Embed Size (px)
DESCRIPTION
Processed data, sample calculations, and interpretations for the Inversion of Sucrose - draft
Citation preview
Department of Chemical Engineering
University of San Carlos – Technological Center
Nasipit, Talamban, Cebu City
ChE 323L
Physical Chemistry Laboratory 1
Inversion of Sucrose
Date Performed: March 4, 2016
Date Submitted: March 7, 2016
An initial laboratory report submitted to:
Dr. Alchris W. Go
Instructor, ChE 323L
An initial laboratory report submitted by:
Alvarez, Ros Vincent
Mambaje, Alronavee
Mondares, Maria Mevicci

Theory
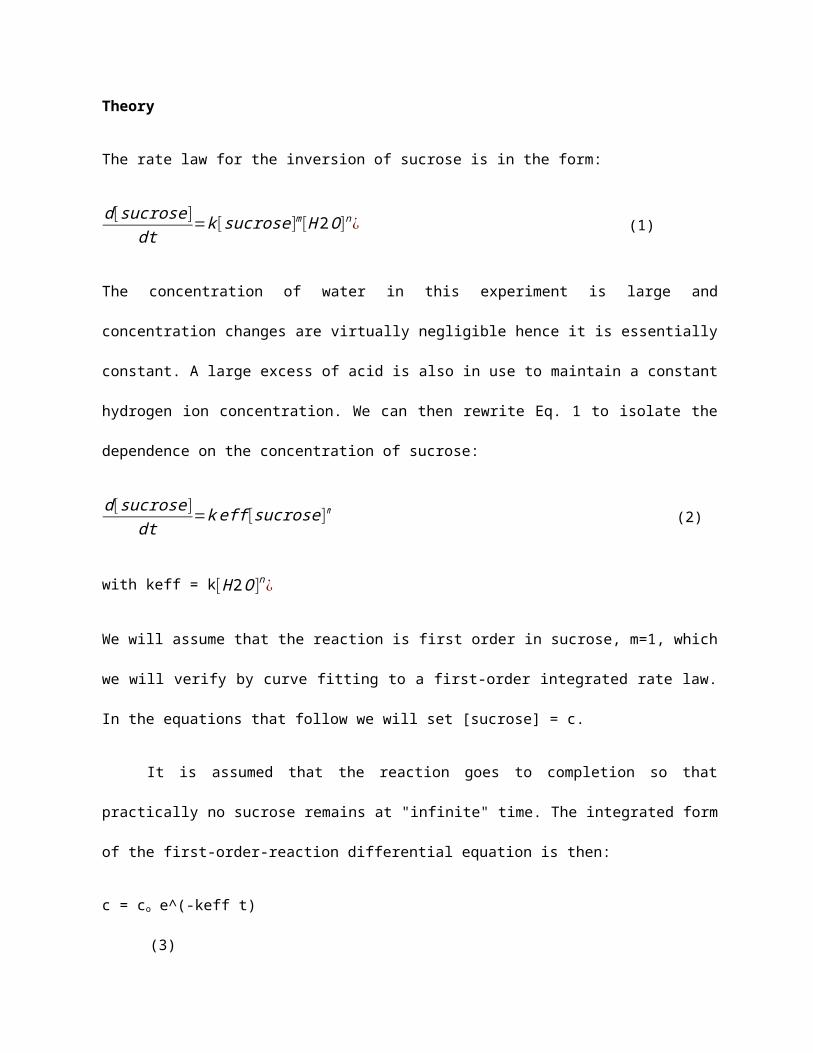
The rate law for the inversion of sucrose is in the form:
d [sucrose ]dt
=k [sucrose]m[H 2O ]n¿ (1)
The concentration of water in this experiment is large and concentration changes are virtually
negligible hence it is essentially constant. A large excess of acid is also in use to maintain a
constant hydrogen ion concentration. We can then rewrite Eq. 1 to isolate the dependence on
the concentration of sucrose:
d [sucrose ]dt
=k eff [sucrose ]m (2)
with keff = k[H 2O ]n ¿
We will assume that the reaction is first order in sucrose, m=1, which we will verify by curve
fitting to a first-order integrated rate law. In the equations that follow we will set [sucrose] = c.
It is assumed that the reaction goes to completion so that practically no sucrose remains at
"infinite" time. The integrated form of the first-order-reaction differential equation is then:
c = co e^(-keff t) (3)
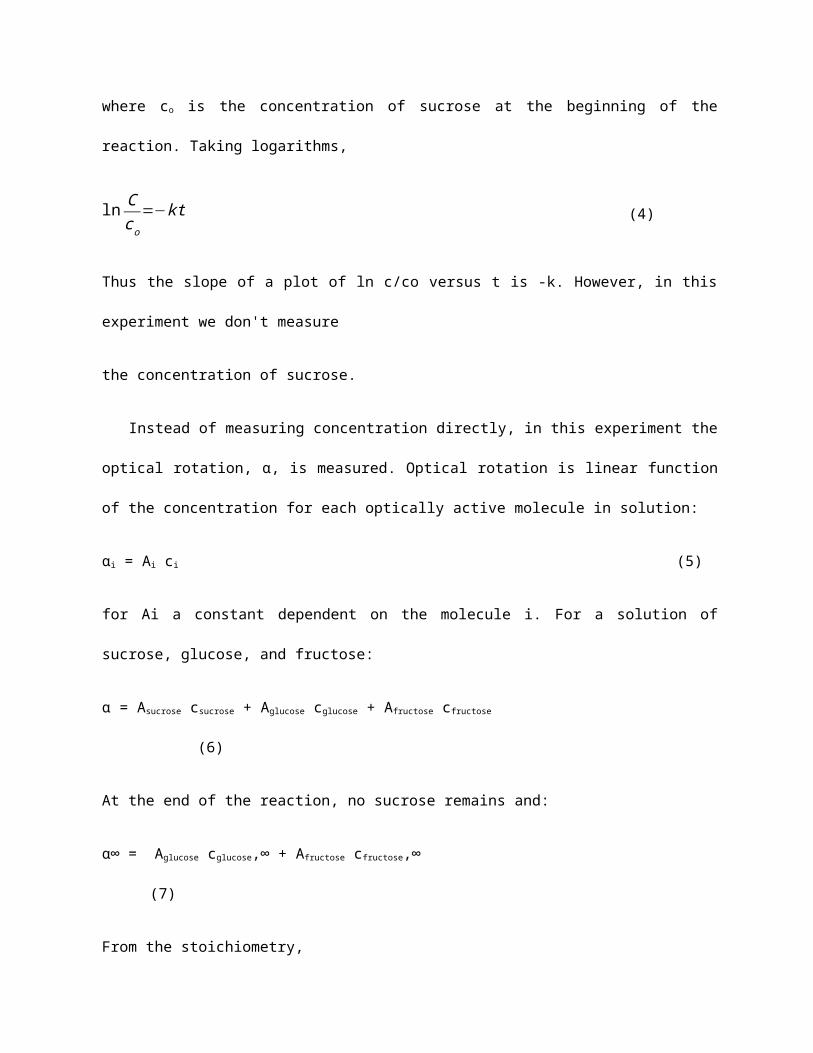
where co is the concentration of sucrose at the beginning of the reaction. Taking logarithms,
ln Cco
=−kt (4)
Thus the slope of a plot of ln c/co versus t is -k. However, in this experiment we don't measure
the concentration of sucrose.
Instead of measuring concentration directly, in this experiment the optical rotation, α, is
measured. Optical rotation is linear function of the concentration for each optically active
molecule in solution:
αi = Ai ci (5)
for Ai a constant dependent on the molecule i. For a solution of sucrose, glucose, and fructose:
α = Asucrose csucrose + Aglucose cglucose + Afructose cfructose (6)
At the end of the reaction, no sucrose remains and:
α∞ = Aglucose cglucose,∞ + Afructose cfructose,∞ (7)
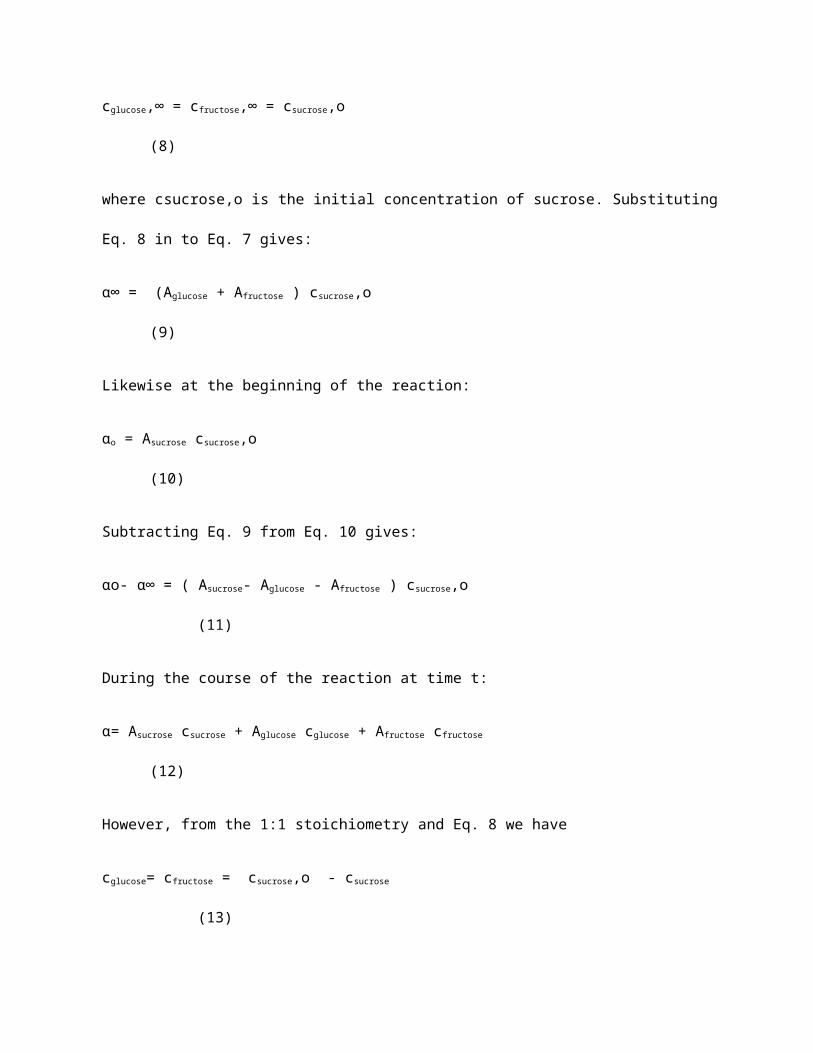
From the stoichiometry,
cglucose,∞ = cfructose,∞ = csucrose,o (8)
where csucrose,o is the initial concentration of sucrose. Substituting Eq. 8 in to Eq. 7 gives:
α∞ = (Aglucose + Afructose ) csucrose,o (9)
Likewise at the beginning of the reaction:
αo = Asucrose csucrose,o (10)
Subtracting Eq. 9 from Eq. 10 gives:
αo- α∞ = ( Asucrose- Aglucose - Afructose ) csucrose,o (11)
During the course of the reaction at time t:
α= Asucrose csucrose + Aglucose cglucose + Afructose cfructose (12)
However, from the 1:1 stoichiometry and Eq. 8 we have
cglucose= cfructose = csucrose,o - csucrose (13)
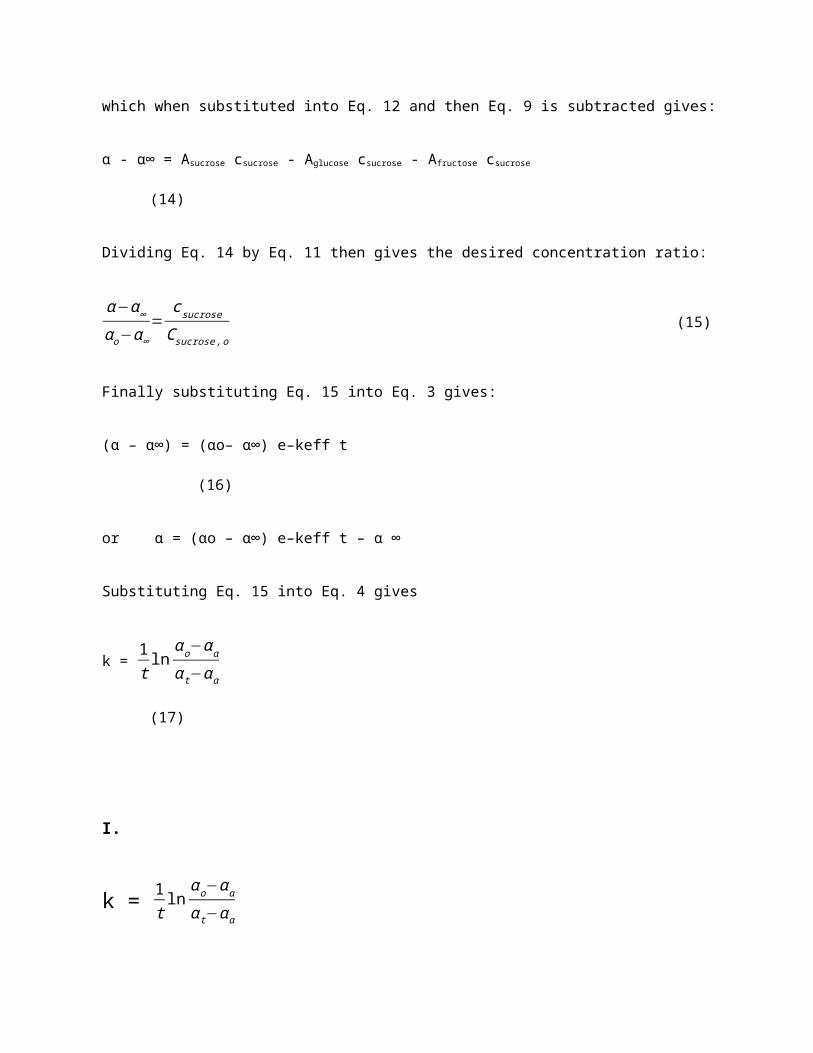
which when substituted into Eq. 12 and then Eq. 9 is subtracted gives:
α - α∞ = Asucrose csucrose - Aglucose csucrose - Afructose csucrose (14)
Dividing Eq. 14 by Eq. 11 then gives the desired concentration ratio:
α−α∞α o−α∞
=c sucroseC sucrose ,o
(15)
Finally substituting Eq. 15 into Eq. 3 gives:
(α – α∞) = (αo– α∞) e–keff t (16)
or α = (αo – α∞) e–keff t – α ∞
Substituting Eq. 15 into Eq. 4 gives
k = 1t
lnαo−α ααt−α α
(17)
I.
k = 1t
lnαo−α ααt−α α
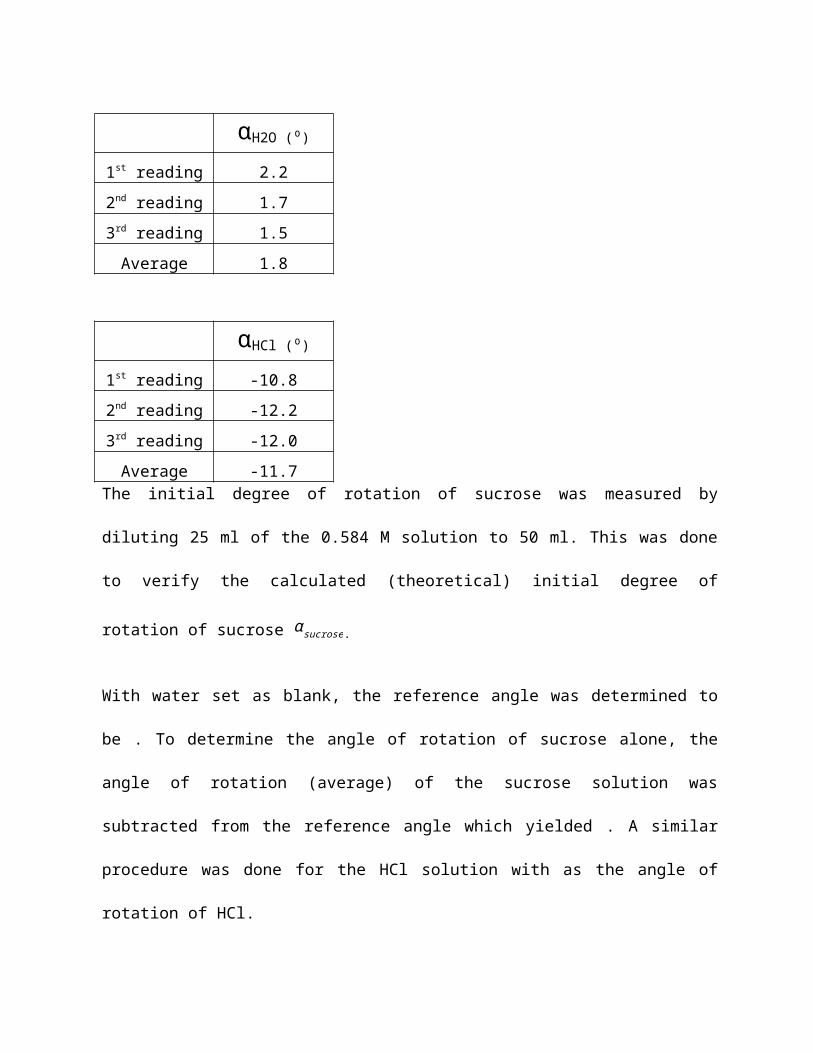
αH2O (⁰)
1st reading 2.2
2nd reading 1.7
3rd reading 1.5
Average 1.8
αHCl (⁰)
1st reading -10.8
2nd reading -12.2
3rd reading -12.0
Average -11.7The initial degree of rotation of sucrose was measured by diluting 25 ml of the 0.584 M solution
to 50 ml. This was done to verify the calculated (theoretical) initial degree of rotation of sucrose
α sucrose.
With water set as blank, the reference angle was determined to be . To determine the angle of
rotation of sucrose alone, the angle of rotation (average) of the sucrose solution was subtracted
from the reference angle which yielded . A similar procedure was done for the HCl solution
with as the angle of rotation of HCl.
The initial angle of rotation was then determined by summing up that measured angles of rotation of water, sucrose and HCl. This value is the expected angle of rotation of the three substances at a point before the reaction takes place.
During the inversion process, the moment when the solutions were mixed was set to be at time zero (t0). Readings were taken at 5 min intervals due to the slow nature of the reaction (hence the HCl catalyst) and the reading that kept constant after 10 min intervals was taken to be the angle of rotation at infinity. This indicates that the sucrose is now consumed too slowly to be practically measured and we assume that the reaction goes to completion. The angle displayed in the Vernier was then subtracted to the reference angle to give the angle of rotation at time t. Results are displayed in Table.
Angle of Rotation with correction from blank
Time (min.), t 5 10 15 20 25 30 40 50 60 ∞
Trial 1Angle Rotation, αt
lnα t−α α
8.1
2.96
4.5
2.75
1.4
2.53
-1.1
2.31
-3.4
2.05
-6.1
1.63
-9.6
0.47
-10.4
-0.22
-11.2
-
-11.2
Trial 2Angle Rotation, αt
lnα t−α α
8.4
2.84
5.1
2.62
3.3
2.48
0
2.16
-2.2
1.87
-6.3
0.88
-8.7
-
-
-
-
-
-8.7
Ave values
Time (min.), t 5 10 15 20 25 30 40 ∞
Angle Rotation, αt
lnα t−α α
8.3
2.91
4.8
2.70
2.4
2.52
-0.6
2.24
-2.8
1.97
-6.2
1.34
-9.2
0.22
-10.0
-
Rearranging equation 1 to a linear form:
ln α t−α α = -kt + ln α o−αα
0 5 10 15 20 25 30 35 40 450
0.5
1
1.5
2
2.5
3
3.5
f(x) = − 0.0751967213114754 x + 3.54336065573771
t (min.)
ln (α
t - α
∞)
Figure 1. Graph of ln function against Time t.
The line of best fit (as shown in Figure1) was obtained using the best-fit Excel function giving a
sope of 0.0752 hence,
k = 0.0752
Sucrose is dextrorotatory while a glucose-fructose mixture resulting from the inversion should
render a slightly levorotatory polarization. It is interesting to note though that glucose is
dextrorotatory like sucrose while fructose is levorotatory and the resulting slight levorotatory
mixture is due to greater specific rotation of fructose. We can therefore make a prediction that
as sucrose is used up in the reaction, the resulting angle of rotation as time progresses should
“move” or rotate in a counter-clockwise fashion or rotated to the left.
This prediction is confirmed based on table with the results reaching the negative scale (blank
adjusted) using the full circle scale polarimeter.