Embed Size (px)
Citation preview
ORIGINAL RESEARCHpublished: 23 November 2018
doi: 10.3389/fmicb.2018.02796
Frontiers in Microbiology | www.frontiersin.org 1 November 2018 | Volume 9 | Article 2796
Edited by:
Konstantinos Papadimitriou,
Agricultural University of Athens,
Greece
Reviewed by:
Diego Mora,
Università degli Studi di Milano, Italy
Michael Gänzle,
University of Alberta, Canada
*Correspondence:
Frank Jakob
†Present Address:
Jürgen Behr,
Leibniz-Institut für
Lebensmittel-Systembiologie,
Technische Universität München,
Freising, Germany
Specialty section:
This article was submitted to
Systems Microbiology,
a section of the journal
Frontiers in Microbiology
Received: 31 August 2018
Accepted: 31 October 2018
Published: 23 November 2018
Citation:
Prechtl RM, Janßen D, Behr J,
Ludwig C, Küster B, Vogel RF and
Jakob F (2018) Sucrose-Induced
Proteomic Response and
Carbohydrate Utilization of
Lactobacillus sakei TMW 1.411 During
Dextran Formation.
Front. Microbiol. 9:2796.
doi: 10.3389/fmicb.2018.02796
Sucrose-Induced ProteomicResponse and CarbohydrateUtilization of Lactobacillus sakeiTMW 1.411 During Dextran Formation
Roman M. Prechtl 1, Dorothee Janßen 1, Jürgen Behr 2†, Christina Ludwig 2,
Bernhard Küster 2, Rudi F. Vogel 1 and Frank Jakob 1*
1 Lehrstuhl für Technische Mikrobiologie, Technische Universität München, Freising, Germany, 2 Bavarian Center for
Biomolecular Mass Spectrometry, Freising, Germany
Lactobacillus (L.) sakei belongs to the dominating lactic acid bacteria in indigenous
meat fermentations, while diverse strains of this species have also been isolated from
plant fermentations. We could recently show, that L. sakei TMW 1.411 produces a high
molecular weight dextran from sucrose, indicating its potential use as a dextran forming
starter culture. However, the general physiological response of L. sakei to sucrose
as carbohydrate source has not been investigated yet, especially upon simultaneous
dextran formation. To address this lack of knowledge, we sequenced the genome of
L. sakei TMW 1.411 and performed a label-free, quantitative proteomics approach
to investigate the sucrose-induced changes in the proteomic profile of this strain in
comparison to its proteomic response to glucose. In total, 21 proteins were found
to be differentially expressed at the applied significance criteria (FDR ≤ 0.01). Among
these, 14 were associated with the carbohydrate metabolism including several enzymes,
which enable sucrose and fructose uptake, as well as, their subsequent intracellular
metabolization, respectively. The plasmid-encoded, extracellular dextransucrase of
L. sakei TMW1.411was expressed at high levels irrespective of the present carbohydrate
and was predominantly responsible for sucrose consumption in growth experiments
using sucrose as sole carbohydrate source, while the released fructose from the
dextransucrase reaction was more preferably taken up and intracellularly metabolized
than sucrose. Genomic comparisons revealed, that operons coding for uptake and
intracellular metabolism of sucrose and fructose are chromosomally conserved among
L. sakei, while plasmid-located dextransucrase genes are present only in few strains. In
accordance with these findings, all 59 different L. sakei strains of our strain collection were
able to grow on sucrose as sole carbohydrate source, while eight of them exhibited a
mucous phenotype on agar plates indicating dextran formation from sucrose. Our study
therefore highlights the intrinsic adaption of L. sakei to plant environments, where sucrose
is abundant, and provides fundamental knowledge regarding the use of L. sakei as starter
culture for sucrose-based food fermentation processes with in-situ dextran formation.
Keywords: Lactobacillus sakei, proteomics, genomics, sucrose, dextran, metabolism
Prechtl et al. Sucrose Metabolism in Lactobacillus sakei
INTRODUCTION
The species Lactobacillus (L.) sakei is typically isolated fromfermented meat products, which was suggested as its mainhabitat, since it belongs to the dominating species in spontaneousmeat fermentations (Hammes et al., 1990; McLeod et al., 2010).Hence, L. sakei spp. are frequently exploited as starter culturesfor the manufacturing of fermented meat products (e.g., raw-fermented sausages) (Zagorec and Champomier-Vergès, 2017).Since the main nutrients available for growth in meat productsare (purine) nucleosides, certain amino acids (e.g., arginine),glucose and ribose (Champomier-Vergès et al., 2001; Chaillouet al., 2005; Rimaux et al., 2012), the adaption of L. sakei spp.to these carbon sources, as well as, associated proteomic profilesand metabolic pathways have been subject of several studies,including growth experiments and -omics approaches (Hammeset al., 1990; Hüfner et al., 2007; Fadda et al., 2010; McLeod et al.,2010, 2011).
However, L. sakei has also been isolated from various plantfermentations such as silage and sauerkraut, while it hadoriginally been isolated from rice wine, namely the traditionalJapanese beverage Sake (Vogel et al., 1993; Torriani et al.,1996; Champomier-Vergès et al., 2001; Amadoro et al., 2015;Prechtl et al., 2018). Above that, some strains of L. sakei expressglucansucrases that synthesize high molecular weight dextransfrom sucrose, which were discussed to contribute to biofilmformation or could be used as fish prebiotics in aquacultures(Gänzle and Follador, 2012; Nácher-Vázquez et al., 2015, 2017a;Prechtl et al., 2018). Thus, the species L. sakei seems to be adaptedto plant-based environments as well, where sucrose is usually themost abundant carbon source.
Despite its frequent use as a starter culture for themanufacturing of fermented meat products, the capability ofsome strains to produce exopolysaccharides such as dextranfrom sucrose has not been commercially exploited yet. Insuch applications, sucrose would have to be added as carbonsource instead of the usually applied glucose, enabling in-situdextran synthesis and thereby the manufacturing of “clean label”products with improved properties (Hilbig et al., unpublisheddata).
However, little is still known about the general physiologicalresponse of dextran-forming L. sakei to this carbohydrate andespecially about metabolic pathways, which allow intracellularsucrose consumption and could hence compete with dextranformation. To address this lack of knowledge, we sequenced thegenome of the dextran-producing strain L. sakei TMW 1.411and performed a label-free proteomic approach for identificationof upregulated metabolic pathways upon its growth on sucrose.Moreover, we determined produced and consumed metabolitesby L. sakei TMW 1.411 during dextran formation, analyzedsucrose metabolic pathways among diverse L. sakei strains viacomparative genomics and finally correlated the obtained resultsto the general outcome of the proteomic study.
MATERIALS AND METHODS
ChemicalsChemicals used for growth media and buffers, as well as,solutions for dextran quantification and sample preparation were
purchased from Carl Roth GmbH (Karlsruhe, Germany), MerckKGaA (Darmstadt, Germany), and GERBU Biotechnik GmbH(Heidelberg, Germany).
Bacterial Strain and Growth ConditionsLactobacillus sakei TMW 1.411, originally isolated fromsauerkraut, was obtained as a cryo-culture from our straincollection. To recover the cells from cryo-cultures, a modifiedMRS (mMRS) medium (Stolz et al., 1995) supplemented with thecarbohydrates glucose 5 g/L, fructose 5 g/L, and maltose 10 g/Lwas used for the preparation of agar plates (1.5%) and liquidprecultures, whereas incubation was carried out for 36–48 hat 30◦C at micro-aerobic conditions in sealed tubes (15ml;Sarstedt AG & Co, Germany) without shaking. Depending onthe performed experiment, the sugars were replaced by othercarbohydrates in the working cultures as indicated. To determineviable cell counts (CFU/mL), 50 µL of appropriate dilutions insaline (0.9% NaCl) were spread on mMRS agar with sterile glassbeads (2.7mm, Carl Roth GmbH, Karlsruhe, Germany) andincubated at 30◦C for at least 48 h.
Genome Sequencing and AnnotationHigh-molecular-weight DNA was isolated from liquid cultures(late exponential growth phase) in mMRS and purified aspreviously described (Kafka et al., 2017). To obtain thewhole genome shotgun sequence (WGS), the Illumina MiSeq R©
sequencing technology was applied in combination with theSPAdes 3.9 assembly algorithm. Afterwards, the WGS wasannotated with PGAP (prokaryotic genome annotation pipeline)and RAST (rapid annotations using subsystems technology),which included SEED subsystem analysis (Aziz et al., 2008;Tatusova et al., 2016). The RAST annotated genome and openreading frames (ORF) are deposited as online supplementarymaterial, whereas the WGS project has been published(DDBJ/ENA/GenBank) under the accession QOSE00000000.The version described in this paper is version QOSE01000000.
Proteomic AnalysisExperimental SetupTo investigate the proteomic shift in response to sucrose assole carbon source, 4 × 15ml precultures (four biol. replicates)of L. sakei TMW 1.411 were prepared in mMRS as describedabove (section Bacterial Strain and Growth Conditions) andused to inoculate 4 × 100ml cultures in mMRS (20 g/Lglucose) with a final OD600 of 0.1. The cultures were grownto the mid-exponential growth phase (pH ∼5.0, determinedin preliminary experiments), which had given good results inprevious experiments (Schott et al., 2017), and subsequentlydistributed to 50ml sealed tubes each (eight tubes in total).Afterwards, the cultures were pelletized (5,000 × g, 10min)and washed once in fresh mMRS. Next, the suspensions werepelletized again and resuspended in an equal volume of mMRSsupplemented with either glucose or sucrose (20 g/L each),followed by incubation at 30◦C for 2 h. Subsequently, 2.5mLof cooled trichloroacetic acid (100%) were added to 40mL ofglucose/sucrose treated cultures (6.25% w/v final concentration)and the suspensions were immediately transferred to pre-cooled50ml tubes and incubated on ice for 10min. After centrifugation
Frontiers in Microbiology | www.frontiersin.org 2 November 2018 | Volume 9 | Article 2796
Prechtl et al. Sucrose Metabolism in Lactobacillus sakei
(5,000 × rpm, 10min, 4◦C), the pellets were washed twicewith 10mL cold acetone (−20◦C) (2,000 rpm, 10min, 4◦C),whereas the supernatants were discarded carefully. Finally, thepellets were frozen in liquid nitrogen and stored at −80◦Cuntil protein isolation and peptide preparation (section PeptidePreparation, Separation, and Mass Spectrometry). In addition,aliquots were taken from each of the four precultures, aswell as, the eight batches after 2 h incubation to determinepH values and the viable cell count in CFU/mL on agarplates.
Peptide Preparation, Separation, and Mass
SpectrometryCell pellets were resuspended in lysis buffer [8Murea, 5mM EDTA disodium salt, 100mM NH4HCO3,1mM Dithiothreitol (DTT) in water, pH = 8.0] anddisrupted mechanically using glass beads (G8772, 425–600µm, Sigma, Germany), whereas a Bradford assay(Bio-Rad Protein Assay, Bio-Rad Laboratories GmbH,Munich, Germany) was performed to determine the totalprotein concentration in the lysate. Afterwards, 100 µgprotein extract of each sample were used for in-solutiondigestion: After reduction (10mM DTT, 30◦C, 30min)and carbamidomethylation (55mM chloroacetamide,60min in the dark), trypsin was added to the samples,and the solutions were incubated overnight at 37◦C.Next, the digested protein samples were desalted usingC18 solid phase extraction with Sep-Pak columns (Waters,WAT054960) following the manufacturer’s protocol. Finally,the purified peptide samples were dried with a SpeedVacdevice and dissolved in an aqueous solution of acetonitrile(2%) and formic acid (0.1%) at a final concentration of0.25 µg/µL.
Peptide analysis was performed on a Dionex Ultimate 3000nano LC system, which was coupled to a Q-Exactive HF massspectrometer (Thermo Scientific, Germany). At first, the peptideswere loaded on a trap column (75µm × 2 cm, self-packed,Reprosil-Pur C18 ODS-3 5µm resin, Dr. Maisch, Ammerbuch)at a flow rate of 5 µL/min in solvent A0 (0.1% formic acidin water). Next, the separation was performed on an analyticalcolumn (75µm × 40 cm, self-packed, Reprosil-Gold C18, 3µmresin, Dr. Maisch, Ammerbuch) at a flow-rate of 300 nL/minapplying a 120min linear gradient (4–32%) of solvent B (0.1%formic acid, 5% DMSO in acetonitrile) and solvent A1 (0.1%formic acid, 5% DMSO in water).
The mass spectrometer was operated in the data dependentmode to automatically switch between MS and MS/MSacquisition. The MS1 spectra were obtained in a mass-to-charge(m/z) range of 360–1,300 m/z using a maximum injection timeof 50ms, whereas the AGC target value was 3e6. Up to 20peptide ion precursors were isolated with an isolation window of1.7 m/z (max. injection time 25ms, AGC value 1e5), fragmentedby higher-energy collisional dissociation (HCD) applying 25%normalized collision energy (NCE) and finally analyzed at aresolution of 15,000 in a scan range from 200 to 2,000m/z. Singly-charged and unassigned precursor ions, as well as, charge states>6+ were excluded.
Protein Identification and QuantificationBoth identification and quantification of peptides and proteinswere performed with the software MaxQuant (v. 1.5.7.4) bysearching the MS2 data against all protein sequences predictedfor the reference genome of L. sakei TMW 1.411 by theRAST annotation pipeline (section Genome Sequencing andAnnotation; GenBank QOSE0100000) using the embeddedsearch engine Andromeda (Cox et al., 2011). While thecarbamidomethylation of cysteine was a fixed modification, theoxidation of methionine, as well as, the N-terminal proteinacetylation were variable modifications. Up to two missedTrypsin/P cleavage sites were allowed and precursor andfragment ion tolerances were set 10 and 20 ppm, respectively.The label-free quantification (Cox et al., 2014) and data matchingwere enabled within theMaxQuant software between consecutiveanalyses, whereas filtering of the search results was performedwith a minimum peptide length of 7 amino acids, as well as,1% peptide and protein false discovery rate (FDR) plus commoncontaminants and reverese identifications.
Data Processing and Statistical AnalysisThe Perseus software (version 1.6.0.7) was used to process theMaxQuant output file (proteinGroups.txt) and conduct statisticalanalyses (Tyanova et al., 2016). After filtering of the proteingroups (removal of identified by site hits, reverse identifications,contaminants), the LFQ intensity data were log2 transformed,whereas the IBAQ intensities were log10 transformed. Toimprove the validity of statistical analysis, only proteins whichhad been identified (i) by at least two unique peptides and(ii) in all four replicates of at least one group (glucose/sucrosetreated cells) were considered, whereas missing values after log-transformation were imputed from a normal distribution (width:0.2; down shift: 1.8). The log2-transformed LFQ data were usedfor a stringent t-Test analysis, using a Benjamini-Hochberg FDRof 0.01 for truncation, whereas proteins with an absolute log2 foldchange (FC) of≥1 were further discussed in the present study. Toestimate absolute protein abundancies at a certain condition, thetransformed IBAQ intensities were averaged ranked descendingfor each group. The results of the t-Test analysis are available asonly Supplementary Material.
Monitoring of Growth, Metabolite, andDextran Formation in mMRs MediumPrecultures in mMRS were prepared from single colonies (twobiol. replicates) on agar plates as described (section BacterialStrain and Growth Conditions) and subsequently used to preparegrowth series (inoculum: OD600 = 0.1) in mMRS mediumsupplemented with sucrose (50 g/L) as sole carbon source.After various incubation times, characteristic growth parameterssuch as viable cell count (CFU/mL; 2.2) and pH (Knick761 Calimatic, Knick, Germany) were determined. Culturesupernatants were prepared by centrifugation (5,000× g, 10min,4◦C) und subsequently stored at −20◦C until metabolite anddextran quantification. Sugars and organic acid concentrationswere determined with a HPLC system (Dionex Ultimate 3000,Thermo Fisher Scientific, United States) coupled to Shodexrefractive index (RI) detector (Showa Denko Shodex, Germany),
Frontiers in Microbiology | www.frontiersin.org 3 November 2018 | Volume 9 | Article 2796
Prechtl et al. Sucrose Metabolism in Lactobacillus sakei
whereas 20 µL were injected from prepared samples. For samplepreparation, supernatants were either filtered (0.2µm nylonfilters, Phenomenex, Germany) and diluted (analysis of sugars)or treated as follows (analysis of organic acids): 50 µL perchloricacid (70%) were added to 1mL of supernatant, mixed thoroughlyand incubated overnight (4◦C). Afterwards, the samples werecentrifuged (13,000 × g, 30min, 4◦C) and filtered (0.2µm). Thesugars were measured with a RezexTM RPM Pb2+ column at aflow-rate of 0.6 mL/min (85◦C) using filtered (0.2µm) deionizedwater as eluent, whereas organic acids were measured with aRezexTM ROA H+ column (both Phenomenex, Germany) at aflow-rate of 0.7 mL/min (85◦C) with 2.5mM H2SO4 (preparedwith filtered, deionized water). Metabolites were identified andquantified by means of appropriate standard solutions with theChromeleonTM software (v. 6.8; Dionex, Germany).
Dextran quantification was performed from dialyzedsupernatants (3.5 kDa cut-off dialysis tubings, MEMBRA-CEL R©,Serva Electrophoresis GmbH, Germany) using the phenolsulfuric acid (PSA) method as described previously (Prechtlet al., 2018). To ensure the reliable removal of sucrose, dialysiswas performed over 48 h (4◦C) with continuous stirring, whereasthe water (5 L exchange volume, ∼100 × dilution factor) waschanged at least five times. As blank value, non-inoculatedmMRS medium was dialyzed in the same way, subjected to PSAquantification and finally subtracted from the amount of dextranquantified in the samples.
Data DepositionAn additional file containing the protein sequences withcorresponding FIG identifiers (from RAST annotation), as wellas, relevant proteome tables with assigned SEED categories andthe results of the t-Test evaluation are deposited online assupplementary data. The mass spectrometry proteomics datahave been deposited to the ProteomeXchange Consortium via thePRIDE partner repository with the dataset identifier PXD011417(http://proteomecentral.proteomexchange.org).
RESULTS
General Features of the Genome of L. sakeiTMW 1.411Prior to performing the proteomic experiment, the genome ofL. sakei TMW 1.411 was sequenced and annotated as describedin the materials and methods section (Genome Sequencing andAnnotation).
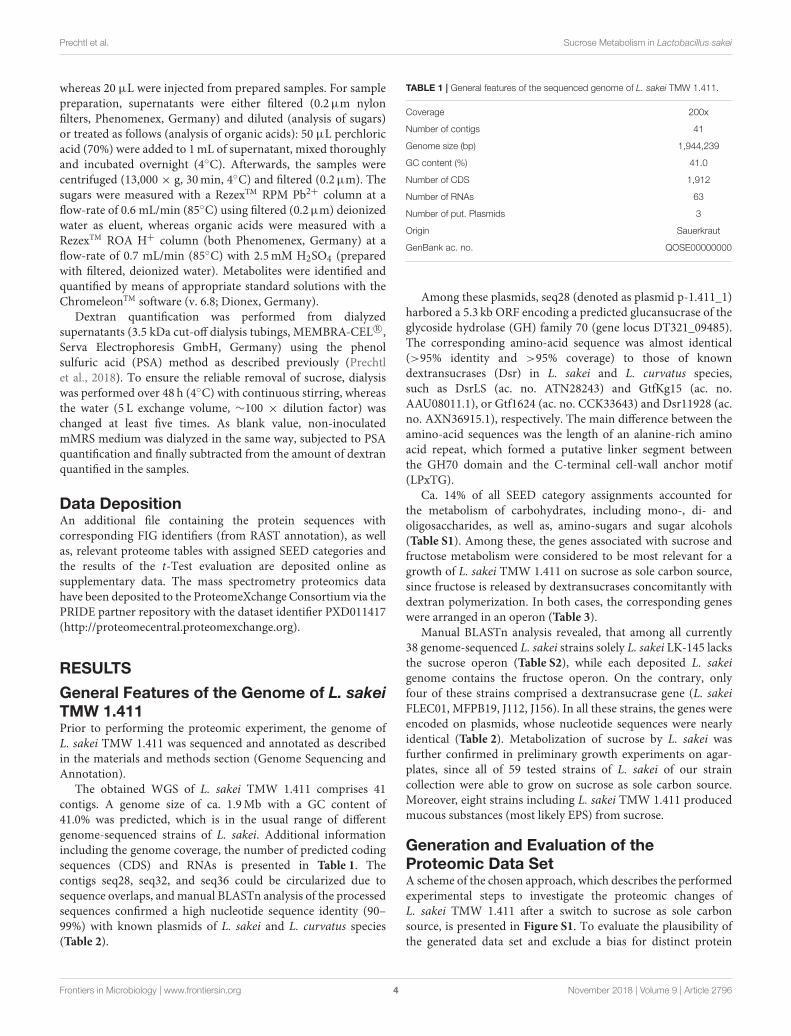
The obtained WGS of L. sakei TMW 1.411 comprises 41contigs. A genome size of ca. 1.9Mb with a GC content of41.0% was predicted, which is in the usual range of differentgenome-sequenced strains of L. sakei. Additional informationincluding the genome coverage, the number of predicted codingsequences (CDS) and RNAs is presented in Table 1. Thecontigs seq28, seq32, and seq36 could be circularized due tosequence overlaps, andmanual BLASTn analysis of the processedsequences confirmed a high nucleotide sequence identity (90–99%) with known plasmids of L. sakei and L. curvatus species(Table 2).
TABLE 1 | General features of the sequenced genome of L. sakei TMW 1.411.
Coverage 200x
Number of contigs 41
Genome size (bp) 1,944,239
GC content (%) 41.0
Number of CDS 1,912
Number of RNAs 63
Number of put. Plasmids 3
Origin Sauerkraut
GenBank ac. no. QOSE00000000
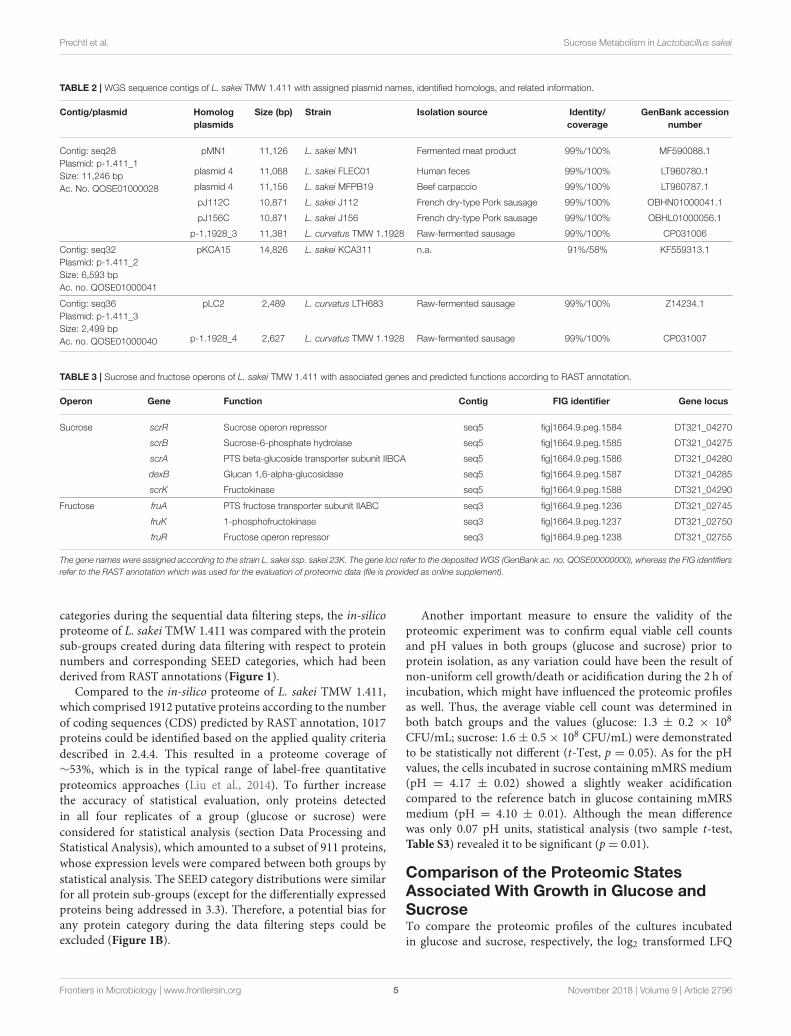
Among these plasmids, seq28 (denoted as plasmid p-1.411_1)harbored a 5.3 kb ORF encoding a predicted glucansucrase of theglycoside hydrolase (GH) family 70 (gene locus DT321_09485).The corresponding amino-acid sequence was almost identical(>95% identity and >95% coverage) to those of knowndextransucrases (Dsr) in L. sakei and L. curvatus species,such as DsrLS (ac. no. ATN28243) and GtfKg15 (ac. no.AAU08011.1), or Gtf1624 (ac. no. CCK33643) and Dsr11928 (ac.no. AXN36915.1), respectively. The main difference between theamino-acid sequences was the length of an alanine-rich aminoacid repeat, which formed a putative linker segment betweenthe GH70 domain and the C-terminal cell-wall anchor motif(LPxTG).
Ca. 14% of all SEED category assignments accounted forthe metabolism of carbohydrates, including mono-, di- andoligosaccharides, as well as, amino-sugars and sugar alcohols(Table S1). Among these, the genes associated with sucrose andfructose metabolism were considered to be most relevant for agrowth of L. sakei TMW 1.411 on sucrose as sole carbon source,since fructose is released by dextransucrases concomitantly withdextran polymerization. In both cases, the corresponding geneswere arranged in an operon (Table 3).
Manual BLASTn analysis revealed, that among all currently38 genome-sequenced L. sakei strains solely L. sakei LK-145 lacksthe sucrose operon (Table S2), while each deposited L. sakeigenome contains the fructose operon. On the contrary, onlyfour of these strains comprised a dextransucrase gene (L. sakeiFLEC01, MFPB19, J112, J156). In all these strains, the genes wereencoded on plasmids, whose nucleotide sequences were nearlyidentical (Table 2). Metabolization of sucrose by L. sakei wasfurther confirmed in preliminary growth experiments on agar-plates, since all of 59 tested strains of L. sakei of our straincollection were able to grow on sucrose as sole carbon source.Moreover, eight strains including L. sakei TMW 1.411 producedmucous substances (most likely EPS) from sucrose.
Generation and Evaluation of theProteomic Data SetA scheme of the chosen approach, which describes the performedexperimental steps to investigate the proteomic changes ofL. sakei TMW 1.411 after a switch to sucrose as sole carbonsource, is presented in Figure S1. To evaluate the plausibility ofthe generated data set and exclude a bias for distinct protein
Frontiers in Microbiology | www.frontiersin.org 4 November 2018 | Volume 9 | Article 2796
Prechtl et al. Sucrose Metabolism in Lactobacillus sakei
TABLE 2 | WGS sequence contigs of L. sakei TMW 1.411 with assigned plasmid names, identified homologs, and related information.
Contig/plasmid Homolog
plasmids
Size (bp) Strain Isolation source Identity/
coverage
GenBank accession
number
Contig: seq28
Plasmid: p-1.411_1
Size: 11,246 bp
Ac. No. QOSE01000028
pMN1 11,126 L. sakei MN1 Fermented meat product 99%/100% MF590088.1
plasmid 4 11,068 L. sakei FLEC01 Human feces 99%/100% LT960780.1
plasmid 4 11,156 L. sakei MFPB19 Beef carpaccio 99%/100% LT960787.1
pJ112C 10,871 L. sakei J112 French dry-type Pork sausage 99%/100% OBHN01000041.1
pJ156C 10,871 L. sakei J156 French dry-type Pork sausage 99%/100% OBHL01000056.1
p-1.1928_3 11,381 L. curvatus TMW 1.1928 Raw-fermented sausage 99%/100% CP031006
Contig: seq32
Plasmid: p-1.411_2
Size: 6,593 bp
Ac. no. QOSE01000041
pKCA15 14,826 L. sakei KCA311 n.a. 91%/58% KF559313.1
Contig: seq36
Plasmid: p-1.411_3
Size: 2,499 bp
Ac. no. QOSE01000040
pLC2 2,489 L. curvatus LTH683 Raw-fermented sausage 99%/100% Z14234.1
p-1.1928_4 2,627 L. curvatus TMW 1.1928 Raw-fermented sausage 99%/100% CP031007
TABLE 3 | Sucrose and fructose operons of L. sakei TMW 1.411 with associated genes and predicted functions according to RAST annotation.
Operon Gene Function Contig FIG identifier Gene locus
Sucrose scrR Sucrose operon repressor seq5 fig|1664.9.peg.1584 DT321_04270
scrB Sucrose-6-phosphate hydrolase seq5 fig|1664.9.peg.1585 DT321_04275
scrA PTS beta-glucoside transporter subunit IIBCA seq5 fig|1664.9.peg.1586 DT321_04280
dexB Glucan 1,6-alpha-glucosidase seq5 fig|1664.9.peg.1587 DT321_04285
scrK Fructokinase seq5 fig|1664.9.peg.1588 DT321_04290
Fructose fruA PTS fructose transporter subunit IIABC seq3 fig|1664.9.peg.1236 DT321_02745
fruK 1-phosphofructokinase seq3 fig|1664.9.peg.1237 DT321_02750
fruR Fructose operon repressor seq3 fig|1664.9.peg.1238 DT321_02755
The gene names were assigned according to the strain L. sakei ssp. sakei 23K. The gene loci refer to the deposited WGS (GenBank ac. no. QOSE00000000), whereas the FIG identifiers
refer to the RAST annotation which was used for the evaluation of proteomic data (file is provided as online supplement).
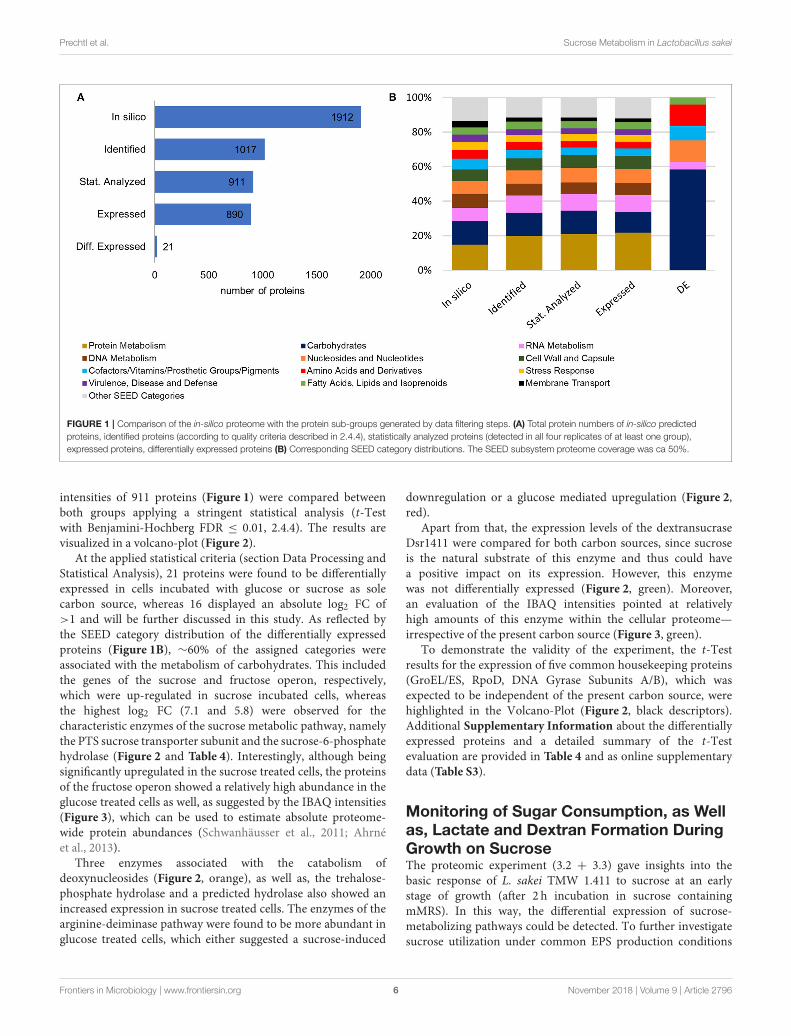
categories during the sequential data filtering steps, the in-silicoproteome of L. sakei TMW 1.411 was compared with the proteinsub-groups created during data filtering with respect to proteinnumbers and corresponding SEED categories, which had beenderived from RAST annotations (Figure 1).
Compared to the in-silico proteome of L. sakei TMW 1.411,which comprised 1912 putative proteins according to the number
of coding sequences (CDS) predicted by RAST annotation, 1017proteins could be identified based on the applied quality criteria
described in 2.4.4. This resulted in a proteome coverage of∼53%, which is in the typical range of label-free quantitative
proteomics approaches (Liu et al., 2014). To further increasethe accuracy of statistical evaluation, only proteins detected
in all four replicates of a group (glucose or sucrose) were
considered for statistical analysis (section Data Processing andStatistical Analysis), which amounted to a subset of 911 proteins,
whose expression levels were compared between both groups by
statistical analysis. The SEED category distributions were similarfor all protein sub-groups (except for the differentially expressedproteins being addressed in 3.3). Therefore, a potential bias forany protein category during the data filtering steps could beexcluded (Figure 1B).
Another important measure to ensure the validity of theproteomic experiment was to confirm equal viable cell countsand pH values in both groups (glucose and sucrose) prior toprotein isolation, as any variation could have been the result ofnon-uniform cell growth/death or acidification during the 2 h ofincubation, which might have influenced the proteomic profilesas well. Thus, the average viable cell count was determined inboth batch groups and the values (glucose: 1.3 ± 0.2 × 10⁸
CFU/mL; sucrose: 1.6± 0.5× 10⁸ CFU/mL) were demonstratedto be statistically not different (t-Test, p = 0.05). As for the pHvalues, the cells incubated in sucrose containing mMRS medium(pH = 4.17 ± 0.02) showed a slightly weaker acidificationcompared to the reference batch in glucose containing mMRSmedium (pH = 4.10 ± 0.01). Although the mean differencewas only 0.07 pH units, statistical analysis (two sample t-test,Table S3) revealed it to be significant (p= 0.01).
Comparison of the Proteomic StatesAssociated With Growth in Glucose andSucroseTo compare the proteomic profiles of the cultures incubatedin glucose and sucrose, respectively, the log2 transformed LFQ
Frontiers in Microbiology | www.frontiersin.org 5 November 2018 | Volume 9 | Article 2796
Prechtl et al. Sucrose Metabolism in Lactobacillus sakei
FIGURE 1 | Comparison of the in-silico proteome with the protein sub-groups generated by data filtering steps. (A) Total protein numbers of in-silico predicted
proteins, identified proteins (according to quality criteria described in 2.4.4), statistically analyzed proteins (detected in all four replicates of at least one group),
expressed proteins, differentially expressed proteins (B) Corresponding SEED category distributions. The SEED subsystem proteome coverage was ca 50%.
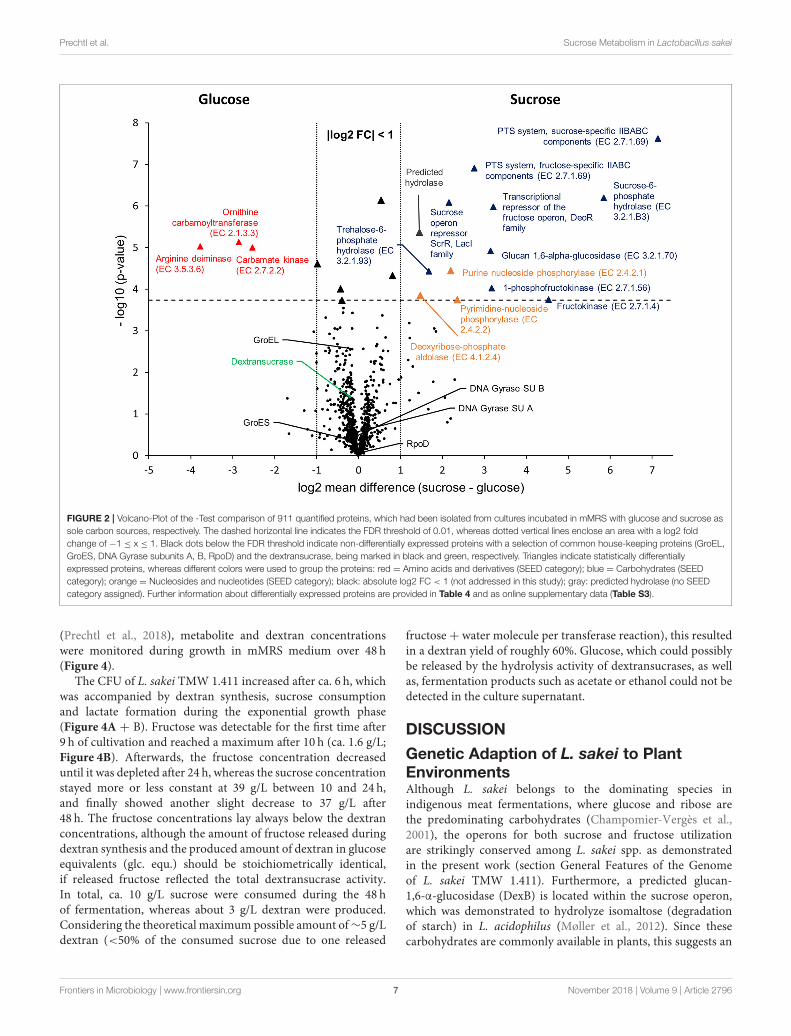
intensities of 911 proteins (Figure 1) were compared betweenboth groups applying a stringent statistical analysis (t-Testwith Benjamini-Hochberg FDR ≤ 0.01, 2.4.4). The results arevisualized in a volcano-plot (Figure 2).
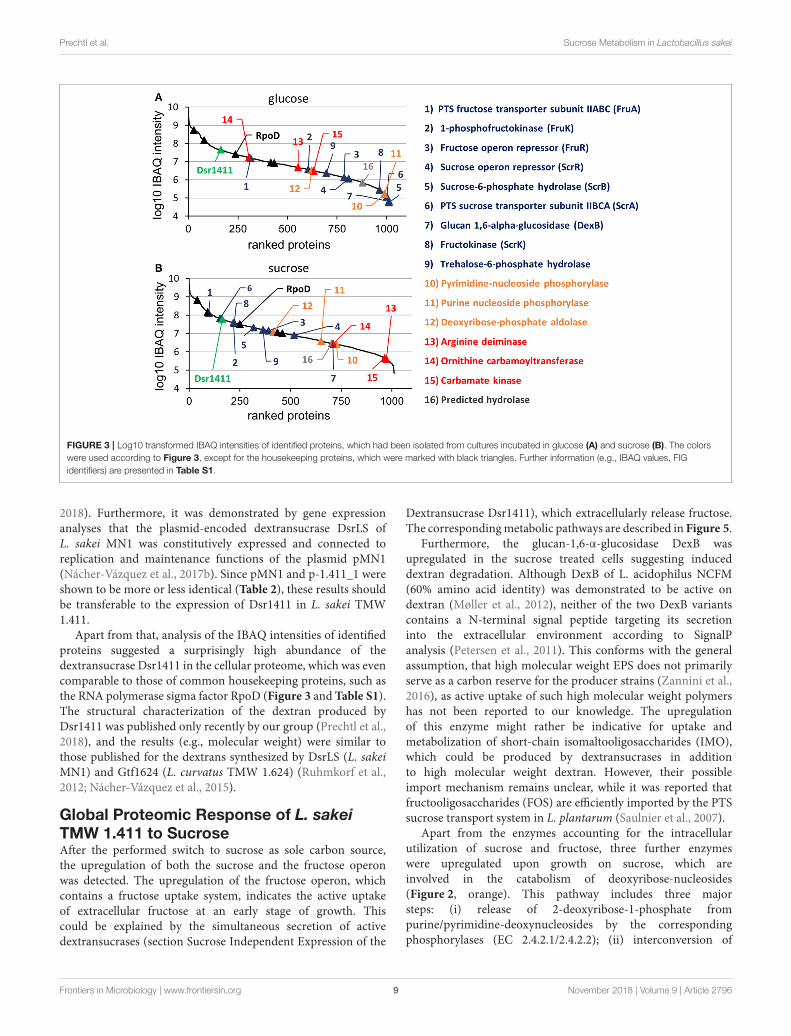
At the applied statistical criteria (section Data Processing andStatistical Analysis), 21 proteins were found to be differentiallyexpressed in cells incubated with glucose or sucrose as solecarbon source, whereas 16 displayed an absolute log2 FC of>1 and will be further discussed in this study. As reflected bythe SEED category distribution of the differentially expressedproteins (Figure 1B), ∼60% of the assigned categories wereassociated with the metabolism of carbohydrates. This includedthe genes of the sucrose and fructose operon, respectively,which were up-regulated in sucrose incubated cells, whereasthe highest log2 FC (7.1 and 5.8) were observed for thecharacteristic enzymes of the sucrose metabolic pathway, namelythe PTS sucrose transporter subunit and the sucrose-6-phosphatehydrolase (Figure 2 and Table 4). Interestingly, although beingsignificantly upregulated in the sucrose treated cells, the proteinsof the fructose operon showed a relatively high abundance in theglucose treated cells as well, as suggested by the IBAQ intensities(Figure 3), which can be used to estimate absolute proteome-wide protein abundances (Schwanhäusser et al., 2011; Ahrnéet al., 2013).
Three enzymes associated with the catabolism ofdeoxynucleosides (Figure 2, orange), as well as, the trehalose-phosphate hydrolase and a predicted hydrolase also showed anincreased expression in sucrose treated cells. The enzymes of thearginine-deiminase pathway were found to be more abundant inglucose treated cells, which either suggested a sucrose-induced
downregulation or a glucose mediated upregulation (Figure 2,red).
Apart from that, the expression levels of the dextransucraseDsr1411 were compared for both carbon sources, since sucroseis the natural substrate of this enzyme and thus could havea positive impact on its expression. However, this enzymewas not differentially expressed (Figure 2, green). Moreover,an evaluation of the IBAQ intensities pointed at relativelyhigh amounts of this enzyme within the cellular proteome—irrespective of the present carbon source (Figure 3, green).
To demonstrate the validity of the experiment, the t-Testresults for the expression of five common housekeeping proteins(GroEL/ES, RpoD, DNA Gyrase Subunits A/B), which wasexpected to be independent of the present carbon source, werehighlighted in the Volcano-Plot (Figure 2, black descriptors).Additional Supplementary Information about the differentiallyexpressed proteins and a detailed summary of the t-Testevaluation are provided in Table 4 and as online supplementarydata (Table S3).
Monitoring of Sugar Consumption, as Wellas, Lactate and Dextran Formation DuringGrowth on SucroseThe proteomic experiment (3.2 + 3.3) gave insights into thebasic response of L. sakei TMW 1.411 to sucrose at an earlystage of growth (after 2 h incubation in sucrose containingmMRS). In this way, the differential expression of sucrose-metabolizing pathways could be detected. To further investigatesucrose utilization under common EPS production conditions
Frontiers in Microbiology | www.frontiersin.org 6 November 2018 | Volume 9 | Article 2796
Prechtl et al. Sucrose Metabolism in Lactobacillus sakei
FIGURE 2 | Volcano-Plot of the -Test comparison of 911 quantified proteins, which had been isolated from cultures incubated in mMRS with glucose and sucrose as
sole carbon sources, respectively. The dashed horizontal line indicates the FDR threshold of 0.01, whereas dotted vertical lines enclose an area with a log2 fold
change of −1 ≤ x ≤ 1. Black dots below the FDR threshold indicate non-differentially expressed proteins with a selection of common house-keeping proteins (GroEL,
GroES, DNA Gyrase subunits A, B, RpoD) and the dextransucrase, being marked in black and green, respectively. Triangles indicate statistically differentially
expressed proteins, whereas different colors were used to group the proteins: red = Amino acids and derivatives (SEED category); blue = Carbohydrates (SEED
category); orange = Nucleosides and nucleotides (SEED category); black: absolute log2 FC < 1 (not addressed in this study); gray: predicted hydrolase (no SEED
category assigned). Further information about differentially expressed proteins are provided in Table 4 and as online supplementary data (Table S3).
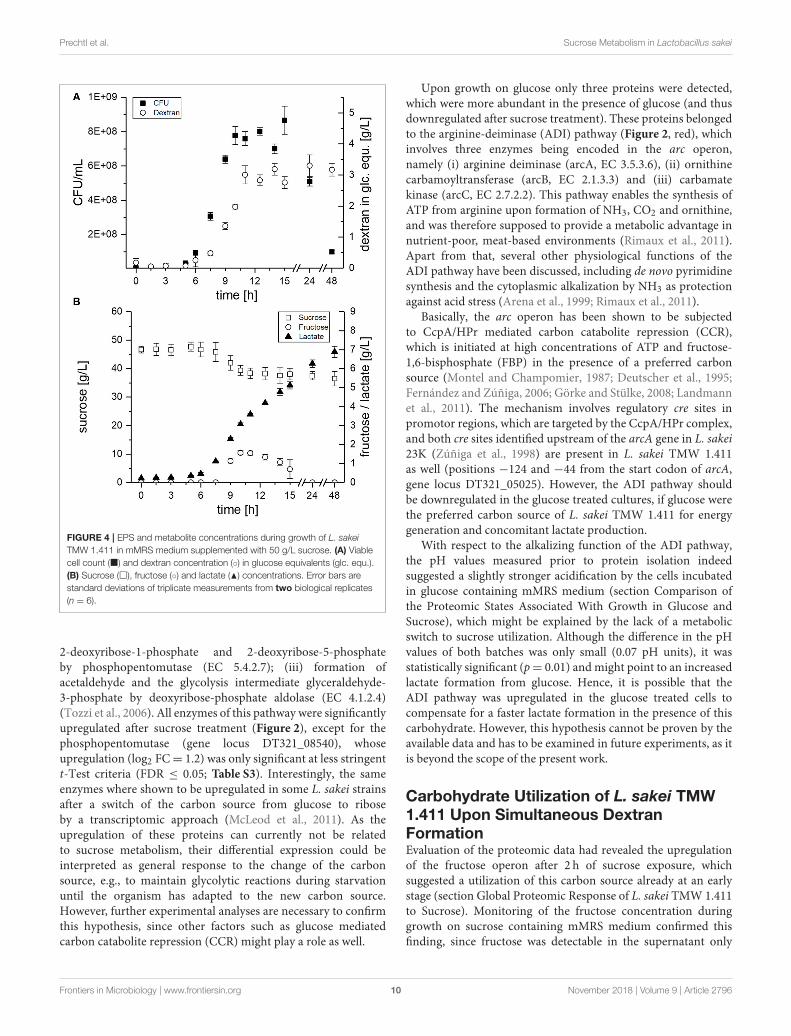
(Prechtl et al., 2018), metabolite and dextran concentrationswere monitored during growth in mMRS medium over 48 h(Figure 4).
The CFU of L. sakei TMW 1.411 increased after ca. 6 h, whichwas accompanied by dextran synthesis, sucrose consumptionand lactate formation during the exponential growth phase(Figure 4A + B). Fructose was detectable for the first time after9 h of cultivation and reached a maximum after 10 h (ca. 1.6 g/L;Figure 4B). Afterwards, the fructose concentration decreaseduntil it was depleted after 24 h, whereas the sucrose concentrationstayed more or less constant at 39 g/L between 10 and 24 h,and finally showed another slight decrease to 37 g/L after48 h. The fructose concentrations lay always below the dextranconcentrations, although the amount of fructose released duringdextran synthesis and the produced amount of dextran in glucoseequivalents (glc. equ.) should be stoichiometrically identical,if released fructose reflected the total dextransucrase activity.In total, ca. 10 g/L sucrose were consumed during the 48 hof fermentation, whereas about 3 g/L dextran were produced.Considering the theoretical maximum possible amount of∼5 g/Ldextran (<50% of the consumed sucrose due to one released
fructose+ water molecule per transferase reaction), this resultedin a dextran yield of roughly 60%. Glucose, which could possiblybe released by the hydrolysis activity of dextransucrases, as wellas, fermentation products such as acetate or ethanol could not bedetected in the culture supernatant.
DISCUSSION
Genetic Adaption of L. sakei to PlantEnvironmentsAlthough L. sakei belongs to the dominating species inindigenous meat fermentations, where glucose and ribose arethe predominating carbohydrates (Champomier-Vergès et al.,2001), the operons for both sucrose and fructose utilizationare strikingly conserved among L. sakei spp. as demonstratedin the present work (section General Features of the Genomeof L. sakei TMW 1.411). Furthermore, a predicted glucan-1,6-α-glucosidase (DexB) is located within the sucrose operon,which was demonstrated to hydrolyze isomaltose (degradationof starch) in L. acidophilus (Møller et al., 2012). Since thesecarbohydrates are commonly available in plants, this suggests an
Frontiers in Microbiology | www.frontiersin.org 7 November 2018 | Volume 9 | Article 2796
Prechtl et al. Sucrose Metabolism in Lactobacillus sakei
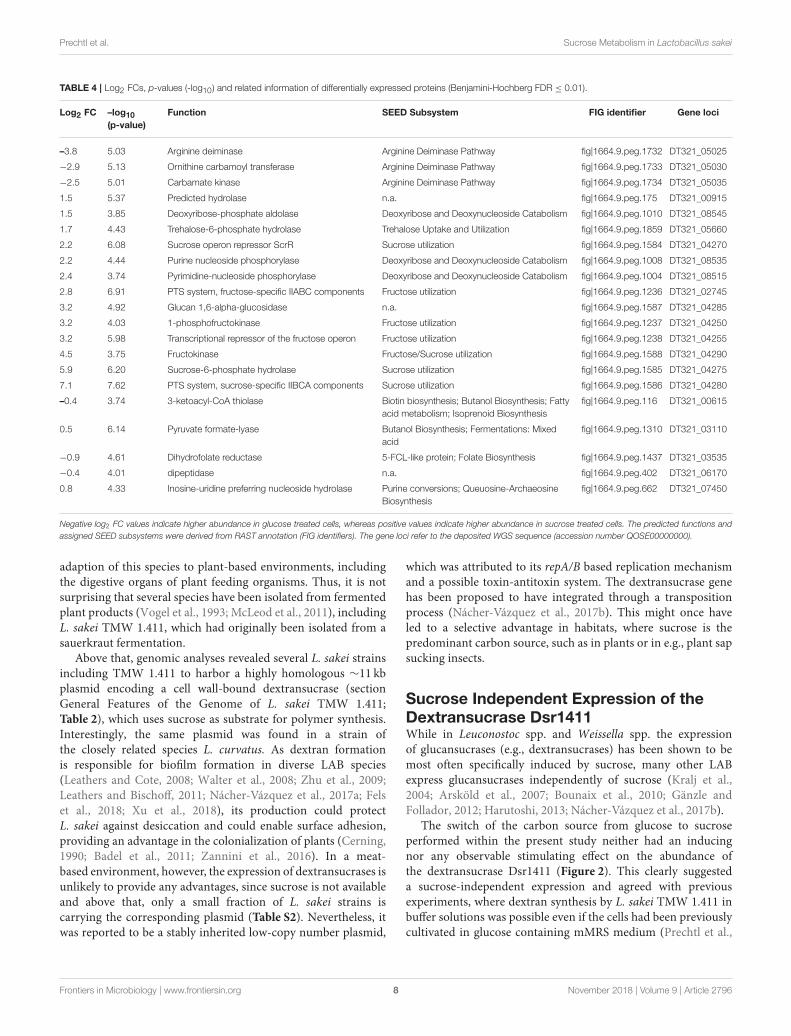
TABLE 4 | Log2 FCs, p-values (-log10) and related information of differentially expressed proteins (Benjamini-Hochberg FDR ≤ 0.01).
Log2 FC –log10(p-value)
Function SEED Subsystem FIG identifier Gene loci
–3.8 5.03 Arginine deiminase Arginine Deiminase Pathway fig|1664.9.peg.1732 DT321_05025
−2.9 5.13 Ornithine carbamoyl transferase Arginine Deiminase Pathway fig|1664.9.peg.1733 DT321_05030
−2.5 5.01 Carbamate kinase Arginine Deiminase Pathway fig|1664.9.peg.1734 DT321_05035
1.5 5.37 Predicted hydrolase n.a. fig|1664.9.peg.175 DT321_00915
1.5 3.85 Deoxyribose-phosphate aldolase Deoxyribose and Deoxynucleoside Catabolism fig|1664.9.peg.1010 DT321_08545
1.7 4.43 Trehalose-6-phosphate hydrolase Trehalose Uptake and Utilization fig|1664.9.peg.1859 DT321_05660
2.2 6.08 Sucrose operon repressor ScrR Sucrose utilization fig|1664.9.peg.1584 DT321_04270
2.2 4.44 Purine nucleoside phosphorylase Deoxyribose and Deoxynucleoside Catabolism fig|1664.9.peg.1008 DT321_08535
2.4 3.74 Pyrimidine-nucleoside phosphorylase Deoxyribose and Deoxynucleoside Catabolism fig|1664.9.peg.1004 DT321_08515
2.8 6.91 PTS system, fructose-specific IIABC components Fructose utilization fig|1664.9.peg.1236 DT321_02745
3.2 4.92 Glucan 1,6-alpha-glucosidase n.a. fig|1664.9.peg.1587 DT321_04285
3.2 4.03 1-phosphofructokinase Fructose utilization fig|1664.9.peg.1237 DT321_04250
3.2 5.98 Transcriptional repressor of the fructose operon Fructose utilization fig|1664.9.peg.1238 DT321_04255
4.5 3.75 Fructokinase Fructose/Sucrose utilization fig|1664.9.peg.1588 DT321_04290
5.9 6.20 Sucrose-6-phosphate hydrolase Sucrose utilization fig|1664.9.peg.1585 DT321_04275
7.1 7.62 PTS system, sucrose-specific IIBCA components Sucrose utilization fig|1664.9.peg.1586 DT321_04280
–0.4 3.74 3-ketoacyl-CoA thiolase Biotin biosynthesis; Butanol Biosynthesis; Fatty
acid metabolism; Isoprenoid Biosynthesis
fig|1664.9.peg.116 DT321_00615
0.5 6.14 Pyruvate formate-lyase Butanol Biosynthesis; Fermentations: Mixed
acid
fig|1664.9.peg.1310 DT321_03110
−0.9 4.61 Dihydrofolate reductase 5-FCL-like protein; Folate Biosynthesis fig|1664.9.peg.1437 DT321_03535
−0.4 4.01 dipeptidase n.a. fig|1664.9.peg.402 DT321_06170
0.8 4.33 Inosine-uridine preferring nucleoside hydrolase Purine conversions; Queuosine-Archaeosine
Biosynthesis
fig|1664.9.peg.662 DT321_07450
Negative log2 FC values indicate higher abundance in glucose treated cells, whereas positive values indicate higher abundance in sucrose treated cells. The predicted functions and
assigned SEED subsystems were derived from RAST annotation (FIG identifiers). The gene loci refer to the deposited WGS sequence (accession number QOSE00000000).
adaption of this species to plant-based environments, includingthe digestive organs of plant feeding organisms. Thus, it is notsurprising that several species have been isolated from fermentedplant products (Vogel et al., 1993; McLeod et al., 2011), includingL. sakei TMW 1.411, which had originally been isolated from asauerkraut fermentation.
Above that, genomic analyses revealed several L. sakei strainsincluding TMW 1.411 to harbor a highly homologous ∼11 kbplasmid encoding a cell wall-bound dextransucrase (sectionGeneral Features of the Genome of L. sakei TMW 1.411;Table 2), which uses sucrose as substrate for polymer synthesis.Interestingly, the same plasmid was found in a strain ofthe closely related species L. curvatus. As dextran formationis responsible for biofilm formation in diverse LAB species(Leathers and Cote, 2008; Walter et al., 2008; Zhu et al., 2009;Leathers and Bischoff, 2011; Nácher-Vázquez et al., 2017a; Felset al., 2018; Xu et al., 2018), its production could protectL. sakei against desiccation and could enable surface adhesion,providing an advantage in the colonialization of plants (Cerning,1990; Badel et al., 2011; Zannini et al., 2016). In a meat-based environment, however, the expression of dextransucrases isunlikely to provide any advantages, since sucrose is not availableand above that, only a small fraction of L. sakei strains iscarrying the corresponding plasmid (Table S2). Nevertheless, itwas reported to be a stably inherited low-copy number plasmid,
which was attributed to its repA/B based replication mechanismand a possible toxin-antitoxin system. The dextransucrase genehas been proposed to have integrated through a transpositionprocess (Nácher-Vázquez et al., 2017b). This might once haveled to a selective advantage in habitats, where sucrose is thepredominant carbon source, such as in plants or in e.g., plant sapsucking insects.
Sucrose Independent Expression of theDextransucrase Dsr1411While in Leuconostoc spp. and Weissella spp. the expressionof glucansucrases (e.g., dextransucrases) has been shown to bemost often specifically induced by sucrose, many other LABexpress glucansucrases independently of sucrose (Kralj et al.,2004; Arsköld et al., 2007; Bounaix et al., 2010; Gänzle andFollador, 2012; Harutoshi, 2013; Nácher-Vázquez et al., 2017b).
The switch of the carbon source from glucose to sucroseperformed within the present study neither had an inducingnor any observable stimulating effect on the abundance ofthe dextransucrase Dsr1411 (Figure 2). This clearly suggesteda sucrose-independent expression and agreed with previousexperiments, where dextran synthesis by L. sakei TMW 1.411 inbuffer solutions was possible even if the cells had been previouslycultivated in glucose containing mMRS medium (Prechtl et al.,
Frontiers in Microbiology | www.frontiersin.org 8 November 2018 | Volume 9 | Article 2796
Prechtl et al. Sucrose Metabolism in Lactobacillus sakei
FIGURE 3 | Log10 transformed IBAQ intensities of identified proteins, which had been isolated from cultures incubated in glucose (A) and sucrose (B). The colors
were used according to Figure 3, except for the housekeeping proteins, which were marked with black triangles. Further information (e.g., IBAQ values, FIG
identifiers) are presented in Table S1.
2018). Furthermore, it was demonstrated by gene expressionanalyses that the plasmid-encoded dextransucrase DsrLS ofL. sakei MN1 was constitutively expressed and connected toreplication and maintenance functions of the plasmid pMN1(Nácher-Vázquez et al., 2017b). Since pMN1 and p-1.411_1 wereshown to be more or less identical (Table 2), these results shouldbe transferable to the expression of Dsr1411 in L. sakei TMW1.411.
Apart from that, analysis of the IBAQ intensities of identifiedproteins suggested a surprisingly high abundance of thedextransucrase Dsr1411 in the cellular proteome, which was evencomparable to those of common housekeeping proteins, such asthe RNA polymerase sigma factor RpoD (Figure 3 and Table S1).The structural characterization of the dextran produced byDsr1411 was published only recently by our group (Prechtl et al.,2018), and the results (e.g., molecular weight) were similar tothose published for the dextrans synthesized by DsrLS (L. sakeiMN1) and Gtf1624 (L. curvatus TMW 1.624) (Ruhmkorf et al.,2012; Nácher-Vázquez et al., 2015).
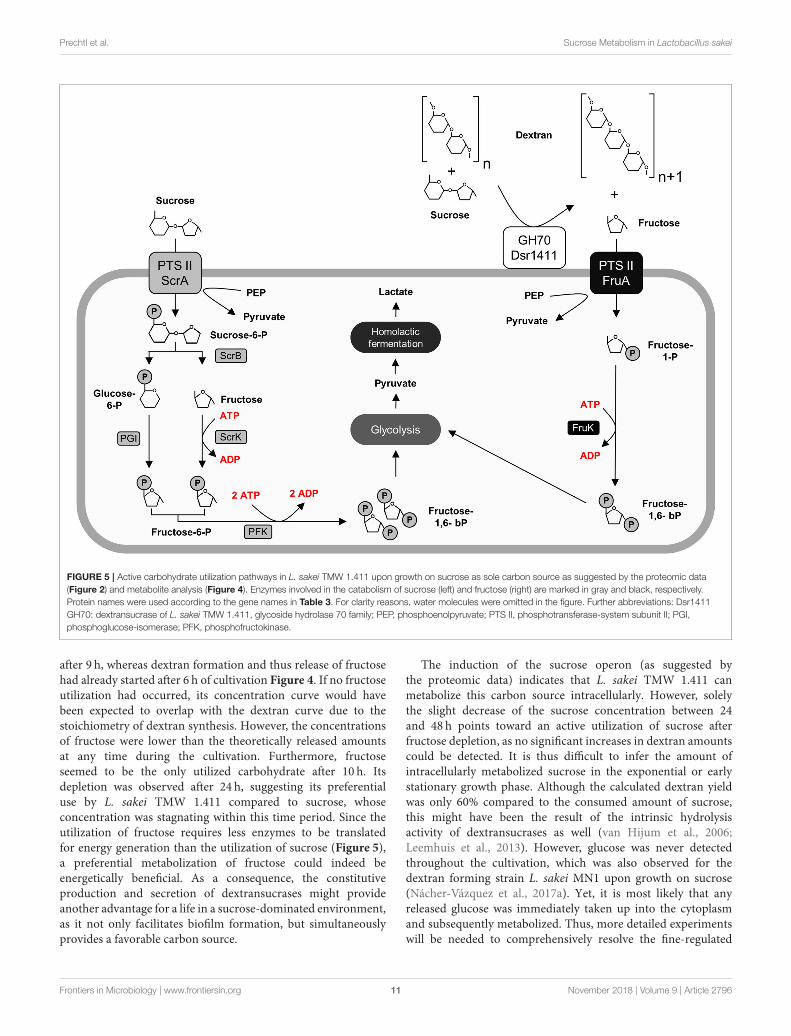
Global Proteomic Response of L. sakeiTMW 1.411 to SucroseAfter the performed switch to sucrose as sole carbon source,the upregulation of both the sucrose and the fructose operonwas detected. The upregulation of the fructose operon, whichcontains a fructose uptake system, indicates the active uptakeof extracellular fructose at an early stage of growth. Thiscould be explained by the simultaneous secretion of activedextransucrases (section Sucrose Independent Expression of the
Dextransucrase Dsr1411), which extracellularly release fructose.The correspondingmetabolic pathways are described in Figure 5.
Furthermore, the glucan-1,6-α-glucosidase DexB wasupregulated in the sucrose treated cells suggesting induceddextran degradation. Although DexB of L. acidophilus NCFM(60% amino acid identity) was demonstrated to be active ondextran (Møller et al., 2012), neither of the two DexB variantscontains a N-terminal signal peptide targeting its secretioninto the extracellular environment according to SignalPanalysis (Petersen et al., 2011). This conforms with the generalassumption, that high molecular weight EPS does not primarilyserve as a carbon reserve for the producer strains (Zannini et al.,2016), as active uptake of such high molecular weight polymershas not been reported to our knowledge. The upregulationof this enzyme might rather be indicative for uptake andmetabolization of short-chain isomaltooligosaccharides (IMO),which could be produced by dextransucrases in additionto high molecular weight dextran. However, their possibleimport mechanism remains unclear, while it was reported thatfructooligosaccharides (FOS) are efficiently imported by the PTSsucrose transport system in L. plantarum (Saulnier et al., 2007).
Apart from the enzymes accounting for the intracellularutilization of sucrose and fructose, three further enzymeswere upregulated upon growth on sucrose, which areinvolved in the catabolism of deoxyribose-nucleosides(Figure 2, orange). This pathway includes three majorsteps: (i) release of 2-deoxyribose-1-phosphate frompurine/pyrimidine-deoxynucleosides by the correspondingphosphorylases (EC 2.4.2.1/2.4.2.2); (ii) interconversion of
Frontiers in Microbiology | www.frontiersin.org 9 November 2018 | Volume 9 | Article 2796
Prechtl et al. Sucrose Metabolism in Lactobacillus sakei
FIGURE 4 | EPS and metabolite concentrations during growth of L. sakei
TMW 1.411 in mMRS medium supplemented with 50 g/L sucrose. (A) Viable
cell count (�) and dextran concentration (◦) in glucose equivalents (glc. equ.).
(B) Sucrose (�), fructose (◦) and lactate (N) concentrations. Error bars are
standard deviations of triplicate measurements from two biological replicates
(n = 6).
2-deoxyribose-1-phosphate and 2-deoxyribose-5-phosphateby phosphopentomutase (EC 5.4.2.7); (iii) formation ofacetaldehyde and the glycolysis intermediate glyceraldehyde-3-phosphate by deoxyribose-phosphate aldolase (EC 4.1.2.4)(Tozzi et al., 2006). All enzymes of this pathway were significantlyupregulated after sucrose treatment (Figure 2), except for thephosphopentomutase (gene locus DT321_08540), whoseupregulation (log2 FC= 1.2) was only significant at less stringentt-Test criteria (FDR ≤ 0.05; Table S3). Interestingly, the sameenzymes where shown to be upregulated in some L. sakei strainsafter a switch of the carbon source from glucose to riboseby a transcriptomic approach (McLeod et al., 2011). As theupregulation of these proteins can currently not be relatedto sucrose metabolism, their differential expression could beinterpreted as general response to the change of the carbonsource, e.g., to maintain glycolytic reactions during starvationuntil the organism has adapted to the new carbon source.However, further experimental analyses are necessary to confirmthis hypothesis, since other factors such as glucose mediatedcarbon catabolite repression (CCR) might play a role as well.
Upon growth on glucose only three proteins were detected,which were more abundant in the presence of glucose (and thusdownregulated after sucrose treatment). These proteins belongedto the arginine-deiminase (ADI) pathway (Figure 2, red), whichinvolves three enzymes being encoded in the arc operon,namely (i) arginine deiminase (arcA, EC 3.5.3.6), (ii) ornithinecarbamoyltransferase (arcB, EC 2.1.3.3) and (iii) carbamatekinase (arcC, EC 2.7.2.2). This pathway enables the synthesis ofATP from arginine upon formation of NH3, CO2 and ornithine,and was therefore supposed to provide a metabolic advantage innutrient-poor, meat-based environments (Rimaux et al., 2011).Apart from that, several other physiological functions of theADI pathway have been discussed, including de novo pyrimidinesynthesis and the cytoplasmic alkalization by NH3 as protectionagainst acid stress (Arena et al., 1999; Rimaux et al., 2011).
Basically, the arc operon has been shown to be subjectedto CcpA/HPr mediated carbon catabolite repression (CCR),which is initiated at high concentrations of ATP and fructose-1,6-bisphosphate (FBP) in the presence of a preferred carbonsource (Montel and Champomier, 1987; Deutscher et al., 1995;Fernández and Zúñiga, 2006; Görke and Stülke, 2008; Landmannet al., 2011). The mechanism involves regulatory cre sites inpromotor regions, which are targeted by the CcpA/HPr complex,and both cre sites identified upstream of the arcA gene in L. sakei23K (Zúñiga et al., 1998) are present in L. sakei TMW 1.411as well (positions −124 and −44 from the start codon of arcA,gene locus DT321_05025). However, the ADI pathway shouldbe downregulated in the glucose treated cultures, if glucose werethe preferred carbon source of L. sakei TMW 1.411 for energygeneration and concomitant lactate production.
With respect to the alkalizing function of the ADI pathway,the pH values measured prior to protein isolation indeedsuggested a slightly stronger acidification by the cells incubatedin glucose containing mMRS medium (section Comparison ofthe Proteomic States Associated With Growth in Glucose andSucrose), which might be explained by the lack of a metabolicswitch to sucrose utilization. Although the difference in the pHvalues of both batches was only small (0.07 pH units), it wasstatistically significant (p= 0.01) and might point to an increasedlactate formation from glucose. Hence, it is possible that theADI pathway was upregulated in the glucose treated cells tocompensate for a faster lactate formation in the presence of thiscarbohydrate. However, this hypothesis cannot be proven by theavailable data and has to be examined in future experiments, as itis beyond the scope of the present work.
Carbohydrate Utilization of L. sakei TMW1.411 Upon Simultaneous DextranFormationEvaluation of the proteomic data had revealed the upregulationof the fructose operon after 2 h of sucrose exposure, whichsuggested a utilization of this carbon source already at an earlystage (section Global Proteomic Response of L. sakei TMW 1.411to Sucrose). Monitoring of the fructose concentration duringgrowth on sucrose containing mMRS medium confirmed thisfinding, since fructose was detectable in the supernatant only
Frontiers in Microbiology | www.frontiersin.org 10 November 2018 | Volume 9 | Article 2796
Prechtl et al. Sucrose Metabolism in Lactobacillus sakei
FIGURE 5 | Active carbohydrate utilization pathways in L. sakei TMW 1.411 upon growth on sucrose as sole carbon source as suggested by the proteomic data
(Figure 2) and metabolite analysis (Figure 4). Enzymes involved in the catabolism of sucrose (left) and fructose (right) are marked in gray and black, respectively.
Protein names were used according to the gene names in Table 3. For clarity reasons, water molecules were omitted in the figure. Further abbreviations: Dsr1411
GH70: dextransucrase of L. sakei TMW 1.411, glycoside hydrolase 70 family; PEP, phosphoenolpyruvate; PTS II, phosphotransferase-system subunit II; PGI,
phosphoglucose-isomerase; PFK, phosphofructokinase.
after 9 h, whereas dextran formation and thus release of fructosehad already started after 6 h of cultivation Figure 4. If no fructoseutilization had occurred, its concentration curve would havebeen expected to overlap with the dextran curve due to thestoichiometry of dextran synthesis. However, the concentrationsof fructose were lower than the theoretically released amountsat any time during the cultivation. Furthermore, fructoseseemed to be the only utilized carbohydrate after 10 h. Itsdepletion was observed after 24 h, suggesting its preferentialuse by L. sakei TMW 1.411 compared to sucrose, whoseconcentration was stagnating within this time period. Since theutilization of fructose requires less enzymes to be translatedfor energy generation than the utilization of sucrose (Figure 5),a preferential metabolization of fructose could indeed beenergetically beneficial. As a consequence, the constitutiveproduction and secretion of dextransucrases might provideanother advantage for a life in a sucrose-dominated environment,as it not only facilitates biofilm formation, but simultaneouslyprovides a favorable carbon source.
The induction of the sucrose operon (as suggested bythe proteomic data) indicates that L. sakei TMW 1.411 canmetabolize this carbon source intracellularly. However, solelythe slight decrease of the sucrose concentration between 24and 48 h points toward an active utilization of sucrose afterfructose depletion, as no significant increases in dextran amountscould be detected. It is thus difficult to infer the amount ofintracellularly metabolized sucrose in the exponential or earlystationary growth phase. Although the calculated dextran yieldwas only 60% compared to the consumed amount of sucrose,this might have been the result of the intrinsic hydrolysisactivity of dextransucrases as well (van Hijum et al., 2006;Leemhuis et al., 2013). However, glucose was never detectedthroughout the cultivation, which was also observed for thedextran forming strain L. sakei MN1 upon growth on sucrose(Nácher-Vázquez et al., 2017a). Yet, it is most likely that anyreleased glucose was immediately taken up into the cytoplasmand subsequently metabolized. Thus, more detailed experimentswill be needed to comprehensively resolve the fine-regulated
Frontiers in Microbiology | www.frontiersin.org 11 November 2018 | Volume 9 | Article 2796
Prechtl et al. Sucrose Metabolism in Lactobacillus sakei
sucrose utilization of L. sakei TMW 1.411 during dextranformation, whereas transcriptomic analyses might help to resolvecomplex up-/downregulation events of the operons throughoutthe cultivation.
AUTHOR CONTRIBUTIONS
RP performed and planned the main experimental workpresented in this manuscript and wrote the main text ofthe manuscript. DJ was involved in some experimental work.JB, CL, and BK were involved in conducting and evaluatingthe proteomic experiments. RV was involved in planningthe experimental setup and writing the manuscript. FJ wasinvolved in planning the experimental setup and in writing themanuscript.
FUNDING
This work was supported by the German Research Foundation(DFG) and the Technische Universität München within the
funding program Open Access Publishing. Part of this work wassupported by the German Federal Ministry for Economic Affairsand Energy via the German Federation of Industrial ResearchAssociations (AiF) and the Research Association of the GermanFood Industry (FEI), project numbers AiF 18357N and AiF19690N.
SUPPLEMENTARY MATERIAL
The Supplementary Material for this article can be foundonline at: https://www.frontiersin.org/articles/10.3389/fmicb.2018.02796/full#supplementary-material
Figure S1 | Overview of the experimental steps for the analysis of
sucrose-induced changes in the proteomic profile of L. sakei TMW 1.411. This
figure is partly based on Figure 1 of Schott et al. (2017).
Table S1 | Proteome tables and IBAQ values.
Table S2 | Operon and dextransucrase conservation.
Table S3 | t-Test evaluation.
Table S4 | RAST annotated ORFs of the L. sakei TMW 1.411 genome.
REFERENCES
Ahrné, E., Molzahn, L., Glatter, T., and Schmidt, A. (2013). Critical assessment of
proteome-wide label-free absolute abundance estimation strategies. Proteomics
13, 2567–2578. doi: 10.1002/pmic.201300135
Amadoro, C., Rossi, F., Piccirilli, M., and Colavita, G. (2015). Features
of Lactobacillus Sakei isolated from italian sausages: focus on strains
from ventricina del vastese. Ital. J. Food Saf. 4:5449. doi: 10.4081/ijfs.
2015.5449
Arena, M. E., Saguir, F. M., and Manca de Nadra, M. C. (1999). Arginine
dihydrolase pathway in Lactobacillus plantarum from orange. Int. J. Food
Microbiol. 47, 203–209. doi: 10.1016/S0168-1605(99)00004-5
Arsköld, E., Svensson, M., Grage, H., Roos, S., Rådström, P., and van Niel,
E. W. (2007). Environmental influences on exopolysaccharide formation in
Lactobacillus reuteri ATCC 55730. Int. J. Food Microbiol. 116, 159–167.
doi: 10.1016/j.ijfoodmicro.2006.12.010
Aziz, R. K., Bartels, D., Best, A. A., DeJongh, M., Disz, T., Edwards, R. A., et al.
(2008). The RAST Server: rapid annotations using subsystems technology.
BMC Genomics 9:75. doi: 10.1186/1471-2164-9-75
Badel, S., Bernardi, T., and Michaud, P. (2011). New perspectives
for Lactobacilli exopolysaccharides. Biotechnol. Adv. 29, 54–66.
doi: 10.1016/j.biotechadv.2010.08.011
Bounaix, M.-S., Robert, H., Gabriel, V., Morel, S., Remaud-Siméon, M.,
Gabriel, B., et al. (2010). Characterization of dextran-producing Weissella
strains isolated from sourdoughs and evidence of constitutive dextransucrase
expression. FEMS Microbiol. Lett. 311, 18–26. doi: 10.1111/j.1574-6968.2010.
02067.x
Cerning, J. (1990). Exocellular polysaccharides produced by lactic acid
bacteria. FEMS Microbiol. Lett. 87, 113–130. doi: 10.1111/j.1574-6968.1990.
tb04883.x
Chaillou, S., Champomier-Vergès, M. C., Cornet, M., Crutz-Le Coq, A. M.,
Dudez, A. M., Martin, V., et al. (2005). The complete genome sequence of the
meat-borne lactic acid bacterium Lactobacillus sakei 23K. Nat. Biotechnol. 23,
1527–1533. doi: 10.1038/nbt1160
Champomier-Vergès, M. C., Chaillou, S., Cornet, M., and Zagorec, M. (2001).
Lactobacillus sakei: recent developments and future prospects. Res. Microbiol.
152, 839–848. doi: 10.1016/S0923-2508(01)01267-0
Cox, J., Hein, M. Y., Luber, C. A., Paron, I., Nagaraj, N., Mann, M. (2014).
Accurate Proteome-wide Label-free quantification by delayed normalization
and maximal peptide ratio extraction, termed maxLFQ. Mol. Cell. Proteomics
13, 2513–2526. doi: 10.1074/mcp.M113.031591
Cox, J., Neuhauser, N., Michalski, A., Scheltema, R. A., Olsen, J. V., and Mann,
M. (2011). Andromeda: a peptide search engine integrated into the MaxQuant
environment. J. Proteome Res. 10, 1794–1805. doi: 10.1021/pr101065j
Deutscher, J., Küster, E., Bergstedt, U., Charrier, V., and Hillen, W. (1995). Protein
kinase-dependent HPr/CcpA interaction links glycolytic activity to carbon
catabolite repression in Gram-positive bacteria.Mol. Microbiol. 15, 1049–1053.
doi: 10.1111/j.1365-2958.1995.tb02280.x
Fadda, S., Anglade, P., Baraige, F., Zagorec, M., Talon, R., Vignolo, G., et al. (2010).
Adaptive response of Lactobacillus sakei 23K during growth in the presence
of meat extracts: a proteomic approach. Int. J. Food Microbiol. 142, 36–43.
doi: 10.1016/j.ijfoodmicro.2010.05.014
Fels, L., Jakob, F., Vogel, R. F., and Wefers, D. (2018). Structural characterization
of the exopolysaccharides from water kefir. Carbohydr. Polym. 189, 296–303.
doi: 10.1016/j.carbpol.2018.02.037
Fernández,M., and Zúñiga,M. (2006). Amino acid catabolic pathways of lactic acid
bacteria. Crit. Rev. Microbiol. 32, 155–183. doi: 10.1080/10408410600880643
Gänzle, M. G., and Follador, R. (2012). Metabolism of oligosaccharides and starch
in lactobacilli: a review. Front. Microbiol. 3:340. doi: 10.3389/fmicb.2012.00340
Görke, B., and Stülke, J. (2008). Carbon catabolite repression in bacteria: many
ways to make the most out of nutrients. Nat. Rev. Microbiol. 6, 613–624.
doi: 10.1038/nrmicro1932
Hammes, W. P., Bantleon, A., and Min, S. (1990). Lactic acid
bacteria in meat fermentation. FEMS Microbiol. Lett. 87, 165–174.
doi: 10.1111/j.1574-6968.1990.tb04886.x
Harutoshi, T. (2013). Exopolysaccharides of Lactic Acid Bacteria for Food and
Colon Health Applications. Lactic Acid Bacteria, ed M. Kongo, IntechOpen.
Available online at: https://www.intechopen.com/books/lactic-acid-bacteria-
r-d-for-food-health-and-livestock-purposes/exopolysaccharides-of-lactic-
acid-bacteria-for-food-and-colon-health-applications
Hüfner, E., Markieton, T., Chaillou, S., Crutz-Le Coq, A. M., Zagorec, M., and
Hertel, C. (2007). Identification of Lactobacillus sakei genes induced during
meat fermentation and their role in survival and growth. Appl. Environ.
Microbiol. 73, 2522–2531. doi: 10.1128/AEM.02396-06
Kafka, T. A., Geissler, A. J., and Vogel, R. F. (2017). Multiple genome
sequences of Lactobacillus plantarum strains. Genome Announc. 5:e00654-17.
doi: 10.1128/genomeA.00654-17
Kralj, S., van Geel-Schutten, G. H., Dondorff, M. M., Kirsanovs, S., van der Maarel,
M. J., and Dijkhuizen, L. (2004). Glucan synthesis in the genus Lactobacillus:
isolation and characterization of glucansucrase genes, enzymes and glucan
products from six different strains. Microbiology 150(Pt 11), 3681–3690.
doi: 10.1099/mic.0.27321-0
Frontiers in Microbiology | www.frontiersin.org 12 November 2018 | Volume 9 | Article 2796
Prechtl et al. Sucrose Metabolism in Lactobacillus sakei
Landmann, J. J., Busse, R. A., Latz, J. H., Singh, K. D., Stülke, J., and Görke,
B. (2011). Crh, the paralogue of the phosphocarrier protein HPr, controls
the methylglyoxal bypass of glycolysis in Bacillus subtilis. Mol. Microbiol. 82,
770–787. doi: 10.1111/j.1365-2958.2011.07857.x
Leathers, T. D., and Bischoff, K. M. (2011). Biofilm formation by strains of
Leuconostoc citreum and L. mesenteroides. Biotechnol. Lett. 33, 517–523.
doi: 10.1007/s10529-010-0450-2
Leathers, T. D., and Cote, G. L. (2008). Biofilm formation by exopolysaccharide
mutants of Leuconostoc mesenteroides strain NRRL B-1355. Appl. Microbiol.
Biotechnol. 78, 1025–1031. doi: 10.1007/s00253-008-1384-7
Leemhuis, H., Pijning, T., Dobruchowska, J. M., van Leeuwen, S. S.,
Kralj, S., Dijkstra, B. W., et al. (2013). Glucansucrases: three-dimensional
structures, reactions, mechanism, alpha-glucan analysis and their implications
in biotechnology and food applications. J. Biotechnol. 163, 250–272.
doi: 10.1016/j.jbiotec.2012.06.037
Liu, X., Hu, Y., Pai, P. J., Chen, D., and Lam, H. (2014). Label-free quantitative
proteomics analysis of antibiotic response in Staphylococcus aureus to oxacillin.
J. Proteome Res. 13, 1223–1233. doi: 10.1021/pr400669d
McLeod, A., Snipen, L., Naterstad, K., and Axelsson, L. (2011). Global
transcriptome response in Lactobacillus sakei during growth on ribose. BMC
Microbiol. 11:145. doi: 10.1186/1471-2180-11-145
McLeod, A., Zagorec,M., Champomier-Vergès,M. C., Naterstad, K., and Axelsson,
L. (2010). Primary metabolism in Lactobacillus sakei food isolates by proteomic
analysis. BMCMicrobiol. 10:120. doi: 10.1186/1471-2180-10-120
Møller, M. S., Fredslund, F., Majumder, A., Nakai, H., Poulsen, J. C., Lo
Leggio, L., et al. (2012). Enzymology and structure of the GH13_31 glucan
1,6-alpha-glucosidase that confers isomaltooligosaccharide utilization in the
probiotic Lactobacillus acidophilus NCFM. J. Bacteriol. 194, 4249–4259.
doi: 10.1128/JB.00622-12
Montel, M. C., and Champomier, M. C. (1987). Arginine catabolism in
Lactobacillus sake isolated frommeat. Appl. Environ. Microbiol. 53, 2683–2685.
Nácher-Vázquez, M., Ballesteros, N., Canales, A., Rodríguez Saint-Jean, S., Pérez-
Prieto, S. I., Prieto, A., et al. (2015). Dextrans produced by lactic acid bacteria
exhibit antiviral and immunomodulatory activity against salmonid viruses.
Carbohydr. Polym. 124, 292–301. doi: 10.1016/j.carbpol.2015.02.020
Nácher-Vázquez, M., Iturria, I., Zarour, K., Mohedano, M. L., Aznar, R., Pardo,
M. A., et al. (2017a). Dextran production by Lactobacillus sakeiMN1 coincides
with reduced autoagglutination, biofilm formation and epithelial cell adhesion.
Carbohydr. Polym. 168, 22–31. doi: 10.1016/j.carbpol.2017.03.024
Nácher-Vázquez, M., Ruiz-Maso, J. A., Mohedano, M. L., Del Solar, G., Aznar, R.,
and Lopez, P. (2017b). Dextransucrase expression is concomitant with that of
replication and maintenance functions of the pMN1 plasmid in Lactobacillus
sakeiMN1. Front. Microbiol. 8:2281. doi: 10.3389/fmicb.2017.02281
Petersen, T. N., Brunak, S., von Heijne, G., and Nielsen, H. (2011). SignalP 4.0:
discriminating signal peptides from transmembrane regions. Nat. Methods 8,
785–786. doi: 10.1038/nmeth.1701
Prechtl, R. M., Wefers, D., Jakob, F., and Vogel, R. F. (2018). Cold
and salt stress modulate amount, molecular and macromolecular
structure of a Lactobacillus sakei dextran. Food Hydrocolloids. 82, 73–81.
doi: 10.1016/j.foodhyd.2018.04.003
Rimaux, T., Rivière, A., Illeghems, K.,Weckx, S., De Vuyst, L., and Leroy, F. (2012).
Expression of the arginine deiminase pathway genes in Lactobacillus sakei
is strain dependent and is affected by the environmental pH. Appl. Environ.
Microbiol. 78, 4874–4883. doi: 10.1128/AEM.07724-11
Rimaux, T., Vrancken, G., Pothakos, V., Maes, D., De Vuyst, L., and Leroy, F.
(2011). The kinetics of the arginine deiminase pathway in the meat starter
culture Lactobacillus sakei CTC 494 are pH-dependent. Food Microbiol. 28,
597–604. doi: 10.1016/j.fm.2010.11.016
Ruhmkorf, C., Rubsam, H., Becker, T., Bork, C., Voiges, K., Mischnick, P.,
et al. (2012). Effect of structurally different microbial homoexopolysaccharides
on the quality of gluten-free bread. Eur. Food Res. Technol. 235, 139–146.
doi: 10.1007/s00217-012-1746-3
Saulnier, D. M., Molenaar, D., de Vos, W. M., Gibson, G. R., and Kolida, S. (2007).
Identification of prebiotic fructooligosaccharide metabolism in Lactobacillus
plantarum WCFS1 through microarrays. Appl. Environ. Microbiol. 73,
1753–1765. doi: 10.1128/AEM.01151-06
Schott, A. S., Behr, J., Geißler, A. J., Kuster, B., Hahne, H., and Vogel, R. F. (2017).
Quantitative proteomics for the comprehensive analysis of stress responses of
Lactobacillus paracasei subsp. paracasei F19. J. Proteome Res. 16, 3816–3829.
doi: 10.1021/acs.jproteome.7b00474
Schwanhäusser, B., Busse, D., Li, N., Dittmar, G., Schuchhardt, J., Wolf, J., et al.
(2011). Global quantification of mammalian gene expression control. Nature
473, 337–342. doi: 10.1038/nature10098
Stolz, P., Bocker, G., Hammes, W. P., and Vogel, R. F. (1995). Utilization
of electron-acceptors by lactobacilli isolated from sourdough. Zeitschr.
LebensmittelUntersuchung Forschung 201, 91–96. doi: 10.1007/BF01193208
Tatusova, T., DiCuccio, M., Badretdin, A., Chetvernin, V., Nawrocki, E. P.,
Zaslavsky, L., et al. (2016). NCBI prokaryotic genome annotation pipeline.
Nucleic Acids Res. 44, 6614–6624. doi: 10.1093/nar/gkw569
Torriani, S., Van Reenen, C. A., Klein, G., Reuter, G., Dellaglio, F., and Dicks, L. M.
T. (1996). Lactobacillus curvatus subsp. curvatus subsp. nov. and Lactobacillus
curvatus subsp. melibiosus subsp. nov. and Lactobacillus sake subsp. sake
subsp. nov. and Lactobacillus sake subsp. carnosus subsp. nov., New Subspecies
of Lactobacillus curvatus Abo-Elnaga and Kandler 1965 and Lactobacillus sake
Katagiri, Kitahara, and Fukami 1934 (Klein et al. 1996, Emended Descriptions),
Respectively. Int. J. Syst. Evol. Microbiol. 46, 1158–1163.
Tozzi, M. G., Camici, M., Mascia, L., Sgarrella, F., and Ipata, P. L. (2006).
Pentose phosphates in nucleoside interconversion and catabolism. FEBS J. 273,
1089–1101. doi: 10.1111/j.1742-4658.2006.05155.x
Tyanova, S., Temu, T., Sinitcyn, P., Carlson, A., Hein, M. Y., Geiger, T., et al.
(2016). The Perseus computational platform for comprehensive analysis of
(prote)omics data. Nat. Methods 13, 731–740. doi: 10.1038/nmeth.3901
van Hijum, S. A., Kralj, S., Ozimek, L. K., Dijkhuizen, L., and van Geel-Schutten, I.
G. (2006). Structure-function relationships of glucansucrase and fructansucrase
enzymes from lactic acid bacteria. Microbiol. Mol. Biol. Rev. 70, 157–176.
doi: 10.1128/MMBR.70.1.157-176.2006
Vogel, R. F., Lohmann, M., Nguyen, M., Weller, A. N., and Hammes, W. P.
(1993). Molecular characterization of Lactobacillus curvatus and Lact. sake
isolated from sauerkraut and their application in sausage fermentations. J. Appl.
Bacteriol. 74, 295–300. doi: 10.1111/j.1365-2672.1993.tb03029.x
Walter, J., Schwab, C., Loach, D. M., Gänzle, M. G., and Tannock, G. W. (2008).
Glucosyltransferase A (GtfA) and inulosucrase (Inu) of Lactobacillus reuteri
TMW1.106 contribute to cell aggregation, in vitro biofilm formation, and
colonization of the mouse gastrointestinal tract.Microbiology 154 (Pt 1), 72–80.
doi: 10.1099/mic.0.2007/010637-0
Xu, D., Fels, L., Wefers, D., Behr, J., Jakob, F., and Vogel, R. F. (2018). Lactobacillus
hordei dextrans induce Saccharomyces cerevisiae aggregation and network
formation on hydrophilic surfaces. Int. J. Biol. Macromol. 115, 236–242.
doi: 10.1016/j.ijbiomac.2018.04.068
Zagorec, M., and Champomier-Vergès, M. C. (2017). Lactobacillus sakei: a
starter for sausage fermentation, a protective culture for meat products.
Microorganisms 5:56. doi: 10.3390/microorganisms5030056
Zannini, E., Waters, D. M., Coffey, A., and Arendt, E. K. (2016). Production,
properties, and industrial food application of lactic acid bacteria-
derived exopolysaccharides. Appl. Microbiol. Biotechnol. 100, 1121–1135.
doi: 10.1007/s00253-015-7172-2
Zhu, M., Ajdic, D., Liu, Y., Lynch, D., Merritt, J., and Banas, J. A. (2009). Role of
the Streptococcus mutans irvA gene in GbpC-independent, dextran-dependent
aggregation and biofilm formation. Appl. Environ. Microbiol. 75, 7037–7043.
doi: 10.1128/AEM.01015-09
Zúñiga, M., Champomier-Verges, M., Zagorec, M., and Pérez-Martínez, G. (1998).
Structural and functional analysis of the gene cluster encoding the enzymes
of the arginine deiminase pathway of lactobacillus sake. J. Bacteriol. 180,
4154–4159.
Conflict of Interest Statement: The authors declare that the research was
conducted in the absence of any commercial or financial relationships that could
be construed as a potential conflict of interest.
Copyright © 2018 Prechtl, Janßen, Behr, Ludwig, Küster, Vogel and Jakob. This is an
open-access article distributed under the terms of the Creative Commons Attribution
License (CC BY). The use, distribution or reproduction in other forums is permitted,
provided the original author(s) and the copyright owner(s) are credited and that the
original publication in this journal is cited, in accordance with accepted academic
practice. No use, distribution or reproduction is permitted which does not comply
with these terms.
Frontiers in Microbiology | www.frontiersin.org 13 November 2018 | Volume 9 | Article 2796