Embed Size (px)
Citation preview
Report
Shaping policy for development odi.org
Successful trade promotion
Lessons from emerging economies
Clara Brandi
Support for trade-related infrastructure, trade facilitation and effective
state–business relations can improve trade performance.
The emerging economies China, India and Brazil have successfully
supported their trade performance and offer lessons for low-income
countries (LICs):
Infrastructure: establish a favourable institutional environment, seek
domestic institutional investors and foreign investment and support
public–private partnerships (PPPs).
Trade Facilitation: boost the use of information and communication
technology (ICT), promote electronic data interchange (EDI) and
single window facilities and minimise physical inspections.
State-Business Relations: build capacity for effective state-business
relations, address vested interests that resist reform and create a
sound framework for competition.
June 2013
Acknowledgements
The author is highly grateful for the helpful comments received from a number of experts,
including Yurendra Basnett, Andre Coelho, Cao Jianping, Alexandre Nicolella, Abilash
Puljal, Ram Singh, Surendar Singh, Dirk Willem te Velde and other anonymous reviewers.
The author is also grateful for Roo Griffiths for editing the final paper.
This report is funded by the Development Progress Project. The findings and conclusions
contained within are those of the authors.
ODI Report i
Table of contents
Acknowledgements ii
Abbreviations iii
Executive summary vi
1 Introduction 1
2 Successful trade performance in emerging economies 2
2.1 Trade performance in China, India and Brazil 2 2.2 Introducing the framework for analysis 3
3 Country case: China 10
3.1 Trade-related infrastructure in China 10 3.2 Trade facilitation in China 14 3.3 State–business relations in China 18
4 Country case: India 20
4.1 Trade-related infrastructure in India 20 4.2 Trade facilitation in India 26 4.3 State–business relations in India 28
5 Country case: Brazil 30
5.1 Trade-related infrastructure in Brazil 30 5.2 Trade facilitation in Brazil 33 5.3 State–business relations in Brazil 35
6 Lessons: what can we learn from emergin economies? 36
6.1 Lessons for trade-related infrastructure 36 6.2 Lessons for trade facilitation 40 6.3 Lessons for state–business relations 44
References 47
Tables
Table 1: Selected infrastructure indicators for China, India and Brazil 4 Table 2: Trading Across Borders 2012 – China, India, Brazil 6 Table 3: Logistics Performance Index 2012 7 Table 4: Existence of an umbrella organisation? 8 Table 5: Existence of an investment promotion agency? 9 Table 6: Existence of competition policies? 9 Table 7: Trading Across Borders indicators – China 14

ODI Report ii
Table 8: Customs modernisation in China 15 Table 9: Trading Across Borders indicators – India 26 Table 10: Investment plans – infrastructure in Brazil 30 Table 11: Trading Across Borders indicators – Brazil 33
ODI Report iii
Abbreviations
AAI Airports Authority of India
ACP Accredited Client Programme
ADB Asian Development Bank
ARTNeT Asia-Pacific Research and Training Network on Trade
BNDES Brazilian Development Bank
BOT Build, Operate and Transfer
BRIC Brazil, Russia, India, China
CBEC Central Board of Excise and Customs
CDS Credit Default Swap
CFS Container Freight System
CIRC China Insurance Regulatory Commission
COMESA Common Market for East and Southern Africa
CTTTFP Comprehensive Trade and Transport Facilitation Programme
DIE German Development Institute
DSE Simplified Export Declaration
EAC East African Community
EC European Commission
ECB External Commercial Borrowing
ECDPM European Centre for Development Policy Management
EDI Electronic Data Interchange
EPC Engineering, Procurement and Construction
FDI Foreign Direct Investment
ODI Report iv
FICCI Federation of Indian Chambers of Commerce and Industry
FII Foreign Institutional Investor
f.o.b. Free On Board
FTA Free Trade Agreement
FTP Foreign Trade Policy
GDP Gross Domestic Product
HIDZ High-Tech Industrial Development Zone
ICD Inland Container Depot
ICEGATE Indian Customs and Excise Gateway
ICES Indian Customs EDI Systems
ICT Information and Communication Technology
IDF Infrastructure Debt Fund
IDFC Infrastructure Development Finance Corporation Ltd.
IFC International Finance Corporation
IIFCL India Infrastructure Finance Company Limited
IPA Investment Promotion Agency
ISI Import Substitution and Industrialisation
IT Information Technology
LCS Land Clearance Station
LIC Low-Income Country
LICF Low-Income Country Infrastructure Fund
LPI Logistical Performance Index
NDRC National Development and Reform Commission
NHDP National Highways Development Project
NIDB National Import Data Base
NPS New Pension Scheme
NTHS National Trunk Highway System
O&M Operations and Maintenance
ODA Official Development Assistance
ODI Report v
ODI Overseas Development Institute
OECD Organisation for Economic Co-operation and Development
PAC Growth Acceleration Programme
PPIAF Public–Private Infrastructure Advisory Facility
PPP Public–Private Partnership
REIDI Special Incentive Regime for Infrastructure Development
RMS Risk Management System
QFII Qualified Foreign Institutional Investor
SADC Southern African Development Community
SECEX Secretariat of Foreign Trade
SEZ Special Economic Zone
SISCOMEX Foreign Trade Integrated System
SOE State-Owned Enterprise
SPS Sanitary and Phytosanitary
SPV Special Purpose Vehicle
SWF Sovereign Wealth Fund
UK United Kingdom
UN United Nations
UNECE UN Economic Commission for Europe
UNESCAP UN Economic and Social Commission for Asia and the Pacific
UNNExT UN Network of Experts for Paperless Trade in Asia and the Pacific
US United States
VGF Viability Gap Funding
WCO World Customs Organization
WTO World Trade Organization
ODI Report vi
Executive summary
Emerging economies have been very successful in supporting their trade performance. But
how have they achieved this, and what lessons could less developed countries learn from
their experiences?
This report reviews the cases of China, India and Brazil to describe which major activities
they have implemented to improve their trade performance. Its specific contribution is to
examine how these countries have facilitated trade, focusing on the provision of
infrastructure, trade facilitation and state–business relations. The report centres, in
particular, on what worked and what lessons might be learned from these experiences for
low-income countries (LICs) to support their trade performance as a crucial engine for
economic development.
Promoting Trade: Infrastructure, Trade Facilitation and State-Business Relations
The report puts the spotlight on support for trade-related infrastructure, trade facilitation and
state–business relations because of their importance for trade performance. The high cost of
trading in many emerging economies and developing countries is a major obstacle to the
improvement of their trade performance. These costs are often the result of poor quality
infrastructure and slow and cumbersome procedures at the border. Support for trade-related
infrastructure such as roads, railways, ports, energy and telecommunication and, second,
trade facilitation and the improvement of rules and procedures that govern how goods cross
borders seek to address these binding constraints (e.g. Calì and te Velde, 2011; Duval and
Utoktham, 2011; Francois and Manchin, 2007; Helble et al., 2009; Moïsé et al., 2011;
Nordås and Piermartini, 2004; OECD, 2012; Portugal-Perez and Wilson, 2011).
Cooperation with the private sector – and state–business relations more generally – can also
contribute positively to trade performance (e.g. Ash, 2011; Rugwabiza, 2011; Simumba,
2009; te Velde, 2010a).
Experiences in Emerging Economies: China, India and Brazil
China’s centrally planned economy made infrastructure reforms to some extent less
challenging than was the case in India and Brazil, since central control of the economy
enabled the Chinese government to take risks and promoted strong integration between
planning and implementation (Leoka and Guma, 2012). Successful infrastructure
development has institutional and policy dimensions, including the approach to planning
and implementation, but the key challenge in LICs is to develop clear financing options. It
is not possible to finance infrastructure investment on the basis of traditional sources of
public finance alone. The experiences in China, India and Brazil offer insights into how
infrastructure can be financed using private sector resources.
While trade-related infrastructure typically demands huge amounts of capital, which tends
to be scarce in LICs, trade facilitation measures can be implemented swiftly once the
political will is present. The emerging economies have successfully implemented a number
of trade facilitation measures that offer some lessons for LICs. Brazil, for example, has had
positive experiences with special trade facilitation policies for low-valued exports policies,
ODI Report vii
which seek to tackle complex and expensive export formalities (Caron and Ansón, 2008).
At the same time, trade facilitation is frequently difficult to put into practice, since it often
goes against strong vested interest. It is important to overcome these political economy
challenges, for example by identifying the most relevant actors as well as their interests or
evaluating what drives or hinders reform in trade facilitation in LICs (Lui and Siziba, 2012).
Formalised state–business relations can facilitate economic performance, for example, on
the basis of better allocative efficiency of government spending and better growth and
industrial policies, but they should be disciplined by competition policies in order to prevent
them from becoming collusive rather than collaborative. The case of India illustrates that a
destructive collusive relationship can be changed into a more collaborative one when
leaders and elites manage to establish developmental coalitions (Alivelu et al., 2009).
Lessons for Trade-related Infrastructure
The experiences in China, India and Brazil illustrate how overlapping challenges that
impede private sector financing of infrastructure finance can be tackled and offer lessons for
LICs in terms of infrastructure development and financing. It is important to establish a
favourable institutional environment for infrastructure development, look for domestic
institutional investors, seek foreign investment with the support of the public sector, for
example by providing credit guarantees, and support public–private partnerships (PPPs) and
private participation in infrastructure, for instance by enhancing upstream preparation
involving sector, policy and legal and regulatory reforms (e.g. Bond et al., 2012; Croce,
2011; Leigland, 2010; Walsh et al., 2011).
Lessons for Trade Facilitation
Following the example of China, India and Brazil, it is essential for LICs to boost the use of
information and communication technology (ICT), promote electronic data interchange
(EDI) and single window facilities for submission and processing of information and
documents, support the harmonisation of documentary requirements across countries,
minimise physical inspections, in particular through adoption of risk management
techniques, and introduce industry- and sector-specific trade facilitation initiatives, such as
for agricultural products or low-valued exports (e.g. ARTNeT and UNNExT, 2012; OECD,
2012). While these trade facilitation approaches offer the potential to enhance a country’s
trade performance, improvements in trade performance also call for tackling the supply-side
constraints to a country’s potential to make use of improved trading conditions.
Lessons for State-business Relations
Effective state–business relations require safeguarding buy-in from all actors, addressing
vested interests that resist reform and creating a sound framework for competition. Capacity
building and safeguarding buy-in from all actors regarding state–business relations
necessitate a strong state that is highly committed (te Velde, 2010c). Tackling vested
interests requires coordination among other interest groups that can benefit from reform
(Ellis and Singh, 2010). Competition authorities can be important for facilitating the
coordination of such groups. Creating a sound framework for competition is essential to
making markets work efficiently to generate growth and development (Ellis and Singh,
2010). Moreover, effective state-business relations in special economic zones (SEZs) can
contribute to growth and a successful trade performance.
ODI Report 1
1 Introduction
Emerging economies have successfully supported their trade performance. This report
reviews the cases of China, India and Brazil to describe which major activities they have
implemented to improve their trade performance. Its specific contribution is to examine
how the countries have facilitated trade, focusing on the provision of infrastructure, trade
facilitation and state–business relations. Based on a review of the current literature, the
report also reviews lessons that might be learnt in low-income countries (LICs) from these
experiences.
The main part of this report reviews the following activities: promoting trade-related
infrastructure, trade facilitation and effective state–business relations. The report puts the
spotlight on support to these three activities because of their importance for trade
performance. The high cost of trading in many emerging economies and developing
countries is a major obstacle to the improvement of their trade performance and the benefits
this can generate. These costs are often the result of poor-quality infrastructure and slow
and cumbersome procedures at the border.
Support to trade-related infrastructure and trade facilitation seeks to address these binding
constraints. Recent research underlines that these activities are effective in improving trade
performance (e.g. Duval and Utoktham, 2011; Francois and Manchin, 2007; Helble et al.,
2009; Moïsé et al., 2011; Nordås and Piermartini, 2004; OECD, 2012; Portugal-Perez and
Wilson, 2011). For example, Calì and te Velde found that a $1 million increase in Aid for
Trade funding directed towards trade-related infrastructure can generate a 6% reduction in
the cost of packing, loading and transporting goods (Calì and te Velde, 2011). Research on
aid effectiveness found that each $1 of aid for trade facilitation can translate into $70 in
exports for recipients (Helble et al., 2009).
Cooperation with the private sector – and state–business relations more generally – can also
contribute positively to trade performance. Effective state–business relations can enhance
economic performance, for instance, through more efficient government spending and better
growth and industrial policies. The private sector can contribute to fostering countries’ trade
performance, for instance by developing human capacity through training, introducing
innovation and technology, supporting the integration of producers in global value chains
and undertaking trade facilitation programmes (e.g. Ash, 2011; Rugwabiza, 2011;
Simumba, 2009; te Velde, 2010a).
The report is structured as follows: Section 2 presents the successful trade performance of
China, India and Brazil, and outlines the framework for analysis, focusing on three types of
activities that are key to successful trade performance: support to trade-related
infrastructure; trade facilitation; and state–business relations. The three following sections
review these three types of measures in three case studies, of China, India and Brazil.
Finally, the report concludes with a summary of findings and recommendations on the way
forward in Section 6.
ODI Report 2
2 Successful trade performance in emerging economies
2.1 Trade performance in China, India and Brazil
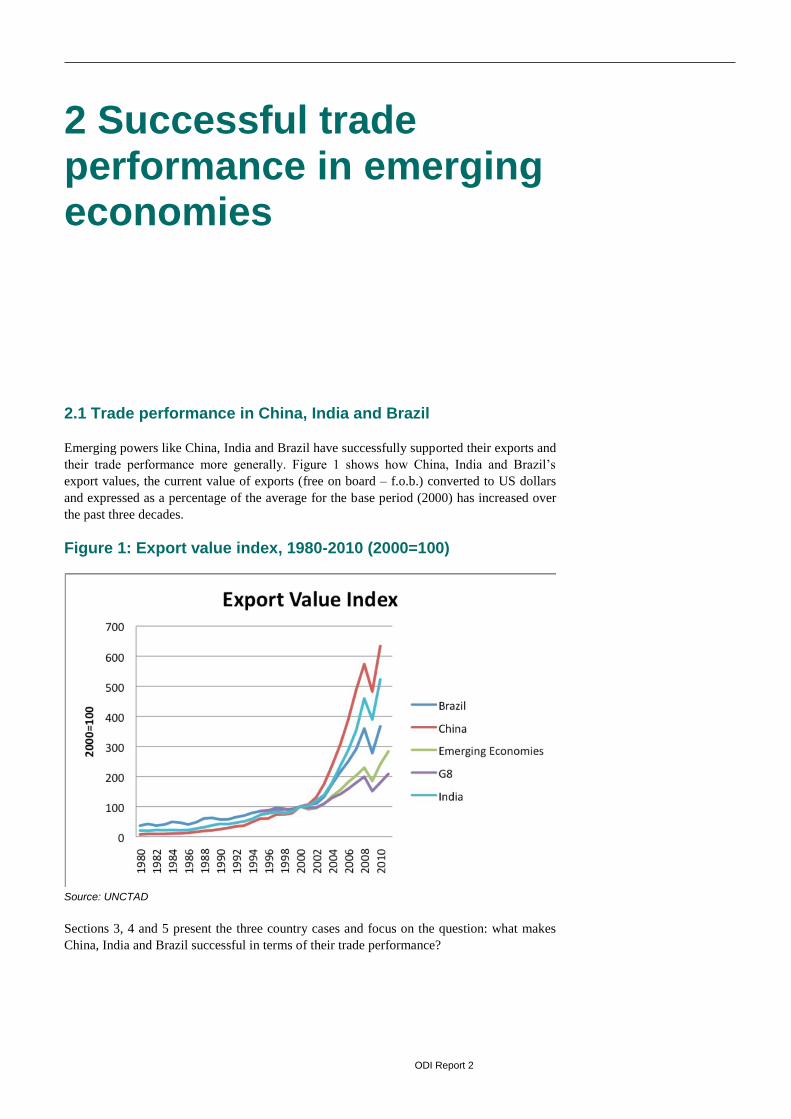
Emerging powers like China, India and Brazil have successfully supported their exports and
their trade performance more generally. Figure 1 shows how China, India and Brazil’s
export values, the current value of exports (free on board – f.o.b.) converted to US dollars
and expressed as a percentage of the average for the base period (2000) has increased over
the past three decades.
Figure 1: Export value index, 1980-2010 (2000=100)
Source: UNCTAD
Sections 3, 4 and 5 present the three country cases and focus on the question: what makes
China, India and Brazil successful in terms of their trade performance?
ODI Report 3
2.2 Introducing the framework for analysis
Three main factors behind a country’s trade success are as follows:
Productive capacity, that is, the capacity of a country to produce goods and
services. Building productive capacity includes business development and
activities aimed at improving the business climate.
Regulatory frameworks, that is, an appropriate institutional framework and
supportive regulatory environment.
Market access and trade promotion, which includes the trade barriers a
country faces for its exports and those that exist for imports, and also refers to
policies aimed at increasing a country’s or company’s exports.
The main part of this report reviews three types of activities that can strengthen and
improve the factors behind trade success outlined above. It focuses on the following
activities: promoting trade-related infrastructure (Section 2.2.1), trade facilitation
(Section 2.2.2) and effective state–business relations (Section 2.2.3).
2.2.1 Trade infrastructure
The first part of each country case study presents how China, India and Brazil have
supported trade-related infrastructure. Trade-related infrastructure comprises not only roads,
railways and ports but also energy, water and telecommunication and, arguably, laboratories
for quality, sanitary and phytosanitary (SPS) controls and verification of compliance
standards with border posts and associated computer and customs software. There is often a
lack of high-quality infrastructure in developing countries owing to market failures in the
context of lumpy investments being delayed in uncertain circumstances (te Velde, 2008).
Support to infrastructure can help address this market failure, for example by providing
incentives for public–private partnerships or grants (ibid.).
The correlation between infrastructure more generally and economic growth and poverty
reduction is neither definite nor automatic (e.g. Estache and Fay, 2007; Klitgaard, 2004).
But infrastructure provides links to the world market that are important for export
competitiveness and manufacturing, which in turn are regarded as vital drivers of economic
performance. Empirical evidence indicates that quality of infrastructure is an important
determinant of trade performance (e.g. Francois and Manchin, 2007; Limão and Venables,
2001; Nordås and Piermartini, 2004; Portugal-Perez and Wilson, 2011).1
Above all, it is the financing of infrastructure that gives rise to severe challenges, especially
because the huge scale of the needed investment and the long gestation period call for
investors who are able to accept a long timeframe for debt repayment and return on equity,
while many financial institutions are not able to invest in such very long-term illiquid assets
(Anand, 2010). In addition, infrastructure investments involve non-recourse or limited
recourse financing, which implies that market and commercial risks play a greater role for
lenders, which in turn necessitates particular appraisal skills (ibid.).
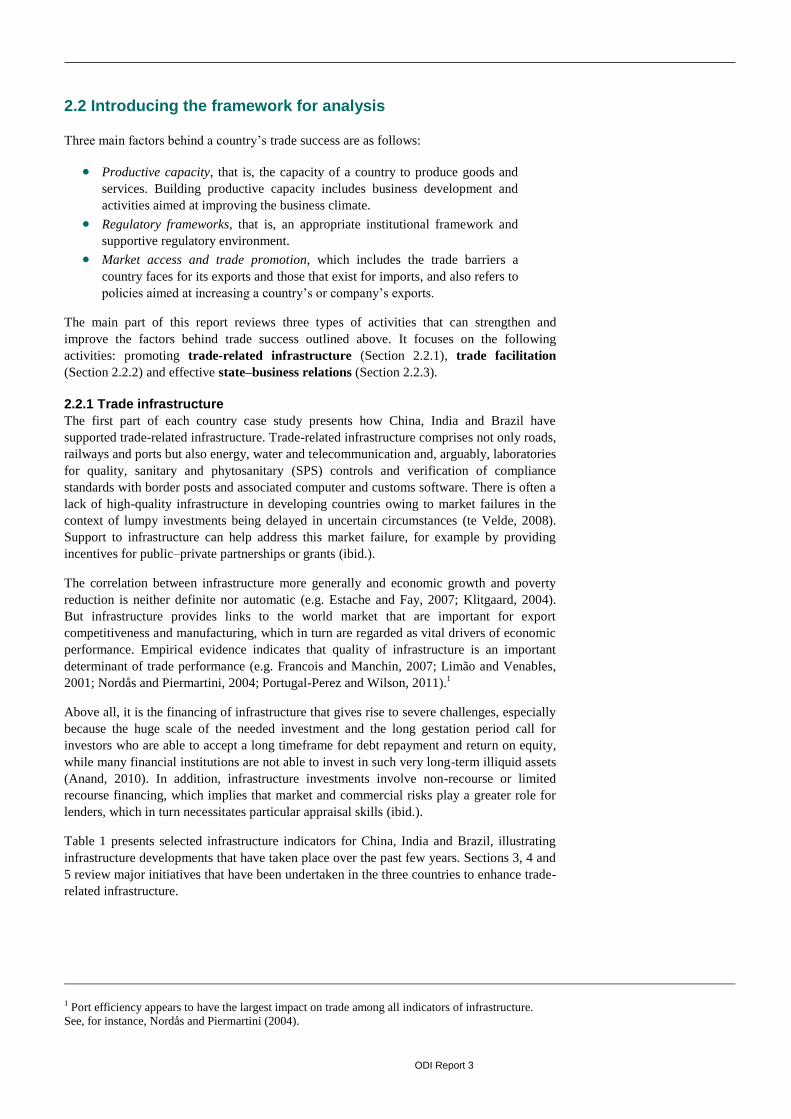
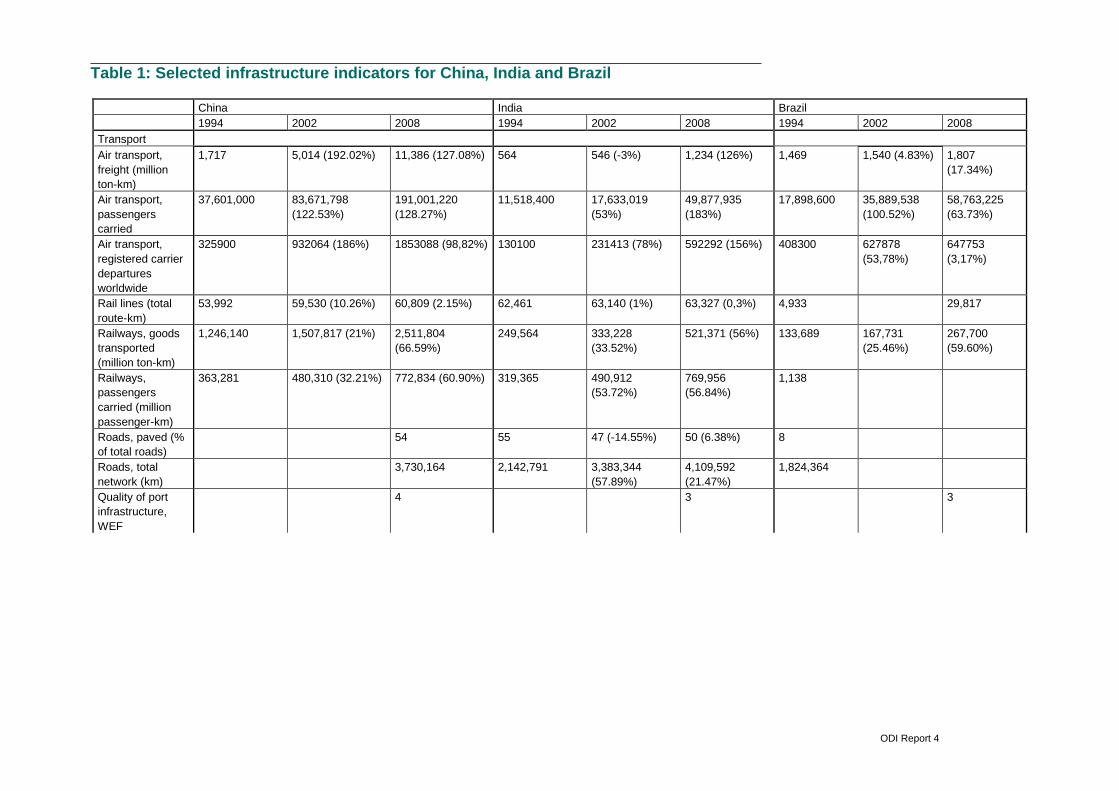
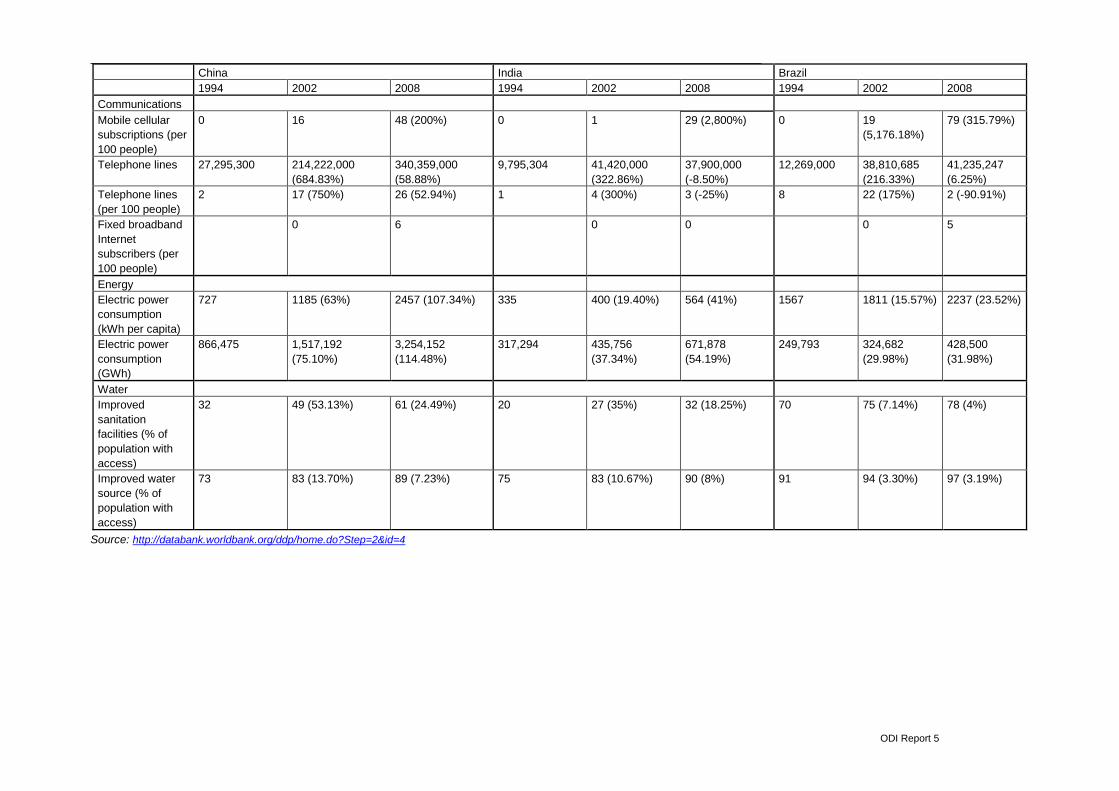
Table 1 presents selected infrastructure indicators for China, India and Brazil, illustrating
infrastructure developments that have taken place over the past few years. Sections 3, 4 and
5 review major initiatives that have been undertaken in the three countries to enhance trade-
related infrastructure.
1 Port efficiency appears to have the largest impact on trade among all indicators of infrastructure.
See, for instance, Nordås and Piermartini (2004).
ODI Report 4
Table 1: Selected infrastructure indicators for China, India and Brazil
China India Brazil
1994 2002 2008 1994 2002 2008 1994 2002 2008
Transport
Air transport,
freight (million
ton-km)
1,717 5,014 (192.02%) 11,386 (127.08%) 564 546 (-3%) 1,234 (126%) 1,469 1,540 (4.83%) 1,807
(17.34%)
Air transport,
passengers
carried
37,601,000 83,671,798
(122.53%)
191,001,220
(128.27%)
11,518,400 17,633,019
(53%)
49,877,935
(183%)
17,898,600 35,889,538
(100.52%)
58,763,225
(63.73%)
Air transport,
registered carrier
departures
worldwide
325900 932064 (186%) 1853088 (98,82%) 130100 231413 (78%) 592292 (156%) 408300 627878
(53,78%)
647753
(3,17%)
Rail lines (total
route-km)
53,992 59,530 (10.26%) 60,809 (2.15%) 62,461 63,140 (1%) 63,327 (0,3%) 4,933 29,817
Railways, goods
transported
(million ton-km)
1,246,140 1,507,817 (21%) 2,511,804
(66.59%)
249,564 333,228
(33.52%)
521,371 (56%) 133,689 167,731
(25.46%)
267,700
(59.60%)
Railways,
passengers
carried (million
passenger-km)
363,281 480,310 (32.21%) 772,834 (60.90%) 319,365 490,912
(53.72%)
769,956
(56.84%)
1,138
Roads, paved (%
of total roads)
54 55 47 (-14.55%) 50 (6.38%) 8
Roads, total
network (km)
3,730,164 2,142,791 3,383,344
(57.89%)
4,109,592
(21.47%)
1,824,364
Quality of port
infrastructure,
WEF
4 3 3
ODI Report 5
China India Brazil
1994 2002 2008 1994 2002 2008 1994 2002 2008
Communications
Mobile cellular
subscriptions (per
100 people)
0 16 48 (200%) 0 1 29 (2,800%) 0 19
(5,176.18%)
79 (315.79%)
Telephone lines 27,295,300 214,222,000
(684.83%)
340,359,000
(58.88%)
9,795,304 41,420,000
(322.86%)
37,900,000
(-8.50%)
12,269,000 38,810,685
(216.33%)
41,235,247
(6.25%)
Telephone lines
(per 100 people)
2 17 (750%) 26 (52.94%) 1 4 (300%) 3 (-25%) 8 22 (175%) 2 (-90.91%)
Fixed broadband
Internet
subscribers (per
100 people)
0 6 0 0 0 5
Energy
Electric power
consumption
(kWh per capita)
727 1185 (63%) 2457 (107.34%) 335 400 (19.40%) 564 (41%) 1567 1811 (15.57%) 2237 (23.52%)
Electric power
consumption
(GWh)
866,475 1,517,192
(75.10%)
3,254,152
(114.48%)
317,294 435,756
(37.34%)
671,878
(54.19%)
249,793 324,682
(29.98%)
428,500
(31.98%)
Water
Improved
sanitation
facilities (% of
population with
access)
32 49 (53.13%) 61 (24.49%) 20 27 (35%) 32 (18.25%) 70 75 (7.14%) 78 (4%)
Improved water
source (% of
population with
access)
73 83 (13.70%) 89 (7.23%) 75 83 (10.67%) 90 (8%) 91 94 (3.30%) 97 (3.19%)
Source: http://databank.worldbank.org/ddp/home.do?Step=2&id=4
ODI Report 6
2.2.2 Trade facilitation
Contrary to common perception, infrastructure like ports, although significant, is not the
most important impediment to trade; almost half of the holdups in the trading process are
the result of burdensome pre-arrival procedures (World Bank, 2007). These cumbersome
procedures could in turn be addressed though trade facilitation measures. There is no
generally agreed definition of trade facilitation (Tantri and Kumar, 2011). In a strict sense,
trade facilitation measures refer to steps undertaken to reduce the transaction costs of
conducting business across the border. The World Trade Organization (WTO) defines trade
facilitation as ‘the simplification and harmonization of international trade procedures’
covering the ‘activities, practices and formalities involved in collecting, presenting,
communicating and processing data required for the movement of goods in international
trade’ (OECD, 2005).2 Recent research on how aid spent on trade facilitation relates to trade
flows indicates that the trade initiating effect of one dollar spent on measures directed
towards trade policy and regulation reform are considerably higher than the trade creation
from investments in other areas of trade support (Helble et al., 2009). Above all, the
efficiency of customs has considerable effects on trade-related costs and the performance of
trade administration.
The benefits of trade facilitation measures typically more than compensate the cost of such
reforms and frequently exhibit a rather brief payback period (Engman, 2005b). Complex or
inefficient border measures activities could raise the cost of goods by between 2% and 15%
(OECD, 2005). Duval and Utoktham (2009) provide data that indicate that a 5% reduction
in the cost of imports in the importing country can expand imports by 1.5%, while an
analogous drop in the cost of exporting can raise exports by 4.2%. Wilson (2007) illustrates
that a 10% decrease in the time at the border of the importer can raise trade by 6%, while a
10% decrease in the number of documents needed by the importer could raise trade by 11%.
Other studies (e.g. Fox et al., 2003; Kim et al., 2004; Wilson et al., 2003; 2004) further
confirm this relationship.3
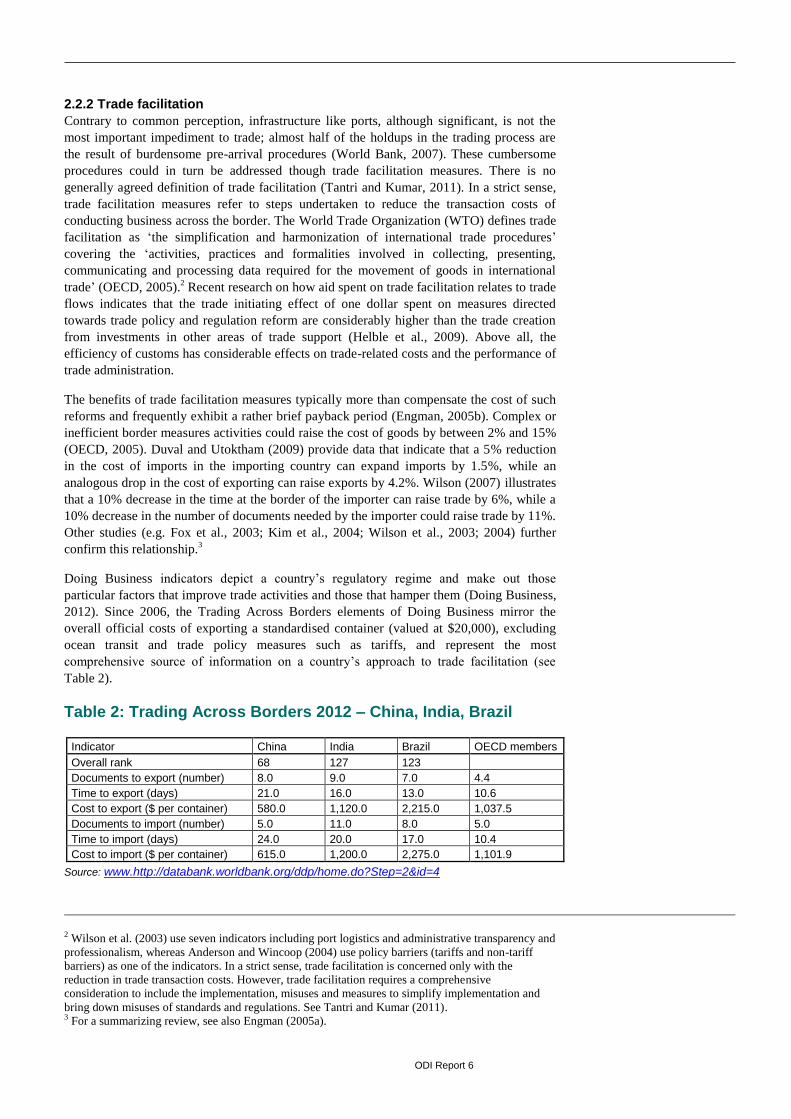
Doing Business indicators depict a country’s regulatory regime and make out those
particular factors that improve trade activities and those that hamper them (Doing Business,
2012). Since 2006, the Trading Across Borders elements of Doing Business mirror the
overall official costs of exporting a standardised container (valued at $20,000), excluding
ocean transit and trade policy measures such as tariffs, and represent the most
comprehensive source of information on a country’s approach to trade facilitation (see
Table 2).
Table 2: Trading Across Borders 2012 – China, India, Brazil
Indicator China India Brazil OECD members
Overall rank 68 127 123
Documents to export (number) 8.0 9.0 7.0 4.4
Time to export (days) 21.0 16.0 13.0 10.6
Cost to export ($ per container) 580.0 1,120.0 2,215.0 1,037.5
Documents to import (number) 5.0 11.0 8.0 5.0
Time to import (days) 24.0 20.0 17.0 10.4
Cost to import ($ per container) 615.0 1,200.0 2,275.0 1,101.9
Source: www.http://databank.worldbank.org/ddp/home.do?Step=2&id=4
2 Wilson et al. (2003) use seven indicators including port logistics and administrative transparency and
professionalism, whereas Anderson and Wincoop (2004) use policy barriers (tariffs and non-tariff
barriers) as one of the indicators. In a strict sense, trade facilitation is concerned only with the
reduction in trade transaction costs. However, trade facilitation requires a comprehensive
consideration to include the implementation, misuses and measures to simplify implementation and
bring down misuses of standards and regulations. See Tantri and Kumar (2011). 3 For a summarizing review, see also Engman (2005a).
ODI Report 7
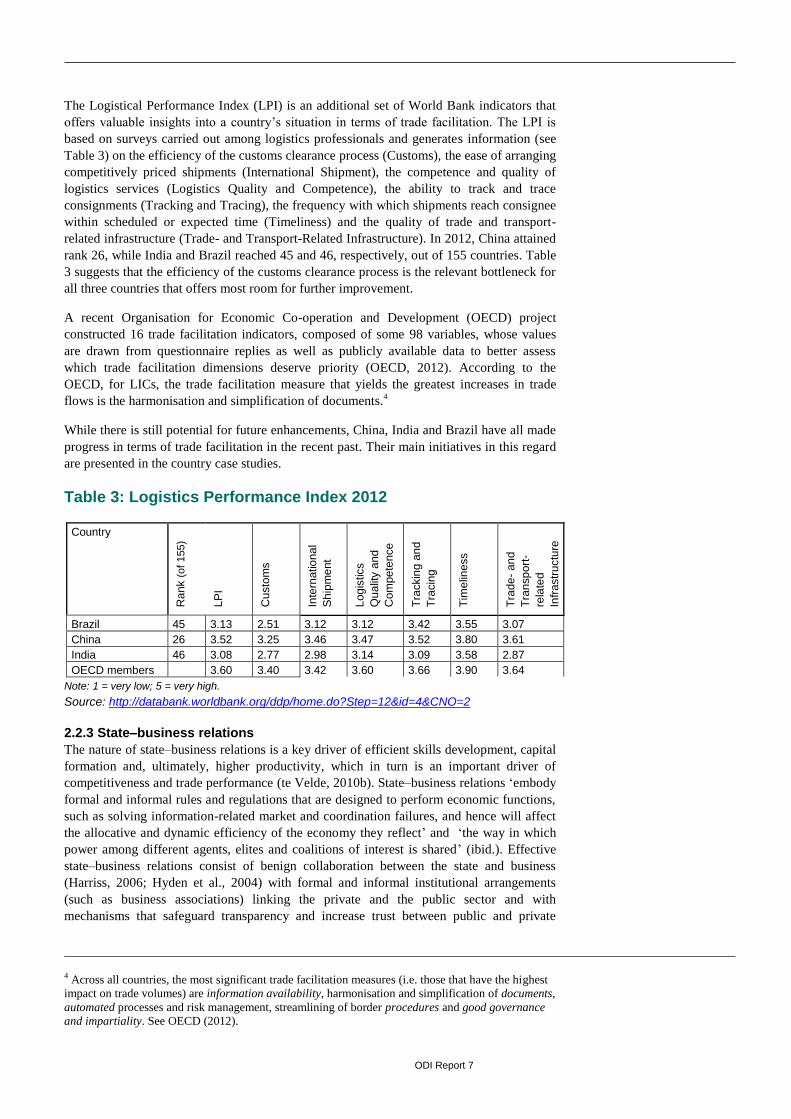
The Logistical Performance Index (LPI) is an additional set of World Bank indicators that
offers valuable insights into a country’s situation in terms of trade facilitation. The LPI is
based on surveys carried out among logistics professionals and generates information (see
Table 3) on the efficiency of the customs clearance process (Customs), the ease of arranging
competitively priced shipments (International Shipment), the competence and quality of
logistics services (Logistics Quality and Competence), the ability to track and trace
consignments (Tracking and Tracing), the frequency with which shipments reach consignee
within scheduled or expected time (Timeliness) and the quality of trade and transport-
related infrastructure (Trade- and Transport-Related Infrastructure). In 2012, China attained
rank 26, while India and Brazil reached 45 and 46, respectively, out of 155 countries. Table
3 suggests that the efficiency of the customs clearance process is the relevant bottleneck for
all three countries that offers most room for further improvement.
A recent Organisation for Economic Co-operation and Development (OECD) project
constructed 16 trade facilitation indicators, composed of some 98 variables, whose values
are drawn from questionnaire replies as well as publicly available data to better assess
which trade facilitation dimensions deserve priority (OECD, 2012). According to the
OECD, for LICs, the trade facilitation measure that yields the greatest increases in trade
flows is the harmonisation and simplification of documents.4
While there is still potential for future enhancements, China, India and Brazil have all made
progress in terms of trade facilitation in the recent past. Their main initiatives in this regard
are presented in the country case studies.
Table 3: Logistics Performance Index 2012
Country
Ra
nk (
of 155)
LP
I
Cu
sto
ms
Inte
rnatio
na
l
Sh
ipm
ent
Log
istics
Qu
alit
y a
nd
Co
mpe
tence
Tra
ckin
g a
nd
Tra
cin
g
Tim
elin
ess
Tra
de
- an
d
Tra
nsp
ort
-
rela
ted
Infr
astr
uctu
re
Brazil 45 3.13 2.51 3.12 3.12 3.42 3.55 3.07
China 26 3.52 3.25 3.46 3.47 3.52 3.80 3.61
India 46 3.08 2.77 2.98 3.14 3.09 3.58 2.87
OECD members 3.60 3.40 3.42 3.60 3.66 3.90 3.64
Note: 1 = very low; 5 = very high.
Source: http://databank.worldbank.org/ddp/home.do?Step=12&id=4&CNO=2
2.2.3 State–business relations
The nature of state–business relations is a key driver of efficient skills development, capital
formation and, ultimately, higher productivity, which in turn is an important driver of
competitiveness and trade performance (te Velde, 2010b). State–business relations ‘embody
formal and informal rules and regulations that are designed to perform economic functions,
such as solving information-related market and coordination failures, and hence will affect
the allocative and dynamic efficiency of the economy they reflect’ and ‘the way in which
power among different agents, elites and coalitions of interest is shared’ (ibid.). Effective
state–business relations consist of benign collaboration between the state and business
(Harriss, 2006; Hyden et al., 2004) with formal and informal institutional arrangements
(such as business associations) linking the private and the public sector and with
mechanisms that safeguard transparency and increase trust between public and private
4 Across all countries, the most significant trade facilitation measures (i.e. those that have the highest
impact on trade volumes) are information availability, harmonisation and simplification of documents,
automated processes and risk management, streamlining of border procedures and good governance
and impartiality. See OECD (2012).
ODI Report 8
agents. Effective state–business relations can address (i) market and coordination failures
and (ii) government failures and can (iii) reduce policy uncertainty (te Velde, 2010a):
Helping tackle market failures
Effective state–business relations can help solve information-related market and
coordination failures regarding, for example, skills development (Lall, 2001), provision of
infrastructure, technological development (ibid.) and capital markets (Stiglitz, 1996). For
instance, business associations can lobby the government to offer more adequate quality
education, which is not likely to be provided by a fragmented private sector in the context
of incomplete markets (te Velde, 2010a).
Helping tackle government failures
Effective state–business relations (e.g. enshrined in effective competition policy) offer
checks and balances on government policies (te Velde, 2010a). They may also help ensure
that infrastructure provision adheres to high-quality standards and is suitable for the needs
of the market – and thereby prevent, for example, situations in which technology institutes
are supply-driven and de-linked from the private sector (Lall, 2001).
Reducing policy uncertainty
Effective state–business relations may help reduce policy uncertainty, which can have
noteworthy negative impacts on investment, especially when the investment in question
entails large sunk and irreversible costs (Dixit and Pindyck, 1994). Businesses with a good
relation with the government may be able to foresee certain policy decisions, but when the
relation between state and private sector is too close, collusive behaviour may lead to
capture of policy to the benefit of few, not all, firms – which underlines the importance of
examining when these relations are collusive in nature and when they are developmental (te
Velde, 2010a).
The measurement of state–business relations has so far received relatively little attention.
Te Velde (2006) suggests four factors for effective state–business relations:5 the way the
private sector is organised vis-à-vis the public sector; the way the public sector is organised
vis-à-vis the private sector; the practice and institutionalisation of state–business relations;
and the avoidance of harmful collusive behaviour. For example, to ensure credibility, both
the public and the private sector should be organised or institutionalised and a set of
competition principles is required to prevent collusive behaviour. For instance,
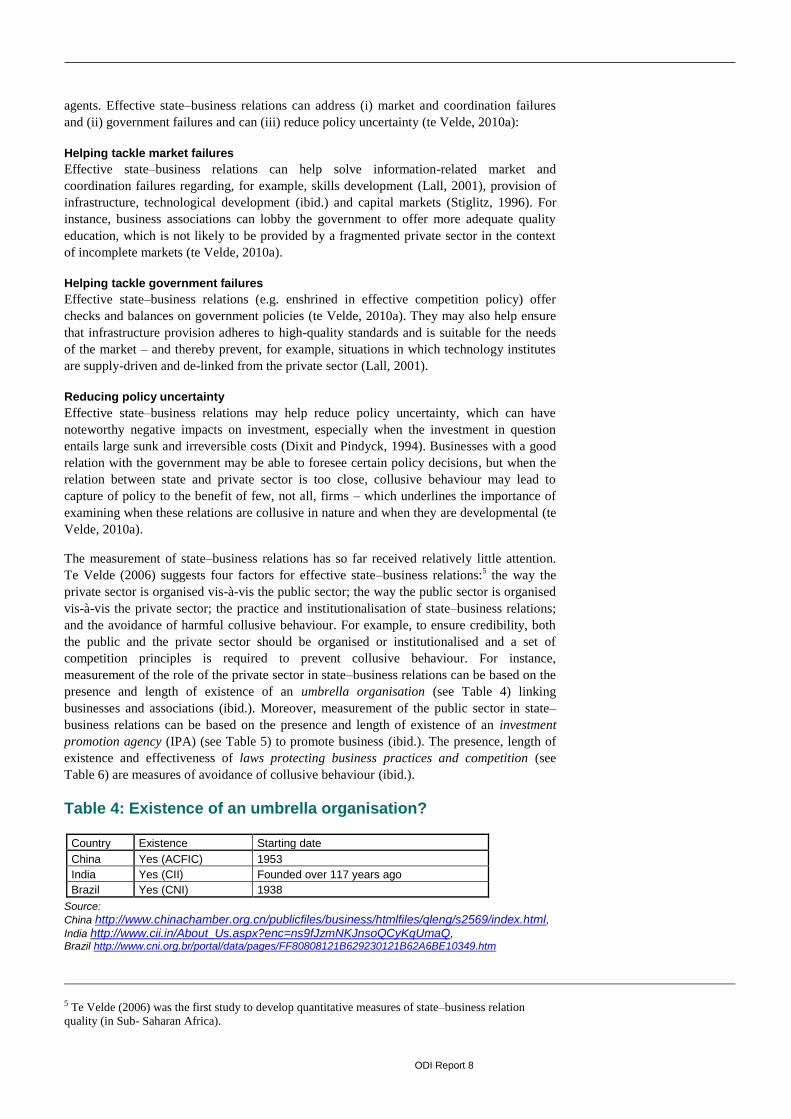
measurement of the role of the private sector in state–business relations can be based on the
presence and length of existence of an umbrella organisation (see Table 4) linking
businesses and associations (ibid.). Moreover, measurement of the public sector in state–
business relations can be based on the presence and length of existence of an investment
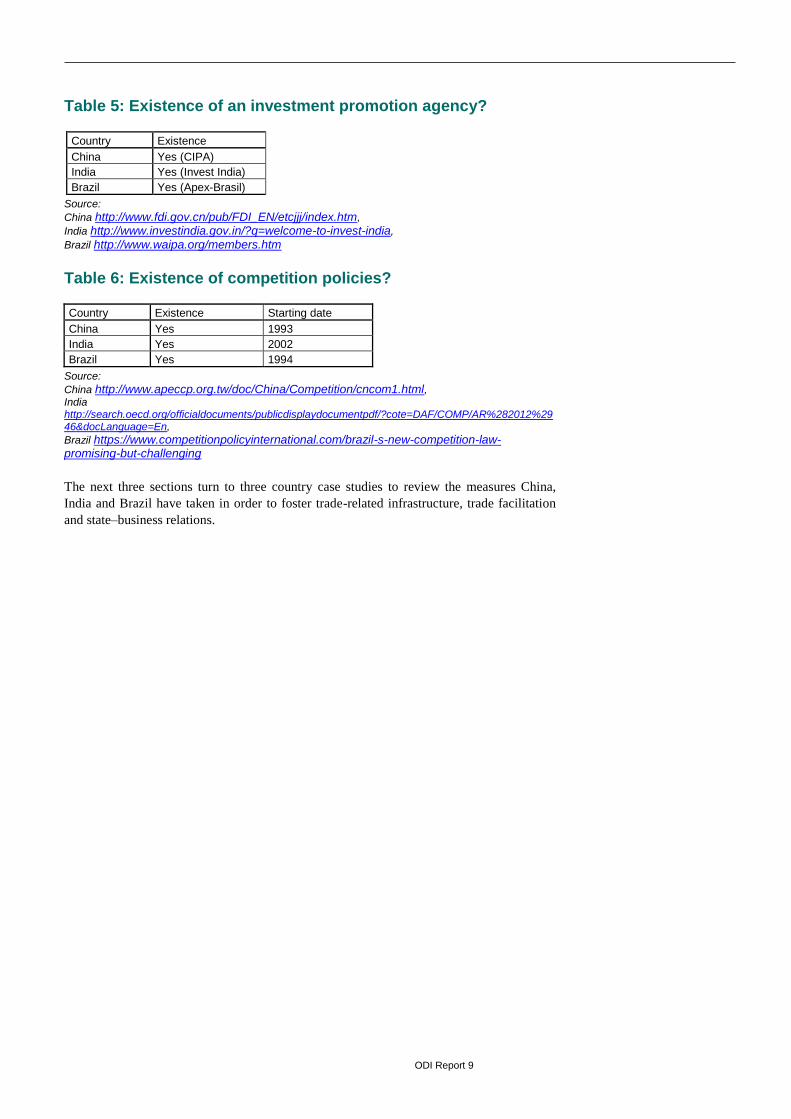
promotion agency (IPA) (see Table 5) to promote business (ibid.). The presence, length of
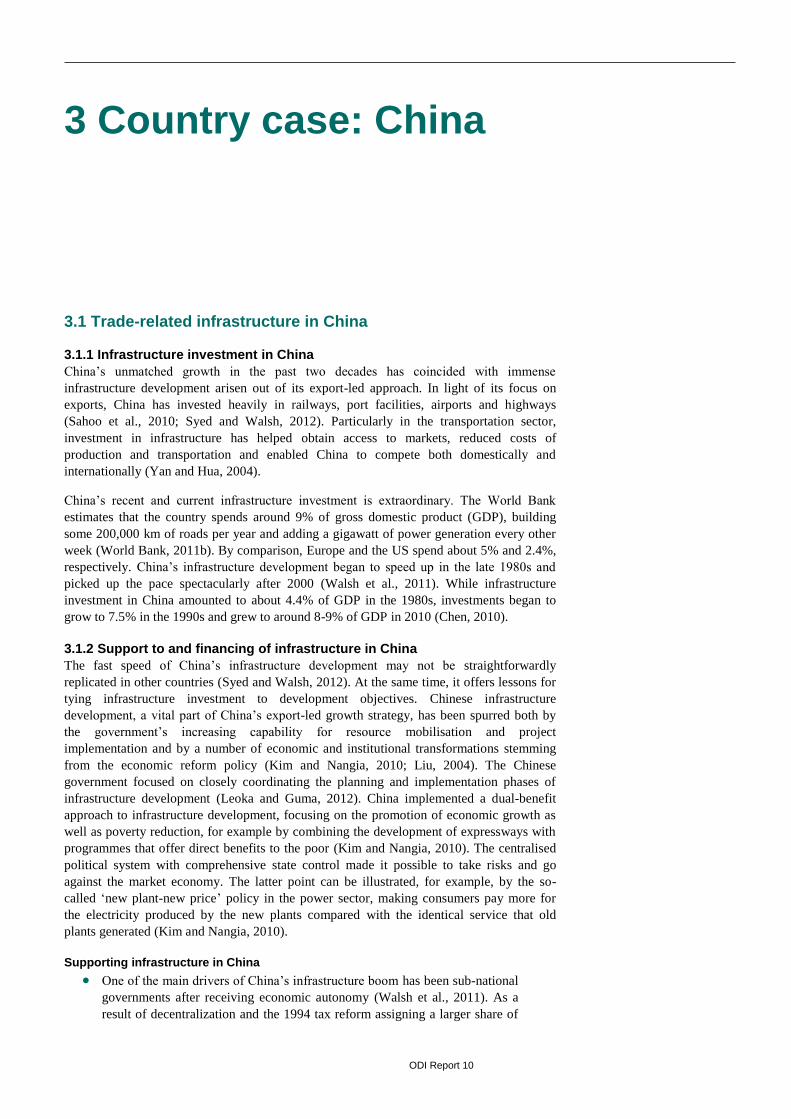
existence and effectiveness of laws protecting business practices and competition (see
Table 6) are measures of avoidance of collusive behaviour (ibid.).
Table 4: Existence of an umbrella organisation?
Country Existence Starting date
China Yes (ACFIC) 1953
India Yes (CII) Founded over 117 years ago
Brazil Yes (CNI) 1938
Source:
China http://www.chinachamber.org.cn/publicfiles/business/htmlfiles/qleng/s2569/index.html, India http://www.cii.in/About_Us.aspx?enc=ns9fJzmNKJnsoQCyKqUmaQ, Brazil http://www.cni.org.br/portal/data/pages/FF80808121B629230121B62A6BE10349.htm
5 Te Velde (2006) was the first study to develop quantitative measures of state–business relation
quality (in Sub- Saharan Africa).
ODI Report 9
Table 5: Existence of an investment promotion agency?
Country Existence
China Yes (CIPA)
India Yes (Invest India)
Brazil Yes (Apex-Brasil)
Source:
China http://www.fdi.gov.cn/pub/FDI_EN/etcjjj/index.htm,
India http://www.investindia.gov.in/?q=welcome-to-invest-india,
Brazil http://www.waipa.org/members.htm
Table 6: Existence of competition policies?
Country Existence Starting date
China Yes 1993
India Yes 2002
Brazil Yes 1994
Source:
China http://www.apeccp.org.tw/doc/China/Competition/cncom1.html, India http://search.oecd.org/officialdocuments/publicdisplaydocumentpdf/?cote=DAF/COMP/AR%282012%2946&docLanguage=En,
Brazil https://www.competitionpolicyinternational.com/brazil-s-new-competition-law-promising-but-challenging
The next three sections turn to three country case studies to review the measures China,
India and Brazil have taken in order to foster trade-related infrastructure, trade facilitation
and state–business relations.
ODI Report 10
3 Country case: China
3.1 Trade-related infrastructure in China
3.1.1 Infrastructure investment in China
China’s unmatched growth in the past two decades has coincided with immense
infrastructure development arisen out of its export-led approach. In light of its focus on
exports, China has invested heavily in railways, port facilities, airports and highways
(Sahoo et al., 2010; Syed and Walsh, 2012). Particularly in the transportation sector,
investment in infrastructure has helped obtain access to markets, reduced costs of
production and transportation and enabled China to compete both domestically and
internationally (Yan and Hua, 2004).
China’s recent and current infrastructure investment is extraordinary. The World Bank
estimates that the country spends around 9% of gross domestic product (GDP), building
some 200,000 km of roads per year and adding a gigawatt of power generation every other
week (World Bank, 2011b). By comparison, Europe and the US spend about 5% and 2.4%,
respectively. China’s infrastructure development began to speed up in the late 1980s and
picked up the pace spectacularly after 2000 (Walsh et al., 2011). While infrastructure
investment in China amounted to about 4.4% of GDP in the 1980s, investments began to
grow to 7.5% in the 1990s and grew to around 8-9% of GDP in 2010 (Chen, 2010).
3.1.2 Support to and financing of infrastructure in China
The fast speed of China’s infrastructure development may not be straightforwardly
replicated in other countries (Syed and Walsh, 2012). At the same time, it offers lessons for
tying infrastructure investment to development objectives. Chinese infrastructure
development, a vital part of China’s export-led growth strategy, has been spurred both by
the government’s increasing capability for resource mobilisation and project
implementation and by a number of economic and institutional transformations stemming
from the economic reform policy (Kim and Nangia, 2010; Liu, 2004). The Chinese
government focused on closely coordinating the planning and implementation phases of
infrastructure development (Leoka and Guma, 2012). China implemented a dual-benefit
approach to infrastructure development, focusing on the promotion of economic growth as
well as poverty reduction, for example by combining the development of expressways with
programmes that offer direct benefits to the poor (Kim and Nangia, 2010). The centralised
political system with comprehensive state control made it possible to take risks and go
against the market economy. The latter point can be illustrated, for example, by the so-
called ‘new plant-new price’ policy in the power sector, making consumers pay more for
the electricity produced by the new plants compared with the identical service that old
plants generated (Kim and Nangia, 2010).
Supporting infrastructure in China
One of the main drivers of China’s infrastructure boom has been sub-national
governments after receiving economic autonomy (Walsh et al., 2011). As a
result of decentralization and the 1994 tax reform assigning a larger share of
ODI Report 11
taxes to the central government, sub-national governments have become keen
to foster economic growth to produce additional revenues (Liu, 2004). To
achieve this goal, they started seeking to mobilise financing for infrastructure
projects, for example by providing guarantees – implicit and explicit – for
bank loans to infrastructure projects and in certain cases subsidies directly for
infrastructure special purpose vehicles (SPVs) to increase profits and credit
ratings (ibid.).
Further initiatives, such as the simplification of government review and
approval procedures and the introduction of performance criteria, contributed
to improving the government capability for the implementation of
infrastructure projects (Liu, 2004).
As a reaction to the 1997 Asian financial crisis, the Chinese government
adopted a proactive fiscal policy and raised public investment in
infrastructure, in part also to satisfy the strong demand for infrastructure
stemming from high growth rates (Liu, 2004). The central government issued
bonds to finance large-scale infrastructure development, which contributed to
sustaining the continued growth of the economy through the crisis. Regarding
the recent global financial crisis, China has launched an even larger economic
stimulus package focusing on infrastructure development.6 China allocated
40% of its $584 billion fiscal stimulus package to infrastructure projects,
focusing on rail, grids, water infrastructure and environmental improvements
(World Bank, 2011b).
Since 2004, China has deregulated the cumbersome and lengthy project
approval system for infrastructure, for example such that government
approval will no longer be needed for projects not funded by the government
(Chen, 2010).
In the context of the 12th Five-Year Plan’s (2011-2015) annual GDP growth
target of 7% and the search for alternative sources of finance, infrastructure
investments are increasingly being opened to private capital, for example by
relaxing the rules on qualified foreign institutional investors (QFIIs) and other
forms of direct and indirect investment (KPMG, 2013; Shao and Yao, 2013).
In September 2012, the National Development and Reform Commission
(NDRC) approved the launch of 55 major infrastructure projects (Back, 2012;
KPMG, 2013).
Public–private partnerships in China
In China, public–private partnerships (PPPs)7 have been implemented for over two
decades.8 From 1990 to 2011, there were 1,018 infrastructure projects with private
participation in China in sectors like energy, telecom, transport, water and sewerage, with a
total investment of $116.4 billion (World Bank, 2013). To promote the implementation of
PPPs in China, a series of policies have been introduced, for example the Opinions on
Acceleration of Privatization Process of Public Facilities in 2002 by the Ministry of
Construction (M. Wang, 2013).
While numerous PPPs have been successful, PPPs frequently give rise to various challenges
in China (e.g. Liu and Yamamoto, 2009). For example, there is no adequate administrative
framework for PPP projects. And, while the approval of a PPP project involves a number of
6 The impact on the private sector’s participation in infrastructure is still unknown but may be very
limited, according to data collected by the Public–Private Infrastructure Advisory Facility (PPIAF) so
far. See Chen (2010). 7 The term ‘PPP’ refers to a number of models of public–private cooperation to mobilise finance and
improve the efficiency of public services and other public functions (Girishankar, 2009). 8 Findings from a recent survey in China indicate that the success factors that are perceived as most
important for PPPs in China refer to a stable macroeconomic environment, shared responsibility
between public and private sectors, a transparent and efficient procurement process, a stable political
and social environment and judicious government control. See Chan et al. (2010).
ODI Report 12
different government departments, it is frequently ambiguous which one is authorised to
negotiate and sign a contract (M. Wang, 2013). Moreover, while China’s Tendering and
Bidding Law requires the tendering process to be open and fair, there are numerous cases of
bribery (Nunns, 2012). Since PPPs represent a relationship between the government and
private actors that resembles a principal-agent relation in which the distribution of
information is asymmetric, they often trigger ‘strategic behavior’ (ten Heuvelhof et al.,
2009). Information asymmetries enable private actors to shirk from making serious work
efforts or refuse to behave in line with the interests of government and can involve adverse
selection ex-ante to the contract period (tendering process) and moral hazard during the
contract period (Rui et al., 2008). Empirical research has shown that a variety of forms of
strategic behavior have emerged in Chinese expressways, including tendering, construction,
operation and maintenance. For instance, in the Shen-Da expressway, 222 jerry-built
locations have been found after 10 years of operation, above all foundation deformation and
cracks in and sinking of the road surface (ibid.).
With the growing interest in PPP projects, the Chinese government has begun to train its
officials to improve their professional skills in order to enhance capacity in PPP operations
or has recruited expert consultants to take account of lacking expertise regarding specific
dimensions of PPP projects (M. Wang, 2013).
China’s plans for infrastructure development are ambitious and the targets are usually
achieved in time:
Roads: The 11th Five-Year Plan envisaged an increase in the National Trunk
Highway System (NTHS) to 65,000 km by 2010 (KPMG, 2009) but, in part
because of the 2008 government stimulus package, at the end of 2010 the
NTHS network was actually over 74,000 km (KPMG, 2013). The 12th Five-
Year Plan has indicated increases in the NTHS with a target of 83,000 km by
2015. While most highway and expressway construction is traditionally
undertaken by local city governments, this puts considerable stress on their
fiscal budgets – yet, since the first Build, Operate and Transfer (BOT)
concessions for PPPs were established in the 1990s, the private sector has
been more actively encouraged to participate in the toll roads sector (KPMG,
2013). Today, more than 70% of the world’s toll roads are within China but
the private sector is still only a small player in greenfield construction,
providing only around 7% of expressway financing in China (Thomas White,
2011).
Railways: On the basis of annual investments of RMB 800 billion in railway
infrastructure, the 12th Five-Year Plan aims at a total high-speed track of
40,000 km to be finished by 2015. However, the July 2011 Wenzhou rail
accident led to a significant reconsideration of planned expenditures,
triggering concerns over the safety and reliability of the railway system as
well as the financial challenges facing the Ministry of Railways (KPMG,
2013). So far, there have been restricted options to invest directly in railway
for the private sector but, given its financial challenges, the Ministry of
Railways announced in 2012 that private capital will receive equal market
entry access (ibid.). Since QFIIs are now permitted to hold railway bonds,
there are now numerous new actors in the market and methods for investing
in the railway sector (ibid.).
Ports: Ports and shipping play an important role in the 12th Five-Year Plan.
Liaoning Jinzhou Port is the first domestic private capital-held coastal port, a
successful case with a record of swift construction and production operations
and positive economic benefits (KPMG, 2013). Today, more and more
foreign investors are showing interest in port construction, complementing
ODI Report 13
the strong involvement of state-owned and domestic privately owned
enterprises.9
Airports: In the period between 2011 and 2015, the opening of 50 new
airports is planned. The latest Catalog for Guidance of Foreign Investment
Industries indicates that foreign investors are permitted to take up to a 49%
equity interest in the construction and operation of airport activities, including
terminals and runways, and that private investors may own up to 100% of
regional airports, but are limited to 49% in major airports such as capital
cities of provinces and certain large cities. So far, one of the hurdles for
private investors airports in China has been the challenge to generate revenue
from secondary activities, such as shop leases and car parking (KPMG,
2013).
Financing infrastructure in China
The major sources of financing for infrastructure projects in China have shifted in the recent
past:
The main source of funding for infrastructure projects have been banking
loans, with state-owned commercial banks and policy banks holding around
80% of total infrastructure loan portfolios and bank financing accounting for
more than half of total infrastructure financing (Walsh et al., 2011).10
Direct fiscal support for infrastructure development is decreasing (Chen,
2010; Walsh et al., 2011).
Corporate bonds have increased in importance but continue to account for a
small part of total financing as the Chinese bond market is still
underdeveloped (Walsh et al., 2011). These bonds have to date mostly been
guaranteed by public banks or other associated companies, which have
increased credit ratings to allow commercial banks and insurance companies
to invest.
It is remarkable that several infrastructure SPVs are listed in the Chinese
stock market, directing funds from the capital market to infrastructure
projects (Walsh et al., 2011).
In 2012, the China Insurance Regulatory Commission (CIRC) decided to
allow insurance companies to invest up to 10% of their balance sheets in both
real estate and private equity (KPMG, 2013).
3.1.3 Summary: infrastructure in China
China’s approach to infrastructure development can be summarised as follows: China has
long been the world’s largest investor in infrastructure (Syed and Walsh, 2012). Chinese
infrastructure development is characterised by strong coordination between policymaking
and implementing and the presence of both market-based arrangements as well as
traditional centrally planned command economy elements. This approach has been
successful since final decision-making authority has continued to be with the central
government and since this central control has made it possible to be less risk-averse and to
defy the market economy when needed. Chinese reforms have included making use of a
trial-and-error approach and have also focused on boosting private and foreign investment
against a background of limited foreign participation in Chinese infrastructure as of now.
The focus is on planning coherent investment, regularly re-examining infrastructure gaps
and reorienting resources (Bredenkamp and Nord, 2010).
9 One example of a successful mutual partnership approach in China is the case of the Maersk Group
and Ningbo Port signing an agreement to mutually invest and manage parts of Meilong Pier at the
Meishan-bonded harbour area (KPMG, 2013). 10 One of the most significant lenders is the China Development Bank, which was established in 1994
to supply long-term financing for specific projects backed by the state. See Walsh et al. (2011).
ODI Report 14
At the same time, there are challenges. Rapid infrastructure development has at times led to
poor-quality, low-technology service and management (Chuan, 2008). Moreover, recently,
collapsing bridges, roads, dikes and dams have been a huge problem. They are often the
result of corruption among local officials who subcontract work to friends or inexperienced
firms (Nunns, 2012). Between 2009 and 2011, more than 15,000 Chinese officials were
punished for construction-related corruption or dereliction of duty (Yuan, 2011), which
often occurs in areas related to infrastructure projects, such as land-use approval or public
bidding (Xinhua, 2011).
So far, public banks have provided most of the required long-term financing for
infrastructure investments in the context of implicit local government guarantees and bond
insurance provided by publicly owned banks (Walsh et al., 2011). Private financing
increases but deficiencies in the legal and regulatory framework, with slow approval
processes, underdeveloped property rights and restricted means of legal remedy, continue to
be a barrier to more extensive private participation in infrastructure (Brooks and Zhai,
2008).
3.2 Trade facilitation in China
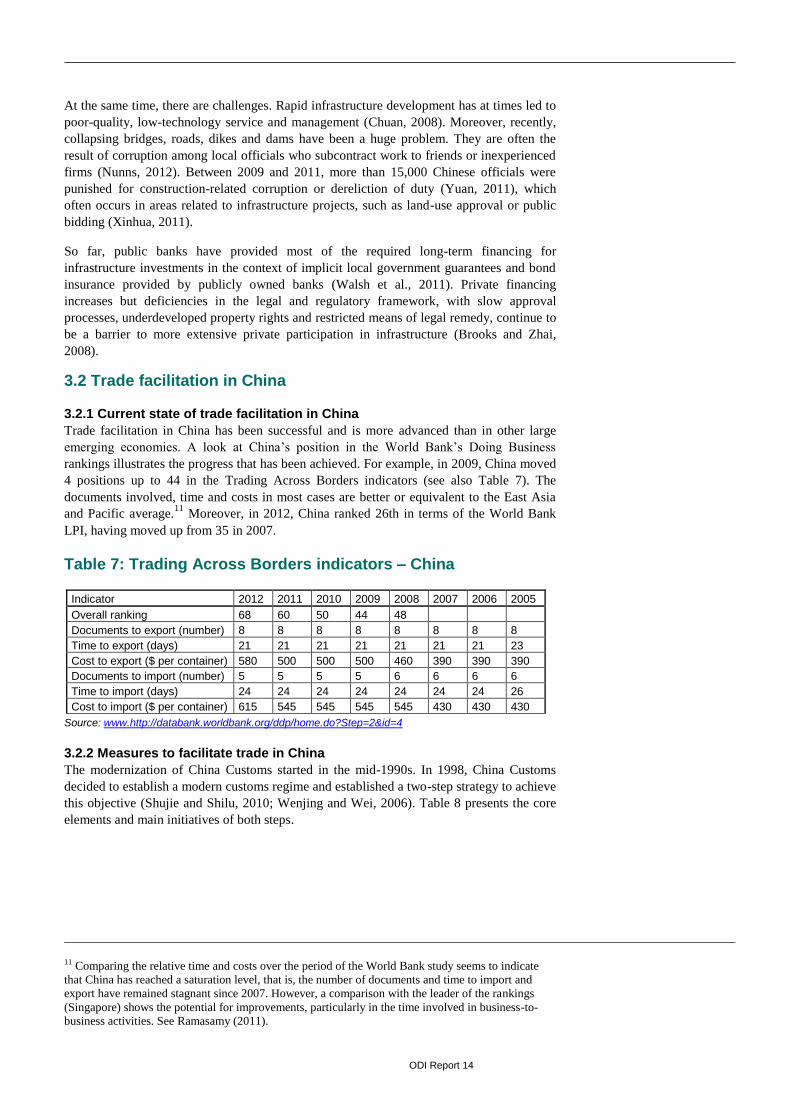
3.2.1 Current state of trade facilitation in China
Trade facilitation in China has been successful and is more advanced than in other large
emerging economies. A look at China’s position in the World Bank’s Doing Business
rankings illustrates the progress that has been achieved. For example, in 2009, China moved
4 positions up to 44 in the Trading Across Borders indicators (see also Table 7). The
documents involved, time and costs in most cases are better or equivalent to the East Asia
and Pacific average.11
Moreover, in 2012, China ranked 26th in terms of the World Bank
LPI, having moved up from 35 in 2007.
Table 7: Trading Across Borders indicators – China
Indicator 2012 2011 2010 2009 2008 2007 2006 2005
Overall ranking 68 60 50 44 48
Documents to export (number) 8 8 8 8 8 8 8 8
Time to export (days) 21 21 21 21 21 21 21 23
Cost to export ($ per container) 580 500 500 500 460 390 390 390
Documents to import (number) 5 5 5 5 6 6 6 6
Time to import (days) 24 24 24 24 24 24 24 26
Cost to import ($ per container) 615 545 545 545 545 430 430 430
Source: www.http://databank.worldbank.org/ddp/home.do?Step=2&id=4
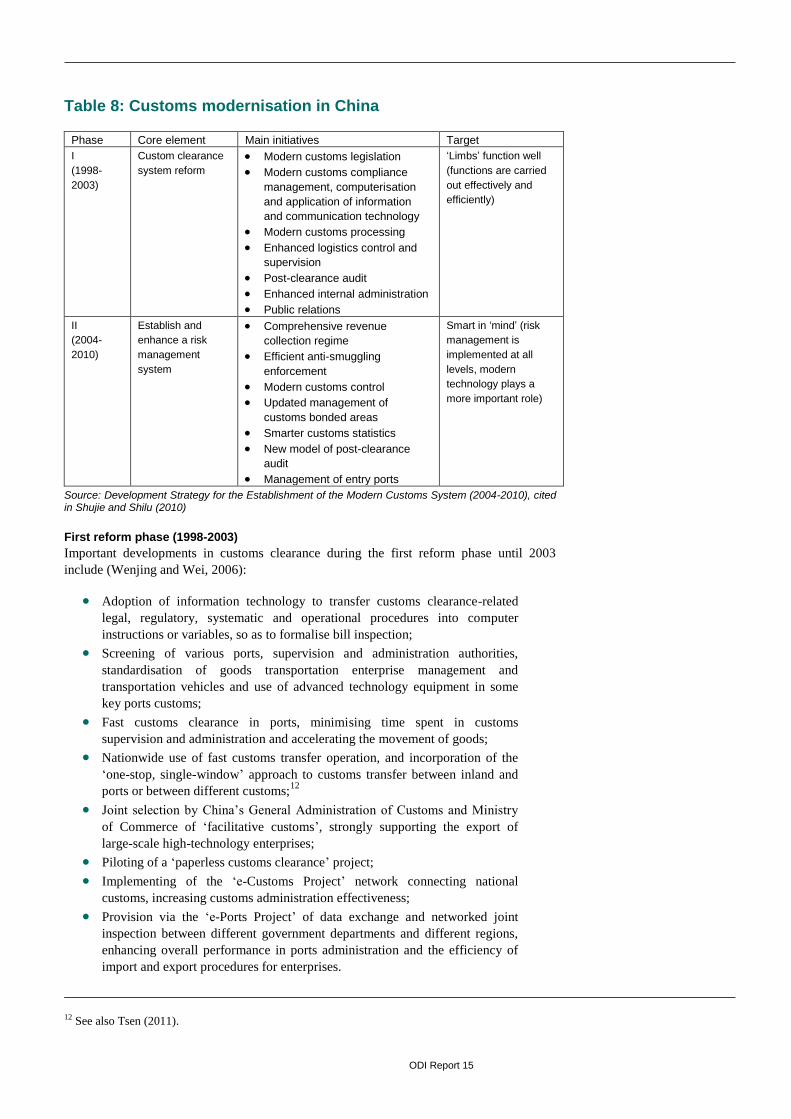
3.2.2 Measures to facilitate trade in China
The modernization of China Customs started in the mid-1990s. In 1998, China Customs
decided to establish a modern customs regime and established a two-step strategy to achieve
this objective (Shujie and Shilu, 2010; Wenjing and Wei, 2006). Table 8 presents the core
elements and main initiatives of both steps.
11 Comparing the relative time and costs over the period of the World Bank study seems to indicate
that China has reached a saturation level, that is, the number of documents and time to import and
export have remained stagnant since 2007. However, a comparison with the leader of the rankings
(Singapore) shows the potential for improvements, particularly in the time involved in business-to-
business activities. See Ramasamy (2011).
ODI Report 15
Table 8: Customs modernisation in China
Phase Core element Main initiatives Target
I
(1998-
2003)
Custom clearance
system reform
Modern customs legislation
Modern customs compliance
management, computerisation
and application of information
and communication technology
Modern customs processing
Enhanced logistics control and
supervision
Post-clearance audit
Enhanced internal administration
Public relations
‘Limbs’ function well
(functions are carried
out effectively and
efficiently)
II
(2004-
2010)
Establish and
enhance a risk
management
system
Comprehensive revenue
collection regime
Efficient anti-smuggling
enforcement
Modern customs control
Updated management of
customs bonded areas
Smarter customs statistics
New model of post-clearance
audit
Management of entry ports
Smart in ‘mind’ (risk
management is
implemented at all
levels, modern
technology plays a
more important role)
Source: Development Strategy for the Establishment of the Modern Customs System (2004-2010), cited in Shujie and Shilu (2010)
First reform phase (1998-2003)
Important developments in customs clearance during the first reform phase until 2003
include (Wenjing and Wei, 2006):
Adoption of information technology to transfer customs clearance-related
legal, regulatory, systematic and operational procedures into computer
instructions or variables, so as to formalise bill inspection;
Screening of various ports, supervision and administration authorities,
standardisation of goods transportation enterprise management and
transportation vehicles and use of advanced technology equipment in some
key ports customs;
Fast customs clearance in ports, minimising time spent in customs
supervision and administration and accelerating the movement of goods;
Nationwide use of fast customs transfer operation, and incorporation of the
‘one-stop, single-window’ approach to customs transfer between inland and
ports or between different customs;12
Joint selection by China’s General Administration of Customs and Ministry
of Commerce of ‘facilitative customs’, strongly supporting the export of
large-scale high-technology enterprises;
Piloting of a ‘paperless customs clearance’ project;
Implementing of the ‘e-Customs Project’ network connecting national
customs, increasing customs administration effectiveness;
Provision via the ‘e-Ports Project’ of data exchange and networked joint
inspection between different government departments and different regions,
enhancing overall performance in ports administration and the efficiency of
import and export procedures for enterprises.
12 See also Tsen (2011).
ODI Report 16
Box 1: Effects of reforming customs clearance in China
As part of its Fast Customs Clearance System during the first reform phase of China Customs, the Chinese government undertook considerable efforts in trade facilitation and establishing new port management and operation mechanisms from 2001 and, as a result, customs clearance efficiency has improved greatly (Wenjing and Wei, 2006). Before the reforms, the average time spent in customs clearance was 2.2 days; after the reforms, the time spent was 1.5 days; similarly, the average time spent in customs clearance in Shenzhen land port for each vehicle transferred to other customs was 30 minutes; after the reforms, it was 1 minute; after the reforms of express customs transfer in the Yangtze River Valley, the number of procedures of customs clearance for exported goods was reduced to 5 from 8, and that for imported goods to 4 from 11, and the number of items for which fees are charged has been reduced to 1 from 3.4.
Second reform phase (2004-2010)
In 2003, Chinese Customs initiated implementation of the second phase of the Modern
Customs System to be undertaken between 2004 and 2010 with the goal of establishing a
‘smart’ customs based on risk management best practices and reforming customs into a
scientifically managed, highly efficient and uncorrupted modern system (Shujie and Shilu,
2010; Wenjing and Wei, 2006). The following are vital elements of China’s strategy in the
second reform phase (Wenjing and Wei, 2006).
Adoption of the WTO valuation agreement principles: Starting 1 January 2002, China
Customs began full implementation of the WTO valuation agreement (Wenjing and Wei,
2006).
Automation and information technology in customs clearance: China Customs used
more and more technology for administrative management and customs clearance
supervision. For example, electronic processing limits the time and cost of international
trade substantially (Shujie and Shilu, 2010).
Electronic Data Interchange (EDI):13
EDI Customs Clearance Engineering was
established formally in China in 1992, having being updated in 2005 and generating the
following results (Mengchao, 2011). Up to 2010, the number of enterprise users exceeded
0.55 million. Daily processing capacity reaches 1.2 million items. In 2009, the amount of
online taxation payment to customs was RMB 39.06 billion nationwide, accounting for
42.4% of taxation entering into the national treasury. This had tripled compared with 2004.
In 2008, the export receipt and settlement of exchange online verification system was
running successfully. By the end of 2010, it registered over $65 billion.
Paperless customs clearance: The highly successful paperless clearance procedures have
been expanded to most customs districts of the General Administration of Customs since
their launch in 2001. The paperless process has greatly increased the speed of customs
clearance: the minimum time spent for exported goods is 5 minutes, and the maximum is
2.85 hours, while the minimum time spent for imported goods is 3 hours, with a maximum
of 32.25 hours (Wenjing and Wei, 2006).
Electronic customs: Since 2004, enterprises have been able to complete customs
procedures over the internet, including declarations for customs clearance, submissions for
examination, verification and writing-off of settlements and sales of exchange and export
refunds. Since 2006, 90% of export declarations for customs clearance have been able to be
completed within 1 day, and 80% of import declarations for customs clearance within 2
days (Wenjing and Wei, 2006).
13 EDI is the structured transmission of data between organisations by electronic means and is used to
transfer electronic documents or business data from one computer system to another computer system,
that is, from one trading partner to another trading partner, without human intervention.
ODI Report 17
Electronic ports: The General Administration of Customs has established 41 electronic
port data branch centres, enabling import exchange payment verification, export exchange
receipt verification, import value-added tax verification, declaration, export tax refund,
customs clearance and online taxation payment, with the following positive results
(Wenjing and Wei, 2006). Already in 2006, the number of enterprises joining the electronic
port system exceeded 200,000, and the number of daily electronic bills transactions was
500,000, with the portal website boasting a daily click rate of over 4.3 million. In 2004,
‘electronic ports’ processed a total of RMB 21.1 billion in duties and taxes paid on the
website, 15 million bills of declaration for imported and exported goods customs clearance
and a daily average rate of 22,000 export refund bills. The time for transmission of
electronic data from customs to taxation departments has also been reduced from 1 month to
24 hours. By the end of 2010, there were over 100 e-port projects running online already.
Integrated and electronic quarantine and inspection: Using information technology has
accelerated the speed of inspection and quarantine (Wenjing and Wei, 2006). In 2005, the
computer operation platform of China’s inspection and quarantine facility, the CIQ 2000
system, was updated, contributing to the establishment of a fast customs clearance
mechanism. After implementing electronic inspection and quarantine, the time spent on the
release of eligible goods reduced by 1 hour. Inspecting the complete process from
manufacturing techniques to product packaging helps supervision and inspection authorities
receive comprehensive data. Based on a related evaluation from related data, product
quality examination procedures can be completed before the products leave the factories.
This in turn reduces time spent on inspection and quarantine.14
Working with the private sector: In 2008, China Customs implemented the Framework of
Standards to Secure and Facilitate Global Trade of the World Customs Organization
(WCO), which is intended to enhance cooperation between customs and the business circle
(Jianqun, 2011). The Sino-Europe Secure and Intelligent Trade Route Pilot Project is the
first cross-continental cooperation project to implement the framework, involving Shenzhen
Customs in China, Rotterdam Customs in Holland and Felixstowe Customs in the UK and
the operators of the ports, some importers and exporters in China, Holland and the UK and
customs brokers, transport contractors and other relevant parties in the supply chain of
international trade, respectively. In 2011, customs in China and the US carried out a pilot
project of Sino-US joint authentication.
Training provided to customs staff: With the overall aim of increasing customs clearance
efficiency, China Customs has been aiming to develop high-quality customs staff and
enhance their professional and managerial skills (Wenjing and Wei, 2006). Currently,
training has been carried out among all levels of customs officials to ensure familiarisation
with the WTO rules and to reinforce management skills, IT skills and knowledge in
classification, valuation, law and technology.
Trade facilitation in bilateral and regional trade agreements: Customs has also
promoted cooperation with customs authorities in bilateral and regional trade partners in the
context of China’s free trade agreements (FTAs), mainly in electronic networking with
regard to preferential certificates of origin and customs data exchange, with European and
Russian customs, respectively (WTO, 2012).
3.2.3 Summary: trade facilitation in China
The implementation of trade facilitation measures has brought down time spent on customs
procedures as well as the transaction costs of trade procedures in China. The introduction of
paperless trading and the electronic quarantine and inspection framework have reduced the
costs for enterprises by around RMB 100 million per year and the implementation of
14 Since the Administration of Quality Supervision, Inspection and Quarantine reformed its entry-exit
inspection procedures and introduced the direct-release system in July 2008, enterprises exporting
certain products may go through inspection in their production area, rather than at ports (WTO, 2010).
ODI Report 18
electronic declaration has cut back the time spent on each batch of goods by 30 minutes
(Wenjing and Wei, 2006). In late 2007, 85% of the key performance indicator targets of the
Second-Step Development Strategy had been achieved (Liu, 2008). Many exporters used e-
ports and all export goods were being processed under the H2000 Customs Clearance
System (Shujie and Shilu, 2010). Almost all customs operations involved risk management
and around 60% of declarations were being automatically processed by the risk
management platform (Liu, 2008; Shujie and Shilu, 2010). The total physical inspection
rate was cut back to 3.41% (Liu, 2008). The clearance time was also reduced: 84% of
exports shipped by sea and 99.7% of exports shipped by other means of transport could be
released within eight working hours (Liu, 2008). IT-based customs clearance procedures
(known as the ‘golden series projects’, including the ‘golden customs project’, and the
‘golden quarantine and inspection project’) have helped boost tax revenue and prevent the
number of smuggling activities (Wenjing and Wei, 2006).15
In 2010, the average time
required for customs clearance was 1.7 hours for exports (2.4 hours in 2008) and 15.5 hours
for imports (14.1 hours in 2008) (WTO, 2012). In sum, the comprehensive initiatives taken
by China Customs and other agencies help foster a trade-enabling environment and business
to increase export competitiveness in an international supply chain.
3.3 State–business relations in China
The role of the state, above all the local states, has been the focus of attention in accounting
for the impressive rural industrialisation in China that triggered the country’s economic
take-off in the early 1980s (Nyberg and Rozelle, 1999; World Bank, 1996). Many
researchers argue that local governments in China have played a key interventionist role in
establishing collectively owned enterprises and in spearheading rural industrialisation,
describing local states as ‘corporatist’ (Oi, 1995; 1999), ‘entrepreneurial’ (Duckett, 1998) or
‘developmental’ (Blecher and Shue, 1996). The central government in China has not been
directly involved in local industrialisation but has established policy incentives to promote
industrial development by local governments. For instance, since the implementation of
fiscal decentralisation polices in the 1980s, local governments have been given the
financing responsibilities of public goods and service provision and the prerogative to
collect taxes as well as to keep a share of tax revenue – which in turn has made developing
tax-contributing industries an essential objective of local governments (Lin and Liu, 2000;
Oi, 1999). At the same time, more recent studies suggest that government stakes in
corporations and other ways of influence have also had negative effects on enterprise
performance (Lihui and Estrin, 2008; Nee et al., 2007; Ong, 2012; Pil and Thum, 2007). In
the end, China could be regarded as a state that lies between the two types of a predatory
and a developmental state, entailing elements of efficiency and inefficiency, of control and
chaos, of relative autonomy and clientelism, of neo-liberalism and neo-corporatism
(Howell, 2006).
The numerous special economic zones (SEZs) that emerged after China’s reforms are areas
with particular state–business relations. SEZs and industrial clusters are without doubt two
important engines of China’s remarkable development and have made crucial contributions
to China’s economic success (Zeng, 2011). Shenzhen, for example, has changed from a
small town into an enormous economic centre that has influenced the development of the
whole Pearl River Delta region, making it the largest, and most successful, SEZ in the world
today (Monaghan, 2012). The areas of Shenzhen, Shantou, Zhuhai, Hainan and Xiamen
along the Chinese southern coast have been developed as manufacturing hubs and open
access to international trade sea-lanes has led to their success. Foremost, the SEZs
(especially the first several) have successfully tested the market economy and new
institutions and have become role models for the rest of the country to follow (Ruis, 2012).
15 For example, the RMB 2.12 billion value of smuggling in 1998 was cut back to RMB 310 million in
1999 and to zero in 2000 after implementation of the networked inspection and supervision of import
declaration bills. As a consequence, customs tax revenue has increased, with a total value of RMB
259.057 billion in 2002, RMB 9.825 billion more than that in 2001. See Wenjing and Wei (2006).
ODI Report 19
Together with the numerous industrial clusters, the SEZs have contributed significantly to
national GDP, employment, exports and attraction of foreign investment. It is estimated
that, as of 2007, SEZs (including all types of industrial parks and zones) accounted for
about 22% of national GDP, about 46% of foreign direct investment (FDI) and about 60%
of exports and generated in excess of 30 million jobs. In 2007, the 54 High-tech Industrial
Development Zones (HIDZs) hosted about half the national high-tech firms and science and
technology incubators (Zeng, 2011). Recently, China has announced the development of six
new African SEZs (Kim, 2013; Ruis, 2012).
The key experiences of China’s SEZs and industrial clusters can best be summarised as
gradualism with an experimental approach; a strong commitment; and the active, pragmatic
facilitation of the state. Some of the specific lessons include the importance of strong
commitment and pragmatism from the top leadership; preferential policies and broad
institutional autonomy; staunch support and proactive participation of governments,
especially in the areas of public goods and externalities; PPPs; FDI and investment from the
Chinese diaspora; clear goals and vigorous benchmarking, monitoring and competition;
business value chains and social networks; and continuous technology learning and
upgrading (Zeng, 2011).
ODI Report 20
4 Country case: India
4.1 Trade-related infrastructure in India
4.1.1 Infrastructure investment in India
India is in the process of promoting its infrastructure with a focus on new ports, airports,
subways, freight rail, power generation and tolled highways (Ash et al., 2011). The Indian
government introduced a $1 trillion national infrastructure plan covering 2012-2017, double
the $500 billion goal of the past five years, with roughly half this investment expected to
come from the private sector. Among headlined projects underway are a $2.5 billion
expansion of the Mumbai subways, construction of a $3.6 billion Hyderabad Metro Rail
system, a $500 million highway upgrade between Jammu and Udhampur and a $173 million
toll road expansion from Ahmedabad to Godhra; six new dedicated freight rail corridors are
also under construction with a Phase 1 cost of $10 billion (Urban Land Institute and Ernst &
Young, 2012). The planned Delhi–Mumbai Industrial Corridor project has featured in a list
of the world’s 100 most innovative and inspiring infrastructure projects, which is distinctive
in its ambition to support trade-related infrastructure in India (Kenny, 2012). The $90
billion project will stretch across seven states and link the nation’s capital, Delhi, with the
financial capital, Mumbai, with a high-speed rail line for freight, a six-lane expressway and
a 4,000 megawatt power station plus nine industrial zones and twenty-four new cities along
the length of the corridor (ibid.).
At the same time, the greatest challenge to India’s future growth and trade performance
success is arguably the currently poor state of its infrastructure (City of London, 2012).
India currently spends 4.7% of GDP on infrastructure, compared to 8.5% of GDP in China
and 2.6% in the US. For example, while India’s road construction was better than that of
China in the early 1990s, this situation has changed radically in the more recent past, for the
most part because of limited infrastructure investment in India. Between 1991 and 2002,
China’s annual investment in its road network increased from about $1 billion to around
$38 billion, while India’s annual investment, starting at a comparable level in 1991, grew to
just $3 billion over the same period (Kim and Nangia, 2010).
4.1.2 Support to and financing of infrastructure in India
Supporting infrastructure in India
Until recently, the Indian government did not adopt the Chinese approach to infrastructure
development in terms of anticipating future demand. India’s infrastructure development
model had a stronger focus on redistribution, for example emphasising the development of
minor irrigation and rural roads as part of anti-poverty programmes in the 1970s and 1980s
rather than logistics to enhance growth and overall economic efficiency (Kim and Nangia,
2010).
ODI Report 21
The majority of infrastructure reforms in India did not start until the late 1980s and early
1990s.
After the 1991 fiscal crisis in India, the government implemented a number of
reforms to improve the global competitiveness of the economy,
acknowledging that the positive impact of these measures would decisively
hinge on the enhancement of the Indian infrastructure (Kim and Nangia,
2010).16
In other words, the development of infrastructure in India was fuelled
by the major economic reforms of the Indian economy, which unravelled the
former command and control regime, liberalised trade by reducing both tariffs
and non-tariff barriers and shifted the Indian state towards a closer and more
collaborative relationship with private capital, including FDI.
In 1994, the government set up an Expert Group for infrastructure
development, which suggested that, for India to maintain its annual target
growth, a threefold increase in infrastructure investments in absolute levels
would be needed and offered a number of recommendation to promote this
investment, including privatization (Kim and Nangia, 2010).17
In the early 1990s, the telecom sector was the first one to permit entry of
private sector firms in both basic and cellular telephone systems (Kim and
Nangia, 2010).
The government has actively encouraged the PPP model in light of the
benefits it offers in terms of cost savings, access to specialised expertise and
proprietary technology, sharing of risks with the private sector and leveraging
its own share in infrastructure investments.
Public–private partnerships in India
India currently attracts more private investment to its infrastructure sectors than China and
Brazil. In 2010, $75 billion was invested in Indian infrastructure-related PPPs (Urban Land
Institute and Ernst & Young, 2012). PPPs have a long history in India (ADB and Economist
Intelligence Unit, 2012). Case studies of Indian PPPs can be examined to learn from
positive and negative aspects of these examples (Bandgar, 2012).
Many PPPs in India have been successful and offer potential lessons for less developed
countries. For example, PPPs have been a success story in the context of a number of
airports that have been built. India made use of the PPP model to upgrade and develop the
two primary gateways at Delhi and Mumbai, and to construct greenfield facilities in
Bangalore and Hyderabad (CAPA, 2012; Ministry of Finance, 2009). Prior to this, all
airports in the country, with the exception of Cochin Airport, were operated by the state-
owned Airports Authority of India (AAI).
To boost PPPs in infrastructure, the government has introduced two main initiatives:
viability gap funding and the India Infrastructure Finance Company Limited (IIFCL) to
satisfy the long-term financing needs of potential investors (Gupta, 2009). Since 2009, the
awarding of PPP projects in India is subject to requirements such as strategic planning, pre-
feasibility analysis, financial viability and PPP suitability, generating a process that is
regarded as time-consuming but fair and predictable (City of London, 2012). The
introduction of Model Concession Agreements in 2004 has contributed to enhancing risk
allocation (ADB and Economist Intelligence Unit, 2012).
16 Until 1994, the Indian government did not have a comprehensive framework for infrastructure and
the infrastructure planning, regulation, production and supply were typically dominated by public
sector state-owned enterprises (SOEs), which generated accountability challenges owing to strong
interference by political ‘bosses’ (Virmani, 2005). 17 The Expert Group’s findings were presented to the government in June 1996 in a report titled ‘The
India Infrastructure Report: Policy Imperatives for Growth and Welfare’.
ODI Report 22
While India’s PPP framework has improved, a number of challenges remain relevant
(Lakshmanan, 2008). Recently, the draft of a national PPP policy was released, proposing that
each PPP project would be vetted at the central government level, but, as of now, there is no
PPP act at a federal level in India (ADB and Economist Intelligence Unit, 2012; FICCI and
Ernst & Young, 2012). Moreover, there is a lack of capacity to structure and undertake PPPs
and there are many challenges due to red tape and land acquisition problems (City of
London, 2012).
Recently, the Indian government took a range of additional measures to promote
development of infrastructure by setting a number of sectoral infrastructure targets,
improving the monitoring of PPPs and easing land transfer between government agencies
for PPP projects (Urban Land Institute and Ernst & Young, 2012).
Encouraging private investment in infrastructure remains a challenge. In the 10th Five-Year
Plan (2002-2007), a promising start was made by the central government with PPP in many
trade-related infrastructure sectors (Gupta, 2009). Between 2007 and 2012, $225 billion
(equivalent to 12% of GDP) was invested by the private sector in infrastructure, much of it
on the basis of PPPs (Economist, 2012). Yet the targets have not been achieved as planned
(FICCI National Committee on Infrastructure and Ernst & Young, 2012). There were many
hold-ups and merely a quarter of all projects are on or ahead of schedule (Economist, 2012).
Railways: In a major initiative in PPP, container movement, until then a
monopoly of the Container Corporation of India, has been thrown open to
competition and a number of major private sector entities have been licensed
for running container trains on tracks owned by Indian Railways.18
But many
projects are behind schedule owing to insufficient funds, misplaced
investment priorities, lack of timely reforms in organisations and inability to
attract private investments, and only 1,750 km of new lines was added from
2006 to 2011, as compared with 14,000 in China (FICCI National Committee
on Infrastructure and Ernst & Young, 2012).
Ports: The 11th Plan included a larger programme of port capacity expansion
based on PPP.19
The Maritime Agenda proposes an investment of Rs. 1,280
billion in 424 projects in major ports and Rs. 1,680 billion in non-major ports
by 2020 with a highly ambitious target of more than 80% of the investment
coming from the private sector, given the experience of PPP projects in the
ports sector and challenges such as environmental clearances, slow
bureaucratic procedures and poor connectivity to the hinterland (FICCI
National Committee on Infrastructure and Ernst & Young, 2012). In 2011-
2012, the capacity addition was almost nil in major ports for cargo handling
(Sreeja, 2012).
Airports: It was planned to involve the private sector in non-aeronautical
activities at 35 non-metro airports and in the development of greenfield
‘merchant’ airports and about 300 airstrips.20
Roads: The central as well as a few state governments have engaged the
private sector in road development, for instance as part of the National
Highways Development Project (NHDP) (see also below).21
Yet the
ambitious targets have not been met yet. In 2009-2010, the National
Highways Authority of India was able to build highways at an average of
13.72 km per day, a number that dropped to an average of 10.39 km per day
in 2011-2012, clearly falling short of the much higher original target of 20 km
18 For more information, see www.indianrailways.gov.in 19 For more information, see www.shipping.nic.in. 20 For more information, see www.aai.aero and www.dgca.nic.in. 21 For more information, see www.nhai.org.
ODI Report 23
a day (FICCI National Committee on Infrastructure and Ernst & Young,
2012).
Financing infrastructure in India
The Indian government had understood early it was important to involve the private sector
in infrastructure development. In 1997, the Infrastructure Development Finance Corporation
Ltd. (IDFC) was incorporated as a specialised financial intermediary for infrastructure. The
year 2004 was characterised by a first huge jump in private investment in infrastructure,
being present in numerous trade-related infrastructure sectors, including telecoms, ports,
airports, power generation and roads (Anand, 2010). For example, India has the largest
PPP-based NHDP in the world: over one-half the envisaged 54,500 km has been planned on
a PPP toll basis and another one-quarter on a PPP annuity basis (ibid.).
The main current financing approaches for infrastructure in India can be summarised as
follows:
To date, India has managed to boost private investment in infrastructure
mostly on the basis of commercial bank financing, notably public sector
banks, both direct and indirect. This has caused an increasing concentration of
risks in the commercial banks’ balance sheets owing to the maturity mismatch
generated by financing long-duration infrastructure projects from the
essentially short-term nature of banks’ liabilities (Lall and Anand, 2009;
Rastogi and Rao, 2011).
Pension funds and insurance companies, while appropriate to fund
infrastructure in light of their long-term liabilities, are to date a minor basis
for funding infrastructure in India, mainly because of the pre-emption of
insurance resources by the government, strict investment guidelines for
insurance companies that most infrastructure projects are not able to satisfy
and general risk aversion on the side of the insurance companies (Anand,
2010).
Equity financing is vital to sustain higher debt, and there has recently been
more and more activity in both public markets and private equity, but the
development of a strong domestic private equity industry is constrained by
the small base of domestic investors (Anand 2010).
The government of India has introduced a number of measures to support infrastructure
projects, which include the following highlights:
Infrastructure debt funds (IDFs): Recently, India introduced IDFs that
show significant promise to facilitate the flow of long-term debt in
infrastructure projects by tapping into sources of long tenure savings such as
insurance and pension funds, which have so far played a rather small part in
financing infrastructure in India (City of London, 2012; Jain and Nair, 2013;
Mahajan, 2012). The finance minister also introduced tax incentives for IDFs.
Foreign institutional investor (FII): In 2012, the maximum limit of FII
investment in bonds and non-convertible debentures issued by infrastructure
companies was increased to $40 billion and the Ministry of Finance further
relaxed the lock-in period and the residual maturity to one year (City of
London, 2012; India Brandi Equity Foundation, 2013).
Foreign Direct Investment: To promote infrastructure financing, 100% FDI
is permitted under the automatic route in a number of sectors, including
mining, power, civil aviation, construction and development projects,
industrial parks, telecommunications and SEZs (City of London, 2012).
External Commercial Borrowing (ECB) policies: In 2011, the Reserve
Bank liberalised the ECB policy relating to the infrastructure sector by
allowing the foreign equity holder to offer credit enhancement for the
ODI Report 24
domestic debt raised by Indian companies engaged exclusively in the
development of infrastructure without the need for ex-ante approval from the
Reserve Bank (City of London, 2012).
Viability gap funding (VGF): VGF, introduced in 2006, entails a grant that
is provided to attract private investment into the infrastructure sector and to
support projects that are economically justified but lack financial viability.
(City of London, 2012).
India Infrastructure Finance Company Limited: IIFCL, set up in 2006 by
the Indian government and with an enhanced capital base since 2011, offers
long-term loans to infrastructure projects, in the context of both direct lending
to project companies and refinancing banks and other financial institutions
(City of London, 2012). Under its credit enhancement initiative, IIFCL offers
partial credit guarantee to improve the ratings of the project bond issue to
increase long-term funds from largely untapped sources, such as insurance
companies and pension funds (ibid.; Jain and Nair, 2013).
Bank financing: A number of steps have been taken to further enhance bank
financing in infrastructure, including permission to invest in unrated bonds in
order to promote the supply of credit for the infrastructure sector (City of
London, 2012).
4.1.3 Summary: infrastructure in India
In both India and China, the municipal government is an important factor in infrastructure
development, and in both countries the potential for private sector funds is immense;
however, whereas in China infrastructure is constructed, operated and maintained by
different companies established by local governments, in India it is the local government
itself that performs these functions, which has made cost recovery less efficient than in
China (Brooks and Zhai, 2008).
The future development of India’s infrastructure presents a huge opportunity as well as a
huge task. The challenges are reflected, for example, in the Indian roads sector. While
India’s road construction was better than that of China in the early 1990s, this situation has
changed radically in the more recent past, for the most part because of limited infrastructure
investment in India. India’s investment philosophy differed from China’s, where the focus
was on new arterial networks; India, in contrast, centred attention on rural roads. While
China now has a striking road system, India is characterised by an under-sized and over-
crowded road network (Kim and Nangia, 2010).
However, toll road projects have proliferated in India, where highway projects account for
than half of all projects involving private participation in infrastructure concluded in 1990-
2006 and accounted for more investment commitments in 2003-2007 than any other sector
apart from telecommunications (Leigland, 2010). High traffic volumes and methods for
reducing private partners’ risks and costs, such as VGF, have helped promote highway
development, but in LICs lower traffic volumes and restricted funding for risk and cost
reduction have constrained the use of toll roads (ibid.).
Investment in railroads is difficult owing to direct government ownership and, while several
airport privatisations have been a success, investment in port facilities has been slow and
energy generation and transmission have been undermined by poor pricing models and
regulations (Syed and Walsh, 2012).
The challenges for India’s infrastructure sector more generally include major capacity
improvements but also additional coordination at the central level and simpler finance
structures with more focus on user fees and greater accountability for infrastructure
agencies in terms of outputs. Domestic players criticise poor policy frameworks and
excessively bureaucratic procedures (Urban Land Institute and Ernst & Young, 2012).
Moreover, there are a number of challenges in better involving the private sector, including
ODI Report 25
attracting private finance, coordination and implementation issues and ability of the Indian
government to carry out PPP projects (Anand, 2010). As discussed above, initial measures
have been taken to tackle these challenges, and, while much still needs to be done, first
results seem positive. Overall, PPPs in India have been a success so far and can offer
lessons for less developed countries.
Despite the various measures that have been taken to promote the Indian infrastructure
sector, a number of challenges remain (City of London, 2012):
Bank financing: In India, banks are the main institutions that can assess and
deal with construction risk and, while the government has introduced a
number of measures to facilitate investments from non-banking sources,
investors are still not able to receive consistent returns at par to the risk at
stake.
Savings: India has a very high saving rate of about 35%, but very little of
these savings are invested in infrastructure, given the absence of effective
long-term savings instruments.
Corporate bond market: While a vibrant corporate bond market can amplify
the flow of long-term funds and reduce reliance on banks, the Indian
corporate bond market, although one of the most developed in Asia, is still
nascent.
Insurance and pension funds: Indian insurance and pension funds face
constraints to directly invest in the infrastructure sector because of their
obligation to invest a large share of their funds in government securities.
CDSs: Since the launch of CDSs in 2011, there has not been much uptake,
especially because of lack of clarity on the required documentation, valuation
and pricing and board approvals in public sector banks and a lack of
knowledge of and exposure to working with derivatives.
Bureaucracy, red tape and land issues: Infrastructure investments in India
are frequently hindered by bureaucracy and land acquisition issues, and firms
often criticise red tape and lack of transparency in the awarding of contracts
as well as a lack of sufficient available debt available to fund new ventures.
Land is often the most controversial issue in infrastructure projects. The
much-awaited Land Acquisition Bill has still not been tabled in the Lower
House of Parliament, but in July 2012 Prime Minister Manmohan Singh
relaxed the land transfer policy on government-owned lands, thereby fast-
tracking pending infrastructure projects and also reducing the approval
periods of newer projects. Key policies and regulation reforms should be fast-
tracked for enhanced implementation, including single window clearance
approach for approval of infrastructure projects; a robust dispute resolution
framework put in place; enhanced monitoring of projects implemented and
funding facilitated; and more favourable taxation policies for infrastructure
projects introduced, including for foreign investment (FICCI National
Committee on Infrastructure and Ernst & Young, 2012).
If no measures are taken to address the above challenges, there is a strong possibility that
India will not achieve the $1 trillion target.
So far, like in China, banks have dominated infrastructure finance in India, but the Reserve
Bank has not allowed the same high concentration in infrastructure assets as Chinese banks
have taken on. In terms of foreign finance, India has so far relied mostly on multilateral
lenders. The establishment of the New Pension Scheme (NPS) shows potential for an
extensive growth of assets under management of pension funds and is therefore promising
for future infrastructure development in India (Walsh et al., 2011).
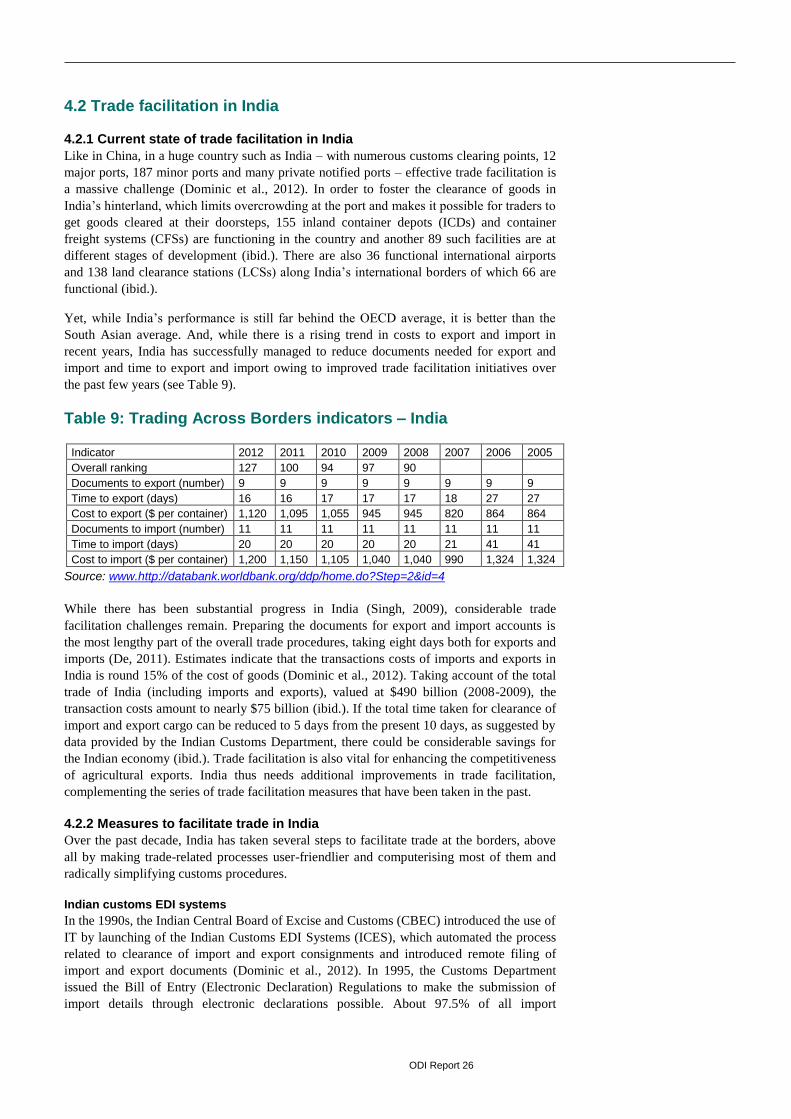
ODI Report 26
4.2 Trade facilitation in India
4.2.1 Current state of trade facilitation in India
Like in China, in a huge country such as India – with numerous customs clearing points, 12
major ports, 187 minor ports and many private notified ports – effective trade facilitation is
a massive challenge (Dominic et al., 2012). In order to foster the clearance of goods in
India’s hinterland, which limits overcrowding at the port and makes it possible for traders to
get goods cleared at their doorsteps, 155 inland container depots (ICDs) and container
freight systems (CFSs) are functioning in the country and another 89 such facilities are at
different stages of development (ibid.). There are also 36 functional international airports
and 138 land clearance stations (LCSs) along India’s international borders of which 66 are
functional (ibid.).
Yet, while India’s performance is still far behind the OECD average, it is better than the
South Asian average. And, while there is a rising trend in costs to export and import in
recent years, India has successfully managed to reduce documents needed for export and
import and time to export and import owing to improved trade facilitation initiatives over
the past few years (see Table 9).
Table 9: Trading Across Borders indicators – India
Indicator 2012 2011 2010 2009 2008 2007 2006 2005
Overall ranking 127 100 94 97 90
Documents to export (number) 9 9 9 9 9 9 9 9
Time to export (days) 16 16 17 17 17 18 27 27
Cost to export ($ per container) 1,120 1,095 1,055 945 945 820 864 864
Documents to import (number) 11 11 11 11 11 11 11 11
Time to import (days) 20 20 20 20 20 21 41 41
Cost to import ($ per container) 1,200 1,150 1,105 1,040 1,040 990 1,324 1,324
Source: www.http://databank.worldbank.org/ddp/home.do?Step=2&id=4
While there has been substantial progress in India (Singh, 2009), considerable trade
facilitation challenges remain. Preparing the documents for export and import accounts is
the most lengthy part of the overall trade procedures, taking eight days both for exports and
imports (De, 2011). Estimates indicate that the transactions costs of imports and exports in
India is round 15% of the cost of goods (Dominic et al., 2012). Taking account of the total
trade of India (including imports and exports), valued at $490 billion (2008-2009), the
transaction costs amount to nearly $75 billion (ibid.). If the total time taken for clearance of
import and export cargo can be reduced to 5 days from the present 10 days, as suggested by
data provided by the Indian Customs Department, there could be considerable savings for
the Indian economy (ibid.). Trade facilitation is also vital for enhancing the competitiveness
of agricultural exports. India thus needs additional improvements in trade facilitation,
complementing the series of trade facilitation measures that have been taken in the past.
4.2.2 Measures to facilitate trade in India
Over the past decade, India has taken several steps to facilitate trade at the borders, above
all by making trade-related processes user-friendlier and computerising most of them and
radically simplifying customs procedures.
Indian customs EDI systems
In the 1990s, the Indian Central Board of Excise and Customs (CBEC) introduced the use of
IT by launching of the Indian Customs EDI Systems (ICES), which automated the process
related to clearance of import and export consignments and introduced remote filing of
import and export documents (Dominic et al., 2012). In 1995, the Customs Department
issued the Bill of Entry (Electronic Declaration) Regulations to make the submission of
import details through electronic declarations possible. About 97.5% of all import
ODI Report 27
documents are processed electronically (WTO, 2011). EDI facilities are available at
92 customs offices and the facility of ‘around the clock’ electronic filing of customs
documents for clearance of goods is possible at an increasing number of centres.22
Electronic commerce portal
In 2002, India further facilitated trade by implementing an electronic commerce portal,
ICEGATE (Indian Customs and Excise Gateway), which eases the electronic filing of
import and export documents and related electronic exchange between customs and the
trader, offering a choice of means of communication, including the internet, and a helpdesk
on a 24x7 basis (Dominic et al., 2012). There has been a steady increase in filing of customs
documents through ICEGATE since its launch and currently about 8,000 import and export
declarations are being filed daily by making use of the facility (ibid.).
National Import Data Base
Moreover, since 2002, the NIDB has been used by the Directorate General of Valuation to
accelerate valuation procedures by allowing a comparison with data gathered on the value
of recent imports of comparable goods (WTO, 2007). This permits customs officers to take
well-informed decisions on valuation and classification of imported goods and to avoid loss
of revenue on account of under-valuation or mis-declaration (Chaturvedi, 2007; Dominic et
al., 2012; Srivastav, 2003).
Risk management system
In 2005, India initiated a risk management system (RMS) in order to decide which
containers to inspect and selectively screen only high- and medium-risk cargo for customs
examination (WTO, 2011). The RMS for processing imports is operational at 48 customs
offices; some 85% of India’s imports are processed via this system. The launch of the RMS
in major customs locations has cut back the average time taken by customs to eight hours,
with two hours for assessment and six hours for examination (ibid.).
Accredited Client Programme
The ACP guarantees clients who are assessed as having a good track record of being highly
compliant facilitation by the RMS, which secures faster delivery and reduced transaction
costs (Chaturvedi, 2007; Dominic et al., 2012). Customs also works with the custodians at
various ports/airports to ensure that the cargo of such units is delivered quickly. As of early
2011, 250 ACP importers are allowed to self-assess their consignments with no need for
examination, in line with India’s commitments to simplify and harmonise customs'
procedures under the revised Kyoto Convention (WTO, 2011).23
Trade facilitation in special economic zones
SEZs offer single window clearance, automation of procedures and trade facilitating on
self-certification basis (Tantri and Kumar, 2011).
Trade facilitation in the context of regional integration
In order to increase trade with neighbouring countries, India has initiated a number of
measures in the context of regional integration, including the establishment of integrated
checkpoints on the border with Pakistan, Bangladesh, Nepal and Myanmar (Mehta, 2011).
Training provided to customs staff
The CBEC has launched a number of measures to train officers so they can deal well with
reforms and streamlining of the various trade measures, which may eventually contribute to
faster clearance of goods (Wenjing and Wei, 2006).
22 There are some 300 customs posts in India. According to the authorities, posts that are not
automated are mainly remote land stations where trade is almost zero. 23 See Customs Circulars Nos 42/2005 and 43/2005, 24 November 2005, and Chaturvedi (2009).
ODI Report 28
Facilitating trade at the operational level
In addition to reforms at the policy level, a number of additional trade facilitation measures
have been launched at the operational level by various customs houses. For example,
Jawaharlar Port has introduced a system of e-payment of duty and customs examinations
through computer system even after office hours to speed up the clearance process.
4.2.3 Summary: trade facilitation in India
In India, trade procedures have become more efficient. In the period between 2005 and
2011, the time needed to finish all trade procedures involved in moving goods from factory
to ship at the nearest seaport – or vice versa – was cut back by more than 40%, with an 18%
reduction being the average for developing economies in the Asia-Pacific region (ARTNeT
and UNNExT, 2012).24
Especially the implementation of the EDI system in 1994, and the
RMS in 2005 at India’s major customs offices, has increased the efficiency of border
procedures. The number of documents processed through the EDI grew from 3.2 million in
2008-2009 to 8 million in 2010-2011. Between 2007 and 2011, the average time for the
completion of export procedures was reduced by 10 days (17 days down from 27 days in
2007), which entails 8 days for document preparation and 2 days for customs clearance and
technical inspections (WTO, 2011).
India’s ongoing Foreign Trade Policy (FTP) 2009-2014 states that the country aims to turn
around the downwards trend of exports (De, 2011). In order to bring down transaction costs,
two important policy measures undertaken through FTP 2009-2014 are further procedural
rationalisation and, as mentioned above, enhancement in infrastructure related to exports
(De, 2011).
4.3 State–business relations in India
In the period between independence and the early 1990s, the Indian economy resembled a
‘command and control regime’.25
Such a dirigiste system, where the state effectively shaped
the investment decisions of the private sector, gave rise to a collusive and rent-seeking
relationship between the state and the private sector, which in turn had considerable
negative effects for the economic performance of India (Sen, 2010). In the 1980s, the
relationship between the state and the private sector changed drastically, which in turn
enabled India’s sustained economic growth in the following years (Kohli, 2006a; 2006b).
After early signs of a shift after the early 1980s, in 1991 the Indian economy was subject to
major economic reforms, the command and control regime ended and the relationship
between the Indian state and private capital changed from a hostile towards a closer and
more collaborative relationship with the business sector (Sen, 2010). The Indian reforms
were targeted at enhancing the economy’s flexibility after a balance of payments crisis and
focused on abolishing restrictions on manufacturing and trade. During the 1990s, licensing
requirements were lifted across many industries, tariffs fell and India’s financial markets
began to open to the world (Syed and Walsh, 2012).
Recent research has shown that the evolution of state–business relations has varied across
Indian states and that these regional variations in the quality or effectiveness of state–
business relations can account for variations in economic growth across Indian states (Calì
and Sen, 2009). Calì and Sen (2009) also find that the establishment of formal organisations
as such does not seem to foster economic growth but that the key elements of the Indian
state–business relations that stimulate economic growth are those linked to the actual
interactions between states and businesses, which in turn underlines that business
24 South-East Asia made the most progress, cutting its average time for completing trade procedures to
20 days. Cambodia and Thailand cut their time by more than 40% during the same period. India and
Pakistan achieved improvements of a similar magnitude, although trade procedures in South and
South-West Asia still take 50% more time to complete than in South-East Asia (30 days on average). 25 This account of state–business relations in India is based on Sen (2010).
ODI Report 29
associations should focus on enhancing more collaborative relations between states and the
private sector. At the industry and firm levels, recent research finds comparable positive
impacts of effective state–business relations on industrial productivity growth and
manufacturing firm performance in India (Kathuria et al., 2010). The case of India also
demonstrates that a negative collusive relationship can be modified into a more
collaborative relationship if leaders and elites manage to form developmental coalitions
(Alivelu et al., 2009).
In 2005, the government of India passed the Special Economic Zones Act to promote
exports, investments and employment generation on the basis of various fiscal benefits and
relaxations.26
Most Indian SEZs are related to IT and IT-enabled services. Roadblocks for
SEZs in India are land acquisition issues and inadequate infrastructure outside the notified
SEZ areas. However, overall, the scheme has been very successful, receiving a good
response from developers and investors, and thus offers lessons for LICs (Maharashtra
Economic Development Council and PricewaterhouseCoopers, 2008).
26 For more details, see also www.sezindia.nic.in.
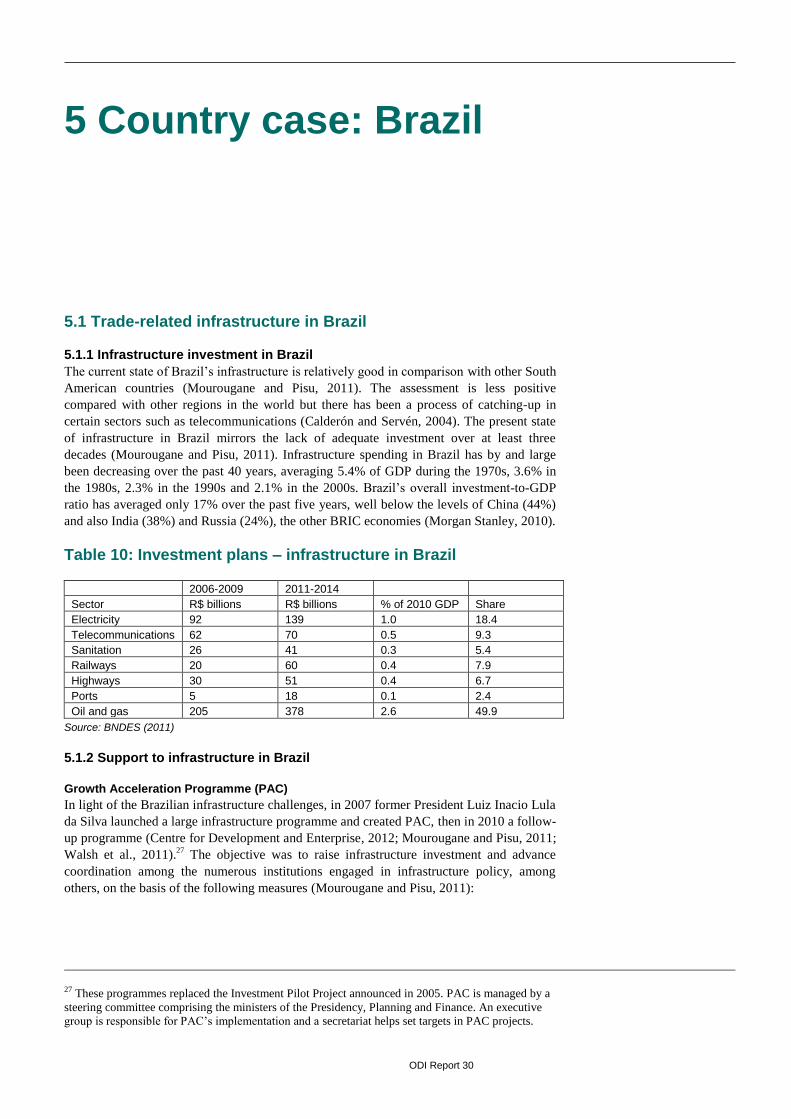
ODI Report 30
5 Country case: Brazil
5.1 Trade-related infrastructure in Brazil
5.1.1 Infrastructure investment in Brazil
The current state of Brazil’s infrastructure is relatively good in comparison with other South
American countries (Mourougane and Pisu, 2011). The assessment is less positive
compared with other regions in the world but there has been a process of catching-up in
certain sectors such as telecommunications (Calderón and Servén, 2004). The present state
of infrastructure in Brazil mirrors the lack of adequate investment over at least three
decades (Mourougane and Pisu, 2011). Infrastructure spending in Brazil has by and large
been decreasing over the past 40 years, averaging 5.4% of GDP during the 1970s, 3.6% in
the 1980s, 2.3% in the 1990s and 2.1% in the 2000s. Brazil’s overall investment-to-GDP
ratio has averaged only 17% over the past five years, well below the levels of China (44%)
and also India (38%) and Russia (24%), the other BRIC economies (Morgan Stanley, 2010).
Table 10: Investment plans – infrastructure in Brazil
2006-2009 2011-2014
Sector R$ billions R$ billions % of 2010 GDP Share
Electricity 92 139 1.0 18.4
Telecommunications 62 70 0.5 9.3
Sanitation 26 41 0.3 5.4
Railways 20 60 0.4 7.9
Highways 30 51 0.4 6.7
Ports 5 18 0.1 2.4
Oil and gas 205 378 2.6 49.9
Source: BNDES (2011)
5.1.2 Support to infrastructure in Brazil
Growth Acceleration Programme (PAC)
In light of the Brazilian infrastructure challenges, in 2007 former President Luiz Inacio Lula
da Silva launched a large infrastructure programme and created PAC, then in 2010 a follow-
up programme (Centre for Development and Enterprise, 2012; Mourougane and Pisu, 2011;
Walsh et al., 2011).27
The objective was to raise infrastructure investment and advance
coordination among the numerous institutions engaged in infrastructure policy, among
others, on the basis of the following measures (Mourougane and Pisu, 2011):
27 These programmes replaced the Investment Pilot Project announced in 2005. PAC is managed by a
steering committee comprising the ministers of the Presidency, Planning and Finance. An executive
group is responsible for PAC’s implementation and a secretariat helps set targets in PAC projects.
ODI Report 31
PAC envisaged $251 billion in additional infrastructure and other investment
over four years, to be financed by the government ($34 billion) as well as
public enterprises and the private sector.28
The first PAC had final outlays of almost R$570 billion for the 2007-2010
period (Lewis, 2012).
PAC exempted specific capital and goods related to infrastructure investment
and construction from some federal taxation through the Special Incentive
Regime for Infrastructure Development (REIDI), and aimed at creating a tax-
exempt national investment fund to finance infrastructure projects.
PAC further strengthened the position of the publicly owned Brazilian
Development Bank (BNDES), which dominates long-term private sector
corporate finance (see also below). The bank decreased spreads for
infrastructure projects strongly and prolonged the terms of some of its loans.
From only $3.4 billion in 2003, BNDES lending for infrastructure projects
rose to $17.5 billion 2008 and $25 billion in 2009, leading to an increase in
the GDP share of public investment to an estimated 3.2% in 2010, with more
than 60% of this investment coming from SOEs.
To tackle contradictory developments at the economy-wide level, the
government has increased resources to monitor progress in the infrastructure
programmes and publishes a regular progress report.
In 2011, the management and the implementation of PAC was moved to the
Ministry of Planning, but if coordination continues to be a challenge the
authorities could deliberate establishing a dedicated agency to oversee
infrastructure developments, which would evaluate projects on a common
basis and coordinate infrastructure policies by advising central and local
governments on priorities and possible financing mechanisms.
Under its PAC 2 Accelerated Growth Programme, the government has committed to
spending R$959 billion on infrastructure projects by 2014 and R$631 billion beyond 2014,
capital which is channelled in part through BNDES (Williams, 2011). By late 2012, PAC 2
had reached 40.4% of its investment goal for the period 2011-2014, spending R$385.9
billion ($186 billion) on road, rail, port, power and other projects, according to the Planning
Ministry (Lewis, 2012).29
The government regards PPPs as an essential approach to attain
PAC’s targets (see also below).
Activities regarding the 2014 World Cup and the 2016 Olympic Games
For the 2014 World Cup and the 2016 Olympic Games, Brazil is in the process of an
enormous transformation. In 2011, the government introduced a policy to accelerate
projects by holding a single tender for both public works’ design and construction of urban
transportation, airport and stadiums projects related to the World Cup. In Rio de Janeiro,
Transolímpica is one of the key projects to improve the city’s public transportation for the
Olympic Games, with a 23 km highway with six lanes – three in each direction with two of
the tracks to be used exclusively by buses through a Bus Rapid Transit scheme with 18
stations – an affordable transport solution that could be replicated in other less developed
countries (KPMG International, 2012). In São Paulo, Line 4 of the Metro was the first PPP
signed by the state, planned to be carrying nearly 1 million people per day (ibid.). The $1
billion Embraport Project, based in the city of Santos in São Paulo, is a privately owned port
with incorporated road and rail infrastructure which will be the largest-ever port project
28 In this sense, it is similar to India’s five-year plans, although in Brazil most public sector investment
will be undertaken by public enterprises rather than directly by national and local governments. 29 For example, PAC 2 projects have already spent R$26.8 billion to add 1,120 km of new highways
throughout Brazil, and are currently improving 22 airports. Airport capacity has been increased by 13
million passengers a year by PAC 2 spending. Electricity generating capacity has been increased by
4,244 megawatt hours thanks to spending of R$87.6 billion on construction of 52 plants since the start
of the PAC 2. See Lewis (2012).
ODI Report 32
financing in Latin America on a limited-recourse basis (ibid.). Together with the São Paulo
Ring Road project, the two assets will have a considerable impact, easing traffic congestion
on land and sea, which will reduce delays and help cargo move more efficiently. Yet,
problems in the context of red tape and corruption scandals continue to challenge
infrastructure development in Brazil.
5.1.3 Financing infrastructure in Brazil
This section discusses the various investment approaches and instruments that have been
implemented thus far.
Bonds
In Brazil, many bonds are issued in US dollar denomination but the government seeks to
raise the number of local bonds issued to relieve the burden at the national level (Fick,
2011; Gregoire, 2011).
BNDES
BNDES is an essential player for the financing of Brazilian infrastructure. BNDES has
granted loans. Moreover, BNDES introduced new financing products for investments in
infrastructure (Leal, 2012). For instance, many projects for the new Investment Programme
in Logistics are funded by BNDES, entailing a repayment deferral period that ranges from
three years (motorways) to five years (railways) (Gregoire, 2011).
Taxes
While taxes in Brazil are relatively high in comparison to other countries (Pereira, 2010;
Selvanayagam, 2010), in 2010, the Brazilian government reduced selected taxes to facilitate
infrastructure development (Chagas, 2011; Gregoire, 2011).
Public–private partnerships
Brazil started to attract private capital into infrastructure development earlier than other
Latin American countries and, over the past decade, the private and the public sector have
both accounted for about half of total investment in infrastructure (Mourougane and Pisu,
2011).30
Brazil is open to the privatisation of its transport infrastructure (Gregoire, 2011; Leal,
2012). In 2004, a new law introduced a distinction between PPPs and concessions and
regulated a number of aspects of PPPs such as project selection, bidding, signing and
management of projects at all levels of government, providing a favourable environment to
benefit from private participation in infrastructure (Mourougane and Pisu, 2011). This law
contributed to constrain the frequency of costly renegotiations, which often undermined
PPP contracts in the past (Calderón and Servén, 2010).
Although the PPP laws have been in place since 2004, few PPPs have been established
since then, in part because the procedure for their formation is highly bureaucratic (Leal,
2012). The current management process of PPPs and concessions should thus be simplified,
for instance by consolidating responsibilities among the various authorities involved and
offering standardised contracts to reduce some of the transactions costs that PPPs generate
(Mourougane and Pisu, 2011). A recent evaluation of PPPs in Brazil underlined strong
performances on investment climate, institutional framework and subnational adjustment
(Economits Intelligence Unit, 2013).
5.1.4 Summary: infrastructure in Brazil
Infrastructure in Brazil used to be chronically underfunded. While it will take some time,
for instance before better transport makes Brazilian goods more competitive on global
30 While private participation was initially concentrated in the telecom sector, since 2004, a surge in
private projects has been observed in the energy sector and since 2006 in the transport sector. See
Mourougane and Pisu (2011).
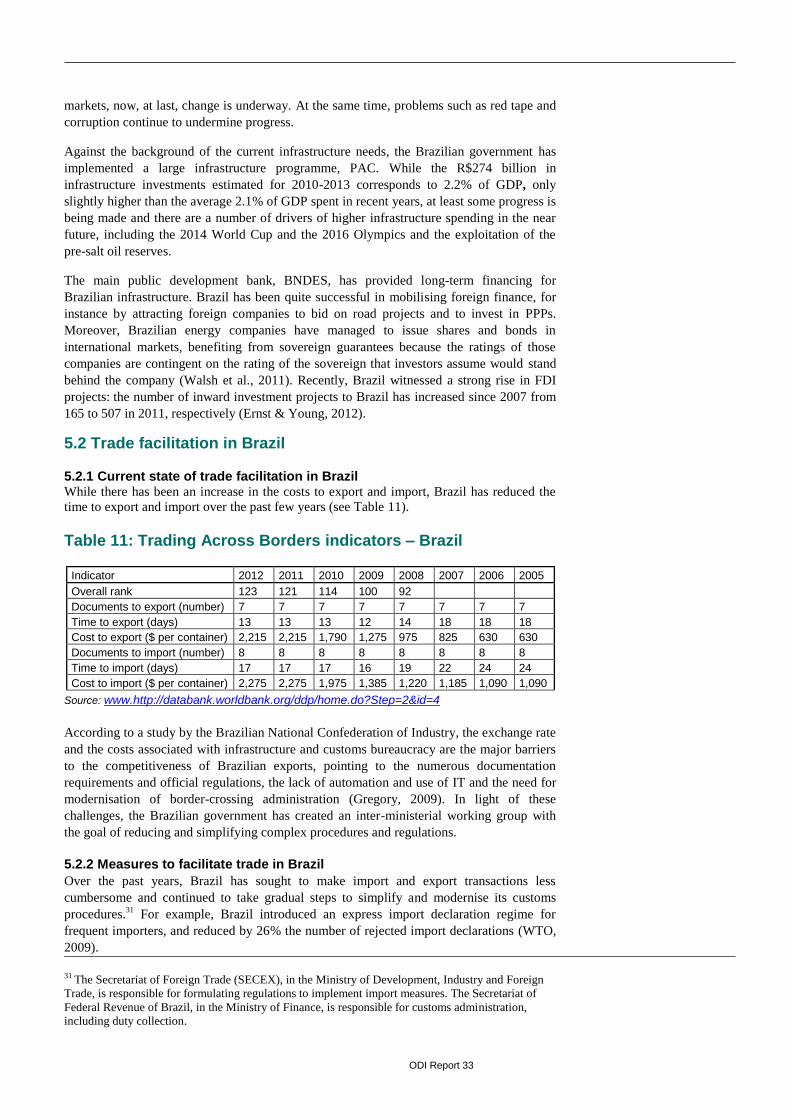
ODI Report 33
markets, now, at last, change is underway. At the same time, problems such as red tape and
corruption continue to undermine progress.
Against the background of the current infrastructure needs, the Brazilian government has
implemented a large infrastructure programme, PAC. While the R$274 billion in
infrastructure investments estimated for 2010-2013 corresponds to 2.2% of GDP, only
slightly higher than the average 2.1% of GDP spent in recent years, at least some progress is
being made and there are a number of drivers of higher infrastructure spending in the near
future, including the 2014 World Cup and the 2016 Olympics and the exploitation of the
pre-salt oil reserves.
The main public development bank, BNDES, has provided long-term financing for
Brazilian infrastructure. Brazil has been quite successful in mobilising foreign finance, for
instance by attracting foreign companies to bid on road projects and to invest in PPPs.
Moreover, Brazilian energy companies have managed to issue shares and bonds in
international markets, benefiting from sovereign guarantees because the ratings of those
companies are contingent on the rating of the sovereign that investors assume would stand
behind the company (Walsh et al., 2011). Recently, Brazil witnessed a strong rise in FDI
projects: the number of inward investment projects to Brazil has increased since 2007 from
165 to 507 in 2011, respectively (Ernst & Young, 2012).
5.2 Trade facilitation in Brazil
5.2.1 Current state of trade facilitation in Brazil While there has been an increase in the costs to export and import, Brazil has reduced the
time to export and import over the past few years (see Table 11).
Table 11: Trading Across Borders indicators – Brazil
Indicator 2012 2011 2010 2009 2008 2007 2006 2005
Overall rank 123 121 114 100 92
Documents to export (number) 7 7 7 7 7 7 7 7
Time to export (days) 13 13 13 12 14 18 18 18
Cost to export ($ per container) 2,215 2,215 1,790 1,275 975 825 630 630
Documents to import (number) 8 8 8 8 8 8 8 8
Time to import (days) 17 17 17 16 19 22 24 24
Cost to import ($ per container) 2,275 2,275 1,975 1,385 1,220 1,185 1,090 1,090
Source: www.http://databank.worldbank.org/ddp/home.do?Step=2&id=4
According to a study by the Brazilian National Confederation of Industry, the exchange rate
and the costs associated with infrastructure and customs bureaucracy are the major barriers
to the competitiveness of Brazilian exports, pointing to the numerous documentation
requirements and official regulations, the lack of automation and use of IT and the need for
modernisation of border-crossing administration (Gregory, 2009). In light of these
challenges, the Brazilian government has created an inter-ministerial working group with
the goal of reducing and simplifying complex procedures and regulations.
5.2.2 Measures to facilitate trade in Brazil
Over the past years, Brazil has sought to make import and export transactions less
cumbersome and continued to take gradual steps to simplify and modernise its customs
procedures.31
For example, Brazil introduced an express import declaration regime for
frequent importers, and reduced by 26% the number of rejected import declarations (WTO,
2009).
31 The Secretariat of Foreign Trade (SECEX), in the Ministry of Development, Industry and Foreign
Trade, is responsible for formulating regulations to implement import measures. The Secretariat of
Federal Revenue of Brazil, in the Ministry of Finance, is responsible for customs administration,
including duty collection.
ODI Report 34
‘Blue line’ regime
In 2004, in order to improve its efficiency, customs introduced the ‘blue line’ regime,
through which goods of authorised importers with strong internal control systems in place
are preferentially directed towards the so-called ‘green channel’, for which clearance is
automatic.
Scanners
Since 2006, the unloading of imported cargo for physical inspection may be exempted
where customs premises are equipped with scanners that permit non-invasive inspection,
substantially reducing customs clearance time.
EDI systems
In 2008, Brazil facilitated trade by updating its EDI system for customs. In 2009, the
government established a computerised information system that processes all customs
procedures, monitors imports and facilitates customs clearance. Known as the Foreign
Trade Integrated System (SISCOMEX), this reduces the time needed for export and import
procedures by facilitating and decreasing the amount of paperwork previously needed for
importing into Brazil.
Paperless ports
To exempt companies from filling in about 935 fields in different forms before products can
enter the country, hindering the import process, the Brazilian government has worked on
introducing a paperless ports system to reduce the use of forms and synchronise
requirements for entry across the country (Moraes, 2011).
Preferential processing
In 2011, Brazil provided customs authorities with better oversight of domestic companies
by improving their ability to audit their operations – offering benefits to the companies that
satisfy the required regulations through faster processing of their import transactions.
Customs cooperation
Brazil has numerous customs cooperation agreements, including with the U, Argentina,
Bolivia, Chile, Colombia, Costa Rica, Cuba, the Dominican Republic, Ecuador, El
Salvador, Haiti, Honduras, Mexico, Nicaragua, Panama, Paraguay, Peru, Portugal, Spain,
Uruguay and Venezuela.
Trade facilitation policies for low-valued exports
In 1999, Brazil introduced very successful trade facilitation policies for low-valued exports,
on the basis of the postal network, in order to simplify cumbersome and costly export
formalities and address the problem of limited access to an affordable transport means. The
scheme is targeted primarily at small and medium-sized enterprises, helping ship their
products abroad quickly. More specifically, the Brazilian government implemented a
simplified export procedure for low-valued exports of value less than $10,000 through the
Simplified Export Declaration (DSE) and has in so doing considerably cut back the number
of steps needed to register an export. DSE exports have been growing in terms of value
since their inception in 1999, with the postal sector being responsible for carrying almost
half of these exports and with logistics and consolidators transporting the rest (Caron and
Ansón, 2008). The number of exporters has stabilised at around 8,000, which represents
almost 40% of total Brazilian exporters, a majority of which would not have otherwise
exported (ibid.). Since 2000, $1.8 billion worth of goods has been processed by Exporta
Fácil and more than 12 million businesses have used the scheme; in 2012 alone, the
programme enabled $170 million worth of exports to leave the country (Universal Postal
Congress, 2012).
5.2.3 Summary: trade facilitation in Brazil
There are particularly useful lessons to be learnt from the Brazilian experience in trade
facilitation policies for low-valued exports. These types of policies might be appealing for
ODI Report 35
several countries, such as Peru, which has already implemented similar schemes – including
for LICs. The programme has already been rolled out in Colombia, Ecuador, Peru and
Uruguay, after being modified to suit local conditions, while Argentina, Bolivia and Chile
are in the process of adopting similar schemes and Serbia has implemented its own
programme based on the Brazilian model (Universal Postal Congress, 2012).32
5.3 State–business relations in Brazil
In response to the Great Depression and the economic recession it generated, Brazil
focussed on an import substitution and industrialisation (ISI) strategy, which was kept
basically until 1990 (Lima and Hirst, 2006) and was rather favourable of industrial sector
interests. After the recession, a corporatist state structure with close ties between state and
business was developed, while industrial interest organisations were set up in sector-specific
organisations and state-level industrial federations (Christensen, 2009). In the period until
the 1990s, there was a propensity towards pro-business policies, which were combined with
the repression of labour during the dictatorship (1964-1985), moving Brazil close to the
authoritarian Asian developmental state (Pedersen, 2008). Yet Evans (1995) suggests that
the nature of the Brazilian state was between being developmental and predatory in light of
its fragmented nature and the inclination towards informal relationships between
bureaucrats and the interests of the private sector.
After the balance of payments crisis in 1980, the focus was on economic stabilisation on the
basis of economic liberalisation and privatisation (Lima and Hirst, 2006). During the
Cardoso governments (1995-2002), there was an inclination to pursue more autonomous
policies and shut down the channels for private sector influence on government policy to
some degree (Pedersen, 2008). Yet, eventually, the private sector became an increasingly
well-organised player in the state–business relationship before Lula came to power
(Christensen, 2009).
While President Lula was in power, the government continued to pursue a policy of
economic openness and strict macroeconomic policies in order to keep stabilising the
Brazilian economy but, in contrast to the neoliberal development strategy of the 1990s,
there was a stronger focus on state activism and the promotion of novel competitive
economic sectors assisted by state action in the area of industrial policy and international
trade policy, shaped through dialogue and cooperation between the business sector and the
state (Christensen, 2009). Overall, the relatively business-friendly policy environment
during the Lula presidency in combination with its autonomous policy formulation suggests
that Brazil can be regarded as a developmental state characterised by the embedded
autonomy of the state.
32 See also Guasch (2008). In addition to the trade facilitation measures mentioned above, since
August 2011 Brazil has implemented a variety of economic and tax measures under the Greater Brazil
Plan, including a tax incentive programme that is designed to benefit Brazilian exporting companies.
See de Meijer (2012).
ODI Report 36
6 Lessons: what can we learn from emerging economies?
The final section of this report pulls together lessons from the experiences of China, India
and Brazil in promoting export success reviewed in the previous sections. This section
reviews differences and similarities between the approaches in the three countries with
respect to trade-related infrastructure (Section 6.1), trade facilitation (Section 6.2) and state-
business relations (Section 6.3). It also suggests what this might imply for LICs.
6.1 Lessons for trade-related infrastructure
China managed to build infrastructure ahead of demand, which contributed to promoting
exports and economic growth. China’s centrally planned economy made infrastructure
reforms to some extent less challenging than was the case in India and Brazil, since central
control of the economy enabled the Chinese government to take risks and promoted strong
integration between planning and implementation (Leoka and Guma, 2012).
The roads sector is an especially vital part of infrastructure, and contributes to successful
trade performance by enabling domestic connectivity and links to global connectivity. As
demonstrated by the experiences in China, India and Brazil, there should be a balanced
approach in terms of focusing on arterial and rural roads, with road quality and conditions
as significant as the length and overall coverage of the roads.
Successful infrastructure development involves a number of institutional and policy
dimensions, including the way planning and implementation is approached, how the risks
are managed and what kinds of incentives and accountability structures are present (Kim
and Nangia, 2010). In the recent past, the scarce global supply of short- and long-term
funding has become highly relevant for future infrastructure development. 33
In light of these
funding shortages, one goal of this report has been to look at how China, India and Brazil
have financed infrastructure improvements and what financing alternatives exist for
countries that aim to boost infrastructure investment. The key challenge for infrastructure
development will be to develop clear financing and pricing policies.
It is not possible to finance infrastructure investment on the basis of traditional sources of
public finance alone (Kingombe, 2011). Traditional sources of funding for infrastructure,
multilateral and official lending institutions, can provide merely a small share of the total
funding requirements, deficit funding will vanish as a feasible alternative and the private
sector and innovative financing will become ever more central. Traditional sources of
33 For an outline of the current and emerging landscape of infrastructure financing, see Kingombe
(2011).
ODI Report 37
private capital such as banks have restricted credit growth and may be further constrained in
light of new regulations such as Basel III, which will discourage banks from making long-
term loans – traditionally used to finance major infrastructure projects – by demanding
more capital be set aside to cover such loans (Teague, 2012). Against this background,
institutional investors, such as pension funds and insurance companies, have been
considered to help close the gap (OECD, 2011).
Prevailing large gaps in access to infrastructure services, especially in LICs, partly reflect
inadequate levels of investment. According to World Bank statistics, LICs are estimated
currently to spend about 3% to 3.5% of their GDP on maintenance of and investment in
their infrastructure, while around 6.5% to 7.5% of GDP is required (Esterhuizen, 2012).34
In
Africa, China has become by far the most significant source of additional infrastructure
financing, but there is still a major funding gap, especially in the region’s LICs (Noman,
2011). Other emerging economies, including India and Brazil, are also increasing finance
for infrastructure projects in Africa.
New development partners can offer lessons for LICs on how to close infrastructure gaps.
The Chinese, for example, have been successful in planning coherent investment,
continuously re-examining infrastructure gaps and orienting resources accordingly and
making sure that infrastructure projects are linked, for instance by connecting new ports by
also building roads and railways that lead to the port (Bredenkamp and Nord, 2010).
The country cases discussed in this report offer some lessons for how infrastructure can be
financed using private sector resources. The experiences in China, India and Brazil are
characterised by considerable heterogeneity, but a number of issues are relevant across
them. More particularly, the country experiences reviewed above illustrate how overlapping
challenges that impede private sector financing of infrastructure finance can be tackled.
6.1.1 Securing sufficient long-term financing for infrastructure investments
Providing adequate long-term financing is essential for infrastructure investments (Walsh et
al., 2011). In China and Brazil, bank loans have been helpful to secure such financing –
through the development bank BNDES in Brazil and through various alternatives in China,
including implicit local government guarantees and bond insurance provided by publicly
owned banks.35
To steer clear of maturity mismatches, banks usually cannot offer loans with
tenors of more than five years – except if they receive longer-term funding, for example via
long-term loans from development finance institutions (Bond et al., 2012). In India, for
instance, banks have dominated infrastructure finance in recent years as well, but the
Reserve Bank has worried about asset liability mismatches and concentration risks and has
not permitted similarly high levels of concentration in infrastructure assets as Chinese banks
have accepted (Rastogi and Rao, 2011). Moreover, the Indian government has not agreed to
put up with the contingent fiscal liability that a development bank like BNDES might take
on. Other countries, for example Chile and Korea, have been relatively successful in
establishing local bond markets to support relatively long-term issuances by infrastructure
companies (Walsh et al., 2011). In Chile, the creation of the pension system was key, which
produced a market for local currency-denominated long-term securities, reducing the
demand for bank finance (ibid.).
6.1.2 Motivating institutional investors to buy into long-term debt markets
One promising solution is for infrastructure projects to be funded in capital markets. But
encouraging institutional investors to buy into long-term debt markets is not easy in the
absence of some form of credit enhancement (Walsh et al., 2011). Against this background,
34 According to Southern Africa Development Community PPP Network Head Kogan Pillay, the
region needs $500 billion between 2014 and 2027 for infrastructure development. See Esterhuizen
(2012). 35 In the future, a proposed BRICS bank is likely to play an important role in co-funding infrastructure
in developing regions. See X. Wang (2013).
ODI Report 38
donors have increasingly made use of official development assistance (ODA) to limit
investment uncertainty by guaranteeing future returns, which permits donors to make
investment projects more financially viable and mobilise funding from capital markets (ODI
et al., 2013). For instance, special purpose bonds, which are backed by donor commitments
to service and repay debt from ODA allocations earmarked for specific purposes, and
blended finance mechanisms, which involve the complementary use of grants and non-grant
sources such as loans or risk capital, are two ways to tap capital markets on the basis of
ODA commitments (Girishankar, 2009; Wälde, 2012). For example, the fact that sovereign
states back special purpose bonds makes such bonds appealing for institutional investors
that can offer long-term finance for infrastructure development (Spratt and Collins, 2012).
In India, domestic institutional investors offer great potential insofar as their investments
are to date focused on government securities and insofar as the development of the Indian
NPS promises considerable growth of assets under management of pension funds. Other
countries, for example Chile, have managed to motivate institutional investors to buy bonds
issued by fully private companies. Chilean pension funds are only permitted to invest in
investment-grade securities, but private insurance companies have insured infrastructure
bonds, enabling the pension funds to buy into these markets.
6.1.3 Mobilising foreign investment
Foreign savings for infrastructure have been mobilised in a number of ways across different
countries (Walsh et al., 2011). In several countries, multilateral lenders have played a
significant role while it has been more difficult to motivate foreign private finance. In
China, there tends to be little foreign participation in infrastructure so far. India has relied
on multilateral lenders, but this source will probably not grow much in the medium term
while infrastructure needs continue to be great; private financing is growing but securing
more foreign private financing remains a challenge. Brazil, for example, has been open to
foreign companies bidding on road projects, for which a pro-business environment and
transparency in policy administration have been essential. Brazilian energy companies have
issued shares and bonds in international markets, having had investment-grade ratings and
having indirectly profited from sovereign guarantees. This could be a promising option for
some larger corporates or public utilities in LICs, but the fiscal risks will have to be
monitored and managed carefully. Brazil has also managed to motivate foreign companies
to invest in PPPs.
Another option to support infrastructure development in LICs is to mobilise innovative
financing that makes use of the large and increasing savings surpluses of some countries
held in sovereign wealth funds (SWFs),36
provide those resources to LICs on concessional
terms and use them to promote private investments (Kingombe, 2011; Noman, 2011). Data
from historical databases on SWF transactions suggest that SWFs can facilitate up to 50%
of the investment needs in infrastructure in Africa over the next decade, benefiting from
emerging economy investors and also African home-grown SWFs (Turkisch, 2011). ODA
might be leveraged to mobilise SWF resources by providing a guarantee for borrowings
from SWFs and using ODA to subsidise the interest payments for sovereign borrowing, and
a Low-Income Country Infrastructure Fund (LICIF), administered by multilateral
development banks, could be established to intermediate the transactions (Noman, 2011).
The focus of BRIC financing on infrastructure could have significant positive effects for
trade performance by tackling infrastructure weaknesses in LICs (Mwase and Yang, 2012).
Yet some worry about the impact on debt sustainability, subsidised export credits received
by some BRIC firms and labour practices (e.g. Brautigam, 2010).
6.1.4 Supporting public–private partnerships
Well-structured PPPs in trade-related infrastructure can help LIC governments raise the
capital required to address shortcomings in that regard. In the Sub-Saharan region, Japan,
36 At the end of 2010, total SWF assets were around $4,300 billion, and are projected to rise to some
$10,000 billion by 2015 (Noman, 2011).
ODI Report 39
for example, has proved a promising partner in the recent past (Esterhuizen, 2012). While
investor hesitation has gone down as a limitation to PPPs in many LICs, for example in
Africa, policy deficiencies and poor institutional arrangements have arisen as the new major
hurdles (ibid.). It is therefore important to support governments to increase the assurance
that PPPs are a promising approach to tackle the infrastructure gap. At the same time, it is
not enough to merely put into operation an enabling policy framework and institutional
arrangements; these frameworks have to be backed up by sufficient political commitment
(Kingombe, 2011).
6.1.5 Lessons and way forward
This summary of results offers a number of lessons for LICs in terms of infrastructure
development and financing:
Establishing a favourable institutional environment for infrastructure development
For example, the creation of an independent government body, comprising representatives
from different ministries and affiliated agencies who report directly to and are held to
account by the head of state, can help administer infrastructure spending programmes and
reduce operational challenges (Wirjawan, 2010). As mentioned above, a new Development
Bank for Infrastructure and Sustainable Development could offer an additional source of
funding for infrastructure in LICs (Bhattacharya et al., 2012).
Looking for domestic institutional investors
The main substitute for banks financing infrastructure, for example if governments are not
prepared to agree to enough contingent fiscal liability, is to search for domestic institutional
investors.
In this context, a promising source of long-term financing for infrastructure are pre-funded
pension plans (Croce, 2011; OECD, 2011). Pension funds in developing countries increased
from around $422 billion in 2001 to $1.4 trillion in 2010 (J.P. Morgan, 2010). Given the
rather young population of most developing countries and the recent introduction of pension
plans, the assets held by pension funds are growing very quickly in many countries, and
since payments from these funds take place over a long term and are highly predictable,
they are a suitable source of funding for infrastructure that can provide stable long-term
returns (Bond et al., 2012).
In order to attract pension fund investment in infrastructure, a number of hurdles need to be
addressed (Croce, 2011). In many countries, pension funds do not have sufficient skills to
invest in infrastructure projects and governments often restrict the ability of pension funds
to invest in infrastructure projects directly (Bond et al., 2012). Motivating institutional
investors to move into infrastructure would require regulatory changes, for example by
permitting large insurance companies and pension funds to diversify into bonds issued by
private insurance companies. In this regard, a significant worry would be the credit risk of
infrastructure bonds. Risk-seeking domestic investors might supply capital for bond
insurance, especially if bankruptcy proceedings are enhanced to enable better recovery from
infrastructure projects.
A recent report by the African Development Bank encourages sponsors of infrastructure
projects in Africa to turn to domestic institutional investors by issuing infrastructure project
bonds (Mezui and Hundal, 2013).37
At the same time, the report underlines that a successful
launch of such bonds requires African countries to enhance their regulatory frameworks. So
far, infrastructure bonds have hardly been in use in Africa (Mu et al., 2013). But the
Government of Kenya has been pioneering them but other African countries like Cape
Verde and Ghana have also expressed interest in issuing such bonds.
37 See also Mbeng Mezui (2012).
ODI Report 40
Looking for foreign investment
In addition to these approaches, LICs could seek foreign investment.38
For example, the
excess savings in the global economy, including a growing pool of savings in developing
and emerging countries, should be used for infrastructure development by turning them into
stable, predictable and scaled finance while providing investors with a safe high quality
asset (Bhattacharya et al., 2012). To support this search for foreign investors, the public
sector could provide credit guarantees, either directly through loan guarantees or indirectly
through regulatory forbearance at public sector banks.
The process of the public sector issuing credit guarantees raises fiscal risks, which should
be managed well. For example, Chile has introduced a refined technique for approximating
contingent fiscal liabilities owing to infrastructure investment (Walsh et al., 2011).
Developing a comparable approach in LICs would offer enhanced information about
contingent fiscal liabilities and shed light on these long-term risks, enabling their better
management.
Supporting PPPs and private participation in infrastructure
Private participation in infrastructure has been low in LICs so far; in order to enhance this
approach, a number of success factors should be taken into account (Kingombe, 2011;
Leigland, 2010): First, the focus should be on project opportunities with a great probability
of success, leaving the rest for funding by government budgets or ODA, which donors and
international financial institutions can support by avoiding the preemption of potentially
bankable projects by ODA (Leigland, 2010). Second, a strong business climate – and
leadership in easing restrictions on doing business – is critical to the success of private
participation in infrastructure projects because it helps facilitate affordable project finance.
For example, India’s investment-grade credit rating, achieved while the country was still
classified as low-income, has played a big part in its success in terms of private
participation in infrastructure. Last but not least, private participation in infrastructure
projects in LICs commonly requires extensive upstream preparation – involving sector,
policy and legal and regulatory reforms (ibid.). Moreover, one lesson for LICs to consider
might be to begin with lighter forms of PPPs, such as operations and management (O&M)
contracts that are easier to enact, carry lower risks and are more likely to be successful, and
then, as the environment for and understanding of PPPs improves, to shift towards more
complex forms of partnerships with the BOT approach (Luthra, 2012). Guidebooks and
toolkits on PPPs can offer additional help (e.g. Thomsen, 2005; UNESCAP, 2011).
6.2 Lessons for trade facilitation
There are two key policy measures to reduce trade transaction costs: the enhancement of
trade-related infrastructure, as discussed above, and trade facilitation, above all the
rationalisation of trade procedures (ARTNeT and UNNExT, 2012). While the former
typically demands huge amounts of capital, which tends to be scarce in LICs, the latter can
be implemented swiftly once the political will is present. Furthermore, reforming trade
procedures enable making better use of existing trade-related infrastructure in LICs. For
example, it can allow customs clearance checkpoints to handle more transactions as traded
goods move faster through the facilities. The modernisation of trade procedures can
therefore be regarded as key to improving trade performance in LICs. Faster, predictable
and transparent customs clearance greatly helps traders lower costs and enhance their
supply chain management (IFC, 2006).
6.2.1 The political economy of trade facilitation
At the same time, the so-called ‘soft trade facilitation’ is frequently highly difficult to put
into practice, since it often goes against strong vested interest and is implemented without
the ‘ribbon-cutting ceremonies’ that make it attractive for politicians and donors (Rippel,
38 With regard to FDI, the case of China might offer some lessons. See Tseng and Zebregs (2002).
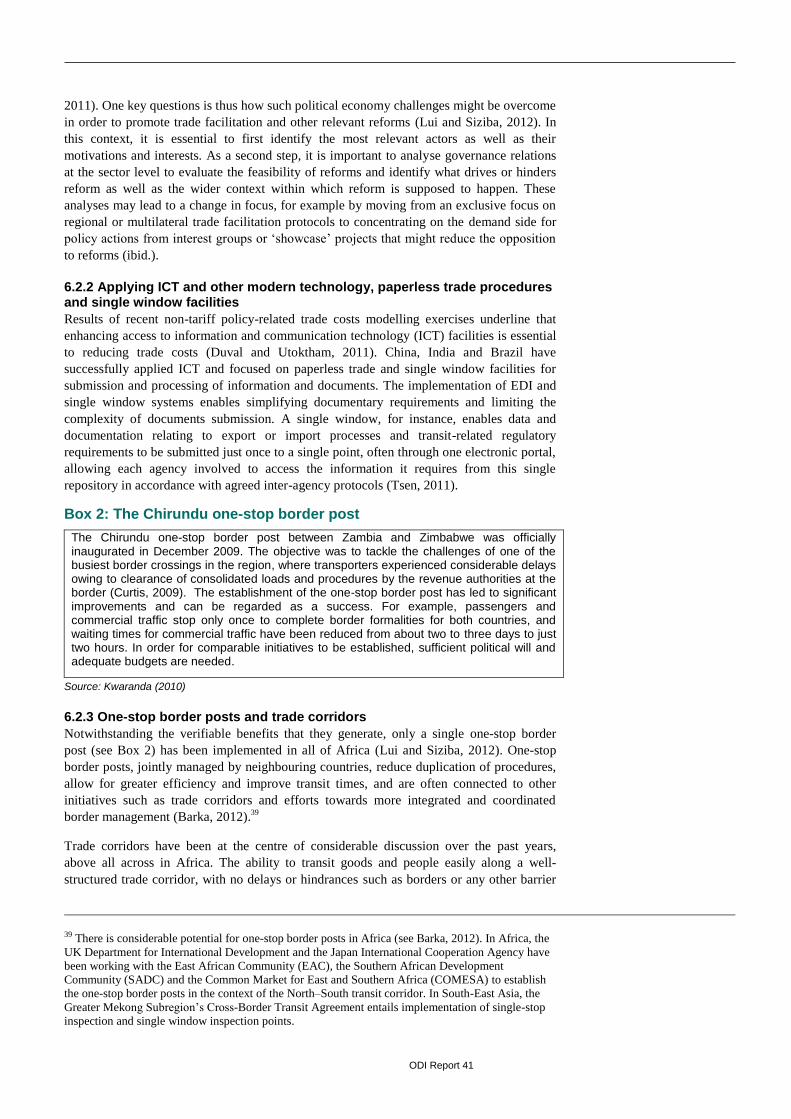
ODI Report 41
2011). One key questions is thus how such political economy challenges might be overcome
in order to promote trade facilitation and other relevant reforms (Lui and Siziba, 2012). In
this context, it is essential to first identify the most relevant actors as well as their
motivations and interests. As a second step, it is important to analyse governance relations
at the sector level to evaluate the feasibility of reforms and identify what drives or hinders
reform as well as the wider context within which reform is supposed to happen. These
analyses may lead to a change in focus, for example by moving from an exclusive focus on
regional or multilateral trade facilitation protocols to concentrating on the demand side for
policy actions from interest groups or ‘showcase’ projects that might reduce the opposition
to reforms (ibid.).
6.2.2 Applying ICT and other modern technology, paperless trade procedures and single window facilities
Results of recent non-tariff policy-related trade costs modelling exercises underline that
enhancing access to information and communication technology (ICT) facilities is essential
to reducing trade costs (Duval and Utoktham, 2011). China, India and Brazil have
successfully applied ICT and focused on paperless trade and single window facilities for
submission and processing of information and documents. The implementation of EDI and
single window systems enables simplifying documentary requirements and limiting the
complexity of documents submission. A single window, for instance, enables data and
documentation relating to export or import processes and transit-related regulatory
requirements to be submitted just once to a single point, often through one electronic portal,
allowing each agency involved to access the information it requires from this single
repository in accordance with agreed inter-agency protocols (Tsen, 2011).
Box 2: The Chirundu one-stop border post
The Chirundu one-stop border post between Zambia and Zimbabwe was officially inaugurated in December 2009. The objective was to tackle the challenges of one of the busiest border crossings in the region, where transporters experienced considerable delays owing to clearance of consolidated loads and procedures by the revenue authorities at the border (Curtis, 2009). The establishment of the one-stop border post has led to significant improvements and can be regarded as a success. For example, passengers and commercial traffic stop only once to complete border formalities for both countries, and waiting times for commercial traffic have been reduced from about two to three days to just two hours. In order for comparable initiatives to be established, sufficient political will and adequate budgets are needed.
Source: Kwaranda (2010)
6.2.3 One-stop border posts and trade corridors
Notwithstanding the verifiable benefits that they generate, only a single one-stop border
post (see Box 2) has been implemented in all of Africa (Lui and Siziba, 2012). One-stop
border posts, jointly managed by neighbouring countries, reduce duplication of procedures,
allow for greater efficiency and improve transit times, and are often connected to other
initiatives such as trade corridors and efforts towards more integrated and coordinated
border management (Barka, 2012).39
Trade corridors have been at the centre of considerable discussion over the past years,
above all across in Africa. The ability to transit goods and people easily along a well-
structured trade corridor, with no delays or hindrances such as borders or any other barrier
39 There is considerable potential for one-stop border posts in Africa (see Barka, 2012). In Africa, the
UK Department for International Development and the Japan International Cooperation Agency have
been working with the East African Community (EAC), the Southern African Development
Community (SADC) and the Common Market for East and Southern Africa (COMESA) to establish
the one-stop border posts in the context of the North–South transit corridor. In South-East Asia, the
Greater Mekong Subregion’s Cross-Border Transit Agreement entails implementation of single-stop
inspection and single window inspection points.
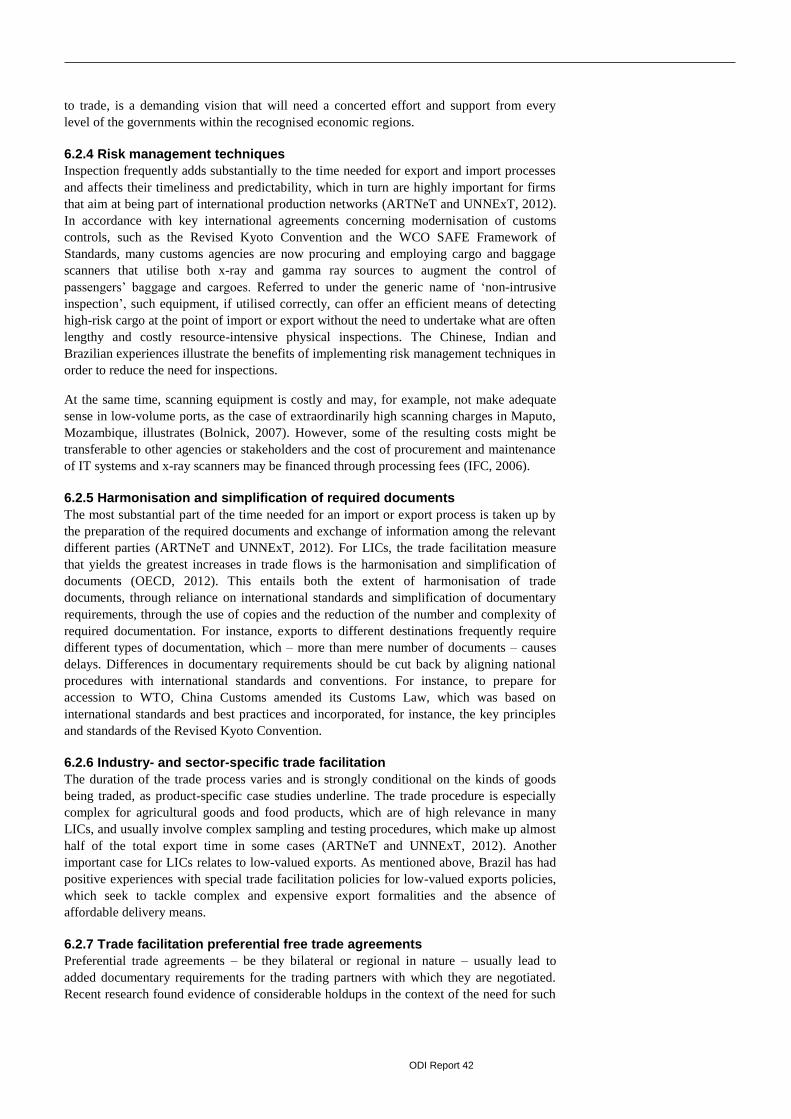
ODI Report 42
to trade, is a demanding vision that will need a concerted effort and support from every
level of the governments within the recognised economic regions.
6.2.4 Risk management techniques
Inspection frequently adds substantially to the time needed for export and import processes
and affects their timeliness and predictability, which in turn are highly important for firms
that aim at being part of international production networks (ARTNeT and UNNExT, 2012).
In accordance with key international agreements concerning modernisation of customs
controls, such as the Revised Kyoto Convention and the WCO SAFE Framework of
Standards, many customs agencies are now procuring and employing cargo and baggage
scanners that utilise both x-ray and gamma ray sources to augment the control of
passengers’ baggage and cargoes. Referred to under the generic name of ‘non-intrusive
inspection’, such equipment, if utilised correctly, can offer an efficient means of detecting
high-risk cargo at the point of import or export without the need to undertake what are often
lengthy and costly resource-intensive physical inspections. The Chinese, Indian and
Brazilian experiences illustrate the benefits of implementing risk management techniques in
order to reduce the need for inspections.
At the same time, scanning equipment is costly and may, for example, not make adequate
sense in low-volume ports, as the case of extraordinarily high scanning charges in Maputo,
Mozambique, illustrates (Bolnick, 2007). However, some of the resulting costs might be
transferable to other agencies or stakeholders and the cost of procurement and maintenance
of IT systems and x-ray scanners may be financed through processing fees (IFC, 2006).
6.2.5 Harmonisation and simplification of required documents
The most substantial part of the time needed for an import or export process is taken up by
the preparation of the required documents and exchange of information among the relevant
different parties (ARTNeT and UNNExT, 2012). For LICs, the trade facilitation measure
that yields the greatest increases in trade flows is the harmonisation and simplification of
documents (OECD, 2012). This entails both the extent of harmonisation of trade
documents, through reliance on international standards and simplification of documentary
requirements, through the use of copies and the reduction of the number and complexity of
required documentation. For instance, exports to different destinations frequently require
different types of documentation, which – more than mere number of documents – causes
delays. Differences in documentary requirements should be cut back by aligning national
procedures with international standards and conventions. For instance, to prepare for
accession to WTO, China Customs amended its Customs Law, which was based on
international standards and best practices and incorporated, for instance, the key principles
and standards of the Revised Kyoto Convention.
6.2.6 Industry- and sector-specific trade facilitation
The duration of the trade process varies and is strongly conditional on the kinds of goods
being traded, as product-specific case studies underline. The trade procedure is especially
complex for agricultural goods and food products, which are of high relevance in many
LICs, and usually involve complex sampling and testing procedures, which make up almost
half of the total export time in some cases (ARTNeT and UNNExT, 2012). Another
important case for LICs relates to low-valued exports. As mentioned above, Brazil has had
positive experiences with special trade facilitation policies for low-valued exports policies,
which seek to tackle complex and expensive export formalities and the absence of
affordable delivery means.
6.2.7 Trade facilitation preferential free trade agreements
Preferential trade agreements – be they bilateral or regional in nature – usually lead to
added documentary requirements for the trading partners with which they are negotiated.
Recent research found evidence of considerable holdups in the context of the need for such
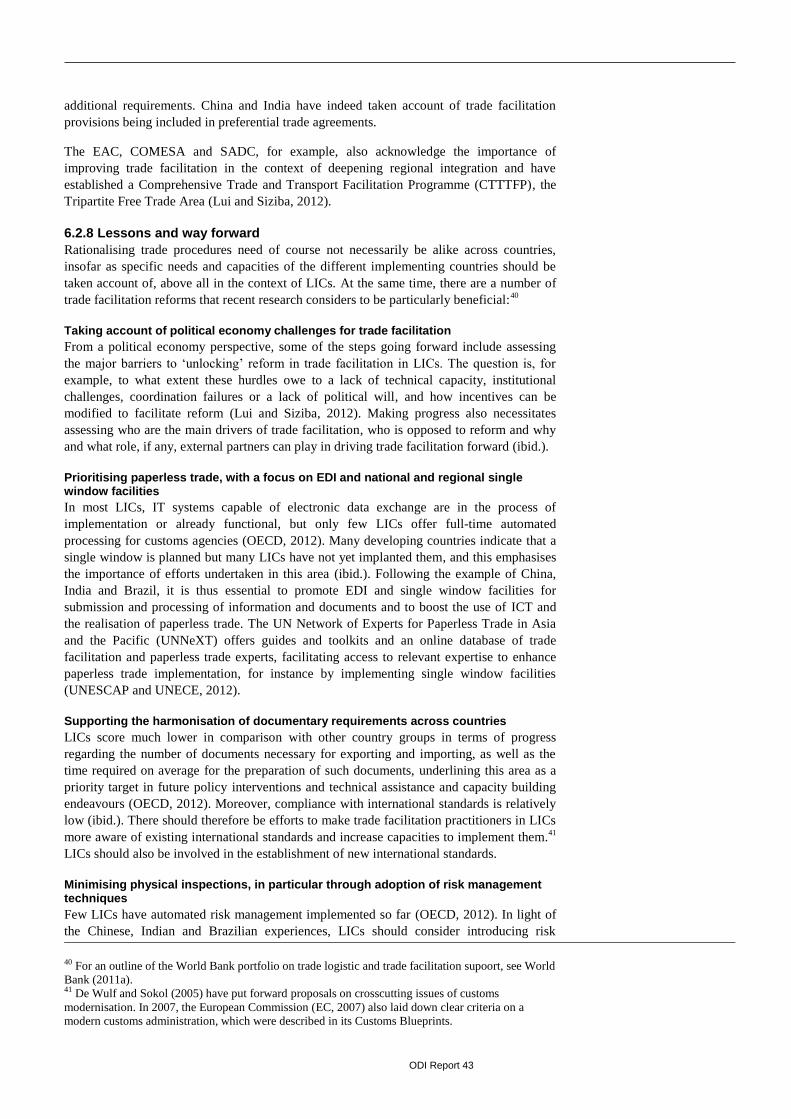
ODI Report 43
additional requirements. China and India have indeed taken account of trade facilitation
provisions being included in preferential trade agreements.
The EAC, COMESA and SADC, for example, also acknowledge the importance of
improving trade facilitation in the context of deepening regional integration and have
established a Comprehensive Trade and Transport Facilitation Programme (CTTTFP), the
Tripartite Free Trade Area (Lui and Siziba, 2012).
6.2.8 Lessons and way forward
Rationalising trade procedures need of course not necessarily be alike across countries,
insofar as specific needs and capacities of the different implementing countries should be
taken account of, above all in the context of LICs. At the same time, there are a number of
trade facilitation reforms that recent research considers to be particularly beneficial:40
Taking account of political economy challenges for trade facilitation
From a political economy perspective, some of the steps going forward include assessing
the major barriers to ‘unlocking’ reform in trade facilitation in LICs. The question is, for
example, to what extent these hurdles owe to a lack of technical capacity, institutional
challenges, coordination failures or a lack of political will, and how incentives can be
modified to facilitate reform (Lui and Siziba, 2012). Making progress also necessitates
assessing who are the main drivers of trade facilitation, who is opposed to reform and why
and what role, if any, external partners can play in driving trade facilitation forward (ibid.).
Prioritising paperless trade, with a focus on EDI and national and regional single window facilities
In most LICs, IT systems capable of electronic data exchange are in the process of
implementation or already functional, but only few LICs offer full-time automated
processing for customs agencies (OECD, 2012). Many developing countries indicate that a
single window is planned but many LICs have not yet implanted them, and this emphasises
the importance of efforts undertaken in this area (ibid.). Following the example of China,
India and Brazil, it is thus essential to promote EDI and single window facilities for
submission and processing of information and documents and to boost the use of ICT and
the realisation of paperless trade. The UN Network of Experts for Paperless Trade in Asia
and the Pacific (UNNeXT) offers guides and toolkits and an online database of trade
facilitation and paperless trade experts, facilitating access to relevant expertise to enhance
paperless trade implementation, for instance by implementing single window facilities
(UNESCAP and UNECE, 2012).
Supporting the harmonisation of documentary requirements across countries
LICs score much lower in comparison with other country groups in terms of progress
regarding the number of documents necessary for exporting and importing, as well as the
time required on average for the preparation of such documents, underlining this area as a
priority target in future policy interventions and technical assistance and capacity building
endeavours (OECD, 2012). Moreover, compliance with international standards is relatively
low (ibid.). There should therefore be efforts to make trade facilitation practitioners in LICs
more aware of existing international standards and increase capacities to implement them.41
LICs should also be involved in the establishment of new international standards.
Minimising physical inspections, in particular through adoption of risk management techniques
Few LICs have automated risk management implemented so far (OECD, 2012). In light of
the Chinese, Indian and Brazilian experiences, LICs should consider introducing risk
40 For an outline of the World Bank portfolio on trade logistic and trade facilitation supoort, see World
Bank (2011a). 41 De Wulf and Sokol (2005) have put forward proposals on crosscutting issues of customs
modernisation. In 2007, the European Commission (EC, 2007) also laid down clear criteria on a
modern customs administration, which were described in its Customs Blueprints.
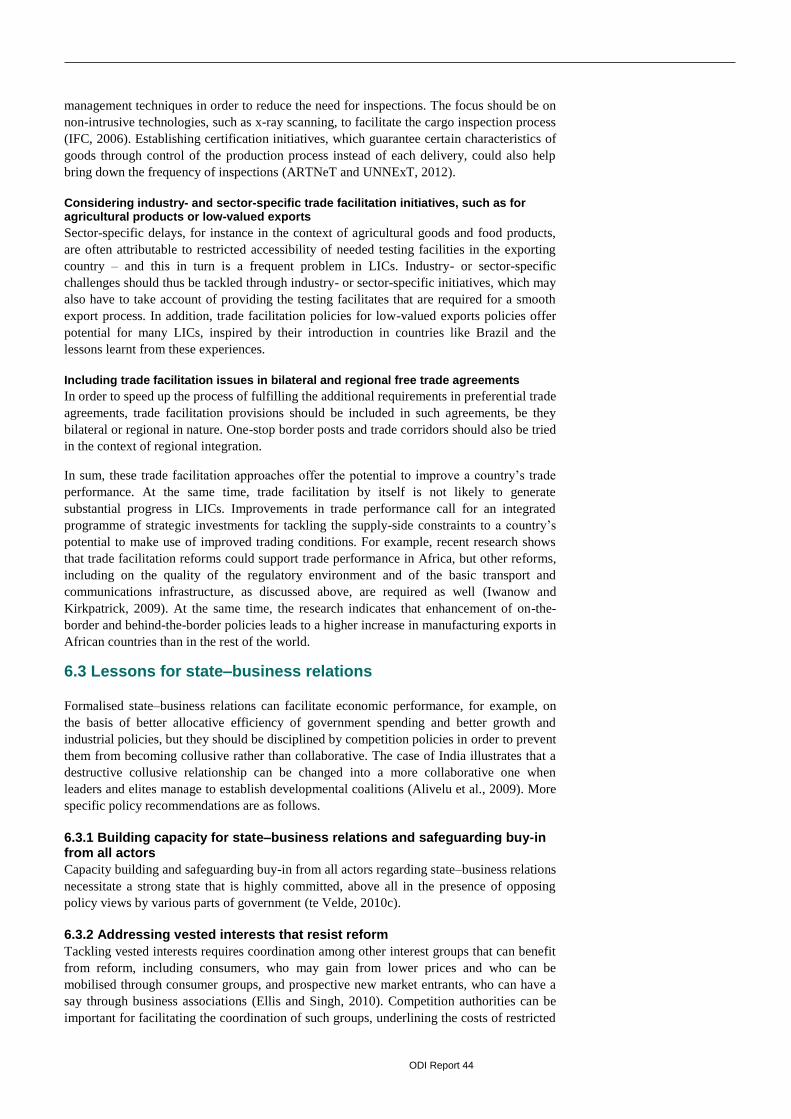
ODI Report 44
management techniques in order to reduce the need for inspections. The focus should be on
non-intrusive technologies, such as x-ray scanning, to facilitate the cargo inspection process
(IFC, 2006). Establishing certification initiatives, which guarantee certain characteristics of
goods through control of the production process instead of each delivery, could also help
bring down the frequency of inspections (ARTNeT and UNNExT, 2012).
Considering industry- and sector-specific trade facilitation initiatives, such as for agricultural products or low-valued exports
Sector-specific delays, for instance in the context of agricultural goods and food products,
are often attributable to restricted accessibility of needed testing facilities in the exporting
country – and this in turn is a frequent problem in LICs. Industry- or sector-specific
challenges should thus be tackled through industry- or sector-specific initiatives, which may
also have to take account of providing the testing facilitates that are required for a smooth
export process. In addition, trade facilitation policies for low-valued exports policies offer
potential for many LICs, inspired by their introduction in countries like Brazil and the
lessons learnt from these experiences.
Including trade facilitation issues in bilateral and regional free trade agreements
In order to speed up the process of fulfilling the additional requirements in preferential trade
agreements, trade facilitation provisions should be included in such agreements, be they
bilateral or regional in nature. One-stop border posts and trade corridors should also be tried
in the context of regional integration.
In sum, these trade facilitation approaches offer the potential to improve a country’s trade
performance. At the same time, trade facilitation by itself is not likely to generate
substantial progress in LICs. Improvements in trade performance call for an integrated
programme of strategic investments for tackling the supply-side constraints to a country’s
potential to make use of improved trading conditions. For example, recent research shows
that trade facilitation reforms could support trade performance in Africa, but other reforms,
including on the quality of the regulatory environment and of the basic transport and
communications infrastructure, as discussed above, are required as well (Iwanow and
Kirkpatrick, 2009). At the same time, the research indicates that enhancement of on-the-
border and behind-the-border policies leads to a higher increase in manufacturing exports in
African countries than in the rest of the world.
6.3 Lessons for state–business relations
Formalised state–business relations can facilitate economic performance, for example, on
the basis of better allocative efficiency of government spending and better growth and
industrial policies, but they should be disciplined by competition policies in order to prevent
them from becoming collusive rather than collaborative. The case of India illustrates that a
destructive collusive relationship can be changed into a more collaborative one when
leaders and elites manage to establish developmental coalitions (Alivelu et al., 2009). More
specific policy recommendations are as follows.
6.3.1 Building capacity for state–business relations and safeguarding buy-in from all actors
Capacity building and safeguarding buy-in from all actors regarding state–business relations
necessitate a strong state that is highly committed, above all in the presence of opposing
policy views by various parts of government (te Velde, 2010c).
6.3.2 Addressing vested interests that resist reform
Tackling vested interests requires coordination among other interest groups that can benefit
from reform, including consumers, who may gain from lower prices and who can be
mobilised through consumer groups, and prospective new market entrants, who can have a
say through business associations (Ellis and Singh, 2010). Competition authorities can be
important for facilitating the coordination of such groups, underlining the costs of restricted
ODI Report 45
competition and generating evidence on the benefits of reform. External actors, including
donors, can assist in the development of constituencies for reform by also providing
evidence on the benefits of reform and supporting the creation of effective competition
authorities (ibid.).
6.3.3 Creating an effective framework for competition
Creating a sound framework for competition is not easy in light of vested interests, but
essential to making markets work efficiently to generate growth and development,
especially when large multinationals with extensive market power are entering small LICs,
and might restrain domestic business (Ellis and Singh, 2010).
6.3.4 Promoting effective special economic zones
Effective state-business relations in SEZs can contribute to growth and a successful trade
performance. Emerging economies’ experiences with SEZs and industrial clusters have
often been very successful up to date, especially in China.42
SEZs can be most valuable in
catalysing processes of economic reform, especially in light of the fact it is more often than
not political factors that distort economic structures and undermine economic dynamism
(Farole, 2011a; 2011b). This is what happened in the classic case of China’s SEZs, which
provided an instrument to experiment with liberal economic reforms before gradually
implementing them in the wider economy. But China aside, do these zones work? What
have we learned from the experiences of developing countries over recent decades?
While the first modern SEZs were founded more than five decades ago, recently they have
become highly popular (Farole, 2011b). According to the International Labour Organization
database of SEZs, there were 176 zones in 47 countries in 1986; by 2006, this number had
increased to 3,500 zones in 130 countries (Boyenge, 2007).
Recent research indicates that the success of SEZs is strongly associated with the reliability
of infrastructure and that incentives tend not to have a strong impact on the success rate
(Farole, 2011a). The successful and unsuccessful cases to date underline a number of
lessons for the development of SEZs (Farole, 2011b).
It is essential to distinguish political commitment from political objectives.
While clear commitment from government is required, zone projects should
be planned cautiously on the basis of a commercial case rather than broader
political objectives.
The success of SEZs is closely linked to the competitiveness of the broader
national economic environment. When SEZs are established in an
environment of poor national competitiveness and weak infrastructure, it is
difficult to connect them to global markets.
It is crucial both to establish a clear and transparent legal and regulatory
framework and an adequate programme for SEZs, and to ensure that these can
de facto be implemented, especially since the relevant authority frequently
does not have adequate resources or capacities to accomplish its mandate.
One major discrepancy between zones that have been successful and those that have not is
the extent to which they have been integrated in the broader national economic policy
framework (Farole, 2011a; 2011b). To be a success in the longer run, SEZs should
contribute to structural transformation of the economy, including diversification and
economic upgrading. In successful cases, the countries have provided the conditions for
ongoing exchange between the domestic economy and investors based on the zones, for
instance on the basis of investment by domestic firms into the zones, forward and backward
linkages, business support and the movement of skilled labour and entrepreneurs between
the zones and the domestic economy (ibid.).
42 For a recent empirical analysis, see Leong (2012).

ODI Report 46
In sum, using SEZs as successful instruments thus requires considerably broader policies
than the limited range of any zone programme by itself (Farole, 2011a; 2011b), such as
supporting skills development, training and knowledge sharing; facilitating industry
clusters; promoting the integration of regional value chains; and assisting public–private
institutions, both industry-specific and transversal.
ODI Report 47
References
ADB (Asian Development Bank) and Economist Intelligence Unit (2012) ‘Evaluating the
Environment for Public-private Partnerships in the Asia-Pacific. The 2011
Infrascope’. London: Economist Intelligence Unit and ADB.
Alivelu, G., Srinivasulu, K. and Gopinath Reddy, M. (2009) ‘State Business Relations and
Performance of the Manufacturing Sector in Andhra Pradesh: A Case Study’.
London: ODI.
Anand, R. (2010) ‘Infrastructure Development in India’. In WEF Positive Infrastructure – A
framework for revitalizing the world economy. Geneva: WEF.
Anderson, J. and van Wincoop, E. (2004) ‘Trade Costs’. Journal of Economic Literature
42(3): 691-751.
ARTNeT (Asia-Pacific Research and Training Network on Trade) and UNNExT (UN
Network of Experts for Paperless Trade in Asia and the Pacific) (2012) ‘Trade
Facilitation in Asia and the Pacific: An Analysis of Import and Export Processes’.
Bangkok: ARTNeT and UNNExT.
Ash, K. (2011) ‘Aid for Trade and the Private Sector: A Partnership that Works’.
International Trade Forum Magazine, 1 December.
Ash, T., Ahmad, I. and Petitcolin, D. (2011) The Roots of Growth. Projecting EM
Infrastructure Demand to 2030. Edinburgh: Royal Bank of Scotland.
Back, A. (2012) ‘Beijing Plans Infrastructure Binge’. Wall Street Journal, 7 September.
Bandgar, N.L. (2012) ‘How to Improve PPP Projects in India: A Learning from the Past’.
Barka, H.B. (2012) ‘Border Posts, Checkpoints, and Intra-African Trade: Challenges and
Solutions’. Abidjan: African Development Bank.
Bhattacharya, A, Romani, M. and Stern, N. (2012) ‘Infrastructure for Development:
Meeting the Challenge’. London: Centre for Climate Change Economics and Policy
and Grantham Research Institute on Climate Change and the Environment.
Blecher, M. and Shue, V. (1996) Tethered Deer: Government and Economy in a Chinese
County. Stanford, CA: Stanford University Press.
BNDES (Brazilian Development Bank) (2011) ‘BNDES Disbursements Total R$ 168.4
billion in 2010’. http://www.bndes.gov.br
Bolnick, B. (2007) ‘The Economic Costs of Port Scanning Fees in Mozambique’. Maputo:
USAID/Mozambique Trade and Investment Project (TIP)/Nathan Associates.
ODI Report 48
Bond, D.L., Platz, D. and Magnusson, M. (2012) ‘Financing Small-Scale Infrastructure
Investments in Developing Countries’. Working Paper 114. New York: DESA.
Boyenge, J.P. (2007) ‘ILO Database on Export Processing Zones, Revised’. Geneva: ILO.
Brautigam, D. (2010) The Dragon’s Gift: The Real Story of China in Africa. Oxford:
Oxford University Press.
Bredenkamp, H. and Nord, R. (2010) ‘Bridges to Growth, Not Roads to Nowhere: Scaling
Up Infrastructure Investment in Low-Income Countries’. iMFdirect.
Brooks, D.H. and Zhai, F. (2008) ‘The Macroeconomic Effects of Infrastructure Financing:
A Tale of Two Countries’. Integration & Trade 28: 297-323.
Calì, M. and Sen, K. (2009) ‘Do Effective State Business Relations Matter for Economic
Growth? Evidence from Indian States’. IPPG Discussion Paper 29. London: ODI.
Calì, M. and te Valde, D.W. (2011) ‘Does Aid for Trade Really Improve Export
Perfomance?’. World Development 39(5): 725-740.
Calderón, C. and Servén, L. (2004) ‘Trends in Infrastructure in Latin America’. World Bank
Policy Research Working Paper 3400.
Calderón, C. and Servén, L. (2010), ‘Infrastructure in Latin America’, World Bank Policy
Research Working Paper 5317, Washington, DC: World Bank.
CAPA (2012) ‘Indian PPP Airports Drive 340% Growth in Retail and Other Non-Aero
Revenues over 5 Years’. New Dehli: CAPA – Centre for Aviation.
Caron, J. and Ansón, J. (2008) ‘Trade Facilitation for Low-valued Exports in Brazil:
Lessons to Be Learned from Simplified Export Declarations and the Use of Postal
Networks through “Exporta Fácil”’. Brasilia: Universal Postal Union.
Centre for Development and Enterprise (2012) ‘Reflecting on Brazil's Success. How
Durable? What Lessons for South Africa?’ Johannesburg: Centre for Development
and Enterprise.
Chagas, C. (2011) ‘Brazil: Recent Modifications to Brazilian Tax Law: Tax Benefits
Related to the Investments in the Infrastructure Sector and Changes in the Financial
Market Taxation’. Mondaq.
Chan, A.P., Patrick, C., Lam, T.I., Daniel, W., Chan, M., Cheung, E. and Ke, Y. (2010)
‘Critical Success Factors for PPPs in Infrastructure Developments: Chinese
Perspective’. Journal of Construction Engineering and Management 136(5): 484-
494.
Chaturvedi, S. (2007) ‘Customs Valuation in India: Identifying Trade Facilitation-related
Concerns’. In Asia-Pacific Research and Training Network on Trade Trade
Facilitation beyond the Multilateral Trade Negotiations: Regional Practices,
Customs Valuation and Other Emerging Issues. New York. New York: UNESCAP.
Chen, C. (2010) ‘Characterizing Infrastructure Development in China’. In WEF Positive
Infrastructure – A Framework for Revitalizing the World Economy. Geneva: WEF.
Christensen, S.F. (2009) ‘The Influence of Business on the Choice of Development Strategy
in “Lula’s” Brazil’. Conference on New Thinking on Citizenship, Power and Public
Space in Latin America, Roskilde, 3-4 June.
ODI Report 49
Chuan, L. (2008) ‘Infrastructure Development in China’. In D. Kumar (ed.) International
Infrastructure Development in East Asia – Towards Balanced Regional Development
and Integration. Chiba: IDE-JETRO.
City of London (2012) ‘Indian Infrastructure 2010-2012: Review’. London: City of London.
Comptroller and Auditor General of India (2002) ‘Indian Customs: Electronic Data
Interchange System’. Delhi: Comptroller and Auditor General of India.
Croce, R.D. (2011) Pension Funds Investment in Infrastructure. Policy Actions. Paris:
OECD.
Curtis, B. (2009) ‘The Chirundu Border Post, Detailed Monitoring of Transit Times’. Sub-
Saharan Africa Transport Policy Program (SSATP) Discussion Paper 10.
Washington, DC: World Bank.
De, P. (2011) ‘Trade Facilitation in India: An Analysis of Trade Processes and Procedures’.
Asia-Pacific Research and Training Network on Trade Working Paper 95.
de Meijer, F. (2012) ‘REINTEGRA Incentive for Brazilian Exporting Companies’.
TradeWatch 11(3).
de Wulf, L. and Sokol, J.B. (eds) (2005) Customs Modernization Handbook. Washington,
DC: World Bank.
Dixit, A. and Pindyck, R. (1994) Investment under Uncertainty. Princeton, NJ: Princeton
University Press.
Doing Business (2012) Doing Business 2013. Smarter Regulations for Small and Medium-
Size Enterprises. Washington, DC.: World Bank and IFC.
Dominic, J., Priya, S. and Agrawal, P. (2012) ‘Trade Facilitation Gap Analysis for Border
Clearance Procedures in India’. New Dehli: Centre for WTO Studies and Indian
Institute of Foreign Trade.
Downie, A. and Lemer, J. (2010) ‘Brazil Strains to Meet Airport Goals’. The Financial
Times, 18 November.
Duckett, J. (1998) The Entrepreneurial State in China: Real Estate and Commerce
Departments in Reform-Era Tianjin. London and New York: Routledge.
Duval, Y. and Utoktham, C. (2009) ‘Behind-the-Border Trade Facilitation in Asia-Pacific:
Cost of Trade, Credit Information, Contract Enforcement and Regulatory
Coherence’, UNESCAP Trade and Investment Division, Staff Working Paper 02/09.
Bangkok: UNESCAP.
Duval, Y. and Utoktham, C. (2011). ‘Trade Facilitation in Asia and the Pacific: Which
Policies and Measures affect Trade Costs the Most?’ Staff Working Paper 01/2011.
Bangkok: UNESCAP.
Dwyer, R. (2011) ‘Brazil: Wanted: Infrastructure Bonds for Long-term Finance’.
Euromoney.
EC (2007) Customs Blueprint. Brussels: European Commission.
Economist Intelligence Unit (2013) ‘Evaluating the Environment for Public-private
Partnerships in Latin America and the Caribbean. The 2012 Infrascope’. London:
Economist Intelligence Unit.
ODI Report 50
Ellis, K. and Singh, R. (2010) Assessing the Economic Impact of Competition. London:
ODI.
Engman, M. (2005a) The Economic Impact of Trade Facilitation. Paris: OECD.
Engman, M. (2005b) ‘The Economic Impact of Trade Facilitation’. Trade Policy Working
Paper 21. Paris: OECD.
Ernst & Young (2012) ‘Brazil – Capturing Momentum’. Ernst & Young.
Estache, A. and Fay, M. (2007) ‘Current Debates on Infrastructure Policy’. Policy Research
Working Paper 4410. Washington, DC: World Bank.
Esterhuizen, I. (2012) ‘Well-structured PPPs Could Help Africa Close Infrastructure Gaps’.
Engineering News, 2 November.
Evans, P. (1995) ‘Embedded Autonomy: States and Industrial Transformations’. Princeton:
Princeton University Press.
Farole, T. (2011a) Special Economic Zones in Africa: Comparing Performance and
Learning from Global Experiences. Washington, DC: World Bank.
Farole, T. (2011b) ‘Special Economic Zones: What Have We Learned? Vox EU.
FICCI and Ernst & Young (2012) ‘Accelerating Public Private Partnerships in India’. New
Dehli: FICCI.
FICCI National Committee on Infrastructure and Ernst & Young (2012) ‘India
Infrastructure Summit 2012. Accelerating Implementation of Infrastructure Projects’.
New Dehli: FICCI National Committee on Infrastructure.
Fick, J. (2011) ‘Brazil’s Rio de Janeiro Seeks $500 Million Bond Issue for Games’. Dow
Jones Newswires.
Fox, A.K., Francois, J.F. and Londono-Kent, P. (2003) ‘Measuring Border Crossing Costs
and Their Implications on Trade Flows: The United States-Mexican Trucking Case’.
Francois, J. and Manchin, M. (2007) ‘Institutions, Infrastructure, and Trade’. Policy
Research Working Paper 4152. Washington, DC: World Bank.
Girishankar, N. (2009) Innovating Development Finance: From Financing Sources to
Financial Solutions. Washington, DC: World Bank.
Gregoire, J. (2011) ‘Transport Infrastructure In Brazil and the Consequences of
Development Failure’. Washington, DC: Nexus Infrastructure.
Gregory, D. (2009) ‘The Benefits of Implementing Trade Facilitation Measures in the
Hemisphere: A Regional Forum’. Ottawa: Focal.
Guasch, J.L. (2008) ‘Exporting by Mail: An Innovative Trade Facilitation Tool’.
Washington, DC: IFC.
Gupta, H. (2009) ‘Trade Facilitation in India’. Regional Policy Forum on Trade Facilitation
and SMEs in Times of Crisis, Beijing.
Harriss, J. (2006) ‘Institutions and State-Business Relations’. Briefing Note 2. London:
IPPG.
Helble, M., Mann, C. and Wilson, J.S. (2009) ‘Aid for Trade Facilitation’. Policy Research
Working Paper 5064. Washington, DC: World Bank.
ODI Report 51
Howell, J. (2006) ‘Reflections on the Chinese State’. Development and Change 37(2): 273-
297.
Hyden, G., Court, J. and Mease, K. (2004) Making Sense of Governance: Empirical
Evidence from Sixteen Developing Countries. Boulder, CO: Lynne Rienner.
IFC (International Finance Corporation) (2006) Reforming the Regulatory Procedures for
Import and Export: Guide for Practitioners. Washington, DC: IFC.
India Brandi Equity Foundation (2013) ‘Foreign Institutional Investors’. In India at a
Glance. Trade and External Sector.
Iwanow, T. and Kirkpatrick, C. (2009) ‘Trade Facilitation and Manufactured Exports: Is
Africa Different?’ World Development 37(6): 1039-1050.
J.P. Morgan (2010) EM Moves into the Mainstream as an Asset Class. New York: J.P.
Morgan Securities LLC.
Jain, N. and Nair, V. (2013) ‘Infrastructure Debt Funds to Accelerate the Growth of
Infrastructure Sector’. Moneylife, 4 March.
Jianqun, J. (2011) ‘Trade Facilitation – An Introduction of the Prospect, Framework of
Safety Standard of Customs and Authorized Economic Operators’. Eighth WFZC
Annual Meeting: China Customs.
Kathuria, V., Rajesh Raj, S.N. and Sen, K. (2010) ‘State Business Relations and
Manufacturing Productivity Growth in India’. MPRA Paper 20314.
Kenny, J. (2012) ‘Delhi-Mumbai Industrial Corridor’. In KPMG Infrastructure 100: World
Cities Edition. Teddington: Haymarket Network Ltd.
Kim, J. and Nangia, R. (2010) ‘Infrastructure Development in India and China – A
Comparative Analysis’. In W. Ascher and C. Krupp (eds) Physical Infrastructure
Development: Balancing The Growth, Equity, and Environmental Imperatives.
Houndmills: Palgrave MacMillan.
Kim, S., Lee, H. and Park, I. (2004) ‘Measuring the Impact of APEC Trade Facilitation: A
Gravity Analysis’. APEC EC Committee Meeting, Santiago, 30 September.
Kim, Y. (2013) ‘Chinese-led SEZs in Africa: Are They a Driving Force of China's Soft
Power?’ Stellenbosch University Centre for Chinese Studies.
Kingombe, C.K.M. (2011) ‘Mapping the New Infrastructure Financing Landscape’.
London: ODI.
Klitgaard, R. (2004) ‘On Infrastructure and Development’. In ADB/JBIC Infrastructure in
East Asia: The Way Forward. Manila: ADB/JBIC.
Kohli, A. (2006a) ‘Politics of Economic Growth in India, 1980-2005 Part 1: The 1980s’.
Economic and Political Weekly.
Kohli, A. (2006b) ‘Politics of Economic Growth in India, 1980-2005, Part 2’. Economic
and Political Weekly.
KPMG (2009) Infrastructure in China: Foundation for Growth. Beijing: KPMG.
KPMG (2013) Infrastructure in China. Sustaining Quality Growth. Beijing: KPMG.
KPMG International (2012) Infrastructure 100: World Cities Edition. Haymarket Network
Ltd.
ODI Report 52
Kwaranda, M. (2010) ‘Evaluation of Chirundu One Stop Border Post – Opportunities and
Challenges’. Harare: Trade & Development Studies Centre.
Lakshmanan, L. (2008) ‘Public-Private Partnership in Indian Infrastructure Development:
Issues and Options’. Occasional Paper 29(1). Delhi: Reserve Bank of India.
Lall, S. (2001) Competitiveness, Technology, and Skills. Cheltenham: Edward Elgar.
Lall, R. B. and Anand, R. (2009) ‘Financing Infrastructure’. IDFC Occasional Paper 3.
Mumbai: Infrastructure Development Finance Company.
Laperrouza, M. (2008) ‘Reforming China’s Infrastructure Sectors’. Network Industries
Quarterly 10(2): 15-17.
Leal, M. (2012) ‘A New Wave of Brazilian Infrastructure Investment’. World Finance.
Leigland, J. (2010) ‘PPI in Poor Countries. How to Increase Private Participation in
Infrastructure Management and Investment’. GridLines Note 51.
Leoka, T. and Guma, N. (2012) ‘China and India Infrastructure: Lessons for SA’.
Infrastructure Insight: Standard Bank.
Leong, C.K. (2012) ‘Special Economic Zones and Growth in China and India: An Empirical
Investigation’. International Economics and Economic Policy, September.
Lewis, J.T. (2012) ‘Brazil Infrastructure Investment Program Reaches 40% of Goal’." Wall
Street Journal.
Lihui, T. and Estrin, S. (2008) ‘Retained State Shareholding in Chinese PLCs: Does
Government Ownership Always Reduce Corporate Value?’ Journal of Comparative
Economics 36(1): 74-89.
Lima, M.R.S. and Hirst, M. (2006) ‘Brazil as an Intermediate State and Regional Power:
Action, Choice and Responsibilities’. International Affairs 82(I): 21-40.
Limão, N. and Venables, A.J. (2001) ‘Infrastructure, Geographical Disadvantage, Transport
Costs, and Trade’. World Bank Economic Review 15(3): 451-479.
Lin, J.Y. and Liu, Z. (2000) ‘Fiscal Decentralization and Economic Growth in China’.
Economic Development and Cultural Change 49(1): 1-20.
Liu, G. (2008) ‘Review on the Implementation of the Second-step Development Strategy
for the Establishment of the Modern Customs System’.
Liu, Z. (2004) ‘Planning and Policy Coordination in China’s Infrastructure Development’.
Background Paper for the EAP Infrastructure Flagship Study: ADB, JBIC, World
Bank.
Liu, Z. and Yamamoto, H. (2009) ‘Public-Private Partnerships (PPPs) in China: Present
Conditions, Trends, and Future Challenges’. Interdisciplinary Information Sciences
15(2): 223-230.
Lui, D. and Siziba, C. (2012) ‘Trade Facilitation Issues in the Political Economy of
Regional Integration in Southern Africa’. Maastricht: ECDPM and SAIA.
Luthra, S.. (2012) ‘Collaborating to Construct India: The Role of Public-Private
Partnerships in Infrastructure Development. An Interview with Ashwin
Mahalingam’. National Bureau of Asian Research.
Mahajan, A. (2012) ‘India’s Infrastructure Debt Fund’. KPMG INSIGHT Magazine 3.
ODI Report 53
Maharashtra Economic Development Council and PricewaterhouseCoopers (2008) ‘SEZs in
India. Major Leap Forward’. Mumbai: PricewaterhouseCoopers.
Mbeng Mezui, C. A. (2012) ‘Accessing Local Markets for Infrastructure: Lessons for
Africa’. Working Paper 153, Tunis: African Development Bank.
Mbeng Mezui, C. A. and Hundal, B. (2013) Structured Finance – Conditions for
infrastructure project bonds in African market. Tunis: African Development Bank.
Mehta, A. (2011) ‘South Asia – Regional Cooperation of Trade Facilitation: Way Forward’.
In Asia Pacific Trade Facilitation Forum 2011.
Mengchao, W. (2011) ‘Status and Challenges of Trade Facilitation and Supply Chain
Efficiency Improvements in China’. Asia-Pacific Trade Facilitation Forum.
Ministry of Finance (2009) ‘The Aiport Sector in India’. Position Paper. New Dehli:
Department of Economic Affairs, Ministry of Finance.
Moïsé, E., Orliac, T. and Minor, P. (2011) ‘Trade Facilitation Indicators: The Impact on
Trade Costs’. Trade Policy Working Paper 118. Paris: OECD.
Monaghan, P. (2012) ‘China's Special Economic Zones Need Re-think for Low Carbon
Age. China Dialogue.
Moraes, T. (2011) ‘Brazil Infrastructure’. IBUS 199.
Morgan Stanley (2010) ‘Brazil Infrastructure: Paving the Way’. Blue Paper, May.
Mourougane, A. and Pisu, M. (2011) ‘Promoting Infrastructure Development in Brazil’.
Economics Department Working Paper 898. Paris: OECD.
Mu, Y., Phelps, P. and Stotsky, J. G. (2013) ‘Bond Markets in Africa’. Working Paper 2.
Washington, DC: IMF.
Mwase, N.and Yang, Y. (2012) ‘BRICs’ Philosophies for Development Financing and
Their Implications for LICs’. Working Paper 74. Washington, DC: IMF.
Nee, V., Opper, S. and Wong, S. (2007) ‘Developmental State and Corporate Governance in
China’. Management and Organization Review 3(1): 19-53.
Noman, A. (2011) ‘Innovative Financing for Infrastructure in Low Income Countries. How
Might the G20 Help?’ Accra: ACET.
Nordås, H.K. and Piermartini, R. (2004) ‘Infrastructure and Trade’. Staff Working Paper 4.
Geneva: WTO.
Nunns, C. (2012) ‘China's Bridges and Dams Crumble under Corruption’. Global Post, 28
August.
Nyberg, A. and Rozelle, S. (1999) Accelerating China's Rural Transformation. Washington,
DC: World Bank.
ODI (Overseas Development Institute), ECPDM (European Centre for Development Policy
Management) and DIE (German Development Institute) (2013) European Report on
Development. Post-2015: Global Action for an Inclusive and Sustainable Future.
Brussels: ERD.
OECD (Organisation for Economic Co-operation and Development) (2005) The Costs and
Benefits of Trade Facilitation. Paris: OECD.
ODI Report 54
OECD (Organisation for Economic Co-operation and Development) (2011) Pension Funds
Investment in Infrastructure. A Survey. Paris: OECD.
OECD (Organisation for Economic Co-operation and Development) (2012) Trade
Facilitation Indicators: The Potential Impact of Trade Facilititation on Developing
Countries' Trade. Paris: OECD.
Oi, J.C. (1995) ‘The Role of the Local State in China's Transitional Economy’. China
Quarterly 144: 1132-1150.
Oi, J.C. (1999) Rural China Takes Off. Berkeley, CA: University of California Press.
Ong, L.H. (2012) ‘Between Developmental and Clientelist States: Local State-Business
Relationships in China’. Comparative Politics 44(2): 191-209.
Pedersen, J.D. (2008) Globalization, Development and the State: The Performance of India
and Brazil since 1990. London: Palgrave.
Pereira, C. (2010) ‘Tax Policy in Brazil: The Reform That Never Was’. Washington, DC:
The Brookings Institution.
Pil, C.J. and Thum, M. (2007) ‘The Economics of Politically Connected Firms’. CESifo
Working Paper 2025.
Portugal-Perez, A. and Wilson, J.S. (2011) ‘Export Performance and Trade Facilitation
Reform: Hard and Soft Infrastructure’. Policy Research Working Paper 5261.
Washington, DC: World Bank.
Posch, B. (2010) ‘Brazilian Boom: Rising Infrastructure Spending Spurs Bond
Opportunities’. Pimco Viewpoints, September.
Ramasamy, B. (2011) ‘An Analysis of Import-Export Procedures and Processes in China’.
Asia-Pacific Research and Training Network on Trade Working Paper 88.
Rastogi, A. and Rao, V. (2011) ‘Product Innovations for Financing Infrastructure: A Study
of India’s Debt Markets’. South Asia Working Paper Series 6. Manila: ADB.
Rippel, B. (2011) ‘Why Trade Facilitation is Important for Africa’. Policy Note 27.
Washington, DC: World Bank.
Rugwabiza, V. (2011) ‘Aid for Trade as Investment in Trade: Engaging the Private Sector.
International Trade Forum Magazine, 1 December.
Rui, M., de Jong, M. and ten Heuvelhof, E. (2008) ‘Public-private Partnerships for
Expressways in China: An Agency Theory Approach’. First International
Conference on Infrastructure Systems and Services: Building Networks for a
Brighter Future, Rotterdam, 10-12 November.
Ruis, M. (2012) The Anatomy of Special Economic Zones. London: Colloquial.
Sahoo, P., Dash, R.K. and Nataraj, G. (2010) ‘Infrastructure Development and Economic
Growth in China’. Discussion Paper 261. Tokyo: IDE.
Selvanayagam, R. (2010) ‘High Taxes and Excessive Red Tape Fuel Brazil's Thriving
Underground Economy’. www.brazzil.com
Sen, K. (2010) ‘From Collusion to Collaboration: State-business Relations and Economic
Performance in India’. In D.W. te Velde (ed.) Effective State-Business Relations,
Industrial Policy and Economic Growth. IPPG-ODI Briefing. London: ODI.
ODI Report 55
Shao, X. and Yao, K. (2013) ‘China to Relax Rules on Foreign Investment under RQFII’.
Xinhua, 25 February.
Shujie, Z. and Shilu, Z. (2010) ‘The Implications of Customs Modernization on Export
Competitiveness in China’. In UN Impact of Trade Facilitation Mechanisms on
Export Competitiveness: A Regional Perspective. New York: UN.
Simumba, T. (2009) ‘Private Sector Participation in Aid for Trade: Breaking Barriers to
Private Sector Growth’. Trade Negotiations Insights 5(8).
Singh, R. (2009) ‘Trade Expansion and Logistic Bottlenecks in India – What Is the Role of
Trade Facilitation?’
Spratt, S. and Collins, L.R. (2012) ‘Development Finance Institutions and Infrastructure: A
Systematic Review of Evidence for Development Additionalit’. Sutton: Private
Infrastructure Development Group Trust.
Sreeja, V.N. (2012) ‘Lack of Infrastructure and Congestion in Indian Ports Affect Exports’.
International Business Times, 16 June
Srivastav, A.K. (2003) ‘Intensive Course on the WTO Customs Valuation Agreement: An
Overview of Indian Customs Valuation Database’. Singapore: ADB.
Stiglitz, J.E. (1996) ‘Some Lessons from the East Asian Miracle’. World Bank Research
Observer 11(2): 151-177.
Syed, M. and Walsh, J.P. (2012) ‘The Tiger and the Dragon’. Finance & Development
49(3): 36-39
Tantri, M.L. and Kumar, C.N. (2011) ‘Export Diversification, Trade Facilitation and
Special Economic Zones: The Indian Experience’. Globelics International
Conference, Buenos Aires, 15-17 November.
te Velde, D.W. (2006) ‘Measuring State-Business Relations in Africa’. IPPG Discussion
Paper 4. London: ODI.
te Velde, D.W. (2008) ‘Financing International Public Goods: A Framework to Address Aid
for Trade’. In D. Njinkeu and H. Cameron (eds) Aid for Trade and Development.
Cambridge: Cambridge University Press.
te Velde, D.W. (2010a) ‘Effective State-Business Relations, Industrial Policy and Wealth
Creation’. In D.W. te Velde (ed.) Effective State-Business Relations, Industrial
Policy and Economic Growth. IPPG-ODI Briefing. London: ODI.
te Velde, D.W. (2010b) ‘Introduction and overview’. In D.W. te Velde (ed.) Effective State-
Business Relations, Industrial Policy and Economic Growth. IPPG-ODI Briefing.
London: ODI.
te Velde, D.W. (2010c) ‘State-business Relations and Economic Performance in Sub-
Saharan Africa’. In D.W. te Velde (ed.) Effective State-Business Relations, Industrial
Policy and Economic Growth. IPPG-ODI Briefing. London: ODI.
Teague, S. (2012) ‘Special Report: Infrastructure Finance’. Global Finance, January.
ten Heuvelhof, E., de Jong, M., Kars, M. and Stout, H. (2009) ‘Recent Trends in
Infrastructure-based Sectors’. In E. ten Heuvelhof, M. de Jong, M. Kars and H. Stout
(eds) Strategic Behaviour in Network Industries. A Multidisciplinary Approach.
Cheltenham: Edward Elgar.
The Economist (2012) ‘RIPP. Infrastructure in India’. 16 December.
ODI Report 56
The Financial Times (2010) ‘Special Report: Brazilian Infrastructure’. 6 May.
Thomas White (2011) ‘Toll Roads in China: Speeding Up Growth’. BRIC Sopotlight
Report Chicago: Thomas White International.
Thomsen, S. (2005) Encouraging PPPs in the Utilities Sector. Paris: OECD.
Tsen, J.K.T. (2011) Ten Years of Single Window Implementation: Lessons Learned for the
Future. New York: UN.
Tseng, W. and Zebregs, H. (2002) ‘Foreign Direct Investment in China: Some Lessons for
Other Countries’. Policy Discussion Papers 02/3. Washington, DC: IMF.
Turkisch, E. (2011) ‘Sovereign Wealth Funds as Investors in Africa: Opportunities and
Barriers’. Paris: OECD.
UNESCAP (UN Economic and Social Commission for Asia and the Pacific) (2011) A
Guidebook on Public-Private Partnership in Infrastructure. Bangkok: UNESCAP.
UNESCAP (UN Economic and Social Commission for Asia and the Pacific) and UNECE
(UN Economic Commission for Europe) (2012) Single Window Planning and
Implementation Guide. New York and Geneva: UN.
Universal Postal Congress (2012) ‘Trade Facilitation Hits Higher Heights’. 25th Universal
Postal Congress. New World, New Strategy, 30 September.
Urban Land Institute and Ernst & Young (2012) Infrastructure 2012. Spotlight on
Leadership. Washington, DC: Urban Land Institute.
Virmani, A. (2005) ‘Economic Reforms: Policy and Institutions: Some Lessons From
Indian Reforms’. ICRIER Working Paper 121. New Dehli: Indian Council for
Research on International Economic Relations.
Wälde, H. (2012) ‘Überblick über neuere 'innovative' Instrumente zur internationalen
Entwicklungsfinanzierung’. Frankfurt: KfW.
Walsh, J.P., Park, C. and Yu, J. (2011) ‘Financing Infrastructure in India: Macroeconomic
Lessons and Emerging Markets Case Studies’. Working Paper 81. Washington, DC:
IMF.
Wang, M. (2013) ‘Public-Private Partnerships in China’. Public Administration Review
73(2): 311-312.
Wang, X. (2013) ‘BRICS Development Bank Likely to Focus on Infrastructure’. China
Daily.
Wenjing, C. and Wei, L. (2006) ‘An Evaluation of the Need and Cost of Selected Trade
Facilitation Measures in China: Implications for the WTO Negotiations on Trade
Facilitation’. Asia-Pacific Research and Training Network on Trade Working Paper
5.
Williams, N.E. (2011) ‘Brazil Faces 2014 Infrastructure Race’. The Rio Times, 18 April.
Wilson, J.S., Mann, C.L. and Otsuki, T. (2003) ‘Trade Facilitation and Economic
Development: Measuring the Impact’. Policy Research Working Paper 2988.
Washington, DC: World Bank.
Wilson, J.S., Mann, C.L. and Otsuki, T. (2004) ‘Assessing the Potential Benefit of Trade
Facilitation: A Global Perspective’. Policy Research Working Paper 3224.
Washington, DC: World Bank.
ODI Report 57
Wilson, N. (2007) ‘Examining the Trade Effects of Certain Customs and Administrative
Procedures’. OECD Trade Policy Working Paper Series 42, Paris: OECD.
Wirjawan, G. (2010) ‘China: A Catalyst for Infrastructure Development’. The Jakarta Post,
7 May.
World Bank (1996) World Development Report 1996: From Plan to Market. New York:
Oxford University Press.
World Bank (2007) Doing Business 2008. Washington, DC: World Bank.
World Bank (2011a) Trade Logistics Facilitation: Key to Competitiveness. Washington,
DC: World Bank.
World Bank (2011b) Transformation through Infrastructure. Washington, DC: World
Bank.
World Bank (2013) ‘Country Snapshot China’. Private Participation in Infrastructure
Database.
WTO (World Trade Organization) (2007) Trade Policy Review India. Geneva: WTO.
WTO (World Trade Organization) (2009) Trade Policy Review: Brazil. Geneva: WTO.
WTO (World Trade Organization) (2010) Trade Policy Review China. Geneva: WTO.
WTO (World Trade Organization) (2011) Trade Policy Review India. Geneva: WTO.
WTO (World Trade Organization) (2012) Trade Policy Review China. Geneva: WTO.
Xinhua (2011) ‘China Fights Graft in Infrastructure Projects’. 18 October.
Yan, D. and Hua, F. (2004) Infrastructure, Growth, and Poverty Reduction in China.
Beijing: Institute of Comprehensive Transportation.
Yuan, H. (2011) ‘China Punishes Officials for Corruption in Construction: Xinhua’.
Bloomberg.
Zeng, D.Z. (2011) China’s Special Economic Zones and Industrial Clusters: Success and
Challenges. Washington, DC: World Bank.
ODI is the UK’s leading
independent think tank on
international development and
humanitarian issues.
Our mission is to inspire and
inform policy and practice which
lead to the reduction of poverty,
the alleviation of suffering and the
achievement of sustainable
livelihoods.
We do this by locking together
high-quality applied research,
practical policy advice and policy-
focused dissemination and
debate.
We work with partners in the
public and private sectors, in both
developing and developed
countries.
Readers are encouraged to reproduce
material from ODI Reports for their
own publications, as long as they are
not being sold commercially. As
copyright holder, ODI requests due
acknowledgement and a copy of the
publication. For online use, we ask
readers to link to the original resource
on the ODI website. The views
presented in this paper are those of the
author(s) and do not necessarily
represent the views of ODI.
© Overseas Development
Institute 2013. This work is licensed
under a Creative Commons
Attribution-NonCommercial Licence
(CC BY-NC 3.0).
ISSN: 2052-7209
Overseas Development Institute
203 Blackfriars Road
London SE1 8NJ
Tel +44 (0)20 7922 0300
Fax +44 (0)20 7922 0399