Embed Size (px)
Citation preview

Louisiana State UniversityLSU Digital Commons
LSU Master's Theses Graduate School
2016
Successful Aging in Oldest-Old Adults: Role ofPhysical and Social FactorsKatie Elizabeth StankoLouisiana State University and Agricultural and Mechanical College, [email protected]
Follow this and additional works at: https://digitalcommons.lsu.edu/gradschool_theses
Part of the Psychology Commons
This Thesis is brought to you for free and open access by the Graduate School at LSU Digital Commons. It has been accepted for inclusion in LSUMaster's Theses by an authorized graduate school editor of LSU Digital Commons. For more information, please contact [email protected].
Recommended CitationStanko, Katie Elizabeth, "Successful Aging in Oldest-Old Adults: Role of Physical and Social Factors" (2016). LSU Master's Theses.4530.https://digitalcommons.lsu.edu/gradschool_theses/4530
SUCCESSFUL AGING IN OLDEST-OLD ADULTS:
ROLE OF PHYSICAL AND SOCIAL FACTORS
A Thesis
Submitted to the Graduate Faculty of the
Louisiana State University and
Agricultural and Mechanical College
in partial fulfillment of the
requirements for the degree of
Master of Arts
in
The Department of Psychology
by
Katie Elizabeth Stanko
B.A., Indiana University of Pennsylvania, 2014
May 2017

ii
In dedication to my favorite successful ager: my grandmother, Virginia Mae Rainey (1924-
2014), who inspired me to have a career in gerontology. Her spirit was imperative for the
motivation to design and complete this thesis.
iii
ACKNOWLEDGEMENTS
The Louisiana Healthy Aging Study (LHAS) is an interinstitutional, multidisciplinary
study of the determinants of longevity and healthy aging in oldest-old adults. The LHAS is a
collaborative effort with behavioral and medical researchers from Louisiana State University
(LSU) in Baton Rouge, LSU Health Sciences Center in New Orleans, Pennington Biomedical
Research Center (PBRC), the University of Pittsburgh, and the University of Alabama at
Birmingham. I thank the LHAS researchers, staff, and participants for their efforts which have
resulted in a rich dataset. I also thank S. Michal Jazwinski for making these data available to me
for use in the current project.

iv
TABLE OF CONTENTS
ACKNOWLEDGEMENTS……………………………………………………………………... iii
LIST OF TABLES…………………………………………………………………………….......v
LIST OF FIGURES………………………………………………………………………………vi
ABSTRACT……………………………………………………………………………………..vii
INTRODUCTION………………………………………………………………………………...1
Demographics and Mortality…...………………………………………….……………...2
Theoretical Approaches to Successful Aging……….………………………...………..…5
Social Factors, Physical Health, and Successful Aging……………………………… .. 8
Frailty………..…………………………………………………………………..……….10
Physical Activity……………………………..…………………………………………..11
FOCUS OF THE PRESENT RESEARCH…………………….………………………………..14
METHOD..………………………………………………………………………………………16
Participants……………………………………………………………………………. ..16
Predictor Variables (Independent Variables)…………………………………………… 17
Outcome Variables (Dependent Measures)……………………………………………...17
SF-36 PCS Scores……………………….…………..……………………… ...17
FI-34 Frailty Index……………….…………………………………………… .18
Statistical Analyses…………………………………………………………………… .18
RESULTS ……………………………………..……………………………………..……… ....19
Analyses of Age and Gender Differences……………………………………………......19
Multiple Regression Analyses…………………………………………………………...28
SF-36 PCS Scores (Subjective Health)…………………………………………..28
FI-34 Index Scores (Objective Health)…………………………………………..31
DISCUSSION……………………………………………………………………………..… .....33
Conclusion……………………………………………………………………………….35
REFERENCES……………………………………………………………………………..……37
APPENDICES…………………………………………………………….…………………..…42
Appendix A: List of 34 Variables Used to Construct Frailty-Index 34……………….. ..42
Appendix B: List of Questions Used to Construct the Yale Physical Activity Survey
Weekly Energy Expenditure Scores…….……………………………………………….43
Appendix C: List of questions used to construct the Medical Outcomes Study
Questionnaire Short Form 36 Health Survey…………………………………………….44
VITA……………………………………………………………………………………….…….48

v
LIST OF TABLES
1. Sociodemographic and Individual Difference Characteristics (N = 732)…………………….20
2. Dimensions of Physical Health by Age Group and Gender………………..……...................22
3. Bivariate Correlations Amongst Variables (Pearson’s)……………..………………………..27
4. Multiple Regression Models with Self-Reported Health as Criterion Variable…….……… 29
5. Multiple Regression Models with Objective Health Status as Criterion Variable….……… .32

vi
LIST OF FIGURES
1. Successful Aging Research Overview ………………………………..…...…….................... 4
2. Number of Clubs or Social Organizations Belonged to by Age Group …………………..... .24
3. Number of Hours per Week Spent Out of Home by Age Group ………………………….…25
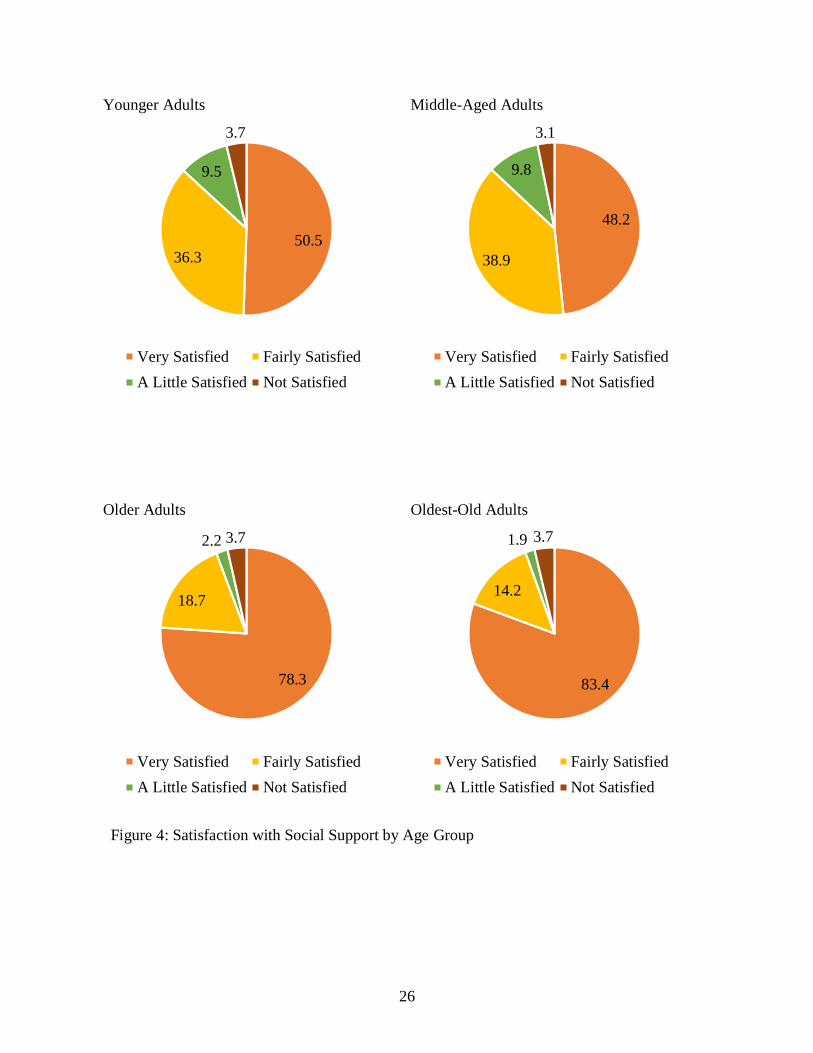
4. Satisfaction with Social Support by Age Group…………………….………………………..26

vii
ABSTRACT
Successful aging, increasing in chronological age while maintaining health, is related to a
multitude of factors including social and physical behaviors. Older adults may report that they
are aging successfully while biomedical outcomes suggest otherwise. In the present study,
sociodemographic characteristics, social engagement, physical activity in relation to frailty and
health-related quality of life (HR QoL) were examined using a lifespan sample of adults (N =
732) from the Louisiana Healthy Aging Study (LHAS). Four age groups were compared:
younger (21-44 years), middle-aged (45-64 years), older (65-84 years), and oldest-old adults (85
to 101 years). A main effect of age was found for both subjective and objective indices of
health, with oldest-old adults reporting lowest health and highest frailty; older and oldest-old
women were in significantly poorer health and had higher levels of frailty than their male
counterparts. Two regression models, one with a subjective health and objective health outcome,
were conducted. In model 1, physical activity, hours out of the home, and frailty score were
significant contributors to subjective health. In model 2, age, gender, level of education, hours
out of the home, and presence of a confidant or close person were all significantly associated
with frailty score. Together these findings indicate both physical activity and social support and
engagement impact how older adults view themselves aging as well as objective, biomedical
outcomes of successful aging.

1
INTRODUCTION
When an infant is born, parents may ponder what trajectory their child’s life will take,
including his or her successful and healthy development. Three children born at the exact
spatiotemporal location as one another can have vastly different health and lifespans: one may
die of a heart attack in middle age, while the other two survive well into later adulthood and
become nonagenarians or even centenarians. Determining the causes and antecedent conditions
that foster healthy and successful aging is a critical challenge for researchers. Importantly, there
is also a societal urgency for doing so. By the year 2050, an estimated 83.7 million adults in the
United States will be 65 years or older, nearly doubling its approximated 2012 population
(Administration on Aging, 2015). Specifically, the “oldest-old” (persons 85 years of age and
older) are the fastest growing segment of the population (Ortman, Velkoff, & Hogan, 2014) ,
while also being the most vulnerable cohort in regards to terminal age-related diseases (Heron,
2016). Given this demographic reality and impending costs of indirect and direct healthcare,
basic research on the determinants of successful aging is a timely imperative (see: Pruchno,
Wilson-Genderson, Rose, & Cartwright, 2010; Rowe & Kahn, 2015).
While the desired “Fountain of Youth” remains a myth, aging successfully can be a
reality if healthcare practitioners and the general public is made aware of the components
needed. Therefore, in the sections that follow, current demographics and mortality rates of older
adults are discussed first. Next, theoretical approaches and factors empirically shown to be
related to successful aging are presented. By measuring across multiple domains of health such
as biological, emotional, physical, and social support, a holistic view of the multiple variables
important for one to successfully age can be revealed.

2
Demographics and Mortality
One of the hallmarks of a developed country is a low mortality rate and an increase in
average lifespan across generations. The United States has demonstrated this exponential trend
especially in the post-World War II era. People born between 1946 and 1964 are known
affectionately by society as “the baby boomers.” This was the first generation to have spending
and economic power as teenagers (Owram, 1997). As they continue to age, Baby Boomers are
redefining what has been traditionally labeled as “older adulthood” in mass quantities. In 2003,
the 65+ population was 35.9 million; by 2013, that number had increased 24.7% to 44.7 million
and is expected to more than double that amount to 98 million older adults by 2060
(Administration of Aging, 2015). While the youngest members of the demographic were
expanding to greater proportions than ever before, concerns for the older population started to
grow: by 1950, the population aged 65+ had more than doubled since the beginning of the 20th
century, and over 60% were living in poverty while less than half owned health insurance. Thus,
in 1965 under President Lyndon B. Johnson, Medicare and Medicaid were enacted as Title
XVIII and Title XIX of the Social Security Act, providing hospital, post-hospital extended care,
and home health coverage to almost all Americans aged 65 or older (Medicare & Medicaid
Milestones, 2015). While empirical research has failed to find a significant effect of Medicare
on mortality before and after implementation (e.g., Finkelstein & McKnight, 2008), other
research has shown a sharp decrease in acute terminal illness such as massive heart attacks
before and after implementation that did not occur in non-Medicare countries in that same time
period (Chay, Swaminathan, & Kim, 2010).
Even as the number of older adults living well into their eighties and beyond increases,
not all of these older adults are aging healthily or successfully. The top five causes of death in

3
the United States for those over 65 include cardiovascular disease, cerebrovascular disease (e.g.,
stroke, aneurysm), and neurodegenerative disease such as Parkinson’s disease, Alzheimer’s
disease, and dementia (Heron, 2016). In 1900, the top three causes of death for Americans 65
and older were influenza and pneumonia, tuberculosis, and diarrhea and enteritis, accounting for
31% of the total causes of death. Due to developments in medicine and sanitation, these diseases
now account for less than 3% of older adult deaths. Instead, as of 2014, heart disease, cancer,
and Chronic Obstructive Pulmonary Disease (COPD), the top three current causes of death,
accounted for over half (53.5%) of the total causes of death (National Center for Health
Statistics, 2016). Negative health and lifestyle behaviors such as smoking, obesity, and
sedentary activity contribute to the current top three causes of death. Therefore, while influenza,
tuberculosis, and diarrhea now have cures and treatments for a reactive approach once one is
diagnosed, there is no one immediate cure for diseases of the heart, cancer, and COPD. Rather,
it may be best to have a preventive approach, educating people across the lifespan on the factors
that lead to and prevent these illnesses.
The fourth and fifth top age-related causes of death, cerebrovascular disease and
Alzheimer’s disease, are more difficult to have a proactive or reactive approach to curtailing.
While some lifestyle behaviors such as smoking has demonstrated an increased risk of stroke
(e.g., Shinton & Beevers, 1989), their sudden and often unpredicted onset can be fatal.
Furthermore, in each decade over 50 the risk of stroke doubles (Panel et al., 1997). Lastly,
Alzheimer’s disease (AD) affects approximately 5.3 million adults age 65+ (Hebert, Weuve,
Scherr, & Evans, 2013), with the oldest-old (85+) being most affected (Heron, 2016). It is
estimated the oldest-old population will expand from 5.6 million in 2012 to nearly 18 million in
2050 (Ortman, Velkoff, & Hogan, 2014), and it is further predicted that 7 million, or 38% of this

4
subpopulation, will have and eventually die from complications from AD. A nursing home
placement often occurs in the later stages of dementia and dementia-related illnesses, where
unhealthy aging is often exacerbated by overwhelmed and undertrained staff (e.g, Cohen-
Mansfield & Mintzer, 2005). Challenging behaviors seen among older persons with dementia
are often managed pharmacologically. Louisiana currently has the highest rate of anti-psychotic
use in nursing facilities (Centers for Medicare and Medicaid Services, 2015). Strategies to
reduce the reliance on antipsychotic medications coupled with interventions to promote quality
of life are important challenges for senior service providers and those in the nursing home
industry. Determining how some people manage to avoid these terminal illnesses while others
succumb has been an interest to scholars for many years, leading to the birth of the field of
successful aging. To illustrate, a chart depicting seminal successful aging research appears in
Figure 1 below.
Figure 1: Successful Aging Research Overview
Theories and Tenets of
Successful Aging
Subjective/Self-Report Theories
Strawbridge (2002)
Pruchno et al (2010)
Objective Theories
Rowe and Kahn
1997; Successful Aging 1.0
2015; Successful Aging 2.0
Lifespan Theories
Baltes et al.
Selection/Optimazation/Compensation
Model
Mechanics and pragmatics

5
Theoretical Approaches to Successful Aging
Rowe and Kahn (1997; 2015) have conceptualized successful aging as encompassing low
level of disease/disease-related disability, relatively high cognitive and physical function, and
continued engagement in social and everyday life activities. From this perspective, successful
aging is a reflection of healthspan mortality as opposed to absolute lifespan mortality (Lithgow,
Lord, & Kirkland, 2012). Healthspan is defined as the length of time one lives in optimal health
without being majorly affected by age-related pathologies. Ideally, one’s healthspan would
overlap his or her lifespan in that all years lived, even in older age, are encompassed by low
disease/illness, high cognitive and physical functioning, and continued social engagement.
However, using an objective, health-centric measure of successful aging severely limits those
who would otherwise describe themselves as successfully aging. For example, Strawbridge,
Wallhagen, and Cohen (2002) examined self-reports of older adults aging successfully compared
to those who were aging successfully according to Rowe and Kahn’s operationalized definition.
While only 18.8% of their sample would be classified as successful aging from Rowe and
Kahn’s perspective, 50.3% of the sample self-reported that they believed they were aging
successfully. Strawbridge et al.’s findings, among others, attest to the need to broaden Rowe and
Kahn’s criteria to include subjective measures of well-being in later life (see Cherry, Marks,
Benedetto, Sullivan, & Barker, 2013, for discussion).
While the general public may have an idea if they themselves are aging successfully or
not, gerontologists have yet to reach consensus of what qualifies as “successful aging.” Baltes
and Carstensen (1996) proposed a more process-based approach to successful aging rather than
outcome-based. That is, they argued that successful aging should not be defined by emphasizing
gains, such as what Rowe and Kahn (1997) proposed, but rather how an individual adapts to

6
losses such as disease and cognitive decline. Rowe and Kahn’s (1987) original definition of
successful aging reflects a medical model in that they had stated no rather than low levels of
disease, which excluded many older adults even if they did not feel their disease did not interfere
with their quality of life. Successful aging, as Baltes and Carstensen proposed, should not be
based upon normative goals and ideals, but rather entail a broader definition in which multiple
outcomes are measured using various assessment criteria (e.g., subjective vs. objective) and a
variety of different norms. In addition, successful aging and gerontological researchers
encompass a multitude of disciplines, such as psychology, public health, kinesiology, etc. to
provide the most holistic view of the components longevity; the Gerontological Society of
America prides itself on displaying and promoting international collaboration between biologists,
health professionals, policymakers, and behavioral social scientists.
In their selection-optimization-compensation (SOC) (Baltes & Baltes, 1990) model,
successful aging occurs when a person continues to reach goals they consider important, using
strategies to adapt to losses caused by aging. This shifts the definition of successful aging from
“overall good physical health” to “personal meaning in life.” Specifically, “success” is defined as
personal goal attainment, while “successful aging” is defined as minimization of losses and
maximization of gains (Baltes & Carstensen, 1996). This is achieved through three processes:
selection, optimization, and compensation. Selection can be a preventive measure for or a
reaction to increasing restrictions in various areas of life usually caused by losses in old age,
such as increasing frailty, memory loss, etc. One older adult may select to reduce amount of
activities involved in, while another may downsize their home and relocate closer to adult
children. Consistent modification of individual goals is at the core of selection.

7
Optimization, the second item in SOC, occurs when older adults choose to enrich and
continually develop their selected domains, known as generativity, or invest in new areas that
will assist them with developmental tasks in older adulthood, such as coming to terms with one’s
own mortality. The last factor of the SOC model, compensation, involves modifying behavior
and use of strategies to assist in areas where losses have occurred. An older adult using a
hearing aid is an example of compensation via technological advances. In a four year
longitudinal study, Lang, Rieckmann, and Baltes (2002) found that older adults who were high in
sensorimotor, cognitive, and social and personality resources invested more time in social
activities with family and reduced diversity in their dominant leisure domain (e.g., physical
leisure, social leisure, intellectual/cultural leisure) than those scoring lower in those resource
areas. The successful agers, those who both scored highest on the resource measures and
survived across the four year study, had used selection to choose which activities were important
to them, compensated for age-related fatigue by taking daytime naps, and optimized their
performance by mastering or becoming deeply involved in the selected areas. All three factors
of the SOC model are very dependent upon the individual’s personal goals; thus, a greater
number of older adults are classified as “successfully aging” using this model of successful aging
rather than Rowe and Kahn’s (1987; 1997). In an Editorial in The Journal of Gerontology, Rowe
and Kahn (2015) addressed these concerns with their original model, saying that their model
better addressed the what of successful aging while more lifespan, process-based models such as
SOC (Baltes & Baltes, 1990) answered the how of successful aging.
As displayed in Figure 1, successful aging has shown evidence for both objective (e.g.,
health-related) and subjective (e.g., self-report and self-appraisal) factors. Pruchno and
colleagues (2010) investigated health-related differences amongst four groups of older adults: 1)

8
people who were successfully aging according to both subjective and objective criteria, 2) those
who were successfully aging according only to subjective criteria, 3) people who were
successfully aging only under objective criteria, and lastly, 4) people who were not successfully
aging according to both subjective and objective criteria. For subjective measures of success,
they asked participants three questions about how they personally felt they were aging.
Objective success was operationalized as maintaining functional ability, having little
physical/bodily pain, and having few chronic conditions. Compared to the Successful agers
(groups 1-3), the Unsuccessful agers (group 4) reported significantly less social support. This
difference was also observed when comparing subjective-only successful agers (group 2) and
objective-only successful agers (group 3) with those who were successful according to both
criterion (group 1). Compared to the objective only group, the subjective only group reported
significantly more social support. Expanding upon prior literature, their study provided evidence
for a successful aging model that encompasses multiple dimensions measured by both objective
and subjective factors (cf. Strawbridge et al., 2002). In addition, evidence was found for role of
social support and engagement in moderating an individual’s appraisal of their quality of life in
older adulthood (Pruchno, Wilson-Genderson, Rose, & Cartwright, 2010).
Social Factors, Physical Health, and Successful Aging
Cherry, Walker et al. (2013) investigated age and gender differences in social
engagement, positive health behaviors (e.g., refraining from tobacco and alcohol use), and
physical health in a study of healthy aging that included very old adults. Social engagement was
operationalized as using a) level of perceived social support, b) presence of a confidant, and c)
number of social activities and hours spent outside of the home. Physical health was measured
via the Short Form 36 (SF-36) (Ware & Sherbourne, 1992; Ware et al., 1995; Ware, 2000), a

9
self-report, domain-specific measure of health-related quality of life (see Appendix C, page 44),
and objective health status based upon an index of six chronic conditions: high cholesterol,
hypertension, diabetes, arthritis, heart problems, and cancer. These conditions ranged in severity
from mild/moderate (e.g., high cholesterol and arthritis) to more severe (e.g., heart problems and
cancer), and were selected to provide a broad assessment of health. For each participant, scores
of 0 (absence) and 1 (presence) were assigned for each health condition and summed to create a
cumulative, composite index of health (range: 0 to 6), with higher scores indicating greater
comorbidities. Originally designed to meet the needs of the Medical Outcome Survey, a large-
scale population-based study, the SF-36 contains 36 health-related quality of life items spread
across eight scales: physical functioning, role limitations due to physical problems, social
problems, bodily pain, general mental health, role limitations due to emotional problems, vitality,
and general health perceptions. These eight scales can also be collapsed across one another to
form a Mental Health Composite Score (MCS) and Physical Health Composite Score (PCS).
MCS and PCS are two summary measures that reduce Type I error risk in running multiple
comparisons in hypothesis testing (Ware et al., 1995). The MCS is comprised of the mental
health, emotional role limitation, and social functioning subscales. The PCS contains the
physical functioning, physical role limitation, and social functioning subscales. The remaining
two subscales, vitality and general health, have correlations with both MCS and PCS
components. Using these two composite scores (MCS and PCS, respectively) reduces the
number of required hypothesis testing to 32 (2 composites multiplied by 16 tests) from 128 (8
domains multiplied by 16 tests (Ware, Kosinski, Bayliss, McHorney, Rogers , & Raczek, 1995).
Validity of the three-level taxonomy (36 individual items, 8 domains, and two composite scores)
has been demonstrated by many researchers (c.f., Ware, 2000) as well as validity across diverse

10
populations (e.g., McHorney, Ware, Lu, & Sherbourne, 1994). In older adults, large population
based studies have demonstrated both internal consistency and validity for use amongst older
adults (e.g., Lyons, Perry, & Littlepage, 1994; Walters, Munro, & Brazier, 2001). Its ease of
distribution and assessment in conjunction with high construct validity and test-retest reliability
have made it one of the most popular health-related quality of life psychometric tests, with over
25,000 publications utilizing it since 1988 (Google Scholar).
The second aim of their study concerned predictors of physical health using measures of
social engagement, positive health behaviors, and both subjective and objective criteria.
Regression analyses indicated that age, gender, and social engagement (specifically hours spent
outside of the house) were associated with self-reported health as indexed by the SF-36 PCS
scores. Social engagement (measured by hours spent outside of the home) was significantly
associated with both physical health dimensions (objective and self-reported) after age, gender,
and demographic factors were entered into the model. For objective health status, the
contribution of both social engagement indices (hours outside of the home and the number of
clubs and social organizations) remained significant after controlling for age, gender, and
demographic factors. Hence, the higher levels of social engagement a person reported, the
higher both their subjective and objective health ratings were, indicating importance of
socialization at the end of the lifespan. Wang et al. reported similar results in Chinese
nonagenarians and centenarians, displaying ecological validity in successful aging across
Western and Eastern cultures (Wang et al., 2015).
Frailty
Recent attempts to quantify successful aging have come in the form of frailty indices.
Frailty is described as a phenotype which presents itself as lower functional reserve and

11
physiologic dysregulation that results in a lowered ability and capacity to manage destabilizing
stress (Kim & Jazwinski, 2015). The frailty phenotype was first described by Fried and
colleagues (2001) as the presence of at least three of five structural and functional deficits in an
individual: unexplained weight loss, exhaustion and fatigue, muscle weakness, slow gait, and
little to no physical activity. A frailty index is a way to further quantify and operationalize this
phenotype. Researchers create frailty indices by gathering common health deficits related to
frailty, such as BMI, chronic conditions, and inability to perform short physical tasks. By using
a frailty index comprised of 34 health-related variables (FI-34) with the LHAS population
(N=869), Kim and Jazwinski (2015) demonstrated a high correlation and non-linear increase in
the rate of deficits with increasing age (at the population level). At the individual level, FI-34
can increase, decrease, or remain the same over three to five years. In comparisons, the FI-34
was a better indicator of healthspan than chronological again; essentially, it measures an
individual’s biological age. See Appendix A (page 51) for all health-related variables included
in this index.
Physical Activity
Assessing levels of physical activity is crucial for successful aging researchers as
continued maintenance of health and independence are reliant upon level of physical functioning.
In a clinical trial, Pahor et al. (2014) provided sedentary older adults who had physical
limitations an intervention of structured, moderate physical activity. This regimen consisted of
aerobic, resistance, and strength training exercises done twice a week at a medical center and
three to four times a week at home. Across 2.6 years, participants who were assigned to the
exercise condition over a health education program were less likely to report acute and persistent
mobility disability, defined as inability to perform a 400m walk, a commonly used metric of

12
physical functioning in older adults. While empirical evidence demonstrates that even moderate
physical activity can beneficial to health, well-being, risk of disability, across the world, older
adults are not meeting recommended physical activity guidelines. Using a sample of 230 elderly
residents of the UK, Davis et al. (2011) found only 3 participants met the required physical
activity levels for health maintenance; in the United States using the National Health and
Nutritional Examination Study (NHANES), Troiano et al. (2008) found only 2.4% of the sample
aged 60+ was meeting the recommended physical activity level. The former studies used
accelerometry, measuring patterns of movements and activity through a pedometer that the
participant wears.
Through accelerometry an objective measure of physical activity is obtained. In
situations where an accelerometer is unavailable, physical activity questionnaires are given for
participants to self-report their level of activity. One of these measures is the Yale Physical
Activity Survey (YPAS) (Dipietro, Caspersen, Ostfeld, & Nadel, 1993), an assessment of
physical activity specifically validated for use with older adults. The first section of the YPAS
(Appendix B) is used to calculate a weekly energy expenditure value (EE). Participants are
asked to report how many hours they spend doing activities under the categories of house work,
yard work, caregiving, exercise, and recreation. The minutes per week one spends doing a
specific activity is multiplied by an intensity code, and all values are then totaled across activities
to create a weekly EE expressed in kcal/wk-1. By using a survey questionnaire, a subjective view
of physical activity is provided.
As successful aging has many contributing factors, multiple domains of health and
health-related quality of life must be measured. In the present research, subjective physical
health was measured via self-report (SF-36 PCS) and frailty scores (FI-34), an objective measure

13
of health. Additionally, estimated level of physical activity was achieved via the energy
expenditure measure of the YPAS, mental/health cognition measured via the Mini-Mental Status
Examination (MMSE) (Folstein, Folstein, & McHugh, 1975) and Geriatric Depression Scale
(GDS) (Sheikh & Yesavage, 1986), and level of social engagement using the same questions
used in Cherry et al. (2013). Taken together, these dependent measures provide a more
comprehensive assessment than in previous research (e.g., Cherry, Walker, et al., 2013).
Additionally, the present study has used a wider age range than earlier studies to provide new
information on oldest-old adults, the fastest growing segment of the older adult population in the
United States.

14
FOCUS OF THE PRESENT RESEARCH
The present research was designed to address two issues with respect to the study of
successful aging in oldest-old adults. The first aim of this study was to examine age group and
gender differences in sociodemographic characteristics (cognitive and affective status, self-
reported health, and educational attainment), physical and social activities, and frailty. This
study extended Cherry, Walker, et al.’s (2013) earlier work in three ways. First, sampling
occurred from a broader range of cognitive status scores (i.e., MMSE of 24 and higher) resulting
in a larger sample (n = 732) which we partitioned into four age groups: younger (21 to 44 years),
middle-aged (45 to 64 years), older (65 to 84 years), and oldest-old adults (85 + years). By
doing so, this study allowed for clearer inferences on health in midlife than in Cherry, Walker, et
al. (2013) where younger and middle-aged adults were combined. Based on prior literature,
significant age group (Cherry et al., 2013) and gender differences (Cherry, Silva Brown, Kim,
Jazwinski, 2016) in self-reported physical health were expected. Additionally, a 34-variable
frailty index as a measure of physical frailty (FI-34; Table 1) was included, which expanded
Cherry et al.’s (2013) six chronic illness measure of objective health. Importantly, the FI-34 has
been validated and provides a more comprehensive assessment of physical well-being than in
earlier work. Significant age group differences in frailty were also expected, based on earlier
findings (Kim & Jazwinski, 2015).
The second aim of this study was to address predictors of both subjective and objective
health in two respective models. In Model 1, SF-36 PCS scores were used as an index of
subjective health-related quality of life. Based on prior research, we expected that social factors
and physical activity would be significantly associated with SF-36 PCS scores after considering
key sociodemographic characteristics (age, gender, level of education). Whether social factors
15
account for unique variance after statistically controlling for sociodemographic, physical activity,
and the FI-34 frailty metric was unclear. Finding that social engagement variables account for
significant variance would suggest that social factors still matter to health outcomes after taking
physical activity and frailty into account. This outcome would confirm the beneficial effects of
both social engagement and physical activity for successful aging in later life (Rowe & Kahn,
1997; Pruchno et al, 2010).
Because the SF-36 PCS is a self-report, subjective measure of quality of life and well-
being, regression analyses with the FI-34 as the outcome variable and sociodemographics,
physical activity, and social engagement and support as predictor variables were carried out.
Thus, in Model 2, FI-34 scores served as the outcome variable as well as an objective,
quantifiable measure of biologic age. Finding significance in these models would indicate the
importance of physical activity and social environment as protective factors against degree of
frailty.

16
METHOD
Participants
A total of 732 participants, who ranged in age from 21 to 101 years were sampled from
the Louisiana Healthy Aging Study (LHAS), a multidisciplinary study of the determinants of
longevity and healthy aging in oldest-old adults. The LHAS is a collaborative effort with
behavioral and medical researchers from Louisiana State University (LSU) in Baton Rouge, LSU
Health Sciences Center in New Orleans, Pennington Biomedical Research Center (PBRC), the
University of Pittsburgh, and the University of Alabama at Birmingham.
LHAS participants lived within an eight parish (county) area which spanned a 40-mile
radius of Baton Rouge. Participants were recruited through random sampling of voter
registration lists and the Center for Medicare and Medicaid Services files by personnel in the
School of Public Health at the LSU Health Sciences Center in New Orleans. Information about
the LHAS was mailed out to potential participants with a self-addressed, stamped envelope and
postcard to return to indicate their interest in participating.
Those who returned their postcards were contacted for a pre-visit at the PBRC where
informed consent was obtained and physiological and psychological measures were obtained.
For those older than 70 years, this preliminary assessment was solicited in a home visit. Next, a
day-long session was held at the PBRC where participants completed multiple measures of
physical and psychosocial functionality. A nurse from the PBRC, as well as faculty and graduate
students from the LSU Department of Psychology (Baton Rouge), collected physiological and
psychological measures from each LHAS participant.
All participants were paid at least $50 for their voluntary participation. The procedures
used were reviewed and approved by the Institutional Review Boards of the participating
17
institutions. All participants scored 24 or higher on the Mini-Mental Status Examination
(MMSE) (in line with Tombaugh & McIntyre, 1992), a screen used to assess cognitive
impairment.
Predictor Variables (Independent Variables)
Social engagement was operationalized by: a) the number of clubs and social
organizations a participant belongs to; b) number of hours per week spent outside of the home; c)
satisfaction with social support received for dealing with day to day problems; and d) whether
they had a confidant, described as someone they can talk to about issues that concern them, after
Cherry, Walker, et al. (2013).
The Yale Physical Activity Survey (YPAS) is self-report measure designed to measure
daily physical activity specifically in older adults. The YPAS contains three summary measures
that have been validated for individual use, including total energy expenditure (EE) (Dipietro,
Caspersen, Ostfeld, & Nadel, 1993). In this study, we utilized the Yale total energy expenditure
subscale score which reflects a sum of time spent on various activities multiplied by an intensity
code, after Kim et al. (2012).
Outcome Variables (Dependent Measures)
SF-36 PCS scores. Self-reported measures of health were taken via the Medical
Outcomes Survey (MOS) Short Form-36 (SF-36) (Ware & Sherbourne, 1992). In this study, we
specifically used the SF-36 Physical Health Composite Score (PCS). The SF-36 PCS scores
range from 0-100 and have been normed, signaling 50 as the mean. A score of 0 indicates the
lowest possible quality of life while 100 is the highest quality of life.

18
FI-34 Frailty Index. As discussed previously, frailty indices provide a quantifiable view
of a person’s biologic age. The entire FI-34 index and individual items are located in Appendix
A (pg. 42). A frailty ratio ranging from 0 (no deficits reported) to 1 (all 34 deficits reported) is
then calculated for each participant.
Statistical Analyses
All statistical analyses were conducted using IBM SPSS version 24.0 statistical software.
Means and standard deviations are reported for all continuous variables. Frequencies and
percentages (%) are reported for categorical variables. To address the first aim of this study,
one-way ANOVAs were run to investigate age (categorized by group: young, middle-aged,
older, and oldest-old), gender, and their interaction effect on social engagement, physical
activity, and frailty. Correlations were also run to demonstrate associations among these
variables. For the second aim, separate multiple regression analyses were carried out for the SF-
36 PCS and FI-34 scores. In Model 1, sociodemographic characteristics, social engagement,
physical activity, and frailty index scores served as predictors for the subjective outcome
variable, self-reported health (SF-36 PCS). In Model 2, sociodemographic characteristics, social
engagement, physical activity were predictors for the objective outcome, degree of frailty (FI-
34). This analysis plan was justified because the independent variables were predictor variables
that we assumed have some degree of correlation amongst one another. This method is also
justified because we had a priori hypotheses about which predictors may influence the model
more than others. In each of these regressions, age, gender, and education were entered first, in
order to account for these sociodemographic variables before considering the predictors of
central interest.

19
RESULTS
Analyses of Age and Gender Differences
Sociodemographic characteristics for all participants are reported in Table 1 (page 27),
including cognitive status (assessed with the Mini-Mental State Exam (MMSE; Folstein,
Folstein, & McHugh, 1975); affective status (assessed with the Geriatric Depression Scale (GDS;
Sheikh & Yesavage, 1986), educational attainment, and self-rated health. Table 2 (page 29)
presents self-reported health and objective health status. An ANOVA on the SF-36 PCS scores
yielded significant main effects of age group, F (3, 724) = 54.36, p < 0.01 and gender, F (1, 724)
= 13.57, p < 0.01. As predicted, scores decreased significantly across each of the age groups.
The Age Group x Gender interaction effect was also significant, F (3, 724) = 5.31, p = 0.01.
Follow-up comparisons confirmed a statistically significant gender difference for the older (p <
0.01) and oldest-old adults (p < 0.01) and but not for the younger (p = 0.73) or middle-aged
adults (p = 0.86), as the means in Table 2 (upper panel) suggest. There was a significant
association between age group and education level, χ2 (18) = 69.37, p < 0.01, and gender, χ2 (6)
= 17.07, p = 0.01. The oldest-old group reported significantly lower levels of education (p <
0.01) than the other three groups which were not different amongst themselves. As predicted, a
significant main effect of age group on measures of affective status, Geriatric Depression Scale
(GDS; Sheikh & Yesavage, 1986), F (3,722) = 6.32, p < 0.01 and the MMSE screen for
cognitive health (Tombaugh & McIntyre, 1992), F (3,724) = 101.68, p < 0.01 was shown. A
gender effect was also found to be a significant for GDS, F (1,722) = 4.98, p = 0.03; females
reported higher scores than males on this measure. An ANOVA on the Yale Total Energy
Expenditure, the measure of physical activity, revealed significant main effects of age group, F
(3, 724) = 27.29, p < 0.01 and gender, F (1, 724) = 6.77, p = 0.01.

20
Table 1: Sociodemographic and Individual Difference Characteristics (N = 732)
Younger adults
(21-44 years)
n = 191
Middle-aged adults
(45-64 years)
n = 196
Older adults
(65-84years)
n = 134
Oldest-old adults
(85 years +)
n = 211
M (SD)
Age 34.7 (6.4) 52.8 (4.9) 74.4 (5.2) 91.2 (2.5)
Cognitive statusa 29.5 (1.0) 29.2 (1.1) 28.7 (1.4) 27.3 (1.7)
Affective statusb 1.9 (2.4) 1.7 (2.4) 1.5 (1.6) 2.5 (2.3)
Physical activity (YPAS)c 8408.5 (6441.9) 7012.1 (4959.5) 6534.2 (4509.9) 3633.2 (3052.1)
N (%)
Sex (female) 133 (69.6%) 115 (58.7%) 74 (55.2%) 122 (57.8%)
Education
< 7th grade 0 (0.0%) 0(0.0%) 1 (0.7%) 5 (2.4%)
7th to 9th grade 1 (0.5%) 1 (0.5%) 4 (3.0%) 19 (9.0%)
10th to 11th grade 4 (2.1%) 2 (1.0%) 4 (3.0%) 15 (7.1%)
High school or GED equivalent 35 (18.3%) 48 (24.6%) 38 (28.3%) 46 (21.8%)
Partial college or training 64 (33.5%) 64 (32.8%) 37 (27.6%) 64 (30.3%)
College degree 67 (35.1%) 49 (25.1%) 31 (23.1%) 40 (19.0%)
Graduate degree 20 (10.5%) 31 (15.9%) 19 (14.2%) 22 (10.4%)
Clubs and social organizations
None 42 (21.9%) 36 (18.4%) 6 (4.5%) 23 (10.9%)
Between 1 and 3 138 (72.3%) 139 (70.9%) 99 (73.9%) 153 (72.5%)
Between 4 and 6 11 (5.8%) 13 (6.6%) 22 (16.4%) 28 (13.3%)

21
(Table 1, continued) More than 6 0(0.0%) 8 (4.1%) 7 (5.2%) 7 (3.3%)
Number of hours per week outside of
home
None 3 (1.6%) 1 (0.5%) 1 (0.7%) 13 (6.2%)
Between 1 and 5 10 (5.2%) 12 (6.2%) 29 (21.6%) 67 (31.7%)
Between 6 and 12 25 (13.1%) 29 (14.9%) 33 (24.6%) 65 (30.8%)
Between 13 and 19 23 (12.0%) 26 (13.2%) 27 (20.5%) 27 (12.8%)
More than 19 130 (68.1%) 127 (65.1%) 44 (32.8%) 39 (18.5%)
Social support
Very satisfied 96 (50.5%) 93 (48.2%) 105 (78.3%) 176 (83.4%)
Fairly satisfied 69 (36.3%) 75 (38.9%) 25 (18.7%) 30 (14.2%)
A little satisfied 18 (9.5%) 19 (9.8%) 3 (2.2%) 4 (1.9%)
Not satisfied 7 (3.7%) 6 (3.1%) 1 (0.7%) 1(0.5%)
Confidant (yes) 182 (95.3%) 183 (93.4%) 123 (91.8%) 182 (86.3%)
Notes. aMini-Mental State Exam (Folstein, Folstein, & McHugh, 1975). bGeriatric Depression Scale (Sheikh & Yesavage, 1986). cYPAS total energy expenditure score expressed as kilocalories per week.

22
Table 2: Dimensions of Physical Health by Age Group and Gender
Variables
Younger adults
(21-44 years)
Middle-aged adults
(45-64 years)
Older adults
(65-84 years)
Oldest-old adults
(85 years +)
Means (Standard Deviations)
SF-36 PCSa
Males 51.13 (8.40) 49.19 (9.10) 46.81 (8.28) 42.82 (10.01)
Females 51.58 (8.12) 48.96 (9.29) 41.83 (11.00) 36.79 (10.87)
Total 51.44 (8.19) 49.06 (9.19) 44.06 (10.15) 39.34 (10.91)
Frailty Index Ratiob
Males 0.06 (0.03) 0.10 (0.06) 0.18 (0.07) 0.18 (0.07)
Females 0.07 (0.04) 0.11 (0.06) 0.19 (0.08) 0.24 (0.09)
Total 0.07 (0.04) 0.105 (0.06) 0.19 (0.08) 0.22 (0.09)
Notes. Entries are means and standard deviations. aSF-36 physical health composite score (Ware et al., 2002). bFrailty Index 34;
number represents ratio of diagnosed illnesses to undiagnosed per individual (Kim & Jazwinski, 2015). Both measures used the full-
sample size of 732.

23
As with the SF-36 PCS scores, each increasing age group reported less physical activity
than the age group before it. A significant Age Group x Gender interaction, F (3, 724) = 2.85, p
= 0.04, was demonstrated, and pairwise comparisons displayed that in the youngest (p = .01) and
middle-aged groups (p = .03), females reported significantly more physical activity than males,
but no significant difference between the oldest two groups were found.
Number of social organizations was found to have a significant association with age
group, χ2 (3) = 50.40 p < 0.01 (Figure 2, pg. 24). Interestingly, this significance was due to
younger adults reporting less than expected clubs and activities, while older-old adults
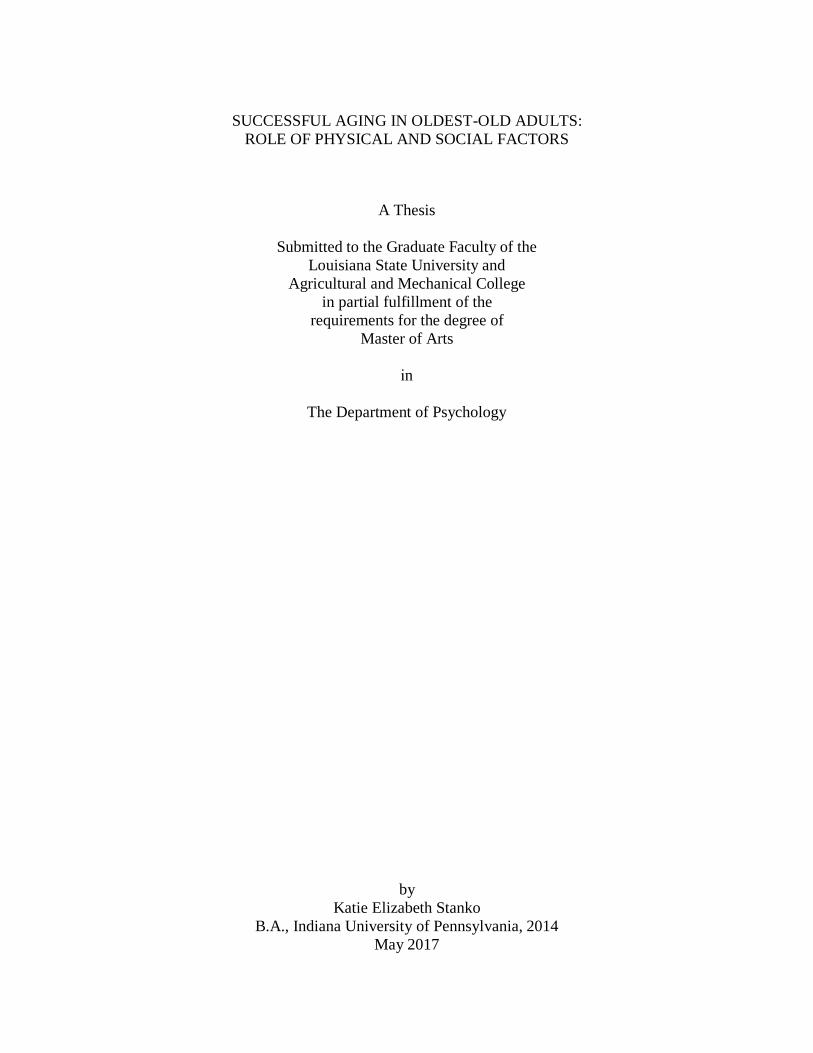
contributed significantly more. Analyses of hours spent outside of the home revealed significant
main effects of age group, χ2 (12) = 176.33 p < 0.01 with the oldest group reporting the least
amount of time spent outside the home, followed by the older group (Figure 3, pg. 25). A gender
effect was displayed, χ2 (4) = 13.71 p = 0.01, which favored males. Satisfaction with social
support revealed a main effect of age group, χ2 (9) = 90.63 p < 0.01, with older and oldest-old
adults reporting higher satisfaction than the younger and middle-aged adults (Figure 4, pg. 26).
For presence of a close person or confidant, age group was significant, χ2 (3) = 11.49 p = 0.01, as
the oldest-old group reported not having a confidant more often than the younger two age groups
(p = 0.01 and p = 0.05, respectively).
For objective health status, analyses of the FI-34 frailty index yielded a significant effect
age group, F (3, 724) = 181.89, p < 0.01, and gender, F (1, 724) = 16.02, p < 0.01. Corrected
postdoc comparisons, revealed significant descending levels of frailty among all four groups,
with the oldest-old group reporting significantly more deficits than the three younger groups (p <
0.01). An Age Group x Gender interaction was observed, F (3,724) = 5.37, p = 0.01, where the
oldest-old group’s males reported less frailty than females did (p < 0.01).

24
Younger Adults Middle-Aged Adults
Older Adults Oldest-Old Adults
Figure 2: Number of Clubs or Social Organizations Belonged to by Age Group
21.9
72.3
5.8
0
None Between 1-3
Between 4-6 More Than 6
18.4
70.9
6.6
4.1
None Between 1-3
Between 4-6 More Than 6
4.5
73.9
16.4
5.2
None Between 1-3
Between 4-6 More Than 6
10.9
72.5
13.3
3.3
None Between 1-3
Between 4-6 More Than 6

25
Younger Adults Middle-Aged Adults
Older Adults Oldest-Old Adults
1.6 5.213.1
1268.1
None
Between 1 and 5
Between 6 and 12
Between 13 and 19
More than 19
0.5 6.2
14.9
13.265.1
None
Between 1 and 5
Between 6 and 12
Between 13 and 19
More than 19
0.7
21.6
24.620.5
32.8
None
Between 1 and 5
Between 6 and 12
Between 13 and 19
More than 19
6.2
31.7
30.8
12.8
18.5
None
Between 1 and 5
Between 6 and 12
Between 13 and 19
More than 19
Figure 3: Number of Hours per Week Spent Out of Home by Age Group
26
Younger Adults Middle-Aged Adults
Older Adults Oldest-Old Adults
50.536.3
9.5
3.7
Very Satisfied Fairly Satisfied
A Little Satisfied Not Satisfied
48.2
38.9
9.8
3.1
Very Satisfied Fairly Satisfied
A Little Satisfied Not Satisfied
78.3
18.7
2.2 3.7
Very Satisfied Fairly Satisfied
A Little Satisfied Not Satisfied
83.4
14.2
1.9 3.7
Very Satisfied Fairly Satisfied
A Little Satisfied Not Satisfied
Figure 4: Satisfaction with Social Support by Age Group

27
Table 3: Bivariate Correlations Amongst Variables (Pearson’s)
1 2 3 4 5 6 7 8 9 10 11 12 13
1. Age Group -
2. Sex -.088* -
3. Education Level -.207** -.088* -
4. Mini-Mental
Status Examination
(MMSE)
-.526** 0.052 .284** -
5. Geriatric
Depression Score
(GDS)
.096** .083* -.220** -.147** -
6. Vocabulary -0.040 -0.059 .517** .361** -.173** -
7. SF-36 PCS -.447** -.086* .199** .304** -.388** .123** -
8. Number of
clubs or social
organizations
.182** -0.068 .181** -0.068 -.194** .128** -0.050 -
9. Hours spent
outside of the
home
-.452** -.123** .223** .353** -.219** .214** .377** 0.049 -
10. Satisfaction
with support
received
.298** -0.040 -0.044 -.144** -.288** 0.001 -0.033 .130** -0.055 -
11. Presence of a
close person or
confidant
-.123** 0.016 0.014 0.072 -.129** -0.057 0.070 0.040 0.065 .107** -
12. Yale Physical
Activity Survey
(YPAS)
-.340** .116** 0.061 .232** -.137** -0.052 .254** -0.021 .205** -.116** 0.049 -
13. Frailty Index
34 (FI-34)
.660** 0.059 -.215** -.399** .281** -.112** -.636** .114** -.438** .094* -.147** -.263** -
*Correlation significant at p< 0.05
**Correlation significant at p < 0.01

28
Bivariate correlation analyses (see Table 3, page 35) revealed lower level of education
was found to associate with higher frailty scores, r = -.215, p < 0.01. Higher scores on the
Geriatric Depression Scale (GDS) were found to relate with higher levels of frailty, r = .281, p <
0.01, while higher scores on the Mini-Mental Status Examination (MMSE) led to lower degree
of frailty, r = -.399, p < 0.01. Number of clubs or activities was also shown to relate to frailty, r
= .114, p = 0.002. Hours out of the home was inversely related with FI-34 score, r = -.438, p <
0.01. There were no more significant age group or gender effects found in this analysis.
Multiple Regression Analyses
SF-36 PCS scores (Subjective Health). Table 4 reveals that age, gender, and education
accounted for a significant 22.8% of the variance in the self-reported health responses, F(3, 722)
= 70.94, p < 0.01 (Model 1). After adding physical activity to the model, the demographic
variables remained significant. Physical activity also made a significant contribution (p < 0.01)
in support of the hypothesis. Totaled, these variables accounted for 24.2% of the variance, F(4,
721) = 57.70, p < 0.01 (Model 2). After adding the four social factors (number of clubs and
activities, hours spent outside the home, presence of a confidant or close person, satisfaction with
support received), the demographic and physical activity variables held their significance,
although only hours spent outside of the home (p < 0.01) and satisfaction with social support (p
= 0.01) made significant contributions; number of social organizations was not found to be
significant to the model (p = 0.31) nor was presence of a confidant or close person (p = 0.76).
Together, these variables accounted for 27.5% of the variance, F(8, 717) = 34.02, p < 0.01
(Model 3). Crucially, these data strongly support the hypothesis that social factors still impact
physical health even after physical activity has been taken into account. Lastly, a final model
was constructed with the aforementioned variables plus the inclusion of the measure of objective

29
Table 4: Multiple Regression Models with Self-Reported Health as Criterion Variable
Unstandardized coefficients Standardized
coefficients
Health outcomes B SE B β P R2
Physical health composite (SF-36 PCS)
Model 1 (Demographics) 22.8%
Age -4.06 .31 -.44 .00
Gender -2.71 .73 -.12 .00
Education .85 .29 .10 .00
Model 2 (Demographics, Physical Activity) 24.2%
Age -3.66 .33 -.39 .00
Gender -2.96 .73 -.13 .00
Education .85 .29 .10 .00
Physical activity (YPAS) a .00 .00 .13 .00
Model 3 (Demographics, Physical Activity, Social
Factors)
27.5%
Age -3.18 .38 -.34 .00
Gender -2.36 .72 -.11 .00
Education .74 .29 .09 .01
Physical activity (YPAS) a .00 .00 .12 .00
Number of clubs -.61 .60 -.03 .31
Hours out of home 1.51 .32 .17 .00

30
(Table 4, continued)
Health outcomes B SE B β P R2
Satisfaction with social support 1.46 .52 .09 .01
Model 4 (Demographics, Physical Activity, Social Factors, Frailty) 42.7%
Age -.15 .40 -.02 .71
Gender -1.15 .65 -.05 .08
Education .44 .26 .05 .09
Physical activity (YPAS) a .00 .00 .09 .00
Number of clubs -.13 .54 -.01 .81
Hours out of home .87 .29 .10 .00
Satisfaction with social support .62 .46 .04 .18
Frailty (FI-34) -64.13 4.65 -.54 .00
Notes. aYPAS total energy expenditure score expressed as kilocalories per week.

31
health, Frailty-Index 34 (Kim & Jazwinski, 2015), to see if demographic and social behaviors
would still hold significance in the variance of self-reported health after an objective measure was
added. A linear regression with FI-34 as predictor and SF-36 PCS as outcome revealed a strong
negative relationship, F(1,730) = 495.93, p < 0.01, R2 = .40. Such a strong relationship may have
made the earlier variables obsolete in the final model; however, once frailty was added, physical
activity (p < 0.01) and hours out of the home (p <0.01) remained significant, F(9, 716) = 59.54, p
< 0.01. Age, gender, and education all lost significance in this final model. This fourth and final
model accounted for a total of 42.8% of the variance in self-reported health.
FI-34 Index Scores (Objective Health). Regarding the three sociodemographic
variables, age, gender, and level of education each showed significance, F(3, 722) = 203.56, p <
0.01 (see Table 5, page 40). This first model reported 45.8% of the variance in objective health
status. When physical activity (YPAS EE; Dipietro, Caspersen, Ostfeld, & Nadel, 1993) was
added to the model, age (p < .01), gender (p < .01), and level of education (p = 0.02) were all
significant predictors of the variance in FI-34 responses, but physical activity itself was not (p =
0.05). Together, these variables were responsible for 46.1% of the variance, F(4, 721) = 154.17, p
< 0.01. When the social factors were added, all prior predictors held their significance (p < 0.05)
except for number of clubs and social organizations (p = 0.06) and physical activity (p = 0.08).
Together, these variables accounted for 48.9% of the variance, F(8, 717) = 85.89, p < 0.01.
These data suggest that multiple non-health related variables outside age (social behaviors
and support, gender, and level of education) remain an important part of the contribution to level
of frailty in an individual and therefore the overall degree to which they are aging successfully and
maximizing their healthspan.

32
Table 5: Multiple Regression Models with Objective Health Status as Criterion Variable
Objective health – Frailty (FI-34)
Model 1 (Demographics) 45.8%
Age .05 .00 .66 .00
Gender .02 .01 .12 .00
Education -.01 .00 -.07 .01
Model 2 (Demographics, Physical
Activity)
46.1%
Age .05 .00 .64 .00
Gender .02 .01 .12 .00
Education -.01 .00 -.07 .02
Physical activity (YPAS)a -.01 .00 -.06 .05
Model 3 (Demographics, Physical
Activity, Social Factors)
48.6%
Age .05 .00 .60 .00
Gender .02 .01 .10 .00
Education -.01 .00 -.06 .03
Physical activity (YPAS)a -.01 .00 -.05 .08
Number of clubs .01 .00 .05 .08
Hours out of home -.01 .00 -.14 .00
Satisfaction with social support -.01 .00 -.10 .00
Notes. aYPAS total energy expenditure score expressed as kilocalories per week.

33
DISCUSSION
In order for one to age successfully, there is, unfortunately, no elixir or potion to take to
cause a long and intertwined lifespan and healthspan. Instead, multiple factors affect both how
people subjectively view themselves aging and objective, biomedical views of aging. In the
present research, age and gender differences were observed in social and physical activity, and
self-reported health and objective health status. These findings and their significance for current
views of successful aging are discussed more fully in the paragraphs that follow.
The first aim in this study was to examine age group and gender differences in
sociodemographic characteristics (cognitive and affective status, self-reported health, and
educational attainment), physical and social activities, and frailty. To address this aim, we divided
the sample to represent four age groups: younger (21-44 years), middle-aged (45-64 years), older
(65-84 years), and oldest-old adults (85 to 101 years). Overall, younger and middle-aged adult
groups were comparable on the social activity measures (number of clubs, perceived social
support, hours out of home). However, middle-aged adults’ physical activity score was lower
than that of the younger adults (p = 0.03) and no different from the older adults (p = 0.82).
Oldest-old adults’ physical activity score was significantly lower than all of the other age groups
(p’s < 0.01), as expected. With respect to self-rated health, middle-aged adults’ mean SF-36 PCS
score was numerically lower than the younger adults, a marginally significant difference (p =
0.07). However, middle-aged adults reported a significantly greater degree of frailty than did the
younger adults, consistent with the hypothesis. Together, these findings imply that middle-aged
adults may be at risk for health-related problems and negative behaviors which threaten the
likelihood of successful aging (e.g., Britton, Shipley, Singh-Manoux, & Marmot, 2008; Dogra &
Stathokostas, 2012). An age-related increase in health problems in mid-life may possibly due to a

34
more sedentary lifestyle than their younger counterparts, although further research would be
desirable before firm conclusions would be warranted.
With respect to the two older reference groups, the mean SF-36 PCS score for the oldest-
old adults was less than that of the older adults, suggestive of a linear decline in self-reported
health in later life. The more interesting aspect of these data was that age interacted with gender,
where the gender difference in SF-36 PCS scores was not significant for the middle-aged and
younger age groups, but a difference favoring males was evident in the two older age groups.
This male protective-factor was replicated in the oldest-old group only for the FI-34 outcome (p <
0.01). This gender difference in physical functioning may be due to older women’s increased
likelihood for disabling conditions such as osteoporosis, fractures, and falls (Murtagh & Hubert,
2003). Although women statistically live longer than men, as the results support, older women are
generally more frail than their male counterparts (Hubbard, 2015). The present results underscore
the important role of physical function in fostering health-related quality of life in late adulthood
(see also Frisard et al., 2006; Srinivas-Shankar et al., 2010).
In regards to frailty, the objective measure of health, analyses revealed a main effect of age
group, with each age group differing significantly from one another. Younger adults reported
significantly less frailty than middle-aged adults, while oldest-old adults reported the highest ratio
of frailty followed by older-old adults. The present measure of frailty provided a comprehensive
assessment of biological factors (including diseases and chronic health conditions) that affect
healthy aging. Including both subjective and objective measures of health-related quality of life is
imperative to truly understanding all possible factors related to successful aging. In this sample,
47.2% of participants reported a score of 50 or higher on the SF-36 PCS, indicating better than
average health (Ware, 2000). In contrast, those same participants reported a mean frailty deficit of

35
.09, approximately 3 out of 34 health-related deficits. Only seven participants across the entire
sample of 732 had frailty ratios of 0. While higher numbers of older adults believe they are
successfully aging than what biomedical outcomes would suggest (Strawbridge, Wallhagen, &
Cohen, 2002), in the present research we found that hours out of the home was a significant
predictor of both outcomes. Future research that incorporates a longitudinal assessment would be
desirable to permit inferences on the causal direction of this relationship.
Conclusion
On a broader note, the field of aging is not confined to one academic discipline; rather,
successful aging research encapsulates biological, psychological, and social factors, which we
assume interact vigorously with each other. An interdisciplinary approach to successful aging
provides a more holistic view of the person, and thus, more generalizable information on the
current state of the field.
The intellectual merit of the research portrayed successful aging from a multidisciplinary,
lifespan perspective. The scope of work includes significant associations among subjective and
objective measures of physical health, levels of social engagement including the oldest-old (age
85+), the fastest growing segment of the population (Ortman, Velkoff, & Hogan, 2014). Using
models of successful aging, the broader impacts and implications of this research can be used to
improve socialization and physical activity programs for retirement and senior centers as the
number of successfully aging elderly people needing their services will skyrocket in the upcoming
years. In accordance with Baltes and Baltes (1990), successful aging occurs when older adults
select or limit their activities and obligations to better meet demands, optimize the chosen
activities to maximize gains and minimize losses, and compensate for age-related losses by using
strategies. The highest-functioning older adults are ones who utilize the SOC model themselves

36
without prompting; however, retirement and nursing homes could provide interventions and
programs that incorporate selection, optimization, and compensation in domains such as health-
related quality of life, physical activity and exercise, and social engagement in order for residents
to maximize their individual healthspans.
The present findings should be considered in light of at least three limitations. First, these
data are based on a cross-sectional design, so inferences about the directionality of effects are not
warranted. Second, we did not have an objective measure of physical activity; future studies
should utilize both a self-report measure such as the YPAS alongside accelerometry to better
characterize objective physical activity. Third, we did not include a measure of lifetime stress or
biological indicators of healthy aging. One potentially important direction for future research
would be to consider a boarder assessment of psychosocial variables that may impact heath.
Additional research to examine the role of genetic factors would also provide insight into
biological variables that may inevitably thwart healthy aging (Kim & Jazwinski, 2015), an
exciting possibility that awaits future research.
37
REFERENCES
Administration of Aging. (2015). Profiles of Older Americans 2014. U.S. Department of Health
and Human Services. Retrieved from
http://www.aoa.acl.gov/Aging_Statistics/Profile/Index.aspx
Anokye, N. K., Trueman, P., Green, C., Pavey, T. G., & Taylor, R. S. (2012). Physical activity
and health related quality of life. BMC Public Health, 12, 624. http://doi.org/10.1186/1471-
2458-12-624
Baltes, M. M., & Carstensen, L. L. (1996). The process of successful ageing. Ageing & Society,
16(4), 397.
Baltes, P. B., & Baltes, M. M. (1990). Psychological perspectives on successful aging: The model
of selective optimization with compensation. In P. B. Baltes & M. M. Baltes (Eds.),
Successful aging: Perspectives from the behavioral sciences (pp. 1–34). New York, NY, US:
Cambridge University Press.
Baltes, P. B., Staudinger, U. M., & Lindenberger, U. (1999). Lifespan psychology: theory and
application to intellectual functioning. Annual Review of Psychology, 50, 471–507.
http://doi.org/10.1146/annurev.psych.50.1.471
Berke, E. M., Choudhury, T., Ali, S., & Rabbi, M. (2011). Objective Measurement of Sociability
and Activity: Mobile Sensing in the Community. Annals of Family Medicine, 9(4), 344–350.
http://doi.org/10.1370/afm.1266
Cairns, D., Brown, J., Tolson, D., & Darbyshire, C. (2014). Caring for a child with learning
disabilities over a prolonged period of time: An exploratory survey on the experiences and
health of older parent carers living in Scotland. Journal of Applied Research in Intellectual
Disabilities, 27(5), 471–480.
Chay, K. Y., Kim, D., & Swaminathan, S. (2010). Medicare, Hospital Utilization and Mortality:
Evidence from the Program’s Origins.
Cherry, K. E., Brown, J. S., Kim, S., & Jazwinski, S. M. (2016). Social Factors and Healthy
Aging: Findings from the Louisiana Healthy Aging Study (LHAS). Kinesiology Review
(Champaign, Ill.), 5(1), 50–56. http://doi.org/10.1123/kr.2015-0052
Cherry, K. E., Marks, L. D., Benedetto, T., Sullivan, M. C., & Barker, A. (2013). Perceptions of
longevity and successful aging in very old adults. Journal of Religion, Spirituality & Aging,
25(4), 288–310. http://doi.org/10.1080/15528030.2013.765368
Cherry, K. E., Walker, E. J., Brown, J. S., Volaufova, J., LaMotte, L. R., Welsh, D. A., … Frisard,
M. I. (2013). Social engagement and health in younger, older, and oldest-old adults in the
Louisiana Healthy Aging Study. Journal of Applied Gerontology, 32(1), 51–75.
http://doi.org/10.1177/0733464811409034

38
Cohen-Mansfield, J., & Mintzer, J. E. (2005). Time for change: The role of nonpharmacological
interventions in treating behavior problems in nursing home residents with dementia.
Alzheimer Disease and Associated Disorders, 19(1), 37–40.
Dipietro, L., Caspersen, C. J., Ostfeld, A. M., & Nadel, E. R. (1993). A survey for assessing
physical activity among older adults. Medicine & Science in Sports & Exercise, 25(5), 628–
642. http://doi.org/10.1249/00005768-199305000-00016
Finkelstein, A., & McKnight, R. (2008). What did Medicare do? The initial impact of Medicare
on mortality and out of pocket medical spending. Journal of Public Economics, 92(7), 1644–
1668. http://doi.org/10.1016/j.jpubeco.2007.10.005
Folstein, M. F., Folstein, S. E., & McHugh, P. R. (1975). Mini-Mental State Examination.
PsycTESTS. http://doi.org/10.1037/t07757-000
Fried, L. P., Tangen, C. M., Walston, J., Newman, A. B., Hirsch, C., Gottdiener, J., … McBurnie,
M. A. (2001). Frailty in Older Adults Evidence for a Phenotype. The Journals of
Gerontology Series A: Biological Sciences and Medical Sciences, 56(3), M146–M157.
http://doi.org/10.1093/gerona/56.3.M146
Garber, C., Greaney, M. L., Riebe, D., Nigg, C. R., Burbank, P. A., & Clark, P. G. (2010).
Physical and mental health-related correlates of physical function in community dwelling
older adults: a cross sectional study. BMC Geriatrics, 10(1), 6. http://doi.org/10.1186/1471-
2318-10-6
Geschke, K., Fellgiebel, A., Laux, N., Schermuly, I., & Scheurich, A. (2013). Quality of Life in
Dementia: Impact of Cognition and Insight on Applicability of the SF-36. The American
Journal of Geriatric Psychiatry, 21(7), 646–654. http://doi.org/10.1016/j.jagp.2012.12.014
Gooding, P. A., Hurst, A., Johnson, J., & Tarrier, N. (2012). Psychological resilience in young and
older adults. International Journal of Geriatric Psychiatry, 27(3), 262–270.
http://doi.org/10.1002/gps.2712
Gorina, Y., Hoyert, D., Lentzner, H., & Goulding, M. (2005). Trends in Causes of Death among
Older Persons in the United States (Aging Trends No. 6) (p. 12). Hyattsville, Maryland.
Retrieved from https://www.cdc.gov/nchs/data/ahcd/agingtrends/06olderpersons.pdf
Harada N.D., Chiu V., King A.C., & Stewart A.L. (2001). An evaluation of three self-report
physical activity instruments for older adults. Medicine & Science in Sports & Exercise,
33(6), 962–970 9p.
He, W., Goodkind, D., & Kowal, P. (2016). An Aging World: 2015 (International Population
Reports No. P95/16-1) (p. 175). U.S. Government Publishing Office, Washington, DC: U.S.
Census Bureau. Retrieved from
https://www.census.gov/content/dam/Census/library/publications/2016/demo/p95-16-1.pdf

39
Hebert, L. E., Weuve, J., Scherr, P. A., & Evans, D. A. (2013). Alzheimer disease in the United
States (2010–2050) estimated using the 2010 census. Neurology, 80(19), 1778–1783.
http://doi.org/10.1212/WNL.0b013e31828726f5
Heron, M. (2016). Deaths: Leading Causes for 2014 (National Vital Statistics Reports No.
Volume 65, Number 5). Hyattsville, Maryland. Retrieved from
http://www.cdc.gov/nchs/data/nvsr/nvsr65/nvsr65_05.pdf
Hoyert, D. (2012). 75 Years of Mortality in the United States, 1935–2010 (NCHS Data Brief No.
88) (p. 7). National Center for Health Statistics: Center for Disease Control and Prevention.
Retrieved from http://www.cdc.gov/nchs/data/databriefs/db88.pdf
Kim, S., Bi, X., Czarny-Ratajczak, M., Dai, J., Welsh, D. A., Myers, L., … Jazwinski, S. M.
(2011). Telomere maintenance genes SIRT1 and XRCC6 impact age-related decline in
telomere length but only SIRT1 is associated with human longevity. Biogerontology, 13(2),
119–131. http://doi.org/10.1007/s10522-011-9360-5
Kim, S., & Jazwinski, S. M. (2015). Quantitative measures of healthy aging and biological age.
Healthy Aging Research, 4. http://doi.org/10.12715/har.2015.4.26
Lang, F. R., Rieckmann, N., & Baltes, M. M. (2002). Adapting to Aging Losses Do Resources
Facilitate Strategies of Selection, Compensation, and Optimization in Everyday Functioning?
The Journals of Gerontology Series B: Psychological Sciences and Social Sciences, 57(6),
P501–P509. http://doi.org/10.1093/geronb/57.6.P501
Lithgow, G. J., Lord, J. M., & Kirkland, J. L. (2012). Translating longevity research into
healthspan. Longevity & Healthspan, 1(1), 1. http://doi.org/10.1186/2046-2395-1-1
Lyons, R. A., Perry, I. M., & Littlepage, B. N. C. (1994). Evidence for the Validity of the Short-
form 36 Questionnaire (SF-36) in an Elderly Population. Age and Ageing, 23(3), 182–184.
http://doi.org/10.1093/ageing/23.3.182
McHorney, C. A., Ware, J. E., Lu, J. F. R., & Sherbourne, C. D. (1994). The MOS 36-Item Short-
Form Health Survey (SF-36): III. Tests of Data Quality, Scaling Assumptions, and
Reliability across Diverse Patient Groups. Medical Care, 32(1), 40–66.
Michael, Y. L., Colditz, G. A., Coakley, E., & Kawachi, I. (1999). Health Behaviors, Social
Networks, and Healthy Aging: Cross-Sectional Evidence from the Nurses’ Health Study.
Quality of Life Research, 8(8), 711–722.
Moore, R. C., Moore, D. J., Thompson, W., Vahia, I. V., Grant, I., & Jeste, D. V. (2013). A Case-
Controlled Study of Successful Aging in Older Adults with HIV. The Journal of Clinical
Psychiatry, 74(5), e417–e423. http://doi.org/10.4088/JCP.12m08100

40
National Center for Health Statistics. (2016). Health, United States, 2015: With With Special
Feature on Racial and Ethnic Health Disparities. Hyattsville, Maryland. Retrieved from
http://www.cdc.gov/nchs/data/hus/hus15.pdf
Ortman, J., Velkoff, V., & Hogan, H. (2014). An Aging Nation: The Older Population in the
United States (Current Population Reports No. P25-1140) (p. 28). Washington, DC: U.S.
Census Bureau. Retrieved from http://www.census.gov/prod/2014pubs/p25-1140.pdf
Owram, D. (1996). Born at the right time : a history of the baby-boom generation. Toronto :
University of Toronto Press, c1996.
Panel, Sacco, R. L., Benjamin, E. J., Broderick, J. P., Dyken, M., Easton, J. D., … Wolf, P. A.
(1997). Risk Factors. Stroke, 28(7), 1507–1517. http://doi.org/10.1161/01.STR.28.7.1507
Pruchno, R. A., Wilson-Genderson, M., & Cartwright, F. (2010). A Two-Factor Model of
Successful Aging. The Journals of Gerontology Series B: Psychological Sciences and Social
Sciences, gbq051. http://doi.org/10.1093/geronb/gbq051
Pruchno, R. A., Wilson-Genderson, M., Rose, M., & Cartwright, F. (2010). Successful Aging:
Early Influences and Contemporary Characteristics. The Gerontologist, 50(6), 821–833.
http://doi.org/10.1093/geront/gnq041
Rowe, J. W., & Kahn, R. L. (1987). Human Aging: Usual and Successful. Science, (4811), 143.
Rowe, J. W., & Kahn, R. L. (1997). Successful Aging. The Gerontologist, 37(4), 433–440.
http://doi.org/10.1093/geront/37.4.433
Rowe, J. W., & Kahn, R. L. (2015). Successful Aging 2.0: Conceptual Expansions for the 21st
Century. The Journals of Gerontology Series B: Psychological Sciences and Social Sciences,
gbv025. http://doi.org/10.1093/geronb/gbv025
Sheikh, J. I., & Yesavage, J. A. (1986). Geriatric Depression Scale (GDS): Recent evidence and
development of a shorter version. Clinical Gerontologist: The Journal of Aging and Mental
Health, 5(1–2), 165–173. http://doi.org/10.1300/J018v05n01_09
Shinton, R., & Beevers, G. (1989). Meta-analysis of relation between cigarette smoking and
stroke. BMJ, 298(6676), 789–794. http://doi.org/10.1136/bmj.298.6676.789
Sjögren, J., & Thulin, L. I. (2004). Quality of life in the very elderly after cardiac surgery: a
comparison of SF-36 between long-term survivors and an age-matched population.
Gerontology, 50(6), 407–410. http://doi.org/10.1159/000080179
Strawbridge, W. J., Wallhagen, M. I., & Cohen, R. D. (2002). Successful Aging and Well-Being
Self-Rated Compared With Rowe and Kahn. The Gerontologist, 42(6), 727–733.
http://doi.org/10.1093/geront/42.6.727

41
Tombaugh, T. N., & McIntyre, N. J. (1992). The Mini-Mental State Examination: A
Comprehensive Review. Journal of the American Geriatrics Society, 40(9), 922–935.
http://doi.org/10.1111/j.1532-5415.1992.tb01992.x
Unger, J. B., McAvay, G., Bruce, M. L., Berkman, L., & Seeman, T. (1999). Variation in the
impact of social network characteristics on physical functioning in elderly persons:
MacArthur Studies of Successful Aging. The Journals of Gerontology. Series B,
Psychological Sciences and Social Sciences, 54(5), S245-251.
Walters, S. J., Munro, J. F., & Brazier, J. E. (2001). Using the SF‐36 with older adults: a cross‐sectional community‐based survey. Age and Ageing, 30(4), 337–343.
http://doi.org/10.1093/ageing/30.4.337
Wanderley, F. A. C., Silva, G., Marques, E., Oliveira, J., Mota, J., & Carvalho, J. (2011).
Associations between objectively assessed physical activity levels and fitness and self-
reported health-related quality of life in community-dwelling older adults. Quality of Life
Research, (9), 1371.
Wang, B., He, P., & Dong, B. (2015). Associations between social networks, social contacts, and
cognitive function among Chinese nonagenarians/centenarians. Archives of Gerontology and
Geriatrics, 60(3), 522–527. http://doi.org/10.1016/j.archger.2015.01.002
Wang, V., Depp, C. A., Ceglowski, J., Thompson, W. K., Rock, D., & Jeste, D. V. (2015). Sexual
Health and Function in Later Life: A Population-Based Study of 606 Older Adults with a
Partner. The American Journal of Geriatric Psychiatry, 23(3), 227–233.
http://doi.org/10.1016/j.jagp.2014.03.006
Ware, J. E. (2000). SF-36 health survey update. Spine, 25(24), 3130–3139.
Ware, J. E., Kosinski, M., Bayliss, M. S., McHorney, C. A., Rogers, W. H., & Raczek, A. (1995).
Comparison of Methods for the Scoring and Statistical Analysis of SF-36 Health Profile and
Summary Measures: Summary of Results from the Medical Outcomes Study. Medical Care,
33(4), AS264-AS279.
Ware, J. E., & Sherbourne, C. D. (1992). The MOS 36-Item Short-Form Health Survey (SF-36): I.
Conceptual Framework and Item Selection. Medical Care, 30(6), 47.

42
APPENDICES
FI34.No. Name Description Numeric code
1 adrdz You’ve been told that you have an adrenal disease 0, 1
2 anemia You’ve been told that you have anemia 0, 1
3 angina You’ve been told that you have angina 0, 1
4. asthma You’ve been told that you have asthma 0, 1
5 balance Standing for 10 sec. with one foot behind the other 0, 1a
6 bathing You need assistance when bathing 0, 1
7 bmi Body mass index (BMI) 0, 0.5, 1b
8 bronch You’ve been told that you have bronchitis 0, 1
9 cataracts You’ve been told that you have cataracts 0, 1
10 chair Number of stand-ups from chair without using arms 0, 1c
11 conghrtf You’ve had congestive heart failure 0, 1
12 copd You’ve been told that you have COPD 0, 1
13 diabetes You’ve been told that you have diabetes 0, 1
14 dressing You need assistance when dressing 0, 1
15 emphy You’ve been told that you have emphysema 0, 1
16 feeding You need assistance when eating 0, 1
17 fhoca A first-degree relative has had cancer 0, 1
18 gds Geriatric depression scale (GDS) 0, 0,5, 1d
19 hattack You’ve had a heart attack 0, 1
20 hbp High blood pressure (based on SBP and DBP readings) 0, 0.33, 0.66, 1e
21 hchol You’ve been told that you have high cholesterol 1.00
22 hhbp You have had high blood pressure before 0, 1
23 hrtmur You’ve been told that you have a heart murmur 0, 1
24 hrtprb You’ve been told that you have a heart problem 0, 1
25 kidndz You’ve been told that you have a kidney disease 0, 1
26 liverdz You’ve been told that you have a liver disease 0, 1
27 mmse Mini-mental state exam (MMSE) 0, 0.25, 0.5, 0.75, 1f
28 osteo You’ve been told that you have osteoporosis 0, 1
29 seiz You’ve had a seizure 0, 1
30 selfrated Self-rating of health 0, 0.25, 0.5, 0.75, 1g
31 stroke You’ve had a stroke 0, 1
32 thydz You’ve been told that you have a thyroid disease 0, 1
33 tia You’ve had a TIA 0, 1
34 urininf You’ve been told that you have a urinary infection 0, 1
Notes: Taken from Kim and Jazwinski (2015). COPD/copd, chronic obstructive pulmonary disease; SBP, systolic
blood pressure; DBP, diastolic blood pressure; tia/TIA, transient ischemic attack. All binary variables were coded
numerically: ‘0’ for the absence of the deficit and ‘1’ for its presence except where noted otherwise: a 0 if balanced for 10 seconds, otherwise, 1; b 0 if 18.5≤x<25, where x=weight (kg)/(height in meters)2, 0.5 if 25≤x< 30, otherwise, 1; c 0 if one can stand up from chair at least once, otherwise 1; d 0 if 0<x≤5, where x is the final score of the test, 0.5 if 6<x≤10, 1 if x>10; e 0 if x<80 and y<120, where x=diastolic pressure and y=systolic pressure, 0.33 if 80≤x≤89 or 120≤y≤139, 0.66 if
90≤x≤99 or 140≤y≤159, 1 if x≥100 or y≥160. This coding is based on the categories of blood pressure levels
according to the National Heart Lung and Blood Institute; f 0 if 24≤x, where x is the final score of the test, 0.25 if 20<x<24, 0.5 if 18≤x≤ 20, 0.75 if 10≤x≤17, and 1 if x<10; g 0 = Excellent, 0.25 = Very good, 0.5 = Good, 0.75 = Fair, 1 = Poor
Appendix A: List of 34 Variables Used to Construct Frailty-Index 34

43
Appendix B: List of Questions Used to Construct the Yale Physical Activity Survey
Weekly Energy Expenditure Scores
Activity Time Intensity Code
Hours Minutes
House Work
Offline Shopping (e.g., grocery, clothes) 3.5
Stair climbing while carrying a load 8.5
Laundry – Unloading/loading machine, hanging, folding only 3.0
Laundry – Washing clothes by hand 4.0
Light housework (e.g., tidying, dusting, ironing, sweeping) 3.0
Heavy housework (e.g., vacuuming, mopping, scrubbing floors and walls, moving
furniture) 4.5
Food preparation: chopping, stirring, moving about while cooking/baking 2.5
Food service: Setting table, carrying food, serving food 2.5
Dish washing: clearing the table, washing/drying dishes, putting dishes away 2.5
Light home repair: small appliance repair, light home repair 3.0
Heavy home repair: painting, carpentry, washing/polishing car 5.5
Other:
Yard Work
Gardening, pruning, planting, weeding, digging, hoeing 4.5
Lawn mowing (walking only) 4.5
Clearing walks/driveways: sweeping, shoveling, raking 5.0
Other:
Caretaking
Older or disabled person (lifting, pushing wheelchair) 5.5
Child care (lifting, carrying, pushing stroller) 4.0
Exercise
Brisk walking 6.0
Pool exercises, stretching, yoga 3.0
Vigorous calisthenics, aerobics 6.0
Cycling 6.0
Swimming (laps only) 6.0
Other:
Recreation Hours Minutes Intensity Code
Leisurely / slow walking 3.5
Needlework: knitting, sewing, needlepoint, etc. 1.5
Dancing: line, ballroom, tap, square, etc. 5.5
Bowling 3.0
Golf 5.0
Racquet sports: tennis, squash, badminton 7.0
Billiards 2.5
Other:
Notes: Taken from Dipietro, Caspersen, Ostfeld, & Nadel, 1993.

44
Medical Outcomes Study Questionnaire Short Form 36 Health Survey
This survey asks for your views about your health. This information will help keep track of
how you feel and how well you are able to do your usual activities. Thank you for completing this survey! For each of the following questions, please circle the number that best describes your answer.
1. In general, would you say your health
is:
Excellent 1
Very good 2
Good 3
Fair 4
Poor 5
2. Compared to one year ago,
Much better now than one year ago 1
Somewhat better now than one year ago 2
About the same 3
Somewhat worse now than one year ago 4
Much worse now than one year ago 5
3. The following items are about activities you might do during a typical day. Does your health now limit you in these activities? If so, how much? (Circle One Number on Each Line)
Yes, Yes, No, Not
Limited Limited Limited
a a At
Lot (1) Little All (3)
(2)
a. Vigorous activities, such as running, lifting 1 2 3
heavy objects, participating in strenuous sports
b. Moderate activities, such as moving a table, 1 2 3
pushing a vacuum cleaner, bowling, or playing
Golf
c. Lifting or carrying groceries 1 2 3
Appendix C - List of questions used to construct the Medical Outcomes Study
Questionnaire Short Form 36 Health Survey (from Ware & Sherbourne, 1992; Ware,
2000)

45
d. Climbing several flights of stairs 1 2 3
e. Climbing one flight of stairs 1 2 3
f. Bending, kneeling, or stooping 1 2 3
g. Walking more than a mile 1 2 3
h. Walking several blocks 1 2 3
i. Walking one block 1 2 3
j. Bathing or dressing yourself 1 2 3
4. During the past 4 weeks, have you had any of the following problems with your work or other regular daily activities as a result of your physical health? (Circle One Number on Each Line)
Yes No
(1) (2)
a. Cut down the amount of time you spent on work or other 1 2
activities
b. Accomplished less than you would like 1 2
c. Were limited in the kind of work or other activities 1 2
d. Had difficulty performing the work or other activities (for 1 2
example, it took extra effort)
5. During the past 4 weeks, have you had any of the following problems with your work or other regular daily activities as a result of any emotional problems (such as feeling depressed or anxious)? (Circle One Number on Each Line)
Yes No
a. Cut down the amount of time you spent on work or other 1 2
activities
b. Accomplished less than you would like 1 2
c. Didn't do work or other activities as carefully as usual 1 2
6. During the past 4 weeks, to what extent has your physical
health or emotional problems interfered with your normal
social activities with family, friends, neighbors, or groups?
Not at all 1
Slightly 2
Moderately 3
Quite a bit 4
Extremely 5

46
7. How much bodily pain have you had during the past 4
weeks?
None 1
Very mild 2
Mild 3
Moderate 4
Severe 5
Very severe 6
8. During the past 4 weeks, how much did pain interfere with
your normal work (including both work outside the home and
housework)?
Not at all 1
A little bit 2
Moderately 3
Quite a bit 4
Extremely 5
These questions are about how you feel and how things have been with you during the past 4
weeks. For each question, please give the one answer that comes closest to the way you have been feeling. (Circle One Number on Each Line)
9. How much of the time during the past 4 weeks . . .
All of Most A Some A None
the of Good of Little of
Time the Bit of the of the the
Time the Time Time Time
Time
a. Did you feel full of pep? 1 2 3 4 5 6
b. Have you been a very 1 2 3 4 5 6
nervous person?
c. Have you felt so down in 1 2 3 4 5 6
the dumps that nothing
could cheer you up?
d. Have you felt calm and 1 2 3 4 5 6
peaceful?
e. Did you have a lot of 1 2 3 4 5 6
energy?

47
All Most A Some A None
of of Good of Little of
the the Bit of the of the the
Time Time the Time Time Time
Time
f. Have you felt 1 2 3 4 5 6
downhearted and blue?
g. Did you feel worn out? 1 2 3 4 5 6
h. Have you been a happy 1 2 3 4 5 6
person?
i. Did you feel tired? 1 2 3 4 5 6
10. During the past 4 weeks, how much of the time has your
physical health or emotional problems interfered with your
social activities (like visiting with friends, relatives, etc.)?
(Circle One Number)
All of the time 1
Most of the time 2
Some of the time 3
A little of the time 4
None of the time 5
11. How TRUE or FALSE is each of the following statements for you. (Circle
One Number on Each Line)
Definitely Mostly Don't Mostly Definitely
True True Know False False
a. I seem to get sick a little 1 2 3 4 5
easier than other people b. I am as healthy as
1
2
3
4
5
anybody I know
c. I expect my health to get 1 2 3 4 5
worse
d. My health is excellent 1 2 3 4 5
Notes: Taken from McHorney, C. A., Ware, J. E., Lu, J. F. R., & Sherbourne, C. D. (1994).

48
VITA
Katie E. Stanko is a third year student in the Cognitive and Brain Sciences doctoral program
at Louisiana State University, Baton Rouge, Louisiana. She received her bachelor’s degrees in
psychology and criminology from Indiana University of Pennsylvania, Indiana, Pennsylvania, in
2014. Her research interests include successful aging, older adults’ response to long-term stress,
trauma, and disaster, and cognitive epidemiology.