Embed Size (px)
Citation preview

2018 annual report
Our formula for successHormel Foods Corporation
1 Hormel PlaceAustin, MN 55912-3680
www.hormelfoods.com
Inspired by the food we make and the difference we can make in this world
Investing in our people and partners
Improving communities and the world
Creating products that improve the lives of our customers
Bold Thinking. Bold Innovation. Bold Ideas.“ We know that building social value and creating economic value are not competing goals. While Our Path Forward is our compass, Our Food Journey™ is our North Star.”
James P. Snee Chairman of the Board, President and Chief Executive Officer
We are a company unlike any other, one that truly understands our position in the world and the difference we can make. While we are committed to many worthy causes, it is our core business — efficiently producing delicious and safe food for the world’s growing population — that makes us most proud. Having fed America and the world for over 125 years, we know that building social value and creating economic value are not competing goals.
To learn more, visit hormelfoods.com/our-food-journey
E Printed on recycled paper
Horm
el Foods Corporation 2018 annual report
239810_Report_B.indd 1 12/7/18 1:01 PM
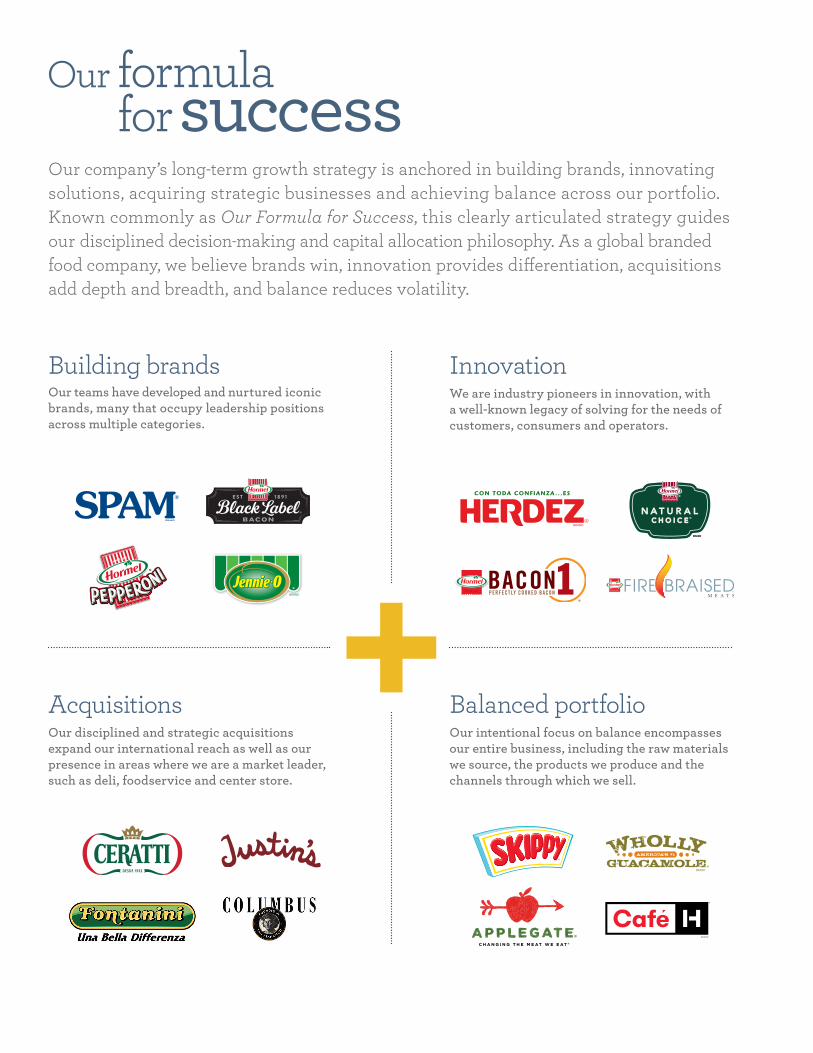
Building brandsOur teams have developed and nurtured iconic brands, many that occupy leadership positions across multiple categories.
Our company’s long-term growth strategy is anchored in building brands, innovating solutions, acquiring strategic businesses and achieving balance across our portfolio. Known commonly as Our Formula for Success, this clearly articulated strategy guides our disciplined decision-making and capital allocation philosophy. As a global branded food company, we believe brands win, innovation provides differentiation, acquisitions add depth and breadth, and balance reduces volatility.
InnovationWe are industry pioneers in innovation, with a well-known legacy of solving for the needs of customers, consumers and operators.
AcquisitionsOur disciplined and strategic acquisitions expand our international reach as well as our presence in areas where we are a market leader, such as deli, foodservice and center store.
Balanced portfolioOur intentional focus on balance encompasses our entire business, including the raw materials we source, the products we produce and the channels through which we sell.
BRAND
BRAND
®
Our formula for success
1
Jim Snee Chairman of the Board, President and Chief Executive Officer
Dear fellow shareholders:We continue to distinguish ourselves as a different kind of company. Hormel Foods is differentiated from ag companies, commodity companies and consumer-packaged-goods companies. We are unlike any other food company in the world — so much so — we created our own category. We are a global branded food company.
As a global branded food company and a leader in the food space, it is our responsibility to recognize and respond to trends and changes in the industry. Today, change is happening at a faster rate than ever before. We like to say change will never be this slow again. Consumers can now find an amazing array of products to put in their physical and online shopping carts. The line between retail and foodservice is blurring with the advent of grocerants, online shopping and home delivery. Consumers can now make restaurant-quality meals with fresh food shipped directly to their homes. Change is exciting, and Hormel Foods is on the cutting edge of these trends.
Constant change requires us to think differently and more boldly in order to stay relevant. In fact, adapting to change is so important to us, it is one of the seven Cultural Beliefs® we want every team member in the company to hold.
CHALLENGE YOURSELF I embrace change, innovation and strategic risk taking.
Over our 127-year history, Hormel Foods has undergone dramatic change, but some things haven’t changed at all. The values that made us successful — our core culture, a spirit of innovation and brand stewardship — have not, and will not, change.
Our formulaOur formula for adapting to change and driving shareholder value — what we call Our Formula for Success — is exceedingly simple, yet difficult to replicate. It has four ingredients: (1) Building strong brands that customers, consumers and operators trust; (2) Relentlessly pursuing innovations that are relevant in the marketplace;
(3) Making strategic and disciplined acquisitions; and (4) Creating intentional balance in our business model. This path is not linear, and there are milestones that demonstrate the progress we have made along the way.
Building brands: One important milestone is our brand presence. When you walk through your local grocery store or shop online, you will see over 40 categories where a Hormel Foods brand holds a No. 1 or No. 2 share. There aren’t many places in a grocery store where you don’t encounter a Hormel Foods brand. Even with shoppers changing where and how they buy their food, we believe consumers and operators will continue to choose brands they know and trust. Building strong brands has never been more important. For this reason, we increased advertising
and promotional support for brands like SPAM®, Skippy®, Justin’s®, Jennie-O®, Hormel® Natural Choice® and Applegate®. I’m confident our leadership position in branded food will afford us opportunities that other companies will not have.
Innovation: Innovation is in our DNA. Fiscal 2018 was a testament to this fact as we received a record number of awards for our innovative new items. Nine different products, including Hormel® Natural Choice® stacks and Applegate Naturals® peppered Genoa salami, were named as best new items by Progressive Grocer Magazine. Also, the Grocery Manufacturers Association recognized Herdez® guacamole salsa for innovation and creativity in the food space. Our innovators, food scientists, engineers and brand managers work hard every day to deliver the next wave of exciting new products to the marketplace. We continue to make excellent progress toward our goal of having 15 percent of sales in the year 2020 generated from products created in the last five years. At the end of 2018, over 14 percent of sales came from innovative new items.
Strategic acquisitions: The acquisition of Columbus Craft Meats in November 2017 is meeting our expectations. Columbus has an outstanding reputation and is a great business that has served as a catalyst to unite our deli businesses across the enterprise. We are always on the lookout for other food companies that deepen and broaden our position as a global branded food company. Finding and closing on acquisitions is never easy, but we have had recent success and will work to add more brands to our portfolio in 2019.
Balanced-business model: Our ability to bring strategic balance to our business is an important fundamental and often comes with difficult decisions. This year we announced the sale of the Fremont processing facility, which allowed us to forego major capital investments,
reduce earnings volatility and ensure a steady supply of raw materials for our value-added products. Most importantly, this agreement provides a seamless transition for the 1,500 people who work there.
Capital managementIn 2018 we invested $390 million in capital, the largest capital investment in our history. Much of this went toward value-added production capacity for businesses such as Jennie-O Turkey Store and Hormel Foodservice. As mentioned earlier, we completed the $857 million acquisition of Columbus, the largest in our history.
Strong cash flow allowed us to return over $388 million in dividends at an annual rate of $0.75 per share. Fiscal 2019 will represent the 53rd consecutive year of dividend increases as we increased our dividend by 12% to $0.84 per share.
At the end of 2017, the Tax Cuts and Jobs Act was signed into law. The passing of tax reform decreased our federal statutory tax rate from 35 percent to 21 percent, increasing our cash flow by well over $100 million. We intend to use these tax benefits to continue making strategic and disciplined investments in our brands, facilities and team members. This year we were also excited to grant universal stock options to our 20,000 team members.
OutlookFiscal 2019 represents a year of capturing the benefits from investments we made in both capital expenditures and acquisitions. Our new deli division will have its inaugural
2
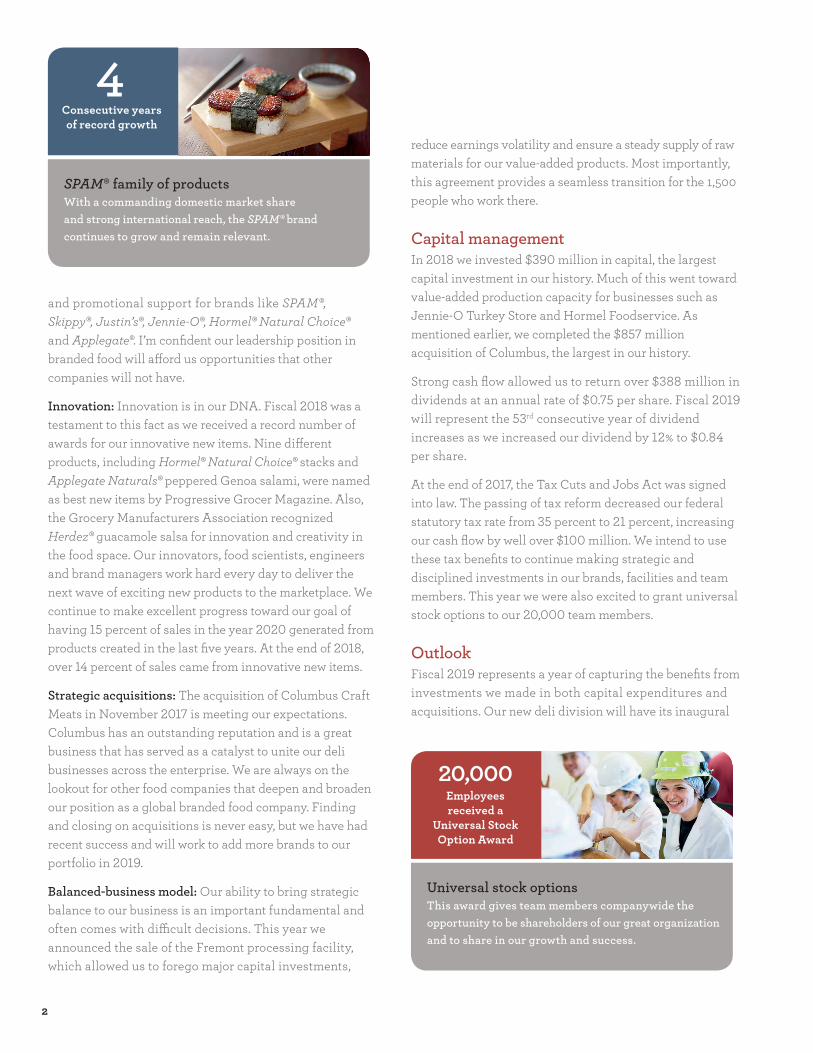
4 Consecutive years of record growth
SPAM® family of products With a commanding domestic market share and strong international reach, the SPAM® brand continues to grow and remain relevant.
20,000 Employees received a
Universal Stock Option Award
Universal stock options This award gives team members companywide the opportunity to be shareholders of our great organization and to share in our growth and success.
3
year and we are excited to start production in our new state-of-the-art facilities in Melrose, Minn., and Wichita, Kan.
The emphasis we place on growing branded value-added products has never been stronger, and we expect meaningful sales gains from each segment in 2019. We also expect earnings growth from all four segments, led by brands such as Wholly Guacamole®, Applegate®, Jennie-O® and SPAM®.
Senior leadership and board member changesI often speak about the exceptional leadership within our company, including our leadership team and board of directors. We announced several retirements and advancements this year. In November 2017, Glenn Leitch was named to the new position of executive vice president of supply chain. Succeeding Glenn, Steve Lykken was named senior vice president and president of Jennie-O Turkey Store.
In February 2018, Jeff Baker was named group vice president of deli and will lead our newly-formed deli division. As a result of Jeff’s advancement, Mark Ourada was named group vice president of foodservice. Following Mark’s promotion, David Weber was named vice president of foodservice sales and Jeff Frank was named vice president of foodservice marketing.
In May 2018, Steve Binder, executive vice president and president of Hormel Business Units, retired after 38 years of service to our company. Steve was an important
leadership force within Hormel Foods and achieved a great track record of success throughout his career. Subsequent to Steve’s retirement, Tom Day advanced to executive vice president of Refrigerated Foods. Don Kremin, group vice president of Specialty Foods, retired in August 2018 after a successful 34-year career with our company, spanning across multiple business units.
John (Jack) Morrison, managing director of Goldner Hawn Johnson & Morrison, served on our board from 2003 to January 2018. Jack’s valuable input and insights into our business will be missed. In November 2018, Bill Newlands, president and chief executive officer elect for Constellation Brands, was elected to our board of directors. Bill is a highly regarded business leader with significant experience in innovation, corporate development, consumer product marketing and international business. Bill will be a great addition to our exceptional and dynamic slate of directors.
Inspired People. Inspired Food.™We like to say that Hormel Foods is an uncommon company. Hormel Foods is unique in so many ways — 80 years of distributing annual profit sharing for our employees, 90 consecutive years of paying a quarterly dividend, an average of 26 years of tenure on our senior management team, 29 out of 33 years of growing earnings and the list goes on.
We are uncommon people delivering uncommon results — and it is getting noticed. This year we were ranked No. 16 on the list of 100 Best Corporate Citizens, ranked No. 8 among the most admired food companies in the world by Fortune magazine and recognized by Forbes as one of the world’s best employers. We truly have a group of inspired people making inspired food.
To our shareholders and employees across the world, thank you for joining us on Our Food Journey™. None of this happens without you.
James P. SneeChairman of the Board, President and Chief Executive Officer
90 Consecutive
years of quarterly dividends
Dividends As of the August dividend payment, the company has paid uninterrupted quarterly dividends for the last 360 quarters, dating back to 1928.
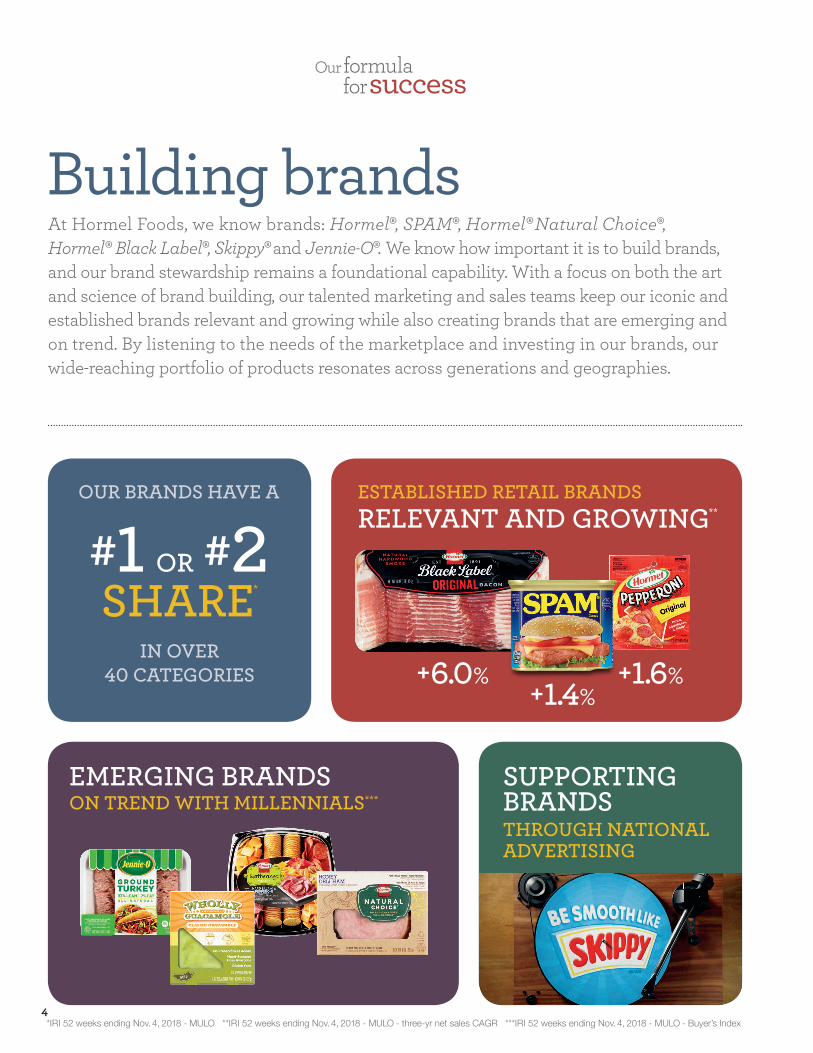
Building brandsAt Hormel Foods, we know brands: Hormel®, SPAM®, Hormel® Natural Choice®, Hormel® Black Label®, Skippy® and Jennie-O®. We know how important it is to build brands, and our brand stewardship remains a foundational capability. With a focus on both the art and science of brand building, our talented marketing and sales teams keep our iconic and established brands relevant and growing while also creating brands that are emerging and on trend. By listening to the needs of the marketplace and investing in our brands, our wide-reaching portfolio of products resonates across generations and geographies.
+1.4% +6.0% +1.6%
SHARE* #1 OR #2
OUR BRANDS HAVE A
IN OVER 40 CATEGORIES
4*IRI 52 weeks ending Nov. 4, 2018 - MULO **IRI 52 weeks ending Nov. 4, 2018 - MULO - three-yr net sales CAGR ***IRI 52 weeks ending Nov. 4, 2018 - MULO - Buyer’s Index
Our formula for success
ESTABLISHED RETAIL BRANDSRELEVANT AND GROWING**
EMERGING BRANDS ON TREND WITH MILLENNIALS***
SUPPORTING BRANDS THROUGH NATIONAL ADVERTISING
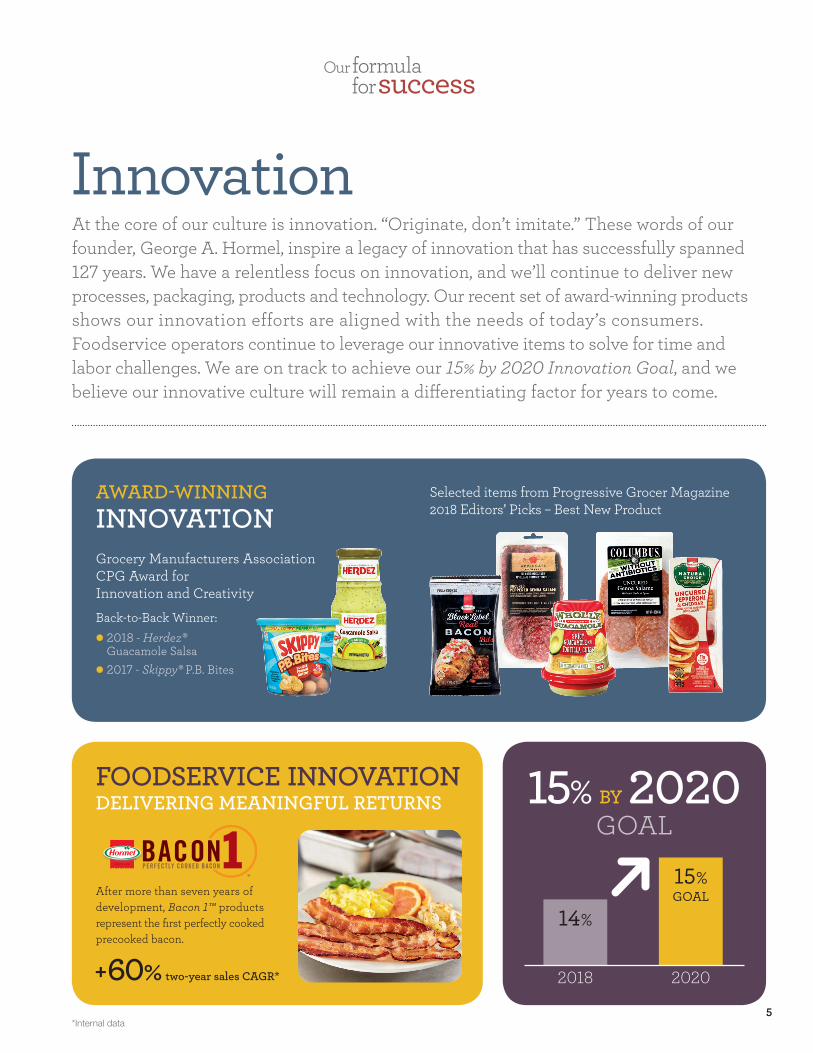
InnovationAt the core of our culture is innovation. “Originate, don’t imitate.” These words of our founder, George A. Hormel, inspire a legacy of innovation that has successfully spanned 127 years. We have a relentless focus on innovation, and we’ll continue to deliver new processes, packaging, products and technology. Our recent set of award-winning products shows our innovation efforts are aligned with the needs of today’s consumers. Foodservice operators continue to leverage our innovative items to solve for time and labor challenges. We are on track to achieve our 15% by 2020 Innovation Goal, and we believe our innovative culture will remain a differentiating factor for years to come.
INSIGHT-DRIVEN INNOVATION
After more than seven years of development, Bacon 1™ products represent the first perfectly cooked precooked bacon.
5
+60% two-year sales CAGR*
15% BY 2020GOAL
2018 2020
14%
15%GOAL
Grocery Manufacturers Association CPG Award for Innovation and Creativity
Back-to-Back Winner:• 2018 - Herdez®
Guacamole Salsa • 2017 - Skippy® P.B. Bites
Selected items from Progressive Grocer Magazine 2018 Editors’ Picks – Best New Product
*Internal data
Our formula for success
AWARD-WINNING INNOVATION
FOODSERVICE INNOVATION DELIVERING MEANINGFUL RETURNS
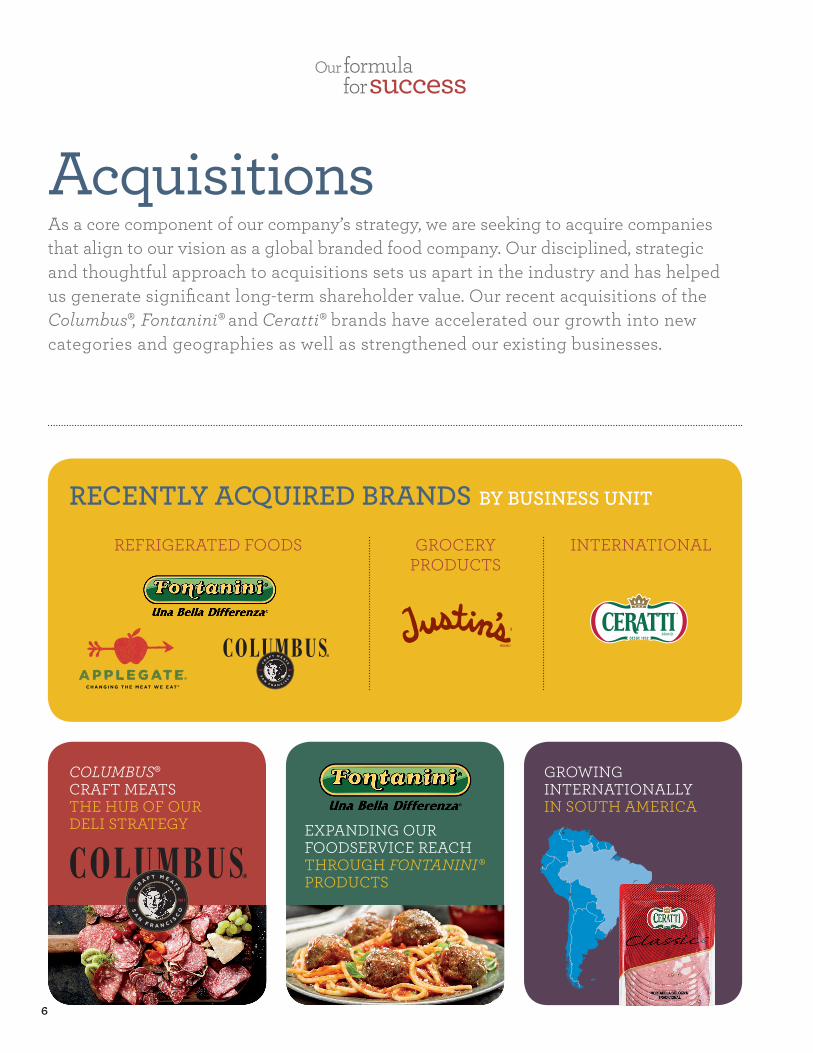
AcquisitionsAs a core component of our company’s strategy, we are seeking to acquire companies that align to our vision as a global branded food company. Our disciplined, strategic and thoughtful approach to acquisitions sets us apart in the industry and has helped us generate significant long-term shareholder value. Our recent acquisitions of the Columbus®, Fontanini® and Ceratti® brands have accelerated our growth into new categories and geographies as well as strengthened our existing businesses.
6
INTERNATIONAL
COLUMBUS® CRAFT MEATSTHE HUB OF OUR DELI STRATEGY EXPANDING OUR
FOODSERVICE REACH THROUGH FONTANINI® PRODUCTS
GROWING INTERNATIONALLY IN SOUTH AMERICA
REFRIGERATED FOODS
BRAND
®
GROCERY PRODUCTS
BRAND
RECENTLY ACQUIRED BRANDS BY BUSINESS UNIT
Our formula for success
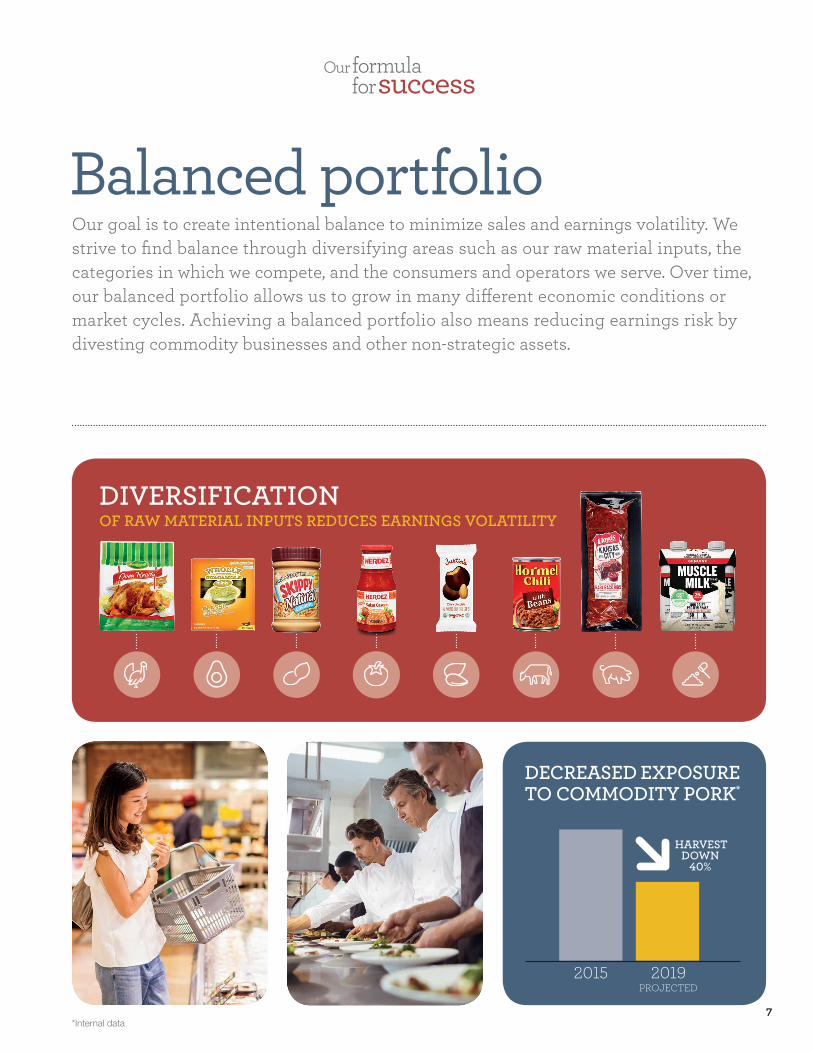
Balanced portfolioOur goal is to create intentional balance to minimize sales and earnings volatility. We strive to find balance through diversifying areas such as our raw material inputs, the categories in which we compete, and the consumers and operators we serve. Over time, our balanced portfolio allows us to grow in many different economic conditions or market cycles. Achieving a balanced portfolio also means reducing earnings risk by divesting commodity businesses and other non-strategic assets.
7
DECREASED EXPOSURE TO COMMODITY PORK*
*Internal data
DIVERSIFICATION OF RAW MATERIAL INPUTS REDUCES EARNINGS VOLATILITY
HARVEST DOWN
40%
2015 2019PROJECTED
Our formula for success
8
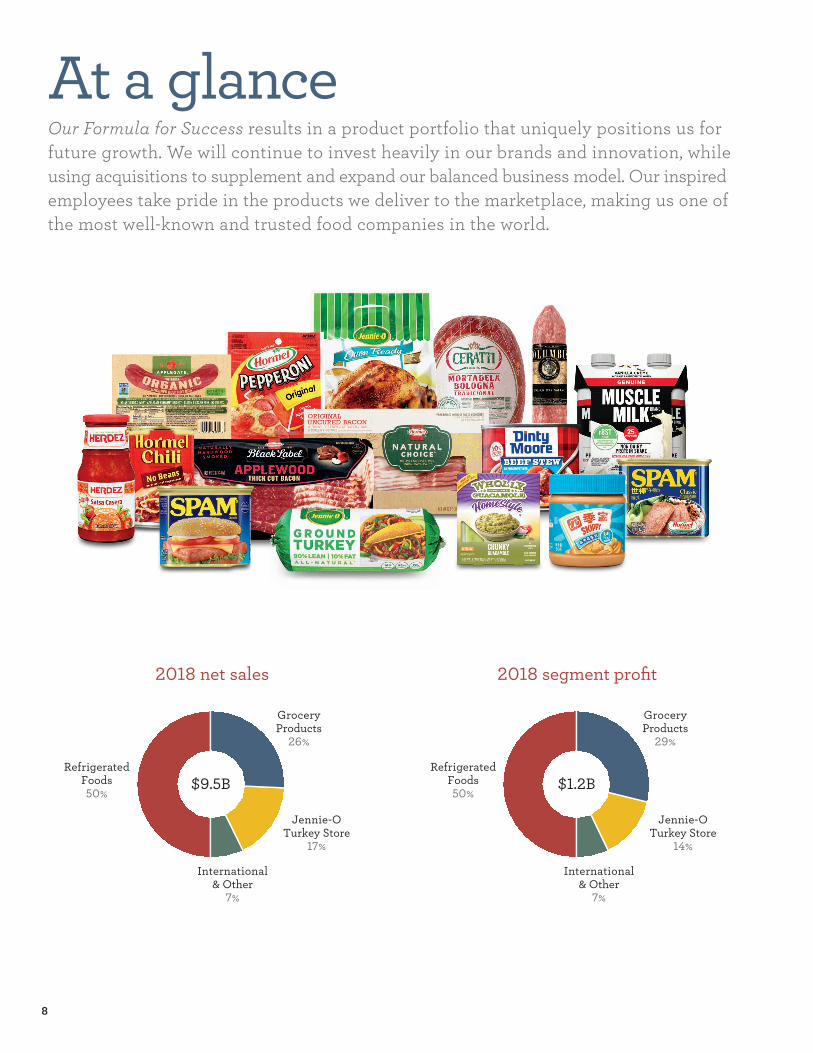
2018 net sales
RefrigeratedFoods50%
GroceryProducts
26%
Jennie-OTurkey Store
17%
International& Other
7%
2018 segment profit
RefrigeratedFoods50%
GroceryProducts
29%
Jennie-OTurkey Store
14%
International& Other
7%
$9.5B $1.2B
At a glanceOur Formula for Success results in a product portfolio that uniquely positions us for future growth. We will continue to invest heavily in our brands and innovation, while using acquisitions to supplement and expand our balanced business model. Our inspired employees take pride in the products we deliver to the marketplace, making us one of the most well-known and trusted food companies in the world.
9
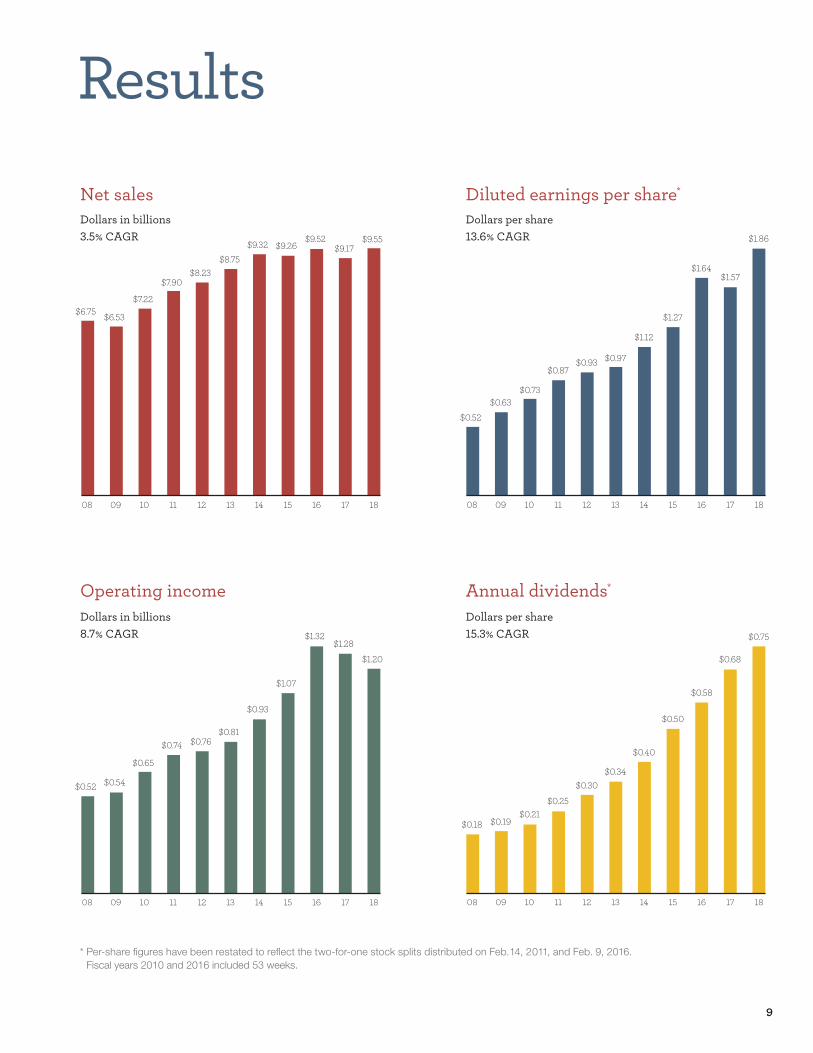
Results
* Per-share figures have been restated to reflect the two-for-one stock splits distributed on Feb. 14, 2011, and Feb. 9, 2016. Fiscal years 2010 and 2016 included 53 weeks.
Diluted earnings per share*
Dollars per share13.6% CAGR
Net salesDollars in billions 3.5% CAGR
Operating incomeDollars in billions8.7% CAGR
Annual dividends*
Dollars per share15.3% CAGR
Results
$0.52
$0.63$0.73
$0.87$0.93 $0.97
$1.12
$1.27
$1.64$1.57
$1.86
$0.18 $0.19$0.21
$0.25
$0.30$0.34
$0.40
$0.50
$0.58
$0.68
$0.75
$6.75 $6.53
$7.22
$7.90$8.23
$8.75
$9.32 $9.26$9.52
$9.17$9.55
$0.52 $0.54
$0.65
$0.74 $0.76$0.81
$0.93
$1.07
$1.32$1.28
$1.20
10 11 12 13 14 15 16 17 18090810 11 12 13 14 15 16 17 180908
10 11 12 13 14 15 16 17 18090810 11 12 13 14 15 16 17 180908
* Per share figures have been restated to reflect the two-for-one stock splits distributed on February 14, 2011, and February 9, 2016. Fiscal years 2010 and 2016 included 53 weeks.
10
* $100 invested on Oct. 28, 2013, in stock or index – including reinvestment of dividends.
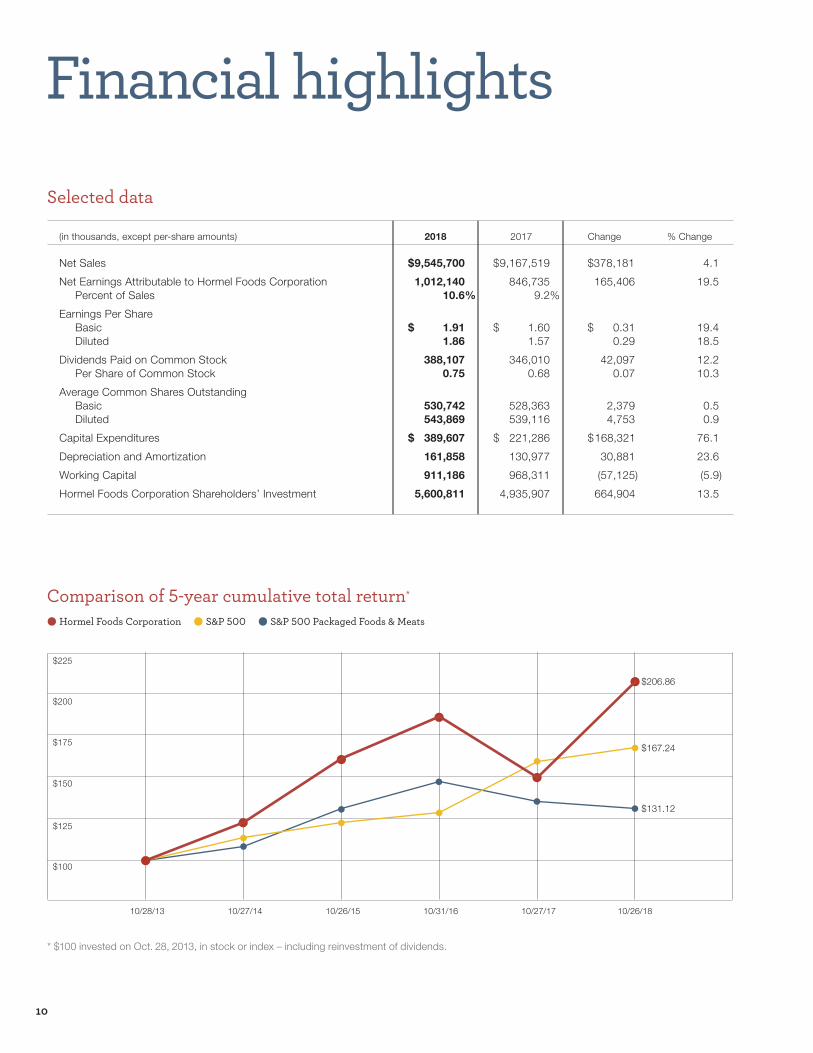
Selected data
(in thousands, except per-share amounts) 2018 2017 Change % Change
Net Sales $ 9,545,700 $ 9,167,519 $ 378,181 4.1
Net Earnings Attributable to Hormel Foods Corporation 1,012,140 846,735 165,406 19.5 Percent of Sales 10.6% 9.2%
Earnings Per Share Basic $ 1.91 $ 1.60 $ 0.31 19.4 Diluted 1.86 1.57 0.29 18.5
Dividends Paid on Common Stock 388,107 346,010 42,097 12.2 Per Share of Common Stock 0.75 0.68 0.07 10.3
Average Common Shares Outstanding Basic 530,742 528,363 2,379 0.5 Diluted 543,869 539,116 4,753 0.9
Capital Expenditures $ 389,607 $ 221,286 $ 168,321 76.1
Depreciation and Amortization 161,858 130,977 30,881 23.6
Working Capital 911,186 968,311 (57,125) (5.9)
Hormel Foods Corporation Shareholders’ Investment 5,600,811 4,935,907 664,904 13.5
Financial highlights
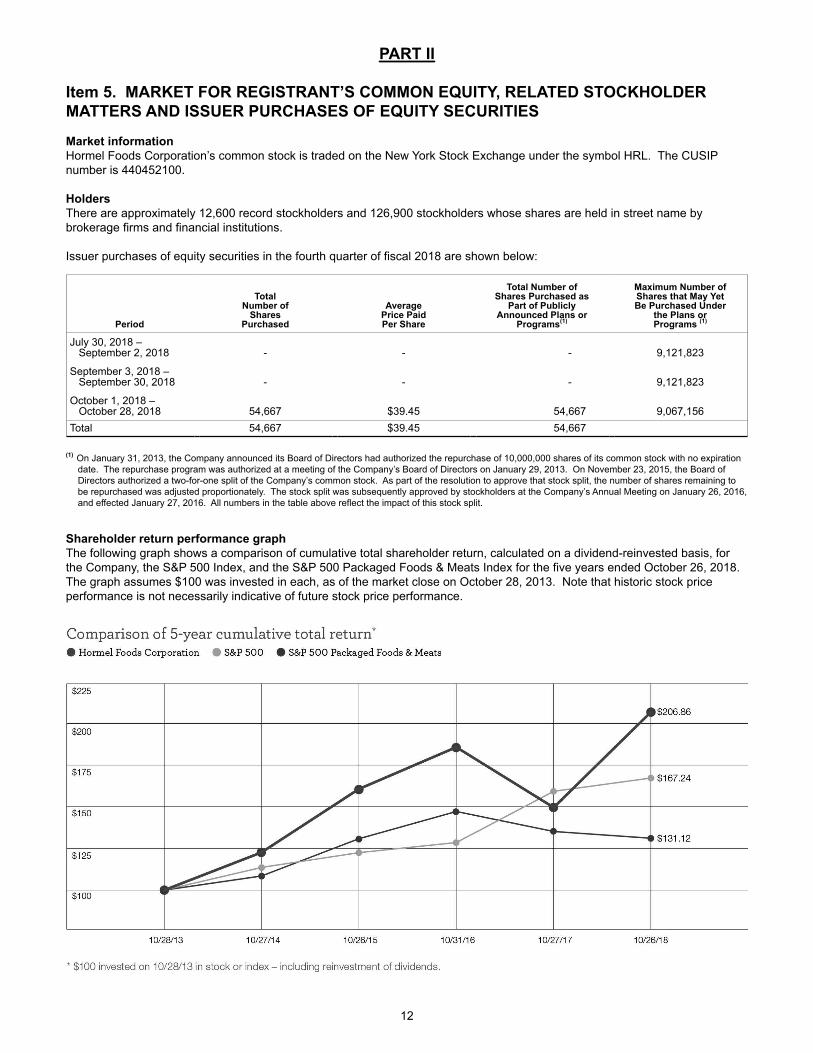
* $100 invested on Oct. 28, 2013 in stock or index – including reinvestment of dividends.
Comparison of 5-year cumulative total return* Hormel Foods Corporation S&P 500 S&P 500 Packaged Foods & Meats
$131.12
$167.24
$206.86
$225
$175
$200
$150
$125
$100
10/28/13 10/27/14 10/26/15 10/31/16 10/27/17 10/26/18

Form 10-KFor the fiscal year ended Oct. 28, 2018
2018
1
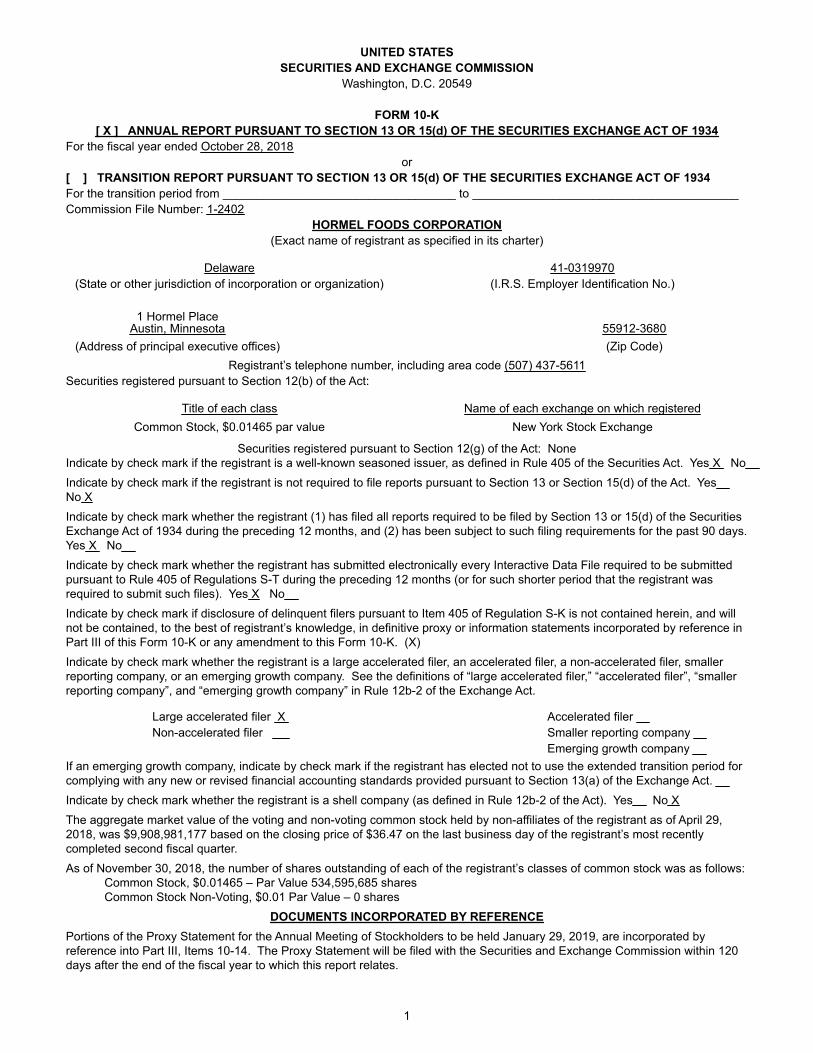
UNITED STATESSECURITIES AND EXCHANGE COMMISSION
Washington, D.C. 20549
FORM 10-K[ X ] ANNUAL REPORT PURSUANT TO SECTION 13 OR 15(d) OF THE SECURITIES EXCHANGE ACT OF 1934
For the fiscal year ended October 28, 2018or
[ ] TRANSITION REPORT PURSUANT TO SECTION 13 OR 15(d) OF THE SECURITIES EXCHANGE ACT OF 1934For the transition period from ___________________________________ to ________________________________________Commission File Number: 1-2402
HORMEL FOODS CORPORATION(Exact name of registrant as specified in its charter)
Delaware 41-0319970(State or other jurisdiction of incorporation or organization) (I.R.S. Employer Identification No.)
1 Hormel PlaceAustin, Minnesota 55912-3680
(Address of principal executive offices) (Zip Code)Registrant’s telephone number, including area code (507) 437-5611
Securities registered pursuant to Section 12(b) of the Act:
Title of each class Name of each exchange on which registeredCommon Stock, $0.01465 par value New York Stock Exchange
Securities registered pursuant to Section 12(g) of the Act: NoneIndicate by check mark if the registrant is a well-known seasoned issuer, as defined in Rule 405 of the Securities Act. Yes X No Indicate by check mark if the registrant is not required to file reports pursuant to Section 13 or Section 15(d) of the Act. Yes No XIndicate by check mark whether the registrant (1) has filed all reports required to be filed by Section 13 or 15(d) of the Securities Exchange Act of 1934 during the preceding 12 months, and (2) has been subject to such filing requirements for the past 90 days. Yes X No Indicate by check mark whether the registrant has submitted electronically every Interactive Data File required to be submitted pursuant to Rule 405 of Regulations S-T during the preceding 12 months (or for such shorter period that the registrant was required to submit such files). Yes X No Indicate by check mark if disclosure of delinquent filers pursuant to Item 405 of Regulation S-K is not contained herein, and will not be contained, to the best of registrant’s knowledge, in definitive proxy or information statements incorporated by reference in Part III of this Form 10-K or any amendment to this Form 10-K. (X)Indicate by check mark whether the registrant is a large accelerated filer, an accelerated filer, a non-accelerated filer, smaller reporting company, or an emerging growth company. See the definitions of “large accelerated filer,” “accelerated filer”, “smaller reporting company”, and “emerging growth company” in Rule 12b-2 of the Exchange Act.
Large accelerated filer X Accelerated filer Non-accelerated filer Smaller reporting company
Emerging growth company If an emerging growth company, indicate by check mark if the registrant has elected not to use the extended transition period for complying with any new or revised financial accounting standards provided pursuant to Section 13(a) of the Exchange Act. Indicate by check mark whether the registrant is a shell company (as defined in Rule 12b-2 of the Act). Yes No XThe aggregate market value of the voting and non-voting common stock held by non-affiliates of the registrant as of April 29, 2018, was $9,908,981,177 based on the closing price of $36.47 on the last business day of the registrant’s most recently completed second fiscal quarter.As of November 30, 2018, the number of shares outstanding of each of the registrant’s classes of common stock was as follows:
Common Stock, $0.01465 – Par Value 534,595,685 sharesCommon Stock Non-Voting, $0.01 Par Value – 0 shares
DOCUMENTS INCORPORATED BY REFERENCEPortions of the Proxy Statement for the Annual Meeting of Stockholders to be held January 29, 2019, are incorporated by reference into Part III, Items 10-14. The Proxy Statement will be filed with the Securities and Exchange Commission within 120 days after the end of the fiscal year to which this report relates.
HORMEL FOODS CORPORATIONTABLE OF CONTENTS
PART I
Item 1. BUSINESS 3
Item 1A. RISK FACTORS 7
Item 1B. UNRESOLVED STAFF COMMENTS 9
Item 2. PROPERTIES 9
Item 3. LEGAL PROCEEDINGS 11
Item 4. MINE SAFETY DISCLOSURES 11
PART II
Item 5. MARKET FOR REGISTRANT’S COMMON EQUITY, RELATED STOCKHOLDERMATTERS AND ISSUER PURCHASES OF EQUITY SECURITIES
12
Item 6. SELECTED FINANCIAL DATA 13
Item 7. MANAGEMENT’S DISCUSSION AND ANALYSIS OF FINANCIAL CONDITION ANDRESULTS OF OPERATIONS
14
Item 7A. QUANTITATIVE AND QUALITATIVE DISCLOSURES ABOUT MARKET RISK 29
Item 8. FINANCIAL STATEMENTS AND SUPPLEMENTARY DATA 30
Item 9. CHANGES IN AND DISAGREEMENTS WITH ACCOUNTANTS ON ACCOUNTING ANDFINANCIAL DISCLOSURE
67
Item 9A. CONTROLS AND PROCEDURES 68
Item 9B. OTHER INFORMATION 68
PART III
Item 10. DIRECTORS, EXECUTIVE OFFICERS AND CORPORATE GOVERNANCE 68
Item 11. EXECUTIVE COMPENSATION 68
Item 12. SECURITY OWNERSHIP OF CERTAIN BENEFICIAL OWNERS AND MANAGEMENTAND RELATED STOCKHOLDER MATTERS
69
Item 13. CERTAIN RELATIONSHIPS AND RELATED TRANSACTIONS, AND DIRECTORINDEPENDENCE
69
Item 14. PRINCIPAL ACCOUNTING FEES AND SERVICES 69
PART IV
Item 15. EXHIBITS, FINANCIAL STATEMENT SCHEDULES 69
Item 16. FORM 10-K SUMMARY 73
SIGNATURES 74
2
3
PART IItem 1. BUSINESS
(a) General Development of Business Hormel Foods Corporation, a Delaware corporation (the Company), was founded by George A. Hormel in 1891 in Austin, Minnesota, as Geo. A. Hormel & Company. The Company started as a processor of meat and food products and continues in this line of business. The Company’s name was changed to Hormel Foods Corporation on January 31, 1995. The Company is primarily engaged in the production of a variety of meat and food products and the marketing of those products throughout the United States and internationally. Although pork and turkey remain the major raw materials for its products, the Company has emphasized for several years the manufacturing and distribution of branded, value-added consumer items rather than the commodity fresh meat business. The Company has continually expanded its product portfolio through organic growth, new product development, and acquisitions. Internationally, the Company markets its products through Hormel Foods International Corporation (HFIC), a wholly owned subsidiary. HFIC has a global presence in the international marketplace through joint ventures and placement of personnel in strategic foreign locations such as Australia, Brazil, Canada, China, Japan, and the Philippines. HFIC has a minority position in a food company in the Philippines (The Purefoods-Hormel Company, Inc., 40% holding). On August 16, 2018, the Company entered into a definitive agreement to sell its Fremont, Nebraska, processing facility to WholeStone Farms, LLC. The transaction is subject to customary closing conditions and is expected to be completed in December 2018.
On November 27, 2017, the Company acquired Columbus Manufacturing, Inc. (Columbus), an authentic premium deli meat and salami company, from Chicago-based Arbor Investments, for $857.4 million. The transaction was funded with cash on hand along with borrowing $375.0 million under a term loan facility and $375.0 million under a revolving credit facility. Columbus specializes in authentic premium deli meat and salami and allows the Company to enhance its scale in the deli by broadening its portfolio of products, customers, and consumers. On August 22, 2017, the Company acquired Cidade do Sol (Ceratti) for a purchase price of $103.3 million. The transaction was funded by the Company with cash on hand. The acquisition of the Ceratti® brand allows the Company to establish a full in-country presence in the fast-growing Brazilian market with a premium brand. On August 16, 2017, the Company acquired Fontanini Italian Meats and Sausages (Fontanini), a branded foodservice business, from Capitol Wholesale Meats, Inc. for a purchase price of $425.7 million. The transaction was funded by the Company with cash on hand and by utilizing short-term financing. Fontanini specializes in authentic Italian meats and sausages, as well as a variety of other premium meat products including pizza toppings and meatballs and allows the Company to expand its foodservice business. On January 3, 2017, the Company completed the sale of Clougherty Packing, LLC, parent company of Farmer John and Saag’s Specialty Meats, along with PFFJ, LLC, farm operations in California, Arizona, and Wyoming. The closing price was $145.0 million in cash. On May 26, 2016, the Company acquired Justin’s, LLC (Justin’s) of Boulder, Colorado, for a purchase price of $280.9 million. The purchase price was funded by the Company with cash on hand and by utilizing short-term financing. This acquisition allowed the Company to enhance its presence in the specialty natural and organic nut butter category. On May 9, 2016, the Company completed the sale of Diamond Crystal Brands resulting in proceeds of $110.1 million, net of selling costs.
On July 13, 2015, the Company acquired Applegate Farms, LLC (Applegate) of Bridgewater, New Jersey, for a final purchase price of $774.1 million in cash. The purchase price was funded by the Company with cash on hand and by utilizing short-term financing. This acquisition allows the Company to expand the breadth of its protein offerings to provide consumers more choice in this fast growing category.
The Company has not been involved in any bankruptcy, receivership, or similar proceedings during its history. Substantially all the assets of the Company have been acquired in the ordinary course of business. The Company had no other significant change in the type of products produced or services rendered, or in the markets or methods of distribution, since the beginning of the 2018 fiscal year. (b) Segments The Company’s business is reported in four segments: Grocery Products, Refrigerated Foods, Jennie-O Turkey Store (JOTS), and International & Other. Net sales to unaffiliated customers, operating profit, total assets, and the presentation of certain other financial information by segment, are reported in Note P of the Notes to Consolidated Financial Statements and in the Management’s Discussion and Analysis of Financial Condition and Results of Operations.
4
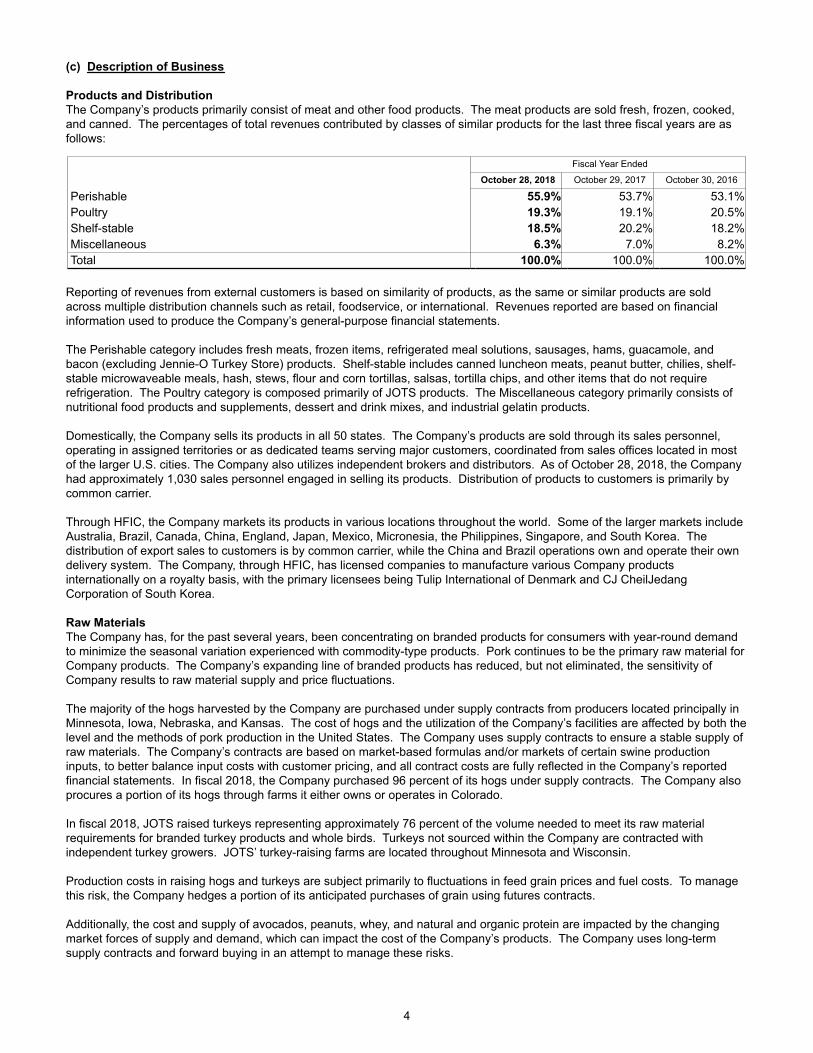
(c) Description of Business Products and Distribution The Company’s products primarily consist of meat and other food products. The meat products are sold fresh, frozen, cooked, and canned. The percentages of total revenues contributed by classes of similar products for the last three fiscal years are as follows:
Fiscal Year Ended
October 28, 2018 October 29, 2017 October 30, 2016
Perishable 55.9% 53.7% 53.1%Poultry 19.3% 19.1% 20.5%Shelf-stable 18.5% 20.2% 18.2%Miscellaneous 6.3% 7.0% 8.2%Total 100.0% 100.0% 100.0%
Reporting of revenues from external customers is based on similarity of products, as the same or similar products are sold across multiple distribution channels such as retail, foodservice, or international. Revenues reported are based on financial information used to produce the Company’s general-purpose financial statements. The Perishable category includes fresh meats, frozen items, refrigerated meal solutions, sausages, hams, guacamole, and bacon (excluding Jennie-O Turkey Store) products. Shelf-stable includes canned luncheon meats, peanut butter, chilies, shelf-stable microwaveable meals, hash, stews, flour and corn tortillas, salsas, tortilla chips, and other items that do not require refrigeration. The Poultry category is composed primarily of JOTS products. The Miscellaneous category primarily consists of nutritional food products and supplements, dessert and drink mixes, and industrial gelatin products. Domestically, the Company sells its products in all 50 states. The Company’s products are sold through its sales personnel, operating in assigned territories or as dedicated teams serving major customers, coordinated from sales offices located in most of the larger U.S. cities. The Company also utilizes independent brokers and distributors. As of October 28, 2018, the Company had approximately 1,030 sales personnel engaged in selling its products. Distribution of products to customers is primarily by common carrier. Through HFIC, the Company markets its products in various locations throughout the world. Some of the larger markets include Australia, Brazil, Canada, China, England, Japan, Mexico, Micronesia, the Philippines, Singapore, and South Korea. The distribution of export sales to customers is by common carrier, while the China and Brazil operations own and operate their own delivery system. The Company, through HFIC, has licensed companies to manufacture various Company products internationally on a royalty basis, with the primary licensees being Tulip International of Denmark and CJ CheilJedang Corporation of South Korea. Raw Materials The Company has, for the past several years, been concentrating on branded products for consumers with year-round demand to minimize the seasonal variation experienced with commodity-type products. Pork continues to be the primary raw material for Company products. The Company’s expanding line of branded products has reduced, but not eliminated, the sensitivity of Company results to raw material supply and price fluctuations. The majority of the hogs harvested by the Company are purchased under supply contracts from producers located principally in Minnesota, Iowa, Nebraska, and Kansas. The cost of hogs and the utilization of the Company’s facilities are affected by both the level and the methods of pork production in the United States. The Company uses supply contracts to ensure a stable supply of raw materials. The Company’s contracts are based on market-based formulas and/or markets of certain swine production inputs, to better balance input costs with customer pricing, and all contract costs are fully reflected in the Company’s reported financial statements. In fiscal 2018, the Company purchased 96 percent of its hogs under supply contracts. The Company also procures a portion of its hogs through farms it either owns or operates in Colorado. In fiscal 2018, JOTS raised turkeys representing approximately 76 percent of the volume needed to meet its raw material requirements for branded turkey products and whole birds. Turkeys not sourced within the Company are contracted with independent turkey growers. JOTS’ turkey-raising farms are located throughout Minnesota and Wisconsin. Production costs in raising hogs and turkeys are subject primarily to fluctuations in feed grain prices and fuel costs. To manage this risk, the Company hedges a portion of its anticipated purchases of grain using futures contracts. Additionally, the cost and supply of avocados, peanuts, whey, and natural and organic protein are impacted by the changing market forces of supply and demand, which can impact the cost of the Company’s products. The Company uses long-term supply contracts and forward buying in an attempt to manage these risks.
5
ManufacturingThe Company has one plant that harvests hogs for processing. Quality Pork Processors, Inc. of Dallas, Texas, operates the harvesting facility in Austin, Minnesota, under a custom harvesting arrangement. The Company currently has seven turkey harvest and processing operations, and 30 facilities that produce and distribute other manufactured items. Albert Lea Select Foods, Inc. operates the processing facility in Albert Lea, Minnesota, under a custom manufacturing agreement. Company products are also custom manufactured by several other companies. The following are the Company’s larger custom manufacturers: Abbyland Foods, Inc., Abbotsford, Wisconsin; Agropur Division Natrel USA, Maplewood, Minnesota; Algood Food Company, Louisville, Kentucky; Cargill Meat Solutions, Minneapolis, MN; Cooper Farms, Van Wert, Ohio: Deitz & Watson, Inc., Philadelphia, Pennsylvania; Harris Ranch Beef Company, Gilroy, California; HP Hood LLC, Lynnfield, Massachusetts; OSI Industries LLC, Chicago, Illinois; Reichel Foods, Inc., Rochester, Minnesota; Reser’s Fine Foods, Topeka, Kansas; and Steuben Foods, Jamaica, New York. Exel, Inc., based in Westerville, Ohio, operates distribution centers for the Company in Dayton, Ohio, and Osceola, Iowa. Patents and TrademarksThere are numerous patents and trademarks important to the Company’s business. The Company holds 45 U.S. issued and 9 foreign patents. Most of the trademarks are registered. Some of the more significant owned or licensed trademarks used by the Company or its affiliates are: HORMEL, ALWAYS TENDER, APPLEGATE, AUSTIN BLUES, BACON 1, BLACK LABEL, BREAD READY, BURKE, CAFÉ H, CERATTI, CHI-CHI’S, COLUMBUS, COMPLEATS, CURE 81, CYTOSPORT, DAN’S PRIZE, DI LUSSO, DINTY MOORE, DON MIGUEL, DOÑA MARIA, EMBASA, EVOLVE, FAST ‘N EASY, FIRE BRAISED, FONTANINI, HERDEZ, HORMEL GATHERINGS, HORMEL VITAL CUISINE, HOUSE OF TSANG, JENNIE-O, JUSTIN’S, LA VICTORIA, LAYOUT, LLOYD’S, MARY KITCHEN, MUSCLE MILK, NATURAL CHOICE, OLD SMOKEHOUSE, OVEN READY, PILLOW PACK, RANGE BRAND, ROSA GRANDE, SKIPPY, SPAM, SPECIAL RECIPE, THICK & EASY, VALLEY FRESH, and WHOLLY GUACAMOLE. The Company’s patents expire after a term that is typically 20 years from the date of filing, with earlier expiration possible based on the Company’s decision to pay required maintenance fees. As long as the Company intends to continue using its trademarks, they are renewed indefinitely. Customers and Backlog OrdersDuring fiscal 2018, sales to Walmart Inc. (Walmart) represented approximately 13.6 percent of the Company’s revenues (measured as gross sales less returns and allowances), compared to 14.4 percent in fiscal 2017. Walmart is a customer for all four segments of the Company. The five largest customers in each segment make up approximately the following percentage of segment sales: 42 percent of Grocery Products, 38 percent of Refrigerated Foods, 42 percent of JOTS, and 18 percent of International & Other. The loss of one or more of the top customers in any of these segments could have a material adverse effect on the results of such segment. Backlog orders are not significant due to the perishable nature of a large portion of the products. Orders are accepted and shipped on a current basis.
CompetitionThe production and sale of meat and food products in the United States and internationally are highly competitive. The Company competes with manufacturers of pork and turkey products, as well as national and regional producers of other meat and protein sources, such as beef, chicken, fish, peanut butter, and whey. The Company believes its largest domestic competitors for its Refrigerated Foods segment in 2018 were Tyson Foods, Inc. and Smithfield Foods, Inc.; for its Grocery Products segment, Conagra Brands, Inc., General Mills, Inc., Campbell Soup Co., J. M. Smucker Co., and Treehouse Foods Inc.; and for JOTS, Cargill, Inc. and Butterball, LLC. All segments compete on the basis of price, product quality and attributes, brand identification, breadth of product line, and customer service. Through aggressive marketing and strong quality assurance programs, the Company’s strategy is to provide higher quality products that possess strong brand recognition, which would then support higher value perceptions from customers. EmployeesAs of October 28, 2018, the Company had approximately 20,100 active domestic and foreign employees. (e) Available Information The Company makes available, free of charge on its Web site at www.hormelfoods.com, its annual report on Form 10-K, quarterly reports on Form 10-Q, current reports on Form 8-K, and amendments to those reports filed or furnished pursuant to Section 13(a) or 15(d) of the Securities Exchange Act of 1934. These reports are accessible under the caption, “Investors – Filings & Reports – SEC Filings” on the Company’s Web site and are available as soon as reasonably practicable after such material is electronically filed with or furnished to the Securities and Exchange Commission. The documents are also available in print, free of charge, to any stockholder who requests them.
6
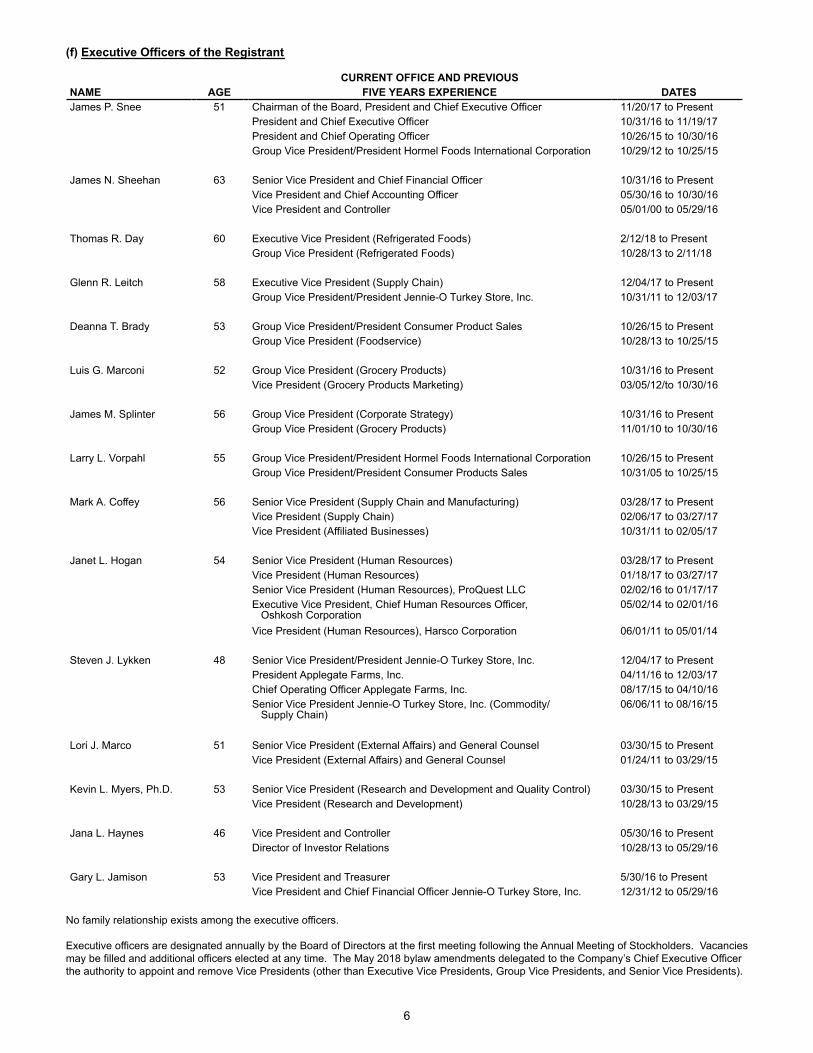
(f) Executive Officers of the Registrant
CURRENT OFFICE AND PREVIOUSNAME AGE FIVE YEARS EXPERIENCE DATESJames P. Snee 51 Chairman of the Board, President and Chief Executive Officer 11/20/17 to Present
President and Chief Executive Officer 10/31/16 to 11/19/17President and Chief Operating Officer 10/26/15 to 10/30/16Group Vice President/President Hormel Foods International Corporation 10/29/12 to 10/25/15
James N. Sheehan 63 Senior Vice President and Chief Financial Officer 10/31/16 to PresentVice President and Chief Accounting Officer 05/30/16 to 10/30/16Vice President and Controller 05/01/00 to 05/29/16
Thomas R. Day 60 Executive Vice President (Refrigerated Foods) 2/12/18 to PresentGroup Vice President (Refrigerated Foods) 10/28/13 to 2/11/18
Glenn R. Leitch 58 Executive Vice President (Supply Chain) 12/04/17 to PresentGroup Vice President/President Jennie-O Turkey Store, Inc. 10/31/11 to 12/03/17
Deanna T. Brady 53 Group Vice President/President Consumer Product Sales 10/26/15 to PresentGroup Vice President (Foodservice) 10/28/13 to 10/25/15
Luis G. Marconi 52 Group Vice President (Grocery Products) 10/31/16 to PresentVice President (Grocery Products Marketing) 03/05/12/to 10/30/16
James M. Splinter 56 Group Vice President (Corporate Strategy) 10/31/16 to PresentGroup Vice President (Grocery Products) 11/01/10 to 10/30/16
Larry L. Vorpahl 55 Group Vice President/President Hormel Foods International Corporation 10/26/15 to PresentGroup Vice President/President Consumer Products Sales 10/31/05 to 10/25/15
Mark A. Coffey 56 Senior Vice President (Supply Chain and Manufacturing) 03/28/17 to PresentVice President (Supply Chain) 02/06/17 to 03/27/17Vice President (Affiliated Businesses) 10/31/11 to 02/05/17
Janet L. Hogan 54 Senior Vice President (Human Resources) 03/28/17 to PresentVice President (Human Resources) 01/18/17 to 03/27/17Senior Vice President (Human Resources), ProQuest LLC 02/02/16 to 01/17/17Executive Vice President, Chief Human Resources Officer, Oshkosh Corporation
05/02/14 to 02/01/16
Vice President (Human Resources), Harsco Corporation 06/01/11 to 05/01/14
Steven J. Lykken 48 Senior Vice President/President Jennie-O Turkey Store, Inc. 12/04/17 to PresentPresident Applegate Farms, Inc. 04/11/16 to 12/03/17Chief Operating Officer Applegate Farms, Inc. 08/17/15 to 04/10/16Senior Vice President Jennie-O Turkey Store, Inc. (Commodity/ Supply Chain)
06/06/11 to 08/16/15
Lori J. Marco 51 Senior Vice President (External Affairs) and General Counsel 03/30/15 to PresentVice President (External Affairs) and General Counsel 01/24/11 to 03/29/15
Kevin L. Myers, Ph.D. 53 Senior Vice President (Research and Development and Quality Control) 03/30/15 to Present Vice President (Research and Development) 10/28/13 to 03/29/15
Jana L. Haynes 46 Vice President and Controller 05/30/16 to Present Director of Investor Relations 10/28/13 to 05/29/16
Gary L. Jamison 53 Vice President and Treasurer 5/30/16 to Present Vice President and Chief Financial Officer Jennie-O Turkey Store, Inc. 12/31/12 to 05/29/16
No family relationship exists among the executive officers.
Executive officers are designated annually by the Board of Directors at the first meeting following the Annual Meeting of Stockholders. Vacancies may be filled and additional officers elected at any time. The May 2018 bylaw amendments delegated to the Company’s Chief Executive Officer the authority to appoint and remove Vice Presidents (other than Executive Vice Presidents, Group Vice Presidents, and Senior Vice Presidents).
7
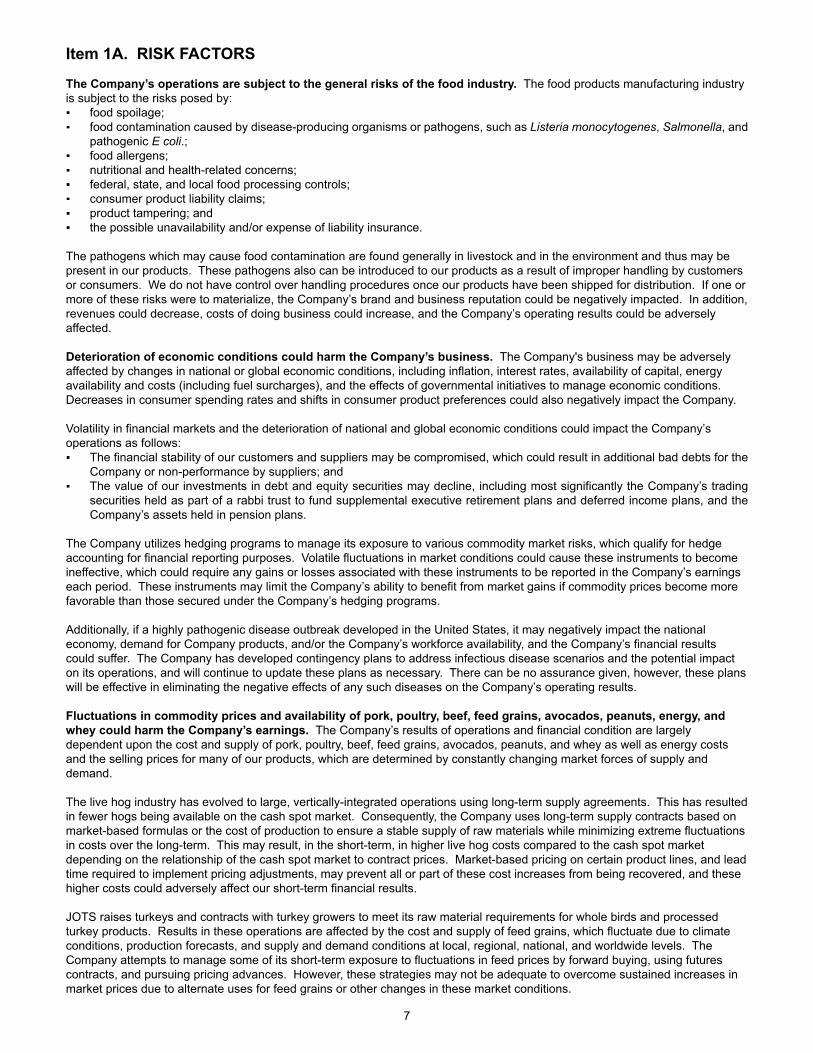
Item 1A. RISK FACTORS The Company’s operations are subject to the general risks of the food industry. The food products manufacturing industry is subject to the risks posed by: food spoilage; food contamination caused by disease-producing organisms or pathogens, such as Listeria monocytogenes, Salmonella, and
pathogenic E coli.; food allergens; nutritional and health-related concerns; federal, state, and local food processing controls; consumer product liability claims; product tampering; and the possible unavailability and/or expense of liability insurance.
The pathogens which may cause food contamination are found generally in livestock and in the environment and thus may be present in our products. These pathogens also can be introduced to our products as a result of improper handling by customers or consumers. We do not have control over handling procedures once our products have been shipped for distribution. If one or more of these risks were to materialize, the Company’s brand and business reputation could be negatively impacted. In addition, revenues could decrease, costs of doing business could increase, and the Company’s operating results could be adversely affected.
Deterioration of economic conditions could harm the Company’s business. The Company's business may be adversely affected by changes in national or global economic conditions, including inflation, interest rates, availability of capital, energy availability and costs (including fuel surcharges), and the effects of governmental initiatives to manage economic conditions. Decreases in consumer spending rates and shifts in consumer product preferences could also negatively impact the Company.
Volatility in financial markets and the deterioration of national and global economic conditions could impact the Company’s operations as follows: The financial stability of our customers and suppliers may be compromised, which could result in additional bad debts for the
Company or non-performance by suppliers; and The value of our investments in debt and equity securities may decline, including most significantly the Company’s trading
securities held as part of a rabbi trust to fund supplemental executive retirement plans and deferred income plans, and the Company’s assets held in pension plans.
The Company utilizes hedging programs to manage its exposure to various commodity market risks, which qualify for hedge accounting for financial reporting purposes. Volatile fluctuations in market conditions could cause these instruments to become ineffective, which could require any gains or losses associated with these instruments to be reported in the Company’s earnings each period. These instruments may limit the Company’s ability to benefit from market gains if commodity prices become more favorable than those secured under the Company’s hedging programs.
Additionally, if a highly pathogenic disease outbreak developed in the United States, it may negatively impact the national economy, demand for Company products, and/or the Company’s workforce availability, and the Company’s financial results could suffer. The Company has developed contingency plans to address infectious disease scenarios and the potential impact on its operations, and will continue to update these plans as necessary. There can be no assurance given, however, these plans will be effective in eliminating the negative effects of any such diseases on the Company’s operating results.
Fluctuations in commodity prices and availability of pork, poultry, beef, feed grains, avocados, peanuts, energy, and whey could harm the Company’s earnings. The Company’s results of operations and financial condition are largely dependent upon the cost and supply of pork, poultry, beef, feed grains, avocados, peanuts, and whey as well as energy costs and the selling prices for many of our products, which are determined by constantly changing market forces of supply and demand.
The live hog industry has evolved to large, vertically-integrated operations using long-term supply agreements. This has resulted in fewer hogs being available on the cash spot market. Consequently, the Company uses long-term supply contracts based on market-based formulas or the cost of production to ensure a stable supply of raw materials while minimizing extreme fluctuations in costs over the long-term. This may result, in the short-term, in higher live hog costs compared to the cash spot market depending on the relationship of the cash spot market to contract prices. Market-based pricing on certain product lines, and lead time required to implement pricing adjustments, may prevent all or part of these cost increases from being recovered, and these higher costs could adversely affect our short-term financial results.
JOTS raises turkeys and contracts with turkey growers to meet its raw material requirements for whole birds and processed turkey products. Results in these operations are affected by the cost and supply of feed grains, which fluctuate due to climate conditions, production forecasts, and supply and demand conditions at local, regional, national, and worldwide levels. The Company attempts to manage some of its short-term exposure to fluctuations in feed prices by forward buying, using futures contracts, and pursuing pricing advances. However, these strategies may not be adequate to overcome sustained increases in market prices due to alternate uses for feed grains or other changes in these market conditions.
8
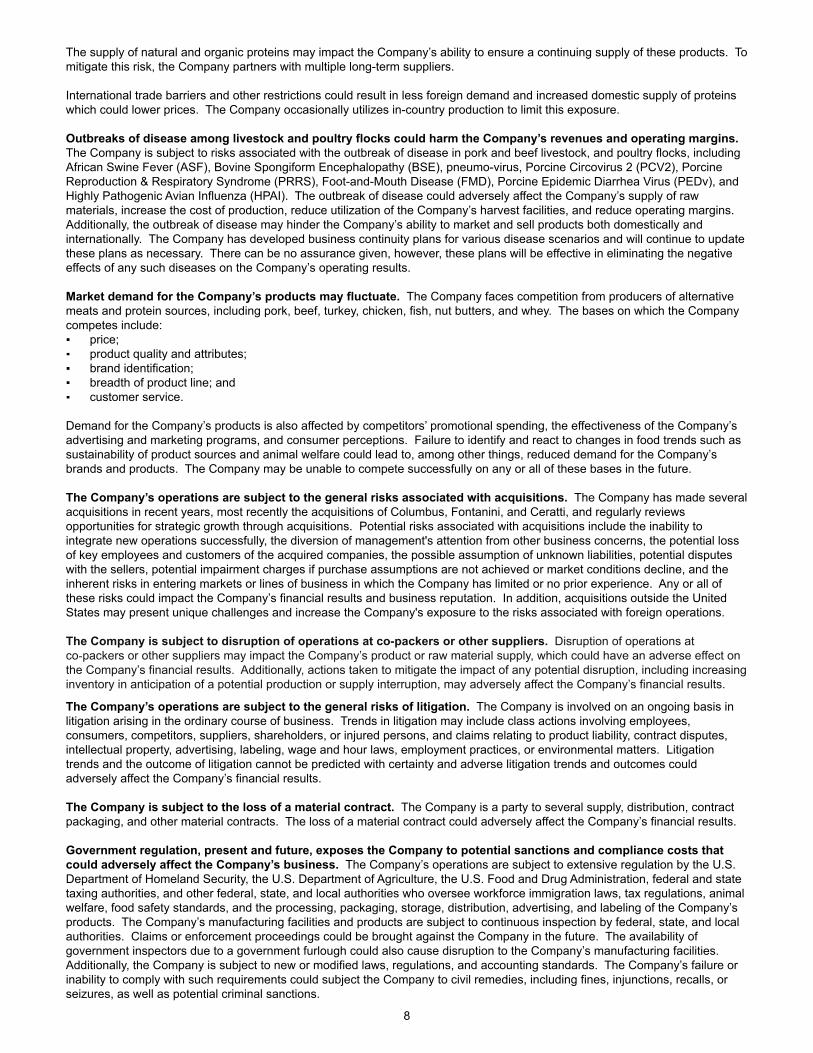
The supply of natural and organic proteins may impact the Company’s ability to ensure a continuing supply of these products. To mitigate this risk, the Company partners with multiple long-term suppliers.
International trade barriers and other restrictions could result in less foreign demand and increased domestic supply of proteins which could lower prices. The Company occasionally utilizes in-country production to limit this exposure.
Outbreaks of disease among livestock and poultry flocks could harm the Company’s revenues and operating margins. The Company is subject to risks associated with the outbreak of disease in pork and beef livestock, and poultry flocks, including African Swine Fever (ASF), Bovine Spongiform Encephalopathy (BSE), pneumo-virus, Porcine Circovirus 2 (PCV2), Porcine Reproduction & Respiratory Syndrome (PRRS), Foot-and-Mouth Disease (FMD), Porcine Epidemic Diarrhea Virus (PEDv), and Highly Pathogenic Avian Influenza (HPAI). The outbreak of disease could adversely affect the Company’s supply of raw materials, increase the cost of production, reduce utilization of the Company’s harvest facilities, and reduce operating margins. Additionally, the outbreak of disease may hinder the Company’s ability to market and sell products both domestically and internationally. The Company has developed business continuity plans for various disease scenarios and will continue to update these plans as necessary. There can be no assurance given, however, these plans will be effective in eliminating the negative effects of any such diseases on the Company’s operating results.
Market demand for the Company’s products may fluctuate. The Company faces competition from producers of alternative meats and protein sources, including pork, beef, turkey, chicken, fish, nut butters, and whey. The bases on which the Company competes include: price; product quality and attributes; brand identification; breadth of product line; and customer service.
Demand for the Company’s products is also affected by competitors’ promotional spending, the effectiveness of the Company’s advertising and marketing programs, and consumer perceptions. Failure to identify and react to changes in food trends such as sustainability of product sources and animal welfare could lead to, among other things, reduced demand for the Company’s brands and products. The Company may be unable to compete successfully on any or all of these bases in the future.
The Company’s operations are subject to the general risks associated with acquisitions. The Company has made several acquisitions in recent years, most recently the acquisitions of Columbus, Fontanini, and Ceratti, and regularly reviews opportunities for strategic growth through acquisitions. Potential risks associated with acquisitions include the inability to integrate new operations successfully, the diversion of management's attention from other business concerns, the potential loss of key employees and customers of the acquired companies, the possible assumption of unknown liabilities, potential disputes with the sellers, potential impairment charges if purchase assumptions are not achieved or market conditions decline, and the inherent risks in entering markets or lines of business in which the Company has limited or no prior experience. Any or all of these risks could impact the Company’s financial results and business reputation. In addition, acquisitions outside the United States may present unique challenges and increase the Company's exposure to the risks associated with foreign operations.
The Company is subject to disruption of operations at co-packers or other suppliers. Disruption of operations at co packers or other suppliers may impact the Company’s product or raw material supply, which could have an adverse effect on the Company’s financial results. Additionally, actions taken to mitigate the impact of any potential disruption, including increasing inventory in anticipation of a potential production or supply interruption, may adversely affect the Company’s financial results.
The Company’s operations are subject to the general risks of litigation. The Company is involved on an ongoing basis in litigation arising in the ordinary course of business. Trends in litigation may include class actions involving employees, consumers, competitors, suppliers, shareholders, or injured persons, and claims relating to product liability, contract disputes, intellectual property, advertising, labeling, wage and hour laws, employment practices, or environmental matters. Litigation trends and the outcome of litigation cannot be predicted with certainty and adverse litigation trends and outcomes could adversely affect the Company’s financial results.
The Company is subject to the loss of a material contract. The Company is a party to several supply, distribution, contract packaging, and other material contracts. The loss of a material contract could adversely affect the Company’s financial results.
Government regulation, present and future, exposes the Company to potential sanctions and compliance costs that could adversely affect the Company’s business. The Company’s operations are subject to extensive regulation by the U.S. Department of Homeland Security, the U.S. Department of Agriculture, the U.S. Food and Drug Administration, federal and state taxing authorities, and other federal, state, and local authorities who oversee workforce immigration laws, tax regulations, animal welfare, food safety standards, and the processing, packaging, storage, distribution, advertising, and labeling of the Company’s products. The Company’s manufacturing facilities and products are subject to continuous inspection by federal, state, and local authorities. Claims or enforcement proceedings could be brought against the Company in the future. The availability of government inspectors due to a government furlough could also cause disruption to the Company’s manufacturing facilities. Additionally, the Company is subject to new or modified laws, regulations, and accounting standards. The Company’s failure or inability to comply with such requirements could subject the Company to civil remedies, including fines, injunctions, recalls, or seizures, as well as potential criminal sanctions.
9
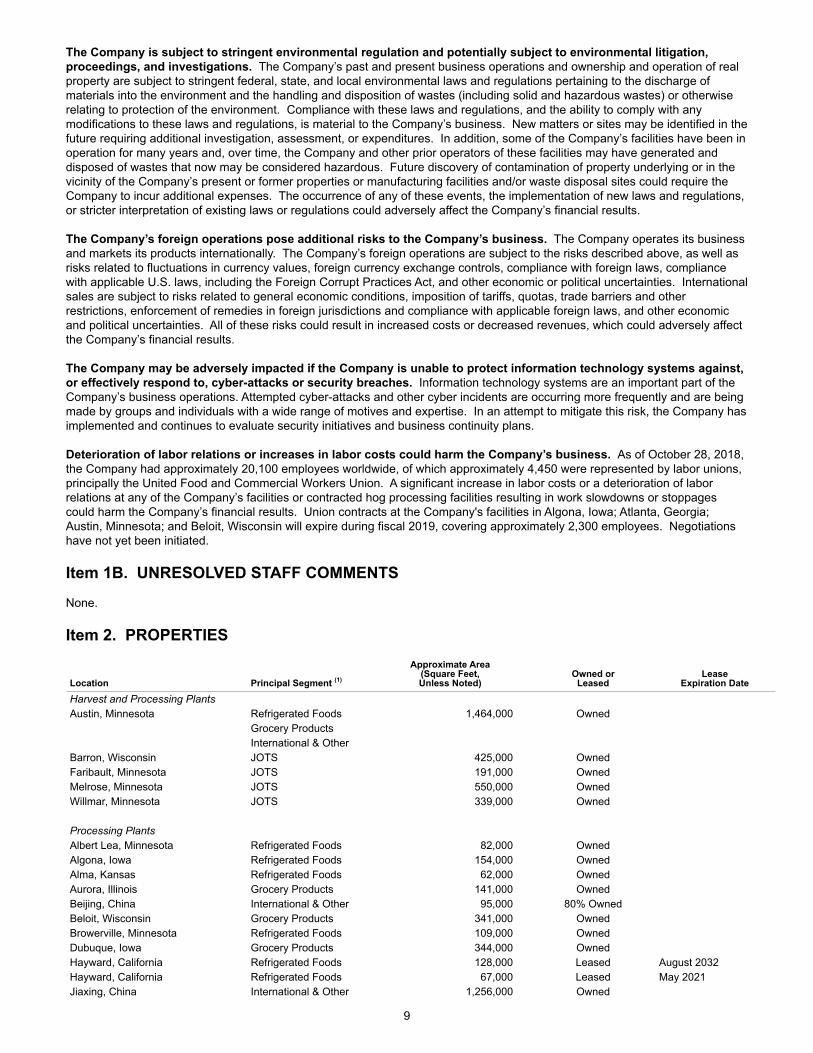
The Company is subject to stringent environmental regulation and potentially subject to environmental litigation, proceedings, and investigations. The Company’s past and present business operations and ownership and operation of real property are subject to stringent federal, state, and local environmental laws and regulations pertaining to the discharge of materials into the environment and the handling and disposition of wastes (including solid and hazardous wastes) or otherwise relating to protection of the environment. Compliance with these laws and regulations, and the ability to comply with any modifications to these laws and regulations, is material to the Company’s business. New matters or sites may be identified in the future requiring additional investigation, assessment, or expenditures. In addition, some of the Company’s facilities have been in operation for many years and, over time, the Company and other prior operators of these facilities may have generated and disposed of wastes that now may be considered hazardous. Future discovery of contamination of property underlying or in the vicinity of the Company’s present or former properties or manufacturing facilities and/or waste disposal sites could require the Company to incur additional expenses. The occurrence of any of these events, the implementation of new laws and regulations, or stricter interpretation of existing laws or regulations could adversely affect the Company’s financial results.
The Company’s foreign operations pose additional risks to the Company’s business. The Company operates its business and markets its products internationally. The Company’s foreign operations are subject to the risks described above, as well as risks related to fluctuations in currency values, foreign currency exchange controls, compliance with foreign laws, compliance with applicable U.S. laws, including the Foreign Corrupt Practices Act, and other economic or political uncertainties. International sales are subject to risks related to general economic conditions, imposition of tariffs, quotas, trade barriers and other restrictions, enforcement of remedies in foreign jurisdictions and compliance with applicable foreign laws, and other economic and political uncertainties. All of these risks could result in increased costs or decreased revenues, which could adversely affect the Company’s financial results.
The Company may be adversely impacted if the Company is unable to protect information technology systems against, or effectively respond to, cyber-attacks or security breaches. Information technology systems are an important part of the Company’s business operations. Attempted cyber-attacks and other cyber incidents are occurring more frequently and are being made by groups and individuals with a wide range of motives and expertise. In an attempt to mitigate this risk, the Company has implemented and continues to evaluate security initiatives and business continuity plans.
Deterioration of labor relations or increases in labor costs could harm the Company’s business. As of October 28, 2018, the Company had approximately 20,100 employees worldwide, of which approximately 4,450 were represented by labor unions, principally the United Food and Commercial Workers Union. A significant increase in labor costs or a deterioration of labor relations at any of the Company’s facilities or contracted hog processing facilities resulting in work slowdowns or stoppages could harm the Company’s financial results. Union contracts at the Company's facilities in Algona, Iowa; Atlanta, Georgia; Austin, Minnesota; and Beloit, Wisconsin will expire during fiscal 2019, covering approximately 2,300 employees. Negotiations have not yet been initiated.
Item 1B. UNRESOLVED STAFF COMMENTS None.
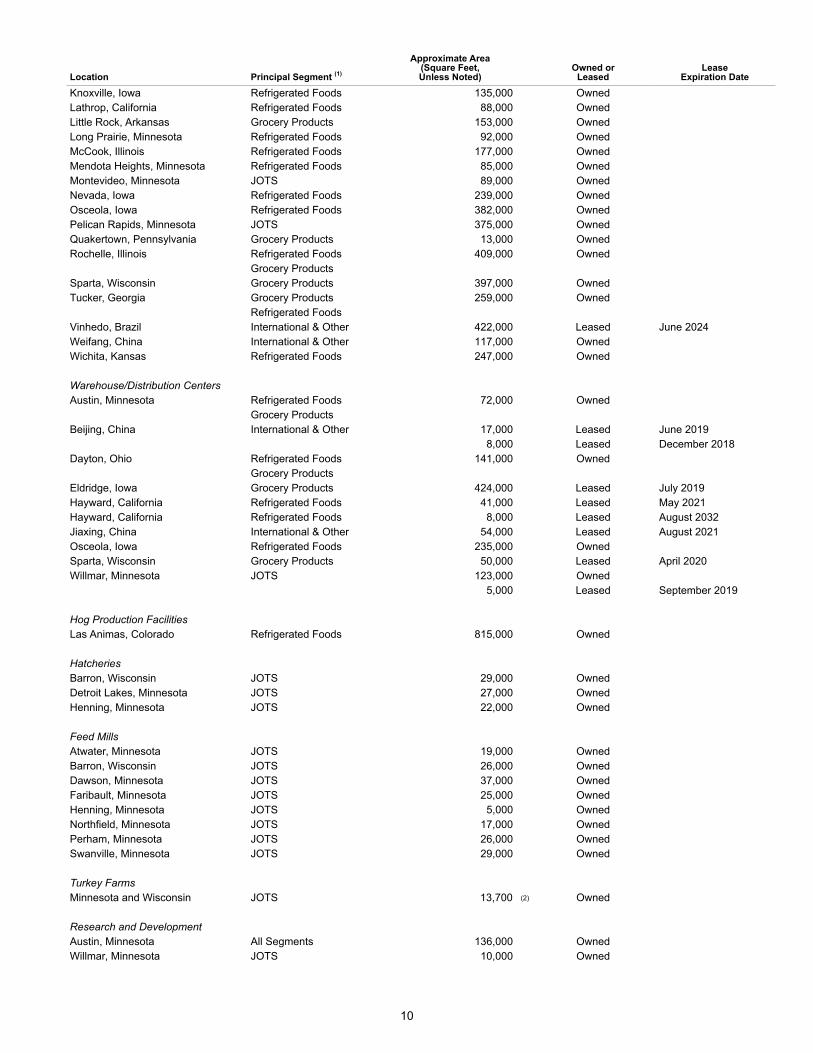
Item 2. PROPERTIES
Location Principal Segment (1)
Approximate Area(Square Feet,Unless Noted)
Owned orLeased
LeaseExpiration Date
Harvest and Processing PlantsAustin, Minnesota Refrigerated Foods 1,464,000 Owned
Grocery ProductsInternational & Other
Barron, Wisconsin JOTS 425,000 OwnedFaribault, Minnesota JOTS 191,000 OwnedMelrose, Minnesota JOTS 550,000 OwnedWillmar, Minnesota JOTS 339,000 Owned
Processing Plants Albert Lea, Minnesota Refrigerated Foods 82,000 OwnedAlgona, Iowa Refrigerated Foods 154,000 OwnedAlma, Kansas Refrigerated Foods 62,000 OwnedAurora, Illinois Grocery Products 141,000 OwnedBeijing, China International & Other 95,000 80% OwnedBeloit, Wisconsin Grocery Products 341,000 OwnedBrowerville, Minnesota Refrigerated Foods 109,000 OwnedDubuque, Iowa Grocery Products 344,000 OwnedHayward, California Refrigerated Foods 128,000 Leased August 2032Hayward, California Refrigerated Foods 67,000 Leased May 2021Jiaxing, China International & Other 1,256,000 Owned
10
Location Principal Segment (1)
Approximate Area(Square Feet,Unless Noted)
Owned orLeased
LeaseExpiration Date
Knoxville, Iowa Refrigerated Foods 135,000 OwnedLathrop, California Refrigerated Foods 88,000 OwnedLittle Rock, Arkansas Grocery Products 153,000 OwnedLong Prairie, Minnesota Refrigerated Foods 92,000 OwnedMcCook, Illinois Refrigerated Foods 177,000 OwnedMendota Heights, Minnesota Refrigerated Foods 85,000 OwnedMontevideo, Minnesota JOTS 89,000 OwnedNevada, Iowa Refrigerated Foods 239,000 OwnedOsceola, Iowa Refrigerated Foods 382,000 OwnedPelican Rapids, Minnesota JOTS 375,000 OwnedQuakertown, Pennsylvania Grocery Products 13,000 OwnedRochelle, Illinois Refrigerated Foods 409,000 Owned
Grocery ProductsSparta, Wisconsin Grocery Products 397,000 Owned Tucker, Georgia Grocery Products 259,000 Owned Refrigerated Foods Vinhedo, Brazil International & Other 422,000 Leased June 2024Weifang, China International & Other 117,000 Owned Wichita, Kansas Refrigerated Foods 247,000 Owned
Warehouse/Distribution Centers Austin, Minnesota Refrigerated Foods 72,000 Owned
Grocery ProductsBeijing, China International & Other 17,000 Leased June 2019
8,000 Leased December 2018Dayton, Ohio Refrigerated Foods 141,000 Owned
Grocery ProductsEldridge, Iowa Grocery Products 424,000 Leased July 2019Hayward, California Refrigerated Foods 41,000 Leased May 2021Hayward, California Refrigerated Foods 8,000 Leased August 2032Jiaxing, China International & Other 54,000 Leased August 2021Osceola, Iowa Refrigerated Foods 235,000 Owned Sparta, Wisconsin Grocery Products 50,000 Leased April 2020Willmar, Minnesota JOTS 123,000 Owned 5,000 Leased September 2019
Hog Production Facilities Las Animas, Colorado Refrigerated Foods 815,000 Owned
Hatcheries Barron, Wisconsin JOTS 29,000 Owned Detroit Lakes, Minnesota JOTS 27,000 Owned Henning, Minnesota JOTS 22,000 Owned
Feed Mills Atwater, Minnesota JOTS 19,000 Owned Barron, Wisconsin JOTS 26,000 Owned Dawson, Minnesota JOTS 37,000 Owned Faribault, Minnesota JOTS 25,000 Owned Henning, Minnesota JOTS 5,000 Owned Northfield, Minnesota JOTS 17,000 Owned Perham, Minnesota JOTS 26,000 Owned Swanville, Minnesota JOTS 29,000 Owned
Turkey Farms Minnesota and Wisconsin JOTS 13,700 (2) Owned
Research and Development Austin, Minnesota All Segments 136,000 Owned Willmar, Minnesota JOTS 10,000 Owned
11
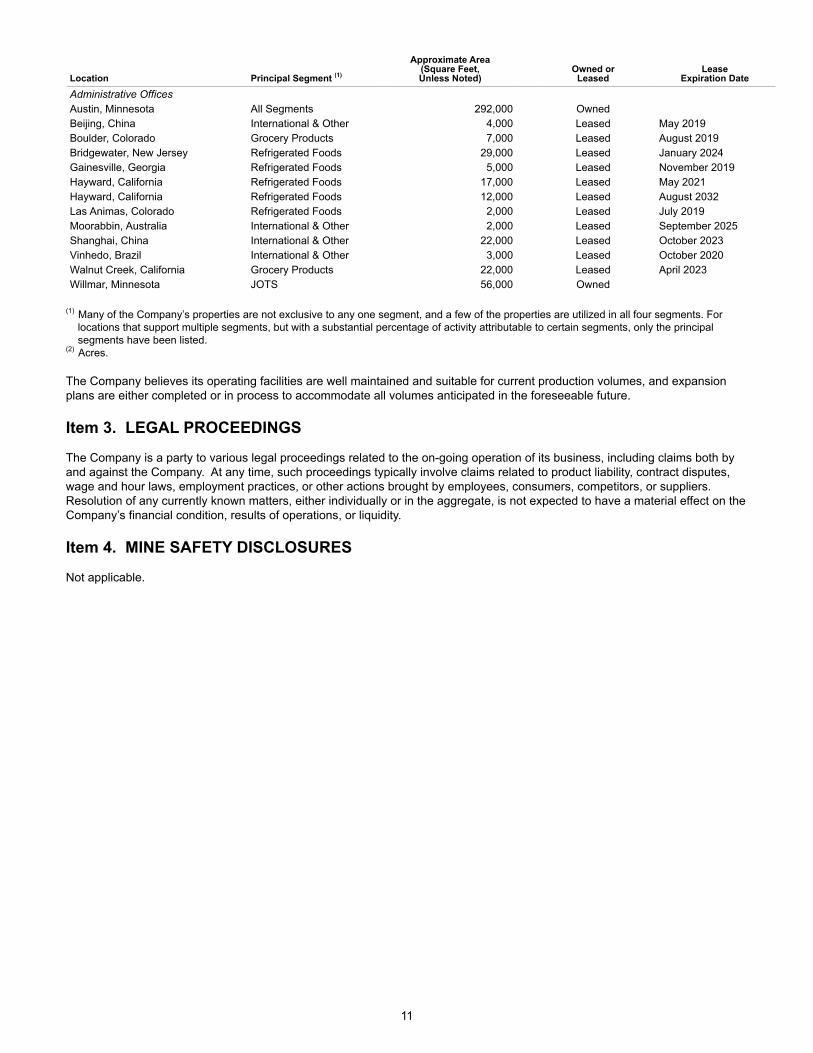
Location Principal Segment (1)
Approximate Area(Square Feet,Unless Noted)
Owned orLeased
LeaseExpiration Date
Administrative Offices Austin, Minnesota All Segments 292,000 Owned Beijing, China International & Other 4,000 Leased May 2019Boulder, Colorado Grocery Products 7,000 Leased August 2019Bridgewater, New Jersey Refrigerated Foods 29,000 Leased January 2024Gainesville, Georgia Refrigerated Foods 5,000 Leased November 2019Hayward, California Refrigerated Foods 17,000 Leased May 2021Hayward, California Refrigerated Foods 12,000 Leased August 2032Las Animas, Colorado Refrigerated Foods 2,000 Leased July 2019Moorabbin, Australia International & Other 2,000 Leased September 2025Shanghai, China International & Other 22,000 Leased October 2023Vinhedo, Brazil International & Other 3,000 Leased October 2020Walnut Creek, California Grocery Products 22,000 Leased April 2023Willmar, Minnesota JOTS 56,000 Owned
(1) Many of the Company’s properties are not exclusive to any one segment, and a few of the properties are utilized in all four segments. For locations that support multiple segments, but with a substantial percentage of activity attributable to certain segments, only the principal segments have been listed.
(2) Acres. The Company believes its operating facilities are well maintained and suitable for current production volumes, and expansion plans are either completed or in process to accommodate all volumes anticipated in the foreseeable future.
Item 3. LEGAL PROCEEDINGS The Company is a party to various legal proceedings related to the on-going operation of its business, including claims both by and against the Company. At any time, such proceedings typically involve claims related to product liability, contract disputes, wage and hour laws, employment practices, or other actions brought by employees, consumers, competitors, or suppliers. Resolution of any currently known matters, either individually or in the aggregate, is not expected to have a material effect on the Company’s financial condition, results of operations, or liquidity.
Item 4. MINE SAFETY DISCLOSURES Not applicable.
12
PART II
Item 5. MARKET FOR REGISTRANT’S COMMON EQUITY, RELATED STOCKHOLDER MATTERS AND ISSUER PURCHASES OF EQUITY SECURITIES Market informationHormel Foods Corporation’s common stock is traded on the New York Stock Exchange under the symbol HRL. The CUSIP number is 440452100.
HoldersThere are approximately 12,600 record stockholders and 126,900 stockholders whose shares are held in street name by brokerage firms and financial institutions. Issuer purchases of equity securities in the fourth quarter of fiscal 2018 are shown below:
Period
TotalNumber of
SharesPurchased
AveragePrice PaidPer Share
Total Number ofShares Purchased as
Part of PubliclyAnnounced Plans or
Programs(1)
Maximum Number ofShares that May YetBe Purchased Under
the Plans orPrograms (1)
July 30, 2018 – September 2, 2018 - - - 9,121,823
September 3, 2018 – September 30, 2018 - - - 9,121,823
October 1, 2018 – October 28, 2018 54,667 $39.45 54,667 9,067,156Total 54,667 $39.45 54,667
(1) On January 31, 2013, the Company announced its Board of Directors had authorized the repurchase of 10,000,000 shares of its common stock with no expiration
date. The repurchase program was authorized at a meeting of the Company’s Board of Directors on January 29, 2013. On November 23, 2015, the Board of Directors authorized a two-for-one split of the Company’s common stock. As part of the resolution to approve that stock split, the number of shares remaining to be repurchased was adjusted proportionately. The stock split was subsequently approved by stockholders at the Company’s Annual Meeting on January 26, 2016, and effected January 27, 2016. All numbers in the table above reflect the impact of this stock split.
Shareholder return performance graphThe following graph shows a comparison of cumulative total shareholder return, calculated on a dividend-reinvested basis, for the Company, the S&P 500 Index, and the S&P 500 Packaged Foods & Meats Index for the five years ended October 26, 2018. The graph assumes $100 was invested in each, as of the market close on October 28, 2013. Note that historic stock price performance is not necessarily indicative of future stock price performance.
13
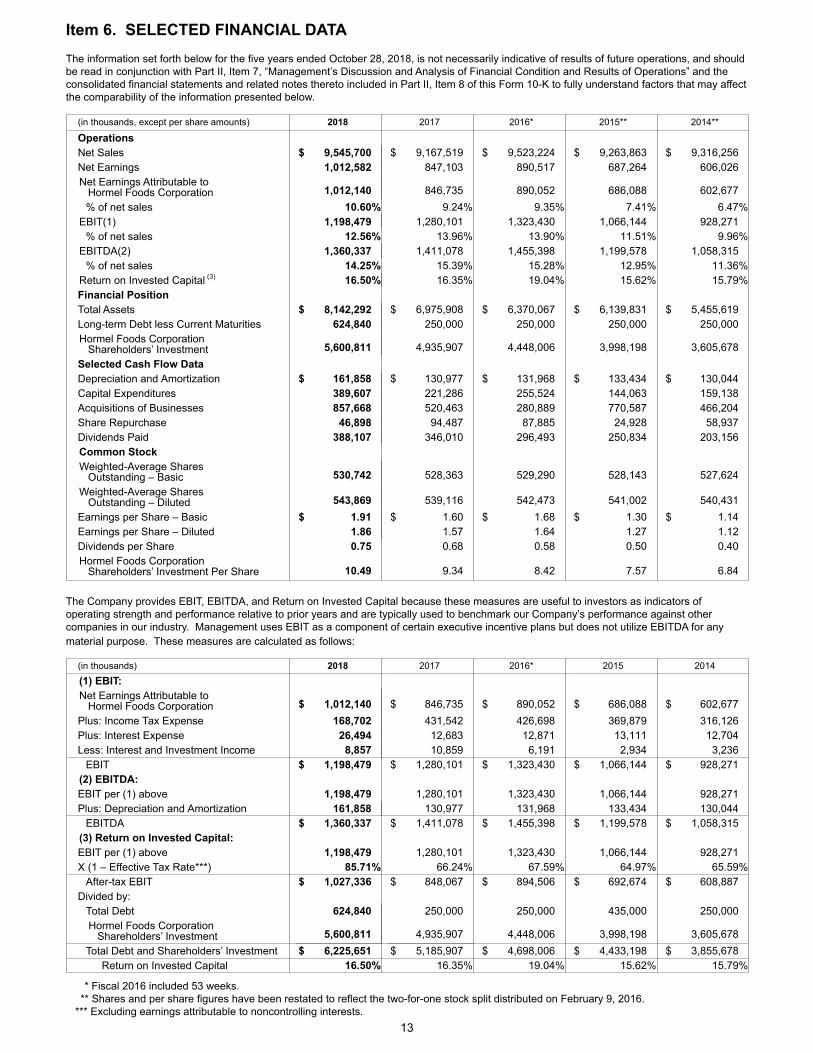
Item 6. SELECTED FINANCIAL DATA The information set forth below for the five years ended October 28, 2018, is not necessarily indicative of results of future operations, and should be read in conjunction with Part II, Item 7, “Management’s Discussion and Analysis of Financial Condition and Results of Operations” and the consolidated financial statements and related notes thereto included in Part II, Item 8 of this Form 10-K to fully understand factors that may affect the comparability of the information presented below.
(in thousands, except per share amounts) 2018 2017 2016* 2015** 2014**
Operations Net Sales $ 9,545,700 $ 9,167,519 $ 9,523,224 $ 9,263,863 $ 9,316,256Net Earnings 1,012,582 847,103 890,517 687,264 606,026Net Earnings Attributable to Hormel Foods Corporation 1,012,140 846,735 890,052 686,088 602,677
% of net sales 10.60% 9.24% 9.35% 7.41% 6.47%EBIT(1) 1,198,479 1,280,101 1,323,430 1,066,144 928,271
% of net sales 12.56% 13.96% 13.90% 11.51% 9.96%EBITDA(2) 1,360,337 1,411,078 1,455,398 1,199,578 1,058,315
% of net sales 14.25% 15.39% 15.28% 12.95% 11.36%Return on Invested Capital (3) 16.50% 16.35% 19.04% 15.62% 15.79%Financial Position Total Assets $ 8,142,292 $ 6,975,908 $ 6,370,067 $ 6,139,831 $ 5,455,619Long-term Debt less Current Maturities 624,840 250,000 250,000 250,000 250,000Hormel Foods Corporation Shareholders’ Investment 5,600,811 4,935,907 4,448,006 3,998,198 3,605,678Selected Cash Flow Data Depreciation and Amortization $ 161,858 $ 130,977 $ 131,968 $ 133,434 $ 130,044Capital Expenditures 389,607 221,286 255,524 144,063 159,138Acquisitions of Businesses 857,668 520,463 280,889 770,587 466,204Share Repurchase 46,898 94,487 87,885 24,928 58,937Dividends Paid 388,107 346,010 296,493 250,834 203,156Common Stock Weighted-Average Shares Outstanding – Basic 530,742 528,363 529,290 528,143 527,624Weighted-Average Shares Outstanding – Diluted 543,869 539,116 542,473 541,002 540,431Earnings per Share – Basic $ 1.91 $ 1.60 $ 1.68 $ 1.30 $ 1.14Earnings per Share – Diluted 1.86 1.57 1.64 1.27 1.12Dividends per Share 0.75 0.68 0.58 0.50 0.40Hormel Foods Corporation Shareholders’ Investment Per Share 10.49 9.34 8.42 7.57 6.84
The Company provides EBIT, EBITDA, and Return on Invested Capital because these measures are useful to investors as indicators of operating strength and performance relative to prior years and are typically used to benchmark our Company’s performance against other companies in our industry. Management uses EBIT as a component of certain executive incentive plans but does not utilize EBITDA for any material purpose. These measures are calculated as follows:
(in thousands) 2018 2017 2016* 2015 2014
(1) EBIT: Net Earnings Attributable to Hormel Foods Corporation $ 1,012,140 $ 846,735 $ 890,052 $ 686,088 $ 602,677Plus: Income Tax Expense 168,702 431,542 426,698 369,879 316,126Plus: Interest Expense 26,494 12,683 12,871 13,111 12,704Less: Interest and Investment Income 8,857 10,859 6,191 2,934 3,236
EBIT $ 1,198,479 $ 1,280,101 $ 1,323,430 $ 1,066,144 $ 928,271(2) EBITDA: EBIT per (1) above 1,198,479 1,280,101 1,323,430 1,066,144 928,271Plus: Depreciation and Amortization 161,858 130,977 131,968 133,434 130,044
EBITDA $ 1,360,337 $ 1,411,078 $ 1,455,398 $ 1,199,578 $ 1,058,315(3) Return on Invested Capital: EBIT per (1) above 1,198,479 1,280,101 1,323,430 1,066,144 928,271X (1 – Effective Tax Rate***) 85.71% 66.24% 67.59% 64.97% 65.59%
After-tax EBIT $ 1,027,336 $ 848,067 $ 894,506 $ 692,674 $ 608,887Divided by:
Total Debt 624,840 250,000 250,000 435,000 250,000Hormel Foods Corporation Shareholders’ Investment 5,600,811 4,935,907 4,448,006 3,998,198 3,605,678Total Debt and Shareholders’ Investment $ 6,225,651 $ 5,185,907 $ 4,698,006 $ 4,433,198 $ 3,855,678
Return on Invested Capital 16.50% 16.35% 19.04% 15.62% 15.79%
* Fiscal 2016 included 53 weeks.** Shares and per share figures have been restated to reflect the two-for-one stock split distributed on February 9, 2016.
*** Excluding earnings attributable to noncontrolling interests.
14
Item 7. MANAGEMENT’S DISCUSSION AND ANALYSIS OF FINANCIAL CONDITIONAND RESULTS OF OPERATIONS Executive Overview Fiscal 2018: The Company delivered record sales and earnings. The impact of the Tax Cuts and Jobs Act (Tax Act) along with strong performances by Refrigerated Foods and International & Other contributed to these results. These factors were able to offset continued weakness at JOTS, higher freight costs, and reduced sales and profitability from the CytoSport and contract manufacturing business in Grocery Products. Sales for the year were $9.5 billion, a 4 percent increase from last year. Organic net sales1 were down 1%. Diluted earnings per share for fiscal 2018 were $1.86, an 18 percent increase compared to $1.57 per share last year. Adjusted diluted earnings per share1 were $1.89, a 20 percent increase. Fiscal 2018 net earnings attributable to the Company increased 20 percent to $1,012.1 million, compared to net earnings of $846.7 million last year. (1see explanation of non-GAAP financial measures in the Consolidated Results section). Refrigerated Foods segment results exceeded last year with contributions from the Columbus and Fontanini acquisitions. Strength in value-added products such as Hormel® Natural Choice® and Hormel® FirebraisedTM Meats overcame lower commodity profits and higher freight expense. International & Other segment results surpassed last year due to strong growth from the China business, which benefited from lower input costs and the addition of the Ceratti acquisition. The JOTS segment continued to be negatively impacted by industry oversupply leading to low commodity prices in addition to increased freight. At the beginning of fiscal 2018, the Specialty Foods segment was merged into the Grocery Products segment. Despite sales growth of Wholly Guacamole® dips and Herdez® salsas, Grocery Products segment financial performance was down from fiscal 2017 as profits were impacted by weakness in the Company's contract manufacturing business, an impairment of the CytoSport trademark, and increased freight. Our Company continued to generate record operating cash flows, which were reinvested into the business through acquisitions and capital expenditures while returning cash back to shareholders in the form of dividends and share repurchases. We completed the acquisition of Columbus, an authentic, premium deli meat and salami company, for $857.4 million. This strategic acquisition positions us as a total deli solutions provider and enhances our other strong deli brands such as Hormel®, Jennie-O®, Applegate®, and DiLusso®. In connection with the acquisition, the Company borrowed $375.0 million under a term loan facility and $375.0 million under a revolving credit facility. As of the close of the year, we repaid the short-term debt. The annual dividend for 2019 will be $0.84 per share and marks the 53rd consecutive year of dividend increases, representing an increase of 12 percent after a 10 percent increase in fiscal 2018. We repurchased 1.4 million shares of common stock in fiscal 2018, spending $46.9 million. Fiscal 2019 Outlook: We expect to grow sales and operating profits in fiscal 2019, with each segment contributing to growth. Momentum in branded, value-added businesses within Refrigerated Foods, especially foodservice and our newly created deli division, should more than offset the expected decline in commodity profits, increased freight, and expenses associated with the divestiture of the Fremont facility. Innovation from brands including Hormel® Bacon 1TM, Hormel® Natural Choice®, and Hormel® Fire BraisedTM meats is expected to provide incremental growth. The contributions from branded items such as the SPAM® family of products, Wholly Guacamole® dips, Herdez® salsas, and Muscle Milk are expected to drive improved Grocery Products results. We expect the JOTS segment to return to growth as industry conditions improve. We anticipate value-added sales and volume growth led by Jennie-O® lean ground turkey and Jennie-O® Oven Ready® items. The International & Other segment plans to grow sales and earnings in both the China and Brazil businesses and expects to increase sales of the SPAM® and Skippy® families of products. Additionally, our supply chain organization is expected to provide cost reductions in numerous areas across the supply chain.
On December 3, 2018, the Company completed the sale of the Fremont processing facility with WholeStone Farms. The transaction included a processing facility and a multiyear agreement to supply the Company pork raw materials. Up until the date of sale, this facility manufactured and harvested hogs for processing. We plan to support our numerous iconic brands with continued advertising in fiscal 2019. Strong cash flow, along with a solid balance sheet, will enable us to continue to return cash to shareholders while investing capital into our value-added businesses. Critical Accounting Policies
This discussion and analysis of financial condition and results of operations is based upon the Company's consolidated financia statements, which have been prepared in accordance with U.S. generally accepted accounting principles (U.S. GAAP). The preparation of these financial statements requires the Company to make estimates and judgments that affect the reported amounts of assets, liabilities, revenues and expenses, and related disclosure of contingent assets and liabilities. The Company evaluates, on an ongoing basis, its estimates for reasonableness as changes occur in its business environment. The Company bases its estimates on experience, the use of independent third-party specialists, and various other assumptions believed to be reasonable under the circumstances, the results of which form the basis for making judgments about the carrying values of assets and liabilities not readily apparent from other sources. Actual results may differ materially from these estimates under different assumptions or conditions.
15
Critical accounting policies are defined as those reflective of significant judgments, estimates, and uncertainties, and potentially result in materially different results under different assumptions and conditions. The Company believes the following are its critical accounting policies: Revenue Recognition: The Company recognizes sales when title passes upon delivery of its products to customers, net of applicable provisions for discounts, returns, and allowances. Products are delivered upon receipt of customer purchase orders with acceptable terms, including price and reasonably assured collectability. The Company offers various sales incentives to customers and consumers. Incentives offered off-invoice include prompt pay allowances, will call allowances, spoilage allowances, and temporary price reductions. These incentives are recognized as reductions of revenue at the time title passes. Coupons are used as an incentive for consumers to purchase various products. The coupons reduce revenues at the time they are offered, based on estimated redemption rates. Promotional contracts are performed by customers to promote the Company’s products to consumers. These incentives reduce revenues at the time of performance through direct payments and accrued promotional funds. Accrued promotional funds are unpaid liabilities for promotional contracts in process or completed at the end of a quarter or fiscal year. Promotional contractual accruals are based on agreements with customers for defined performance. The liability relating to these agreements is based on a review of the outstanding contracts on which performance has taken place but which the promotional payments relating to such contracts remain unpaid as of the end of the fiscal year. The level of customer performance and the historical spend rate versus contracted rates are significant estimates used to determine these liabilities. Inventory Valuation: The Company values inventories at the lower of cost or net realizable value. For pork inventories, when the carcasses are disassembled and transferred from primal processing to various manufacturing departments, the primal values, as adjusted by the Company for product specifications and further processing, become the basis for calculating inventory values. Turkey raw materials are represented by the deboned meat quantities. The Company values these raw materials using a concept referred to as the “meat cost pool.” The meat cost pool is determined by combining the cost to grow turkeys with processing costs, less any net sales revenue from by-products created from the processing and not used in producing Company products. The Company has developed a series of ratios using historical data and current market conditions (which themselves involve estimates and judgment determinations by the Company) to allocate the meat cost pool to each meat component. Substantially all inventoriable expenses, meat, packaging, and supplies are valued by the average cost method. Goodwill and Other Indefinite-Lived Intangibles: Estimating the fair value of the Company’s goodwill reporting units and intangible assets requires significant judgement. Accordingly, the Company obtains the assistance of third-party valuation specialists who utilize available historical information along with future expectations to value the assets. Determining the useful life of an intangible asset also requires judgement. Certain acquired brands are expected to have indefinite lives based on their history and the Company’s plans to continue to support and build the brands. Other acquired assets such as customer relationships, are expected to have determinable useful lives. Indefinite-lived intangible assets are originally recorded at their estimated fair values at the date of acquisition and the residual of the purchase price is recorded to goodwill. Goodwill and other indefinite-lived intangible assets are allocated to reporting units that will receive the related sales and income. Goodwill and indefinite-lived intangible assets are tested annually for impairment, or more frequently if impairment indicators arise. In conducting the annual impairment test for goodwill, the Company has the option to first assess qualitative factors to determine whether it is more likely than not (> 50% likelihood) the fair value of any reporting unit is less than its carrying amount. If the Company elects to perform a qualitative assessment and determines an impairment is more likely than not, the Company is required to perform a quantitative impairment test. Otherwise, no further analysis is required. Alternatively, the Company may elect not to perform the qualitative assessment and proceed directly to the quantitative impairment test. Prior to the fourth quarter of fiscal 2017, if the carrying value of a reporting unit exceeded its fair value, the Company completed the second step of the test to determine the amount of goodwill impairment loss, if any, to be recognized. In the second step, the Company estimated an implied fair value of the reporting unit’s goodwill by allocating the fair value of the reporting unit to all of the assets and liabilities other than goodwill (including any unrecognized intangible assets). The impairment loss was equal to the excess of the carrying value of the goodwill over the implied fair value of that goodwill. In the fourth quarter of fiscal 2017, the Company adopted Accounting Standards Update (ASU) 2017-04, Simplifying the Test for Goodwill Impairment. As a result, the Company recognizes an impairment loss equal to the difference between the carrying value and estimated fair value of the reporting unit if the carrying value of a reporting unit exceeds its fair value. In conducting a qualitative assessment, the Company analyzes actual and projected growth trends for net sales, gross margin, and segment profit for each reporting unit, as well as historical performance versus plan and the results of prior quantitative tests performed. Additionally, the Company assesses critical areas that may impact its business, including macroeconomic conditions and the related impact, market-related exposures, any plans to market for sale all or a portion of their business, competitive changes, new or discontinued product lines, changes in key personnel, or any potential risks to their projected financial results. If performed, the quantitative goodwill impairment test is performed at the reporting unit level. First, the fair value of each reporting unit is compared to its corresponding carrying value, including goodwill. The fair value of each reporting unit is estimated using discounted cash flow valuations (Level 3), which incorporate assumptions regarding future growth rates,
16
terminal values, and discount rates. The estimates and assumptions used consider historical performance and are consistent with the assumptions used in determining future profit plans for each reporting unit, which are approved by the Company’s Board of Directors. If the quantitative assessment results in the carrying value exceeding the fair value of any reporting unit, then the results from the quantitative analysis will be relied upon to determine both the existence and amount of goodwill impairment. An impairment loss will be recognized for the amount by which the reporting unit’s carrying amount exceeds its fair value, not to exceed the carrying amount of goodwill in that reporting unit. During the fourth quarter of fiscal 2018, the Company completed its annual goodwill impairment tests and elected to perform a qualitative assessment. As a result of the qualitative testing during fiscal 2018 and 2016 and quantitative testing during fiscal 2017, no material goodwill impairment charges were recorded. An immaterial impairment charge was recorded in the second quarter of fiscal 2016 for the Company's Diamond Crystal Brands (DCB) business based on the agreed-upon sales price for the business. In conducting the annual impairment test for its indefinite-lived intangible assets, the Company first performs a qualitative assessment to determine whether it is more likely than not (> 50% likelihood) that an indefinite-lived intangible asset is impaired. If the Company concludes this is the case, then a quantitative test for impairment must be performed. Otherwise, the Company does not need to perform a quantitative test. In conducting the initial qualitative assessment, the Company analyzes growth rates for historical and projected net sales and the results of prior quantitative tests performed. Additionally, the Company assesses critical areas that may impact its intangible assets or the applicable royalty rates to determine if there are factors that could indicate impairment of the asset. If performed, the quantitative impairment test compares the fair value to the carrying value of the indefinite-lived intangible asset. The fair value of indefinite-lived intangible assets is primarily determined on the basis of estimated discounted value, using the relief from royalty method (Level 3). This method incorporates assumptions regarding future sales projections and discount rates. If the carrying value exceeds fair value, the indefinite-lived intangible asset is considered impaired and an impairment charge is recorded. Even if not required, the Company periodically elects to perform the quantitative test in order to confirm the qualitative assessment. During the 2017 annual impairment review, the Company completed a quantitative assessment of indefinite-lived intangible assets. As a result of the review, no material impairment charges were recorded; however, four trademarks were determined to have fair values exceeding their carrying values by less than a 10 percent margin. Due to the lack of excess value of these assets, the Company elected to test these assets using a quantitative analysis during fiscal 2018. For all other indefinite-lived intangible assets, the Company tested the assets using a qualitative analysis. During the qualitative review, it was determined that further assessment in the form of a quantitative test was necessary for two additional indefinite-lived intangible assets. In total, the Company performed a quantitative test for six trademarks in fiscal 2018, one of which was determined to be impaired. During the fourth quarter of fiscal 2018, a $17.3 million intangible asset impairment charge was recorded for the CytoSport trademark. As a result of the 2018 quantitative test, one trademark was determined to have fair value exceeding its carrying value by approximately a 10 percent margin. See additional discussion regarding the Company’s goodwill and intangible assets in Note D. During fiscal years 2018, 2017, and 2016, there were no other material remeasurements of assets or liabilities at fair value on a nonrecurring basis subsequent to their initial recognition. Employee Benefit Plans: The Company incurs expenses relating to employee benefits, such as noncontributory defined benefit pension plans and post-retirement health care benefits. In accounting for these employment costs, management must make a variety of assumptions and estimates including mortality rates, discount rates, overall compensation increases, expected return on plan assets, and health care cost trend rates. The Company considers historical data as well as current facts and circumstances when determining these estimates. The Company uses third-party specialists to assist management in the determination of these estimates and the calculation of certain employee benefit expenses and the outstanding obligation. Income Taxes: The Company records income taxes in accordance with the liability method of accounting. Deferred taxes are recognized for the estimated taxes ultimately payable or recoverable based on enacted tax law. Changes in enacted tax rates are reflected in the tax provision as they occur. Due to passage of the Tax Act, the tax provision at the end of fiscal 2018 was provisional. The Company will continue to refine such amounts within the measurement period allowed, which will be completed no later than the first quarter of fiscal 2019. The Company computes its provision for income taxes based on the statutory tax rates and tax planning opportunities available to it in the various jurisdictions in which it operates. Significant judgment is required in evaluating the Company’s tax positions and determining its annual tax provision. While the Company considers all of its tax positions fully supportable, the Company is occasionally challenged by various tax authorities regarding the amount of taxes due. The Company recognizes a tax position in its financial statements when it is more likely than not the position will be sustained upon examination, based on the technical merits of the position. This position is then measured at the largest amount of benefit that is greater than 50 percent likely of being realized upon ultimate settlement. A change in judgment related to the expected ultimate resolution of uncertain tax positions will be recognized in earnings in the quarter of such change. Contingent Liabilities: At any time, the Company may be subject to investigations, legal proceedings, or claims related to the on-going operation of its business, including claims both by and against the Company. Such proceedings typically involve claims
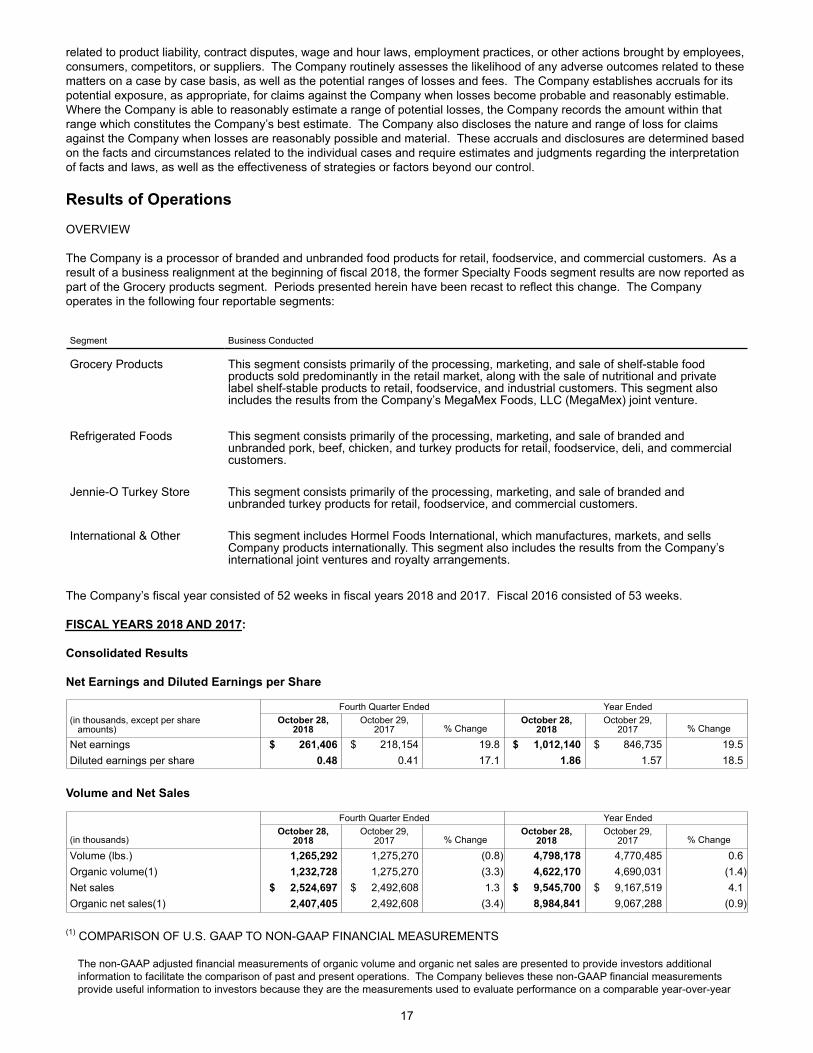
17
related to product liability, contract disputes, wage and hour laws, employment practices, or other actions brought by employees, consumers, competitors, or suppliers. The Company routinely assesses the likelihood of any adverse outcomes related to these matters on a case by case basis, as well as the potential ranges of losses and fees. The Company establishes accruals for its potential exposure, as appropriate, for claims against the Company when losses become probable and reasonably estimable. Where the Company is able to reasonably estimate a range of potential losses, the Company records the amount within that range which constitutes the Company’s best estimate. The Company also discloses the nature and range of loss for claims against the Company when losses are reasonably possible and material. These accruals and disclosures are determined based on the facts and circumstances related to the individual cases and require estimates and judgments regarding the interpretation of facts and laws, as well as the effectiveness of strategies or factors beyond our control. Results of Operations
OVERVIEW
The Company is a processor of branded and unbranded food products for retail, foodservice, and commercial customers. As a result of a business realignment at the beginning of fiscal 2018, the former Specialty Foods segment results are now reported as part of the Grocery products segment. Periods presented herein have been recast to reflect this change. The Company operates in the following four reportable segments:
Segment Business Conducted
Grocery Products This segment consists primarily of the processing, marketing, and sale of shelf-stable foodproducts sold predominantly in the retail market, along with the sale of nutritional and privatelabel shelf-stable products to retail, foodservice, and industrial customers. This segment alsoincludes the results from the Company’s MegaMex Foods, LLC (MegaMex) joint venture.
Refrigerated Foods This segment consists primarily of the processing, marketing, and sale of branded andunbranded pork, beef, chicken, and turkey products for retail, foodservice, deli, and commercialcustomers.
Jennie-O Turkey Store This segment consists primarily of the processing, marketing, and sale of branded andunbranded turkey products for retail, foodservice, and commercial customers.
International & Other This segment includes Hormel Foods International, which manufactures, markets, and sellsCompany products internationally. This segment also includes the results from the Company’sinternational joint ventures and royalty arrangements.
The Company’s fiscal year consisted of 52 weeks in fiscal years 2018 and 2017. Fiscal 2016 consisted of 53 weeks.
FISCAL YEARS 2018 AND 2017:
Consolidated Results
Net Earnings and Diluted Earnings per Share
Fourth Quarter Ended Year Ended(in thousands, except per share amounts)
October 28,2018
October 29,2017 % Change
October 28,2018
October 29,2017 % Change
Net earnings $ 261,406 $ 218,154 19.8 $ 1,012,140 $ 846,735 19.5Diluted earnings per share 0.48 0.41 17.1 1.86 1.57 18.5
Volume and Net Sales
Fourth Quarter Ended Year Ended
(in thousands)October 28,
2018October 29,
2017 % ChangeOctober 28,
2018October 29,
2017 % Change
Volume (lbs.) 1,265,292 1,275,270 (0.8) 4,798,178 4,770,485 0.6Organic volume(1) 1,232,728 1,275,270 (3.3) 4,622,170 4,690,031 (1.4)Net sales $ 2,524,697 $ 2,492,608 1.3 $ 9,545,700 $ 9,167,519 4.1Organic net sales(1) 2,407,405 2,492,608 (3.4) 8,984,841 9,067,288 (0.9)
(1) COMPARISON OF U.S. GAAP TO NON-GAAP FINANCIAL MEASUREMENTS
The non-GAAP adjusted financial measurements of organic volume and organic net sales are presented to provide investors additional information to facilitate the comparison of past and present operations. The Company believes these non-GAAP financial measurements provide useful information to investors because they are the measurements used to evaluate performance on a comparable year-over-year
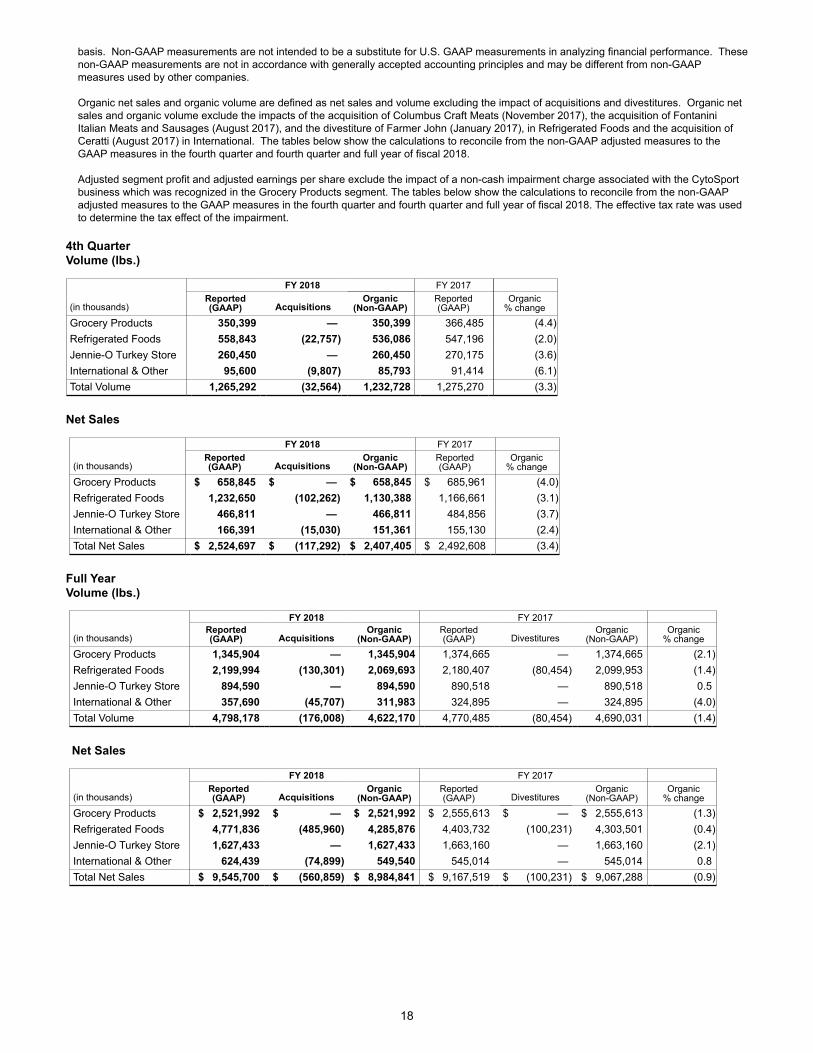
18
basis. Non-GAAP measurements are not intended to be a substitute for U.S. GAAP measurements in analyzing financial performance. These non-GAAP measurements are not in accordance with generally accepted accounting principles and may be different from non-GAAP measures used by other companies. Organic net sales and organic volume are defined as net sales and volume excluding the impact of acquisitions and divestitures. Organic net sales and organic volume exclude the impacts of the acquisition of Columbus Craft Meats (November 2017), the acquisition of Fontanini Italian Meats and Sausages (August 2017), and the divestiture of Farmer John (January 2017), in Refrigerated Foods and the acquisition of Ceratti (August 2017) in International. The tables below show the calculations to reconcile from the non-GAAP adjusted measures to the GAAP measures in the fourth quarter and fourth quarter and full year of fiscal 2018.
Adjusted segment profit and adjusted earnings per share exclude the impact of a non-cash impairment charge associated with the CytoSport business which was recognized in the Grocery Products segment. The tables below show the calculations to reconcile from the non-GAAP adjusted measures to the GAAP measures in the fourth quarter and fourth quarter and full year of fiscal 2018. The effective tax rate was used to determine the tax effect of the impairment.
4th QuarterVolume (lbs.)
FY 2018 FY 2017
(in thousands)Reported(GAAP) Acquisitions
Organic(Non-GAAP)
Reported(GAAP)
Organic% change
Grocery Products 350,399 — 350,399 366,485 (4.4)Refrigerated Foods 558,843 (22,757) 536,086 547,196 (2.0)Jennie-O Turkey Store 260,450 — 260,450 270,175 (3.6)International & Other 95,600 (9,807) 85,793 91,414 (6.1)Total Volume 1,265,292 (32,564) 1,232,728 1,275,270 (3.3)
Net Sales
FY 2018 FY 2017
(in thousands)Reported(GAAP) Acquisitions
Organic(Non-GAAP)
Reported(GAAP)
Organic% change
Grocery Products $ 658,845 $ — $ 658,845 $ 685,961 (4.0)Refrigerated Foods 1,232,650 (102,262) 1,130,388 1,166,661 (3.1)Jennie-O Turkey Store 466,811 — 466,811 484,856 (3.7)International & Other 166,391 (15,030) 151,361 155,130 (2.4)Total Net Sales $ 2,524,697 $ (117,292) $ 2,407,405 $ 2,492,608 (3.4)
Full YearVolume (lbs.)
FY 2018 FY 2017
(in thousands)Reported(GAAP) Acquisitions
Organic(Non-GAAP)
Reported(GAAP) Divestitures
Organic(Non-GAAP)
Organic% change
Grocery Products 1,345,904 — 1,345,904 1,374,665 — 1,374,665 (2.1)Refrigerated Foods 2,199,994 (130,301) 2,069,693 2,180,407 (80,454) 2,099,953 (1.4)Jennie-O Turkey Store 894,590 — 894,590 890,518 — 890,518 0.5International & Other 357,690 (45,707) 311,983 324,895 — 324,895 (4.0)Total Volume 4,798,178 (176,008) 4,622,170 4,770,485 (80,454) 4,690,031 (1.4)
Net Sales
FY 2018 FY 2017
(in thousands)Reported(GAAP) Acquisitions
Organic(Non-GAAP)
Reported(GAAP) Divestitures
Organic(Non-GAAP)
Organic% change
Grocery Products $ 2,521,992 $ — $ 2,521,992 $ 2,555,613 $ — $ 2,555,613 (1.3)Refrigerated Foods 4,771,836 (485,960) 4,285,876 4,403,732 (100,231) 4,303,501 (0.4)Jennie-O Turkey Store 1,627,433 — 1,627,433 1,663,160 — 1,663,160 (2.1)International & Other 624,439 (74,899) 549,540 545,014 — 545,014 0.8Total Net Sales $ 9,545,700 $ (560,859) $ 8,984,841 $ 9,167,519 $ (100,231) $ 9,067,288 (0.9)
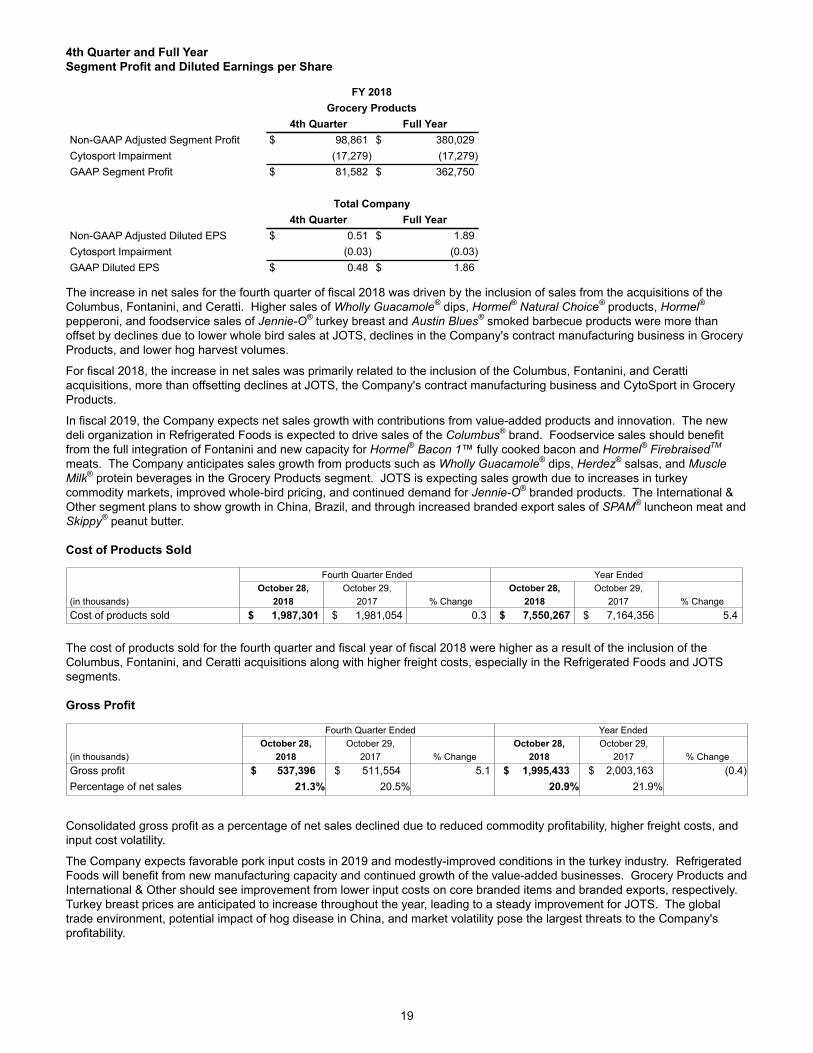
19
4th Quarter and Full YearSegment Profit and Diluted Earnings per Share
FY 2018Grocery Products
4th Quarter Full YearNon-GAAP Adjusted Segment Profit $ 98,861 $ 380,029Cytosport Impairment (17,279) (17,279)GAAP Segment Profit $ 81,582 $ 362,750
Total Company4th Quarter Full Year
Non-GAAP Adjusted Diluted EPS $ 0.51 $ 1.89Cytosport Impairment (0.03) (0.03)GAAP Diluted EPS $ 0.48 $ 1.86
The increase in net sales for the fourth quarter of fiscal 2018 was driven by the inclusion of sales from the acquisitions of the Columbus, Fontanini, and Ceratti. Higher sales of Wholly Guacamole® dips, Hormel® Natural Choice® products, Hormel® pepperoni, and foodservice sales of Jennie-O® turkey breast and Austin Blues® smoked barbecue products were more than offset by declines due to lower whole bird sales at JOTS, declines in the Company's contract manufacturing business in Grocery Products, and lower hog harvest volumes.
For fiscal 2018, the increase in net sales was primarily related to the inclusion of the Columbus, Fontanini, and Ceratti acquisitions, more than offsetting declines at JOTS, the Company's contract manufacturing business and CytoSport in Grocery Products.
In fiscal 2019, the Company expects net sales growth with contributions from value-added products and innovation. The new deli organization in Refrigerated Foods is expected to drive sales of the Columbus® brand. Foodservice sales should benefit from the full integration of Fontanini and new capacity for Hormel® Bacon 1™ fully cooked bacon and Hormel® FirebraisedTM meats. The Company anticipates sales growth from products such as Wholly Guacamole® dips, Herdez® salsas, and Muscle Milk® protein beverages in the Grocery Products segment. JOTS is expecting sales growth due to increases in turkey commodity markets, improved whole-bird pricing, and continued demand for Jennie-O® branded products. The International & Other segment plans to show growth in China, Brazil, and through increased branded export sales of SPAM® luncheon meat and Skippy® peanut butter.
Cost of Products Sold
Fourth Quarter Ended Year EndedOctober 28, October 29, October 28, October 29,
(in thousands) 2018 2017 % Change 2018 2017 % ChangeCost of products sold $ 1,987,301 $ 1,981,054 0.3 $ 7,550,267 $ 7,164,356 5.4
The cost of products sold for the fourth quarter and fiscal year of fiscal 2018 were higher as a result of the inclusion of the Columbus, Fontanini, and Ceratti acquisitions along with higher freight costs, especially in the Refrigerated Foods and JOTS segments.
Gross Profit
Fourth Quarter Ended Year EndedOctober 28, October 29, October 28, October 29,
(in thousands) 2018 2017 % Change 2018 2017 % ChangeGross profit $ 537,396 $ 511,554 5.1 $ 1,995,433 $ 2,003,163 (0.4)Percentage of net sales 21.3% 20.5% 20.9% 21.9%
Consolidated gross profit as a percentage of net sales declined due to reduced commodity profitability, higher freight costs, and input cost volatility.
The Company expects favorable pork input costs in 2019 and modestly-improved conditions in the turkey industry. Refrigerated Foods will benefit from new manufacturing capacity and continued growth of the value-added businesses. Grocery Products and International & Other should see improvement from lower input costs on core branded items and branded exports, respectively. Turkey breast prices are anticipated to increase throughout the year, leading to a steady improvement for JOTS. The global trade environment, potential impact of hog disease in China, and market volatility pose the largest threats to the Company's profitability.
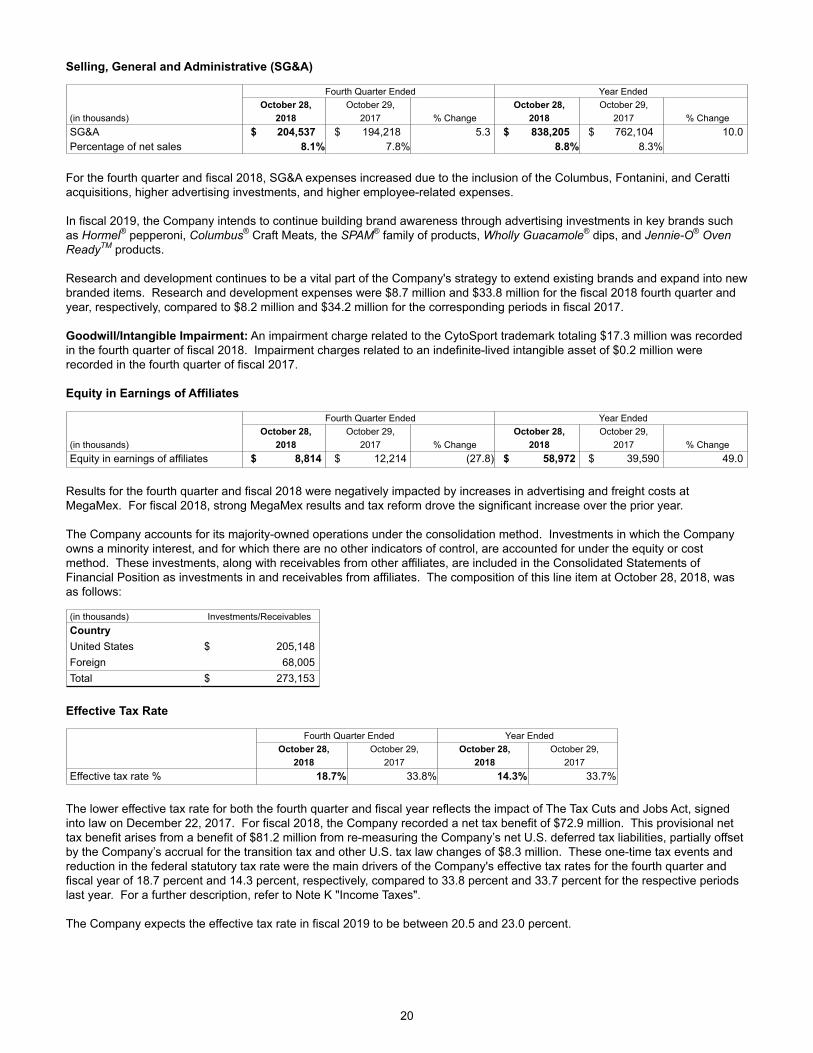
20
Selling, General and Administrative (SG&A)
Fourth Quarter Ended Year EndedOctober 28, October 29, October 28, October 29,
(in thousands) 2018 2017 % Change 2018 2017 % ChangeSG&A $ 204,537 $ 194,218 5.3 $ 838,205 $ 762,104 10.0Percentage of net sales 8.1% 7.8% 8.8% 8.3%
For the fourth quarter and fiscal 2018, SG&A expenses increased due to the inclusion of the Columbus, Fontanini, and Ceratti acquisitions, higher advertising investments, and higher employee-related expenses.
In fiscal 2019, the Company intends to continue building brand awareness through advertising investments in key brands such as Hormel® pepperoni, Columbus® Craft Meats, the SPAM® family of products, Wholly Guacamole® dips, and Jennie-O® Oven ReadyTM products.
Research and development continues to be a vital part of the Company's strategy to extend existing brands and expand into new branded items. Research and development expenses were $8.7 million and $33.8 million for the fiscal 2018 fourth quarter and year, respectively, compared to $8.2 million and $34.2 million for the corresponding periods in fiscal 2017.
Goodwill/Intangible Impairment: An impairment charge related to the CytoSport trademark totaling $17.3 million was recorded in the fourth quarter of fiscal 2018. Impairment charges related to an indefinite-lived intangible asset of $0.2 million were recorded in the fourth quarter of fiscal 2017.
Equity in Earnings of Affiliates
Fourth Quarter Ended Year EndedOctober 28, October 29, October 28, October 29,
(in thousands) 2018 2017 % Change 2018 2017 % ChangeEquity in earnings of affiliates $ 8,814 $ 12,214 (27.8) $ 58,972 $ 39,590 49.0
Results for the fourth quarter and fiscal 2018 were negatively impacted by increases in advertising and freight costs at MegaMex. For fiscal 2018, strong MegaMex results and tax reform drove the significant increase over the prior year.
The Company accounts for its majority-owned operations under the consolidation method. Investments in which the Company owns a minority interest, and for which there are no other indicators of control, are accounted for under the equity or cost method. These investments, along with receivables from other affiliates, are included in the Consolidated Statements of Financial Position as investments in and receivables from affiliates. The composition of this line item at October 28, 2018, was as follows:
(in thousands) Investments/ReceivablesCountry United States $ 205,148Foreign 68,005Total $ 273,153
Effective Tax Rate
Fourth Quarter Ended Year EndedOctober 28, October 29, October 28, October 29,
2018 2017 2018 2017Effective tax rate % 18.7% 33.8% 14.3% 33.7%
The lower effective tax rate for both the fourth quarter and fiscal year reflects the impact of The Tax Cuts and Jobs Act, signed into law on December 22, 2017. For fiscal 2018, the Company recorded a net tax benefit of $72.9 million. This provisional net tax benefit arises from a benefit of $81.2 million from re-measuring the Company’s net U.S. deferred tax liabilities, partially offset by the Company’s accrual for the transition tax and other U.S. tax law changes of $8.3 million. These one-time tax events and reduction in the federal statutory tax rate were the main drivers of the Company's effective tax rates for the fourth quarter and fiscal year of 18.7 percent and 14.3 percent, respectively, compared to 33.8 percent and 33.7 percent for the respective periods last year. For a further description, refer to Note K "Income Taxes".
The Company expects the effective tax rate in fiscal 2019 to be between 20.5 and 23.0 percent.
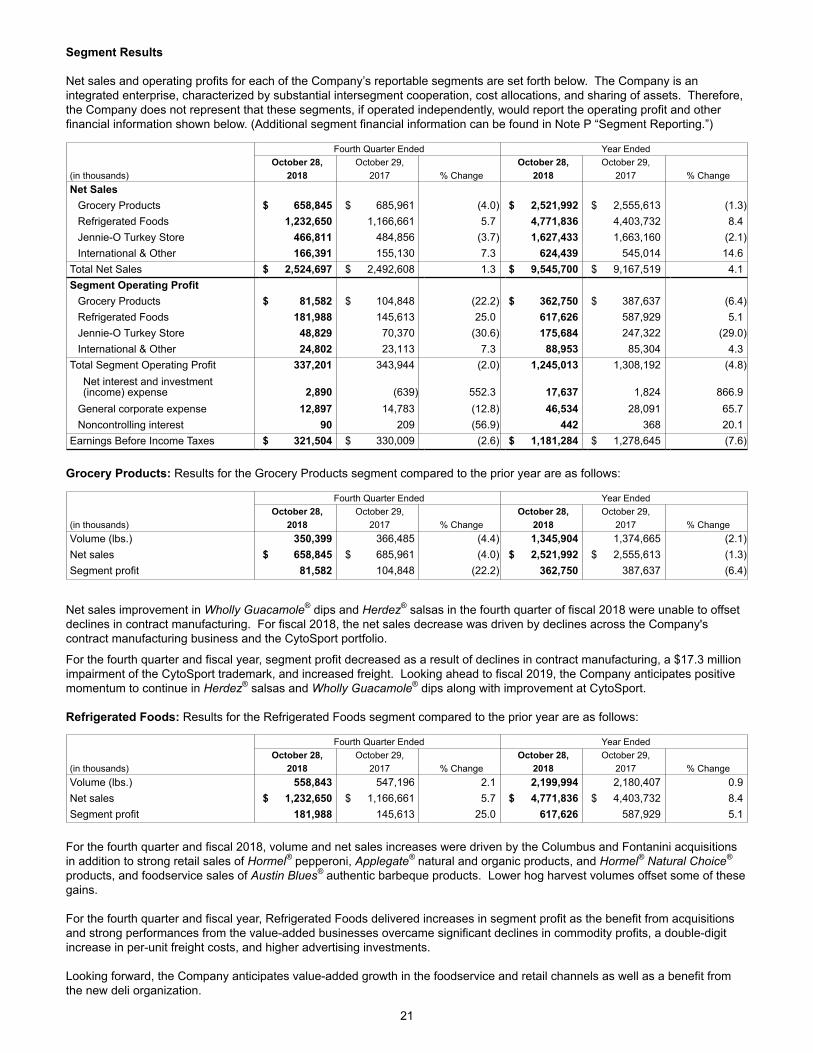
21
Segment Results Net sales and operating profits for each of the Company’s reportable segments are set forth below. The Company is an integrated enterprise, characterized by substantial intersegment cooperation, cost allocations, and sharing of assets. Therefore, the Company does not represent that these segments, if operated independently, would report the operating profit and other financial information shown below. (Additional segment financial information can be found in Note P “Segment Reporting.”)
Fourth Quarter Ended Year Ended October 28, October 29, October 28, October 29, (in thousands) 2018 2017 % Change 2018 2017 % ChangeNet Sales
Grocery Products $ 658,845 $ 685,961 (4.0) $ 2,521,992 $ 2,555,613 (1.3)Refrigerated Foods 1,232,650 1,166,661 5.7 4,771,836 4,403,732 8.4Jennie-O Turkey Store 466,811 484,856 (3.7) 1,627,433 1,663,160 (2.1)International & Other 166,391 155,130 7.3 624,439 545,014 14.6
Total Net Sales $ 2,524,697 $ 2,492,608 1.3 $ 9,545,700 $ 9,167,519 4.1Segment Operating Profit
Grocery Products $ 81,582 $ 104,848 (22.2) $ 362,750 $ 387,637 (6.4)Refrigerated Foods 181,988 145,613 25.0 617,626 587,929 5.1Jennie-O Turkey Store 48,829 70,370 (30.6) 175,684 247,322 (29.0)International & Other 24,802 23,113 7.3 88,953 85,304 4.3
Total Segment Operating Profit 337,201 343,944 (2.0) 1,245,013 1,308,192 (4.8)Net interest and investment(income) expense 2,890 (639) 552.3 17,637 1,824 866.9
General corporate expense 12,897 14,783 (12.8) 46,534 28,091 65.7Noncontrolling interest 90 209 (56.9) 442 368 20.1
Earnings Before Income Taxes $ 321,504 $ 330,009 (2.6) $ 1,181,284 $ 1,278,645 (7.6)
Grocery Products: Results for the Grocery Products segment compared to the prior year are as follows:
Fourth Quarter Ended Year Ended October 28, October 29, October 28, October 29, (in thousands) 2018 2017 % Change 2018 2017 % ChangeVolume (lbs.) 350,399 366,485 (4.4) 1,345,904 1,374,665 (2.1)Net sales $ 658,845 $ 685,961 (4.0) $ 2,521,992 $ 2,555,613 (1.3)Segment profit 81,582 104,848 (22.2) 362,750 387,637 (6.4)
Net sales improvement in Wholly Guacamole® dips and Herdez® salsas in the fourth quarter of fiscal 2018 were unable to offset declines in contract manufacturing. For fiscal 2018, the net sales decrease was driven by declines across the Company's contract manufacturing business and the CytoSport portfolio.
For the fourth quarter and fiscal year, segment profit decreased as a result of declines in contract manufacturing, a $17.3 million impairment of the CytoSport trademark, and increased freight. Looking ahead to fiscal 2019, the Company anticipates positive momentum to continue in Herdez® salsas and Wholly Guacamole® dips along with improvement at CytoSport.
Refrigerated Foods: Results for the Refrigerated Foods segment compared to the prior year are as follows:
Fourth Quarter Ended Year Ended October 28, October 29, October 28, October 29, (in thousands) 2018 2017 % Change 2018 2017 % ChangeVolume (lbs.) 558,843 547,196 2.1 2,199,994 2,180,407 0.9Net sales $ 1,232,650 $ 1,166,661 5.7 $ 4,771,836 $ 4,403,732 8.4Segment profit 181,988 145,613 25.0 617,626 587,929 5.1
For the fourth quarter and fiscal 2018, volume and net sales increases were driven by the Columbus and Fontanini acquisitions in addition to strong retail sales of Hormel® pepperoni, Applegate® natural and organic products, and Hormel® Natural Choice®
products, and foodservice sales of Austin Blues® authentic barbeque products. Lower hog harvest volumes offset some of these gains.
For the fourth quarter and fiscal year, Refrigerated Foods delivered increases in segment profit as the benefit from acquisitions and strong performances from the value-added businesses overcame significant declines in commodity profits, a double-digit increase in per-unit freight costs, and higher advertising investments. Looking forward, the Company anticipates value-added growth in the foodservice and retail channels as well as a benefit from the new deli organization.
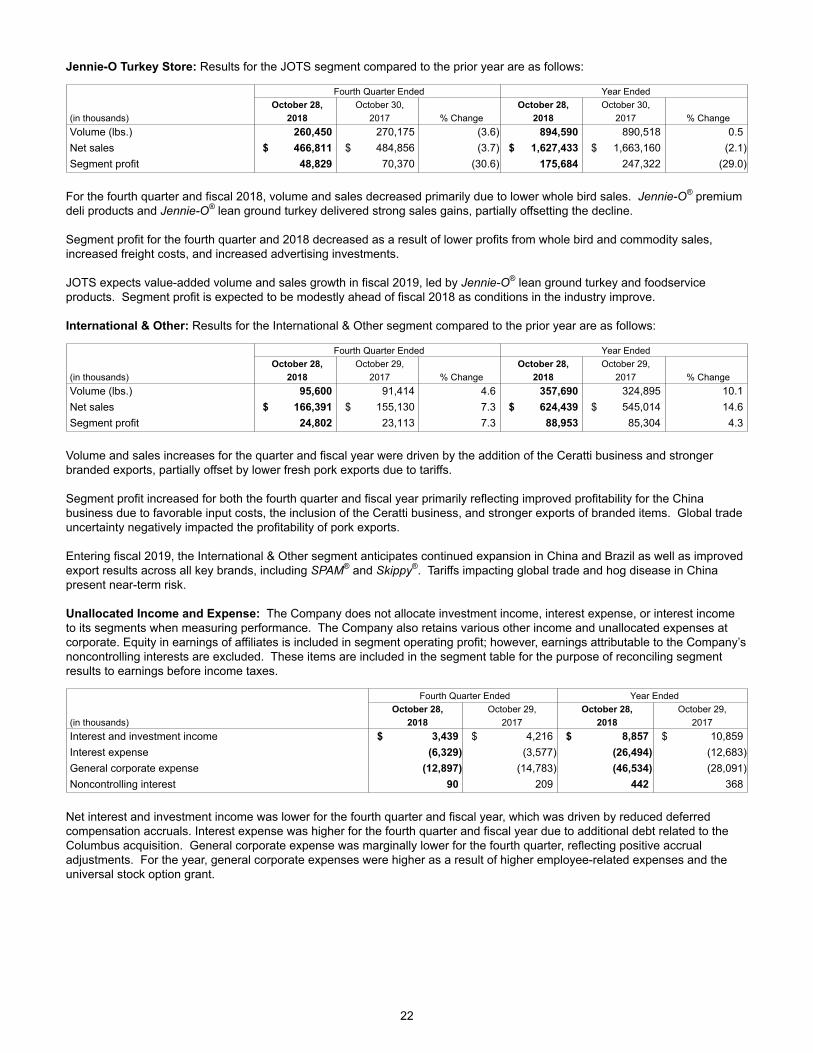
22
Jennie-O Turkey Store: Results for the JOTS segment compared to the prior year are as follows:
Fourth Quarter Ended Year Ended October 28, October 30, October 28, October 30, (in thousands) 2018 2017 % Change 2018 2017 % ChangeVolume (lbs.) 260,450 270,175 (3.6) 894,590 890,518 0.5Net sales $ 466,811 $ 484,856 (3.7) $ 1,627,433 $ 1,663,160 (2.1)Segment profit 48,829 70,370 (30.6) 175,684 247,322 (29.0)
For the fourth quarter and fiscal 2018, volume and sales decreased primarily due to lower whole bird sales. Jennie-O® premium deli products and Jennie-O® lean ground turkey delivered strong sales gains, partially offsetting the decline.
Segment profit for the fourth quarter and 2018 decreased as a result of lower profits from whole bird and commodity sales, increased freight costs, and increased advertising investments.
JOTS expects value-added volume and sales growth in fiscal 2019, led by Jennie-O® lean ground turkey and foodservice products. Segment profit is expected to be modestly ahead of fiscal 2018 as conditions in the industry improve.
International & Other: Results for the International & Other segment compared to the prior year are as follows:
Fourth Quarter Ended Year Ended October 28, October 29, October 28, October 29, (in thousands) 2018 2017 % Change 2018 2017 % ChangeVolume (lbs.) 95,600 91,414 4.6 357,690 324,895 10.1Net sales $ 166,391 $ 155,130 7.3 $ 624,439 $ 545,014 14.6Segment profit 24,802 23,113 7.3 88,953 85,304 4.3
Volume and sales increases for the quarter and fiscal year were driven by the addition of the Ceratti business and stronger branded exports, partially offset by lower fresh pork exports due to tariffs.
Segment profit increased for both the fourth quarter and fiscal year primarily reflecting improved profitability for the China business due to favorable input costs, the inclusion of the Ceratti business, and stronger exports of branded items. Global trade uncertainty negatively impacted the profitability of pork exports.
Entering fiscal 2019, the International & Other segment anticipates continued expansion in China and Brazil as well as improved export results across all key brands, including SPAM® and Skippy®. Tariffs impacting global trade and hog disease in China present near-term risk.
Unallocated Income and Expense: The Company does not allocate investment income, interest expense, or interest income to its segments when measuring performance. The Company also retains various other income and unallocated expenses at corporate. Equity in earnings of affiliates is included in segment operating profit; however, earnings attributable to the Company’s noncontrolling interests are excluded. These items are included in the segment table for the purpose of reconciling segment results to earnings before income taxes.
Fourth Quarter Ended Year Ended October 28, October 29, October 28, October 29,(in thousands) 2018 2017 2018 2017Interest and investment income $ 3,439 $ 4,216 $ 8,857 $ 10,859Interest expense (6,329) (3,577) (26,494) (12,683)General corporate expense (12,897) (14,783) (46,534) (28,091)Noncontrolling interest 90 209 442 368
Net interest and investment income was lower for the fourth quarter and fiscal year, which was driven by reduced deferred compensation accruals. Interest expense was higher for the fourth quarter and fiscal year due to additional debt related to the Columbus acquisition. General corporate expense was marginally lower for the fourth quarter, reflecting positive accrual adjustments. For the year, general corporate expenses were higher as a result of higher employee-related expenses and the universal stock option grant.
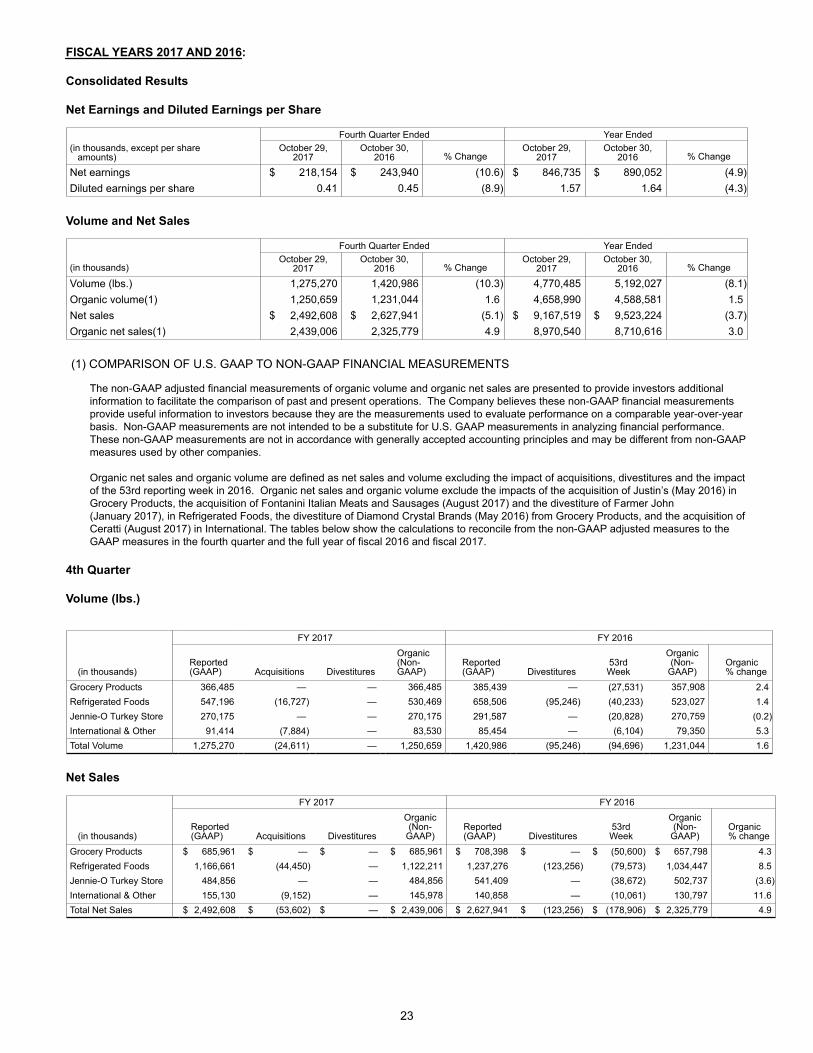
23
FISCAL YEARS 2017 AND 2016: Consolidated Results Net Earnings and Diluted Earnings per Share
Fourth Quarter Ended Year Ended(in thousands, except per share amounts)
October 29,2017
October 30,2016 % Change
October 29,2017
October 30,2016 % Change
Net earnings $ 218,154 $ 243,940 (10.6) $ 846,735 $ 890,052 (4.9)Diluted earnings per share 0.41 0.45 (8.9) 1.57 1.64 (4.3)
Volume and Net Sales
Fourth Quarter Ended Year Ended
(in thousands)October 29,
2017October 30,
2016 % ChangeOctober 29,
2017October 30,
2016 % Change
Volume (lbs.) 1,275,270 1,420,986 (10.3) 4,770,485 5,192,027 (8.1)Organic volume(1) 1,250,659 1,231,044 1.6 4,658,990 4,588,581 1.5Net sales $ 2,492,608 $ 2,627,941 (5.1) $ 9,167,519 $ 9,523,224 (3.7)Organic net sales(1) 2,439,006 2,325,779 4.9 8,970,540 8,710,616 3.0
(1) COMPARISON OF U.S. GAAP TO NON-GAAP FINANCIAL MEASUREMENTS
The non-GAAP adjusted financial measurements of organic volume and organic net sales are presented to provide investors additional information to facilitate the comparison of past and present operations. The Company believes these non-GAAP financial measurements provide useful information to investors because they are the measurements used to evaluate performance on a comparable year-over-year basis. Non-GAAP measurements are not intended to be a substitute for U.S. GAAP measurements in analyzing financial performance. These non-GAAP measurements are not in accordance with generally accepted accounting principles and may be different from non-GAAP measures used by other companies. Organic net sales and organic volume are defined as net sales and volume excluding the impact of acquisitions, divestitures and the impact of the 53rd reporting week in 2016. Organic net sales and organic volume exclude the impacts of the acquisition of Justin’s (May 2016) in Grocery Products, the acquisition of Fontanini Italian Meats and Sausages (August 2017) and the divestiture of Farmer John (January 2017), in Refrigerated Foods, the divestiture of Diamond Crystal Brands (May 2016) from Grocery Products, and the acquisition of Ceratti (August 2017) in International. The tables below show the calculations to reconcile from the non-GAAP adjusted measures to the GAAP measures in the fourth quarter and the full year of fiscal 2016 and fiscal 2017.
4th Quarter
Volume (lbs.)
FY 2017 FY 2016
(in thousands)Reported(GAAP) Acquisitions Divestitures
Organic(Non-GAAP)
Reported(GAAP) Divestitures
53rdWeek
Organic(Non-
GAAP)Organic% change
Grocery Products 366,485 — — 366,485 385,439 — (27,531) 357,908 2.4Refrigerated Foods 547,196 (16,727) — 530,469 658,506 (95,246) (40,233) 523,027 1.4Jennie-O Turkey Store 270,175 — — 270,175 291,587 — (20,828) 270,759 (0.2)International & Other 91,414 (7,884) — 83,530 85,454 — (6,104) 79,350 5.3Total Volume 1,275,270 (24,611) — 1,250,659 1,420,986 (95,246) (94,696) 1,231,044 1.6
Net Sales
FY 2017 FY 2016
(in thousands)Reported(GAAP) Acquisitions Divestitures
Organic(Non-
GAAP)Reported(GAAP) Divestitures
53rdWeek
Organic(Non-
GAAP)Organic% change
Grocery Products $ 685,961 $ — $ — $ 685,961 $ 708,398 $ — $ (50,600) $ 657,798 4.3Refrigerated Foods 1,166,661 (44,450) — 1,122,211 1,237,276 (123,256) (79,573) 1,034,447 8.5Jennie-O Turkey Store 484,856 — — 484,856 541,409 — (38,672) 502,737 (3.6)International & Other 155,130 (9,152) — 145,978 140,858 — (10,061) 130,797 11.6Total Net Sales $ 2,492,608 $ (53,602) $ — $ 2,439,006 $ 2,627,941 $ (123,256) $ (178,906) $ 2,325,779 4.9
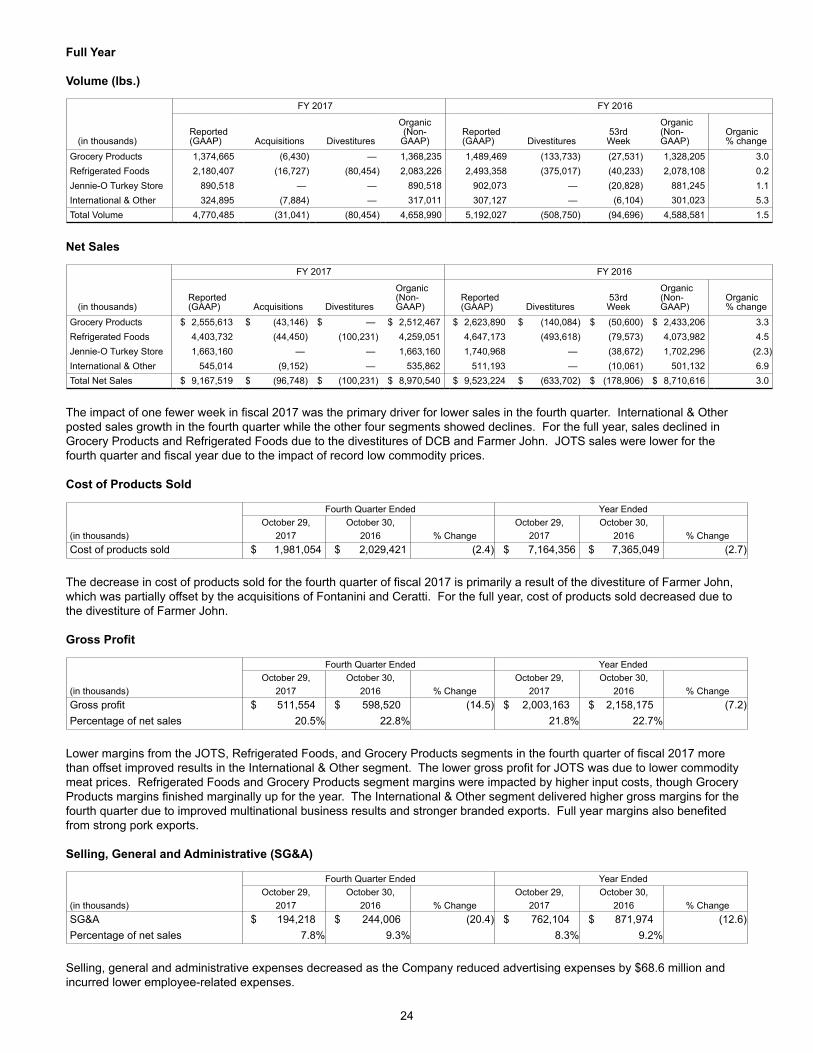
24
Full Year
Volume (lbs.)
FY 2017 FY 2016
(in thousands)Reported(GAAP) Acquisitions Divestitures
Organic(Non-
GAAP)Reported(GAAP) Divestitures
53rdWeek
Organic(Non-GAAP)
Organic% change
Grocery Products 1,374,665 (6,430) — 1,368,235 1,489,469 (133,733) (27,531) 1,328,205 3.0Refrigerated Foods 2,180,407 (16,727) (80,454) 2,083,226 2,493,358 (375,017) (40,233) 2,078,108 0.2Jennie-O Turkey Store 890,518 — — 890,518 902,073 — (20,828) 881,245 1.1International & Other 324,895 (7,884) — 317,011 307,127 — (6,104) 301,023 5.3Total Volume 4,770,485 (31,041) (80,454) 4,658,990 5,192,027 (508,750) (94,696) 4,588,581 1.5
Net Sales
FY 2017 FY 2016
(in thousands)Reported(GAAP) Acquisitions Divestitures
Organic(Non-GAAP)
Reported(GAAP) Divestitures
53rdWeek
Organic(Non-GAAP)
Organic% change
Grocery Products $ 2,555,613 $ (43,146) $ — $ 2,512,467 $ 2,623,890 $ (140,084) $ (50,600) $ 2,433,206 3.3Refrigerated Foods 4,403,732 (44,450) (100,231) 4,259,051 4,647,173 (493,618) (79,573) 4,073,982 4.5Jennie-O Turkey Store 1,663,160 — — 1,663,160 1,740,968 — (38,672) 1,702,296 (2.3)International & Other 545,014 (9,152) — 535,862 511,193 — (10,061) 501,132 6.9Total Net Sales $ 9,167,519 $ (96,748) $ (100,231) $ 8,970,540 $ 9,523,224 $ (633,702) $ (178,906) $ 8,710,616 3.0
The impact of one fewer week in fiscal 2017 was the primary driver for lower sales in the fourth quarter. International & Other posted sales growth in the fourth quarter while the other four segments showed declines. For the full year, sales declined in Grocery Products and Refrigerated Foods due to the divestitures of DCB and Farmer John. JOTS sales were lower for the fourth quarter and fiscal year due to the impact of record low commodity prices.
Cost of Products Sold
Fourth Quarter Ended Year EndedOctober 29, October 30, October 29, October 30,
(in thousands) 2017 2016 % Change 2017 2016 % ChangeCost of products sold $ 1,981,054 $ 2,029,421 (2.4) $ 7,164,356 $ 7,365,049 (2.7)
The decrease in cost of products sold for the fourth quarter of fiscal 2017 is primarily a result of the divestiture of Farmer John, which was partially offset by the acquisitions of Fontanini and Ceratti. For the full year, cost of products sold decreased due to the divestiture of Farmer John. Gross Profit
Fourth Quarter Ended Year EndedOctober 29, October 30, October 29, October 30,
(in thousands) 2017 2016 % Change 2017 2016 % ChangeGross profit $ 511,554 $ 598,520 (14.5) $ 2,003,163 $ 2,158,175 (7.2)Percentage of net sales 20.5% 22.8% 21.8% 22.7%
Lower margins from the JOTS, Refrigerated Foods, and Grocery Products segments in the fourth quarter of fiscal 2017 more than offset improved results in the International & Other segment. The lower gross profit for JOTS was due to lower commodity meat prices. Refrigerated Foods and Grocery Products segment margins were impacted by higher input costs, though Grocery Products margins finished marginally up for the year. The International & Other segment delivered higher gross margins for the fourth quarter due to improved multinational business results and stronger branded exports. Full year margins also benefited from strong pork exports. Selling, General and Administrative (SG&A)
Fourth Quarter Ended Year EndedOctober 29, October 30, October 29, October 30,
(in thousands) 2017 2016 % Change 2017 2016 % ChangeSG&A $ 194,218 $ 244,006 (20.4) $ 762,104 $ 871,974 (12.6)Percentage of net sales 7.8% 9.3% 8.3% 9.2%
Selling, general and administrative expenses decreased as the Company reduced advertising expenses by $68.6 million and incurred lower employee-related expenses.
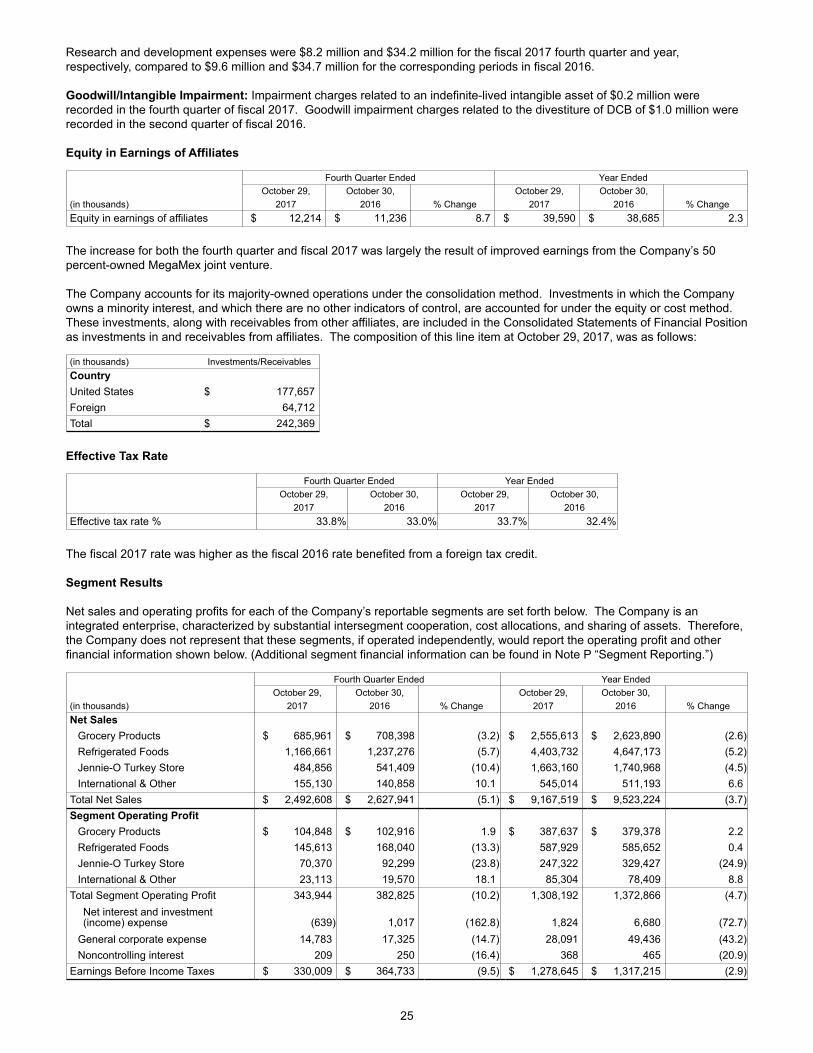
25
Research and development expenses were $8.2 million and $34.2 million for the fiscal 2017 fourth quarter and year, respectively, compared to $9.6 million and $34.7 million for the corresponding periods in fiscal 2016. Goodwill/Intangible Impairment: Impairment charges related to an indefinite-lived intangible asset of $0.2 million were recorded in the fourth quarter of fiscal 2017. Goodwill impairment charges related to the divestiture of DCB of $1.0 million were recorded in the second quarter of fiscal 2016. Equity in Earnings of Affiliates
Fourth Quarter Ended Year EndedOctober 29, October 30, October 29, October 30,
(in thousands) 2017 2016 % Change 2017 2016 % ChangeEquity in earnings of affiliates $ 12,214 $ 11,236 8.7 $ 39,590 $ 38,685 2.3
The increase for both the fourth quarter and fiscal 2017 was largely the result of improved earnings from the Company’s 50 percent-owned MegaMex joint venture. The Company accounts for its majority-owned operations under the consolidation method. Investments in which the Company owns a minority interest, and which there are no other indicators of control, are accounted for under the equity or cost method. These investments, along with receivables from other affiliates, are included in the Consolidated Statements of Financial Position as investments in and receivables from affiliates. The composition of this line item at October 29, 2017, was as follows:
(in thousands) Investments/ReceivablesCountry United States $ 177,657Foreign 64,712Total $ 242,369
Effective Tax Rate
Fourth Quarter Ended Year EndedOctober 29, October 30, October 29, October 30,
2017 2016 2017 2016Effective tax rate % 33.8% 33.0% 33.7% 32.4%
The fiscal 2017 rate was higher as the fiscal 2016 rate benefited from a foreign tax credit.
Segment Results
Net sales and operating profits for each of the Company’s reportable segments are set forth below. The Company is an integrated enterprise, characterized by substantial intersegment cooperation, cost allocations, and sharing of assets. Therefore, the Company does not represent that these segments, if operated independently, would report the operating profit and other financial information shown below. (Additional segment financial information can be found in Note P “Segment Reporting.”)
Fourth Quarter Ended Year Ended October 29, October 30, October 29, October 30, (in thousands) 2017 2016 % Change 2017 2016 % ChangeNet Sales
Grocery Products $ 685,961 $ 708,398 (3.2) $ 2,555,613 $ 2,623,890 (2.6)Refrigerated Foods 1,166,661 1,237,276 (5.7) 4,403,732 4,647,173 (5.2)Jennie-O Turkey Store 484,856 541,409 (10.4) 1,663,160 1,740,968 (4.5)International & Other 155,130 140,858 10.1 545,014 511,193 6.6
Total Net Sales $ 2,492,608 $ 2,627,941 (5.1) $ 9,167,519 $ 9,523,224 (3.7)Segment Operating Profit
Grocery Products $ 104,848 $ 102,916 1.9 $ 387,637 $ 379,378 2.2Refrigerated Foods 145,613 168,040 (13.3) 587,929 585,652 0.4Jennie-O Turkey Store 70,370 92,299 (23.8) 247,322 329,427 (24.9)International & Other 23,113 19,570 18.1 85,304 78,409 8.8
Total Segment Operating Profit 343,944 382,825 (10.2) 1,308,192 1,372,866 (4.7)Net interest and investment(income) expense (639) 1,017 (162.8) 1,824 6,680 (72.7)
General corporate expense 14,783 17,325 (14.7) 28,091 49,436 (43.2)Noncontrolling interest 209 250 (16.4) 368 465 (20.9)
Earnings Before Income Taxes $ 330,009 $ 364,733 (9.5) $ 1,278,645 $ 1,317,215 (2.9)
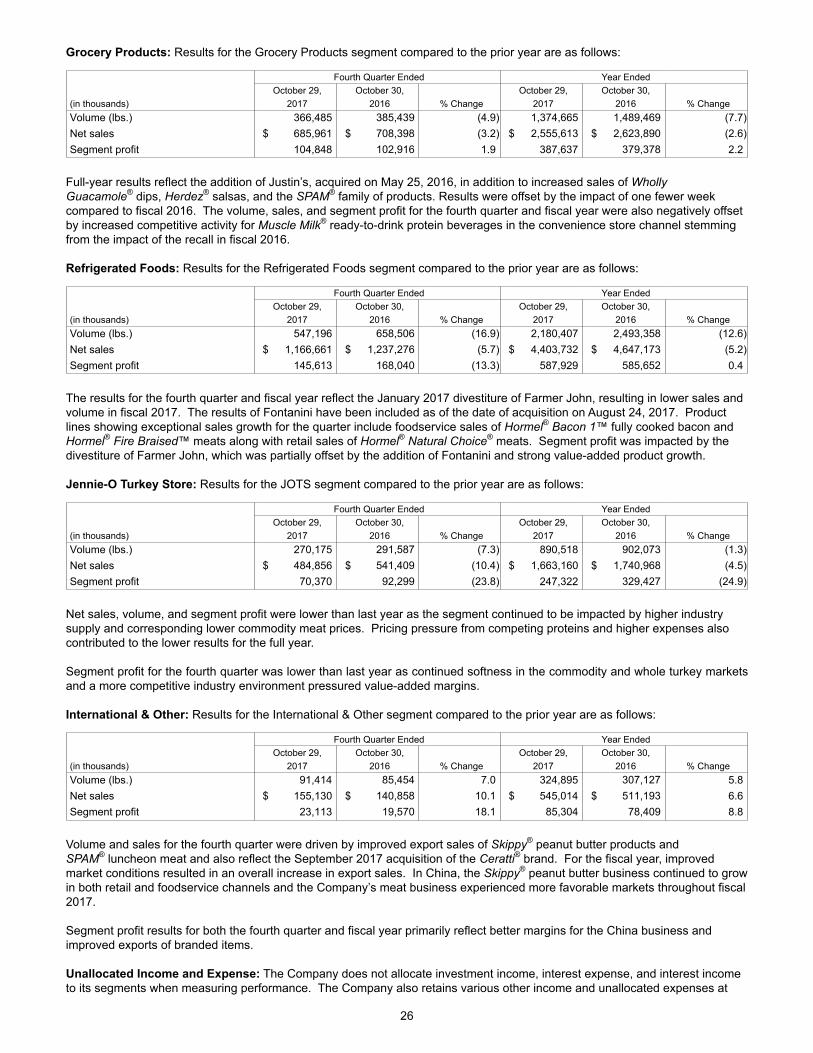
26
Grocery Products: Results for the Grocery Products segment compared to the prior year are as follows:
Fourth Quarter Ended Year Ended October 29, October 30, October 29, October 30, (in thousands) 2017 2016 % Change 2017 2016 % ChangeVolume (lbs.) 366,485 385,439 (4.9) 1,374,665 1,489,469 (7.7)Net sales $ 685,961 $ 708,398 (3.2) $ 2,555,613 $ 2,623,890 (2.6)Segment profit 104,848 102,916 1.9 387,637 379,378 2.2
Full-year results reflect the addition of Justin’s, acquired on May 25, 2016, in addition to increased sales of Wholly Guacamole® dips, Herdez® salsas, and the SPAM® family of products. Results were offset by the impact of one fewer week compared to fiscal 2016. The volume, sales, and segment profit for the fourth quarter and fiscal year were also negatively offset by increased competitive activity for Muscle Milk® ready-to-drink protein beverages in the convenience store channel stemming from the impact of the recall in fiscal 2016. Refrigerated Foods: Results for the Refrigerated Foods segment compared to the prior year are as follows:
Fourth Quarter Ended Year Ended October 29, October 30, October 29, October 30, (in thousands) 2017 2016 % Change 2017 2016 % ChangeVolume (lbs.) 547,196 658,506 (16.9) 2,180,407 2,493,358 (12.6)Net sales $ 1,166,661 $ 1,237,276 (5.7) $ 4,403,732 $ 4,647,173 (5.2)Segment profit 145,613 168,040 (13.3) 587,929 585,652 0.4
The results for the fourth quarter and fiscal year reflect the January 2017 divestiture of Farmer John, resulting in lower sales and volume in fiscal 2017. The results of Fontanini have been included as of the date of acquisition on August 24, 2017. Product lines showing exceptional sales growth for the quarter include foodservice sales of Hormel® Bacon 1™ fully cooked bacon and Hormel® Fire Braised™ meats along with retail sales of Hormel® Natural Choice® meats. Segment profit was impacted by the divestiture of Farmer John, which was partially offset by the addition of Fontanini and strong value-added product growth. Jennie-O Turkey Store: Results for the JOTS segment compared to the prior year are as follows:
Fourth Quarter Ended Year Ended October 29, October 30, October 29, October 30, (in thousands) 2017 2016 % Change 2017 2016 % ChangeVolume (lbs.) 270,175 291,587 (7.3) 890,518 902,073 (1.3)Net sales $ 484,856 $ 541,409 (10.4) $ 1,663,160 $ 1,740,968 (4.5)Segment profit 70,370 92,299 (23.8) 247,322 329,427 (24.9)
Net sales, volume, and segment profit were lower than last year as the segment continued to be impacted by higher industry supply and corresponding lower commodity meat prices. Pricing pressure from competing proteins and higher expenses also contributed to the lower results for the full year. Segment profit for the fourth quarter was lower than last year as continued softness in the commodity and whole turkey markets and a more competitive industry environment pressured value-added margins. International & Other: Results for the International & Other segment compared to the prior year are as follows:
Fourth Quarter Ended Year Ended October 29, October 30, October 29, October 30, (in thousands) 2017 2016 % Change 2017 2016 % ChangeVolume (lbs.) 91,414 85,454 7.0 324,895 307,127 5.8Net sales $ 155,130 $ 140,858 10.1 $ 545,014 $ 511,193 6.6Segment profit 23,113 19,570 18.1 85,304 78,409 8.8
Volume and sales for the fourth quarter were driven by improved export sales of Skippy® peanut butter products and SPAM® luncheon meat and also reflect the September 2017 acquisition of the Ceratti® brand. For the fiscal year, improved market conditions resulted in an overall increase in export sales. In China, the Skippy® peanut butter business continued to grow in both retail and foodservice channels and the Company’s meat business experienced more favorable markets throughout fiscal 2017.
Segment profit results for both the fourth quarter and fiscal year primarily reflect better margins for the China business and improved exports of branded items. Unallocated Income and Expense: The Company does not allocate investment income, interest expense, and interest income to its segments when measuring performance. The Company also retains various other income and unallocated expenses at
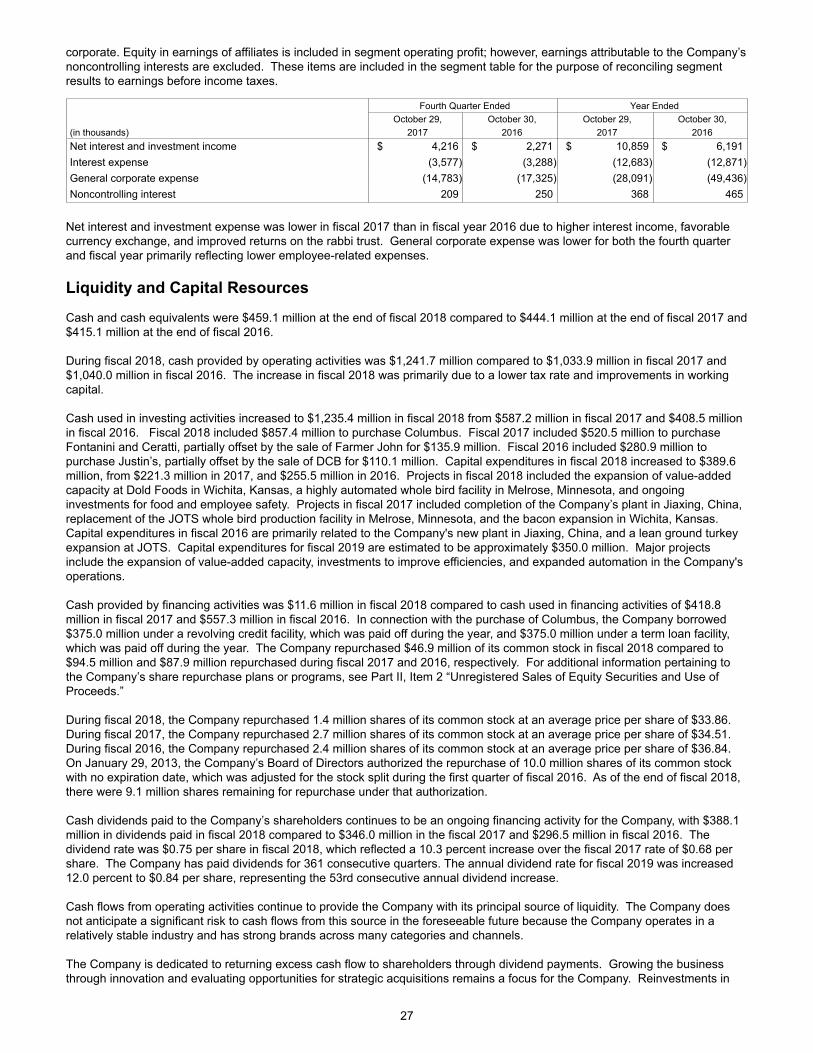
27
corporate. Equity in earnings of affiliates is included in segment operating profit; however, earnings attributable to the Company’s noncontrolling interests are excluded. These items are included in the segment table for the purpose of reconciling segment results to earnings before income taxes.
Fourth Quarter Ended Year Ended October 29, October 30, October 29, October 30,(in thousands) 2017 2016 2017 2016Net interest and investment income $ 4,216 $ 2,271 $ 10,859 $ 6,191Interest expense (3,577) (3,288) (12,683) (12,871)General corporate expense (14,783) (17,325) (28,091) (49,436)Noncontrolling interest 209 250 368 465
Net interest and investment expense was lower in fiscal 2017 than in fiscal year 2016 due to higher interest income, favorable currency exchange, and improved returns on the rabbi trust. General corporate expense was lower for both the fourth quarter and fiscal year primarily reflecting lower employee-related expenses.
Liquidity and Capital Resources Cash and cash equivalents were $459.1 million at the end of fiscal 2018 compared to $444.1 million at the end of fiscal 2017 and $415.1 million at the end of fiscal 2016. During fiscal 2018, cash provided by operating activities was $1,241.7 million compared to $1,033.9 million in fiscal 2017 and $1,040.0 million in fiscal 2016. The increase in fiscal 2018 was primarily due to a lower tax rate and improvements in working capital. Cash used in investing activities increased to $1,235.4 million in fiscal 2018 from $587.2 million in fiscal 2017 and $408.5 million in fiscal 2016. Fiscal 2018 included $857.4 million to purchase Columbus. Fiscal 2017 included $520.5 million to purchase Fontanini and Ceratti, partially offset by the sale of Farmer John for $135.9 million. Fiscal 2016 included $280.9 million to purchase Justin’s, partially offset by the sale of DCB for $110.1 million. Capital expenditures in fiscal 2018 increased to $389.6 million, from $221.3 million in 2017, and $255.5 million in 2016. Projects in fiscal 2018 included the expansion of value-added capacity at Dold Foods in Wichita, Kansas, a highly automated whole bird facility in Melrose, Minnesota, and ongoing investments for food and employee safety. Projects in fiscal 2017 included completion of the Company’s plant in Jiaxing, China, replacement of the JOTS whole bird production facility in Melrose, Minnesota, and the bacon expansion in Wichita, Kansas. Capital expenditures in fiscal 2016 are primarily related to the Company's new plant in Jiaxing, China, and a lean ground turkey expansion at JOTS. Capital expenditures for fiscal 2019 are estimated to be approximately $350.0 million. Major projects include the expansion of value-added capacity, investments to improve efficiencies, and expanded automation in the Company's operations. Cash provided by financing activities was $11.6 million in fiscal 2018 compared to cash used in financing activities of $418.8 million in fiscal 2017 and $557.3 million in fiscal 2016. In connection with the purchase of Columbus, the Company borrowed $375.0 million under a revolving credit facility, which was paid off during the year, and $375.0 million under a term loan facility, which was paid off during the year. The Company repurchased $46.9 million of its common stock in fiscal 2018 compared to $94.5 million and $87.9 million repurchased during fiscal 2017 and 2016, respectively. For additional information pertaining to the Company’s share repurchase plans or programs, see Part II, Item 2 “Unregistered Sales of Equity Securities and Use of Proceeds.”
During fiscal 2018, the Company repurchased 1.4 million shares of its common stock at an average price per share of $33.86. During fiscal 2017, the Company repurchased 2.7 million shares of its common stock at an average price per share of $34.51. During fiscal 2016, the Company repurchased 2.4 million shares of its common stock at an average price per share of $36.84. On January 29, 2013, the Company’s Board of Directors authorized the repurchase of 10.0 million shares of its common stock with no expiration date, which was adjusted for the stock split during the first quarter of fiscal 2016. As of the end of fiscal 2018, there were 9.1 million shares remaining for repurchase under that authorization. Cash dividends paid to the Company’s shareholders continues to be an ongoing financing activity for the Company, with $388.1 million in dividends paid in fiscal 2018 compared to $346.0 million in the fiscal 2017 and $296.5 million in fiscal 2016. The dividend rate was $0.75 per share in fiscal 2018, which reflected a 10.3 percent increase over the fiscal 2017 rate of $0.68 per share. The Company has paid dividends for 361 consecutive quarters. The annual dividend rate for fiscal 2019 was increased 12.0 percent to $0.84 per share, representing the 53rd consecutive annual dividend increase. Cash flows from operating activities continue to provide the Company with its principal source of liquidity. The Company does not anticipate a significant risk to cash flows from this source in the foreseeable future because the Company operates in a relatively stable industry and has strong brands across many categories and channels. The Company is dedicated to returning excess cash flow to shareholders through dividend payments. Growing the business through innovation and evaluating opportunities for strategic acquisitions remains a focus for the Company. Reinvestments in
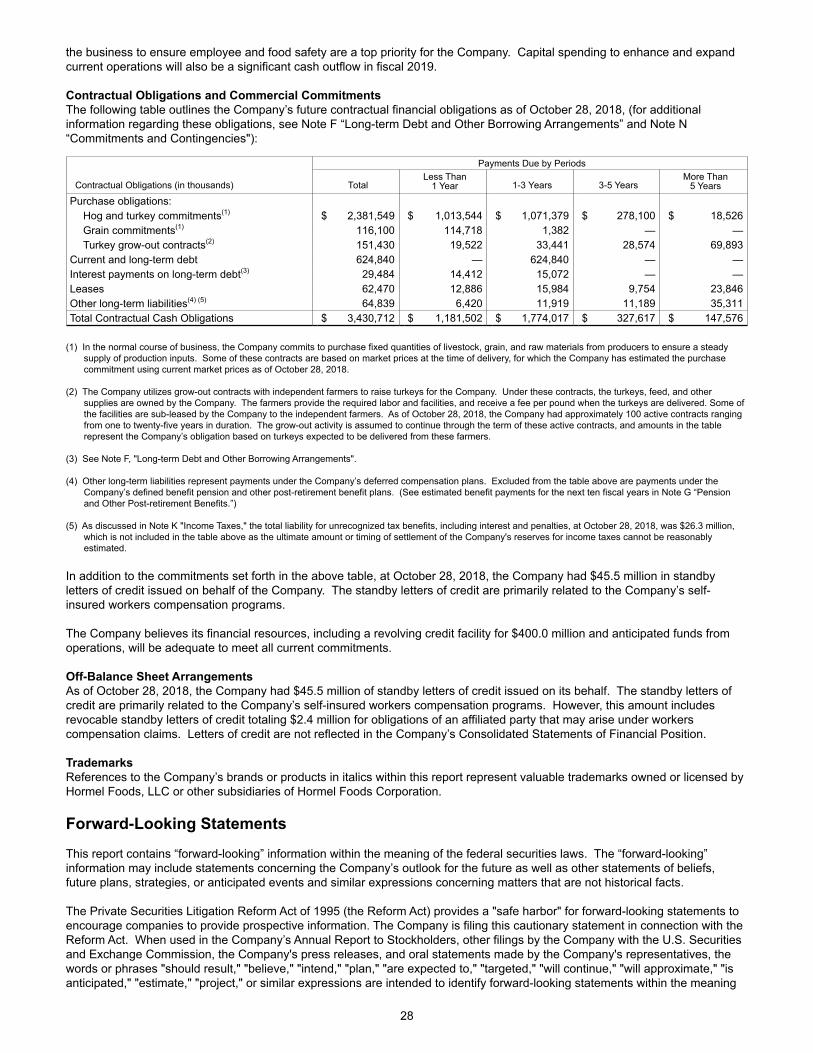
28
the business to ensure employee and food safety are a top priority for the Company. Capital spending to enhance and expand current operations will also be a significant cash outflow in fiscal 2019.
Contractual Obligations and Commercial CommitmentsThe following table outlines the Company’s future contractual financial obligations as of October 28, 2018, (for additional information regarding these obligations, see Note F “Long-term Debt and Other Borrowing Arrangements” and Note N “Commitments and Contingencies"):
Payments Due by Periods
Contractual Obligations (in thousands) TotalLess Than
1 Year 1-3 Years 3-5 YearsMore Than
5 Years
Purchase obligations: Hog and turkey commitments(1) $ 2,381,549 $ 1,013,544 $ 1,071,379 $ 278,100 $ 18,526Grain commitments(1) 116,100 114,718 1,382 — —Turkey grow-out contracts(2) 151,430 19,522 33,441 28,574 69,893
Current and long-term debt 624,840 — 624,840 — —Interest payments on long-term debt(3) 29,484 14,412 15,072 — —Leases 62,470 12,886 15,984 9,754 23,846Other long-term liabilities(4) (5) 64,839 6,420 11,919 11,189 35,311Total Contractual Cash Obligations $ 3,430,712 $ 1,181,502 $ 1,774,017 $ 327,617 $ 147,576
(1) In the normal course of business, the Company commits to purchase fixed quantities of livestock, grain, and raw materials from producers to ensure a steady
supply of production inputs. Some of these contracts are based on market prices at the time of delivery, for which the Company has estimated the purchase commitment using current market prices as of October 28, 2018.
(2) The Company utilizes grow-out contracts with independent farmers to raise turkeys for the Company. Under these contracts, the turkeys, feed, and other
supplies are owned by the Company. The farmers provide the required labor and facilities, and receive a fee per pound when the turkeys are delivered. Some of the facilities are sub-leased by the Company to the independent farmers. As of October 28, 2018, the Company had approximately 100 active contracts ranging from one to twenty-five years in duration. The grow-out activity is assumed to continue through the term of these active contracts, and amounts in the table represent the Company’s obligation based on turkeys expected to be delivered from these farmers.
(3) See Note F, "Long-term Debt and Other Borrowing Arrangements". (4) Other long-term liabilities represent payments under the Company’s deferred compensation plans. Excluded from the table above are payments under the
Company’s defined benefit pension and other post-retirement benefit plans. (See estimated benefit payments for the next ten fiscal years in Note G “Pension and Other Post-retirement Benefits.”)
(5) As discussed in Note K "Income Taxes," the total liability for unrecognized tax benefits, including interest and penalties, at October 28, 2018, was $26.3 million, which is not included in the table above as the ultimate amount or timing of settlement of the Company's reserves for income taxes cannot be reasonably estimated.
In addition to the commitments set forth in the above table, at October 28, 2018, the Company had $45.5 million in standby letters of credit issued on behalf of the Company. The standby letters of credit are primarily related to the Company’s self-insured workers compensation programs. The Company believes its financial resources, including a revolving credit facility for $400.0 million and anticipated funds from operations, will be adequate to meet all current commitments. Off-Balance Sheet ArrangementsAs of October 28, 2018, the Company had $45.5 million of standby letters of credit issued on its behalf. The standby letters of credit are primarily related to the Company’s self-insured workers compensation programs. However, this amount includes revocable standby letters of credit totaling $2.4 million for obligations of an affiliated party that may arise under workers compensation claims. Letters of credit are not reflected in the Company’s Consolidated Statements of Financial Position.
Trademarks References to the Company’s brands or products in italics within this report represent valuable trademarks owned or licensed by Hormel Foods, LLC or other subsidiaries of Hormel Foods Corporation.
Forward-Looking Statements
This report contains “forward-looking” information within the meaning of the federal securities laws. The “forward-looking” information may include statements concerning the Company’s outlook for the future as well as other statements of beliefs, future plans, strategies, or anticipated events and similar expressions concerning matters that are not historical facts.
The Private Securities Litigation Reform Act of 1995 (the Reform Act) provides a "safe harbor" for forward-looking statements to encourage companies to provide prospective information. The Company is filing this cautionary statement in connection with the Reform Act. When used in the Company’s Annual Report to Stockholders, other filings by the Company with the U.S. Securities and Exchange Commission, the Company's press releases, and oral statements made by the Company's representatives, the words or phrases "should result," "believe," "intend," "plan," "are expected to," "targeted," "will continue," "will approximate," "is anticipated," "estimate," "project," or similar expressions are intended to identify forward-looking statements within the meaning
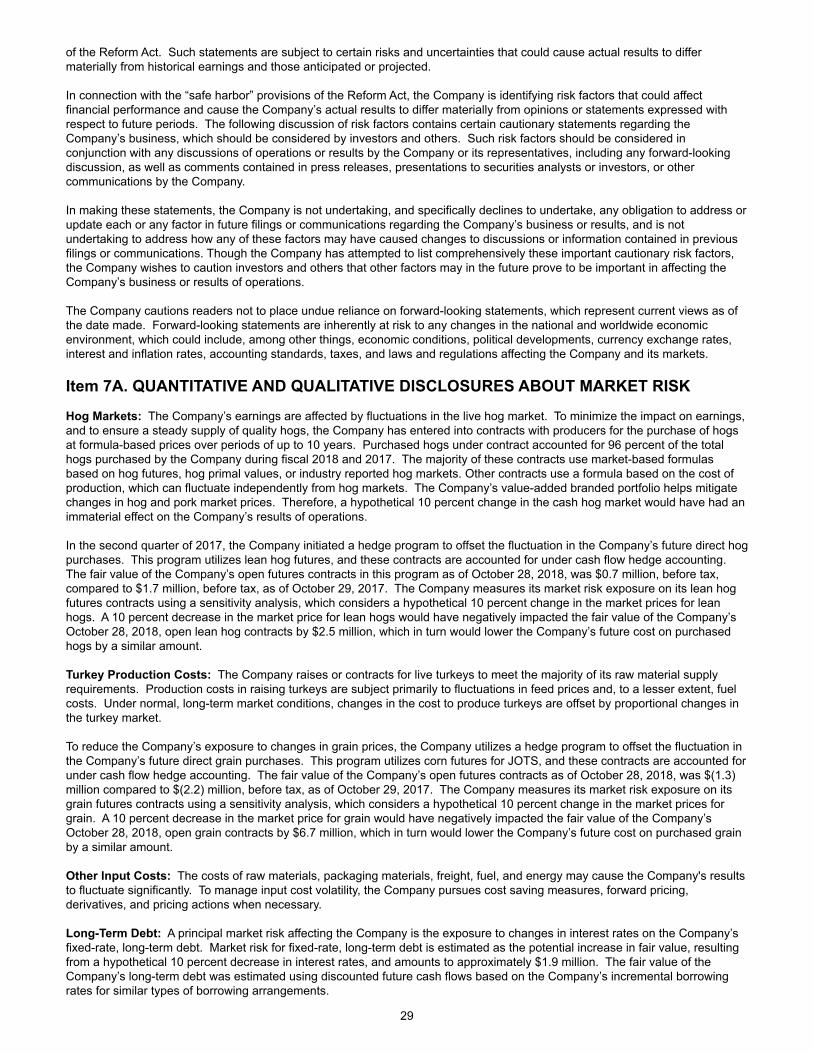
29
of the Reform Act. Such statements are subject to certain risks and uncertainties that could cause actual results to differ materially from historical earnings and those anticipated or projected.
In connection with the “safe harbor” provisions of the Reform Act, the Company is identifying risk factors that could affect financial performance and cause the Company’s actual results to differ materially from opinions or statements expressed with respect to future periods. The following discussion of risk factors contains certain cautionary statements regarding the Company’s business, which should be considered by investors and others. Such risk factors should be considered in conjunction with any discussions of operations or results by the Company or its representatives, including any forward-looking discussion, as well as comments contained in press releases, presentations to securities analysts or investors, or other communications by the Company.
In making these statements, the Company is not undertaking, and specifically declines to undertake, any obligation to address or update each or any factor in future filings or communications regarding the Company’s business or results, and is not undertaking to address how any of these factors may have caused changes to discussions or information contained in previous filings or communications. Though the Company has attempted to list comprehensively these important cautionary risk factors, the Company wishes to caution investors and others that other factors may in the future prove to be important in affecting the Company’s business or results of operations.
The Company cautions readers not to place undue reliance on forward-looking statements, which represent current views as of the date made. Forward-looking statements are inherently at risk to any changes in the national and worldwide economic environment, which could include, among other things, economic conditions, political developments, currency exchange rates, interest and inflation rates, accounting standards, taxes, and laws and regulations affecting the Company and its markets.
Item 7A. QUANTITATIVE AND QUALITATIVE DISCLOSURES ABOUT MARKET RISK Hog Markets: The Company’s earnings are affected by fluctuations in the live hog market. To minimize the impact on earnings, and to ensure a steady supply of quality hogs, the Company has entered into contracts with producers for the purchase of hogs at formula-based prices over periods of up to 10 years. Purchased hogs under contract accounted for 96 percent of the total hogs purchased by the Company during fiscal 2018 and 2017. The majority of these contracts use market-based formulas based on hog futures, hog primal values, or industry reported hog markets. Other contracts use a formula based on the cost of production, which can fluctuate independently from hog markets. The Company’s value-added branded portfolio helps mitigate changes in hog and pork market prices. Therefore, a hypothetical 10 percent change in the cash hog market would have had an immaterial effect on the Company’s results of operations. In the second quarter of 2017, the Company initiated a hedge program to offset the fluctuation in the Company’s future direct hog purchases. This program utilizes lean hog futures, and these contracts are accounted for under cash flow hedge accounting. The fair value of the Company’s open futures contracts in this program as of October 28, 2018, was $0.7 million, before tax, compared to $1.7 million, before tax, as of October 29, 2017. The Company measures its market risk exposure on its lean hog futures contracts using a sensitivity analysis, which considers a hypothetical 10 percent change in the market prices for lean hogs. A 10 percent decrease in the market price for lean hogs would have negatively impacted the fair value of the Company’s October 28, 2018, open lean hog contracts by $2.5 million, which in turn would lower the Company’s future cost on purchased hogs by a similar amount. Turkey Production Costs: The Company raises or contracts for live turkeys to meet the majority of its raw material supply requirements. Production costs in raising turkeys are subject primarily to fluctuations in feed prices and, to a lesser extent, fuel costs. Under normal, long-term market conditions, changes in the cost to produce turkeys are offset by proportional changes in the turkey market. To reduce the Company’s exposure to changes in grain prices, the Company utilizes a hedge program to offset the fluctuation in the Company’s future direct grain purchases. This program utilizes corn futures for JOTS, and these contracts are accounted for under cash flow hedge accounting. The fair value of the Company’s open futures contracts as of October 28, 2018, was $(1.3) million compared to $(2.2) million, before tax, as of October 29, 2017. The Company measures its market risk exposure on its grain futures contracts using a sensitivity analysis, which considers a hypothetical 10 percent change in the market prices for grain. A 10 percent decrease in the market price for grain would have negatively impacted the fair value of the Company’s October 28, 2018, open grain contracts by $6.7 million, which in turn would lower the Company’s future cost on purchased grain by a similar amount. Other Input Costs: The costs of raw materials, packaging materials, freight, fuel, and energy may cause the Company's results to fluctuate significantly. To manage input cost volatility, the Company pursues cost saving measures, forward pricing, derivatives, and pricing actions when necessary. Long-Term Debt: A principal market risk affecting the Company is the exposure to changes in interest rates on the Company’s fixed-rate, long-term debt. Market risk for fixed-rate, long-term debt is estimated as the potential increase in fair value, resulting from a hypothetical 10 percent decrease in interest rates, and amounts to approximately $1.9 million. The fair value of the Company’s long-term debt was estimated using discounted future cash flows based on the Company’s incremental borrowing rates for similar types of borrowing arrangements.
30
Investments: The Company has corporate-owned life insurance policies classified as trading securities as part of a rabbi trust to fund certain supplemental executive retirement plans and deferred income plans. As of October 28, 2018, the balance of these securities totaled $137.3 million compared to $128.5 million as of October 29, 2017. A majority of these securities represent fixed income funds. The Company is subject to market risk due to fluctuations in the value of the remaining investments, as unrealized gains and losses associated with these securities are included in the Company’s net earnings on a mark-to-market basis. A 10 percent decline in the value of the investments not held in fixed income funds would have a direct negative impact to the Company’s pretax earnings of approximately $4.3 million, while a 10 percent increase in value would have a positive impact of the same amount. International Assets: The fair values of certain Company assets are subject to fluctuations in foreign currencies. The Company’s net asset position in foreign currencies as of October 28, 2018, was $687.7 million, compared to $781.3 million as of October 29, 2017, with most of the exposure existing in Chinese yuan and Brazilian real. Changes in currency exchange rates impact the fair values of Company assets either currently through the Consolidated Statements of Operations as currency gains/ losses, or by affecting other comprehensive loss. The Company measures its foreign currency exchange risk by using a 10 percent sensitivity analysis on the Company’s primary foreign net asset position, the Chinese yuan and the Brazilian real, as of October 28, 2018. A 10 percent strengthening in the value of the yuan relative to the U.S. dollar would result in other comprehensive income of approximately $51.0 million pretax. A 10 percent weakening in the value of the yuan relative to the U.S. dollar would result in other comprehensive loss of approximately $41.7 million pretax. A 10 percent strengthening in the value of the real relative to the U.S. dollar would result in other comprehensive income of approximately $13.1 million pretax. A 10 percent weakening in the value of the real relative to the U.S. dollar would result in other comprehensive loss of approximately $10.7 million pretax. During fiscal 2018, the value of the Brazilian real declined 21.9 percent. (See Note J for additional details).
Item 8. FINANCIAL STATEMENTS AND SUPPLEMENTARY DATA
31
Report of Management
Management’s Responsibility for Financial Statements The accompanying financial statements were prepared by the management of Hormel Foods Corporation which is responsible for their integrity and objectivity. These statements have been prepared in accordance with U.S. generally accepted accounting principles appropriate in the circumstances and, as such, include amounts that are based on our best estimates and judgments. Hormel Foods Corporation has developed a system of internal controls designed to assure that the records reflect the transactions of the Company and that the established policies and procedures are adhered to. This system is augmented by well-communicated written policies and procedures, a strong program of internal audit, and well-qualified personnel. These financial statements have been audited by Ernst & Young LLP, an independent registered public accounting firm, and their report is included herein. The audit was conducted in accordance with the standards of the Public Company Accounting Oversight Board (United States) and includes a review of the Company’s accounting and financial controls and tests of transactions. The Audit Committee of the Board of Directors, composed solely of outside directors, meets periodically with the independent auditors, management, and the internal auditors to assure that each is carrying out its responsibilities. Both Ernst & Young LLP and our internal auditors have full and free access to the Audit Committee, with or without the presence of management, to discuss the results of their audit work and their opinions on the adequacy of internal controls and the quality of financial reporting.
Management’s Report on Internal Control Over Financial Reporting Management of Hormel Foods Corporation is responsible for establishing and maintaining adequate internal control over financial reporting for the Company, as such term is defined in Exchange Act Rule 13a–15(f). The Company’s internal control system is designed to provide reasonable assurance regarding the reliability of financial reporting and the preparation of financial statements for external purposes in accordance with generally accepted accounting standards. Under the supervision, and with the participation of management, including the Chief Executive Officer and Chief Financial Officer, we conducted an evaluation of the effectiveness of our internal control over financial reporting based on the framework in Internal Control - Integrated Framework issued by the Committee of Sponsoring Organizations of the Treadway Commission (2013 framework). Based on our evaluation under the framework in Internal Control - Integrated Framework, we concluded that our internal control over financial reporting was effective as of October 28, 2018. Our internal control over financial reporting as of October 28, 2018, has been audited by Ernst & Young LLP, an independent registered public accounting firm, as stated in their report which is included herein.
/s/ James P. Snee /s/ James N. SheehanChairman of the Board, Senior Vice PresidentPresident, Chief Executive Officer, and Director and Chief Financial Officer
32
Report of Independent Registered Public Accounting Firm
To the Shareholders and The Board of Directors of Hormel Foods Corporation We have audited Hormel Foods Corporation’s internal control over financial reporting as of October 28, 2018, based on criteria established in Internal Control–Integrated Framework issued by the Committee of Sponsoring Organizations of the Treadway Commission (2013 framework), (the COSO criteria). In our opinion, Hormel Foods Corporation (the Company) maintained, in all material respects, effective internal control over financial reporting as of October 28, 2018, based on the COSO criteria.
We have also audited, in accordance with the standards of the Public Company Accounting Oversight Board (United States) (PCAOB), the consolidated balance sheets of Hormel Foods Corporation as of October 28, 2018 and October 29, 2017 and the related consolidated statements of comprehensive income, shareholders’ equity and cash flows for each of the three years in the period ended October 28, 2018 and the related notes and financial statement schedule listed in the Index at Item 15 (collectively referred to as the consolidated financial statements) and our report dated December 7, 2018 expressed an unqualified opinion thereon.
Basis for Opinion
The Company’s management is responsible for maintaining effective internal control over financial reporting and for its assessment of the effectiveness of internal control over financial reporting included in the accompanying Management’s Report on Internal Control over Financial Reporting. Our responsibility is to express an opinion on the company’s internal control over financial reporting based on our audit. We are a public accounting firm registered with the PCAOB and are required to be independent with respect to the Company in accordance with the U.S. federal securities laws and the applicable rules and regulations of the Securities and Exchange Commission and the PCAOB. We conducted our audit in accordance with the standards of the PCAOB. Those standards require that we plan and perform the audit to obtain reasonable assurance about whether effective internal control over financial reporting was maintained in all material respects.
Our audit included obtaining an understanding of internal control over financial reporting, assessing the risk that a material weakness exists, testing and evaluating the design and operating effectiveness of internal control based on the assessed risk, and performing such other procedures as we considered necessary in the circumstances. We believe that our audit provides a reasonable basis for our opinion.
Definition and Limitations of Internal Control over Financial Reporting
A company’s internal control over financial reporting is a process designed to provide reasonable assurance regarding the reliability of financial reporting and the preparation of financial statements for external purposes in accordance with generally accepted accounting principles. A company’s internal control over financial reporting includes those policies and procedures that (1) pertain to the maintenance of records that, in reasonable detail, accurately and fairly reflect the transactions and dispositions of the assets of the company; (2) provide reasonable assurance that transactions are recorded as necessary to permit preparation of financial statements in accordance with generally accepted accounting principles, and that receipts and expenditures of the company are being made only in accordance with authorizations of management and directors of the company; and (3) provide reasonable assurance regarding prevention or timely detection of unauthorized acquisition, use, or disposition of the company’s assets that could have a material effect on the financial statements.
Because of its inherent limitations, internal control over financial reporting may not prevent or detect misstatements. Also, projections of any evaluation of effectiveness to future periods are subject to the risk that controls may become inadequate because of changes in conditions, or that the degree of compliance with the policies or procedures may deteriorate.
/s/ Ernst & Young LLP
Minneapolis, Minnesota
December 7, 2018
33
Report of Independent Registered Public Accounting Firm
To the Shareholders and The Board of Directors of Hormel Foods Corporation
Opinion on the Financial Statements
We have audited the consolidated balance sheets of Hormel Foods Corporation (the Company) as of October 28, 2018 and October 29, 2017, the related consolidated statements of comprehensive income, shareholders’ equity and cash flows for each of the three years in the period ended October 28, 2018, and the related notes and financial statement schedule listed in the Index at Item 15 (collectively referred to as the consolidated financial statements). In our opinion, the consolidated financial statements present fairly, in all material respects, the financial position of the Company at October 28, 2018 and October 29, 2017, and the results of its operations and its cash flows for each of the three years in the period ended October 28, 2018, in conformity with U.S. generally accepted accounting principles.
We also have audited, in accordance with the standards of the Public Company Accounting Oversight Board (United States) (PCAOB), the Company’s internal control over financial reporting as of October 28, 2018, based on criteria established in Internal Control-Integrated Framework issued by the Committee of Sponsoring Organizations of the Treadway Commission (2013 framework) and our report dated December 7, 2018 expressed an unqualified opinion thereon.
Basis for Opinion
These financial statements are the responsibility of the Company’s management. Our responsibility is to express an opinion on the Company’s financial statements based on our audits. We are a public accounting firm registered with the PCAOB and are required to be independent with respect to the Company in accordance with the U.S. federal securities laws and the applicable rules and regulations of the Securities and Exchange Commission and the PCAOB.
We conducted our audits in accordance with the standards of the PCAOB. Those standards require that we plan and perform the audit to obtain reasonable assurance about whether the financial statements are free of material misstatement, whether due to error or fraud. Our audits included performing procedures to assess the risks of material misstatement of the financial statements, whether due to error or fraud, and performing procedures that respond to those risks. Such procedures included examining, on a test basis, evidence regarding the amounts and disclosures in the financial statements. Our audits also included evaluating the accounting principles used and significant estimates made by management, as well as evaluating the overall presentation of the financial statements. We believe that our audits provide a reasonable basis for our opinion.
/s/ Ernst & Young LLP
We have served as the Corporation’s auditor since 1931.
Minneapolis, Minnesota
December 7, 2018
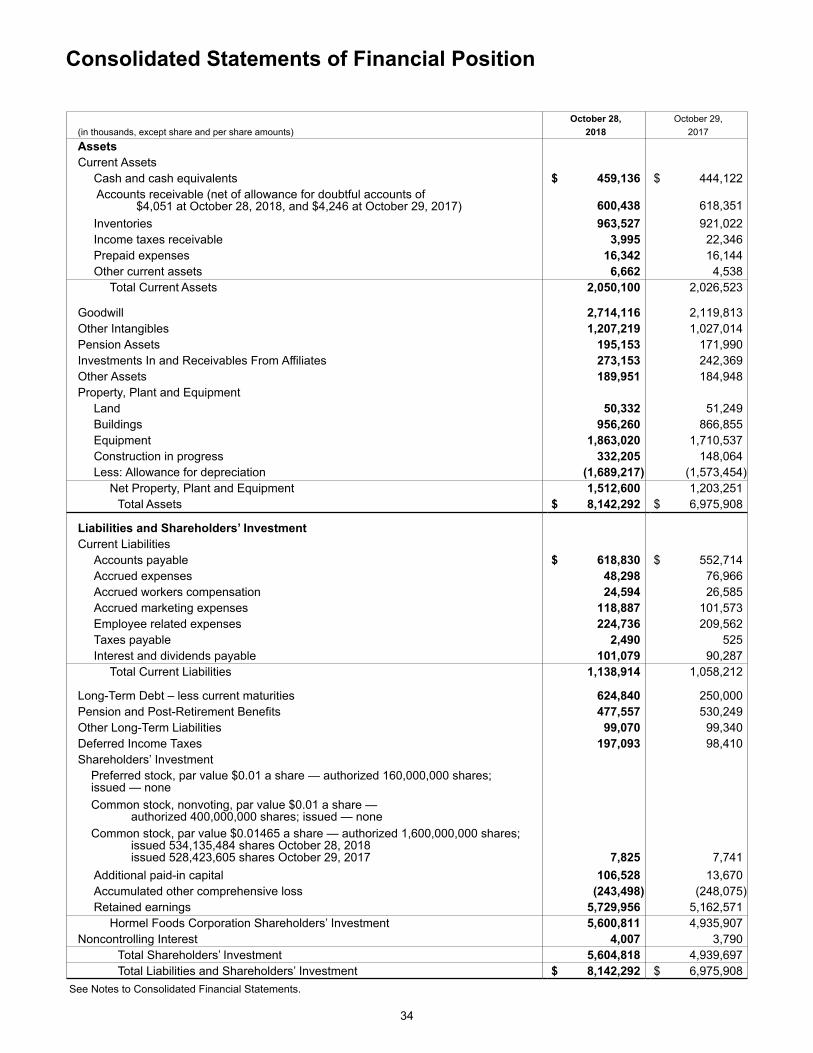
34
Consolidated Statements of Financial Position October 28, October 29,
(in thousands, except share and per share amounts) 2018 2017Assets Current Assets
Cash and cash equivalents $ 459,136 $ 444,122Accounts receivable (net of allowance for doubtful accounts of $4,051 at October 28, 2018, and $4,246 at October 29, 2017) 600,438 618,351Inventories 963,527 921,022Income taxes receivable 3,995 22,346Prepaid expenses 16,342 16,144Other current assets 6,662 4,538
Total Current Assets 2,050,100 2,026,523
Goodwill 2,714,116 2,119,813Other Intangibles 1,207,219 1,027,014Pension Assets 195,153 171,990Investments In and Receivables From Affiliates 273,153 242,369Other Assets 189,951 184,948Property, Plant and Equipment
Land 50,332 51,249Buildings 956,260 866,855Equipment 1,863,020 1,710,537Construction in progress 332,205 148,064Less: Allowance for depreciation (1,689,217) (1,573,454)
Net Property, Plant and Equipment 1,512,600 1,203,251Total Assets $ 8,142,292 $ 6,975,908
Liabilities and Shareholders’ InvestmentCurrent Liabilities
Accounts payable $ 618,830 $ 552,714Accrued expenses 48,298 76,966Accrued workers compensation 24,594 26,585Accrued marketing expenses 118,887 101,573Employee related expenses 224,736 209,562Taxes payable 2,490 525Interest and dividends payable 101,079 90,287
Total Current Liabilities 1,138,914 1,058,212
Long-Term Debt – less current maturities 624,840 250,000Pension and Post-Retirement Benefits 477,557 530,249Other Long-Term Liabilities 99,070 99,340Deferred Income Taxes 197,093 98,410Shareholders’ Investment
Preferred stock, par value $0.01 a share — authorized 160,000,000 shares;issued — noneCommon stock, nonvoting, par value $0.01 a share — authorized 400,000,000 shares; issued — noneCommon stock, par value $0.01465 a share — authorized 1,600,000,000 shares; issued 534,135,484 shares October 28, 2018 issued 528,423,605 shares October 29, 2017 7,825 7,741Additional paid-in capital 106,528 13,670Accumulated other comprehensive loss (243,498) (248,075)Retained earnings 5,729,956 5,162,571
Hormel Foods Corporation Shareholders’ Investment 5,600,811 4,935,907Noncontrolling Interest 4,007 3,790
Total Shareholders’ Investment 5,604,818 4,939,697Total Liabilities and Shareholders’ Investment $ 8,142,292 $ 6,975,908
See Notes to Consolidated Financial Statements.
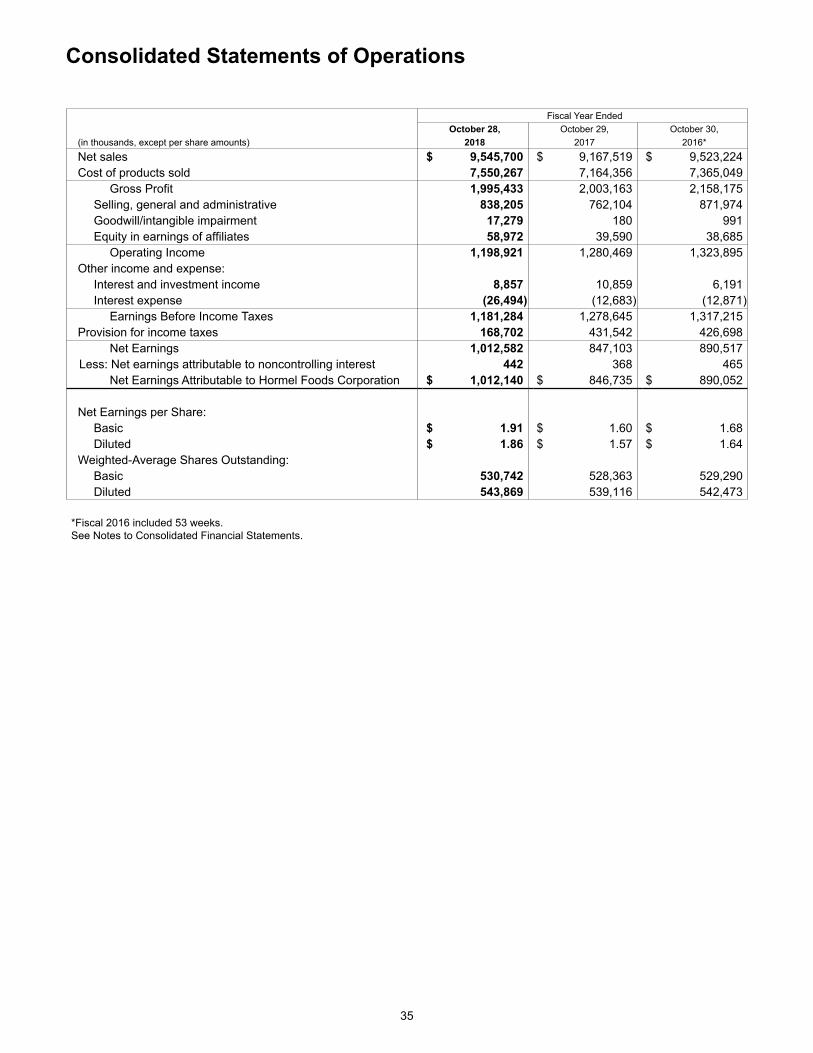
35
Consolidated Statements of Operations
Fiscal Year Ended October 28, October 29, October 30,
(in thousands, except per share amounts) 2018 2017 2016*Net sales $ 9,545,700 $ 9,167,519 $ 9,523,224Cost of products sold 7,550,267 7,164,356 7,365,049
Gross Profit 1,995,433 2,003,163 2,158,175Selling, general and administrative 838,205 762,104 871,974Goodwill/intangible impairment 17,279 180 991Equity in earnings of affiliates 58,972 39,590 38,685
Operating Income 1,198,921 1,280,469 1,323,895Other income and expense:
Interest and investment income 8,857 10,859 6,191Interest expense (26,494) (12,683) (12,871)
Earnings Before Income Taxes 1,181,284 1,278,645 1,317,215Provision for income taxes 168,702 431,542 426,698
Net Earnings 1,012,582 847,103 890,517Less: Net earnings attributable to noncontrolling interest 442 368 465
Net Earnings Attributable to Hormel Foods Corporation $ 1,012,140 $ 846,735 $ 890,052
Net Earnings per Share:Basic $ 1.91 $ 1.60 $ 1.68Diluted $ 1.86 $ 1.57 $ 1.64
Weighted-Average Shares Outstanding:Basic 530,742 528,363 529,290Diluted 543,869 539,116 542,473
*Fiscal 2016 included 53 weeks.See Notes to Consolidated Financial Statements.
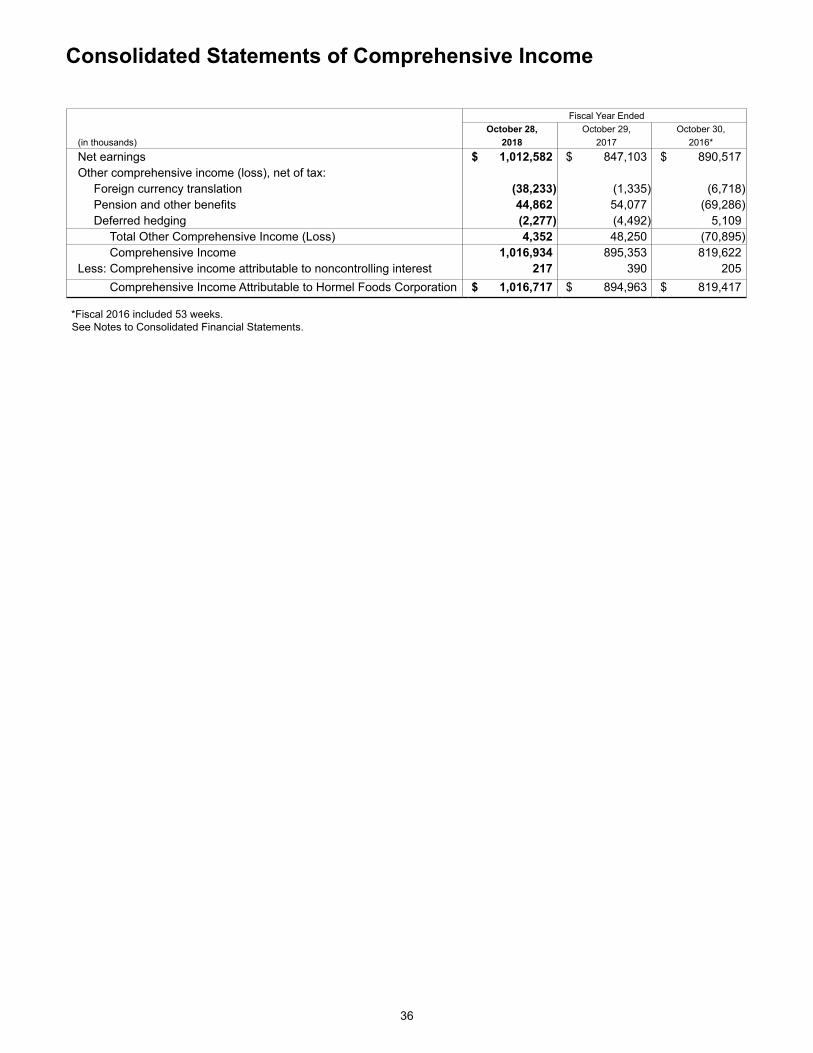
36
Consolidated Statements of Comprehensive Income Fiscal Year Ended October 28, October 29, October 30,
(in thousands) 2018 2017 2016*Net earnings $ 1,012,582 $ 847,103 $ 890,517Other comprehensive income (loss), net of tax:
Foreign currency translation (38,233) (1,335) (6,718)Pension and other benefits 44,862 54,077 (69,286)Deferred hedging (2,277) (4,492) 5,109
Total Other Comprehensive Income (Loss) 4,352 48,250 (70,895)Comprehensive Income 1,016,934 895,353 819,622
Less: Comprehensive income attributable to noncontrolling interest 217 390 205Comprehensive Income Attributable to Hormel Foods Corporation $ 1,016,717 $ 894,963 $ 819,417
*Fiscal 2016 included 53 weeks. See Notes to Consolidated Financial Statements.
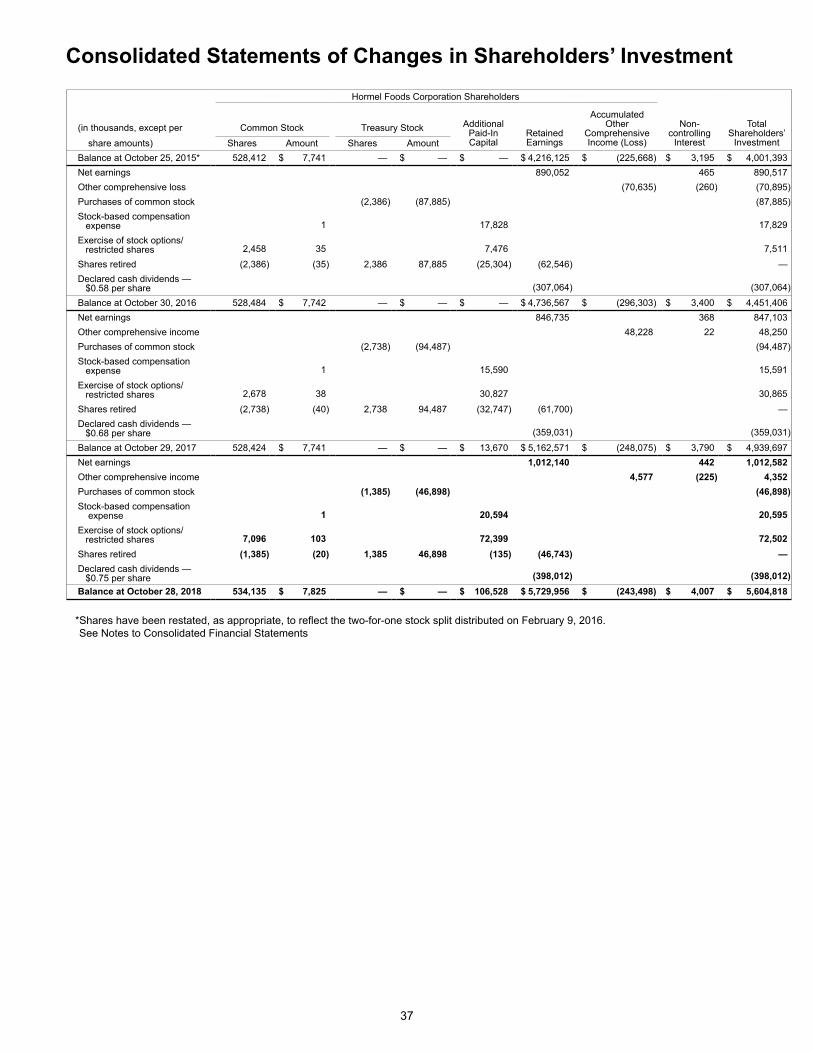
37
Consolidated Statements of Changes in Shareholders’ Investment
Hormel Foods Corporation Shareholders
(in thousands, except per Common Stock Treasury Stock AdditionalPaid-InCapital
RetainedEarnings
AccumulatedOther
ComprehensiveIncome (Loss)
Non-controlling
Interest
TotalShareholders’
Investment share amounts) Shares Amount Shares AmountBalance at October 25, 2015* 528,412 $ 7,741 — $ — $ — $ 4,216,125 $ (225,668) $ 3,195 $ 4,001,393Net earnings 890,052 465 890,517Other comprehensive loss (70,635) (260) (70,895)Purchases of common stock (2,386) (87,885) (87,885)Stock-based compensation expense 1 17,828 17,829Exercise of stock options/ restricted shares 2,458 35 7,476 7,511Shares retired (2,386) (35) 2,386 87,885 (25,304) (62,546) —Declared cash dividends — $0.58 per share (307,064) (307,064)Balance at October 30, 2016 528,484 $ 7,742 — $ — $ — $ 4,736,567 $ (296,303) $ 3,400 $ 4,451,406Net earnings 846,735 368 847,103Other comprehensive income 48,228 22 48,250Purchases of common stock (2,738) (94,487) (94,487)Stock-based compensation expense 1 15,590 15,591Exercise of stock options/ restricted shares 2,678 38 30,827 30,865Shares retired (2,738) (40) 2,738 94,487 (32,747) (61,700) —Declared cash dividends — $0.68 per share (359,031) (359,031)Balance at October 29, 2017 528,424 $ 7,741 — $ — $ 13,670 $ 5,162,571 $ (248,075) $ 3,790 $ 4,939,697Net earnings 1,012,140 442 1,012,582Other comprehensive income 4,577 (225) 4,352Purchases of common stock (1,385) (46,898) (46,898)Stock-based compensation expense 1 20,594 20,595Exercise of stock options/ restricted shares 7,096 103 72,399 72,502Shares retired (1,385) (20) 1,385 46,898 (135) (46,743) —Declared cash dividends — $0.75 per share (398,012) (398,012)Balance at October 28, 2018 534,135 $ 7,825 — $ — $ 106,528 $ 5,729,956 $ (243,498) $ 4,007 $ 5,604,818
*Shares have been restated, as appropriate, to reflect the two-for-one stock split distributed on February 9, 2016.See Notes to Consolidated Financial Statements
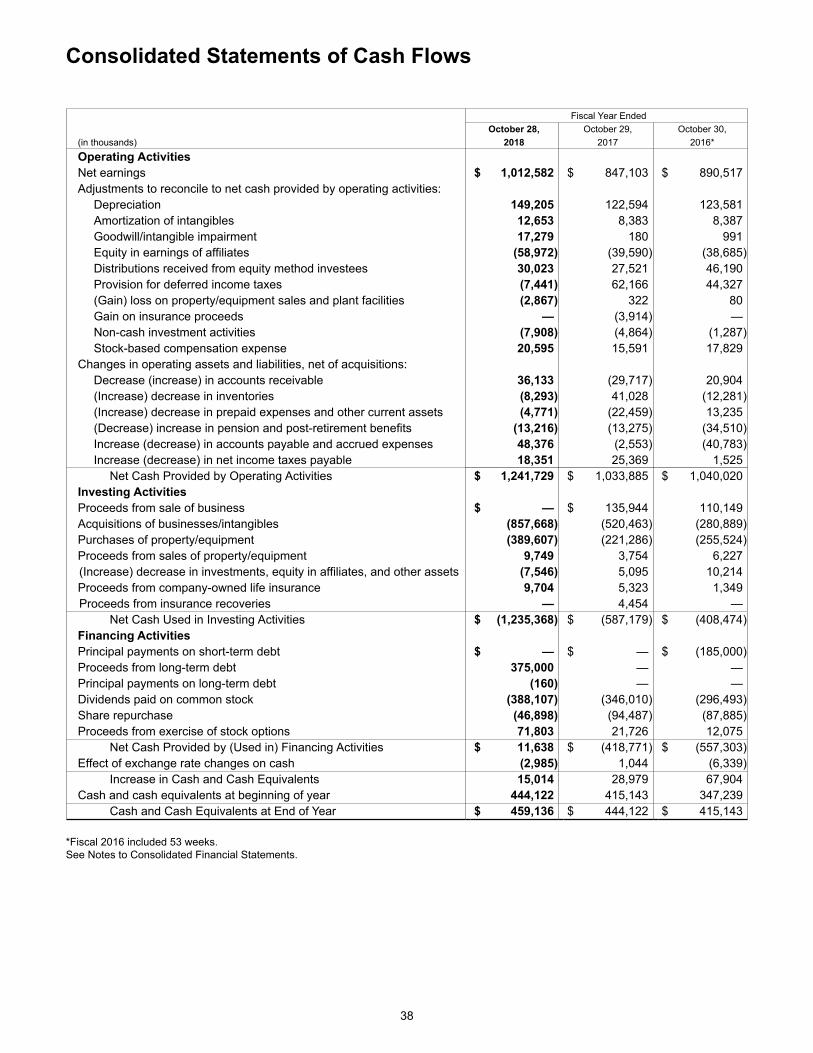
38
Consolidated Statements of Cash Flows Fiscal Year Ended October 28, October 29, October 30,
(in thousands) 2018 2017 2016*Operating Activities Net earnings $ 1,012,582 $ 847,103 $ 890,517Adjustments to reconcile to net cash provided by operating activities:
Depreciation 149,205 122,594 123,581Amortization of intangibles 12,653 8,383 8,387Goodwill/intangible impairment 17,279 180 991Equity in earnings of affiliates (58,972) (39,590) (38,685)Distributions received from equity method investees 30,023 27,521 46,190Provision for deferred income taxes (7,441) 62,166 44,327(Gain) loss on property/equipment sales and plant facilities (2,867) 322 80Gain on insurance proceeds — (3,914) —Non-cash investment activities (7,908) (4,864) (1,287)Stock-based compensation expense 20,595 15,591 17,829
Changes in operating assets and liabilities, net of acquisitions:Decrease (increase) in accounts receivable 36,133 (29,717) 20,904(Increase) decrease in inventories (8,293) 41,028 (12,281)(Increase) decrease in prepaid expenses and other current assets (4,771) (22,459) 13,235(Decrease) increase in pension and post-retirement benefits (13,216) (13,275) (34,510)Increase (decrease) in accounts payable and accrued expenses 48,376 (2,553) (40,783)Increase (decrease) in net income taxes payable 18,351 25,369 1,525
Net Cash Provided by Operating Activities $ 1,241,729 $ 1,033,885 $ 1,040,020Investing ActivitiesProceeds from sale of business $ — $ 135,944 110,149Acquisitions of businesses/intangibles (857,668) (520,463) (280,889)Purchases of property/equipment (389,607) (221,286) (255,524)Proceeds from sales of property/equipment 9,749 3,754 6,227(Increase) decrease in investments, equity in affiliates, and other assets (7,546) 5,095 10,214Proceeds from company-owned life insurance 9,704 5,323 1,349Proceeds from insurance recoveries — 4,454 —
Net Cash Used in Investing Activities $ (1,235,368) $ (587,179) $ (408,474)Financing ActivitiesPrincipal payments on short-term debt $ — $ — $ (185,000)Proceeds from long-term debt 375,000 — —Principal payments on long-term debt (160) — —Dividends paid on common stock (388,107) (346,010) (296,493)Share repurchase (46,898) (94,487) (87,885)Proceeds from exercise of stock options 71,803 21,726 12,075
Net Cash Provided by (Used in) Financing Activities $ 11,638 $ (418,771) $ (557,303)Effect of exchange rate changes on cash (2,985) 1,044 (6,339)
Increase in Cash and Cash Equivalents 15,014 28,979 67,904Cash and cash equivalents at beginning of year 444,122 415,143 347,239
Cash and Cash Equivalents at End of Year $ 459,136 $ 444,122 $ 415,143
*Fiscal 2016 included 53 weeks.See Notes to Consolidated Financial Statements.
39
Notes to Consolidated Financial Statements
Note ASummary of Significant Accounting PoliciesPrinciples of Consolidation: The consolidated financial statements include the accounts of Hormel Foods Corporation (the Company) and all of its majority-owned subsidiaries after elimination of intercompany accounts, transactions, and profits. Stock Split: On November 23, 2015, the Company’s Board of Directors authorized a two-for-one split of the Company’s voting common stock, which was subsequently approved by shareholders at the Company’s Annual Meeting on January 26, 2016, and effected on January 27, 2016. The Company’s voting common stock was reclassified by reducing the par value from$.0293 per share to $0.01465 per share and the number of authorized shares was increased from 800 million to 1.6 billion shares, in order to effect the two-for-one stock split. The Company distributed the additional shares of $.01465 par value common stock on February 9, 2016, and the shares began trading at the post-split price on February 10, 2016. Unless otherwise noted, all prior year share amounts and per share calculations throughout this Annual Report have been restated to reflect the impact of this split and to provide data on a comparable basis. Such restatements include calculations regarding the Company’s weighted-average shares, earnings per share, and dividends per share, as well as disclosures regarding the Company’s stock-based compensation plans and share repurchase activity. Use of Estimates: The preparation of financial statements in conformity with U.S. generally accepted accounting principles (U.S. GAAP) requires management to make estimates and assumptions that affect the amounts reported in the financial statements and accompanying notes. Actual results could differ from those estimates. Fiscal Year: The Company’s fiscal year ends on the last Sunday in October. Fiscal years 2018 and 2017 consisted of 52 weeks and fiscal 2016 consisted of 53 weeks. Cash and Cash Equivalents: The Company considers all investments with an original maturity of three months or less on their acquisition date to be cash equivalents. The Company’s cash equivalents as of October 28, 2018, and October 29, 2017, consisted primarily of bank deposits, money market funds rated AAA, or other highly liquid investment accounts. The Net Asset Value (NAV) of the Company’s money market funds is based on the market value of the securities in their portfolio. Fair Value Measurements: Pursuant to the provisions of Accounting Standards Codification (ASC) 820, Fair Value Measurements and Disclosures (ASC 820), the Company measures certain assets and liabilities at fair value or discloses the fair value of certain assets and liabilities recorded at cost in the consolidated financial statements. Fair value is calculated as the price that would be received to sell an asset or paid to transfer a liability in an orderly transaction between market participants at the measurement date (an exit price). ASC 820 establishes a fair value hierarchy which requires assets and liabilities measured at fair value to be categorized into one of three levels based on the inputs used in the valuation. The Company classifies assets and liabilities in their entirety based on the lowest level of input significant to the fair value measurement. The three levels are defined as follows:
Level 1: Observable inputs based on quoted prices (unadjusted) in active markets for identical assets or liabilities.
Level 2: Observable inputs, other than those included in Level 1, based on quoted prices for similar assets and liabilities in active markets, or quoted prices for identical assets and liabilities in inactive markets.
Level 3: Unobservable inputs that reflect an entity’s own assumptions about what inputs a market participant would use in pricing the asset or liability based on the best information available in the circumstances.
See additional discussion regarding the Company’s fair value measurements in Notes G, H, and M. Investments: The Company maintains a rabbi trust to fund certain supplemental executive retirement plans and deferred income plans. Under the plans, the participants can defer certain types of compensation and elect to receive a return on the deferred amounts based on the changes in fair value of various investment options, primarily a variety of mutual funds. The Company has corporate-owned life insurance policies on certain participants in the deferred compensation plans. The cash surrender value of the policies is included in other assets on the Consolidated Statements of Financial Position. The securities held by the trust are classified as trading securities. Therefore, unrealized losses and gains associated with these investments are included in the Company’s earnings. Securities held by the trust generated (losses) gains of $(0.4) million, $6.2 million, and $2.6 million for fiscal years 2018, 2017, and 2016, respectively.
40
Inventories: Inventories are stated at the lower of cost or net realizable value. Cost is determined principally under the average cost method. Adjustments to the Company’s lower of cost or net realizable value inventory reserve are reflected in cost of products sold in the Consolidated Statements of Operations. Property, Plant and Equipment: Property, plant and equipment are stated at cost. The Company uses the straight-line method in computing depreciation. The annual provisions for depreciation have been computed principally using the following ranges of asset lives: buildings 20 to 40 years, machinery and equipment 3 to 10 years. Internal-use software development and implementation costs are expensed until the Company has determined that the software will result in probable future economic benefits, and management has committed to funding the project. Thereafter, all material development and implementation costs, and purchased software costs are capitalized as part of machinery and equipment and amortized using the straight-line method over the remaining estimated useful lives. Goodwill and Other Indefinite-Lived Intangibles: Indefinite-lived intangible assets are originally recorded at their estimated fair values at date of acquisition and the residual of the purchase price is recorded to goodwill. Goodwill and other indefinite-lived intangible assets are allocated to reporting units that will receive the related sales and income. Goodwill and indefinite-lived intangible assets are tested annually for impairment, or more frequently if impairment indicators arise. In conducting the annual impairment test for goodwill, the Company has the option to first assess qualitative factors to determine whether it is more likely than not (> 50% likelihood) that the fair value of any reporting unit is less than its carrying amount. If the Company elects to perform a qualitative assessment and determines an impairment is more likely than not, the Company is required to perform a quantitative impairment test. Otherwise, no further analysis is required. Alternatively, the Company may elect not to perform the qualitative assessment and proceed directly to the quantitative impairment test. In conducting a qualitative assessment, the Company analyzes actual and projected growth trends for net sales, gross margin, and segment profit for each reporting unit, as well as historical performance versus plan and the results of prior quantitative tests performed. Additionally, the Company assesses critical areas that may impact its business, including macroeconomic conditions and the related impact, market-related exposures, any plans to market for sale all or a portion of their business, competitive changes, new or discontinued product lines, changes in key personnel, or any other potential risks to their projected financial results. If performed, the quantitative goodwill impairment test is performed at the reporting unit level. First, the fair value of each reporting unit is compared to its corresponding carrying value, including goodwill. The fair value of each reporting unit is estimated using discounted cash flow valuations (Level 3), which incorporate assumptions regarding future growth rates, terminal values, and discount rates. The estimates and assumptions used consider historical performance and are consistent with the assumptions used in determining future profit plans for each reporting unit, which are approved by the Company’s Board of Directors. If the quantitative assessment results in the carrying value exceeding the fair value of any reporting unit, then the results from the quantitative analysis will be relied upon to determine both the existence and amount of goodwill impairment. An impairment loss will be recognized for the amount by which the reporting unit’s carrying amount exceeds its fair value, not to exceed the carrying amount of goodwill in that reporting unit. During the fourth quarter of fiscal 2018, the Company completed its annual impairment tests and elected to perform a qualitative assessment. As a result of the qualitative testing during fiscal 2018 and 2016 and quantitative testing during fiscal 2017, no material impairment charges were recorded. An immaterial impairment charge was recorded in the second quarter of fiscal 2016 for the Company's Diamond Crystal Brands (DCB) business based on the agreed-upon sales price for the business. In conducting the annual impairment test for its indefinite-lived intangible assets, the Company first performs a qualitative assessment to determine whether it is more likely than not (> 50% likelihood) that an indefinite-lived intangible asset is impaired. If the Company concludes that this is the case, then a quantitative test for impairment must be performed. Otherwise, the Company does not need to perform a quantitative test. In conducting the qualitative assessment, the Company analyzes growth rates for historical and projected net sales and the results of prior quantitative tests performed. Additionally, each reporting unit assesses critical areas that may impact their intangible assets or the applicable royalty rates to determine if there are factors that could indicate impairment of the asset. If performed, the quantitative impairment test compares the fair value and carrying value of the indefinite-lived intangible asset. The fair value of indefinite-lived intangible assets is primarily determined on the basis of estimated discounted value, using the relief from royalty method (Level 3), which incorporates assumptions regarding future sales projections and discount rates. If the carrying value exceeds fair value, the indefinite-lived intangible asset is considered impaired and an impairment charge is recorded for the difference. Even if not required, the Company periodically elects to perform the quantitative test in order to confirm the qualitative assessment. During the 2017 annual impairment review, the Company completed a quantitative assessment of indefinite-lived intangible assets. As a result of the review, no material impairment charges were recorded; however, four trademarks were determined to have fair values exceeding their carrying values by less than a 10 percent margin. Due to the lack of excess value of these assets, the Company elected to test these assets using a quantitative analysis during fiscal 2018. For all other indefinite-lived
41
intangible assets, the Company tested the assets using a qualitative analysis. During the qualitative review, it was revealed that further assessment in the form of a quantitative test was necessary for two additional indefinite-lived intangible assets. In total, the Company performed a quantitative test for six trade names in fiscal 2018 and only one was determined to be impaired. During the fourth quarter of fiscal 2018, a $17.3 million intangible asset impairment charge was recorded for the CytoSport trademark. See additional discussion regarding the Company’s goodwill and intangible assets in Note D. During fiscal years 2018, 2017, and 2016, there were no other material remeasurements of assets or liabilities at fair value on a nonrecurring basis subsequent to their initial recognition.
Impairment of Long-Lived Assets and Definite-Lived Intangible Assets: Definite-lived intangible assets are amortized over their estimated useful lives. The Company reviews long-lived assets and definite-lived intangible assets for impairment annually, or more frequently when events or changes in circumstances indicate that the carrying amount of an asset may not be recoverable. If impairment indicators are present and the estimated future undiscounted cash flows are less than the carrying value of the assets and any related goodwill, the carrying value is reduced to the estimated fair value.
Assets Held for Sale: The Company classifies assets as held for sale when management approves and commits to a formal plan of sale with the expectation the sale will be completed within one year. The net assets of the business held for sale are then recorded at the lower of their current carrying value or the fair market value, less costs to sell. See additional discussion regarding the Company’s assets held for sale in Note E. Employee Benefit Plans: The Company has elected to use the corridor approach to recognize expenses related to its defined benefit pension and other post-retirement benefit plans. Under the corridor approach, actuarial gains or losses resulting from experience different from that assumed and from changes in assumptions are deferred and amortized over future periods. For the defined benefit pension plans, the unrecognized gains and losses are amortized when the net gain or loss exceeds 10.0% of the greater of the projected benefit obligation or the fair value of plan assets at the beginning of the year. For the other post-retirement plans, the unrecognized gains and losses are amortized when the net gain or loss exceeds 10.0% of the accumulated pension benefit obligation at the beginning of the year. For plans with active employees, net gains or losses in excess of the corridor are amortized over the average remaining service period of participating employees expected to receive benefits under those plans. For plans with only retiree participants, net gains or losses in excess of the corridor are amortized over the average remaining life of the retirees receiving benefits under those plans. Contingent Liabilities: The Company may be subject to investigations, legal proceedings, or claims related to the on-going operation of its business, including claims both by and against the Company. Such proceedings typically involve claims related to product liability, contract disputes, wage and hour laws, employment practices, or other actions brought by employees, consumers, competitors, or suppliers. The Company establishes accruals for its potential exposure, as appropriate, for claims against the Company when losses become probable and reasonably estimable. Where the Company is able to reasonably estimate a range of potential losses, the Company records the amount within that range which constitutes the Company’s best estimate. The Company also discloses the nature of and range of loss for claims against the Company when losses are reasonably possible and material.
Foreign Currency Translation: Assets and liabilities denominated in foreign currency are translated at the current exchange rate as of the statement of financial position date, and amounts in the statement of operations are translated at the average monthly exchange rate. Translation adjustments resulting from fluctuations in exchange rates are recorded as a component of accumulated other comprehensive loss in shareholders’ investment. When calculating foreign currency translation, the Company deemed its foreign investments to be permanent in nature and has not provided for taxes on currency translation adjustments arising from converting the investment in a foreign currency to U.S. dollars. Derivatives and Hedging Activity: The Company uses commodity and currency positions to manage its exposure to price fluctuations in those markets. The contracts are recorded at fair value on the Consolidated Statements of Financial Position within other current assets or accounts payable. Additional information on hedging activities is presented in Note H. Equity Method Investments: The Company has a number of investments in joint ventures where its voting interests are in excess of 20 percent but not greater than 50 percent and for which there are no other indicators of control. The Company accounts for such investments under the equity method of accounting, and its underlying share of each investee’s equity is reported in the Consolidated Statements of Financial Position as part of investments in and receivables from affiliates. The Company regularly monitors and evaluates the fair value of its equity investments. If events and circumstances indicate that a decline in the fair value of these assets has occurred and is other than temporary, the Company will record a charge in equity in earnings of affiliates in the Consolidated Statements of Operations. The Company’s equity investments do not have a readily determinable fair value as none of them are publicly traded. The fair values of the Company’s private equity investments are determined by discounting the estimated future cash flows of each entity. These cash flow estimates include assumptions on growth rates and future currency exchange rates (Level 3). The Company did not record an impairment charge on any of its equity investments in fiscal years 2018, 2017, or 2016. See additional discussion regarding the Company’s equity method investments in Note I.
42
Revenue Recognition: The Company recognizes sales when title passes upon delivery of its products to customers, net of applicable provisions for discounts, returns, and allowances. Products are delivered upon receipt of customer purchase orders with acceptable terms, including price and reasonably assured collectability. The Company offers various sales incentives to customers and consumers. Incentives offered off-invoice include prompt pay allowances, will call allowances, spoilage allowances, and temporary price reductions. These incentives are recognized as reductions of revenue at the time title passes. Coupons are used as an incentive for consumers to purchase various products. The coupons reduce revenues at the time they are offered, based on estimated redemption rates. Promotional contracts are performed by customers to promote the Company’s products to consumers. These incentives reduce revenues at the time of performance through direct payments and accrued promotional funds. Accrued promotional funds are unpaid liabilities for promotional contracts in process or completed at the end of a quarter or fiscal year. Promotional contract accruals are based on a review of the unpaid outstanding contracts on which performance has taken place. Estimates used to determine the revenue reduction include the level of customer performance and the historical spend rate versus contracted rates. Allowance for Doubtful Accounts: The Company estimates the allowance for doubtful accounts based on a combination of factors, including the age of its accounts receivable balances, customer history, collection experience, and current market factors. Additionally, a specific reserve may be established if the Company becomes aware of a customer’s inability to meet its financial obligations. Advertising Expenses: Advertising costs are expensed when incurred. Advertising expenses include all media advertising but exclude the costs associated with samples, demonstrations, and market research. Advertising costs for fiscal years 2018, 2017, and 2016 were $151.5 million, $135.6 million, and $204.1 million, respectively. Shipping and Handling Costs: The Company’s shipping and handling expenses are included in cost of products sold. Research and Development Expenses: Research and development costs are expensed as incurred and are included in selling, general and administrative expenses. Research and development expenses incurred for fiscal years 2018, 2017, and 2016 were $33.8 million, $34.2 million, and $34.7 million, respectively. Income Taxes: The Company records income taxes in accordance with the liability method of accounting. Deferred taxes are recognized for the estimated taxes ultimately payable or recoverable based on enacted tax law. Changes in enacted tax rates are reflected in the tax provision as they occur. In accordance with ASC 740, Income Taxes, the Company recognizes a tax position in its financial statements when it is more likely than not that the position will be sustained upon examination based on the technical merits of the position. That position is then measured at the largest amount of benefit that is greater than 50 percent likely of being realized upon ultimate settlement. Employee Stock Options: The Company records stock-based compensation expense in accordance with ASC 718, Compensation – Stock Compensation. For options subject to graded vesting, the Company recognizes stock-based compensation expense ratably over the shorter of the vesting period or requisite service period. Stock-based compensation expense for grants made to retirement-eligible employees is recognized on the date of grant. Share Repurchases: On January 29, 2013, the Company’s Board of Directors authorized the repurchase of 10.0 million shares (pre-split) of its common stock with no expiration date. The Company may purchase shares of its common stock through open market and privately negotiated transactions at prices deemed appropriate by management. On November 23, 2015, the Company’s Board of Directors authorized a two-for-one split of the Company’s voting common stock. As part of the Board’s approval of that stock split, the number of shares remaining to be repurchased was adjusted proportionately. The timing and amount of repurchase transactions under the repurchase authorization depend on market conditions as well as corporate and regulatory considerations. During the year ended October 28, 2018, the Company repurchased a total of 1.4 million shares at an average price of $33.86. As of October 28, 2018, the remaining share repurchase authorization under the program was 9.1 million shares (post-split). Supplemental Cash Flow Information: Non-cash investment activities presented on the Consolidated Statements of Cash Flows primarily consist of unrealized gains or losses on the Company’s rabbi trust. The noted investments are included in other assets on the Consolidated Statements of Financial Position. Changes in the value of these investments are included in the Company’s net earnings and are presented in the Consolidated Statements of Operations as either interest and investment income (loss) or interest expense, as appropriate. Reclassifications: Certain reclassifications of previously reported amounts have been made to conform to the current year presentation. The reclassifications had no impact on net earnings or operating cash flows as previously reported.
43
Accounting Changes and Recent Accounting Pronouncements
New Accounting Pronouncements adopted in current fiscal year
In July 2015, the FASB issued ASU 2015-11, Inventory (Topic 330). The updated guidance requires that inventory be measured at the lower of cost and net realizable value. The guidance is limited to inventory measured using the first-in, first-out (FIFO) or average cost methods and excludes inventory measured using last-in, first-out (LIFO) or retail inventory methods. Net realizable value is defined as estimated selling prices in the ordinary course of business, less reasonably predictable costs of completion, disposal and transportation. The updated guidance is effective for fiscal years, and interim periods within those fiscal years, beginning after December 15, 2016, with early adoption permitted. The Company adopted the updated provisions on a prospective basis at the beginning of fiscal 2018. The adoption did not have a material impact on its consolidated financial statements, results of operations or cash flows.
In March 2016, the FASB issued ASU 2016-09, Compensation-Stock Compensation: Improvements to Employee Share-Based Payment Accounting (Topic 718). The update simplifies several aspects of the accounting for share-based payment transactions, including the income tax consequences, classification of awards as either equity or liabilities, and classification on the statement of cash flows. The updated guidance is effective for fiscal years, and interim periods within those fiscal years, beginning after December 15, 2016. Early adoption is permitted in any interim or annual period, with adjustments reflected as of the beginning of the fiscal year. Accordingly, the Company adopted the provisions of this new accounting standard at the beginning of fiscal 2018. This resulted in the excess tax benefits and tax deficiencies realized upon exercise or vesting of stock-based awards being recorded in its Consolidated Statements of Operations instead of additional paid-in capital within its Consolidated Statements of Financial Position. The amendments requiring recognition of excess tax benefits and tax deficiencies in the income statement have been applied prospectively. Excess tax benefits of $19.6 million and $40.4 million were recorded as a reduction of income tax expense for the fourth quarter and fiscal year ended October 28, 2018, respectively. The effective tax rate was reduced by 6.1 percent and 3.4 percent for the fourth quarter and twelve months ended October 28, 2018, respectively, as a result of the exercise activity. The Company applied the amendments related to the presentation of excess tax benefits on the Consolidated Statement of Cash Flows using a retrospective transition method, and as a result, realized windfalls were reclassified from financing activities to operating activities in its Consolidated Statements of Cash Flows. In accordance with ASU 2016-09, the Company has made the accounting policy election to estimate forfeitures and adjust as actual forfeitures occur.
In August 2016, the FASB issued ASU 2016-15, Statement of Cash Flows - Classification of Certain Cash Receipts and Cash Payments (Topic 230). The update makes eight targeted changes to how cash receipts and cash payments are presented and classified in the statement of cash flows. The updated guidance is effective for fiscal years, and interim periods within those fiscal years, beginning after December 15, 2017, with early adoption permitted provided all amendments are adopted in the same period. The guidance requires application using a retrospective transition method. The Company early adopted the provisions of the new accounting standard at the beginning of fiscal 2018 and elected to account for distributions received from equity method investees as cash flows from operating activities using the nature of distribution approach accounting policy. Under the nature of the distribution approach, distributions are classified based on the nature of the activity that generated them. The guidance requires cash received from the settlement of insurance claims to be classified on the basis of the related insurance coverage. Accordingly, the Company classified cash settlements received from insurance claims to the specific type of loss to determine the cash flow classification of the proceeds. The guidance also requires cash proceeds from the settlement of corporate-owned life insurance policies to be classified as investing activities. Accordingly, the Company classified the cash proceeds received from corporate-owned life insurance policies as cash flows from investing activities. The adoption did not have a material impact on its consolidated financial statements.
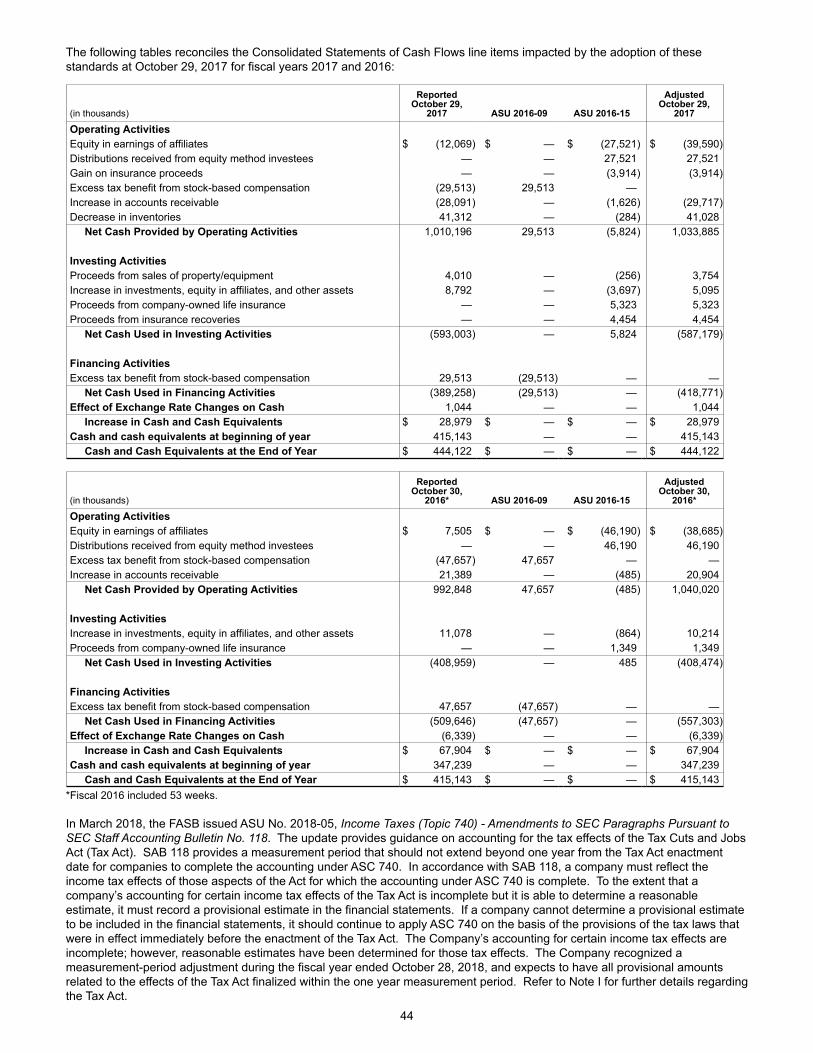
44
The following tables reconciles the Consolidated Statements of Cash Flows line items impacted by the adoption of these standards at October 29, 2017 for fiscal years 2017 and 2016:
(in thousands)
ReportedOctober 29,
2017 ASU 2016-09 ASU 2016-15
AdjustedOctober 29,
2017
Operating ActivitiesEquity in earnings of affiliates $ (12,069) $ — $ (27,521) $ (39,590)Distributions received from equity method investees — — 27,521 27,521Gain on insurance proceeds — — (3,914) (3,914)Excess tax benefit from stock-based compensation (29,513) 29,513 —Increase in accounts receivable (28,091) — (1,626) (29,717)Decrease in inventories 41,312 — (284) 41,028 Net Cash Provided by Operating Activities 1,010,196 29,513 (5,824) 1,033,885
Investing ActivitiesProceeds from sales of property/equipment 4,010 — (256) 3,754Increase in investments, equity in affiliates, and other assets 8,792 — (3,697) 5,095Proceeds from company-owned life insurance — — 5,323 5,323Proceeds from insurance recoveries — — 4,454 4,454 Net Cash Used in Investing Activities (593,003) — 5,824 (587,179)
Financing ActivitiesExcess tax benefit from stock-based compensation 29,513 (29,513) — — Net Cash Used in Financing Activities (389,258) (29,513) — (418,771)Effect of Exchange Rate Changes on Cash 1,044 — — 1,044 Increase in Cash and Cash Equivalents $ 28,979 $ — $ — $ 28,979Cash and cash equivalents at beginning of year 415,143 — — 415,143 Cash and Cash Equivalents at the End of Year $ 444,122 $ — $ — $ 444,122
(in thousands)
ReportedOctober 30,
2016* ASU 2016-09 ASU 2016-15
AdjustedOctober 30,
2016*
Operating ActivitiesEquity in earnings of affiliates $ 7,505 $ — $ (46,190) $ (38,685)Distributions received from equity method investees — — 46,190 46,190Excess tax benefit from stock-based compensation (47,657) 47,657 — —Increase in accounts receivable 21,389 — (485) 20,904 Net Cash Provided by Operating Activities 992,848 47,657 (485) 1,040,020
Investing ActivitiesIncrease in investments, equity in affiliates, and other assets 11,078 — (864) 10,214Proceeds from company-owned life insurance — — 1,349 1,349 Net Cash Used in Investing Activities (408,959) — 485 (408,474)
Financing ActivitiesExcess tax benefit from stock-based compensation 47,657 (47,657) — — Net Cash Used in Financing Activities (509,646) (47,657) — (557,303)Effect of Exchange Rate Changes on Cash (6,339) — — (6,339) Increase in Cash and Cash Equivalents $ 67,904 $ — $ — $ 67,904Cash and cash equivalents at beginning of year 347,239 — — 347,239 Cash and Cash Equivalents at the End of Year $ 415,143 $ — $ — $ 415,143
*Fiscal 2016 included 53 weeks.
In March 2018, the FASB issued ASU No. 2018-05, Income Taxes (Topic 740) - Amendments to SEC Paragraphs Pursuant to SEC Staff Accounting Bulletin No. 118. The update provides guidance on accounting for the tax effects of the Tax Cuts and Jobs Act (Tax Act). SAB 118 provides a measurement period that should not extend beyond one year from the Tax Act enactment date for companies to complete the accounting under ASC 740. In accordance with SAB 118, a company must reflect the income tax effects of those aspects of the Act for which the accounting under ASC 740 is complete. To the extent that a company’s accounting for certain income tax effects of the Tax Act is incomplete but it is able to determine a reasonable estimate, it must record a provisional estimate in the financial statements. If a company cannot determine a provisional estimate to be included in the financial statements, it should continue to apply ASC 740 on the basis of the provisions of the tax laws that were in effect immediately before the enactment of the Tax Act. The Company’s accounting for certain income tax effects are incomplete; however, reasonable estimates have been determined for those tax effects. The Company recognized a measurement-period adjustment during the fiscal year ended October 28, 2018, and expects to have all provisional amounts related to the effects of the Tax Act finalized within the one year measurement period. Refer to Note I for further details regarding the Tax Act.
45
New Accounting Pronouncements not yet adopted In May 2014, the FASB issued ASU 2014-09, Revenue from Contracts with Customers (Topic 606). This topic converges the guidance within U.S. GAAP and international financial reporting standards and supersedes ASC 605, Revenue Recognition. The new standard requires companies to recognize revenue to depict the transfer of goods or services to customers in amounts that reflect the consideration to which the company expects to be entitled in exchange for those goods or services. The new standard will also result in enhanced disclosures about revenue, provide guidance for transactions which were not previously addressed comprehensively, and improve guidance for multiple-element arrangements. The new guidance is effective for annual reporting periods beginning after December 15, 2017. The updated guidance is to be applied either retrospectively or by using a cumulative effect adjustment. The Company will adopt the provisions of the new standard using the full retrospective method at the beginning of fiscal 2019. The Company has completed its detailed assessments relating to revenue streams and customer arrangements, and is focused on controls to support recognition and disclosure requirements under the new guidance. The Company plans to make the following policy elections upon adoption: to account for shipping and handling costs as contract fulfillment costs and to exclude taxes imposed on and collected from customers in revenue producing transactions (e.g., sales, use, and value added taxes) from the transaction price. The Company will account for variable consideration using the expected value method. The Company also plans to apply the practical expedient to not capitalize contract costs to obtain contracts with a duration of one year or less, which are expensed and included in the Consolidated Statements of Operations. The Company will not have a cumulative effect adjustment as a result of adoption. Adoption of the new standard will not have a material impact on the Company’s results of operations. In February 2016, the FASB issued ASU 2016-02, Leases (Topic 842). The updated guidance requires lessees to recognize a right-of-use asset and lease liability for all leases with terms of more than 12 months. Recognition, measurement, and presentation of expenses will depend on the classification as a finance or operating lease. The update also requires certain quantitative and qualitative disclosures. Accounting guidance for lessors is largely unchanged. In July 2018, the FASB issued ASU 2018-11, which provides an optional transition method in addition to the existing modified retrospective transition method allowing entities to recognize a cumulative effect adjustment to the opening balance of retained earnings in the period of adoption rather than in the earliest period presented. The requirements of the new standard are effective for fiscal years beginning after December 15, 2018, including interim periods within those fiscal years. The Company expects to adopt the provisions of this new accounting standard at the beginning of fiscal 2020 and is in the process of evaluating the impact of adoption on its consolidated financial statements and related disclosures. In June 2016, the FASB issued ASU 2016-13, Financial Instruments - Credit Losses: Measurement of Credit Losses on Financial Instruments (Topic 958). The update provides guidance on the measurement of credit losses for most financial assets and certain other instruments that are not measured at fair value through net income. The amendment replaces the current incurred loss impairment methodology with a methodology to reflect expected credit losses and requires consideration of a broader range of reasonable and supportable information to explain credit loss estimates. The updated guidance is to be applied on a modified retrospective approach and is effective for fiscal years, and interim periods within those fiscal years, beginning after December 15, 2019. Early adoption is permitted for all entities for fiscal years beginning after December 15, 2018, and interim periods therein. The Company is currently assessing the timing and impact of adopting the updated provisions. In October 2016, the FASB issued ASU 2016-16, Income Taxes - Intra-Entity Transfers of Assets Other Than Inventory (Topic 740). The updated guidance requires the recognition of the income tax consequences of an intra-entity asset transfer, other than transfers of inventory, when the transfer occurs. For intra-entity transfers of inventory, the income tax effects will continue to be deferred until the inventory has been sold to a third party. The updated guidance is effective for reporting periods beginning after December 15, 2017, with early adoption permitted only within the first interim period of a fiscal year. The guidance is required to be applied on a modified retrospective basis through a cumulative effect adjustment directly to retained earnings as of the beginning of the period of adoption. The Company will adopt the provisions of the new accounting standard at the beginning of fiscal 2019, which will result in a reclassification from prepaid tax assets to deferred tax assets. In addition, due to impact of the lower tax rate on deferred tax balances resulting from the Tax Act, the Company expects to recognize a cumulative effect adjustment to retained earnings of approximately $10.5 million.
In March 2017, the FASB issued ASU 2017-07, Compensation - Retirement Benefits: Improving the Presentation of Net Periodic Pension Cost and Net Periodic Postretirement Benefit Cost (Topic 715). The updated guidance requires an employer to report the service cost component of net periodic pension cost and net periodic post-retirement benefit cost in the same line item or items as other compensation costs. The updated guidance also requires the other components of net periodic pension cost and net periodic post-retirement benefit cost to be presented in the income statement separately from the service cost component and outside income from operations. Additionally, only the service cost component is eligible for capitalization, when applicable. This guidance is effective for fiscal years, and interim periods within those fiscal years, beginning after December 15, 2017. Early adoption is permitted. The updated guidance should be applied retrospectively for the presentation of the service cost component and other components of net benefit cost in the income statement and prospectively, on and after the effective date, for the capitalization of the service cost component of net benefit cost. The Company will adopt the provisions of this new accounting standard at the beginning of fiscal 2019. In connection with this adoption, we expect to record reductions in Operating Income of $19.0 million and $3.7 million with corresponding increases in Other Income for fiscal years ended October 28, 2018, and October 29, 2017, respectively.
46
In August 2017, the FASB issued ASU 2017-12, Derivatives and Hedging - Targeted Improvements to Accounting for Hedging Activities (Topic 815). The updated guidance expands an entity’s ability to hedge nonfinancial and financial risk components and reduce complexity in fair value hedges of interest rate risk. The guidance eliminates the requirement to separately measure and report hedge ineffectiveness and generally requires the entire change in the fair value of a hedging instrument to be presented in the same income statement line as the hedged item. The guidance also eases certain documentation and assessment requirements and modifies the accounting for components excluded from the assessment of hedge effectiveness. Entities will apply the amendments to cash flow and net investment hedge relationships that exist on the date of adoption using a modified retrospective approach. The presentation and disclosure requirement apply prospectively. The updated guidance is effective for fiscal years beginning after December 15, 2018, including interim periods within those years. Early adoption is permitted in any interim or annual period. The Company plans to early adopt the provisions of this new accounting standard at the beginning of fiscal 2019 and does not expect a material impact to its consolidated financial statements.
In February 2018, the FASB issued ASU 2018-02, Income Statement - Reporting Comprehensive Income (Topic 220). The updated guidance allows entities to reclassify stranded income tax effects resulting from the Tax Act from accumulated other comprehensive income to retained earnings in their consolidated financial statements. Under the Tax Act, deferred taxes were adjusted to reflect the reduction of the historical corporate income tax rate to the newly enacted corporate income tax rate, which left the tax effects on items within accumulated other comprehensive income stranded at an inappropriate tax rate. The updated guidance is effective for fiscal years beginning after December 15, 2018, including interim periods within those years. Early adoption is permitted in any interim period and should be applied either in the period of adoption or retrospectively to each period (or periods) in which the effect of the change in the U.S. federal corporate income tax rate in the Tax Act is recognized. The Company will adopt the provisions of this new accounting standard at the beginning of fiscal 2019. The adoption will result in a reclassification of $50.7 million from Accumulated Other Comprehensive Income to Retained Earnings.
In July 2018, the FASB issued ASU 2018-09, Codification Improvements. This amendment makes changes to a variety of topics to clarify, correct errors in, or make minor improvements to the Accounting Standards Codification (ASC). The transition and effective date guidance is based on the facts and circumstances of each amendment. Some of the amendments do not require transition guidance and will be effective upon issuance of ASU 2018-09. However, many of the amendments do have transition guidance with effective dates for annual periods beginning after December 15, 2018. The Company is currently assessing the impact of adoption on its consolidated financial statements, results of operations and cash flows.
In August 2018, the FASB issued ASU 2018-13, Fair Value Measurement - Disclosure Framework (Topic 820). The updated guidance improves the disclosure requirements on fair value measurements. The updated guidance if effective for fiscal years, and interim periods within those fiscal years, beginning after December 15, 2019. Early adoption is permitted for any removed or modified disclosures. The Company is currently assessing the timing and impact of adopting the updated provisions.
In August 2018, the FASB issued ASU 2018-14, Compensation - Retirement Benefits - Defined Benefit Plans (Topic 715). The updated guidance improves disclosure requirements for employers who sponsor defined benefit pension or other postretirement plans. The amendments are effective for fiscal years ending after December 15, 2020, with early adoption permitted. The Company is currently assessing the timing and impact of adopting the updated provisions.
In August 2018, the FASB issued ASU No. 2018-15, Intangibles - Goodwill and Other - Internal-Use Software: Customer’s Accounting for Implementation Costs Incurred in a Cloud Computing Arrangement That Is a Service Contract (Topic 350). The amendments in the update align the requirements for capitalizing implementation costs incurred in a hosting arrangement that is a service contract with the requirements for capitalizing implementation costs incurred to develop or obtain internal-use software (and hosting arrangements that include an internal use software license). The amendments are effective for fiscal years beginning after December 15, 2019, and for interim periods within those fiscal years and is to be applied either retrospectively or prospectively to all implementation costs incurred after the adoption date. Early adoption is permitted, including adoption in any interim period. The Company is currently evaluating the effect of this update and expects to adopt the provisions of this new accounting standard at the beginning of fiscal 2019.
Any other recently issued accounting standards or pronouncements not disclosed above have been excluded as they either are not relevant to the Company, or they are not expected to have a material effect on its business practices, financial condition, results of operations, or disclosures.
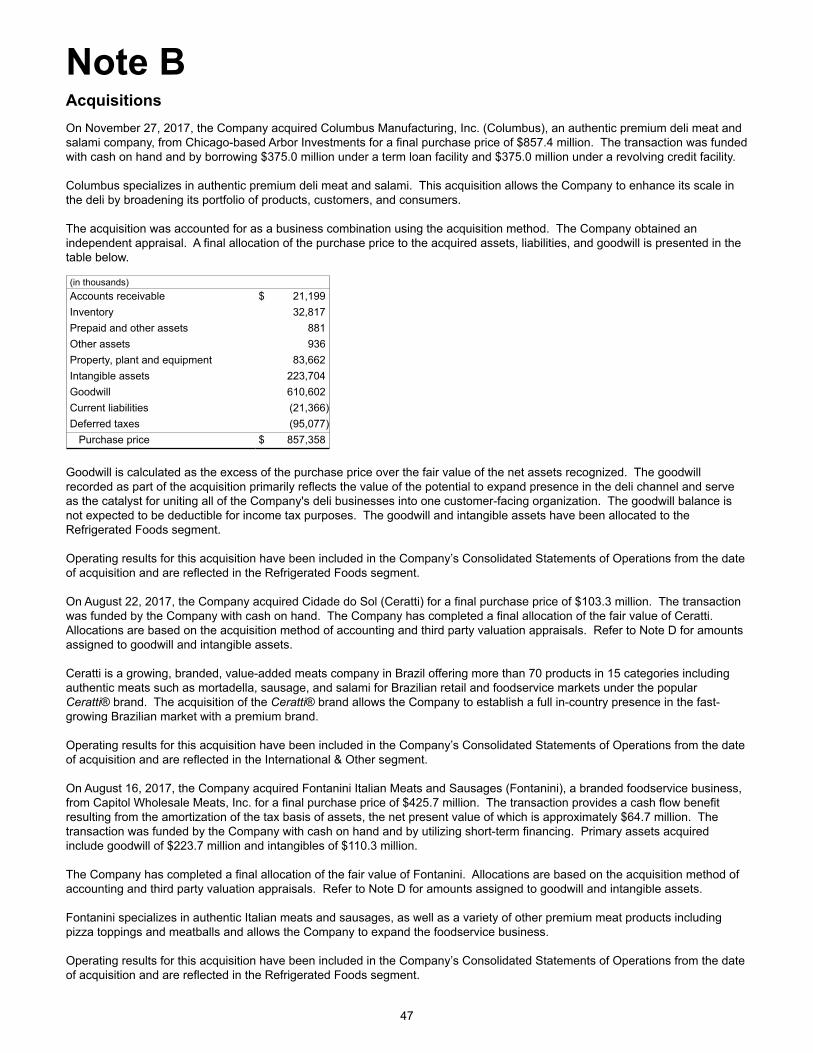
47
Note BAcquisitionsOn November 27, 2017, the Company acquired Columbus Manufacturing, Inc. (Columbus), an authentic premium deli meat and salami company, from Chicago-based Arbor Investments for a final purchase price of $857.4 million. The transaction was funded with cash on hand and by borrowing $375.0 million under a term loan facility and $375.0 million under a revolving credit facility.
Columbus specializes in authentic premium deli meat and salami. This acquisition allows the Company to enhance its scale in the deli by broadening its portfolio of products, customers, and consumers.
The acquisition was accounted for as a business combination using the acquisition method. The Company obtained an independent appraisal. A final allocation of the purchase price to the acquired assets, liabilities, and goodwill is presented in the table below.
(in thousands)Accounts receivable $ 21,199Inventory 32,817Prepaid and other assets 881Other assets 936Property, plant and equipment 83,662Intangible assets 223,704Goodwill 610,602Current liabilities (21,366)Deferred taxes (95,077) Purchase price $ 857,358
Goodwill is calculated as the excess of the purchase price over the fair value of the net assets recognized. The goodwill recorded as part of the acquisition primarily reflects the value of the potential to expand presence in the deli channel and serve as the catalyst for uniting all of the Company's deli businesses into one customer-facing organization. The goodwill balance is not expected to be deductible for income tax purposes. The goodwill and intangible assets have been allocated to the Refrigerated Foods segment.
Operating results for this acquisition have been included in the Company’s Consolidated Statements of Operations from the date of acquisition and are reflected in the Refrigerated Foods segment.
On August 22, 2017, the Company acquired Cidade do Sol (Ceratti) for a final purchase price of $103.3 million. The transaction was funded by the Company with cash on hand. The Company has completed a final allocation of the fair value of Ceratti. Allocations are based on the acquisition method of accounting and third party valuation appraisals. Refer to Note D for amounts assigned to goodwill and intangible assets. Ceratti is a growing, branded, value-added meats company in Brazil offering more than 70 products in 15 categories including authentic meats such as mortadella, sausage, and salami for Brazilian retail and foodservice markets under the popular Ceratti® brand. The acquisition of the Ceratti® brand allows the Company to establish a full in-country presence in the fast-growing Brazilian market with a premium brand. Operating results for this acquisition have been included in the Company’s Consolidated Statements of Operations from the date of acquisition and are reflected in the International & Other segment. On August 16, 2017, the Company acquired Fontanini Italian Meats and Sausages (Fontanini), a branded foodservice business, from Capitol Wholesale Meats, Inc. for a final purchase price of $425.7 million. The transaction provides a cash flow benefit resulting from the amortization of the tax basis of assets, the net present value of which is approximately $64.7 million. The transaction was funded by the Company with cash on hand and by utilizing short-term financing. Primary assets acquired include goodwill of $223.7 million and intangibles of $110.3 million.
The Company has completed a final allocation of the fair value of Fontanini. Allocations are based on the acquisition method of accounting and third party valuation appraisals. Refer to Note D for amounts assigned to goodwill and intangible assets. Fontanini specializes in authentic Italian meats and sausages, as well as a variety of other premium meat products including pizza toppings and meatballs and allows the Company to expand the foodservice business. Operating results for this acquisition have been included in the Company’s Consolidated Statements of Operations from the date of acquisition and are reflected in the Refrigerated Foods segment.
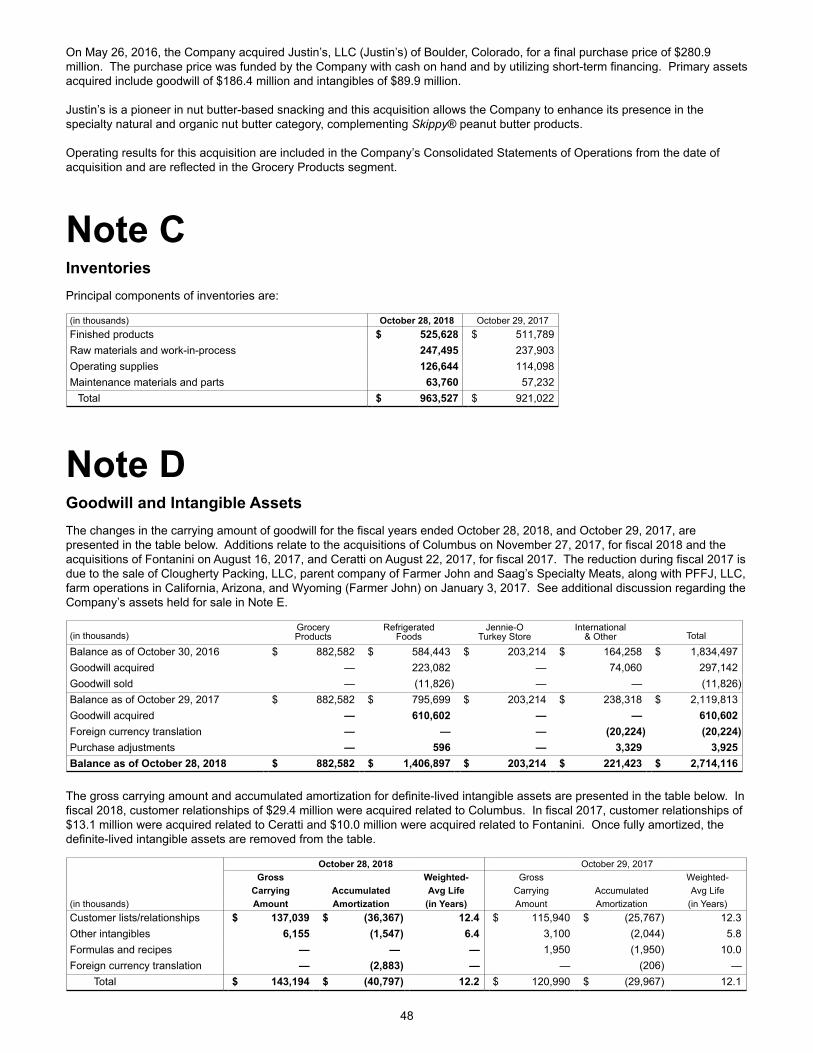
48
On May 26, 2016, the Company acquired Justin’s, LLC (Justin’s) of Boulder, Colorado, for a final purchase price of $280.9 million. The purchase price was funded by the Company with cash on hand and by utilizing short-term financing. Primary assets acquired include goodwill of $186.4 million and intangibles of $89.9 million. Justin’s is a pioneer in nut butter-based snacking and this acquisition allows the Company to enhance its presence in the specialty natural and organic nut butter category, complementing Skippy® peanut butter products. Operating results for this acquisition are included in the Company’s Consolidated Statements of Operations from the date of acquisition and are reflected in the Grocery Products segment.
Note C
Inventories Principal components of inventories are:
(in thousands) October 28, 2018 October 29, 2017Finished products $ 525,628 $ 511,789Raw materials and work-in-process 247,495 237,903Operating supplies 126,644 114,098Maintenance materials and parts 63,760 57,232
Total $ 963,527 $ 921,022
Note D Goodwill and Intangible AssetsThe changes in the carrying amount of goodwill for the fiscal years ended October 28, 2018, and October 29, 2017, are presented in the table below. Additions relate to the acquisitions of Columbus on November 27, 2017, for fiscal 2018 and the acquisitions of Fontanini on August 16, 2017, and Ceratti on August 22, 2017, for fiscal 2017. The reduction during fiscal 2017 is due to the sale of Clougherty Packing, LLC, parent company of Farmer John and Saag’s Specialty Meats, along with PFFJ, LLC, farm operations in California, Arizona, and Wyoming (Farmer John) on January 3, 2017. See additional discussion regarding the Company’s assets held for sale in Note E.
(in thousands)GroceryProducts
RefrigeratedFoods
Jennie-OTurkey Store
International& Other Total
Balance as of October 30, 2016 $ 882,582 $ 584,443 $ 203,214 $ 164,258 $ 1,834,497Goodwill acquired — 223,082 — 74,060 297,142Goodwill sold — (11,826) — — (11,826)Balance as of October 29, 2017 $ 882,582 $ 795,699 $ 203,214 $ 238,318 $ 2,119,813Goodwill acquired — 610,602 — — 610,602Foreign currency translation — — — (20,224) (20,224)Purchase adjustments — 596 — 3,329 3,925Balance as of October 28, 2018 $ 882,582 $ 1,406,897 $ 203,214 $ 221,423 $ 2,714,116
The gross carrying amount and accumulated amortization for definite-lived intangible assets are presented in the table below. In fiscal 2018, customer relationships of $29.4 million were acquired related to Columbus. In fiscal 2017, customer relationships of $13.1 million were acquired related to Ceratti and $10.0 million were acquired related to Fontanini. Once fully amortized, the definite-lived intangible assets are removed from the table.
October 28, 2018 October 29, 2017Gross Weighted- Gross Weighted-
Carrying Accumulated Avg Life Carrying Accumulated Avg Life(in thousands) Amount Amortization (in Years) Amount Amortization (in Years)Customer lists/relationships $ 137,039 $ (36,367) 12.4 $ 115,940 $ (25,767) 12.3Other intangibles 6,155 (1,547) 6.4 3,100 (2,044) 5.8Formulas and recipes — — — 1,950 (1,950) 10.0Foreign currency translation — (2,883) — — (206) —
Total $ 143,194 $ (40,797) 12.2 $ 120,990 $ (29,967) 12.1
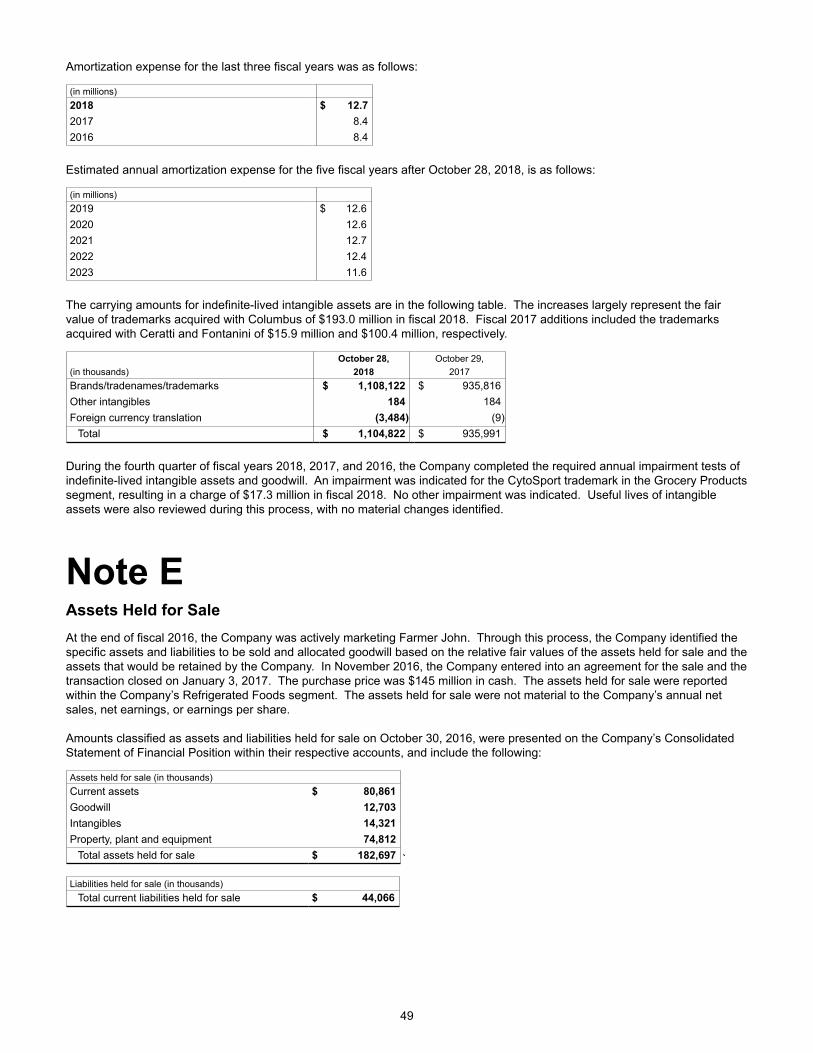
49
Amortization expense for the last three fiscal years was as follows:
(in millions)2018 $ 12.72017 8.42016 8.4
Estimated annual amortization expense for the five fiscal years after October 28, 2018, is as follows:
(in millions)2019 $ 12.62020 12.62021 12.72022 12.42023 11.6
The carrying amounts for indefinite-lived intangible assets are in the following table. The increases largely represent the fair value of trademarks acquired with Columbus of $193.0 million in fiscal 2018. Fiscal 2017 additions included the trademarks acquired with Ceratti and Fontanini of $15.9 million and $100.4 million, respectively.
October 28, October 29,(in thousands) 2018 2017Brands/tradenames/trademarks $ 1,108,122 $ 935,816Other intangibles 184 184Foreign currency translation (3,484) (9)
Total $ 1,104,822 $ 935,991
During the fourth quarter of fiscal years 2018, 2017, and 2016, the Company completed the required annual impairment tests of indefinite-lived intangible assets and goodwill. An impairment was indicated for the CytoSport trademark in the Grocery Products segment, resulting in a charge of $17.3 million in fiscal 2018. No other impairment was indicated. Useful lives of intangible assets were also reviewed during this process, with no material changes identified.
Note EAssets Held for SaleAt the end of fiscal 2016, the Company was actively marketing Farmer John. Through this process, the Company identified the specific assets and liabilities to be sold and allocated goodwill based on the relative fair values of the assets held for sale and the assets that would be retained by the Company. In November 2016, the Company entered into an agreement for the sale and the transaction closed on January 3, 2017. The purchase price was $145 million in cash. The assets held for sale were reported within the Company’s Refrigerated Foods segment. The assets held for sale were not material to the Company’s annual net sales, net earnings, or earnings per share.
Amounts classified as assets and liabilities held for sale on October 30, 2016, were presented on the Company’s Consolidated Statement of Financial Position within their respective accounts, and include the following:
Assets held for sale (in thousands)Current assets $ 80,861Goodwill 12,703Intangibles 14,321Property, plant and equipment 74,812
Total assets held for sale $ 182,697 `
Liabilities held for sale (in thousands)Total current liabilities held for sale $ 44,066
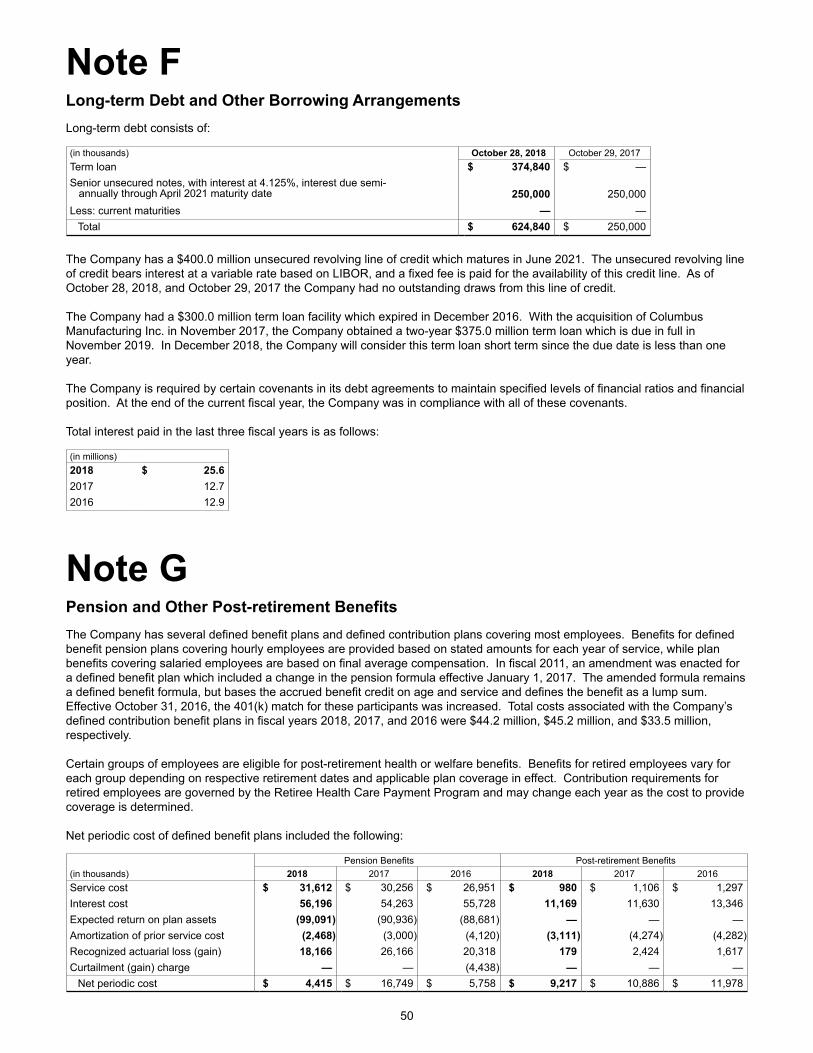
50
Note FLong-term Debt and Other Borrowing ArrangementsLong-term debt consists of:
(in thousands) October 28, 2018 October 29, 2017Term loan $ 374,840 $ —Senior unsecured notes, with interest at 4.125%, interest due semi- annually through April 2021 maturity date 250,000 250,000Less: current maturities — —
Total $ 624,840 $ 250,000
The Company has a $400.0 million unsecured revolving line of credit which matures in June 2021. The unsecured revolving line of credit bears interest at a variable rate based on LIBOR, and a fixed fee is paid for the availability of this credit line. As of October 28, 2018, and October 29, 2017 the Company had no outstanding draws from this line of credit.
The Company had a $300.0 million term loan facility which expired in December 2016. With the acquisition of Columbus Manufacturing Inc. in November 2017, the Company obtained a two-year $375.0 million term loan which is due in full in November 2019. In December 2018, the Company will consider this term loan short term since the due date is less than one year.
The Company is required by certain covenants in its debt agreements to maintain specified levels of financial ratios and financial position. At the end of the current fiscal year, the Company was in compliance with all of these covenants.
Total interest paid in the last three fiscal years is as follows:
(in millions)2018 $ 25.62017 12.72016 12.9
Note GPension and Other Post-retirement Benefits The Company has several defined benefit plans and defined contribution plans covering most employees. Benefits for defined benefit pension plans covering hourly employees are provided based on stated amounts for each year of service, while plan benefits covering salaried employees are based on final average compensation. In fiscal 2011, an amendment was enacted for a defined benefit plan which included a change in the pension formula effective January 1, 2017. The amended formula remains a defined benefit formula, but bases the accrued benefit credit on age and service and defines the benefit as a lump sum. Effective October 31, 2016, the 401(k) match for these participants was increased. Total costs associated with the Company’s defined contribution benefit plans in fiscal years 2018, 2017, and 2016 were $44.2 million, $45.2 million, and $33.5 million, respectively.
Certain groups of employees are eligible for post-retirement health or welfare benefits. Benefits for retired employees vary for each group depending on respective retirement dates and applicable plan coverage in effect. Contribution requirements for retired employees are governed by the Retiree Health Care Payment Program and may change each year as the cost to provide coverage is determined.
Net periodic cost of defined benefit plans included the following:
Pension Benefits Post-retirement Benefits(in thousands) 2018 2017 2016 2018 2017 2016Service cost $ 31,612 $ 30,256 $ 26,951 $ 980 $ 1,106 $ 1,297Interest cost 56,196 54,263 55,728 11,169 11,630 13,346Expected return on plan assets (99,091) (90,936) (88,681) — — —Amortization of prior service cost (2,468) (3,000) (4,120) (3,111) (4,274) (4,282)Recognized actuarial loss (gain) 18,166 26,166 20,318 179 2,424 1,617Curtailment (gain) charge — — (4,438) — — —
Net periodic cost $ 4,415 $ 16,749 $ 5,758 $ 9,217 $ 10,886 $ 11,978
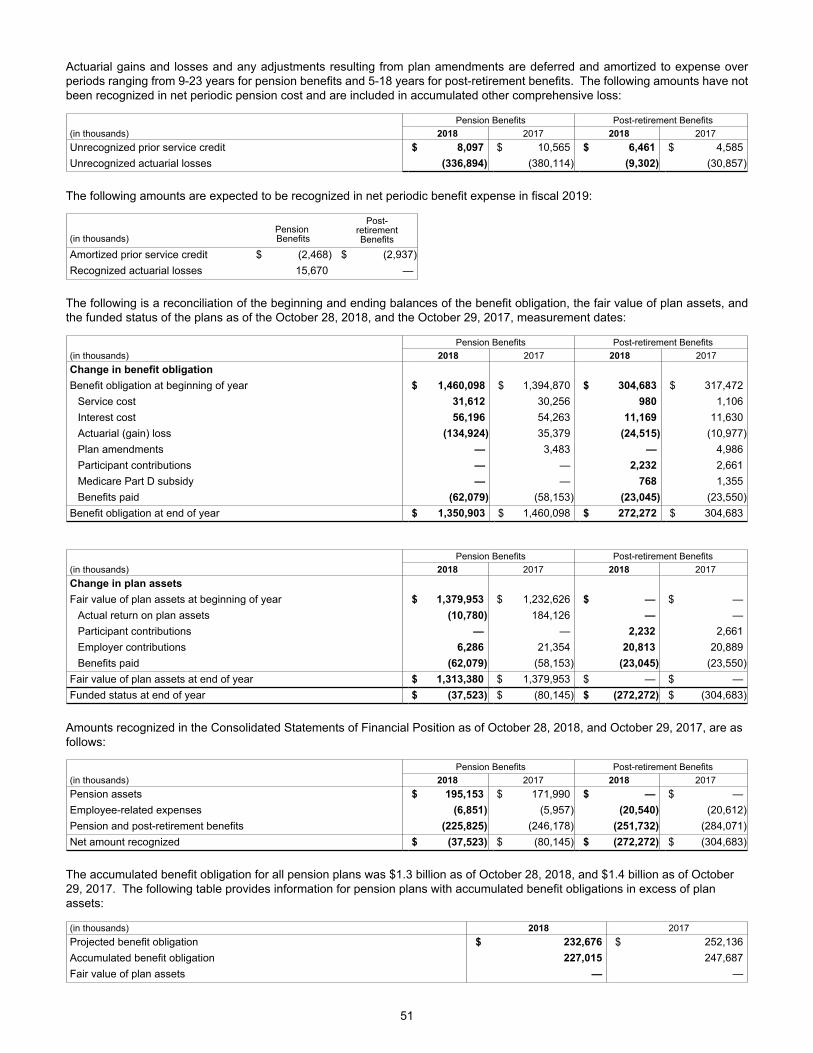
51
Actuarial gains and losses and any adjustments resulting from plan amendments are deferred and amortized to expense over periods ranging from 9-23 years for pension benefits and 5-18 years for post-retirement benefits. The following amounts have not been recognized in net periodic pension cost and are included in accumulated other comprehensive loss:
Pension Benefits Post-retirement Benefits(in thousands) 2018 2017 2018 2017Unrecognized prior service credit $ 8,097 $ 10,565 $ 6,461 $ 4,585Unrecognized actuarial losses (336,894) (380,114) (9,302) (30,857)
The following amounts are expected to be recognized in net periodic benefit expense in fiscal 2019:
(in thousands)Pension Benefits
Post-retirementBenefits
Amortized prior service credit $ (2,468) $ (2,937)Recognized actuarial losses 15,670 —
The following is a reconciliation of the beginning and ending balances of the benefit obligation, the fair value of plan assets, and the funded status of the plans as of the October 28, 2018, and the October 29, 2017, measurement dates:
Pension Benefits Post-retirement Benefits(in thousands) 2018 2017 2018 2017Change in benefit obligationBenefit obligation at beginning of year $ 1,460,098 $ 1,394,870 $ 304,683 $ 317,472
Service cost 31,612 30,256 980 1,106Interest cost 56,196 54,263 11,169 11,630Actuarial (gain) loss (134,924) 35,379 (24,515) (10,977)Plan amendments — 3,483 — 4,986Participant contributions — — 2,232 2,661Medicare Part D subsidy — — 768 1,355Benefits paid (62,079) (58,153) (23,045) (23,550)
Benefit obligation at end of year $ 1,350,903 $ 1,460,098 $ 272,272 $ 304,683
Pension Benefits Post-retirement Benefits(in thousands) 2018 2017 2018 2017Change in plan assetsFair value of plan assets at beginning of year $ 1,379,953 $ 1,232,626 $ — $ —
Actual return on plan assets (10,780) 184,126 — —Participant contributions — — 2,232 2,661Employer contributions 6,286 21,354 20,813 20,889Benefits paid (62,079) (58,153) (23,045) (23,550)
Fair value of plan assets at end of year $ 1,313,380 $ 1,379,953 $ — $ —Funded status at end of year $ (37,523) $ (80,145) $ (272,272) $ (304,683)
Amounts recognized in the Consolidated Statements of Financial Position as of October 28, 2018, and October 29, 2017, are as follows:
Pension Benefits Post-retirement Benefits(in thousands) 2018 2017 2018 2017Pension assets $ 195,153 $ 171,990 $ — $ —Employee-related expenses (6,851) (5,957) (20,540) (20,612)Pension and post-retirement benefits (225,825) (246,178) (251,732) (284,071)Net amount recognized $ (37,523) $ (80,145) $ (272,272) $ (304,683)
The accumulated benefit obligation for all pension plans was $1.3 billion as of October 28, 2018, and $1.4 billion as of October 29, 2017. The following table provides information for pension plans with accumulated benefit obligations in excess of plan assets:
(in thousands) 2018 2017Projected benefit obligation $ 232,676 $ 252,136Accumulated benefit obligation 227,015 247,687Fair value of plan assets — —
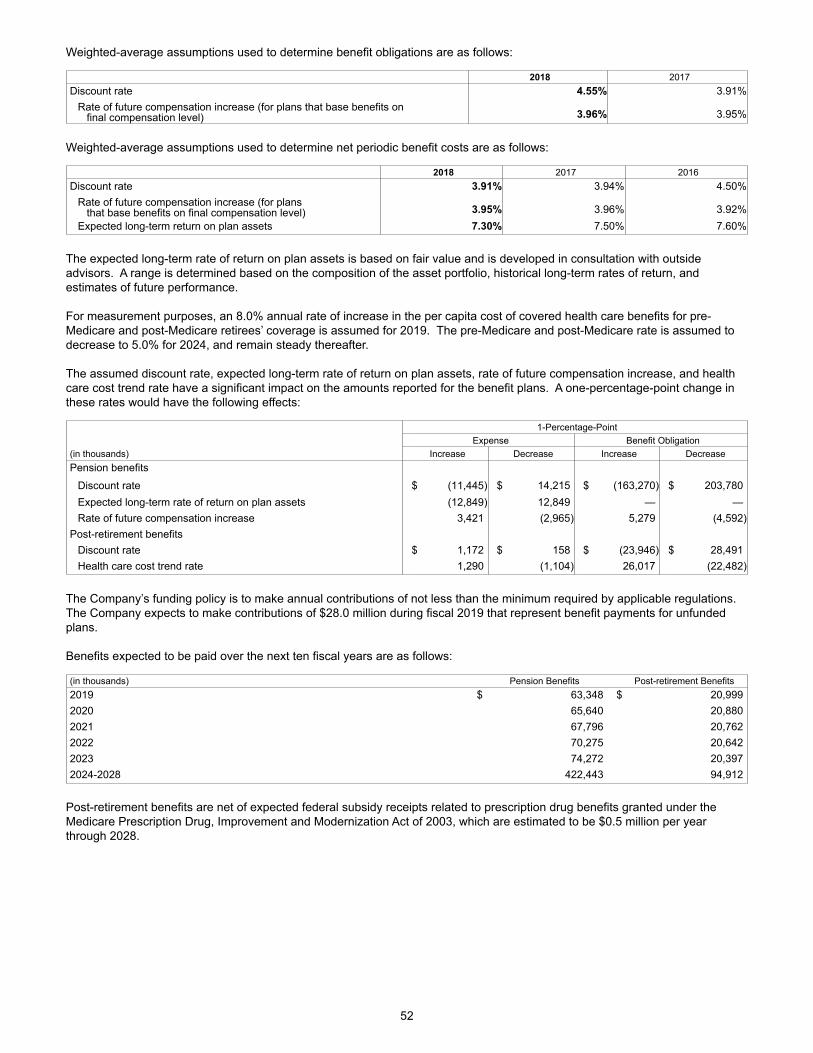
52
Weighted-average assumptions used to determine benefit obligations are as follows:
2018 2017Discount rate 4.55% 3.91%
Rate of future compensation increase (for plans that base benefits on final compensation level) 3.96% 3.95%
Weighted-average assumptions used to determine net periodic benefit costs are as follows:
2018 2017 2016Discount rate 3.91% 3.94% 4.50%
Rate of future compensation increase (for plans that base benefits on final compensation level) 3.95% 3.96% 3.92%Expected long-term return on plan assets 7.30% 7.50% 7.60%
The expected long-term rate of return on plan assets is based on fair value and is developed in consultation with outside advisors. A range is determined based on the composition of the asset portfolio, historical long-term rates of return, and estimates of future performance.
For measurement purposes, an 8.0% annual rate of increase in the per capita cost of covered health care benefits for pre-Medicare and post-Medicare retirees’ coverage is assumed for 2019. The pre-Medicare and post-Medicare rate is assumed to decrease to 5.0% for 2024, and remain steady thereafter. The assumed discount rate, expected long-term rate of return on plan assets, rate of future compensation increase, and health care cost trend rate have a significant impact on the amounts reported for the benefit plans. A one-percentage-point change in these rates would have the following effects:
1-Percentage-PointExpense Benefit Obligation
(in thousands) Increase Decrease Increase DecreasePension benefits
Discount rate $ (11,445) $ 14,215 $ (163,270) $ 203,780Expected long-term rate of return on plan assets (12,849) 12,849 — —Rate of future compensation increase 3,421 (2,965) 5,279 (4,592)
Post-retirement benefitsDiscount rate $ 1,172 $ 158 $ (23,946) $ 28,491Health care cost trend rate 1,290 (1,104) 26,017 (22,482)
The Company’s funding policy is to make annual contributions of not less than the minimum required by applicable regulations. The Company expects to make contributions of $28.0 million during fiscal 2019 that represent benefit payments for unfunded plans. Benefits expected to be paid over the next ten fiscal years are as follows:
(in thousands) Pension Benefits Post-retirement Benefits2019 $ 63,348 $ 20,9992020 65,640 20,8802021 67,796 20,7622022 70,275 20,6422023 74,272 20,3972024-2028 422,443 94,912
Post-retirement benefits are net of expected federal subsidy receipts related to prescription drug benefits granted under the Medicare Prescription Drug, Improvement and Modernization Act of 2003, which are estimated to be $0.5 million per year through 2028.
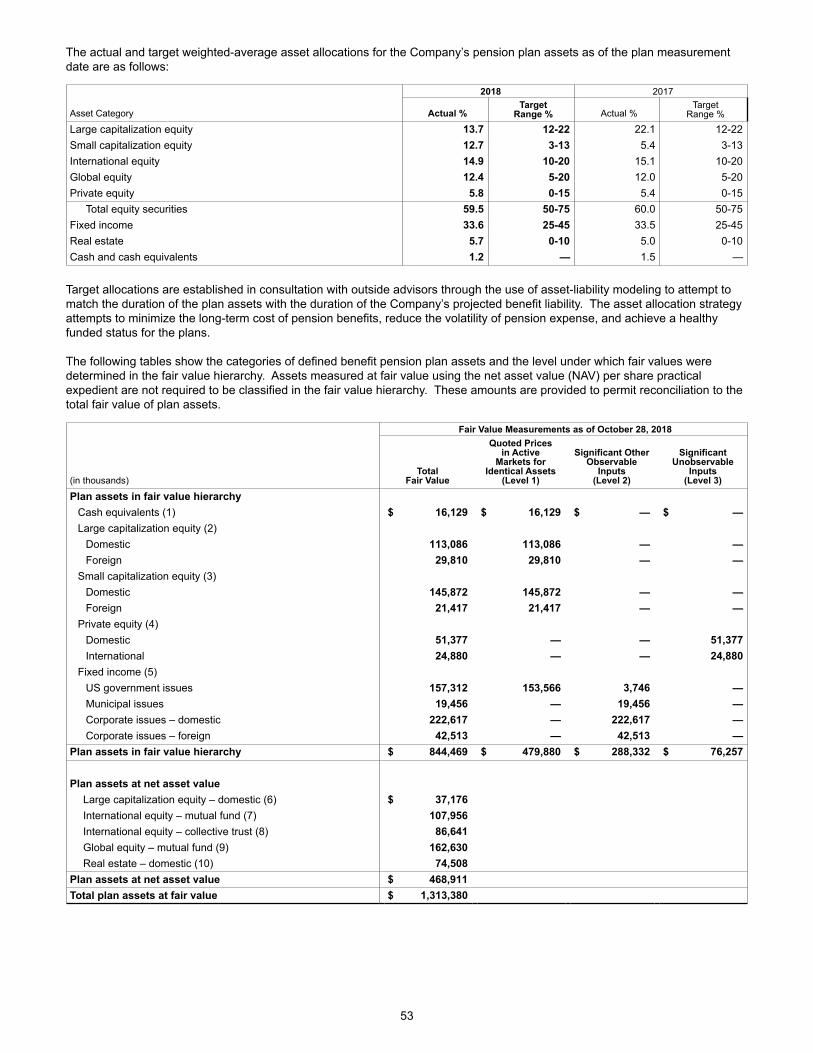
53
The actual and target weighted-average asset allocations for the Company’s pension plan assets as of the plan measurement date are as follows:
2018 2017
Asset Category Actual %Target
Range % Actual %Target
Range %
Large capitalization equity 13.7 12-22 22.1 12-22Small capitalization equity 12.7 3-13 5.4 3-13International equity 14.9 10-20 15.1 10-20Global equity 12.4 5-20 12.0 5-20Private equity 5.8 0-15 5.4 0-15
Total equity securities 59.5 50-75 60.0 50-75Fixed income 33.6 25-45 33.5 25-45Real estate 5.7 0-10 5.0 0-10Cash and cash equivalents 1.2 — 1.5 —
Target allocations are established in consultation with outside advisors through the use of asset-liability modeling to attempt to match the duration of the plan assets with the duration of the Company’s projected benefit liability. The asset allocation strategy attempts to minimize the long-term cost of pension benefits, reduce the volatility of pension expense, and achieve a healthy funded status for the plans.
The following tables show the categories of defined benefit pension plan assets and the level under which fair values were determined in the fair value hierarchy. Assets measured at fair value using the net asset value (NAV) per share practical expedient are not required to be classified in the fair value hierarchy. These amounts are provided to permit reconciliation to the total fair value of plan assets.
Fair Value Measurements as of October 28, 2018
(in thousands)Total
Fair Value
Quoted Pricesin Active
Markets forIdentical Assets
(Level 1)
Significant OtherObservable
Inputs(Level 2)
SignificantUnobservable
Inputs(Level 3)
Plan assets in fair value hierarchy Cash equivalents (1) $ 16,129 $ 16,129 $ — $ —Large capitalization equity (2)
Domestic 113,086 113,086 — —Foreign 29,810 29,810 — —
Small capitalization equity (3)Domestic 145,872 145,872 — —Foreign 21,417 21,417 — —
Private equity (4)Domestic 51,377 — — 51,377International 24,880 — — 24,880
Fixed income (5)US government issues 157,312 153,566 3,746 —Municipal issues 19,456 — 19,456 —Corporate issues – domestic 222,617 — 222,617 —Corporate issues – foreign 42,513 — 42,513 —
Plan assets in fair value hierarchy $ 844,469 $ 479,880 $ 288,332 $ 76,257
Plan assets at net asset valueLarge capitalization equity – domestic (6) $ 37,176International equity – mutual fund (7) 107,956International equity – collective trust (8) 86,641Global equity – mutual fund (9) 162,630Real estate – domestic (10) 74,508
Plan assets at net asset value $ 468,911Total plan assets at fair value $ 1,313,380
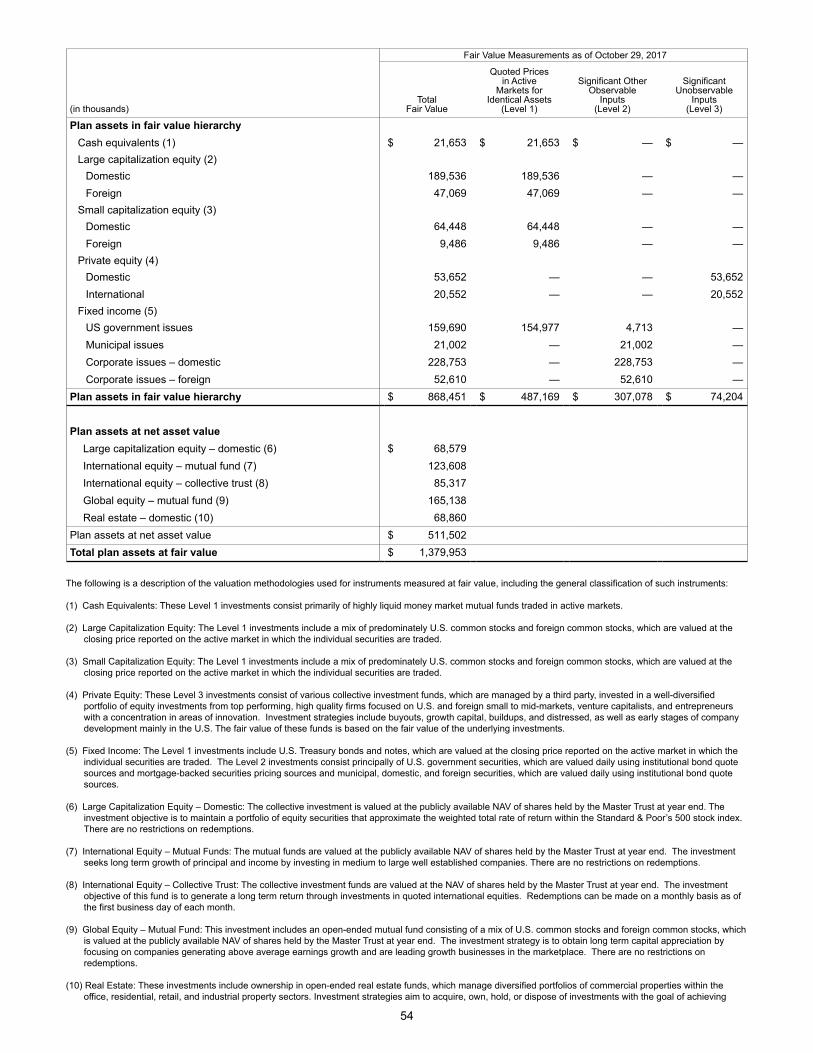
54
Fair Value Measurements as of October 29, 2017
(in thousands)Total
Fair Value
Quoted Pricesin Active
Markets forIdentical Assets
(Level 1)
Significant OtherObservable
Inputs(Level 2)
SignificantUnobservable
Inputs(Level 3)
Plan assets in fair value hierarchy Cash equivalents (1) $ 21,653 $ 21,653 $ — $ —Large capitalization equity (2)
Domestic 189,536 189,536 — —Foreign 47,069 47,069 — —
Small capitalization equity (3)Domestic 64,448 64,448 — —Foreign 9,486 9,486 — —
Private equity (4)Domestic 53,652 — — 53,652International 20,552 — — 20,552
Fixed income (5)US government issues 159,690 154,977 4,713 —Municipal issues 21,002 — 21,002 —Corporate issues – domestic 228,753 — 228,753 —Corporate issues – foreign 52,610 — 52,610 —
Plan assets in fair value hierarchy $ 868,451 $ 487,169 $ 307,078 $ 74,204
Plan assets at net asset valueLarge capitalization equity – domestic (6) $ 68,579International equity – mutual fund (7) 123,608International equity – collective trust (8) 85,317Global equity – mutual fund (9) 165,138Real estate – domestic (10) 68,860
Plan assets at net asset value $ 511,502Total plan assets at fair value $ 1,379,953
The following is a description of the valuation methodologies used for instruments measured at fair value, including the general classification of such instruments: (1) Cash Equivalents: These Level 1 investments consist primarily of highly liquid money market mutual funds traded in active markets. (2) Large Capitalization Equity: The Level 1 investments include a mix of predominately U.S. common stocks and foreign common stocks, which are valued at the
closing price reported on the active market in which the individual securities are traded. (3) Small Capitalization Equity: The Level 1 investments include a mix of predominately U.S. common stocks and foreign common stocks, which are valued at the
closing price reported on the active market in which the individual securities are traded. (4) Private Equity: These Level 3 investments consist of various collective investment funds, which are managed by a third party, invested in a well-diversified
portfolio of equity investments from top performing, high quality firms focused on U.S. and foreign small to mid-markets, venture capitalists, and entrepreneurs with a concentration in areas of innovation. Investment strategies include buyouts, growth capital, buildups, and distressed, as well as early stages of company development mainly in the U.S. The fair value of these funds is based on the fair value of the underlying investments.
(5) Fixed Income: The Level 1 investments include U.S. Treasury bonds and notes, which are valued at the closing price reported on the active market in which the
individual securities are traded. The Level 2 investments consist principally of U.S. government securities, which are valued daily using institutional bond quote sources and mortgage-backed securities pricing sources and municipal, domestic, and foreign securities, which are valued daily using institutional bond quote sources.
(6) Large Capitalization Equity – Domestic: The collective investment is valued at the publicly available NAV of shares held by the Master Trust at year end. The
investment objective is to maintain a portfolio of equity securities that approximate the weighted total rate of return within the Standard & Poor’s 500 stock index. There are no restrictions on redemptions.
(7) International Equity – Mutual Funds: The mutual funds are valued at the publicly available NAV of shares held by the Master Trust at year end. The investment
seeks long term growth of principal and income by investing in medium to large well established companies. There are no restrictions on redemptions. (8) International Equity – Collective Trust: The collective investment funds are valued at the NAV of shares held by the Master Trust at year end. The investment
objective of this fund is to generate a long term return through investments in quoted international equities. Redemptions can be made on a monthly basis as of the first business day of each month.
(9) Global Equity – Mutual Fund: This investment includes an open-ended mutual fund consisting of a mix of U.S. common stocks and foreign common stocks, which
is valued at the publicly available NAV of shares held by the Master Trust at year end. The investment strategy is to obtain long term capital appreciation by focusing on companies generating above average earnings growth and are leading growth businesses in the marketplace. There are no restrictions on redemptions.
(10) Real Estate: These investments include ownership in open-ended real estate funds, which manage diversified portfolios of commercial properties within the
office, residential, retail, and industrial property sectors. Investment strategies aim to acquire, own, hold, or dispose of investments with the goal of achieving
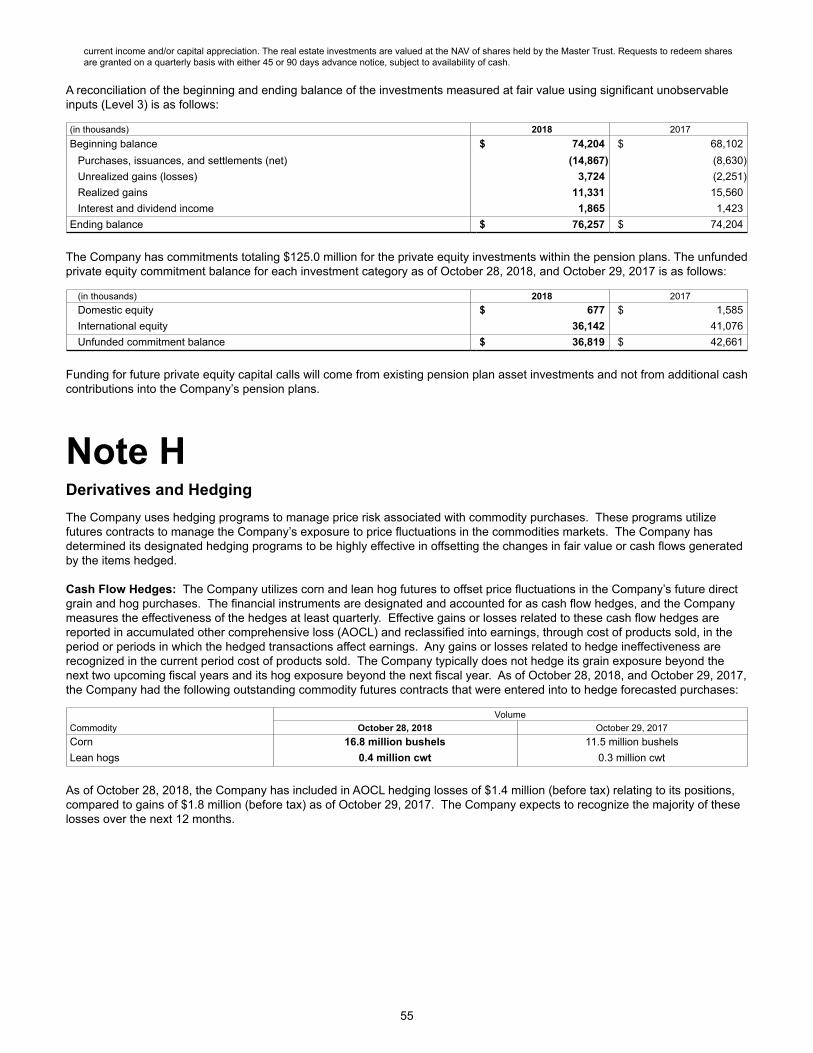
55
current income and/or capital appreciation. The real estate investments are valued at the NAV of shares held by the Master Trust. Requests to redeem shares are granted on a quarterly basis with either 45 or 90 days advance notice, subject to availability of cash.
A reconciliation of the beginning and ending balance of the investments measured at fair value using significant unobservable inputs (Level 3) is as follows:
(in thousands) 2018 2017Beginning balance $ 74,204 $ 68,102
Purchases, issuances, and settlements (net) (14,867) (8,630)Unrealized gains (losses) 3,724 (2,251)Realized gains 11,331 15,560Interest and dividend income 1,865 1,423
Ending balance $ 76,257 $ 74,204
The Company has commitments totaling $125.0 million for the private equity investments within the pension plans. The unfunded private equity commitment balance for each investment category as of October 28, 2018, and October 29, 2017 is as follows:
(in thousands) 2018 2017Domestic equity $ 677 $ 1,585International equity 36,142 41,076Unfunded commitment balance $ 36,819 $ 42,661
Funding for future private equity capital calls will come from existing pension plan asset investments and not from additional cash contributions into the Company’s pension plans.
Note H
Derivatives and HedgingThe Company uses hedging programs to manage price risk associated with commodity purchases. These programs utilize futures contracts to manage the Company’s exposure to price fluctuations in the commodities markets. The Company has determined its designated hedging programs to be highly effective in offsetting the changes in fair value or cash flows generated by the items hedged. Cash Flow Hedges: The Company utilizes corn and lean hog futures to offset price fluctuations in the Company’s future direct grain and hog purchases. The financial instruments are designated and accounted for as cash flow hedges, and the Company measures the effectiveness of the hedges at least quarterly. Effective gains or losses related to these cash flow hedges are reported in accumulated other comprehensive loss (AOCL) and reclassified into earnings, through cost of products sold, in the period or periods in which the hedged transactions affect earnings. Any gains or losses related to hedge ineffectiveness are recognized in the current period cost of products sold. The Company typically does not hedge its grain exposure beyond the next two upcoming fiscal years and its hog exposure beyond the next fiscal year. As of October 28, 2018, and October 29, 2017, the Company had the following outstanding commodity futures contracts that were entered into to hedge forecasted purchases:
VolumeCommodity October 28, 2018 October 29, 2017Corn 16.8 million bushels 11.5 million bushelsLean hogs 0.4 million cwt 0.3 million cwt
As of October 28, 2018, the Company has included in AOCL hedging losses of $1.4 million (before tax) relating to its positions, compared to gains of $1.8 million (before tax) as of October 29, 2017. The Company expects to recognize the majority of these losses over the next 12 months.
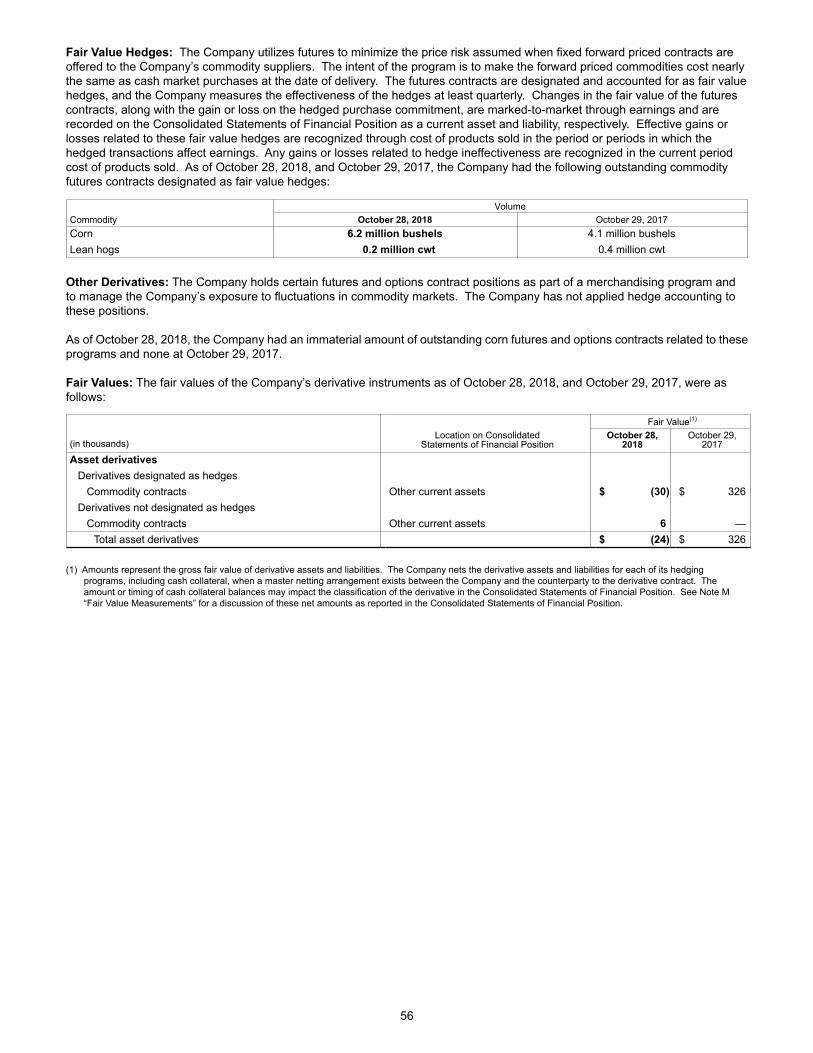
56
Fair Value Hedges: The Company utilizes futures to minimize the price risk assumed when fixed forward priced contracts are offered to the Company’s commodity suppliers. The intent of the program is to make the forward priced commodities cost nearly the same as cash market purchases at the date of delivery. The futures contracts are designated and accounted for as fair value hedges, and the Company measures the effectiveness of the hedges at least quarterly. Changes in the fair value of the futures contracts, along with the gain or loss on the hedged purchase commitment, are marked-to-market through earnings and are recorded on the Consolidated Statements of Financial Position as a current asset and liability, respectively. Effective gains or losses related to these fair value hedges are recognized through cost of products sold in the period or periods in which the hedged transactions affect earnings. Any gains or losses related to hedge ineffectiveness are recognized in the current period cost of products sold. As of October 28, 2018, and October 29, 2017, the Company had the following outstanding commodity futures contracts designated as fair value hedges:
VolumeCommodity October 28, 2018 October 29, 2017Corn 6.2 million bushels 4.1 million bushelsLean hogs 0.2 million cwt 0.4 million cwt
Other Derivatives: The Company holds certain futures and options contract positions as part of a merchandising program and to manage the Company’s exposure to fluctuations in commodity markets. The Company has not applied hedge accounting to these positions. As of October 28, 2018, the Company had an immaterial amount of outstanding corn futures and options contracts related to these programs and none at October 29, 2017.
Fair Values: The fair values of the Company’s derivative instruments as of October 28, 2018, and October 29, 2017, were as follows:
Fair Value(1)
(in thousands)Location on Consolidated
Statements of Financial PositionOctober 28,
2018October 29,
2017
Asset derivatives Derivatives designated as hedges Commodity contracts Other current assets $ (30) $ 326Derivatives not designated as hedges Commodity contracts Other current assets 6 —
Total asset derivatives $ (24) $ 326
(1) Amounts represent the gross fair value of derivative assets and liabilities. The Company nets the derivative assets and liabilities for each of its hedging
programs, including cash collateral, when a master netting arrangement exists between the Company and the counterparty to the derivative contract. The amount or timing of cash collateral balances may impact the classification of the derivative in the Consolidated Statements of Financial Position. See Note M “Fair Value Measurements” for a discussion of these net amounts as reported in the Consolidated Statements of Financial Position.
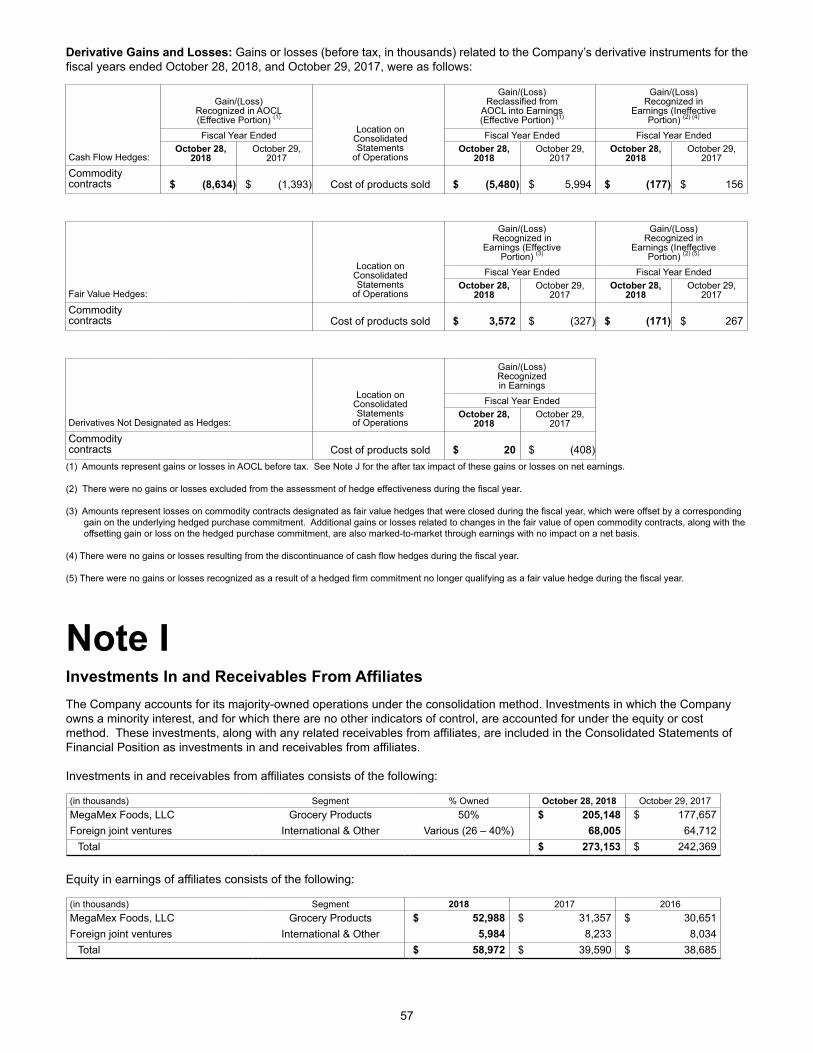
57
Derivative Gains and Losses: Gains or losses (before tax, in thousands) related to the Company’s derivative instruments for the fiscal years ended October 28, 2018, and October 29, 2017, were as follows:
Gain/(Loss)
Recognized in AOCL(Effective Portion) (1)
Location onConsolidatedStatements
of Operations
Gain/(Loss)Reclassified from
AOCL into Earnings(Effective Portion) (1)
Gain/(Loss)Recognized in
Earnings (IneffectivePortion) (2) (4)
Fiscal Year Ended Fiscal Year Ended Fiscal Year Ended
Cash Flow Hedges:October 28,
2018October 29,
2017October 28,
2018October 29,
2017October 28,
2018October 29,
2017
Commoditycontracts $ (8,634) $ (1,393) Cost of products sold $ (5,480) $ 5,994 $ (177) $ 156
Location on
ConsolidatedStatements
of Operations
Gain/(Loss)Recognized in
Earnings (EffectivePortion) (3)
Gain/(Loss)Recognized in
Earnings (IneffectivePortion) (2) (5)
Fiscal Year Ended Fiscal Year Ended
Fair Value Hedges: October 28,
2018October 29,
2017October 28,
2018October 29,
2017
Commoditycontracts Cost of products sold $ 3,572 $ (327) $ (171) $ 267
Location on
ConsolidatedStatements
of Operations
Gain/(Loss)Recognizedin Earnings
Fiscal Year Ended
Derivatives Not Designated as Hedges:October 28,
2018October 29,
2017 Commoditycontracts Cost of products sold $ 20 $ (408)
(1) Amounts represent gains or losses in AOCL before tax. See Note J for the after tax impact of these gains or losses on net earnings.
(2) There were no gains or losses excluded from the assessment of hedge effectiveness during the fiscal year.
(3) Amounts represent losses on commodity contracts designated as fair value hedges that were closed during the fiscal year, which were offset by a corresponding gain on the underlying hedged purchase commitment. Additional gains or losses related to changes in the fair value of open commodity contracts, along with the offsetting gain or loss on the hedged purchase commitment, are also marked-to-market through earnings with no impact on a net basis.
(4) There were no gains or losses resulting from the discontinuance of cash flow hedges during the fiscal year.
(5) There were no gains or losses recognized as a result of a hedged firm commitment no longer qualifying as a fair value hedge during the fiscal year.
Note IInvestments In and Receivables From AffiliatesThe Company accounts for its majority-owned operations under the consolidation method. Investments in which the Company owns a minority interest, and for which there are no other indicators of control, are accounted for under the equity or cost method. These investments, along with any related receivables from affiliates, are included in the Consolidated Statements of Financial Position as investments in and receivables from affiliates.
Investments in and receivables from affiliates consists of the following:
(in thousands) Segment % Owned October 28, 2018 October 29, 2017MegaMex Foods, LLC Grocery Products 50% $ 205,148 $ 177,657Foreign joint ventures International & Other Various (26 – 40%) 68,005 64,712
Total $ 273,153 $ 242,369
Equity in earnings of affiliates consists of the following:
(in thousands) Segment 2018 2017 2016MegaMex Foods, LLC Grocery Products $ 52,988 $ 31,357 $ 30,651Foreign joint ventures International & Other 5,984 8,233 8,034
Total $ 58,972 $ 39,590 $ 38,685
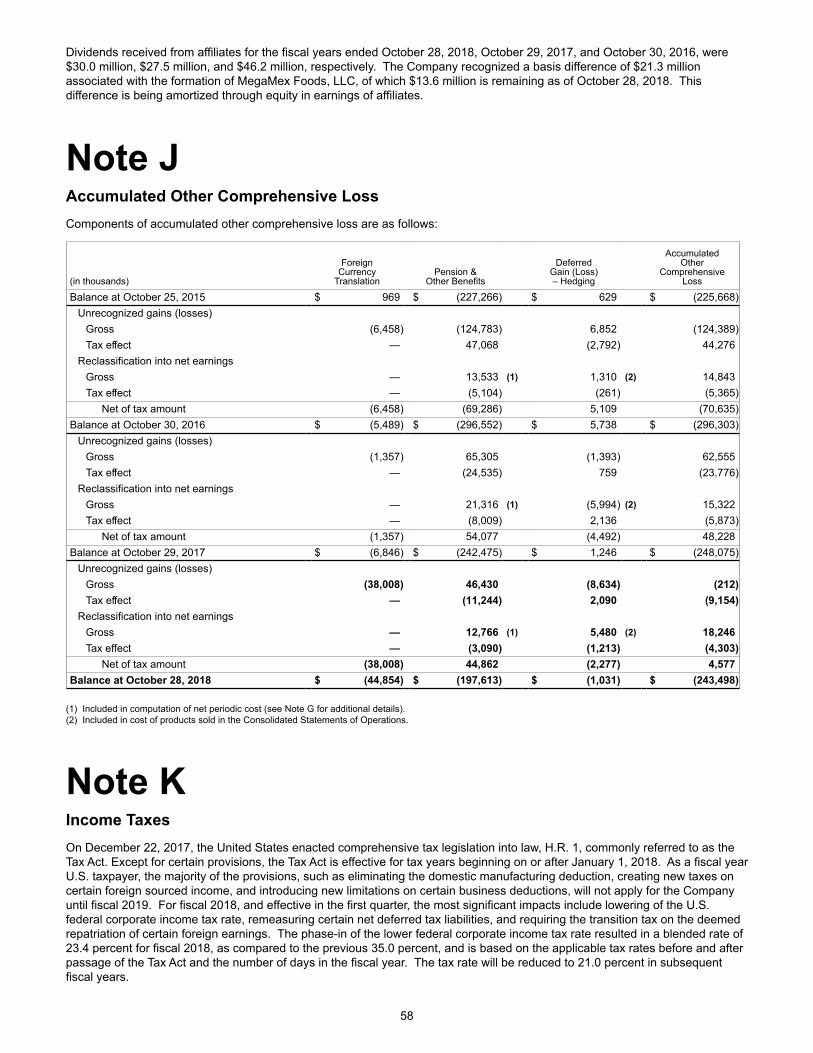
58
Dividends received from affiliates for the fiscal years ended October 28, 2018, October 29, 2017, and October 30, 2016, were $30.0 million, $27.5 million, and $46.2 million, respectively. The Company recognized a basis difference of $21.3 million associated with the formation of MegaMex Foods, LLC, of which $13.6 million is remaining as of October 28, 2018. This difference is being amortized through equity in earnings of affiliates.
Note J Accumulated Other Comprehensive LossComponents of accumulated other comprehensive loss are as follows:
(in thousands)
ForeignCurrency
TranslationPension &
Other Benefits
DeferredGain (Loss)– Hedging
AccumulatedOther
ComprehensiveLoss
Balance at October 25, 2015 $ 969 $ (227,266) $ 629 $ (225,668)Unrecognized gains (losses)
Gross (6,458) (124,783) 6,852 (124,389)Tax effect — 47,068 (2,792) 44,276
Reclassification into net earningsGross — 13,533 (1) 1,310 (2) 14,843Tax effect — (5,104) (261) (5,365)
Net of tax amount (6,458) (69,286) 5,109 (70,635)Balance at October 30, 2016 $ (5,489) $ (296,552) $ 5,738 $ (296,303)
Unrecognized gains (losses)Gross (1,357) 65,305 (1,393) 62,555Tax effect — (24,535) 759 (23,776)
Reclassification into net earningsGross — 21,316 (1) (5,994) (2) 15,322Tax effect — (8,009) 2,136 (5,873)
Net of tax amount (1,357) 54,077 (4,492) 48,228Balance at October 29, 2017 $ (6,846) $ (242,475) $ 1,246 $ (248,075)
Unrecognized gains (losses)Gross (38,008) 46,430 (8,634) (212)Tax effect — (11,244) 2,090 (9,154)
Reclassification into net earningsGross — 12,766 (1) 5,480 (2) 18,246Tax effect — (3,090) (1,213) (4,303)
Net of tax amount (38,008) 44,862 (2,277) 4,577Balance at October 28, 2018 $ (44,854) $ (197,613) $ (1,031) $ (243,498)
(1) Included in computation of net periodic cost (see Note G for additional details).(2) Included in cost of products sold in the Consolidated Statements of Operations.
Note KIncome TaxesOn December 22, 2017, the United States enacted comprehensive tax legislation into law, H.R. 1, commonly referred to as the Tax Act. Except for certain provisions, the Tax Act is effective for tax years beginning on or after January 1, 2018. As a fiscal year U.S. taxpayer, the majority of the provisions, such as eliminating the domestic manufacturing deduction, creating new taxes on certain foreign sourced income, and introducing new limitations on certain business deductions, will not apply for the Company until fiscal 2019. For fiscal 2018, and effective in the first quarter, the most significant impacts include lowering of the U.S. federal corporate income tax rate, remeasuring certain net deferred tax liabilities, and requiring the transition tax on the deemed repatriation of certain foreign earnings. The phase-in of the lower federal corporate income tax rate resulted in a blended rate of 23.4 percent for fiscal 2018, as compared to the previous 35.0 percent, and is based on the applicable tax rates before and after passage of the Tax Act and the number of days in the fiscal year. The tax rate will be reduced to 21.0 percent in subsequent fiscal years.
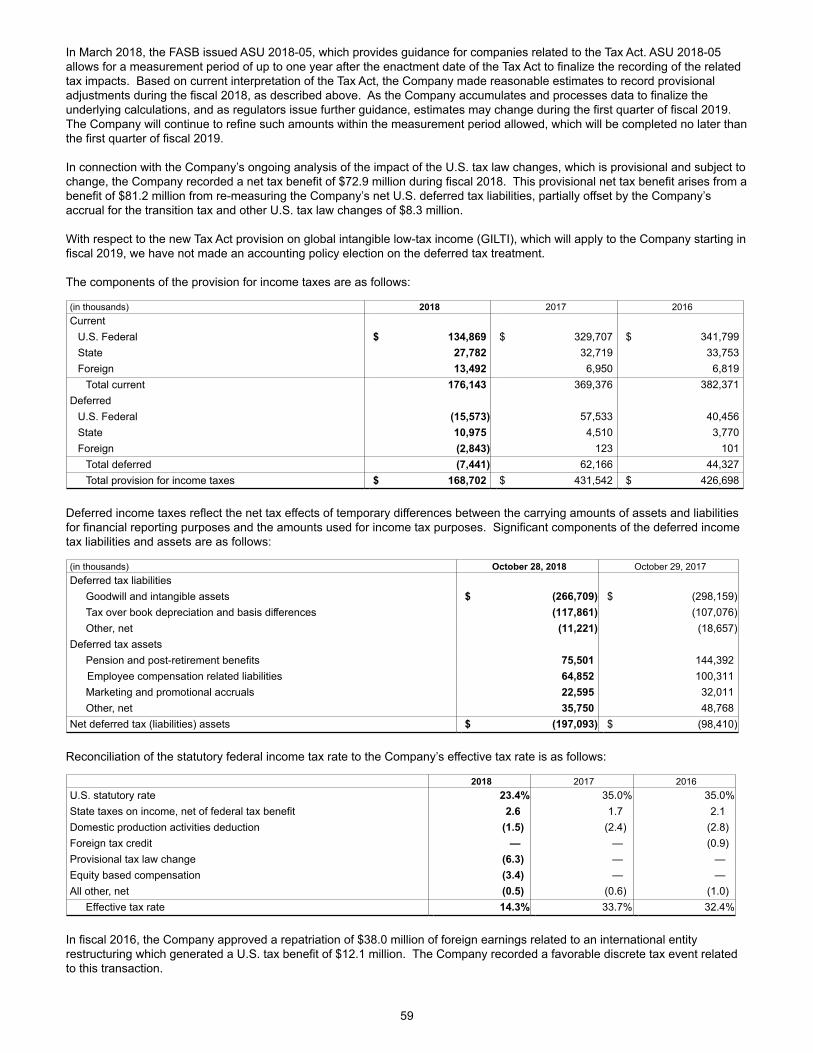
59
In March 2018, the FASB issued ASU 2018-05, which provides guidance for companies related to the Tax Act. ASU 2018-05 allows for a measurement period of up to one year after the enactment date of the Tax Act to finalize the recording of the related tax impacts. Based on current interpretation of the Tax Act, the Company made reasonable estimates to record provisional adjustments during the fiscal 2018, as described above. As the Company accumulates and processes data to finalize the underlying calculations, and as regulators issue further guidance, estimates may change during the first quarter of fiscal 2019. The Company will continue to refine such amounts within the measurement period allowed, which will be completed no later than the first quarter of fiscal 2019.
In connection with the Company’s ongoing analysis of the impact of the U.S. tax law changes, which is provisional and subject to change, the Company recorded a net tax benefit of $72.9 million during fiscal 2018. This provisional net tax benefit arises from a benefit of $81.2 million from re-measuring the Company’s net U.S. deferred tax liabilities, partially offset by the Company’s accrual for the transition tax and other U.S. tax law changes of $8.3 million.
With respect to the new Tax Act provision on global intangible low-tax income (GILTI), which will apply to the Company starting in fiscal 2019, we have not made an accounting policy election on the deferred tax treatment.
The components of the provision for income taxes are as follows:
(in thousands) 2018 2017 2016Current
U.S. Federal $ 134,869 $ 329,707 $ 341,799State 27,782 32,719 33,753Foreign 13,492 6,950 6,819
Total current 176,143 369,376 382,371Deferred
U.S. Federal (15,573) 57,533 40,456State 10,975 4,510 3,770Foreign (2,843) 123 101
Total deferred (7,441) 62,166 44,327Total provision for income taxes $ 168,702 $ 431,542 $ 426,698
Deferred income taxes reflect the net tax effects of temporary differences between the carrying amounts of assets and liabilities for financial reporting purposes and the amounts used for income tax purposes. Significant components of the deferred income tax liabilities and assets are as follows:
(in thousands) October 28, 2018 October 29, 2017Deferred tax liabilities
Goodwill and intangible assets $ (266,709) $ (298,159)Tax over book depreciation and basis differences (117,861) (107,076)Other, net (11,221) (18,657)
Deferred tax assetsPension and post-retirement benefits 75,501 144,392Employee compensation related liabilities 64,852 100,311Marketing and promotional accruals 22,595 32,011Other, net 35,750 48,768
Net deferred tax (liabilities) assets $ (197,093) $ (98,410)
Reconciliation of the statutory federal income tax rate to the Company’s effective tax rate is as follows:
2018 2017 2016U.S. statutory rate 23.4% 35.0% 35.0%State taxes on income, net of federal tax benefit 2.6 1.7 2.1Domestic production activities deduction (1.5) (2.4) (2.8)Foreign tax credit — — (0.9)Provisional tax law change (6.3) — —Equity based compensation (3.4) — —All other, net (0.5) (0.6) (1.0)
Effective tax rate 14.3% 33.7% 32.4%
In fiscal 2016, the Company approved a repatriation of $38.0 million of foreign earnings related to an international entity restructuring which generated a U.S. tax benefit of $12.1 million. The Company recorded a favorable discrete tax event related to this transaction.
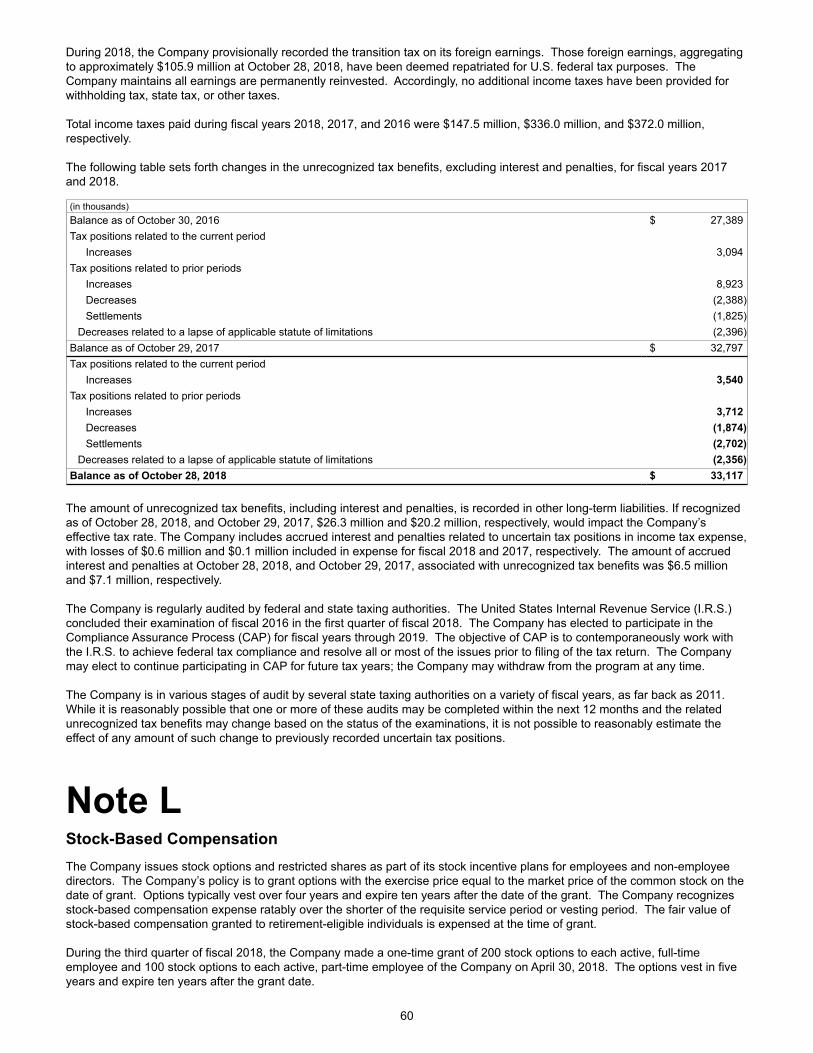
60
During 2018, the Company provisionally recorded the transition tax on its foreign earnings. Those foreign earnings, aggregating to approximately $105.9 million at October 28, 2018, have been deemed repatriated for U.S. federal tax purposes. The Company maintains all earnings are permanently reinvested. Accordingly, no additional income taxes have been provided for withholding tax, state tax, or other taxes.
Total income taxes paid during fiscal years 2018, 2017, and 2016 were $147.5 million, $336.0 million, and $372.0 million, respectively. The following table sets forth changes in the unrecognized tax benefits, excluding interest and penalties, for fiscal years 2017 and 2018.
(in thousands)Balance as of October 30, 2016 $ 27,389Tax positions related to the current period
Increases 3,094Tax positions related to prior periods
Increases 8,923Decreases (2,388)Settlements (1,825)
Decreases related to a lapse of applicable statute of limitations (2,396)Balance as of October 29, 2017 $ 32,797Tax positions related to the current period
Increases 3,540Tax positions related to prior periods
Increases 3,712Decreases (1,874)Settlements (2,702)
Decreases related to a lapse of applicable statute of limitations (2,356)Balance as of October 28, 2018 $ 33,117
The amount of unrecognized tax benefits, including interest and penalties, is recorded in other long-term liabilities. If recognized as of October 28, 2018, and October 29, 2017, $26.3 million and $20.2 million, respectively, would impact the Company’s effective tax rate. The Company includes accrued interest and penalties related to uncertain tax positions in income tax expense, with losses of $0.6 million and $0.1 million included in expense for fiscal 2018 and 2017, respectively. The amount of accrued interest and penalties at October 28, 2018, and October 29, 2017, associated with unrecognized tax benefits was $6.5 million and $7.1 million, respectively. The Company is regularly audited by federal and state taxing authorities. The United States Internal Revenue Service (I.R.S.) concluded their examination of fiscal 2016 in the first quarter of fiscal 2018. The Company has elected to participate in the Compliance Assurance Process (CAP) for fiscal years through 2019. The objective of CAP is to contemporaneously work with the I.R.S. to achieve federal tax compliance and resolve all or most of the issues prior to filing of the tax return. The Company may elect to continue participating in CAP for future tax years; the Company may withdraw from the program at any time. The Company is in various stages of audit by several state taxing authorities on a variety of fiscal years, as far back as 2011. While it is reasonably possible that one or more of these audits may be completed within the next 12 months and the related unrecognized tax benefits may change based on the status of the examinations, it is not possible to reasonably estimate the effect of any amount of such change to previously recorded uncertain tax positions.
Note LStock-Based CompensationThe Company issues stock options and restricted shares as part of its stock incentive plans for employees and non-employee directors. The Company’s policy is to grant options with the exercise price equal to the market price of the common stock on the date of grant. Options typically vest over four years and expire ten years after the date of the grant. The Company recognizes stock-based compensation expense ratably over the shorter of the requisite service period or vesting period. The fair value of stock-based compensation granted to retirement-eligible individuals is expensed at the time of grant.
During the third quarter of fiscal 2018, the Company made a one-time grant of 200 stock options to each active, full-time employee and 100 stock options to each active, part-time employee of the Company on April 30, 2018. The options vest in five years and expire ten years after the grant date.
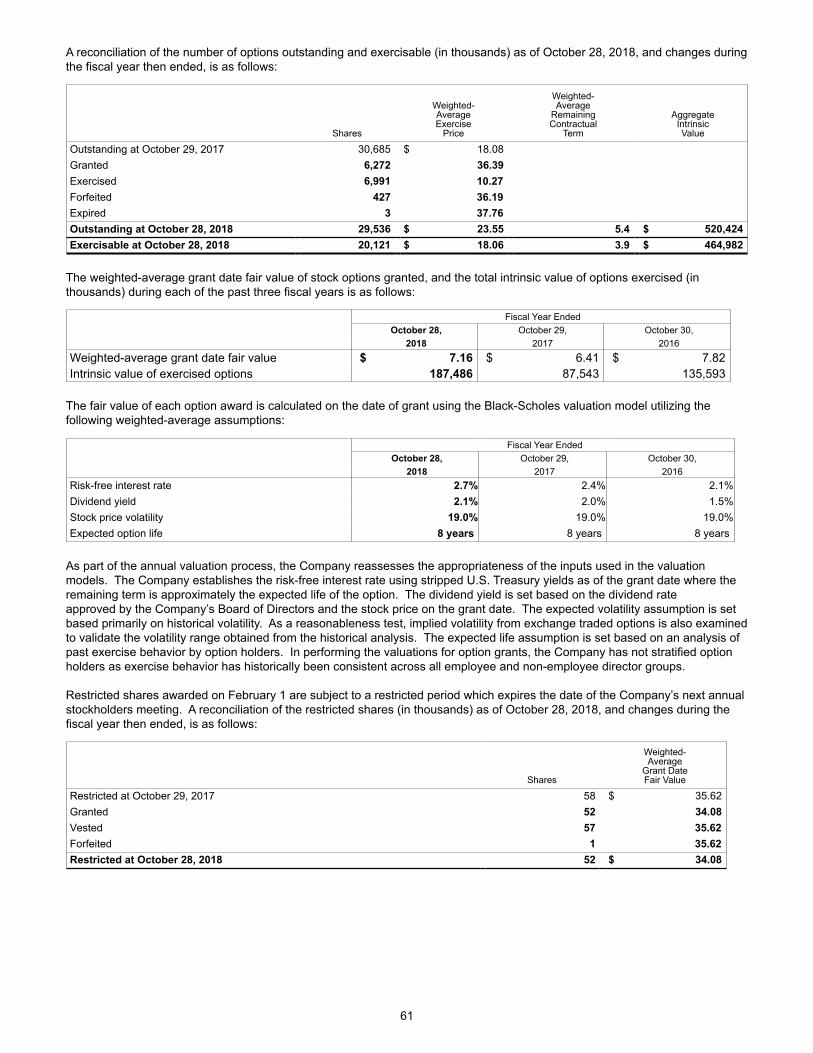
61
A reconciliation of the number of options outstanding and exercisable (in thousands) as of October 28, 2018, and changes during the fiscal year then ended, is as follows:
Shares
Weighted-AverageExercise
Price
Weighted-Average
RemainingContractual
Term
AggregateIntrinsicValue
Outstanding at October 29, 2017 30,685 $ 18.08Granted 6,272 36.39Exercised 6,991 10.27Forfeited 427 36.19Expired 3 37.76Outstanding at October 28, 2018 29,536 $ 23.55 5.4 $ 520,424Exercisable at October 28, 2018 20,121 $ 18.06 3.9 $ 464,982
The weighted-average grant date fair value of stock options granted, and the total intrinsic value of options exercised (in thousands) during each of the past three fiscal years is as follows:
Fiscal Year Ended October 28, October 29, October 30, 2018 2017 2016Weighted-average grant date fair value $ 7.16 $ 6.41 $ 7.82Intrinsic value of exercised options 187,486 87,543 135,593
The fair value of each option award is calculated on the date of grant using the Black-Scholes valuation model utilizing the following weighted-average assumptions:
Fiscal Year Ended October 28, October 29, October 30, 2018 2017 2016Risk-free interest rate 2.7% 2.4% 2.1%Dividend yield 2.1% 2.0% 1.5%Stock price volatility 19.0% 19.0% 19.0%Expected option life 8 years 8 years 8 years
As part of the annual valuation process, the Company reassesses the appropriateness of the inputs used in the valuation models. The Company establishes the risk-free interest rate using stripped U.S. Treasury yields as of the grant date where the remaining term is approximately the expected life of the option. The dividend yield is set based on the dividend rateapproved by the Company’s Board of Directors and the stock price on the grant date. The expected volatility assumption is set based primarily on historical volatility. As a reasonableness test, implied volatility from exchange traded options is also examined to validate the volatility range obtained from the historical analysis. The expected life assumption is set based on an analysis of past exercise behavior by option holders. In performing the valuations for option grants, the Company has not stratified option holders as exercise behavior has historically been consistent across all employee and non-employee director groups. Restricted shares awarded on February 1 are subject to a restricted period which expires the date of the Company’s next annualstockholders meeting. A reconciliation of the restricted shares (in thousands) as of October 28, 2018, and changes during the fiscal year then ended, is as follows:
Shares
Weighted-Average
Grant DateFair Value
Restricted at October 29, 2017 58 $ 35.62Granted 52 34.08Vested 57 35.62Forfeited 1 35.62Restricted at October 28, 2018 52 $ 34.08
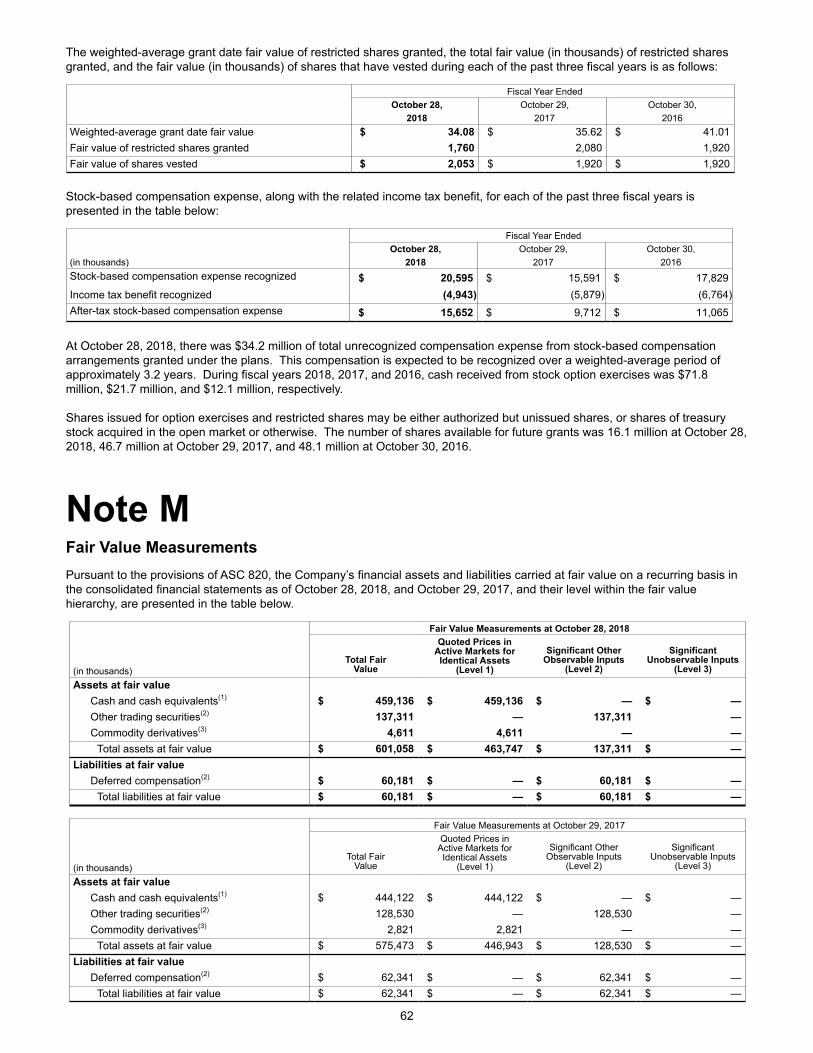
62
The weighted-average grant date fair value of restricted shares granted, the total fair value (in thousands) of restricted shares granted, and the fair value (in thousands) of shares that have vested during each of the past three fiscal years is as follows:
Fiscal Year Ended October 28, October 29, October 30, 2018 2017 2016Weighted-average grant date fair value $ 34.08 $ 35.62 $ 41.01Fair value of restricted shares granted 1,760 2,080 1,920Fair value of shares vested $ 2,053 $ 1,920 $ 1,920
Stock-based compensation expense, along with the related income tax benefit, for each of the past three fiscal years is presented in the table below:
Fiscal Year Ended October 28, October 29, October 30,(in thousands) 2018 2017 2016Stock-based compensation expense recognized $ 20,595 $ 15,591 $ 17,829Income tax benefit recognized (4,943) (5,879) (6,764)After-tax stock-based compensation expense $ 15,652 $ 9,712 $ 11,065
At October 28, 2018, there was $34.2 million of total unrecognized compensation expense from stock-based compensation arrangements granted under the plans. This compensation is expected to be recognized over a weighted-average period of approximately 3.2 years. During fiscal years 2018, 2017, and 2016, cash received from stock option exercises was $71.8 million, $21.7 million, and $12.1 million, respectively. Shares issued for option exercises and restricted shares may be either authorized but unissued shares, or shares of treasury stock acquired in the open market or otherwise. The number of shares available for future grants was 16.1 million at October 28, 2018, 46.7 million at October 29, 2017, and 48.1 million at October 30, 2016.
Note MFair Value MeasurementsPursuant to the provisions of ASC 820, the Company’s financial assets and liabilities carried at fair value on a recurring basis in the consolidated financial statements as of October 28, 2018, and October 29, 2017, and their level within the fair value hierarchy, are presented in the table below.
Fair Value Measurements at October 28, 2018
Total Fair Value
Quoted Prices inActive Markets forIdentical Assets
(Level 1)
Significant OtherObservable Inputs
(Level 2)
SignificantUnobservable Inputs
(Level 3)(in thousands)Assets at fair value
Cash and cash equivalents(1) $ 459,136 $ 459,136 $ — $ —Other trading securities(2) 137,311 — 137,311 —Commodity derivatives(3) 4,611 4,611 — —
Total assets at fair value $ 601,058 $ 463,747 $ 137,311 $ —Liabilities at fair value
Deferred compensation(2) $ 60,181 $ — $ 60,181 $ —Total liabilities at fair value $ 60,181 $ — $ 60,181 $ —
Fair Value Measurements at October 29, 2017
Total Fair Value
Quoted Prices in Active Markets for Identical Assets
(Level 1)
Significant OtherObservable Inputs
(Level 2)
SignificantUnobservable Inputs
(Level 3)(in thousands)Assets at fair value
Cash and cash equivalents(1) $ 444,122 $ 444,122 $ — $ —Other trading securities(2) 128,530 — 128,530 —Commodity derivatives(3) 2,821 2,821 — —
Total assets at fair value $ 575,473 $ 446,943 $ 128,530 $ —Liabilities at fair value
Deferred compensation(2) $ 62,341 $ — $ 62,341 $ —Total liabilities at fair value $ 62,341 $ — $ 62,341 $ —
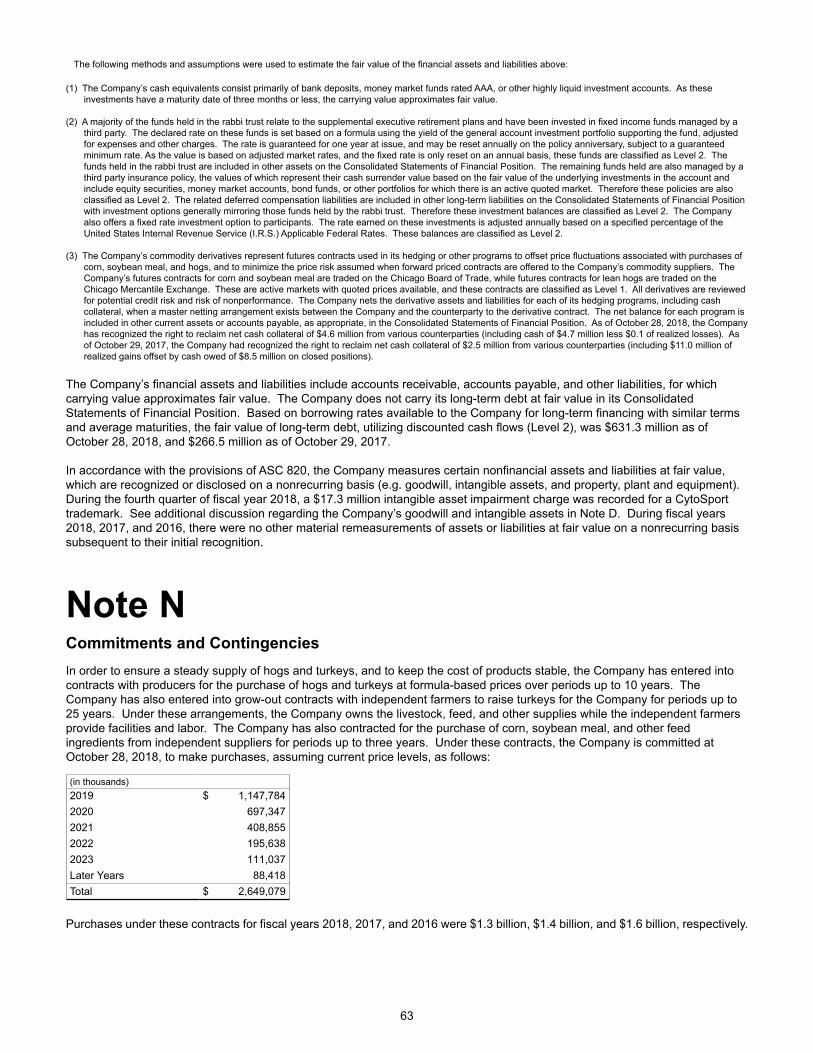
63
The following methods and assumptions were used to estimate the fair value of the financial assets and liabilities above:
(1) The Company’s cash equivalents consist primarily of bank deposits, money market funds rated AAA, or other highly liquid investment accounts. As these
investments have a maturity date of three months or less, the carrying value approximates fair value. (2) A majority of the funds held in the rabbi trust relate to the supplemental executive retirement plans and have been invested in fixed income funds managed by a
third party. The declared rate on these funds is set based on a formula using the yield of the general account investment portfolio supporting the fund, adjusted for expenses and other charges. The rate is guaranteed for one year at issue, and may be reset annually on the policy anniversary, subject to a guaranteed minimum rate. As the value is based on adjusted market rates, and the fixed rate is only reset on an annual basis, these funds are classified as Level 2. The funds held in the rabbi trust are included in other assets on the Consolidated Statements of Financial Position. The remaining funds held are also managed by a third party insurance policy, the values of which represent their cash surrender value based on the fair value of the underlying investments in the account and include equity securities, money market accounts, bond funds, or other portfolios for which there is an active quoted market. Therefore these policies are also classified as Level 2. The related deferred compensation liabilities are included in other long-term liabilities on the Consolidated Statements of Financial Position with investment options generally mirroring those funds held by the rabbi trust. Therefore these investment balances are classified as Level 2. The Company also offers a fixed rate investment option to participants. The rate earned on these investments is adjusted annually based on a specified percentage of the United States Internal Revenue Service (I.R.S.) Applicable Federal Rates. These balances are classified as Level 2.
(3) The Company’s commodity derivatives represent futures contracts used in its hedging or other programs to offset price fluctuations associated with purchases of
corn, soybean meal, and hogs, and to minimize the price risk assumed when forward priced contracts are offered to the Company’s commodity suppliers. The Company’s futures contracts for corn and soybean meal are traded on the Chicago Board of Trade, while futures contracts for lean hogs are traded on the Chicago Mercantile Exchange. These are active markets with quoted prices available, and these contracts are classified as Level 1. All derivatives are reviewed for potential credit risk and risk of nonperformance. The Company nets the derivative assets and liabilities for each of its hedging programs, including cash collateral, when a master netting arrangement exists between the Company and the counterparty to the derivative contract. The net balance for each program is included in other current assets or accounts payable, as appropriate, in the Consolidated Statements of Financial Position. As of October 28, 2018, the Company has recognized the right to reclaim net cash collateral of $4.6 million from various counterparties (including cash of $4.7 million less $0.1 of realized losses). As of October 29, 2017, the Company had recognized the right to reclaim net cash collateral of $2.5 million from various counterparties (including $11.0 million of realized gains offset by cash owed of $8.5 million on closed positions).
The Company’s financial assets and liabilities include accounts receivable, accounts payable, and other liabilities, for which carrying value approximates fair value. The Company does not carry its long-term debt at fair value in its Consolidated Statements of Financial Position. Based on borrowing rates available to the Company for long-term financing with similar terms and average maturities, the fair value of long-term debt, utilizing discounted cash flows (Level 2), was $631.3 million as of October 28, 2018, and $266.5 million as of October 29, 2017. In accordance with the provisions of ASC 820, the Company measures certain nonfinancial assets and liabilities at fair value, which are recognized or disclosed on a nonrecurring basis (e.g. goodwill, intangible assets, and property, plant and equipment). During the fourth quarter of fiscal year 2018, a $17.3 million intangible asset impairment charge was recorded for a CytoSport trademark. See additional discussion regarding the Company’s goodwill and intangible assets in Note D. During fiscal years 2018, 2017, and 2016, there were no other material remeasurements of assets or liabilities at fair value on a nonrecurring basis subsequent to their initial recognition.
Note NCommitments and ContingenciesIn order to ensure a steady supply of hogs and turkeys, and to keep the cost of products stable, the Company has entered into contracts with producers for the purchase of hogs and turkeys at formula-based prices over periods up to 10 years. The Company has also entered into grow-out contracts with independent farmers to raise turkeys for the Company for periods up to 25 years. Under these arrangements, the Company owns the livestock, feed, and other supplies while the independent farmers provide facilities and labor. The Company has also contracted for the purchase of corn, soybean meal, and other feed ingredients from independent suppliers for periods up to three years. Under these contracts, the Company is committed at October 28, 2018, to make purchases, assuming current price levels, as follows:
(in thousands)2019 $ 1,147,7842020 697,3472021 408,8552022 195,6382023 111,037Later Years 88,418Total $ 2,649,079
Purchases under these contracts for fiscal years 2018, 2017, and 2016 were $1.3 billion, $1.4 billion, and $1.6 billion, respectively.
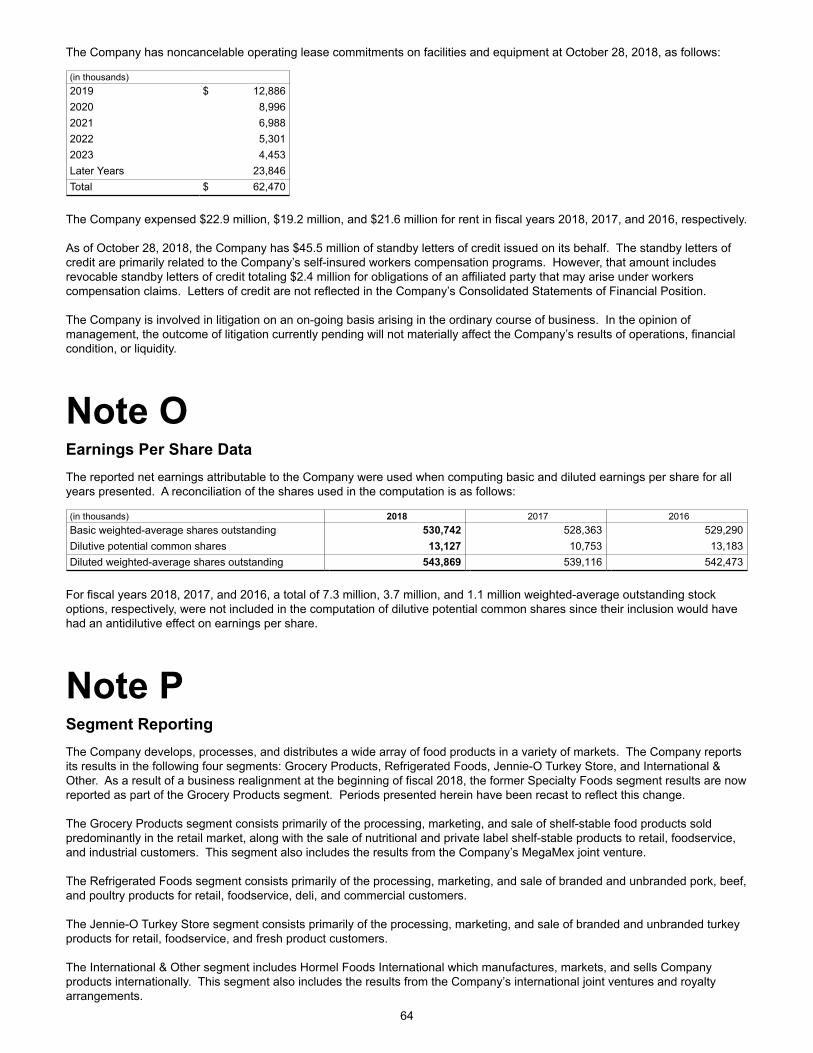
64
The Company has noncancelable operating lease commitments on facilities and equipment at October 28, 2018, as follows:
(in thousands)2019 $ 12,8862020 8,9962021 6,9882022 5,3012023 4,453Later Years 23,846Total $ 62,470
The Company expensed $22.9 million, $19.2 million, and $21.6 million for rent in fiscal years 2018, 2017, and 2016, respectively. As of October 28, 2018, the Company has $45.5 million of standby letters of credit issued on its behalf. The standby letters of credit are primarily related to the Company’s self-insured workers compensation programs. However, that amount includes revocable standby letters of credit totaling $2.4 million for obligations of an affiliated party that may arise under workers compensation claims. Letters of credit are not reflected in the Company’s Consolidated Statements of Financial Position. The Company is involved in litigation on an on-going basis arising in the ordinary course of business. In the opinion of management, the outcome of litigation currently pending will not materially affect the Company’s results of operations, financial condition, or liquidity.
Note O
Earnings Per Share DataThe reported net earnings attributable to the Company were used when computing basic and diluted earnings per share for all years presented. A reconciliation of the shares used in the computation is as follows:
(in thousands) 2018 2017 2016Basic weighted-average shares outstanding 530,742 528,363 529,290Dilutive potential common shares 13,127 10,753 13,183Diluted weighted-average shares outstanding 543,869 539,116 542,473
For fiscal years 2018, 2017, and 2016, a total of 7.3 million, 3.7 million, and 1.1 million weighted-average outstanding stock options, respectively, were not included in the computation of dilutive potential common shares since their inclusion would have had an antidilutive effect on earnings per share.
Note P Segment ReportingThe Company develops, processes, and distributes a wide array of food products in a variety of markets. The Company reports its results in the following four segments: Grocery Products, Refrigerated Foods, Jennie-O Turkey Store, and International & Other. As a result of a business realignment at the beginning of fiscal 2018, the former Specialty Foods segment results are now reported as part of the Grocery Products segment. Periods presented herein have been recast to reflect this change. The Grocery Products segment consists primarily of the processing, marketing, and sale of shelf-stable food products sold predominantly in the retail market, along with the sale of nutritional and private label shelf-stable products to retail, foodservice, and industrial customers. This segment also includes the results from the Company’s MegaMex joint venture. The Refrigerated Foods segment consists primarily of the processing, marketing, and sale of branded and unbranded pork, beef, and poultry products for retail, foodservice, deli, and commercial customers. The Jennie-O Turkey Store segment consists primarily of the processing, marketing, and sale of branded and unbranded turkey products for retail, foodservice, and fresh product customers. The International & Other segment includes Hormel Foods International which manufactures, markets, and sells Company products internationally. This segment also includes the results from the Company’s international joint ventures and royalty arrangements.

65
Intersegment sales are recorded at prices that approximate cost and are eliminated in the Consolidated Statements of Operations. The Company does not allocate investment income, interest expense, and interest income to its segments when measuring performance. The Company also retains various other income and unallocated expenses at corporate. Equity in earnings of affiliates is included in segment operating profit; however, earnings attributable to the Company’s noncontrolling interests are excluded. These items are included below as net interest and investment expense (income), general corporate expense, and noncontrolling interest when reconciling to earnings before income taxes. Sales and operating profits for each of the Company’s reportable segments and reconciliation to earnings before income taxes are set forth below. The Company is an integrated enterprise, characterized by substantial intersegment cooperation, cost allocations, and sharing of assets. Therefore, the Company does not represent that these segments, if operated independently, would report the operating profit and other financial information shown below.
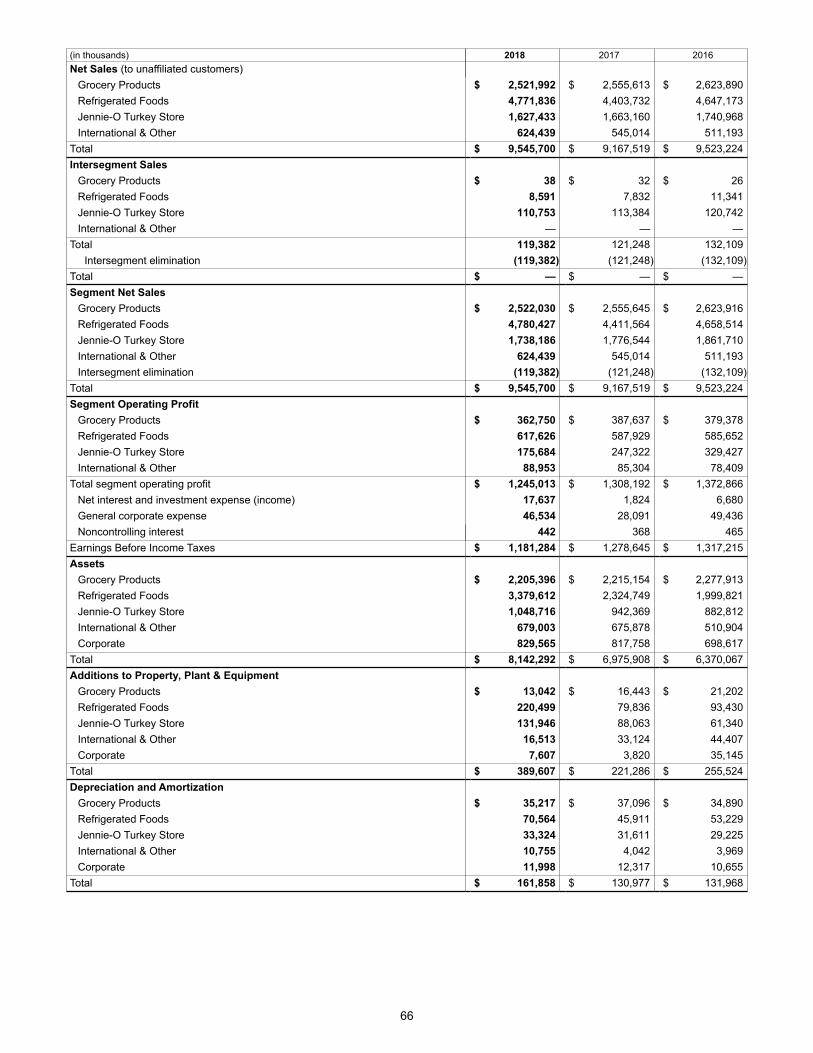
66
(in thousands) 2018 2017 2016Net Sales (to unaffiliated customers)
Grocery Products $ 2,521,992 $ 2,555,613 $ 2,623,890Refrigerated Foods 4,771,836 4,403,732 4,647,173Jennie-O Turkey Store 1,627,433 1,663,160 1,740,968International & Other 624,439 545,014 511,193
Total $ 9,545,700 $ 9,167,519 $ 9,523,224Intersegment Sales
Grocery Products $ 38 $ 32 $ 26Refrigerated Foods 8,591 7,832 11,341Jennie-O Turkey Store 110,753 113,384 120,742International & Other — — —
Total 119,382 121,248 132,109Intersegment elimination (119,382) (121,248) (132,109)
Total $ — $ — $ —Segment Net Sales
Grocery Products $ 2,522,030 $ 2,555,645 $ 2,623,916Refrigerated Foods 4,780,427 4,411,564 4,658,514Jennie-O Turkey Store 1,738,186 1,776,544 1,861,710International & Other 624,439 545,014 511,193Intersegment elimination (119,382) (121,248) (132,109)
Total $ 9,545,700 $ 9,167,519 $ 9,523,224Segment Operating Profit
Grocery Products $ 362,750 $ 387,637 $ 379,378Refrigerated Foods 617,626 587,929 585,652Jennie-O Turkey Store 175,684 247,322 329,427International & Other 88,953 85,304 78,409
Total segment operating profit $ 1,245,013 $ 1,308,192 $ 1,372,866Net interest and investment expense (income) 17,637 1,824 6,680General corporate expense 46,534 28,091 49,436Noncontrolling interest 442 368 465
Earnings Before Income Taxes $ 1,181,284 $ 1,278,645 $ 1,317,215Assets
Grocery Products $ 2,205,396 $ 2,215,154 $ 2,277,913Refrigerated Foods 3,379,612 2,324,749 1,999,821Jennie-O Turkey Store 1,048,716 942,369 882,812International & Other 679,003 675,878 510,904Corporate 829,565 817,758 698,617
Total $ 8,142,292 $ 6,975,908 $ 6,370,067Additions to Property, Plant & Equipment
Grocery Products $ 13,042 $ 16,443 $ 21,202Refrigerated Foods 220,499 79,836 93,430Jennie-O Turkey Store 131,946 88,063 61,340International & Other 16,513 33,124 44,407Corporate 7,607 3,820 35,145
Total $ 389,607 $ 221,286 $ 255,524Depreciation and Amortization
Grocery Products $ 35,217 $ 37,096 $ 34,890Refrigerated Foods 70,564 45,911 53,229Jennie-O Turkey Store 33,324 31,611 29,225International & Other 10,755 4,042 3,969Corporate 11,998 12,317 10,655
Total $ 161,858 $ 130,977 $ 131,968
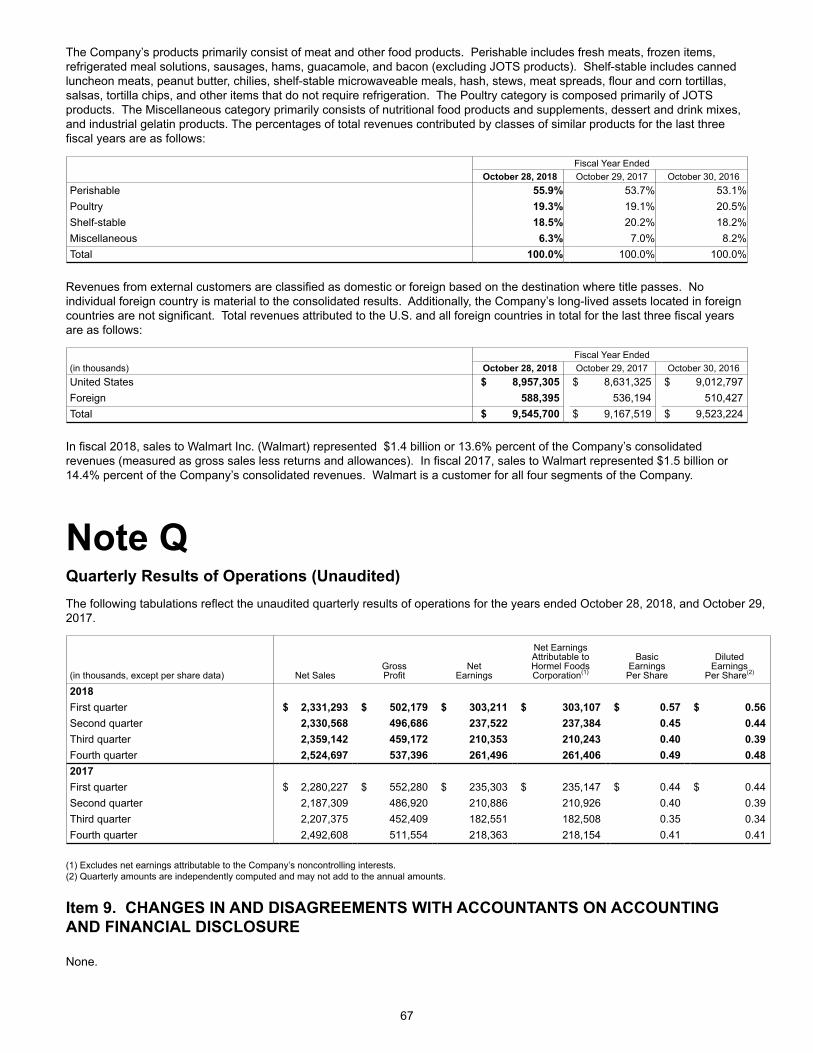
67
The Company’s products primarily consist of meat and other food products. Perishable includes fresh meats, frozen items, refrigerated meal solutions, sausages, hams, guacamole, and bacon (excluding JOTS products). Shelf-stable includes canned luncheon meats, peanut butter, chilies, shelf-stable microwaveable meals, hash, stews, meat spreads, flour and corn tortillas, salsas, tortilla chips, and other items that do not require refrigeration. The Poultry category is composed primarily of JOTS products. The Miscellaneous category primarily consists of nutritional food products and supplements, dessert and drink mixes, and industrial gelatin products. The percentages of total revenues contributed by classes of similar products for the last three fiscal years are as follows:
Fiscal Year EndedOctober 28, 2018 October 29, 2017 October 30, 2016
Perishable 55.9% 53.7% 53.1%Poultry 19.3% 19.1% 20.5%Shelf-stable 18.5% 20.2% 18.2%Miscellaneous 6.3% 7.0% 8.2%Total 100.0% 100.0% 100.0%
Revenues from external customers are classified as domestic or foreign based on the destination where title passes. No individual foreign country is material to the consolidated results. Additionally, the Company’s long-lived assets located in foreign countries are not significant. Total revenues attributed to the U.S. and all foreign countries in total for the last three fiscal years are as follows:
Fiscal Year Ended(in thousands) October 28, 2018 October 29, 2017 October 30, 2016United States $ 8,957,305 $ 8,631,325 $ 9,012,797Foreign 588,395 536,194 510,427Total $ 9,545,700 $ 9,167,519 $ 9,523,224
In fiscal 2018, sales to Walmart Inc. (Walmart) represented $1.4 billion or 13.6% percent of the Company’s consolidated revenues (measured as gross sales less returns and allowances). In fiscal 2017, sales to Walmart represented $1.5 billion or 14.4% percent of the Company’s consolidated revenues. Walmart is a customer for all four segments of the Company.
Note QQuarterly Results of Operations (Unaudited)The following tabulations reflect the unaudited quarterly results of operations for the years ended October 28, 2018, and October 29, 2017.
(in thousands, except per share data) Net SalesGrossProfit
NetEarnings
Net EarningsAttributable toHormel FoodsCorporation(1)
BasicEarnings
Per Share
DilutedEarnings
Per Share(2)
2018 First quarter $ 2,331,293 $ 502,179 $ 303,211 $ 303,107 $ 0.57 $ 0.56Second quarter 2,330,568 496,686 237,522 237,384 0.45 0.44Third quarter 2,359,142 459,172 210,353 210,243 0.40 0.39Fourth quarter 2,524,697 537,396 261,496 261,406 0.49 0.482017First quarter $ 2,280,227 $ 552,280 $ 235,303 $ 235,147 $ 0.44 $ 0.44Second quarter 2,187,309 486,920 210,886 210,926 0.40 0.39Third quarter 2,207,375 452,409 182,551 182,508 0.35 0.34Fourth quarter 2,492,608 511,554 218,363 218,154 0.41 0.41
(1) Excludes net earnings attributable to the Company’s noncontrolling interests.(2) Quarterly amounts are independently computed and may not add to the annual amounts.
Item 9. CHANGES IN AND DISAGREEMENTS WITH ACCOUNTANTS ON ACCOUNTING AND FINANCIAL DISCLOSURE None.
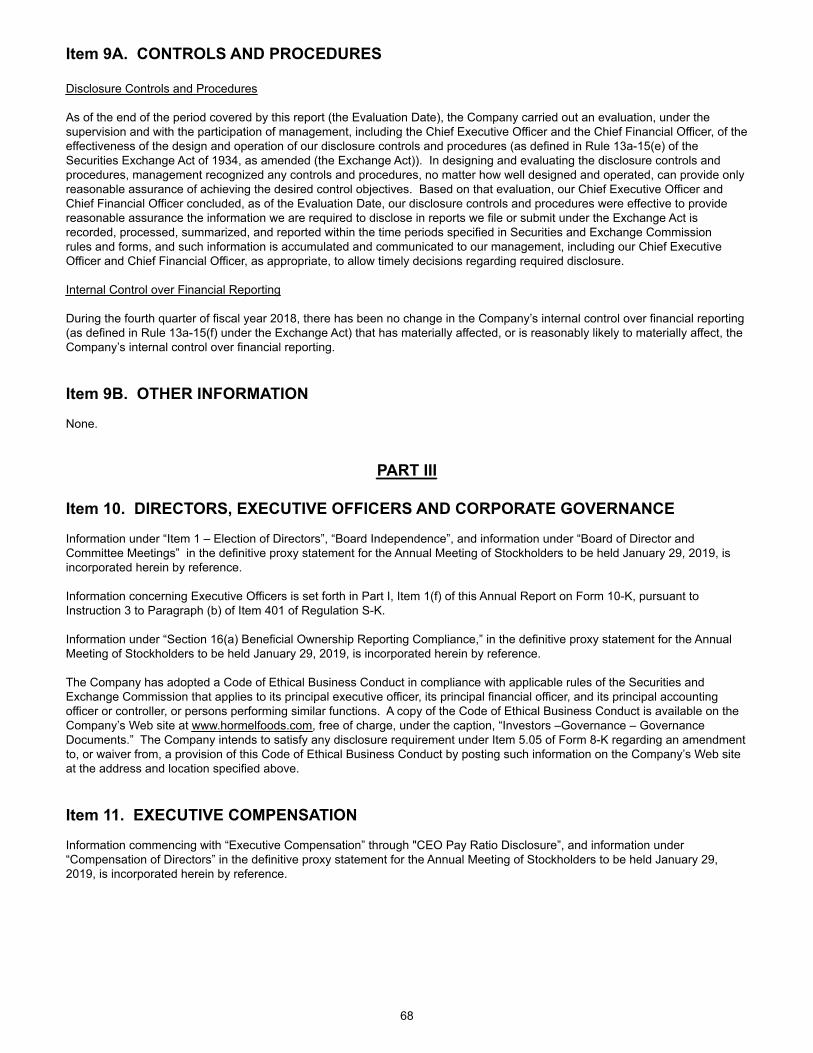
68
Item 9A. CONTROLS AND PROCEDURES Disclosure Controls and Procedures As of the end of the period covered by this report (the Evaluation Date), the Company carried out an evaluation, under the supervision and with the participation of management, including the Chief Executive Officer and the Chief Financial Officer, of the effectiveness of the design and operation of our disclosure controls and procedures (as defined in Rule 13a-15(e) of the Securities Exchange Act of 1934, as amended (the Exchange Act)). In designing and evaluating the disclosure controls and procedures, management recognized any controls and procedures, no matter how well designed and operated, can provide only reasonable assurance of achieving the desired control objectives. Based on that evaluation, our Chief Executive Officer and Chief Financial Officer concluded, as of the Evaluation Date, our disclosure controls and procedures were effective to provide reasonable assurance the information we are required to disclose in reports we file or submit under the Exchange Act is recorded, processed, summarized, and reported within the time periods specified in Securities and Exchange Commission rules and forms, and such information is accumulated and communicated to our management, including our Chief Executive Officer and Chief Financial Officer, as appropriate, to allow timely decisions regarding required disclosure. Internal Control over Financial Reporting During the fourth quarter of fiscal year 2018, there has been no change in the Company’s internal control over financial reporting (as defined in Rule 13a-15(f) under the Exchange Act) that has materially affected, or is reasonably likely to materially affect, the Company’s internal control over financial reporting.
Item 9B. OTHER INFORMATION None.
PART III
Item 10. DIRECTORS, EXECUTIVE OFFICERS AND CORPORATE GOVERNANCE Information under “Item 1 – Election of Directors”, “Board Independence”, and information under “Board of Director and Committee Meetings” in the definitive proxy statement for the Annual Meeting of Stockholders to be held January 29, 2019, is incorporated herein by reference. Information concerning Executive Officers is set forth in Part I, Item 1(f) of this Annual Report on Form 10-K, pursuant to Instruction 3 to Paragraph (b) of Item 401 of Regulation S-K. Information under “Section 16(a) Beneficial Ownership Reporting Compliance,” in the definitive proxy statement for the Annual Meeting of Stockholders to be held January 29, 2019, is incorporated herein by reference. The Company has adopted a Code of Ethical Business Conduct in compliance with applicable rules of the Securities and Exchange Commission that applies to its principal executive officer, its principal financial officer, and its principal accounting officer or controller, or persons performing similar functions. A copy of the Code of Ethical Business Conduct is available on the Company’s Web site at www.hormelfoods.com, free of charge, under the caption, “Investors –Governance – Governance Documents.” The Company intends to satisfy any disclosure requirement under Item 5.05 of Form 8-K regarding an amendment to, or waiver from, a provision of this Code of Ethical Business Conduct by posting such information on the Company’s Web site at the address and location specified above.
Item 11. EXECUTIVE COMPENSATION Information commencing with “Executive Compensation” through "CEO Pay Ratio Disclosure”, and information under “Compensation of Directors” in the definitive proxy statement for the Annual Meeting of Stockholders to be held January 29, 2019, is incorporated herein by reference.
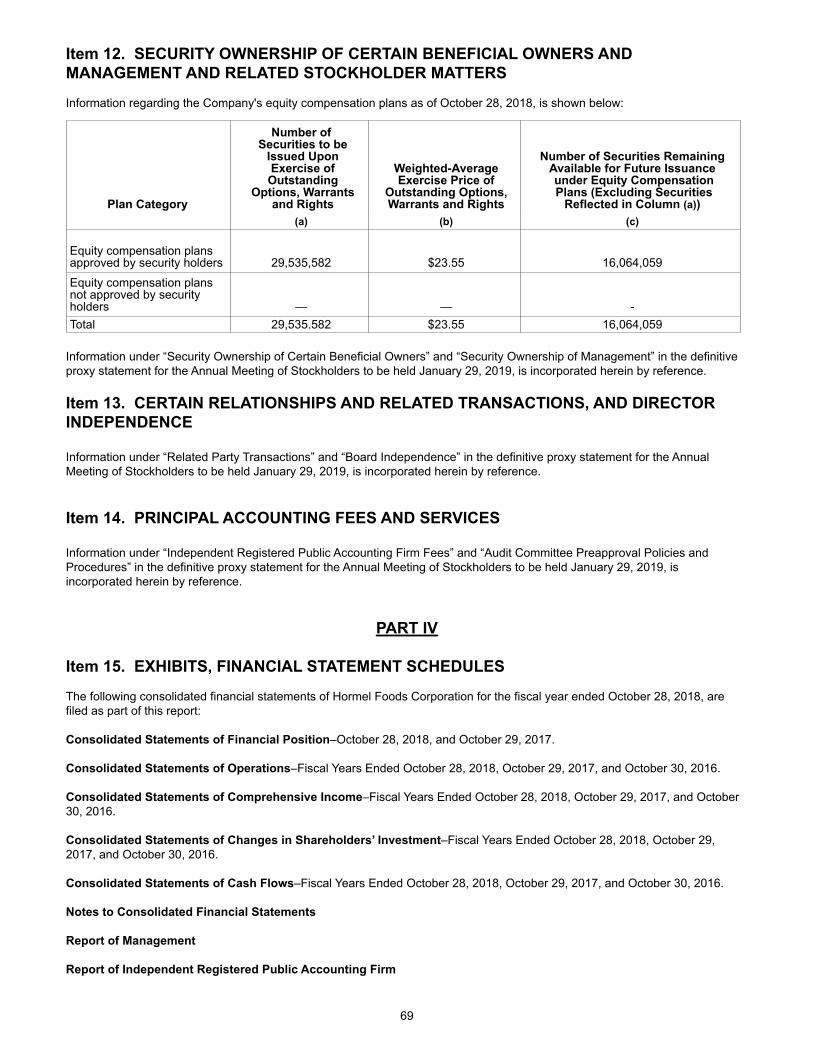
69
Item 12. SECURITY OWNERSHIP OF CERTAIN BENEFICIAL OWNERS AND MANAGEMENT AND RELATED STOCKHOLDER MATTERS Information regarding the Company's equity compensation plans as of October 28, 2018, is shown below:
Plan Category
Number of Securities to be
Issued Upon Exercise of Outstanding
Options, Warrants and Rights
Weighted-AverageExercise Price of
Outstanding Options,Warrants and Rights
Number of Securities Remaining Available for Future Issuance under Equity Compensation Plans (Excluding Securities
Reflected in Column (a))(a) (b) (c)
Equity compensation plansapproved by security holders 29,535,582 $23.55 16,064,059
Equity compensation plansnot approved by securityholders — — -Total 29,535.582 $23.55 16,064,059
Information under “Security Ownership of Certain Beneficial Owners” and “Security Ownership of Management” in the definitive proxy statement for the Annual Meeting of Stockholders to be held January 29, 2019, is incorporated herein by reference.
Item 13. CERTAIN RELATIONSHIPS AND RELATED TRANSACTIONS, AND DIRECTOR INDEPENDENCE Information under “Related Party Transactions” and “Board Independence” in the definitive proxy statement for the Annual Meeting of Stockholders to be held January 29, 2019, is incorporated herein by reference.
Item 14. PRINCIPAL ACCOUNTING FEES AND SERVICES Information under “Independent Registered Public Accounting Firm Fees” and “Audit Committee Preapproval Policies and Procedures” in the definitive proxy statement for the Annual Meeting of Stockholders to be held January 29, 2019, is incorporated herein by reference.
PART IV
Item 15. EXHIBITS, FINANCIAL STATEMENT SCHEDULES The following consolidated financial statements of Hormel Foods Corporation for the fiscal year ended October 28, 2018, are filed as part of this report: Consolidated Statements of Financial Position–October 28, 2018, and October 29, 2017. Consolidated Statements of Operations–Fiscal Years Ended October 28, 2018, October 29, 2017, and October 30, 2016. Consolidated Statements of Comprehensive Income–Fiscal Years Ended October 28, 2018, October 29, 2017, and October 30, 2016. Consolidated Statements of Changes in Shareholders’ Investment–Fiscal Years Ended October 28, 2018, October 29, 2017, and October 30, 2016. Consolidated Statements of Cash Flows–Fiscal Years Ended October 28, 2018, October 29, 2017, and October 30, 2016. Notes to Consolidated Financial Statements
Report of Management Report of Independent Registered Public Accounting Firm
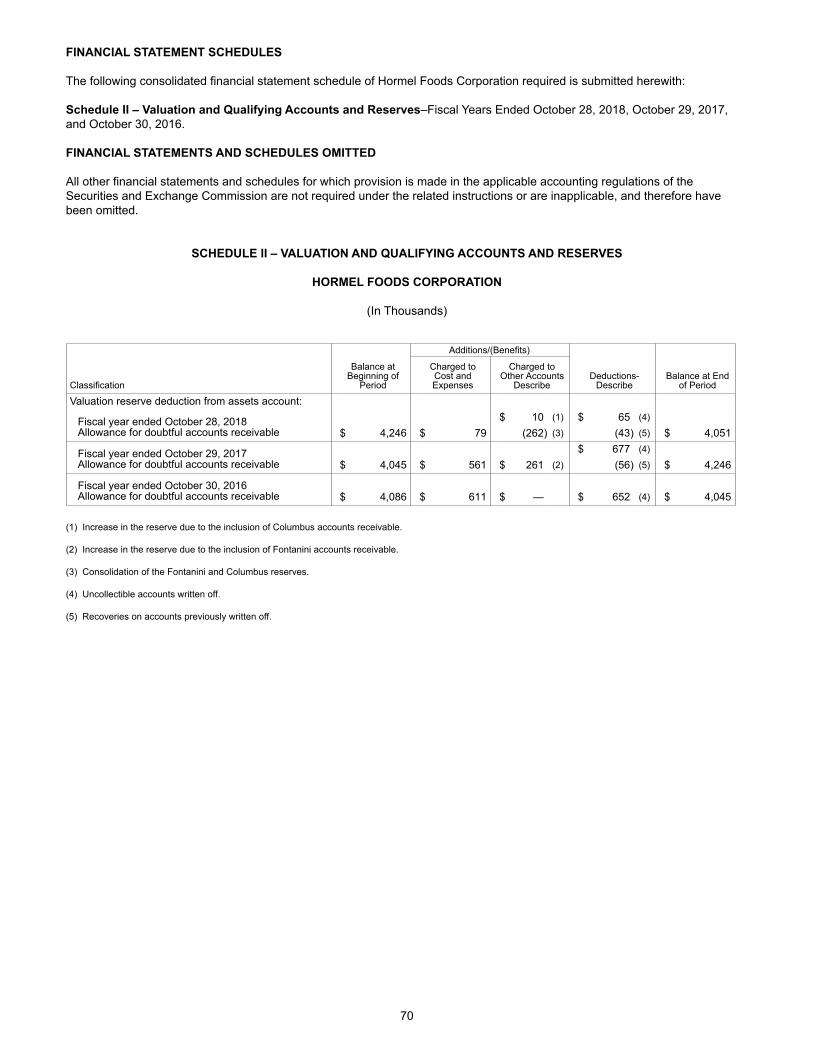
70
FINANCIAL STATEMENT SCHEDULES The following consolidated financial statement schedule of Hormel Foods Corporation required is submitted herewith: Schedule II – Valuation and Qualifying Accounts and Reserves–Fiscal Years Ended October 28, 2018, October 29, 2017, and October 30, 2016. FINANCIAL STATEMENTS AND SCHEDULES OMITTED All other financial statements and schedules for which provision is made in the applicable accounting regulations of the Securities and Exchange Commission are not required under the related instructions or are inapplicable, and therefore have been omitted.
SCHEDULE II – VALUATION AND QUALIFYING ACCOUNTS AND RESERVES
HORMEL FOODS CORPORATION
(In Thousands)
Additions/(Benefits)
Classification
Balance atBeginning of
Period
Charged toCost andExpenses
Charged toOther Accounts
DescribeDeductions-
DescribeBalance at End
of Period
Valuation reserve deduction from assets account:
Fiscal year ended October 28, 2018Allowance for doubtful accounts receivable
$ 10 (1) $ 65 (4)
$ 4,246 $ 79 (262) (3) (43) (5) $ 4,051
Fiscal year ended October 29, 2017Allowance for doubtful accounts receivable
$ 677 (4)
$ 4,045 $ 561 $ 261 (2) (56) (5) $ 4,246
Fiscal year ended October 30, 2016Allowance for doubtful accounts receivable $ 4,086 $ 611 $ — $ 652 (4) $ 4,045
(1) Increase in the reserve due to the inclusion of Columbus accounts receivable.
(2) Increase in the reserve due to the inclusion of Fontanini accounts receivable. (3) Consolidation of the Fontanini and Columbus reserves. (4) Uncollectible accounts written off. (5) Recoveries on accounts previously written off.
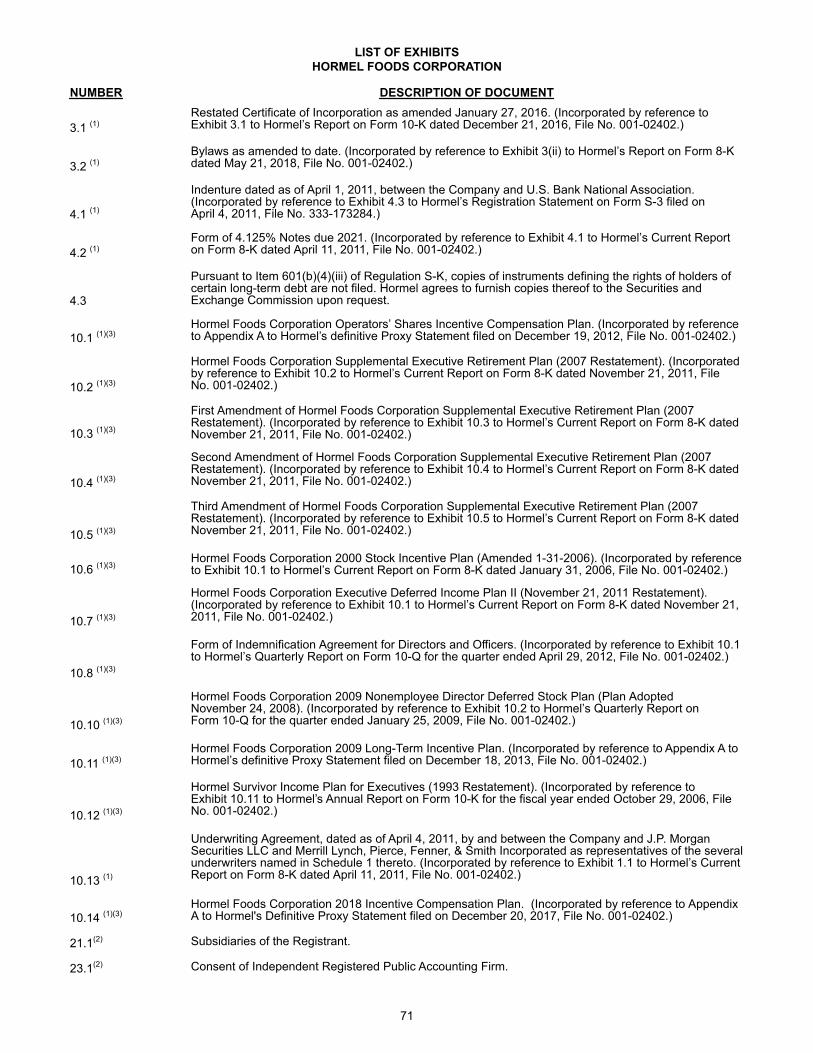
71
LIST OF EXHIBITSHORMEL FOODS CORPORATION
NUMBER DESCRIPTION OF DOCUMENT
3.1 (1)Restated Certificate of Incorporation as amended January 27, 2016. (Incorporated by reference toExhibit 3.1 to Hormel’s Report on Form 10-K dated December 21, 2016, File No. 001-02402.)
3.2 (1)Bylaws as amended to date. (Incorporated by reference to Exhibit 3(ii) to Hormel’s Report on Form 8-Kdated May 21, 2018, File No. 001-02402.)
4.1 (1)
Indenture dated as of April 1, 2011, between the Company and U.S. Bank National Association.(Incorporated by reference to Exhibit 4.3 to Hormel’s Registration Statement on Form S-3 filed onApril 4, 2011, File No. 333-173284.)
4.2 (1)Form of 4.125% Notes due 2021. (Incorporated by reference to Exhibit 4.1 to Hormel’s Current Reporton Form 8-K dated April 11, 2011, File No. 001-02402.)
4.3
Pursuant to Item 601(b)(4)(iii) of Regulation S-K, copies of instruments defining the rights of holders ofcertain long-term debt are not filed. Hormel agrees to furnish copies thereof to the Securities andExchange Commission upon request.
10.1 (1)(3)Hormel Foods Corporation Operators’ Shares Incentive Compensation Plan. (Incorporated by referenceto Appendix A to Hormel’s definitive Proxy Statement filed on December 19, 2012, File No. 001-02402.)
10.2 (1)(3)
Hormel Foods Corporation Supplemental Executive Retirement Plan (2007 Restatement). (Incorporatedby reference to Exhibit 10.2 to Hormel’s Current Report on Form 8-K dated November 21, 2011, FileNo. 001-02402.)
10.3 (1)(3)
First Amendment of Hormel Foods Corporation Supplemental Executive Retirement Plan (2007Restatement). (Incorporated by reference to Exhibit 10.3 to Hormel’s Current Report on Form 8-K datedNovember 21, 2011, File No. 001-02402.)
10.4 (1)(3)
Second Amendment of Hormel Foods Corporation Supplemental Executive Retirement Plan (2007Restatement). (Incorporated by reference to Exhibit 10.4 to Hormel’s Current Report on Form 8-K datedNovember 21, 2011, File No. 001-02402.)
10.5 (1)(3)
Third Amendment of Hormel Foods Corporation Supplemental Executive Retirement Plan (2007Restatement). (Incorporated by reference to Exhibit 10.5 to Hormel’s Current Report on Form 8-K datedNovember 21, 2011, File No. 001-02402.)
10.6 (1)(3)Hormel Foods Corporation 2000 Stock Incentive Plan (Amended 1-31-2006). (Incorporated by referenceto Exhibit 10.1 to Hormel’s Current Report on Form 8-K dated January 31, 2006, File No. 001-02402.)
10.7 (1)(3)
Hormel Foods Corporation Executive Deferred Income Plan II (November 21, 2011 Restatement).(Incorporated by reference to Exhibit 10.1 to Hormel’s Current Report on Form 8-K dated November 21,2011, File No. 001-02402.)
10.8 (1)(3)
Form of Indemnification Agreement for Directors and Officers. (Incorporated by reference to Exhibit 10.1to Hormel’s Quarterly Report on Form 10-Q for the quarter ended April 29, 2012, File No. 001-02402.)
10.10 (1)(3)
Hormel Foods Corporation 2009 Nonemployee Director Deferred Stock Plan (Plan AdoptedNovember 24, 2008). (Incorporated by reference to Exhibit 10.2 to Hormel’s Quarterly Report onForm 10-Q for the quarter ended January 25, 2009, File No. 001-02402.)
10.11 (1)(3)Hormel Foods Corporation 2009 Long-Term Incentive Plan. (Incorporated by reference to Appendix A toHormel’s definitive Proxy Statement filed on December 18, 2013, File No. 001-02402.)
10.12 (1)(3)
Hormel Survivor Income Plan for Executives (1993 Restatement). (Incorporated by reference toExhibit 10.11 to Hormel’s Annual Report on Form 10-K for the fiscal year ended October 29, 2006, FileNo. 001-02402.)
10.13 (1)
Underwriting Agreement, dated as of April 4, 2011, by and between the Company and J.P. MorganSecurities LLC and Merrill Lynch, Pierce, Fenner, & Smith Incorporated as representatives of the severalunderwriters named in Schedule 1 thereto. (Incorporated by reference to Exhibit 1.1 to Hormel’s CurrentReport on Form 8-K dated April 11, 2011, File No. 001-02402.)
10.14 (1)(3)Hormel Foods Corporation 2018 Incentive Compensation Plan. (Incorporated by reference to AppendixA to Hormel's Definitive Proxy Statement filed on December 20, 2017, File No. 001-02402.)
21.1(2) Subsidiaries of the Registrant.
23.1(2) Consent of Independent Registered Public Accounting Firm.
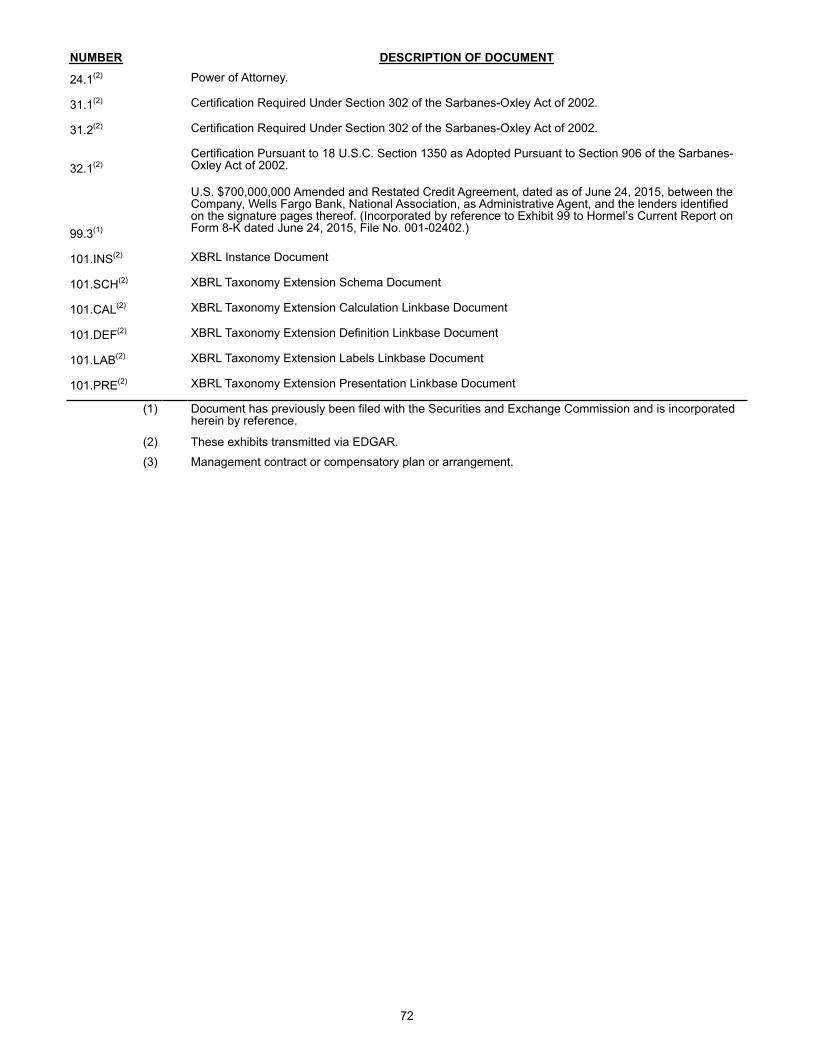
72
NUMBER DESCRIPTION OF DOCUMENT
24.1(2) Power of Attorney.
31.1(2) Certification Required Under Section 302 of the Sarbanes-Oxley Act of 2002.
31.2(2) Certification Required Under Section 302 of the Sarbanes-Oxley Act of 2002.
32.1(2)Certification Pursuant to 18 U.S.C. Section 1350 as Adopted Pursuant to Section 906 of the Sarbanes-Oxley Act of 2002.
99.3(1)
U.S. $700,000,000 Amended and Restated Credit Agreement, dated as of June 24, 2015, between theCompany, Wells Fargo Bank, National Association, as Administrative Agent, and the lenders identifiedon the signature pages thereof. (Incorporated by reference to Exhibit 99 to Hormel’s Current Report onForm 8-K dated June 24, 2015, File No. 001-02402.)
101.INS(2) XBRL Instance Document
101.SCH(2) XBRL Taxonomy Extension Schema Document
101.CAL(2) XBRL Taxonomy Extension Calculation Linkbase Document
101.DEF(2) XBRL Taxonomy Extension Definition Linkbase Document
101.LAB(2) XBRL Taxonomy Extension Labels Linkbase Document
101.PRE(2) XBRL Taxonomy Extension Presentation Linkbase Document
(1) Document has previously been filed with the Securities and Exchange Commission and is incorporatedherein by reference.
(2) These exhibits transmitted via EDGAR.
(3) Management contract or compensatory plan or arrangement.

73
Item 16. FORM 10-K SUMMARY Not applicable.
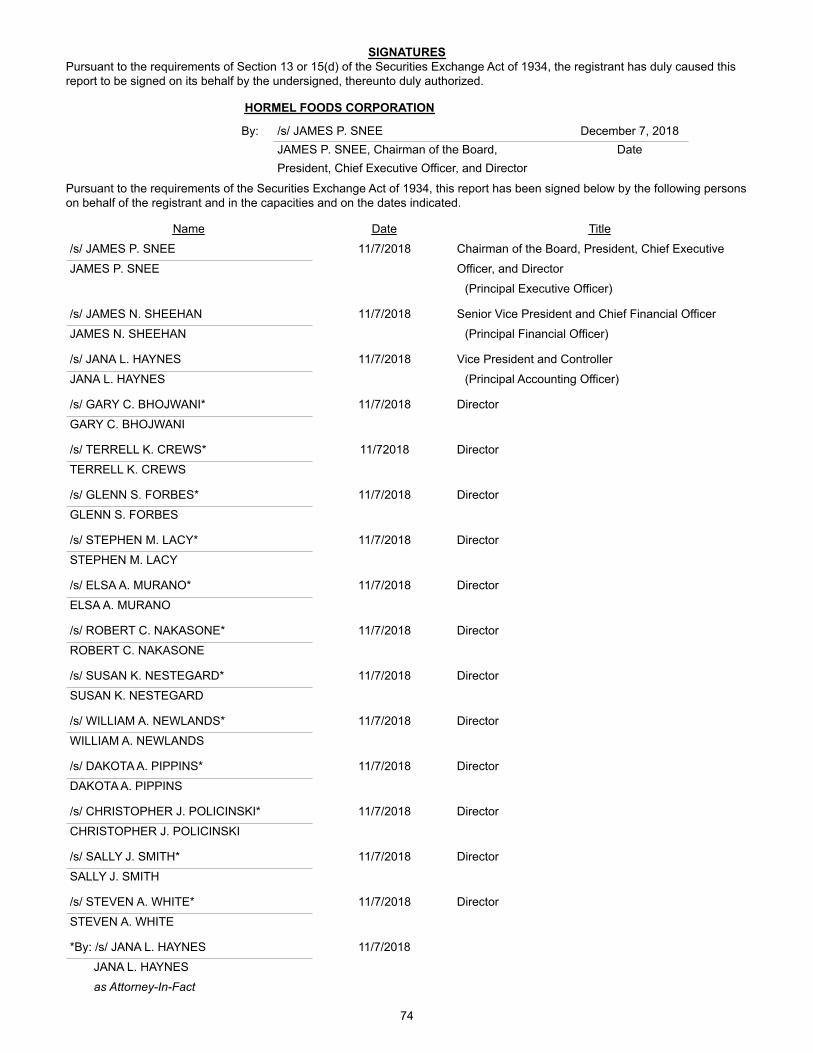
74
SIGNATURESPursuant to the requirements of Section 13 or 15(d) of the Securities Exchange Act of 1934, the registrant has duly caused this report to be signed on its behalf by the undersigned, thereunto duly authorized.
HORMEL FOODS CORPORATION
By: /s/ JAMES P. SNEE December 7, 2018JAMES P. SNEE, Chairman of the Board, DatePresident, Chief Executive Officer, and Director
Pursuant to the requirements of the Securities Exchange Act of 1934, this report has been signed below by the following persons on behalf of the registrant and in the capacities and on the dates indicated.
Name Date Title
/s/ JAMES P. SNEE 11/7/2018 Chairman of the Board, President, Chief Executive
JAMES P. SNEE Officer, and Director
(Principal Executive Officer)
/s/ JAMES N. SHEEHAN 11/7/2018 Senior Vice President and Chief Financial Officer
JAMES N. SHEEHAN (Principal Financial Officer)
/s/ JANA L. HAYNES 11/7/2018 Vice President and Controller
JANA L. HAYNES (Principal Accounting Officer)
/s/ GARY C. BHOJWANI* 11/7/2018 Director
GARY C. BHOJWANI
/s/ TERRELL K. CREWS* 11/72018 Director
TERRELL K. CREWS
/s/ GLENN S. FORBES* 11/7/2018 Director
GLENN S. FORBES
/s/ STEPHEN M. LACY* 11/7/2018 Director
STEPHEN M. LACY
/s/ ELSA A. MURANO* 11/7/2018 Director
ELSA A. MURANO
/s/ ROBERT C. NAKASONE* 11/7/2018 Director
ROBERT C. NAKASONE
/s/ SUSAN K. NESTEGARD* 11/7/2018 Director
SUSAN K. NESTEGARD
/s/ WILLIAM A. NEWLANDS* 11/7/2018 Director
WILLIAM A. NEWLANDS
/s/ DAKOTA A. PIPPINS* 11/7/2018 Director
DAKOTA A. PIPPINS
/s/ CHRISTOPHER J. POLICINSKI* 11/7/2018 Director
CHRISTOPHER J. POLICINSKI
/s/ SALLY J. SMITH* 11/7/2018 Director
SALLY J. SMITH
/s/ STEVEN A. WHITE* 11/7/2018 Director
STEVEN A. WHITE
*By: /s/ JANA L. HAYNES 11/7/2018
JANA L. HAYNES
as Attorney-In-Fact
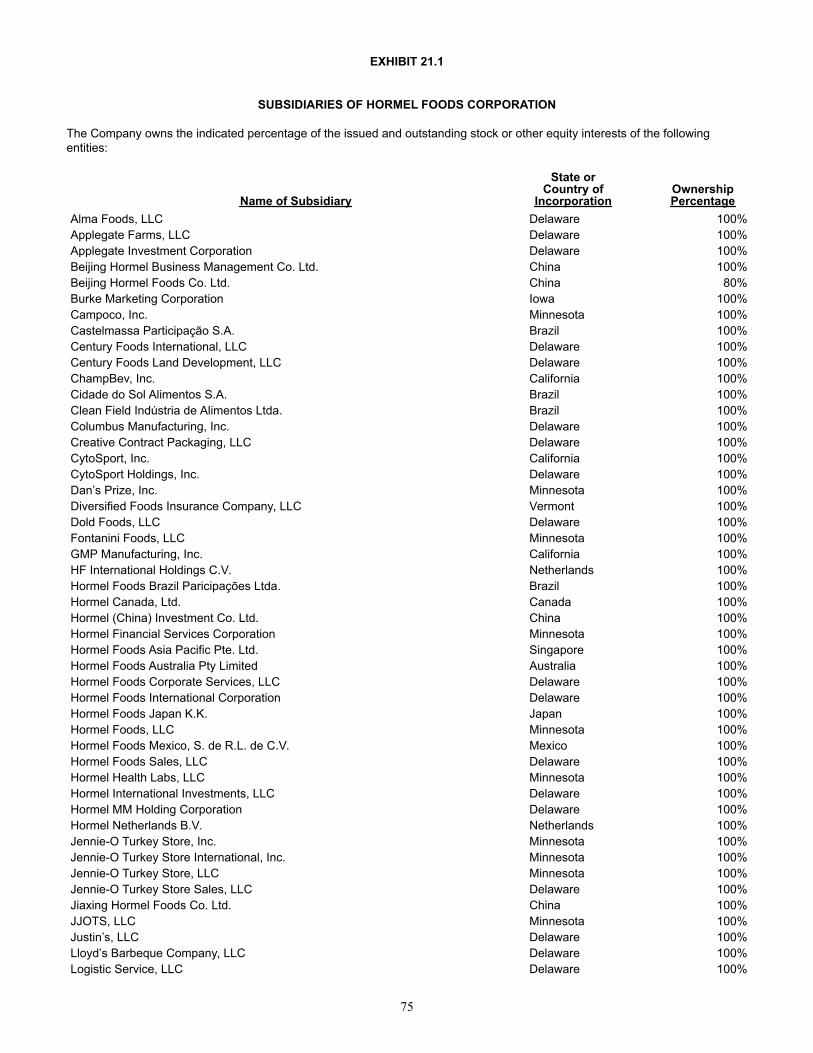
75
EXHIBIT 21.1
SUBSIDIARIES OF HORMEL FOODS CORPORATION
The Company owns the indicated percentage of the issued and outstanding stock or other equity interests of the following entities:
Name of Subsidiary
State orCountry of
Incorporation OwnershipPercentage
Alma Foods, LLC Delaware 100%Applegate Farms, LLC Delaware 100%Applegate Investment Corporation Delaware 100%Beijing Hormel Business Management Co. Ltd. China 100%Beijing Hormel Foods Co. Ltd. China 80%Burke Marketing Corporation Iowa 100%Campoco, Inc. Minnesota 100%Castelmassa Participação S.A. Brazil 100%Century Foods International, LLC Delaware 100%Century Foods Land Development, LLC Delaware 100%ChampBev, Inc. California 100%Cidade do Sol Alimentos S.A. Brazil 100%Clean Field Indústria de Alimentos Ltda. Brazil 100%Columbus Manufacturing, Inc. Delaware 100%Creative Contract Packaging, LLC Delaware 100%CytoSport, Inc. California 100%CytoSport Holdings, Inc. Delaware 100%Dan’s Prize, Inc. Minnesota 100%Diversified Foods Insurance Company, LLC Vermont 100%Dold Foods, LLC Delaware 100%Fontanini Foods, LLC Minnesota 100%GMP Manufacturing, Inc. California 100%HF International Holdings C.V. Netherlands 100%Hormel Foods Brazil Paricipações Ltda. Brazil 100%Hormel Canada, Ltd. Canada 100%Hormel (China) Investment Co. Ltd. China 100%Hormel Financial Services Corporation Minnesota 100%Hormel Foods Asia Pacific Pte. Ltd. Singapore 100%Hormel Foods Australia Pty Limited Australia 100%Hormel Foods Corporate Services, LLC Delaware 100%Hormel Foods International Corporation Delaware 100%Hormel Foods Japan K.K. Japan 100%Hormel Foods, LLC Minnesota 100%Hormel Foods Mexico, S. de R.L. de C.V. Mexico 100%Hormel Foods Sales, LLC Delaware 100%Hormel Health Labs, LLC Minnesota 100%Hormel International Investments, LLC Delaware 100%Hormel MM Holding Corporation Delaware 100%Hormel Netherlands B.V. Netherlands 100%Jennie-O Turkey Store, Inc. Minnesota 100%Jennie-O Turkey Store International, Inc. Minnesota 100%Jennie-O Turkey Store, LLC Minnesota 100%Jennie-O Turkey Store Sales, LLC Delaware 100%Jiaxing Hormel Foods Co. Ltd. China 100%JJOTS, LLC Minnesota 100%Justin’s, LLC Delaware 100%Lloyd’s Barbeque Company, LLC Delaware 100%Logistic Service, LLC Delaware 100%
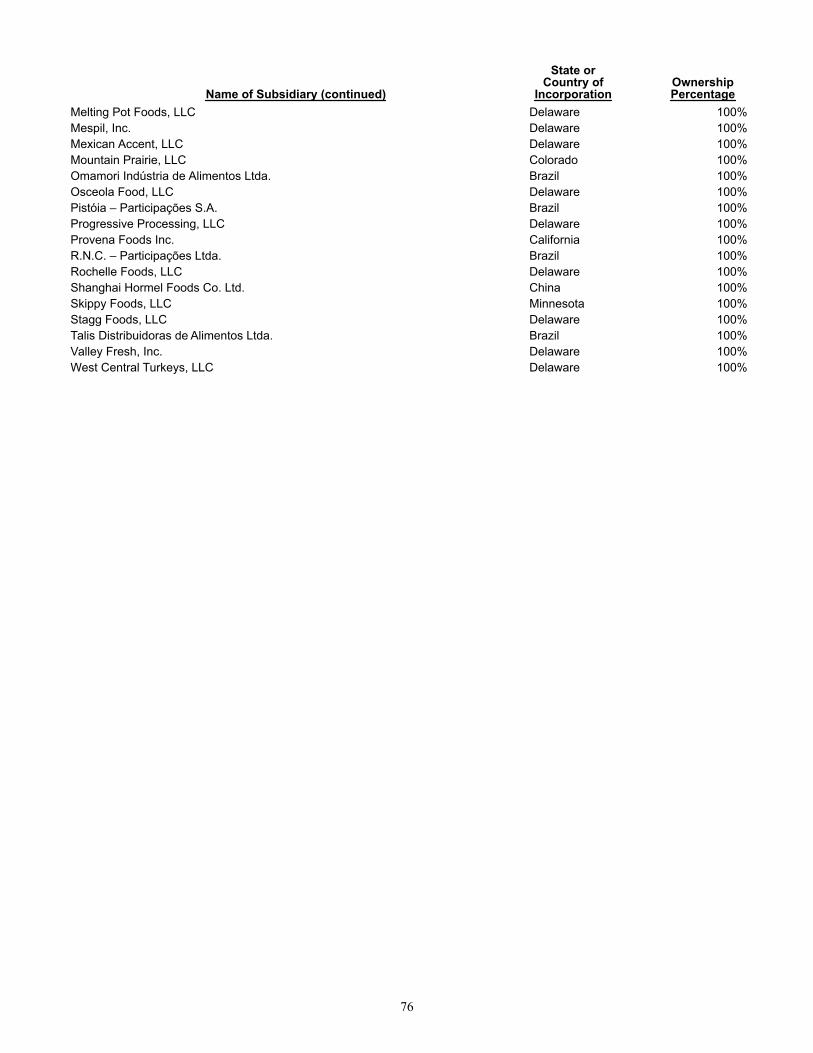
76
Name of Subsidiary (continued)
State orCountry of
Incorporation OwnershipPercentage
Melting Pot Foods, LLC Delaware 100%Mespil, Inc. Delaware 100%Mexican Accent, LLC Delaware 100%Mountain Prairie, LLC Colorado 100%Omamori Indústria de Alimentos Ltda. Brazil 100%Osceola Food, LLC Delaware 100%Pistóia – Participações S.A. Brazil 100%Progressive Processing, LLC Delaware 100%Provena Foods Inc. California 100%R.N.C. – Participações Ltda. Brazil 100%Rochelle Foods, LLC Delaware 100%Shanghai Hormel Foods Co. Ltd. China 100%Skippy Foods, LLC Minnesota 100%Stagg Foods, LLC Delaware 100%Talis Distribuidoras de Alimentos Ltda. Brazil 100%Valley Fresh, Inc. Delaware 100%West Central Turkeys, LLC Delaware 100%
77
EXHIBIT 23.1
CONSENT OF INDEPENDENT REGISTERED PUBLIC ACCOUNTING FIRM
We consent to the incorporation by reference in the following Registration Statements:
(1) Registration Statement Number 33-14615 on Form S-8 dated May 27, 1987,
(2) Post-Effective Amendment Number 1 to Registration Statement Number 33-29053 on Form S-8 dated January 26, 1990,
(3) Registration Statement Number 333-44178 on Form S-8 dated August 21, 2000,
(4) Registration Statement Numbers 333-102805, 333-102806, 333-102808, and 333-102810 on Forms S-8 dated January 29, 2003,
(5) Registration Statement Number 333-110776 on Form S-8 dated November 26, 2003,
(6) Registration Statement Number 333-131625 on Form S-8 dated February 7, 2006,
(7) Registration Statement Number 333-136642 on Form S-8 dated August 15, 2006,
(8) Registration Statement Number 333-162405 on Form S-8 dated October 9, 2009,
(9) Registration Statement Number 333-173284 on Form S-3ASR dated April 4, 2011,
(10) Registration Statement Number 333-190714 on Form S-8 dated August 19, 2013,
(11) Registration Statement Numbers 333-191719 and 333-191720 on Forms S-8 dated October 15, 2013,
(12) Registration Statement Number 333-195916 on Form S-3ASR dated May 13, 2014, and
(13) Registration Statement Number 333-217593 on Form S-3ASR dated May 2, 2017,
(14) Registration Statement Number 333-222801 on Form S-8 dated January 1, 2018;
of our reports dated December 7, 2018, with respect to the consolidated financial statements and schedule of Hormel Foods Corporation and the effectiveness of internal control over financial reporting Hormel Foods Corporation included in this Annual Report (Form 10-K) of Hormel Foods Corporation for the year ended October 28, 2018.
/s/ Ernst & Young LLP Minneapolis, MNDecember 7, 2018
EXHIBIT 24.1POWER OF ATTORNEY
Each person whose signature appears below hereby constitutes and appoints each of James N. Sheehan, Jana L. Haynes, and Gary L.
Jamison, with full power to each to act without the other, his or her true and lawful attorney-in-fact and agent with full power of substitution, forhim or her and in his or her name, place and stead, in any and all capacities, to sign the Annual Report on Form 10-K of Hormel FoodsCorporation (“Hormel”) for Hormel’s fiscal year ended October 28, 2018, and any or all amendments to said Annual Report, and to file the same,with all exhibits thereto, and other documents in connection therewith, with the Securities and Exchange Commission, and to file the same withsuch other authorities as necessary, granting unto each such attorney-in-fact and agent full power and authority to do and perform each andevery act and thing requisite and necessary to be done in and about the premises, as fully to all intents and purposes as he or she might or coulddo in person, hereby ratifying and confirming all that each such attorney-in-fact and agent, or his substitute, may lawfully do or cause to be doneby virtue hereof.
Signature Title Date/s/ James P. Snee Chairman of the Board, President, Chief Executive November 20, 2018James P. Snee Officer, and Director
(Principal Executive Officer)
/s/ James N. Sheehan Senior Vice President and Chief Financial Officer November 20, 2018James N. Sheehan (Principal Financial Officer)
/s/ Jana L. Haynes Vice President and Controller November 20, 2018Jana L. Haynes (Principal Accounting Officer)
/s/ Gary C. Bhojwani Director November 20, 2018Gary C. Bhojwani
/s/ Terrell K. Crews Director November 20, 2018Terrell K. Crews
/s/ Glenn S. Forbes Director November 20, 2018Glenn S. Forbes
/s/ Stephen M. Lacy Director November 20, 2018Stephen M. Lacy
/s/ Elsa A. Murano Director November 20, 2018Elsa A. Murano
/s/ Robert C. Nakasone Director November 20, 2018Robert C. Nakasone
/s/ Susan K. Nestegard Director November 20, 2018Susan K. Nestegard
/s/ William A. Newlands Director November 20, 2018William A. Newlands
/s/ Dakota A. Pippins Director November 20, 2018Dakota A. Pippins
/s/ Christopher J. Policinski Director November 20, 2018Christopher J. Policinski
/s/ Sally J. Smith Director November 20, 2018Sally J. Smith
/s/ Steven A. White Director November 20, 2018Steven A. White
*By /s/JANA L. HAYNES JANA L. HAYNES as Attorney-In-Fact
78
79
EXHIBIT 31.1
CERTIFICATION REQUIRED UNDER SECTION 302 OF THE SARBANES-OXLEY ACT OF 2002
I, James P. Snee, certify that: 1. I have reviewed this Annual Report on Form 10-K of Hormel Foods Corporation for the fiscal year ended October 28, 2018; 2. Based on my knowledge, this report does not contain any untrue statement of a material fact or omit to state a material fact
necessary to make the statements made, in light of the circumstances under which such statements were made, not misleading with respect to the period covered by this report;
3. Based on my knowledge, the financial statements, and other financial information included in this report, fairly present in all
material respects the financial condition, results of operations and cash flows of the registrant as of, and for, the periods presented in this report;
4. The registrant’s other certifying officer and I are responsible for establishing and maintaining disclosure controls and
procedures (as defined in Exchange Act Rules 13a-15(e) and 15d-15(e)) and internal control over financial reporting (as defined in Exchange Act Rules 13a-15(f) and 15d-15(f)) for the registrant and have:
a. Designed such disclosure controls and procedures, or caused such disclosure controls and procedures to be designed
under our supervision, to ensure that material information relating to the registrant, including its consolidated subsidiaries, is made known to us by others within those entities, particularly during the period in which this report is being prepared;
b. Designed such internal control over financial reporting, or caused such internal control over financial reporting to be
designed under our supervision, to provide reasonable assurance regarding the reliability of financial reporting and the preparation of financial statements for external purposes in accordance with generally accepted accounting principles;
c. Evaluated the effectiveness of the registrant’s disclosure controls and procedures and presented in this report our
conclusions about the effectiveness of the disclosure controls and procedures, as of the end of the period covered by this report based on such evaluation; and
d. Disclosed in this report any change in the registrant’s internal control over financial reporting that occurred during the
registrant’s most recent fiscal quarter (the registrant’s fourth fiscal quarter in the case of an annual report) that has materially affected, or is reasonably likely to materially affect, the registrant’s internal control over financial reporting; and
5. The registrant’s other certifying officer and I have disclosed, based on our most recent evaluation of internal control over
financial reporting, to the registrant’s auditors and the audit committee of the registrant’s board of directors (or persons performing the equivalent functions):
a. All significant deficiencies and material weaknesses in the design or operation of internal control over financial reporting
which are reasonably likely to adversely affect the registrant’s ability to record, process, summarize and report financial information; and
b. Any fraud, whether or not material, that involves management or other employees who have a significant role in the
registrant’s internal control over financial reporting.
Dated: December 7, 2018 Signed: /s/ JAMES P. SNEE JAMES P. SNEE Chairman of the Board, President, Chief Executive
Officer and Director
80
EXHIBIT 31.2
CERTIFICATION REQUIRED UNDER SECTION 302 OF THE SARBANES-OXLEY ACT OF 2002
I, James N. Sheehan, certify that:
1. I have reviewed this Annual Report on Form 10-K of Hormel Foods Corporation for the fiscal year ended October 28, 2018;
2. Based on my knowledge, this report does not contain any untrue statement of a material fact or omit to state a material factnecessary to make the statements made, in light of the circumstances under which such statements were made, notmisleading with respect to the period covered by this report;
3. Based on my knowledge, the financial statements, and other financial information included in this report, fairly present in allmaterial respects the financial condition, results of operations and cash flows of the registrant as of, and for, the periodspresented in this report;
4. The registrant’s other certifying officer and I are responsible for establishing and maintaining disclosure controls andprocedures (as defined in Exchange Act Rules 13a-15(e) and 15d-15(e)) and internal control over financial reporting (asdefined in Exchange Act Rules 13a-15(f) and 15d-15(f)) for the registrant and have:
a. Designed such disclosure controls and procedures, or caused such disclosure controls and procedures to be designedunder our supervision, to ensure that material information relating to the registrant, including its consolidated subsidiaries,is made known to us by others within those entities, particularly during the period in which this report is being prepared;
b. Designed such internal control over financial reporting, or caused such internal control over financial reporting to bedesigned under our supervision, to provide reasonable assurance regarding the reliability of financial reporting and thepreparation of financial statements for external purposes in accordance with generally accepted accounting principles;
c. Evaluated the effectiveness of the registrant’s disclosure controls and procedures and presented in this report ourconclusions about the effectiveness of the disclosure controls and procedures, as of the end of the period covered by thisreport based on such evaluation; and
d. Disclosed in this report any change in the registrant’s internal control over financial reporting that occurred during theregistrant’s most recent fiscal quarter (the registrant’s fourth fiscal quarter in the case of an annual report) that hasmaterially affected, or is reasonably likely to materially affect, the registrant’s internal control over financial reporting; and
5. The registrant’s other certifying officer and I have disclosed, based on our most recent evaluation of internal control overfinancial reporting, to the registrant’s auditors and the audit committee of the registrant’s board of directors (or personsperforming the equivalent functions):
a. All significant deficiencies and material weaknesses in the design or operation of internal control over financial reportingwhich are reasonably likely to adversely affect the registrant’s ability to record, process, summarize and report financialinformation; and
b. Any fraud, whether or not material, that involves management or other employees who have a significant role in theregistrant’s internal control over financial reporting.
Dated: December 7, 2018 Signed: /s/ JAMES N. SHEEHANJAMES N. SHEEHANSenior Vice President and Chief Financial Officer
81
EXHIBIT 32.1
CERTIFICATION PURSUANT TO18 U.S.C. SECTION 1350
AS ADOPTED PURSUANT TOSECTION 906 OF THE SARBANES-OXLEY ACT OF 2002
In connection with the Annual Report on Form 10-K of Hormel Foods Corporation (the “Company”) for the period ended October 28, 2018, as filed with the Securities and Exchange Commission (the “Report”), the undersigned hereby certify, pursuant to 18 U.S.C. Section 1350, as adopted pursuant to Section 906 of the Sarbanes-Oxley Act of 2002, that:
(1) The Report fully complies with the requirements of Section 13(a) or 15(d) of the Securities and Exchange Act of 1934, as amended; and
(2) The information contained in the Report fairly presents, in all material respects, the financial condition and results of operations of the Company.
Dated: December 7, 2018 /s/ JAMES P. SNEE JAMES P. SNEE Chairman of the Board, President, Chief Executive Officer, and
Director Dated: December 7, 2018 /s/ JAMES N. SHEEHAN JAMES N. SHEEHAN Senior Vice President and Chief Financial Officer

(This page intentionally left blank)
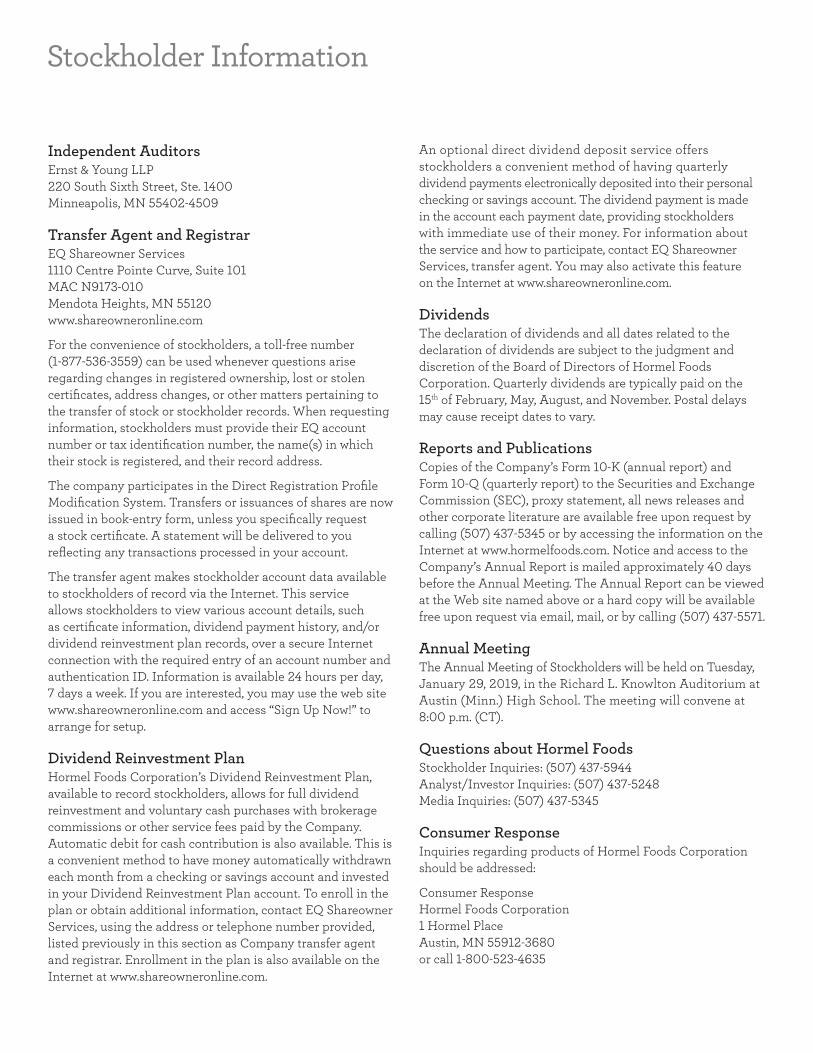
Stockholder Information
Independent AuditorsErnst & Young LLP 220 South Sixth Street, Ste. 1400 Minneapolis, MN 55402-4509
Transfer Agent and RegistrarEQ Shareowner Services 1110 Centre Pointe Curve, Suite 101 MAC N9173-010 Mendota Heights, MN 55120 www.shareowneronline.com
For the convenience of stockholders, a toll-free number (1-877-536-3559) can be used whenever questions arise regarding changes in registered ownership, lost or stolen certificates, address changes, or other matters pertaining to the transfer of stock or stockholder records. When requesting information, stockholders must provide their EQ account number or tax identification number, the name(s) in which their stock is registered, and their record address.
The company participates in the Direct Registration Profile Modification System. Transfers or issuances of shares are now issued in book-entry form, unless you specifically request a stock certificate. A statement will be delivered to you reflecting any transactions processed in your account.
The transfer agent makes stockholder account data available to stockholders of record via the Internet. This service allows stockholders to view various account details, such as certificate information, dividend payment history, and/or dividend reinvestment plan records, over a secure Internet connection with the required entry of an account number and authentication ID. Information is available 24 hours per day, 7 days a week. If you are interested, you may use the web site www.shareowneronline.com and access “Sign Up Now!” to arrange for setup.
Dividend Reinvestment PlanHormel Foods Corporation’s Dividend Reinvestment Plan, available to record stockholders, allows for full dividend reinvestment and voluntary cash purchases with brokerage commissions or other service fees paid by the Company. Automatic debit for cash contribution is also available. This is a convenient method to have money automatically withdrawn each month from a checking or savings account and invested in your Dividend Reinvestment Plan account. To enroll in the plan or obtain additional information, contact EQ Shareowner Services, using the address or telephone number provided, listed previously in this section as Company transfer agent and registrar. Enrollment in the plan is also available on the Internet at www.shareowneronline.com.
An optional direct dividend deposit service offers stockholders a convenient method of having quarterly dividend payments electronically deposited into their personal checking or savings account. The dividend payment is made in the account each payment date, providing stockholders with immediate use of their money. For information about the service and how to participate, contact EQ Shareowner Services, transfer agent. You may also activate this feature on the Internet at www.shareowneronline.com.
DividendsThe declaration of dividends and all dates related to the declaration of dividends are subject to the judgment and discretion of the Board of Directors of Hormel Foods Corporation. Quarterly dividends are typically paid on the 15th of February, May, August, and November. Postal delays may cause receipt dates to vary.
Reports and PublicationsCopies of the Company’s Form 10-K (annual report) and Form 10-Q (quarterly report) to the Securities and Exchange Commission (SEC), proxy statement, all news releases and other corporate literature are available free upon request by calling (507) 437-5345 or by accessing the information on the Internet at www.hormelfoods.com. Notice and access to the Company’s Annual Report is mailed approximately 40 days before the Annual Meeting. The Annual Report can be viewed at the Web site named above or a hard copy will be available free upon request via email, mail, or by calling (507) 437-5571.
Annual MeetingThe Annual Meeting of Stockholders will be held on Tuesday, January 29, 2019, in the Richard L. Knowlton Auditorium at Austin (Minn.) High School. The meeting will convene at 8:00 p.m. (CT).
Questions about Hormel FoodsStockholder Inquiries: (507) 437-5944 Analyst/Investor Inquiries: (507) 437-5248 Media Inquiries: (507) 437-5345
Consumer ResponseInquiries regarding products of Hormel Foods Corporation should be addressed:
Consumer Response Hormel Foods Corporation 1 Hormel Place Austin, MN 55912-3680 or call 1-800-523-4635
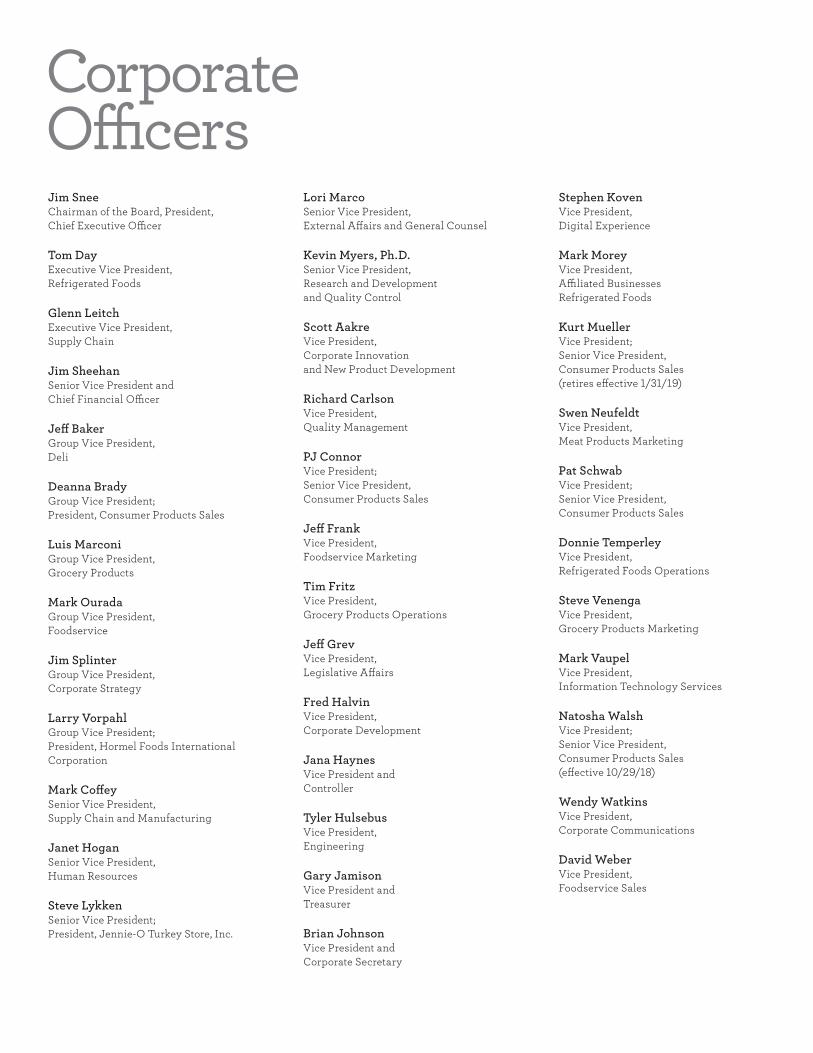
Jim SneeChairman of the Board, President, Chief Executive Officer
Tom DayExecutive Vice President, Refrigerated Foods
Glenn LeitchExecutive Vice President, Supply Chain
Jim SheehanSenior Vice President and Chief Financial Officer
Jeff BakerGroup Vice President, Deli
Deanna BradyGroup Vice President; President, Consumer Products Sales
Luis MarconiGroup Vice President, Grocery Products
Mark OuradaGroup Vice President, Foodservice
Jim SplinterGroup Vice President, Corporate Strategy
Larry VorpahlGroup Vice President; President, Hormel Foods International Corporation
Mark CoffeySenior Vice President, Supply Chain and Manufacturing
Janet HoganSenior Vice President, Human Resources
Steve LykkenSenior Vice President; President, Jennie-O Turkey Store, Inc.
Lori MarcoSenior Vice President, External Affairs and General Counsel
Kevin Myers, Ph.D.Senior Vice President, Research and Development and Quality Control
Scott AakreVice President, Corporate Innovation and New Product Development
Richard CarlsonVice President, Quality Management
PJ ConnorVice President; Senior Vice President, Consumer Products Sales
Jeff FrankVice President, Foodservice Marketing
Tim FritzVice President, Grocery Products Operations
Jeff GrevVice President, Legislative Affairs
Fred HalvinVice President, Corporate Development
Jana HaynesVice President and Controller
Tyler HulsebusVice President, Engineering
Gary JamisonVice President and Treasurer
Brian JohnsonVice President and Corporate Secretary
Stephen KovenVice President, Digital Experience
Mark MoreyVice President, Affiliated Businesses Refrigerated Foods
Kurt MuellerVice President; Senior Vice President, Consumer Products Sales (retires effective 1/31/19)
Swen NeufeldtVice President, Meat Products Marketing
Pat SchwabVice President; Senior Vice President, Consumer Products Sales
Donnie TemperleyVice President, Refrigerated Foods Operations
Steve VenengaVice President, Grocery Products Marketing
Mark VaupelVice President, Information Technology Services
Natosha WalshVice President; Senior Vice President, Consumer Products Sales (effective 10/29/18)
Wendy WatkinsVice President, Corporate Communications
David WeberVice President, Foodservice Sales
Corporate Officers

Glenn S. Forbes, M.D.Retired Executive Board Chair, former CEO Mayo Clinic – Rochester and Emeritus Physician, Mayo ClinicDirector since September 2011
Stephen M. LacyExecutive Chairman, Meredith CorporationDirector since September 2011
Gary C. BhojwaniChief Executive Officer, CNO Financial Group, Inc. Director since July 2014
Terrell K. CrewsRetired Executive Vice President and Chief Financial Officer, Monsanto CompanyDirector since October 2007
James P. SneeChairman of the Board, President and Chief Executive OfficerDirector since October 2015
Dakota A. PippinsPresident and Chief Executive Officer, Pippins Strategies, LLCDirector since January 2001
Christopher J. PolicinskiRetired President and Chief Executive Officer, Land O’Lakes, Inc.Director since September 2012 Lead Director since September 2016
Sally J. SmithRetired President and Chief Executive Officer, Buffalo Wild Wings, Inc. Director since July 2014
Steven A. WhitePresident, Comcast West Division, Comcast CorporationDirector since July 2014
Elsa A. Murano, Ph.D.Director of Norman Borlaug Institute for International Agriculture, Professor and President Emerita, Texas A&M UniversityDirector since September 2006
Robert C. NakasoneRetired Chief Executive Officer, Toys "R" Us, Inc.Director since September 2006
Susan K. NestegardFormer President, Global Healthcare Sector, Ecolab Inc.Director since October 2009
Board of Directors
William A. NewlandsPresident and Chief Operating Officer, Constellation Brands, Inc.Director since November 2018

2018 annual report
Our formula for successHormel Foods Corporation
1 Hormel PlaceAustin, MN 55912-3680
www.hormelfoods.com
Inspired by the food we make and the difference we can make in this world
Investing in our people and partners
Improving communities and the world
Creating products that improve the lives of our customers
Bold Thinking. Bold Innovation. Bold Ideas.“ We know that building social value and creating economic value are not competing goals. While Our Path Forward is our compass, Our Food Journey™ is our North Star.”
James P. Snee Chairman of the Board, President and Chief Executive Officer
We are a company unlike any other, one that truly understands our position in the world and the difference we can make. While we are committed to many worthy causes, it is our core business — efficiently producing delicious and safe food for the world’s growing population — that makes us most proud. Having fed America and the world for over 125 years, we know that building social value and creating economic value are not competing goals.
To learn more, visit hormelfoods.com/our-food-journey
E Printed on recycled paper
Horm
el Foods Corporation 2018 annual report
239810_Report_B.indd 1 12/7/18 1:01 PM


![CONTAINER GLASS FORMING MACHINES AL - Sklostroj · B [mm] - - 2916 2992 2992 2992 2992 2992 2992 3292 3292 3292 3680 3680 3680 4060 4060 4060 C [mm] - - 3138 3410 3410 3410 3410 3410](https://img.pdfslide.us/doc/110x75/5ec26e4c2feb6b224c47cf82/container-glass-forming-machines-al-sklostroj-b-mm-2916-2992-2992-2992-2992.jpg)