Embed Size (px)
Citation preview
Succeeding against the odds: A quantitativeassessment of the effectiveness of IkamvaYouth
LEWIS SIDNEY MCLEANSERVAAS VAN DER BERG
Stellenbosch Economic Working Papers: WP05/2017
www.ekon.sun.ac.za/wpapers/2017/wp052017
June 2017
KEYWORDS: IkamvaYouth, programme evaluation, matric resultsJEL: I21, I24
ReSEP (Research on Socio-Economic Policy)http://resep.sun.ac.za
DEPARTMENT OF ECONOMICSUNIVERSITY OF STELLENBOSCH
SOUTH AFRICA
A WORKING PAPER OF THE DEPARTMENT OF ECONOMICS AND THEBUREAU FOR ECONOMIC RESEARCH AT THE UNIVERSITY OF STELLENBOSCH
www.ekon.sun.ac.za/wpapers
Succeeding against the odds: A quantitative assessment of the effectiveness of IkamvaYouth
ReSEP (Research on Socio-Economic Policy), Department of Economics, University of Stellenbosch
Abstract: The work presented here is essentially an update to the previous evaluation
conducted by ReSEP (Research on Socio-Economics Policy), located in Stellenbosch
University’s Department of Economics: Against the Odds: An Evaluation of the IkamvaYouth
Programme. This update to Against the Odds provides a more rigorous quantitative
assessment of the contribution of the IkamvaYouth programme to learners’ performance at
school. IkamvaYouth’s contribution to the performance of its learners – the ‘Ikamvanites’ –
is estimated in five matric subjects: English as a First Additional Language, Mathematics,
Mathematical Literacy, Physical Sciences and Life Sciences. Controlling for socioeconomic
and demographic factors, estimates for the 2014 sample of matriculating Ikamvanites suggest
that the IkamvaYouth programme is associated with dramatic improvements ranging from a
low as high as 0.293 standard deviations (about six percentage points) for Physical Sciences
up to a high of 0.502 standard deviations (about ten percentage points) for Life Sciences. We
check the robustness of these results with a subsample of Western Cape learners who could
be matched with their 2011 grade 9 Systemic Test results. Matching makes it possible to
control for learners’ pre-programme performance and thus for factors such as students’ pre-
programme motivation and ability. However, the matching process also restricts the sample
to a subset of high-performing learners (learners who reached matric without failing a grade
between grade 9 and matric) that, it is argued, are not a good counterfactual for how
Ikamvanites would have performed had they not participated in the programme. As a result,
estimates of the effectiveness of the programme obtained from the matched sample would
under-represent the effectiveness of the programme, and should thus be treated as lower-
bound estimates of the effectiveness of IkamvaYouth. These lower-bound estimates of the
impact of the programme range from a high of 0.30 standard deviations (about 5.5 percentage
points) for Life Sciences, still approximately a year of learning, to a low of 0.036 (about one
percentage point) for Physical Sciences. Thus, in sum, the findings suggest that IkamvaYouth
does indeed add substantially to the performance of its learners, helping them to succeed
against the odds.
LEWIS MCLEAN DEPARTMENT OF ECONOMICS
UNIVERSITY OF STELLENBOSCH PRIVATE BAG X1, 7602
MATIELAND, SOUTH AFRICA [email protected]
SERVAAS VAN DER BERG DEPARTMENT OF ECONOMICS
UNIVERSITY OF STELLENBOSCH PRIVATE BAG X1, 7602
MATIELAND, SOUTH AFRICA [email protected]
Contents
Introduction ................................................................................................................................ 1
Section 1: Estimates Based on Full Sample (All Five Provinces) ............................................. 2
1.1: Data and Regression Specification ................................................................................. 2
1.2: Notes on Interpretation and Limitations ......................................................................... 5
1.3 Descriptive Statistics ........................................................................................................ 6
1.4 Notes on Interpreting Regression Outputs ....................................................................... 7
1.5 Discussion of Initial Estimates......................................................................................... 8
Table 1.1: Outputs from Table B2.3 Expressed in Percentage Points ............................. 10
Section 2: Restricted Sample Estimates, with Systemic Test Results ..................................... 10
2.1 Data, Matching and Sources of Bias .............................................................................. 10
2.2 A ‘Lower-Bound’ Estimate of the Effectiveness of IkamvaYouth ............................... 16
Table 2.1: Outputs from Tables D3.1 to D3.5 Column Four Expressed in Percentage
Points................................................................................................................................ 19
Conclusion ............................................................................................................................... 19
References ................................................................................................................................ 21
Appendix A: Unmatched, All Provinces ................................................................................. 22
A1: Descriptive Statistics ..................................................................................................... 22
Table A1.1: Ikamvanites 2014 Matric Results ................................................................ 22
Table A1.2: Ikamva Feeder Schools (Excluding Ikamvanites) 2014 Matric Results ...... 22
Table A1.3: All Learners 2014 Matric Results ................................................................ 22
Figure A1.1: English ........................................................................................................ 23
Figure A1.2: Mathematics ............................................................................................... 23
Figure A1.3: Mathematical Literacy ................................................................................ 23
Figure A1.4: Physical Sciences........................................................................................ 24
Figure A1.5: Life Sciences .............................................................................................. 24
A2: Regression Outputs ....................................................................................................... 26
Table A2.1: Ikamvanites, Excluding Feeder Schools Dummy ........................................ 26
Table A2.2: Ikamva Schools, Excluding Ikamvanite Dummy ........................................ 26
Table A2.3: Ikamvanites, Controlling for Ikamva Schools ............................................. 26
Appendix B: Unmatched, All Provinces, Excluding Quintile 5 .............................................. 27
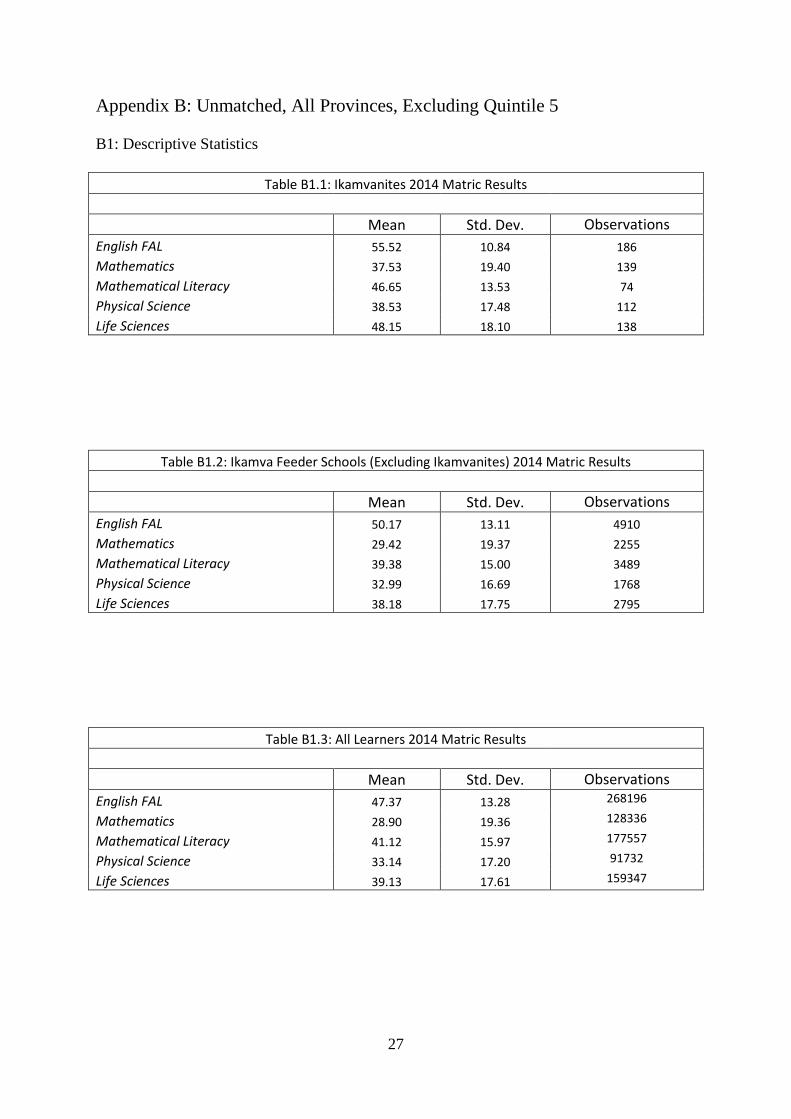
B1: Descriptive Statistics ..................................................................................................... 27
Table B1.1: Ikamvanites 2014 Matric Results ................................................................. 27
Table B1.2: Ikamva Feeder Schools (Excluding Ikamvanites) 2014 Matric Results ...... 27
Table B1.3: All Learners 2014 Matric Results ................................................................ 27
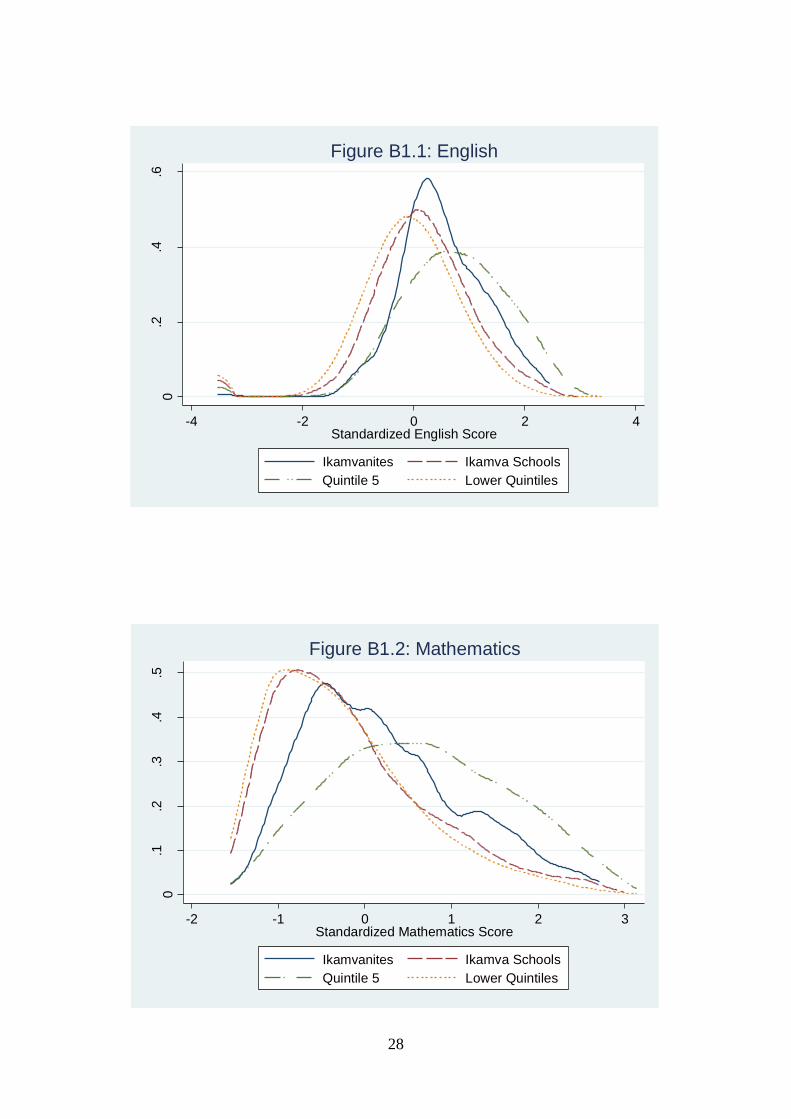
Figure B1.1: English ........................................................................................................ 28
Figure B1.2: Mathematics ................................................................................................ 28
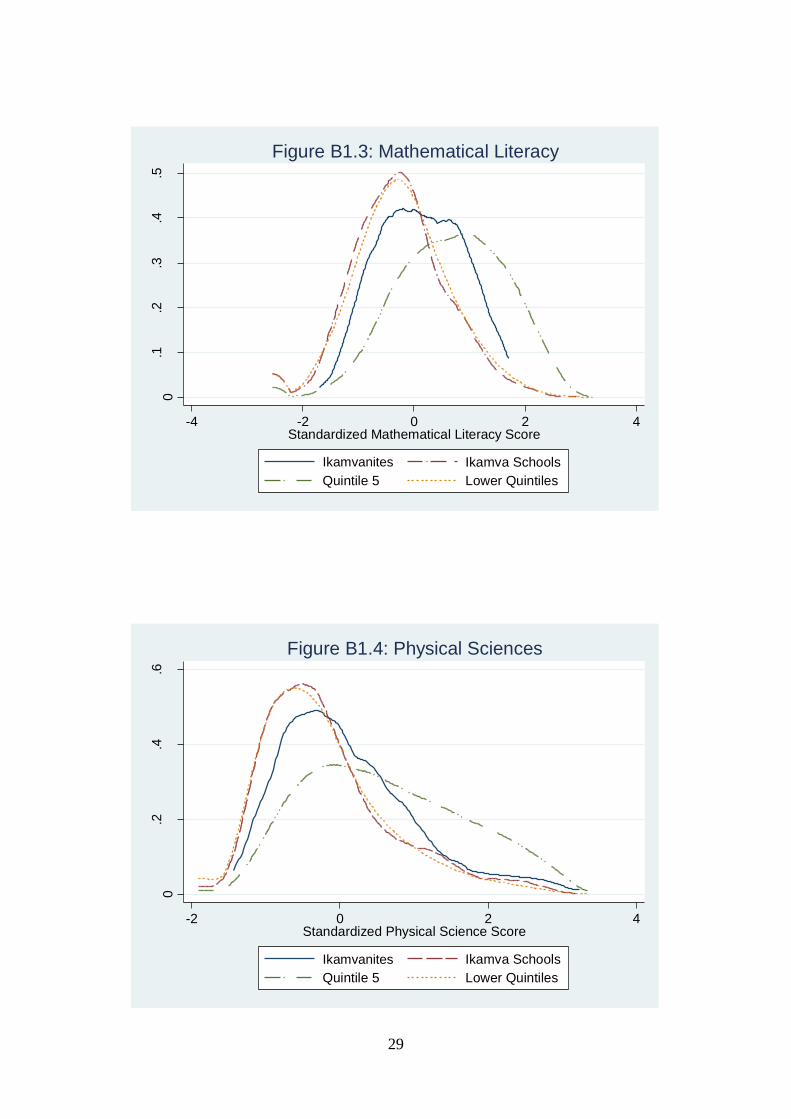
Figure B1.3: Mathematical Literacy ................................................................................ 29
Figure B1.4: Physical Sciences ........................................................................................ 29
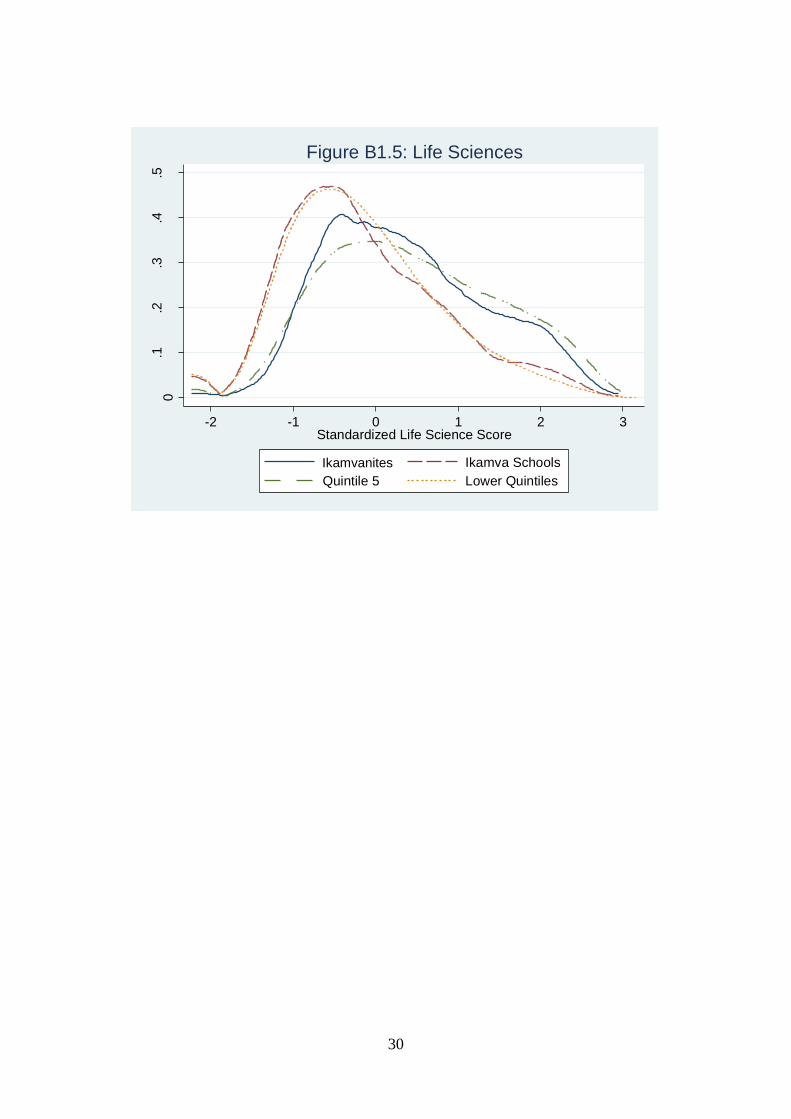
Figure B1.5: Life Sciences ............................................................................................... 30
Table B2.1: Ikamvanites, Excluding Feeder Schools Dummy ........................................ 31
Table B2.2: Ikamva Schools, Excluding Ikamvanite Dummy ........................................ 31
Table B2.3: Ikamvanites, Controlling for Ikamva Schools ............................................. 31
Appendix C: Matched, Western Cape ..................................................................................... 32
C1: Descriptive Statistics, Matric Performance ................................................................... 32
Table C1.1: Western Cape Ikamvanites ........................................................................... 32
Table C1.2: Western Cape Ikamva Feeder Schools ......................................................... 32
Table C1.3: All Western Cape Learners .......................................................................... 33
C2: Descriptive Statistics, Systemic Performance ............................................................... 33
Table C2.1: Systemic Performance.................................................................................. 33
C3: Regression Outputs ....................................................................................................... 34
Table C3.1: English FAL ................................................................................................... 34
Table C3.2: Mathematics ................................................................................................. 34
Table C3.3: Mathematical Literacy ................................................................................. 34
Table C3.4: Physical Sciences ......................................................................................... 35
Table C3.5: Life Sciences ................................................................................................ 35
Appendix D: Matched, Western Cape, Excluding Quintile 5 .................................................. 36
D1: Descriptive Statistics, Matric Results ........................................................................... 36
Table D1.1: Western Cape Ikamvanites .......................................................................... 36
Table D1.2: Western Cape Ikamva Feeder Schools ........................................................ 36
Table D1.3: All Western Cape Learners .......................................................................... 37
D2: Descriptive Statistics, Systemic Performance............................................................... 37
Table D2.1: Systemic Performance ................................................................................. 37
D3: Regression Outputs ....................................................................................................... 38
Table D3.1: English FAL .................................................................................................. 38
Table D3.2: Mathematics ................................................................................................. 38
Table D3.3: Mathematical Literacy ................................................................................. 38
Table D3.4: Physical Sciences ......................................................................................... 39
Table D3.5: Life Sciences ................................................................................................ 39
Appendix E: Restricted and Unrestricted Western Cape Sample Estimates, Including Quintile
Five Schools ............................................................................................................................. 40
E1.1: English FAL ........................................................................................................... 40
E1.2: Mathematics ........................................................................................................... 40
E1.3: Mathematical Literacy ............................................................................................ 40
E1.4: Physical Sciences ................................................................................................... 41
E1.5: Life Sciences .......................................................................................................... 41
Appendix F: Restricted and Unrestricted Western Cape Sample Estimates, Excluding
Quintile Five Schools ............................................................................................................... 42
F1.1: English FAL ........................................................................................................... 42
F1.2: Mathematics............................................................................................................ 42
F1.3: Mathematical Literacy ............................................................................................ 42
F1.4: Physical Sciences .................................................................................................... 43
F1.5: Life Sciences........................................................................................................... 43
1
Introduction
The work presented here is essentially an update to the previous evaluation conducted by
Stellenbosch University’s Department of Economics: Against the Odds: An Evaluation of the
IkamvaYouth Programme. Against the Odds was very comprehensive in terms of the breadth
of its assessment, but it was lacking in terms of its quantitative assessment of the impact of
the programme on learners’ performance at school. More specifically, the estimates of
participating learners’ performance included in the prior report could not account for
learners’ academic performance prior to joining the programme. Thus, while the estimates
presented in Against the Odds indicated that participating learners certainly do excel
academically, the report could not ascertain the extent to which these academic achievements
reflected learners’ pre-programme motivation or abilities rather than the effectiveness of
IkamvaYouth.
It is precisely with respects to the robustness of the estimates that this current study improves
on Against the Odds. This study estimates IkamvaYouth’s contribution to the performance of
its learners – the ‘Ikamvanites’ – in five matric subjects: English as a First Additional
Language (hereafter simply referred to as ‘English FAL’), Mathematics, Mathematical
Literacy, Physical Sciences and Life Sciences. In Section 1, these estimates are obtained for
the full sample 2014 cohort of grade 12 learners residing in the five provinces containing
matriculating Ikamvanites – for these estimates no attempt is made to control for learners’
past performance. As is discussed below, the Section 1 estimates suggest that IkamvaYouth
has had an immense impact on the performance of its learners. However, it is in Section 2
that this study provides evidence of the robustness of this result. Here the effectiveness of the
programme is estimated for a sub-set of Western Cape learners who could be matched to the
2011 Systemic Test results; these test results are used to control for learners’ past
performance. This procedure, as is detailed below, may actually introduce more problems
than it solves, but it is argued that these estimates provide a suitable lower-bound estimate of
the effectiveness of IkamvaYouth. In combination, it lends support to the main finding that
IkamvaYouth seems to have a major impact on the performance of its learners.
2
Section 1: Estimates Based on Full Sample (All Five Provinces)
1.1: Data and Regression Specification
Information on the performance of South Africa’s 2014 cohort of matriculants was obtained
from the 2014 official matric results for the Western Cape, KwaZulu-Natal, the Eastern Cape,
North-West Province and Gauteng. As stipulated above, this evaluation only considers the
performance of Ikamvanites in English FAL, Mathematics, Mathematical Literacy, Physical
Sciences and Life Sciences; data on the performance of learners in all other subjects was thus
dropped from the dataset. For all regression outputs included in this evaluation, the included
subjects are respectively referred to as English FAL, Mathematics, Math. Lit., Physics, and
Life Sci. Note then when written without italics subject names refer specifically to the subject
rather than the 2014 data for each subject (and vice versa for subject names written in italics).
243 Ikamvanites were identified in this data by their exam numbers, obtained from
IkamvaYouth’s database. This information was used to generate a variable, Ikamvanite,
which takes on a value of one if a learner was an IkamvaYouth participant upon completion
of matric (and a zero otherwise). This approach – i.e. using a binary variable (that either takes
on a value of zero or one) rather than a variable that indicates the length of exposure to the
programme – is advantageous for its simplicity. In the regression outputs discussed below,
the coefficient estimate for the binary variable Ikamvanite may simply be interpreted as the
average benefit derived from participation in the IkamvaYouth programme, expressed in the
units of the dependent variable (which, in all cases, is either English FAL, Mathematics,
Math. Lit., Physics, or Life Sci).
Regarding the units of the dependent variables, learners’ scores in these five subjects are
recorded in the official matric data as percentages. In accordance with common practice,
these variables where standardized using the following transformation:
𝑍𝑖 =𝑋𝑖 − 𝑋 ̅
𝜎𝑋
wherein 𝑍𝑖 is learner 𝑖’s standardized score for subject 𝑋, 𝑋𝑖 is learner 𝑖’s score for subject 𝑋
expressed as a percentage, �̅� is the average of all learners’ scores in subject 𝑋, and 𝜎𝑋 is the
standard deviation of learners’ scores for subject 𝑋. Standardizing learners’ scores simply
ensures that the average score (of zero) and standard deviation (of one) is the same for all
subjects.
3
Using standardized dependent variables is advantageous in that regressing on them produces
coefficients expressed in standard deviations. In other words, the effect sizes estimated in
these regressions will be expressed as a proportion of the distribution of the relevant
dependent variable (English FAL, Mathematics, etc.). This makes estimated effect sizes for
dependent variables with tight distributions (such as English FAL, which has a standard
deviation of 10.56, as can be seen in Table A1.1,) and wide distributions (such as
Mathematics, which has a standard deviation of 19.03) comparable.
The downside of using standardized scores is that the interpretation of the coefficient
estimates is less intuitive than for coefficients expressed in terms of percentage points.
Illustrating by way of an example, the correct interpretation of a coefficient of 0.502 on
Ikamvanite, produced from regressing English FAL on Ikamvanite (Table A1.1, column
A1.1.1) would read as follows: “Participation in the IkamvaYouth programme yields an
estimated 0.502 standard deviations improvement in learners’ English FAL scores”.
However, the estimated effect size can be easily converted from standard deviations to
percentage points by simply multiplying the estimated coefficient by the standard deviation
of the dependent variable; this will be done for the most important results discussed below.
Turning now to issues of estimation, all of the regressions discussed below conform to the
same simple setup. In each regression, learners’ scores in one of the five subjects under
consideration (the dependent variable) are regressed on Ikamvanite and a selection of control
variables. For those less familiar with the technical workings of OLS regression analysis,
control variables are used to account for systematic differences between learners which
would otherwise obscure the effect that is of interested here. Explaining by way of a
hypothetical example, if Physics is regressed on Ikamvanite without adding any control
variables, it might be found that the resulting coefficient estimate for Ikamvanite – i.e. the
estimated effect of participation in the IkamvaYouth programme – is small and negative. This
of course is not because the programme negatively affects the performance of its participants.
Without control variables, OLS regression analysis simply compares the average score of the
learners captured under Ikamvanite with the average score for all other learners. This would
be fine if non-participants were good counterfactuals for how Ikamvanites would have
performed had they been non-participants, but this is clearly not the case. By design,
IkamvaYouth reaches out to learners who are faced with numerous disadvantages and
impediments to learning, and on the basis of these disadvantages one might expect
Ikamvanites to underperform relative to the average performance of other learner, even with

4
the assistance of the programme. Adding relevant control variables can help to remove such
impediments to estimation. As their name suggests, control variables ‘control away’ the
impact of other factors that determine learners’ performance, thus improving the
comparability between otherwise very different learners.
Regarding the aims of this evaluation, Ikamvanites should be made as comparable as possible
with all non-participants, as under these conditions the estimates of the impact of the
programme will be generalizable as a prediction of the added benefit that will be derived
from the programme if it is expanded further. Thus a set of control variables is added in an
attempt to account for important systematic differences between Ikamvanites and non-
participants. In this regard, all estimates discussed in section 1.5 include control variables for
race, province, schools’ socioeconomic status using the national quintile, whether or not
schools charge school fees, schools’ language of learning and teaching, learners’ gender, any
history of grade repetition, learners’ home language, and whether children are immigrants or
have special needs. In addition to these control variables which were included in the official
2014 matric data, one additional control variable is generated, Ikamva Schools, which takes
on a one for all learners who attend a school attended by at least one Ikamvanite. In
combination, these demographic control variables give some indication of the resources
available to learners and their background, thus addressing many of the avenues that might
lead one to underestimate the effectiveness of IkamvaYouth. Note that estimates discussed
under Section 2 of this report contain the same list of control variables, barring the provincial
variables (the sample for that Section 2 is restricted to the Western Cape) and the ‘repeater’
variable (as students with a history of grade repetition could not be matched with data
documenting their prior performance).
Finally, before moving on to a discussion of the estimates presented in Appendix A and
Appendix B, it is worth briefly noting here that there are several factors not accounted for in
this battery of control variables that might still bias the estimates away from the true effect of
the programme. Specifically, learners’ motivation, a key determinant of performance which
might be correlated with the uptake of the programme (and which would thus cause one to
overestimate the effectiveness of the programme), is not accounted for here. This issue will
be returned to in Section 2 of this evaluation, wherein it is demonstrated that this factor may
not have a very large impact on the estimates presented here in Section 1.
5
1.2: Notes on Interpretation and Limitations
Descriptive statistics and regression outputs obtained for the whole sample of learners from
the five provinces included in this study are reported in Appendix A. Appendix B includes
the same set of descriptive statistics and regression outputs, again estimated using the data
from all five provinces but excluding the top quintile of schools. Omitting quintile five
schools was done for reasons similar to those discussed with regards to the inclusion of
control variables. As discussed above, the validity of the estimates is contingent on the extent
to which non-participants in the sample resemble a good counterfactual for the performance
of Ikamvanites had they not been given access to the programme. In principle, controlling for
whether or not a learner attended a quintile five school should be sufficient to capture the
effect of this difference between learners, but given the evidence which suggests that South
Africa’s educational system is de facto divided into a well-functioning high SES system and a
dysfunctional low SES system (Spaull, 2013) it may be more appropriate to omit those
learners who might be drawn from a fundamentally different data generating process.
For the estimates presented in this section, it must be remembered that participating learners’
academic performance prior to joining the programme has not sufficiently been accounted
for. If the learners who decided to participate in the IkamvaYouth programme were
outperforming their otherwise similar peers (due to more motivation or greater innate ability)
prior to joining the programme, these estimates would overstate the effectiveness of
IkamvaYouth. This of course would undermine the reliability of these estimates as an
indicator of how effective the programme will be if it is expanded. As is discussed in Section
2, this source of bias is probably not too great a source of concern, but regarding the
generalizability of these results, it is worth keeping in mind that these estimates capture the
effect of the IkamvaYouth intervention for motivated learners. Consequently, expanding the
reach of the programme within schools will likely see diminishing returns to the performance
of new learners as the pool of motivated learners yet to join the programme decreases.
Expansion to new schools, i.e. to new pockets of unassisted motivated learners, will likely
result in similarly large improvements for these new learners. In other words, these estimates
yield a plausible indication of the impact that a lateral expansion of IkamvaYouth to new
schools might have, but would likely overstate the gains from a continuous deepening of the
programme at already participating schools.
6
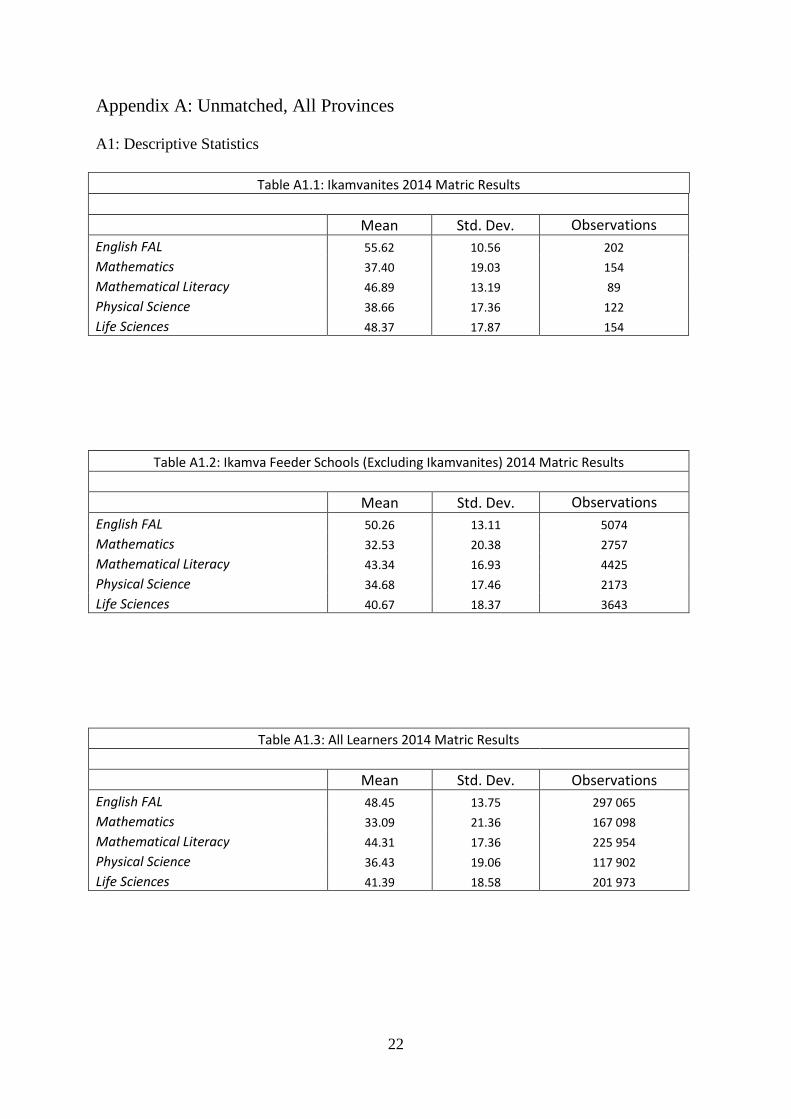
1.3 Descriptive Statistics
Table A1.1, A1.2 and A1.3 respectively display the average matric scores of the 2014
Ikamvanites, their feeder schools, and all other schools in each of the five subjects under
consideration. The results for the IkamvaYouth feeder schools include the Ikamvanites’
scores, but excluding them makes little difference, given that they account for a very small
proportion of the learners who attended their schools. Comparing Table A1.1 and Table A1.2,
Ikamvanites on average over-perform relative to their feeder school peers in all five subjects;
the largest margin is nearly eight percentage points (for Life Sciences), and the smallest
margin is approximately 3.5 percentage points (Mathematical Literacy). Comparing the
average performance of Ikamva feeder schools (Table A1.2) with the average performance of
the full sample of learners (all five provinces, all school quintiles), the feeder schools
outperform the full sample average for English FAL and underperform in all of the other
subjects. The performance of these schools in English FAL may simply reflect their urban
location (note that information on the location of schools was not available in the dataset),
with urban learners experiencing more exposure to English.
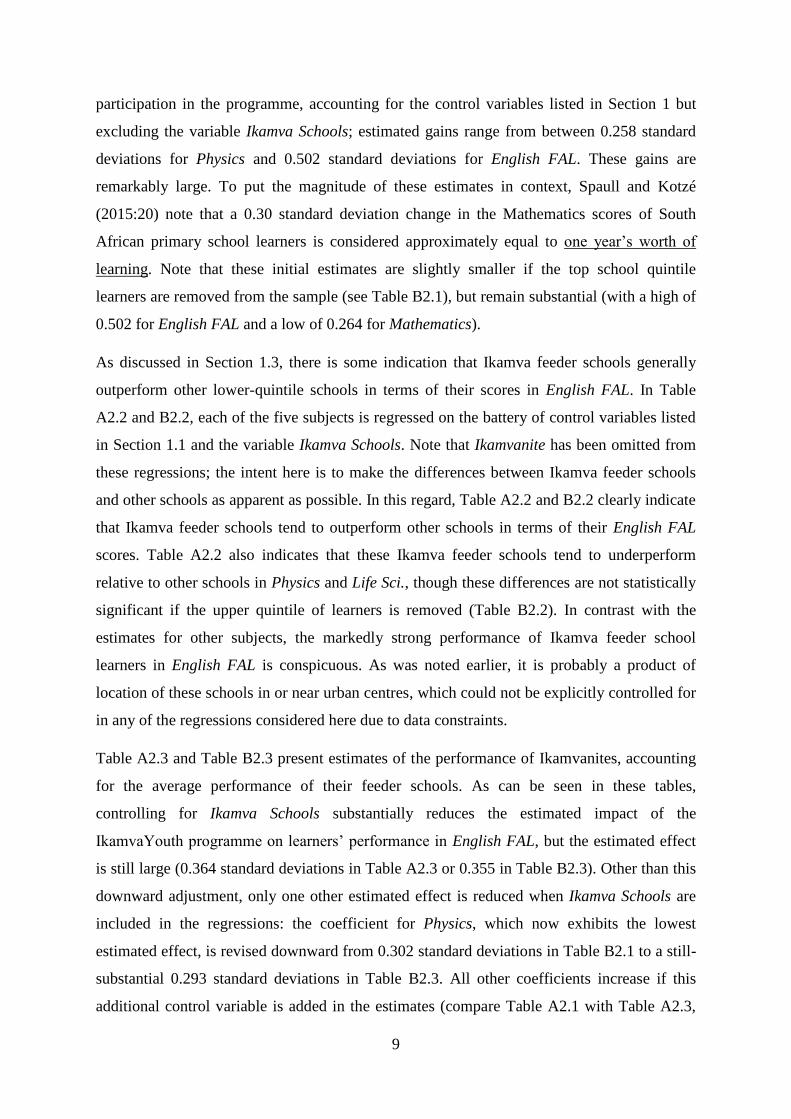
Table B1.1, B1.2 and B1.3 display average scores for the same categories (Ikamvanites,
feeder schools and full sample respectively), but omitting quintile five. Omitting learners who
attended quintile five schools has almost no impact on the average scores of Ikamvanites.
Much larger changes were observed for the average performance of Ikamva feeder schools
(Table B1.2) and the full sample of learners (Table B1.3), and in these cases all changes were
negative. Thus, after accounting for the influence of quintile five schools’ learners,
Ikamvanites continue to outperform both their feeder school peers and their matric cohort.
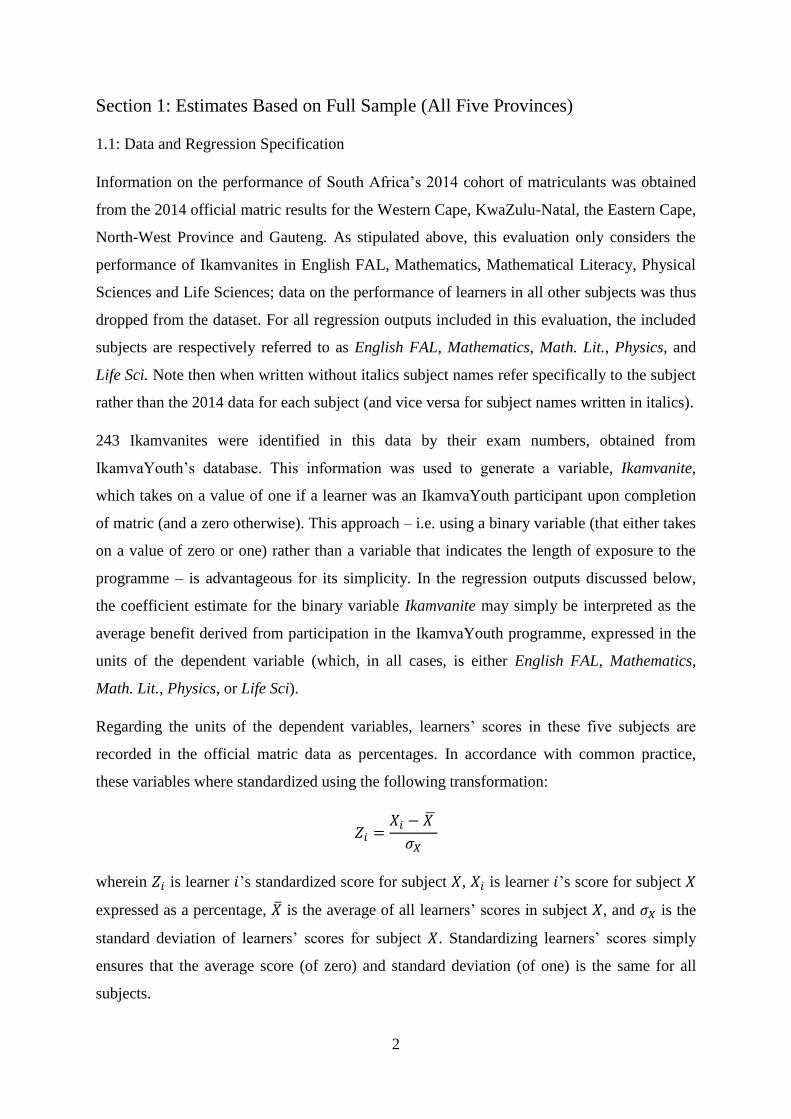
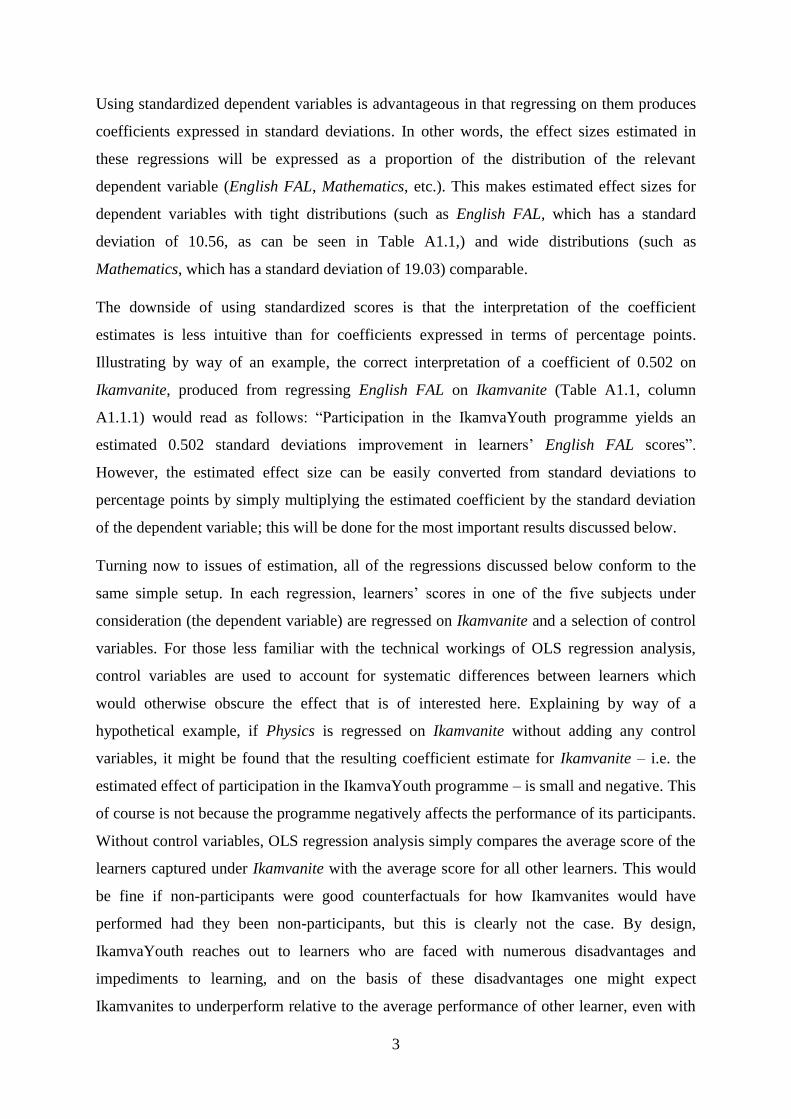
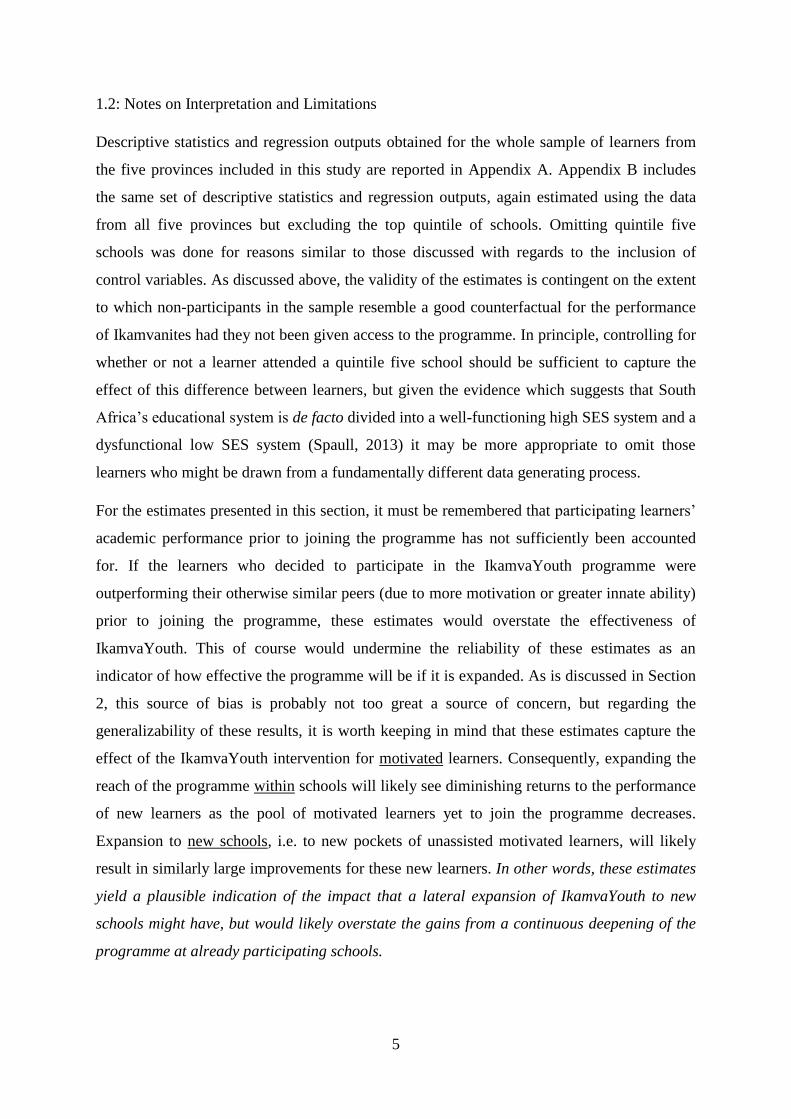
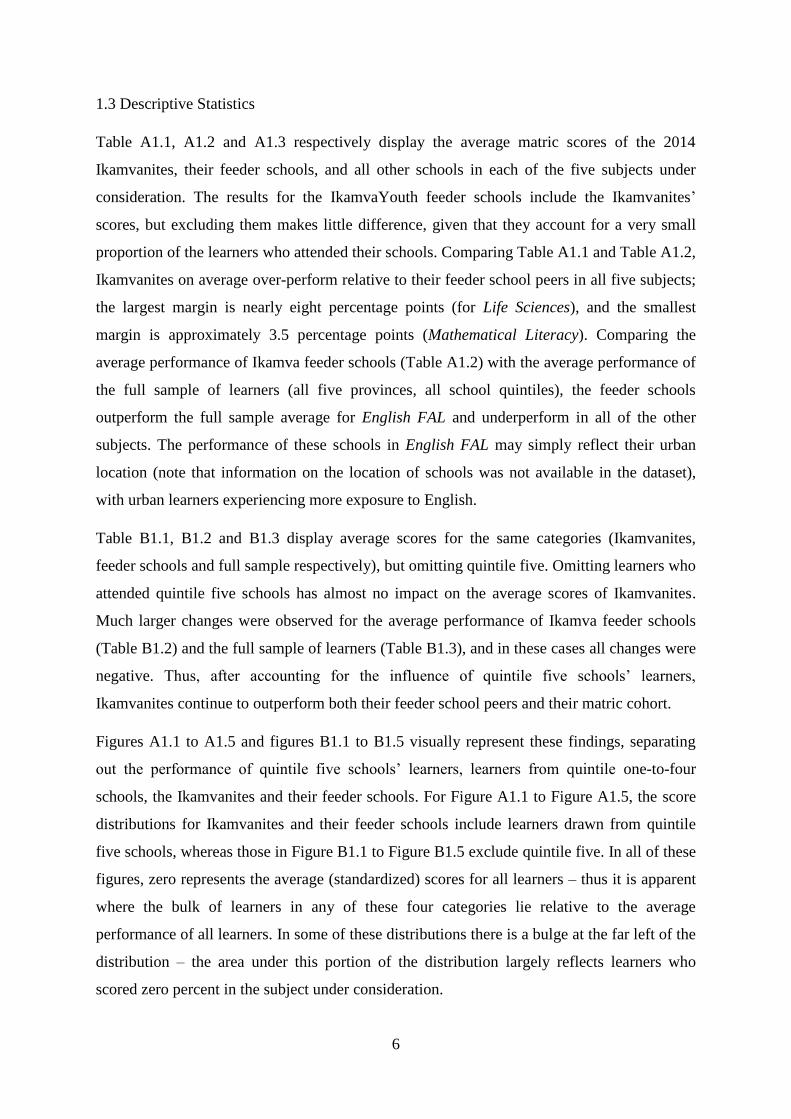
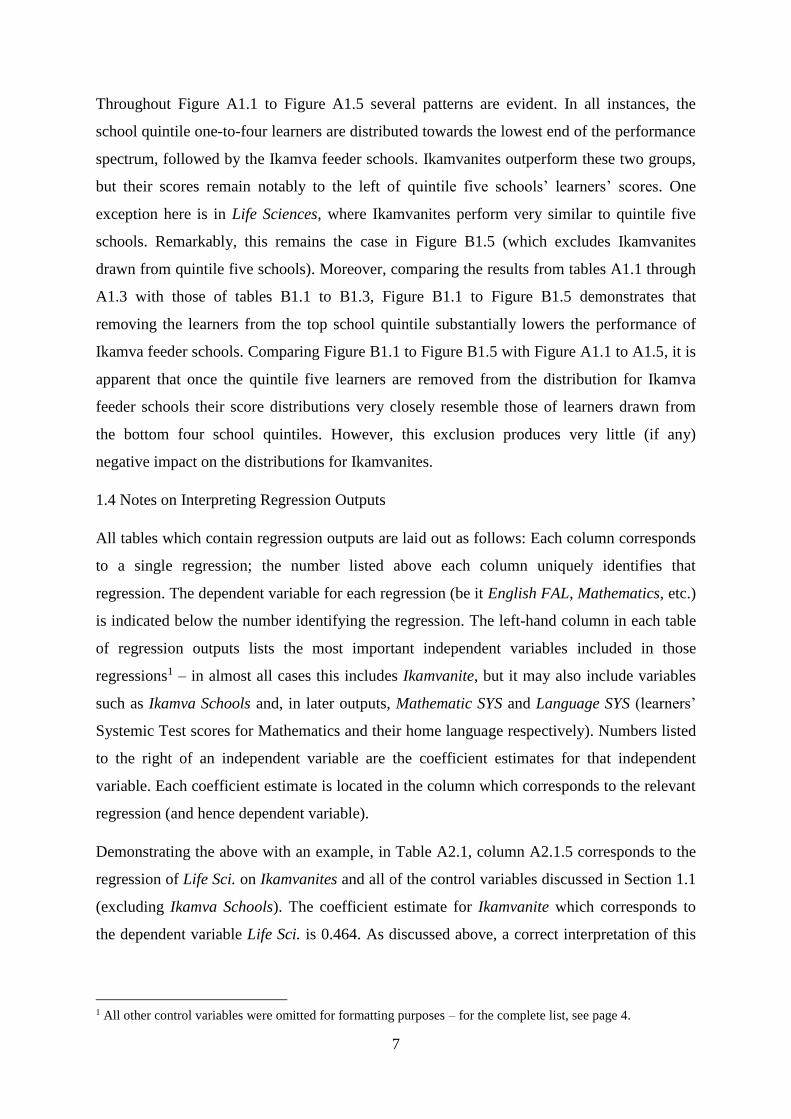
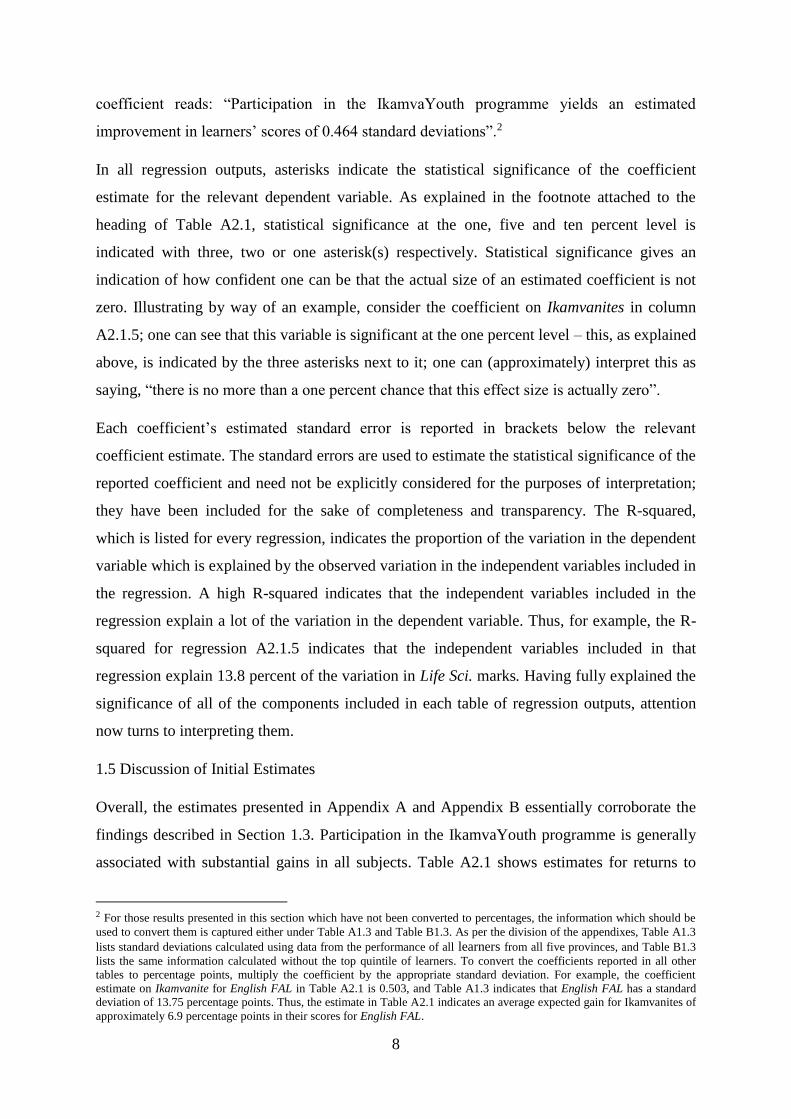
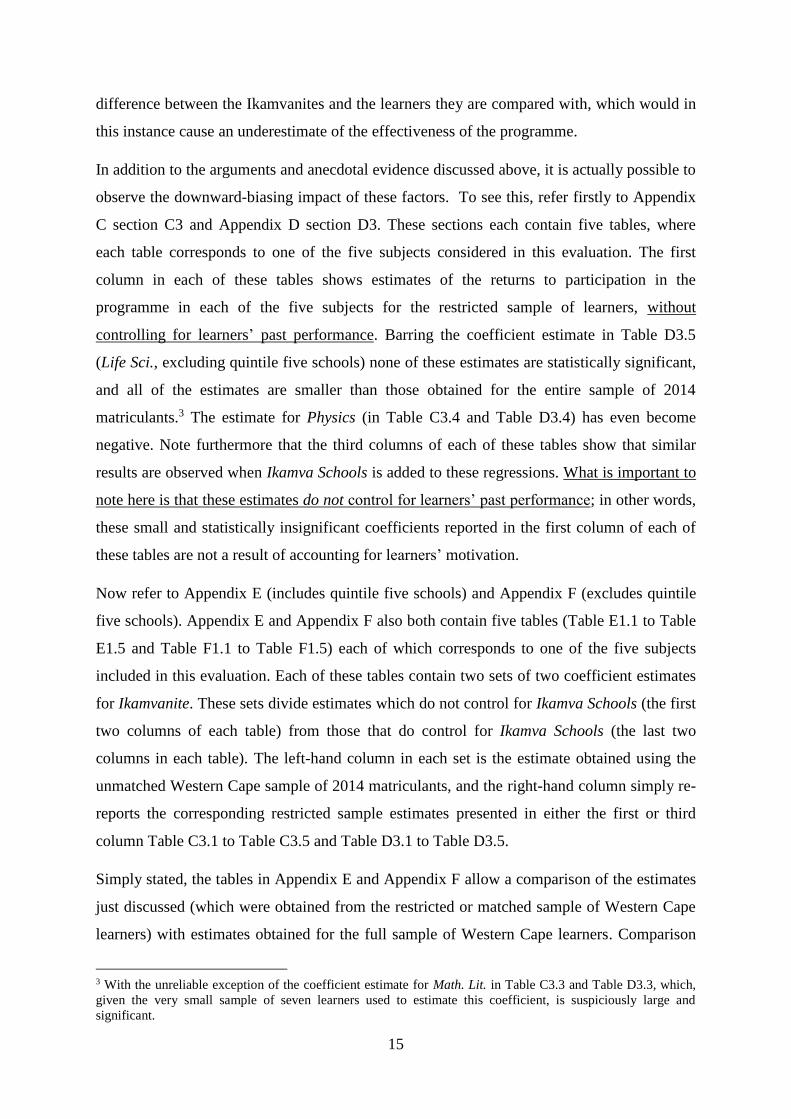
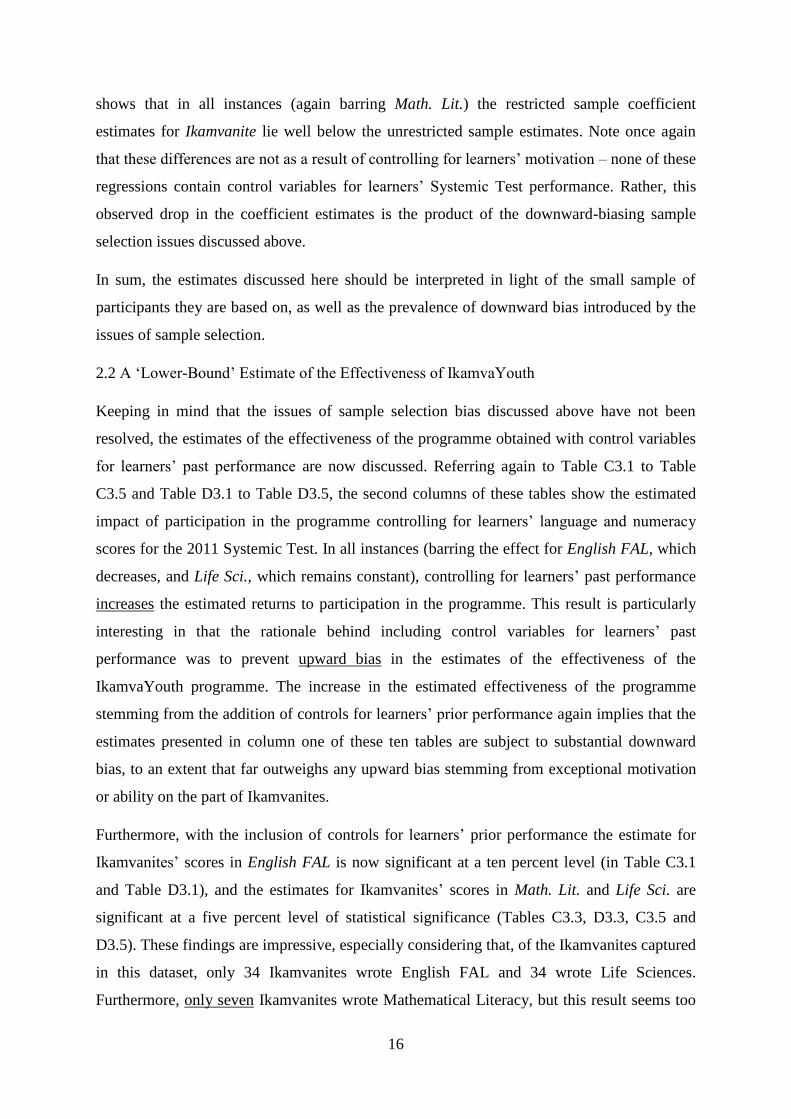
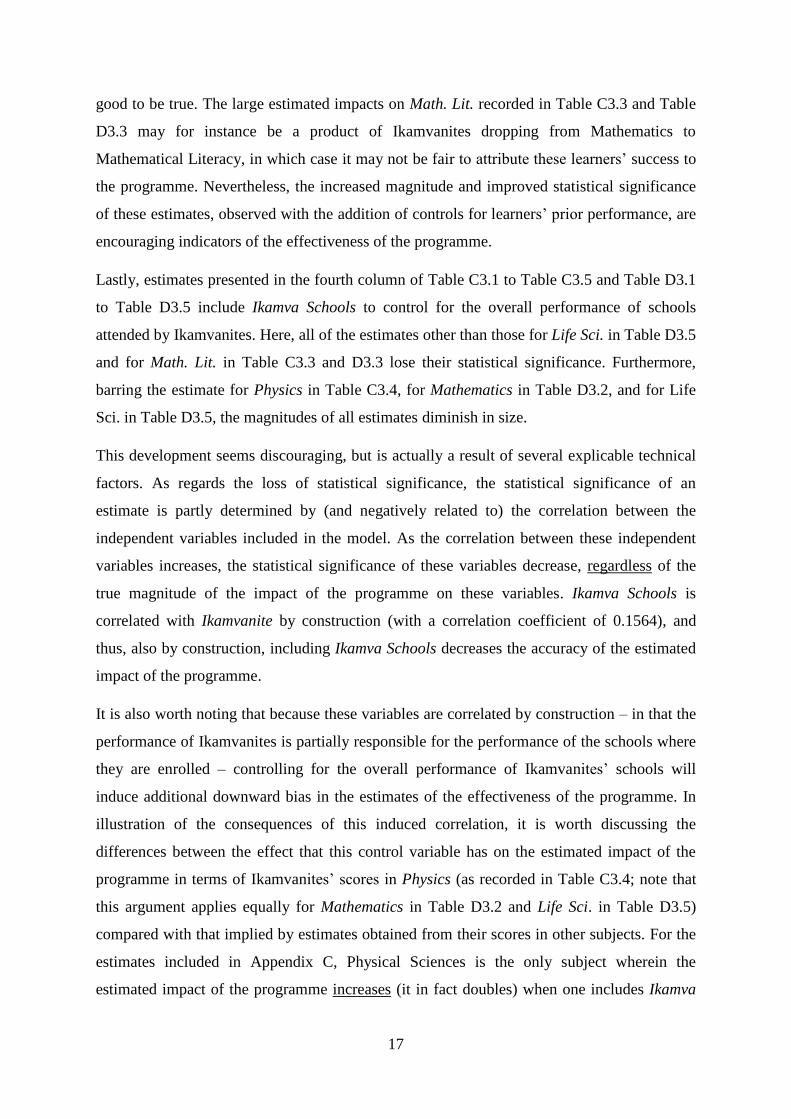
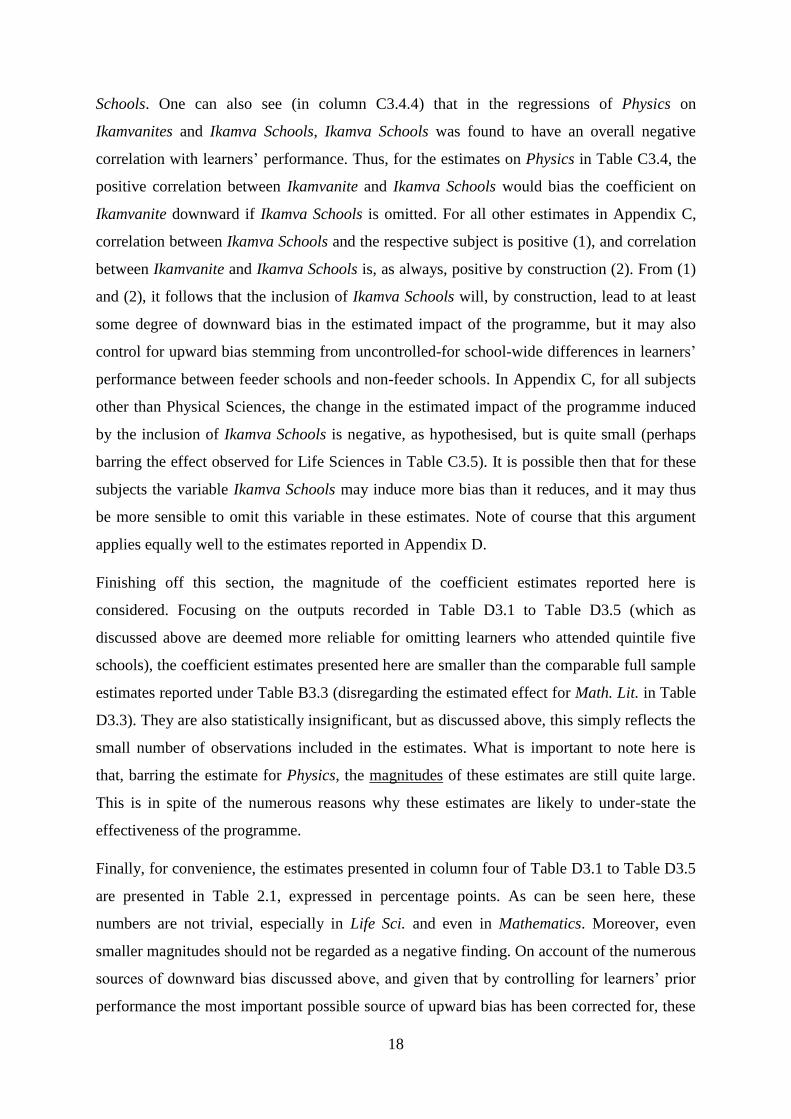
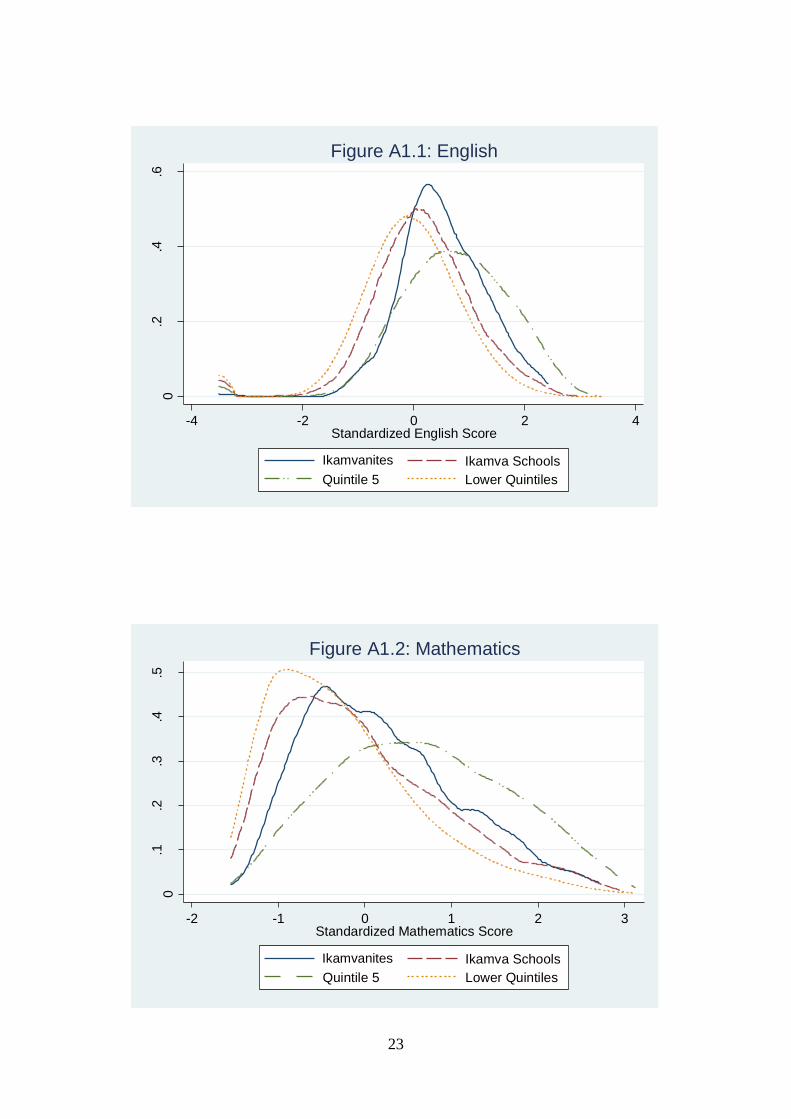
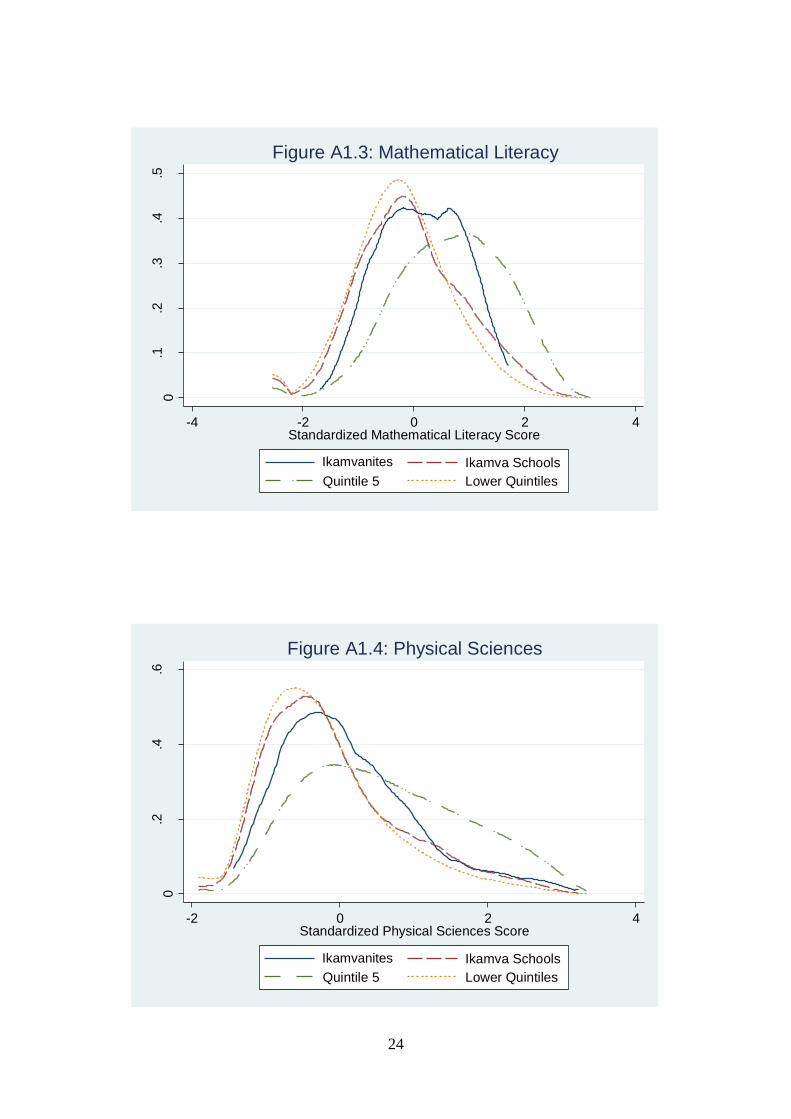
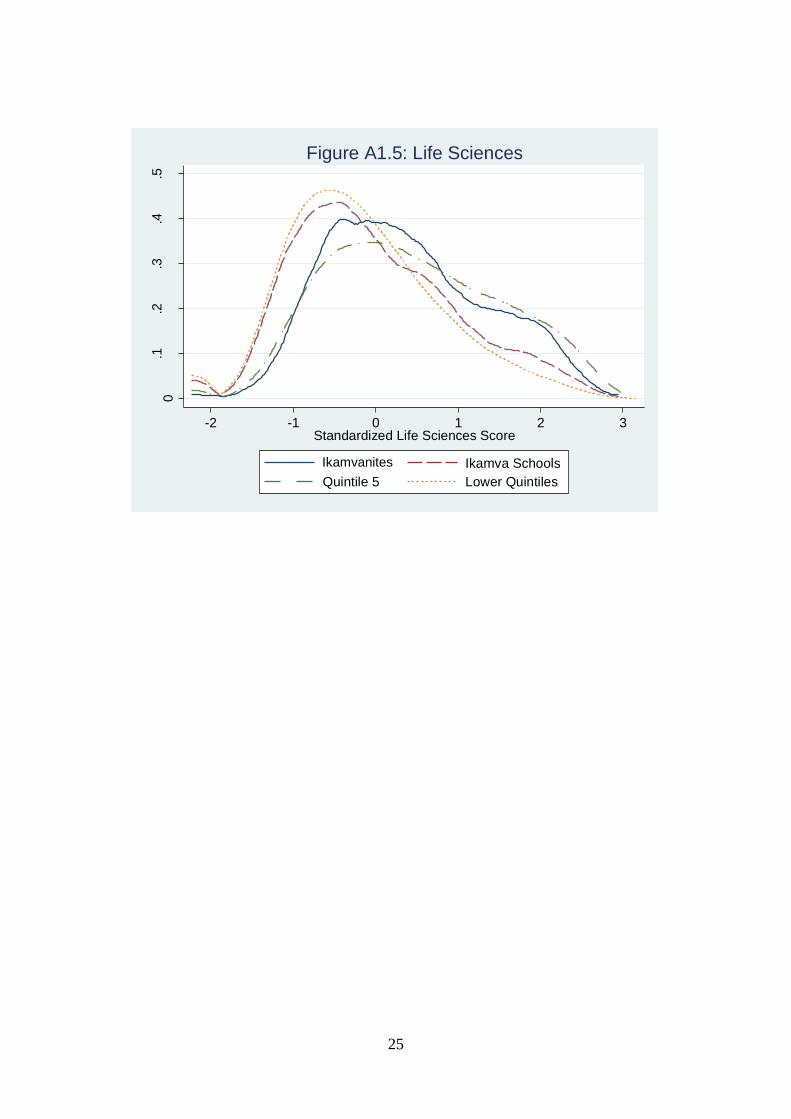
Figures A1.1 to A1.5 and figures B1.1 to B1.5 visually represent these findings, separating
out the performance of quintile five schools’ learners, learners from quintile one-to-four
schools, the Ikamvanites and their feeder schools. For Figure A1.1 to Figure A1.5, the score
distributions for Ikamvanites and their feeder schools include learners drawn from quintile
five schools, whereas those in Figure B1.1 to Figure B1.5 exclude quintile five. In all of these
figures, zero represents the average (standardized) scores for all learners – thus it is apparent
where the bulk of learners in any of these four categories lie relative to the average
performance of all learners. In some of these distributions there is a bulge at the far left of the
distribution – the area under this portion of the distribution largely reflects learners who
scored zero percent in the subject under consideration.
7
Throughout Figure A1.1 to Figure A1.5 several patterns are evident. In all instances, the
school quintile one-to-four learners are distributed towards the lowest end of the performance
spectrum, followed by the Ikamva feeder schools. Ikamvanites outperform these two groups,
but their scores remain notably to the left of quintile five schools’ learners’ scores. One
exception here is in Life Sciences, where Ikamvanites perform very similar to quintile five
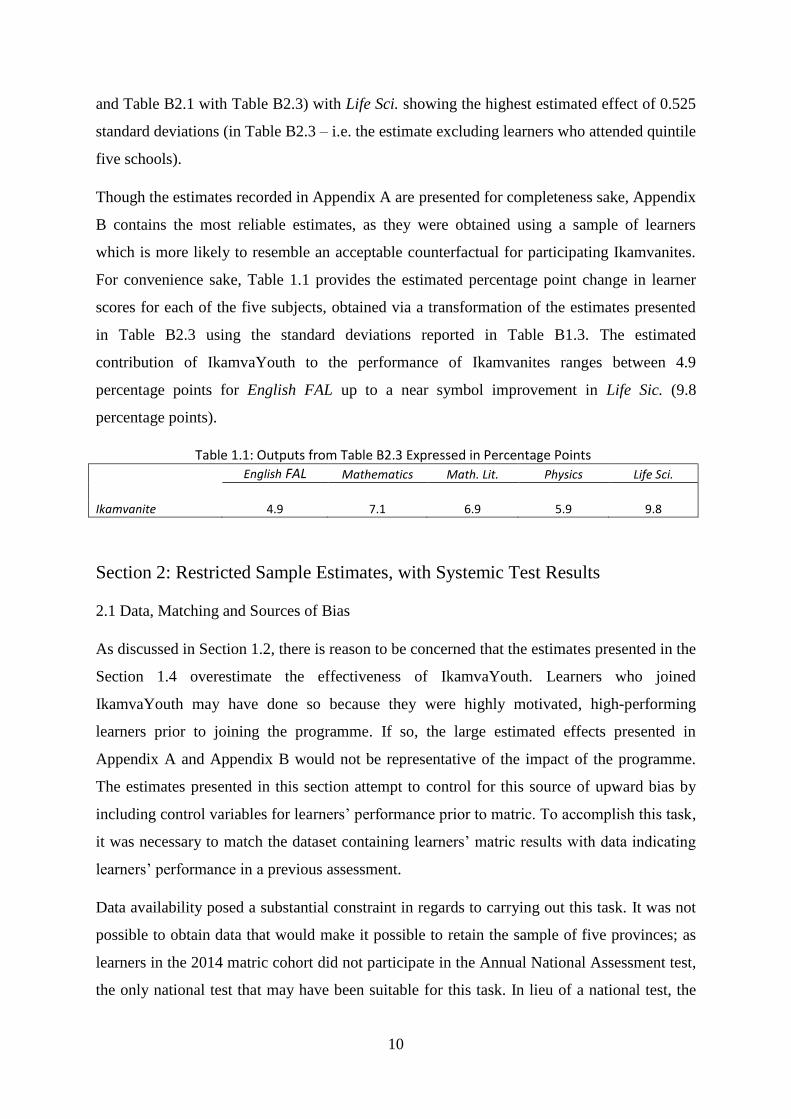
schools. Remarkably, this remains the case in Figure B1.5 (which excludes Ikamvanites
drawn from quintile five schools). Moreover, comparing the results from tables A1.1 through
A1.3 with those of tables B1.1 to B1.3, Figure B1.1 to Figure B1.5 demonstrates that
removing the learners from the top school quintile substantially lowers the performance of
Ikamva feeder schools. Comparing Figure B1.1 to Figure B1.5 with Figure A1.1 to A1.5, it is
apparent that once the quintile five learners are removed from the distribution for Ikamva
feeder schools their score distributions very closely resemble those of learners drawn from
the bottom four school quintiles. However, this exclusion produces very little (if any)
negative impact on the distributions for Ikamvanites.
1.4 Notes on Interpreting Regression Outputs
All tables which contain regression outputs are laid out as follows: Each column corresponds
to a single regression; the number listed above each column uniquely identifies that
regression. The dependent variable for each regression (be it English FAL, Mathematics, etc.)
is indicated below the number identifying the regression. The left-hand column in each table
of regression outputs lists the most important independent variables included in those
regressions1 – in almost all cases this includes Ikamvanite, but it may also include variables
such as Ikamva Schools and, in later outputs, Mathematic SYS and Language SYS (learners’
Systemic Test scores for Mathematics and their home language respectively). Numbers listed
to the right of an independent variable are the coefficient estimates for that independent
variable. Each coefficient estimate is located in the column which corresponds to the relevant
regression (and hence dependent variable).
Demonstrating the above with an example, in Table A2.1, column A2.1.5 corresponds to the
regression of Life Sci. on Ikamvanites and all of the control variables discussed in Section 1.1
(excluding Ikamva Schools). The coefficient estimate for Ikamvanite which corresponds to
the dependent variable Life Sci. is 0.464. As discussed above, a correct interpretation of this
1 All other control variables were omitted for formatting purposes – for the complete list, see page 4.
8
coefficient reads: “Participation in the IkamvaYouth programme yields an estimated
improvement in learners’ scores of 0.464 standard deviations”.2
In all regression outputs, asterisks indicate the statistical significance of the coefficient
estimate for the relevant dependent variable. As explained in the footnote attached to the
heading of Table A2.1, statistical significance at the one, five and ten percent level is
indicated with three, two or one asterisk(s) respectively. Statistical significance gives an
indication of how confident one can be that the actual size of an estimated coefficient is not
zero. Illustrating by way of an example, consider the coefficient on Ikamvanites in column
A2.1.5; one can see that this variable is significant at the one percent level – this, as explained
above, is indicated by the three asterisks next to it; one can (approximately) interpret this as
saying, “there is no more than a one percent chance that this effect size is actually zero”.
Each coefficient’s estimated standard error is reported in brackets below the relevant
coefficient estimate. The standard errors are used to estimate the statistical significance of the
reported coefficient and need not be explicitly considered for the purposes of interpretation;
they have been included for the sake of completeness and transparency. The R-squared,
which is listed for every regression, indicates the proportion of the variation in the dependent
variable which is explained by the observed variation in the independent variables included in
the regression. A high R-squared indicates that the independent variables included in the
regression explain a lot of the variation in the dependent variable. Thus, for example, the R-
squared for regression A2.1.5 indicates that the independent variables included in that
regression explain 13.8 percent of the variation in Life Sci. marks. Having fully explained the
significance of all of the components included in each table of regression outputs, attention
now turns to interpreting them.
1.5 Discussion of Initial Estimates
Overall, the estimates presented in Appendix A and Appendix B essentially corroborate the
findings described in Section 1.3. Participation in the IkamvaYouth programme is generally
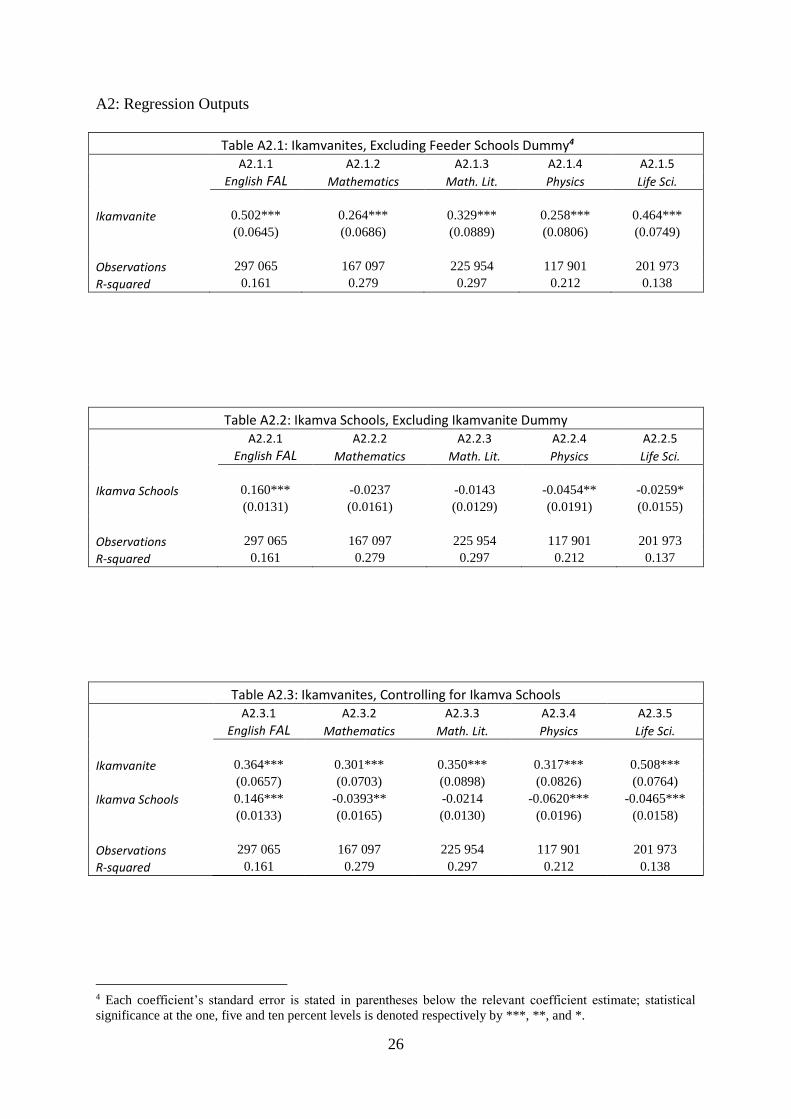
associated with substantial gains in all subjects. Table A2.1 shows estimates for returns to
2 For those results presented in this section which have not been converted to percentages, the information which should be
used to convert them is captured either under Table A1.3 and Table B1.3. As per the division of the appendixes, Table A1.3
lists standard deviations calculated using data from the performance of all learners from all five provinces, and Table B1.3
lists the same information calculated without the top quintile of learners. To convert the coefficients reported in all other
tables to percentage points, multiply the coefficient by the appropriate standard deviation. For example, the coefficient
estimate on Ikamvanite for English FAL in Table A2.1 is 0.503, and Table A1.3 indicates that English FAL has a standard
deviation of 13.75 percentage points. Thus, the estimate in Table A2.1 indicates an average expected gain for Ikamvanites of
approximately 6.9 percentage points in their scores for English FAL.
9
participation in the programme, accounting for the control variables listed in Section 1 but
excluding the variable Ikamva Schools; estimated gains range from between 0.258 standard
deviations for Physics and 0.502 standard deviations for English FAL. These gains are
remarkably large. To put the magnitude of these estimates in context, Spaull and Kotzé
(2015:20) note that a 0.30 standard deviation change in the Mathematics scores of South
African primary school learners is considered approximately equal to one year’s worth of
learning. Note that these initial estimates are slightly smaller if the top school quintile
learners are removed from the sample (see Table B2.1), but remain substantial (with a high of
0.502 for English FAL and a low of 0.264 for Mathematics).
As discussed in Section 1.3, there is some indication that Ikamva feeder schools generally
outperform other lower-quintile schools in terms of their scores in English FAL. In Table
A2.2 and B2.2, each of the five subjects is regressed on the battery of control variables listed
in Section 1.1 and the variable Ikamva Schools. Note that Ikamvanite has been omitted from
these regressions; the intent here is to make the differences between Ikamva feeder schools
and other schools as apparent as possible. In this regard, Table A2.2 and B2.2 clearly indicate
that Ikamva feeder schools tend to outperform other schools in terms of their English FAL
scores. Table A2.2 also indicates that these Ikamva feeder schools tend to underperform
relative to other schools in Physics and Life Sci., though these differences are not statistically
significant if the upper quintile of learners is removed (Table B2.2). In contrast with the
estimates for other subjects, the markedly strong performance of Ikamva feeder school
learners in English FAL is conspicuous. As was noted earlier, it is probably a product of
location of these schools in or near urban centres, which could not be explicitly controlled for
in any of the regressions considered here due to data constraints.
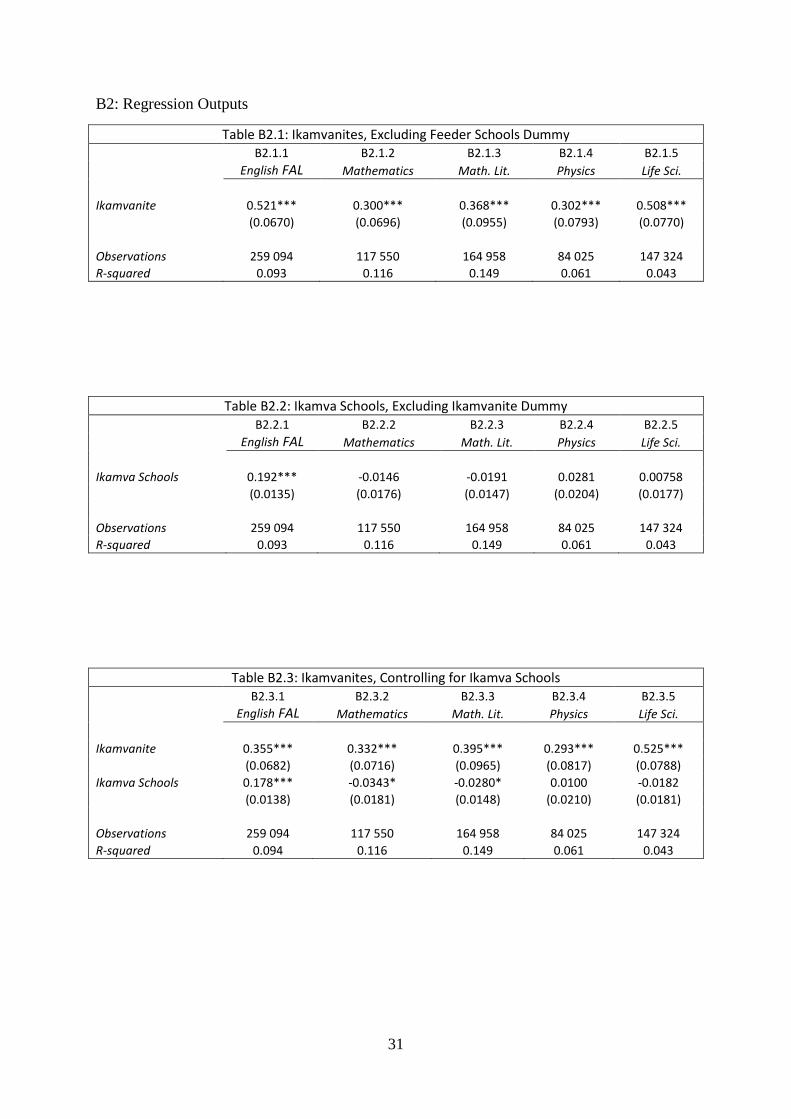
Table A2.3 and Table B2.3 present estimates of the performance of Ikamvanites, accounting
for the average performance of their feeder schools. As can be seen in these tables,
controlling for Ikamva Schools substantially reduces the estimated impact of the
IkamvaYouth programme on learners’ performance in English FAL, but the estimated effect
is still large (0.364 standard deviations in Table A2.3 or 0.355 in Table B2.3). Other than this
downward adjustment, only one other estimated effect is reduced when Ikamva Schools are
included in the regressions: the coefficient for Physics, which now exhibits the lowest
estimated effect, is revised downward from 0.302 standard deviations in Table B2.1 to a still-
substantial 0.293 standard deviations in Table B2.3. All other coefficients increase if this
additional control variable is added in the estimates (compare Table A2.1 with Table A2.3,
10
and Table B2.1 with Table B2.3) with Life Sci. showing the highest estimated effect of 0.525
standard deviations (in Table B2.3 – i.e. the estimate excluding learners who attended quintile
five schools).
Though the estimates recorded in Appendix A are presented for completeness sake, Appendix
B contains the most reliable estimates, as they were obtained using a sample of learners
which is more likely to resemble an acceptable counterfactual for participating Ikamvanites.
For convenience sake, Table 1.1 provides the estimated percentage point change in learner
scores for each of the five subjects, obtained via a transformation of the estimates presented
in Table B2.3 using the standard deviations reported in Table B1.3. The estimated
contribution of IkamvaYouth to the performance of Ikamvanites ranges between 4.9
percentage points for English FAL up to a near symbol improvement in Life Sic. (9.8
percentage points).
Table 1.1: Outputs from Table B2.3 Expressed in Percentage Points
English FAL Mathematics Math. Lit. Physics Life Sci.
Ikamvanite 4.9 7.1 6.9 5.9 9.8
Section 2: Restricted Sample Estimates, with Systemic Test Results
2.1 Data, Matching and Sources of Bias
As discussed in Section 1.2, there is reason to be concerned that the estimates presented in the
Section 1.4 overestimate the effectiveness of IkamvaYouth. Learners who joined
IkamvaYouth may have done so because they were highly motivated, high-performing
learners prior to joining the programme. If so, the large estimated effects presented in
Appendix A and Appendix B would not be representative of the impact of the programme.
The estimates presented in this section attempt to control for this source of upward bias by
including control variables for learners’ performance prior to matric. To accomplish this task,
it was necessary to match the dataset containing learners’ matric results with data indicating
learners’ performance in a previous assessment.
Data availability posed a substantial constraint in regards to carrying out this task. It was not
possible to obtain data that would make it possible to retain the sample of five provinces; as
learners in the 2014 matric cohort did not participate in the Annual National Assessment test,
the only national test that may have been suitable for this task. In lieu of a national test, the
11
2011 Western Cape Systemic Test written in grade 9 was the only dataset available to match
with the sample of 2014 matriculants, thus the next part of the analysis relates to this
province only. Matching was conducted using learners’ first name, surname, date of birth and
gender.
Matching the 2014 matric cohort with the 2011 Systemic results reduced the sample in two
respects. Firstly, the provincial nature of the Systemic Test restricted the sample to the 48 827
matriculants in the Western Cape sub-sample of 2014 matriculants. The sample was reduced
even further in the matching process, as only those who could be matched with their 2011
Systemic Test results could be included in the final dataset of matched learners. This
restriction reduced the total sub-sample of Western Cape matriculants from 48 827 learners to
30 258 learners, and reduced the total sample of Western Cape Ikamvanite matriculants from
65 learners to a mere 38 learners (which drops further to 35 learners if quintile five schools’
learners are excluded).
Several issues arise from the restrictions imposed by the matching process. Firstly, the small
sample of remaining Ikamvanites makes it unlikely that a statistically significant result will
be found regardless of the effectiveness of the programme. This follows from the inverse
relationship between sample size and estimation accuracy (standard errors) of coefficient
estimates. With such a small sample, even a large actual effect will be inaccurately estimated
and will thus probably be statistically insignificant. As discussed below, finding that even a
few of these estimates are statistically significant under these stringent conditions is an
immensely positive result.
In addition to reducing the accuracy of the estimates, restricting the sample as was done here
has likely introduced sample selection issues which will bias estimates downward. Issues of
sample selection arise when a sample is non-randomly selected. If selection is non-random,
as it is here, the learners who remain in the sample may not resemble a good counterfactual
for the performance of Ikamvanites had they been non-participants, even after account for
available control variables.
There are at least three ways in which the matching process might have induced sample
selection bias into the estimates. Firstly, given that the Western Cape branches of
IkamvaYouth are the founding and most well-established branches of the programme, basing
the estimates of the effectiveness of IkamvaYouth solely on the performance of its Western
Cape learners could induce an upward bias in the estimates. However, available data
12
indicates that there is no such bias. Firstly, compare the average performance of Western
Cape Ikamvanites (Table C1.1 or Table D1.1) with the average performance of the full 2014
sample of Ikamvanites (Table A1.1 or Table B1.1). In all five subjects, and for both the
sample including and excluding quintile five schools’ learners, the average scores of the
Western Cape Ikamvanites are lower than the average scores for all Ikamvanites. This is the
opposite of what one would expect to find if the Western Cape IkamvaYouth branches were
more effective than those in other provinces. Furthermore, as will be shown shortly, a
comparison of estimates of the effectiveness of the programme obtained for the restricted and
unrestricted sample of Western Cape learners suggests that this potential source of upward
bias is probably less important than two other sources of downward bias.
The second source of sample selection bias also follows from the restriction of these
estimates to Western Cape learners, but here this restriction will bias estimates downward.
The Western Cape is generally a very high SES province, but IkamvaYouth focus specifically
on uplifting learners from low SES backgrounds. On account of the Western Cape’s
demographics, it is likely that many of the non-participants included in the sample are bad
counterfactuals. They may look similar to Ikamvanites in terms of the available data, but they
may differ vastly in terms of omitted variables – specifically learners’ SES – in a manner that
will induce a downward bias in the estimates. While it cannot be certain that this source of
bias is present in the estimates, the Western Cape is clearly the province in which this is most
likely to occur and thus one should be aware of this possibility. This issue can however be
addressed to a reasonable extent by simply omitting quintile five schools’ learners. Hence the
practice followed in Section 1 is repeated wherein each estimate is run twice, once including
quintile five schools’ learners (captured under Appendix C) and once omitting them (captured
under Appendix D).
An important and less readily solvable third source of downward bias inherent to the matched
sample follows from the fact that learners who could be matched with their 2011 Systemic
Test results probably differ systematically from many of the learners who could not be
matched. The argument supporting this claim runs as follows:
1. Approximately forty percent of the Western Cape’s 2014 cohort of matriculants could
not be matched with their 2011 Systemic Test results, and were thus omitted from the
reduced sample.
13
2. Learners could only be matched with their Systemic Test results if they were in grade
9 in 2011 and were in matric in 2014. Thus, any learner who repeated a year between
grade 9 and matric could not have been matched. Given the high proportion of South
African learners who fail a year between grade 9 and matric, it is likely that most of
the 2014 matriculants who were not matched could not be matched because they
repeated at least one year between grade 9 and matric.
3. Given point 2, it follows that learners who were matched with their 2011 Systemic
Test results differ from those learners who were not matched. These differences are of
particular interest to us for matched learners who did not perform well in the Systemic
Test. Specifically, learners who performed poorly in the 2011 Systemic Test but
nevertheless reached matric by 2014 might tend to be more highly motivated on
average than their similarly low-scoring unmatched peers. Alternatively, their success
might be attributable to higher-than-average innate ability, or to assistance from
private tutors or some intervention programme received after grade 9. Whatever the
explanation, given the structure of the matching process one would expect matched
learners to differ from unmatched learners in respects that are positively related to
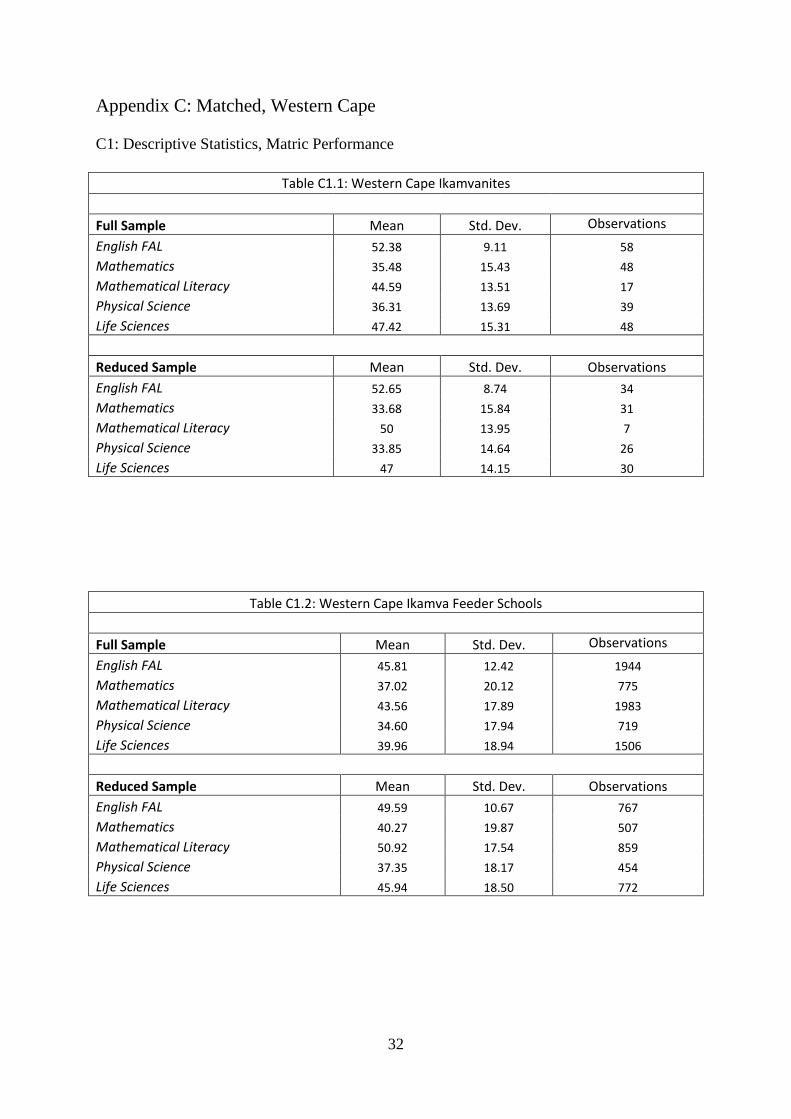
greater academic success. These claims are substantiated by Table C1.2, C1.3, D1.2
and D1.3, where Tables C1.2 and C1.3 show the mean performance of both the
matched (restricted) and unmatched (unrestricted) samples of Western Cape Ikamva
feeder school learners (C1.2) and the entire sample of Western Cape learners (C1.3)
for all five subjects (D1.2 and D1.3 are similarly constructed, but they omit all
learners who reportedly attended a quintile five school). In all four tables and in every
one of the five matric subject therein, the average scores for the restricted (matched)
sample of learners are substantially higher than those of the unrestricted (unmatched)
sample of learners, both for Ikamva feeder schools and for the entire 2014 Western
Cape cohort of matriculants. (The average score of those learners who were not
matched must thus be even lower than the average score for all learners in each
subject.)
4. Following the argument made under points 2 and 3, matched learners that participated
in the IkamvaYouth programme (point 2) must have written the Systemic Test in
2011 and proceeded to grade 12 by 2014, but (point 3) they may not have managed to
do so if they had not participated in the programme.
5. However, these Ikamvanites are being compared with learners who were able to pass
each subsequent year without the assistance offered by IkamvaYouth, possibly
14
because many of them were in fact very motivated or able learners, or because they
had access to other channels of assistance or resources (point 3).
6. Thus it is likely that the impact of IkamvaYouth is understated by estimates which
control for learners’ Systemic Test results. Ikamvanites did not perform well in the
2011 Systemic Test: Table C2.1 show that they averaged 42.31 percent for the
language test segment and 21.40 percent for the numerical test segment, both of
which are well below their feeder schools’ average scores and even further below the
matched learners’ provincial averages; Table D2.1, which excludes quintile five
schools, shows that Ikamvanites achieved an average in both segments that is nearly
identical to that of their feeder schools (41.3 for language, 20.9 for numeracy), and
which remains below the matched learners’ provincial average. As discussed, other
low-scoring matched learners may on average owe some of their success to factors
(motivation, ability, home SES, external assistance, etc.) that the Ikamvanites do not
have access to. Thus, other low-scoring learners may be a bad counterfactual for
Ikamvanites scores had they been non-participants – controlling for the Systemic Test
results in this restricted sample may thus cause the estimates to be biased downward.
As a last point regarding sources of downward bias, it is also worth noting that subject
choices may introduce further issues of sample selection which may be present no matter
which sample is estimated on. IkamvaYouth encourages its learners to take Mathematics and
Physical Science – these are difficult subjects and Ikamvanites may not have decided to
attempt them had it not been for the prompting of IkamvaYouth. However, other learners
who decided to take these subjects also did so in a non-random manner. Their decision to
take any one of these two subjects was likely derived from their beliefs about their own
capacities, their goals, and possibly by prompting on the part of their parents. Note that there
is evidence of this hypothesis in the data: the gap between the average scores for matched
learners and the full sample of learners for Mathematics and Physics is, as can be seen in
Table C1.3 and Table D1.3, smaller than the gaps between these groups for all other subjects.
Moreover, the proportion of learners who were matched is highest (by a substantial margin)
for Mathematics and Physics, even when the upper quintile of learners is excluded (see Table
C1.3 and Table D1.3 – this information can be ascertained from the number of observations
listed for each subject). Those who selected into these subjects thus appear to be more
capable of passing lower grades than learners who did not enrol in one of these two (more
difficult) subjects. As discussed prior, self-selection of this sort would introduce a systematic
15
difference between the Ikamvanites and the learners they are compared with, which would in
this instance cause an underestimate of the effectiveness of the programme.
In addition to the arguments and anecdotal evidence discussed above, it is actually possible to
observe the downward-biasing impact of these factors. To see this, refer firstly to Appendix
C section C3 and Appendix D section D3. These sections each contain five tables, where
each table corresponds to one of the five subjects considered in this evaluation. The first
column in each of these tables shows estimates of the returns to participation in the
programme in each of the five subjects for the restricted sample of learners, without
controlling for learners’ past performance. Barring the coefficient estimate in Table D3.5
(Life Sci., excluding quintile five schools) none of these estimates are statistically significant,
and all of the estimates are smaller than those obtained for the entire sample of 2014
matriculants.3 The estimate for Physics (in Table C3.4 and Table D3.4) has even become
negative. Note furthermore that the third columns of each of these tables show that similar
results are observed when Ikamva Schools is added to these regressions. What is important to
note here is that these estimates do not control for learners’ past performance; in other words,
these small and statistically insignificant coefficients reported in the first column of each of
these tables are not a result of accounting for learners’ motivation.
Now refer to Appendix E (includes quintile five schools) and Appendix F (excludes quintile
five schools). Appendix E and Appendix F also both contain five tables (Table E1.1 to Table
E1.5 and Table F1.1 to Table F1.5) each of which corresponds to one of the five subjects
included in this evaluation. Each of these tables contain two sets of two coefficient estimates
for Ikamvanite. These sets divide estimates which do not control for Ikamva Schools (the first
two columns of each table) from those that do control for Ikamva Schools (the last two
columns in each table). The left-hand column in each set is the estimate obtained using the
unmatched Western Cape sample of 2014 matriculants, and the right-hand column simply re-
reports the corresponding restricted sample estimates presented in either the first or third
column Table C3.1 to Table C3.5 and Table D3.1 to Table D3.5.
Simply stated, the tables in Appendix E and Appendix F allow a comparison of the estimates
just discussed (which were obtained from the restricted or matched sample of Western Cape
learners) with estimates obtained for the full sample of Western Cape learners. Comparison
3 With the unreliable exception of the coefficient estimate for Math. Lit. in Table C3.3 and Table D3.3, which,
given the very small sample of seven learners used to estimate this coefficient, is suspiciously large and
significant.
16
shows that in all instances (again barring Math. Lit.) the restricted sample coefficient
estimates for Ikamvanite lie well below the unrestricted sample estimates. Note once again
that these differences are not as a result of controlling for learners’ motivation – none of these
regressions contain control variables for learners’ Systemic Test performance. Rather, this
observed drop in the coefficient estimates is the product of the downward-biasing sample
selection issues discussed above.
In sum, the estimates discussed here should be interpreted in light of the small sample of
participants they are based on, as well as the prevalence of downward bias introduced by the
issues of sample selection.
2.2 A ‘Lower-Bound’ Estimate of the Effectiveness of IkamvaYouth
Keeping in mind that the issues of sample selection bias discussed above have not been
resolved, the estimates of the effectiveness of the programme obtained with control variables
for learners’ past performance are now discussed. Referring again to Table C3.1 to Table
C3.5 and Table D3.1 to Table D3.5, the second columns of these tables show the estimated
impact of participation in the programme controlling for learners’ language and numeracy
scores for the 2011 Systemic Test. In all instances (barring the effect for English FAL, which
decreases, and Life Sci., which remains constant), controlling for learners’ past performance
increases the estimated returns to participation in the programme. This result is particularly
interesting in that the rationale behind including control variables for learners’ past
performance was to prevent upward bias in the estimates of the effectiveness of the
IkamvaYouth programme. The increase in the estimated effectiveness of the programme
stemming from the addition of controls for learners’ prior performance again implies that the
estimates presented in column one of these ten tables are subject to substantial downward
bias, to an extent that far outweighs any upward bias stemming from exceptional motivation
or ability on the part of Ikamvanites.
Furthermore, with the inclusion of controls for learners’ prior performance the estimate for
Ikamvanites’ scores in English FAL is now significant at a ten percent level (in Table C3.1
and Table D3.1), and the estimates for Ikamvanites’ scores in Math. Lit. and Life Sci. are
significant at a five percent level of statistical significance (Tables C3.3, D3.3, C3.5 and
D3.5). These findings are impressive, especially considering that, of the Ikamvanites captured
in this dataset, only 34 Ikamvanites wrote English FAL and 34 wrote Life Sciences.
Furthermore, only seven Ikamvanites wrote Mathematical Literacy, but this result seems too
17
good to be true. The large estimated impacts on Math. Lit. recorded in Table C3.3 and Table
D3.3 may for instance be a product of Ikamvanites dropping from Mathematics to
Mathematical Literacy, in which case it may not be fair to attribute these learners’ success to
the programme. Nevertheless, the increased magnitude and improved statistical significance
of these estimates, observed with the addition of controls for learners’ prior performance, are
encouraging indicators of the effectiveness of the programme.
Lastly, estimates presented in the fourth column of Table C3.1 to Table C3.5 and Table D3.1
to Table D3.5 include Ikamva Schools to control for the overall performance of schools
attended by Ikamvanites. Here, all of the estimates other than those for Life Sci. in Table D3.5
and for Math. Lit. in Table C3.3 and D3.3 lose their statistical significance. Furthermore,
barring the estimate for Physics in Table C3.4, for Mathematics in Table D3.2, and for Life
Sci. in Table D3.5, the magnitudes of all estimates diminish in size.
This development seems discouraging, but is actually a result of several explicable technical
factors. As regards the loss of statistical significance, the statistical significance of an
estimate is partly determined by (and negatively related to) the correlation between the
independent variables included in the model. As the correlation between these independent
variables increases, the statistical significance of these variables decrease, regardless of the
true magnitude of the impact of the programme on these variables. Ikamva Schools is
correlated with Ikamvanite by construction (with a correlation coefficient of 0.1564), and
thus, also by construction, including Ikamva Schools decreases the accuracy of the estimated
impact of the programme.
It is also worth noting that because these variables are correlated by construction – in that the
performance of Ikamvanites is partially responsible for the performance of the schools where
they are enrolled – controlling for the overall performance of Ikamvanites’ schools will
induce additional downward bias in the estimates of the effectiveness of the programme. In
illustration of the consequences of this induced correlation, it is worth discussing the
differences between the effect that this control variable has on the estimated impact of the
programme in terms of Ikamvanites’ scores in Physics (as recorded in Table C3.4; note that
this argument applies equally for Mathematics in Table D3.2 and Life Sci. in Table D3.5)
compared with that implied by estimates obtained from their scores in other subjects. For the
estimates included in Appendix C, Physical Sciences is the only subject wherein the
estimated impact of the programme increases (it in fact doubles) when one includes Ikamva
18
Schools. One can also see (in column C3.4.4) that in the regressions of Physics on
Ikamvanites and Ikamva Schools, Ikamva Schools was found to have an overall negative
correlation with learners’ performance. Thus, for the estimates on Physics in Table C3.4, the
positive correlation between Ikamvanite and Ikamva Schools would bias the coefficient on
Ikamvanite downward if Ikamva Schools is omitted. For all other estimates in Appendix C,
correlation between Ikamva Schools and the respective subject is positive (1), and correlation
between Ikamvanite and Ikamva Schools is, as always, positive by construction (2). From (1)
and (2), it follows that the inclusion of Ikamva Schools will, by construction, lead to at least
some degree of downward bias in the estimated impact of the programme, but it may also
control for upward bias stemming from uncontrolled-for school-wide differences in learners’
performance between feeder schools and non-feeder schools. In Appendix C, for all subjects
other than Physical Sciences, the change in the estimated impact of the programme induced
by the inclusion of Ikamva Schools is negative, as hypothesised, but is quite small (perhaps
barring the effect observed for Life Sciences in Table C3.5). It is possible then that for these
subjects the variable Ikamva Schools may induce more bias than it reduces, and it may thus
be more sensible to omit this variable in these estimates. Note of course that this argument
applies equally well to the estimates reported in Appendix D.
Finishing off this section, the magnitude of the coefficient estimates reported here is
considered. Focusing on the outputs recorded in Table D3.1 to Table D3.5 (which as
discussed above are deemed more reliable for omitting learners who attended quintile five
schools), the coefficient estimates presented here are smaller than the comparable full sample
estimates reported under Table B3.3 (disregarding the estimated effect for Math. Lit. in Table
D3.3). They are also statistically insignificant, but as discussed above, this simply reflects the
small number of observations included in the estimates. What is important to note here is
that, barring the estimate for Physics, the magnitudes of these estimates are still quite large.
This is in spite of the numerous reasons why these estimates are likely to under-state the
effectiveness of the programme.
Finally, for convenience, the estimates presented in column four of Table D3.1 to Table D3.5
are presented in Table 2.1, expressed in percentage points. As can be seen here, these
numbers are not trivial, especially in Life Sci. and even in Mathematics. Moreover, even
smaller magnitudes should not be regarded as a negative finding. On account of the numerous
sources of downward bias discussed above, and given that by controlling for learners’ prior
performance the most important possible source of upward bias has been corrected for, these
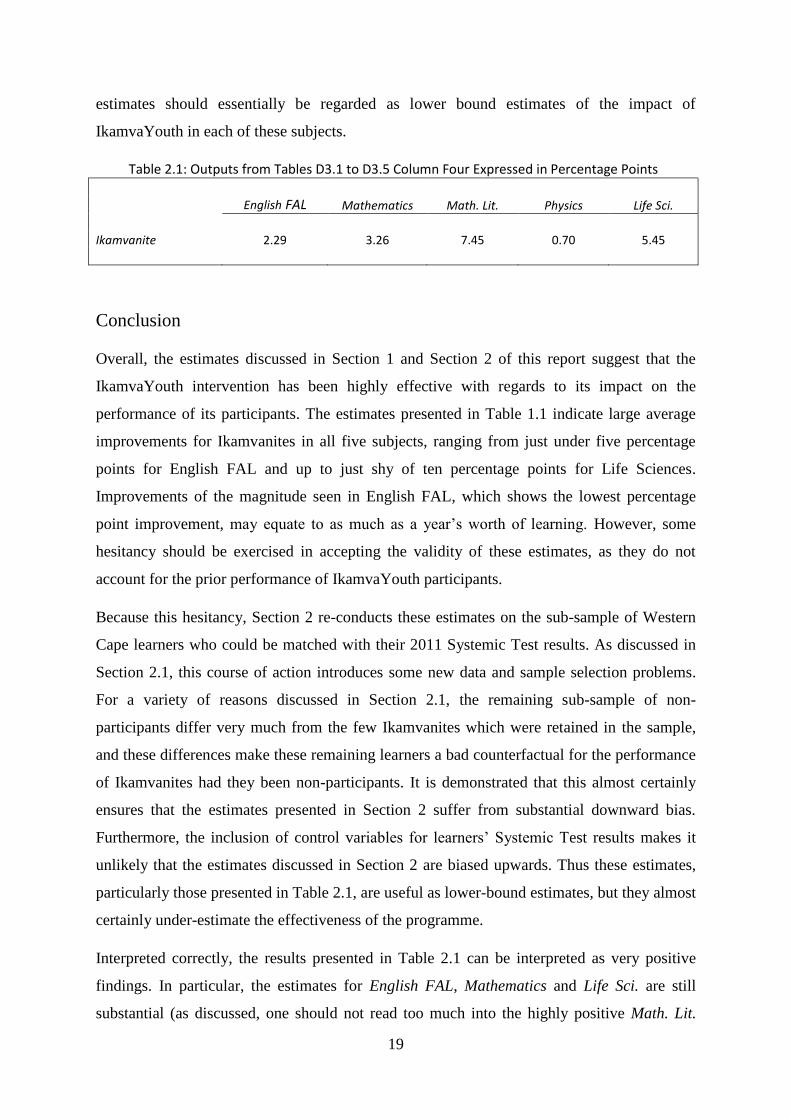
19
estimates should essentially be regarded as lower bound estimates of the impact of
IkamvaYouth in each of these subjects.
Table 2.1: Outputs from Tables D3.1 to D3.5 Column Four Expressed in Percentage Points
English FAL Mathematics Math. Lit. Physics Life Sci.
Ikamvanite 2.29 3.26 7.45 0.70 5.45
Conclusion
Overall, the estimates discussed in Section 1 and Section 2 of this report suggest that the
IkamvaYouth intervention has been highly effective with regards to its impact on the
performance of its participants. The estimates presented in Table 1.1 indicate large average
improvements for Ikamvanites in all five subjects, ranging from just under five percentage
points for English FAL and up to just shy of ten percentage points for Life Sciences.
Improvements of the magnitude seen in English FAL, which shows the lowest percentage
point improvement, may equate to as much as a year’s worth of learning. However, some
hesitancy should be exercised in accepting the validity of these estimates, as they do not
account for the prior performance of IkamvaYouth participants.
Because this hesitancy, Section 2 re-conducts these estimates on the sub-sample of Western
Cape learners who could be matched with their 2011 Systemic Test results. As discussed in
Section 2.1, this course of action introduces some new data and sample selection problems.
For a variety of reasons discussed in Section 2.1, the remaining sub-sample of non-
participants differ very much from the few Ikamvanites which were retained in the sample,
and these differences make these remaining learners a bad counterfactual for the performance
of Ikamvanites had they been non-participants. It is demonstrated that this almost certainly
ensures that the estimates presented in Section 2 suffer from substantial downward bias.
Furthermore, the inclusion of control variables for learners’ Systemic Test results makes it
unlikely that the estimates discussed in Section 2 are biased upwards. Thus these estimates,
particularly those presented in Table 2.1, are useful as lower-bound estimates, but they almost
certainly under-estimate the effectiveness of the programme.
Interpreted correctly, the results presented in Table 2.1 can be interpreted as very positive
findings. In particular, the estimates for English FAL, Mathematics and Life Sci. are still
substantial (as discussed, one should not read too much into the highly positive Math. Lit.
20
estimate). Only Physics shows no impact from participation in the programme; as discussed,
this is probably a reflection of additional sources of bias (stemming from issues of self-
selection) that may afflict the estimated for Mathematics and Physical Sciences. Thus,
overall, the findings suggest that IkamvaYouth does indeed add substantially to the
performance of its learners, helping them to succeed against the odds.
21
References
Department of Basic Education and Training. 2015. National Senior Certificate Results,
2014. Pretoria: Department of Basic Education.
Spaull, N. & Kotzé, J. 2015. Starting Behind and Staying Behind in South Africa: The Case
of Insurmountable Learning Deficits in Mathematics. International Journal of Educational
Development, 41(March):13-14.
Spaull, N. 2013. Poverty & privilege: Primary school inequality in South Africa.
International Journal of Educational Development, 33(2013):436-447.
Spaull, N., Burger, R., Burger, C., Van der Berg, S., Van Wyk, C. & Dzivakwi, R. 2012.
Against the odds: An evaluation of the IkamvaYouth programme. Department of Economics,
Stellenbosch University.
Western Cape Education Department. 2012. Western Cape Systemic Test Results, 2011.
Cape Town: Western Cape Education Department.
22
Appendix A: Unmatched, All Provinces
A1: Descriptive Statistics
Table A1.1: Ikamvanites 2014 Matric Results
Mean Std. Dev. Observations
English FAL 55.62 10.56 202
Mathematics 37.40 19.03 154
Mathematical Literacy 46.89 13.19 89
Physical Science 38.66 17.36 122
Life Sciences 48.37 17.87 154
Table A1.2: Ikamva Feeder Schools (Excluding Ikamvanites) 2014 Matric Results
Mean Std. Dev. Observations
English FAL 50.26 13.11 5074
Mathematics 32.53 20.38 2757
Mathematical Literacy 43.34 16.93 4425
Physical Science 34.68 17.46 2173
Life Sciences 40.67 18.37 3643
Table A1.3: All Learners 2014 Matric Results
Mean Std. Dev. Observations
English FAL 48.45 13.75 297 065
Mathematics 33.09 21.36 167 098
Mathematical Literacy 44.31 17.36 225 954
Physical Science 36.43 19.06 117 902
Life Sciences 41.39 18.58 201 973
23
Figure A1.1: English Figure A1.2: Mathematics
Figure A1.3: Mathematical Literacy
0.2
.4.6
De
nsity
-4 -2 0 2 4Standardized English Score
Ikamvaites Ikamva Schools
Quintile 5 Lower Quintiles
Figure A1.1: English
0.1
.2.3
.4.5
De
nsity
-2 -1 0 1 2 3Standardized Mathematics Score
Ikamvaites Ikamva Schools
Quintile 5 Lower Quintiles
Figure A1.2: Mathematics
Ikamvanites
Ikamvanites
24
Figure A1.4: Physical Sciences Figure A1.5: Life Sciences
0.1
.2.3
.4.5
De
nsity
-4 -2 0 2 4Standardized Mathematical Literacy Score
Ikamvaites Ikamva Schools
Quintile 5 Lower Quintiles
Figure A1.3: Mathematical Literacy0
.2.4
.6
De
nsity
-2 0 2 4Standardized Physical Sciences Score
Ikamvaites Ikamva Schools
Quintile 5 Lower Quintiles
Figure A1.4: Physical Sciences
Ikamvanites
Ikamvanites
25
0.1
.2.3
.4.5
De
nsity
-2 -1 0 1 2 3Standardized Life Sciences Score
Ikamvaites Ikamva Schools
Quintile 5 Lower Quintiles
Figure A1.5: Life Sciences
Ikamvanites
26
A2: Regression Outputs
Table A2.1: Ikamvanites, Excluding Feeder Schools Dummy4 A2.1.1 A2.1.2 A2.1.3 A2.1.4 A2.1.5
English FAL Mathematics Math. Lit. Physics Life Sci.
Ikamvanite 0.502*** 0.264*** 0.329*** 0.258*** 0.464***
(0.0645) (0.0686) (0.0889) (0.0806) (0.0749)
Observations 297 065 167 097 225 954 117 901 201 973
R-squared 0.161 0.279 0.297 0.212 0.138
Table A2.2: Ikamva Schools, Excluding Ikamvanite Dummy A2.2.1 A2.2.2 A2.2.3 A2.2.4 A2.2.5
English FAL Mathematics Math. Lit. Physics Life Sci.
Ikamva Schools 0.160*** -0.0237 -0.0143 -0.0454** -0.0259*
(0.0131) (0.0161) (0.0129) (0.0191) (0.0155)
Observations 297 065 167 097 225 954 117 901 201 973
R-squared 0.161 0.279 0.297 0.212 0.137
Table A2.3: Ikamvanites, Controlling for Ikamva Schools A2.3.1 A2.3.2 A2.3.3 A2.3.4 A2.3.5
English FAL Mathematics Math. Lit. Physics Life Sci.
Ikamvanite 0.364*** 0.301*** 0.350*** 0.317*** 0.508***
(0.0657) (0.0703) (0.0898) (0.0826) (0.0764)
Ikamva Schools 0.146*** -0.0393** -0.0214 -0.0620*** -0.0465***
(0.0133) (0.0165) (0.0130) (0.0196) (0.0158)
Observations 297 065 167 097 225 954 117 901 201 973
R-squared 0.161 0.279 0.297 0.212 0.138
4 Each coefficient’s standard error is stated in parentheses below the relevant coefficient estimate; statistical
significance at the one, five and ten percent levels is denoted respectively by ***, **, and *.
27
Appendix B: Unmatched, All Provinces, Excluding Quintile 5
B1: Descriptive Statistics
Table B1.1: Ikamvanites 2014 Matric Results
Mean Std. Dev. Observations
English FAL 55.52 10.84 186
Mathematics 37.53 19.40 139
Mathematical Literacy 46.65 13.53 74
Physical Science 38.53 17.48 112
Life Sciences 48.15 18.10 138
Table B1.2: Ikamva Feeder Schools (Excluding Ikamvanites) 2014 Matric Results
Mean Std. Dev. Observations
English FAL 50.17 13.11 4910
Mathematics 29.42 19.37 2255
Mathematical Literacy 39.38 15.00 3489
Physical Science 32.99 16.69 1768
Life Sciences 38.18 17.75 2795
Table B1.3: All Learners 2014 Matric Results
Mean Std. Dev. Observations
English FAL 47.37 13.28 268196
Mathematics 28.90 19.36 128336
Mathematical Literacy 41.12 15.97 177557
Physical Science 33.14 17.20 91732
Life Sciences 39.13 17.61 159347
28
Figure B1.1: English Figure B1.2: Mathematics
0.2
.4.6
De
nsity
-4 -2 0 2 4Standardized English Score
Ikamvaites Ikamva Schools
Quintile 5 Lower Quintiles
Figure B1.1: English0
.1.2
.3.4
.5
De
nsity
-2 -1 0 1 2 3Standardized Mathematics Score
Ikamvaites Ikamva Schools
Quintile 5 Lower Quintiles
Figure B1.2: Mathematics
Ikamvanites
Ikamvanites
29
Figure B1.3: Mathematical Literacy Figure B1.4: Physical Sciences
0.1
.2.3
.4.5
De
nsity
-4 -2 0 2 4Standardized Mathematical Literacy Score
Ikamvaites Ikamva Schools
Quintile 5 Lower Quintiles
Figure B1.3: Mathematical Literacy0
.2.4
.6
De
nsity
-2 0 2 4Standardized Physical Science Score
Ikamvaites Ikamva Schools
Quintile 5 Lower Quintiles
Figure B1.4: Physical Sciences
Ikamvanites
Ikamvanites
30
Figure B1.5: Life Sciences
0.1
.2.3
.4.5
De
nsity
-2 -1 0 1 2 3Standardized Life Science Score
Ikamvaites Ikamva Schools
Quintile 5 Lower Quintiles
Figure B1.5: Life Sciences
Ikamvanites
31
B2: Regression Outputs
Table B2.1: Ikamvanites, Excluding Feeder Schools Dummy B2.1.1 B2.1.2 B2.1.3 B2.1.4 B2.1.5
English FAL Mathematics Math. Lit. Physics Life Sci.
Ikamvanite 0.521*** 0.300*** 0.368*** 0.302*** 0.508***
(0.0670) (0.0696) (0.0955) (0.0793) (0.0770)
Observations 259 094 117 550 164 958 84 025 147 324
R-squared 0.093 0.116 0.149 0.061 0.043
Table B2.2: Ikamva Schools, Excluding Ikamvanite Dummy B2.2.1 B2.2.2 B2.2.3 B2.2.4 B2.2.5
English FAL Mathematics Math. Lit. Physics Life Sci.
Ikamva Schools 0.192*** -0.0146 -0.0191 0.0281 0.00758
(0.0135) (0.0176) (0.0147) (0.0204) (0.0177)
Observations 259 094 117 550 164 958 84 025 147 324
R-squared 0.093 0.116 0.149 0.061 0.043
Table B2.3: Ikamvanites, Controlling for Ikamva Schools B2.3.1 B2.3.2 B2.3.3 B2.3.4 B2.3.5
English FAL Mathematics Math. Lit. Physics Life Sci.
Ikamvanite 0.355*** 0.332*** 0.395*** 0.293*** 0.525***
(0.0682) (0.0716) (0.0965) (0.0817) (0.0788)
Ikamva Schools 0.178*** -0.0343* -0.0280* 0.0100 -0.0182
(0.0138) (0.0181) (0.0148) (0.0210) (0.0181)
Observations 259 094 117 550 164 958 84 025 147 324
R-squared 0.094 0.116 0.149 0.061 0.043
32
Appendix C: Matched, Western Cape
C1: Descriptive Statistics, Matric Performance
Table C1.1: Western Cape Ikamvanites
Full Sample Mean Std. Dev. Observations
English FAL 52.38 9.11 58
Mathematics 35.48 15.43 48
Mathematical Literacy 44.59 13.51 17
Physical Science 36.31 13.69 39
Life Sciences 47.42 15.31 48
Reduced Sample Mean Std. Dev. Observations
English FAL 52.65 8.74 34
Mathematics 33.68 15.84 31
Mathematical Literacy 50 13.95 7
Physical Science 33.85 14.64 26
Life Sciences 47 14.15 30
Table C1.2: Western Cape Ikamva Feeder Schools
Full Sample Mean Std. Dev. Observations
English FAL 45.81 12.42 1944
Mathematics 37.02 20.12 775
Mathematical Literacy 43.56 17.89 1983
Physical Science 34.60 17.94 719
Life Sciences 39.96 18.94 1506
Reduced Sample Mean Std. Dev. Observations
English FAL 49.59 10.67 767
Mathematics 40.27 19.87 507
Mathematical Literacy 50.92 17.54 859
Physical Science 37.35 18.17 454
Life Sciences 45.94 18.50 772

33
Table C1.3: All Western Cape Learners
Full Sample Mean Std. Dev. Observations
English FAL 50.78 14.00 30171
Mathematics 46.07 22.87 15375
Mathematical Literacy 47.99 18.25 33436
Physical Science 44.09 22.22 11191
Life Sciences 43.43 20.48 24837
Reduced Sample Mean Std. Dev. Observations
English FAL 55.40 13.11 17024
Mathematics 48.24 22.41 11815
Mathematical Literacy 53.69 17.21 18443
Physical Science 46.59 21.93 8340
Life Sciences 48.29 19.93 15973
C2: Descriptive Statistics, Systemic Performance
Table C2.1: Systemic Performance
Ikamvanites Mean Std. Dev. Observations
Systemic Language 42.31 13.05 38
Systemic Mathematics 21.40 8.17 38
Ikamva Schools Mean Std. Dev. Observations
Systemic Language 53.31 19.40 1366
Systemic Mathematics 28.75 17.99 1366
WC All Schools Mean Std. Dev. Observations
Systemic Language 60.16 19.12 30258
Systemic Mathematics 36.55 21.37 30258
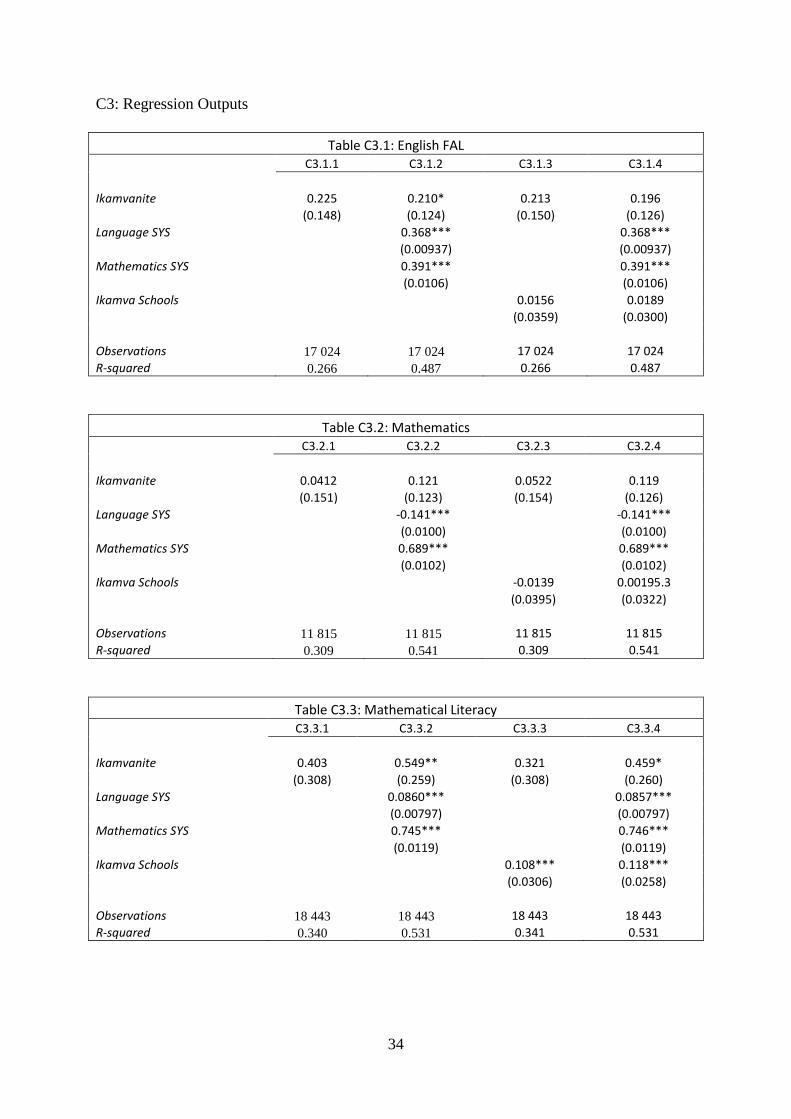
34
C3: Regression Outputs
Table C3.1: English FAL C3.1.1 C3.1.2 C3.1.3 C3.1.4
Ikamvanite 0.225 0.210* 0.213 0.196
(0.148) (0.124) (0.150) (0.126)
Language SYS
0.368***
0.368***
(0.00937)
(0.00937)
Mathematics SYS
0.391***
0.391***
(0.0106)
(0.0106)
Ikamva Schools
0.0156 0.0189
(0.0359) (0.0300)
Observations 17 024 17 024 17 024 17 024
R-squared 0.266 0.487 0.266 0.487
Table C3.2: Mathematics C3.2.1 C3.2.2 C3.2.3 C3.2.4
Ikamvanite 0.0412 0.121 0.0522 0.119
(0.151) (0.123) (0.154) (0.126)
Language SYS
-0.141***
-0.141***
(0.0100)
(0.0100)
Mathematics SYS
0.689***
0.689***
(0.0102)
(0.0102)
Ikamva Schools
-0.0139 0.00195.3
(0.0395) (0.0322)
Observations 11 815 11 815 11 815 11 815
R-squared 0.309 0.541 0.309 0.541
Table C3.3: Mathematical Literacy C3.3.1 C3.3.2 C3.3.3 C3.3.4
Ikamvanite 0.403 0.549** 0.321 0.459*
(0.308) (0.259) (0.308) (0.260)
Language SYS
0.0860***
0.0857***
(0.00797)
(0.00797)
Mathematics SYS
0.745***
0.746***
(0.0119)
(0.0119)
Ikamva Schools
0.108*** 0.118***
(0.0306) (0.0258)
Observations 18 443 18 443 18 443 18 443
R-squared 0.340 0.531 0.341 0.531
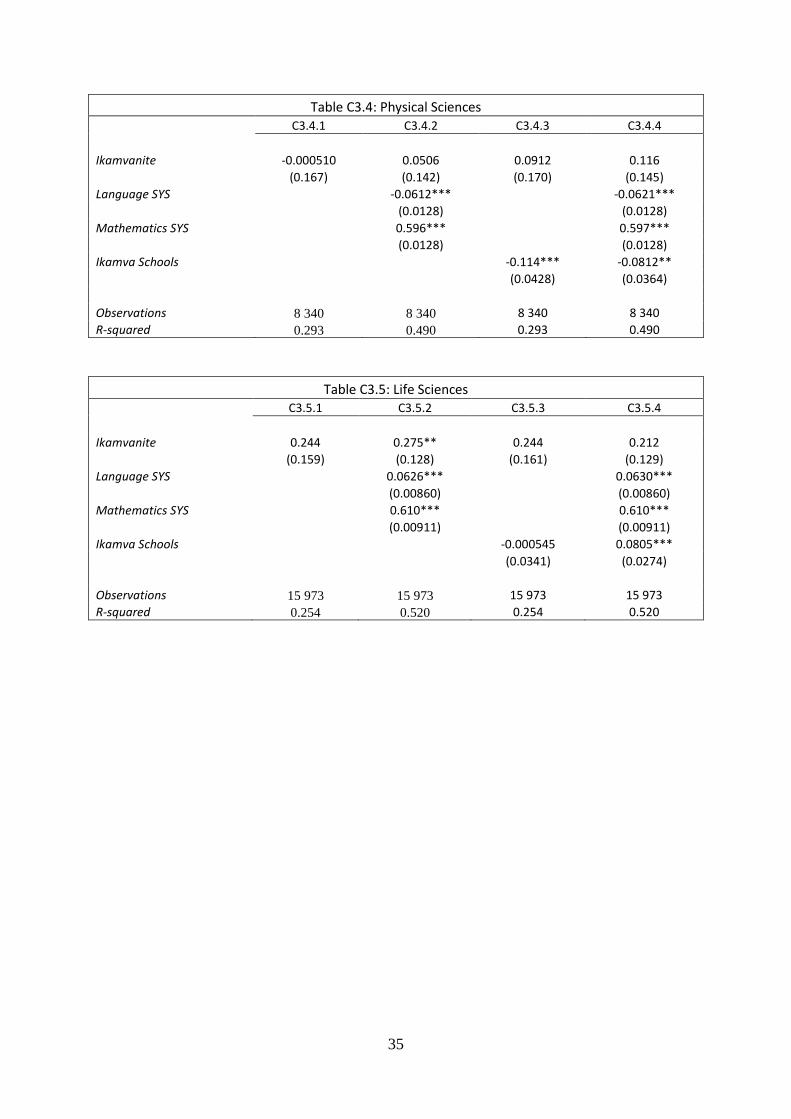
35
Table C3.4: Physical Sciences C3.4.1 C3.4.2 C3.4.3 C3.4.4
Ikamvanite -0.000510 0.0506 0.0912 0.116
(0.167) (0.142) (0.170) (0.145)
Language SYS
-0.0612***
-0.0621***
(0.0128)
(0.0128)
Mathematics SYS
0.596***
0.597***
(0.0128)
(0.0128)
Ikamva Schools
-0.114*** -0.0812**
(0.0428) (0.0364)
Observations 8 340 8 340 8 340 8 340
R-squared 0.293 0.490 0.293 0.490
Table C3.5: Life Sciences
C3.5.1 C3.5.2 C3.5.3 C3.5.4
Ikamvanite 0.244 0.275** 0.244 0.212
(0.159) (0.128) (0.161) (0.129)
Language SYS
0.0626***
0.0630***
(0.00860)
(0.00860)
Mathematics SYS
0.610***
0.610***
(0.00911)
(0.00911)
Ikamva Schools
-0.000545 0.0805***
(0.0341) (0.0274)
Observations 15 973 15 973 15 973 15 973
R-squared 0.254 0.520 0.254 0.520
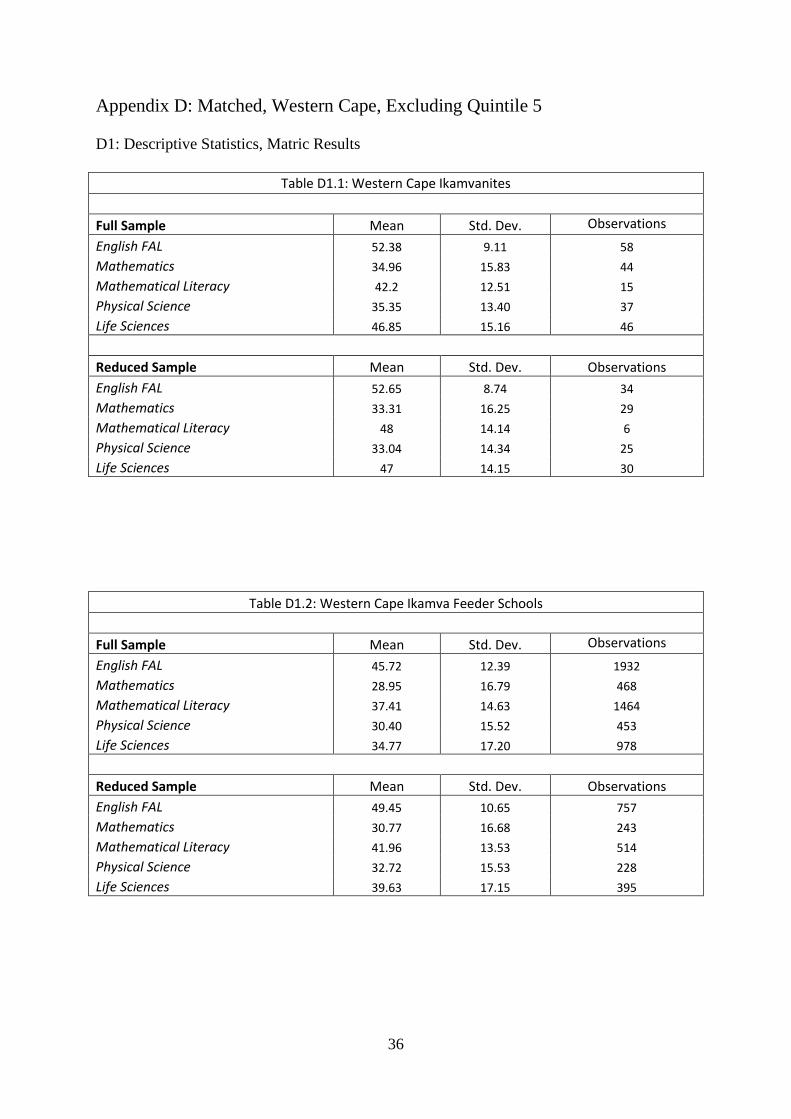
36
Appendix D: Matched, Western Cape, Excluding Quintile 5
D1: Descriptive Statistics, Matric Results
Table D1.1: Western Cape Ikamvanites
Full Sample Mean Std. Dev. Observations
English FAL 52.38 9.11 58
Mathematics 34.96 15.83 44
Mathematical Literacy 42.2 12.51 15
Physical Science 35.35 13.40 37
Life Sciences 46.85 15.16 46
Reduced Sample Mean Std. Dev. Observations
English FAL 52.65 8.74 34
Mathematics 33.31 16.25 29
Mathematical Literacy 48 14.14 6
Physical Science 33.04 14.34 25
Life Sciences 47 14.15 30
Table D1.2: Western Cape Ikamva Feeder Schools
Full Sample Mean Std. Dev. Observations
English FAL 45.72 12.39 1932
Mathematics 28.95 16.79 468
Mathematical Literacy 37.41 14.63 1464
Physical Science 30.40 15.52 453
Life Sciences 34.77 17.20 978
Reduced Sample Mean Std. Dev. Observations
English FAL 49.45 10.65 757
Mathematics 30.77 16.68 243
Mathematical Literacy 41.96 13.53 514
Physical Science 32.72 15.53 228
Life Sciences 39.63 17.15 395
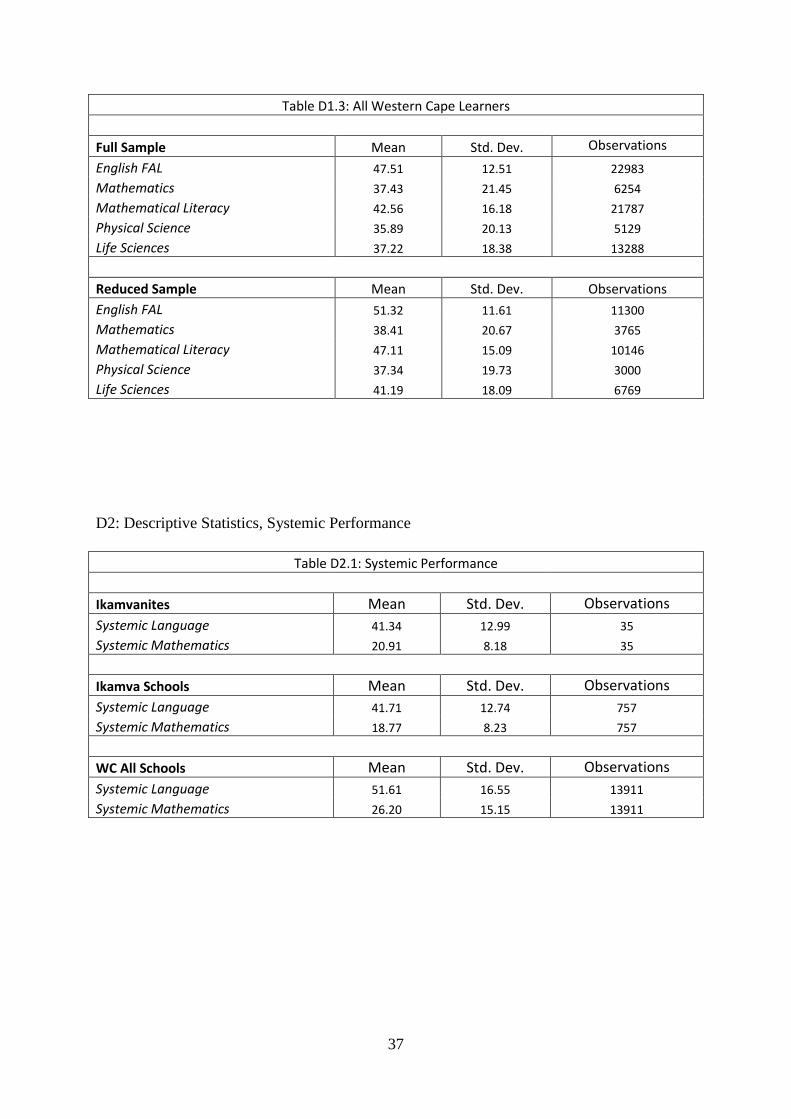
37
Table D1.3: All Western Cape Learners
Full Sample Mean Std. Dev. Observations
English FAL 47.51 12.51 22983
Mathematics 37.43 21.45 6254
Mathematical Literacy 42.56 16.18 21787
Physical Science 35.89 20.13 5129
Life Sciences 37.22 18.38 13288
Reduced Sample Mean Std. Dev. Observations
English FAL 51.32 11.61 11300
Mathematics 38.41 20.67 3765
Mathematical Literacy 47.11 15.09 10146
Physical Science 37.34 19.73 3000
Life Sciences 41.19 18.09 6769
D2: Descriptive Statistics, Systemic Performance
Table D2.1: Systemic Performance
Ikamvanites Mean Std. Dev. Observations
Systemic Language 41.34 12.99 35
Systemic Mathematics 20.91 8.18 35
Ikamva Schools Mean Std. Dev. Observations
Systemic Language 41.71 12.74 757
Systemic Mathematics 18.77 8.23 757
WC All Schools Mean Std. Dev. Observations
Systemic Language 51.61 16.55 13911
Systemic Mathematics 26.20 15.15 13911
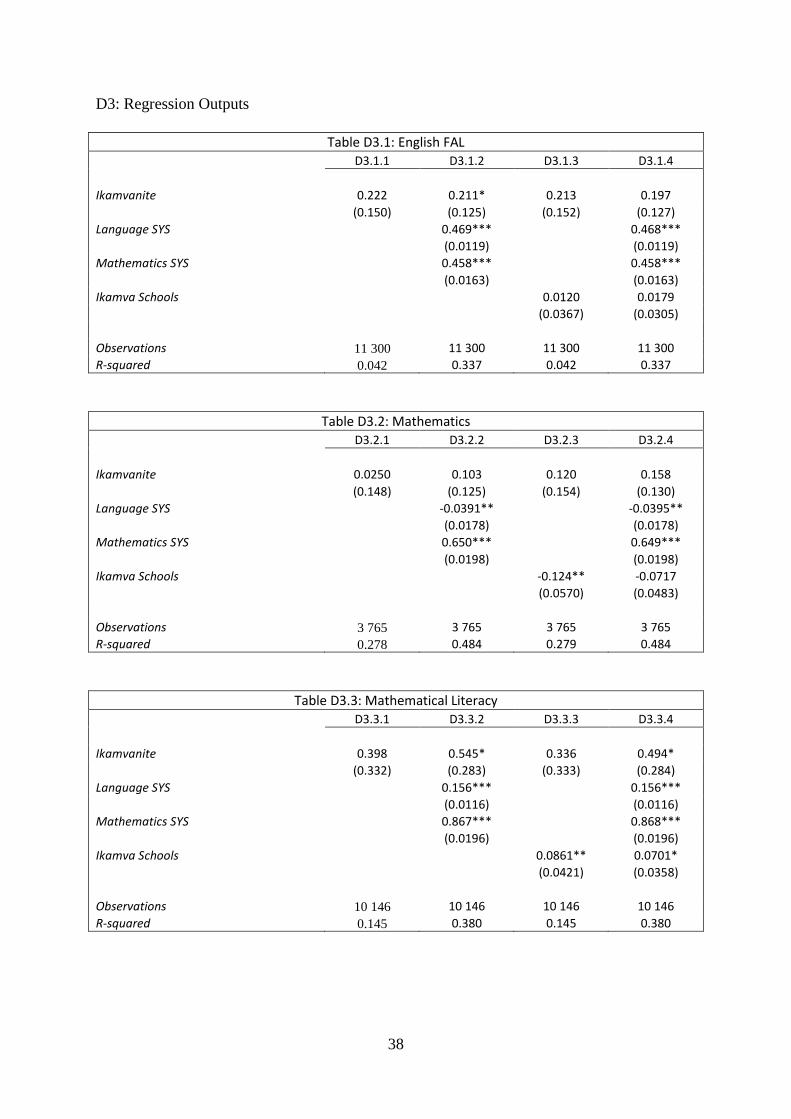
38
D3: Regression Outputs
Table D3.1: English FAL D3.1.1 D3.1.2 D3.1.3 D3.1.4
Ikamvanite 0.222 0.211* 0.213 0.197
(0.150) (0.125) (0.152) (0.127)
Language SYS
0.469***
0.468***
(0.0119)
(0.0119)
Mathematics SYS
0.458***
0.458***
(0.0163)
(0.0163)
Ikamva Schools
0.0120 0.0179
(0.0367) (0.0305)
Observations 11 300 11 300 11 300 11 300
R-squared 0.042 0.337 0.042 0.337
Table D3.2: Mathematics D3.2.1 D3.2.2 D3.2.3 D3.2.4
Ikamvanite 0.0250 0.103 0.120 0.158
(0.148) (0.125) (0.154) (0.130)
Language SYS
-0.0391**
-0.0395**
(0.0178)
(0.0178)
Mathematics SYS
0.650***
0.649***
(0.0198)
(0.0198)
Ikamva Schools
-0.124** -0.0717
(0.0570) (0.0483)
Observations 3 765 3 765 3 765 3 765
R-squared 0.278 0.484 0.279 0.484
Table D3.3: Mathematical Literacy D3.3.1 D3.3.2 D3.3.3 D3.3.4
Ikamvanite 0.398 0.545* 0.336 0.494*
(0.332) (0.283) (0.333) (0.284)
Language SYS
0.156***
0.156***
(0.0116)
(0.0116)
Mathematics SYS
0.867***
0.868***
(0.0196)
(0.0196)
Ikamva Schools
0.0861** 0.0701*
(0.0421) (0.0358)
Observations 10 146 10 146 10 146 10 146
R-squared 0.145 0.380 0.145 0.380
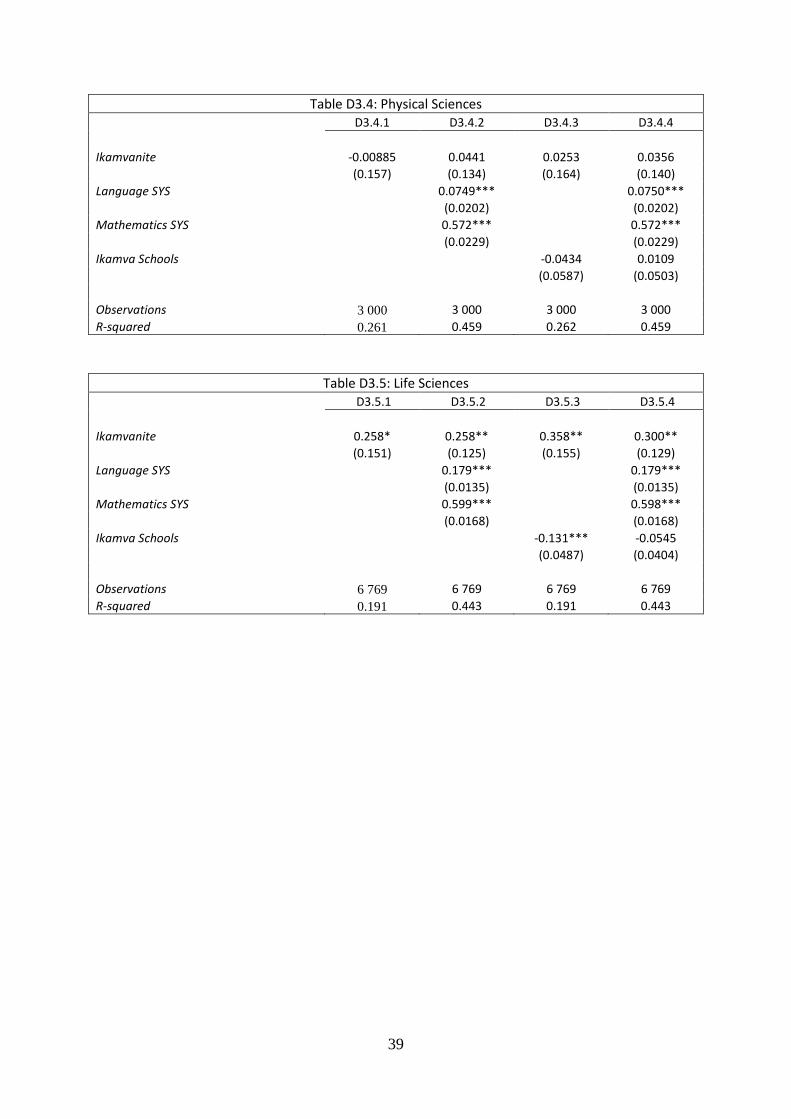
39
Table D3.4: Physical Sciences D3.4.1 D3.4.2 D3.4.3 D3.4.4
Ikamvanite -0.00885 0.0441 0.0253 0.0356
(0.157) (0.134) (0.164) (0.140)
Language SYS
0.0749***
0.0750***
(0.0202)
(0.0202)
Mathematics SYS
0.572***
0.572***
(0.0229)
(0.0229)
Ikamva Schools
-0.0434 0.0109
(0.0587) (0.0503)
Observations 3 000 3 000 3 000 3 000
R-squared 0.261 0.459 0.262 0.459
Table D3.5: Life Sciences D3.5.1 D3.5.2 D3.5.3 D3.5.4
Ikamvanite 0.258* 0.258** 0.358** 0.300**
(0.151) (0.125) (0.155) (0.129)
Language SYS
0.179***
0.179***
(0.0135)
(0.0135)
Mathematics SYS
0.599***
0.598***
(0.0168)
(0.0168)
Ikamva Schools
-0.131*** -0.0545
(0.0487) (0.0404)
Observations 6 769 6 769 6 769 6 769
R-squared 0.191 0.443 0.191 0.443
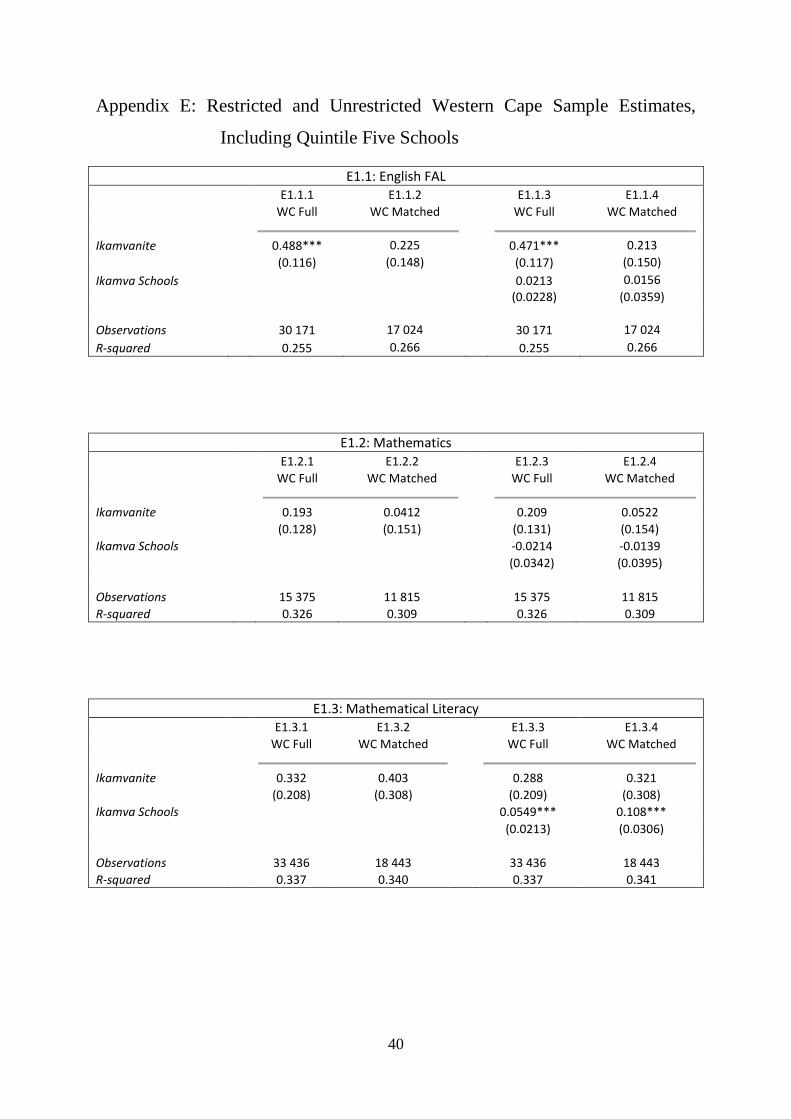
40
Appendix E: Restricted and Unrestricted Western Cape Sample Estimates,
Including Quintile Five Schools
E1.1: English FAL
E1.1.1 E1.1.2 E1.1.3 E1.1.4
WC Full WC Matched WC Full WC Matched
Ikamvanite 0.488*** 0.225 0.471*** 0.213
(0.116) (0.148) (0.117) (0.150)
Ikamva Schools
0.0213 0.0156
(0.0228) (0.0359)
Observations 30 171 17 024 30 171 17 024
R-squared 0.255 0.266 0.255 0.266
E1.2: Mathematics
E1.2.1 E1.2.2 E1.2.3 E1.2.4
WC Full WC Matched WC Full WC Matched
Ikamvanite 0.193 0.0412 0.209 0.0522
(0.128) (0.151) (0.131) (0.154)
Ikamva Schools
-0.0214 -0.0139
(0.0342) (0.0395)
Observations 15 375 11 815 15 375 11 815
R-squared 0.326 0.309 0.326 0.309
E1.3: Mathematical Literacy
E1.3.1 E1.3.2 E1.3.3 E1.3.4
WC Full WC Matched WC Full WC Matched
Ikamvanite 0.332 0.403 0.288 0.321
(0.208) (0.308) (0.209) (0.308)
Ikamva Schools 0.0549*** 0.108***
(0.0213) (0.0306)
Observations 33 436 18 443 33 436 18 443
R-squared 0.337 0.340 0.337 0.341
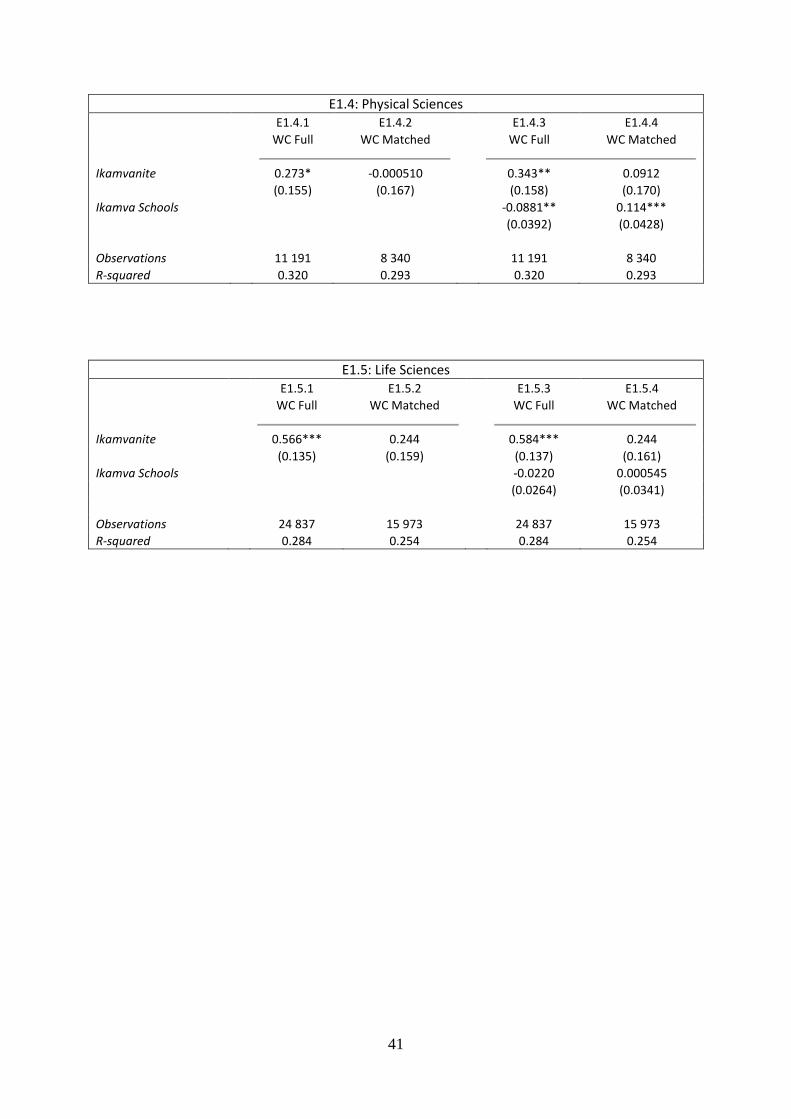
41
E1.4: Physical Sciences
E1.4.1 E1.4.2 E1.4.3 E1.4.4
WC Full WC Matched WC Full WC Matched
Ikamvanite 0.273* -0.000510 0.343** 0.0912
(0.155) (0.167) (0.158) (0.170)
Ikamva Schools -0.0881** 0.114***
(0.0392) (0.0428)
Observations 11 191 8 340 11 191 8 340
R-squared 0.320 0.293 0.320 0.293
E1.5: Life Sciences
E1.5.1 E1.5.2 E1.5.3 E1.5.4
WC Full WC Matched WC Full WC Matched
Ikamvanite 0.566*** 0.244 0.584*** 0.244
(0.135) (0.159) (0.137) (0.161)
Ikamva Schools -0.0220 0.000545
(0.0264) (0.0341)
Observations 24 837 15 973 24 837 15 973
R-squared 0.284 0.254 0.284 0.254
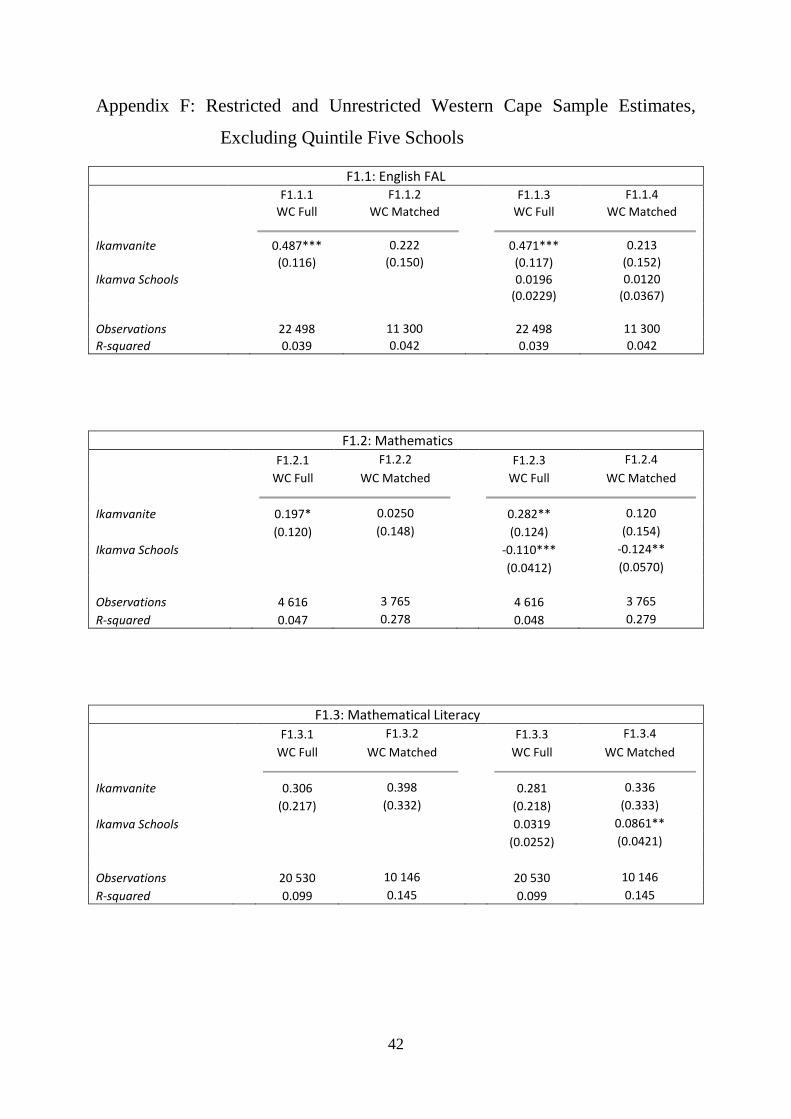
42
Appendix F: Restricted and Unrestricted Western Cape Sample Estimates,
Excluding Quintile Five Schools
F1.1: English FAL
F1.1.1 F1.1.2 F1.1.3 F1.1.4
WC Full WC Matched WC Full WC Matched
Ikamvanite 0.487*** 0.222 0.471*** 0.213
(0.116) (0.150) (0.117) (0.152)
Ikamva Schools
0.0196 0.0120
(0.0229) (0.0367)
Observations 22 498 11 300 22 498 11 300
R-squared 0.039 0.042 0.039 0.042
F1.2: Mathematics
F1.2.1 F1.2.2 F1.2.3 F1.2.4
WC Full WC Matched WC Full WC Matched
Ikamvanite 0.197* 0.0250 0.282** 0.120
(0.120) (0.148) (0.124) (0.154)
Ikamva Schools -0.110*** -0.124**
(0.0412) (0.0570)
Observations 4 616 3 765 4 616 3 765
R-squared 0.047 0.278 0.048 0.279
F1.3: Mathematical Literacy
F1.3.1 F1.3.2 F1.3.3 F1.3.4
WC Full WC Matched WC Full WC Matched
Ikamvanite 0.306 0.398 0.281 0.336
(0.217) (0.332) (0.218) (0.333)
Ikamva Schools 0.0319 0.0861**
(0.0252) (0.0421)
Observations 20 530 10 146 20 530 10 146
R-squared 0.099 0.145 0.099 0.145
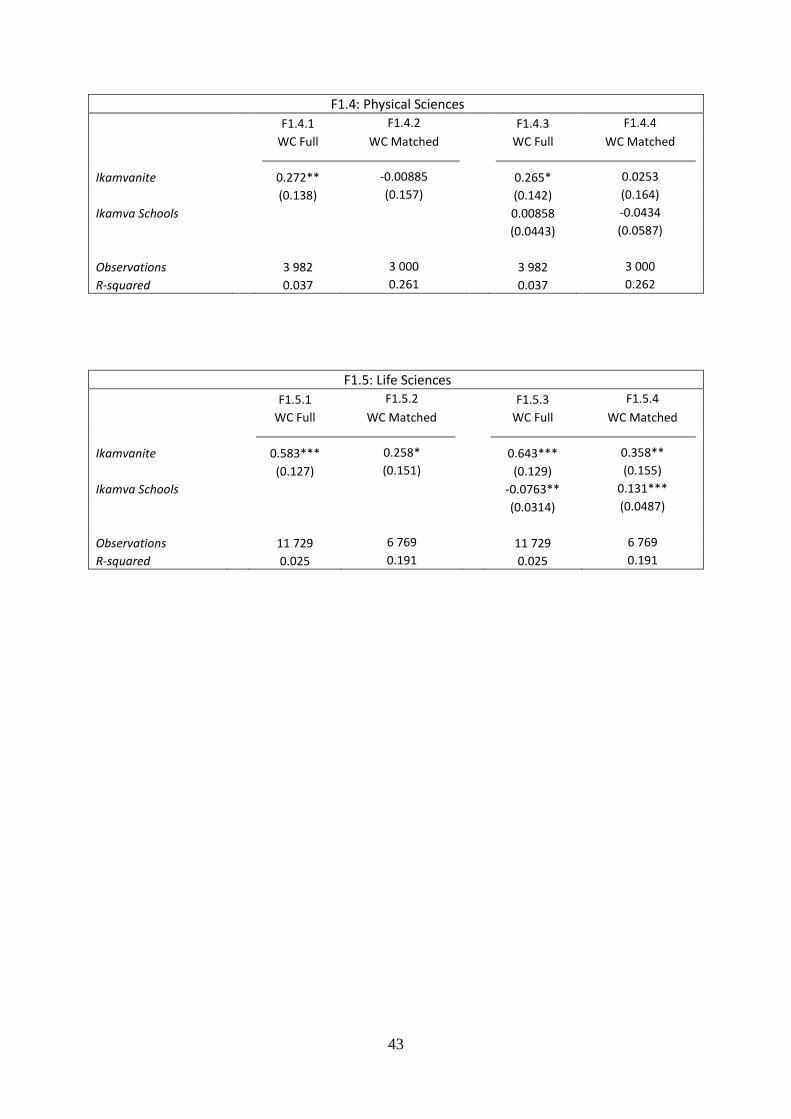
43
F1.4: Physical Sciences
F1.4.1 F1.4.2 F1.4.3 F1.4.4
WC Full WC Matched WC Full WC Matched
Ikamvanite 0.272** -0.00885 0.265* 0.0253
(0.138) (0.157) (0.142) (0.164)
Ikamva Schools 0.00858 -0.0434
(0.0443) (0.0587)
Observations 3 982 3 000 3 982 3 000
R-squared 0.037 0.261 0.037 0.262
F1.5: Life Sciences
F1.5.1 F1.5.2 F1.5.3 F1.5.4
WC Full WC Matched WC Full WC Matched
Ikamvanite 0.583*** 0.258* 0.643*** 0.358**
(0.127) (0.151) (0.129) (0.155)
Ikamva Schools -0.0763** 0.131***
(0.0314) (0.0487)
Observations 11 729 6 769 11 729 6 769
R-squared 0.025 0.191 0.025 0.191