Embed Size (px)
Citation preview
Subway Service Performance Measurement at New York City Transit: Recent Advancements
Alla Venugopal Reddy
Sr. Director, System Data & Research, Operations Planning MTA New York City Transit, 2 Broadway, Office A17.92, New York, N.Y.
Abstract ID: 63
Abstract. A recurring challenge facing North American transit managers in today’s economic climate is the persistent question of how to do more with less – not only to maintain but to improve service in the face of deficits of historic proportions, and against a background of public pressure to reduce government costs. MTA New York City Transit (NYCT) has responded to that challenge by re-tooling its performance measurement frameworks to better capture performance from a customer’s perspective, respond to management system improvement initiatives, and better incentivize operating decisions that deliver excellent customer service.
NYCT’s key operating performance indicators as measured from a customer’s perspective have traditionally been in two areas: on-time performance (OTP), and service quality indicators (SQI). The main OTP measure method is called Wait Assessment (WA), designed to measure wait times experienced by customers waiting to board at a station stop. WA applies an analytical algorithm on departure times of all vehicles passing a time point. Initially defined as % of intervals between trains that does not exceed a +2 minutes peak/+4 minutes off-peak threshold more than the scheduled headway, the algorithm has undergone numerous refinements.
WA standard was modified to within +25% of the scheduled headway, thereby making it relative performance measure that is stricter for lines with more frequent service. However, this pass/fail standard does not give any information on the distribution of service intervals not meeting standard, thus it was further refined to use a distribution for failing intervals provides customers a more detailed view of system performance, planned to be effective beginning January 2012. At this time NYCT is considering setting WA standards for shared-track territory, treating different routes as the same service corridor and analyzing performance of trains sharing track together regardless of their route designation.
Upgrading a previous sample-based method that gathered limited data manually, extensive data was downloaded from the Automated Train Supervision (ATS) to provide 100% coverage and much lower time-lag for compiling performance measures. This allowed near-term corrective action by operations supervisors.
Alla Reddy
Page 1
Introduction
Public transit systems in the United States are generally owned and operated by state, county, or municipal agencies or authorities receiving financial operating support from the local government parent entity and capital investment from the Federal government. New York City Transit (NYCT) is an operating agency supported by the Metropolitan Transportation Authority (MTA), State of New York. The primary role of the MTA is to provide financial management and oversight, bonding authority, project management for large-scale capital projects, and to balance the needs of various modes of transportation serving the New York metropolitan region. Today the MTA oversees NYCT’s subway and city bus networks, two commuter railroads, a suburban bus network, numerous toll bridges and tunnels at key river crossings, and several large construction projects including the Second Avenue Subway, Manhattan’s East Side Access, and the new Fulton Street Transit Center. NYCT provides day-to-day operational management of the subway and bus networks, including supervision of operating and maintenance crews, service planning, implementation of smaller capital projects (such as rolling stock procurement), and certain back-office management functions [1].
NYCT’s predominant role is to ensure that trains and buses operate safely, reliably, on-time, and provide convenient services to the customer in a cost effective manner. One of the tools we have to ensure the mission is being properly carried out is an independent performance audit infrastructure—independent from both the operations management and the customer advocacy groups—and continuous applied research and improvements in not only monitoring methodologies but also how the service can be improved.
Our experience with deferred maintenance and service deterioration in the 1970s serves as a cautionary tale of how service quality, and eventually system maintenance can quickly deteriorate in the absence of an independent performance monitoring program. Furthermore, performance monitoring can provide the needed justification and basis for obtaining the funds and grants needed for continued system operations and upkeep.
About New York City Transit
NYCT operates the third largest subway system in the world (by annual ridership), carrying about 5.0 million riders on an average weekday. The subway system extends 830 track miles through four boroughs, covering a service area of 321 square miles and serving a population of 8.0 million people 24-hours, seven days a week. The subway is equipped with 6,375 electric passenger cars stored in 13 yards and two heavy maintenance facilities, travelling a combined total of over 354 million miles a year on 24 routes and three permanent shuttles. The system operates over 468 stations with a total of 5,105 stairways, 906 platforms, 192 elevators, and 178 escalators.
On the bus side, the 199 local and 24 express routes serve 11,995 stops and provide almost 55,000 weekday scheduled trips, carrying 2.4 million weekday riders throughout the 1,852 mile route network. The 1.83 billion passenger miles consumed by New Yorkers each year in 926 million discrete trips requires a fleet of 4,406 buses maintained in 19 depots by nearly 17,000 dedicated NYCT Bus employees.
Alla Reddy
Page 2
About the Subway Service Performance Indicator (PI) Program
The Performance Indicator (PI) program was established in 1994 in response to the MTA Inspector General’s research [2] recommending the need for measures of service reliability other than the traditional Terminal On-Time Performance (TOTP). A detailed description of the NYCT PI program is found in Cramer et al. [3]. TOTP is a good operational measure for commuter railroads where the majority of customers are traveling to the final stop in the central business district (CBD). However, transit lines tend to drop off and pick-up many passengers at intermediate stations, which requires more sophisticated measures capable of blending waiting time and travel time experiences from a customer perspective. Extensive research had been conducted to understand transit service reliability from the passenger and the transit manager’s perspectives [4], building on prior models of headway variance [5,6].
Statistical measures of service reliability, such as root-mean-squared average passenger wait time [7], were considered too complex for use as public measures. NYCT developed simplified version of the algorithms that are more easily understood. The result was Wait Assessment (WA). This design of the PI program achieves a duality of purposes:
1. To provide the public with measurements that are clearly defined, easily verifiable, readily understandable, and realistically represent the many factors that impact their riding experience, such that NYCT can be held accountable to its core mission.
2. To provide quantitative information to operating personnel that can be used to diagnose and correct service problems, and to improve overall performance.
All subway lines are monitored. Principal bus routes representing the greatest ridership, demographic, and geographic areas within each borough of the city were selected. A stratified statistical sample, designed to prevent sample bias by route, is generated using a fully automated system and achieves an accuracy of 95 ± 5% at the route level.
Wait Assessment Development
The PI program’s main purpose is to monitor how well NYCT is providing service to the public [8]. Wait Assessment is publicly reported at the systemwide, bus by route and subway by line level. These results are routinely used by rider advocacy groups for their annual rating of subway lines in their State of the Subways report. Maintaining a transparent and accountable performance reporting process is critical to achieving public trust in the performance audit infrastructure. Indeed, stakeholder and watchdog groups have adopted the MTA’s measures as the basis of its performance reporting:
The MTA and its Operating Agencies provide some of the most transparent and detailed operational metrics among U.S. transit agencies; and this information is readily available on the MTA website. With respect to MNR and LIRR, no major commuter railroad comes close to their level of operational performance disclosure, especially with the recent addition of metrics on delayed and canceled trains in Board materials and on the website. In addition, the NYCT is to be lauded for the improvement of its performance indicators over the last 15 years, particularly with the implementation and refinement of its Wait Assessment metric. [9]
Alla Reddy
Page 3
Wait Assessment applies an analytical algorithm on raw data collected by surveyors (including fleet number and departure time of all vehicles passing a location.) Data is collected at en-route timepoints (not just terminals), because the majority of riders enter and depart the system at intermediate stops along the route.
As it was first conceived, Wait Assessment was an absolute measure of relative performance. It’s an absolute measure because the thresholds of what constitutes an acceptable excess wait time [10] is a fixed quantity for a given time period (+2 minutes peak/+4 minutes off-peak). However, it is a measure of relative performance because it is based on headways between trains—obtained by comparing a train’s departure time with its predecessor, and not by comparing a train’s departure time with the fixed schedule. The rationale for this was to provide a customer with a “Bill of Rights”, a fixed standard of excess wait time above which the service interval is considered unacceptable.
This type of measurement metric has one interesting property: lines scheduled with shorter headways tend to score higher, because there is simply a higher probability of a train—any train—achieving that two-/four-minute window above headway.
Refinement – Absolute versus Relative
In discussions with operations management, it became apparent that this property does not give dispatchers correct incentives. The lines that have high frequency service are often very congested, where the smallest perturbation in headways or ridership volume can quickly snowball into bunched service and big gaps [11]. On lower frequency lines, dispatchers have a little more latitude to adjust schedules, and the headway isn’t so critical to maintaining proper service. To prevent such imbalance, the standard to which each line is held must be a function of service frequency, with busier lines held to more exacting standards. In turn, the tolerable excess wait time must be specified relative to the headway.
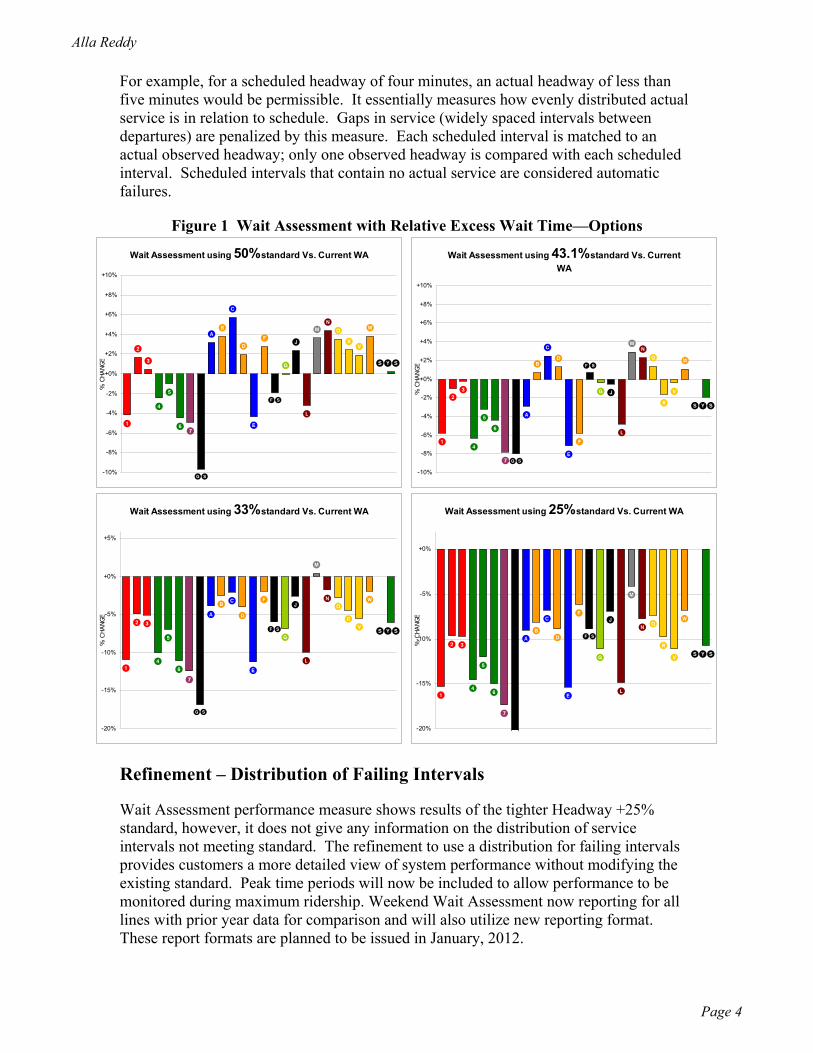
To determine an appropriate percentage, the difference between a +2/+4 standard and a percentage standard was computed at a line level at numerous levels (Figure 1). As NYCT’s typical headway is 4 minutes peak, 8 minutes off-peak, a standard of headway +50% seems reasonable. Indeed, Figure 1 shows a standard of 50% would leave overall scores approximately unchanged, lowering scores on frequent lines like 1, 4, 6, 7, and E, while improving scores on infrequent lines like B, C, and N. Because of differences in total train volumes between lines, historical data shows that a 50% standard would actually increase systemwide Wait Assessment scores slightly, and a standard of 43.1% would actually maintain the systemwide result compared to while re-distributing pass and fail scores amongst different lines.
After much consultation with stakeholders and management, the final decision was reached to modify the Wait Assessment threshold to be within +25% of the scheduled headway, thereby making Wait Assessment a relative performance measure. The strictest standard at +25% was selected in an effort to assure the public that NYCT is looking for continuous improvements in service delivery. The formal definition of Wait Assessment for subway lines thus became:
% of intervals between trains that does not exceed 25% of scheduled headway.
Alla Reddy
Page 4
For example, for a scheduled headway of four minutes, an actual headway of less than five minutes would be permissible. It essentially measures how evenly distributed actual service is in relation to schedule. Gaps in service (widely spaced intervals between departures) are penalized by this measure. Each scheduled interval is matched to an actual observed headway; only one observed headway is compared with each scheduled interval. Scheduled intervals that contain no actual service are considered automatic failures.
Figure 1 Wait Assessment with Relative Excess Wait Time—Options
Wait Assessment using 50% standard Vs. Current WA
SYS
V
W
6 E
M
J RQ
GS
C
B
D
1
2
5
3
F
FS
L
N
G
4
7
A
-10%
-8%
-6%
-4%
-2%
+0%
+2%
+4%
+6%
+8%
+10%
% C
HA
NG
E
Wait Assessment using 43.1% standard Vs. Current WA
SYSA
7
4
G
N
L
FS
F
3
5
2
1
DB
C
GS
Q
RJ
M
E
6
W
V
-10%
-8%
-6%
-4%
-2%
+0%
+2%
+4%
+6%
+8%
+10%
% C
HA
NG
E
Wait Assessment using 33% standard Vs. Current WA
SYS
A
7
4
G
N
L
FS
F
3
5
2
1
D
B C
GS
Q
R
J
M
E6
W
V
-20%
-15%
-10%
-5%
+0%
+5%
% C
HA
NG
E
Wait Assessment using 25% standard Vs. Current WA
SYSV
W
6 E
M
J
R
QC
BD
1
2
5
3
F
FS
L
N
G
4
7
A
-20%
-15%
-10%
-5%
+0%
% C
HA
NG
E
Refinement – Distribution of Failing Intervals
Wait Assessment performance measure shows results of the tighter Headway +25% standard, however, it does not give any information on the distribution of service intervals not meeting standard. The refinement to use a distribution for failing intervals provides customers a more detailed view of system performance without modifying the existing standard. Peak time periods will now be included to allow performance to be monitored during maximum ridership. Weekend Wait Assessment now reporting for all lines with prior year data for comparison and will also utilize new reporting format. These report formats are planned to be issued in January, 2012.
Alla Reddy
Page 5
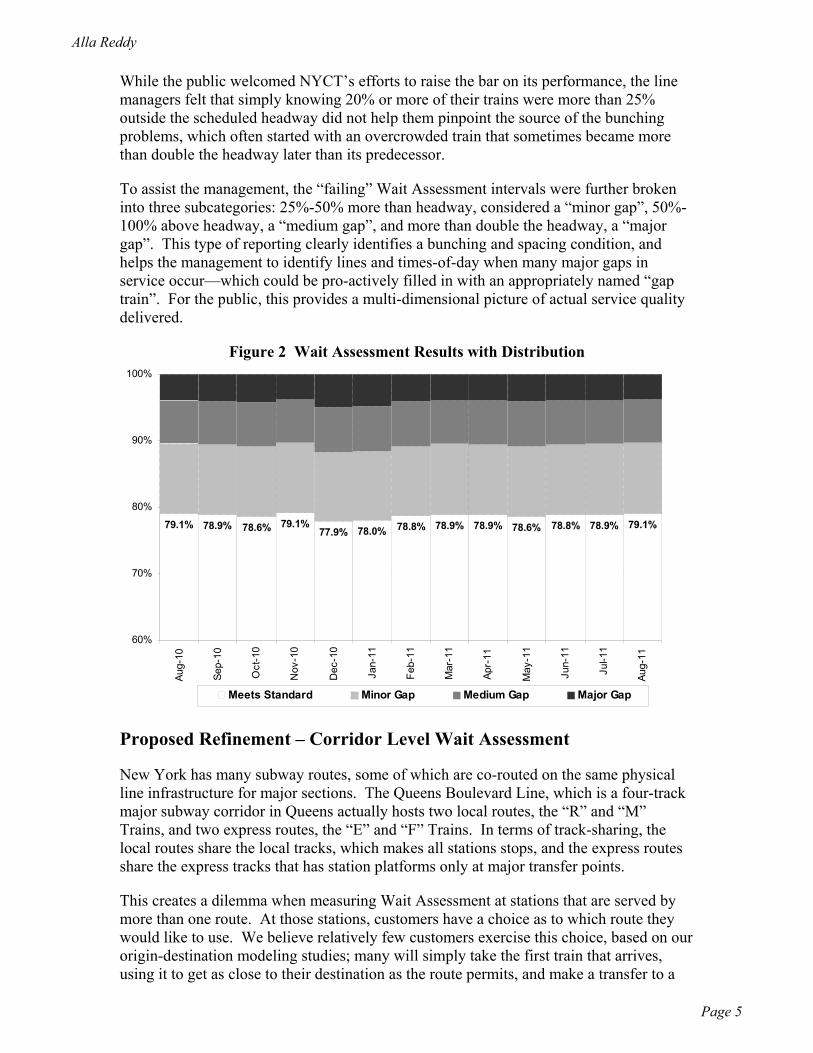
While the public welcomed NYCT’s efforts to raise the bar on its performance, the line managers felt that simply knowing 20% or more of their trains were more than 25% outside the scheduled headway did not help them pinpoint the source of the bunching problems, which often started with an overcrowded train that sometimes became more than double the headway later than its predecessor.
To assist the management, the “failing” Wait Assessment intervals were further broken into three subcategories: 25%-50% more than headway, considered a “minor gap”, 50%-100% above headway, a “medium gap”, and more than double the headway, a “major gap”. This type of reporting clearly identifies a bunching and spacing condition, and helps the management to identify lines and times-of-day when many major gaps in service occur—which could be pro-actively filled in with an appropriately named “gap train”. For the public, this provides a multi-dimensional picture of actual service quality delivered.
Figure 2 Wait Assessment Results with Distribution
79.1% 78.9% 78.6% 79.1%77.9% 78.0% 78.8% 78.9% 78.9% 78.6% 78.8% 78.9% 79.1%
60%
70%
80%
90%
100%
Aug-
10
Sep-
10
Oct
-10
Nov
-10
Dec
-10
Jan-
11
Feb-
11
Mar
-11
Apr-
11
May
-11
Jun-
11
Jul-1
1
Aug-
11
Meets Standard Minor Gap Medium Gap Major Gap
Proposed Refinement – Corridor Level Wait Assessment
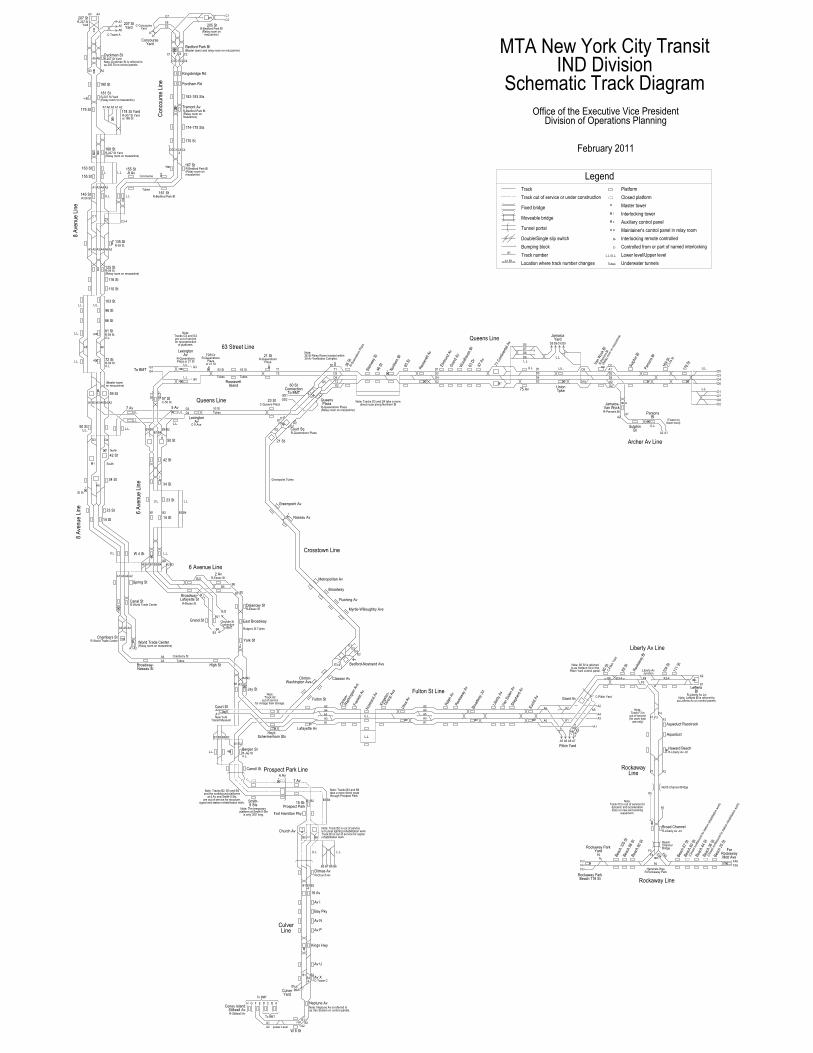
New York has many subway routes, some of which are co-routed on the same physical line infrastructure for major sections. The Queens Boulevard Line, which is a four-track major subway corridor in Queens actually hosts two local routes, the “R” and “M” Trains, and two express routes, the “E” and “F” Trains. In terms of track-sharing, the local routes share the local tracks, which makes all stations stops, and the express routes share the express tracks that has station platforms only at major transfer points.
This creates a dilemma when measuring Wait Assessment at stations that are served by more than one route. At those stations, customers have a choice as to which route they would like to use. We believe relatively few customers exercise this choice, based on our origin-destination modeling studies; many will simply take the first train that arrives, using it to get as close to their destination as the route permits, and make a transfer to a
Alla Reddy
Page 6
different train later on in their journey. Yet other customers prefer a one-seat ride and will wait on the platform for the exact route they require. Wait Assessment is a route-based measure; that is, it measures the intervals between trains of the same route—and does not consider the intervals between trains that are sharing the same track if they are assigned different route letters or numbers.
There is a debate about how such shared-track corridors should be managed. Customers who are destined for the branching section of trunk lines often require a specific route to reach their final destination, and therefore are interested in knowing if their route is having bunching and spacing problems. Customers who use the trunk section exclusively, or make inter-divisional transfers at major transfer points, are usually more interested in the corridor-level measures because routes letters or numbers are only of passing interest to them—for they simply require a train going in the same direction they’re travelling. When routes share track, it is operationally important to keep even spacing between trains even if they have different route letters or numbers, therefore line management usually are more interested in track-level measures.
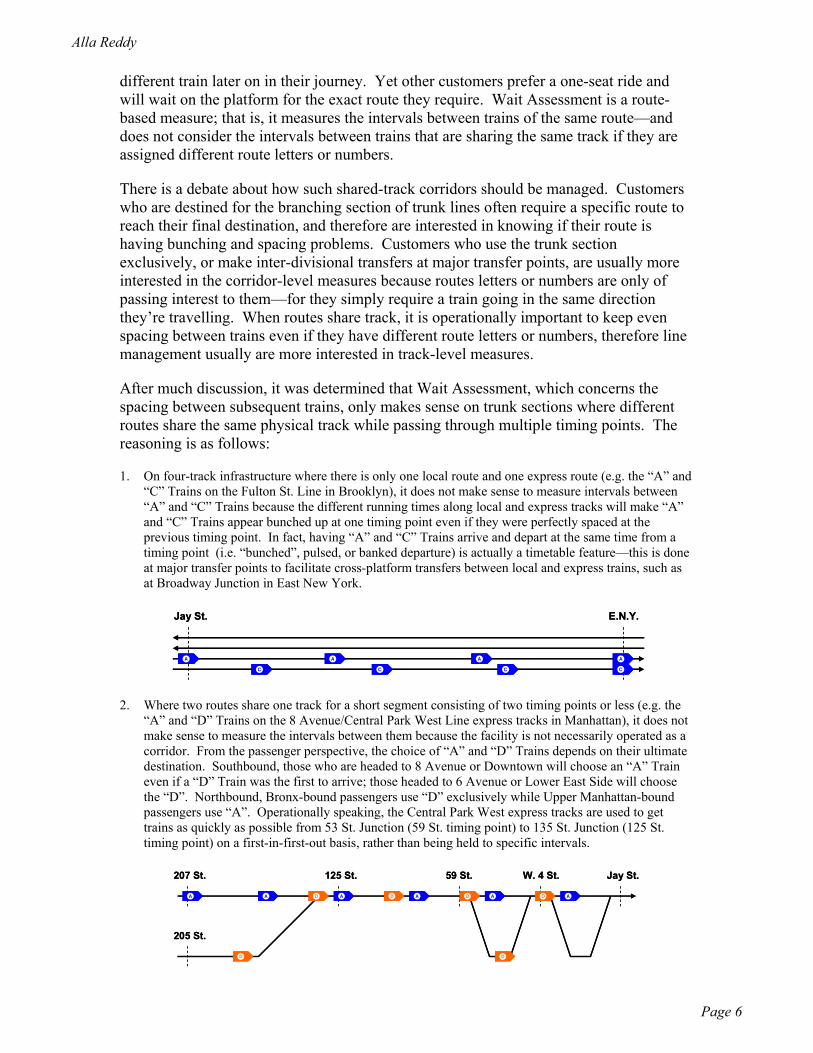
After much discussion, it was determined that Wait Assessment, which concerns the spacing between subsequent trains, only makes sense on trunk sections where different routes share the same physical track while passing through multiple timing points. The reasoning is as follows:
1. On four-track infrastructure where there is only one local route and one express route (e.g. the “A” and “C” Trains on the Fulton St. Line in Brooklyn), it does not make sense to measure intervals between “A” and “C” Trains because the different running times along local and express tracks will make “A” and “C” Trains appear bunched up at one timing point even if they were perfectly spaced at the previous timing point. In fact, having “A” and “C” Trains arrive and depart at the same time from a timing point (i.e. “bunched”, pulsed, or banked departure) is actually a timetable feature—this is done at major transfer points to facilitate cross-platform transfers between local and express trains, such as at Broadway Junction in East New York.
Jay St. E.N.Y.
AC
AC
A AC C
Jay St. E.N.Y.
AACC
AACC
AA AACC CC
2. Where two routes share one track for a short segment consisting of two timing points or less (e.g. the “A” and “D” Trains on the 8 Avenue/Central Park West Line express tracks in Manhattan), it does not make sense to measure the intervals between them because the facility is not necessarily operated as a corridor. From the passenger perspective, the choice of “A” and “D” Trains depends on their ultimate destination. Southbound, those who are headed to 8 Avenue or Downtown will choose an “A” Train even if a “D” Train was the first to arrive; those headed to 6 Avenue or Lower East Side will choose the “D”. Northbound, Bronx-bound passengers use “D” exclusively while Upper Manhattan-bound passengers use “A”. Operationally speaking, the Central Park West express tracks are used to get trains as quickly as possible from 53 St. Junction (59 St. timing point) to 135 St. Junction (125 St. timing point) on a first-in-first-out basis, rather than being held to specific intervals.
125 St. Jay St.
A
59 St. W. 4 St.207 St.
205 St.
A A A AD D AD
D
D
D
125 St. Jay St.
AA
59 St. W. 4 St.207 St.
205 St.
AA AA AA AADD DD AADD
DD
DD
DD
L.L.
U.L.
North
B3 B5B4B1
B6 B2
T
T
T
59 St
34 St
42 St
M
D4D3
A5 A6
(Master toweron mezzanine)
86 St
L.L. MR-59 StU.L.
72 St
L.L. M R-59 StU.L.
81 St
A1 B3 A3 A4 B4 A2
50 StU.L. L.L.
30 St
42 St
SouthT
A5T
34 St
23 St
14 St
B6T2
B5T1
C-50 St57 St
50 StT
7 AvU.L.
L.L.
5 Av
A7A5A6
A1 A3 A4 A2
U.L. L.L.Concourse
Tubes
M
M
M
A
C-Tower A
C1C2 C3-4
A1 A3A5 A4 A6 A2
A7 A6 A5 A1 A2
U.L.L.L.
C2
C3 C1 C2 C4
C1(Master tower and relay room on mezzanine)
A3 A4207 StR-207 St
Yard
Dyckman StR-207 St YardNote: Dyckman St is referred toas 200 St on control panels.
A5 A6
MA3 A4
190 St
181 StR-207 St Yard(Relay room on mezzanine)
175 St 174 St YardR-207 St Yardor 168 St
M168 StR-207 St Yard(Relay room on mezzanine)
163 St
155 St
U.L. L.L.R-59 St145 St
M
M 135 StR-59 St
M
103 St
125 StR-59 St(Relay room on mezzanine)
110 St
116 St
155 St-8 Av M
161 StR-Bedford Park Bl
M 167 StR-Bedford Park Bl(Relay room onmezzanine)
C5 C1 C2C3-4
174-175 Sts
170 St
182-183 Sts
Fordham Rd
Kingsbridge Rd
C6M
ConcourseYard
C7
C5C6
C-ConcourseYard
205 St
Bedford Park Bl
R-Bedford Park Bl(Relay room onmezzanine)
Tremont Av
MC1C2
R-Bedford Park Bl(Relay room on
mezzanine)
M
207 StYard
96 St
Conc
ours
e Lin
e
G3G4
M
G4
G3
L.L.
U.L.
LexingtonAv
R-QueensboroPlaza or 21 St
14 St
23 St
B1 B2
U.L.
8 Av
enue
Line B3 B4
L.L.
6 Av
enue
Line
A6
A5
A2
A4A3
A1
K5K2
K1
K5A7
K6A8
Pitkin YardA5 A6 A8 A7
L.L.
U.L.A5
TTT
A2A4A5A3A1
Ralph
AvRo
ckaw
ayAv
Broa
dway
Jct
Libert
y Av
T
Eucli
d Av
Van S
iclen
AvSh
ephe
rdAv
Grant Av C-Pitkin Yard
Clint
on-
Was
hingto
n Avs
Fran
klin A
vNo
stran
d Av
Utica
Av
Kings
ton-
Throo
p Avs
F4F3 K1
K2
F3F1F4
F2
Liberty AvJunction
Rock
away
Bl
K3-4K6
88St
80St
C-Pit
kinYa
rd
AK3-4
LeffertsBl
R-Liberty Av JctNote: Lefferts Bl is referred to
as Lefferts Av on control panels.
104 S
t11
1 St
Aqueduct Racetrack
Aqueduct
A
F2F1
Howard BeachR-Liberty Av Jct
North Channel Bridge
F6
Hammels WyeR-Rockaway Park
F6F4AF3A
F3A
M
A
Rockaway ParkBeach 116 St
F4AF4F3
F3F4F5
F5
Beac
h 105
StBe
ach 98
StBe
ach 9
0 St
Beac
h 67 S
tBeachChannelBridge Far
RockawayMott AveBe
ach 4
4 St
T
Beac
h 25 S
t
Broad ChannelR-Liberty Av Jct
Note: 80 St is referredto as Hudson St on the
Pitkin Yard control panel.
AB2AB1 A1 B1 B3 B4 A2 B2
A4 A2A3A1
A3 A5 A4
A4A3
BJ2B6
B5
B1 B2BJ1
B3B4
BJ1BJ2
Cranberry StTubes
A4 B2
A3B1
T
T
T
U.L. L.L.
Spring St
A1 A2
High StBroadway-Nassau St
W 4 St
R-Essex St2 Av
Grand St
Delancey StR-Essex St
East Broadway
Rutgers St Tubes
York St
Jay St
B1 B3 B4 B2
E1 E2
T
L.L.
Carroll St
A2A1
Court St
New YorkTransit Museum
T
Hoyt-Schermerhorn Sts
Broadway-Lafayette St
R-Essex St
M Bergen StR-Jay StU.L.
B2B1
T
Note: Tracks B3 and B4take a more direct routethrough Prospect Park.
7 Av4 Av
15 St-Prospect Park
Fort Hamilton Pky
B5 B6
U.L. L.L.
T
B5 B7 B8 B6
Church Av
Ditmas AvR-Church Av
Prospect Park Line
6 Avenue Line
A2A4
A3A1
Rockaway Line
Liberty Av Line
Fulton St LineFulton St
Classon Av
Bedford-Nostrand AvsT
E1E3
E4E2
E3-4
Clinton-Washington Avs
Broadway
Myrtle-Willoughby Avs
Flushing Av
Metropolitan Av
Greenpoint Av
TNassau Av
Greenpoint Tubes
QueensPlaza
T1D3D4
U.L.
L.L.
D5D7D8D6
E5
D1E1
M
TT2D2
D5
Court SqR-Queensboro Plaza
21 St
D1M
M
R-Queensboro Plaza(Relay room on mezzanine)
23 StC-Queens Plaza
T North
ernBl
46St36
StR-
Quee
nsbo
roPla
zaSt
einwa
y St
Note: Tracks D3 and D4 take a moredirect route along Northern Bl
65St
Woo
dhav
enBl
75 Av
71-C
ontin
ental
Av
63Dr
67Av
Gran
d Av
D1D3
Roos
evelt
Av
Elmhu
rstAv
TD4D2
E2D2
GD2GD1
Note:36 St Relay Room located within39 Av Ventilation Complex.
UnionTpke
U.L.
L.L.
D9
D10
D5 D6 D9D10
T
D1
D3D4
D2
U.L.
L.L.
D5D3D4D6
D1D7D8D2
(Tower onlower level)
ParsonsBl
SutphinBl
Archer Av Line
M
Van W
yck B
lR-
Parso
nsBl
(Rela
y roo
mon
mezza
nine)
Sutph
inBl
169 S
tC-
179 St
T T
179 S
t
Parso
nsBl
Jamaica-Van WyckR-Parsons Bl
M
U.L.M
JamaicaYard
D1
D4D2
D3
Queens Line
Tubes53 St
C-5 Ave
LexingtonAv
D4D3
T1T2
A
R-QueensboroPlaza
21 St
RooseveltIsland
63 St
Tubes
M
FDR DrR-Queensboro
Plazaor 21 St
63 St
Tubes
63 Street Line
Queens Line
8 Av
enue
Line
To BMT
Lafayette Av
A1
A2
A1
A1A2
A2
RockawayLine
F6
Rockaway ParkYard
Crosstown Line
Av I
Bay Pky
Av N
Av P
Kings Hwy
Av U
T
18 Av
Av XC-Tower C
B5B6Culver
Yard
Neptune AvNote: Neptune Av is referred toas Van Sicklen on control panels.
CulverLine
B1 B2B3-4
W 8 StA2
B2A1B1
ABCDEFH G
To BMT
Lower Level
Coney IslandStillwell AvR-Stillwell Av
To BMT
A1A2
B1 B3-4
B2
B3 B4Smith-9 Sts
Note:Track A2
out of servicefor vintage train storage.
(Relay room on mezzanine)World Trade Center
Chambers StR-World Trade Center M
M
Canal StR-World Trade Center
MTA New York City TransitIND Division
Schematic Track Diagram
Note: Track B2 is out of servicefor tunnel lighting rehabilitation work.Track B3 is out of service for signalrehabilitation work.
Note: The temporaryplatform at Smith-9 Sts
is only 300' long.
Note:Track F5 is out of service for
dynamic and accelerationtests on new and existing
equipment.
Note:Track F3 is
out of service(for work train
use only)
Note: Tracks B2, B3 and B4and the northbound platforms
at 4 Av and Smith-9 Stsare out of service for structure,
signal and station rehabilitation work.
Office of the Executive Vice PresidentDivision of Operations Planning
February 2011
Note:Tracks G3 and G4are out of servicefor reconstruction
of platforms.
Fixed bridge
Moveable bridge
Tunnel portal
Double/Single slip switchBumping blockTrack number
TrackTrack out of service or under construction
Location where track number changesA1 B1
A1
Platform
Underwater tunnelsTubes
Legend
Lower level/Upper levelL.L./U.L.
C- Controlled from or part of named interlockingInterlocking remote controlledR-
Maintainer's control panel in relay roomM
Auxiliary control panelA
Interlocking towerT
Master towerClosed platform
60 StConnection
To BMT
Chrystie StConnection
To BMT
Beac
h 60 S
t(C
losed
north
boun
d forsta
tion reh
abilita
tion wo
rk)
(Clos
edno
rthbo
und for
statio
n rehab
ilitatio
n work)
Beac
h 36 S
t
Alla Reddy
Page 7
Based on these criteria, only three major corridors were identified where it made sense to measure Wait Assessment on a corridor level. Those corridors are:
1. Lexington Ave IRT express tracks (host to “4” and “5” Trains) between 125 St., Manhattan and Franklin Av., Brooklyn, with timing points at 125 St., 86 St., 42 St., Brooklyn Bridge, Bowling Green, Borough Hall, Flatbush Av., and Franklin Av.
2. West Side IRT express tracks (host to “2” and “3” Trains) between 135 St-Lenox, Manhattan and Franklin Av., Brooklyn, with timing points at 135 St., 96 St., 42 St., Chamber St., Borough Hall, Flatbush Av., and Franklin Av.
3. Queens Boulevard Line (host to “E” and “F” Express Trains, and “M” and “R” Local Trains) between Continental Av., Queens, and 36 St. Interlocking, Queens, with timing points at Continental, Roosevelt, and 36 St.
All other shared-track segments were too short to be properly operated as a corridor, and customer train choice tend to be route based. Because of the availability of automatically collected signal system data, the West Side IRT Corridor was chosen as a test case and the Wait Assessment results were computed using different algorithms.
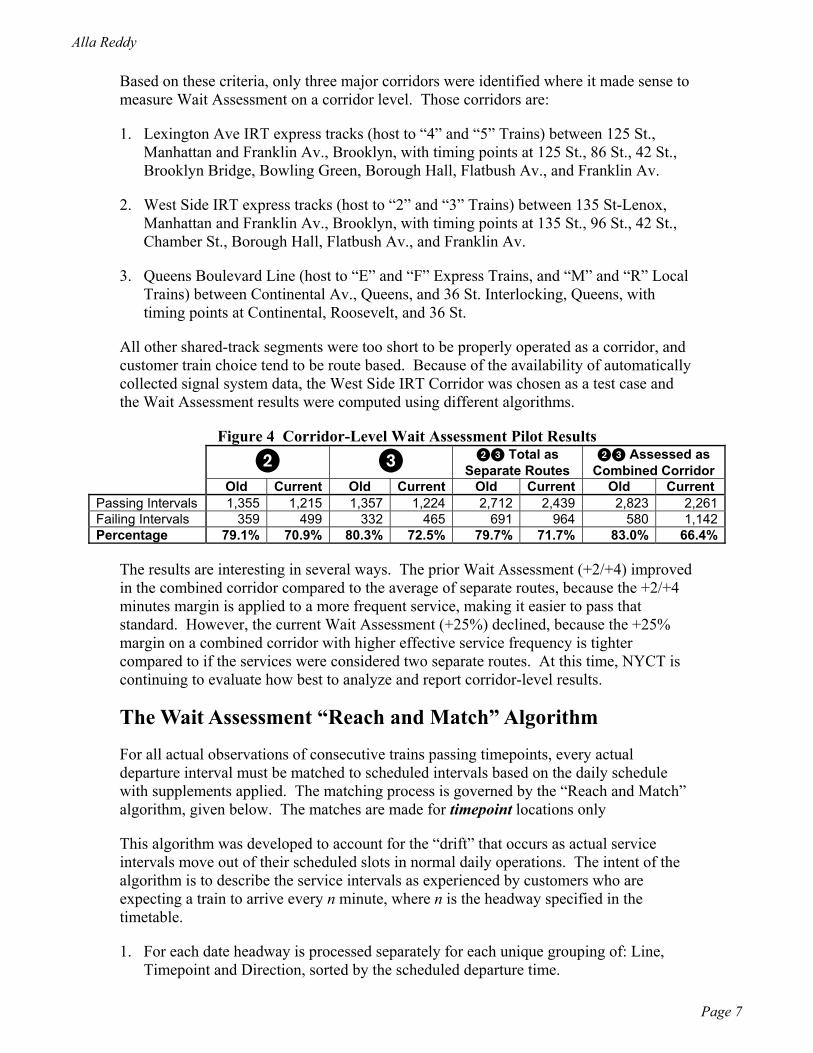
Figure 4 Corridor-Level Wait Assessment Pilot Results 2 3 23 Total as
Separate Routes 23 Assessed as
Combined Corridor Old Current Old Current Old Current Old Current Passing Intervals 1,355 1,215 1,357 1,224 2,712 2,439 2,823 2,261Failing Intervals 359 499 332 465 691 964 580 1,142Percentage 79.1% 70.9% 80.3% 72.5% 79.7% 71.7% 83.0% 66.4%
The results are interesting in several ways. The prior Wait Assessment (+2/+4) improved in the combined corridor compared to the average of separate routes, because the +2/+4 minutes margin is applied to a more frequent service, making it easier to pass that standard. However, the current Wait Assessment (+25%) declined, because the +25% margin on a combined corridor with higher effective service frequency is tighter compared to if the services were considered two separate routes. At this time, NYCT is continuing to evaluate how best to analyze and report corridor-level results.
The Wait Assessment “Reach and Match” Algorithm
For all actual observations of consecutive trains passing timepoints, every actual departure interval must be matched to scheduled intervals based on the daily schedule with supplements applied. The matching process is governed by the “Reach and Match” algorithm, given below. The matches are made for timepoint locations only
This algorithm was developed to account for the “drift” that occurs as actual service intervals move out of their scheduled slots in normal daily operations. The intent of the algorithm is to describe the service intervals as experienced by customers who are expecting a train to arrive every n minute, where n is the headway specified in the timetable.
1. For each date headway is processed separately for each unique grouping of: Line, Timepoint and Direction, sorted by the scheduled departure time.
Alla Reddy
Page 8
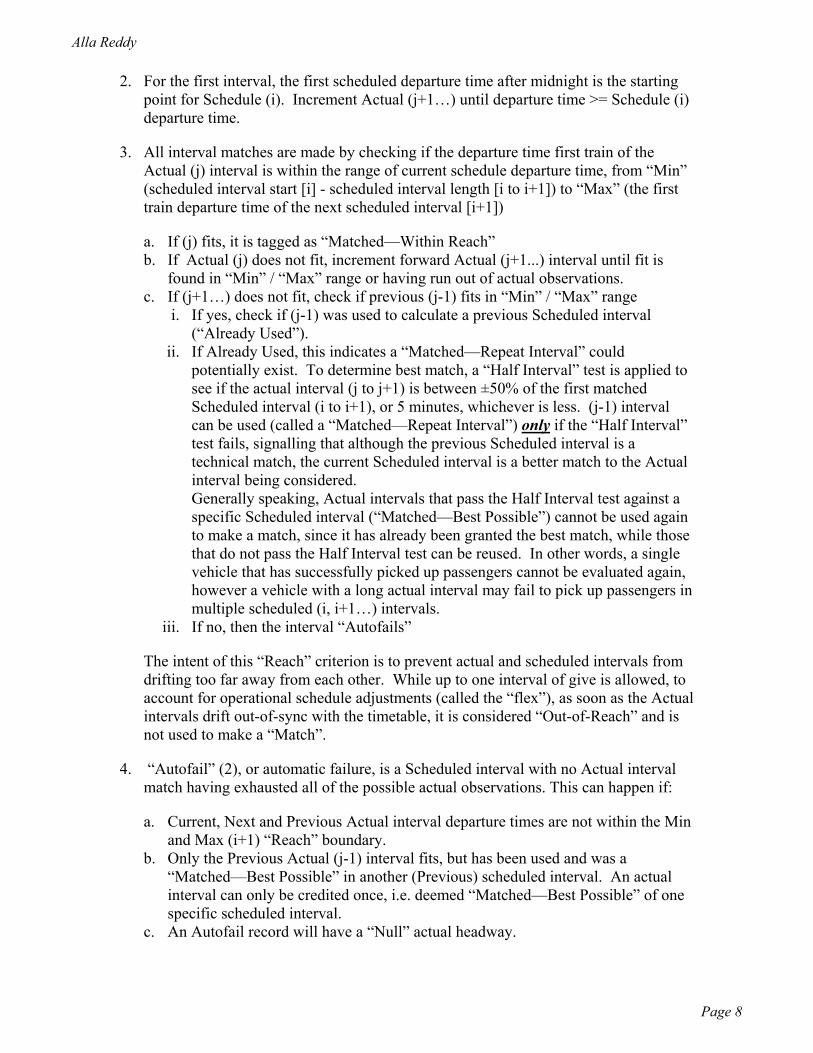
2. For the first interval, the first scheduled departure time after midnight is the starting point for Schedule (i). Increment Actual (j+1…) until departure time >= Schedule (i) departure time.
3. All interval matches are made by checking if the departure time first train of the Actual (j) interval is within the range of current schedule departure time, from “Min” (scheduled interval start [i] - scheduled interval length [i to i+1]) to “Max” (the first train departure time of the next scheduled interval [i+1])
a. If (j) fits, it is tagged as “Matched—Within Reach” b. If Actual (j) does not fit, increment forward Actual (j+1...) interval until fit is
found in “Min” / “Max” range or having run out of actual observations. c. If (j+1…) does not fit, check if previous (j-1) fits in “Min” / “Max” range
i. If yes, check if (j-1) was used to calculate a previous Scheduled interval (“Already Used”).
ii. If Already Used, this indicates a “Matched—Repeat Interval” could potentially exist. To determine best match, a “Half Interval” test is applied to see if the actual interval (j to j+1) is between ±50% of the first matched Scheduled interval (i to i+1), or 5 minutes, whichever is less. (j-1) interval can be used (called a “Matched—Repeat Interval”) only if the “Half Interval” test fails, signalling that although the previous Scheduled interval is a technical match, the current Scheduled interval is a better match to the Actual interval being considered.
Generally speaking, Actual intervals that pass the Half Interval test against a specific Scheduled interval (“Matched—Best Possible”) cannot be used again to make a match, since it has already been granted the best match, while those that do not pass the Half Interval test can be reused. In other words, a single vehicle that has successfully picked up passengers cannot be evaluated again, however a vehicle with a long actual interval may fail to pick up passengers in multiple scheduled (i, i+1…) intervals.
iii. If no, then the interval “Autofails”
The intent of this “Reach” criterion is to prevent actual and scheduled intervals from drifting too far away from each other. While up to one interval of give is allowed, to account for operational schedule adjustments (called the “flex”), as soon as the Actual intervals drift out-of-sync with the timetable, it is considered “Out-of-Reach” and is not used to make a “Match”.
4. “Autofail” (2), or automatic failure, is a Scheduled interval with no Actual interval match having exhausted all of the possible actual observations. This can happen if:
a. Current, Next and Previous Actual interval departure times are not within the Min and Max (i+1) “Reach” boundary.
b. Only the Previous Actual (j-1) interval fits, but has been used and was a “Matched—Best Possible” in another (Previous) scheduled interval. An actual interval can only be credited once, i.e. deemed “Matched—Best Possible” of one specific scheduled interval.
c. An Autofail record will have a “Null” actual headway.
Alla Reddy
Page 9
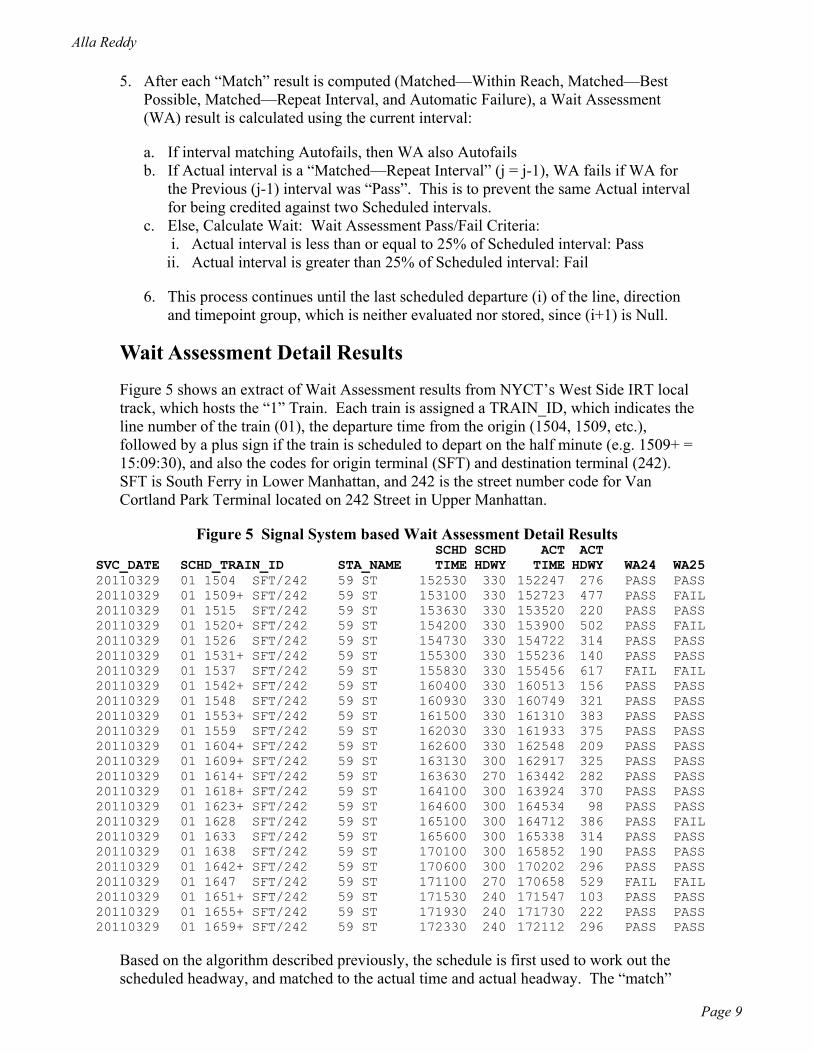
5. After each “Match” result is computed (Matched—Within Reach, Matched—Best Possible, Matched—Repeat Interval, and Automatic Failure), a Wait Assessment (WA) result is calculated using the current interval:
a. If interval matching Autofails, then WA also Autofails b. If Actual interval is a “Matched—Repeat Interval” (j = j-1), WA fails if WA for
the Previous (j-1) interval was “Pass”. This is to prevent the same Actual interval for being credited against two Scheduled intervals.
c. Else, Calculate Wait: Wait Assessment Pass/Fail Criteria: i. Actual interval is less than or equal to 25% of Scheduled interval: Pass
ii. Actual interval is greater than 25% of Scheduled interval: Fail
6. This process continues until the last scheduled departure (i) of the line, direction and timepoint group, which is neither evaluated nor stored, since (i+1) is Null.
Wait Assessment Detail Results
Figure 5 shows an extract of Wait Assessment results from NYCT’s West Side IRT local track, which hosts the “1” Train. Each train is assigned a TRAIN_ID, which indicates the line number of the train (01), the departure time from the origin (1504, 1509, etc.), followed by a plus sign if the train is scheduled to depart on the half minute (e.g. 1509+ = 15:09:30), and also the codes for origin terminal (SFT) and destination terminal (242). SFT is South Ferry in Lower Manhattan, and 242 is the street number code for Van Cortland Park Terminal located on 242 Street in Upper Manhattan.
Figure 5 Signal System based Wait Assessment Detail Results
SVC_DATE SCHD_TRAIN_ID STA_NAME SCHD TIME
SCHD HDWY
ACT TIME
ACT HDWY WA24 WA25
20110329 01 1504 SFT/242 59 ST 152530 330 152247 276 PASS PASS 20110329 01 1509+ SFT/242 59 ST 153100 330 152723 477 PASS FAIL 20110329 01 1515 SFT/242 59 ST 153630 330 153520 220 PASS PASS 20110329 01 1520+ SFT/242 59 ST 154200 330 153900 502 PASS FAIL 20110329 01 1526 SFT/242 59 ST 154730 330 154722 314 PASS PASS 20110329 01 1531+ SFT/242 59 ST 155300 330 155236 140 PASS PASS 20110329 01 1537 SFT/242 59 ST 155830 330 155456 617 FAIL FAIL 20110329 01 1542+ SFT/242 59 ST 160400 330 160513 156 PASS PASS 20110329 01 1548 SFT/242 59 ST 160930 330 160749 321 PASS PASS 20110329 01 1553+ SFT/242 59 ST 161500 330 161310 383 PASS PASS 20110329 01 1559 SFT/242 59 ST 162030 330 161933 375 PASS PASS 20110329 01 1604+ SFT/242 59 ST 162600 330 162548 209 PASS PASS 20110329 01 1609+ SFT/242 59 ST 163130 300 162917 325 PASS PASS 20110329 01 1614+ SFT/242 59 ST 163630 270 163442 282 PASS PASS 20110329 01 1618+ SFT/242 59 ST 164100 300 163924 370 PASS PASS 20110329 01 1623+ SFT/242 59 ST 164600 300 164534 98 PASS PASS 20110329 01 1628 SFT/242 59 ST 165100 300 164712 386 PASS FAIL 20110329 01 1633 SFT/242 59 ST 165600 300 165338 314 PASS PASS 20110329 01 1638 SFT/242 59 ST 170100 300 165852 190 PASS PASS 20110329 01 1642+ SFT/242 59 ST 170600 300 170202 296 PASS PASS 20110329 01 1647 SFT/242 59 ST 171100 270 170658 529 FAIL FAIL 20110329 01 1651+ SFT/242 59 ST 171530 240 171547 103 PASS PASS 20110329 01 1655+ SFT/242 59 ST 171930 240 171730 222 PASS PASS 20110329 01 1659+ SFT/242 59 ST 172330 240 172112 296 PASS PASS
Based on the algorithm described previously, the schedule is first used to work out the scheduled headway, and matched to the actual time and actual headway. The “match”
Alla Reddy
Page 10
part of the algorithm determines whether the interval is within reach, and some intervals that are too narrow or too wide easily falls out of reach (e.g. the 1520+ departure from SFT was out of reach by the time the train had moved north to 59 St.) Initially, Wait Assessment was defined as +2/+4 minutes, with results shown in the WA24 column. Note that it is possible for an interval to be out-of-reach yet for Wait Assessment to pass, because service was provided during that time. When the stricter “+25%” standard came into effect, with results shown in the WA25 column, there were more failed intervals.
Daily Reporting
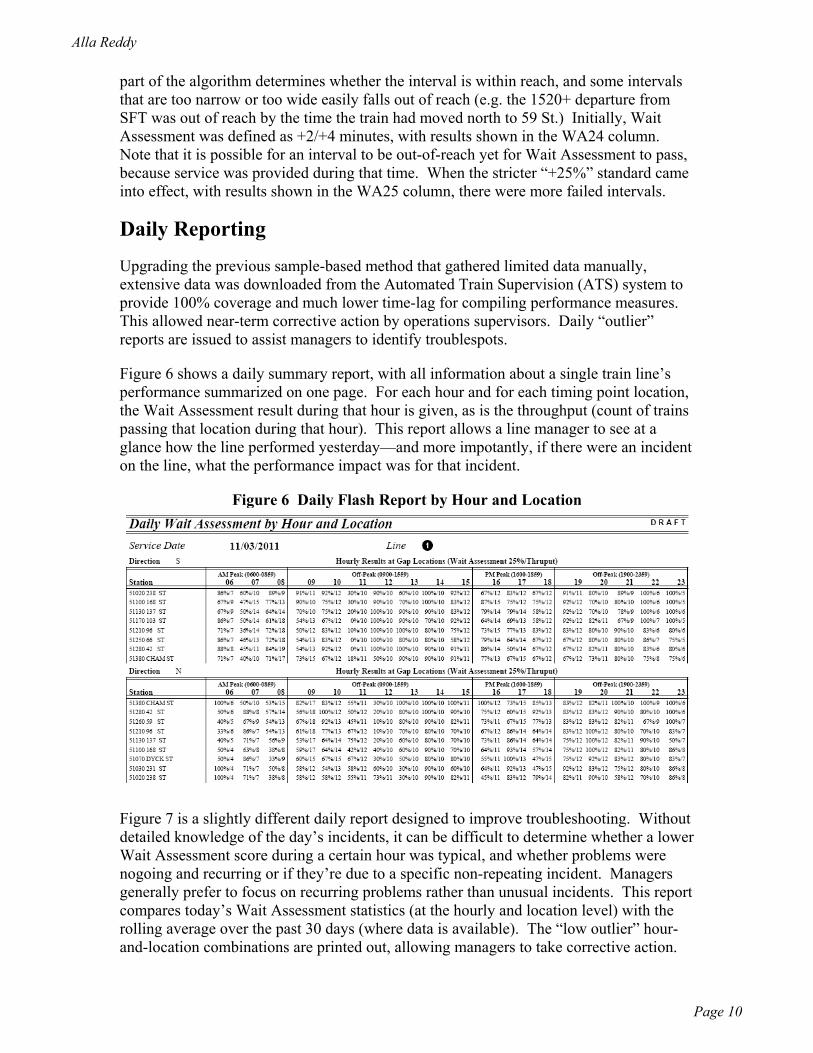
Upgrading the previous sample-based method that gathered limited data manually, extensive data was downloaded from the Automated Train Supervision (ATS) system to provide 100% coverage and much lower time-lag for compiling performance measures. This allowed near-term corrective action by operations supervisors. Daily “outlier” reports are issued to assist managers to identify troublespots.
Figure 6 shows a daily summary report, with all information about a single train line’s performance summarized on one page. For each hour and for each timing point location, the Wait Assessment result during that hour is given, as is the throughput (count of trains passing that location during that hour). This report allows a line manager to see at a glance how the line performed yesterday—and more impotantly, if there were an incident on the line, what the performance impact was for that incident.
Figure 6 Daily Flash Report by Hour and Location
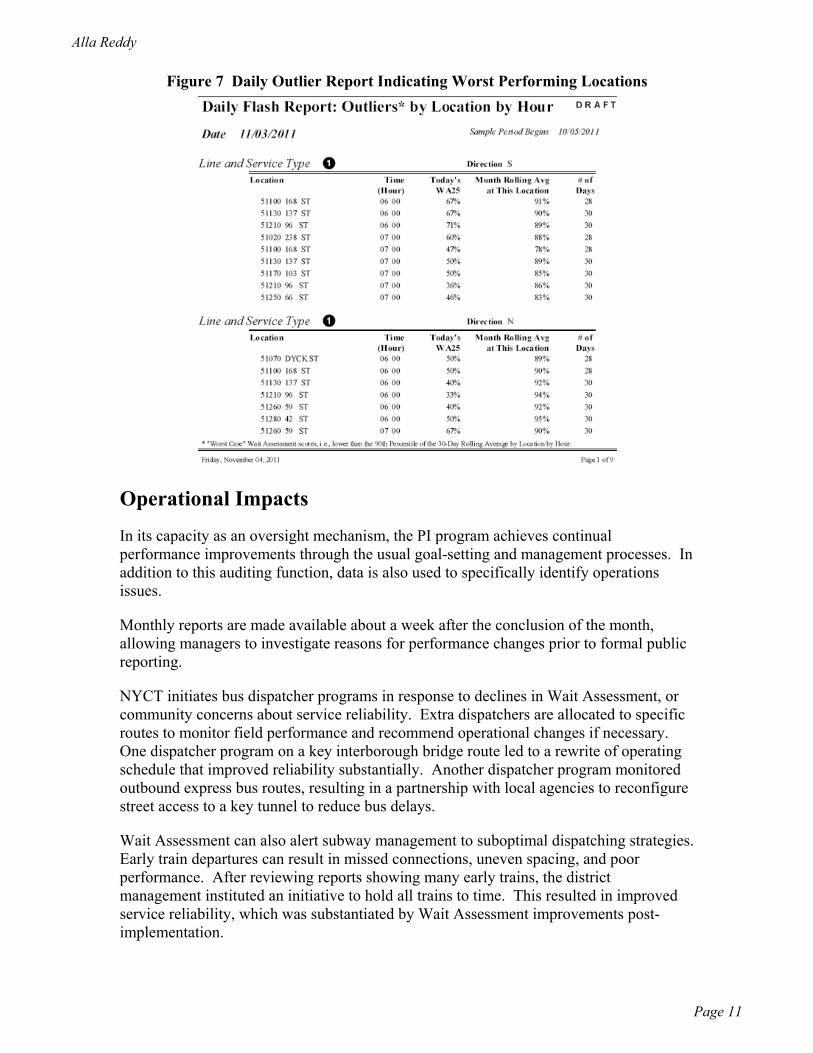
Figure 7 is a slightly different daily report designed to improve troubleshooting. Without detailed knowledge of the day’s incidents, it can be difficult to determine whether a lower Wait Assessment score during a certain hour was typical, and whether problems were nogoing and recurring or if they’re due to a specific non-repeating incident. Managers generally prefer to focus on recurring problems rather than unusual incidents. This report compares today’s Wait Assessment statistics (at the hourly and location level) with the rolling average over the past 30 days (where data is available). The “low outlier” hour-and-location combinations are printed out, allowing managers to take corrective action.
Alla Reddy
Page 11
Figure 7 Daily Outlier Report Indicating Worst Performing Locations
Operational Impacts
In its capacity as an oversight mechanism, the PI program achieves continual performance improvements through the usual goal-setting and management processes. In addition to this auditing function, data is also used to specifically identify operations issues.
Monthly reports are made available about a week after the conclusion of the month, allowing managers to investigate reasons for performance changes prior to formal public reporting.
NYCT initiates bus dispatcher programs in response to declines in Wait Assessment, or community concerns about service reliability. Extra dispatchers are allocated to specific routes to monitor field performance and recommend operational changes if necessary. One dispatcher program on a key interborough bridge route led to a rewrite of operating schedule that improved reliability substantially. Another dispatcher program monitored outbound express bus routes, resulting in a partnership with local agencies to reconfigure street access to a key tunnel to reduce bus delays.
Wait Assessment can also alert subway management to suboptimal dispatching strategies. Early train departures can result in missed connections, uneven spacing, and poor performance. After reviewing reports showing many early trains, the district management instituted an initiative to hold all trains to time. This resulted in improved service reliability, which was substantiated by Wait Assessment improvements post-implementation.
Alla Reddy
Page 12
Conclusions
MTA New York City Transit (NYCT) has responded to the challenge of “doing more with less” by re-tooling its performance measurement frameworks to better capture performance from a customer’s perspective, respond to management system improvement initiatives, and better incentivize operating decisions that deliver excellent customer service.
Recent improvements to the WA standard have made it a more meaningful relative performance measure that is stricter for lines with more frequent service. The former pass/fail standard has now been replaced with by a distribution for failing intervals that provides customers a more detailed view of system performance. NYCT is continuing to improve its performance standards by understanding how WA could fairly and best applied to shared-track territories where different routes can be treated as the same service corridor and train performance analyzed without reference to route designation.
Upgrading a previous sample-based method that gathered limited data manually, extensive data was downloaded from the Automated Train Supervision (ATS) to provide 100% coverage and much lower time-lag for compiling performance measures. This allowed near-term corrective action by operations supervisors.
These improvements to NYCT’s customer-centric service performance indicators were developed with extensive consultation with operations management, have been ratified by the MTA Board, and endorsed by stakeholders and public advocacy groups. In the tradition of improved reporting, NYCT will continue to explore new ways of assessing its own performance and reporting it for both internal diagnostic purposes and for public accountability.
Acknowledgements
The author would like to thank Alex Lu and John Cucarese for assistance in preparing this manuscript. Responsibility for errors or omissions remains with the author. Opinions expressed are the author’s and do not necessarily reflect official policy of Metropolitan Transportation Authority or MTA New York City Transit.
Alla Reddy
References
[1] Reddy, Alla V., A. Lu, and T. Wang. Subway Productivity, Profitability, and Performance: A Tale of Five Cities. TRB Paper #10-0487. In Transportation Research Records 2143, pp.48-58, Transportation Research Board of the National Academies, Washington, D.C., 2010.
[2] Office of the Inspector General, State of New York. Regularity Indices for Evaluating Transit Performance. MTA/IG Technical Report 90-32. New York, N.Y., 1990.
[3] Cramer, Anthony, J. Cucarese, M. Tran, A. Lu, and A.V. Reddy. Performance Measurements on Mass Transit: New York City Transit Authority Case Study. In Transportation Research Records 2111, Transportation Research Board of the National Academies, Washington, D.C., 2009.
[4] Henderson, G., P. Kwong, and H. Adkins. Subway Reliability and the Odds of Getting There On-Time. In Transportation Research Record: Journal of the Transportation Research Board, No. 1297, Transportation Research Board of the National Academies, Washington, D.C., 1991, pp.10-13.
[5] Adebisi, O. A Mathematical Model for Headway Variance of Fixed Bus Routes. Transportation Research B, Vol. 20B, No. 1, 1986, pp 59-70.
[6] Henderson, G., P. Kwong, and H. Adkins. Regularity Indices for Evaluating Transit Performance. In Transportation Research Record: Journal of the Transportation Research Board, No. 1297, Transportation Research Board of the National Academies, Washington, D.C., 1991.
[7] Wilson, N. H. M., D. Nelson, A. Palmere, T. Grayson and C. Cederquist. Service Quality Monitoring for High-Frequency Transit Lines. In Transportation Research Record: Journal of the Transportation Research Board, No. 1349, Transportation Research Board of the National Academies, Washington, D.C., 1992, pp. 3-11.
[8] Kittelson & Associates Inc. Transit Cooperative Research Program (TCRP) Project G-6 Interim Report: A Guidebook for Developing a Transit Performance Measurement System. Transportation Research Board of the National Academies, Washington D.C., 2002.
[9] Permanent Citizens Advisory Committee to the MTA. Research Report—Minutes Matter: A Review of Performance Metrics at the MTA. New York, N.Y., 2011.
[10] Graham, Daniel, X. Liu, and M. Trompet. Development of Key Performance Indicator to Compare Regularity of Service Between Urban Bus Operators. Paper #11-0540, Presented at the Transportation Research Board 90th Annual Meeting, Washington, D.C., 2011.
[11] Wilson, Nigel H.M., R. Macchi, R. Fellows, and A. Deckoff. Improving Service on the MBTA Green Line through Better Operations Control. In Transportation Research Record 1361, pp. 296-304, Washington, D.C., 1992.