Embed Size (px)
Citation preview
SUBURBANISATION VERSUS RE-CENTRALISATION: THE
CHANGING IMPACT OF INTERNATIONAL MIGRATION’S
MASSIVE INFLOWS IN THE SPANISH LARGEST METROPOLITAN
AREAS (2000-2010)1
Jordi Bayona-i-Carrasco
Human Geography Department, Universitat de Barcelona
e-mail: [email protected]
Fernando Gil-Alonso
Human Geography Department, Universitat de Barcelona
e-mail: [email protected]
Isabel Pujadas-i-Rúbies
Human Geography Department, Universitat de Barcelona
e-mail: [email protected]
Abstract: This paper analyses the impact of international migration on the population‟s
change and composition of the Spanish largest urban areas, focusing on foreigners‟ impact on
suburbanisation and re-centralisation dynamics. During this last decade, Spain has been the
European country with largest international migration inflows. The proportion of foreign
residents has therefore increased from a trifling 2.3% in 2000 to today‟s 12.2%. In other
words, in absolute terms, more than five million new inhabitants have been added to the
existing population. Moreover, they have been unevenly distributed throughout the territory,
concentrating in specific provinces which specialise on tourist, services or intensive
agriculture jobs, and in large urban areas. It is on this last issue that the paper will be
focusing. Spain has fifteen large metropolitan areas with more than half a million inhabitants.
According to 2010 data, the percentage of foreigners in their core cities ranges from 17.5%
and 17.4% in Barcelona and Madrid to 5.3% or 1.7% in Seville and Cadiz. After two previous
decades of stagnation or population decrease, central city figures have clearly grown (due
basically to foreign immigration) during this 2000-2010 period, while suburbanisation –to
which foreigners have also incorporated– has also intensified. The economic crisis upsurge
(2008) and its strong impact on the real estate sector, draw to an end to this urban expansion
and growth period: foreign population inflows have diminished since then, as well as
Spaniard‟s residential moves from core cities towards peripheries. Therefore, mobility has
been reduced and metropolitan areas have entered a new phase to which we will draw our
interest. The paper seeks: 1) to provide an overview of recent population changes in Spanish
metropolitan areas; 2) to look for metropolitan area urban development timing differences, as
1 This paper is a result of the R+D projects “Residential strategies and urban models at the RMB” (CSO2010-
22117-C02-02), directed by Dr. Anna Alabart, and “Spain‟s demographic dynamics through the 20th Century
Censuses” (CSO2008-06217), directed by Dr. Fernando Gil-Alonso. Both research projects are financed by the
Spanish Ministry of Science and Innovation through the 2008-2011 R+D+I National Plan. Authors are members
of the Population, Territory and Citizenship Research Group, directed by Dr. Isabel Pujadas, which has been
distinguished by the Generalitat de Catalunya (ref.: 2009SGR01086).
2
well as differences in their respective core city‟s role and in the type of outskirts; and 3) to
assess the impact that the current economic crisis has had on these trends, pointing to the most
affected metropolitan areas and establishing typologies that will distinguish those where
suburbanisation has further continued, those where re-centralisation dynamics are currently
the most significant trend, and those where a mix of both can be found.
Keywords: Foreign immigration, suburbanisation, urban growth, metropolitan areas, Spain.
1. Introduction
Spain‟s population has undergone an abrupt increase due to an intense, brief and
unexpected foreign immigration rise. In a decade, the country reached, from less that 40
million inhabitants, -considered in some early 1990‟s population projections (Instituto de
Demografía, 1994) as Spain‟s ceiling-, to 47 million residents. These 6 extra million
inhabitants represent the highest absolute and relative (more than 14%) growth since the
1900. Additionally, it should also be taken into account that this increase coexisted with
extremely low fertility and mortality rates. Even though such a growth has an impact over the
whole territory, certain areas have been particularly affected due to foreigner‟s uneven spatial
distribution. The paper focuses on its effects on the main Spanish metropolitan areas, which
are districts recently undergoing major changes (Feria and Albertos, 2010). Though, as we
will see, many have been considered by foreign immigrants as attraction points (but also only
as entry doors, therefore settling elsewhere), other cities have hardly received any
demographic impact. In the mid 1990‟s, the Spanish urban system was at a maturity stage,
and suburbanisation and metropolitan expansion processes dominated. In other words, most
metropolitan centres were losing population, their residents were progressively ageing and,
urban peripheries were rapidly expanding. Then, particularly from 2000 onwards, this
development was abruptly interrupted by the massive arrival of foreign migrants, beginning a
new urban demographic growth cycle, which present authors have studied for the four major
Spanish metropolitan areas: Madrid, Barcelona, Valencia and Seville (Bayona and Gil-
Alonso, 2008; Bayona et al., 2011). Population decline in their central cities started to
diminish and some are even presently once again gaining population as foreigners are
compensating the constant local origin population loss. Meanwhile suburbanization processes
and flows, mainly made up of Spanish people though increasingly also of immigrants, grew,
accelerating the phenomenon. This demographic and geographic expansive cycle ends when
the global economic crisis -worsened by a local real estate market collapse after the 1996-
2007 inflationist period- strikes Spain. Even though foreigner inflows have, since then,
decreased in Spain as a whole, their impact on the largest urban areas is probably very
heterogeneous.
As this latter period has already lasted for some years, we belief that some conclusions
can start to extracted both from changes introduced by high immigration years and from the
effects of the economic crisis on migration flows. Therefore, we aim to: 1) to provide an
overview of recent population changes in Spanish metropolitan areas; 2) to distinguish stages
in their development (urban core population decrease, new growth period due to international
immigration, new suburbanization stage by foreigners, and the impact of the economic crisis);
3) to search for urban development timing differences between metropolitan areas, among
their respective central city‟s role and in the type of fringe areas; and finally, 4) to analyse
residential mobility dynamics, taking differences between foreigners‟ and Spaniards‟ choice
of place of residence into account.
3
2. Theoretical framework
The classical cyclical urbanisation model built by Van den Berg et al. (1982) is widely
accepted by urban geographers and other urban researchers as an explanation of past and
present population changes in both urban cores and surrounding fringe areas. This model is
useful to describe urban growth and decline periods in Europe through four sequential stages:
urbanisation, suburbanisation, desurbanisation and reurbanisation, each one being sub-divided
into two periods of relative or absolute population increase (centralisation) or decrease
(decentralisation). In a first stage, urbanisation, the core city wins more population than the
surrounding region, while the opposite occurs in the following phase, suburbanisation, when
demographic decentralisation leads core cities lose relative demographic strength, while
surrounding areas rapidly raise their inhabitant numbers. Though core cities still initially
show population increase, growth first progressively slows down, and then finally starts
diminishing.
Even though in the suburbanisation stage all the urban area as a whole still shows
positive growth, the sign shifts to negative in the subsequent phase, desurbanisation, when
population decline appears both in core cities and fringe areas. While the latter ones start to
present a negative demographic trend, central cities become increasingly de-populated (Hall,
2006). In extreme cases, these can even fall into disrepair, decrepitude and vacancy –a
phenomenon called „urban decay‟ by some authors like Medhurst and Parry Lewis (1969) or
Andersen (2003), and „shrinking cities‟ by others (Oswalt, 2003; Oswalt and Rieniets, 2006;
Ebers, 2007). When population and economic activities in rural areas and satellite non-
metropolitan towns grow along with desurbanisation, the phenomenon has been called
„counterurbanisation‟ (Fielding, 1982).
Finally, desurbanisation should be followed by a fourth a final stage, reurbanisation,
characterised by a progressive core city population recovery and a later fringe area decline
rate reduction. Van den Berg et al. (1982) considered this fourth stage (which would complete
and restart the urban development cycle) as purely hypothetical and unlikely. However
population data collected in the 1990s and the early 21st century shows that some core cities
are once again gaining population and thus, reurbanisation is in fact taking place (Lever,
1993; Cheshire, 1995; Ogden and Hall, 2000; Haase et al., 2005; Buzar et al., 2007).This
urban recovery phase is seemingly caused by the settlement in core cities of two parallel
flows, that of local and that of foreign people. On the one hand autochthonous households
(one-person and one-parent household, non-family shared households and other non-
traditional ones) people, particularly youngsters, seeking better educational and work
opportunities, or those just generally attracted by core cities due to their positional advantages
and way of life (Champion, 2001b; Buzar et al., 2005; Kabisch and Haase, 2011) are reaching
in urban centres. Such movements would be related to „second demographic transition‟
household structure and lifestyle changes (Van de Kaa, 1987; Lesthaeghe and Neels, 2002).
On the other hand, foreign immigrants would also be moving there. These flows have been
particularly strong in Spain and other Southern Europe countries with a highly segregated
labour markets (Domingo and Gil-Alonso, 2007; Gil-Alonso and Domingo, 2008), which
offer international immigrants low-paid jobs and favour their settlement in the core cities and
particularly their low-quality neighbourhoods (Bayona and López-Gay, 2011). Meanwhile
national citizens‟ suburbanisation trends have continued growing (Bayona and Gil-Alonso,
2008; Bayona et al., 2011).
This four-stage sequential model of urban development has been employed by several
authors (Cheshire, 1995; Turok and Mikhnenko, 2007; Kabisch and Haase, 2011) to compare
4
European urban trends. Our paper intends to apply the Kabisch and Haase (2011) adaptation
of the Van den Berg et al. (1982) model to classify the 15 Spanish urban areas with more than
500,000 inhabitants. According to Nel·lo (2007), just before the present economic crisis,
Spanish cities were undergoing the third stage of metropolitan development. After a first
concentration period (1959-1975) that is to say, and using the Van den Berg et al. (1982)
model, the urbanisation phase, there was a strong dispersion stage, the so called
suburbanisation period (1975-1996), in which the main cities lost population (suburbanisation
stage with absolute decentralization). From the latter date onwards, Spanish cities would have
entered a third phase. Even though suburbanisation continued, urban metropolitan centres
would have started to recover (suburbanisation stage with relative decentralisation).
This core city demographic recovery and fringe area growth has also been observed by
Kabisch and Haase (2011: 244) from 2001 onwards in the other southern European cities.
However, the Spanish case would be somewhat different as it would not follow the usual
recentralization model in which people return to the urban centre (Cheshire, 1995; Champion,
2001a). Those moving to metropolitan cores are in fact no longer Spanish people, who in
most city centres are actually diminishing -though López-Gay, 2011, beliefs that this trend
slowing down and that, in the near future, it will change sign. They would rather be foreign
immigrants (see Bayona and Gil-Alonso, 2008; and Pujadas, 2009, for Barcelona; or Pozo and
García, 2009, for Madrid) arriving during Spain‟s two decade long immigration boom
(Muñoz and Izquierdo, 1989), and intensifying in the second half of the 1990‟s.
In Spain, this third phase concludes when the economic crisis irrupts, particularly
striking the real estate market. For the purposes of this paper, we will therefore, consider it
specifically lasting from January the 1st 2000 to January the 1
st 2008. Consequently, a new
stage started on this latter date. As we do not still have enough perspective, nor data (we only
have final data for the 2008-2010 period) nor a theoretical framework, it is too early to
analyse or extract many conclusions from it. Maybe the most interesting recent contribution is
has been made by Kabisch and Haase, who have applied the Van den Berg et al. theoretical
model to European evidence obtained in these last two decades, reaching the conclusion that
“no consecutive order of the stages of urban development was identified. Rather, we would
support the idea that the regular onward cycle of the stages of urban development (van den
Berg et al.,1982) was proven to have been reversed due to the trends of reinforcing
suburbanisation and developing reurbanisation after 2001” (Kabisch and Haase, 2011: 246).
Therefore, this last decade, several stages coexisted while significant differences between
European regions emerged: in Eastern European agglomerations, desurbanisation has been
predominant, though in the other three regions -Northern, Western and Southern Europe-
suburbanisation is still the dominant phenomenon and reurbanisation is also increasingly
present.
Using this theoretical framework, we intend to analyse this uncertainty 2008-2010
period through its demographic changes, comparing it with the one before (2000-2007) in
which demographic growth was higher. Foreign and local populations will be analysed
separately, as we suspect that, if it had not been for foreigner flows, after suburbanisation,
Spanish urban areas would have probably entered -as the Van den Berg et al. (1982) model
indicates- the desurbanisation one and that in these last two years some of the Spanish cities
might have been driven towards it. Nevertheless, if we are to prove this hypothesis the two
populations need to be analysed separately. By doing so, we will also be able to assess the
stage at which each of the Spanish cities studied is situated and the impact of foreign
immigration on each of them. Given the overall foreign migrant figures, these will
undoubtedly be relevant.
5
3. Foreign immigration in Spain
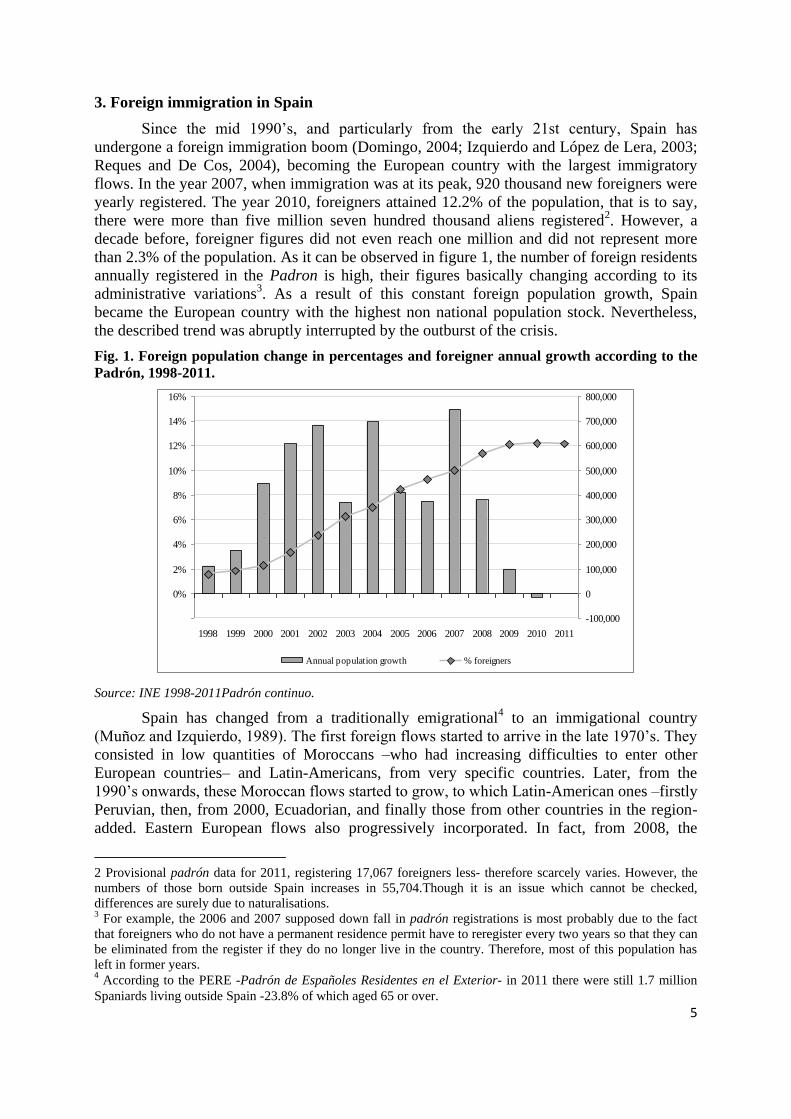
Since the mid 1990‟s, and particularly from the early 21st century, Spain has
undergone a foreign immigration boom (Domingo, 2004; Izquierdo and López de Lera, 2003;
Reques and De Cos, 2004), becoming the European country with the largest immigratory
flows. In the year 2007, when immigration was at its peak, 920 thousand new foreigners were
yearly registered. The year 2010, foreigners attained 12.2% of the population, that is to say,
there were more than five million seven hundred thousand aliens registered2. However, a
decade before, foreigner figures did not even reach one million and did not represent more
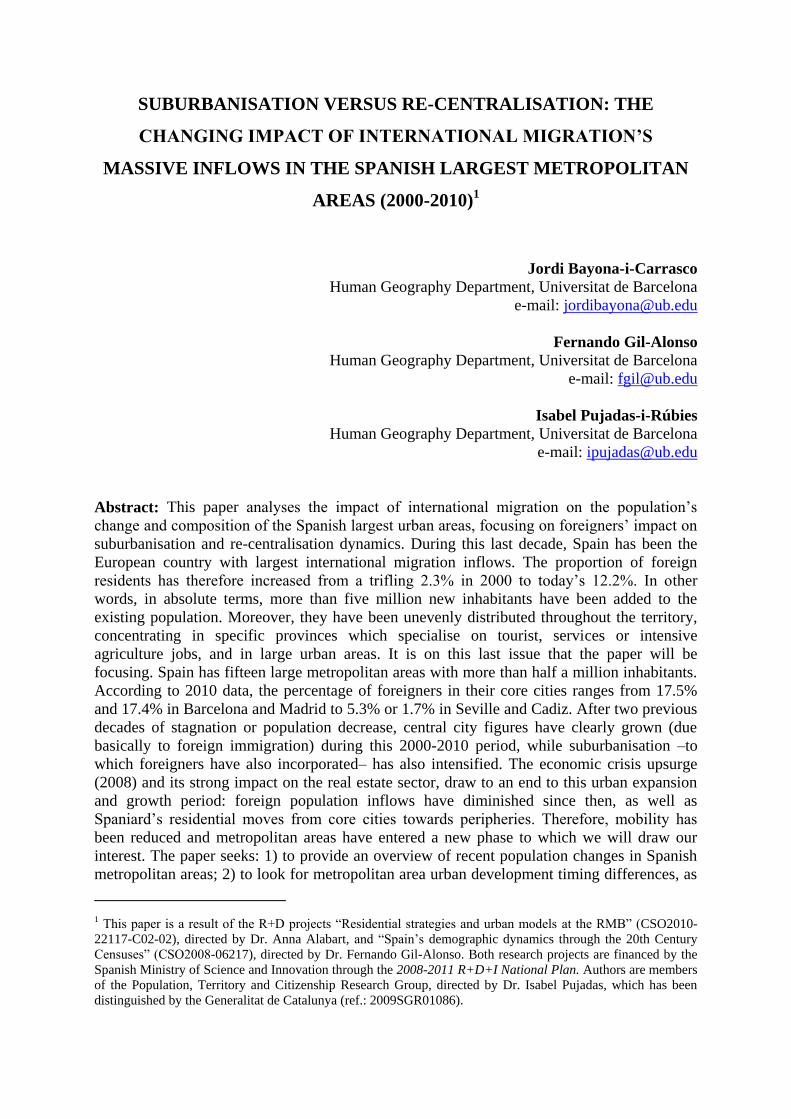
than 2.3% of the population. As it can be observed in figure 1, the number of foreign residents
annually registered in the Padron is high, their figures basically changing according to its
administrative variations3. As a result of this constant foreign population growth, Spain
became the European country with the highest non national population stock. Nevertheless,
the described trend was abruptly interrupted by the outburst of the crisis.
Fig. 1. Foreign population change in percentages and foreigner annual growth according to the
Padrón, 1998-2011.
-2%
0%
2%
4%
6%
8%
10%
12%
14%
16%
1998 1999 2000 2001 2002 2003 2004 2005 2006 2007 2008 2009 2010 2011
-100,000
0
100,000
200,000
300,000
400,000
500,000
600,000
700,000
800,000
Annual population growth % foreigners
Source: INE 1998-2011Padrón continuo.
Spain has changed from a traditionally emigrational4 to an immigational country
(Muñoz and Izquierdo, 1989). The first foreign flows started to arrive in the late 1970‟s. They
consisted in low quantities of Moroccans –who had increasing difficulties to enter other
European countries– and Latin-Americans, from very specific countries. Later, from the
1990‟s onwards, these Moroccan flows started to grow, to which Latin-American ones –firstly
Peruvian, then, from 2000, Ecuadorian, and finally those from other countries in the region-
added. Eastern European flows also progressively incorporated. In fact, from 2008, the
2 Provisional padrón data for 2011, registering 17,067 foreigners less- therefore scarcely varies. However, the
numbers of those born outside Spain increases in 55,704.Though it is an issue which cannot be checked,
differences are surely due to naturalisations. 3 For example, the 2006 and 2007 supposed down fall in padrón registrations is most probably due to the fact
that foreigners who do not have a permanent residence permit have to reregister every two years so that they can
be eliminated from the register if they do no longer live in the country. Therefore, most of this population has
left in former years. 4 According to the PERE -Padrón de Españoles Residentes en el Exterior- in 2011 there were still 1.7 million
Spaniards living outside Spain -23.8% of which aged 65 or over.
6
foreign nationality with the highest number of residents in Spain was actually Rumanians.
Finally, Asian flows should also be mentioned. Significant numbers of Communitarians, who
in some Mediterranean and insular regions would mainly be retired people, should be also
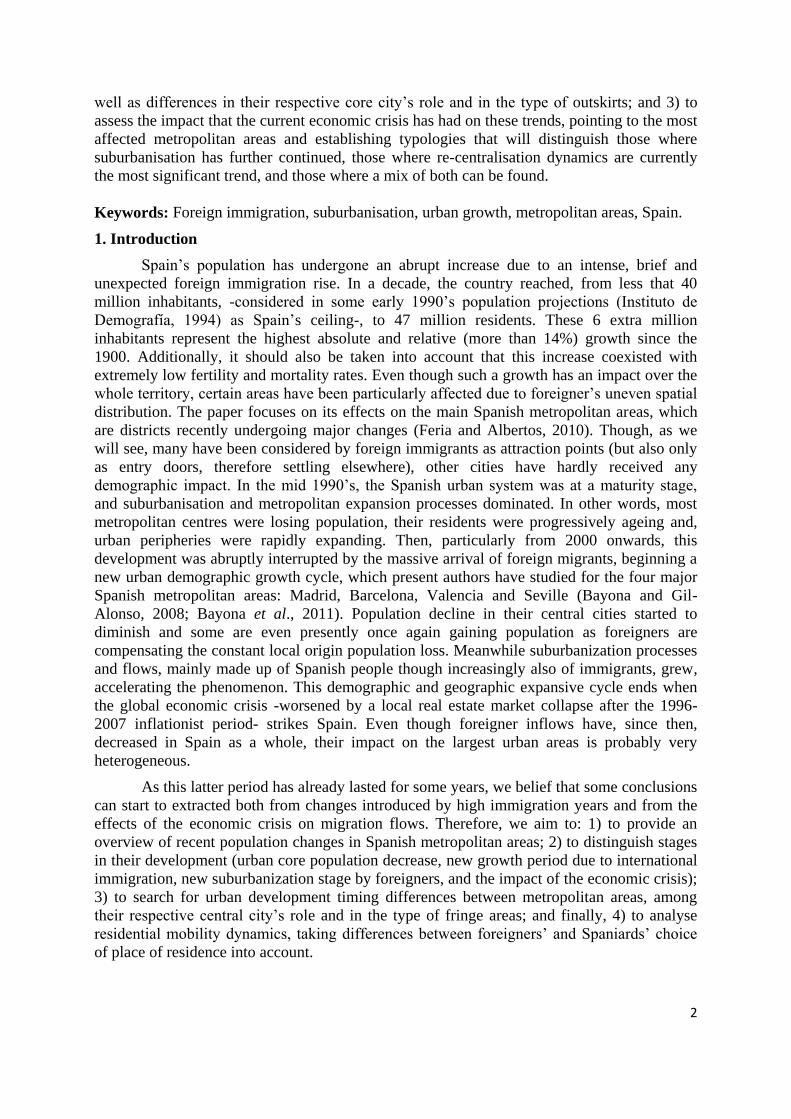
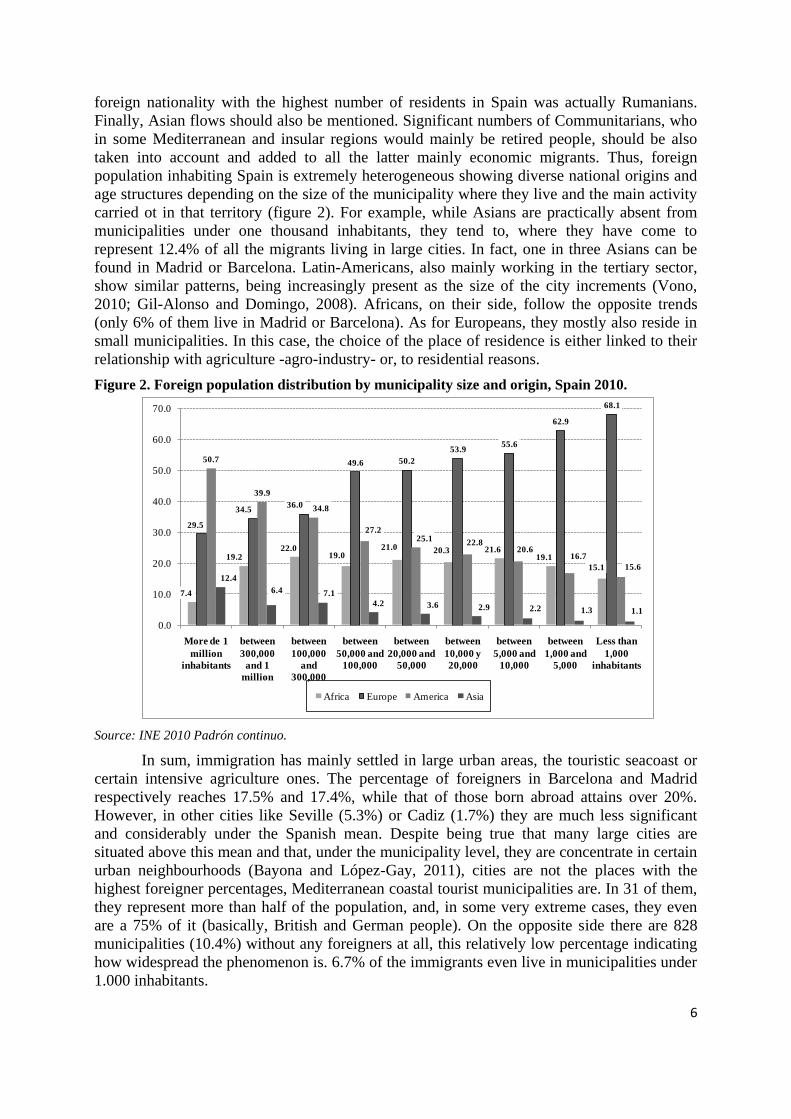
taken into account and added to all the latter mainly economic migrants. Thus, foreign
population inhabiting Spain is extremely heterogeneous showing diverse national origins and
age structures depending on the size of the municipality where they live and the main activity
carried ot in that territory (figure 2). For example, while Asians are practically absent from
municipalities under one thousand inhabitants, they tend to, where they have come to
represent 12.4% of all the migrants living in large cities. In fact, one in three Asians can be
found in Madrid or Barcelona. Latin-Americans, also mainly working in the tertiary sector,
show similar patterns, being increasingly present as the size of the city increments (Vono,
2010; Gil-Alonso and Domingo, 2008). Africans, on their side, follow the opposite trends
(only 6% of them live in Madrid or Barcelona). As for Europeans, they mostly also reside in
small municipalities. In this case, the choice of the place of residence is either linked to their
relationship with agriculture -agro-industry- or, to residential reasons.
Figure 2. Foreign population distribution by municipality size and origin, Spain 2010.
7.4
19.222.0
19.021.0 20.3 21.6
19.1
15.1
29.5
34.536.0
49.6 50.2
53.955.6
62.9
68.1
50.7
39.9
34.8
27.225.1
22.820.6
16.7
15.6
12.4
6.4 7.1
4.2 3.6 2.9 2.2 1.3 1.1
0.0
10.0
20.0
30.0
40.0
50.0
60.0
70.0
More de 1
million
inhabitants
between
300,000
and 1
million
between
100,000
and
300,000
between
50,000 and
100,000
between
20,000 and
50,000
between
10,000 y
20,000
between
5,000 and
10,000
between
1,000 and
5,000
Less than
1,000
inhabitants
Africa Europe America Asia
Source: INE 2010 Padrón continuo.
In sum, immigration has mainly settled in large urban areas, the touristic seacoast or
certain intensive agriculture ones. The percentage of foreigners in Barcelona and Madrid
respectively reaches 17.5% and 17.4%, while that of those born abroad attains over 20%.
However, in other cities like Seville (5.3%) or Cadiz (1.7%) they are much less significant
and considerably under the Spanish mean. Despite being true that many large cities are
situated above this mean and that, under the municipality level, they are concentrate in certain
urban neighbourhoods (Bayona and López-Gay, 2011), cities are not the places with the
highest foreigner percentages, Mediterranean coastal tourist municipalities are. In 31 of them,
they represent more than half of the population, and, in some very extreme cases, they even
are a 75% of it (basically, British and German people). On the opposite side there are 828
municipalities (10.4%) without any foreigners at all, this relatively low percentage indicating
how widespread the phenomenon is. 6.7% of the immigrants even live in municipalities under
1.000 inhabitants.
7
4. Data and Urban Areas Definition
Sources used in the paper are the 1991 population census –from which population data
has been extracted and employed as a starting point, and the most recent available Padrón
continuo –from January the 1st 2010. Population has been distinguished by nationality
(foreign or local) while metropolitan areas have been divided into core and periphery. This
stock data has been completed with 1999-2009 municipal flow micro-data obtained from the
Estadística de Variaciones Residenciales (EVR). Data on births and deaths from the
Movimiento Natural de la Población (MNP) have also been included. Therefore, with this
data obtained from the INE‟s web, we have been able to observe 1996-2009 natural growth
variations in metropolitan municipalities.
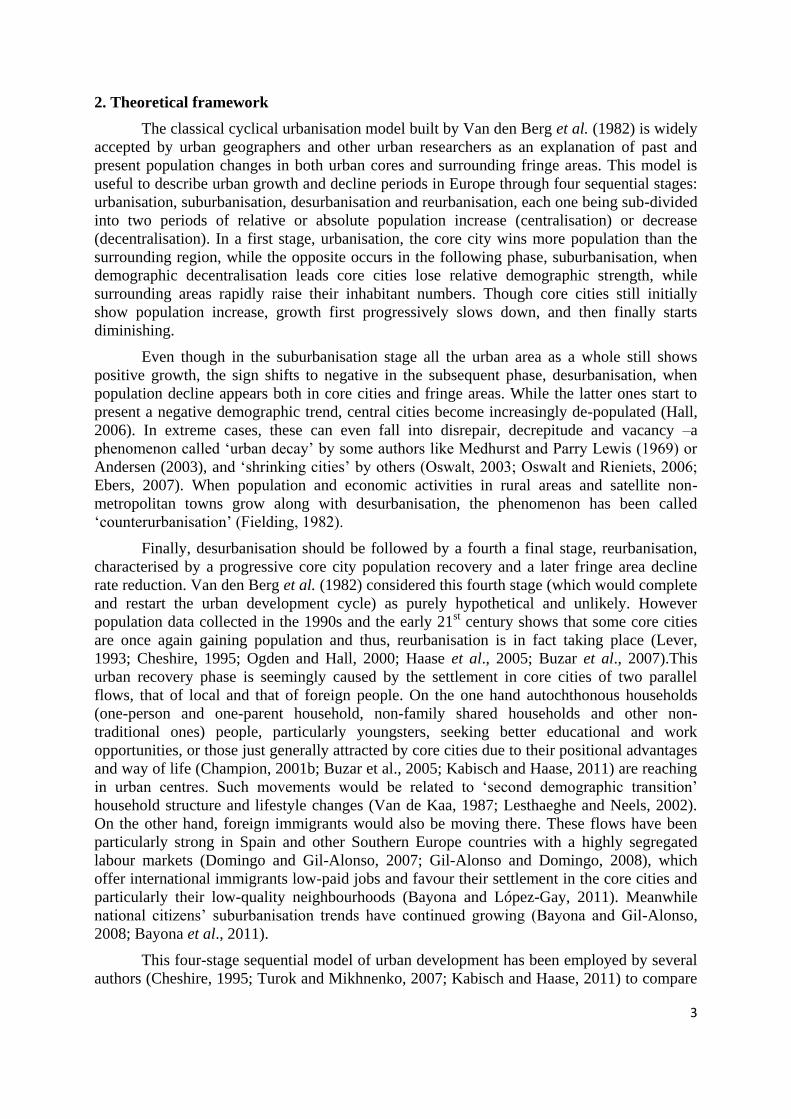
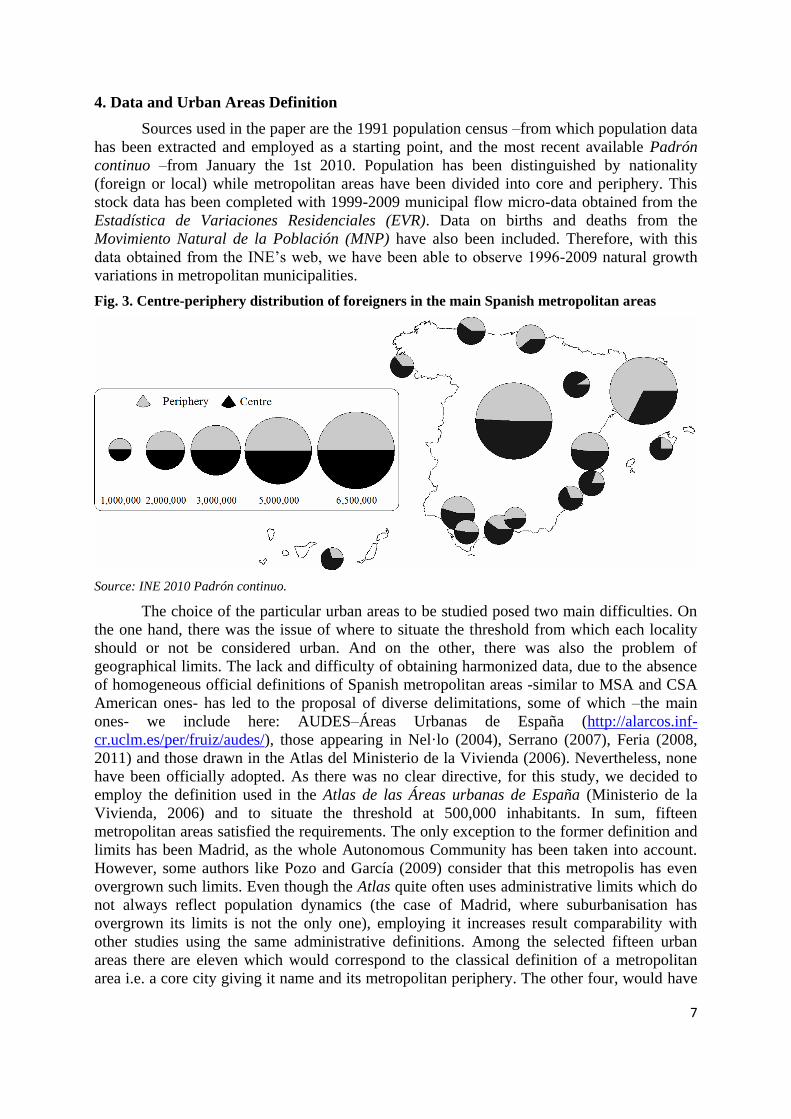
Fig. 3. Centre-periphery distribution of foreigners in the main Spanish metropolitan areas
Source: INE 2010 Padrón continuo.
The choice of the particular urban areas to be studied posed two main difficulties. On
the one hand, there was the issue of where to situate the threshold from which each locality
should or not be considered urban. And on the other, there was also the problem of
geographical limits. The lack and difficulty of obtaining harmonized data, due to the absence
of homogeneous official definitions of Spanish metropolitan areas -similar to MSA and CSA
American ones- has led to the proposal of diverse delimitations, some of which –the main
ones- we include here: AUDES–Áreas Urbanas de España (http://alarcos.inf-
cr.uclm.es/per/fruiz/audes/), those appearing in Nel·lo (2004), Serrano (2007), Feria (2008,
2011) and those drawn in the Atlas del Ministerio de la Vivienda (2006). Nevertheless, none
have been officially adopted. As there was no clear directive, for this study, we decided to
employ the definition used in the Atlas de las Áreas urbanas de España (Ministerio de la
Vivienda, 2006) and to situate the threshold at 500,000 inhabitants. In sum, fifteen
metropolitan areas satisfied the requirements. The only exception to the former definition and
limits has been Madrid, as the whole Autonomous Community has been taken into account.
However, some authors like Pozo and García (2009) consider that this metropolis has even
overgrown such limits. Even though the Atlas quite often uses administrative limits which do
not always reflect population dynamics (the case of Madrid, where suburbanisation has
overgrown its limits is not the only one), employing it increases result comparability with
other studies using the same administrative definitions. Among the selected fifteen urban
areas there are eleven which would correspond to the classical definition of a metropolitan
area i.e. a core city giving it name and its metropolitan periphery. The other four, would have
8
grown from a couple of centres. They are: the central urban area of Asturias (Gijón and
Oviedo), Alicante (Alicante and Elche), Bahía de Cádiz (Jerez de la Frontera and Cádiz)
Pontevedra (Vigo and Pontevedra). The number of municipalities composing these
metropolitan areas ranges from four, in the case of Las Palmas de Gran Canaria, to 164 in the
case of Barcelona and 178 in that of Madrid -it should be taken into account that the area
analysed corresponds to the whole Autonomous Community. In all, they are 564
municipalities, representing 7.0% out of the present 8,114, holding more than 21 million
inhabitants, that is so say, 46.6% of the Spanish population. The 2000-2010 period has been
divided into two: The first would go from 2000 to 2008, corresponding to the economic
growth and large immigration flow years. In contrast, the last, including only two years, from
2008 to 2010, would be that of those pertaining to the present crisis and slow foreign
population increases.
5. Urban population growth
Between 2000 and 2010, registered inhabitants increased from 40,499,790 to
47,021,031. As known, foreigners played a crucial role in the process, being approximately
responsible for at least three quarters of the growth. Leaving naturalizations and children from
mixed marriages aside, their numbers have multiplied by six, increasing from 923,879 to
5,747,734, or in other words, from 2.3% to 12.2% of the population, which is -it should be
remembered- the highest absolute (six and a half million inhabitants more) and relative
growth in a decade since the 1900.
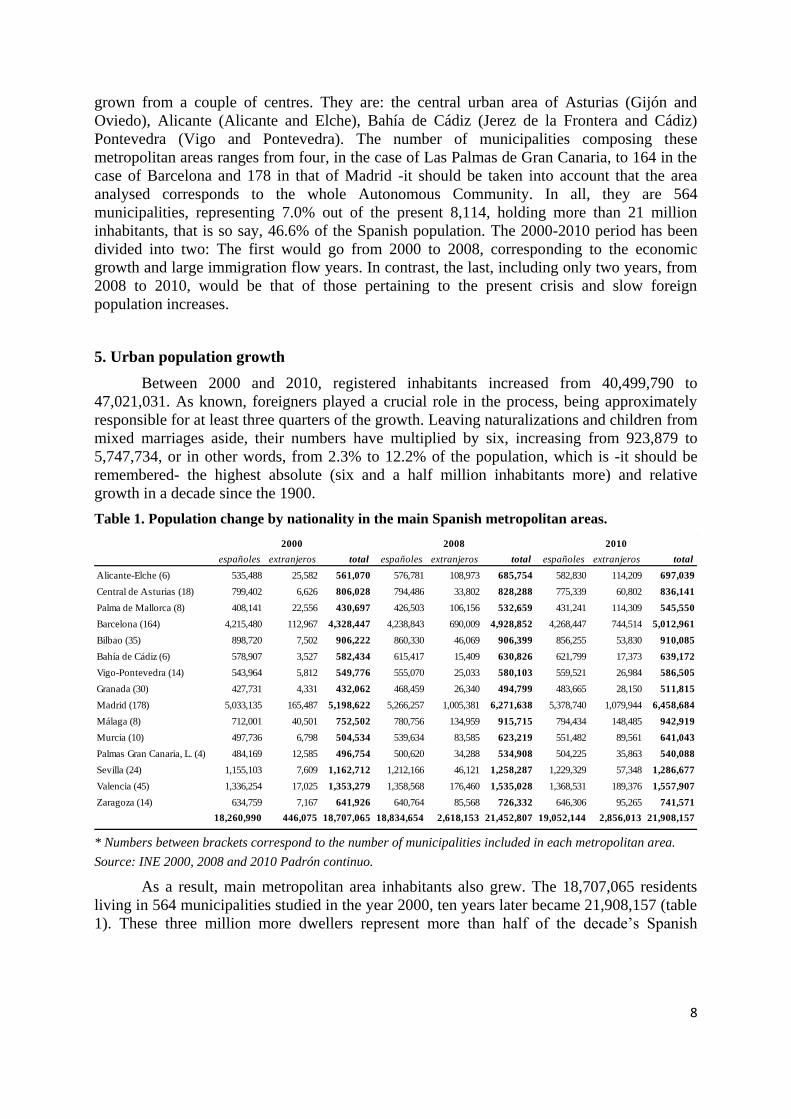
Table 1. Population change by nationality in the main Spanish metropolitan areas.
españoles extranjeros total españoles extranjeros total españoles extranjeros total
Alicante-Elche (6) 535,488 25,582 561,070 576,781 108,973 685,754 582,830 114,209 697,039
Central de Asturias (18) 799,402 6,626 806,028 794,486 33,802 828,288 775,339 60,802 836,141
Palma de Mallorca (8) 408,141 22,556 430,697 426,503 106,156 532,659 431,241 114,309 545,550
Barcelona (164) 4,215,480 112,967 4,328,447 4,238,843 690,009 4,928,852 4,268,447 744,514 5,012,961
Bilbao (35) 898,720 7,502 906,222 860,330 46,069 906,399 856,255 53,830 910,085
Bahía de Cádiz (6) 578,907 3,527 582,434 615,417 15,409 630,826 621,799 17,373 639,172
Vigo-Pontevedra (14) 543,964 5,812 549,776 555,070 25,033 580,103 559,521 26,984 586,505
Granada (30) 427,731 4,331 432,062 468,459 26,340 494,799 483,665 28,150 511,815
Madrid (178) 5,033,135 165,487 5,198,622 5,266,257 1,005,381 6,271,638 5,378,740 1,079,944 6,458,684
Málaga (8) 712,001 40,501 752,502 780,756 134,959 915,715 794,434 148,485 942,919
Murcia (10) 497,736 6,798 504,534 539,634 83,585 623,219 551,482 89,561 641,043
Palmas Gran Canaria, L. (4) 484,169 12,585 496,754 500,620 34,288 534,908 504,225 35,863 540,088
Sevilla (24) 1,155,103 7,609 1,162,712 1,212,166 46,121 1,258,287 1,229,329 57,348 1,286,677
Valencia (45) 1,336,254 17,025 1,353,279 1,358,568 176,460 1,535,028 1,368,531 189,376 1,557,907
Zaragoza (14) 634,759 7,167 641,926 640,764 85,568 726,332 646,306 95,265 741,571
18,260,990 446,075 18,707,065 18,834,654 2,618,153 21,452,807 19,052,144 2,856,013 21,908,157
2000 2008 2010
* Numbers between brackets correspond to the number of municipalities included in each metropolitan area.
Source: INE 2000, 2008 and 2010 Padrón continuo.
As a result, main metropolitan area inhabitants also grew. The 18,707,065 residents
living in 564 municipalities studied in the year 2000, ten years later became 21,908,157 (table
1). These three million more dwellers represent more than half of the decade‟s Spanish
9
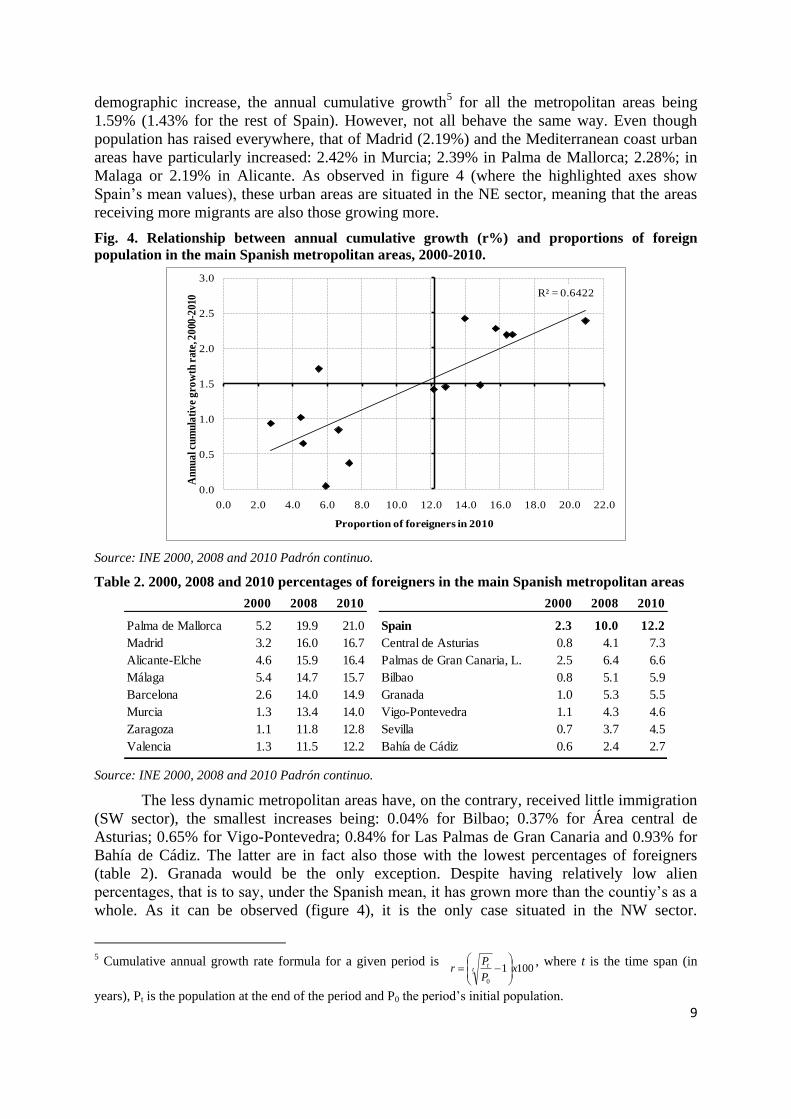
demographic increase, the annual cumulative growth5 for all the metropolitan areas being
1.59% (1.43% for the rest of Spain). However, not all behave the same way. Even though
population has raised everywhere, that of Madrid (2.19%) and the Mediterranean coast urban
areas have particularly increased: 2.42% in Murcia; 2.39% in Palma de Mallorca; 2.28%; in
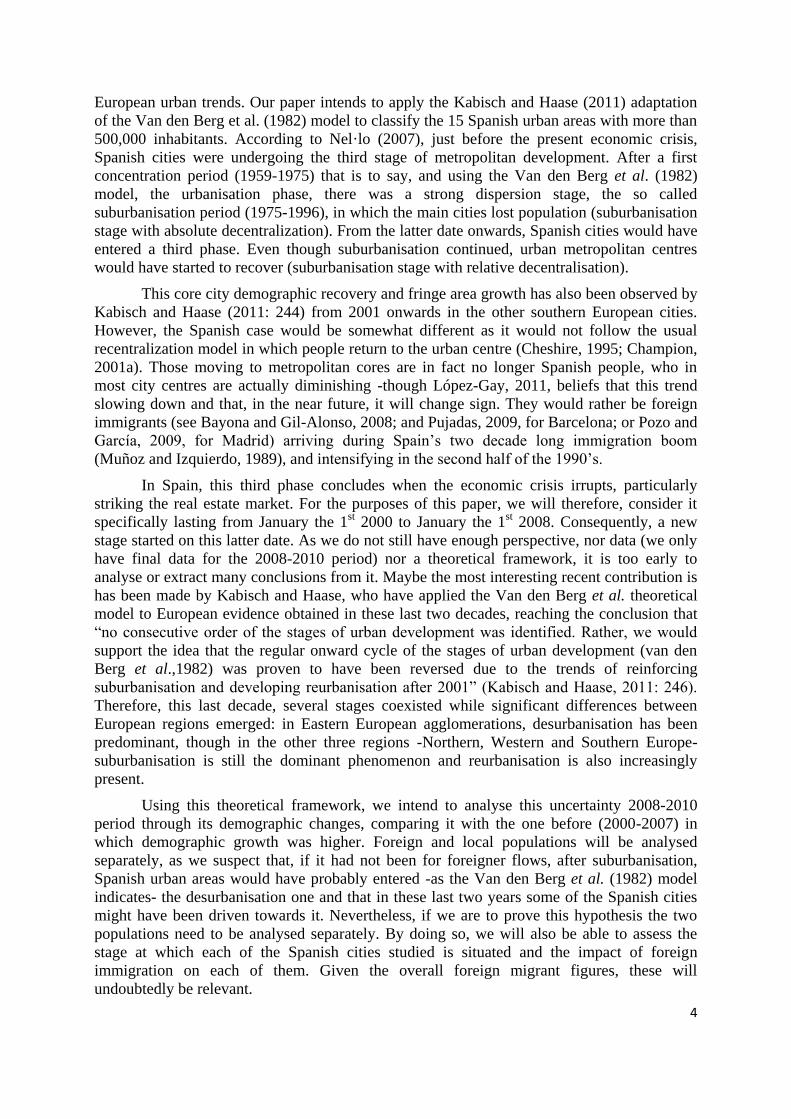
Malaga or 2.19% in Alicante. As observed in figure 4 (where the highlighted axes show
Spain‟s mean values), these urban areas are situated in the NE sector, meaning that the areas
receiving more migrants are also those growing more.
Fig. 4. Relationship between annual cumulative growth (r%) and proportions of foreign
population in the main Spanish metropolitan areas, 2000-2010.
R² = 0.6422
0.0
0.5
1.0
1.5
2.0
2.5
3.0
0.0 2.0 4.0 6.0 8.0 10.0 12.0 14.0 16.0 18.0 20.0 22.0
An
nu
al c
um
ula
tiv
e g
row
th r
ate,
20
00-2
010
Proportion of foreigners in 2010
Source: INE 2000, 2008 and 2010 Padrón continuo.
Table 2. 2000, 2008 and 2010 percentages of foreigners in the main Spanish metropolitan areas
2000 2008 2010 2000 2008 2010
Palma de Mallorca 5.2 19.9 21.0 Spain 2.3 10.0 12.2
Madrid 3.2 16.0 16.7 Central de Asturias 0.8 4.1 7.3
Alicante-Elche 4.6 15.9 16.4 Palmas de Gran Canaria, L. 2.5 6.4 6.6
Málaga 5.4 14.7 15.7 Bilbao 0.8 5.1 5.9
Barcelona 2.6 14.0 14.9 Granada 1.0 5.3 5.5
Murcia 1.3 13.4 14.0 Vigo-Pontevedra 1.1 4.3 4.6
Zaragoza 1.1 11.8 12.8 Sevilla 0.7 3.7 4.5
Valencia 1.3 11.5 12.2 Bahía de Cádiz 0.6 2.4 2.7
Source: INE 2000, 2008 and 2010 Padrón continuo.
The less dynamic metropolitan areas have, on the contrary, received little immigration
(SW sector), the smallest increases being: 0.04% for Bilbao; 0.37% for Área central de
Asturias; 0.65% for Vigo-Pontevedra; 0.84% for Las Palmas de Gran Canaria and 0.93% for
Bahía de Cádiz. The latter are in fact also those with the lowest percentages of foreigners
(table 2). Granada would be the only exception. Despite having relatively low alien
percentages, that is to say, under the Spanish mean, it has grown more than the countiy‟s as a
whole. As it can be observed (figure 4), it is the only case situated in the NW sector.
5 Cumulative annual growth rate formula for a given period is
10010
xP
Pr t
t
, where t is the time span (in
years), Pt is the population at the end of the period and P0 the period‟s initial population.
10
Barcelona, Zaragoza and Valencia, on their side, combine high foreigner percentages and
growths under the Spanish population mean (SE sector).
In sum, foreigners‟ presence in urban areas is highly irregular, ranging between 21%
(Palma de Mallorca and its metropolitan area) and 2.7% (Bahía de Cádiz). In fact, the
proportion of immigrants living in seven of the metropolitan areas drops significantly under
the Spanish mean (table 2).
6. The impact of the economic crisis on demographic growth
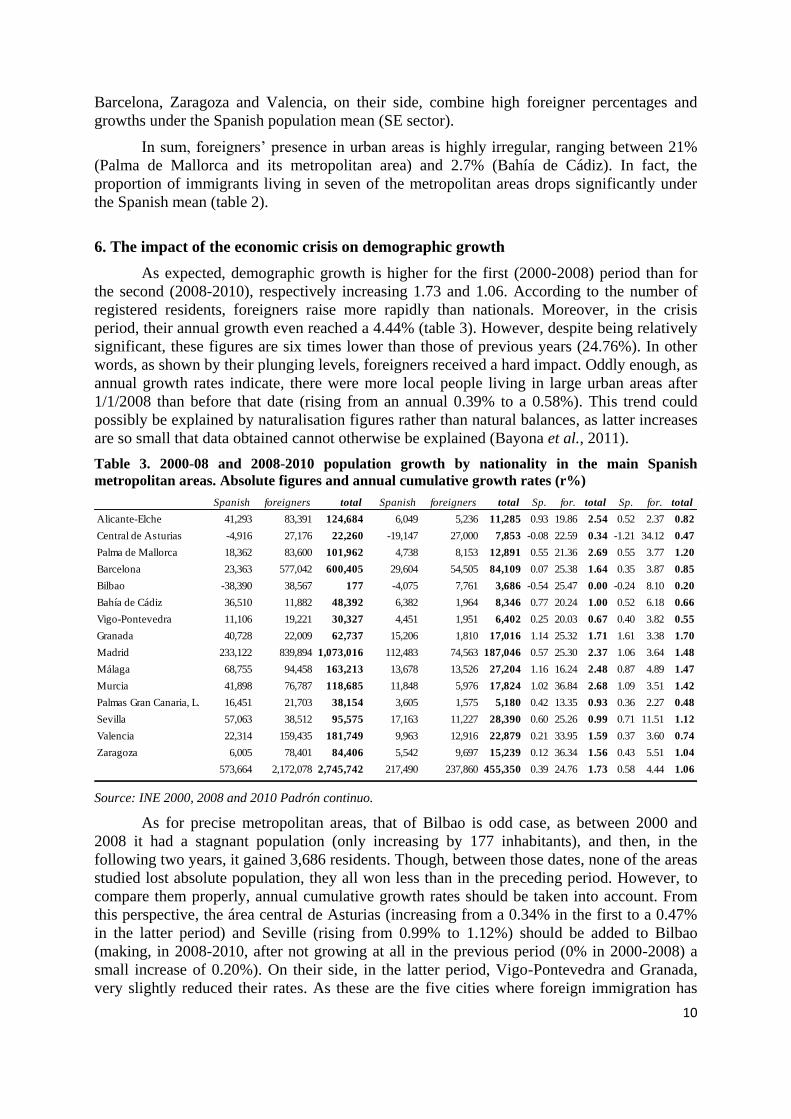
As expected, demographic growth is higher for the first (2000-2008) period than for
the second (2008-2010), respectively increasing 1.73 and 1.06. According to the number of
registered residents, foreigners raise more rapidly than nationals. Moreover, in the crisis
period, their annual growth even reached a 4.44% (table 3). However, despite being relatively
significant, these figures are six times lower than those of previous years (24.76%). In other
words, as shown by their plunging levels, foreigners received a hard impact. Oddly enough, as
annual growth rates indicate, there were more local people living in large urban areas after
1/1/2008 than before that date (rising from an annual 0.39% to a 0.58%). This trend could
possibly be explained by naturalisation figures rather than natural balances, as latter increases
are so small that data obtained cannot otherwise be explained (Bayona et al., 2011).
Table 3. 2000-08 and 2008-2010 population growth by nationality in the main Spanish
metropolitan areas. Absolute figures and annual cumulative growth rates (r%)
Spanish foreigners total Spanish foreigners total Sp. for. total Sp. for. total
Alicante-Elche 41,293 83,391 124,684 6,049 5,236 11,285 0.93 19.86 2.54 0.52 2.37 0.82
Central de Asturias -4,916 27,176 22,260 -19,147 27,000 7,853 -0.08 22.59 0.34 -1.21 34.12 0.47
Palma de Mallorca 18,362 83,600 101,962 4,738 8,153 12,891 0.55 21.36 2.69 0.55 3.77 1.20
Barcelona 23,363 577,042 600,405 29,604 54,505 84,109 0.07 25.38 1.64 0.35 3.87 0.85
Bilbao -38,390 38,567 177 -4,075 7,761 3,686 -0.54 25.47 0.00 -0.24 8.10 0.20
Bahía de Cádiz 36,510 11,882 48,392 6,382 1,964 8,346 0.77 20.24 1.00 0.52 6.18 0.66
Vigo-Pontevedra 11,106 19,221 30,327 4,451 1,951 6,402 0.25 20.03 0.67 0.40 3.82 0.55
Granada 40,728 22,009 62,737 15,206 1,810 17,016 1.14 25.32 1.71 1.61 3.38 1.70
Madrid 233,122 839,894 1,073,016 112,483 74,563 187,046 0.57 25.30 2.37 1.06 3.64 1.48
Málaga 68,755 94,458 163,213 13,678 13,526 27,204 1.16 16.24 2.48 0.87 4.89 1.47
Murcia 41,898 76,787 118,685 11,848 5,976 17,824 1.02 36.84 2.68 1.09 3.51 1.42
Palmas Gran Canaria, L. 16,451 21,703 38,154 3,605 1,575 5,180 0.42 13.35 0.93 0.36 2.27 0.48
Sevilla 57,063 38,512 95,575 17,163 11,227 28,390 0.60 25.26 0.99 0.71 11.51 1.12
Valencia 22,314 159,435 181,749 9,963 12,916 22,879 0.21 33.95 1.59 0.37 3.60 0.74
Zaragoza 6,005 78,401 84,406 5,542 9,697 15,239 0.12 36.34 1.56 0.43 5.51 1.04
573,664 2,172,078 2,745,742 217,490 237,860 455,350 0.39 24.76 1.73 0.58 4.44 1.06
Source: INE 2000, 2008 and 2010 Padrón continuo.
As for precise metropolitan areas, that of Bilbao is odd case, as between 2000 and
2008 it had a stagnant population (only increasing by 177 inhabitants), and then, in the
following two years, it gained 3,686 residents. Though, between those dates, none of the areas
studied lost absolute population, they all won less than in the preceding period. However, to
compare them properly, annual cumulative growth rates should be taken into account. From
this perspective, the área central de Asturias (increasing from a 0.34% in the first to a 0.47%
in the latter period) and Seville (rising from 0.99% to 1.12%) should be added to Bilbao
(making, in 2008-2010, after not growing at all in the previous period (0% in 2000-2008) a
small increase of 0.20%). On their side, in the latter period, Vigo-Pontevedra and Granada,
very slightly reduced their rates. As these are the five cities where foreign immigration has
11
been relatively less present (table 2) they are probably also those less affected by the
economic crisis. On the contrary, growth rates of metropolitan areas with the highest
proportions of foreigners have considerably fallen.
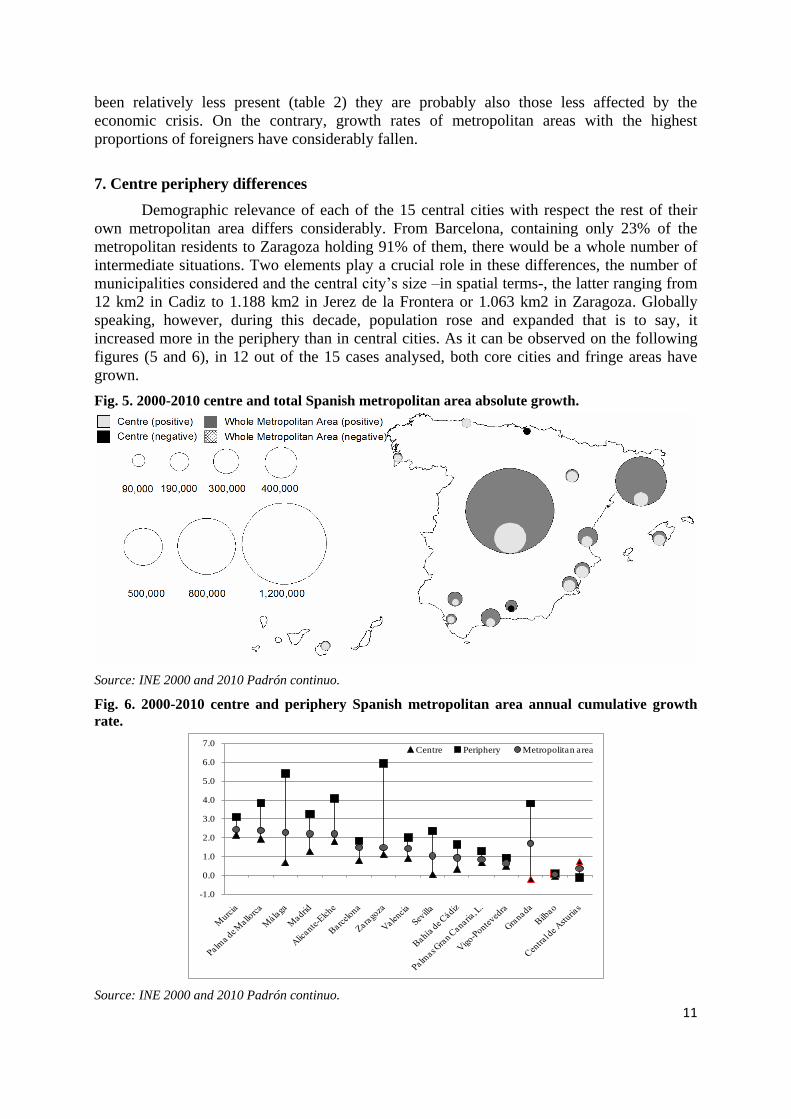
7. Centre periphery differences
Demographic relevance of each of the 15 central cities with respect the rest of their
own metropolitan area differs considerably. From Barcelona, containing only 23% of the
metropolitan residents to Zaragoza holding 91% of them, there would be a whole number of
intermediate situations. Two elements play a crucial role in these differences, the number of
municipalities considered and the central city‟s size –in spatial terms-, the latter ranging from
12 km2 in Cadiz to 1.188 km2 in Jerez de la Frontera or 1.063 km2 in Zaragoza. Globally
speaking, however, during this decade, population rose and expanded that is to say, it
increased more in the periphery than in central cities. As it can be observed on the following
figures (5 and 6), in 12 out of the 15 cases analysed, both core cities and fringe areas have
grown.
Fig. 5. 2000-2010 centre and total Spanish metropolitan area absolute growth.
Source: INE 2000 and 2010 Padrón continuo.
Fig. 6. 2000-2010 centre and periphery Spanish metropolitan area annual cumulative growth
rate.
-1.0
0.0
1.0
2.0
3.0
4.0
5.0
6.0
7.0Centre Periphery Metropolitan area
Source: INE 2000 and 2010 Padrón continuo.
12
The three exceptions to this pattern would be the three metropolitan areas furthest on
the right (figure 6). While both central cities of Granada and Bilbao lose population, in the
area central de Asturias, the centre grows but its periphery diminishes. In sum, except for the
latter case, which would still be at the initial urbanisation stage where there is absolute
centralization (Van den Berg et al., 1982), the rest would be at a deconcentration phase,
which would be absolute (Granada and Bilbao) or relative (the rest of metropolitan areas)
depending on the cases. Malaga –where the people living in the core city fall from 73.8% in
2000 to 60.3% in 2010- and Granada - where it dropped from 56.4% to 46.7%- would be the
most paradigmatic deconcentration cases. As formerly indicated, the latter city‟s residents
diminish by 0.22% while its periphery grows 3.81%. However, the case of Bilbao is slightly
different as its population distribution remains stagnant, its central municipality only
increasing by 0.03% and its periphery by 0.09%.
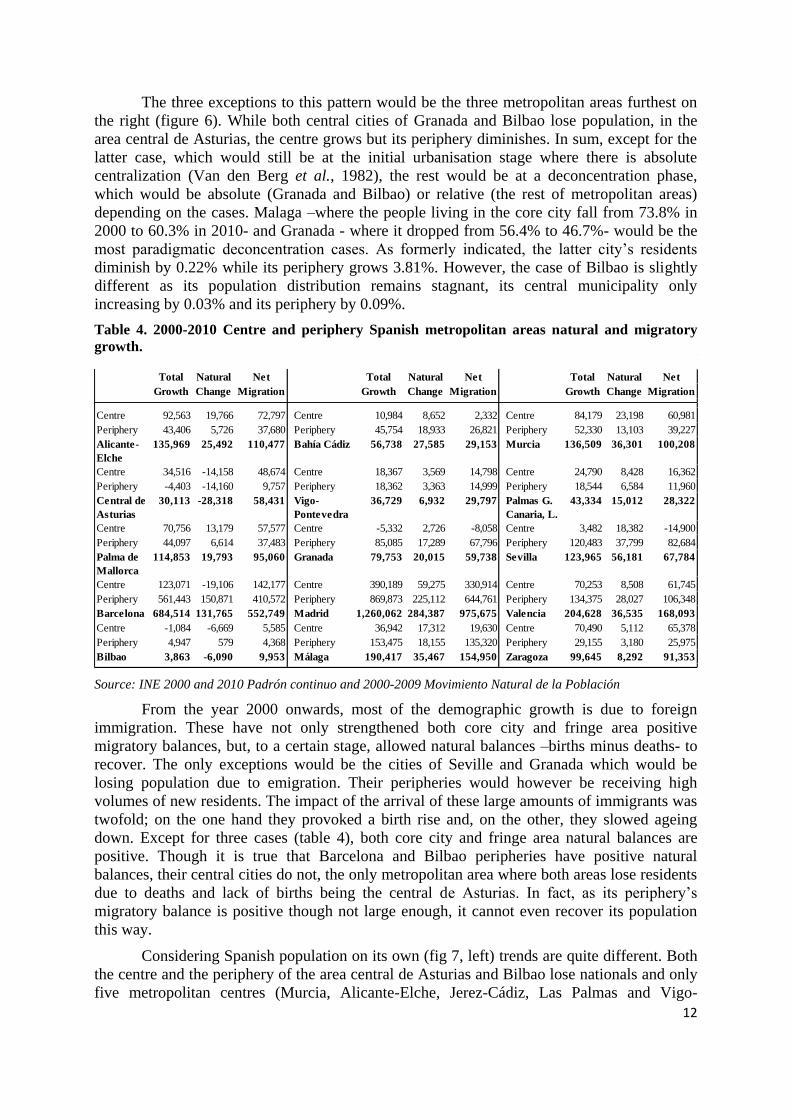
Table 4. 2000-2010 Centre and periphery Spanish metropolitan areas natural and migratory
growth.
Total Natural Net Total Natural Net Total Natural Net
Growth Change Migration Growth Change Migration Growth Change Migration
Centre 92,563 19,766 72,797 Centre 10,984 8,652 2,332 Centre 84,179 23,198 60,981
Periphery 43,406 5,726 37,680 Periphery 45,754 18,933 26,821 Periphery 52,330 13,103 39,227
Alicante-
Elche
135,969 25,492 110,477 Bahía Cádiz 56,738 27,585 29,153 Murcia 136,509 36,301 100,208
Centre 34,516 -14,158 48,674 Centre 18,367 3,569 14,798 Centre 24,790 8,428 16,362
Periphery -4,403 -14,160 9,757 Periphery 18,362 3,363 14,999 Periphery 18,544 6,584 11,960
Central de
Asturias
30,113 -28,318 58,431 Vigo-
Pontevedra
36,729 6,932 29,797 Palmas G.
Canaria, L.
43,334 15,012 28,322
Centre 70,756 13,179 57,577 Centre -5,332 2,726 -8,058 Centre 3,482 18,382 -14,900
Periphery 44,097 6,614 37,483 Periphery 85,085 17,289 67,796 Periphery 120,483 37,799 82,684
Palma de
Mallorca
114,853 19,793 95,060 Granada 79,753 20,015 59,738 Sevilla 123,965 56,181 67,784
Centre 123,071 -19,106 142,177 Centre 390,189 59,275 330,914 Centre 70,253 8,508 61,745
Periphery 561,443 150,871 410,572 Periphery 869,873 225,112 644,761 Periphery 134,375 28,027 106,348
Barcelona 684,514 131,765 552,749 Madrid 1,260,062 284,387 975,675 Valencia 204,628 36,535 168,093
Centre -1,084 -6,669 5,585 Centre 36,942 17,312 19,630 Centre 70,490 5,112 65,378
Periphery 4,947 579 4,368 Periphery 153,475 18,155 135,320 Periphery 29,155 3,180 25,975
Bilbao 3,863 -6,090 9,953 Málaga 190,417 35,467 154,950 Zaragoza 99,645 8,292 91,353
Source: INE 2000 and 2010 Padrón continuo and 2000-2009 Movimiento Natural de la Población
From the year 2000 onwards, most of the demographic growth is due to foreign
immigration. These have not only strengthened both core city and fringe area positive
migratory balances, but, to a certain stage, allowed natural balances –births minus deaths- to
recover. The only exceptions would be the cities of Seville and Granada which would be
losing population due to emigration. Their peripheries would however be receiving high
volumes of new residents. The impact of the arrival of these large amounts of immigrants was
twofold; on the one hand they provoked a birth rise and, on the other, they slowed ageing
down. Except for three cases (table 4), both core city and fringe area natural balances are
positive. Though it is true that Barcelona and Bilbao peripheries have positive natural
balances, their central cities do not, the only metropolitan area where both areas lose residents
due to deaths and lack of births being the central de Asturias. In fact, as its periphery‟s
migratory balance is positive though not large enough, it cannot even recover its population
this way.
Considering Spanish population on its own (fig 7, left) trends are quite different. Both
the centre and the periphery of the area central de Asturias and Bilbao lose nationals and only
five metropolitan centres (Murcia, Alicante-Elche, Jerez-Cádiz, Las Palmas and Vigo-
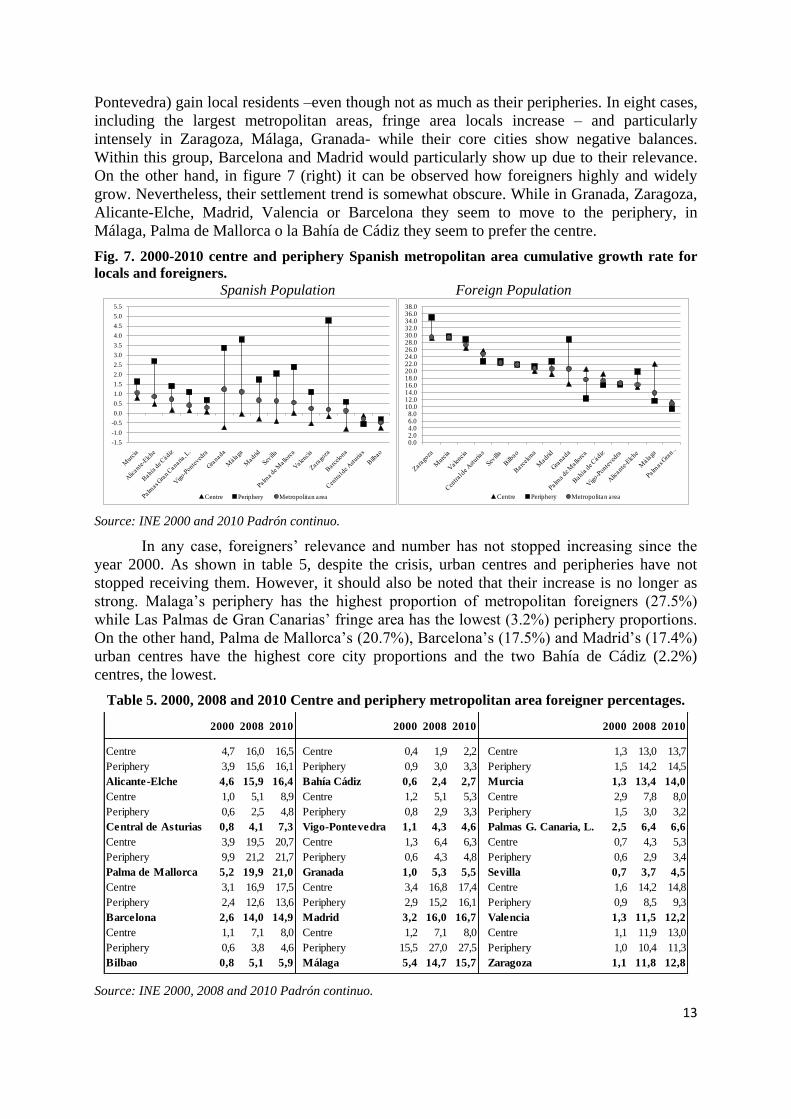
13
Pontevedra) gain local residents –even though not as much as their peripheries. In eight cases,
including the largest metropolitan areas, fringe area locals increase – and particularly
intensely in Zaragoza, Málaga, Granada- while their core cities show negative balances.
Within this group, Barcelona and Madrid would particularly show up due to their relevance.
On the other hand, in figure 7 (right) it can be observed how foreigners highly and widely
grow. Nevertheless, their settlement trend is somewhat obscure. While in Granada, Zaragoza,
Alicante-Elche, Madrid, Valencia or Barcelona they seem to move to the periphery, in
Málaga, Palma de Mallorca o la Bahía de Cádiz they seem to prefer the centre.
Fig. 7. 2000-2010 centre and periphery Spanish metropolitan area cumulative growth rate for
locals and foreigners.
Spanish Population Foreign Population
-1.5
-1.0
-0.5
0.0
0.5
1.0
1.5
2.0
2.5
3.0
3.5
4.0
4.5
5.0
5.5
Centre Periphery Metropolitan area
0.02.04.06.08.0
10.012.014.016.018.020.022.024.026.028.030.032.034.036.038.0
Centre Periphery Metropolitan area
Source: INE 2000 and 2010 Padrón continuo.
In any case, foreigners‟ relevance and number has not stopped increasing since the
year 2000. As shown in table 5, despite the crisis, urban centres and peripheries have not
stopped receiving them. However, it should also be noted that their increase is no longer as
strong. Malaga‟s periphery has the highest proportion of metropolitan foreigners (27.5%)
while Las Palmas de Gran Canarias‟ fringe area has the lowest (3.2%) periphery proportions.
On the other hand, Palma de Mallorca‟s (20.7%), Barcelona‟s (17.5%) and Madrid‟s (17.4%)
urban centres have the highest core city proportions and the two Bahía de Cádiz (2.2%)
centres, the lowest.
Table 5. 2000, 2008 and 2010 Centre and periphery metropolitan area foreigner percentages.
2000 2008 2010 2000 2008 2010 2000 2008 2010
Centre 4,7 16,0 16,5 Centre 0,4 1,9 2,2 Centre 1,3 13,0 13,7
Periphery 3,9 15,6 16,1 Periphery 0,9 3,0 3,3 Periphery 1,5 14,2 14,5
Alicante-Elche 4,6 15,9 16,4 Bahía Cádiz 0,6 2,4 2,7 Murcia 1,3 13,4 14,0
Centre 1,0 5,1 8,9 Centre 1,2 5,1 5,3 Centre 2,9 7,8 8,0
Periphery 0,6 2,5 4,8 Periphery 0,8 2,9 3,3 Periphery 1,5 3,0 3,2
Central de Asturias 0,8 4,1 7,3 Vigo-Pontevedra 1,1 4,3 4,6 Palmas G. Canaria, L. 2,5 6,4 6,6
Centre 3,9 19,5 20,7 Centre 1,3 6,4 6,3 Centre 0,7 4,3 5,3
Periphery 9,9 21,2 21,7 Periphery 0,6 4,3 4,8 Periphery 0,6 2,9 3,4
Palma de Mallorca 5,2 19,9 21,0 Granada 1,0 5,3 5,5 Sevilla 0,7 3,7 4,5
Centre 3,1 16,9 17,5 Centre 3,4 16,8 17,4 Centre 1,6 14,2 14,8
Periphery 2,4 12,6 13,6 Periphery 2,9 15,2 16,1 Periphery 0,9 8,5 9,3
Barcelona 2,6 14,0 14,9 Madrid 3,2 16,0 16,7 Valencia 1,3 11,5 12,2
Centre 1,1 7,1 8,0 Centre 1,2 7,1 8,0 Centre 1,1 11,9 13,0
Periphery 0,6 3,8 4,6 Periphery 15,5 27,0 27,5 Periphery 1,0 10,4 11,3
Bilbao 0,8 5,1 5,9 Málaga 5,4 14,7 15,7 Zaragoza 1,1 11,8 12,8
Source: INE 2000, 2008 and 2010 Padrón continuo.
14
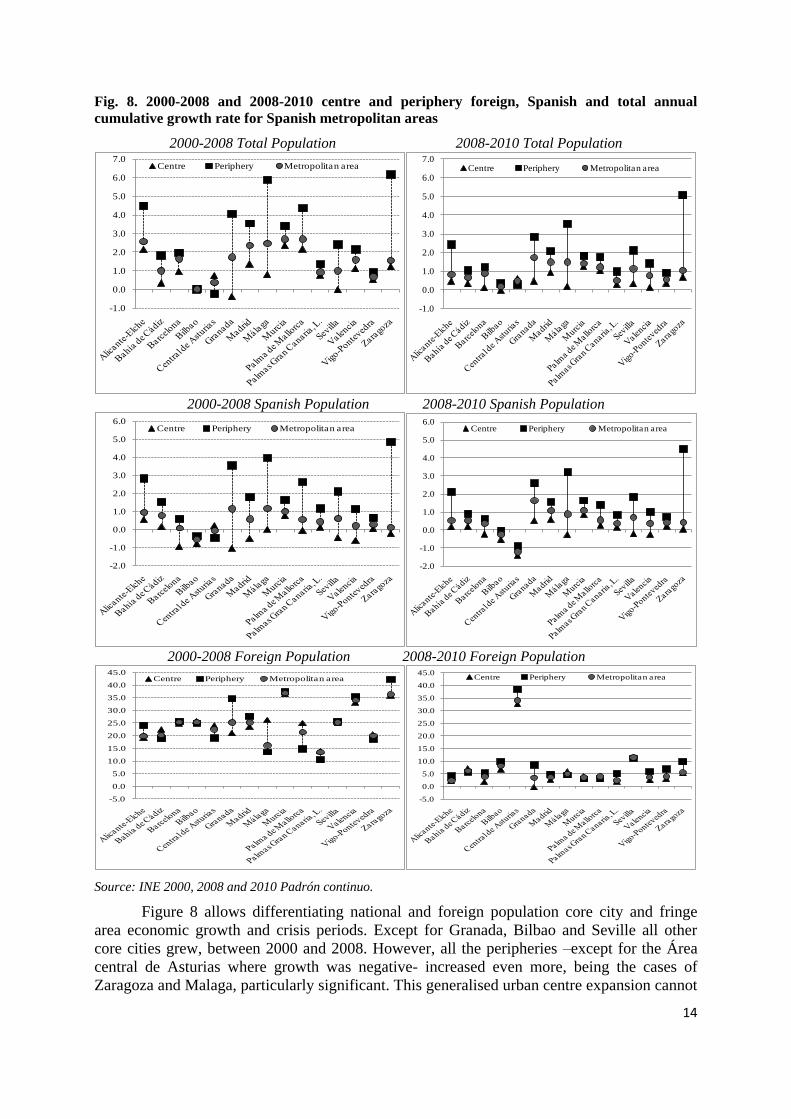
Fig. 8. 2000-2008 and 2008-2010 centre and periphery foreign, Spanish and total annual
cumulative growth rate for Spanish metropolitan areas
2000-2008 Total Population 2008-2010 Total Population
-1.0
0.0
1.0
2.0
3.0
4.0
5.0
6.0
7.0Centre Periphery Metropolitan area
-1.0
0.0
1.0
2.0
3.0
4.0
5.0
6.0
7.0Centre Periphery Metropolitan area
2000-2008 Spanish Population 2008-2010 Spanish Population
-2.0
-1.0
0.0
1.0
2.0
3.0
4.0
5.0
6.0Centre Periphery Metropolitan area
-2.0
-1.0
0.0
1.0
2.0
3.0
4.0
5.0
6.0Centre Periphery Metropolitan area
2000-2008 Foreign Population 2008-2010 Foreign Population
-5.0
0.0
5.0
10.0
15.0
20.0
25.0
30.0
35.0
40.0
45.0Centre Periphery Metropolitan area
-5.0
0.0
5.0
10.0
15.0
20.0
25.0
30.0
35.0
40.0
45.0Centre Periphery Metropolitan area
Source: INE 2000, 2008 and 2010 Padrón continuo.
Figure 8 allows differentiating national and foreign population core city and fringe
area economic growth and crisis periods. Except for Granada, Bilbao and Seville all other
core cities grew, between 2000 and 2008. However, all the peripheries –except for the Área
central de Asturias where growth was negative- increased even more, being the cases of
Zaragoza and Malaga, particularly significant. This generalised urban centre expansion cannot
15
be understood without the enormous foreign immigration inflows they received (8 of them
even losing Spanish population). The cases of Granada (-1.04% annually) and Barcelona (-
0.96% annually) would especially stand out. On the other hand, except for the central de
Asturias (-0.47%) and Bilbao (-0.38%), all the other peripheries gain local residents.
Interestingly enough, the 2008-2010 crisis seems to have particularly affected
peripheries and those centres which grew more during the previous period. By contrast, core
cities receiving less impact during growth years are also those less modified by the crisis.
Seville and Granada even show small positive growths. This diversity of impacts seems to be
due to the large immigration reduction to which metropolitan areas are submitted as a
consequence of the crisis. While in the city of Granada flows even become negative. At the
opposite end we can find the central de Asturias urban cores where immigration has largely
increased. Probably driven by demographic inertia, local population seems to be less affected
by the crisis. The number of urban centres losing Spaniards even reduces from 8 to 6.
Granada, Madrid, Palma de Mallorca and Zaragoza, which had reached that situation, started
gaining them. On the contrary Malaga, and particularly the two cities forming the central de
Asturias, are those having greater falls. In Barcelona, Valencia, Seville and Bilbao, on their
side, Spanish residents diminish in both periods, though less in the second. Except for
Alicante-Elche, the rest gain it during both periods, though more in the latter.
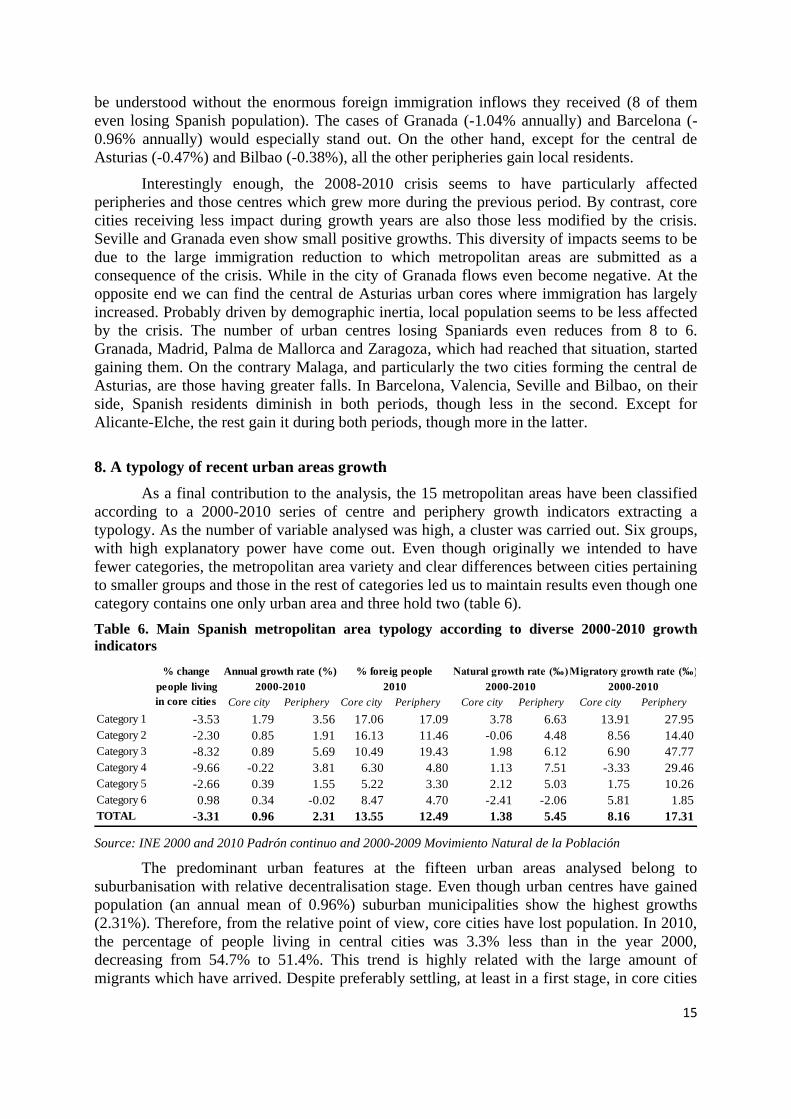
8. A typology of recent urban areas growth
As a final contribution to the analysis, the 15 metropolitan areas have been classified
according to a 2000-2010 series of centre and periphery growth indicators extracting a
typology. As the number of variable analysed was high, a cluster was carried out. Six groups,
with high explanatory power have come out. Even though originally we intended to have
fewer categories, the metropolitan area variety and clear differences between cities pertaining
to smaller groups and those in the rest of categories led us to maintain results even though one
category contains one only urban area and three hold two (table 6).
Table 6. Main Spanish metropolitan area typology according to diverse 2000-2010 growth
indicators
% change
people living
in core cities Core city Periphery Core city Periphery Core city Periphery Core city Periphery
Category 1 -3.53 1.79 3.56 17.06 17.09 3.78 6.63 13.91 27.95
Category 2 -2.30 0.85 1.91 16.13 11.46 -0.06 4.48 8.56 14.40
Category 3 -8.32 0.89 5.69 10.49 19.43 1.98 6.12 6.90 47.77
Category 4 -9.66 -0.22 3.81 6.30 4.80 1.13 7.51 -3.33 29.46
Category 5 -2.66 0.39 1.55 5.22 3.30 2.12 5.03 1.75 10.26
Category 6 0.98 0.34 -0.02 8.47 4.70 -2.41 -2.06 5.81 1.85
TOTAL -3.31 0.96 2.31 13.55 12.49 1.38 5.45 8.16 17.31
Annual growth rate (%) % foreig people Natural growth rate (‰)Migratory growth rate (‰)
2000-2010 2010 2000-2010 2000-2010
Source: INE 2000 and 2010 Padrón continuo and 2000-2009 Movimiento Natural de la Población
The predominant urban features at the fifteen urban areas analysed belong to
suburbanisation with relative decentralisation stage. Even though urban centres have gained
population (an annual mean of 0.96%) suburban municipalities show the highest growths
(2.31%). Therefore, from the relative point of view, core cities have lost population. In 2010,
the percentage of people living in central cities was 3.3% less than in the year 2000,
decreasing from 54.7% to 51.4%. This trend is highly related with the large amount of
migrants which have arrived. Despite preferably settling, at least in a first stage, in core cities
16
(13.6% of their population is foreign) and less in peripheries (12.5%) they have reinforced
Spanish population‟s suburbanisation dynamics. More specifically, young Spaniards
migration and settlement behaviour are the main causes of larger periphery migratory growth
(17.3 per thousand compared to 8.2 per thousand in core cities, basically gaining foreigners)
but also of their natural growth (5.4 per thousand in comparison to 1.4 per thousand in core
cities). Even though peripheries only contain 48.6% of the population, they produce 77.9% of
the natural growth and 65.4% of the 2000-2010 migratory one.
However, there obviously are differences among them. Both the periphery and core
cities of those pertaining to category 1 (Alicante-Elche, Madrid, Murcia and Palma de
Mallorca) have substantial amounts of foreigners, always above the Spanish mean. Even
though they are all undergoing a strong suburbanisation process and the central city is
therefore losing force, the metropolitan core is still considerably increasing. As both their
centres and suburban areas show high natural and migratory balances, these metropolises are
the most demographically dynamic. They are also the locations where large amounts of
migrants choose to settle. Madrid has a large power of attraction due to its status as capital
and has become a migrant‟s entry door; Palma de Mallorca and Alicante have a large amount
of Communitarian residents and Murcia concentrates on intensive agriculture.
Despite having similar characteristics to those of the former group, category 2 urban
areas, that is to say Valencia and Barcelona, have grown less. Their core cities are less
dynamic and their suburbanisation flows smaller. Foreigner percentages in the central city
continue being high, but they are slightly lower in fringe areas. Even though natural growth is
even negative in the city of Barcelona, with immigration, both cities recover population, due
to high migration balances. This would be particularly significant as, in the previous period,
they had absolute losses.
The main characteristics of category 3 metropolitan areas are their extremely strong
suburbanization process, and that their core cities are subsequently becoming less significant
from the demographic point of view. In effect, Málaga‟s and Zaragoza‟s peripheries are
growing more than their core cities due to the extraordinarily high migratory balances
combined with a significant natural growth. This is due to their particularly young population
structure, a characteristic of this young household migration towards the periphery. In both
metropolitan areas, the percentage of foreigners is similar to that of Spain as a whole. Finally,
it should be stressed that in Malaga, they particularly settle in fringe areas, a characteristic
which should be related to the fact that the main type of migrants moving there are
Communitarians.
Category 4 is only made up of one metropolitan area, Granada. The main reason
behind it is that, during the analysed decade, its core city relative population has dropped by
10%. Despite having positive natural growths central city loses population due to the small
flows arriving and their subsequent negative migratory balances. Peripheries, on the contrary,
show the opposite trends, as they are quickly suburbanising due to high Spanish immigration
flows and show one of the highest natural growth rates. In summary, the main difference with
the rest of high suburbanised cities is that the lack of foreign migrants is leading to a core city
population loss.
Foreign population percentages in Bahía de Cádiz, Las Palmas de Gran Canaria,
Sevilla and Vigo-Pontevedra core cities and fringe areas, forming category 5, are
extraordinarily low, very much under the Spanish mean, and in the periphery particularly so.
These cities are the only ones where natural growth is higher than migratory balances. Bahía
de Cádiz and Seville are two southern Spain metropolitan areas where international
17
migration‟s incidence is low and which are showing similar trends to those of the North
Western metropolis of Vigo-Pontevedra. However, the case of Las Palmas de Gran Canaria is
somewhat different. Even though there are large amounts of foreigners in the island, they do
not live in its main city. These mainly Communitarian residents prefer to do it in the touristic
areas. Even though they have not received much immigration, suburbanisation is also present.
Despite their core cities have, in absolute figures, gained a certain amount of population, this
is not true from the relative point of view.
Finally, the two last metropolitan areas Bilbao and Central de Asturias belong to
category 6, being, their stagnant population and the lowest suburbanisation flows, their main
characteristics. In fact, Gijón and Oviedo, the central de Asturias core cities, would be
recovering population while their fringe areas lose it. Therefore, this would mean that they are
still at the urbanisation stage. On the other hand, the population of Bilbao‟s metropolitan area
is stagnant, as it slightly diminishes in the centre and hardly grows in the periphery. Natural
growth for both central cities is clearly negative and for Asturias‟ fringe area, extremely so.
On its side, that of Bilbao is practically nonexistent. In sum, despite 8% of these core cities‟
population is foreign, their general demographic trend is no different from that of the rest of
northern Spain.
9. Discussion and conclusions
In the early 21st century and as a consequence of the massive arrival of foreign
migrants, all the Spanish metropolitan areas with more than half a million residents have
gained population. However, growth magnitudes have been extremely different. On one
extreme we find the metropolis of Bilbao, where population has maintained nearly stagnant,
and on the other, that of the Madrid, which has increased by about 1,250,000 inhabitants.
Local population trends –naturalisations should also be taken into account- indicate that,
without immigrants, urban growth would have been much lower or in the case of Bilbao and
the area central de Asturias have even been negative.
The only metropolis still undergoing urbanisation and absolute centralisation is
precisely the latter. The rest would either be experiencing suburbanisation within the absolute
phase (Bilbao and Seville and Granada before 2008) or relative (the rest) decentralisation.
However, this typology is influenced by the large amount of immigrants which have arrived
to the country. If only local population developments are taken into account, the situation
becomes quite different. Then, the four main cities -Madrid, Barcelona, Valencia and Seville-
plus Zaragoza, Palma and Granada would also be under absolute decentralisation. However,
as a consequence of the crisis, they seem to be directly initiating reurbanisation without going
through desurbanisation. The effects of the crisis and the constant Spanish population loss
have also seemingly led area central de Asturias to this latter mentioned stage -without going
through suburbanization. Bilbao would also be undergoing desurbanisation, though it is
showing recovery signs. These results seem to be in the line with those found by Kabisch and
Haase (2011) for Europe as a whole. According to these latter authors, the Van den Berg et al.
(1982) urbanisation stages would not follow one another but would coincide in time.
Therefore, at one moment in time, different cities would be situated at diverse stages
depending on their morphology, size and economic activities developed in them.
Finally, answering the question set at the title, the economic and real estate crisis
seems in effect to have restrained suburbanization dynamics. On the one hand, there are many
less foreigners arriving, so metropolitan areas have reduced their rhythm of growth. On the
other, as getting access to new dwellings has become more difficult, Spanish population is
18
moving less and exit flows have been reduced. Therefore, urban centres are even gaining local
residents, or at least have stopped losing them, the only exception being Malaga, Alicante-
Elche and Gijón-Oviedo urban nuclei.
References
ANDERSEN, H.S. (2003) Urban sores: on the interaction between segregation, urban decay,
and deprived neighbourhoods, Ashgate, Farnham (UK).
BAYONA, J.; GIL-ALONSO, F. and PUJADAS, I. (2011) “Inmigración extranjera y el
proceso de suburbanización en las principales áreas urbanas españolas (1999-2008)” in
PUJADAS, I.; et al. (Ed.) Población y espacios urbanos, Departament de Geografia Humana
de la Universitat de Barcelona and Grupo de Población de la AGE, Barcelona, p. 801-818.
BAYONA, J., GIL-ALONSO, F. and PUJADAS, I. (2011) “Dinàmica residencial de la
població estrangera en les principals regions metropolitanes d‟Espanya” Revista Catalana de
Sociologia, 27
BAYONA, J. and GIL-ALONSO, F. (2008) “El papel de la inmigración extranjera en la
expansión de las áreas urbanas. El caso de Barcelona (1998-2007)” Scripta Nova. Revista
Electrónica de Geografía y Ciencias Sociales. Barcelona: UB, n. 270 (132).
BAYONA, J. and LÓPEZ-GAY, A. (2011) “Concentración, segregación y movilidad
residencial de los extranjeros en Barcelona” Documents d’Anàlisi Geogràfica, 57 (3), p. 381-
412.
BUZAR, S., OGDEN, P.E. and HALL, R. (2005) “Households matter: the quiet demography
of urban transformation”, Progress in Human Geography, 29: 413-436.
BUZAR, S., OGDEN, P.E., HALL, R., HAASE, A., KABISCH, S. and STEINFÜHRER, A.
(2007) “Splintering urban populations: Emergent landscapes of reurbanisation in four
European cities”, Urban Studies, 44: 651-677.
CHAMPION, A.G. (2001a) “Urbanization, Suburbanization, Counterurbanization and
Reurbanization” in PADDISON, R. (ed) Handbook of Urban Studies, SAGE, London, p. 143-
161.
CHAMPION, A.G. (2001b): “A Changing Demographic Regime and Evolving Polycentric
Urban Regions: Consequences for the Size, Composition and Distribution of City
Populations” Urban Studies, 38: 657-677.
CHESHIRE, P. (1995) “A New Phase of Urban Development in Western Europe? The
Evidence for the 1980s” Urban Studies, 32 (7): 1045-1063.
DOMINGO, A. (2004) “La immigració actual a Espanya. Aspectes demogràfics” Papers de
Demografía, 252.
DOMINGO, A. and GIL-ALONSO, F. (2007) “Immigration and Changing Labour Force
Structure in the Southern European Union“ Population (English edition), 62 (4): 709-727.
EBERS, M. (2007) Shrinking cities, the hidden challenge, Grin Verlag, Norderstedt.
FERIA, J.M. (2008): “Un ensayo metodológico de definición de las áreas metropolitanas
españolas a partir de la variable residencia-trabajo”, Revista Investigaciones Geográficas, 46,
p. 49-68.
FERIA, J.M. (2011) “Ciudad y Territorio. Nuevas dinámicas espaciales” In PUJADAS, I. et
al. (ed.) Población y Espacios Urbanos, Departament de Geografía Humana de la UB and
Grupo de población de la AGE, Barcelona, p. 13-52.
19
FERIA, J.M. and ALBERTOS, J.M. (coords.) (2010) La ciudad metropolitana en España.
Procesos urbanos en los inicios del siglo XX, Thomson Reuters, Pamplona.
FIELDING, A.J. (1982) “Counterurbanisation in Western Europe”, Progress in Planning, 17:
1-52.
GIL-ALONSO, F. and DOMINGO, A. (2008) “Latinoamericanos en el mercado de trabajo
español, 2000-05” Papeles de Población, 55: 145-172.
HAASE, A., KABISCH, S. and STEINFÜHRER, A. (2005) “Reurbanisation of inner-city
areas in European cities: Scrutinizing a concept of urban development with reference to
demographic and household change”, in SAGAN, I. and SMITH, D.M. (eds.) Society,
Economy, Environment – Towards the Sustainable City, Bogucki Wydawnictwo Naukowe,
Gdansk and Poznan, p. 75-91.
HALL, P. (2006) “Aged industrial countries”, in OSWALT, P. and RIENIETS, T. (eds.) Atlas
of Shrinking Cities, Hatje Cantz, Ostfildern, p. 144-145.
INSTITUTO DE DEMOGRAFÍA (1994) Proyección de la población española, Instituto de
Demografía/C.S.I.C., Madrid.
IZQUIERDO, A. and LÓPEZ DE LERA, D. (2003) “El rastro demográfico de la inmigración
en España: 1996-2002”, Papeles de Economía Española, 98: 68-93.
KABISCH, N. and HAASE, D. (2011) “Diversifying European Agglomerations: Evidence of
Urban Population Trends for the 21st Century”, Population, Space and Place, 17: 236-253.
LESTHAEGHE, R. and NEELS, K. (2002) “From the First to the Second Demographic
Transition: An interpretation of the Spatial Continuity of Demographic Innovation in France,
Belgium and Switzerland”, European Journal of Population, 18(4): 325-360.
LEVER, W.F. (1993) “Reurbanisation: The policy implications”, Urban Studies, 30: 267-284.
LÓPEZ-GAY, A. (2011) “¿Vuelve el centro? Caracterización demográfica de los procesos de
reurbanización en las metrópolis españolas”, in PUJADAS, I. et al. (Ed.) Población y
Espacios urbanos, Departament de Geografia Humana de la Universitat de Barcelona and
Grupo de Población de la AGE, Barcelona, p. 163-180.
MEDHURST, F. and PARRY LEWIS, J. (1969) Urban decay: An analysis and a policy,
Macmillan,
MINISTERIO DE LA VIVIENDA (2006) Atlas Estadístico de las Áreas urbanas en España,
I.S.B.N.: 978-84-96387-33-1.
MUÑOZ, F. and Izquierdo, A. (1989) “L‟Espagne, pays d‟immigration” Population, 44 (2):
257-289.
NEL·LO, O. (2004) “¿Cambio de siglo, cambio de ciclo? Las grandes ciudades españolas en
el umbral del siglo XXI”, Ciudad y territorio. Estudios Territoriales 36 (141-142): 523-542.
NEL·LO, O. (2007) “La tercera fase del proceso de metropolitanización en España”. In Los
procesos urbanos postfordistas. Ed. AGE and Universitat de les Illes Balears, Palma de
Mallorca.
OGDEN, P.E. and HALL, R. (2000) “Households, reurbanisation and the rise of living alone
in the principal French cities 1975-1990” Urban Studies, 37: 367-390.
OSWALT, P. (2003) Shrinking Cities: International research, Hatje Cantz, Ostfildern.
OSWALT, P. and RIENIETS, T. (eds.) (2006) Atlas of Shrinking Cities, Hatje Cantz,
Ostfildern, p. 144-145.
20
POZO, E. and GARCÍA, J.C. (2009) “Inmigración y cambio demográfico en la región
metropolitana madrileña entre 1996 y 2006,” Anales de Geografía de la UCM, 29 (1): 111-
138.
PUJADAS, I. (2009) “Movilidad residencial y expansión urbana en la Región Metropolitana
de Barcelona, 1982-2005” Scripta Nova. Revista Electrónica de Geografía y Ciencias
sociales. Barcelona: UB, 290 <http://www.ub.es/geocrit/sn/sn-290.htm >.
REQUES, P. and DE COS, O. (2004) “De lo global a lo local: repercusiones geodemográficas
de la inmigración en España” Economistas, 99: 48-61.
SERRANO, J.M. (2007) “Progresiva polarización demográfica de las aglomeraciones urbanas
en España dentro de sus ámbitos provinciales” Geographicalia, 51: 29-57.
TUROK, I. and MYKHNENKO, V. (2007) “The trajectories of European Cities, 1960-2005”,
Cities, 24: 165-182.
VAN DE KAA, D.J. (1987) “Europe‟s second demographic transition”, Population Bulletin,
42(1) : 1-59.
VAN DEN BERG, L., DREWETT, R., KLAASEN, L.H., ROSSI, A. and VIJVERBERG,
C.H.T. (1982) Urban Europe: A Study of Growth and Decline, Pergamon, Oxford.
VONO, D. (2010) ¿Preferidos y favorecidos? El proceso de asentamiento de la población
latinoamericana en España, PhD, CED and UAB Geography Department.