Embed Size (px)
Citation preview

SUBTRACTING RESIDUAL UNBALANCE FOR IMPROVED TEST STAND VIBRATION CORRELATION
by John C. Nicholas
President and Chief Engineer
Rotating Machinery Technology, Inc.
Wellsville , New York
Stephen L. Edney Group Leader, Stress and Vibration
Dresser-Rand, Steam Turbine Division
Wellsville, New York
John A. Kocur Chief Engineer, Mechanical Analysis
Demag Delaval Turbomachinery
Trenton, New Jersey
and Jerry F. Hustak
Manager, Development Projects
Dresser-Rand, Turbo Products Division
Olean, New York
John C. Nicholas is part owner, President, and Chief Engineer of Rotating Machinery Technology Incorporated, a company that repairs and services turbomachinery, and manufactures bearings and seals. He has worked in the turbomachinery industry for 20 years in the rotor and bearing dynamics areas, including five years at Ingersoll-Rand and five years as the Supervisor of the Rotordynamics Group at the Steam Turbine Division of Dresser-Rand.
Dr. Nicholas, a member of ASME, STLE, and the Vibration Institute, has authored 30 technical papers concerning tilting pad bearing design, pressure dam bearings, rotordynamics, and support stiffness effects on critical speeds.
He received his B.S.M.E. degree from the University of Pittsburgh (1968) and his Ph.D. degree from the University of Virginia ( 1977) in rotor and bearing dynamics. While at Virginia, he authored the tilting pad and pressure dam bearing computer programs that are used by many rotating equipment vendors, users, and consultants.
Stephen L. (Steve) Edney is Group Leader of the Stress and Vibration Group at the Steam Turbine Division of Dresser-Rand in Wellsville, New York. In this capacity, he is responsible for providing technical support in rotordynamics and stress analysis. This includes directing evaluation on rerate inquiries of existing machines, troubleshooting field vibration problems, and conducting research programs.
7
Dr. Edney has 14 years of industrial experience, including the past six years with Dresser-Rand. He started his career at GEC-Alsthom in the United Kingdom.
Dr. Edney received his B.Sc. (1983) and Ph.D. (1990) degrees in Mechanical Engineering from the University of Nottingham, England. He is a member of ASME and the Vibration Institute, and a graduate member of the !MechE. He has authored or coauthored eight technical papers covering the finite element modelling of shafts, the nonlinear response of a rotor in oil film bearings to shock excitation, and turbulence in tilting pad journal bearings.
John A. Kocur is Chief Engineer of Mechanical Analysis at Demag Delaval Turbomachinery, in Trenton, New Jersey. He has worked in the turbomachinery industry for the last 11 years. In his current capacity, he directs the rotordynamic and stress analysis of the compressor and steam turbine product lines. Prior to joining Demag Delaval, he held the position of Group Leader of Rotordynamics at Pratt & W hitney's Government Engines and Space
Propulsion Division. There, Dr. Kocur conducted and directed analysis of aircraft engine and rocket turbopump designs. He started his career at the Amoco Corporation Research Center in the position of Research Engineer.
Dr. Kocur has coauthored papers, lectured on hydrostatic bearings, has sat as Committee Chairman for the Fluid Film Bearing Workshop at NASA Lewis, and is a member of ASME.
He received his B.S.M.E. (1978), M.S.M.E. (1982), and Ph.D. degrees (1991) from the University of Virginia and an M.B.A. degree (1981) from Tulane University.

8 PROCEEDINGS OF THE 26TH TURBOMACIDNERY SYMPOSIUM
ABSTRACT The importance of correlating rotordynamic analytical results to
actual test data has become extremely important in recent years. Many user specifications require the verification of vendor generated analytical results in conjunction with shop unbalance testing. This correlation generally includes critical speed, amplification factor, and vibration magnitude.
Several problems arise during shop unbalance testing. First, it is not always feasible to place an unbalance test weight in a location where it will logically excite the mode in question. This can lead to test runs. where, despite a large unbalance weight, the residual unbalance is more influential than the test weight. Thus, the resulting rotor vibration is controlled by the residual unbalance and not the test unbalance. Consequently, any type of analytical correlation for this situation is extremely difficult.
Another problem with test stand data is that it usually comes from four different vibration probe locations. This results in four vibration plots and, in many cases, four different critical speeds, amplification factors, and vibration magnitudes. Again, the analytical correlation for this situation is extremely difficult, since determining the actual values for these parameters is somewhat nebulous.
These problems are addressed herein and a solution is offered. Several examples of analytical and test stand results are presented for steam turbines and centrifugal compressors. These examples highlight and discuss the problem areas identified. A method is presented for subtracting the vibration due to residual unbalance from that of the verification test. The resulting vibration with residual subtraction isolates the effect of the unbalance weight, and leads to improved correlation with analytical prediction.
INTRODUCTION With the constant pursuit for improved performance of
turbomachinery, engineers are facing the increasingly difficult task of designing reliable equipment to the limit. Over time, this has been made possible with decades of experience evolving design practices and modelling techniques. Not least does this include rotordynamics analysis, that today has evolved to the point where critical speeds can be accurately predicted [1], and dynamic instability avoided [2].
Although this increased knowledge has allowed some latitude with regard to safe operation in the vicinity of rotor critical speeds [3], it also has resulted in the requisite that the design be mechanically verified. For example, prevailing rotordynamics specifications allow operation on or near a rotor critical speed provided that the mode is highly damped. Concurrently, the requirement was added that all machines be unbalance tested prior to customer acceptance. This test includes a series of runs to reveal the exact location of all critical speeds that fall below trip speed, and to demonstrate no encroachment on the required separation margin of the nearest critical speed above trip.
While the behavior of modes below trip speed are usually identifiable, demonstration of the separation margin and/or the location of higher order modes above trip relies entirely upon the dynamic analysis of the rotor system. Therefore, the requirement to perform an unbalance test on all machines to validate the analysis is a valid and logical progression. This precludes any machine from leaving the test stand without prior analytical or experimental knowledge of the actual locations of all critical speeds. Thus, the method used to verify the analytical model must be practical and accurate. On some designs of turbomachinery, it is difficult to place an unbalance weight(s) on the rotor to logically excite the modes of concern. Centrifugal compressors are a prime example. The only readily accessible attachment plane is the coupling flange, which may have little influence on the modal response of the critical speed in question. In these instances, a method to determine and compare the effect of the unbalance weight on the rotor response is of prime importance.
Herein is described and examples presented of a method that can be used to subtract the vibration due to a rotor's inherent residual unbalance from an unbalance test run. This procedure isolates the vibration of the test weight(s) from the influence of the rotor's residual unbalance. The resulting vibration with residual subtraction is more appropriate for correlation with analytical prediction.
Advances in Rotordynamics Prediction
Over the last twenty-five years, there have been major advances in analytical rotor and bearing dynamics that have led greatly to improved critical speed predictions. Significant strides were made in the 1960s in parallel with the growth of the digital computer. These advances led to the development of the transfer matrix method for modelling shafts and the numerical solution of Reynolds equation for determining bearing dynamic coefficients. Notable contributions during this period were the early works of Lund, who published three landmark papers [4, 5, 6]. Lund's work (and others) provided the foundation for the development of many early bearing and rotordynamics computer programs that, even today, remain the basis of a vast majority of widely used codes.
In more recent years, with the increasing capability of modem computers, the finite element method has gained popularity in bearing and rotordynamics analysis. It has been applied in the modelling of tapered shafts [7] to incorporate gyroscopic, rotary inertia, shear and material damping, and in the continuing refinement of bearing models to include thermal and elastic effects [8, 9, 10]. More recent advances have addressed the development of oil and labyrinth seal codes that allow their destabilizing forces to be included in the rotor system model [11, 12], the importance of including support stiffness effects beyond the bearings [1], and the modelling of squeeze film dampers [13].
Evolution of Industrial Specifications
In conjunction with the advances in critical speed prediction, rotordynamics specifications were written and adopted by the American Petroleum Institute (API). Early editions of the API specifications (612 first [14], and 617 second and third [15, 16]) prohibited operation on, or near, any critical speed, regardless of the rotor's dynamic sensitivity. Tuttle [17] commented on this by stating that the "idea of specifying a maximum amplification factor is suggested as an alternative to an absolute prohibition against critical speeds in the operating speed range." However, by the late 1970s, these specifications had established an exception to the absolute separation margin requirement ( 612 second [ 18], and 617 fourth [19]) of 20 percent above maximum spe�d and 15 percent below minimum speed. The exception to this was that even if a critical speed violated a separation margin, it might still be acceptable, provided the rotor passed an unbalance sensitivity test.
In the 1980s, new editions to API were released that established a separation margin as a function of the rotor's dynamic sensitivity or amplification factor (612 third [20] and 617 fifth [21]). Critical speeds with amplification factors of less than 2.5 also were considered to be nonresponsive, with no separation margin required. These critical speeds were termed critically damped, and allowed manufacturers of rotating machinery to design machines that could run on or near a well damped rotor system resonance. Another important modification was the requirement that every machine undergo shop verification testing to identify the location of all critical speeds below trip.
The latest editions to API (612 fourth [22], and 617 sixth [23]) were issued in the mid 1990s. Both of these editions retained most of the previous specifications, but with two notable changes. First, the upper limit on the amount of unbalance used in the shop verification test was eliminated. Second, a section was added that requires a revision of the rotordynamics analysis if the shop verification test results do not agree with analytical prediction regarding critical speed, amplification factor, and vibration

SUBTRACTING RESIDUAL UNBALANCE FOR IMPROVED TEST STAND VffiRATION CORRELATION 9
magnitude. This section also includes a description of the method to be used for the unbalance test to raise the vibration at the probe locations to a specified amplitude. No limit, however, was placed on the magnitude of unbalance weight that could be used. This could lead to excessively large weights being applied, yielding abnormally large rotating forces that could result in the possibility of mechanical damage to equipment.
RESIDUAL UNBALANCE SUBTRACTION Although, for the most part, the correlation between measured
and predicted rotordynarnic behavior is encouraging, there are occasions when the test results do not accurately match analysis. Even in those cases where the general trends are favorable, there can be notable differences between probe location in the correlation of amplification factor and amplitude. In contrast, there are cases where the correlation is very poor and it is difficult to identify the exact location of a critical speed. The primary reason for this is the unbalance condition used to excite the critical speed in question. With some designs of turbomachinery, it is not always feasible to place the verification weight in a location that will logically excite a given mode, without time consuming disassembly of the machine and then some difficulty attaching the weight. Consequently, the weight is often applied in a location that is practical, and not necessarily optimum, to excite the mode of concern. In these cases, the modal influence of the weight is usually dominated by that of the rotor's residual unbalance.
The effect of an applied weight can be isolated by vectorially subtracting the vibration of the as balanced rotor from that with the applied weight. This is possible, since the rotor's vibration with an applied weight includes both the effect of the test weight plus the residual unbalance. For example, if the response vectors of amplitude and phase over a given speed range due to residual unbalance and with the test weight are described as "Q"R. and "Q".A, respectively, then the vector difference given by "Q" v =VA - V R yields the vibration due to the effect of the test weight alone. However, one must recognize that it is nearly impossible to generate two separate vectors that contain vibration data at identical speeds. Therefore, in order to perform this subtraction, one has to find two speeds that closely match in value within a specified tolerance. Although this is a potential source of error, the magnitude should be minimal provided the speed tolerance is small.
A similar technique to that described above has been used to determine the unbalance sensitivity of a motor [24]. In this case study, the differential vibration caused by the addition of a trial balance weight was determined by vectorially subtracting the Bode plots of two unbalance conditions.
STEAM TURBINES Special purpose steam turbines are required to be designed with
externally accessible field balance planes. Two planes are typically provided, located inboard of the journal bearings in the outboard area of the steam packing cases. These locations facilitate the placement of unbalance weights to logically excite first and second mode critical speeds for the shop verification test.
Three examples of residual unbalance subtraction on steam turbine rotors are discussed. The results presented are for a first mode excitation. This is because the· machines were designed to operate between their first and second rotor critical speeds; the first critical speed is, therefore, the only peak response that may be evaluated.
The first two examples are on special purpose steam turbines with integrally forged rotors: a large, slow speed machine with a highly responsive first mode; and a small, high speed machine with a critically damped first mode. These machines were designed with field balance planes that were used to locate the unbalance weights for the verification test. The third example is on a medium sized general purpose machine designed without field balance planes.
This example is included to demonstrate the effect of exciting the first mode by placing a single unbalance weight at the coupling. The results are compared with analytical predictions generated using measured bearing clearances in the calculation of the dynamic bearing coefficients, and an assumed isotropic support stiffness.
The following notation is used. Viewed from the governor, SEL and EEL refer to the probes located at the steam and exhaust ends 45 degrees counterclockwise from top dead center, and SER and EER to the probes located at the steam and exhaust ends 45 degrees clockwise from top dead center.
Example 1: Slow Speed Special Purpose Steam Turbine
The first example is a large 10 stage, backpressure, special purpose mechanical drive turbine. The design operating range was from a minimum governor speed of 2,450 rpm up to a maximum continuous speed of 2,970 rpm. Pertinent rotor and bearing information is listed in Table 1. The mass elastic model used in the analysis is illustrated in Figure 1. Values of 4.0 X 10⁶lb/in and 500 lb were used for the support stiffness and mass at each bearing in the unbalance response analysis.
Table 1. Steam Turbine Rotor and Bearing Information.
I E:umplel E:umplel I EumpleJ
llolor
Wcight(lbt) 5366 643 1163
Bearing Span L, (in) 117.0 51.0 57.12
MidshAft Diameter D, (in) 10.0 6.5 6.0
L,/0, Ratio (dim) 11.7 7.8 9.5
Field Balance Planes Yes Yes No Beorlnp
Type Tilling Pod Tilting Pod Tilling Pod
J��) 10.0/8.0 5.0/5.0 4.5/3.0
��dimim 0.75/0.75 0.75/0.75 0.4710.35
�Wj 62.1/88.5 16.3/18.0 65.2/69.3
Bearing C1cannoe (mil) 16.50 /12.25 9.2519.25 7.25/6.25 Exhiust/Steam &d
NumberSbces 4 5 5
PivotO!Ii!et 0.5 0.6 0.5
LoodOrientatioo BetwoenPod BetwoenPod Between Pod
+-------------�1�17�00�-------------.1�
2388 LBS
Figure 1. Mass Elastic Model of Rotor with Test Unbalance Noted-Example 1 .
The shop verification test was conducted by placing unbalance weights in phase at the rotors field balance planes (as indicated on Figure 1). The magnitude of each weight was equivalent to an unbalance of 16W/N, where W is the journal static load nearest each field balance plane and N is the maximum continuous operating speed. Actual values used as compared with the rotor's residual unbalance resulting from a progressive low speed balance are summarized in Table 2. Clearly, the magnitude of the
10 PROCEEDINGS OF THE 26TH TURBOMACHINERY SYMPOSIUM
verification weight is significant, yielding an unbalance that is greater than one order of magnitude larger than that of the rotor's residual unbalance.
Table 2. Comparison of Residual vs Verification UnbalanceExample 1.
Balance APITolenulce Low Speed Reoidual Verification U,IU, Plane 4 WIN per Pbm.e Unbalance u. Unbalance U¥
(oz-ln) (oz-in) (oz-ln)
Steam End 3.22 0.61 12.88 21.1
Exhaust End 4.01 1.32 16.04 12.2
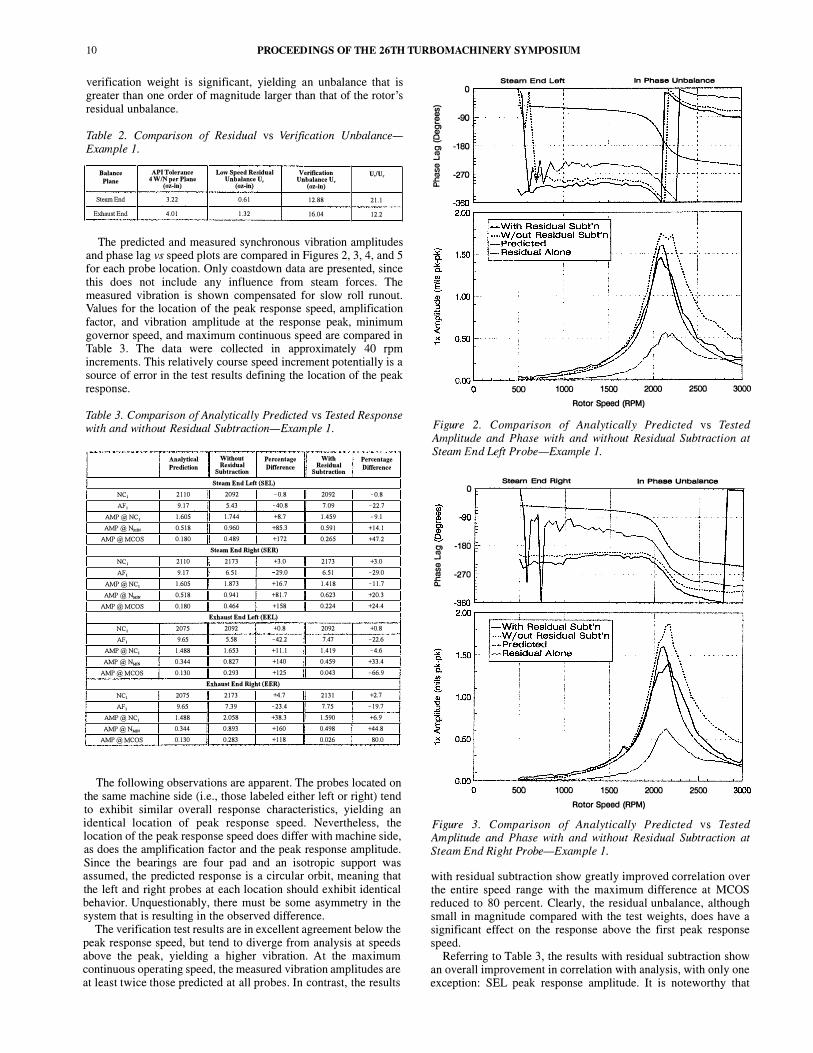
The predicted and measured synchronous vibration amplitudes and phase lag vs speed plots are compared in Figures 2, 3, 4, and 5 for each probe location. Only coastdown data are presented, since this does not include any influence from steam forces. The measured vibration is shown compensated for slow roll runout. Values for the location of the peak response speed, amplification factor, and vibration amplitude at the response peak, minimum governor speed, and maximum continuous speed are compared in Table 3. The data were collected in approximately 40 rpm increments. This relatively course speed increment potentially is a source of error in the test results defining the location of the peak response.
Table 3. Comparison of Analytically Predicted vs Tested Response with and without Residual Subtraction-Example 1.
Analytical Without Percentage With Pen:entage Predletion Reoldual Di«ennee Reoidual Difference�
Subtraetion Subtraetion
Steam End l.ell (SEL)
NC, 2110 2092 -0.8 2092 -0.8
AF, 9.17 5.43 -40.8 7.09 -22.7
AMP@NC, 1.605 1.744 +8.7 1.459 -9.1
AMP@Num 0.518 0.960 +85.3 0.591 +14.1
AMP@MCOS 0.180 0.489 +172 0.265 +47.2
Steam Eud Right (SER)
NC, 2110 2173 +3.0 2173 +3.0
AF, 9.17 6.51 29.0 6.51 -29.0
AMP@NC, 1.605 1.873 +16.7 1.418 -11.7
AMP@NNIH 0.518 0.941 +81.7 0.623 +20.3
AMP@MCOS 0.180 0.464 +158 0.224 +24.4
EmaUJt End Left (EEL)
NC, 2075 2092 +0.8 2092 +0.8
AF, 9.65 5.58 -42.2 7.47 -22.6
AMP@NC, 1.488 1.653 +11.1 1.419 -4.6
AMP@NNIN 0.344 0.827 +140 0.459 +33.4
AMP@MCOS 0.130 0.293 +125 0.043 -66.9
E:dlauat End Right (EER)
NC, 2075 2173 +4.7 2131 +2.7
AF, 9.65 7.39 -23.4 7.75 -19.7
AMP@NC, 1.488 2.058 +38.3 1.590 +6.9
AMP@N..,. 0.344 0.893 +160 0.498 +44.8
AMP@MCOS 0.130 0.283 +118 0.026 80.0
The following observations are apparent. The probes located on the same machine side (i.e., those labeled either left or right) tend to exhibit similar overall response characteristics, yielding an identical location of peak response speed. Nevertheless, the location of the peak response speed does differ with machine side, as does the amplification factor and the peak response amplitude. Since the bearings are four pad and an isotropic support was assumed, the predicted response is a circular orbit, meaning that the left and right probes at each location should exhibit identical behavior. Unquestionably, there must be some asymmetry in the system that is resulting in the observed difference.
The verification test results are in excellent agreement below the peak response speed, but tend to diverge from analysis at speeds above the peak, yielding a higher vibration. At the maximum continuous operating speed, the measured vibration amplitudes are at least twice those predicted at all probes. In contrast, the results
Steam End Left In Phaae Unbalance
0
I -90 Cl
e_ Cl -180
j m -270 .r:: a..
500 1000 1500 2000 2500 3000 Rotor Speed (RPM)
Figure 2. Comparison of Analytically Predicted vs Tested Amplitude and Phase with and without Residual Subtraction at Steam End Left Probe-Example 1.
Steam End Right In Ph...., Unbalenoe 0
J � Cl -180
j I -270 f
500 1000 1500 2000 2500 3000 Rotor Speed (RPM)
Figure 3. Comparison of Analytically Predicted vs Tested Amplitude and Phase with and without Residual Subtraction at Steam End Right Probe-Example 1.
with residual subtraction show greatly improved correlation over the entire speed range with the maximum difference at MCOS reduced to 80 percent. Clearly, the residual unbalance, although small in magnitude compared with the test weights, does have a significant effect on the response above the first peak response speed.
Referring to Table 3, the results with residual subtraction show an overall improvement in correlation with analysis, with only one exception: SEL peak response amplitude. It is noteworthy that

SUBTRACTING RESIDUAL UNBALANCE FOR IMPROVED TEST STAND VIBRATION CORRELATION 1 1
Exhaust End Left In Phll88 Unbalance
I j -180
J -270
� �----��--�----�----��--�--� �oo �=;�===r;===�--�--�--�
-With Residual Subt'n
I 1
i � 0.50
····Wfout Residual Subt'n -Predicted -Residual Alone
500 1000 1500 2000 Rotor Speed (RPM)
2500 3000
Figure 4. Comparison of Analytically Predicted vs Tested Amplitude and Phase with and without Residual Subtraction at Exhaust End Left Probe-Example 1.
In Ph1188 Unbalance
i I!! -90
� j -180
; -270
1.50
1.00 -
0.50
500 1000 1500 2000 2500 3000 Rotor Speed (RPM)
Figure 5. Comparison of Analytically Predicted vs Tested Amplitude and Phase with and without Residual Subtraction at Exhaust End Right Probe-Example 1.
regarding phase lag, the results with residual subtraction also show a general improvement in correlation with analysis. This is particularly evident at the exhaust end probes.
Example 2: High Speed Special Purpose Steam Turbine
The second example is a small, three stage, backpressure, special purpose mechanical drive turbine. The design operating
range was from a minimum governor speed of 7,909 rpm up to a maximum continuous speed of 11,863 rpm. Pertinent rotor and bearing information is listed in Table 1, and the mass elastic model is illustrated in Figure 6. Values of 3.0 X 1Q6lb/in and 150 lb were used for the support stiffness and mass at each bearing.
8.88 - +-------------�51�Jro�--------------l�
354 LBS 310 LBS
Figure 6. Mass Elastic Model of Rotor with Test Unbalance Noted-Example 2.
The shop verification test was conducted by placing unbalance weights in phase at the rotors field balance planes. The magnitude of each weight was equivalent to an unbalance of 32W/N (where W is the journal static load). Actual values used are compared with the rotor's residual unbalance in Table 4. As in the previous example, the verification weight yields an unbalance that is greater than one order of magnitude larger than the rotor's low speed residual unbalance.
Table 4. Comparison of Residual vs Verification UnbalanceExample 2.
Balance API Tolerance uu:t::n�ual Verilleatlon U,JU, Plane 4 WIN per Plane Unbalanee u ..
( ... In) (oz..ln) (oz.ln) Steam End 0.105 0.039 0.84 21.5
Exhaust End 0.119 0.041 0.95 23.2
The predicted and measured synchronous vibration amplitudes and phase lag vs speed plots are compared in Figures 7, 8, 9, and 10 for each probe location. Coastdown data again are presented. Values for the location of the peak response speed, amplification factor, and vibration amplitude at the peak response, minimum governor speed, and maximum continuous speed are compared in Table 5. On passing through the peak response, the data were collected in approximately 120 rpm increments.
The verification test results are in excellent agreement with the predicted values, with only a slight deviation from analysis at the exhaust end probes at speeds above the peak response. This raises the question of why take the time to perform the residual subtraction when there is no apparent need. And, in fact, when this is done, there is very little improvement in the accuracy of the results. The reason is that, in this case, the rotor was exceptionally well balanced yielding a vibration of less than 0.1 mil (peak-topeak) over the speed range tested. Consequently, the correction is minimal, as indicated by the results.
Nevertheless, this case clearly demonstrates the validity of the methodology outlined. For example, the corrected results improve the accuracy of the data with only three exceptions: EEL location of peak response, EEL amplitude at minimum speed, and EER peak response amplitude. In these cases, the loss of accuracy is minimal. The most likely source of error is the large speed increment in the data collected. Of interest is that the greatest improvement in accuracy is at the upper end of the operating speed range where the residual unbalance has the largest influence. As in

12 PROCEEDINGS OF THE 26TH TURBOMACHINERY SYMPOSIUM
Table 5. Comparison of Analytically Predicted vs Tested Response with and without Residual Subtraction-Example 2.
Analytical Without Pen:eatage Wlth Percentage Prediction Reoldaol Dllrerence Reoldaol -
Sahtnetlon Sabtradlon
Steam Ead I.efl (SEL)
NC, 7450 7547 +1.3 7547 +1.3
AF, 2.48 2.50 +0.8 2.50 +0.8
AMP@NC, 0.537 0.579 +7,8 0.548 +2.0
AMP@N.,. 0.512 0.548 +7.0 0.511 -0.2
AMP@MCOS 0.180 0.220 +22.2 0.201 +11.7
Steam Ead lllght (SER)
NC, 7450 7135 -4.2 7135 -4.2
AF, 2.48 2.13 -14.1 2.13 -14.1
AMP@NC, 0.519 0.551 +6.2 0.528 +1.7
AMP@N.,. 0.499 0.522 +4.6 0.502 +0.6
AMP@MCOS 0.179 0.222 +24.0 0.199 11.2
Eshaaot End I.efl (EEL)
NC, 7000 7270 +3.9 7407 +5.8
AF, 2.26 2.65 +17.3 2.51 +11.1
AMP@NC, 0.551 0.567 +2.9 0.557 +1.1
AMP@N..,. 0.487 0.522 +7.2 0.535 +9.9
AMP@MCOS 0.213 0.070 -67.1 0.132 -38.0
Eshauat End lllght (EER)
NC, 7000 7135 +1.9 7135 +1.9
AF, 2.19 2.64 +20.5 2.55 +16.4
AMP@NC, 0.535 0.532 -0.6 0.529 -1.1
AMP@N•� 0.484 0.429 -11.4 0.443 -8.5
AMP@MCOS 0.213 0.057 -73.2 0.137 -35.7
In Pha8e Unbalance
o.oo L...-II!ll:;;;;..==:t::::::;::...�.L.......��.L.......��L.....�.........J 0 2000 4000 6000 6000
Rotor Speed (RPM)
10000 12000
Figure 7. Comparison of Analytically Predicted vs Tested Amplitude and Phase with and without Residual Subtraction at Steam End Left Probe-Example 2.
the previous example, the results with residual subtraction also show a general improvement in correlation of the phase lag.
Example 3: General Purpose Steam Turbine
The third example is on a six stage, backpressure, general purpose mechanical drive turbine. The design operating range was from a minimum governor speed of 6,500 rpm up to a maximum continuous speed of 7,951 rpm. As in the previous two examples, pertinent rotor and bearing information is listed in Table 1. The
� � !ll :s ..
i 0.40
� 0.20
0.00 0 2000 4000 6000 6000 10000 12000
Rotor Speed (RPM)
Figure 8. Comparison of Predicted and Measured Amplitude and Phase with and without Residual Subtraction at Steam End Right Probe-Example 2.
Exhauat End Lett In Phaaa Unbalance
-360
1.00
-With Residual Subt'n •••. w;out Residual Subt'n
0.80 ... -Predicted
I -Residual Alone
!ll 0.60 s
i 0.40
.. .... 0.20
0.00 0 2000 4000 6000 6000 10000 12000
Rotor Speed (RPM)
Figure 9. Comparison of Analytically Predicted vs Tested Amplitude and Phase with and without Residual Subtraction at Exhaust End Left Probe-Example 2.
mass elastic model is shown in Figure 11. Values of 3.0 X 10⁶lb/in and 500 lb were used for the support stiffness and mass.
Since this machine was designed to a general purpose specification, field balance planes were omitted. A shop verification test, however, was conducted by placing a single unbalance weight at the coupling. The magnitude of this weight was equivalent to an unbalance of 16W/N, where W is the exhaust end journal static load. The actual value used is compared with the

SUBTRACTING RESIDUAL UNBALANCE FOR IMPROVED TEST STAND VIBRATION CORRELATION 13
Exhaust End Right In Phase Unbalance
-90
-180
-270
-&m ����----�----�--��-----4----� 1.00,----------------------,
0.60
-With Residual Subt'n .... w;out Residual Subt'n --·Predicted --·-Residual Alone
Rotor Speed (RPM)
Figure 10. Comparison of Analytically Predicted vs Tested Amplitude and Phase with and without Residual Subtraction at Exhaust End Right Probe-Example 2.
11.00 57.12 13.82
"' !/) !/) !/) !/) "' !/) ..J Ill "' m "' "' "! ..J ..J ..J ..J ..J It! "! "! ;:; "! .. ... � "' "' ::.=! "' "' .. "'
623 LBS 540 LBS
Figure II. Mass Elastic Model of Rotor vvith Test Unbalance Noted-Example 3.
rotor's residual unbalance in Table 6. Once again, the verification weight has an unbalance that is greater than one order of magnitude larger than the rotor's low speed residual unbalance.
Table 6. Comparison of Residual vs Verification UnbalanceExample 3.
Balance API Tolerance �:&d!n�:s��u:d Verification U,!U, Plane 4 WIN per Plane Unba1ant.� U,.
(oz...in) (oz-in) (oz-bt)
Steam End 0.272 0.056
Exhaust End 0.313 0.046
Coupling 1.2 26.1
The predicted and measured synchronous vibration amplitudes and phase lag vs speed plots are compared in Figures 12, 13, 14, and 15. Values for the location of the peak response speed, amplification factor, and vibration amplitude at the peak response, minimum governor speed, and maximum continuous speed are compared in Table 7. On passing through the peak response, the data were collected in approximately 60 rpm increments.
Unlike the previous two examples, this case shows a significant improvement in overall response of the results with residual
Table 7. Comparison of Analytically Predicted vs Tested Response with and without Residual Subtraction-Example 3.
NCI
AF1
AMP@NC,
AMP@NNm
/\MP@MCOS
NC,
AFI
AMP@NC1
AMP@NMIN
Mll'@MCOS
NC1
AF,
Al:v1P@NC1
AMP@N�!IN
AMP@MCOS
NC1
AF1
AMP@NC1
AMP@Nw11
AMP@MCOS
Ul ., � Ol
g Ol -180 "' ...J ., "' <0 -270 .c a..
Analytical Without Percentage WUh Percentage Prediction Residual Difference Residual Difference
Subtraction Subtraction
Steam End Left (SEL)
4430 4254 -4.0 4254 -4.0
5.27 3,92 -25.6 4.35 -17.5
0.209 0.274 +31.1 0.211 +1.0
0.203 0.250 +23.2 0.178 -12.3
0.303 0.337 +11.2 0.187 -38.3
Steam End Right (SER)
4150 4003 -3.5 4003 -3.5
5 19 5.77 +11.1 3.61 -30.4
0.225 0.409 +81.8 0.256 +13.8
0.190 0.275 +44.7 0.200 +5.3
0.348 0.441 +26.7 0.269 -22.7
ExhauNt End Uft (EEL)
3800 3327 -12.4 3388 -10.8
3.17 2.61 -17.7 2.74 -13.6
0.187 0.268 +43.3 0.198 +5.9
0.293 0.347 +18.4 0.332 +13.3
0.467 0.668 +43.0 0.527 +12.8
Exhaust End Right (EER)
3870 3878 +0.2 3950 +2.1
3.28 4.51 +37.5 3.96 +20.7
0.198 0.353 +78.2 0.223 +12.6
0.348 0.384 +10.3 0.356 +2.3
0.597 0.632 +5.9 0.492 -17.6
Steam End Left Coupling Unbalance
1000 2000 3000 4000 5000 6000 7000 8000 Rotor Speed (RPM)
Figure 12. Comparison of Analytically Predicted vs Tested Amplitude and Phase with and without Residual Subtraction at Steam End Left Probe-Example 3 .
subtraction compared with the analysis. The primary reason for this is the unbalance location used to excite the first critical speed, which is a cylindrical mode. A concentrated overhung unbalance has more of a conical influence on the response of a rotating shaft. Consequently, the test weight has its effectiveness somewhat diminished compared with that of the residual unbalance, which is randomly distributed along the entire length of the rotor.
The most noticeable improvement of the results with residual subtraction is at the peak response, particularly at the probes located on the right hand side of the machine. Although, overall, the results appear worse in four cases, the poor signal quality of the

14 PROCEEDINGS OF THE 26TH TURBOMACHINERY SYMPOSIUM
:i' i a.
i CD "0
t Ji! �
0.10
1000 2000 3000 4000 5000 6000 7000 6000
Rotor Speed (RPM)
Figure 13. Comparison of Analytically Predicted vs Tested Amplitude and Phase with and without Residual Subtraction at Steam End Right Probe-Example 3.
I ! "' -180
�
i ·270
0.20
o.oo L����l..���:.:.......L�...L......J 0 1000 2000 3000 4000 5000 6000 7000 6000
Rotor Speed (RPM)
Figure 14. Comparison of Analytically Predicted vs Tested Amplitude and Phase with and without Residual Subtraction at Exhaust End Left Probe-Example 3.
data that were acquired via a tape recorder is a major source of this error.
This example also demonstrates the variation in location of critical speed and amplification factor that can occur from probe to probe and end to end. Referring to Table 7, the location of the predicted critical speed varies by up to 14.2 percent and the amplification factor by up to 39.8 percent. In comparison, the critical speed with residual subtraction varies by up to 20.4 percent and the amplification factor by up to 37.0 percent.
0 Exhaust End Right Coupling Unbalance
I -90
� "' ·180
� !!I ·270 .t: Q.
0.20
1000 2000 3000 4000 5000 6000 7000 8000
Rotor Speed (RPM)
Figure 15. Comparison of Analytically Predicted vs Tested Amplitude and Phase with and without Residual Subtraction at Exhaust End Right Probe-Example 3.
CENTRIFUGAL COMPRESSORS As sent to the test stand, centrifugal compressor residual
unbalance will normally exist. For high speed flexible shaft designs, this will include an unbalance distribution that is often sacrificed to some extent at the first critical speed to achieve low vibration levels over the operating range. Thus, sufficient excitation usually exists to easily identify the peak response at the first critical as observed at the probe locations. However, unlike special purpose steam turbines, centrifugal compressors are not required to have externally accessible field balance planes. Most compressor unbalance tests, therefore, are conducted by placing the verification weight at the coupling. Consequently, for flexible rotors with an extended separation margin between the first and second critical speeds, the coupling weight will have little effect on vibration levels at the first critical speed.
Example 4: Three Stage Centrifugal Compressor
First, consider the three stage centrifugal compressor illustrated in Figure 16. Pertinent rotor and bearing information is listed in Table 8. This compressor was designed with sufficient separation margins to meet current rotordynamic specifications and, thus, is insensitive to coupling unbalance. The predicted response to a coupling unbalance of 32W/N (where W is the rotor overhung weight) at the coupling end probe is shown in Figure 17. At the operating speed of 13,400 rpm, response levels below 0.1 mil (peak-to-peak) are predicted. Clearly, this unbalance condition has little effect on the predicted damped first critical speed of 10,000 rpm obtained with a midspan unbalance (figure not included). Consequently, the location of the first critical speed cannot easily be identified in the plot.
Presented in Figure 18 is the coupling end vibration of this compressor in the as balanced condition. Clearly, the first critical speed is easily identified. A well damped first peak response near 10,000 rpm is evident. With the placement of the 32W/N verification weight on the coupling, the Bode plot of Figure 19 was produced. The first peak response speed remains clearly evident. However, any increase in the vibration level at the critical due to the unbalance weight is not perceivable.

SUBTRACTING RESIDUAL UNBALANCE FOR IMPROVED TEST STAND VIBRATION CORRELATION 15
Table 8. Centrifugal Compressor Rotor and Bearing Information.
Enmple4 EXllmple5 Rotor
Weight(lbQ 285 1587 Bearing Span L. (in) 36.0 76.81
Midshaft Diameter D, (in) 5.25 7.25 LJD. Ratio (dim) 6.9 !0.6
Field Balance Planes No No
Bearings Type Tilting Pad Tilting Pad
Journal Diameter (in) 25 5.0 LID Ratio (dim) 0.45 0.46
Projected Load (psi) 50.6 69.0 Bearing Clearance (mil) 4.0 8.0
Number Shoes 5 5 Pivot Offset 0.5 0.55
Load Orientation Between Pad Between Pad
Journal Bearing
Case Labyrinth
Impeller Eye Labyrinth
Impeller Eye Labyrinth
Impeller Eye labyrinth
Balance Piston
Case labyrinth
Journal Bearing
Figure 16. Three Stage Compressor Schematic-Example 4.
Now, a direct comparison is made for the three stage compressor between the test stand results of Figure 19 and the analytical results
0 2000 4000 6000 8000 10000 12000 14000
Rotor Speed (rpm) Figure 17. Three Stage Compressor Analytically Predicted Response with 32WIN Coupling Unbalance-Example 4.
���iN�?��w�G "X" f4' Right 1X UNCOMP 0.1 82[69 From 09FEB9617:28:16 To 09FEB96 1�30:1 3 Steady State
90 g� 180 �'*' 270 a:� 360
B 90 �==�==�====�==�==��==�� 0.15
§& 0.10 �'� �0 0.05
0.00
Mechanical test following 4 hour run.
Figure 18. Three Stage Compressor Actual Test Response with Residual Unbalance-Example 4.
��JiN�?��i�G ")(" L� Right 1X UNCOMP 0 1 88f4> From 09FEB9618:20:23 To 09FEB96 18:34:16 Steady State
4
SPEED: 0.5 krpm/div Unbalance verification test: 1 .25 gms on spool piece.
10 10 krpm 12
Figure 19. Three Stage Compressor Actual Test Response with 32WIN Coupling Unbalance without Residual SubtractionExample 4.
of Figure 17. From Figure 17, the analysis predicts a valley in the response at 11,000 rpm. The test stand results from Figure 19 actually show a valley near 13,000 rpm.
Clearly, it appears that the analysis (Figure 17) does not correspond to the test stand unbalance plots (Figure 19). This is largely due to the fact that the vibration plotted from the verification test is a result of the verification weight plus the rotor's residual unbalance. This residual unbalance is unknown and cannot be taken into account in the analysis. Furthermore, the results would be unchanged by the size of the coupling unbalance, since the test weight used did not affect the vibration level at the first critical speed.
The effect of the verification weight can be isolated by subtracting the as balanced vibration (Figure 18) from the

16 PROCEEDINGS OF T HE 26TH T URBOMACHINERY SYMPOSIUM
verification test vibration (Figure 19). The result of this residual unbalance subtraction for the three stage compressor is shown in Figure 20. Notice that the peak at 10,000 rpm is replaced by a valley near 11,000 rpm, as predicted by the analytical results of Figure 17.
���N1C?�MNG"X" f4!1'Right 1XUNCOMP 0.018fNA
From 09FEB9618:20:23 To 09FEB9618:34:16 Steady State
r. �. � 1 . '' > 120 · · I . . I . . I
�� 180 . ·.• .' : •. : : .· : : 01 . . I . I " : " I .
�� 240 : : : . : : ' : . : fi:� 300 : : : : . : . i . . : .
. . I . . I , I
� 0.10
�� 0.08 "'- 0.08 :re 0.04 �8 0.02
d 0.00
SPEEO: 0.5 krpmldlv
- VECTOR DATA: SUBTRACTION-· Effect of adding unbalance weight.
Figure 20. Three Stage Compressor Actual Test Response with Residual Subtraction-Example 4.
Example.5: Eight Stage Centrifugal Compressor
Second, consider the eight stage compressor illustrated in Figure 21. Rotor and bearing information is listed in Table 8. This compressor also was designed with sufficient separation margins to meet current rotordynarnic specifications and, thus, also is insensitive to coupling unbalance. The predicted response to a coupling unbalance of 32W/N (where W is the rotor overhung weight) at the coupling end probe is shown in Figure 22. At the maximum continuous speed of 11,500 rpm, response levels of 0.15 mil (peak-to-peak) are predicted. Furthermore, a nodal situation occurs at the first critical speed of this rotor, i.e., at 3,600 rpm.
The eight stage compressor in the as balanced condition produced the Bode plot shown in Figure 23. The compressor's Bode plot with a 32W/N verification weight at the coupling are represented in Figure 24. The response of the first critical speed is easily identified in both plots at 3,700 rpm. However, as before, any increase in the vibration level at the critical due to the unbalance weight is not perceivable. The effect of the verification weight may again be isolated by subtracting the residual unbalance data (Figure 23) from the unbalanced data (Figuie 24). The result of this subtraction is shown in Figure 25. The 3,700 rpm peak at the first critical that is evident in Figures 23 and 24 is hardly noticeable in Figure 25, as predicted by the analytical results from Figure 22.
DISCUSSION Influence of Residual Unbalance
However small, the residual unbalance inherent in a rotor can influence the correlation of test stand data with analytical prediction. In all of the examples presented, an overall improvement in the correlation of the test stand data with analytical prediction was observed by subtracting the vibration due to residual unbalance. In particular, in the centrifugal compressor examples, the vibration with the unbalance test weight was indistinguishable from the data with residual unbalance alone. This is because the modal influence of the test weight was insignificant when compared to the effect of the residual unbalance. In these cases, performing the residual subtraction for meaningful test stand vibration correlation is a necessity.
Influence of Unbalance Location
The location used for placement of the unbalance test weight is a major factor influencing the quality of the test results. Results obtained from an unbalance condition that logically excites the
Journal Bearing
Case Labyrinth
Impeller Eye Labyrinth
Impeller Eye Labyrinth
Impeller Eye Labyrinth
Impeller Eye Labyrinth
Honeycomb Balance Piston
Impeller Eye Labyrinth
Impeller Eye Labyrinth
Impeller Eye Labyrinth
Impeller Eye Labyrinth Case Labyrinth
Journal Bearing
Figure 21. Eight Stage Compressor Schematic-Example 5.
"f .!1 l 0.15
j J
0.10
� 0.05
2000 4000 6000 8000
Rotor Speed (rpm) 10000 12000 14000
Figure 22. Eight Stage Compressor Analytically Predicted Response with 32WIN Coupling Unbalance-Example 5.
mode in question will always yield superior data. Nevertheless, even in those cases where the modal effect of the unbalance weight is not readily evident, its influence can be isolated by subtracting the vibration due to residual unbalance.
Effect of Probe Location
Clearly, from the examples presented, there always will be some judgment required in the interpretation of the measured data. Even in the case of a relatively rigid rotor supported on soft bearings,

SUBTRACTING RESIDUAL UNBALANCE FOR IMPROVED TEST STAND VIBRATION CORRELATION 17
�m=N1:���D ;:'PRT. L419 Left 1x UNCOMP 1 .21 tFrom 10AUG911 14:02:1 5 To 10AUG911 14:08:32 Startup
1 80
g� 270
�r 360 "'"' 90 a. -
-� 1 .0 �8: 2 ·E 0.5 � �
0.0
-nlcal test following 4 hour run.
SPEED: 0.5 klpm/dlv
3700 rpm
Figure 23. Eight Stage Compressor Actual Test Response with Residual Unbalance-Example 5.
��i�l:�k��D ;:'PRT. L419 Lall 1X UNCOMP 1.31p4 From 10AUG95 20:08:1 3 To 10AUG95 20: 1 1 :14 Startup
180
g! 270 i;J � 360 f!! 90
3700 rpm
� 1 80 �==�==�====�==�����
�� 1 .0
�e 0.5 � �
0
0.0
Unbalance verification test 32W/N weight placed on coupling hub.
Figure 24. Eight Stage Compressor Actual Test Response with 32W/N Coupling Unbalance without Residual SubtractionExample 5.
��iN<f��D �RT. L419 Lall 1X UNCOMP 0.057f_NA Frcm 10AUG95 20:08:22 To 10AUG911 20: 1 1 :08 Startup
.. > 120 �� 180 �! 240 a. -
SPEED: 0.5 krpmldlv
- VECTOR DATA: SUBTRACTION - • Eflect of adding unbala""" weight.
3700 rpm
Figure 25. Eight Stage Compressor Actual Test Response with Residual Subtraction-Example 5.
there often will be some degree of correlation variation at all of the vibration probes. This not only will be in terms of the location of the peak response speed, but also in terms of the value of the amplification factor.
There are several reasons why this should be the case that, at the design stage, are impossible to include in the analytical model. The primary reason is the unknown distribution of unbalance in the rotor, which is indeterminable. Another factor is the influence of the support, which is often treated as a symmetric stiffness in the analytical model. In practice, support characteristics are asymmetric and frequency dependent, and can have a significant effect on critical speed. Secondary effects include values assumed for bearing and pad clearance at each journal bearing, and the influence of fluid forces (such as oil and labyrinth seals, and
bearing preload resulting from coupling misalignment, aerodynamic, and/or steam partial admission).
CONCLUSIONS A methodology is presented that can be used to isolate the modal
influence of a verification weight(s) for improved test stand vibration correlation. The results presented demonstrate the importance of recognizing the limitations in conducting such tests when unbalance weights cannot be placed to logically excite modes under consideration. In such cases, the modal influence of an unbalance weight can be insignificant when compared to the residual unbalance inherent in a rotor. This effect must be accounted for in the evaluation of the test data to provide any meaningful correlation.
The primary conclusions of this investigation may be summarized as follows:
• There will often be some degree of variation in the location of critical speed and amplification factor as observed at the vibration probes.
• Residual unbalance can have a significant influence on the response of a rotor, particularly at speeds near to or above the first critical speed.
• The degree to which an unbalance test can be correlated with analytical prediction is, to some extent, highly dependent on the location used for the test weight.
• On insensitive designs that are to be verification tested by placing an unbalance weight at the coupling, a limit should be placed on the value of unbalance used to avoid excessive unbalance forces being applied to the rotor.
• At the design stage, it is impossible to include all factors that could influence the test stand response of a rotor. Consequently, it is reasonable to expect some degree of variation in the correlation of the verification test with analysis.
RECOMMENDATIONS In correlation of the analytical model with the unbalance test,
allowance must be made for the fact that critical speeds will vary with probe location, and amplification factors and vibration magnitudes will be influenced by residual unbalance. Without subtracting the vibration due to residual unbalance from the unbalance test, one must recognize that applying stringent acceptance criteria on critical speed, amplification factor, and vibration magnitude can be limited. If the test stand correlation is judged to be unacceptable, the vibration due to residual unbalance should be subtracted and the results compared with analytical prediction.
NOMENCLATURE AF1 = Amplification factor at NC1 (dim)
AMP = Vibration amplitude (mil)
D = Journal bearing diameter (in)
D8 = Midshaft diameter (in)
L = Journal bearing pad axial length (in)
Lb = Bearing span (in)
MCOS = Maximum continuous operating speed (rpm)
= Minimum governor speed (rpm)
= Maximum continuous operating speed (rpm)
= First peak response speed (rpm)
= Residual unbalance (oz-in)
= Verification unbalance (oz-in)

18 PROCEEDINGS OF THE 26TH TURBOMACHINERY SYMPOSIUM
�A �R �v w
= Residual plus verification weight response vector (mil)
= Residual response vector (mil)
= Verification weight response vector (mil)
= Journal static load or rotor overhung weight (lbf)
REFERENCES 1. Nicholas, J. C., Whalen, J. K., and Franklin, S. D., "Improving
Critical Speed Calculations Using Flexible Bearing Support FRF Compliance Data," Proceedings of the Fifteenth Turbomachinery Symposium, The Thrbomachinery Laboratory, Texas A&M University, College Station, Texas, pp. 69-78 (1986).
2. Kirk, R. G., "Evaluation of Aerodynamic Instability Mechanisms for Centrifugal Compressors-Parts 1 and 2: Current Theory and Advanced Analysis," ASME Journal of Vibration, Acoustics, Stress and Reliability in Design, 110 (2), pp. 201-212 (1988).
3. Nicholas, J. C., "Operating Turbomachinery on or near the Second Critical Speed in Accordance with API Specifications," Proceedings of the Eighteenth Turbomachinery Symposium, The Turbomachinery Laboratory, Texas A&M University, College Station, Texas, pp. 47-54 (1989).
4. Lund, J. W., "Spring and Damping Coefficients for the Tilting Pad Journal Bearing," Transactions of the ASLE, 7 (4), pp. 342-352 (1964).
5. Lund, J. W., "The Stability of an Elastic Rotor in Journal Bearings with Flexible Damped Supports," Transactions of the ASME, Journal of Applied Mechanics, 87, pp. 911-920 (1965).
6. Lund, J. W., "Stability and Damped Critical Speeds of a Flexible Rotor in Fluid-Film Bearings," ASME Journal of Engineering for Industry, 96 (2), pp. 509-517 (1974).
7. Greenhill, L. M., Bickford, W. B., and Nelson, H. D., "A Conical Beam Finite Element for Rotor Dynamics Analysis," Transactions of the ASME, Journal of Vibration, Acoustics, Stress and Reliability in Design, 107, pp. 421-430 (1985).
8. Ettles, C. M. M., "The Analysis and Performance of Pivoted Pad Journal Bearings Considering Thermal and Elastic Effects," STLE Journal of Lubrication Technology, 102 (2), pp. 182-192 (1980).
9. Knight, J. D. and Barrett, L. E., "Analysis of Tilting Pad Journal Bearings with Heat Transfer Effects," STLE Tribology Transactions, 110 (1), pp. 128-133 (1988).
10. Branagan, L. A., "Thermal Analysis of Fixed and Tilting Pad Journal Bearings Including Cross-Film Viscosity Variations and Deformations," Ph.D. Dissertation, University of Virginia, Charlottesville, Virginia (1985) . .
11. Iwatsubo, T., Matooka, N., and Kawai, R., "Spring and Damping Coefficients of the Labyrinth Seal," NASA CP 2250, pp. 105-222 (1982).
12. Childs, D. W. and Scharrer, J. K., "An Iwatsubo-Based Solution for Labyrinth Seals-Comparison to Experimental Results," Rotordynamic Instability Problems in High Performance Turbomachinery, Texas A&M University, College Station, Texas (1984).
13. Gunter, E. J., Barrett, L. E., and Allaire, P. E., "Design and Application of Squeeze Film Dampers for Thrbomachinery Stabilization," Proceedings of the Fourth Turbomachinery Symposium, The Turbomachinery Laboratory, Texas A&M University, College Station, Texas, pp. 127-141 (1975).
14. American Petroleum Institute Standard 612, "Special Purpose Steam Turbines for Refinery Services," American Petroleum Institute, Washington D.C., First Edition (1969).
15. American Petroleum Institute Standard 617, "Centrifugal Compressors for Petroleum, Chemical and Gas Service Industries," American Petroleum Institute, Washington D.C., Second Edition (1963).
16. American Petroleum Institute Standard 617, "Centrifugal Compressors for Petroleum, Chemical and Gas Service Industries," American Petroleum Institute, Washington D.C., Third Edition (1973).
17. Tuttle, J. A., "Damping of Lateral Critical Speeds of Turbomachinery," ASME Paper 70-FE-14 (1970).
18. American Petroleum Institute Standard 612, "Special Purpose Stearn Turbines for Refinery Services," American Petroleum Institute, Washington D.C., Second Edition (1979).
19. American Petroleum Institute Standard 617, "Centrifugal Compressors for Petroleum, Chemical and Gas Service Industries," American Petroleum Institute, Washington D.C., Fourth Edition (1979).
20. American Petroleum Institute Standard 612, "Special Purpose Stearn Thrbines for Refinery Services," American Petroleum Institute, Washington D.C., Third Edition (1987).
21. American Petroleum Institute Standard 617, "Centrifugal Compressors for Petroleum, Chemical and Gas Service Industries," American Petroleum Institute, Washington D.C., Fifth Edition (1988).
22. American Petroleum Institute Standard 612, "Special Purpose Steam Turbines for Refinery Services," American Petroleum Institute, Washington D.C., Fourth Edition (1996).
23. American Petroleum Institute Standard 617, "Centrifugal Compressors for Petroleum, Chemical and Gas Service Industries," American Petroleum Institute, Washington D.C., Sixth Edition (1995).
24. Szenasi, F. R., "Motor-Generator Vibration Problems Encountered When Restaging an FCCU Turboexpander," Proceedings of the Second International Turbo-Expander User's Council, Technical Services Institute, Corpus Christi, Texas (1993).