Embed Size (px)
Citation preview

Earth Planets Space, 57, 755–760, 2005
Subsurface structural mapping of Gebel El-Zeit area, Gulf of Suez, Egyptusing aeromagnetic data
Essam Aboud1, Ahmed Salem2, and Keisuke Ushijima1
1Earth Resources Engineering Department, Kyushu University, Fukuoka 812-8581, Japan2Airborne Geophysics Department, Nuclear Materials Authority, Cairo, Egypt
(Received January 30, 2004; Revised May 12, 2005; Accepted May 12, 2005)
The Gebel El-Zeit area is located on the western coast of the Gulf of Suez, Egypt. The areas in/and around theGulf of Suez are generally important due to their hydrocarbon resources. In this study, we have applied gradientinterpretation techniques (Euler deconvolution and analytic signal) to the aeromagnetic data of the Gebel El-Zeitarea. The main objective of this study is to identify and delineate the possible subsurface structure of the area thatmay assist in locating new hydrocarbon prospects. Results of Euler method suggested that, on the eastern andwestern parts of the area, the basement could be observed on the ground (∼50 m over the ground) and becamemore deeper on the central part to reach depth of 5 km (from the ground level). Results from the analytic signalmethod indicated that, the depth to the basement has an average value of 156 m on the eastern side and 758 m onthe western side. Generally, the area is characterized by a graben structure bounded by major faults striking inthe NW-SE direction.Key words: Gebel El-Zeit area, magnetic, euler deconvolution, analytic signal, Gulf of Suez, Egypt.
1. IntroductionThe Gebel El-Zeit area is located on the western coast of
the Gulf of Suez, Egypt (Fig. 1). The study area has a greatimportance due to its hydrocarbon resources. Several seis-mic surveys have been applied in the Gebel El-Zeit area todelineate the subsurface structure and its relation to hydro-carbon prospects. In most of these surveys, seismic energywas masked by the Pre-Miocene salt formation (Taha et al.,2002). As a result, seismic mapping of the horizons be-low Pre-Miocene salt is difficult and unreliable. Therefore,other geophysical studies are recommended to delineate thesubsurface structure.
The magnetic method is one of the best geophysical tech-niques to delineate subsurface structures. Aeromagneticmaps reflect spatial variations in the magnetic field of theearth. These variations are related to distribution of struc-tures, magnetic susceptibilities, and/or remanent magneti-zation. Sedimentary rocks, in general, have low magneticproperties compared with igneous and metamorphic rocksthat tend to have a much greater magnetic content. Thus,many aeromagnetic surveys are useful for mapping base-ment and igneous intrusions.
In this paper, we attempt to map the subsurface structureand estimate the depth to the basement in the Gebel El-Zeitarea using the existing aeromagnetic data. This study isbased on the application of gradient (Euler deconvolutionand analytic signal) techniques. The advantage of thesetechniques is that they provide source location parametersusing only a few assumptions. However, these methods use
Copyright c© The Society of Geomagnetism and Earth, Planetary and Space Sci-ences (SGEPSS); The Seismological Society of Japan; The Volcanological Societyof Japan; The Geodetic Society of Japan; The Japanese Society for Planetary Sci-ences; TERRAPUB.
structural models such as contacts, thin dikes and horizontalcylinders, which may over-simplify the true situation.
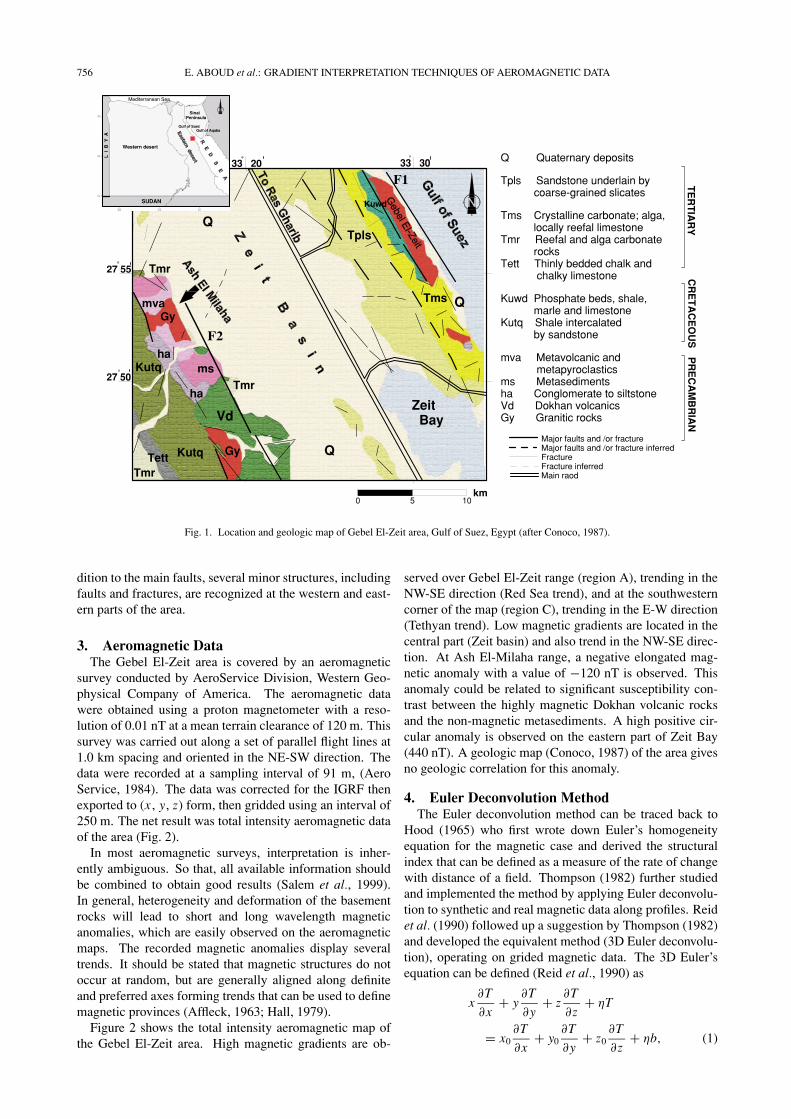
2. Geologic SettingSeveral major and minor topographic features (Fig. 1)
characterize the Gebel El-Zeit area. The most conspicuousof all is the gravel plain occupying the central lowland partof the area. The area is bordered on the west by the northernpart of Ash El Milaha range, and on the east by the relativelyhigh topographic features of the Gebel El-Zeit range, whichextends about 14 km in the NW-SE direction, parallel to theGulf of Suez. The Gebel El Zeit range reachs a maximumelevation of 465 m and is an exposed granite pluton.
The Gebel El-Zeit area represents a typical example of acomplex structure of the Gulf of Suez region (Allam, 1988).The Gulf of Suez may be viewed as a great-elongated (400km long) depression separating the central Sinai Peninsulafrom the mainland of Africa. In fact, the Gulf of Suezregion represents one of the most intensively faulted areasof Egypt. Structural analysis of the Gulf of Suez was carriedout using seismic profiles and well data. Because of thethick evaporitic sequence in the upper Miocene, the qualityof the seismic records is generally poor (Colletta et al.,1988). The structure of the Gulf of Suez is dominated bynormal faults and tilted blocks trending in NW-SE, withsedimentary fill up to 6 km thick (Jackson et al., 1988).
Allam (1988) and Angelier (1985) stated that the GebelEl-Zeit area is characterized by two main faults parallel tothe Gulf of Suez (F1 and F2 on Fig. 1). These two faultsform a graben system structure taking the direction of NW-SE. These faults bring the granite mass of the northern partof Ash El-Milaha and Gebel El-Zeit ranges in juxtapositionwith the younger sedimentary rocks (Farouk, 1965). In ad-
755
756 E. ABOUD et al.: GRADIENT INTERPRETATION TECHNIQUES OF AEROMAGNETIC DATA
Q
Q
Q
Kutq
Kutq
Vd
Tpls
ha
ha
ms
Tmr
Tmr
Tmr
mva
Gy
Zeit Bay
27 55
27 50
33 20 33 30
Gy
Q Quaternary deposits
Tpls Sandstone underlain by coarse-grained slicates
Tms Crystalline carbonate; alga, locally reefal limestoneTmr Reefal and alga carbonate rocksTett Thinly bedded chalk and chalky limestone
Kuwd Phosphate beds, shale, marle and limestoneKutq Shale intercalated by sandstone
mva Metavolcanic and metapyroclasticsms Metasedimentsha Conglomerate to siltstoneVd Dokhan volcanicsGy Granitic rocks
Tms
Kuwd
Tett
Major faults and /or fractureMajor faults and /or fracture inferredFractureFracture inferredMain raod
F1 TE
RT
IAR
YC
RE
TA
CE
OU
SP
RE
CA
MB
RIA
N
F2
SUDAN
L I
B Y
A
SinaiPeninsula
Western desert
Mediterranean Sea
Gulf of SuezGulf of Aqaba
0 5 10km
Fig. 1. Location and geologic map of Gebel El-Zeit area, Gulf of Suez, Egypt (after Conoco, 1987).
dition to the main faults, several minor structures, includingfaults and fractures, are recognized at the western and east-ern parts of the area.
3. Aeromagnetic DataThe Gebel El-Zeit area is covered by an aeromagnetic
survey conducted by AeroService Division, Western Geo-physical Company of America. The aeromagnetic datawere obtained using a proton magnetometer with a reso-lution of 0.01 nT at a mean terrain clearance of 120 m. Thissurvey was carried out along a set of parallel flight lines at1.0 km spacing and oriented in the NE-SW direction. Thedata were recorded at a sampling interval of 91 m, (AeroService, 1984). The data was corrected for the IGRF thenexported to (x , y, z) form, then gridded using an interval of250 m. The net result was total intensity aeromagnetic dataof the area (Fig. 2).
In most aeromagnetic surveys, interpretation is inher-ently ambiguous. So that, all available information shouldbe combined to obtain good results (Salem et al., 1999).In general, heterogeneity and deformation of the basementrocks will lead to short and long wavelength magneticanomalies, which are easily observed on the aeromagneticmaps. The recorded magnetic anomalies display severaltrends. It should be stated that magnetic structures do notoccur at random, but are generally aligned along definiteand preferred axes forming trends that can be used to definemagnetic provinces (Affleck, 1963; Hall, 1979).
Figure 2 shows the total intensity aeromagnetic map ofthe Gebel El-Zeit area. High magnetic gradients are ob-
served over Gebel El-Zeit range (region A), trending in theNW-SE direction (Red Sea trend), and at the southwesterncorner of the map (region C), trending in the E-W direction(Tethyan trend). Low magnetic gradients are located in thecentral part (Zeit basin) and also trend in the NW-SE direc-tion. At Ash El-Milaha range, a negative elongated mag-netic anomaly with a value of −120 nT is observed. Thisanomaly could be related to significant susceptibility con-trast between the highly magnetic Dokhan volcanic rocksand the non-magnetic metasediments. A high positive cir-cular anomaly is observed on the eastern part of Zeit Bay(440 nT). A geologic map (Conoco, 1987) of the area givesno geologic correlation for this anomaly.
4. Euler Deconvolution MethodThe Euler deconvolution method can be traced back to
Hood (1965) who first wrote down Euler’s homogeneityequation for the magnetic case and derived the structuralindex that can be defined as a measure of the rate of changewith distance of a field. Thompson (1982) further studiedand implemented the method by applying Euler deconvolu-tion to synthetic and real magnetic data along profiles. Reidet al. (1990) followed up a suggestion by Thompson (1982)and developed the equivalent method (3D Euler deconvolu-tion), operating on grided magnetic data. The 3D Euler’sequation can be defined (Reid et al., 1990) as
x∂T
∂x+ y
∂T
∂y+ z
∂T
∂z+ ηT
= x0∂T
∂x+ y0
∂T
∂y+ z0
∂T
∂z+ ηb, (1)

E. ABOUD et al.: GRADIENT INTERPRETATION TECHNIQUES OF AEROMAGNETIC DATA 757
1
2
3
4
5
6
7
Borehole
27 55
27 50
33 20 33 30
Zeit Bay
Direction of fli
ght line
Direction of flight lin
e
A
B
0 5 10km
Fig. 2. Aeromagnetic contour map of the Gebel El-Zeit area, (Aero Service, 1984), C.I. = 10 nT. Drill-holes depths are explained in Table 1.
where η is the structural index value that needs to be chosenaccording to a prior knowledge of the source geometry (e.g.η = 1 for dike, η = 2 for a horizontal or vertical cylin-der, and η = 3 for magnetic sphere); b is the base level ofthe field; ( ∂T
∂x , ∂T∂y , and ∂T
∂z ) are the derivatives of the field inx , y and z directions. The field is measured at a point (x ,y, and z) and is produced by a point or line source locatedat a point (x0, y0, and z0). By considering four or moreneighboring observations at a time (an operating window),source location (x0, y0, and z0) and b can be computed bysolving a linear system of equations generated from Eq. (1).Then by moving the operating window from one location tothe next over the anomaly, multiple solutions for the samesource are obtained (Ravat, 1996). One of the main disad-vantages of the Euler technique is that only a few simplegeometries satisfy Euler’s homogeneity equation (Blakely,1995). Additionally, the technique is best suited for sourcesfor which the anomaly attenuation rate is constant such asidealized magnetic sources. For arbitrary sources, the struc-tural index changes with the source-to-observation distance,which may lead to errors in the depth estimate of the source(Ravat, 1996). Another disadvantage of this method is thatthe structural index must be assumed as prior information.However, Thompson (1982) and Reid et al. (1990) showedthat the optimum structural index usually yields the tightestclustering of the solutions. Despite this disadvantage, theEuler deconvolution technique commonly gives satisfactoryresults approximated to the location for complex bodies.
5. Analytic Signal MethodThe amplitude of analytic signal (AAS) of the magnetic
anomaly is given by Roest et al. (1992) as
AAS(x, y) =√(
∂T
∂x
)2
+(
∂T
∂y
)2
+(
∂T
∂z
)2
. (2)
The horizontal and vertical derivatives of the mag-netic anomaly are Hilbert transform pairs of each other(Nabighian, 1972). The analytic signal method has beensuccessfully applied in the form of profile data to locatedike bodies (Nabighian, 1972, 1974, 1984; Atchuta et al.,1981). Moreover the approach was further developed byRoest et al. (1992) for the interpretation of aeromagneticmaps. Improvements of the approach in the interpretation ofaeromagnetic data were also presented by Hsu et al. (1996,1998). Furthermore, Thurston and Smith (1997) presenteda variation of the approach (also known as local wave num-ber).The appeal of the method is that the location and depthof the sources are found with only a few assumptions aboutthe nature of the source bodies, which usually are assumedas 2D magnetic sources (contact, horizontal cylinder, ordike). For these geological models, the shape of the AASis a bell-shaped symmetric function located directly abovethe source body. In addition, depths can be obtained fromthe shape of AAS (Atchuta et al., 1981; Roest et al., 1992).Roest et al. (1992) pointed out that the depth can be esti-mated from the shape of the analytic signal based on non-linear curve fitting. However, solving the non-linear prob-

758 E. ABOUD et al.: GRADIENT INTERPRETATION TECHNIQUES OF AEROMAGNETIC DATA
4452
3743
3769
2727
4051
2162
2908
27 55
27 50
33 20 33 30
Zeit Bay
-50 to 750 750 to 2000 2000 to 3000 3000 to 4000 4000 to 5000
Depth (m)
Borehole and depths
Gulf of Suez
A
B
C
0 5 10km* Depth (-) is up and (+) down
Fig. 3. Euler method solutions of Gebel El-Zeit area using a structure index of 0.5. Drill-holes depths are explained in Table 1.
lem is always difficult. Here, we have developed an alterna-tive method from which the depth for a contact model canbe calculated from the analytic signal. The 2D expressionof the AAS for a contact model can be written (MacLeod etal., 1993) as
AAS(x) = K
(x2 + z2)1/2, (3)
where K is the magnetization constant and z is the depthto the top of the contact. It is clear that, the analytic signalattains its maximum above the source directly at x = 0 as
AAS(0) = K
z. (4)
Normalizing Eq. (3) by (4), we obtain
AASn(x) = AAS(x)
AAS(0)= z
(x2 + z2)1/2. (5)
Squaring and rearranging Eq. (5), we get
(AASn(x))2 · x2 = z2(1 − (AASn(x))2). (6)
It is obvious that the above equation can provide the depthto the contact model from only two normalized analyticsignal values. However, due to several sources of errors,multiple values are required to get a good depth estimate.The depth can be obtained from Eq. (6), by least-squaresapproximation as
z =√ ∑m
i=1(AASn(xi ))2 · x2i∑m
i=1(1 − (AASn(xi ))2), (7)
where m is the number of observations.
6. Application and ResultsSince Euler and analytic signal methods are based on the
derivatives of the field, noise in the measured data can affectthe results. Such noise may come from various sourcessuch as the measurement uncertainty, the removal of thebackground fields and the computation errors of gradients.Noise reducing techniques such as upward continuation andlow pass filters can be implemented to reduce the effect ofnoise and enhance signal to noise ratio of the observed data(Salem et al., 2004). In this study, we have applied upwardcontinuation with a distance of 0.5 km as a smoothing filter.6.1 Results of euler method
In our study, we are seeking the magnetic contacts thatmay delineate the basement beneath sedimentary basins.Theoretically, a structural index of 0 is an appropriate valuefor contact models. However, this value usually gives un-stable results (Barbosa et al., 1999). Therefore, we have as-signed a value of 0.5 as a structural index to locate the pos-sible magnetic contacts from the observed magnetic data.Reid et al. (1990) and Ravat (1996) discussed adequatelythe effect of the size of the operating window on the esti-mation of source location using the Euler technique. Gen-erally, selection of the window size is a function of the gridcell size and should be selected to be large enough to incor-porate substantial variations of the total field and its gradi-ents (Ravat, 1996) and small enough to avoid significanceeffects from adjacent or multiple sources. Calculated so-lutions from larger windows contain fewer artifacts due tonoise (Ravat, 1996). For this study, we used an overlappingmoving window of 2.5 km by 2.5 km (10 × 10 data points)for Euler depth estimation.

E. ABOUD et al.: GRADIENT INTERPRETATION TECHNIQUES OF AEROMAGNETIC DATA 759
4452
3743
3769
2727
4051
2162
2908
Zeit Bay
Gulf of Suez
BP1
P2
P3
P4
27 55
27 50
33 20 33 30
Borehole
0
0.02
0.04
0.06
0.08
0.1
0.12
0.14
0.16
0.18
0.2
0.22
0.24
0.26
nT/km
0 5 10km
Depths (m)p1 = 739 p2 = 779p3 = 959p4 = 556p5 = 566p6 = -113p7 = 15
* Depth (-) is up and (+) down
Fig. 4. Analytic signal image map of the Gebel El-Zeit area. P1–P7 are the selected profiles and their estimated depths are listed in Table 2 (see legend),Drill-holes depths are explained in Table 1.
Table 1. Drill-holes and depths of the basement in the study area.
No Well Name Depth (m) Penetration
1 Zeit Bay #1 4452 Upper Cretaceous
2 G. Zeit #2 3743 Miocene
3 Wadi Dib #1 3769 Basement
4 C9A-1 2727 Basement
5 ERDMA-2 4051 Basement
6 Gazwarina #1 2162 Basement
7 QQ 89-3 2908 Basement
Figure 3 shows the Euler source locations with circlescolored by the estimated depth values. It is worthy to notethat some of the solutions are well clustered and trendingin the Red Sea direction (NW-SE), especially in the regionslabeled A and C. The source locations A and C have depthsranging from 50 m (over the ground) and 2 km. Sourcelocations within region B are found to be less clusteredthan those for A and C. The depth values for these sourcelocations ranged between 3 km and 5 km. From the drillhole information, at the region B, basement depth is morethan 4452 m (Zeit Bay #1, Upper Cretaceous). Generally,the estimated depth values agree with the depth informationobtained from the drill holes (Table 1). Accuracy of theresults depends on the signal to noise ratio of the magneticanomalies. This may explain the poor clustering of regionB where anomalies of have lower signal to noise ratio than
Table 2. Estimated depths from analytic signal method at the contacts.
Profile Depth (m)
P1 739
P2 779
P3 959
P4 556
P5 566
P6 −113
P7 15
in other source regions (A and C).6.2 Results of analytic signal method
The analytic signal signature of the Gebel El-Zeit areawas calculated (Fig. 4) from the upward-continued data, inthe frequency domain using the FFT technique (Blakely,1995). Higher values of the AAS are observed at two re-gions labeled A and C as shown in Fig. 4, which indicatesthat, these regions have significant susceptibility contrastthat give signatures on the map. Moreover, the boundariesof Zeit basin could be easily observed, from Fig. 3, whichindicated the effectiveness of the analytic signal method inbasin studies. To estimate the depth to the basement fromthe analytic signal, seven profiles were selected over the re-gions A and C (in which contacts could be found). Equation(7) was used to calculate the depth for each profile at thecontacts between basement rocks and sedimentary basin.

760 E. ABOUD et al.: GRADIENT INTERPRETATION TECHNIQUES OF AEROMAGNETIC DATA
The calculated depth (for each profile) was located at themaximum value of the analytic signal. This maximum isnot necessary to be located at the center of the profiles be-cause it depends on the location of the source with respect tothe profile (horizontal displacement). All the depths are cal-culated from the ground level after subtracting the upward-continued distance (500 m) and the terrain clearance dis-tance (120 m). Table 2 shows the depth values derivedfrom the method mentioned before. Generally, the depthvalues for region A have an average value of 156 m andfor region C an average of 758 m. However, the calculateddepths from Euler method at region C were ranged between50 m (on the ground) and 750 m beneath the subsurface andthe average calculated depths from the analytic signal aboutwas 758 m. This discrepancy could be explained by thedistribution of magnetic rocks along this region at differentdepths.
7. ConclusionsIn this paper, we attempted to add a new insight on the
structural setting of the Gebel El-Zeit area from the aero-magnetic data. The study is based on application of Eulerand analytic signal methods. Results of these methods helpdefine the main geological trends and depths of subsurfacegeologic structures. The similarity of the estimated depthvalues from the Euler and analytic signal method suggeststhat these methods are very useful to locate subsurface mag-netic sources, which reflect the structural framework of thearea.
The study area is characterized by a basin structural sys-tem taking the direction of NW-SE (Red Sea direction). Thebasement is exposed on the eastern and western flanks andreaches depths of ∼5 km in the central part.
Acknowledgments. The authors would like to thank EgyptianGeneral Petroleum Corporation for providing the magnetic data.We also greatly appreciate all of the staff of Exploration Geo-physics Laboratory of Kyushu University, for their contributionand support. We thank Dr. Shigeo Okuma for organizing theIUGG 2003 magnetic session and encouraging us to submit thispaper. We also thank Dr. Richard W. Saltus (USGS) and an anony-mous reviewer for revision and comments for this paper.
ReferencesAero Service, Final operational report of airborne magnetic/radiation sur-
vey in the Eastern Desert, Egypt, for the Egyptian General PetroleumCorporation, Aero Service Division, Houston, Texas, Six Volumes,Western Geophysical Company of America, 1984.
Affleck, J., Magnetic anomaly trend and spacing pattern, Geophysics, 28,379–395, 1963.
Allam, A., A Lithostratigraphical and structural study on Gebel El-Zeitarea, Gulf of Suez, Egypt, Journal of African Earth Sciences, 7, 933–944, 1988.
Angelier, J., Extension and rifting: the Zeit region, Gulf of Suez, Journalof Structural Geology, 7(5), 605–612, 1985.
Atchuta R. D., H. V. Ram Babu, and P. V. Sanker, Narayan Interpretationof magnetic anomalies due to dikes: the complex gradient method, Geo-physics, 46, 1572–1578, 1981.
Barbosa, V. C. F., J. B. C. Silva, and W. E. Mederios, Stability analysisand improvement of structural index estimation in Euler deconvolution,Geophysics, 64, 48–60, 1999.
Blakely, R. J., Potential Theory in Gravity and Magnetic Applications,Cambridge Univ. Press, 1995.
Colletta, B., P. Le Quellec, J. Letouzey, and I. Moretti, Longitudinal evo-lution of the Suez rift structure (Egypt), Tectonophysics, 153, 221–233,1988.
Conoco, Geologic map of Egypt, Scale 1: 500 000 Coral Inc. Cairo, Egypt,1987.
Farouk, A. M., A geophysical studies on the area between Wadi Dara andGebel El-Zeit, Gulf of Suez district, U.A.R. for Petroleum Exploration,Assiute University, M.Sc. thesis, 1965.
Hall, S. A., A total intensity aeromagnetic map of the Red Sea and itsinterpretation, US Geol. Surv. Saudi Arabian project Report, pp. 275–260, 1979.
Hood, P., Gradient measurements in aeromagnetic surveying, Geophysics,30, 891–902, 1965.
Hsu, S. K., J. C. Sibunet, and C. T. Shyu, High-resolution detection of ge-ologic boundaries from potential field anomalies. An enhanced analyticsignal technique, Geophysics, 61, 373–386, 1996.
Hsu, S. K., D. Coppens, and C. T. Shyu, Depth to magnetic source usingthe generalized analytic signal, Geophysics, 63, 1947–1957, 1998.
Jackson, J. A., N. J. White, Z. Garfunkel, and H. Anderson, Relations be-tween normal-fault geometry, tilting and vertical motions in the exten-sional terrains: an example from the southern Gulf of Suez, Journal ofStructural Geology, 10(2), 155–170, 1988.
MacLeod, I. N., K. Jones, and T. F. Dai, 3-D analytic signal in the interpre-tation of total magnetic field data at low magnetic latitudes, Proceedingsof the Third International Congress of Brazilian Society of Geophysi-cists, 1993.
Nabighian, M. N., The analytical signal of two-dimensional magnetic bod-ies with polygonal cross-section, its properties and use for automatedinterpretation, Geophysics, 37, 507–517, 1972.
Nabighian, M. N., Additional comment on the analytical signal of two-dimensional magnetic bodies with polygonal cross-section, Geophysics,39, 85–92, 1974.
Nabighian, M. N., Towards a three dimensional automatic interpretationof potential field data via generalized Hilbert transform, Fundamentalrelations, Geophysics, 47, 780–786, 1984.
Ravat, D., Analysis of the Euler method and its applicability in environ-mental magnetic investigations, Journal of Environmental EngineeringGeophysics, 1, 229–238, 1996.
Reid, A. B., J. M. Allsop, H. Granser, A. J. Millett, and I. W. Somerton,Magnetic interpretation in three dimensions using Euler Deconvolution,Geophysics, 55, 80–90, 1990.
Roest, W. R., J. Verheof, and M. Pilkington, Magnetic interpretation usingthe 3-D analytic signal, Geophysics, 57, 116–125, 1992.
Salem, A., A. Elsirafi, and K. Ushijima, Design and application of high-Resolution aeromagnetic survey over Gebel Duwi Area and its offshoreextension, Egypt, Mem. Fac. Eng., Kyushu Univ., 59(3), 201–213, 1999.
Salem, A., D. Ravat, M. Mushyandebvu, and K. Ushijima, Linearizedleast-squares method for interpretation of potential-field data fromsources of simple geometry, Geophysics, 69, 783–788, 2004.
Taha, A., B. Hoda, and A. Fadel, Minimizing the Exploration Risk by Us-ing 3DVSP. International Petroleum Conference and Exhibition, Cairo,2002.
Thompson, D. T., EULDEPTH: A new technique for making computer-assisted depth from magnetic data, Geophysics, 47, 31–37, 1982.
Thurston, J. B. and R. S. Smith, Automatic conversions of magnetic datato depth, dip, and susceptibility contrast using the SPI (TM) method,Geophysics, 62, 807–813, 1997.
E. Aboud (e-mail: [email protected]), A. Salem, and K.Ushijima