Embed Size (px)
Citation preview

Substrate specificity of receptor tyrosine kinases is
critical for selective signaling
A thesis submitted to the faculty of the Watson School of Biological Sciences In partial
fulfillment of the requirements for the degree of Doctor of Philosophy
By Maria Luisa Pineda Montoya
Cold Spring Harbor, NY
2012
Table of Contents
List of Figures ......................................................................................................................... 4Standard Abbreviations ........................................................................................................ 5Acknowledgements ............................................................................................................... 6Abstract .................................................................................................................................... 9SECTION I............................................................................................................................. 10Chapter 1: Introduction ....................................................................................................... 12
1.1. Overview ................................................................................................................................. 121.2 Molecular pathology of lung carcinoma: current concepts ............................................... 121.3 Toward a molecular taxonomy of lung cancer .................................................................... 151.4 The genetic landscape of lung cancer: lesions that affect DNA repair ............................ 171.5 The genetic landscape of lung cancer: lesions that affect tumor suppressor genes and growth inhibitory pathways .................................................................................................. 181.6 The genetic landscape of lung cancer: oncogenes and growth-stimulatory pathways . 201.7 Receptor tyrosine kinases: structure and functions ............................................................ 271.8 Beyond the genetic landscape of lung cancer: epigenetic regulation and microRNA- mediated regulation of lung cancer ...................................................................................... 361.9 Conclusions .............................................................................................................................. 37
SECTION II ........................................................................................................................... 44Synopsis ................................................................................................................................. 45Chapter 2: Oncogenic RTKs have distinct substrate preferences ................................. 48
2.1 Summary ................................................................................................................................... 482.2 Highlights ................................................................................................................................. 482.3 Introduction .............................................................................................................................. 482.4 Peptide library design and kinase assay optimization ....................................................... 512.5 PGFR and EGFR are characterized by distinct substrate specificities ............................. 522.6 RTKs with activity that leads to EMT and erlotinb resistance have similar substrate preferences ................................................................................................................................ 542.7 Discussion ................................................................................................................................. 55
Chapter 3: SOCS3 is differentially phosphorylated by PDGFR and EGFR ................. 653.1 Summary ................................................................................................................................... 653.2 Highlights ................................................................................................................................. 653.3 Computational prediction identified SOCS3 as a potential PDGFR- and EGFR- differentially phosphorylated substrate ............................................................................... 663.4 SOCS3 is differentially phosphorylated by EGFR and PDGFR ........................................ 663.5 MS analysis identify the SOCS3 Y165 residues as a preferential phosphorylation site for PDGFR compared to EGFR. ............................................................................................. 67
3.6 Mutagenesis studies confirmed SOCS3 Y165 residues to be a preferential phosphorylation site for PDGFR compared to EGFR ........................................................ 683.7 In addition to PDGFR SOCS3 is phosphorylated by other RTKs. .................................... 693.8 Discussion ................................................................................................................................. 70
Chapter 4: PDGFR induced migration and erlotinib resistance is mediated by a sustained IL-6 through the phosphorylation dependent degradation of SOCS3. ...... 79
4.1 Summary ................................................................................................................................... 794.2 Highlights ................................................................................................................................. 794.3 Introduction .............................................................................................................................. 794.4 SOCS3 Y165 phosphorylation induces SOCS3 ubiquitination and degradation ........... 834.5 PDGFR mediated phosphorylation results in sustained IL-6 signaling .......................... 844.6 PDGFR mediated phosphorylation of SOCS3 cooperates with IL-6 signaling in inducing EMT........................................................................................................................... 864.7 Discussion ................................................................................................................................. 87
SECTION III .......................................................................................................................... 96Chapter 5: Discussion and Future perspectives .............................................................. 98SECTION IV ........................................................................................................................ 103Appendix i: Phospho-proteomic analyses of signaling differences between PDGFR
and EGFR in NSCLC ............................................................................................. 105 Appendix ii: Functional genomic screens to interrogate signaling differences among RTKs ....................................................................................................................... 110
SECTION V ......................................................................................................................... 117MATERIALS AND METHODS ....................................................................................... 118SECTION VI ........................................................................................................................ 128REFERENCES ..................................................................................................................... 129
List of Figures
Figure 1.1. Pie chart of the incidence of lung cancer sorted by histological type.…………………. 39 Figure 1.2. Timeline of seminal hypotheses, research discoveries, and research initiatives that
have led to an improved cancer genome.………………………………………………… 40
Figure 1.3. The diagram illustrates signaling networks that are altered in NSCLC………………. 41 Figure 1.4. The evolution and expansion of RTK signaling. ………………………………………… 42 Figure 1.5. RTKs as nodes in complex signaling networks…………………………………..……… 43 Figure 2.1. Peptide library screen design………………………………………………….…….…….. 59 Figure 2.2. Peptide library design and kinase assay optimization…………………………………. 60 Figure 2.3. Peptide library screen to compare the substrate specificity between EGFR wild type
and PDGFR…………………………………………………………………………………... 61
Figure 2.4. PSSM logo representation of results for EGFR and PDGFR as well as the identification of putative peptide substrates for PDGFR utilizing Scansite…………...
62
Figure 2.5. Validation of EGFR and PDGFR preferential phosphorylation motifs………………... 63 Figure 2.6. Peptide library screen to compare the substrate specificity between MET and EGFR-
T790M………………………………………………………………………………………… 64
Figure 3.1. SOCS3 is differentially phosphorylated by PDGFR and EGFR..….……………….…… 74 Figure 3.2. SOCS3 structure……………………………………………………………………………... 75 Figure 3.3. Validation of SOCS3 phosphorylation by PDGFR rather than EGFR…………………. 76 Figure 3.4. Validation of Y165 as a novel SOCS3 site of phosphorylation by PDGFR …………… 77 Figure 3.5. Differential phosphorylation of SOCS3 by RTKs. ………………….…………………………… 78 Figure 3.6. Kinome phosphorylation profile of SOCS3………………………………………………. 79 Figure 4.1. Functional analysis of SOCS3 phosphorylation in a NSCLC cell line…………………. 90 Figure 4.2. Ubiquitination is responsible for the decrease of the mutant SOCS3-DDID………….. 91 Figure 4.3. Silencing of SOCS3 and PDGFR-alpha activation modifies IL-6 signaling pathway in NSCLC
cells. ………………………………………………………………………………...………… 92
Figure 4.4. SOCS3 Y165 phosphorylation induced a sustained IL-6 signaling pathway……………..…… 93 Figure 4.5 PDGFR-alpha expression induces EMT, increased metastatic spread and erlotinib resistance
in NSCLC derived cells. ………………………………………………………………..…………… 94
Figure 4.6 Proposed model of PDGFR phosphorylation of SOCS3 and its biological relevance in the IL-6 signaling cascade……………………………………………………………….
96
Figure A.1.1 An overview of a proteomic procedure with iTRAQ reagents………………………… 107 Figure A.1.2 Characterization of RTKs signaling differences & similarities using phospho-
proteomic…………………………………………………………………………………….. 108
Figure A.2.1 Functional genomic shRNA library screen performed in H1703 NSCLC cells……….. 114 Figure A.2.2 Completion and analysis of additional functional genomic screens for other NSCLC
cell lines……………………………………………………………………………………… 115
Standard Abbreviations
a.a. amino acid AD adenocarcinoma ATP adenosine-triphosphate bp basepairs D aspartic acid - asp Dox doxycycline E glutamic acid - glu EGFR epidermal growth factor receptor EMT epithelial to mesenchymal transition F phenylalanine - phe I isoleucine - ile IL interleukins IP immunoprecipitation JAKs Janus kinases kb kilobases MET mesenchymal to epithelial transition MS Mass Spectrometry NSCLC non small-cell lung cancer PCA principle component analysis PCR polymerase chain reaction PDGF platelet-derived growth factor PDGFR platelet-derived growth factor receptor alpha PTB phosphotyrosine-binding PTK protein tyrosine kinase PTM post translational modification PTP protein tyrosine phosphatase qPCR quantitative PCR RNAi RNA interference RTK receptor tyrosine kinase rtTA reverse tetracycline transactivator Ser serine - ser SH2 src homology 2 shRNA short hairpin RNA siRNA short interfering RNA SOCS supressor of cytokine signaling SQ squamous cell STAT signal transducer and activator of transcription Thr threonine - thr TetON tetracycline inducible system TK tyrosine kinase TKD tyrosine kinase domain TKI tyrosine kinase inhibitor WB Western Blot WT Wild Type Y tyrosine-Tyr

6
Acknowledgements
First, I want to thank my thesis advisor Raffaella Sordella. Her support and
assistance had led me to achieve this work in a short amount of time. Many laughs and
motivational speeches had to occur for me to get here. I want to thank my lab mates who are
almost there, Trine Lindsted and Matthew Camiolo. The rest of the Sordella lab: Serif
Senturk, Firat Ibrahim, Debjani Pal, Benjamin Bottner. I want to thank in particular Zhan
Yao: he guided me through the beginning of my doctorate thesis and in the process became
a really good friend.
I want to take this opportunity to thank my WSBS Thesis Committee. Greg Hannon,
for grilling me during my first interview during recruitment, for the encouragement
throughout the courses, for his guidance and countless support. Scott Lowe, for many
discussions and time spent on my committee. Darryl Pappin whom I collaborated and had
several discussions with about proteomics RTKs profiling. My committee external advisor,
Vivek Mittal from Weill Cornell Medical College. I want to specially thank Adrian Krainer
my academic mentor. Adrian, over the years at CSHL you have been an incredible mentor
and friend. Without your moral support and trust I would not be graduating. Gracias por
siempre atenderme sin cita y dedicarme horas para resolver dificultades en el camino.
The WSBS my family at CSHL. Dawn, Alyson, Kim, Leemor and Keisha. I have so
many memories with each of you and I can’t thank you enough for all the unconditional
assistance. My classmates, entering class of 2007: I am very happy and thankful for having
an amazing and amusing group of peers! Also, I am very grateful for the funding support
from the Beckman Foundation and the William Randolph Hearst Foundation throughout
my doctoral studies in the WSBS.
Thanks to the CSHL proteomics facility led by Cristian Ruse. To all the Hannon Lab
for the assistance and reagents. Kenneth Chang, Amy Valentine, Krista Marran and Fred
Rollins for all the guidance with the genomic screen. To all my CSHL friends and colleagues
whom I have spent years with at wine and cheese, Ultimate Frisbee, volleyball, and in the
bar. The Krainer Lab, for making me feel part of their lab. Silvia Fenoglio my bench mate.
Prem Premsrirut for partying and food battles. Michelle Faleiro, my partner in crime. Julie,
my Korean confidant. To all of our NYC friends, we are appreciative to have met all of you.
7
I want to thank all the people that helped me to edit the thesis: Adrian Krainer,
Isabel Aznarez Da Silva, Yevgeniy Plavskin, Alea Mills, Paula Smith, Hema Bashyam and
Charla Lambert. I appreciate sincerely all the work you all put into improving this thesis.
I want to thank and recognize that my scientific training started at 15 years of age in
the laboratory of Dr. Gerhild Packert at Barry University. Her mentoring, support and
guidance encouraged me to start my doctoral education. The Goizueta Foundation, Olga
Goizueta in particular for the undergraduate funding. The NIH MARC*USTAR program at
Barry University and Dr. Flona Redway.
Gracias a toda mi familia por apoyarme todos estos años. Mami muchas gracias por
llevarme todas las semanas a la Universidad para trabajar en el lab, y por siempre estar
pendiente de mis triunfos. Mis hermanos, Juancho y Álvaro por siempre estar orgullosos. A
Carlitos por siempre estar pendiente, y a mi papa Diego por el apoyo desde lejos. A mis
suegros Analida y don Elias, gracias por ser como unos segundos padres para mí. Adri,
Julián, Tomas y Pablito por ser tan especiales. Las tías Mariela y Margot por todos sus rezos
y fortaleza. Mi prima Jessica por siempre estar pendiente y a mis mejores amigas de
Colombia: Pale, Joa, y Karen.

8
El más importante de todos: mi mejor amigo, mi confidente, mi amor, mi esposo.
Alvaro te dedico esta tesis a ti! por que sin tu apoyo incondicional no estaría aquí. Te Amo.
9
Abstract
The completion of the human genome project has marked a new beginning in biomedical
sciences. As human cancer is a genetic disease, the field of oncology has been one of the first to be
impacted by this historic revolution. High-throughput mutational profiling of tumors has provided
an unprecedented amount of information on genetic changes leading to cancer and has already
revolutionized the way lung cancers are classified and treated. Fundamental for successfully
translating the information uncovered by these genetic studies into the clinic is the molecular and
functional characterization of the identified genetic lesions. As part of these efforts, the goal of my
thesis studies was to gain an understanding of how genetic lesions affecting receptor tyrosine
kinases (RTKs) contribute to treatment response and survival differences observed in lung tumors.
Phosphorylation of tyrosine residues in proteins was first described in 1979 as an activity of
a viral transforming gene product. Soon afterwards RTKs were recognized to play a role in
transducing growth factor signals across the plasma membrane. Over the past 50 years, the
importance of RTKs has been demonstrated in multiple studies, and increasing amounts of data
have implicated the deregulation and malfunction of these signaling proteins in a variety of
diseases including lung cancer. Although highly similar in structure and regulation, different RTKs
exert distinct biological functions. The ability of RTKs to function within common pathways, yet
induce diverse phenotypic responses, has largely been attributed to: 1) differences in cellular
context, as signaling proteins are differentially expressed in distinct cell types; 2) the strength and
temporal properties of signaling; and 3) differences in binding sites for effector molecules.
In addition to these mechanisms, we discovered that intrinsic differences in RTK substrate
specificity could also play a role in modulating functional differences among RTKs. In particular,
we found the SOCS3 residue Y165 to be differentially phosphorylated by certain RTKs such as the
platelet derived growth factor receptor (PDGFR) and the epidermal growth factor receptor (EGFR).
The increased phosphorylation leads to ubiquitination and proteasome-dependent degradation of
SOCS3. As SOCS3 is one of the major negative regulators of IL-6 mediated signaling, degradation of
SOCS3 by PDGFR-mediated phosphorylation results in potentiation of IL-6 signaling, and
phenotypically in the acquisition of mesenchymal-like features and increased metastatic potential
as well as erlotinib resistance.

10
SECTION I

11
CHAPTER I
INTRODUCTION
12
Chapter 1: Introduction
1.1. Overview
There is a broad consensus that cancer is, in essence, a genetic disease, and that
accumulation of molecular alterations in the genome of somatic cells is the basis of tumor
onset and progression. Hence, the availability of the human genome sequence and progress
in DNA sequencing technologies has dramatically improved knowledge of this disease and
in particular of lung cancer. These new insights are transforming the field of lung oncology
at multiple levels. First, characterization of the lung genomic landscape is redesigning lung
tumor taxonomy by moving it from a histologic- to a genetic-based level. Second, the
success of cancer drugs designed to target the molecular alterations underlying lung
tumorigenesis (e.g., erlotinib in the case of EGFR oncogenic mutations, and crizotinib in the
case of ALK4 translocations) has proven that somatic genetic alterations can be exploited as
targets for therapy. In addition, tumor genotyping is helping clinicians to tailor cancer
treatments by matching patients with the best available treatment for their tumors.
In this chapter, I will review the progress that has been made in characterizing the
lung genomic landscape with particular emphasis on genetic abnormalities that lead to
deregulation of RTKs activities. Before going into detail on how novel integrated
approaches have allow a compressive and systematic evaluation of genetic alterations that
occur in lung cancer, I will briefly summarize current concepts on the molecular pathology
of lung cancer.
1.2 Molecular pathology of lung carcinoma: current concepts
Lung cancer is the leading cause of cancer death in the United States and in the
world, with more than 1.32 million fatalities annually (Parkin et al. 2005). In 2008, more
patients in the U.S. died of lung cancer than colorectal, breast, and prostate cancer combined
(Jemal et al. 2008). It is estimated that lung cancer accounts for 31% of all cancer deaths in
men and 26% in woman (Herbst and Bunn 2003; Fuster and Sandler 2004; Jemal et al. 2008;
American Cancer Society 2012). For patients with local disease, the median 5-year survival is
49%; with regional disease it decreases to 16%; and in patients in whom the tumor has
already spread to the lymph nodes (distant disease) it plummets to 2% (Ries et al. 2005). The
13
more favorable prognoses observed in the minority of patients with localized disease can be
attributed to the possibility of surgically removing the tumor.
The mayor risk factor for developing lung cancer is smoking. It is estimated that 70%
of all lung cancer patients are smokers (Fauci et al. 2009). Other risk factors include exposure
to radon (a radioactive gas that results from the breakdown of uranium in soil and rocks),
asbestos, chemicals or minerals such as arsenic (Samet 2009; Weiderpass 2010), and poor air
quality especially in large cities and heavily trafficked roads (Weiderpass 2010). Chronic
inflammatory conditions such as chronic obstructive pulmonary disease (COPD) have also
been linked to an increased probability of developing lung cancer (NCI 2012). In addition to
these extrinsic cues, epidemiological studies have also indicated that genetic and epigenetic
factors could contribute to lung tumorigenesis as well. As an example, in non-smokers the
frequency of non-small cell lung cancer (NSCLC) is higher in women compared to men of
the same age and ethnicity (Wei et al. 2000).
One of the major hurdles in the treatment of lung cancer and one of the reasons why
this is such a deadly disease is its highly heterogeneous nature. In fact, the ways in which
lung tumors appear, behave and respond to treatment are highly dissimilar, making each
tumor almost one-of-a-kind.
Interestingly, it has been long appreciated that the appearance of lung cells (i.e.,
histology) could be correlated to particular tumor behavior and with a particular anatomic
distribution (NCI 2012). Based on these observations, lung tumors have been classified
based on cell size and shape. In particular, as shown in Figure 1.1, lung cancer has
traditionally been subdivided into two major types: small cell lung carcinoma and NSCLC,
the latter accounting for almost 80% of all cases (NCI 2012). NSCLC is further classified into
epidermoid/squamous (29%), adenocarcinoma/bronchioalveolar (35%), and large cell (9%)
(Travis et al. 2004). Of these, squamous cell carcinoma (SQs) is often linked to a history of
smoking and tends to be located in the middle of the lungs, near bronchial bifurcations.
Adenocarcinomas (ADs) on the other hand are usually located in more distal/outer regions
of the lungs and tend to grow and spread more quickly (NCI 2012).
Yet, it has become evident that this classification is insufficient. Patients with
histologically similar tumors have different clinical outcomes. Furthermore, tumors that
14
cannot be distinguished based on histological analysis can respond very differently to
identical therapies.
With the development of technologies that allow for high-throughput analysis of
genomic data and the sequencing of the human genome, it has becoming increasingly
understood that the frequency and distribution of mutations affecting cancer genes can be
used to redefine the histology-based taxonomy of a given tumor type(Meyerson et al. 2010).
Spurred by the pioneering work by the laboratories of William Sellers, Matthew Meyerson
and Daniel Haber, classification of lung cancer is now moving from a histologic- to a
genetic-based. These efforts were largely inspired by the clinical success of small-molecule
inhibitors of tyrosine kinases in the treatment of human tumors (Shawver et al. 2002).
Studies correlating the presence of EGFR oncogenic mutations in lung cancer patients that
respond to treatment with EGFR inhibitors have suggested the importance of patient
stratification in cancer treatment and provided an additional rationale for many cancer
genomics projects: i.e., identify a genetic lesion and find an agent that is active against the
lesion (Shawver et al. 2002).
Although very promising, tailored treatment in lung cancer is highly limited by the
paucity of therapeutic options currently available. In addition to surgical removal, common
lung cancer treatments include palliative care, chemotherapy, and radiation therapy. The
most frequently used chemotherapy regimens in advanced NSCLC (stage IV) are based on
cisplatin or carboplatin treatments, in combination with gemcitabine, paclitaxel, docetaxel,
etoposide, or vinorelbine and doxorubicin (Hirsh 2010). In addition to these chemotherapy
drugs, the only other FDA approved drugs are the EGFR tyrosine kinase inhibitor (TKI)
erlotinib, and the anaplastic lymphoma kinase inhibitor crizotinib (Hirsh 2010). Hence, the
identification of novel genetic vulnerabilities of lung tumors is an important undertaking for
the medical and scientific community.
In conclusion, while tumors have historically been classified based on two criteria -
localization (site of occurrence) and appearance (histology) - these criteria are currently
being re-evaluated. In particular the presence of genetic lesions has now been proposed as
major criteria for lung taxonomy. This transformation of lung molecular pathology will
likely improve the precision at which lung tumors can be classified and it will help in
tailoring therapeutic regimens based on the genetic landscape of individual tumors.
15
1.3 Toward a molecular taxonomy of lung cancer
Key to redefining the histology-based taxonomy of lung cancer has been the
development of technologies that allow for high-throughput analysis of genomic data. In
this regard, the complete sequencing of the human genome has marked a new era in lung
oncology and in biomedical science in general.
Before elucidation of the human genome, several cancer genes, such as KRAS, TP53,
and APC, were successfully discovered using approaches based on oncovirus analysis,
linkage studies, loss of heterozygosity, and cytogenetics. The completion of the Human
Genome Project in 2004 (International Human Genome Consortium 2004), which provided a
sequence-based map of the normal human genome, together with the construction of the
HapMap, containing single nucleotide polymorphisms (SNPs), and the underlying genomic
structure of natural human genomic variation, dramatically accelerated the pace and depth
at which new genetic aberrations can be identify (reviewed in Meyerson et al. 2010). Figure
1.2 clearly illustrates the developments in the search of cancer genes, its increased pace, as
well as the most relevant findings in this field.
The human genome project and the subsequent large-scale cancer genomic projects
have resulted in the development of new faster and more affordable high-throughput
technologies as well as bioinformatics tools that allow for the analysis of sequencing data
(Fuller et al. 2009).
Following its development in 1977, the Sanger method for DNA sequencing (first
generation sequencing) was the method of choice for elucidating the nucleotide sequence of
DNA molecules for thirty years (Sanger et al. 1977). The development of next-generation
sequencing (NGS) technologies over the past 15 years has significantly lowered the cost and
the time required for DNA sequencing (Metzker 2010). Moreover, NGS approaches are more
sensitive and quantitative than Sanger methods. Hence, they are capable of detecting
somatic mutations even when present only in a subset of tumor cells as well as copy number
variations. Nonetheless, next-generation sequencing still presents some limitations mainly
due to the relatively high error rate in the short reads generated during the sequencing
process and by the difficulty of assembling the generated sequence reads (Metzker 2010).
Another application of second-generation sequencing involves utilizing nucleic acid “baits”
16
to capture regions of interest in the total pool of nucleic acids. Because most areas of the
genome can be targeted, including exons, this allows rapid and low cost surveying of cancer
mutations.
The use of these technologies has revolutionized the pace and depth at which lung
tumors are been analyzed and allowed for the generation of high-resolution genomic maps
(Rizzo and Buck 2012). As a result we now realize that by the time a cancer is diagnosed, it
is composed of billions of cells carrying numerous genetic mutations, including single
nucleotide changes, small insertions and deletions, large chromosomal reorganizations,
copy number variations and gene overexpression resulting from other mechanisms such as
those mediated by miRNAs (Pinkel et al. 1999; Bignell et al. 2004; Garraway et al. 2005; Zhao
et al. 2005, Maher et al. 2009).
Overall the number of mutations uncovered by these studies is much larger than
what initially was anticipated. It is now appreciated that only a small fraction of these
genetic alterations are “drivers” that is, genes that drive cancer by giving cells a selective
advantage and that in contrast the majority of genetic lesions are mutations with no
functional role in tumorigenesis that are referred to as “passengers.” Thus, distinguishing
drivers from passenger mutations is currently one of the main challenges in cancer genetics.
Current efforts to address this hurdle include a combination of genetic, bio-informatic and
functional approaches, some of which are currently being developed at CSHL.
One of the complications in the functional characterization of cancer mutations is the
realization that in addition to cell proliferation also self-sufficiency of growth, evasion of cell
death (apoptosis and surveillance by the immune system), limitless replicative potential,
sustained angiogenesis, tissue invasion and metastasis and metabolic growth are acquired
capabilities that are similarly indispensable for tumor development and progression
(Hanahan and Weinberg 2011). Thus, based on these new criteria the spectrum of driving
mutations has largely been expanded.
Interestingly, it has also been observed that in addition to promoting the malignant
transformation of a cell, persistent up-regulation of a particular growth signal or pathway
can also result in “oncogenic addiction” whereby the cell becomes dependent on certain
aberrant oncogenic signaling for survival (Weinstein 2002). This presents an obvious target
17
for therapeutics: i.e., remove or inhibit the oncogenic signal and an addicted tumor cell will
die, whereas normal “non-addicted” cells will be unaffected.
Although incomplete, the functional characterization of some of the genetic lesions
found in tumors has revealed that the acquisition of these cancer hallmarks is achieved by
the deregulation of regulatory circuits that normally control cell physiology and
homeostasis. Broadly, genes mutated in cancer that are positive regulators of these
circuitries are referred as oncogenes, while genes that are negative regulators are referred to
as tumor suppressor genes (TSGs).
In addition to oncogenes and tumor suppressor genes, functional characterization of
genes mutated in cancer has revealed the identification of a distinct class of genes involved
in DNA repair mechanisms. Spontaneous mutations in these genes can in fact increase the
frequency at which mutations can be accumulated. This seems particular relevant in the case
of lung cancers as mutations in these genes in patients that are heavily smokers can results
in the rapid occurrence of tumors.
Although hundreds of mutations in lung cancer have been found, in the next
sections, I will review those that occur with higher frequencies, as indicated by data
collected in the Catalogue of Somatic Mutations in Cancer (COSMIC) (Forbes et al. 2008). In
particular, because my studies are aimed at understanding how specific genetic alterations
can contribute to NSCLC heterogeneity, I will limit my analysis to this specific type of lung
cancer.
1.4 The genetic landscape of lung cancer: lesions that affect DNA repair
Genetic lesions that affect the normal activity of genes involved in DNA repair by
increasing the frequency of mutations in general augment the probability of developing
cancer (Loeb 2001). This is particular relevant in the case of lung cancers caused by smoking.
Interestingly, although cigarette smoking is the major risk factor associated with 80–
90% of all lung cancer cases, only 10–15% of heavy smokers ultimately develop lung cancer
(Li et al. 2001; Shen et al. 2003). This suggests that besides exogenous susceptibility factors,
endogenous factors must be involved in lung carcinogenesis. Indeed, DNA repair capacity
appears to be significantly lower in lung cancer patients that are heavy smokers than in
healthy controls, and is consider an independent risk factor for the development of NSCLC
18
(Wei et al 1996; Wei et al. 2000). Molecular studies have in particular identified
polymorphisms in genes involved in detoxification processes of tobacco-derived
carcinogens, such as the cytochrome p450 system and glutathione S transferase, showing
that these can contribute to lung cancer susceptibility (Houlston 2000; Houlston1999). Also
in non-smokers, deficits in repair capacity have been linked to genetic instability and
ultimately carcinogenesis (Hecht 2002). Although conflicting data have been published,
recent meta-analyses suggested a moderately increased risk of lung cancer for persons
harboring CYP1A and glutathione S transferase M1 polymorphisms (Cosma et al. 1993;
Crofts et al 1994; Houlston 2000; Houlston1999).
1.5 The genetic landscape of lung cancer: lesions that affect tumor suppressor
genes and growth inhibitory pathways
Loss of TSG function is an important feature in lung tumorigenesis, since they are
considered negative regulators of growth. TSGs are believed to be inactivated in a two-step
process: LOH chromosomal deletion or translocation is usually one step, while point
mutation or epigenetic silencing of the second allele can be the second step (Harris 1988).
Described below are a few examples of TSGs commonly altered in NSCLC including TP53,
CDKN2A, FHIT, RASSF1a, TSLC1, and PTEN (Figure 1.3).
TP53
The p53 TSG is located on the short arm of chromosome 17 (17p13) and encodes a 53-
kDa protein. In normal physiology, this protein prevents accumulation of genetic damage in
cells in response to cellular stress. p53 acts as a transcription factor inducing expression of
downstream genes, such as the cyclin-dependent kinase (CDK) inhibitor p21KIP, GADD45
or BAX (Laptenko and Prives 2006; Beckerman and Prives 2010; Brady et al. 2011). In a very
simplistic view, downstream target genes of p53 regulate a cell cycle checkpoint signal that
causes the cell to undergo G1 arrest, allowing DNA repair, or apoptosis. The oncogene
MDM2, which is also a target gene of p53, functions as a negative feedback system,
inactivating the p53 protein (Pomerantz et al. 1998; Zhang et al. 1998). Inactivating
mutations in the p53 TSG are among the most common alterations in cancer (Holstein et al.
1991). p53 mutations are often single base substitutions, occurring in the majority of the
19
cases in exons 5–8 (Holstein et al. 1991). Similar to K-RAS mutations, most p53 mutations
are G-T transversions and there is a positive correlation between mutations and the use of
tobacco (Gao et al. 1997). Interestingly, the incidence of p53 mutations is higher in females
with NSCLC than in males (Toyooka et al. 2003). The precise mechanism behind this
observation is still unclear.
TSLC1
Recently, a tumor suppressor gene in lung cancer (TSLC1) located on chromosome
11 (11q23.2) was identified as a new TSG in NSCLC (Kuramochi et al. 2001). TSLC1 is
expressed in normal bronchial epithelium, whereas the protein is down-regulated in NSCLC
(Ito et al. 2003). A classic two-hit inactivation mechanism (loss of one allele and promoter
hypermethylation or inactivating mutations in the remaining allele) is observed in 40% of
NSCLCs (Kuramochi et al. 2001) and is associated with poor prognosis (Fukami et al. 2003).
TSLC1 encodes a membrane glycoprotein of the immunoglobulin superfamily (Ig-CAM)
that participates in cell-cell adhesion (Masuda et al. 2002). Although its precise mechanism
of tumor suppression remains unclear, it is assumed that tumor suppression is achieved by
loss of contact inhibition. Interestingly, when TSLC1 was introduced in a cell line lacking
this gene (A549 cells), tumor growth was suppressed in nude mice (Kuramochi et al. 2001).
PTEN
The TSG phosphate and tensin homolog detected on chromosome 10 (PTEN), also
called MMAC1 (mutated in multiple advanced cancers), maps to 10q23.3 and encodes a
cytoplasmic protein that influences the phosphoinositide-3-kinase (PI-3K)/Akt pathway
(Li et al. 1997). Loss of PTEN expression results in increased Akt activity and continued
cell survival (anti-apoptosis) and cell proliferation (Di Cristofano et al. 1998; Stambolic et
al. 1998). In contrast to other malignancies, such as prostate cancer, mutation in PTEN is a
rare event in NSCLC, with a frequency of 0–16% depending on the study (Li et al. 1997;
Forgacs et al. 1998; Hosoya et al. 1999; Kohno et al. 1998; Yokomiso et al. 1998).
Interestingly, PTEN inactivation is more frequently detected at the protein level (17–24%)
(Soria et al. 2002; Torres et al. 2001). Although further studies are needed one study
20
showed PTEN promoter hypermethylation in 35% primary NSCLC and in 69% of NSCLC
cell lines (Soria et al. 2002).
LKB1
The serine/threonine kinase LKB1 (also called STK11) is inactivated in
approximately 30% of lung cancers and often correlates with KRAS activation, resulting in
the promotion of cell growth and in mouse model in increased metastatic spread (Ji et al.
2007). It functions as a TSG by regulating cell polarity, differentiation, and metastasis and
can regulate cell metabolism. It has also been reported to inhibit the mTOR pathway
(Sanchez-Cespedes 2011).
1.6 The genetic landscape of lung cancer: oncogenes and growth-stimulatory
pathways
Genome-wide mutational analyses suggest that the mutational landscape of cancer
is made up of a handful of genes that are mutated in a high fraction of tumors, sometimes
referred to as “mountains,” while most mutated genes are altered at relatively low
frequencies, sometimes referred to as “hills”. The mountains probably give a high
selective advantage to the mutated cell, and the hills might provide a lower advantage,
making it hard to distinguish them from passenger mutations. Bioinformatic studies
suggest that the mountains and hills can be grouped into sets of pathways and biologic
processes. Pathway analyses have allowed the stratification of mutated genes in NSCLC to
core pathways (Figure 1.3). Among them, the KRAS, Wnt, ALK, NKX2.1 and RTKs
mediated pathways are the most frequently deregulated in NSCLC.
RAS-RAF-MEK signaling pathway
RAS-RAF-MEK is another downstream signaling pathway that is activated by
RTKs and has been widely implicated in human cancers. In a simplified view, in response
to growth factor signals, activated RTKs trigger GTP binding by RAS GTPases. GTP-
bound RAS subsequently leads to phosphorylation-mediated RAF activation, which in
turn signals MEK and ERK signaling molecules that facilitate cell growth and
21
proliferation. The most commonly mutated RAS isoform in human cancer is KRAS
(Quinlan et al. 2008). Activating mutations in KRAS cause irreversible binding of KRAS to
GTP, resulting in constitutive activation of the signaling molecule. According to the
COSMIC database, KRAS mutations have been identified in 22% of NSCLC
adenocarcinomas and are less frequently associated with squamous cell carcinomas
Forbes et al. 2008). More than 90% of KRAS mutations occur in exon 1, with a much
smaller fraction occurring in exon 2. Because NSCLC tumors harboring KRAS mutations
are refractory to EGFR inhibitors, detection of KRAS mutations is a negative indicator of
response to anti-EGFR therapies (Van et al. 2007; Zhu et al. 2008; Massarelli et al. 2007;
Eberhard et al. 2005).
BRAF, which encodes a serine/threonine kinase, is the most commonly mutated
gene in melanoma. In NSCLC, BRAF mutations have also been identified. 2% of squamous
carcinomas harbor mutations mostly in exon 11, while 4% of adenocarcinomas express
mostly V600E mutation in exon 15 (74%) (Forbes et al. 2008). The locations of these
mutations suggest different mechanisms of BRAF activation. The V600E mutation resides in
the BRAF activation domain, whereas the exon 11 mutation affects a residue in the AKT
phosphorylation site and likely results in loss of inhibitory phosphorylation by AKT (Brose
et al. 2002).
Although rare, mutations in the MEK1 kinase, which is downstream of KRAS and
BRAF, may also play a role in NSCLC. A single somatic activating point mutation in exon 2
of MEK1 was identified in 2 of 207 primary lung tumors with no other mutation (Marks et
al. 2008). Screening of lung cancer derived cell lines identified an additional point mutation
in exon 2 of MEK1 in the NCI-H1437 cell line.
WNT signaling pathway
Wnt proteins form a family of highly conserved secreted signaling molecules that
regulate cell-to-cell interactions during development. As currently understood, Wnt
proteins bind to receptors of the Frizzled and LRP families on the cell surface. Through
several cytoplasmic components, the signal is then transduced to beta-catenin, which enters
the nucleus and forms a complex with TCF to activate transcription of Wnt target genes.
Mutations in exon 3 of the gene encoding β-catenin mediate accumulation and constitutive
22
activation of β-catenin (Fujimori et al. 2001). These mutations have been identified in 10% of
NSCLC adenocarcinoma. No such mutations were found in the squamous subtypes (Miller
et al. 1999, Forbes et al. 2008). The Wnt signaling pathway therefore represents a potential
tumorigenesis mechanism in lung adenocarcinoma, alternative to RTK activation.
Anaplastic lymphoma kinase (ALK)
ALK is a RTK that is commonly associated with oncogenic gene fusions in
hematologic disorders, such as anaplastic large cell lymphoma. Translocations involving
ALK have been identified with at least 11 partner genes in various hematologic and solid
tumor malignancies. The most frequent of these results from adenosine to a thymine (2;5)
chromosomal translocation that fuses ALK on chromosome 2 with the nucleophosmin
(NPM) gene on chromosome 5 giving rise to the NPM-ALK fusion protein (Morris et al.
1994; Morris et al. 1997). This type of translocation generally leads to elevated expression
levels of ALK and subsequently causes increased activation of the PI3K-AKT signaling
pathway, a signaling pathway believed to be crucial in malignant transformation driven by
ALK (Greenland et al. 2001; Slupianek et al. 2001).
Recently, chromosome 2p inversions resulting in ALK translocations were also
identified in NSCLC (Soda et al. 2007). ALK translocations have been associated with ∼7%
of adenocarcinomas and are only rarely seen in other NSCLC subtypes. Similarly to EGFR
oncogenic-mutations, ALK translocations may also have a significant association with acinar
histology and have also been found in BACs (Inamura et al. 2008; Inamura et al. 2009). The
echinoderm microtubule-associated protein-like 4 gene (EML4) is the partner gene in nearly
all ALK fusions found in NSCLC thus far, although in a few other patients KIF5B-ALK
fusion was also identified (Sanders et al. 2010). To date, 15 variants of the EML4-ALK fusion
transcript involving at least eight different EML4 exons have been described (Sanders et al.
2010; Perner et al. 2008; Shaw et al. 2009; Choi et al. 2008; Koivunen et al. 2008; Wong et al.
2009; Takahashi et al. 2010). Interestingly, fusion variants of EML4-ALK have been
associated with a unique histo-type. For example, a recent study found variant 1 associated
with mixed papillary with BAC component histologies and variant 2 with acinar histologies
(Inamura et al. 2008).
23
NKX2-1 (TITF1)
Genome-wide screens for DNA copy number changes in primary NSCLCs found
multiple examples of amplification at 14q13.3—and subsequent functional analysis (siRNA
knockdowns in NSCLCs) identified NKX2-1 (also termed TITF1) as the most likely target of
amplification in lung cancer (Kendall et al. 2007; Kwei et al. 2008; Weir et al. 2007). NKX2-1
encodes a lineage-specific transcription factor essential for branching morphogenesis in lung
development and the formation of type II pneumocytes, the cells lining lung alveoli.
Amplification of tissue-specific transcription factors in cancer has been observed in AR
in prostate cancer, MITF in melanoma, and ESR1 in breast cancer. These findings have led to
the development of a “lineage-dependency” concept in tumors whose survival and
progression of a tumor is dependent upon continued signaling through specific lineage
pathways (i.e., abnormal expression of pathways involved in normal cell development)
rather than continued signaling through the pathway of oncogenic transformation as seen
with oncogene addiction (Tanaka et al. 2007). Counter intuitively, recent work from Tyler
Jacks lab indicated that silencing of NKX2-1 can increase the metastatic spread of tumors
(Winslow et al. 2011).
Receptor tyrosine kinases (RTKs)
Receptor tyrosine kinases, including EGFR, PDGFR, MET and FGFR, are among the
most frequently mutated genes in NSCLC (Ding et al. 2008). Altogether they account
approximately for 60% of all oncogenic mutations so far identified and affect approximately
40% of all NSCLCs.
In particular, EGFR is overexpressed in 40% of NSCLC, and its expression is
correlated with poor prognosis (Ohsaki et al. 2000; Nicholson et al. 2001; Hirsch et al. 2003;
Arteaga 2003; Sharma 2007). In the majority of cases, overexpression of EGFR has been
linked to amplification of chromosomal region 7p12, where the EGFR gene is located (Testa
& Siegfried 1993). In addition to EGFR, its cognate ligands (EGF and TGF-alpha) are also
frequently overexpressed in NSCLCs. This establishes autocrine loops leading to receptor
hyperactivity, hence unleashing EGFR activation from its dependence on the tumor-
microenvironment (ligand availability) (Putnam et al. 1992; Rusch et al. 1993).
24
In 2004, heterozygous mutations in the EGFR gene were detected in NSCLC (Lynch
et al. 2004; Pao et al. 2004; Sordella et al. 2004). These mutations were clustered around the
kinase domain of the EGFR kinase and were strongly associated with clinical response to
gefitinib and erlotinib, two small-molecule EGFR kinase inhibitors. These mutations could
be subdivided into three groups: the substitution mutation G719S located in the glycine-rich
nucleotide triphosphate-binding P loop, small in-frame deletion mutations in exon 19 and
the substitution mutation L858R that is located in the activation loop (Lynch et al. 2004; Paez
et al. 2004; Sordella et al. 2004).
According to data collected in the COSMIC database (Forbes et al. 2008), EGFR
mutations are found in approximately 40% of adenocarcinomas, 30% of mixed
adenosquamous carcinomas, and ≤5% of squamous or large-cell carcinomas. Furthermore,
studies have also demonstrated significant association with tumors with bronchio-alveolar
carcinoma (BAC) features, acinar patterns, and papillary subtypes of adenocarcinoma
(Chantranuwat et al. 2005; Blons et al. 2006; Ohtsuka et al. 2006; Sakuma et al. 2007).
Interestingly, these mutations occur more frequently overall in non-smokers (∼95-75% in
nonsmokers, 5–15% in smokers), in women and in patients of Asian ethnicity (Lynch et al.
2004). Although the frequency of EGFR gene mutations in NSCLC is roughly 10% in
Caucasian patient populations, the proportion in East Asian patients is around 30% (Janne
et al. 2005). Interestingly, these features match with those of patients who respond to EGFR
tyrosine kinase inhibitor (TKI) treatment in initial phase II trials (Fukuoka et al. 2003; Kris et
al. 2003; Miller et al. 2004; Soulieres et al. 2004).
Functional experiments in vitro and in mouse models showed that these mutations
are oncogenic. Ectopic expression of EGFR mutations in an adenocarcinoma cell line
increases the cell’s sensitivity to EGFR inhibitors (Paez et al. 2004). Sordella et al. showed
that lung cancer–derived EGFR mutations activate the anti-apoptotic Akt and STAT3/5
pathways, providing a link between these mutations, malignant transformation and
“addiction” to anti-apoptotic pathways (2004). Interestingly, by specifically silencing the
mutant EGFR allele using small interfering RNA technology, they were able to show
induction of apoptosis in EGFR-mutant but not wild-type cells and, thus, a dependency of
EGFR mutants on this oncogene. It is still unresolved whether the mechanism by which the
mutations confer responsiveness to EGFR TKI is by changing the biochemical properties of
25
the kinase, by targeting an activated kinase on which the cell has become strictly dependent,
or both.
Unfortunately, all NSCLC patients treated with the EGFR TKIs gefitinib or erlotinib
will eventually relapse and succumb to the disease (Kobayashi et al. 2005; Pao et al. 2005a).
Similar to CML patients who acquire resistance to imatinib caused by the emergence of
secondary mutations in the BCR-ABL kinase domain, NSCLC patients treated with EGFR
TKI, also acquire resistance, attributed to the presence of a secondary mutation in the EGFR
kinase domain (T790M). When the T790M mutation, analogous to the T315I mutation in
CML, was introduced into CHO-K1 cells, resistance to EGFR TKI treatment is observed
(Blencke et al. 2005). Interestingly, crystal structure of EGFR harboring the T790M mutation
indicated that the threonine residue at position 790 bind erlotinib via a bridging water
molecule (Stamos et al. 2002). The substitution by a methionine reduces the affinity of
erlotinib and gefitinib to EGFR and hence dampens the cell’s sensitivity to EGFR TKI.
Second generation inhibitors have now been developed and shown to effectively kill cells
carrying the T790M resistance mutation in concentrations that might be achievable in
patients (Kobayashi et al., 2005; Balak et al., 2006; Kosaka et al., 2006). Still, clinical trials
with these inhibitors have so far failed to show efficacy in patients.
In addition to secondary EGFR mutations, amplification of MET has also been
described. The p190 MET gene encodes the receptor for the hepatocyte growth factor (HGF)
(Naldini L, et al. 1991; Giordano et al. 1989). MET is widely expressed on the surface of
epithelial cancer cells, whereas HGF is mostly secreted by mesenchymal cells (Prat et al.
1994). However, overexpression and/or trans-activation by other RTKs can also overcome
the requirement for paracrine stimulation. Met-mediated signaling regulates cell migration,
cell scattering and invasion of extracellular matrices in adult tissues (Toschi and Passi 2008)
through the activation of several signal transduction cascades, such as PI3K, MAPK, STAT,
WNT and NOTCH pathways. While in other tumors, missense mutations have been found
(hereditary papillary cell carcinoma) (Olivero et al. 1999; Di Renzo et al. 2000), in the case of
NSCLC multiple studies have identified MET amplification as the principal source of its
oncogenic activation. Depending on the studies, frequency of amplification varies from 1.4
to 21% (Onozato et al. 2009; Beau-Faller et al. 2008; Cappuzzo et al. 2009). In addition,
several groups have now reported an intronic splice variant of the MET gene that skips exon
26
14 in approximately 2-3% of Japanese patients with NSCLC (Onozato et al. 2009; Kong-
Beltran at al. 2006). Functional studies indicated that MET amplification is not only
sufficient to drive tumorigenesis but also increases the metastatic potential on NSCLC cells.
In particular, amplification of MET correlates with poor prognosis in surgically resected
NSCLC patients (Cappuzzo et al 2009). More recently, MET amplification has been detected
also in cancer patients that developed resistance to gefitinib or erlotinib. In this case, MET-
induced resistance to EGFR inhibitors has been linked to activation of the PI3K pathway
(Engelman et al. 2007).
Among other RTKs over-expressed in NSCLC, there are PDGFR and FGFR. The
PDGFR family includes the PDGFRα, PDGFRβ and Kit receptors (Zwick et al. 2001). The two
receptors are activated by a ligand dimer consisting of PDGF-A and/or PDGF-B in three
possible dimer conformations (αα, ββ and αβ) (Heldin et al. 1998). While cells of mesodermal
origin such as fibroblast and smooth muscle cells, usually express PDGFR, it is also found in
epithelial and endothelial cells (Ross et al. 1985; Shawver et al. 2002). Hence, not
surprisingly, in 2007 PDGFRα was identified by biochemical, functional, and clinical
analysis to be actively expressed in NSCLC tumors and cell lines (Rikova et al. 2007). Recent
studies confirmed these initial findings and in addition also indicate that PDGFRA is
amplified in lung squamous cell carcinoma (Heist & Engelman 2012). Similarly to EGFR,
PDGFR stimulates signaling cascades mediated by phospholipase Cγ, PI3K, STAT5, and
MAPK/SHP-2 (Rikova et al. 2007) and regulates cellular proliferation, differentiation,
growth, motility and invasion. Interestingly, NSCLC cell lines and tumors harboring
PDGFR-alpha amplification are sensitive to imatinib treatment, a PDGFR selective inhibitor
used in the clinic for patients with CML (Rikova, et al. 2007).
Deregulation of FGFR signaling caused by point mutations, elevated expression or
different splicing forms has been identified in a variety of human tumors (Zwick, et al.
2001). In the case of lung cancer, FGFR1 amplification has been identified in approximately
20% of squamous cell cancers (Engelman 2012). Similarly to the case of other RTKs,
inhibition of FGFR1 in cancer cell lines and in mouse models harboring FGFR1 amplification
leads to growth inhibition and apoptosis (Heist and Engelman 2012).
Interestingly despite their high similarities in their molecular structure and
biochemical functions, distinct clinical features have been correlated with the activation of
27
different RTKs. Hence, in principle this suggests that distinct RTK mutations could
contribute to lung cancer heterogeneity. In the last four years, my studies have been focused
on trying to gain a better understanding of the molecular mechanisms behind signaling
differences among RTKs frequently mutated in NSCLC and to determine whether
phenotypic variations observed in tumors can be attributed to signaling variation among
these oncogenes.
Given the centrality of RTKs in my study in the next section I will first describe their
molecular features, how they function and current principles underpinning their signaling
specificities and commonalities.
1.7 Receptor tyrosine kinases: structure and functions
All RTKs possess a single trans-membrane domain separating the extra-cellular
ligand binding portion from their intra-cellular tyrosine kinase region (Ullrich &
Schlessinger 1990). All RTKs have a conserved kinase domain, composed of ~300 amino
acids (Hubbard 1999). This domain is characterized by an amino-terminal lobe and a larger
carboxy-terminal lobe. The cleft formed by the two lobes allows the transferring of the most
distal phosphoryl group from an ATP molecule to a tyrosine hydroxyl group in the protein
substrate.
Sequencing of the human genome revealed the existence of 90 tyrosine kinases;
among them, 58 are RTKs and 32 are non-RTKs (Manning et al. 2002; Robinson et al. 2000).
Based on their similarity in the extra-cellular moiety, RTKs can then be classified into 20
sub-families (van der Geer et al. 1994).
Phylogenetic studies indicated that the first RTK likely arose from fusion of an
epidermal growth factor (EGF)–like domain and a cytoplasmic tyrosine kinase, before the
appearance of metazoans (King and Caroll 2001) (Figure 1.4). Subsequently, the number and
diversity of RTK genes sharply increased during metazoan evolution, but remained
exclusive to this subkingdom. The only exceptions are choanoflagellates, a type of flagellates
that are morphologically similar to the choanocytes of certain sponges and are considered
the closest living organisms to metazoans (Amit et al. 2007). The homology retention of
RTKs during evolution is thought to be due to gene duplication and fusion events that give
rise to divergent protein sequences characterized by distinct biological functions. It has
28
been calculated that the frequency of gene duplication occurring in the course of evolution
occurs at a background rate of 0.01 duplications per gene per million years (Lynch and
Conery 2000).
During evolution, gene duplication has expanded not only the number of RTKs, but
also the components of their signaling pathways. Interestingly, upon duplication, highly
connected proteins retained their interactions, creating networks rich in highly connected
nodes (Rzhetsky and Gomez 2001; Pastor-Satorras et al. 2003), for example, the PI3K and
MAPK families. This redundancy in principle can explain robustness, plasticity and
contingency of signaling networks activated by RTKs, and at the same time suggests a
certain degree of specificity in their biological activities.
Mechanism of activation of RTKs: Ligand binding, receptor dimerization and phosphorylation
The mechanism of receptor kinase activation has been thoroughly characterized by
structural and biochemical studies. It is now accepted that ligand binding induces a
conformational change that stabilizes receptor dimerization leading to kinase activity and
auto-phosphorylation of tyrosine residues present usually in their most terminal part (tail).
Phosphorylation of tyrosines in the tail creates binding sites for effector proteins, hence
leading to the activation a series of signaling pathways that mediate their biological effects
(Zwick et al. 2001) (Figure 1.5).
The structural diversity of ligands and receptors suggest various strategies for
ligand-induced dimerization. There are four current models of dimerization (Lemmon and
Schlessinger 2010). In the first model, the stable interaction between two receptors is
permitted only in the presence of a bivalent ligand and an accessory molecule. The ligand in
this case actively participates in the binding of the receptors. This is true in the case of
activation of FGFRs, in which dimerization is achieved only in the presence of heparin and
FGF (Spivak-Kroizman et al. 1994). In the second model, dimerization of the receptors is
mediated exclusively through receptor-receptor interaction; the ligand in this case makes no
direct contribution to the dimer interface, but allows for a change in the conformation that
permits binding. EGFR can be activated through this mode. The binding of a number of
ligands, including EGF, TGF-α and neuregulins (Olayioye et al. 2000), induce
conformational changes in the extracellular region of EGFR, exposing the dimerization site
29
in domain II and allowing for the two EGFR monomers to interact (Burgess et al. 2003).
Therefore, unlike FGFR, the dimerization of ErbB receptors is mediated entirely by the
receptor, as each of the monomeric ligands binds to only one receptor on the opposite side
to the surface where the two receptors interact to form a dimer. The third mode of receptor
dimerization is entirely ligand-mediated and the two receptors are never in contact. This is
the case of TrkA (NGF receptor) dimerization, in which two NGF molecules dimerize
(Wehrman et al. 2007; Wiesmann et al. 1999; Lemmon and Schlessinger 2010). Lastly, as in
the case of KIT, the ligand (stem cell factor) binds to the extracellular region of the receptor,
mediating the interaction of two receptor molecules and allowing the two Ig-like domains in
the proximity of the plasma membrane to interact (Liu et al. 2007; Yuzawa et al. 2007). In
this case, the ligand allows for a conformational change, but also directly participates in the
binding.
Although the mechanism of activation by ligands is different, in all cases,
dimerization leads to activation of RTKs. This is achieved through conformational changes
in the intracellular moiety. As a consequence of dimerization, two RTKs are positioned in
close proximity, allowing for trans-phosphorylation of critical tyrosine residues.
Nonetheless, in the majority of RTKs, conformational changes are not sufficient to ensure
full activity. Multiple cis- and trans- inhibitor mechanisms have in fact been shown to
dampen RTK activity. In many instances, as in the case of MuSK, Flt3, KIT, and Ephs, the
cytoplasmic juxta-membrane region of RTKs mediates cis-auto-inhibition. (Till et al. 2002;
Griffith et al. 2004; Mol et al. 2004; Wybenga-Groot et al. 2001). Crystal structure studies in
fact showed that the juxta-membrane region forms a helical structure, which interacts with
the N-lobe of the kinase domain and prevents the DFG sequence in the activation loop to be
positioned in the proximity of ATP and substrate. In other cases, auto-inhibition is provided
by the C-terminal sequence. For instance, Tie2 C-terminal tail blocks substrate access by
interacting with the active site of the RTK (Niu et al. 2002; Shewchuk et al. 2000). In general,
trans-phosphorylation of tyrosines in the activation loop, in the juxta-membrane segment,
and/or in the C-terminal region, has been shown to relieve this inhibitory mechanism,
allowing for full enzymatic activity.
30
RTKs recruitment and activation of downstream signaling
Auto-phosphorylation of RTKs not only primarily serves to enhance the catalytic
activity after ligand binding, but also provides a docking site for the recruitment and
activation of downstream signaling molecules (Ullrich and Schlessinger 1990). Enhancing
the catalytic activity of RTKs by the first phosphorylation allows for phosphorylation of
other tyrosine residues that recruit cytoplasmic signaling molecules containing Src
homology-2 (SH2) and phosphotyrosine-binding (PTB) domains (Pawson 2004; Schlessinger
and Lemmon 2003). Then, FGFR receptor substrate2 (FRS2), the insulin receptor substrate-1
(IRS1) and the Grb2-associated binder (Gab1), work as scaffold proteins for the recruitment
of other signaling components (Schlessinger 2000).
Specificity in the binding of PTB and SH2 containing proteins to certain tyrosines is
ensured by the amino acid sequences surrounding the phospho-acceptor site (Songyang and
Cantley 2004). In the past, peptide library screens have been performed for the generation of
quantitative SH2 interaction networks for certain RTKs (Songyang and Cantley 2004). In
2009, the structure of an SH2 domain bound to a phosphorylated RTK was reported (Bae et
al. 2009). This study corroborates previous findings and provides more detailed insight into
SH2 binding specificity. In addition, based on crystallographic evidence, it appears that the
four residues downstream of the phosphorylated tyrosine, a secondary binding site on the
SH2 domain has also been shown to play a role (Bae et al. 2009). As for other tyrosine
kinases, activation of RTK downstream signaling can also be triggered by the direct
phosphorylation of substrates. This is the case for example for PLC-gamma and GAB1.
Functional differences among RTKs
At first glance all the RTKs appear to be highly similar. As mentioned, all possess a
highly homologous tyrosine-kinase domain, they activate almost the same signaling
pathways (i.e., PI3K, MAPK, PLC gamma), and they all regulate very similar cellular
functions (i.e., growth, motility, differentiation). However, several lines of evidence
indicated specificity in their biological activities and functions (i.e., mesenchymal
phenotype, sensitivity to selective RTK inhibitors). Knockout experiments in mice showed
for example that EGFR is an essential gene, as its deletion results in embryonic lethality due
31
to compromised development of epithelial tissues in several organs, including skin, lung
and gastrointestinal tract (Threadgill et al. 1995; Miettinen et al. 1995; Siblia & Wagner 1995).
In contrast, although MET and PDGFR have also been shown to be essential for early mouse
development; their deletion is lethal, in the first case due to abnormal placental
development (Uehara 1995; Soriano 1994), and in the second case due to renal and
hematological abnormalities (Schatteman 1992; Orr-Urtreger 1992). Interestingly, in contrast
to EGFR deficient mice, knocking-out specific EGFR ligands (EGF, TGF-alpha, amphiregulin
and heparin-binding EGF) showed tissue-restricted phenotypes, suggesting ligand/receptor
interaction plays a role in mediating the observed phenotypic variation (Luetteke et al. 1999;
Luetteke et al. 1993; Iwamoto et al. 2003; Jackson et al. 2003). The importance of ligands in
dictating RTKs biological diversity is exemplified by fibroblast growth factor receptor
(FGFR). There are over 48 different isoforms of FGFRs produced by alternative splicing in
the extracellular domain of the four FGFR genes (Duchesne et al 2006). Each of these
isoforms has selective affinity to fibroblast growth factors, which are the largest family of
growth factor ligands, comprising 22 members (Ornitz and Itoh 2001). In principle, these
studies suggest that temporal and spatial control of RTKs activity by availability of different
ligands is an important feature regulating their function and specificity.
Ligand specificity can also explain differences among RTKs observed in vitro, where
clearly the availability of growth factors is not limiting. In this case, different
ligand/receptor affinities and intrinsic chemical and physical properties of ligands such as
resistance to acidification, can lead to sustained activation of RTKs in different cellular
compartments. This is the case for example of EGFR stimulation by EGF or TGF-alpha. The
latter has an increased binding affinity and is resistant to acidification (Kramer et al. 1994).
As a consequence, while EGF can induce a transient stimulation that is limited to activation
of EGFR at the plasma-membrane, stimulation of cells with TGF-alpha results in prolonged
activation of EGFR, even in multi-vesicular bodies, characterized by a low pH (Lenferink et
al. 1998).
However other studies have clearly indicated that differences in interaction with
signaling effectors play an equally important role in ensuring signaling specificity among
RTKs. It has been shown for example that variation in intracellular binding sequences
results in qualitative activation of signal transduction modules. This is the case, for example,
32
for insulin receptor (IR) and EGFR. While the first possesses four binding sites for PI3K, the
second possess none. Hence, IR can directly activate PI3K, while EGFR can induce
activation of PI3K only indirectly, either through the recruitment of GAB family members or
by trans-phosphorylating Her2 and Her3. In a similar fashion, negative regulators can
differentially impact RTK-mediated signaling by binding to RTKs with different strength
(e.g., MIG6) (Segatto et al 2011).
Specificity of signaling: substrate specificity
Protein phosphorylation is one of the most fundamental mechanisms for signal
transduction. Consequently, protein kinases are among the largest classes of human genes,
encompassing ≈600 members (Mannin 2002). In the case of soluble kinases, the specificity of
signal transduction clearly cannot depend on ligands, but has been shown to depend on the
ability of each kinase to precisely phosphorylate particular sites on specific substrate
proteins. The specificity of phosphorylation is in this case determined by at least two major
elements: peptide specificity and regulated co-localization of substrate/kinase (Faux and
Scott 1996; Kreegipuu et al. 1998; Oancea and Meyer 1998; Newton 2001; Parker and
Parkinson 2001).
Peptide specificity describes the preference of a kinase for particular amino acids
surrounding the phosphorylation site. Kinases typically discriminate well in their substrates
preferences. Studies conducted in the late 1980s and early 1990s have generated “consensus
motifs” and classification of serine and threonine kinases into three classes: basophilic
kinases (PKA, PKC), which favor basic residues around the phosphorylation site; and
acidophilic kinases (CKII) and proline-directed kinases (CDKs and MAPKs), which require
a proline residue immediately C-terminal to the phosphorylation site (Kreegipuu et al.
1998). This likely indicates the spatial structure of the peptide chain around the
phosphorylatable group and electrostatic forces that are important for the substrate
specificity of many protein kinases. At that time, specialized graph representations were
also developed. In a typical “sequence logo” the phosphorylation site is at the center (P0),
residues N-terminal to it are on the left and at the C-terminal are on the right. Each position
is represented by a stack of letters, each representing an amino acid code. The higher the
letter, the higher the selectivity (Shneider and Stephens 1990). Selectivity is usually
33
determined as the difference between the distribution of residues at that position and the
proteome in general. Letters are generally also color coded to indicate physico-chemical
properties; for example, blue for basic, red for acidic, black for hydrophobic.
In the mid-1990s, in addition to “substrate specificity” the concept of “substrate
recruitment” was introduced. Studies have shown that PTK specificity also depends on the
proximity and availability of the substrate. Clearly this departs from the view that cells are
freely diffusible systems in which enzymes and substrates are free to float around. Efficient
and specific peptide substrates for some PTKs with Km in the mid micro molar range have
been identified (Shu et al. 2005). This implies that during evolution, efficient
phosphorylation of any given substrate has been selected either by optimizing sequences
surrounding the phosphorylation site and/or by increasing the frequency of encounters of a
mediocre substrate with a kinase. Auto-phosphorylation sites are an extreme case, in which
surrounding sequences are not “good” substrates per se. Yet, the fact that these are
“mediocre” sequences suggests that even strong recruitment is not sufficient to compensate
for very low phosphorylation rate. Therefore, because of the cooperation of recruitment and
peptide specificity in creating phosphorylation specificity, it is virtually impossible to
predict a priori which of the two has been selected during evolution.
While people agree that substrate specificity plays a role in serine (Ser) and
threonine (Thr) kinases, early studies based on p60SRC auto-phosphorylation site peptides
and angiotensin suggested that protein tyrosine kinases are much more promiscuous and
have very low substrate specificity (Cheng et al. 1993). However, contrary evidence has
accumulated over the years, suggesting this assumption needs to be re-examined.
In 1988, Sahal et al. hypothesized substrate specificity differences among RTKs in a
seminal study on differential phosphorylation of tyrosine-containing polymers by insulin
receptor and IGF-1R (Sahal et al. 1988). Those initial findings were subsequent by supported
by studies from Todd Miller and colleagues and by Cantley and colleagues (Xu et al. 1995;
Songyang et al. 1994a). Miller’s group compared the capability of purified intracellular
domain of IR and IGF1R to phosphorylate a series of peptides that reproduced the major
phosphorylation sites found in these receptors. They found that while both can highly
phosphorylate peptides containing the YMXM or YXXM consensus, only IGF1R was less
dependent on the presence of methionine residues C-terminal to the tyrosine site. As
34
opposed to IR, IGF1R in fact can efficiently phosphorylate a peptide (YVNI) corresponding
to the IRS-1 Y895 site. Cantley et al. instead used a degenerate peptide library to show that
each residue surrounding the tyrosine is an important determinant of substrate specificity
for PTKs (Songyang et al. 1994a). By using this novel technique, they were able to compare
substrate specificity among Fes, SRC, LCK, ABL, EGFR, PDGFR, FGFR and IR. They showed
that residues at least four amino acids upstream and four amino acids downstream of the
phospho-acceptor site can contribute to substrate specificity. In addition, they found that
most PTKs selected peptides with D or E residues N-terminal to the tyrosine residues.
Interestingly, while cytosolic TKs selected for substrates with I or V at position -1 and D, A
or G at position +1, RTKs selected substrates with a D at position -1 and large hydrophobic
amino acids at position +1. All selected hydrophobic amino acid at position +3.
Last year, Lipari’s laboratory provided further evidence by assaying differences in
substrate specificity among 81 tyrosine kinases with three different substrates (Blouin et al.
2011). They found that while the JAK1 peptide (CAGAGAIETDKEYYTVKD) was highly
promiscuous for many PTKs, all SRC family kinases efficiently phosphorylated the CDK1
peptide (KIGEGTYGVVYK) and RTKs greatly favored the IRS1 peptide
(CKKSRGDYMTMQIG). Of note, 65–70% of all the phosphorylatable residues were
predicted to be on the surface of the protein.
In addition to the above mentioned studies, bioinformatic approaches have also been
implemented to identify kinase consensus sites. For example, Kreegipuuet and collaborators
analyzed 14849 Ser, 11095 Thr and 6535 Tyr residues in 406 distinct proteins by 34 different
kinases (Kreegipuuet al. 1999). One interesting observation that emerged from these studies
was that the majority of Ser/Thr kinases have a preference for serine residues, with the
number of discovered threonine phosphorylation sites being in most cases 3–10 times less
than the number of serine sites. This cannot be explained by different natural occurrence of
these amino acids since the ratio of serine and threonine content in proteins is 1.3:1 as
calculated from sequence data for more than 60000 different proteins (SwissProt database
http://www.sciencedirect.com/science/article/pii/S0014579398005031-BIB9#BIB9).
Similar to previous studies, these observations confirmed the importance of amino acids
between positions −4 and +4 around the phosphorylation site. This statistical analysis also
indicated that most of the Ser/Thr protein kinases can be divided into three classes,
35
including basophilic (e.g. PKA, PKC, CaM-II kinase), acidophilic (e.g. casein kinases I and II),
and proline-directed protein kinases (e.g. cyclin-dependent kinases, MAP kinases), and
further, that most of the analyzed tyrosine kinases are acidophilic. Interestingly,
comparative analysis of protein secondary structure also suggests its influence to be much
weaker respect to the effects of the peptide primary structure. Overall, the recent findings
support the previous observations, suggesting that substrate specificity is important in
mediating biological differences among kinases.
Additional evidence that catalytic specificity is critical for functional differences
among RTKS is supported by studies of RTKS oncogenic variants. In the case of RET
receptor, a germ-line mutation affecting the catalytic core results in the autosomal cancer
syndrome MEN2B (multiple endocrine neoplasia type 2-B) (Eng 1996). In the mutated form
a methionine in position 918 is changed into a threonine residue in the catalytic domain. As
a consequence while WT RET phosphorylates the optimal peptide AEEEEYFELVAKKK, the
mutant RET in addition to this peptide now also phosphorylates optimal substrates for SRC
and ABL and mediates the activation of pathway normally mediated by SH-2 containing
PTKS and protein containing SH2 of the group I. Similarly we recently observed differences
in substrates specificity among wild type and mutant EGFR.
The availability of crystal structures for the majority of kinases has provided
molecular insights on substrate specificity among protein tyrosine kinases. These studies
revealed that PTK specificity is dictated by multiple factors, including the amino acid
sequence surrounding the phosphorylation site, long-range interactions with other motifs
and surfaces of the substrate, and the recruitment of substrates by domains other than the
kinase catalytic domain.
The protein kinase domain is highly conserved among both tyrosine and
serine/threonine kinases. As mentioned previously, it contains an N-terminal lobe involved
in ATP binding and a C-terminal lobe that is thought to be involved in protein substrate
recognition. However, with the exception of IRK, there has been limited information until
very recently about how most PTKs recognize tyrosine-containing peptide substrates. This
is mainly due to challenges in the crystallization of PTK–peptide substrate complexes
because of the generally low affinity of this interaction. Several lines of evidence have
suggested that the transition state for PTK reactions is dissociative (Kim and Cole 1997; Kim
36
and Cole 1998; Ablooglu et al. 2000). In a dissociative (as opposed to an associative)
transition state, there is little bond formation between the tyrosine (substrate) on the peptide
and the attacked phosphorus before substantial departure of the ADP. For instance, a bi-
substrate analog of a physiological peptide sequence based on the insulin receptor substrate
1 (IRS-1) Tyr727-containing region (i.e., IRS727–ATP), was designed and synthesized as a
selective and potent inhibitor of IRK in which ATPγS is linked to a tyrosine-mimic-
containing peptide via an acetyl spacer (Parang et al. 2001). IRS727–ATP proved to be a
useful tool for the X-ray crystallographic analysis of IRK bound to substrate. In addition, the
IRK co-crystal structure with the IRS727–ATP bi-substrate analog showed the expected
interactions of nucleotide and peptide moieties with the appropriate kinase binding sites
(Parang et al. 2001). Also the IRK co-crystal structure showed that the P+1 and P+3
methionine residues in the peptide were positioned in shallow hydrophobic pockets on the
surface of the C-terminal kinase lobe and formed an interaction with the activation loop of
the kinase. The encouraging results with the IRK co-crystal structure led to the further
synthesis and study of several other bi-substrate analogs targeted against different
serine/threonine and tyrosine protein kinases (Shen and Cole 2003; Hines and Cole 2004;
Hines et al. 2005; Cheng et al. 2006; Levinson et al. 2006; Zhang et al. 2006). Despite limited
sequence homology, a comparison of the primary structure of the peptide moieties of the bi-
substrate analogs that crystallized with the IRK, Abl and EGFR kinases and the structure of
the enzyme binding pockets reveals the importance of non-polar and hydrophobic
interactions at the P + 1 and P + 3 positions, suggesting a model in which hydrophobic
interactions predominate in the binding of peptides substrate to tyrosine kinases.
Yet despite the accumulations of all these evidences, in the majority of cases
substrate preferences are not considered as a determinant of RTKs specificity.
1.8 Beyond the genetic landscape of lung cancer: epigenetic regulation and
microRNA-mediated regulation of lung cancer
I would like to end this chapter by mentioning that in addition to genetic
aberrations; recently it has been observed that other molecular mechanisms can modify gene
expression without any changes in DNA sequence. In particular DNA hyper-methylation
has been proposed to play a role in lung tumorigenesis (Helman et al. 2012). Increased DNA
37
methylation in a normally un-methylated promoter region of a gene usually results in
silencing of gene transcription and is therefore viewed as an alternative route for the
inactivation of TSGs. In lung cancer, many genes have been found to be silenced by
promoter hypermethylation (Rauch et al. 2008; Pfeifer and Rauch 2009). Usually, they are
involved in tumor suppression, tissue invasion, DNA repair, detoxification of tobacco
carcinogens, and differentiation.
miRNAs are a recently identified class of non–protein encoding small RNAs present
in the genomes of plants and animals (He and Hannon 2004). Ranging in size from 20 to 25
nucleotides, miRNAs are small RNA molecules that are capable of regulating gene
expression by either direct cleavage of a targeted mRNA or inhibiting translation by
interacting with the 3′ untranslated region (UTR) of a target mRNAs (Ambros 2003; Bartel.
2004; Lai 2003; He and Hannon 2004). One of the most widely studied miRNAs in lung
cancer is the lethal-7 (let-7) miRNA family (Reinhart et al. 2002; Osada and Takahashi 2010).
Functioning as a tumor suppressor, let-7 has been shown to regulate NRAS, KRAS, and
HMGA2 via binding to their respective 3′ UTRs. It is frequently under-expressed in lung
tumors, particularly NSCLC, compared with normal lung, and decreased expression has
also been associated with poor prognosis (Takamizawa et al. 2004). Induction of let-7
miRNA expression has been found to inhibit growth in vitro and reduce tumor development
in a murine model of lung cancer (Esquela-Kerscher et al. 2008; Kumar et al. 2008; Trang et
al. 2010). In addition to let-7, other miRNAs with suggested tumor-suppressing effects in
lung cancer include miR-126, miR-29a/b/c, miR-1 (Leidinger et al. 2011), and recently, miR-
128b was reported to be a direct regulator of EGFR with frequent LOH occurring in NSCLC
cell lines (Weiss et al. 2008). Oncogenic miRNAs found to be over-expressed in lung cancer
include the miR-17-92 cluster miR-205, miR-21, and miR-155 (Leidinger et al. 2011). In
collaboration with Dr. Greg Hannon’s laboratory at CSHL and Dr. Stiles at Cornell Weill
Medical Center our laboratory has recently identified novel mir-RNA associated with
increased metastatic spread.
1.9 Conclusions
Genetic and epigenetic mechanisms underlying lung cancer development and
progression continue to emerge. Over the past decade, research has been spearheaded by
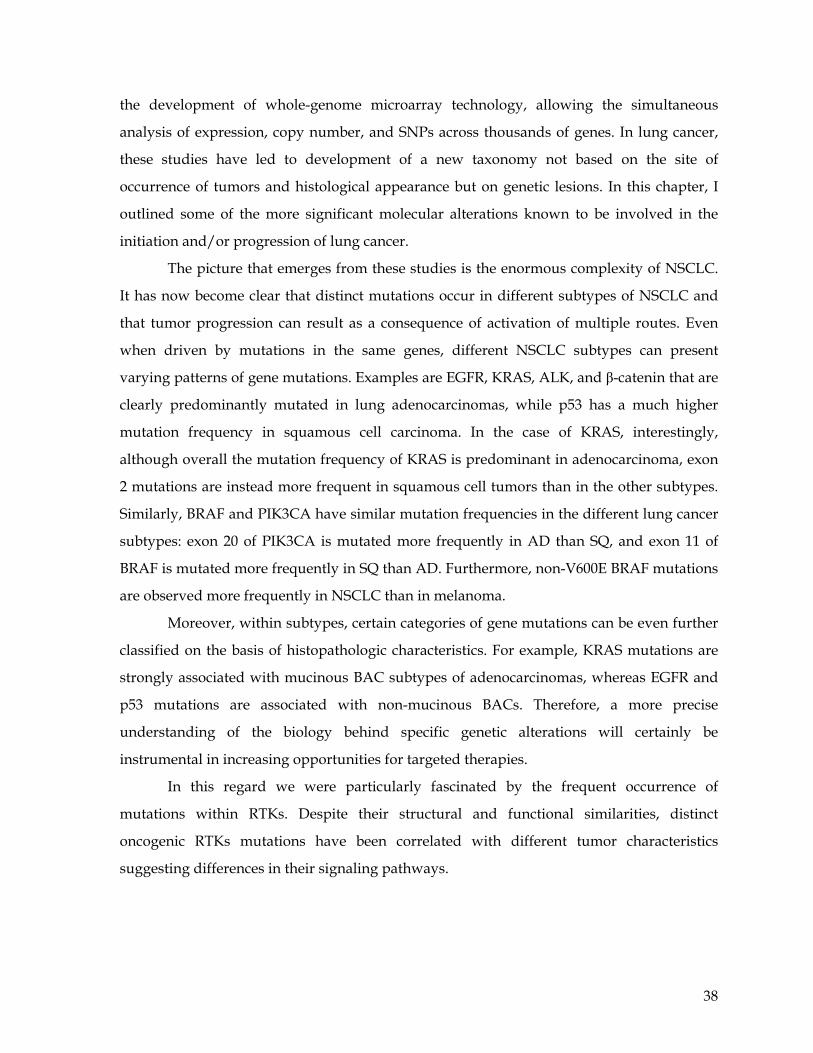
38
the development of whole-genome microarray technology, allowing the simultaneous
analysis of expression, copy number, and SNPs across thousands of genes. In lung cancer,
these studies have led to development of a new taxonomy not based on the site of
occurrence of tumors and histological appearance but on genetic lesions. In this chapter, I
outlined some of the more significant molecular alterations known to be involved in the
initiation and/or progression of lung cancer.
The picture that emerges from these studies is the enormous complexity of NSCLC.
It has now become clear that distinct mutations occur in different subtypes of NSCLC and
that tumor progression can result as a consequence of activation of multiple routes. Even
when driven by mutations in the same genes, different NSCLC subtypes can present
varying patterns of gene mutations. Examples are EGFR, KRAS, ALK, and β-catenin that are
clearly predominantly mutated in lung adenocarcinomas, while p53 has a much higher
mutation frequency in squamous cell carcinoma. In the case of KRAS, interestingly,
although overall the mutation frequency of KRAS is predominant in adenocarcinoma, exon
2 mutations are instead more frequent in squamous cell tumors than in the other subtypes.
Similarly, BRAF and PIK3CA have similar mutation frequencies in the different lung cancer
subtypes: exon 20 of PIK3CA is mutated more frequently in AD than SQ, and exon 11 of
BRAF is mutated more frequently in SQ than AD. Furthermore, non-V600E BRAF mutations
are observed more frequently in NSCLC than in melanoma.
Moreover, within subtypes, certain categories of gene mutations can be even further
classified on the basis of histopathologic characteristics. For example, KRAS mutations are
strongly associated with mucinous BAC subtypes of adenocarcinomas, whereas EGFR and
p53 mutations are associated with non-mucinous BACs. Therefore, a more precise
understanding of the biology behind specific genetic alterations will certainly be
instrumental in increasing opportunities for targeted therapies.
In this regard we were particularly fascinated by the frequent occurrence of
mutations within RTKs. Despite their structural and functional similarities, distinct
oncogenic RTKs mutations have been correlated with different tumor characteristics
suggesting differences in their signaling pathways.
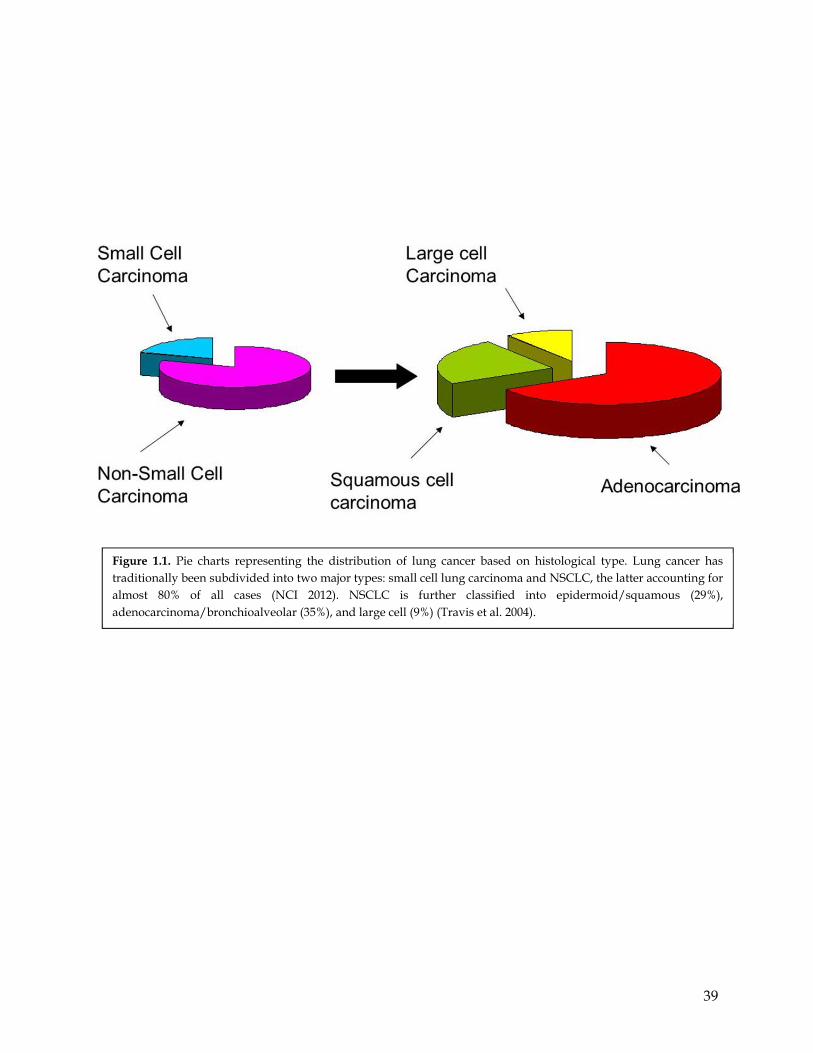
39
Figure 1.1. Pie charts representing the distribution of lung cancer based on histological type. Lung cancer has traditionally been subdivided into two major types: small cell lung carcinoma and NSCLC, the latter accounting for almost 80% of all cases (NCI 2012). NSCLC is further classified into epidermoid/squamous (29%), adenocarcinoma/bronchioalveolar (35%), and large cell (9%) (Travis et al. 2004).
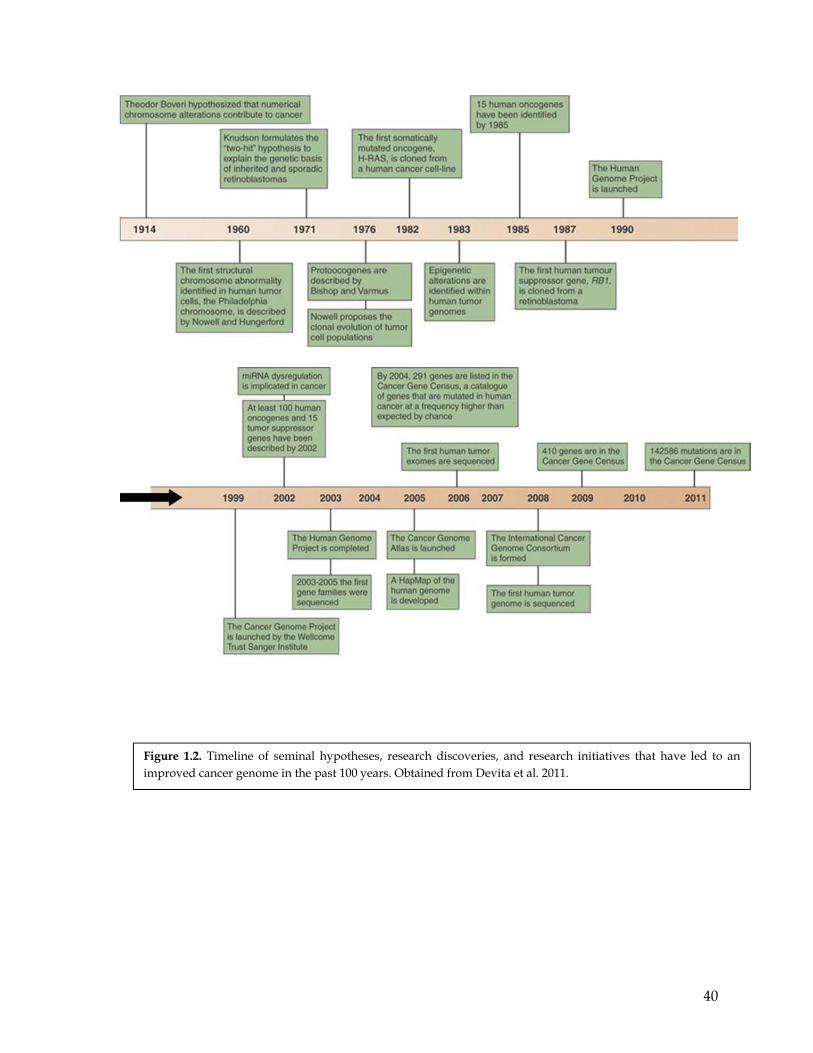
40
Figure 1.2. Timeline of seminal hypotheses, research discoveries, and research initiatives that have led to an improved cancer genome in the past 100 years. Obtained from Devita et al. 2011.
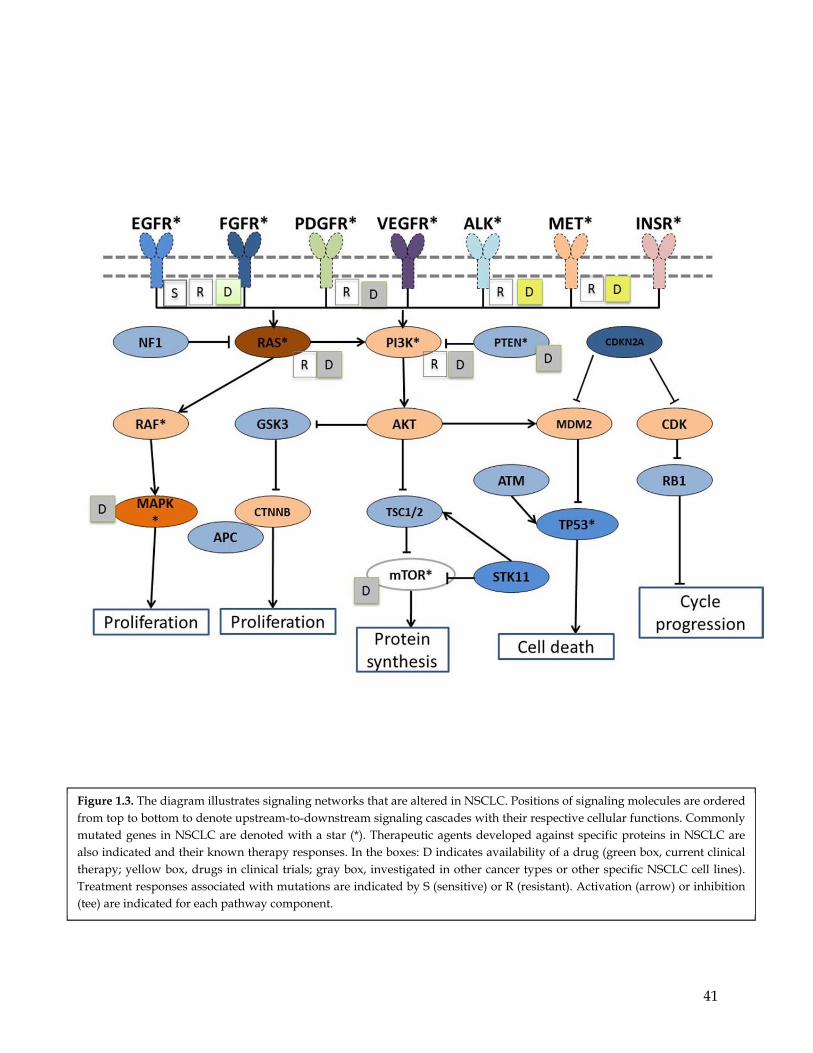
41
Figure 1.3. The diagram illustrates signaling networks that are altered in NSCLC. Positions of signaling molecules are ordered from top to bottom to denote upstream-to-downstream signaling cascades with their respective cellular functions. Commonly mutated genes in NSCLC are denoted with a star (*). Therapeutic agents developed against specific proteins in NSCLC are also indicated and their known therapy responses. In the boxes: D indicates availability of a drug (green box, current clinical therapy; yellow box, drugs in clinical trials; gray box, investigated in other cancer types or other specific NSCLC cell lines). Treatment responses associated with mutations are indicated by S (sensitive) or R (resistant). Activation (arrow) or inhibition (tee) are indicated for each pathway component.
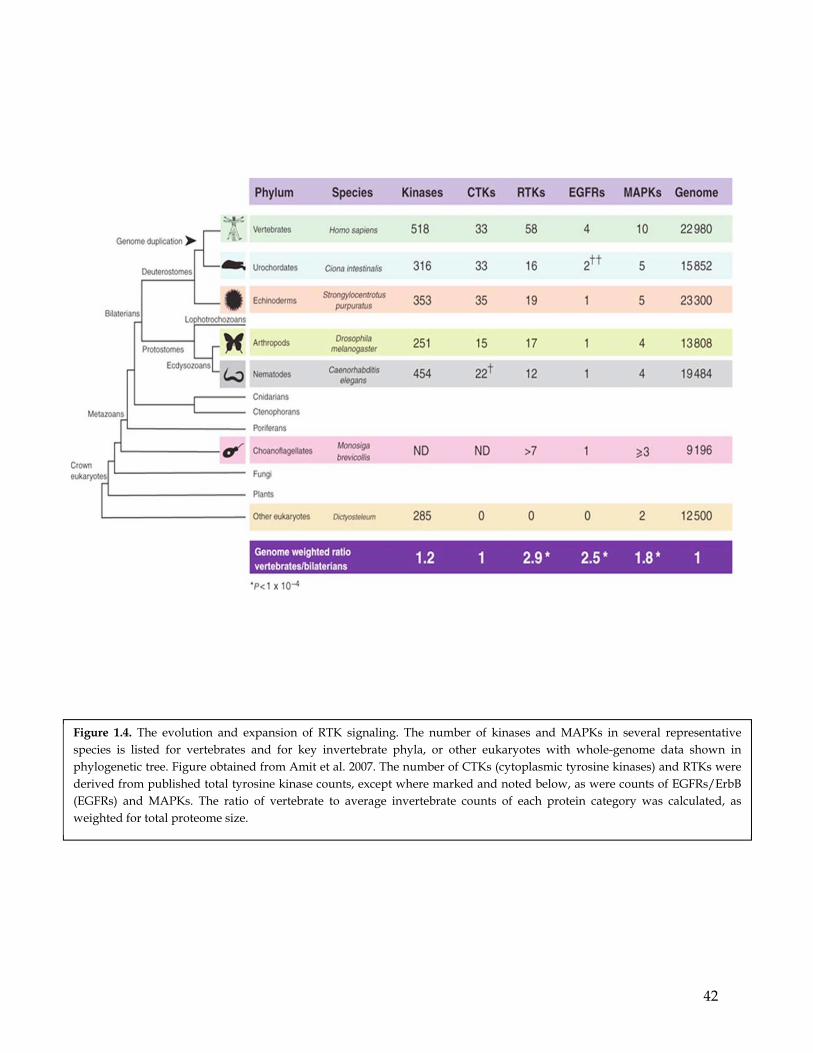
42
Figure 1.4. The evolution and expansion of RTK signaling. The number of kinases and MAPKs in several representative species is listed for vertebrates and for key invertebrate phyla, or other eukaryotes with whole-genome data shown in phylogenetic tree. Figure obtained from Amit et al. 2007. The number of CTKs (cytoplasmic tyrosine kinases) and RTKs were derived from published total tyrosine kinase counts, except where marked and noted below, as were counts of EGFRs/ErbB (EGFRs) and MAPKs. The ratio of vertebrate to average invertebrate counts of each protein category was calculated, as weighted for total proteome size.
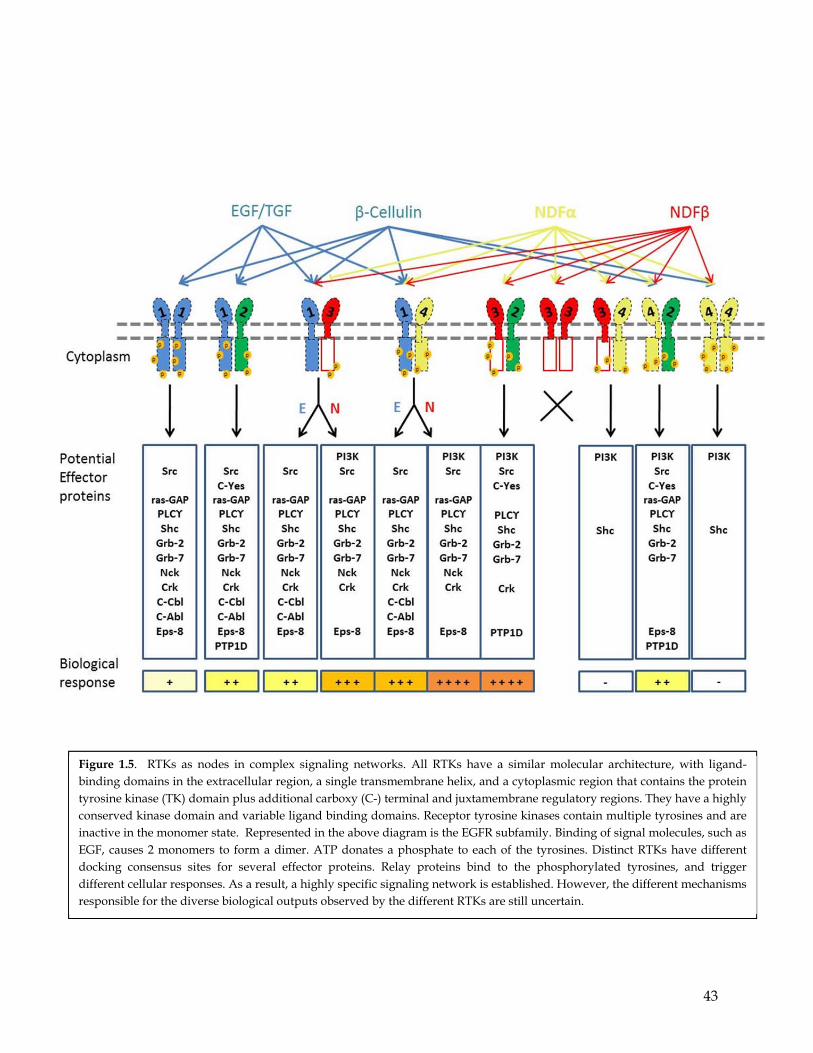
43
Figure 1.5. RTKs as nodes in complex signaling networks. All RTKs have a similar molecular architecture, with ligand-binding domains in the extracellular region, a single transmembrane helix, and a cytoplasmic region that contains the protein tyrosine kinase (TK) domain plus additional carboxy (C-) terminal and juxtamembrane regulatory regions. They have a highly conserved kinase domain and variable ligand binding domains. Receptor tyrosine kinases contain multiple tyrosines and are inactive in the monomer state. Represented in the above diagram is the EGFR subfamily. Binding of signal molecules, such as EGF, causes 2 monomers to form a dimer. ATP donates a phosphate to each of the tyrosines. Distinct RTKs have different docking consensus sites for several effector proteins. Relay proteins bind to the phosphorylated tyrosines, and trigger different cellular responses. As a result, a highly specific signaling network is established. However, the different mechanisms responsible for the diverse biological outputs observed by the different RTKs are still uncertain.

44
SECTION II
RESULTS
45
Synopsis
Since their initial discovery, increasing amounts of data implicated the deregulation
and malfunctioning of RTKs in a variety of diseases (Gschewind 2004), including lung
cancer (Ding et al. 2008). Therefore, a detailed knowledge of RTK biology is crucial for
understanding tumorigenesis and developing effective target therapies.
At first glance, all RTKs appear to be highly similar. As mentioned in the previous
section, all possess a highly homologous tyrosine-kinase domain, activate in essence the
same signaling pathways (i.e., PI3K, MAPK, and PLC gamma), and regulate very similar
cell functions (i.e., growth, motility, and differentiation). However, several experiments
have indicated specificity in the biological activities of RTKs (i.e., mesenchymal phenotype
and sensitivity to selective RTK inhibitors). In 1995, Soriano et al. utilized as an experimental
system normal mouse mammary gland cells and compared the activity of different RTKs in
inducing branching-like structures in a 3D gel composed of collagen and laminin. The only
RTK capable of forming branching duct-like structures was c-MET (Soriano et al. 1995)
Functionally, differences among RTKs have been also suggested in vivo. In the case
of NSCLC, for example, the activation of PDGFR-alpha leads to the acquisition of
mesenchymal-like features, increased metastatic potential, and has been associated with
poor tumor prognosis (Gotzmann et al. 2006). In addition, overexpression of PDGFR-alpha
has also been observed in cells that have become resistant to erlotinib treatment (Pao et al.
2004). For this reason, I primarily focused on characterizing PDGFR-alpha kinase (referred
to as PDGFR).
While it is now widely accepted that distinct RTKs have specific biological function,
the molecular mechanisms behind their specificity are still a matter of debate. As part of
current theories proposed to explain the diverse biological outputs of RTKs, it has been
suggested that the specificity of RTKs depends on temporal and spatial control of enzyme
activity as well as on the selective interaction of RTKs with defined effector molecules.
Alternatively, we hypothesized that biological differences among RTKs can be explained by
distinct substrate specificity.
To better understand differences among RTKs and in order to provide experimental
evidence in support of our hypothesis, during the course of my thesis studies, I utilized a
46
multifaceted approach that included biochemical (Chapter 2.1), phospho-proteomic
(Appendix 1), and functional genomic (Appendix 2) methodologies.
We found that indeed EGFR and PDGFR as well other RTKs are characterized by
distinct substrate specificity (Chapter 2). By using bioinformatics tools we then identified
SOCS3 as one protein differentially phosphorylated both in vitro and in vivo by these two
RTKs (Chapter 2). The phosphorylation of SOCS3 results in ubiquitin-proteasomal mediated
degradation of SOCS3 and in a sustained IL-6 mediated signaling (Chapter 3). As a result,
cells acquire mesenchymal and pro-metastatic features (Chapter 4).

47
CHAPTER 2
48
Chapter 2: Oncogenic RTKs have distinct substrate preferences
2.1 Summary
At first glance, all RTKs appear to be highly similar. However, several experiments
have indicated specificity in the biological activities of RTKs. As part of current theories
proposed to explain the diverse biological outputs of RTKs, it has been suggested that the
specificity of RTKs depends on temporal and spatial control of enzyme activity as well as on
the selective interaction of RTKs with defined effector molecules. As an alternative, we
hypothesized that biological differences among RTKs can be explained by distinct substrate
specificity. We found that EGFR and PDGFR as well other RTKs are characterized by
distinct substrate specificity. Interestingly RTKs with activity that leads to EMT and
erlotinib resistance have similar substrate preferences.
2.2 Highlights
PDGFR and EGFR are characterized by defined substrate specificities
RTKs with activity that leads to EMT and erlotinib resistance have similar substrate
preferences
2.3 Introduction
It is now widely accepted that, despite their high homology, RTKs are characterized
by distinct biological functions. We hypothesized that distinct substrate specificity among
RTKs can explain their diverse biological outputs.
In the past few years, several techniques such as mass spectrometry (MS), protein
chips, computational algorithms, and live cell imaging have been employed to identify and
study kinase–substrate relationships. These have provided groundbreaking information
regarding differences in signaling pathways activated by different RTKs. For instance, MS
has been extensively applied to identify proteins that are phosphorylated by a given
tyrosine kinase. Phosphoproteomic studies of Src, Her2/neu, EGFR, and insulin receptor
have recently been reported (Blagoev et al. 2004; Ibarrola et al. 2004; Kratchmarova et al.
2005; Zhang et al. 2005; Bose et al. 2006; Qiao et al. 2006; Schmelzle et al. 2006; Wang et al.
49
2006). Furthermore, substrates of the Bcr-Abl fusion protein have also been inferred from
proteomic studies with Imatinib (Gleevec®), a Bcr-Abl-directed small-molecule kinase
inhibitor (Goss et al. 2006; Liang et al. 2006). Although MS based methodologies can lead to
the rapid isolation and identification of phosphorylated proteins in an unbiased fashion,
they are incapable of distinguishing between proteins that are direct substrates and those
that are phosphorylated by downstream kinases. To improve the temporal resolution of MS
experiments, methods based on stable isotope labeling have been developed for quantitative
analysis prior to MS use. In this setting, proteins are labeled with different stable isotopes
(Silac) or chemical labels (iTRAQ), either during cell culture or after cells have been lysed
(reviewed in Johnson and White, 2012). Although in principle, the use of chemical
complementation has the potential to provide temporal and spatial connection to validate
the kinase–substrate linkage, this technology has not been developed to allow for sufficient
in-depth analysis (Shogren-Knaak et al. 2001; Qiao et al. 2006).
As an alternative, Cantley and colleagues developed a blueprint that provided a
major breakthrough in understanding the peptide specificity of PTKs (Songyang et al.
1994a). Their method is based on the phosphorylation of degenerate peptide libraries. The
kinase of interest is incubated in solution with a very large number of peptides, all
containing a single fixed tyrosine within a degenerate peptide sequence made up of all
possible amino acids. Only those peptides that contain favorable amino acids surround the
fixed phospho-acceptor site and are phosphorylated by the kinase. In the first iteration of
this method, the phosphorylated peptides are separated from the bulk of non-
phosphorylated peptides and sequenced by Edman degradation. The affinity of the kinase
for any amino acid at each position is then determined by comparing the ratio of amino acid
present at each position in the phosphorylated peptides versus the starting peptide library
mixture.
In practice, the technique Cantley’s lab developed has proven very challenging and
time consuming, mainly due to difficulties in the separation of the phosphorylated peptides
from the non-phosphorylated peptide background. One way around these problems
involves the use of peptides that are immobilized on a solid support. The optimal motif
phosphorylated by the kinase in this case can be easily determined by incubating the
immobilized peptides with the kinase of interest in the presence of [32P] ATP. The amount
50
of radioactivity incorporated into the solid support at each position in the array indicates
whether the motifs are optimal. Yet this technique also has several limitations because of
high background signals caused by non-specific association between radio-labeled ATP on
the support membrane. Non-specific interaction of the kinase with the membrane can also
result in not homogenous kinase distribution.
To overcome to these hurdles, Cantley and colleagues recently optimized a
methodology that uses the best aspects of both the solution-phase and the solid-support
approaches (Hutti et al. 2004). In this case a library containing 198 separate degenerate
peptide mixtures is used, each mixture containing a fixed serine or threonine residue and a
second single fixed amino acid in any one of nine flanking positions. The second fixed
position includes any one of the twenty naturally occurring amino acids as well as phospho-
threonine and phosphotyrosine. The remaining flanking positions contain a degenerate
mixture of all the amino acids. Importantly, all of the libraries contain an N-terminal biotin
tag, so that the kinase reaction can be performed in solution, after which the peptides can be
spotted and captured onto avidin-coated membrane (Hutti et al. 2004). The use of solution-
phase phosphorylation eliminates many of the artifacts seen with immobilized substrates,
and the solid-phase peptide capture and quantification excludes the requirement for Edman
sequencing. This in turn eliminates the problem of phosphopeptide purification and allows
for phosphorylated amino acids to be included in the motif determination. Using this
approach, Turk and colleagues were recently able to obtain and/or confirm the
phosphorylation motifs for PKC, PKD, and type II TGF receptor kinase, as well as to
identify a new motif for the proto-oncogene kinase Pim2 (Turk et al. 2006).
By utilizing a similar technology, we were able to demonstrate that RTKs are
characterized by profound differences in their substrate specificity, hence suggesting the
intriguing hypothesis that substrate specificities can underpin the diversity in the biological
outputs of RTKs.
51
RESULTS
2.4 Peptide library design and kinase assay optimization
In order to identifying optimal phosphorylation consensus motifs for PDGFR and
EGFR, I used a positional scanning peptide library technique similar to the approach
described by Turk and colleagues (Turk et al. 2006). This biochemical approach allowed up-
front identification of potential direct substrates without the need to perform kinase assays
on individual substrates.
Specifically, a library composed of 198 separate synthetic peptides was synthesized
by Primm, Biotech Inc. (See Figure 2.1 for more details). The peptides were each nine amino
acid long and contained a central fixed tyrosine residue flanked on both sides by a mixture
of degenerate amino acids at positions -1,-2,-3,-4,-5 and +1,+2,+3,+4. The peptides also
contained a second single fixed amino acid in any one of nine flanking positions. Degenerate
positions were prepared by coupling mixtures of the twenty naturally occurring amino
acids and the second fixed position included any one of the twenty naturally occurring
amino acids. Each peptide contained an NH2-terminal biotin tag separated from the rest by
three glycine (spacer) residues (Figure 2.1). Each peptide mixture was synthesized on a scale
of 5 mg. The crude peptide mixtures were dissolved in DMSO to achieve an approximate
concentration of 25 mM. To perform the kinase assays, a working 0.5 mM aqueous peptide
solution was prepared by rapidly diluting the 25mM-stock solution with 50 mM HEPES, pH
7.4.
The enzymes used in the kinase assays were generated as GST-tagged recombinant
proteins in insect cells (Baculo virus). This system allows for the purification of the protein
under non-denaturing conditions by binding its substrate to glutathione and following with
elution. More precisely, for our studies we employed only the intracellular domain of each
RTK. In each case, glutathione purification yielded proteins that were over 80% pure by
Coomassie blue-stained SDS-PAGE gel. The identity of each kinase was sequence-verified
by digesting with trypsin followed by LS-MS/MS. The MS/MS data verified PDGFR
identity (amino acids 550-1089) from 55 peptides that covered 50% of the amino acid
sequence of the recombinant protein. In the case of EGFR (amino acids 668-1210), identity
was determined from 23 peptides that covered 29% of the amino acid sequence of the
recombinant protein.
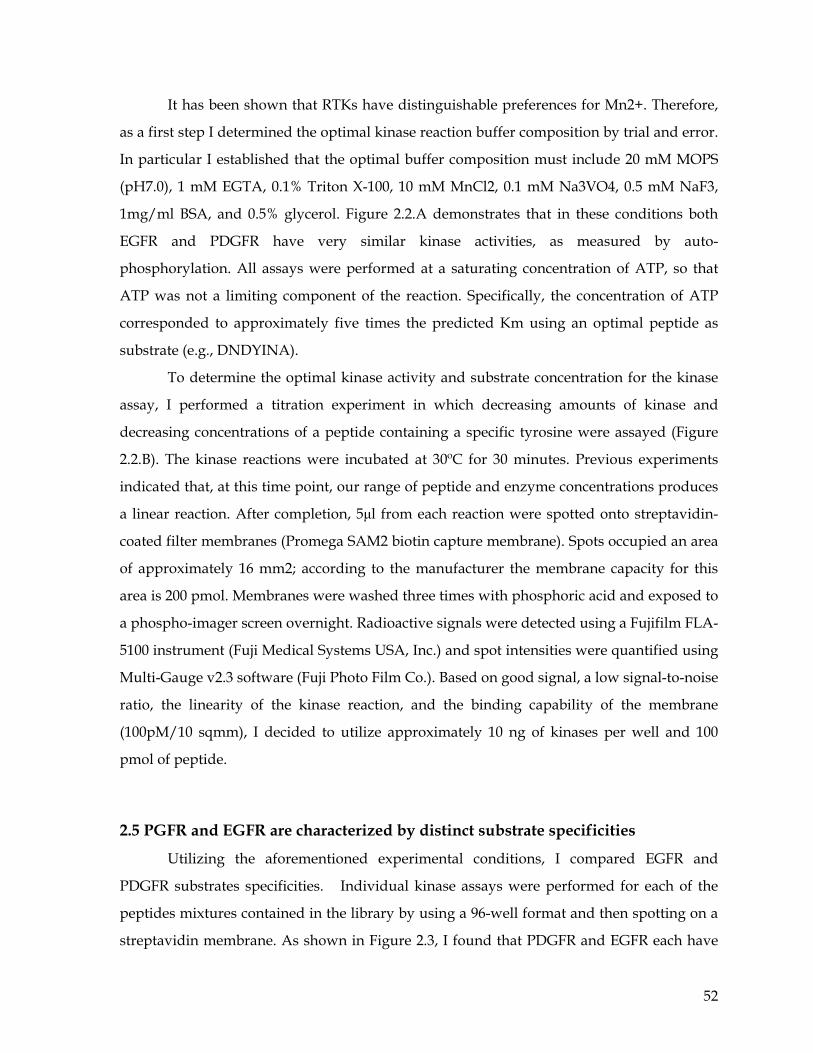
52
It has been shown that RTKs have distinguishable preferences for Mn2+. Therefore,
as a first step I determined the optimal kinase reaction buffer composition by trial and error.
In particular I established that the optimal buffer composition must include 20 mM MOPS
(pH7.0), 1 mM EGTA, 0.1% Triton X-100, 10 mM MnCl2, 0.1 mM Na3VO4, 0.5 mM NaF3,
1mg/ml BSA, and 0.5% glycerol. Figure 2.2.A demonstrates that in these conditions both
EGFR and PDGFR have very similar kinase activities, as measured by auto-
phosphorylation. All assays were performed at a saturating concentration of ATP, so that
ATP was not a limiting component of the reaction. Specifically, the concentration of ATP
corresponded to approximately five times the predicted Km using an optimal peptide as
substrate (e.g., DNDYINA).
To determine the optimal kinase activity and substrate concentration for the kinase
assay, I performed a titration experiment in which decreasing amounts of kinase and
decreasing concentrations of a peptide containing a specific tyrosine were assayed (Figure
2.2.B). The kinase reactions were incubated at 30ºC for 30 minutes. Previous experiments
indicated that, at this time point, our range of peptide and enzyme concentrations produces
a linear reaction. After completion, 5μl from each reaction were spotted onto streptavidin-
coated filter membranes (Promega SAM2 biotin capture membrane). Spots occupied an area
of approximately 16 mm2; according to the manufacturer the membrane capacity for this
area is 200 pmol. Membranes were washed three times with phosphoric acid and exposed to
a phospho-imager screen overnight. Radioactive signals were detected using a Fujifilm FLA-
5100 instrument (Fuji Medical Systems USA, Inc.) and spot intensities were quantified using
Multi-Gauge v2.3 software (Fuji Photo Film Co.). Based on good signal, a low signal-to-noise
ratio, the linearity of the kinase reaction, and the binding capability of the membrane
(100pM/10 sqmm), I decided to utilize approximately 10 ng of kinases per well and 100
pmol of peptide.
2.5 PGFR and EGFR are characterized by distinct substrate specificities
Utilizing the aforementioned experimental conditions, I compared EGFR and
PDGFR substrates specificities. Individual kinase assays were performed for each of the
peptides mixtures contained in the library by using a 96-well format and then spotting on a
streptavidin membrane. As shown in Figure 2.3, I found that PDGFR and EGFR each have
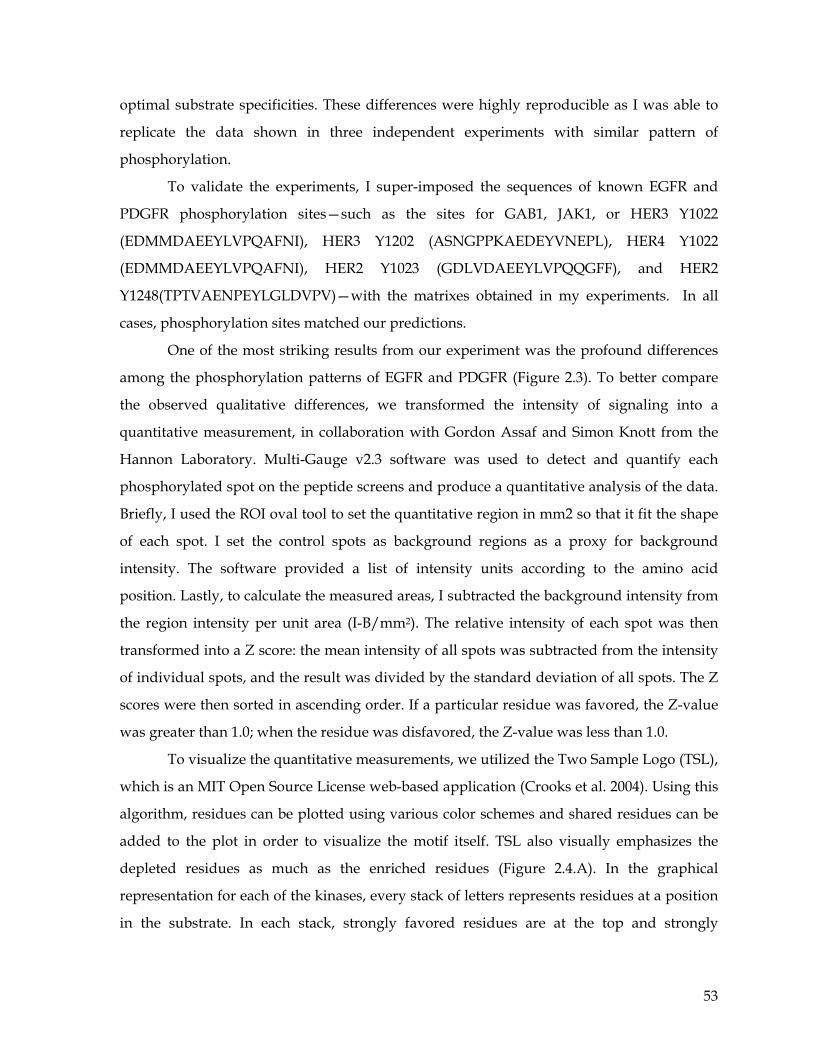
53
optimal substrate specificities. These differences were highly reproducible as I was able to
replicate the data shown in three independent experiments with similar pattern of
phosphorylation.
To validate the experiments, I super-imposed the sequences of known EGFR and
PDGFR phosphorylation sites—such as the sites for GAB1, JAK1, or HER3 Y1022
(EDMMDAEEYLVPQAFNI), HER3 Y1202 (ASNGPPKAEDEYVNEPL), HER4 Y1022
(EDMMDAEEYLVPQAFNI), HER2 Y1023 (GDLVDAEEYLVPQQGFF), and HER2
Y1248(TPTVAENPEYLGLDVPV)—with the matrixes obtained in my experiments. In all
cases, phosphorylation sites matched our predictions.
One of the most striking results from our experiment was the profound differences
among the phosphorylation patterns of EGFR and PDGFR (Figure 2.3). To better compare
the observed qualitative differences, we transformed the intensity of signaling into a
quantitative measurement, in collaboration with Gordon Assaf and Simon Knott from the
Hannon Laboratory. Multi-Gauge v2.3 software was used to detect and quantify each
phosphorylated spot on the peptide screens and produce a quantitative analysis of the data.
Briefly, I used the ROI oval tool to set the quantitative region in mm2 so that it fit the shape
of each spot. I set the control spots as background regions as a proxy for background
intensity. The software provided a list of intensity units according to the amino acid
position. Lastly, to calculate the measured areas, I subtracted the background intensity from
the region intensity per unit area (I-B/mm2). The relative intensity of each spot was then
transformed into a Z score: the mean intensity of all spots was subtracted from the intensity
of individual spots, and the result was divided by the standard deviation of all spots. The Z
scores were then sorted in ascending order. If a particular residue was favored, the Z-value
was greater than 1.0; when the residue was disfavored, the Z-value was less than 1.0.
To visualize the quantitative measurements, we utilized the Two Sample Logo (TSL),
which is an MIT Open Source License web-based application (Crooks et al. 2004). Using this
algorithm, residues can be plotted using various color schemes and shared residues can be
added to the plot in order to visualize the motif itself. TSL also visually emphasizes the
depleted residues as much as the enriched residues (Figure 2.4.A). In the graphical
representation for each of the kinases, every stack of letters represents residues at a position
in the substrate. In each stack, strongly favored residues are at the top and strongly
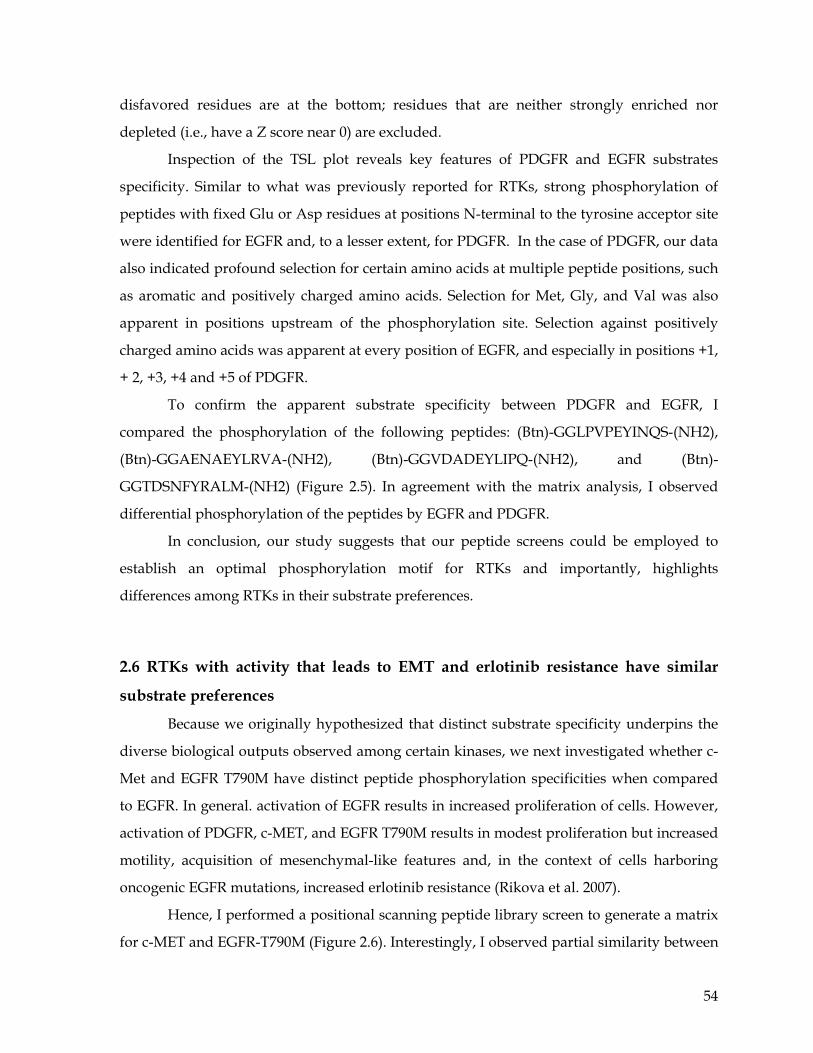
54
disfavored residues are at the bottom; residues that are neither strongly enriched nor
depleted (i.e., have a Z score near 0) are excluded.
Inspection of the TSL plot reveals key features of PDGFR and EGFR substrates
specificity. Similar to what was previously reported for RTKs, strong phosphorylation of
peptides with fixed Glu or Asp residues at positions N-terminal to the tyrosine acceptor site
were identified for EGFR and, to a lesser extent, for PDGFR. In the case of PDGFR, our data
also indicated profound selection for certain amino acids at multiple peptide positions, such
as aromatic and positively charged amino acids. Selection for Met, Gly, and Val was also
apparent in positions upstream of the phosphorylation site. Selection against positively
charged amino acids was apparent at every position of EGFR, and especially in positions +1,
+ 2, +3, +4 and +5 of PDGFR.
To confirm the apparent substrate specificity between PDGFR and EGFR, I
compared the phosphorylation of the following peptides: (Btn)-GGLPVPEYINQS-(NH2),
(Btn)-GGAENAEYLRVA-(NH2), (Btn)-GGVDADEYLIPQ-(NH2), and (Btn)-
GGTDSNFYRALM-(NH2) (Figure 2.5). In agreement with the matrix analysis, I observed
differential phosphorylation of the peptides by EGFR and PDGFR.
In conclusion, our study suggests that our peptide screens could be employed to
establish an optimal phosphorylation motif for RTKs and importantly, highlights
differences among RTKs in their substrate preferences.
2.6 RTKs with activity that leads to EMT and erlotinib resistance have similar
substrate preferences
Because we originally hypothesized that distinct substrate specificity underpins the
diverse biological outputs observed among certain kinases, we next investigated whether c-
Met and EGFR T790M have distinct peptide phosphorylation specificities when compared
to EGFR. In general. activation of EGFR results in increased proliferation of cells. However,
activation of PDGFR, c-MET, and EGFR T790M results in modest proliferation but increased
motility, acquisition of mesenchymal-like features and, in the context of cells harboring
oncogenic EGFR mutations, increased erlotinib resistance (Rikova et al. 2007).
Hence, I performed a positional scanning peptide library screen to generate a matrix
for c-MET and EGFR-T790M (Figure 2.6). Interestingly, I observed partial similarity between
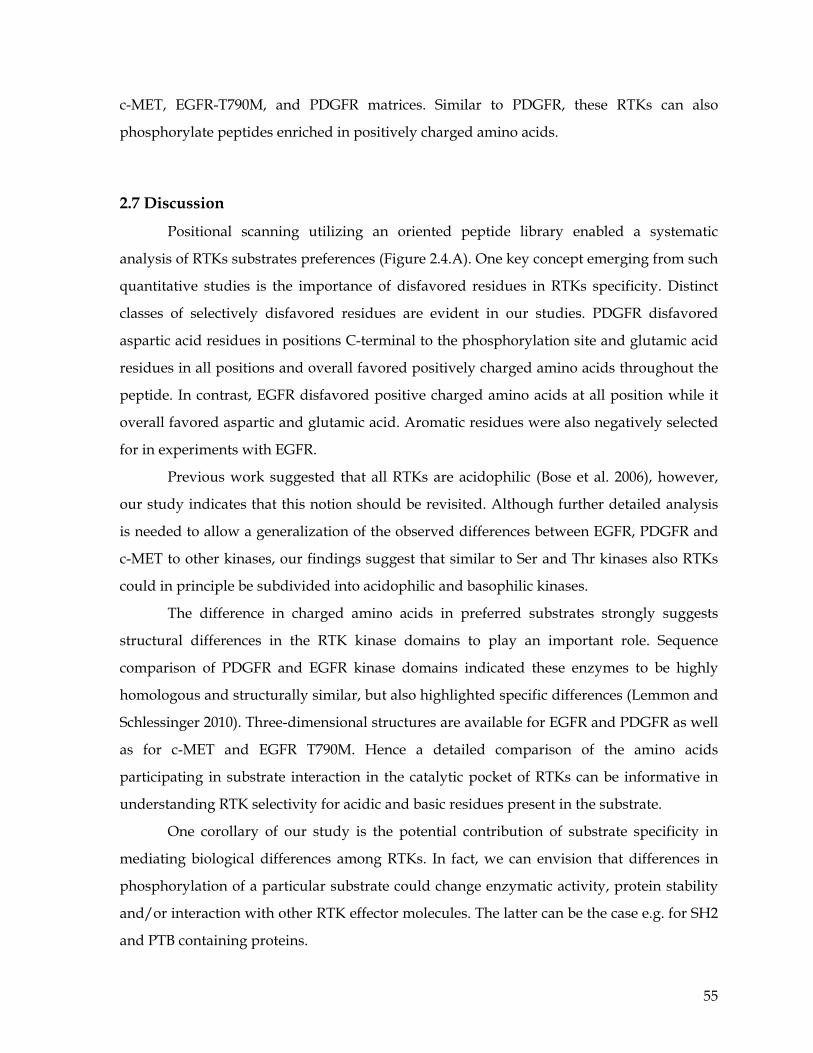
55
c-MET, EGFR-T790M, and PDGFR matrices. Similar to PDGFR, these RTKs can also
phosphorylate peptides enriched in positively charged amino acids.
2.7 Discussion
Positional scanning utilizing an oriented peptide library enabled a systematic
analysis of RTKs substrates preferences (Figure 2.4.A). One key concept emerging from such
quantitative studies is the importance of disfavored residues in RTKs specificity. Distinct
classes of selectively disfavored residues are evident in our studies. PDGFR disfavored
aspartic acid residues in positions C-terminal to the phosphorylation site and glutamic acid
residues in all positions and overall favored positively charged amino acids throughout the
peptide. In contrast, EGFR disfavored positive charged amino acids at all position while it
overall favored aspartic and glutamic acid. Aromatic residues were also negatively selected
for in experiments with EGFR.
Previous work suggested that all RTKs are acidophilic (Bose et al. 2006), however,
our study indicates that this notion should be revisited. Although further detailed analysis
is needed to allow a generalization of the observed differences between EGFR, PDGFR and
c-MET to other kinases, our findings suggest that similar to Ser and Thr kinases also RTKs
could in principle be subdivided into acidophilic and basophilic kinases.
The difference in charged amino acids in preferred substrates strongly suggests
structural differences in the RTK kinase domains to play an important role. Sequence
comparison of PDGFR and EGFR kinase domains indicated these enzymes to be highly
homologous and structurally similar, but also highlighted specific differences (Lemmon and
Schlessinger 2010). Three-dimensional structures are available for EGFR and PDGFR as well
as for c-MET and EGFR T790M. Hence a detailed comparison of the amino acids
participating in substrate interaction in the catalytic pocket of RTKs can be informative in
understanding RTK selectivity for acidic and basic residues present in the substrate.
One corollary of our study is the potential contribution of substrate specificity in
mediating biological differences among RTKs. In fact, we can envision that differences in
phosphorylation of a particular substrate could change enzymatic activity, protein stability
and/or interaction with other RTK effector molecules. The latter can be the case e.g. for SH2
and PTB containing proteins.
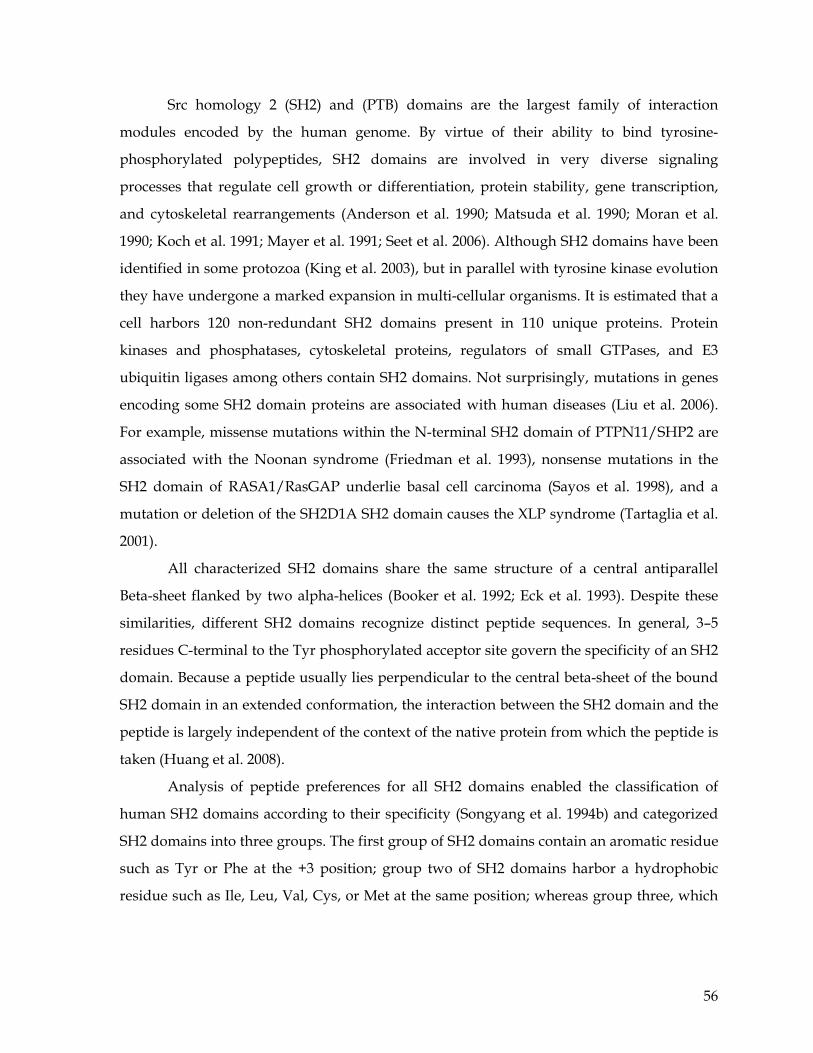
56
Src homology 2 (SH2) and (PTB) domains are the largest family of interaction
modules encoded by the human genome. By virtue of their ability to bind tyrosine-
phosphorylated polypeptides, SH2 domains are involved in very diverse signaling
processes that regulate cell growth or differentiation, protein stability, gene transcription,
and cytoskeletal rearrangements (Anderson et al. 1990; Matsuda et al. 1990; Moran et al.
1990; Koch et al. 1991; Mayer et al. 1991; Seet et al. 2006). Although SH2 domains have been
identified in some protozoa (King et al. 2003), but in parallel with tyrosine kinase evolution
they have undergone a marked expansion in multi-cellular organisms. It is estimated that a
cell harbors 120 non-redundant SH2 domains present in 110 unique proteins. Protein
kinases and phosphatases, cytoskeletal proteins, regulators of small GTPases, and E3
ubiquitin ligases among others contain SH2 domains. Not surprisingly, mutations in genes
encoding some SH2 domain proteins are associated with human diseases (Liu et al. 2006).
For example, missense mutations within the N-terminal SH2 domain of PTPN11/SHP2 are
associated with the Noonan syndrome (Friedman et al. 1993), nonsense mutations in the
SH2 domain of RASA1/RasGAP underlie basal cell carcinoma (Sayos et al. 1998), and a
mutation or deletion of the SH2D1A SH2 domain causes the XLP syndrome (Tartaglia et al.
2001).
All characterized SH2 domains share the same structure of a central antiparallel
Beta-sheet flanked by two alpha-helices (Booker et al. 1992; Eck et al. 1993). Despite these
similarities, different SH2 domains recognize distinct peptide sequences. In general, 3–5
residues C-terminal to the Tyr phosphorylated acceptor site govern the specificity of an SH2
domain. Because a peptide usually lies perpendicular to the central beta-sheet of the bound
SH2 domain in an extended conformation, the interaction between the SH2 domain and the
peptide is largely independent of the context of the native protein from which the peptide is
taken (Huang et al. 2008).
Analysis of peptide preferences for all SH2 domains enabled the classification of
human SH2 domains according to their specificity (Songyang et al. 1994b) and categorized
SH2 domains into three groups. The first group of SH2 domains contain an aromatic residue
such as Tyr or Phe at the +3 position; group two of SH2 domains harbor a hydrophobic
residue such as Ile, Leu, Val, Cys, or Met at the same position; whereas group three, which
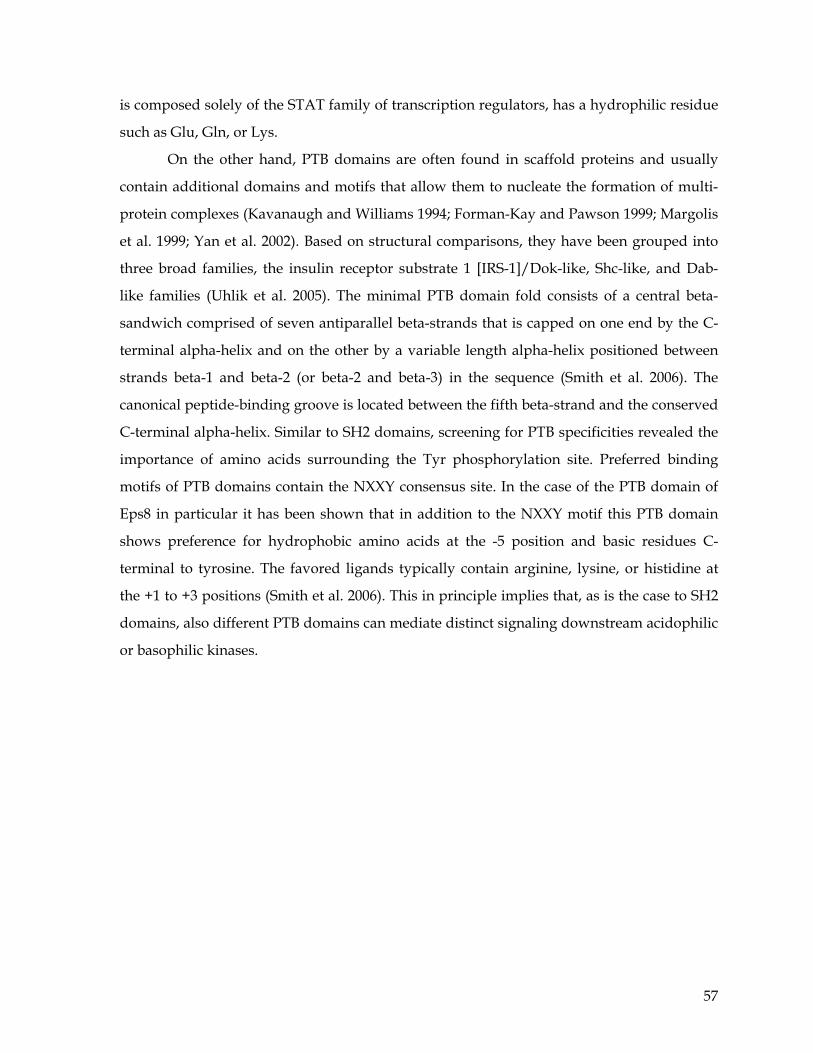
57
is composed solely of the STAT family of transcription regulators, has a hydrophilic residue
such as Glu, Gln, or Lys.
On the other hand, PTB domains are often found in scaffold proteins and usually
contain additional domains and motifs that allow them to nucleate the formation of multi-
protein complexes (Kavanaugh and Williams 1994; Forman-Kay and Pawson 1999; Margolis
et al. 1999; Yan et al. 2002). Based on structural comparisons, they have been grouped into
three broad families, the insulin receptor substrate 1 [IRS-1]/Dok-like, Shc-like, and Dab-
like families (Uhlik et al. 2005). The minimal PTB domain fold consists of a central beta-
sandwich comprised of seven antiparallel beta-strands that is capped on one end by the C-
terminal alpha-helix and on the other by a variable length alpha-helix positioned between
strands beta-1 and beta-2 (or beta-2 and beta-3) in the sequence (Smith et al. 2006). The
canonical peptide-binding groove is located between the fifth beta-strand and the conserved
C-terminal alpha-helix. Similar to SH2 domains, screening for PTB specificities revealed the
importance of amino acids surrounding the Tyr phosphorylation site. Preferred binding
motifs of PTB domains contain the NXXY consensus site. In the case of the PTB domain of
Eps8 in particular it has been shown that in addition to the NXXY motif this PTB domain
shows preference for hydrophobic amino acids at the -5 position and basic residues C-
terminal to tyrosine. The favored ligands typically contain arginine, lysine, or histidine at
the +1 to +3 positions (Smith et al. 2006). This in principle implies that, as is the case to SH2
domains, also different PTB domains can mediate distinct signaling downstream acidophilic
or basophilic kinases.
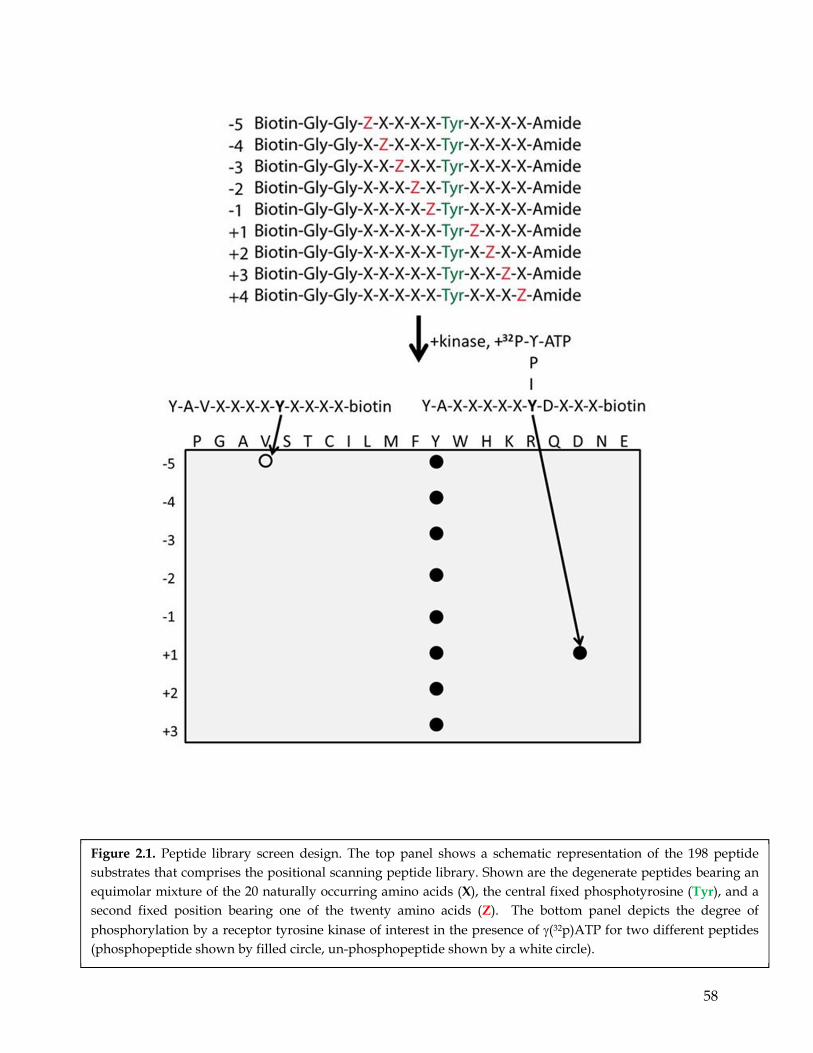
58
Figure 2.1. Peptide library screen design. The top panel shows a schematic representation of the 198 peptide substrates that comprises the positional scanning peptide library. Shown are the degenerate peptides bearing an equimolar mixture of the 20 naturally occurring amino acids (X), the central fixed phosphotyrosine (Tyr), and a second fixed position bearing one of the twenty amino acids (Z). The bottom panel depicts the degree of phosphorylation by a receptor tyrosine kinase of interest in the presence of (32p)ATP for two different peptides (phosphopeptide shown by filled circle, un-phosphopeptide shown by a white circle).
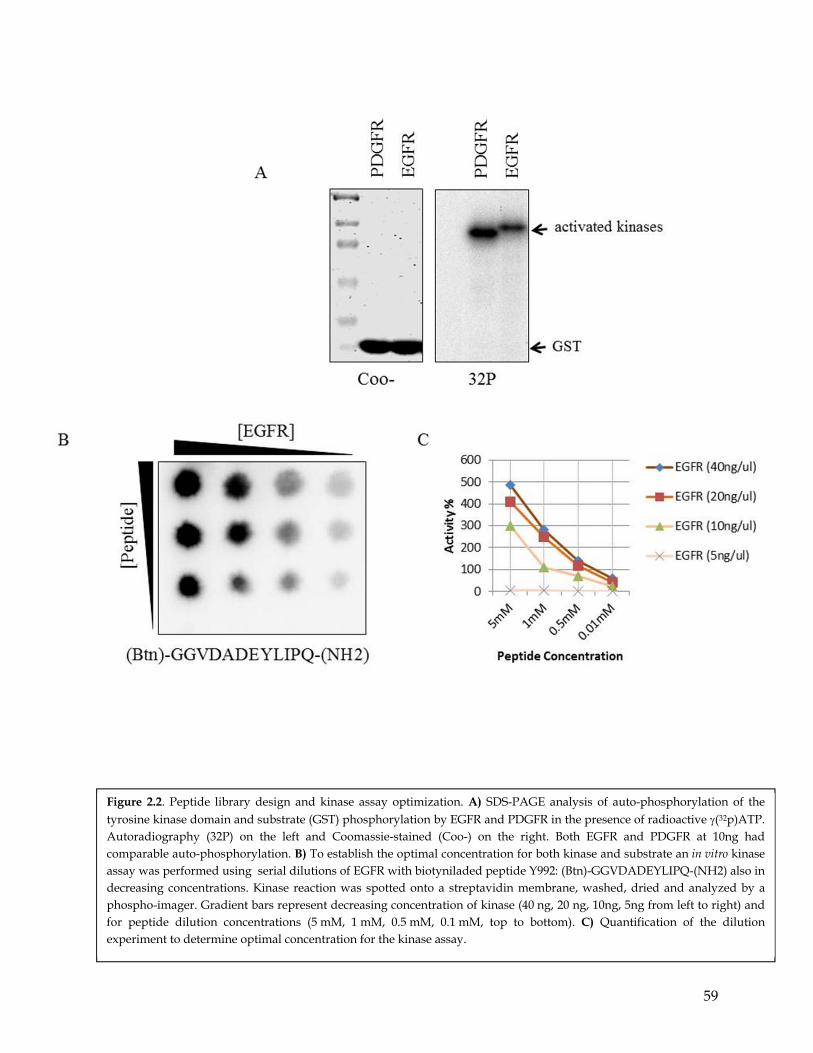
59
Figure 2.2. Peptide library design and kinase assay optimization. A) SDS-PAGE analysis of auto-phosphorylation of the tyrosine kinase domain and substrate (GST) phosphorylation by EGFR and PDGFR in the presence of radioactive (32p)ATP. Autoradiography (32P) on the left and Coomassie-stained (Coo-) on the right. Both EGFR and PDGFR at 10ng had comparable auto-phosphorylation. B) To establish the optimal concentration for both kinase and substrate an in vitro kinase assay was performed using serial dilutions of EGFR with biotyniladed peptide Y992: (Btn)-GGVDADEYLIPQ-(NH2) also in decreasing concentrations. Kinase reaction was spotted onto a streptavidin membrane, washed, dried and analyzed by a phospho-imager. Gradient bars represent decreasing concentration of kinase (40 ng, 20 ng, 10ng, 5ng from left to right) and for peptide dilution concentrations (5 mM, 1 mM, 0.5 mM, 0.1 mM, top to bottom). C) Quantification of the dilution experiment to determine optimal concentration for the kinase assay.
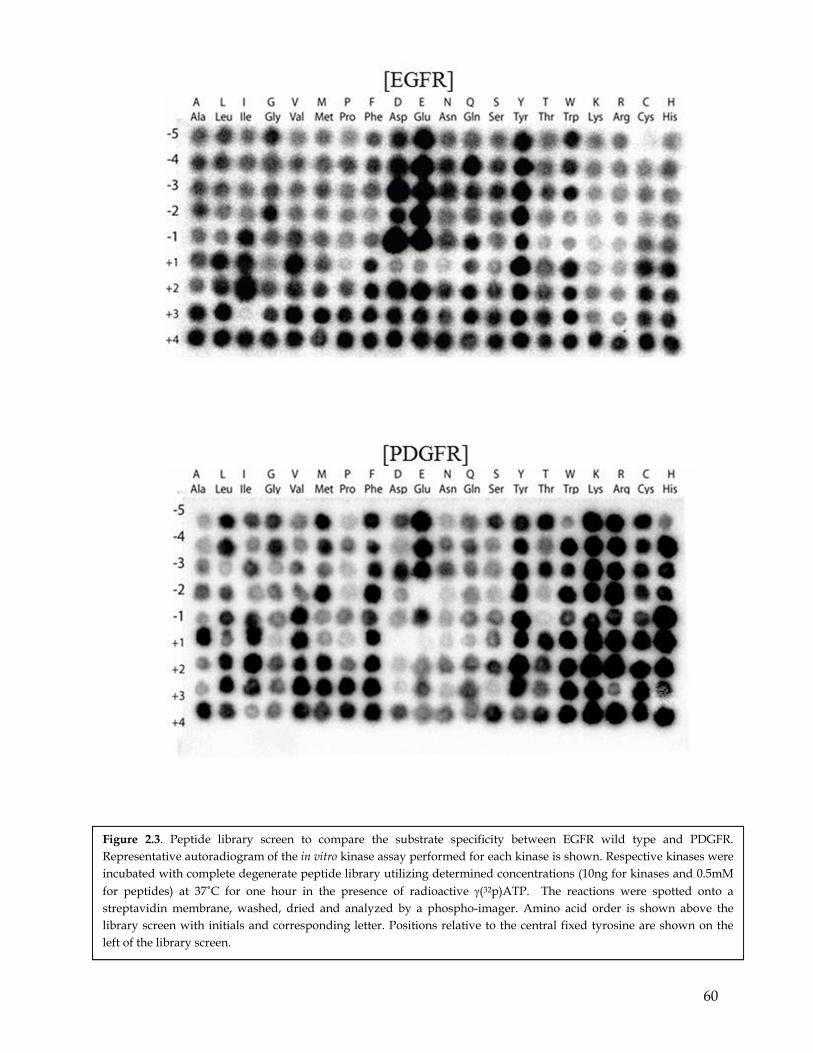
60
Figure 2.3. Peptide library screen to compare the substrate specificity between EGFR wild type and PDGFR. Representative autoradiogram of the in vitro kinase assay performed for each kinase is shown. Respective kinases were incubated with complete degenerate peptide library utilizing determined concentrations (10ng for kinases and 0.5mM for peptides) at 37˚C for one hour in the presence of radioactive (32p)ATP. The reactions were spotted onto a streptavidin membrane, washed, dried and analyzed by a phospho-imager. Amino acid order is shown above the library screen with initials and corresponding letter. Positions relative to the central fixed tyrosine are shown on the left of the library screen.
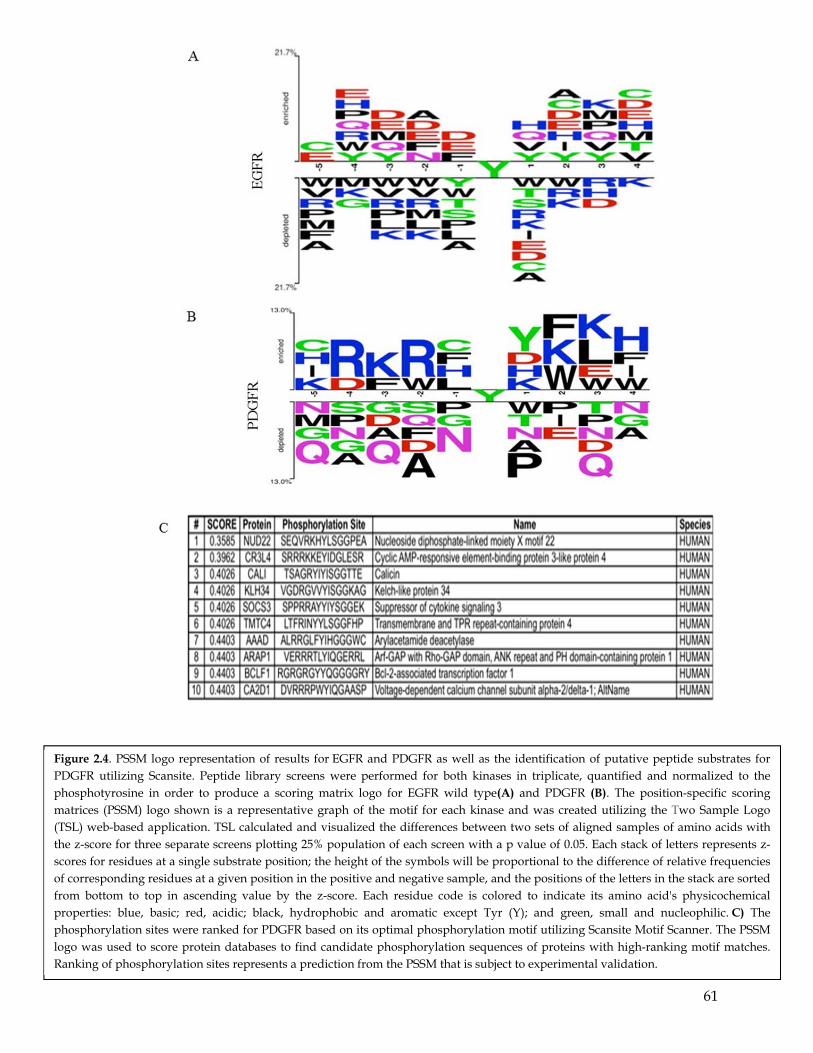
61
Figure 2.4. PSSM logo representation of results for EGFR and PDGFR as well as the identification of putative peptide substrates for PDGFR utilizing Scansite. Peptide library screens were performed for both kinases in triplicate, quantified and normalized to the phosphotyrosine in order to produce a scoring matrix logo for EGFR wild type(A) and PDGFR (B). The position-specific scoring matrices (PSSM) logo shown is a representative graph of the motif for each kinase and was created utilizing the Two Sample Logo (TSL) web-based application. TSL calculated and visualized the differences between two sets of aligned samples of amino acids with the z-score for three separate screens plotting 25% population of each screen with a p value of 0.05. Each stack of letters represents z-scores for residues at a single substrate position; the height of the symbols will be proportional to the difference of relative frequencies of corresponding residues at a given position in the positive and negative sample, and the positions of the letters in the stack are sorted from bottom to top in ascending value by the z-score. Each residue code is colored to indicate its amino acid's physicochemical properties: blue, basic; red, acidic; black, hydrophobic and aromatic except Tyr (Y); and green, small and nucleophilic. C) The phosphorylation sites were ranked for PDGFR based on its optimal phosphorylation motif utilizing Scansite Motif Scanner. The PSSM logo was used to score protein databases to find candidate phosphorylation sequences of proteins with high-ranking motif matches. Ranking of phosphorylation sites represents a prediction from the PSSM that is subject to experimental validation.
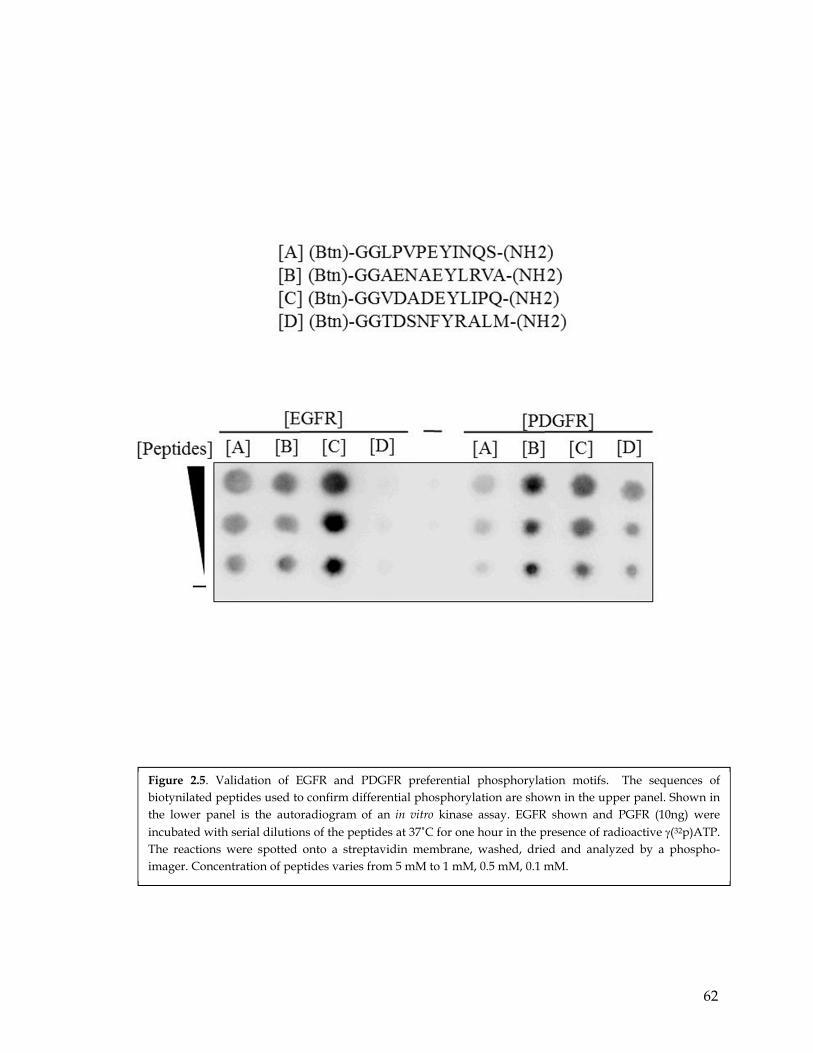
62
Figure 2.5. Validation of EGFR and PDGFR preferential phosphorylation motifs. The sequences of biotynilated peptides used to confirm differential phosphorylation are shown in the upper panel. Shown in the lower panel is the autoradiogram of an in vitro kinase assay. EGFR shown and PGFR (10ng) were incubated with serial dilutions of the peptides at 37˚C for one hour in the presence of radioactive (32p)ATP. The reactions were spotted onto a streptavidin membrane, washed, dried and analyzed by a phospho-imager. Concentration of peptides varies from 5 mM to 1 mM, 0.5 mM, 0.1 mM.
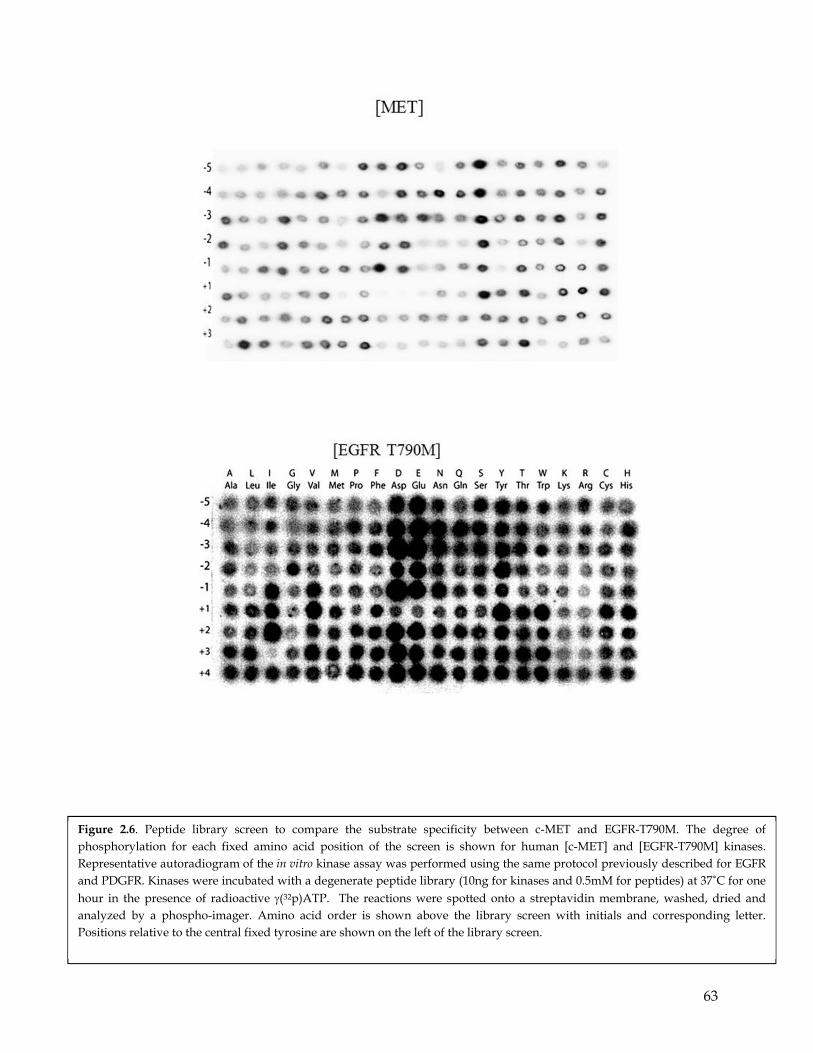
63
Figure 2.6. Peptide library screen to compare the substrate specificity between c-MET and EGFR-T790M. The degree of phosphorylation for each fixed amino acid position of the screen is shown for human [c-MET] and [EGFR-T790M] kinases. Representative autoradiogram of the in vitro kinase assay was performed using the same protocol previously described for EGFR and PDGFR. Kinases were incubated with a degenerate peptide library (10ng for kinases and 0.5mM for peptides) at 37˚C for one hour in the presence of radioactive (32p)ATP. The reactions were spotted onto a streptavidin membrane, washed, dried and analyzed by a phospho-imager. Amino acid order is shown above the library screen with initials and corresponding letter. Positions relative to the central fixed tyrosine are shown on the left of the library screen.

64
CHAPTER 3
65
Chapter 3: SOCS3 is differentially phosphorylated by PDGFR and
EGFR
3.1 Summary
The results presented in Chapter 2 indicate profound differences in substrate
specificity between EGFR and RTKs, such as PDGFR, whose activities lead to
mesenchymalization of cells, increased motility, extra-cellular matrix invasion and, in
certain contexts, erlotinib resistance. In principle, this suggests that peptide specificity could
mediate the functional diversity observed among RTKs.
To identify potential substrates differentially phosphorylated by RTKs underpinning
PDGFR mediated EMT and erlotinib resistance, we performed a bioinformatics analysis.
Among the potential candidates identified in silico, we found SOCS3.
SOCS3 is part of one of the main negative feedback mechanisms regulating IL-6
mediating signaling. Given the importance of IL-6 signaling in the control of EMT, and
erlotinib resistance, we further validated SOCS3 as a preferential substrate.
Biochemical evidence both in vitro and in vivo showed increased phosphorylation of
SOCS3 by PDGFR, c-MET, and EGFR T790M when compared to EGFR.
3.2 Highlights
Computational prediction identified SOCS3 as a potential differentially
phosphorylated substrate SOCS3 is differentially phosphorylated by EGFR and
PDGFR
MS analysis identified the SOCS3 Y165 residue as a preferential phosphorylation site
for PDGFR
Mutagenesis studies confirmed the SOCS3 Y165 residue to be a preferential
phosphorylation site for PDGFR
SOCS3 is also phosphorylated by other RTKs
66
RESULTS
3.3 Computational prediction identified SOCS3 as a potential PDGFR- and EGFR-
differentially phosphorylated substrate
To identify potential substrates that are differentially phosphorylated by PDGFR and
EFGR, we utilized a bio-informatic approach (Figure 2.4.B). Z scores computed as described
in the previous chapter were used to search the SWISS-PROT database for human proteins
containing optimal phosphorylation peptide motifs for PDGFR and EGFR. The search was
performed utilizing the option ‘Search Using Quick Matrix Method’ available through the
Scansite website (Obenauer et al. 2003). This program allows users to define an approximate
motif by specifying a short pattern of amino acids. Scansite makes a crude weight matrix
based on inputs, assigning a score of 9.0 to residues in the primary preference row, a score
of 4.5 to those in the secondary preference row and a score of 1.0 to all unspecified residues.
The result of using the Quick Matrix Method is less quantitative than a normal database
search, but in principle can yield useful results when only limited motif information is
available. Using this method, we were able to obtain the list of proteins depicted in Figure
2.4.C as potential substrates for PDGFR. Among these, we were particularly interested in
SOCS3 as a putative PDGFR substrate. SOCS3, in fact, is part of one of the main negative
feedback mechanisms regulating IL-6 mediating signaling. Given the importance of IL-6
signaling in the control of EMT, and erlotinib resistance; SOCS3 phosphorylation could in
principle explain the functional differences observed between EGFR and PDGFR.
3.4 SOCS3 is differentially phosphorylated by EGFR and PDGFR
Our in silico analysis identified residue Y165 of SOCS3 as a putative PDGFR
substrate. To validate this hypothesis, we utilized biochemical approaches.
As a first step, a recombinant SOCS3 protein was generated. I utilized an E.coli
expression vector containing a glutathione S-transferase (GST) coding sequence linked to
the open reading frame of SOCS3, as well as an empty GST-only control. This system allows
for expression and purification of the recombinant protein under non-denaturing
conditions. DNA sequencing was utilized to confirm the nature of the different constructs
and exclude the presence of mutations. Glutathione purification yielded proteins that were
67
over 80% pure by Coomassie blue-stained SDS-PAGE gel. A Western blot analysis utilizing
a SOCS3 specific antibody further confirmed the identity of the recombinant protein.
To validate the phosphorylation of SOCS3 by PDGFR, I performed a kinase assay in
which I incubated PDGFR or EGFR with either purified GST-SOCS3 or GST alone as control.
The incubations were done in the presence of radioactive ATP following procedures
described in the previous chapter. The phosphorylation was visualized via
autoradiography, and the protein quantity was visualized by Coomassie-gel staining. After
the kinase assay, the reactions were boiled and subjected to analysis by SDS-PAGE.
Radioactive signals were detected using a Fujifilm FLA-5100 instrument (Fuji Medical
Systems USA, Inc.), and band intensities were quantified using Multi-Gauge v2.3 software
(FujiFilm).
As shown in Figure 3.1B, the difference in SOCS3 phosphorylation between PDGFR
and EGFR was dramatic. A Michaelis/Menten kinetic analysis was performed to confirm
these differences. 100 ng of either EGFR or PDGFR was used to phosphorylate GST-SOCS3
WT at concentrations that ranged from 2µg to 62.5ng. The reactions were performed as
beforehand described (Figure 3.1C) and the image was analyzed using Prism 5 (GraphPad
Software). As can be observed in Figure 3.1.D, the Km values ranged from a low 8 µM for
PDGFR to a high 30µM for EGFR, indicating SOCS3 to be a preferential substrate for PDGFR
compared to EGFR.
3.5 MS analysis identify the SOCS3 Y165 residues as a preferential
phosphorylation site for PDGFR compared to EGFR
Having confirmed SOCS3 to be differentially phosphorylated by PDGFR compared
to EGFR, we next sought to determine the identity of the tyrosine(s) differentially
phosphorylated by PDGFR. SOCS3 in fact possesses multiple tyrosines that can potentially
be phosphorylated by PDGFR (depicted by red numbers in Figure 3.2.B).
When we analyzed the Z scores obtained by peptide scanning positional analysis, we
identified the Y165 residue as the preferential substrate for PDGFR. To validate this
observation, we utilized a MS based method. A kinase assay was performed as described
above in which GST-SOCS3 was incubated in the presence of cold ATP with two different
concentrations of PDGFR, EGFR, and no kinase as a negative control (Figure 3.3.A). The
68
reaction was then run in a denaturing SDS-PAGE gel and a band of the expected size (32
kDa) was excised and digested in-gel with trypsin or GluC. Peptide pellets were diluted into
25ul, and 10ul of the solution was injected into Orbitrap (LC/MS/MS) at the Stony Brook
proteomics center (Figure 3.3.B). The mass spectrometer was set up to take the top three
peptides and also constantly fragment masses of 679.33, 615.75, 671.78, as those are
theoretical 2+ masses of phosphorylated peptides (SEYphosQLVVNAVR,
TVNGHLDSYphosEK, AYYphosIYSGGEK). Peptide AYYIYSGGEK was found in similar
numbers among the four samples but the phosphorylated version was detected only in the
GST-SOCS3 sample with PDGFR (Figure 3.3.B). Interestingly, the second tyrosine in this
peptide was detected by MS to be the residue phosphorylated by PDGFR, as previously
predicted. In the case of EGFR, no significant phosphorylation on Y165 was observed.
In summary, our data indicated that the Y165 residue constitutes a novel and unique
PDGFR phosphorylation site.
3.6 Mutagenesis studies confirmed SOCS3 Y165 residues to be a preferential
phosphorylation site for PDGFR compared to EGFR
To further confirm that the tyrosine phosphorylated by PDGFR was the Y165
residue, we generated an N terminal FLAG SOCS3 recombinant protein in which the Y165
residue was changed into phenylalanine by in vitro mutagenesis (Figure 3.4.A). As a positive
control, I also generated the SOCS3 mutant Y204F, since SOCS3 was previously shown to be
a phosphorylation site. We utilized the tTiGFP vector developed in the Lowe Laboratory
that is a tetracycline-regulated mammalian expression system with a green fluorescent
protein (GFP) marker of induction for expression. The expression of genes cloned into this
vector is repressed in the absence of tetracycline and induced in the presence of tetracycline
(Yao et al. 1998). In particular, we used a modified version of the well-characterized TRE-
CMV polymerase II promoter (TREtight) that is less leaky to drive tetracycline-inducible
transcription of cDNAs in mammalian cells utilizing a retrovirus (Dickins et al2005;
Stegmeier et al. 2005; Shin et al. 2006). The transcription is driven by the reverse tetracycline
transactivator (rtTA), which is transfected in parallel and activated only in the presence of a
tetracycline analog (Gossen et al. 1995). For induction of the Tet On system we utilized
doxycycline which is similar to tetracycline in its mechanism of action, exhibits similar dose
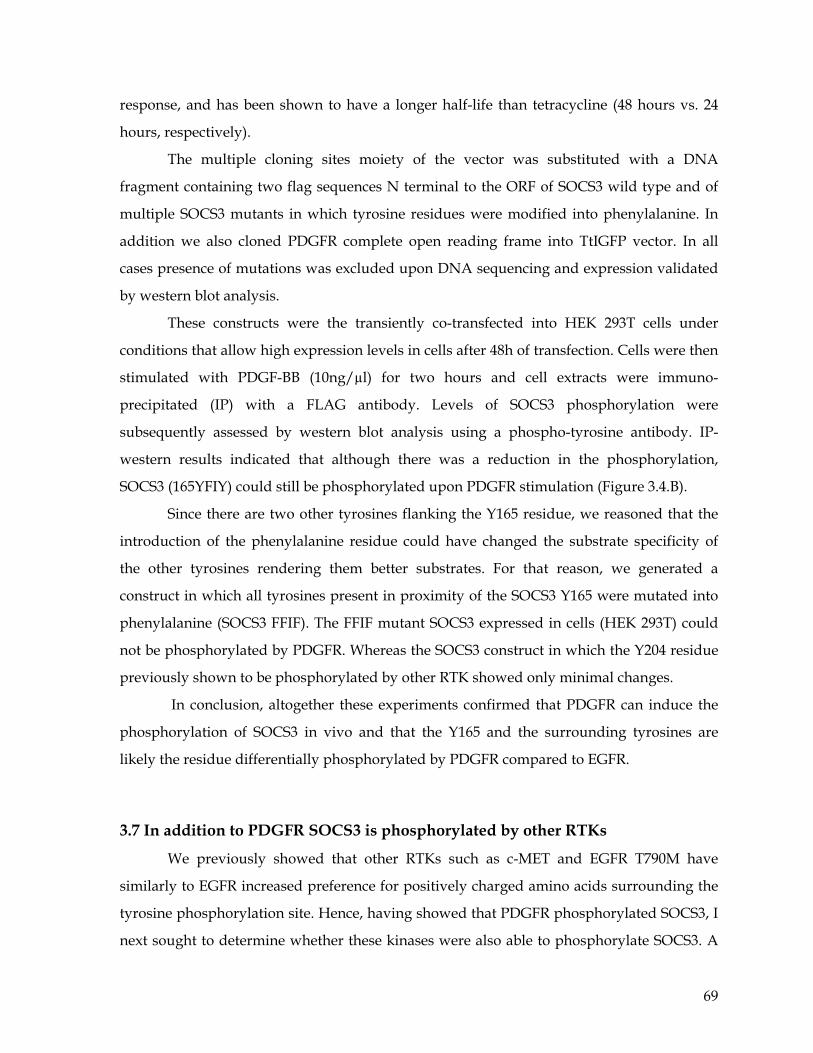
69
response, and has been shown to have a longer half-life than tetracycline (48 hours vs. 24
hours, respectively).
The multiple cloning sites moiety of the vector was substituted with a DNA
fragment containing two flag sequences N terminal to the ORF of SOCS3 wild type and of
multiple SOCS3 mutants in which tyrosine residues were modified into phenylalanine. In
addition we also cloned PDGFR complete open reading frame into TtIGFP vector. In all
cases presence of mutations was excluded upon DNA sequencing and expression validated
by western blot analysis.
These constructs were the transiently co-transfected into HEK 293T cells under
conditions that allow high expression levels in cells after 48h of transfection. Cells were then
stimulated with PDGF-BB (10ng/µl) for two hours and cell extracts were immuno-
precipitated (IP) with a FLAG antibody. Levels of SOCS3 phosphorylation were
subsequently assessed by western blot analysis using a phospho-tyrosine antibody. IP-
western results indicated that although there was a reduction in the phosphorylation,
SOCS3 (165YFIY) could still be phosphorylated upon PDGFR stimulation (Figure 3.4.B).
Since there are two other tyrosines flanking the Y165 residue, we reasoned that the
introduction of the phenylalanine residue could have changed the substrate specificity of
the other tyrosines rendering them better substrates. For that reason, we generated a
construct in which all tyrosines present in proximity of the SOCS3 Y165 were mutated into
phenylalanine (SOCS3 FFIF). The FFIF mutant SOCS3 expressed in cells (HEK 293T) could
not be phosphorylated by PDGFR. Whereas the SOCS3 construct in which the Y204 residue
previously shown to be phosphorylated by other RTK showed only minimal changes.
In conclusion, altogether these experiments confirmed that PDGFR can induce the
phosphorylation of SOCS3 in vivo and that the Y165 and the surrounding tyrosines are
likely the residue differentially phosphorylated by PDGFR compared to EGFR.
3.7 In addition to PDGFR SOCS3 is phosphorylated by other RTKs
We previously showed that other RTKs such as c-MET and EGFR T790M have
similarly to EGFR increased preference for positively charged amino acids surrounding the
tyrosine phosphorylation site. Hence, having showed that PDGFR phosphorylated SOCS3, I
next sought to determine whether these kinases were also able to phosphorylate SOCS3. A
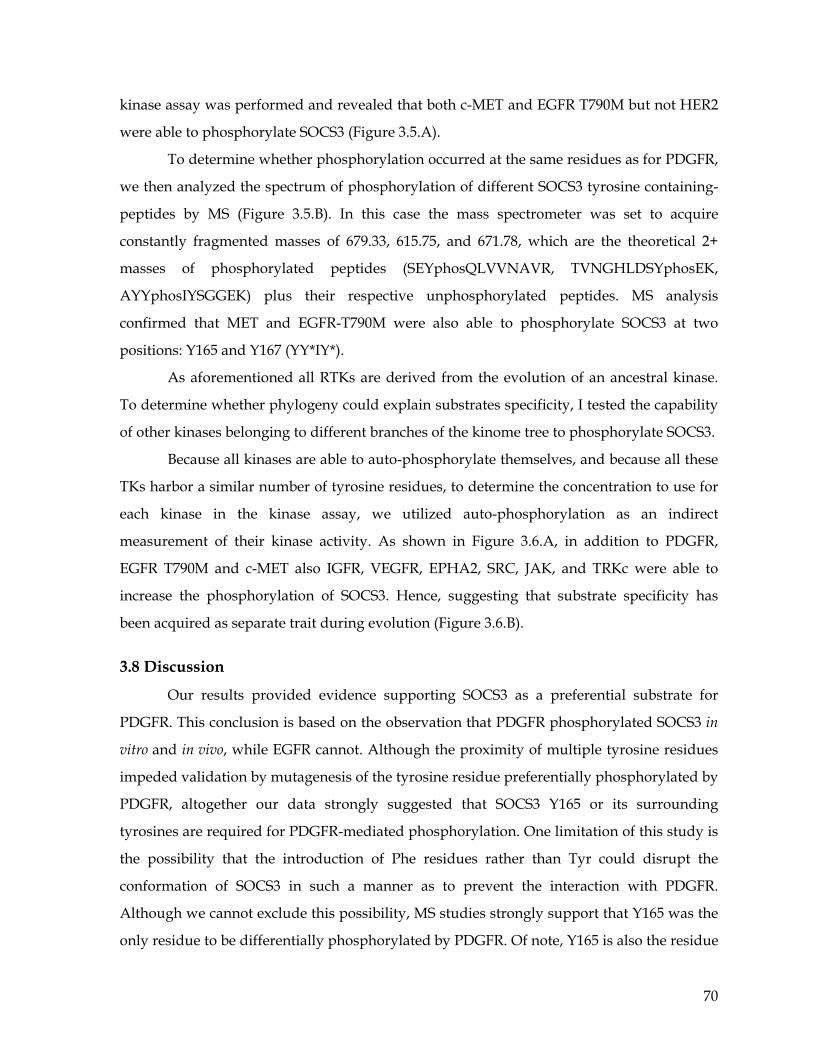
70
kinase assay was performed and revealed that both c-MET and EGFR T790M but not HER2
were able to phosphorylate SOCS3 (Figure 3.5.A).
To determine whether phosphorylation occurred at the same residues as for PDGFR,
we then analyzed the spectrum of phosphorylation of different SOCS3 tyrosine containing-
peptides by MS (Figure 3.5.B). In this case the mass spectrometer was set to acquire
constantly fragmented masses of 679.33, 615.75, and 671.78, which are the theoretical 2+
masses of phosphorylated peptides (SEYphosQLVVNAVR, TVNGHLDSYphosEK,
AYYphosIYSGGEK) plus their respective unphosphorylated peptides. MS analysis
confirmed that MET and EGFR-T790M were also able to phosphorylate SOCS3 at two
positions: Y165 and Y167 (YY*IY*).
As aforementioned all RTKs are derived from the evolution of an ancestral kinase.
To determine whether phylogeny could explain substrates specificity, I tested the capability
of other kinases belonging to different branches of the kinome tree to phosphorylate SOCS3.
Because all kinases are able to auto-phosphorylate themselves, and because all these
TKs harbor a similar number of tyrosine residues, to determine the concentration to use for
each kinase in the kinase assay, we utilized auto-phosphorylation as an indirect
measurement of their kinase activity. As shown in Figure 3.6.A, in addition to PDGFR,
EGFR T790M and c-MET also IGFR, VEGFR, EPHA2, SRC, JAK, and TRKc were able to
increase the phosphorylation of SOCS3. Hence, suggesting that substrate specificity has
been acquired as separate trait during evolution (Figure 3.6.B).
3.8 Discussion
Our results provided evidence supporting SOCS3 as a preferential substrate for
PDGFR. This conclusion is based on the observation that PDGFR phosphorylated SOCS3 in
vitro and in vivo, while EGFR cannot. Although the proximity of multiple tyrosine residues
impeded validation by mutagenesis of the tyrosine residue preferentially phosphorylated by
PDGFR, altogether our data strongly suggested that SOCS3 Y165 or its surrounding
tyrosines are required for PDGFR-mediated phosphorylation. One limitation of this study is
the possibility that the introduction of Phe residues rather than Tyr could disrupt the
conformation of SOCS3 in such a manner as to prevent the interaction with PDGFR.
Although we cannot exclude this possibility, MS studies strongly support that Y165 was the
only residue to be differentially phosphorylated by PDGFR. Of note, Y165 is also the residue
71
predicted to be most favorably phosphorylated by PDGFR based on our peptide screen
experiment.
Tyrosine residues when phosphorylated become good docking sites for
phosphotyrosine binding (PTB) and SH2 domains (Pinna and Ruzzene 1996). Analysis of
consensus binding sites for PTB and SH2 binding proteins revealed SOCS4 and SOCS5 to be
the best candidates that could bind to Y165 of SOCS3. This is particularly exciting because it
suggests that the phosphorylation of SOCS3 could in principle lead to the ubiquitination
and degradation of SOCS3.
It is common for SOCS proteins to induce the ubiquitination and degradation of
other family members. For example, this has been previously observed for SOCS1 and
SOCS3 (Rui et al. 2002). Similar to other SOCS family members, both SOCS4 and SOCS5 can
induce ubiquitination upon binding to their substrates (Yoshimura et al. 2007).
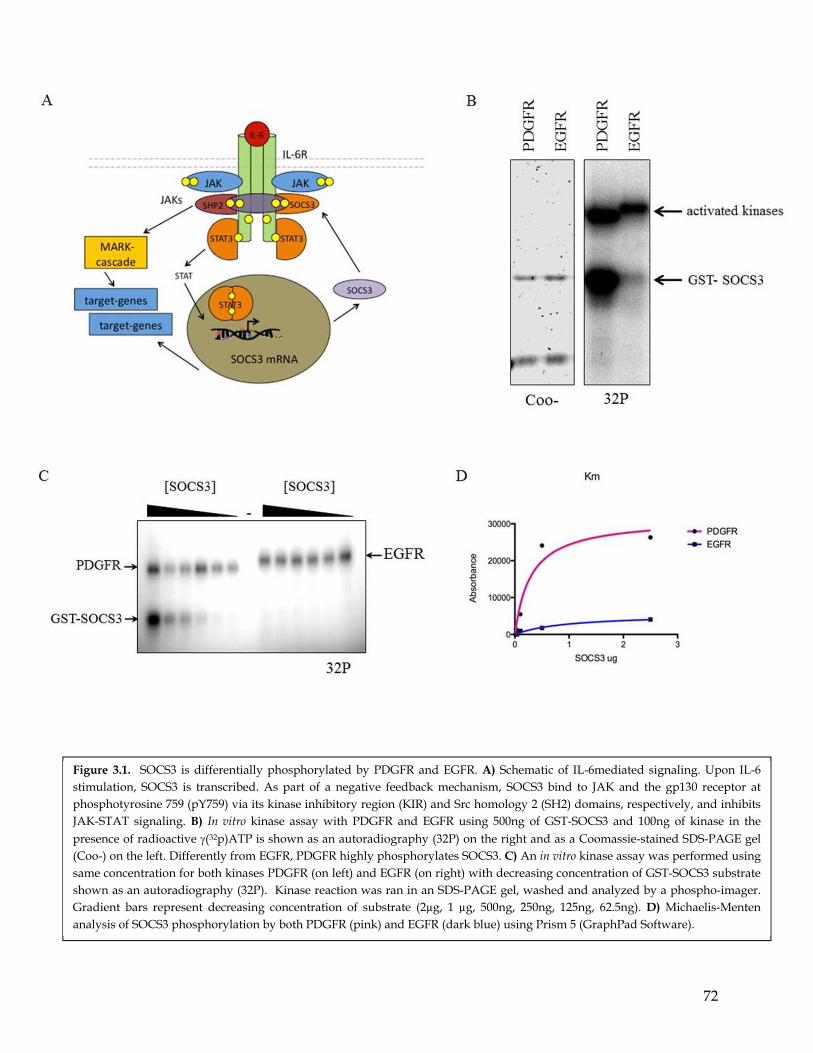
72
Figure 3.1. SOCS3 is differentially phosphorylated by PDGFR and EGFR. A) Schematic of IL-6mediated signaling. Upon IL-6 stimulation, SOCS3 is transcribed. As part of a negative feedback mechanism, SOCS3 bind to JAK and the gp130 receptor at phosphotyrosine 759 (pY759) via its kinase inhibitory region (KIR) and Src homology 2 (SH2) domains, respectively, and inhibits JAK-STAT signaling. B) In vitro kinase assay with PDGFR and EGFR using 500ng of GST-SOCS3 and 100ng of kinase in the presence of radioactive (32p)ATP is shown as an autoradiography (32P) on the right and as a Coomassie-stained SDS-PAGE gel (Coo-) on the left. Differently from EGFR, PDGFR highly phosphorylates SOCS3. C) An in vitro kinase assay was performed using same concentration for both kinases PDGFR (on left) and EGFR (on right) with decreasing concentration of GST-SOCS3 substrate shown as an autoradiography (32P). Kinase reaction was ran in an SDS-PAGE gel, washed and analyzed by a phospho-imager. Gradient bars represent decreasing concentration of substrate (2µg, 1 µg, 500ng, 250ng, 125ng, 62.5ng). D) Michaelis-Menten analysis of SOCS3 phosphorylation by both PDGFR (pink) and EGFR (dark blue) using Prism 5 (GraphPad Software).
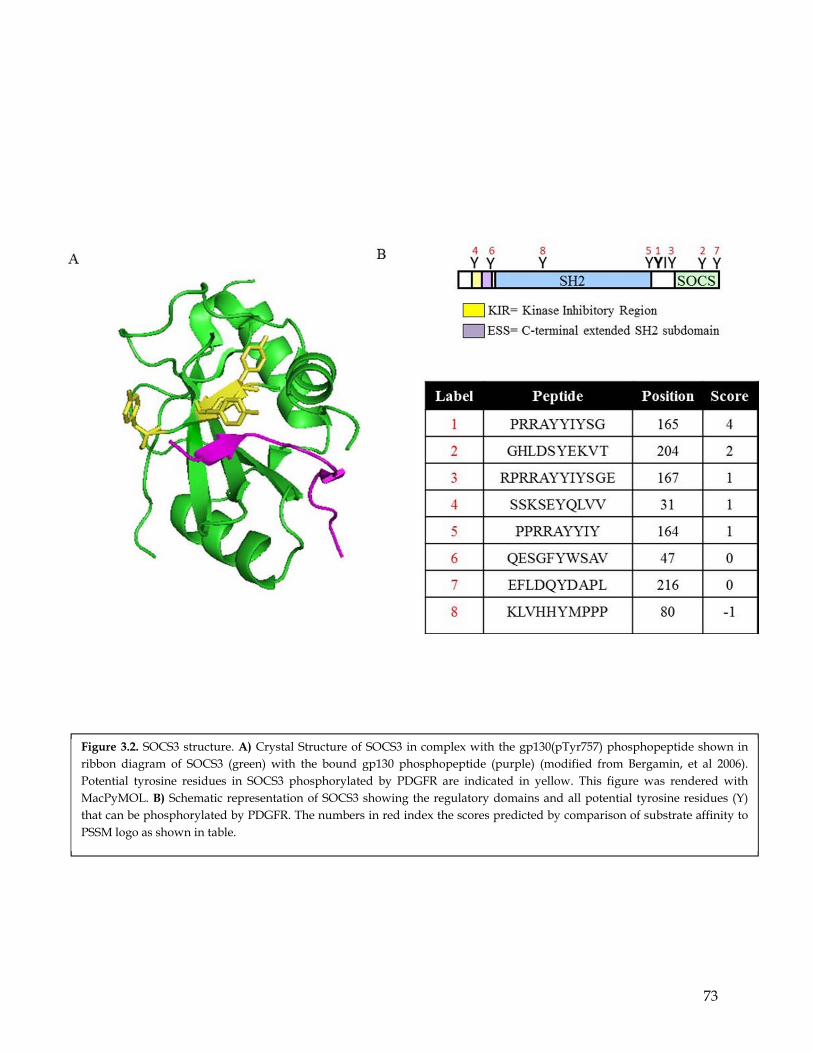
73
Figure 3.2. SOCS3 structure. A) Crystal Structure of SOCS3 in complex with the gp130(pTyr757) phosphopeptide shown in ribbon diagram of SOCS3 (green) with the bound gp130 phosphopeptide (purple) (modified from Bergamin, et al 2006). Potential tyrosine residues in SOCS3 phosphorylated by PDGFR are indicated in yellow. This figure was rendered with MacPyMOL. B) Schematic representation of SOCS3 showing the regulatory domains and all potential tyrosine residues (Y) that can be phosphorylated by PDGFR. The numbers in red index the scores predicted by comparison of substrate affinity to PSSM logo as shown in table.
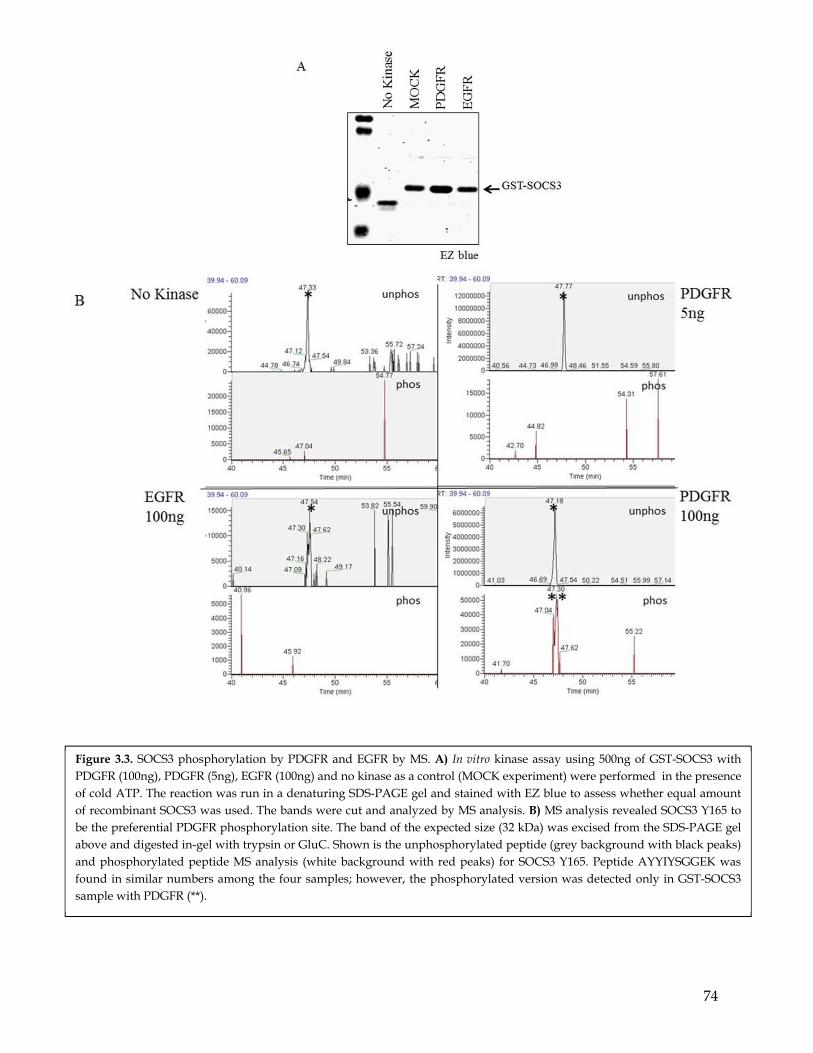
74
Figure 3.3. SOCS3 phosphorylation by PDGFR and EGFR by MS. A) In vitro kinase assay using 500ng of GST-SOCS3 with PDGFR (100ng), PDGFR (5ng), EGFR (100ng) and no kinase as a control (MOCK experiment) were performed in the presence of cold ATP. The reaction was run in a denaturing SDS-PAGE gel and stained with EZ blue to assess whether equal amount of recombinant SOCS3 was used. The bands were cut and analyzed by MS analysis. B) MS analysis revealed SOCS3 Y165 to be the preferential PDGFR phosphorylation site. The band of the expected size (32 kDa) was excised from the SDS-PAGE gel above and digested in-gel with trypsin or GluC. Shown is the unphosphorylated peptide (grey background with black peaks) and phosphorylated peptide MS analysis (white background with red peaks) for SOCS3 Y165. Peptide AYYIYSGGEK was found in similar numbers among the four samples; however, the phosphorylated version was detected only in GST-SOCS3 sample with PDGFR (**).
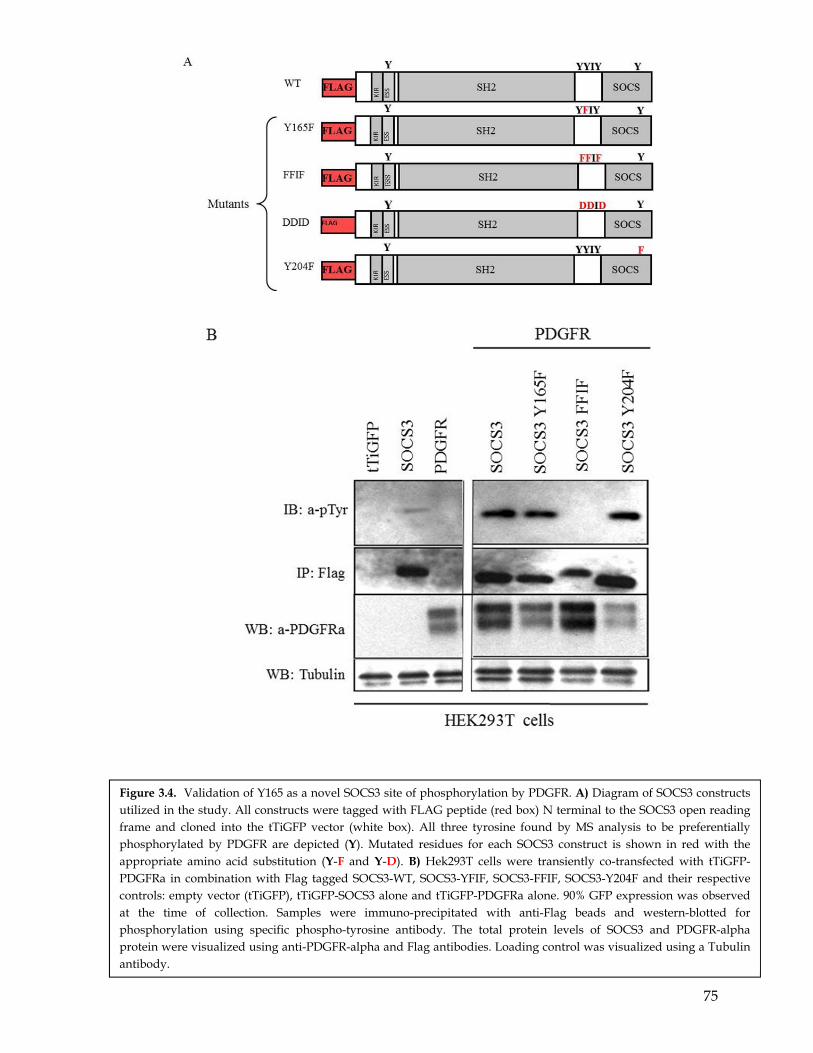
75
Figure 3.4. Validation of Y165 as a novel SOCS3 site of phosphorylation by PDGFR. A) Diagram of SOCS3 constructs utilized in the study. All constructs were tagged with FLAG peptide (red box) N terminal to the SOCS3 open reading frame and cloned into the tTiGFP vector (white box). All three tyrosine found by MS analysis to be preferentially phosphorylated by PDGFR are depicted (Y). Mutated residues for each SOCS3 construct is shown in red with the appropriate amino acid substitution (Y-F and Y-D). B) Hek293T cells were transiently co-transfected with tTiGFP-PDGFRa in combination with Flag tagged SOCS3-WT, SOCS3-YFIF, SOCS3-FFIF, SOCS3-Y204F and their respective controls: empty vector (tTiGFP), tTiGFP-SOCS3 alone and tTiGFP-PDGFRa alone. 90% GFP expression was observed at the time of collection. Samples were immuno-precipitated with anti-Flag beads and western-blotted for phosphorylation using specific phospho-tyrosine antibody. The total protein levels of SOCS3 and PDGFR-alpha protein were visualized using anti-PDGFR-alpha and Flag antibodies. Loading control was visualized using a Tubulin antibody.
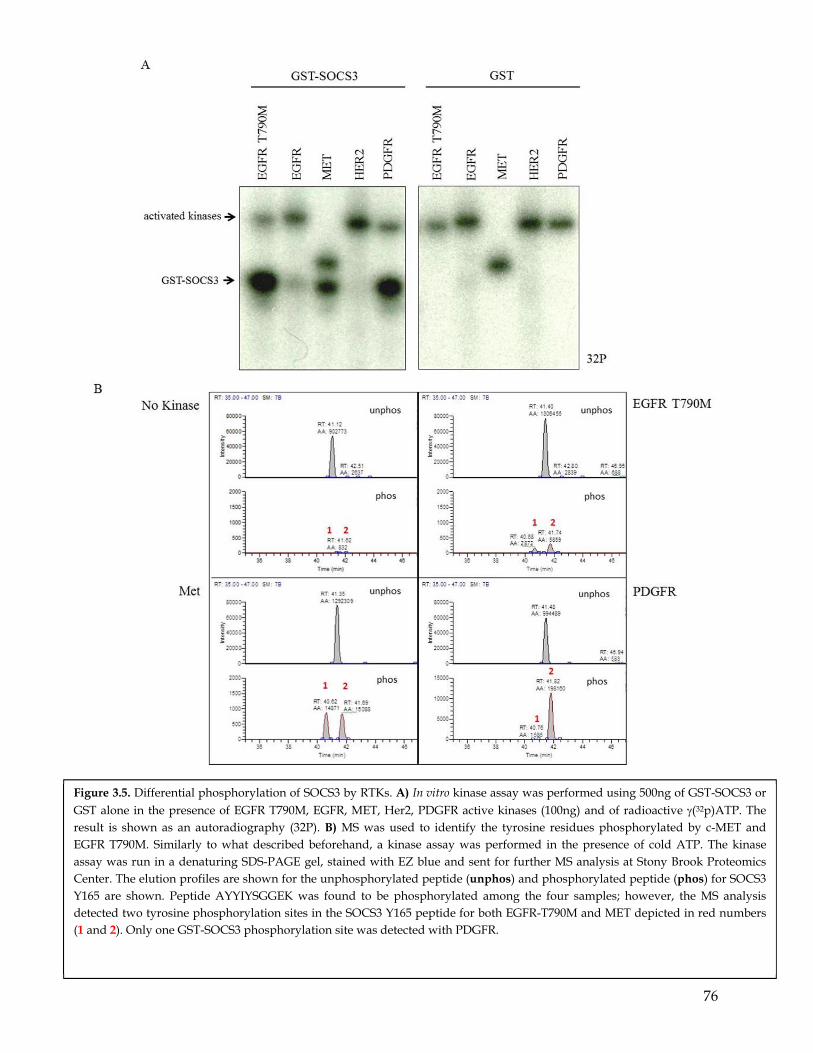
76
Figure 3.5. Differential phosphorylation of SOCS3 by RTKs. A) In vitro kinase assay was performed using 500ng of GST-SOCS3 or GST alone in the presence of EGFR T790M, EGFR, MET, Her2, PDGFR active kinases (100ng) and of radioactive (32p)ATP. The result is shown as an autoradiography (32P). B) MS was used to identify the tyrosine residues phosphorylated by c-MET and EGFR T790M. Similarly to what described beforehand, a kinase assay was performed in the presence of cold ATP. The kinase assay was run in a denaturing SDS-PAGE gel, stained with EZ blue and sent for further MS analysis at Stony Brook Proteomics Center. The elution profiles are shown for the unphosphorylated peptide (unphos) and phosphorylated peptide (phos) for SOCS3 Y165 are shown. Peptide AYYIYSGGEK was found to be phosphorylated among the four samples; however, the MS analysis detected two tyrosine phosphorylation sites in the SOCS3 Y165 peptide for both EGFR-T790M and MET depicted in red numbers (1 and 2). Only one GST-SOCS3 phosphorylation site was detected with PDGFR.
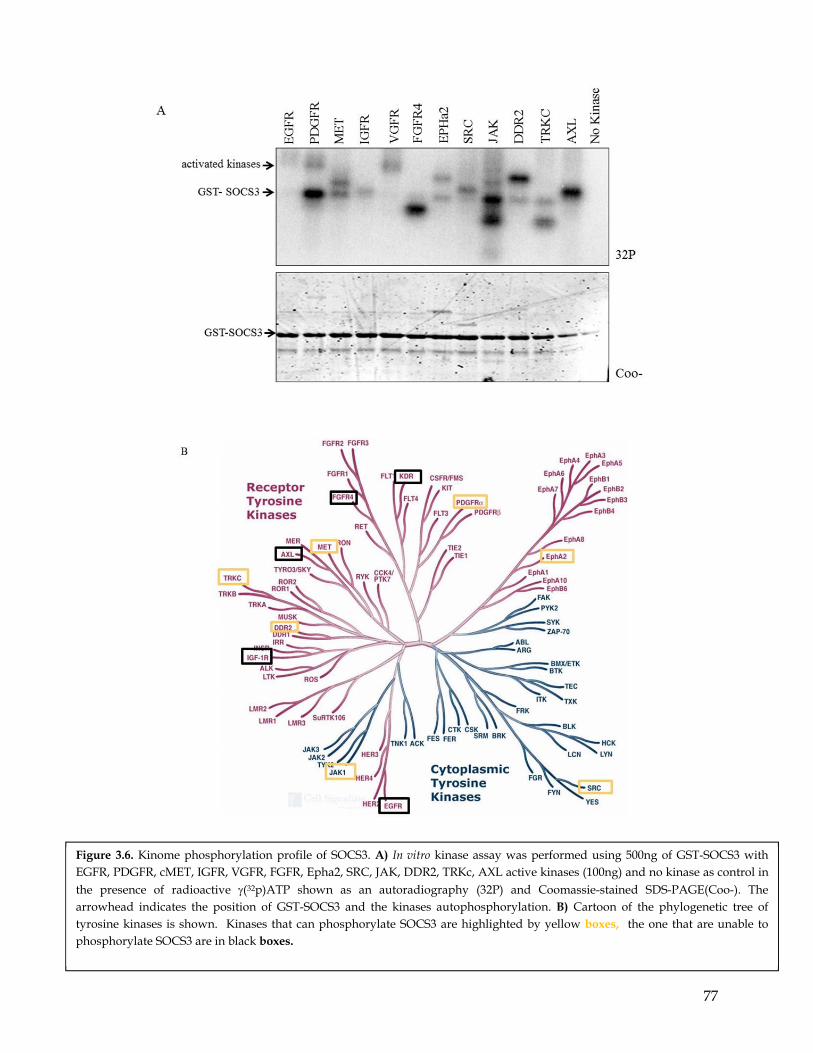
77
Figure 3.6. Kinome phosphorylation profile of SOCS3. A) In vitro kinase assay was performed using 500ng of GST-SOCS3 with EGFR, PDGFR, cMET, IGFR, VGFR, FGFR, Epha2, SRC, JAK, DDR2, TRKc, AXL active kinases (100ng) and no kinase as control in the presence of radioactive (32p)ATP shown as an autoradiography (32P) and Coomassie-stained SDS-PAGE(Coo-). The arrowhead indicates the position of GST-SOCS3 and the kinases autophosphorylation. B) Cartoon of the phylogenetic tree of tyrosine kinases is shown. Kinases that can phosphorylate SOCS3 are highlighted by yellow boxes, the one that are unable to phosphorylate SOCS3 are in black boxes.

78
CHAPTER 4
79
Chapter 4: PDGFR induced migration and erlotinib resistance is
mediated by a sustained IL-6 through the phosphorylation dependent
degradation of SOCS3
4.1 Summary
Cytokines regulate a variety of aspects of cell growth and differentiation. In
particular, Interleukin (IL-6) has been shown to play a critical role in inflammation, tissue
regeneration and tumorigenesis. Here we showed that SOCS3 is a critical node in
coordinating the interaction of PDGF and IL-6 signaling. PDGFR can in fact directly
phosphorylate SOCS3 and induce its rapid degradation via ubiquitination and proteasomal
degradation. As a result when cells are stimulated with IL-6, SOCS3 fails to block IL-6
signaling. Phenotypically this seems to be correlated with EMT, increased metastatic spread
and erlotinib resistance.
Because the biological activity of IL-6 seems to be context dependent, our findings
provided further support to the notion that biological output is the result of integration
among interconnected and intricate networks. In principle, these observations can provide a
molecular framework for the contingency of cellular signaling and substrate specificity.
4.2 Highlights
SOCS3 Y165 phosphorylation induces SOCS3 ubiquitination and degradation
PDGFR-mediated phosphorylation results in sustained IL-6 signaling
PDGFR-mediated phosphorylation of SOCS3 cooperates with IL-6 signaling in
inducing EMT and erlotinib resistance
4.3 Introduction
Cytokines regulate a variety of aspects of cell growth and differentiation through
their interactions with cytokine-specific receptors. These biological effect are mediated
80
through the activation of Janus kinases (JAKs) and activators of transcription (STATs) as
shown in Figure 3.1.A (Ihle 1996; Darnell 1997). The activities of the JAK/STAT pathways
are tightly regulated by the suppressor of cytokine signaling (SOCS) proteins. This family of
proteins is characterized by the presence of an SH2 domain and a conserved motif termed
the SOCS box (Starr and Hilton 1998; Yoshimura 1998). SOCS proteins suppress cytokine
signaling through interactions between their SH2 domains and tyrosine phosphorylation
sites on cytokine receptors or on JAKs. The SOCS activities include competing for the
recruitment of other signaling proteins, directly blocking the catalytic activity of the kinases
and/or targeting the proteins for degradation through recruitment of ubiquitination
complexes through their SOCS box domain. For instance, SOCS proteins have been shown
to form an E3-ubiquitin ligase complex with elonginC, elonginB, cullin2/5, and ring box
protein-1 (Kamura et al. 2001). Several studies reported that the C-terminal SOCS box of
SOCS1 and SOCS3, which interacts with elonginC, is required for proteasomal degradation
of SOCS binding partners, such as TEL-JAK2, JAK2, Vav, and insulin receptor substrate-1
and -2 (De Sepulveda et al. 2000; Frantsve et al. 2001; Kamizono et al. 2001; Rui et al. 2002;
Ungureanu et al. 2002).
The physiological functions of the SOCS family members have been investigated
through experiments using knockout mice. For instance, SOCS1 deficiency results in a
perinatal lethality that is associated with altered T-cell development and interferon
signaling (Alexander et al. 1999; Marine et al. 1999b). SOCS2 deficiency results in a
phenotype consistent with a primary role in growth hormone signaling (Metcalf et al. 2000).
SOCS6-deficient mice are normal, with the exception that they weigh 10% less than wild-
type littermates (Krebs et al. 2002). In the case of SOCS3, disruption of the gene results
instead in embryonic lethality, although the timing of the lethality varies depending on the
study. In one study, embryos were obtained beyond mid-gestation and frequently were
found to exhibit an erythrocytosis phenotype (Marine et al. 1999a). In a subsequent study,
no embryos were found beyond mid-gestation, and analysis of erythropoiesis at this stage
failed to identify any phenotypic alterations (Roberts et al. 2001). However, there were
detectable phenotypic alterations in placental morphology, suggesting a role for SOCS3 in
placental development. Tetraploid complementation rescued the placenta defects, yet
SOCS3 mice died prenatally likely due to major cardiac defects (Roberts et al. 2001).
81
In contrast to the other SOCS genes, SOCS3 is induced by a broad spectrum of
cytokines including IL-6, leptin, ciliary neurotrophic factor (CNTF) and leukemia inhibitory
factor (LIF), as well as by factors such as lipopolysaccharide (Starr et al. 1997; Bjørbæk et al.
1998; Bjørbæk et al. 1999; Ito et al. 1999; Stoiber et al. 1999). As with the other SOCS proteins,
over-expression of SOCS3 can suppress responses to a number of cytokines. Thus far,
SOCS3 has been proven to be an inhibitor of signal transduction for LIF, IL-11, IL-6, GH,
insulin, EGF and leptin (Bjørbæk et al. 1998; Bjørbæk et al. 1999; Hansen et al. 1999;
Nicholson et al. 1999; Sasaki et al. 1999).
Of particular interest to us is the regulation of the IL-6 pathway. IL-6 is a pleiotropic
cytokine secreted by a number of different cell types that exert both paracrine and autocrine
stimulation. Increased production of IL-6 was implicated in various disease processes, such
as Alzheimer’s disease, autoimmunity (e.g., rheumatoid arthritis), inflammation, myocardial
infarction, Paget’s disease, and osteoporosis, as well as in tumorigenesis (Kishimoto et al.
1995; Jones et al. 2001). Examples of tumorigenesis include breast cancer, colon cancer,
hepatocellular carcinoma, cholangiocarcinoma, glioblastoma, pancreatic cancer, NSCLC,
prostatic and bladder cancers, and B-cell malignancies (Castleman’s disease) (Kishimoto
2010). In particular our lab and others showed that stimulation of cells with IL-6 can lead to
increased resistance to chemotherapy and in certain context to EMT (Yao et al. 2010).
IL-6 binds to a heterodimeric receptor composed of an IL-6R (IL-6R, or CD126) and
two molecules of gp130 (CD130)(Kishimoto et al. 1992; Ward et al. 1994). Wjile CD126 is
highly specific for IL-6, gp130 is a common signal-transducing receptor for a subfamily of
cytokines (the gp130 cytokine family) which includes IL-6, IL-11, LIF, ciliary neurotrophic
factor, oncostatin M, cardiotropin-1, and neurotrophin-1 (Kishimoto et al. 1992).
Upon activation, gp130 was shown to bind to JAK1, JAK2, and TYK2 (Lutticken et al.
1994; Hermanns et al. 1999; Radtke et al. 2002). Of these interactions, the one with JAK1
plays an essential role, because in cells lacking JAK1, IL-6-mediated transduction is greatly
impaired (Guschin et al. 1995; Rodig et al. 1998). Activation of the Janus kinases upon IL-6
stimulation induces IL-6-receptor phosphorylation and subsequent recruitment of signaling
proteins. Among these is STAT3, which binds to the four tyrosine residues of gp130 (Tyr-
767, Tyr-814, Tyr-905, and Tyr-915), becomes phosphorylated in a JAK dependent manner,
82
and translocates to the nucleus to induce IL-6-responsive genes (Wegenka et al. 1993; Stahl
et al. 1995; Gerhartz et al. 1996; Schmitz et al. 2000).
Tyrosine 759 of gp130 was suggested to be involved in the inhibition of IL-6
signaling, since mutation of this tyrosine to phenylalanine enhances IL-6 signaling (Kim et
al. 1998; Schaper et al. 1998). It was demonstrated that Tyr-759 can recruit both the tyrosine
phosphatase SHP-2 and SOCS3. SHP-2 was shown to negatively regulate the IL-6 signaling
pathway, but it was also reported that recruitment of SHP-2 to gp130 functions as an
adaptor and leads to Ras/mitogen-activated protein kinase activation (Fukada et al. 1996;
Lehmann et al. 2003) (Figure 3.2.A).
Consistent with the importance of SOCS3 in regulating critical signaling pathways,
SOCS3 has been recently shown to play a critical role in cardiac development, in
neuroregeneration, in fibrosis, and in the onset and progression of tumors (e.g.,
colangyocarcinoma, pancreatic cancer, hepatocellular carcinoma) (Yoshimura et al 2007).
Decreasing the expression of SOCS3 in tumor-derived cell lines also resulted in epithelial to
mesenchymal transition and in increased pro-metastatic features. Although the mechanism
of SOCS-3 induced metastasis is not fully understood it seems that it might be linked to
increased activation of the IL-6 pathway and to hyper-activation of PYK2 (Zhang et al.
2008).
Decreased expression of SOCS3 has been observed in tumors and correlated to
increased metastatic spread. Studies have reported increased promoter methylation in
SOCS3 in certain tumors (Nakagawa et al. 2008). In addition, SOCS3 functions have been
shown to be regulated by covalent modifications. For example, SOCS3 can be tyrosine-
phosphorylated upon stimulation with IL-2, IL-3, erythropoietin (Epo), epidermal growth
factor, platelet-derived growth factor, and insulin (Cohney et al. 1999; Cacalano et al. 2001;
Peraldi et al. 2001). This modification occurs on Tyr-204 and Tyr-221 within the SOCS box. It
was reported that phosphorylated of Tyr-204 and Tyr-221 of SOCS3 works as a docking site
for p120RasGAP and results in a sustained extracellular signal-regulated kinase activation
(Cacalano et al. 2001; Haan et al. 2003).
Based on these lines of evidence, we hypothesized that the phosphorylation of
SOCS3 by PDGFR could represent an important node of integration of signaling mediated
by these extra-cellular cues. Given the relevance of both PDGFR and IL-6, understanding the
83
impact of SOCS3 phosphorylation could provide, in principle, useful insights into the
development of therapies for the treatment of many diseases such as inflammatory diseases
and cancer, in which, hyper-cytokine signaling is usually involved.
We found that Y165 phosphorylation resulted in increased ubiquitination of SOCS3
and its proteasomal-mediated degradation. This in turns leads to a sustained activation of
signaling pathways downstream of IL-6 stimulation. Preliminary data suggest that as a
result of this sustained signaling activity, the cells undergo EMT and acquire increased
metastatic potential as well as increased erlotinib resistance.
RESULTS
4.4 SOCS3 Y165 phosphorylation induces SOCS3 ubiquitination and degradation
Having revealed SOCS3 to be a PDGFR substrate, we next conducted studies aimed
at better understanding the biological significance of the phosphorylation at the identified
residue. To this end, I cloned the wild type SOCS3, as well as two variants, in which residue
Y165 (and the surrounding residues Y164, Y167) were mutated into a phenylalanine or an
aspartic acid using the Tet-ON system described above. We termed these constructs SOCS3
FFIF (Y to F) and SOCS3 DDID (Y to D). Of note, whereas the SOCS3 FFIF protein cannot be
phosphorylated by PDGFR and thereby it simulates a constitutive un-phosphorylated form;
the SOCS3 DDID mimics a constitutively phosphorylated form of SOCS3. After the
retroviral constructs (tTiGFP) were established and sequence verified, I was able to
successfully express SOCS3 WT and mutants in the NSCLC cell line H1650 and generate
stable cell lines (Figure 4.1.A). This particular cell line was derived from the pleural effusion
of a 27 years old male patient affected by NSCLC, harbors an oncogenic mutation of EGFR
and is sensitive to erlotinib, an EGFR-selective inhibitor used in the clinic for the treatment
of certain NSCLC (Lynch et al. 2004). Using the Tet-ON system, strong expression of the
SOCS3 transcript was achieved after 48h of doxycycline induction. To enrich for infected
cells, GFP-positive cells were retrieved from a heterogeneous population by flow cytometry
assisted cell sorting (FACS) (Figure 4.1.B).
Interestingly, when I analyzed expression of the different SOCS3 constructs by
Western-blot analysis after doxycycline induction of the different SOCS3 constructs in
84
H1650 cells, I observed that the SOCS3 DDID construct was consistently expressed at lower
levels than SOCS3 wild type and the SOCS3 FFIF mutant (Figure 4.1.C).
To rule out that this decrease in protein levels was due to differences in the levels of
transcription for the different constructs, I analyzed mRNA levels of SOCS3. I utilized
primers spanning the vector boundaries to selectively amplify the ectopically expressed
SOCS3 transcript. RT-QPCR analysis indicated similar mRNA level of expression for all
constructs, suggesting a post-transcriptional mechanism of regulation may be responsible
for the decrease of the constitutively phosphorylated form of SOCS3 (Figure 4.1.D).
Although we did not directly measure the stability of SOCS3 and its variants, we
hypothesized that SOCS3 phosphorylation could induce its ubiquitination and degradation.
To determine whether ubiquitin-induced degradation was responsible for the observed
differences, I immunoprecipitated the ectopically expressed SOCS3 constructs with an anti-
FLAG antibody and assessed the levels of ubiquitination by Western blot analysis using an
ubiquitin-selective antibody. The results of the experiments, depicted in Figure 4.2.A,
indeed show increased ubiquitination of the SOCS3 DDID construct compared to SOCS3
WT and SOCS3 FFIF.
Poly-ubiquitination is usually a signal for proteasomal degradation. To test the
possibility that proteasomal degradation was responsible for decreased SOCS3 DDID levels,
I inhibited the proteasome machinery in the SOCS3-overexpressing H1650 cells by treating
cells with MG132, a potent and selective proteasome inhibitor (Figure 4.2.B). The levels of
expression of the different SOCS3 constructs were measured by Western blot analysis.
Treatment with MG132 was sufficient to increase SOCS3 DDID to levels that were
comparable to the one observed in the case of SOCS3 wild-type construct. No major
differences were observed for SOCS3 FFIF construct.
In summary, we concluded that the phosphorylation of SOCS3 by PDGFR triggers
rapid protein degradation by the proteasome machinery.
4.5 PDGFR mediated phosphorylation results in sustained IL-6 signaling
SOCS3 is one of main constituents of negative feedback mechanisms regulating IL-6
signaling. Hence, we reasoned that PDGFR induces degradation of SOCS3 upon
85
phosphorylation, we could potentiate IL-6 mediated signaling by releasing its negative
inhibition.
To test this hypothesis, we first examined the status of activation of the IL-6 axis
when the expression of SOCS3 was decreased using specific siRNA (Invitrogen). As an
indirect measurement of IL-6 mediated signaling we evaluated the level of STAT3 and
MAPK phosphorylation and its major down-stream signaling effectors upon stimulation of
cells with IL-6 at different times. Consistent with published data, knock-down of SOCS3
resulted into a sustained STAT3 and MAPK phosphorylation upon IL-6 stimulation (Figure
4.3.A).
Next, we determined the effect of PDGFR stimulation on IL-6 mediated signaling. To
this end, we utilized the stable NSCLC cell line over-expressing PDGFR described in
Chapter 3, which was generated by the introduction of PDGFR under the control of a
tetracycline-inducible promoter (tTiGFP). Treatment of cells with doxycycline for 48 hours
induces a sustained expression of PDGFR (Figure 4.3.B). However, dox-mediated PDGFR
induction was not sufficient per se to activate the receptor. Auto-phosphorylation of PDGFR
in fact required stimulation by PDGF-BB (10ng/µl) as shown by the phosphotyrosine
western-blot in Figure 4.3.B. When we analyzed the effect of activation of PDGFR on IL-6
mediated signaling, we observed that expression of PDGFR alone did not change the levels
of phosphorylation of STAT3, but stimulation with PDGF-BB and IL-6 appeared to cause a
persistent STAT3 phosphorylation (Figure 4.3.B), similar to the case of cells in which SOCS3
was silenced.
To directly prove a causative role of SOCS3 phosphorylation in mediating the
sustained IL-6 signaling, we then examined the activation of the IL-6 signaling in H1650
cells ectopically expressing SOCS3 WT and SOCS3 mutations that mimic the
phosphorylation and the unphosphorylated form of SOCS3 (SOCS3 FFIF and DDID),
respectively.
The expression of SOCS3 wild type or the constitutively phosphorylated form of
SOCS3-DDID was induced with doxycycline for a period of 48h (Figure 4.4.A). SOCS3
expression in cells in usually very low but it is induced 30 minutes after stimulation with IL-
6. Hence, to minimize the effects of endogenous SOCS3, we examined the effect of
86
ectopically expressed SOCS3 on IL-6 mediated signaling at early time points (e.g., 5, 10 ,15
minutes).
In cells expressing SOCS3 WT or the SOCS3 FFIF isoform, we observed a decrease in
the levels of phosphorylation of STAT3 (Figure 4.4.A). The experiments were performed in
triplicate and quantified using Odyssey® Software. As shown in the chart on the right side
of Figure 4.4.A, while ectopically expression of SOCS3 was sufficient to reduce the
phosphorylation of STAT3 upon stimulation with IL-6, expression of the SOCS3-DDID
mutant failed to do so. This is consistent with the observation that SOCS-3 DDID is rapidly
degraded in cells.
To provide evidence that failure to decrease STAT3 phosphorylation was simply due
to decreased protein expression and not due to other molecular mechanisms, we blocked the
degradation of SOCS3 by treating the cells with a proteasome inhibitor (Figure 4.4.B), that
we previously showed was sufficient to block SOCS3 degradation. Pre-treatment of cells
with MG132 increased the levels of SOCS3-DDID and reduced the phosphorylation of
STAT3 to a level comparable to the one observed in the SOCS3 wild type overexpressing
cells. We interpreted this result as an indication that by decreasing the level of SOCS3,
PDGFR could cooperate with IL-6 in activating STAT3-mediated signaling.
4.6 PDGFR mediated phosphorylation of SOCS3 cooperates with IL-6 signaling in
inducing EMT
In the course of these experiments, it was noticed that PDGFR expressing cells
acquired mesenchymal-like morphology when co-stimulated with IL-6 and PDGF-BB
(Figure 4.5.A). This in principle suggests that the cooperation of PDGFR and IL-6 signaling
pathways can be functionally important. Interestingly, the injection of H1650 cells
overexpressing PDGFR resulted in lung metastasis when the mice were fed on doxycycline
(Figure 4.5.B).
To definitely test the importance of SOCS3 phosphorylation in the cooperation of IL-
6 and PDGFR, I constructed H1650 cells expressing inducible PDGFR and SOCS3 WT and
SOCS3 FFIF mutant. If in fact the decreased expression of SOCS3 is required for mediating
the effect of IL-6 stimulation, I should expect to see a failure of Il-6 in inducing
87
mesenchymalization of cells and in formation of metastasis. These experiments are
underway.
As IL-6 treatment can increase the cell resistance to erlotinib (Yao et al. 2010), I also
determined whether treatment with PDGF-BB and IL-6 could modify the H1650-PDGFR
cell’s sensitivity to erlotinib. As previously reported, treatment with IL-6 was sufficient to
decrease the sensitivity of cells to erlotinib; however co-stimulation with PDGF-BB in H1650
cells overexpressing PDGFR potentiated the IL-6 effect (Figure 4.5.C). Of note, PDGFR by
itself had only minimal effect on erlotinib sensitivity.
Our observations are of particular importance, as it has been argued that the
activation of other RTKs including PDGFR in cells expressing oncogenic EGFR mutations
lead to TKI resistance through compensatory mechanism via the activation of the PI3K
pathway (Engelman et al. 2007). Our data, in principle, provide an alternative explanation
and suggest resistance can be explained by a rearrangement of the signaling network
downstream of RTKs. I am currently testing this hypothesis in cells expressing PDGFR as
well as c-MET and EGFR T790M.
4.7 Discussion
Cytokines such as IL-6 have been shown to be important for inflammatory
conditions, tissue regeneration and tumorigenesis. Yet, it has become evident that the effects
of Il-6 are highly context dependent. For instance, while in certain cell lines, IL-6 can induce
EMT and expansion of CD44+CD24- cells; in other cell lines, IL-6 stimulation fails to drive
such phenotypes despite normal activation of IL-6 mediated signaling in cells.
Here we showed that SOCS3 is a critical node in coordinating the interaction of
PDGF and IL-6 signaling. PDGFR can in fact phosphorylate directly SOCS3 and induce its
rapid degradation via ubiquitination and proteasomal mediated degradation. As a result
when cells are stimulated with IL-6, SOCS3 fails to block Il-6 signaling. Phenotypically this
seems to be correlated with EMT, increased metastatic spread and erlotinib resistance
(Figure 4.6).
These findings are of particular interest because PDGFR and IL-6 are co-activated in
multiple biological systems. Thereby, our findings provided further support to the notion
that biological output is the result of integration among interconnected and intricate
88
networks. In principle, these observations can provide a molecular framework for the
contingency of cellular signaling and substrate specificity.
In the context of tumorigenesis, our results can be particular relevant. PDGFR-, c-
MET- and EGFR T790M-over-expressing tumors are in fact characterized by an EMT
phenotype, increased metastatic potential and erlotinib resistance. Our data argue that in
these tumors, a sustained IL-6 signaling is mediating these phenotypes. We are currently
exploring this hypothesis.
It has been proposed that tumor phenotypes are driven not only by cell–autonomous
mechanisms but also through the interaction with the microenvironment and with other
tumor sub-populations. Interestingly, recent studies in glioblastoma have indicated that
intra-tumor heterogeneity is important for the maintenance of distinct clonal populations
(Szerlip et al. 2012). In particular, it has been shown that certain glioblastoma tumors
harboring oncogenic EGFR mutations have elevated expression of IL-6. This in turn
stimulates the proliferation of adjacent EGFR-expressing cells in a paracrine fashion (Inda et
al. 2010). In addition, several groups have also described the existence in glioblastoma
tumors of multiple clonal populations that harbor both EGFR and PDGFR over-expression
(Szerlip et al. 2012). These observations, together with the fact that both Il-6 and PDGFR are
secreted by activated components of the tumor microenvironment, suggest that the
cooperation of IL-6 and PDGFR occur beyond a cell autonomous context. To this end, it
would be interesting to determine whether phosphorylation or inactivation of SOCS3 plays
a role in maintaining intra-tumor heterogeneity as well as in mediating certain effects of the
tumor microenvironment on tumor onset and progression. In principle this can also be
applied to tumors harboring c-MET amplifications and EGFR T790M mutations, as both of
these receptors can phosphorylate SOCS3. Although, a more comprehensive analysis is
required to make a strong inference, preliminary data indicate that NSCLC-derived cell
lines harboring c-MET, PDGFR and T790M are characterized by a constitutive activation of
the IL-6 pathway and low levels of SOCS3. Preliminary data also indicate that these cells are
particularly sensitive to IL-6-pathway inhibition.
Nonetheless, further studies are necessary to elucidate how sustained IL-6 activation
can lead to EMT. Early data from our lab indicate that IL-6 hyper-activation can lead to EMT
is not due to STAT3, as silencing of STAT3 is not sufficient to revert the EMT phenotype
89
observed in cells stimulated with IL-6. Similarly, we found that expression of a
constitutively active STAT3 is not sufficient to induce EMT. Therefore, it can be reasoned
that induction of EMT should be through other mechanisms upon SOCS3 phosphorylation.
Since SOCS3 not only inhibits IL-6-mediated STAT3 activation, but it also negatively
regulates many other signaling pathways. For instance, SOCS3 binds to the insulin receptor
(IRS1/2) and induces their degradation (Elliott and Johnston 2004). Similarly, SOCS3 can
also interact with EGFR and PYK2 to induce their ubiquitination and degradation
(Yoshimura et al. 2007).
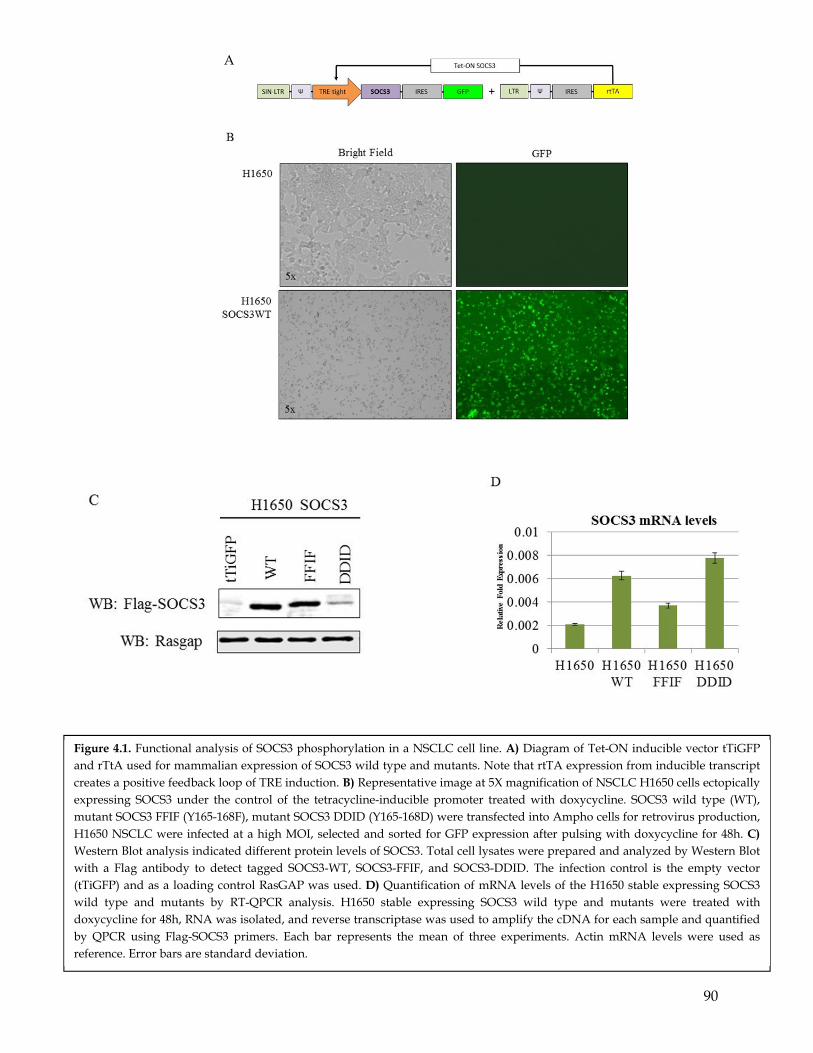
90
Figure 4.1. Functional analysis of SOCS3 phosphorylation in a NSCLC cell line. A) Diagram of Tet-ON inducible vector tTiGFP and rTtA used for mammalian expression of SOCS3 wild type and mutants. Note that rtTA expression from inducible transcript creates a positive feedback loop of TRE induction. B) Representative image at 5X magnification of NSCLC H1650 cells ectopically expressing SOCS3 under the control of the tetracycline-inducible promoter treated with doxycycline. SOCS3 wild type (WT), mutant SOCS3 FFIF (Y165-168F), mutant SOCS3 DDID (Y165-168D) were transfected into Ampho cells for retrovirus production, H1650 NSCLC were infected at a high MOI, selected and sorted for GFP expression after pulsing with doxycycline for 48h. C) Western Blot analysis indicated different protein levels of SOCS3. Total cell lysates were prepared and analyzed by Western Blot with a Flag antibody to detect tagged SOCS3-WT, SOCS3-FFIF, and SOCS3-DDID. The infection control is the empty vector (tTiGFP) and as a loading control RasGAP was used. D) Quantification of mRNA levels of the H1650 stable expressing SOCS3 wild type and mutants by RT-QPCR analysis. H1650 stable expressing SOCS3 wild type and mutants were treated with doxycycline for 48h, RNA was isolated, and reverse transcriptase was used to amplify the cDNA for each sample and quantified by QPCR using Flag-SOCS3 primers. Each bar represents the mean of three experiments. Actin mRNA levels were used as reference. Error bars are standard deviation.
A
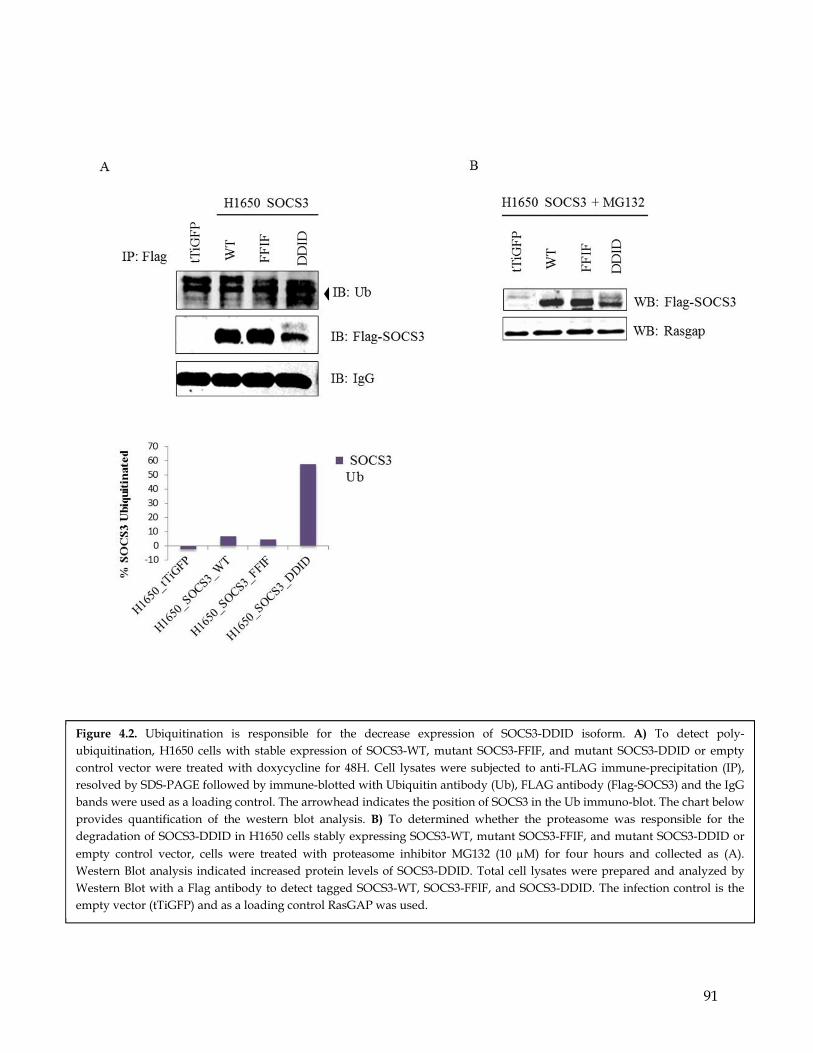
91
Figure 4.2. Ubiquitination is responsible for the decrease expression of SOCS3-DDID isoform. A) To detect poly-ubiquitination, H1650 cells with stable expression of SOCS3-WT, mutant SOCS3-FFIF, and mutant SOCS3-DDID or empty control vector were treated with doxycycline for 48H. Cell lysates were subjected to anti-FLAG immune-precipitation (IP), resolved by SDS-PAGE followed by immune-blotted with Ubiquitin antibody (Ub), FLAG antibody (Flag-SOCS3) and the IgG bands were used as a loading control. The arrowhead indicates the position of SOCS3 in the Ub immuno-blot. The chart below provides quantification of the western blot analysis. B) To determined whether the proteasome was responsible for the degradation of SOCS3-DDID in H1650 cells stably expressing SOCS3-WT, mutant SOCS3-FFIF, and mutant SOCS3-DDID or empty control vector, cells were treated with proteasome inhibitor MG132 (10 M) for four hours and collected as (A). Western Blot analysis indicated increased protein levels of SOCS3-DDID. Total cell lysates were prepared and analyzed by Western Blot with a Flag antibody to detect tagged SOCS3-WT, SOCS3-FFIF, and SOCS3-DDID. The infection control is the empty vector (tTiGFP) and as a loading control RasGAP was used.
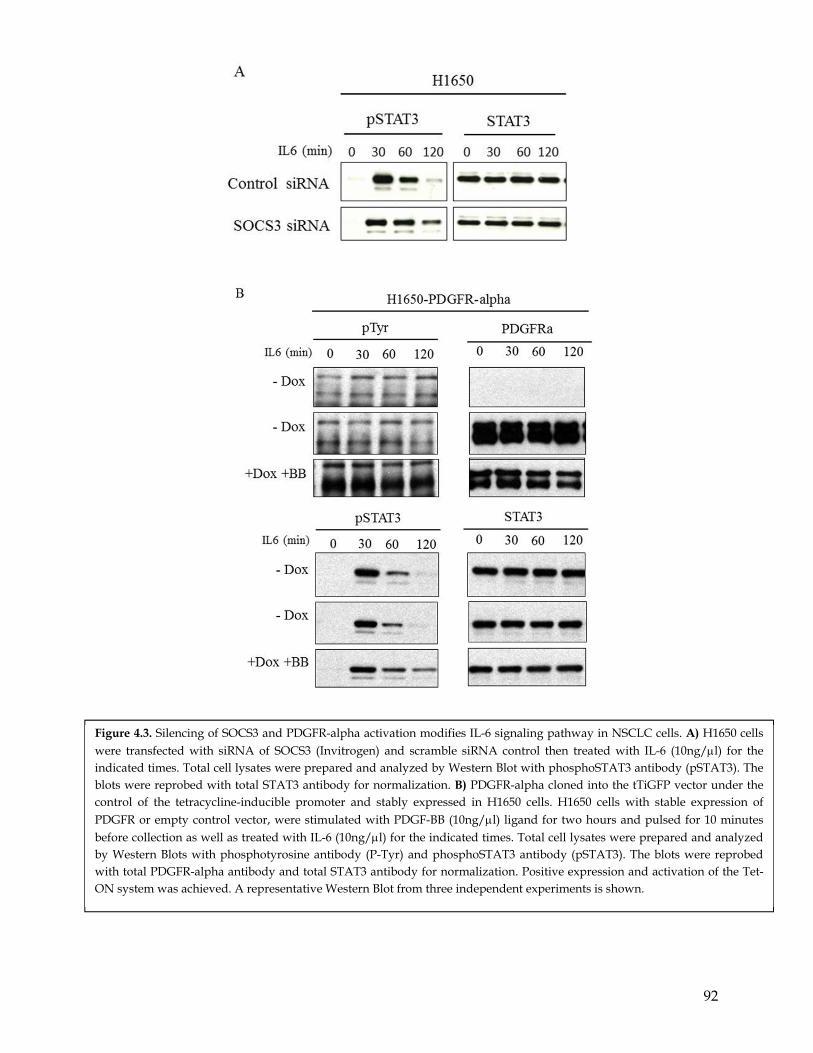
92
Figure 4.3. Silencing of SOCS3 and PDGFR-alpha activation modifies IL-6 signaling pathway in NSCLC cells. A) H1650 cells were transfected with siRNA of SOCS3 (Invitrogen) and scramble siRNA control then treated with IL-6 (10ng/l) for the indicated times. Total cell lysates were prepared and analyzed by Western Blot with phosphoSTAT3 antibody (pSTAT3). The blots were reprobed with total STAT3 antibody for normalization. B) PDGFR-alpha cloned into the tTiGFP vector under the control of the tetracycline-inducible promoter and stably expressed in H1650 cells. H1650 cells with stable expression of PDGFR or empty control vector, were stimulated with PDGF-BB (10ng/l) ligand for two hours and pulsed for 10 minutes before collection as well as treated with IL-6 (10ng/l) for the indicated times. Total cell lysates were prepared and analyzed by Western Blots with phosphotyrosine antibody (P-Tyr) and phosphoSTAT3 antibody (pSTAT3). The blots were reprobed with total PDGFR-alpha antibody and total STAT3 antibody for normalization. Positive expression and activation of the Tet-ON system was achieved. A representative Western Blot from three independent experiments is shown.
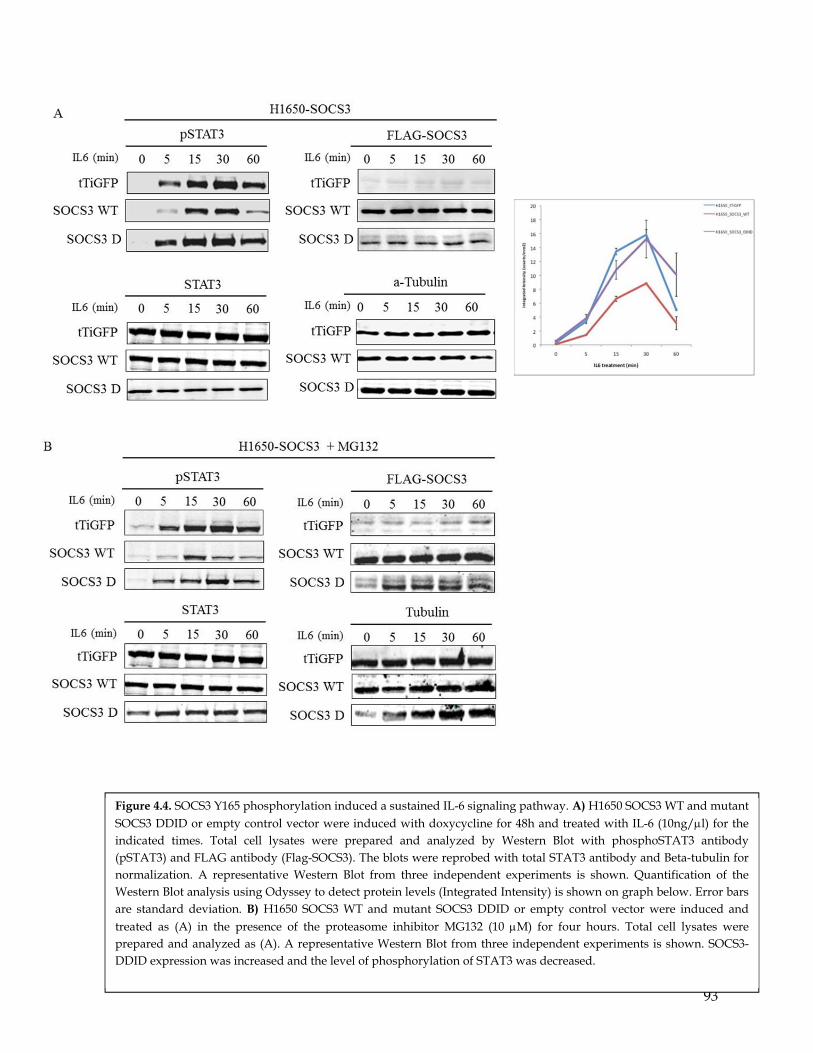
93
Figure 4.4. SOCS3 Y165 phosphorylation induced a sustained IL-6 signaling pathway. A) H1650 SOCS3 WT and mutant SOCS3 DDID or empty control vector were induced with doxycycline for 48h and treated with IL-6 (10ng/l) for the indicated times. Total cell lysates were prepared and analyzed by Western Blot with phosphoSTAT3 antibody (pSTAT3) and FLAG antibody (Flag-SOCS3). The blots were reprobed with total STAT3 antibody and Beta-tubulin for normalization. A representative Western Blot from three independent experiments is shown. Quantification of the Western Blot analysis using Odyssey to detect protein levels (Integrated Intensity) is shown on graph below. Error bars are standard deviation. B) H1650 SOCS3 WT and mutant SOCS3 DDID or empty control vector were induced and treated as (A) in the presence of the proteasome inhibitor MG132 (10 M) for four hours. Total cell lysates were prepared and analyzed as (A). A representative Western Blot from three independent experiments is shown. SOCS3-DDID expression was increased and the level of phosphorylation of STAT3 was decreased.
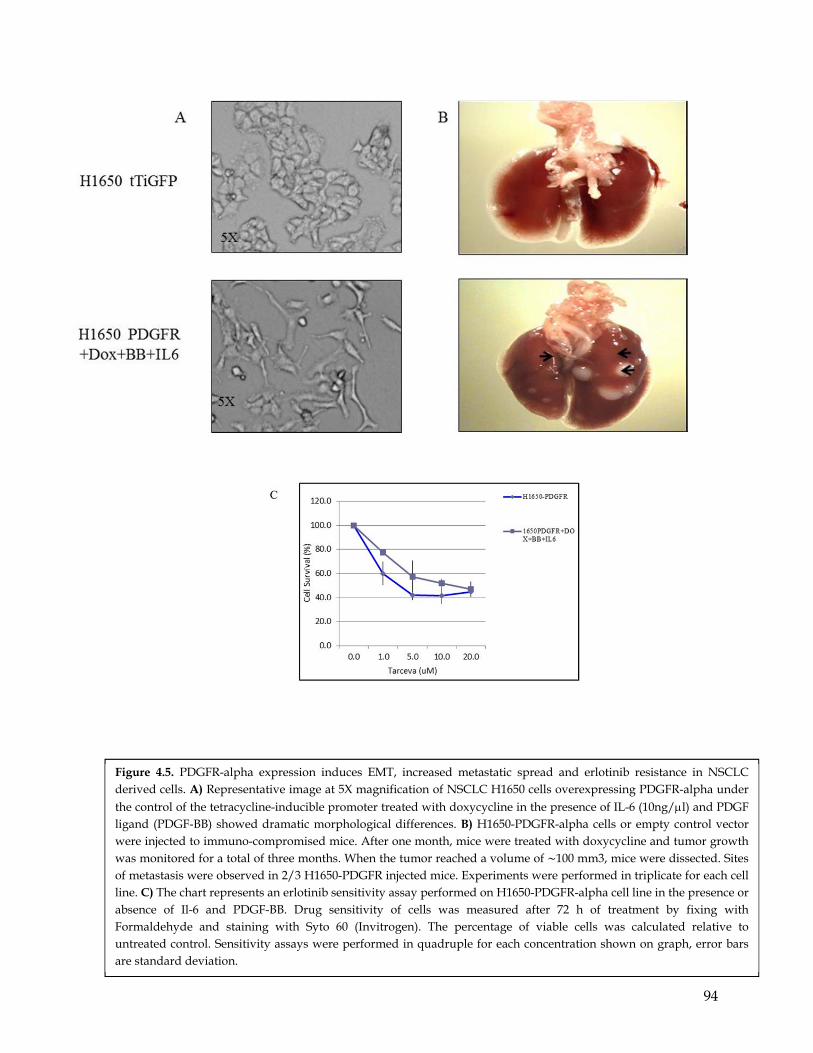
94
Figure 4.5. PDGFR-alpha expression induces EMT, increased metastatic spread and erlotinib resistance in NSCLC derived cells. A) Representative image at 5X magnification of NSCLC H1650 cells overexpressing PDGFR-alpha under the control of the tetracycline-inducible promoter treated with doxycycline in the presence of IL-6 (10ng/l) and PDGF ligand (PDGF-BB) showed dramatic morphological differences. B) H1650-PDGFR-alpha cells or empty control vector were injected to immuno-compromised mice. After one month, mice were treated with doxycycline and tumor growth was monitored for a total of three months. When the tumor reached a volume of ∼100 mm3, mice were dissected. Sites of metastasis were observed in 2/3 H1650-PDGFR injected mice. Experiments were performed in triplicate for each cell line. C) The chart represents an erlotinib sensitivity assay performed on H1650-PDGFR-alpha cell line in the presence or absence of Il-6 and PDGF-BB. Drug sensitivity of cells was measured after 72 h of treatment by fixing with Formaldehyde and staining with Syto 60 (Invitrogen). The percentage of viable cells was calculated relative to untreated control. Sensitivity assays were performed in quadruple for each concentration shown on graph, error bars are standard deviation.
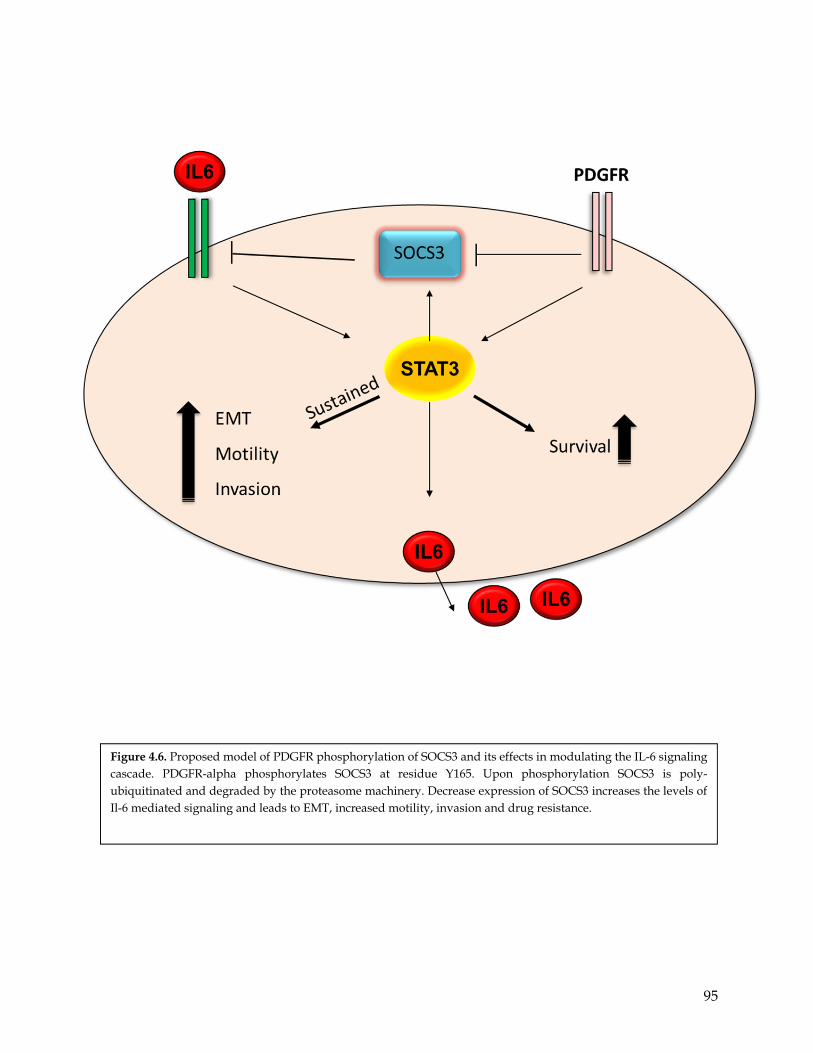
95
Figure 4.6. Proposed model of PDGFR phosphorylation of SOCS3 and its effects in modulating the IL-6 signaling cascade. PDGFR-alpha phosphorylates SOCS3 at residue Y165. Upon phosphorylation SOCS3 is poly-ubiquitinated and degraded by the proteasome machinery. Decrease expression of SOCS3 increases the levels of Il-6 mediated signaling and leads to EMT, increased motility, invasion and drug resistance.

96
SECTION III

97
CHAPTER 5
DISCUSSION AND FUTURE PERSPECTIVES
98
Chapter 5: Discussion and Future perspectives
Protein tyrosine kinases (PTKs) were first described in 1970s by Temin as viral
transforming gene products. PTKs can be divided into two classes: the trans-membrane
receptor tyrosine kinase (RTK) class and the non-receptor tyrosine kinase (NRTK) class,
which are further grouped into subfamilies based on sequence similarity (Manning et al.
2002). More than a quarter of a century ago, it was quickly recognized that RTKs in
particular could play a role in transducing growth factor signals across the plasma
membrane. Over time, it has become clear that RTKs control many different cellular
functions by phosphorylating proteins involved in gene expression, metabolic pathways,
cell growth and differentiation, membrane transport, and apoptosis (reviewed in Lemmon
and Schlessinger 2010). In the early 1990s, several studies showed that viral transduction of
the PDGFR ligand promoted cell transformation by activating this RTK through an
autocrine loop (Doolittle et al. 1983; Waterfield et al. 1983). Subsequently, a gene encoding
EGFR was shown to be amplified and mutated in brain tumors, causing the constitutive
activation of downstream signaling in tumor tissues (Libermann et al. 1985). Over the past
50 years, the importance of RTKs has been clearly demonstrated in multiple studies and
increasing amounts of data have now implicated the deregulation of these signaling
proteins in a variety of diseases.
Aberrant activation of many RTKs due to amplification, activating mutations, or
ligand over-expression has been observed in multiple tumor types (Gschewind 2004). In
lung cancer in particular, over-expression of EGFR, HER2, FGFR, PDGFR, or c-MET occur at
a high frequency together with certain oncogenic EGFR mutations. Altogether, the genetic
lesions observed in RTKs account for the vast majority of known oncogenic lesions observed
in this disease (Ding et al. 2008).
At the functional level, deregulation of RTKs activity is important in mediating
multiple aspects of tumorigenesis. Increased activation of RTKs has been shown to increase
cell proliferation, metastasis, DNA damage, protection from apoptosis and to modify the
micro-environment and cell metabolism (Fukada et al. 1996; Lehmann et al. 2003).
Although highly similar in their structure and regulation, different RTKs exert
distinct biological functions. The ability of RTKs to signal through common pathways while
99
inducing diverse phenotypic responses has largely been attributed to differences in cellular
context (Jordan et al. 2000; Simon 2000). For example, while FGFR1 induces differentiation
in neuronal cells, in fibroblasts it increases proliferation (Marshall 1995; Lin et al. 1996).
When expressed in the same cellular background however, different RTKs have also been
shown to elicit different phenotypic responses. For instance, activation of EGFR induces
proliferation in PC12 neuronal cells, whereas activation of FGFR1 induces differentiation
(Pollock et al. 1990; Lin et al. 1996). Recently, Miller-Jensen et al (2007) showed that the
phenotypic response of cells to external stimuli can be predicted using models that rely on
linear combinations of a common set of downstream signaling proteins. This suggests that
different RTKs may be able to elicit different phenotypic responses in the same cell type by
activating a common set of signaling proteins, but to different quantitative degrees. In this
model, the integration of signaling elicited by RTKs at multiple levels determines the
cellular outcome.
In my study, I showed that in addition to these mechanisms, intrinsic differences in
RTK substrate specificities could also play a role in modulating functional outcomes. In
particular, the work in this thesis presents evidence indicating that certain RTKs, such as
PDGFR and MET, have site-specific phosphorylation preferences for particular peptides. For
instance, PDGFR showed increased selectivity for positively charged peptides. Hence,
similar to the case of serine and threonine kinases, our data suggests that RTKs could also be
sub-divided into acidophilic and basophilic kinases. Further experiments analyzing a broad
number of RTKs will be required to validate this notion. Nonetheless, the difference in
charge of preferred peptides strongly implies that these variations are due to structural
divergence in the kinase domain. In this regard, the observation that a single amino acid
change in mutant EGFR (T790M) is sufficient to modify substrate specificity is of particular
interest. Crystal structures of multiple kinase domains are now available in complexes with
pseudo-substrates. We are currently conducting studies in collaboration with Hiroyasu
Furukawa (Hiro) at CSHL aimed at identifying possible structural variations among RTKs
that could support our findings.
To identify possible PDGFR selective substrates, we conducted a bioinformatics
analysis and identified SOCS3 as a potential candidate that is differentially phosphorylated
by PDGFR and EGFR. In vitro and in vivo studies confirmed these predictions through MS,
100
mutagenesis, biochemical analysis and kinase assays. In particular, I found that upon
phosphorylation of SOCS3, the protein is rapidly degraded. Given the preeminent role of
SOCS3 as a component of the negative feedback loop of the IL-6 axis, our findings suggest
that the decreased expression of SOCS3 upon PDGFR phosphorylation induces sustained
IL-6 signaling. Indeed, PDGFR activation was important in prolonging the time of activation
of STAT3 upon IL-6 stimulation. Functionally this overexpression resulted in an increase of
EMT, motility, and erlotinib resistance.
These results are intriguing, because they reinforce the notion that the biological
output of signaling pathways is highly context-dependent. For instance, the simple
stimulation with PDGF-BB in cells expressing PDGFR was not sufficient to induce the above
phenotypes; however, when the cells were co-stimulated with PDGF-BB and IL-6, they
acquired a mesenchymal phenotype.
The fact that SOCS3 is regulated at the protein level by PDGFR is also exciting
because it allows for faster regulation of signaling cascades compared to regulation at the
transcriptional level. Yet, because the numbers of players (SOCS3 phosphorylation and
ubiquitination) is restricted in this case, this mode of signaling integration can increase
plasticity at the expense of robustness.
As mentioned previously, SH2 and PTB domains are the largest family of interaction
modules encoded by the human genome which recognize tyrosine-phosphorylated
sequences. Therefore, these domains play pivotal roles in transducing and controlling
cellular signals from PTKs. By virtue of their ability to bind tyrosine-phosphorylated
polypeptides (Schlessinger and Lemmon 2003), the domains are involved in signaling
processes that regulate cell growth or differentiation, protein ubiquitination and/or
degradation, gene transcription, and cytoskeletal rearrangements (Pawson 2004; Kirkin and
Dikic 2007). Thus, differences in amino acid preferences for substrate recognition could have
an impact on the class of PTB and SH2 domain proteins with which PDGFR substrates can
interact. This may be the case in these studies, which showed that SOCS3 was ubiquitinated
and degraded in response to phosphorylation at position Y165, which is a potential binding
site for the SH2 domain of SOCS4 and SOCS5.
IL-6-, PDGFR-, and c-MET-mediated signaling are not only relevant for NSCLC, but
have been shown to be important in many other tumor types. It would be interesting to
101
explore the relevance of integration of RTKs and IL-6-mediated signaling in other contexts,
such as HCC, glioblastoma, and pancreatic cancers. In these tumors, clear roles for IL-6,
PDGFR, and c-MET have been elucidated in both cell culture systems and animal models.
In the case of glioblastoma, IL-6 paracrine stimulation has been shown to be important in
driving tumorigenesis. Interestingly, a recent publication also indicated the existence of
heterogeneous distribution of PDGFR and EGFR in certain glioblastoma tumors. This
observation suggests the possibility that IL-6 and PDGFR could cooperate in increasing the
expression of IL-6 and other secreted factors, and in doing so contribute to the proliferation
of neighboring clonal populations (Szerlip et al. 2012). Since IL-6 receptor, PDGFR, and c-
MET are not only expressed in tumor cells but also in other components of the tumor micro-
environment, this model could explain cooperation between tumor-associated fibroblasts,
macrophages, platelets, and the tumor cells themselves during tumorigenesis.
Besides tumorigenesis, the importance of other physio-pathological conditions in
which PDGFR and IL-6 have been shown to play a role cannot be excluded. These
conditions include rheumatoid arthritis, fibrosis, and maintenance of stem cell self-renewal.
While my study was exclusively focused on the IL-6 axis, SOCS3 regulates many
other signaling pathways and it would be important to extend these studies to such systems.
In fact, the deregulation of SOCS3 by PDGFR could have more profound effects than just the
regulation of the IL-6 axis. For instance, SOCS3 has been shown to regulate IR, CTNF,
interfon, and LIF. In the case of IR, decreased expression of SOCS3 has been shown to
induce insulin resistance and in the case of CTNF, it increases neuronal regeneration
(Yoshimura et al. 2007). The possibility that SOCS3 degradation could increase axonal
growth after injury opens up potential therapeutic opportunities. For example, lowering
SOCS3 expression either by localized delivery of siRNA oligonucleotides or by
oligonucleotide-mediated premature SOCS3 poly-adenylation, it may be possible to increase
axonal growth after neuronal damage or spinal cord injury.
A final outcome of my thesis studies is the possibility of utilizing our novel findings
of RTK substrate specificity to generate probes that could aid in the visualization of kinases
in vivo. Fluorescence resonance energy transfer (FRET) has been used to confirm
interactions between a kinase and a candidate substrate. Using information about known
substrates, FRET-based reporters have been developed to measure the activity of specific
102
kinases in live cells (Zhang and Allen 2007). These reporters are single proteins that contain
four major components: two forms of green fluorescent protein (CFP and YFP) at the N and
C terminus, which form the FRET pair; a substrate domain for the kinase of interest; and, a
phosphorylation binding domain, such as SH2 or 14-3-3 domains. In response to
phosphorylation of the substrate domain of the reporter, the SH2 or 14-3-3 domain binds the
substrate domain, thereby triggering a conformational change in the reporter that alters its
FRET signal. Development of a Src reporter was recently described and used to study
integrin signaling induced by local mechanical stimulation of endothelial cells (Wang et al.
2005). Furthermore, a protein kinase A (PKA) FRET reporter has been adapted for high-
throughput drug screening to identify small-molecule kinase inhibitors and pathway-
modulating compounds. Therefore, I could use our observations to develop specific FRET
substrate domains. Experiments such as this one open up a totally new direction for kinase
and molecular target therapy innovation.

103
SECTION IV

104
APPENDIXES
105
Appendix i: Phospho-proteomic analyses of signaling differences between
PDGFR and EGFR in NSCLC
Cells respond to external cues by transferring information from their surface to their
inside. To communicate information, phosphorylation of proteins has evolved as one of the
most common modalities of signal transduction. (Ullrich and Schelessinger 1990). Protein
phosphorylation is mediated by the protein kinase family, one of the largest enzyme super-
families in higher eukaryotes (Manning et al. 2002). Deregulation of kinase activity has been
observed in multiple pathological conditions. In particular in the case of NSCLC,
amplifications and mutations in members of a particular class of kinases, the receptor
tyrosine kinases super-family, have been shown to be causing the disease. Thereby, a better
understanding of the signaling network governed by RTKs can provide important insights
into mechanisms controlling cell growth and oncogenic transformation.
Mass Spectrometry (MS) is a sensitive and specific analytical tool that has been
routinely and successfully applied to the identification and characterization of tyrosine
phosphorylation-dependent signaling networks across biological systems. In collaboration
with Dr. White’s laboratory I utilized MS-based studies to identify components of signaling
pathways downstream EGFR and PDGFR. As described before, PDGFR and EGFR are
aberrantly activated in NSCLC due to gene amplification, missense mutations or small in
frame deletions.
To compare changes in signaling downstream of oncogenic EGFR mutations and
PDGFR in NSCLC, I utilized as a cell system based on H1650 cells ectopically expressing
PDGFR in a doxycycline-inducible manner (See Chapter 4.5 for a detailed description of
these cells). Of note, in cells subjected to doxycycline the PDGFR receptor is in an off-state
unless PDGF ligand is added to the culture. To identify experimental conditions in which
phosphorylation of target proteins was at its highest level, I tested different protocols in
which I varied the time of serum starvation and stimulation of cells with EGF and PDGF-BB.
Maximum phosphorylation levels were reached when I induced the expression of PDGFR
for 2 days by treating cells with 1µg/ml of doxycycline, serum starved the cells for 16 hours
and pulsed the cells twice with 10 ng of either PDGF-BB or EGF at 16 hours and again 15
minutes prior to harvesting the cells. To further confirm the specificity of signaling I also
treated cells with PDGFR and EGFR inhibitors as indicated in Figure A.1.2.
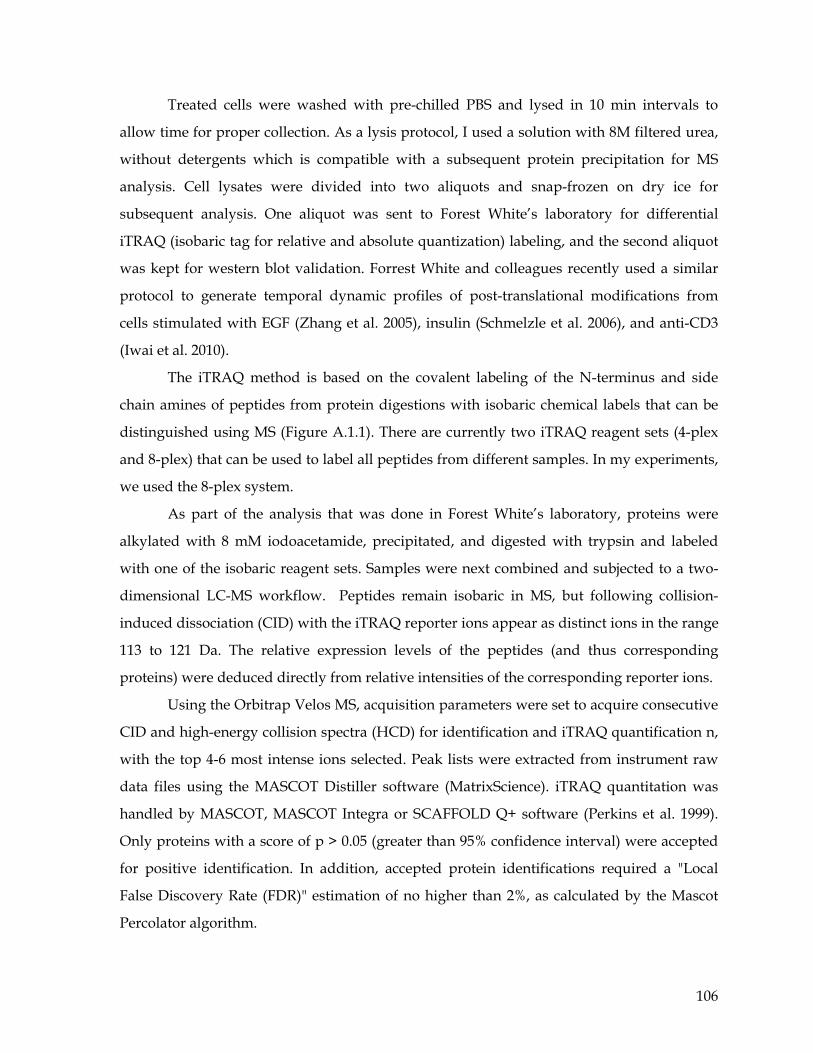
106
Treated cells were washed with pre-chilled PBS and lysed in 10 min intervals to
allow time for proper collection. As a lysis protocol, I used a solution with 8M filtered urea,
without detergents which is compatible with a subsequent protein precipitation for MS
analysis. Cell lysates were divided into two aliquots and snap-frozen on dry ice for
subsequent analysis. One aliquot was sent to Forest White’s laboratory for differential
iTRAQ (isobaric tag for relative and absolute quantization) labeling, and the second aliquot
was kept for western blot validation. Forrest White and colleagues recently used a similar
protocol to generate temporal dynamic profiles of post-translational modifications from
cells stimulated with EGF (Zhang et al. 2005), insulin (Schmelzle et al. 2006), and anti-CD3
(Iwai et al. 2010).
The iTRAQ method is based on the covalent labeling of the N-terminus and side
chain amines of peptides from protein digestions with isobaric chemical labels that can be
distinguished using MS (Figure A.1.1). There are currently two iTRAQ reagent sets (4-plex
and 8-plex) that can be used to label all peptides from different samples. In my experiments,
we used the 8-plex system.
As part of the analysis that was done in Forest White’s laboratory, proteins were
alkylated with 8 mM iodoacetamide, precipitated, and digested with trypsin and labeled
with one of the isobaric reagent sets. Samples were next combined and subjected to a two-
dimensional LC-MS workflow. Peptides remain isobaric in MS, but following collision-
induced dissociation (CID) with the iTRAQ reporter ions appear as distinct ions in the range
113 to 121 Da. The relative expression levels of the peptides (and thus corresponding
proteins) were deduced directly from relative intensities of the corresponding reporter ions.
Using the Orbitrap Velos MS, acquisition parameters were set to acquire consecutive
CID and high-energy collision spectra (HCD) for identification and iTRAQ quantification n,
with the top 4-6 most intense ions selected. Peak lists were extracted from instrument raw
data files using the MASCOT Distiller software (MatrixScience). iTRAQ quantitation was
handled by MASCOT, MASCOT Integra or SCAFFOLD Q+ software (Perkins et al. 1999).
Only proteins with a score of p > 0.05 (greater than 95% confidence interval) were accepted
for positive identification. In addition, accepted protein identifications required a "Local
False Discovery Rate (FDR)" estimation of no higher than 2%, as calculated by the Mascot
Percolator algorithm.
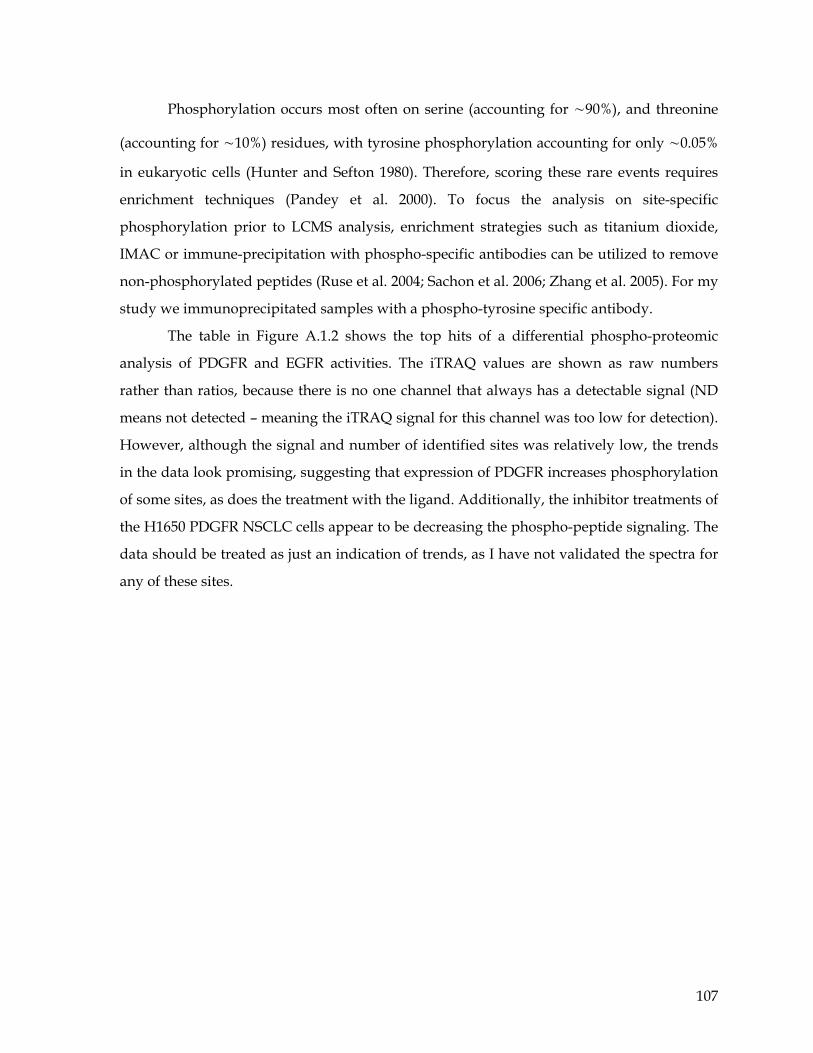
107
Phosphorylation occurs most often on serine (accounting for ∼90%), and threonine
(accounting for ∼10%) residues, with tyrosine phosphorylation accounting for only ∼0.05%
in eukaryotic cells (Hunter and Sefton 1980). Therefore, scoring these rare events requires
enrichment techniques (Pandey et al. 2000). To focus the analysis on site-specific
phosphorylation prior to LCMS analysis, enrichment strategies such as titanium dioxide,
IMAC or immune-precipitation with phospho-specific antibodies can be utilized to remove
non-phosphorylated peptides (Ruse et al. 2004; Sachon et al. 2006; Zhang et al. 2005). For my
study we immunoprecipitated samples with a phospho-tyrosine specific antibody.
The table in Figure A.1.2 shows the top hits of a differential phospho-proteomic
analysis of PDGFR and EGFR activities. The iTRAQ values are shown as raw numbers
rather than ratios, because there is no one channel that always has a detectable signal (ND
means not detected – meaning the iTRAQ signal for this channel was too low for detection).
However, although the signal and number of identified sites was relatively low, the trends
in the data look promising, suggesting that expression of PDGFR increases phosphorylation
of some sites, as does the treatment with the ligand. Additionally, the inhibitor treatments of
the H1650 PDGFR NSCLC cells appear to be decreasing the phospho-peptide signaling. The
data should be treated as just an indication of trends, as I have not validated the spectra for
any of these sites.
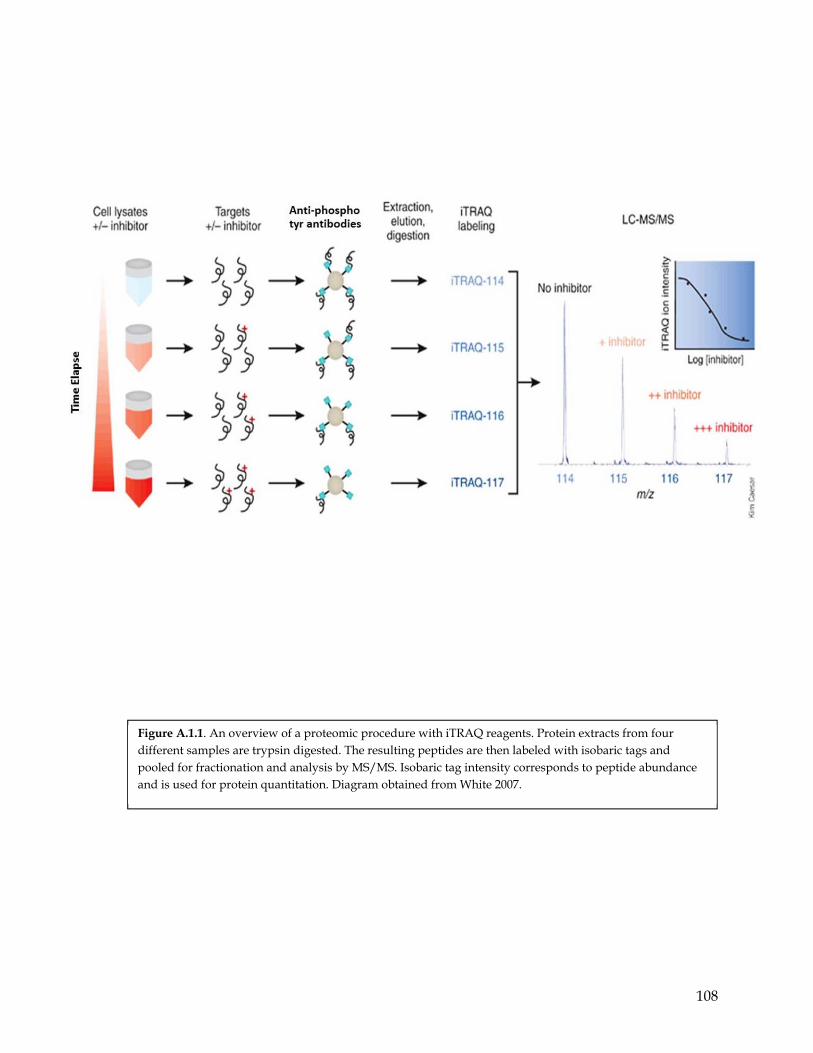
108
Figure A.1.1. An overview of a proteomic procedure with iTRAQ reagents. Protein extracts from four different samples are trypsin digested. The resulting peptides are then labeled with isobaric tags and pooled for fractionation and analysis by MS/MS. Isobaric tag intensity corresponds to peptide abundance and is used for protein quantitation. Diagram obtained from White 2007.
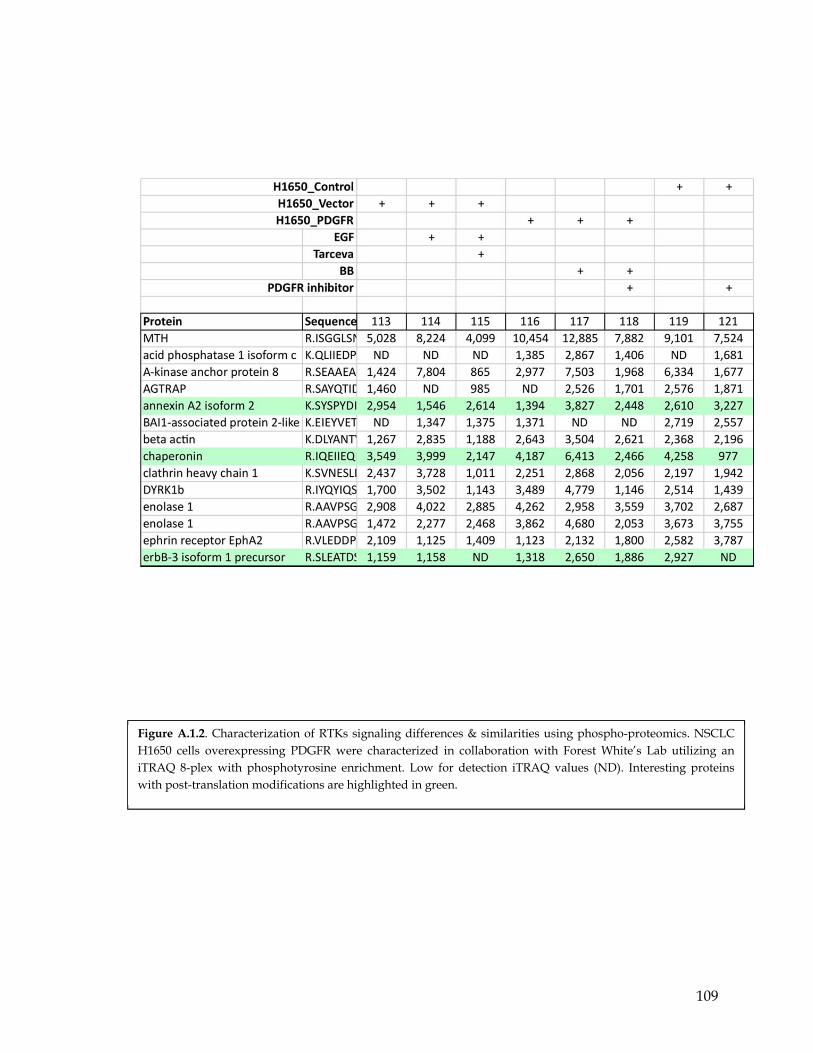
109
Figure A.1.2. Characterization of RTKs signaling differences & similarities using phospho-proteomics. NSCLC H1650 cells overexpressing PDGFR were characterized in collaboration with Forest White’s Lab utilizing an iTRAQ 8-plex with phosphotyrosine enrichment. Low for detection iTRAQ values (ND). Interesting proteins with post-translation modifications are highlighted in green.
110
Appendix ii: Functional genomic screens to interrogate signaling differences
among RTKs
It has been observed that cells with EGFR oncogenic mutations when expressing
PDGFR become more resistant to treatment with EGFR selective inhibitors that cells not
expressing PDGFR. We reasoned that this could be accounted for by PDGFR-induced
differences in the signaling network. This implies that cells expressing EGFR or PDGFR
should be distinctly sensitive in the inactivation of signaling network components required
for their proliferation or survival.
In the late 1990’s and early 2000’s, the discovery of RNA interference (RNAi)
provided a technology to perform genetic screen in mammalian cells (Fire et al. 1998;
Brummelkamp et al. 2002; Paddison et al. 2004b; Silva et al. 2005). RNAi is a sequence-
specific, post-transcriptional gene-silencing process that is mediated by double-stranded
RNA (dsRNA) molecules (reviewed in Moffat and Sabatini 2006). To identify EGFR and
PDGFR regulated signaling constituents I utilized a functional genomic approach using
RNAi technology developed by the laboratory of Dr. Hannon. In principle, this
methodology allows for the identification of signaling components in the RTK pathways
that are required for the survival and/or proliferation of cells. In contrast to the other
strategies that I utilized in my studies, this approach might identify signaling components
that are not directly regulated by RTK phosphorylation.
During the past decade at CSHL Dr. Hannon’s laboratory has developed a blueprint
that allows to effectively and functionally interrogate the human genome using RNAi-based
strategies. RNAi screens can be carried out using either siRNA-based transient transfection
or shRNA-based stable gene knockdown. Vector-based shRNA libraries have several unique
advantages that make them particularly attractive: targets can be screened in pools, thus
significantly reducing the cost of the screen and they enable long-term gene knockdown
thereby revealing phenotypic changes that may not materialize with short term strategies.
A number of genome-wide shRNA libraries covering the human and mouse
genomes have been constructed. They differ in size, coverage, shRNA sequence design, and,
most importantly, strategies used to generate the miRNA-mimicking sequences for gene
silencing. As opposed to other libraries that utilize RNA polymerase III to drive
transcription, those developed at CSHL make use of the RNA polymerase II promoter.
111
Furthermore, we express hairpin RNAs in the context of a natural miRNA, miR-30 (125
bases 5’ and 3’ of the pri-miR-30 sequence), to mimic the pri-miRNA for RNAi. This
strategy has proven to be up to 12 fold more efficient than other designs in causing gene
silencing.
Specifically, I have utilized the Version-2 library (V2), which contains approximately
10,000 shRNAs with 2-3 dedicated shRNAs per gene. This second-generation Hannon-
Elledge shRNA library is a collection of ten thousand shRNAs covering roughly three
thousand genes that have been shown to be involved in tumorigenesis. The shRNAs in the
library are directed against genes involved in kinase or phosphatase signaling, the cell cycle,
apoptosis, transporter activity and the cytoskeleton (Silva et al. 2005). The 22-nt sequences
that comprise the shRNAs were designed by Rosetta Inpharmatics (Kirkland, USA) using
proprietary algorithms based on empirical testing of thousands of siRNAs. These
algorithms introduce positional biases and thermodynamic rules suggested by analysis of
siRNA and endogenous miRNA incorporation into the RISC complex. The V2 library exists
in multiple forms differing in the vector used as a vehicle for shRNA delivery. The one used
is based on the pSMP retroviral vector, which was developed to maximize expression of the
shRNA to allow gene silencing at single copy viral integration.
A particular feature of note for the library is its traceable shRNA expression.
Because it utilizes RNA Pol II to drive the shRNA expression, a reporter fluorescence
marker (i.e., GFP) can be directly placed in front of the Mir30-shRNA cassette. The reporter
can thus faithfully track shRNA expression quantitatively. This feature enables one to select
for cells with the desired level of knockdown. Additionally, the presence of a unique 60
nucleotide sequence for each plasmid allows for the identification of a specific shRNA
vector within a pooled population. Hence, unlike RNAi libraries that can only be screened
in a well-by-well format, the presence of the unique bar-coding system allows screening to
be conducted in a pooled manner.
As mentioned earlier, pooled shRNA screens are in principle lower in cost and more
flexible to perform. To identify shRNAs that confer the desired phenotype in the library, the
composition of shRNAs in the pool at the end of the assay is compared with the
composition of the pool at the beginning of the assay. To this end all shRNAs that have been
integrated in the genome are PCR-recovered as a single mixture using universal primers
112
directed against the vector back-bone. The abundance of each shRNA in the mixture is then
measured either by hybridization on custom made microarray containing the complement
barcode sequences of the entire shRNA library or by next-generation sequencing of the
genomic DNA extracted from the pool of cells.
By using this methodology, I set out to perform a functional genomic screen in lung
adenocarcinoma cell lines that express mutant EGFR and/or PDGFR and that are sensitive
to the molecular inhibition of either of these RTKs. The screens in this study where designed
to be either straight lethal or synthetic lethal screens. Straight lethal screens identify shRNAs
that kill cells over time. These lethal shRNAs often identify genes that effect growth and
survival and are thus selected out over time (Silva et al. 2008). Treatment of certain cells
with kinase inhibitors in combination with shRNAs have been shown to produce a synthetic
lethal effect (O’Connell et al. 2010; Bivona et al. 2011).
The first screen I performed was in the NSCLC cell line H1703. This NSCLC cell line
displays overexpression and activation of PDGFR, as well as increased sensitivity to
treatment with a specific PDGFR inhibitor. As a first step, I amplified the 10K second-
generation shRNA library and prepared it for transfection. The library was then transfected
into an amphotropic phoenix packaging cell line. Virus produced by this packaging cell line
was then used to infect H1703 cells. To achieve a good representation, I infected more than
500 cells per individual shRNA, with a target of 1000 cells per shRNA. Each experiment was
conducted in triplicate in 15-cm dishes. Some of the cells were harvested (T0) after 48h,
when the virus was anticipated to have integrated into the genome and is expressed at very
low level. Cells were then selected in puromycin to generate a uniform cell population
expressing the shRNA library. After 72h on puromycin selection were completed, H1703
cells were allowed to recover for one week and then trypsinized; half of the cells were
collected (T1), and the rest were utilized for further treatment with selective RTK inhibitors
at two different concentrations (IC20 and IC80). For H1703 cells, we used a specific PDGFR
inhibitor and DMSO as a control for the drug treatment (IC0). Only after the DMSO control
plate reached confluency, a subset of cells was collected again (T2). The remaining cell
population was maintained under inhibitor treatment for approximately 2 more weeks and
again collected (T5).
113
After all the collections were performed, genomic DNA was extracted for each time
point. The shRNAs were then amplified using barcode-specific PCR primers followed by gel
extractions to provide high-quality DNA for microarray. The PCR products were then
differentially labeled with two dyes: Cy-3 was used to label the sample library and Cy-5 was
used to label the control library. Control and sample libraries were mixed in equal amounts
and applied to the chambers of the microarray slides. Ideally, large amounts of DNA should
be labeled and purified. To reduce variation, in our screen we always hybridized 1micro-
gram or more to an Agilent array containing the complement barcode sequences of the
entire shRNA library (Figure A.2.1.A).
The microarray was then scanned, and the results were analyzed by Joel Parker, a
bioinformatician consulting for the Hannon lab, using a variety of statistical techniques,
such as principal component analysis (PCA) and false discovery rate (FDR) (Figure A.2.1).
Comparison of shRNA expressed at T0 vs. subsequent time points provided a list of lethal
genes whose expression was required for the survival of the cells. In addition, the synthetic
lethal genes were identified by measuring the abundance of barcodes within the mixed
population of the enriched or depleted shRNAs resulting from treatment with the TK
inhibitors (Figure A.2.1.D).
The normalization plots showed that 9256 probes were found in all 9 T0 samples,
suggesting that a high-quality percentage had been obtained from the 10K library (Figure
A.2.1.B). The principal component graph also suggested a technical variation between chips
and between different hybridizations for each screen, indicating selection of particular
shRNAs over time (Figure A.2.1.C).
Next, I performed a screen in two more NSCLC cell lines, a cell line resistant to
erlotinib that contains two EGFR mutations (H1975) and a cell line sensitive to erlotinib
(H4006). H4006 cells contain an 18 bp in-frame deletion found in exon 19. Also in this case
the normalization plots reflecting the negative controls to select hairpins measured for both
screens resulted in 9,555 hairpins for further analysis (Figure A.2.2.B). PCA indicated that
the primary variation between screens was due to differences in cell lines. In addition, the
repeatability within each of the experimental conditions was high, with median probe
coefficients of variations less than or equal to 6%.

114
Additionally, we determined genes that when silenced produce a straight lethal
effect (T0 unselected vs. T5 selected) in all the cell lines we analyzed (H1703, PC9, H4006,
H1650, H1975 and M3 -a derivative of H1650 that is resistant to erlotinib) (Figure A.2.2).
The data are still very preliminary, further statistical and bio-informatics analysis is
needed to identify common and unique synthetic lethal genes in erlotinib sensitive cell lines
(PC9, H4006, and H1650) and resistant cell lines (H1703, H1975 and M3). These candidate
genes will then have to be thoroughly validated in subsequent endeavors.
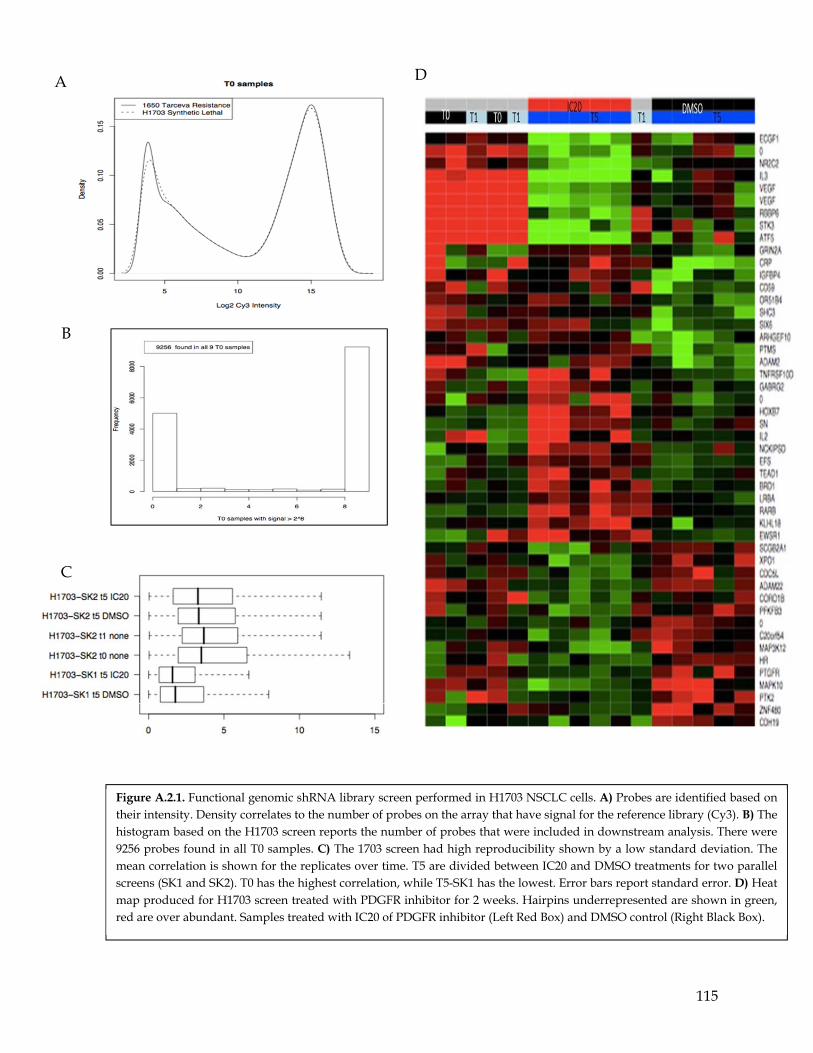
115
Figure A.2.1. Functional genomic shRNA library screen performed in H1703 NSCLC cells. A) Probes are identified based on their intensity. Density correlates to the number of probes on the array that have signal for the reference library (Cy3). B) The histogram based on the H1703 screen reports the number of probes that were included in downstream analysis. There were 9256 probes found in all T0 samples. C) The 1703 screen had high reproducibility shown by a low standard deviation. The mean correlation is shown for the replicates over time. T5 are divided between IC20 and DMSO treatments for two parallel screens (SK1 and SK2). T0 has the highest correlation, while T5-SK1 has the lowest. Error bars report standard error. D) Heat map produced for H1703 screen treated with PDGFR inhibitor for 2 weeks. Hairpins underrepresented are shown in green, red are over abundant. Samples treated with IC20 of PDGFR inhibitor (Left Red Box) and DMSO control (Right Black Box).
A
B
C
D
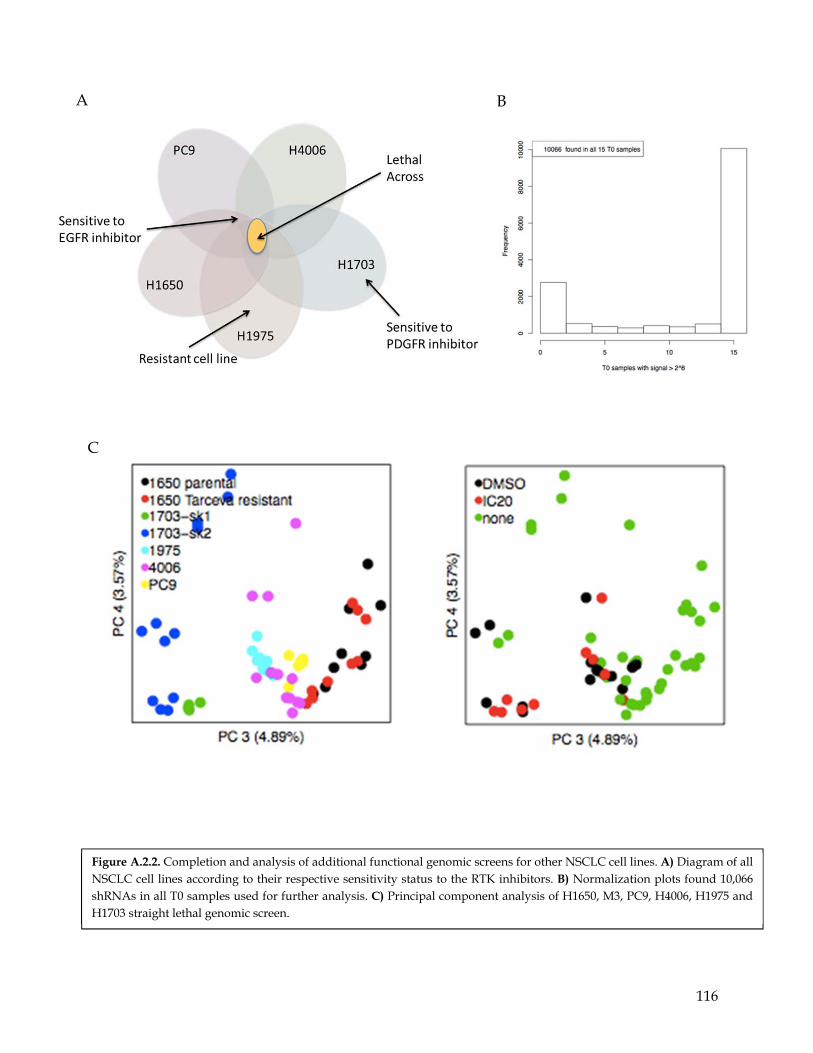
116
Figure A.2.2. Completion and analysis of additional functional genomic screens for other NSCLC cell lines. A) Diagram of all NSCLC cell lines according to their respective sensitivity status to the RTK inhibitors. B) Normalization plots found 10,066 shRNAs in all T0 samples used for further analysis. C) Principal component analysis of H1650, M3, PC9, H4006, H1975 and H1703 straight lethal genomic screen.
A B
C

117
SECTION V
118
MATERIALS AND METHODS
Cell culture
H1650 (H1650), H1703 (NCI-H1703), H1975 (NCI-H1975), HCC4006 were obtained
from the American Type Culture Collection (ATCC) repository. All the cell lines were
cultured in RPMI supplemented with 5% FBS, glutamine, penicillin, and streptomycin. The
lentiviral packaging cell line HEK293T was cultured in DMEM containing 10% FBS,
penicillin, streptomycin, and sodium pyruvate.
Antibodies and reagents The following antibodies were used in this study: mouse anti-Flag M2 (F1804,
Sigma), rabbit anti-PDGFRα (3164, Cell Signaling Technology), mouse anti-phosphotyrosine
clone 4G10(05-321, Millipore), mouse anti-RASGAP antibody (BD Transduction
Laboratories), mouse anti-STAT3 antibody (124H6, Cell Signaling Technology), and rabbit
anti- phospho-STAT3 antibody (D3A7, Cell Signaling Technology), goat polyclonal anti-
SOCS3-M20 antibody (sc-7009, Santa Cruz Biotechnology), mouse anti-beta-Tubulin
antibody (2-28-33, Santa Cruz Biotechnology).
erlotinib hydrochloride was purchased from LGM Pharmaceuticals, Inc. Recombinant
interlukin-6 (rhIL-6), were obtained from R&D Systems. Human recombinant PDGF-BB was
purchased from Millipore. For stimulation, the cells were starved in medium without fetal
bovine serum and treated with 10 ng/ml IL-6 and 1 ng/ml PDGF-BB. The inhibitor MG132
(Calbiochem) was dissolved in DMSO and used at a concentration of 10 um.
Preparation of lysate from cell culture The cell culture dish was placed on ice and washed with ice-cold PBS. The PBS was
drained, and then ice-cold lysis buffer was added (1 ml per 107 cells/100mm dish/150cm2
flask; 0.5ml per 5x10⁶ cells/60mm dish/75cm2 flask). Adherent cells were scraped off the
dish using a cold plastic cell scraper; the cell suspension was transferred into a pre-cooled
eppendorf tube. In a microcentrifuge at 4°C all samples were centrifuged for 30minutes at
13,000 rpm. The tubes were removed from the centrifuge and placed on ice, the supernatant
was transferred into a fresh 1.5ml eppendorf tube always maintained on ice, and the pellet
was discarded.
119
Lysis buffers RIPA buffer (Radio Immuno Precipitation Assay buffer) 50mM Tris pH. 8.0, 150mM
NaCl, 0.1% SDS (sodium dodecyl sulphate), 0.5% Sodium deoxydolate, 1.0% Triton X-100 in
H20 and filtered with Corning 0.22µm stored at 4˚C for up to 3 Years. To prevent
proteolysis, dephosphorylation and denaturation from occurring the inhibitors below were
always added fresh to the lysis buffer before the cell collections. For all western blots we
used ready to use Cocktail 25X (Invitrogen), NaF (10mM), NaVn (0.1M) and DTT (0.5mM).
Determination of protein concentration Perform a BCA (bicinchoninic acid) assay (Thermo Scientific Pierce). Using Bovine
serum albumin (BSA) as the protein standard. RIPA buffer with protease and phosphatase
inhibitors was used to dilute the standards into six decreasing concentrations of BSA
(20µg/µl). The amount for each reagent A and B was calculated and mixed in a falcon tube
for a minute. All samples were measured in triplicates using 2µl in each well plus 50µl of the
BCA mixture and incubated for 30 minutes at 37˚C. The BCA/copper complex is water-
soluble and exhibits a strong linear absorbance at 562 nm with increasing protein
concentrations. Plates were read using SpectraMax 190 from Molecular Devices provided by
the Tonks Laboratory and analyzed using SOFTmax PRO software. The concentration of
each sample was determined and 20ng for all protein samples was calculated for loading.
Samples were either frozen at -20°C or -80°C for later use or prepared for
immunoprecipitation or for loading onto a SDS-PAGE gel using 6X Laemmli buffer.
Western Blotting Western blots were used to confirm the overexpression or knockdown of shRNAs on
specific proteins as well as to assess the effects on cellular signaling mechanisms. Western
blots were performed using either Laemmli 6X or RIPA buffer. SDS-PAGE (for Sodium
Dodecyl Sulfate PolyAcrylamide Gel Electrophoresis) was performed and wet transferred at
4˚C into nitrocellulose membranes. To check for success of transfer the membrane was
stained with Ponceau Red and blocked with 5% milk or BSA solution. Blots were scanned
on the Odyssey Fluorescent Scanner using secondary antibodies from Licor Biosciences.
(926-32212 IRDye 800CW Donkey anti-Mouse IgG, and 926-32211 IRDye 800CW Goat anti-
120
Rabbit IgG). Pierce ECL Western Blotting Substrate was also used with HRP-conjugated
secondary antibodies from GE Healthcare (Rabbit IgG, HRP-Linked F(ab)2 Fragment from
donkey and ECL Mouse IgG, HRP-Linked F(ab')2 Fragment (from sheep). Blots were
exposed to autoradiographic films for one to three minutes and then developed using
Kodak XoMat 2000A.
Protein Expression The pGEX-6P-1 GST expression vector containing SOCS3 WT, FFIF, DDID cDNA
were transformed into E. coli strain, BL21(DE3) and plated in LB-amp Agar plates.
Individual colonies were inoculated in 5ml of LB-amp overnight and grown at 37˚C (until
A600 = 1-2). Pre-culture was diluted into 150 mL LB-amp broth and cultures were grown
with shaking (250 rpm) for 1-2 hours at 37˚ C (until A600 = 0.5). Then, expression of fusion
proteins was induced by adding isopropyl-ß D-thiogalactoside (IPTG) to 0.1 mM final
concentration and the cells were allowed to grow for an additional 3-5 hours at 37°C. Cells
were harvested by centrifugation at 4000 rpm for 10 min, supernatant was discarded, pellet
was suspended in 1mL of lysis buffer, and sonicated to lyse cells at 50% duty cycle for 5min
each. Cell debris was spinned down and stored at -80C or incubated with washed
glutathione beads at 4C from 4-16h rotating. Samples were treated with 1X SDS-PAGE
buffer, run on SDS- PAGE and stained with Coomassie Blue.
In vitro GST-SOCS3 Kinase Assay 500 ng to 1µg/ml of glutathione S-transferase-tagged proteins (wt and mutants
SOCS3) were first incubated with Glutathione beads previously washed and resuspended in
binding buffer (50 mM Tris pH 7.4, 150 mM NaCl, 2 mM EDTA) for 4 hours to overnight at
4˚C with constant agitation. The beads-protein complexes were washed 3 times with
washing buffer (50 mM Tris pH 7.4, 150 mM NaCl, EDTA 2 mM, NP40 1%) and then
incubated with 100ng of kinase for 2 hours at 30˚ C or 1 hour at 37˚ C with agitation in 10
mM MOPS, 1 mM EGTA and 0.1% Triton X-100 0.1 mM Na3VO4 (reaction buffer), and 10
mM MnCl2, 1 mM DTT, 0.5 mM Na3VO4, 0.5 mM NaF3, Mg2+ and ATP mix (Millipore 1:1
dilution) diluted in 2.5 mM Hepe pH 7.4, 50 mM, 0.5mM ATP with 1 mCi/100µl y-[32P]
ATP (3000Ci/mMol) to allow visualization of phosphorylation via autoradiography and
phosphor imaging reaction were terminated by adding Laemmli buffer. After incubation,
121
the reactions were boiled and subjected to analysis by SDS-PAGE. Radioactive signals were
detected using a Fujifilm FLA-5100 instrument (Fuji Medical Systems USA, Inc.), and band
intensities were quantified using Multi- Gauge v2.3 software (FujiFilm).
Steady-State Kinetics
Michaelis/Menten analysis requires the use of a high enzyme-to-substrate ratio so
that product formation is linearly proportional to time. Substrate concentration must be
RKM to approach saturation and allow accurate determination of Vmax. Therefore, 100 nM
either EGFR or PDGFR were used to phosphorylate 0–5 mM GST-SOCS3 WT in these
assays. The reactions were performed as for the kinase assay described above, but in the
presence of decreasing concentration of substrate. After incubation, the reactions were
imaged as above and analyzed using Prism 5 (GraphPad Software).
Peptide library screen The peptide library that employed was synthesized by Primm, Biotech Inc. on a scale
of 5 mg per peptide mixture. Degenerate positions were prepared by coupling mixtures of
the 20 naturally occurring amino acids. Crude peptide mixtures were dissolved in DMSO
and quantified by absorbance at 280 nm. Stock solutions were adjusted to 25 mM by adding
the appropriate volume of DMSO and stored at –20ºC. Working 0.5 mM aqueous stocks
were prepared by diluting the DMSO stock rapidly into 50 mM HEPES, pH 7.4. Aqueous
solutions were aliquotted into 96-well polypropylene stock plates in 40 µl aliquots, sealed
with aluminum adhesive foil, and stored at –20ºC.
Assays were performed by dispensing reaction buffer (40 mM MOPS, pH 7, 1mM EDTA)
into 96-well plates. Peptides were transferred to assay plates from stock plates manually
using a multi-channel pipette. Reactions were initiated by adding reaction buffer containing
400 µM cold ATP with 0.1-0.2 µCi/µl ã-[32P]-ATP and protein kinase diluted in (20mM
MOPS, pH 7.0, 1 mM EDTA, 5% glycerol, 0,1 mercaptoethanol 1mg/ml BSA). The final
concentrations of the reaction components will be 50 µM peptide and 100 µM ATP at a
specific activity of 0.25-0.5 mCi/pmol. The concentration of ATP corresponded to
approximately 5 times the predicted km using an optimal peptide as substrate (e.g.
DNDYINA).
122
Approximately 10 ng of kinases were used per well, and kinase reactions were incubated at
30ºC for 30 minutes (linear range). After completion 5ul from each reaction were spotted
onto avidin-coated filter sheets (Promega SAM2 biotin capture membrane). Spots occupy
approximately 16 mm2 area and contain 100 pmol peptide; according to the manufacturer
the membrane capacity for this area is 200 pmol. Membranes were washed three times with
10 mM Tris-HCl, pH 7.4, 140 mM NaCl, 0.1% SDS, three times with 2 M NaCl, twice with 2
M NaCl, 1% H3PO4, and twice with water, dried, and exposed to a phosphorimager screen
overnight. Radioactive signals were detected using a Fujifilm FLA-5100 instrument (Fuji
Medical Systems USA, Inc.), and spot intensities were quantified using Multi- Gauge v2.3
software (FujiFilm).
Immunoprecipitation (IP) Approximately, 3×10⁷ cells were lysed in 500–1000 µl of lysis buffer (1% Triton X-
100, 20 mm Tris/HCl (pH 7.6), 150 mm NaCl, 10 mm NaF supplemented with 1 mm
Na3VO4, 1 mm phenylmethylsulfonyl fluoride, 5 µg/ml aprotinin, 5 µg/ml leupeptin, 5
µg/ml pepstatin, and 10 um MG132) for 30 min at 4 °C. Insoluble material was removed by
centrifugation, and cell lysates were precleared with washed protein A-Sepharose beads
(Amersham Biosciences) for 1 h at 4 °C collect input. After removal of the Sepharose, the
lysates (1–3 mg of protein) were incubated overnight rotating with EZview Red ANTI-
FLAG M2 Affinity Gel (F2426, Sigma-Aldrich) at 4 °C. After centrifugation the beads were
washed 3 times with washing buffer (0.1% Triton X-100, 20 mm Tris/HCl (pH 7.6), 150 mm
NaCl, 10 mm NaF, 1 mm Na3VO4).
Immunoblots Immunoprecipitates were eluted by boiling in 1X Laemmli buffer at 95°C for 5 min
and resolved by SDS-PAGE, transferred to nitrocellulose membranes (Bio-Rad), and blotted
with antibodies as indicated.
Mammalian expression vectors A Flag tag encoding sequence was added to the N terminus of SOCS3 wild-type and
mutant by PCR, and the resulting fragments were cloned into EcoRI/BamHI sites of into
pMSCV- pTREtight-GFP with rtTA-IRES-Hygro (a gift from S. Lowe, CSHL). All constructs
123
used in this study were sequence verified. SOCS3 wt and mutant were PCR amplified from
the vector above and ligated into pEntry4 and recombined into pLenti6/UbC/V5-DEST™
Gateway® Vector (Invitrogen™).
PCR and mutagenesis PCR was performed using 5µl of cDNA in a total of 100µl reaction mixtures
containing 10 µM deoxynucleoside triphosphate (dNTP) mix (Roche), 10µl of ThermoPol
buffer (NEB), 1µl of Taq DNA polymerase (NEB), and 1mM each primer. Amplification of
SOCS3 was performed using the following primers:
EcoRI-flag-socs3-F:
5’GGAATTCATGGACTACAAGGACGACGATGACAAGCTCGATGGAGGAatggtcacccaca
gcaag-3’
BamHI-flag-socs3-R:
5’gcggatccTCAGGCGTAGTCGGGCACGTCGTAGGGGTAaagcggggcatcgtactg-3’
BamHI-Flag-SOCS3-F:
5’ggatccATGGACTACAAGGACGACGATGACAAGatggtcacccacagcaa-3’
ECORI-SOCS3-R: 5’-GGAATTCAAGCGGGGCATCGTTACTG-3’
Mutagenesis primers
SOCS3_DDID_F 5’-AGCCGATGACATCGACTCCGG-3’
SOCS3_DDID_R 5’-GTCGATGTCATCGGCTCTTCT-3’
SOCS3 FFIF_F 5’-AGCCTTTTTCATCTTCTCCGG-3’
SOCS3 FFIF_R 5’-GAAGATGAAAAAGGCTCTTCT-3’
SOCS3 FFID _F 5’-AGCCTTTTTCATCGACTCCGG-3’
SOCS3 FFID_R 5’-GTCGATGAAAAAGGCTCTTCT-3’
SOCS3 FDIF_F 5’-AGCCTTTGACATCTTCTCCGG-3’
SOCS3 FDIF_R 5’-GAAGATGTCAAAGGCTCTTCT-3’
SOCS3 DFIF_F 5’-AGCCGATTTCATCTACTCCGG-3’
SOCS3 DFIF_R 5’-GAAGATGAAATCGGCTCTTCT-3’
PDGFR cloning
PDGFRA_F1 5’-TGAAGGCACGCCGCTTCCTG-3’
PDGFRA_R1 5’-ACGGCCCTCCACGGTACTCC-3’
PDGFRA F2 5’-CGCCAGGCTACCAGGGAGGT-3’
124
PDGFRA R2 5’-CAGGAAGCGGCGTGCCTTCA-3’
PDGFRA F3 5’-CGCCAGGCTACCAGGGAGGT-3’
PDGFRA R3 5’-CCAGGACTGCAGCAGCCACC-3’
PCR parameters used for cDNAs prepared from H1650 cells were 95°C for 5 min,
followed by 35 cycles at 95°C for 45 s, 56°C for 30 s, and 72°C for 1min, and a final step at
72°C for 10 min. PCR products were separated on 2% agarose gels and visualized by
ethidium bromide staining using the U:Genius imaging system (Syngene). PCR products
were purified using PrepEase® Gel Extraction Kit (USB) and digested, ligated into
destination vector described above. Positive clones were sequenced verified. Mutagenesis of
SOCS3 was performed using RACE (rapid amplification of cDNA ends). Modified sequence
primers used for each construct are shown above.
PDGFR cloning was also performed in sections since it is a long transcript of more
than 3.2Kbases. Sections were amplified with the primers above from the inside and then
utilized outside primer with EcoRI/BamHI sites for blunting ends and ligating to tTiGFP
vector.
FACS analysis H1650 over-expressing cells and all other NSCLC cell lines were grown in RPMI
media supplemented with 5% FBS, sodium pyruvate, penicillin, and streptomycin. Cells
were harvested at 70% confluency, dissociated and washed in PBS with 5% FBS. Following
this wash, cells were pelleted and resuspended in solution containing PBS (pH 7.2), 0.5%
bovine serum albumin, and 2 mM EDTA. Counting experiments were performed using an
LSR II flow cytometer (Becton Dickenson); 100,000 events were collected for each sample.
Sorting experiments were done with a BD FACS Aria II cell sorter for GFP cells. Gates were
set using H1650 as a reference population.
Mouse model system
The in vivo mouse experiments were performed by inoculating 3 × 10⁶ H1650
subcutaneously into each flank of immunodeficient Nu/Nu mice on Swiss CD1 background
(Charles River Breeding Laboratories). Mice were given Doxycicline in water after a month.
After the tumors reached a volume of approximately 100 mm3, tumors were weighted and
125
mice dissected for metastasis. Organs with metastatic sites were imaged and stored in fixed
solution.
Drug curves
Drug curves are performed in 96 well plates. Cells are grown in 10cm plates until
they are ~80 percent confluent and growing well. They are then trypsinized and counted.
Cells are plated at a density of 2,000 cells per well in a 96 well plate. Cells are allowed to
attach overnight and then treated with serial dilutions of erlotinib (or other drug). Serial
dilution is performed in a 12 well reservoir and then delivered to the plate using
multichannel pipettes. After 72 hours of drug treatment, cells are washed twice with PBS
and then fixed with 4% formaldehyde. Then, cells are washed with water to remove excess
formaldehyde and stained with Syto-60 (Invitrogen) to stain DNA. Plates are washed with
water again to remove excess stain. Plates are read in the Licor Odyssey scanner.
Fluorescent intensities of each 96well are recorded and the images are then analyzed using
the Licor software. Averages over each set of wells is generated and compared to the
untreated control and reported as percent survival of control, untreated populations.
siRNA-based gene knockdown To target the SOCS3 gene, commercially prepared Stealth RNAi siRNAs I)
HSS113312 and II) HSS113313 III) HSS113313 were obtained from Invitrogen. siRNAs were
transfected into cells using Lipofectamine 2000 (Invitrogen) as per the manufacturer's
instructions. Two days after transfection, mRNA levels were determined by RT-PCR and
protein levels were determined by lyzing the cells in RIPA buffer as previously described.
Stable knockdown was obtained even at 10 days following transfection. mRNA levels were
assessed by RT-PCR.
RNA extraction and quantitative RT-PCR
Total RNA was collected from cultured cells and purified using Trizol reagent
following the manufacturer’s instructions (Invitrogen). Total RNA (500 ng) was subjected to
a reverse transcriptase reaction using the Improm-II Reverse Transcriptase kit (Promega).
cDNA corresponding to approximately 1% of the RNA was used in three replicates for
quantitative PCR with the SYBR GREEN (Applied Biosystems) labeling or for standard
PCR. Indicated Taqman gene expression assays (Applied Biosystems) and the Taqman
126
universal PCR master mix (Applied Biosystems) were used to quantify gene expression.
Quantitative expression data were acquired and analyzed using an ABI (Applied
Biosystems) Sequence Detection System. Primers are listed as follows: SOCS3: Forward
Primer GCCAAGAGGGCGACAAGTT, SOCS3 Reverse Primer
AGGAAAACAGCATACTCCTGGA.
In-gel Digestion and Protein Identification Using Mass Spectrometry Silver-stained protein bands were excised from one-dimensional SDS gels and cut
further into small cubes (∼1 × 1 mm). After in-gel reduction, alkylation, and distaining, the
proteins were digested overnight with trypsin (12 ng/µl). The tryptic peptides were
extracted from gels dried in a vacuum centrifuge and analyzed by electrospray liquid
chromatography-tandem mass spectrometry using a nanoscale C18 column coupled in-line
with an ion trap mass spectrometer (LCQ Deca, Thermo Finnigan). The instrument was set
in a data-dependent acquisition mode, cycling between one full MS scan and MS/MS scans
of the three most abundant ions. The MS and MS/MS data were used to search the
nonredundant NCBI protein database using the MASCOT search engine.
127
Thesis Contributions
Trine Lindsted carried out the earlier EGFR peptide screens, which were repeated several
times. The EGFR peptide screen performed by Trine was selected as the representative
autoradiogram (Figure 2.3). Gordon Assaf and Simon Knott assisted in the bioinformatics
analysis to construct the PSSM logo for EGFR and PDGFR (Figure 2.4). Toni Koller at Stony
Brook University proteomics facility performed the Mass Spec analysis of SOCS3 (Figure 3.3
and 3.5). Zhan Yao guided and assisted in initial experimental design and procedures for
the kinase assay of SOCS3 using specific RTKs. Zhan Yao performed the injection of H1650-
PDGFR cells into nude mice and dissection of mice (Figure 4.5). All other experiments were
conducted by Maria Luisa Pineda.
Daniel Sears from Forrest White’s Laboratory performed the iTRAQ and MS analysis in
Appendix i. All other experiments were conducted by Maria Luisa Pineda.
Ken Chang originally prepared 10K set, and designed the microarrays for hybridization and
was instrumental in screen design (Appendix ii). Johannes Zuber helped with oligo cloning
procedures. Krista Marran and Amy Valentine assisted with virus production. Joel Parker of
UNC/Gene Expression systems performed statistical analysis on microarray data. All other
experiments conducted by Maria Luisa Pineda.

128
SECTION VI
129
REFERENCES
Ablooglu AJ, Till JH, Kim K, Parang K, Cole PA, Hubbard SR, Kohanski RA. 2000. Probing the
catalytic mechanism of the insulin receptor kinase with a tetrafluorotyrosine-containing peptide substrate. Journal of Biological Chemistry 275: 30394-30398.
Agathanggelou A, Honorio S, Macartney DP, Martinez A, Dallol A, Rader J, Fullwood P, Chauhan A, Walker R, Shaw JA et al. 2001. Methylation associated inactivation of RASSF1A from region 3p21.3 in lung, breast and ovarian tumours. Oncogene 20: 1509-1518.
Alexander WS, Starr R, Fenner JE, Scott CL, Handman E, Sprigg NS, Corbin JE, Cornish AL, Darwiche R, Owczarek CM et al. 1999. SOCS1 is a critical inhibitor of interferon γ signaling and prevents the potentially fatal neonatal actions of this cytokine. Cell 98: 597-608.
American Cancer Society. 2012. Lung Cancer (Non-Small Cell). Ambros V. 2003. MicroRNA pathways in flies and worms: growth, death, fat, stress, and timing. Cell
113: 673-676. Amit I, Wides R, Yarden Y. 2007. Evolvable signaling networks of receptor tyrosine kinases: relevance
of robustness to malignancy and to cancer therapy. Molecular systems biology 3: 151. Anderson D, Koch CA, Grey L, Ellis C, Moran MF, Pawson T. 1990. Binding of SH2 domains of
phospholipase C(γ)1, GAP, and Src to activated growth factor receptors. Science 250: 979-982. Arteaga CL. 2003. ErbB-targeted therapeutic approaches in human cancer. Experimental cell research
284: 122-130. Babon JJ, Yao S, Norton RS. 2006. The Structure of SOCS3 Reveals the Basis of the Extended SH2
Domain Function and Identifies an Unstructured Insertion That Regulates Stability. Mol.Cell 22: 205-216.
Bae JH, Lew ED, Yuzawa S, Tomé F, Lax I, Schlessinger J. 2009. The Selectivity of Receptor Tyrosine Kinase Signaling Is Controlled by a Secondary SH2 Domain Binding Site. Cell 138: 514-524.
Balmain A, Gray J, Ponder B. The genetics and genomics of cancer. Nature genetics. Bartel DP. 2004. MicroRNAs: genomics, biogenesis, mechanism, and function. Cell 116: 281-297. Beausoleil SA, Jedrychowski M, Schwartz D, et al. 2004. Large-scale characterization of HeLa cell
nuclear phosphoproteins. Proceedings of the National Academy of Sciences of the United States of America 101: 12130–12135.
Beau-Faller M, Ruppert AM, Voegeli AC, Neuville A, Meyer N, Guerin E, Legrain M, Mennecier B, Wihlm JM, Massard G et al. 2008. MET gene copy number in non-small cell lung cancer: Molecular analysis in a targeted tyrosine kinase inhibitor naïve cohort. Journal of Thoracic Oncology 3: 331-339.
Beer DG, Kardia SLR, Huang C-C, Giordano TJ, Levin AM, Misek DE, Lin L, Chen G, Gharib TG, Thomas DG et al. 2002. Gene-expression profiles predict survival of patients with lung adenocarcinoma. Nat Med 8: 816-824.
Beckerman R, Prives C. 2010. Transcriptional regulation by p53. Cold Spring Harb Perspect Biol 2: a000935. doi: 10.1101/cshperspect.a000935.
Belinsky SA, Nikula KJ, Palmisano WA, Michels R, Saccomanno G, Gabrielson E, Baylin SB, Herman JG. 1998. Aberrant methylation of p16INK4a is an early event in lung cancer and a potential biomarker for early diagnosis. Proceedings of the National Academy of Sciences of the United States of America 95: 11891-11896.
Benedict W, Murphree A, Banerjee A, Spina C, Sparkes M, Sparkes R. 1983. Patient with 13 chromosome deletion: evidence that the retinoblastoma gene is a recessive cancer gene. Science 219: 973-975.
Bérard J, Laboune F, Mukuna M, Massé S, Kothary R, Bradley WEC. 1996. Lung tumors in mice expressing an antisense RARβ2 transgene. FASEB Journal 10: 1091-1097.
Betticher DC, Heighway J, Hasleton PS, Altermatt HJ, Ryder WDJ, Cerny T, Thatcher N. 1996. Prognostic significance of CCND1 (cyclin D1) overexpression in primary resected non-small-cell lung cancer. British journal of cancer 73: 294-300.
130
Bhattacharjee A, Richards WG, Staunton J, Li C, Monti S, Vasa P, Ladd C, Beheshti J, Bueno R, Gillette M et al. 2001. Classification of human lung carcinomas by mRNA expression profiling reveals distinct adenocarcinoma subclasses. Proc Natl Acad Sci U S A 98: 13790-13795.
Bignell GR, Huang J, Greshock J, Watt S, Butler A, West S, Grigorova M, Jones KW, Wei W, Stratton MR et al. 2004. High-Resolution Analysis of DNA Copy Number Using Oligonucleotide Microarrays. Genome Research 14: 287-295.
Bivona TG, Hieronymus H, Parker J, Chang K, Taron M, Rosell R, Moonsamy P, Dahlman K, Miller VA, Costa C et al. 2011. FAS and NF-#B signalling modulate dependence of lung cancers on mutant EGFR. Nature: 523-526.
Bjørbæk C, Elmquist JK, El-Haschimi K, Kelly J, Ahima RS, Hileman S, Flier JS. 1999. Activation of SOCS-3 messenger ribonucleic acid in the hypothalamus by ciliary neurotrophic factor. Endocrinology 140: 2035-2043.
Bjørbæk C, Elmquist JK, Frantz JD, Shoelson SE, Flier JS. 1998. Identification of SOCS-3 as a potential mediator of central leptin resistance. Molecular Cell 1: 619-625.
Blagoev B, Ong SE, Kratchmarova I, Mann M. 2004. Temporal analysis of phosphotyrosine-dependent signaling networks by quantitative proteomics. Nature Biotechnology 22: 1139-1145.
Blencke S, Ullrich A, Daub H. 2003. Mutation of threonine 766 in the epidermal growth factor receptor reveals a hotspot for resistance formation against selective tyrosine kinase inhibitors. The Journal of biological chemistry 278: 15435-15440.
Blons H, Cote JF, Le Corre D, Riquet M, Fabre-Guilevin E, Laurent-Puig P, Danel C. 2006. Epidermal growth factor receptor mutation in lung cancer are linked to bronchioloalveolar differentiation. The American journal of surgical pathology 30: 1309-1315.
Blume-Jensen P, Hunter T. 2001. Oncogenic kinase signalling. Nature 411: 355-365. Blouin J, Roby P, Arcand M, Beaude L, Lipari F. 2011. Catalytic Specificity of Human Protein
Tyrosine Kinases Revealed by Peptide Substrate Profiling.Curr Chem Genomics.; 5: 115–121. Bodenmiller B, Mueller LN, Mueller M, Domon B, Aebersold R. 2007. Reproducible isolation of
distinct, overlapping segments of the phosphoproteome. Nature Methods 4: 231–237. Booker GW, Breeze AL, Downing AK, Panayotou G, Gout I, Waterfield MD, Campbell ID. 1992.
Structure of an SH2 domain of the p85α subunit of phosphatidylinositol-3-OH kinase. Nature 358: 684-687.
Borg JP, Marchetto S, Le Bivic A, Ollendorff V, Jaulin-Bastard F, Saito H, Fournier E, Adelaide J, Margolis B, Birnbaum D. 2000. ERBIN: a basolateral PDZ protein that interacts with the mammalian ERBB2/HER2 receptor. Nat Cell Biol 2: 407-414.
Bose R, Molina H, Scott Patterson A, Bitok JK, Periaswamy B, Baderh JS, Pandey A, Cole PA. 2006. Phosphoproteomic analysis of Her2/neu signaling and inhibition. Proceedings of the National Academy of Sciences of the United States of America 103: 9773-9778.
Bottaro DP, Rubin JS, Faletto DL, Chan AM, Kmiecik TE, Vande Woude GF, Aaronson SA. 1991. Identification of the hepatocyte growth factor receptor as the c-met proto-oncogene product. Science 251: 802-804.
Brady CA, Jiang D, Mello SS, Johnson TM, Jarvis LA, Kozak MM, Broz DK, Basak S, Park EJ, Mclaughlin ME, et al. 2011. Distinct p53 transcriptional programs dictate acute DNA-damage responses and tumor suppression. Cell 145: 571–583.
Brambilla E, Constantin B, Drabkin H, Roche J. 2000. Semaphorin SEMA3F localization in malignant human lung and cell lines: A suggested role in cell adhesion and cell migration. American Journal of Pathology 156: 939-950.
Brose MS, Volpe P, Feldman M, Kumar M, Rishi I, Gerrero R, Einhorn E, Herlyn M, Minna J, Nicholson A et al. 2002. BRAF and RAS Mutations in Human Lung Cancer and Melanoma. Cancer research 62: 6997-7000.
Brummelkamp TR, Bernards R, Agami R. 2002. A system for stable expression of short interfering RNAs in mammalian cells. Science: 550-553.
131
Burbee DG, Forgacs E, Zöchbauer-Müller S, Shivakumar L, Fong K, Gao B, Randle D, Kondo M, Virmani A, Bader S et al. 2001. Epigenetic inactivation of RASSF1A in lung and breast cancers and malignant phenotype suppression. Journal of the National Cancer Institute 93: 691-699.
Burgess AW, Cho HS, Eigenbrot C, Ferguson KM, Garrett TPJ, Leahy DJ, Lemmon MA, Sliwkowski MX, Ward CW, Yokoyama S. 2003. An open-and-shut case? Recent insights into the activation of EGF/ErbB receptors. Molecular Cell 12: 541-552.
Cacalano NA, Sanden D, Johnston JA. 2001. Tyrosine-phosphorylated SOCS-3 inhibits STAT activation but binds to p120 RasGAP and activates Ras. Nature Cell Biology 3: 460-465.
Cagle PT, Dacic S. 2011. Lung cancer and the future of pathology. Archives of pathology & laboratory medicine 135: 293-295.
Cappuzzo F, Marchetti A, Skokan M, Rossi E, Gajapathy S, Felicioni L, Grammastro MD, Sciarrotta MG, Buttitta F, Incarbone M et al. 2009. Increased MET gene copy number negatively affects survival of surgically resected non-small-cell lung cancer patients. Journal of Clinical Oncology 27: 1667-1674.
Chantranuwat C, Sriuranpong V, Huapai N, Chalermchai T, Leungtaweeboon K, Voravud N, Mutirangura A. 2005. Histopathologic characteristics of pulmonary adenocarcinomas with and without EGFR mutation. Journal of the Medical Association of Thailand = Chotmaihet thangphaet 88 Suppl 4: S322-329.
Cheng HC, Matsuura I, Wang JH. 1993. In vitro substrate specificity of protein tyrosine kinases. Mol Cell Biochem. Nov;127-128:103-12.
Cheng KY, Noble MEM, Skamnaki V, Brown NR, Lowe ED, Kontogiannis L, Shen K, Cole PA, Siligardi G, Johnson LN. 2006. The role of the phospho-CDK2/cyclin A recruitment site in substrate recognition. Journal of Biological Chemistry 281: 23167-23179.
Choi YL, Takeuchi K, Soda M, Inamura K, Togashi Y, Hatano S, Enomoto M, Hamada T, Haruta H, Watanabe H et al. 2008. Identification of Novel Isoforms of the EML4-ALK Transforming Gene in Non–Small Cell Lung Cancer. Cancer research 68: 4971-4976.
Cohney SJ, Sanden D, Cacalano NA, Yoshimura A, Mui A, Migone TS, Johnston JA. 1999. SOCS-3 is tyrosine phosphorylated in response to interleukin-2 and suppresses STAT5 phosphorylation and lymphocyte proliferation. Molecular and Cellular Biology 19: 4980-4988.
Cosma G, Crofts F, Taioli E, Toniolo P, Garte S. 1993. Relationship between genotype and function of the human CYP1A1 gene. Journal of toxicology and environmental health 40: 309-316.
Crofts F, Taioli E, Trachman J, Cosma GN, Currie D, Toniolo P, Garte SJ. 1994. Functional significance of different human CYP1A1 genotypes. Carcinogenesis 15: 2961-2963.
Cox C, Bignell G, Greenman C, et al. 2005. A survey of homozygous deletions in human cancer genomes. Proc Natl Acad Sci USA 102: 4542–4547.
Dammann R, Li C, Yoon JH, Chin PL, Bates S, Pfeifer GP. 2000. Epigenetic inactivation of a RAS association domain family protein from the lung tumour suppressor locus 3p21.3. Nature genetics 25: 315-319.
Darnell Jr JE. 1997. STATs and gene regulation. Science 277: 1630-1635. De Sepulveda P, Ilangumaran S, Rottapel R. 2000. Suppressor of cytokine signaling-1 inhibits VAV
function through protein degradation. Journal of Biological Chemistry 275: 14005-14008. Dedhar S, Gaboury L, Galloway P, Eaves C. 1988. Human granulocyte-macrophage colony-
stimulating factor is a growth factor active on a variety of cell types of nonhemopoietic origin. Proceedings of the National Academy of Sciences of the United States of America 85: 9253-9257.
Dickins RA, Hemann MT, Zilfou JT, Simpson DR, Ibarra I, Hannon GJ, Lowe SW. 2005. Probing tumor phenotypes using stable and regulated synthetic microRNA precursors. Nature Genetics. 1289-1295.
Di Cristofano A, Pesce B, Cordon-Cardo C, Pandolfi PP. 1998. Pten is essential for embryonic development and tumour suppression. Nature genetics 19: 348-355.
132
Di Renzo MF, Olivero M, Martone T, Maffe A, Maggiora P, Stefani AD, Valente G, Giordano S, Cortesina G, Comoglio PM. 2000. Somatic mutations of the MET oncogene are selected during metastatic spread of human HNSC carcinomas. Oncogene 19: 1547-1555.
Ding L, Getz G, Wheeler DA, Mardis ER, McLellan MD, Cibulskis K, Sougnez C, Greulich H, Muzny DM, Morgan MB et al. 2008. Somatic mutations affect key pathways in lung adenocarcinoma. Nature 455: 1069-1075.
Druker BJ, Talpaz M, Resta DJ, et al. 2001. Efficacy and safety of a specific inhibitor of the BCR-ABL tyrosine kinase in chronic myeloid leukemia. N Engl J Med 344:1031–7.
Doolittle RF, Hunkapiller MW, Hood LE, Devare SG, Robbins KC, Aaronson SA, Antoniades HN. 1983. Simian sarcoma virus onc gene, v-sis, is derived from the gene (or genes) encoding a platelet-derived growth factor. Science. 221:275–277.
Eberhard DA, Johnson BE, Amler LC, Goddard AD, Heldens SL, Herbst RS, Ince WL, Jänne PA, Januario T, Johnson DH et al. 2005. Mutations in the Epidermal Growth Factor Receptor and in KRAS Are Predictive and Prognostic Indicators in Patients With Non–Small-Cell Lung Cancer Treated With Chemotherapy Alone and in Combination With erlotinib. Journal of Clinical Oncology 23: 5900-5909.
Eck MJ, Shoelson SE, Harrison SC. 1993. Recognition of a high-affinity phosphotyrosyl peptide by the Src homology-2 domain of p56(lck). Nature 362: 87-91.
Elliott J and Johnston J A. 2004. SOCS: role in inflammation, allergy and homeostasis. Trends in Immunology 25: 434–440
Eng C. 1996. The RET proto-oncogene in multiple endocrine neoplasia type 2 and Hirschsprung's disease. N Engl J Med;335:943-951
Engelman JA, Zejnullahu K, Mitsudomi T, Song Y, Hyland C, Joon OP, Lindeman N, Gale CM, Zhao X, Christensen J et al. 2007. MET amplification leads to gefitinib resistance in lung cancer by activating ERBB3 signaling. Science 316: 1039-1043.
Esquela-Kerscher A, Trang P, Wiggins JF, Patrawala L, Cheng A, Ford L, Weidhaas JB, Brown D, Bader AG, Slack FJ. 2008. The let-7 microRNA reduces tumor growth in mouse models of lung cancer.Cell Cycle. 7(6):759-64.
Fauci AS, Braunwald E, Kasper D, Hauser S. 2009. Harrison's Manual of Medicine. McGraw-Hill Medical.
Faux MC, Scott JD. 1996. More on target with protein phosphorylation: Conferring specificity by location. Trends in Biochemical Sciences 21: 312-315.
Fellmann C, Zuber J, McJunkin K, Chang K, Malone CD, Dickins RA, Xu Q, Hengartner MO, Elledge SJ, Hannon GJ et al. 2011. Functional Identification of Optimized RNAi Triggers Using a Massively Parallel Sensor Assay. Molecular Cell: 733-746.
Fire A, Xu S, Montgomery MK, Kostas SA, Driver SE, Mello CC. 1998. Potent and specific genetic interference by double-stranded RNA in Caenorhabditis elegans. Nature: 806-811.
Folkman J, Shing Y. 1992. Angiogenesis. The Journal of biological chemistry 267: 10931-10934. Forbes SA, Bhamra G, Bamford S, Dawson E, Kok C, Clements J, Menzies A, Teague JW, Futreal PA,
Stratton MR. 2008. The Catalogue of Somatic Mutations in Cancer (COSMIC). Current protocols in human genetics / editorial board, Jonathan L Haines [et al] Chapter 10: Unit 10 11.
Forgacs E, Biesterveld EJ, Sekido Y, Fong K, Muneer S, Wistuba II, Milchgrub S, Brezinschek R, Virmani A, Gazdar AF et al. 1998. Mutation analysis of the PTEN/MMAC1 gene in lung cancer. Oncogene 17: 1557-1565.
Forman-Kay JD, Pawson T. 1999. Diversity in protein recognition by PTB domains. Current Opinion in Structural Biology 9: 690-695.
Frantsve J, Schwaller J, Sternberg DW, Kutok J, Gilliland DG. 2001. Socs-1 inhibits TEL-JAK2-mediated transformation of hematopoietic cells through inhibition of JAK2 kinase activity and induction of proteasome-mediated degradation. Molecular and Cellular Biology 21: 3547-3557.
133
Friedman E, Gejman PV, Martin GA, McCormick F. 1993. Nonsense mutations in the C-terminal SH2 region of the GTPase activating protein (GAP) gene in human tumours. Nature genetics 5: 242-247.
Fujita-Yamaguchi, Y. & Kathuria, S. 1988. Characterization of receptor tyrosine-specific protein kinases by the use of inhibitors. Staurosporine is a 100-times more potent inhibitor of insulin receptor than IGF-1 receptor, Biochem. Biophys. Res. Commun. 157, 955–962.
Fujii K, Zhu G, Liu Y, Hallam J, Chen L, Herrero J, Shaw S. 2004. Kinase peptide specificity: Improved determination and relevance to protein phosphorylation. Proceedings of the National Academy of Sciences of the United States of America 101: 13744-13749.
Fujimori M, Ikeda S, Shimizu Y, Okajima M, Asahara T. 2001. Accumulation of beta-catenin protein and mutations in exon 3 of beta-catenin gene in gastrointestinal carcinoid tumor. Cancer research 61: 6656-6659.
Fukada T, Hibi M, Yamanaka Y, Takahashi-Tezuka M, Fujitani Y, Yamaguchi T, Nakajima K, Hirano T. 1996. Two signals are necessary for cell proliferation induced by a cytokine receptor gp130: Involvement of STAT3 in anti-apoptosis. Immunity 5: 449-460.
Fukami T, Fukuhara H, Kuramochi M, Maruyama T, Isogai K, Sakamoto M, Takamoto S, Murakami Y. 2003. Promoter methylation of the TSLC1 gene in advanced lung tumors and various cancer cell lines. International Journal of Cancer 107: 53-59.
Fukuoka M, Yano S, Giaccone G, Tamura T, Nakagawa K, Douillard JY, Nishiwaki Y, Vansteenkiste J, Kudoh S, Rischin D et al. 2003. Multi-institutional randomized phase II trial of gefitinib for previously treated patients with advanced non-small-cell lung cancer (The IDEAL 1 Trial) [corrected]. Journal of clinical oncology : official journal of the American Society of Clinical Oncology 21: 2237-2246.
Fuster LM, Sandler AB. 2004. Select clinical trials of erlotinib (OSI-774) in non-small-cell lung cancer with emphasis on phase III outcomes. Clinical lung cancer 6 Suppl 1: S24-29.
Gafken PR, Lampe PD. 2006. Methodologies for characterizing phosphoproteins by mass spectrometry. Cell Communication and Adhesion 13: 249–62.
Gao HG, Chen JK, Stewart J, Song B, Rayappa C, Whong WZ, Ong T. 1997. Distribution of p53 and K-ras mutations in human lung cancer tissues. Carcinogenesis 18: 473-478.
Gerhartz C, Heesel B, Sasse J, Hemmann U, Landgraf C, Schneider-Mergener J, Horn F, Heinrich PC, Graeve L. 1996. Differential activation of acute phase response factor/STAT3 and STAT1 via the cytoplasmic domain of the interleukin 6 signal transducer gp130: I. Definition of a novel phosphotyrosine motif mediating STAT1 activation. Journal of Biological Chemistry 271: 12991-12998.
Gerlinger M, Rowan AJ, Horswell S, Larkin J, Endesfelder D, Gronroos E, Martinez P, Matthews N, Stewart A, Tarpey P et al. 2012. Intratumor Heterogeneity and Branched Evolution Revealed by Multiregion Sequencing. New England Journal of Medicine 366: 883-892.
Giordano S, Ponzetto C, Di Renzo MF, Cooper CS, Comoglio PM. 1989. Tyrosine kinase receptor indistinguishable from the c-met protein. Nature 339: 155-156.
Girard L, Zochbauer-Muller S, Virmani AK, Gazdar AF, Minna JD. 2000. Genome-wide allelotyping of lung cancer identifies new regions of allelic loss, differences between small cell lung cancer and non-small cell lung cancer, and loci clustering. Cancer research 60: 4894-4906.
Goss VL, Lee KA, Moritz A, Nardone J, Spek EJ, MacNeill J, Rush J, Comb MJ, Polakiewicz RD. 2006. A common phosphotyrosine signature for the Bcr-Abl kinase. Blood 107: 4888-4897.
Gotzmann J, Fischer ANM, Zojer M, Mikula M, Proell V, Huber H, Jechlinger M, Waerner T, Weith A, Beug H et al. 2006. A crucial function of PDGF in TGF-[beta]-mediated cancer progression of hepatocytes. Oncogene 25: 3170-3185.
Greenland C, Touriol C, Chevillard G, Morris SW, Bai R, Duyster J, Delsol G, Allouche M. 2001. Expression of the oncogenic NPM-ALK chimeric protein in human lymphoid T-cells inhibits drug-induced, but not Fas-induced apoptosis. Oncogene 20: 7386-7397.
Griffith J, Black J, Faerman C, Swenson L, Wynn M, Lu F, Lippke J, Saxena K. 2004. The Structural Basis for Autoinhibition of FLT3 by the Juxtamembrane Domain. Molecular Cell 13: 169-178.
134
Gschwind A, Fischer OM, Ullrich A. 2004. The discovery of receptor tyrosine kinases: targets for cancer therapy. Nat Rev Cancer 4:361-370.
Guschin D, Rogers N, Briscoe J, Witthuhn B, Watling D, Horn F, Pellegrini S, Yasukawa K, Heinrich P, Stark GR et al. 1995. A major role for the protein tyrosine kinase JAK1 in the JAK/STAT signal transduction pathway in response to interleukin-6. EMBO Journal 14: 1421-1429.
Haan S, Ferguson P, Sommer U, Hiremath M, McVicar DW, Heinrich PC, Johnston JA, Cacalano NA. 2003. Tyrosine phosphorylation disrupts elongin interaction and accelerates SOCS3 degradation. Journal of Biological Chemistry 278: 31972-31979.
Hanahan D and Weinberg R A.2011. Hallmarks of Cancer: The Next Generation. Cell: 144(5): 646-674. Hansen JA, Lindberg K, Hilton DJ, Nielsen JH, Billestrup N. 1999. Mechanism of inhibition of growth
hormone receptor signaling by suppressor of cytokine signaling proteins. Molecular Endocrinology 13: 1832-1843.
Harris H. 1988. The Analysis of Malignancy by Cell Fusion: The Position in 1988. Cancer research 48: 3302-3306.
He L, Hannon GJ. 2004. MicroRNAs: small RNAs with a big role in gene regulation. Nat Rev Genet 5: 522-531.
Hecht SS. 2002. Cigarette smoking and lung cancer: chemical mechanisms and approaches to prevention. The lancet oncology 3: 461-469.
Heist RS, Engelman JA. 2012. SnapShot: non-small cell lung cancer. Cancer cell 21: 448 e442. Heldin CH, Ostman A, Ronnstrand L. 1998. Signal transduction via platelet-derived growth factor
receptors. Biochimica et biophysica acta 1378: F79-113. Helman E, Naxerova K, Kohane IS. 2012. DNA hypermethylation in lung cancer is targeted at
differentiation-associated genes. Oncogene 31: 1181-1188. Herbst RS, Bunn PA, Jr. 2003. Targeting the epidermal growth factor receptor in non-small cell lung
cancer. Clinical cancer research : an official journal of the American Association for Cancer Research 9: 5813-5824.
Hermanns HM, Radtke S, Haan C, Schmitz-Van De Leur H, Tavernier J, Heinrich PC, Behrmann I. 1999. Contributions of leukemia inhibitory factor receptor and oncostatin M receptor to signal transduction in heterodimeric complexes with glycoprotein 130. Journal of Immunology 163: 6651-6658.
Hines AC, Cole PA. 2004. Design, synthesis, and characterization of an ATP-peptide conjugate inhibitor of protein kinase A. Bioorganic and Medicinal Chemistry Letters 14: 2951-2954.
Hines AC, Parang K, Kohanski RA, Hubbard SR, Cole PA. 2005. Bisubstrate analog probes for the insulin receptor protein tyrosine kinase: Molecular yardsticks for analyzing catalytic mechanism and inhibitor design. Bioorganic Chemistry 33: 285-297.
Hirsch FR, Varella-Garcia M, Bunn PA, Jr., Di Maria MV, Veve R, Bremmes RM, Baron AE, Zeng C, Franklin WA. 2003. Epidermal growth factor receptor in non-small-cell lung carcinomas: correlation between gene copy number and protein expression and impact on prognosis. Journal of clinical oncology : official journal of the American Society of Clinical Oncology 21: 3798-3807.
Hirsh V. 2010. Systemic therapies in metastatic non-small-cell lung cancer with emphasis on targeted therapies: the rational approach. Current oncology (Toronto, Ont) 17: 13-23.
Hollstein M, Sidransky D, Vogelstein B, Harris C. 1991. p53 mutations in human cancers. Science 253: 49-53.
Hoque MO, Lee CC, Cairns P, Schoenberg M, Sidransky D. 2003. Genome-wide genetic characterization of bladder cancer: a comparison of high-density single-nucleotide polymorphism arrays and PCR-based microsatellite analysis. Cancer research 63: 2216-2222.
Hosoya Y, Gemma A, Seike M, Kurimoto F, Uematsu K, Hibino S, Yoshimura A, Shibuya M, Kudoh S. 1999. Alteration of the PTEN/MMAC1 gene locus in primary lung cancer with distant metastasis. Lung cancer (Amsterdam, Netherlands) 25: 87-93.
135
Houlston RS. 1999. Glutathione S-transferase M1 status and lung cancer risk: a meta-analysis. Cancer epidemiology, biomarkers & prevention : a publication of the American Association for Cancer Research, cosponsored by the American Society of Preventive Oncology 8: 675-682.
-. 2000. CYP1A1 polymorphisms and lung cancer risk: a meta-analysis. Pharmacogenetics 10: 105-114. Huang H, Li L, Wu C, Schibli D, Colwill K, Ma S, Li C, Roy P, Ho K, Songyang Z et al. 2008. Defining
the Specificity Space of the Human Src Homology 2 Domain. Molecular & Cellular Proteomics 7: 768-784.
Hubbard SR. 1997. Crystal structure of the activated insulin receptor tyrosine kinase in complex with peptide substrate and ATP analog. The EMBO journal 16: 5572-5581.
Hunter T, Sefton BM. 1980. Transforming gene product of Rous sarcoma virus phosphorylates tyrosine. Proceedings of the National Academy of Sciences of the United States of America 77: 1311–1315.
Hutti J E, Jarrell ET, Chang J D, Abbott DW, Storz P, Toker A, Cantley LC, and Turk BE. 2004. A rapid method for determining protein kinase phosphorylation specificity. Nat. Methods 1, 27– 29.
Ibarrola N, Molina H, Iwahori A, Pandey A. 2004. A Novel Proteomic Approach for Specific Identification of Tyrosine Kinase Substrates Using [13C]Tyrosine. Journal of Biological Chemistry 279: 15805-15813.
Ihle JN. 1996. Janus kinases in cytokine signalling. Philosophical Transactions of the Royal Society B: Biological Sciences 351: 159-166.
Inamura K, Takeuchi K, Togashi Y, Hatano S, Ninomiya H, Motoi N, Mun M-y, Sakao Y, Okumura S, Nakagawa K et al. 2009. EML4-ALK lung cancers are characterized by rare other mutations, a TTF-1 cell lineage, an acinar histology, and young onset. Mod Pathol 22: 508-515.
Inamura K, Takeuchi K, Togashi Y, Nomura K, Ninomiya H, Okui M, Satoh Y, Okumura S, Nakagawa K, Soda M et al. 2008. EML4-ALK fusion is linked to histological characteristics in a subset of lung cancers. Journal of thoracic oncology : official publication of the International Association for the Study of Lung Cancer 3: 13-17.
Inda MM, Bonavia R, Mukasa A, Narita Y, Sah DW, Vandenberg S, et al. 2010. Tumor heterogeneity is an active process maintained by a mutant EGFR-induced cytokine circuit in glioblastoma. Genes Development 24: 1731–1745.
International Human Genome Consortium. 2004. Finishing the euchromatic sequence of the human genome. Nature 431, 931–945.
Ito A, Okada M, Uchino K, Wakayama T, Koma YI, Iseki S, Tsubota N, Okita Y, Kitamura Y. 2003. Expression of the TSLC1 adhesion molecule in pulmonary epithelium and its down-regulation in pulmonary adenocarcinoma other than bronchioloalveolar carcinoma. Laboratory Investigation 83: 1175-1183.
Ito S, Ansari P, Sakatsume M, Dickensheets H, Vazquez N, Donnelly RP, Larner AC, Finbloom DS. 1999. Interleukin-10 inhibits expression of both interferon α- and interferon γ-induced genes by suppressing tyrosine phosphorylation of STAT1. Blood 93: 1456-1463.
Iwai LK, Benoist C, Mathis D, White FM. 2010. Quantitative phosphoproteomic analysis of T cell receptor signaling in diabetes prone and resistant mice. Journal of Proteome Research 9: 3135–3145.
Jänne PA, Li C, Zhao X, et al. 2004. High-resolution single-nucleotide polymorphism array and clustering analysis of loss of heterozygosity in human lung cancer cell lines. Oncogene 23: 2716–2726.
Jänne PA, Engelman JA, Johnson BE. 2005. Epidermal Growth Factor Receptor Mutations in Non–Small-Cell Lung Cancer: Implications for Treatment and Tumor Biology. Journal of Clinical Oncology 23: 3227-3234.
Jemal A, Siegel R, Ward E, Hao Y, Xu J, Murray T, Thun MJ. 2008. Cancer Statistics, 2008. CA: A Cancer Journal for Clinicians 58: 71-96.
Ji H, Ramsey MR, Hayes DN, Fan C, McNamara K, Kozlowski P, Torrice C, Wu MC, Shimamura T, Perera SA et al. 2007. LKB1 modulates lung cancer differentiation and metastasis. Nature 448: 807-810.
136
Johnson H, White FM. 2012. Toward quantitative phosphotyrosine profiling in vivo. Seminars in Cell & Developmental Biology.
Jones SA, Horiuchi S, Topley N, Yamamoto N, Fuller GM. 2001. The soluble interleukin 6 receptor: Mechanisms of production and implications in disease. FASEB Journal 15: 43-58.
Jordan JD, Landau EM, Iyengar R. 2000. Signaling networks: The origins of cellular multitasking. Cell 103: 193-200.
Kallioniemi A, Kallioniemi OP, Sudar D, et al. 1992.Comparative genomic hybridization for molecular cytogenetic analysis of solid tumors. Science.258:818–21.
Kamizono S, Hanada T, Yasukawa H, Minoguchi S, Kato R, Minoguchi M, Hattori K, Hatakeyama S, Yada M, Morita S et al. 2001. The SOCS Box of SOCS-1 Accelerates Ubiquitin-dependent Proteolysis of TEL-JAK2. Journal of Biological Chemistry 276: 12530-12538.
Kamura T, Burian D, Yan Q, Schmidt SL, Lane WS, Querido E, Branton PE, Shilatifard A, Conaway RC, Conaway JW. 2001. MUF1, A Novel Elongin BC-interacting Leucine-rich Repeat Protein That Can Assemble with Cul5 and Rbx1 to Reconstitute a Ubiquitin Ligase. Journal of Biological Chemistry 276: 29748-29753.
Kavanaugh WM, Williams LT. 1994. An alternative to SH2 domains for binding tyrosine-phosphorylated proteins. Science 266: 1862-1865.
Kendall J., Liu Q., Bakleh A., Krasnitz A., Nguyen K.C., Lakshmi B., Gerald W.L., Powers S., Mu D. 2007. Oncogenic cooperation and coamplification of developmental transcription factor genes in lung cancer. Proc. Natl. Acad. Sci. USA, 104 (), pp. 16663–16668
Kennedy GC, Matsuzaki H, Dong S, et al. 2003. Large-scale genotyping of complex DNA. Nat Biotechnol 21: 1233–1237.
Kim H, Hawley TS, Hawley RG, Baumann H. 1998. Protein tyrosine phosphatase 2 (SHP-2) moderates signaling by gp130 but is not required for the induction of acute-phase plasma protein genes in hepatic cells. Molecular and Cellular Biology 18: 1525-1533.
Kim K, Cole PA. 1997. Measurement of a Bronsted nucleophile coefficient and insights into the transition state for a protein tyrosine kinase. Journal of the American Chemical Society 119: 11096-11097.
-. 1998. Kinetic analysis of a protein tyrosine kinase reaction transition state in the forward and reverse directions. Journal of the American Chemical Society 120: 6851-6858.
King N, Carroll SB. 2001. A receptor tyrosine kinase from choanoflagellates: molecular insights into early animal evolution. Proc Natl Acad Sci U S A 98: 15032-15037.
King N, Hittinger CT, Carroll SB. 2003. Evolution of key cell signaling and adhesion protein families predates animal origins. Science 301: 361-363.
Kishimoto T. 2010. IL-6: from its discovery to clinical applications. International Immunology 22: 347–352
Kishimoto T, Akira S, Taga T. 1992. Interleukin-6 and its receptor: A paradigm for cytokines. Science 258: 593-597.
Kishimoto T, Taga T, Yamasaki K, Matsuda T, Tang B, Muraguchi A, Horii Y, Suematsu S, Hirata Y, Yawata H. 1989. Normal and abnormal regulation of human B cell differentiation by a new cytokine, BSF2/IL-6. Advances in Experimental Medicine and Biology 254: 135-143.
Kishimoto T, Tanaka T, Yoshida K, Akira S, Taga T. 1995. Cytokine signal transduction through a homo- or heterodimer of gp130. Annals of the New York Academy of Sciences 766: 224-234.
Knudson AG, Jr. 1989. The ninth Gordon Hamilton-Fairley memorial lecture. Hereditary cancers: clues to mechanisms of carcinogenesis. British journal of cancer 59: 661-666.
Kobayashi S, Boggon TJ, Dayaram T, Janne PA, Kocher O, Meyerson M, Johnson BE, Eck MJ, Tenen DG, Halmos B. 2005a. EGFR mutation and resistance of non-small-cell lung cancer to gefitinib. The New England journal of medicine 352: 786-792.
Kobayashi S, Ji H, Yuza Y, Meyerson M, Wong K-K, Tenen DG, Halmos B. 2005b. An Alternative Inhibitor Overcomes Resistance Caused by a Mutation of the Epidermal Growth Factor Receptor. Cancer research 65: 7096-7101.
137
Kohno T, Takahashi M, Manda R, Yokota J. 1998. Inactivation of the PTEN/MMACI/TEPI gene in human lung cancers. Genes Chromosomes and Cancer 22: 152-156.
Koivunen JP, Mermel C, Zejnullahu K, Murphy C, Lifshits E, Holmes AJ, Choi HG, Kim J, Chiang D, Thomas R et al. 2008. EML4-ALK Fusion Gene and Efficacy of an ALK Kinase Inhibitor in Lung Cancer. Clinical Cancer Research 14: 4275-4283.
Kolodkin AL, Levengood DV, Rowe EG, Tai YT, Giger RJ, Ginty DD. 1997. Neuropilin is a semaphorin III receptor. Cell 90: 753-762.
Kong-Beltran M, Seshagiri S, Zha J, Zhu W, Bhawe K, Mendoza N, Holcomb T, Pujara K, Stinson J, Fu L et al. 2006. Somatic mutations lead to an oncogenic deletion of Met in lung cancer. Cancer research 66: 283-289.
Kramer RH, Lenferink AE, van Bueren-Koornneef IL, van der Meer A, van de Poll ML, van Zoelen EJ. 1994. Identification of the high affinity binding site of transforming growth factor-alpha (TGF-alpha) for the chicken epidermal growth factor (EGF) receptor using EGF/TGF-alpha chimeras. The Journal of biological chemistry 269: 8708-8711.
Kratchmarova I, Blagoev B, Haack-Sorensen M, Kassem M, Mann M. 2005. Cell Signalling: Mechanism of divergent growth factor effects in mesenchymal stem cell differentiation. Science 308: 1472-1477.
Krebs DL, Uren RT, Metcalf D, Rakar S, Zhang JG, Starr R, De Souza DP, Hanzinikolas K, Eyles J, Connolly LM et al. 2002. SOCS-6 binds to insulin receptor substrate 4, and mice lacking the SOCS-6 gene exhibit mild growth retardation. Molecular and Cellular Biology 22: 4567-4578.
Kreegipuu A, Blom N, Brunak S, Järv J. 1998. Statistical analysis of protein kinase specificity determinants. FEBS Letters 430: 45-50.
Kreegipuu,A. et al. 1999. PhosphoBase, a database of phosphorylation sites: release 2.0. Nucleic Acids Res., 27, 237–239.
Kris MG, Natale RB, Herbst RS, Lynch TJ, Jr., Prager D, Belani CP, Schiller JH, Kelly K, Spiridonidis H, Sandler A et al. 2003. Efficacy of gefitinib, an inhibitor of the epidermal growth factor receptor tyrosine kinase, in symptomatic patients with non-small cell lung cancer: a randomized trial. JAMA : the journal of the American Medical Association 290: 2149-2158.
Kumar MS, Erkeland SJ, Pester RE, et al. 2008. Suppression of nonsmall cell lung tumor development by the let-7 microRNA family. Proc Natl Acad Sci USA; 105: 3903–3908.
Kuramochi M, Fukuhara H, Nobukuni T, Kanbe T, Maruyama T, Ghosh HP, Pletcher M, Isomura M, Onizuka M, Kitamura T et al. 2001. TSLC1 is a tumor-suppressor gene in human non-small-cell lung cancer. Nature genetics 27: 427-430.
Kurie JM, Lee JS, Khuri FR, Mao L, Morice RC, Lee JJ, Walsh GL, Broxson A, Lippman SM, Ro JY et al. 2000. N-(4-hydroxyphenyl)retinamide in the chemoprevention of squamous metaplasia and dysplasia of the bronchial epithelium. Clinical Cancer Research 6: 2973-2979.
Kurie JM, Lotan R, Lee JJ, Lee JS, Morice RC, Liu DD, Xu XC, Khuri FR, Ro JY, Hittelman WN et al. 2003. Treatment of former smokers with 9-cis-retinoic acid reverse loss of retinoic acid receptor-β expression in the bronchial epithelium: Results from a randomized placebo-controlled trial. Journal of the National Cancer Institute 95: 206-214.
Kurihara N, Bertolini D, Suda T, Akiyama Y, Roodman GD. 1990. IL-6 stimulates osteoclast-like multinucleated cell formation in long term human marrow cultures by inducing IL-1 release. Journal of Immunology 144: 4226-4230.
Kwak EL, Sordella R, Bell DW, Godin-Heymann N, Okimoto RA, Brannigan BW, Harris PL, Driscoll DR, Fidias P, Lynch TJ et al. 2005. Irreversible inhibitors of the EGF receptor may circumvent acquired resistance to gefitinib. Proceedings of the National Academy of Sciences of the United States of America 102: 7665-7670.
Kwei K.A. Kim Y.H, Girard L., Kao J., Pacyna-Gengelbach M., Salari K., Lee J., Choi Y.L., Sato M., Wang P. et al. 2008. Genomic profiling identifies TITF1 as a lineage-specific oncogene amplified in lung cancer. Oncogene 27: 3635–3640
Lai EC. 2003. microRNAs: runts of the genome assert themselves. Curr Biol 13: R925-R936.
138
Laptenko O, Prives C. 2006. Transcriptional regulation by p53: One protein, many possibilities. Cell Death Differ 13: 951–961.
Lantuéjoul S, Constantin B, Drabkin H, Brambilla C, Roche J, Brambilla E. 2003. Expression of VEGF, semaphorin SEMA3F, and their common receptors neuropilins NP1 and NP2 in preinvasive bronchial lesions, lung tumours, and cell lines. Journal of Pathology 200: 336-347.
Lehmann U, Schmitz J, Weissenbach M, Sobota RM, Hörtner M, Friederichs K, Behrmann I, Tsiaris W, Sasaki A, Schneider-Mergener J et al. 2003. SHP2 and SOCS3 contribute to Tyr-759-dependent attenuation of interleukin-6 signaling through gp130. Journal of Biological Chemistry 278: 661-671.
Leid M, Kastner P, Chambon P. 1992. Multiplicity generates diversity in the retinoic acid signalling pathways. Trends in Biochemical Sciences 17: 427-433.
Leidinger P, Keller A, Meese E. 2011. MicroRNAs – Important Molecules in Lung Cancer Research. Genetics.; 2: 104.
Lemmon MA, Schlessinger J. 2010. Cell signaling by receptor tyrosine kinases. Cell 141: 1117-1134. Lenferink AEG, Pinkas-Kramarski R, van de Poll MLM, van Vugt MJH, Klapper LN, Tzahar E,
Waterman H, Sela M, van Zoelen EJJ, Yarden Y. 1998. Differential endocytic routing of homo- and hetero-dimeric ErbB tyrosine kinases confers signaling superiority to receptor heterodimers. The EMBO journal 17: 3385-3397.
Levinson NM, Kuchment O, Shen K, Young MA, Koldobskiy M, Karplus M, Cole PA, Kuriyan J. 2006. A Src-like inactive conformation in the Abl tyrosine kinase domain. PLoS Biology 4: 753-767.
Li D, Firozi PF, Wang LE, Bosken CH, Spitz MR, Hong WK, Wei Q. 2001. Sensitivity to DNA damage induced by benzo(a)pyrene diol epoxide and risk of lung cancer: a case-control analysis. Cancer research 61: 1445-1450.
Li J, Yen C, Liaw D, Podsypanina K, Bose S, Wang SI, Puc J, Miliaresis C, Rodgers L, McCombie R et al. 1997. PTEN, a putative protein tyrosine phosphatase gene mutated in human brain, breast, and prostate cancer. Science 275: 1943-1947.
Liang X, Hajivandi M, Veach D, Wisniewski D, Clarkson B, Resh MD, Pope RM. 2006. Quantification of change in phosphorylation of BCR-ABL kinase and its substrates in response to Imatinib treatment in human chronic myelogenous leukemia cells. Proteomics 6: 4554-4564.
Libermann TA, Nusbaum HR, Raxon N, Kris R, Lax I, Soreq H, Whittle N, Waterfield MD, Ullrich A, Schlessinger J. 1985. Amplification, enhanced expression and possible rearrangment of EGF receptor gene in primary human brain tumours of glial origin. Nature. 313:144–147.
Lieberfarb ME, Lin M, Lechpammer M, Li C, Tanenbaum DM, Febbo PG, Wright RL, Shim J, Kantoff PW, Loda M et al. 2003. Genome-wide loss of heterozygosity analysis from laser capture microdissected prostate cancer using single nucleotide polymorphic allele (SNP) arrays and a novel bioinformatics platform dChipSNP. Cancer research 63: 4781-4785.
Lin HY, Xu J, Ornitz DM, Halegoua S, Hayman MJ. 1996. The fibroblast growth factor receptor-1 is necessary for the induction of neurite outgrowth in PC12 cells by aFGF. Journal of Neuroscience 16: 4579-4587.
Lindblad-Toh K, Tanenbaum DM, Daly MJ, Winchester E, Lui W-O, Villapakkam A, Stanton SE, Larsson C, Hudson TJ, Johnson BE et al. 2000. Loss-of-heterozygosity analysis of small-cell lung carcinomas using single-nucleotide polymorphism arrays. Nat Biotech 18: 1001-1005.
Liu BA, Jablonowski K, Raina M, Arce M, Pawson T, Nash PD. 2006. The human and mouse complement of SH2 domain proteins-establishing the boundaries of phosphotyrosine signaling. Mol Cell 22: 851-868.
Liu H, Chen X, Focia PJ, He X. 2007. Structural basis for stem cell factor-KIT signaling and activation of class III receptor tyrosine kinases. EMBO Journal 26: 891-901.
Loeb LA. 2001. A mutator phenotype in cancer. Cancer Res 61:3230–3239. Lucito R, Healy J, Alexander J, Reiner A, Esposito D, Chi M, Rodgers L, Brady A, Sebat J, Troge J et al.
2003. Representational Oligonucleotide Microarray Analysis: A High-Resolution Method to Detect Genome Copy Number Variation. Genome Research 13: 2291-2305.
139
Lutticken C, Wegenka UM, Yuan J, Buschmann J, Schindler C, Ziemiecki A, Harpur AG, Wilks AF, Yasukawa K, Taga T et al. 1994. Association of transcription factor APRF and protein kinase Jak1 with the interleukin-6 signal transducer gp130. Science 263: 89-92.
Lynch M, Conery JS. 2000. The evolutionary fate and consequences of duplicate genes. Science 290: 1151-1155.
Lynch TJ, Bell DW, Sordella R, Gurubhagavatula S, Okimoto RA, Brannigan BW, Harris PL, Haserlat SM, Supko JG, Haluska FG et al. 2004. Activating mutations in the epidermal growth factor receptor underlying responsiveness of non-small-cell lung cancer to gefitinib. The New England journal of medicine 350: 2129-2139.
Maher, C A. et al. 2009. Transcriptome sequencing to detect gene fusions in cancer. Nature458, 97–101.
Manning G, Whyte DB, Martinez R, Hunter T, Sudarsanam S. 2002. The Protein Kinase Complement of the Human Genome. Science 298: 1912-1934.
Marchetti A, Martella C, Felicioni L, Barassi F, Salvatore S, Chella A, Camplese PP, Iarussi T, Mucilli F, Mezzetti A et al. 2005. EGFR mutations in non-small-cell lung cancer: analysis of a large series of cases and development of a rapid and sensitive method for diagnostic screening with potential implications on pharmacologic treatment. Journal of clinical oncology : official journal of the American Society of Clinical Oncology 23: 857-865.
Margolis B, Borg JP, Straight S, Meyer D. 1999. The function of PTB domain proteins. Kidney International 56: 1230-1237.
Marine JC, McKay C, Wang D, Topham DJ, Parganas E, Nakajima H, Pendeville H, Yasukawa H, Sasaki A, Yoshimura A et al. 1999a. SOCS3 is essential in the regulation of fetal liver erythropoiesis. Cell 98: 617-627.
Marine JC, Topham DJ, McKay C, Wang D, Parganas E, Stravopodis D, Yoshimura A, Ihle JN. 1999b. SOCS1 deficiency causes a lymphocyte-dependent perinatal lethality. Cell 98: 609-616.
Marks JL, Gong Y, Chitale D, Golas B, McLellan MD, Kasai Y, Ding L, Mardis ER, Wilson RK, Solit D et al. 2008. Novel MEK1 Mutation Identified by Mutational Analysis of Epidermal Growth Factor Receptor Signaling Pathway Genes in Lung Adenocarcinoma. Cancer research 68: 5524-5528.
Marshall CJ. 1995. Specificity of receptor tyrosine kinase signaling: Transient versus sustained extracellular signal-regulated kinase activation. Cell 80: 179-185.
Martinet N, Alla F, Farré G, Labib T, Drouot H, Vidili R, Picard E, Gaube MP, Le Faou D, Siat J et al. 2000. Retinoic acid receptor and retinoid X receptor alterations in lung cancer precursor lesions. Cancer research 60: 2869-2875.
Massarelli E, Varella-Garcia M, Tang X, Xavier AC, Ozburn NC, Liu DD, Bekele BN, Herbst RS, Wistuba II. 2007. KRAS Mutation Is an Important Predictor of Resistance to Therapy with Epidermal Growth Factor Receptor Tyrosine Kinase Inhibitors in Non–Small-Cell Lung Cancer. Clinical Cancer Research 13: 2890-2896.
Masuda M, Yageta M, Fukuhara H, Kuramochi M, Maruyama T, Nomoto A, Murakami Y. 2002. The tumor suppressor protein TSLC1 is involved in cell-cell adhesion. Journal of Biological Chemistry 277: 31014-31019.
Matsuda M, Mayer BJ, Fukui Y, Hanafusa H. 1990. Binding of transforming protein, P47(gag-crk), to a broad range of phosphotyrosine-containing proteins. Science 248: 1537-1539.
Matsuzaki H, Dong S, Loi H, Di X, Liu G, Hubbell E, Law J, Berntsen T, Chadha M, Hui H et al. 2004. Genotyping over 100,000 SNPs on a pair of oligonucleotide arrays. Nat Meth 1: 109-111.
Mayer BJ, Jackson PK, Baltimore D. 1991. The noncatalytic src homology region 2 segment of abl tyrosine kinase binds to tyrosine-phosphorylated cellular proteins with high affinity. Proceedings of the National Academy of Sciences of the United States of America 88: 627-631.
Meyerson M, Gabriel S, Getz G. 2010. Advances in understanding cancer genomes through second-generation sequencing. Nat Rev Genet 11: 685-696.
140
McLarty JW, Holiday DB, Girard WM, Yanagihara RH, Kummet TD, Greenberg SD. 1995. β-Carotene, vitamin A, and lung cancer chemoprevention: Results of an intermediate endpoint study. American Journal of Clinical Nutrition 62: 1431S-1438S.
Mei R, Galipeau PC, Prass C, Berno A, Ghandour G, Patil N, Wolff RK, Chee MS, Reid BJ, Lockhart DJ. 2000. Genome-wide Detection of Allelic Imbalance Using Human SNPs and High-density DNA Arrays. Genome Research 10: 1126-1137.
Metcalf D, Greenhalgh CJ, Viney E, Wilison TA, Starr R, Nicola NA, Hilton DJ, Alexander WS. 2000. Gigantism in mice lacking suppressor of cytokine signalling-2. Nature 405: 1069-1073.
Metzker ML. 2010. Sequencing technologies — the next generation. Nature Rev. Genet. 11, 31–46. Miller-Jensen K, Janes KA, Brugge JS, Lauffenburger DA. 2007. Common effector processing mediates
cell-specific responses to stimuli. Nature 448: 604-608. Miller JR, Hocking AM, Brown JD, Moon RT. 1999. Mechanism and function of signal transduction by
the Wnt/beta-catenin and Wnt/Ca2+ pathways. Oncogene 18: 7860-7872. Miller VA, Kris MG, Shah N, Patel J, Azzoli C, Gomez J, Krug LM, Pao W, Rizvi N, Pizzo B et al. 2004.
Bronchioloalveolar pathologic subtype and smoking history predict sensitivity to gefitinib in advanced non-small-cell lung cancer. Journal of clinical oncology : official journal of the American Society of Clinical Oncology 22: 1103-1109.
Mizutani Y, Bonavida B, Koishihara Y, Akamatsu KI, Ohsugi Y, Yoshida O. 1995. Sensitization of human renal cell carcinoma cells to cis- diamminedichloroplatinum(II) by anti-interleukin 6 monoclonal antibody or anti-interleukin 6 receptor monoclonal antibody. Cancer research 55: 590-596.
Mol CD, Dougan DR, Schneider TR, Skene RJ, Kraus ML, Scheibe DN, Snell GP, Zou H, Sang BC, Wilson KP. 2004. Structural basis for the autoinhibition and STI-571 inhibition of c-Kit tyrosine kinase. Journal of Biological Chemistry 279: 31655-31663.
Moran MF, Koch CA, Anderson D, Ellis C, England L, Martin GS, Pawson T. 1990. Src homology region 2 domains direct protein-protein interactions in signal transduction. Proceedings of the National Academy of Sciences of the United States of America 87: 8622-8626.
Morris SW, Kirstein MN, Valentine MB, Dittmer K, Shapiro DN, Look AT, Saltman DL. 1995. Fusion of a kinase gene, ALK, to a nucleolar protein gene, NPM, in non-Hodgkin's lymphoma. Science 267: 316-317.
Moffat J and Sabatini DM. 2006. Building mammalian signaling pathways with RNAi screens. Nature Reviews Molecular Cell Biology 7: 177-187.
Motoi N, Szoke J, Riely GJ, Seshan VE, Kris MG, Rusch VW, Gerald WL, Travis WD. 2008. Lung adenocarcinoma: Modification of the 2004 WHO mixed subtype to include the major histologic subtype suggests correlations between papillary and micropapillary adenocarcinoma subtypes, EGFR mutations and gene expression analysis. American Journal of Surgical Pathology 32: 810-827.
Nakagawa T, Lida S, Osanai T, Uetake H, Aruga T, Toriya Y, Takagi Y, Kawachi H, Sugihara K. 2008. Decreased expression of SOCS-3 mRNA in breast cancer with lymph node metastasis. Oncology Reports 19: 33-39.
Naldini L, Vigna E, Narsimhan RP, Gaudino G, Zarnegar R, Michalopoulos GK, Comoglio PM. 1991. Hepatocyte growth factor (HGF) stimulates the tyrosine kinase activity of the receptor encoded by the proto-oncogene c-MET. Oncogene 6: 501-504.
Newton AC. 2001. Protein kinase C: Structural and spatial regulation by phosphorylation, cofactors, and macromolecular interactions. Chemical Reviews 101: 2353-2364.
Nicholson RI, Gee JM, Harper ME. 2001. EGFR and cancer prognosis. European journal of cancer (Oxford, England : 1990) 37 Suppl 4: S9-15.
Nicholson SE, Willson TA, Farley A, Starr R, Zhang JG, Baca M, Alexander WS, Metcalf D, Hilton DJ, Nicola NA. 1999. Mutational analyses of the SOCS proteins suggest a dual domain requirement but distinct mechanisms for inhibition of LIF and IL-6 signal transduction. EMBO Journal 18: 375-385.
141
Niu XL, Peters KG, Kontos CD. 2002. Deletion of the carboxyl terminus of Tie2 enhances kinase activity, signaling, and function: Evidence for an autoinhibitory mechanism. Journal of Biological Chemistry 277: 31768-31773.
NCI. 2012. Non Small Cell Lung Cancer. Novick D, Shulman LM, Chen L, Revel M. 1992. Enhancement of interleukin 6 cytostatic effect on
human breast carcinoma cells by soluble IL-6 receptor from urine and reversion by monoclonal antibody. Cytokine 4: 6-11.
Oancea E, Meyer T. 1998. Protein kinase C as a molecular machine for decoding calcium and diacylglycerol signals. Cell 95: 307-318.
Obenauer JC, Cantley LC, Yaffe MB. 2003. Scansite 2.0: Proteome-wide prediction of cell signaling interactions using short sequence motifs. Nucleic Acids Research 31:3635-3641.
Oda K, Matsuoka Y, Funahashi A, Kitano H. 2005. A comprehensive pathway map of epidermal growth factor receptor signaling. Molecular systems biology 1: 2005 0010.
Ohsaki Y, Tanno S, Fujita Y, Toyoshima E, Fujiuchi S, Nishigaki Y, Ishida S, Nagase A, Miyokawa N, Hirata S et al. 2000. Epidermal growth factor receptor expression correlates with poor prognosis in non-small cell lung cancer patients with p53 overexpression. Oncology reports 7: 603-607.
Ohtsuka K, Ohnishi H, Furuyashiki G, Nogami H, Koshiishi Y, Ooide A, Matsushima S, Watanabe T, Goya T. 2006. Clinico-pathological and biological significance of tyrosine kinase domain gene mutations and overexpression of epidermal growth factor receptor for lung adenocarcinoma. Journal of thoracic oncology : official publication of the International Association for the Study of Lung Cancer 1: 787-795.
Olayioye MA, Neve RM, Lane HA, Hynes NE. 2000. The ErbB signaling network: receptor heterodimerization in development and cancer. The EMBO journal 19: 3159-3167.
Olivero M, Valente G, Bardelli A, Longati P, Ferrero N, Cracco C, Terrone C, Rocca-Rossetti S, Comoglio PM, Di Renzo MF. 1999. Novel mutation in the ATP-binding site of the MET oncogene tyrosine kinase in a HPRCC family. International journal of cancer Journal international du cancer 82: 640-643.
Olsen J, Blagoev B, Macek B, Mann M. 2006. Global, in vivo, and site-specific phosphorylation dynamics in signaling networks. Cell 127: 635–648.
Omenn GS, Goodman GE, Thornquist MD, Balmes J, Cullen MR, Glass A, Keogh JP, Meyskens Jr FL, Valanis B, Williams Jr JH et al. 1996. Effects of a combination of beta carotene and vitamin A on lung cancer and cardiovascular disease. New England Journal of Medicine 334: 1150-1155.
Onozato R, Kosaka T, Kuwano H, Sekido Y, Yatabe Y, Mitsudomi T. 2009. Activation of MET by gene amplification or by splice mutations deleting the juxtamembrane domain in primary resected lung cancers. Journal of Thoracic Oncology 4: 5-11.
Ortiz-Vega S, Khokhlatchev A, Nedwidek M, Zhang XF, Dammann R, Pfeifer GP, Avruch J. 2002. The putative tumor suppressor RASSF1A homodimerizes and heterodimerizes with the Ras-GTP binding protein Nore1. Oncogene 21: 1381-1390.
Osada H, Takahashi T. 2011. let-7 and miR-17-92: Small-sized major players in lung cancer development. Cancer Science 102: 9-17.
Otterson GA, Xiao GH, Geradts J, Jin F, Chen WD, Niklinska W, Kaye FJ, Yeung RS. 1998. Protein expression and functional analysis of the FHIT gene in human tumor cells. Journal of the National Cancer Institute 90: 426-432.
O’Connell BC, Adamson B, Lydeard JR, Sowa ME, Ciccia A, Bredemeyer AL, Schlabach M, Gygi SP, Elledge SJ, Harper JW. 2010. A genome-wide camptothecin sensitivity screen identifies a mammalian MMS22L-NFKBIL2 complex required for genomic stability. Molecular Cell: 645-657.
Paddison PJ, Cleary M, Silva JM, Chang K, Sheth N, Sachidanandam R, Hannon GJ. 2004a. Cloning of short hairpin RNAs for gene knockdown in mammalian cells. Nat Methods: 163-167.
142
Paddison PJ, Silva JM, Conklin DS, Schlabach M, Li M, Aruleba S, Balija V, O’Shaughnessy A, Gnoj L, Scobie K et al. 2004b. A resource for large-scale RNA-interference-based screens in mammals. Nature: 427-431.
Pandey A, Podtelejnikov AV, Blagoev B, Bustelo XR, Mann M, Lodish HF. 2000. Analysis of receptor signaling pathways by mass spectrometry: identification of Vav-2 as a substrate of the epidermal and platelet-derived growth factor receptors. Proceedings of the National Academy of Sciences of the United States of America 97: 179–184.
Pao W, Miller V, Zakowski M, Doherty J, Politi K, Sarkaria I, Singh B, Heelan R, Rusch V, Fulton L et al. 2004. EGF receptor gene mutations are common in lung cancers from "never smokers" and are associated with sensitivity of tumors to gefitinib and erlotinib. Proceedings of the National Academy of Sciences 101: 13306-13311.
Parang K, Till JH, Ablooglu AJ, Kohanski RA, Hubbard SR, Cole PA. 2001. Mechanism-based design of a protein kinase inhibitor. Nature Structural Biology 8: 37-41.
Parker PJ, Parkinson SJ. 2001. AGC protein kinase phosphorylation and protein kinase C. Biochemical Society Transactions 29: 860-863.
Parkin DM, Bray F, Ferlay J, Pisani P. 2005. Global Cancer Statistics, 2002. CA: A Cancer Journal for Clinicians 55: 74-108.
Pastor-Satorras R, Smith E, Sole RV. 2003. Evolving protein interaction networks through gene duplication. Journal of theoretical biology 222: 199-210.
Pawson T. 2004. Specificity in Signal Transduction: From Phosphotyrosine-SH2 Domain Interactions to Complex Cellular Systems. Cell 116: 191-203.
Peraldi P, Filloux C, Emanuelli B, Hilton DJ, Van Obberghen E. 2001. Insulin Induces Suppressor of Cytokine Signaling-3 Tyrosine Phosphorylation through Janus-activated Kinase. Journal of Biological Chemistry 276: 24614-24620.
Perner S, Wagner PL, Demichelis F, Mehra R, Lafargue CJ, Moss BJ, Arbogast S, Soltermann A, Weder W, Giordano TJ et al. 2008. EML4-ALK fusion lung cancer: a rare acquired event. Neoplasia (New York, NY) 10: 298-302.
Picard E, Seguin C, Monhoven N, Rochelte-Egly C, Siat J, Borrelly J, Martinet Y, Martinet N, Vignaud JM. 1999. Expression of retinoid receptor genes and proteins in non-small-cell lung cancer. Journal of the National Cancer Institute 91: 1059-1066.
Pinna LA, Ruzzene M. 1996. How do protein kinases recognize their substrate? Biochimica et Biophysica Acta 1314:191-225.
Pinkel D, Segraves R, Sudar D, Clark S, Poole I, Kowbel D, Collins C, Kuo W-L, Chen C, Zhai Y et al. 1998. High resolution analysis of DNA copy number variation using comparative genomic hybridization to microarrays. Nature genetics 20: 207-211.
Pirinen RT, Hirvikoski P, Johansson RT, Hollmén S, Kosma VM. 2001. Reduced expression of α-catenin, β-catenin, and γ-catenin is associated with high cell proliferative activity and poor differentiation in non-small cell lung cancer. Journal of Clinical Pathology 54: 391-395.
Pfeifer GP, Rauch TA. 2009. DNA methylation patterns in lung carcinomas. Semin Cancer Biol 19: 181–187.
Pollack JR, Perou CM, Alizadeh AA, Eisen MB, Pergamenschikov A, Williams CF, Jeffrey SS, Botstein D, Brown PO. 1999. Genome-wide analysis of DNA copy-number changes using cDNA microarrays. Nature genetics 23: 41-46.
Pollock JD, Krempin M, Rudy B. 1990. Differential effects of NGF, FGF, EGF, cAMP, and dexamethasone on neurite outgrowth and sodium channel expression in PC 12 cells. Journal of Neuroscience 10: 2626-2637.
Pomerantz J, Schreiber-Agus N, Liegeois NJ, Silverman A, Alland L, Chin L, Potes J, Chen K, Orlow I, Lee HW et al. 1998. The Ink4a tumor suppressor gene product, p19Arf, interacts with MDM2 and neutralizes MDM2's inhibition of p53. Cell 92: 713-723.
Prat M, Narsimhan RP, Crepaldi T, Nicotra MR, Natali PG, Comoglio PM. 1991. The receptor encoded by the human c-MET oncogene is expressed in hepatocytes, epithelial cells and solid tumors. International journal of cancer Journal international du cancer 49: 323-328.
143
Putnam EA, Yen N, Gallick GE, Steck PA, Fang K, Akpakip B, Gazdar AF, Roth JA. 1992. Autocrine growth stimulation by transforming growth factor-alpha in human non-small cell lung cancer. Surgical oncology 1: 49-60.
Qiao Y, Molina H, Pandey A, Zhang J, Cole PA. 2006. Chemical rescue of a mutant enzyme in living cells. Science 311: 1293-1297.
Quinlan MP, Settleman J. 2008. Explaining the preponderance of Kras mutations in human cancer: An isoform-specific function in stem cell expansion. Cell cycle (Georgetown, Tex) 7: 1332-1335.
Radtke S, Hermanns HM, Haan C, De Leur HSV, Gascan H, Heinrich PC, Behrmann I. 2002. Novel role of Janus kinase 1 in the regulation of oncostatin M receptor surface expression. Journal of Biological Chemistry 277: 11297-11305.
Rauch TA, Zhong X, Wu X, Wang M, Kernstine KH, Wang Z et al. 2008. High resolution mapping of DNA hypermethylation and hypomethylation in lung cancer. Proc Natl Acad Sci USA 105: 252–257.
Reinhart BJ, Weinstein EG, Rhoades MW, Bartel B, Bartel DP. 2002. MicroRNAs in plants. Genes Dev 16: 1616-1626.
Retera JMAM, Leers MPG, Sulzer MA, Theunissen PHMH. 1998. The expression of β-catenin in non-small-cell lung cancer: A clinicopathological study. Journal of Clinical Pathology 51: 891-894.
Ries LAG, Eisner MP, Kosary CL. 2003. SEER cancer statistics review, 1975-2000. SEER Cancer Statistics Review, 1975-2000.
Rikova K, Guo A, Zeng Q, Possemato A, Yu J, Haack H, Nardone J, Lee K, Reeves C, Li Y et al. 2007. Global Survey of Phosphotyrosine Signaling Identifies Oncogenic Kinases in Lung Cancer. Cell 131: 1190-1203.
Rizzo JM, Buck MJ. 2012. Key principles and clinical applications of "next-generation" DNA sequencing. Cancer Prev Res 7:887-900.
Roberts AW, Robb L, Rakar S, Hartley L, Cluse L, Nicola NA, Metcalf D, Hilton DJ, Alexander WS. 2001. Placental defects and embryonic lethality in mice lacking suppressor of cytokine signaling 3. Proceedings of the National Academy of Sciences of the United States of America 98: 9324-9329.
Rodig SJ, Meraz MA, White JM, Lampe PA, Riley JK, Arthur CD, King KL, Sheehan KCF, Yin L, Pennica D et al. 1998. Disruption of the Jak1 gene demonstrates obligatory and nonredundant roles of the Jaks in cytokine-induced biologic responses. Cell 93: 373-383.
Ross PL, Huang YN, Marchese JN, et al. 2004. Multiplexed protein quantitation in Saccharomyces cerevisiae using amine-reactive isobaric tagging reagents. Molecular and Cellular Proteomics 3: 1154–1169.
Ross R, Bowen-Pope DF, Raines EW. 1985. Platelet-derived growth factor: its potential roles in wound healing, atherosclerosis, neoplasia, and growth and development. Ciba Foundation symposium 116: 98-112.
Rui L, Yuan M, Frantz D, Shoelson S, White MF. 2002. SOCS-1 and SOCS-3 block insulin signaling by ubiquitin-mediated degradation of IRS1 and IRS2. Journal of Biological Chemistry 277: 42394-42398.
Rusch V, Baselga J, Cordon-Cardo C, Orazem J, Zaman M, Hoda S, McIntosh J, Kurie J, Dmitrovsky E. 1993. Differential expression of the epidermal growth factor receptor and its ligands in primary non-small cell lung cancers and adjacent benign lung. Cancer research 53: 2379-2385.
Rzhetsky A, Gomez SM. 2001. Birth of scale-free molecular networks and the number of distinct DNA and protein domains per genome. Bioinformatics (Oxford, England) 17: 988-996.
Sachon E, Mohammed S, Bache N, Jensen ON. 2006. Phosphopeptide quantitation using amine-reactive isobaric tagging reagents and tandem mass spectrometry: application to proteins isolated by gel electrophoresis. Rapid Communications in Mass Spectrometry 20: 1127–1134.
Sakuma Y, Matsukuma S, Yoshihara M, Nakamura Y, Noda K, Nakayama H, Kameda Y, Tsuchiya E, Miyagi Y. 2007. Distinctive evaluation of nonmucinous and mucinous subtypes of bronchioloalveolar carcinomas in EGFR and K-ras gene-mutation analyses for Japanese lung
144
adenocarcinomas: confirmation of the correlations with histologic subtypes and gene mutations. American journal of clinical pathology 128: 100-108.
Samet JM, Avila-Tang E, Boffetta P, Hannan LM, Olivo-Marston S, Thun MJ, Rudin CM. 2009. Lung Cancer in Never Smokers: Clinical Epidemiology and Environmental Risk Factors. Clinical Cancer Research 15: 5626-5645.
Sanchez-Cespedes M. 2011. The role of LKB1 in lung cancer. Fam Cancer. Sep;10(3):447-53. Sanders HR, Li HR, Bruey JM, Scheerle JA, Meloni-Ehrig AM, Kelly JC, Novick C, Albitar M. 2011.
Exon scanning by reverse transcriptase-polymerase chain reaction for detection of known and novel EML4-ALK fusion variants in non-small cell lung cancer. Cancer genetics 204: 45-52.
Sanger F, Nicklen S, Coulson AR. 1977. DNA sequencing with chain-terminating inhibitors. Proc Natl Acad Sci 74:5463–7.
Sartori G, Cavazza A, Sgambato A, Marchioni A, Barbieri F, Longo L, Bavieri M, Murer B, Meschiari E, Tamberi S et al. 2009. EGFR and K-ras mutations along the spectrum of pulmonary epithelial tumors of the lung and elaboration of a combined clinicopathologic and molecular scoring system to predict clinical responsiveness to EGFR inhibitors. American journal of clinical pathology 131: 478-489.
Sasaki A, Yasukawa H, Suzuki A, Kamizono S, Syoda T, Kinjyo I, Sasaki M, Johnston JA, Yoshimura A. 1999. Cytokine-inducible SH2 protein-3 (CIS3/SOCS3) inhibits Janus tyrosine kinase by binding through the N-terminal kinase inhibitory region as well as SH2 domain. Genes to Cells 4: 339-351.
Sayos J, Wu C, Morra M, Wang N, Zhang X, Allen D, Van Schaik S, Notarangelo L, Geha R, Roncarolo MG et al. 1998. The X-linked lymphoproliferative-disease gene product SAP regulates signals induced through the co-receptor SLAM. Nature 395: 462-469.
Schaper F, Gendo C, Eck M, Schmitz J, Grimm C, Anhuf D, Kerr IM, Heinrich PC. 1998. Activation of the protein tyrosine phosphatase SHP2 via the interleukin-6 signal transducing receptor protein gp130 requires tyrosine kinase Jak1 and limits acute-phase protein expression. Biochemical Journal 335: 557-565.
Schlessinger J. 2000. Cell signaling by receptor tyrosine kinases. Cell 103: 211-225. Schlessinger J, Lemmon MA. 2003. SH2 and PTB domains in tyrosine kinase signaling. Science"s STKE
[electronic resource] : signal transduction knowledge environment 2003. Schmelzle K, Kane S, Gridley S, Lienhard GE, White FM. 2006. Temporal dynamics of tyrosine
phosphorylation in insulin signaling. Diabetes 55: 2171-2179. Schmitz J, Dahmen H, Grimm C, Gendo C, Müller-Newen G, Heinrich PC, Schaper F. 2000. The
cytoplasmic tyrosine motifs in full-length glycoprotein 130 have different roles in IL-6 signal transduction. Journal of Immunology 164: 848-854.
Schneider TD, Stephens RM. 1990. Sequence Logos: A new way to display concensus sequences. Nucleic Acid Research 18:6097-6100.
Seet BT, Dikic I, Zhou MM, Pawson T. 2006. Reading protein modifications with interaction domains. Nature Reviews Molecular Cell Biology 7: 473-483.
Segatto O, Anastasi S, Alemà S. 2011. Regulation of epidermal growth factor receptor signalling by inducible feedback inhibitors. Journal of Cell Science 124: Pt 11: 1785-1793.
Sekido Y, Bader S, Latif F, Gnarra JR, Gazdar AF, Linehan WM, Zbar B, Lerman MI, Minna JD. 1994. Molecular analysis of the von Hippel-Lindau disease tumor suppressor gene in human lung cancer cell lines. Oncogene 9: 1599-1604.
Sharma SV, Settleman J. 2006. Oncogenic shock: turning an activated kinase against the tumor cell.Cell Cycle: 2878-2880.
Sharma SV, Bell DW, Settleman J, Haber DA. 2007. Epidermal growth factor receptor mutations in lung cancer. Nat Rev Cancer 7: 169-181.
Shaw AT, Yeap BY, Mino-Kenudson M, Digumarthy SR, Costa DB, Heist RS, Solomon B, Stubbs H, Admane S, McDermott U et al. 2009. Clinical features and outcome of patients with non-small-cell lung cancer who harbor EML4-ALK. Journal of clinical oncology : official journal of the American Society of Clinical Oncology 27: 4247-4253.
145
Shawver LK, Slamon D, Ullrich A. 2002. Smart drugs: Tyrosine kinase inhibitors in cancer therapy. Cancer cell 1: 117-123.
Shen H, Spitz MR, Qiao Y, Guo Z, Wang LE, Bosken CH, Amos CI, Wei Q. 2003. Smoking, DNA repair capacity and risk of nonsmall cell lung cancer. International journal of cancer Journal international du cancer 107: 84-88.
Shen K, Cole PA. 2003. Conversion of a Tyrosine Kinase Protein Substrate to a High Affinity Ligand by ATP Linkage. Journal of the American Chemical Society 125: 16172-16173.
Shewchuk LM, Hassell AM, Ellis B, Holmes WD, Davis R, Horne EL, Kadwell SH, McKee DD, Moore JT. 2000. Structure of the Tie2 RTK domain - Self-inhibition by the nucleotide binding loop, activation loop, and C-terminal tail. Structure 8: 1105-1113.
Shogren-Knaak MA, Alaimo PJ, Shokat KM. 2001. Recent advantages in chemical approaches to the study of biological systems. Annual Review of Cell and Developmental Biology 17: 405-433.
Silva JM, Li MZ, Chang K, Ge W, Golding MC, Rickles RJ, Siolas D, Hu G, Paddison PJ, Schlabach MR et al. 2005. Second-generation shRNA libraries covering the mouse and human genomes. Nature Genetics: 1281-1288.
Silva JM, Marran K, Parker JS, Silva J, Golding M, Schlabach MR, Elledge SJ, Hannon GJ, Chang K. 2008. Profiling essential genes in human mammary cells by multiplex RNAi screening. Science: 617-620.
Simon MA. 2000. Receptor tyrosine kinases: Specific outcomes from general signals. Cell 103: 13-15. Slupianek A, Nieborowska-Skorska M, Hoser G, Morrione A, Majewski M, Xue L, Morris SW, Wasik
MA, Skorski T. 2001. Role of Phosphatidylinositol 3-Kinase-Akt Pathway in Nucleophosmin/Anaplastic Lymphoma Kinase-mediated Lymphomagenesis. Cancer research 61: 2194-2199.
Smith M J, Hardy WR, Murphy JM, Jones N, and Pawson T. 2006. Screening for PTB domain binding partners and ligand specificity using proteome-derived NPXY peptide arrays. Mol. Cell. Biol. 26, 8461– 8474
Soda M, Choi YL, Enomoto M, Takada S, Yamashita Y, Ishikawa S, Fujiwara S-i, Watanabe H, Kurashina K, Hatanaka H et al. 2007. Identification of the transforming EML4-ALK fusion gene in non-small-cell lung cancer. Nature 448: 561-566.
Songyang Z, Blechner S, Hoagland N, Hoekstra MF, Piwnica-Worms H, Cantley LC. 1994a. Use of an oriented peptide library to determine the optimal substrates of protein kinases. Current biology : CB 4: 973-982.
Songyang Z, Cantley LC. 2004. ZIP codes for delivering SH2 domains. Cell 116: S41-43, 42 p following S48.
Songyang Z, Shoelson SE, McGlade J, Olivier P, Pawson T, Bustelo XR, Barbacid M, Sabe H, Hanafusa H, Yi T et al. 1994b. Specific motifs recognized by the SH2 domains of Csk, 3BP2, fps/fes, GRB- 2, HCP, SHC, Syk, and Vav. Molecular and Cellular Biology 14: 2777-2785.
Sordella R, Bell DW, Haber DA, Settleman J. 2004. Gefitinib-sensitizing EGFR mutations in lung cancer activate anti-apoptotic pathways. Science 305: 1163-1167.
Soria JC, Lee HY, Lee JI, Wang L, Issa JP, Kemp BL, Liu DD, Kurie JM, Mao L, Khuri FR. 2002. Lack of PTEN expression in non-small cell lung cancer could be related to promoter methylation. Clinical Cancer Research 8: 1178-1184.
Soria JC, Xu X, Liu DD, Lee JJ, Kurie J, Morice RC, Khuri F, Mao L, Hong WK, Lotan R. 2003. Retinoic acid receptor β and telomerase catalytic subunit expression in bronchial epithelium of heavy smokers. Journal of the National Cancer Institute 95: 165-168.
Soriano J.V., Pepper M.S., Nakamura T., Orci L., Montesano R. 1995. Hepatocyte growth factor stimulates extensive development of branching duct-like structures by cloned mammary gland epithelial cells. J Cell Sci. 413-30.
Soriano J.V., Pepper M.S., Nakamura T., Orci L., Montesano R. 1995. Hepatocyte growth factor stimulates extensive development of branching duct-like structures by cloned mammary gland epithelial cells. J Cell Sci. 413-30.
146
Soulieres D, Senzer NN, Vokes EE, Hidalgo M, Agarwala SS, Siu LL. 2004. Multicenter phase II study of erlotinib, an oral epidermal growth factor receptor tyrosine kinase inhibitor, in patients with recurrent or metastatic squamous cell cancer of the head and neck. Journal of clinical oncology : official journal of the American Society of Clinical Oncology 22: 77-85.
Sozzi G, Veronese ML, Negrini M, Baffa R, Cotticelli MG, Inoue H, Tornielli S, Pilotti S, De Gregorio L, Pastorino U et al. 1996. The FHIT gene at 3p14.2 is abnormal in lung cancer. Cell 85: 17-26.
Spivak-Kroizman T, Lemmon MA, Dikic I, Ladbury JE, Pinchasi D, Huang J, Jaye M, Crumley G, Schlessinger J, Lax I. 1994. Heparin-induced oligomerization of FGF molecules is responsible for FGF receptor dimerization, activation, and cell proliferation. Cell 79: 1015-1024.
Stahl N, Farruggella TJ, Boulton TG, Zhong Z, Darnell Jr JE, Yancopoulos GD. 1995. Choice of STATs and other substrates specified by modular tyrosine-based motifs in cytokine receptors. Science 267: 1349-1353.
Stambolic V, Suzuki A, De la Pompa JL, Brothers GM, Mirtsos C, Sasaki T, Ruland J, Penninger JM, Siderovski DP, Mak TW. 1998. Negative regulation of PKB/Akt-dependent cell survival by the tumor suppressor PTEN. Cell 95: 29-39.
Stamos J, Sliwkowski MX, Eigenbrot C. 2002. Structure of the epidermal growth factor receptor kinase domain alone and in complex with a 4-anilinoquinazoline inhibitor. The Journal of biological chemistry 277: 46265-46272.
Starr R, Hilton DJ. 1998. SOCS: Suppressors of cytokine signalling. International Journal of Biochemistry and Cell Biology 30: 1081-1085.
Starr R, Willson TA, Viney EM, Murray LJL, Rayner JR, Jenkins BJ, Gonda TJ, Alexander WS, Metcalf D, Nicola NA et al. 1997. A family of cytokine-inducible inhibitors of signalling. Nature 387: 917-921.
Stoiber D, Kovarik P, Cohney S, Johnston JA, Steinlein P, Decker T. 1999. Lipopolysaccharide induces in macrophages the synthesis of the suppressor of cytokine signaling 3 and suppresses signal transduction in response to the activating factor IFN-γ. Journal of Immunology 163: 2640-2647.
Sugio K, Uramoto H, Ono K, Oyama T, Hanagiri T, Sugaya M, Ichiki Y, So T, Nakata S, Morita M et al. 2006. Mutations within the tyrosine kinase domain of EGFR gene specifically occur in lung adenocarcinoma patients with a low exposure of tobacco smoking. British journal of cancer 94: 896-903.
Szerlip NJ, Pedraza A, Chakravarty D, Azim M, McGuire J, Fang Y, Ozawa T, Holland EC, Huse JT, Jhanwar S, et al. 2012. Intratumoral heterogeneity of receptor tyrosine kinases EGFR and PDGFRA amplification in glioblastoma defines subpopulations with distinct growth factor response. Proceedings of the National Academy of Sciences 109: 3041–3046.
Takahashi T, Sonobe M, Kobayashi M, Yoshizawa A, Menju T, Nakayama E, Mino N, Iwakiri S, Sato K, Miyahara R et al. 2010. Clinicopathologic features of non-small-cell lung cancer with EML4-ALK fusion gene. Annals of surgical oncology 17: 889-897.
Takamizawa J, Konishi H, Yanagisawa K et al. 2004. Reduced expression of the let-7 microRNAs in human lung cancers in association with shortened postoperative survival. Cancer Res; 64: 3753–6.
Takeuchi K, Choi YL, Soda M, Inamura K, Togashi Y, Hatano S, Enomoto M, Takada S, Yamashita Y, Satoh Y et al. 2008. Multiplex Reverse Transcription-PCR Screening for EML4-ALK Fusion Transcripts. Clinical Cancer Research 14: 6618-6624.
Takeuchi K, Choi YL, Togashi Y, Soda M, Hatano S, Inamura K, Takada S, Ueno T, Yamashita Y, Satoh Y et al. 2009. KIF5B-ALK, a Novel Fusion Oncokinase Identified by an Immunohistochemistry-based Diagnostic System for ALK-positive Lung Cancer. Clinical Cancer Research 15: 3143-3149.
Tanaka H., Yanagisawa K., K. Shinjo, A. Taguchi, K. Maeno, S. Tomida, Y. Shimada, H. Osada, T. Kosaka, H. Matsubara et al. 2007. Lineage-specific dependency of lung adenocarcinomas on the lung development regulator TTF-1. Cancer Res., 67 : 6007–6011
147
Tartaglia M, Mehler EL, Goldberg R, Zampino G, Brunner HG, Kremer H, Van der Burgt I, Crosby AH, Ion A, Jeffery S et al. 2001. Mutations in PTPN11, encoding the protein tyrosine phosphatase SHP-2, cause Noonan syndrome. Nature genetics 29: 465-468.
Temin HM. 1966. Studies on carcinogenesis by avian sarcoma viruses. 3 The differential effect of serum and polyanions on multiplication of uninfected and converted cells. J Natl Cancer Inst. 37:167–175.
Teng Y, Wang X, Wang Y, Ma D. 2010. Wnt/beta-catenin signaling regulates cancer stem cells in lung cancer A549 cells. Biochemical and biophysical research communications 392: 373-379.
Testa JR, Siegfried JM. 1992. Chromosome abnormalities in human non-small cell lung cancer. Cancer research 52: 2702s-2706s.
Till JH, Becerra M, Watty A, Lu Y, Ma Y, Neubert TA, Burden SJ, Hubbard SR. 2002. Crystal structure of the MuSK tyrosine kinase: Insights into receptor autoregulation. Structure 10: 1187-1196.
To CT, Tsao MS. 1998. The roles of hepatocyte growth factor/scatter factor and met receptor in human cancers (Review). Oncology reports 5: 1013-1024.
Tomizawa Y, Kohno T, Kondo H, Otsuka A, Nishioka M, Niki T, Yamada T, Maeshima A, Yoshimura K, Saito R et al. 2002. Clinicopathological significance of epigenetic inactivation of RASSF1A at 3p21.3 in Stage I lung adenocarcinoma. Clinical Cancer Research 8: 2362-2368.
Torres J, Navarro S, Roglá I, Ripoll F, Lluch A, García-Conde J, Llombart-Bosch A, Cervera J, Pulido R. 2001. Heterogeneous lack of expression of the tumour suppressor PTEN protein in human neoplastic tissues. European Journal of Cancer 37: 114-121.
Toschi L, Janne PA. 2008. Single-agent and combination therapeutic strategies to inhibit hepatocyte growth factor/MET signaling in cancer. Clinical cancer research : an official journal of the American Association for Cancer Research 14: 5941-5946.
Toulouse A, Morin J, Dion PA, Houle B, Edward W, Bradley C. 2000. RARβ2 specificity in mediating RA inhibition of growth of lung cancer- derived cells. Lung cancer (Amsterdam, Netherlands) 28: 127-137.
Toyooka S, Matsuo K, Shigematsu H, Kosaka T, Tokumo M, Yatabe Y, Ichihara S, Inukai M, Suehisa H, Soh J et al. 2007. The impact of sex and smoking status on the mutational spectrum of epidermal growth factor receptor gene in non small cell lung cancer. Clinical cancer research : an official journal of the American Association for Cancer Research 13: 5763-5768.
Toyooka S, Tsuda T, Gazdar AF. 2003. The TP53 gene, tobacco exposure, and lung cancer. Human mutation 21: 229-239.
Travis WD, Cancer IAfRo, Pathology IAo. 2004. Pathology and Genetics of Tumours of the Lung, Pleura, Thymus and Heart. IARC Press.
Trang P, Medina PP, Wiggins JF, Ruffino L, Kelnar K, Omotola M, Homer R, Brown D, Bader AG, Weidhaas JB, Slack FJ. 2010. Regression of murine lung tumors by the let-7 microRNA.Oncogene. 29(11):1580-7.
Turk BE, Hutti JE, Cantley LC. 2006. Determining protein kinase substrate specificity by parallel solution-phase assay of large numbers of peptide substrates. Nat Protocols 1: 375-379.
Ubersax JA, Ferrell JE Jr. 2007. Mechanisms of specificity in protein phosphorylation. Nature Reviews Molecular Cell Biology 8, 530-541.
Uhlik MT, Temple B, Bencharit S, Kimple AJ, Siderovski DP, Johnson GL. 2005. Structural and evolutionary division of phosphotyrosine binding (PTB) domains. Journal of Molecular Biology 345: 1-20.
Ullrich A, Coussens L, Hayflick JS, Dull TJ, Gray A, Tam AW, Lee J, Yarden Y, Libermann TA, Schlessinger J et al. 1984. Human epidermal growth factor receptor cDNA sequence and aberrant expression of the amplified gene in A431 epidermoid carcinoma cells. Nature 309: 418-425.
Ullrich A, Schlessinger J. 1990. Signal transduction by receptors with tyrosine kinase activity. Cell 61: 203-212.
148
Ungureanu D, Saharinen P, Junttila I, Hilton DJ, Silvennoinen O. 2002. Regulation of Jak2 through the ubiquitin-proteasome pathway involves phosphorylation of Jak2 on Y1007 and interaction with SOCS-1. Molecular and Cellular Biology 22: 3316-3326.
van der Geer P, Hunter T, Lindberg RA. 1994. Receptor protein-tyrosine kinases and their signal transduction pathways. Annual review of cell biology 10: 251-337.
van Zandwijk N, Mathy A, Boerrigter L, Ruijter H, Tielen I, de Jong D, Baas P, Burgers S, Nederlof P. 2007. EGFR and KRAS mutations as criteria for treatment with tyrosine kinase inhibitors: retro- and prospective observations in non-small-cell lung cancer. Annals of oncology : official journal of the European Society for Medical Oncology / ESMO 18: 99-103.
Villen J, Beausoleil SA, Gerber SA, Gygi SP. 2007. Large-scale phosphorylation analysis of mouse liver. Proceedings of the National Academy of Sciences of the United States of America 104: 1488-1493.
Wajapeyee N, Serra RW, Zhu X, Mahalingam M, Green MR. 2008. Cell 132: 363-374. Wang DG, Fan JB, Siao CJ, Berno A, Young P, Sapolsky R, Ghandour G, Perkins N, Winchester E,
Spencer J et al. 1998. Large-scale identification, mapping, and genotyping of single-nucleotide polymorphisms in the human genome. Science 280: 1077-1082.
Wang Y, Armstrong SA. 2007. Genome-wide SNP analysis in cancer: leukemia shows the way. Cancer cell 11: 308-309.
Wang Y, Li R, Du D, Zhang C, Yuan H, Zeng R, Chen Z. 2006. Proteomic analysis reveals novel molecules involved in insulin signaling pathway. Journal of Proteome Research 5: 846-855.
Ward LD, Howlett GJ, Discolo G, Yasukawa K, Hammacher A, Moritz RL, Simpson RJ. 1994. High affinity interleukin-6 receptor is a hexameric complex consisting of two molecules each of interleukin-6, interleukin-6 receptor, and gp-130. Journal of Biological Chemistry 269: 23286-23289.
Waterfield MD, Scrace GT, Whittle N, Stroobant P, Johnsson A, Wasteson A, Westermark B, CHH, Huang JS, Deuel TF. 1983. Platelet-derived growth factor is structurally related to the putative transforming protein p28sis of simian saccoma virus. Nature. 304:35–39.
Weinstein IB. 2002. Cancer. Addiction to oncogenes--the Achilles heel of cancer. in Science, pp. 63-64.
Wegenka UM, Buschmann J, Lutticken C, Heinrich PC, Horn F. 1993. Acute-phase response factor, a nuclear factor binding to acute-phase response elements, is rapidly activated by interleukin-6 at the posttranslational level. Molecular and Cellular Biology 13: 276-288.
Wehrman T, He X, Raab B, Dukipatti A, Blau H, Garcia KC. 2007. Structural and mechanistic insights into nerve growth factor interactions with the TrkA and p75 receptors. Neuron 53: 25-38.
Wei Q, Cheng L, Amos CI, Wang LE, Guo Z, Hong WK, Spitz MR. 2000. Repair of tobacco carcinogen-induced DNA adducts and lung cancer risk: a molecular epidemiologic study. Journal of the National Cancer Institute 92: 1764-1772.
Wei Q, Cheng L, Hong WK, Spitz MR. 1996. Reduced DNA Repair Capacity in Lung Cancer Patients. Cancer research 56: 4103-4107.
Weiderpass E. 2010. Lifestyle and cancer risk. Journal of Preventive Medicine and Public Health 43: 459-471.
Weir B, Zhao X, Meyerson M. 2004. Somatic alterations in the human cancer genome. Cancer cell 6: 433-438.
Weir BA, Woo MS, Getz G, Perner S, Ding L, Beroukhim R, Lin WM, Province MA, Kraja A, Johnson LA et al. 2007. Characterizing the cancer genome in lung adenocarcinoma. Nature 450: 893-898.
Wiesmann C, Ultsch MH, Bass SH, de Vos AM. 1999. Crystal structure of nerve growth factor in complex with the ligand-binding domain of the TrkA receptor. Nature 401: 184-188.
Winslow MM, Dayton TL, Verhaak RGW, Kim-Kiselak C, Snyder EL, Feldser DM, Hubbard DD, DuPage MJ, Whittaker CA, Hoersch S et al. 2011. Suppression of lung adenocarcinoma progression by Nkx2-1. Nature 473: 101-104.
149
White, F.M. 2007. On the iTRAQ of kinase inhibitors. Nature Biotechnology 25:994-996. Wong DW, Leung EL, So KK, Tam IY, Sihoe AD, Cheng LC, Ho KK, Au JS, Chung LP, Pik Wong M.
2009. The EML4-ALK fusion gene is involved in various histologic types of lung cancers from nonsmokers with wild-type EGFR and KRAS. Cancer 115: 1723-1733.
Wu X, Gu J, Amos CI, Jiang H, Hong WK, Spitz MR. 1998. A parallel study of in vitro sensitivity to benzo[a]pyrene diol epoxide and bleomycin in lung carcinoma cases and controls. Cancer 83: 1118-1127.
Wybenga-Groot LE, Baskin B, Ong SH, Tong J, Pawson T, Sicheri F. 2001. Structural basis for autoinhibition of the EphB2 receptor tyrosine kinase by the unphosphorylated juxtamembrane region. Cell 106: 745-757.
Xu B, Bird VG. , Miller TM. 1995. Substrate Specificities of the Insulin and Insulin-like Growth Factor 1 Receptor Tyrosine Kinase Catalytic Domains. The American Society for Biochemistry and Molecular Biology Volume 270, Number 50, Issue of December 15, 1995 pp. 29825-29830
Xu XC, Sozzi G, Lee JS, Lee JJ, Pastorino U, Pilotti S, Kurie JM, Hong WK, Lotan R. 1997. Suppression of retinoic acid receptor β in non-small-cell lung cancer in vivo: Implications for lung cancer development. Journal of the National Cancer Institute 89: 624-629.
Yanagisawa K, Kondo M, Osada H, Uchida K, Takagi K, Masuda A, Takahashi T. 1996. Molecular analysis of the FHIT gene at 3p14.2 in lung cancer cell lines. Cancer research 56: 5579-5582.
Yao Z, Fenoglio S, Gao DC, Camiolo M, Stiles B, Lindsted T, Schlederer M, Johns C, Altorki N, Mittal V et al. 2010. TGF-beta IL-6 axis mediates selective and adaptive mechanisms of resistance to molecular targeted therapy in lung cancer. in Proc Natl Acad Sci USA, pp. 15535-15540.
Yao F, Svensjo T, Winkler T, Lu M, Eriksson C & Eriksson E. 1998. Tetracycline repressor, tetR, rather than the tetR-mammalian cell transcription factor fusion derivatives, regulates inducible gene expression in mammalian cells. Human Gene Therapy 9: 1939–1950.
Yarden Y, Schlessinger J. 1987. Self-phosphorylation of epidermal growth factor receptor: evidence for a model of intermolecular allosteric activation. Biochemistry 26: 1434–1442.
Yarden Y, Sliwkowski MX. 2001. Untangling the ErbB signalling network. Nature Reviews Molecular Cell Biology 2: 127-137.
Yokomizo A, Tindall DJ, Drabkin H, Gemmill R, Franklin W, Yang P, Sugio K, Smith DI, Liu W. 1998. PTEN/MMAC1 mutations identified in small cell, but not in non-small cell lung cancers. Oncogene 17: 475-479.
Yoshimura A. 1998. The CIS family: Negative regulators of JAK-STAT signaling. Cytokine and Growth Factor Reviews 9: 197-204.
Yoshimura A, Naka T, Kubo M. 2007. SOCS proteins, cytokine signalling and immune regulation. Nature Reviews Immunology 7: 454-465.
Yuzawa S, Opatowsky Y, Zhang Z, Mandiyan V, Lax I, Schlessinger J. 2007. Structural Basis for Activation of the Receptor Tyrosine Kinase KIT by Stem Cell Factor. Cell 130: 323-334.
Zhang Y, Xiong Y, Yarbrough WG. 1998. ARF Promotes MDM2 Degradation and Stabilizes p53: ARF-INK4a Locus Deletion Impairs Both the Rb and p53 Tumor Suppression Pathways. Cell 92: 725-734.
Zhang X, Gureasko J, Shen K, Cole PA, Kuriyan J. 2006. An Allosteric Mechanism for Activation of the Kinase Domain of Epidermal Growth Factor Receptor. Cell 125: 1137-1149.
Zhang Y, Wolf-Yadlin A, Ross PL, Pappin DJ, Rush J, Lauffenburger DA, White FM. 2005. Time-resolved mass spectrometry of tyrosine phosphorylation sites in the epidermal growth factor receptor signaling network reveals dynamic modules. Molecular and Cellular Proteomics 4: 1240-1250.
Zhang J, Adrian FJ, Jahnke W, Cowan-Jacob SW, Li AG, Iacob RE, Sim T, Powers J, Dierks C, Sun F et al. 2010. Targeting Bcr-Abl by combining allosteric with ATP-binding-site inhibitors. Nature 463: 501-506.
Zhang J, and Allen, M. D. 2007. FRET-based biosensors for protein kinases: illuminating the kinome. Mol. Biosyst. 3, 759–765.
150
Zhang S, Guo D, Jiang L, Zhang Q, Qiu X, et al. 2008. SOCS3 inhibiting migration of A549 cells correlates with PYK2 signaling in vitro. BMC Cancer 8: 150.
Zhao X, Li C, Paez JG, Chin K, Jänne PA, Chen T-H, Girard L, Minna J, Christiani D, Leo C et al. 2004. An Integrated View of Copy Number and Allelic Alterations in the Cancer Genome Using Single Nucleotide Polymorphism Arrays. Cancer research 64: 3060-3071.
Zhao X, Weir BA, LaFramboise T, Lin M, Beroukhim R, Garraway L, Beheshti J, Lee JC, Naoki K, Richards WG et al. 2005. Homozygous Deletions and Chromosome Amplifications in Human Lung Carcinomas Revealed by Single Nucleotide Polymorphism Array Analysis. Cancer research 65: 5561-5570.
Zhu CQ, da Cunha Santos G, Ding K, Sakurada A, Cutz JC, Liu N, Zhang T, Marrano P, Whitehead M, Squire JA et al. 2008. Role of KRAS and EGFR as biomarkers of response to erlotinib in National Cancer Institute of Canada Clinical Trials Group Study BR.21. Journal of clinical oncology : official journal of the American Society of Clinical Oncology 26: 4268-4275.
Zhu G, Liu Y, Shaw S. 2005. Protein kinase specificity. A strategic collaboration between kinase peptide specificity and substrate recruitment. Cell Cycle 4: 52-56.
Zöchbauer-Müller S, Fong KM, Virmani AK, Geradts J, Gazdar AF, Minna JD. 2001. Aberrant promoter methylation of multiple genes in non-small cell lung cancers. Cancer research 61: 249-255. Meyerson M, Gabriel S, Getz G. 2010. Advances in understanding cancer genomes through second-generation sequencing. Nat Rev Genet 11: 685-696.
Zwick E, Bange J, Ullrich A. 2001. Receptor tyrosine kinase signalling as a target for cancer intervention strategies. Endocrine-related cancer 8: 161-173. Fuller CW, Middendorf LR, Benner SA, Church GM, Harris T, Huang X, Jovanovich SB, Nelson JR, Schloss JA, Schwartz DC et al. 2009. The challenges of sequencing by synthesis. Nat Biotech 27: 1013-1023.