Embed Size (px)
Citation preview
Substrate recognition and specificity of double-stranded RNAbinding proteins
Lela Vukovic1,2, Hye Ran Koh1,2, Sua Myong2,3, KlausSchulten1,2
1Department of Physics, University of Illinois at Urbana-Champaign, Urbana, IL 61801, UnitedStates2Center for the Physics of Living Cells, University of Illinoisat Urbana-Champaign, Urbana,IL 61801, United States3Department of Bioengineering, University of Illinois at Urbana-Champaign, Urbana, IL 61801,United States
* Authors to whom all correspondence should be addresed: [email protected], [email protected]
Electronic Supporting Information (ESI)
S1

Figure S1: SEQLOGO constructed from 8 sequences of dsRBDs (TRBP dsRBD1, TRBP dsRBD2, PACT dsRBD1, PACT dsRBD2, ADAR1 dsRBD1, ADAR1 dsRBD2, ADAR2 dsRBD1, ADAR2 dsRBD2). The SEQLOGOwas generated with Weblogo 3.3 [1].
S2

Figure S2: EMSA of 25-bp duplexes incubated with 0, 1, and 5µM of TRBP-RBD2. TRBP-RBD2 binds todsRNA and DNA-RNA (only 5µM TRBP-RBD2), and does not bind to dsDNA. The quantified binding fractionof TRBP-RBD2 to each duplex is displayed below the gel image.
S3

0 20 40 60 800
3
6
9
12
15
0 20 40 60 800
3
6
9
12
15
0 20 40 60 800
3
6
9
12
15NH-bond= 5.04NH-bond= 6.88
NH-bo
nd
t [ns]
dsRNA
NH-bond= 8.03
NH-bo
nd
t [ns]
DNA-RNA
NH-bo
nd
t [ns]
dsDNA
Figure S3: Time dependence of the number of hydrogen bonds atthe interface of TRBP-RBD2 with dsRNA (left),DNA-RNA (middle) and dsDNA (right) duplexes. The average number of hydrogen bonds is shown in the topright corner of each plot.
Table S1: Averages of selected helical parameters (twist, slide, and roll) for dsRNA, DNA-RNA, and dsDNAduplexes in complex with TRBP-RBD2. Dihedral anglesδ and χ, and phase angles of pseudorotation,P, ofduplex strands I and II. For DNA-RNA duplex, strands I and II correspond to RNA and DNA strands, respectively.The reported values are evaluated from averaged structuresof complexes, which were obtained by averaging thecoordinates of each system over the last 40 ns of simulation.Standard deviations are given in brackets. All thevalues in the table were calculated with 3-DNA software [2].
Duplex Twist [◦] Slide [A] Roll [◦] δI [◦] δII [◦] χI [◦] χII [◦] PI [◦] PII [◦]dsRNA 29.5 (1.6) -1.4 (0.3) 11 (4) 79 (3) 79 (2) -156 (6) -155 (6) 17 (5) 18 (4)
DNA-RNA 30.2 (1.6) -1.1 (0.4) 7 (4) 82 (6) 111 (9) -153 (8) -129 (15) 19 (18) 109 (28)dsDNA 32.2 (2.8) -0.6 (0.3) 4 (4) 119 (8) 118 (10) -120 (9) -123 (13) 126 (17) 125 (17)
S4

Figure S4: Interactions of positively charged TRBP-RBD2 residues with a major groove of dsRNA, DNA-RNAand dsDNA. Distances of Lys210, Lys211, Lys214 and Arg215 residues from the nearest phosphate groups (P-atoms) are shown for the last 85 ns of simulations. Thin linescorrespond to data sampled from trajectories; thicklines show gliding time averages over 800 ps.
S5

Figure S5: Register fit of Lys210-Lys214 pair in major grooves of dsRNA(a), DNA-RNA (b), and dsDNA(c).Nitrogen atoms in the amino groups of Lys210 and Lys214 are highlighted as blue spheres, and phosphorus atoms,which coordinate the shown amino groups, are highlighted astan spheres. TRBP-RBD2 is shown as transparentcartoon, and duplexes are shown by backbone contours. The shown complexes are obtained by averaging thecoordinates of each system over the last 40 ns of simulation.
S6

Figure S6: Duplex forms of dsRNA, DNA-RNA and dsDNA simulated in 0.05 M NaCl. The analyzed duplexesare obtained by averaging the coordinates of each system over the last 40 ns of simulation. (a) Helical rise forduplex base pairs of A-form dsRNA, B-form dsDNA, and averaged structures of simulated dsRNA, DNA-RNA,and dsDNA. Helical rise values were calculated with 3-DNA software [2]. (b) Averaged structures of three studiedduplexes. RNA strands are shown in gold, and DNA strands are shown in orange. Tan arrows indicate majorgroove widths and red arrows point to minor grooves.
S7
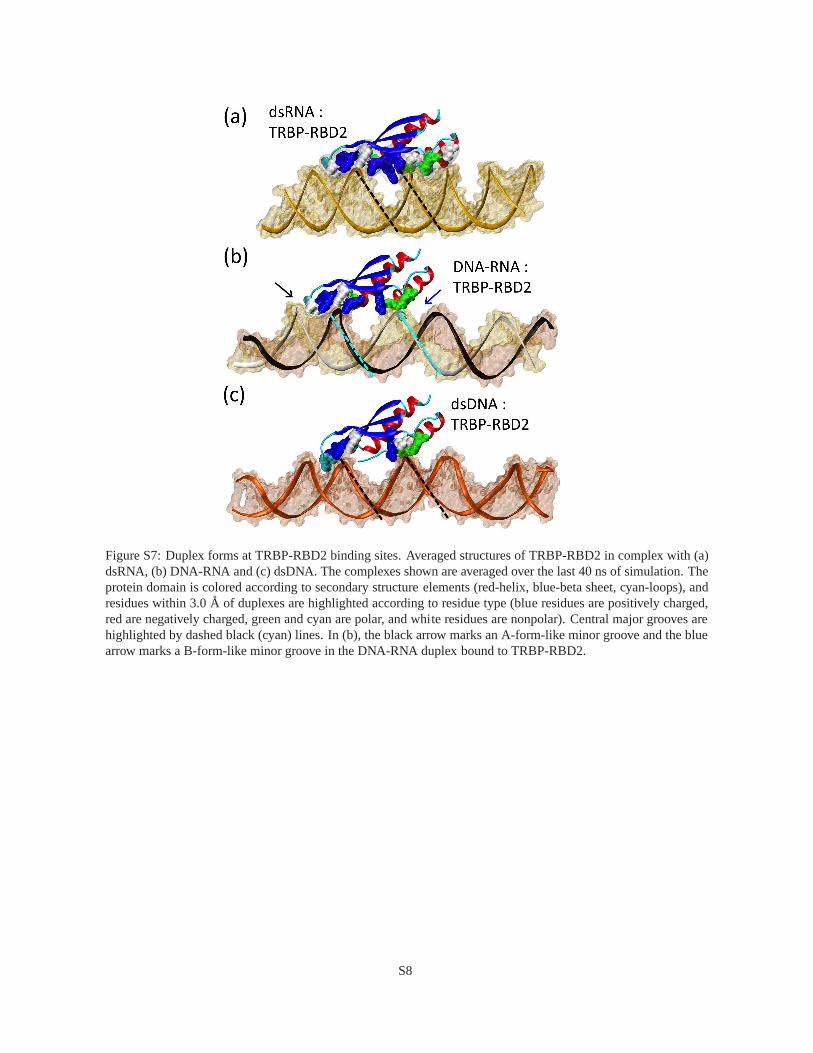
Figure S7: Duplex forms at TRBP-RBD2 binding sites. Averaged structures of TRBP-RBD2 in complex with (a)dsRNA, (b) DNA-RNA and (c) dsDNA. The complexes shown are averaged over the last 40 ns of simulation. Theprotein domain is colored according to secondary structureelements (red-helix, blue-beta sheet, cyan-loops), andresidues within 3.0A of duplexes are highlighted according to residue type (blue residues are positively charged,red are negatively charged, green and cyan are polar, and white residues are nonpolar). Central major grooves arehighlighted by dashed black (cyan) lines. In (b), the black arrow marks an A-form-like minor groove and the bluearrow marks a B-form-like minor groove in the DNA-RNA duplexbound to TRBP-RBD2.
S8
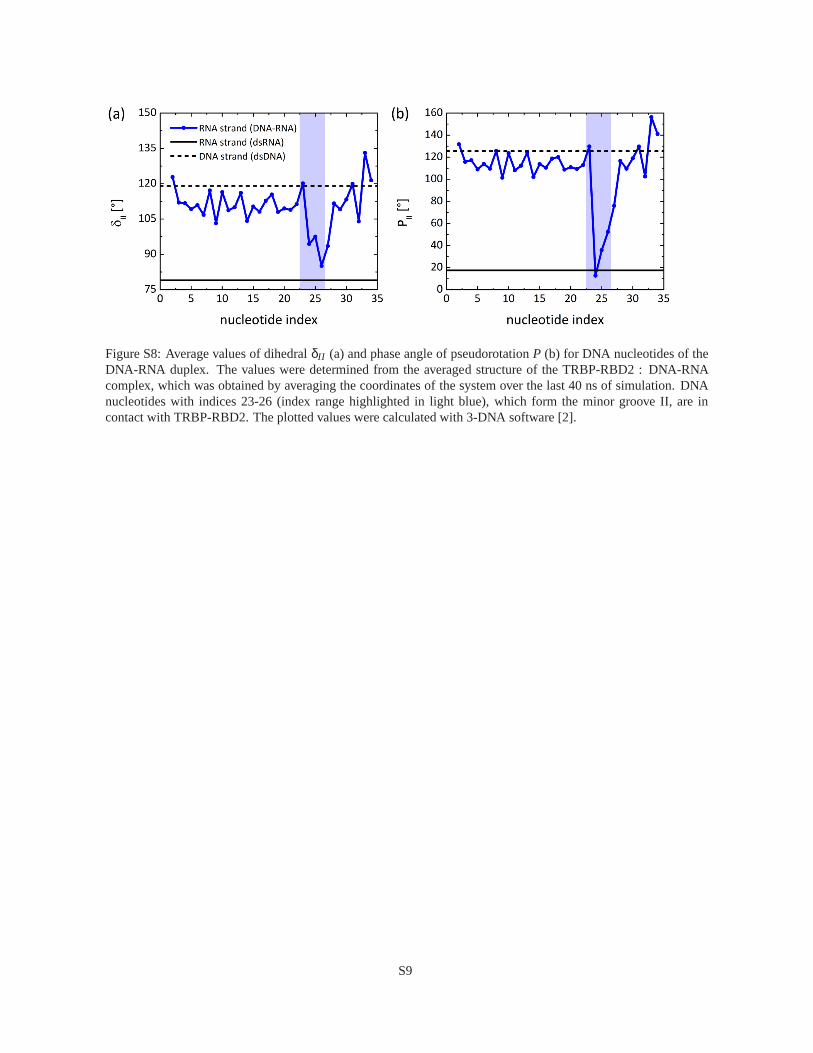
Figure S8: Average values of dihedralδII (a) and phase angle of pseudorotationP (b) for DNA nucleotides of theDNA-RNA duplex. The values were determined from the averaged structure of the TRBP-RBD2 : DNA-RNAcomplex, which was obtained by averaging the coordinates ofthe system over the last 40 ns of simulation. DNAnucleotides with indices 23-26 (index range highlighted inlight blue), which form the minor groove II, are incontact with TRBP-RBD2. The plotted values were calculatedwith 3-DNA software [2].
S9

cont
act a
rea
[Å]
time [ns]
TRBP-RBD1 TRBP-RBD2
ener
gy [k
cal/m
ol]
time [ns]
Figure S9: Interaction of TRBP-RBD1 and TRBP-RBD2 with the dsRNA duplex. (Top) Contact areas betweenTRBP-RBD1 or TRBP-RBD2 and dsRNA. (Bottom) Interaction (nonbonding) energy between TRBP-RBD1 orTRBP-RBD2 and the dsRNA duplex. The plots are shown for the last 85 ns of simulations.Thin lines correspondto data sampled from trajectories; thick lines show glidingtime averages over 800 ps.
S10

References
[1] Crooks, G. E., Hon, G., Chandonia, J. M. and Brenner, S. E.(2004) WebLogo: A sequence logo generator.Genome Res. 14,1188-1190.
[2] Lu, X.-J. and Olson, W. K. (2003) 3DNA: A software packagefor the analysis, rebuilding and visualization ofthree-dimensional nucleic acid structures.Nucleic Acids Res. 31, 5108-5121.
S11