Embed Size (px)
Citation preview
Substitute Liquid Fuels (SLF) Used in Cement Kilns - Life Cycle Analysis
Research’ and Development
Technical Report P274
@!!I A ENVIRONMENT AGENCY
Ali pulps used in production of this paper is sourced from sustainable managed forests and are elemental chlorine free and wood free
SubstitukLiquid Fuels (SLF) Used in Cement Kilns- Life Cjde Analysis.
R&D’Technical Report I?274
Research Contractor: Chem Systems Ltd
Further copies of this report are available from: Environment Agency R&D Dissemination Centre, c/o WRc, Frankland Road, Swindon, Wilts SN5 8YF
tel: 017934465000 fax: 01793414562 e-mail: [email protected]:
Publishing Organisation: Environment Agency Rio House Waterside Drive Aztec West Almondsbury Bristol BS32 4UD
Tel: 01454 624400 Fax: 01454 624409
ISBN: 1 857 05079 7
0 Environment Agency 1999
All rights reserved. No part of this document may be reproduced, stored in a retrieval system, or transmitted, in any form or by any means, electronic, mechanical, photocopying, recording or otherwise without the prior permission of the Environment Agency.
The views expressed in this document are not necessarily those:of the Environment Agency. Its officers, servant or agents accept no liability whatsoever for any loss or damage arising from the interpretation.or use of the information, or reliance upon views contained herein.
Dissemination status Internal: Released to Regions External: Released to the Public Domain
Statement of use This report summarises the findings of research carried out to provide information on the Life Cycle Analysis of Substitute Liquid Fuels used for burning in cement kilns. This information within this document is for use by Environment Agency staff and others involved in the management of Process Industries Regulation.
Research contractor This document was produced under R&D Project P4-044 by:
Chem Systems Ltd IBM South Bank 3SW 76 Upper Ground London SE1 9PZ
Tel: 0171202 6000 Fax: 0171202 6038
Environment Agency Project Leader The Environment Agency’s Project Leader for R&D Project P4-044 was: Mr Don Munns, Environment Agency, Thames Region
R&D Technical Report P274
CONTENTS Page
Executive Summary
Keywords I:
1;
1.1 1.2 1.3 2. 2.1 2.2 2.3 3. 3.1 3.2 3.3 3.4 3.5 4. 4.1 4.2 5: 5.1 5.2 5.3 5.4 5.5
Introduction
Background Objectives Study. Outline Waste Streams Sources Waste Compositions : Quantities of Waste Streams Life Cycle Assessment (LCA) Approach Life Cycle Inventory Calculation. Life Cycle Inventory Results Environmental-Impact Analysis Conclusions of Life Cycle Assessment (LCA) Economic and Market Issues Economics Waste Supply and,Disposal Summary and Conclusions. General Waste Streams Life.Cycle Assessment Economic and Market Issues Criteria for Exclusions
Bibliography:
List of Tables
2.1 Commonly usedsolvents . 2.2 Typical compositionsof waste available for SLF 2.3 Further examples of organic compounds in incinerable waste 2.4 Organic waste arisings: Number of consignments in selected
categories (12 months 19996/7 - partial) 2.5 Information on number of UK operating units in selected types of ..
industry 2.6 Partial estimate of arisings of selected wastes, UK, 199617
(thousand tonnes per year) 2.7 Selected organic wastes form German industry and hospitals’ 2.8 Estimates of incinerable wastes from the UK chemical industry (1997) 2.9 Solvent use indicative estimates, UK; 1997 2.10 ,: Solvent waste estimates, UK, 1997 2.11 Collection and disposal of used oil by the UK; ‘1993 (*)
iv
V
1
1 1 2 3 3- 15 20 29 29.. 39 50 70 74 80 80 86 92, 92 92 93 95. 96
99
4 16 19
20
20
22,: 23 24 25: 26 26 ..
R&D Technical Report P274 ‘. i
2.12 Summary estimate of quantities of selected organic wastes in the UK, 1997
2.13 3.1 3.2 3.3
3.4 3.5
3.6
3.7 3.8
Maximum SLF consumption in cement kilns Composition of wastes studied in LCA (‘) Compositions of coal and petcoke Partitioning of waste elements between incinerator output streams (percent) Fuel consumption per tonne of clinker Partitioning of waste elements between cement ‘kiln output.streams (percent) Life Cycle Inventory data: incineration system and SLF to wet process cement kiln Sulphur dioxide emissions (grams per kg SLF) Life Cycle Inventory data: incineration system and SLF to dry process cement kiln
3.9
3.10
3.11
3.12
3.13
3.14 3.15 3.16 3.17
3.18 4.1 4.2 4.3 4.4 5.1
Life Cycle Inventory data: incineration system, SLF to wet process cement kiln, recycling (toluene) Life Cycle Inventory data: incineration system, SLF to wet process cement kiln, recycling (acetone) Life Cycle Inventory data: incineration system, SLF to wet process cement kiln, recycling (trichloroethylene) Life Cycle Inventory data: incineration system and SLF to cement kiln: aqueous waste Life Cycle Inventory data: incineration system and SLF to cement kiln: oily waste Life Cycle Inventory data: clean fuel to cement kiln option Example of LCA Impact Categories Differences in atmospheric emissions weighted by EAL Differences in environmental burdens per functional unit divided by total UK burdens per year Possible exclusion limits for individual wastes being blended to SLF Indicative economics of disposal routes (& per tonne waste feed) Solvent processed by CORA members 1990-94 (OOOm3) Waste incinerated in UK (000 tonnes) Indicative trends in future waste arisings to 2005 Summary estimate of quantities of selected organic wastes in the UK, 1997
5.2 Maximum SLF consumption in cement kilns , 5.3 Possible exclusion limits for individual wastes being blended to SLF
List of Figures
3.1 3.2 3.3 3.4 3.5 3.6
Typical LCA System LCA systems compared in the study Simplified incinerator system Simplified SLF to cement kiln system Simplified solvent recovery system SLF to cement kiln (wet process) impacts as percentage of incineration impacts
27 28 40 41
43 45
48
52 54
55
57
59
61
63
66 ks 71 72
72 78 84 87 88 90
93 96 97
29 34 42 44 49
53
R&D Technical Report P274 .. ii
3.7
3.8 3.9 3.10 3.11 3.12
3.13 3.14 4.1 4.2 4.3 5.1
SLF cement kiln (dry process) impacts as percentage of incineration impacts 53 Impacts as percentage of incineration impacts : hydrocarbon solvent 58 IYmpacts as percentage of incineration impacts :,oxygenated.soIvent 58 Impacts as percentage of incineration impacts: chlorinated waste 64 Impacts as percentage of incineration impacts: aqueous waste 64 Impacts as percentage of incineration impacts, no fuel substitution: oily waste 65 Impacts as percentage of incineration impacts: deep recovery case 69 Impacts as percentage of incineration impacts: clean fuel to cement kiln i 69 Prices of selected solvents 81 Solvent recovery.versus processing time 83 Recycler gate fee versus solvent price 85 Impacts as percentage of incineration impacts: oxygenated solvent 95
R&D Technical Report P274 . . . 111
EXECUTIVE SUMMARY
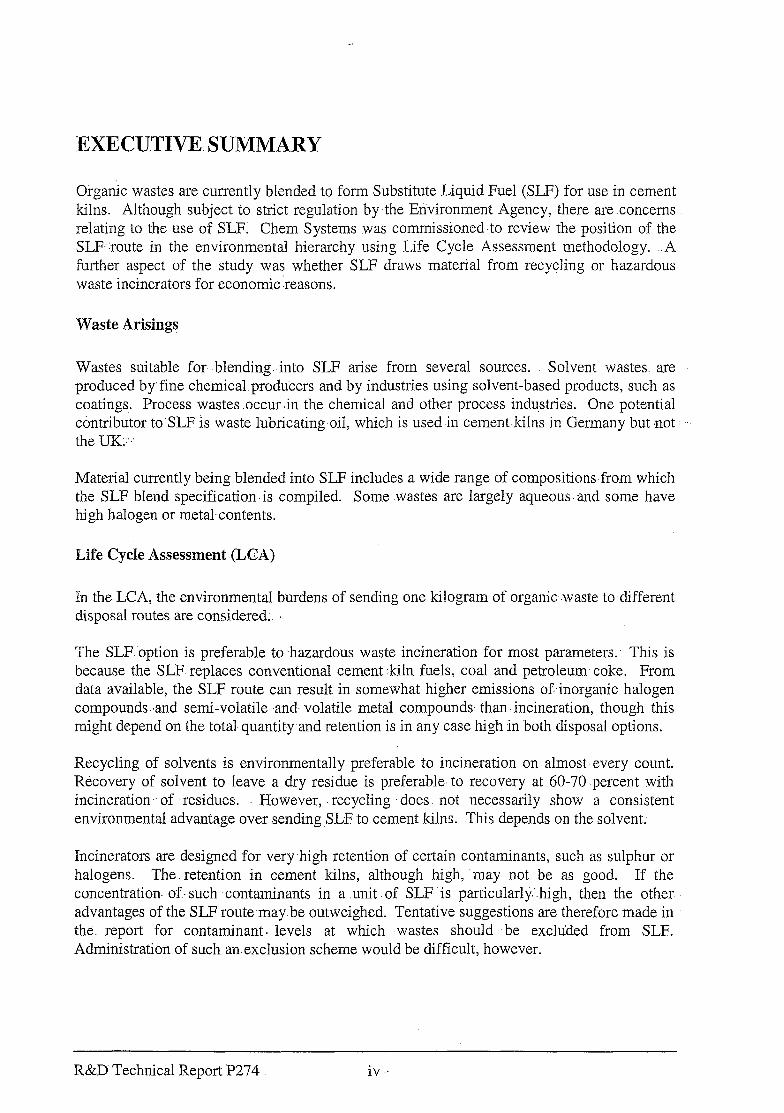
Organic wastes are currently blended to form Substitute Liquid Fuel (SLF) for use in cement kilns. Although subject to strict regulation by the Environment Agency, there are concerns relating to the use of SLF. Chem Systems was commissioned to review the position of the SLF ‘route in the environmental hierarchy using Life Cycle Assessment methodology. ..A further aspect of the study was whether SLF draws material from recycling or hazardous waste incinerators for economicreasons.
Waste Arising!
Wastes suitable for -blending. into SLF arise from several sources. Solvent wastes are produced by,fine chemical producers and by industries using solvent-based products, such as coatings. Process wastes .occur ,in the chemical and other process industries. One potential contributor to‘SLF is waste lubricating oil, which is used-in cement.kilns in Germany but ,not the UK;:~..
Material currently being blended into SLF includes a wide range of compositions from which the SLF blend specification is compiled. Some .wastes are largely aqueous. and some have high halogen or metal contents.
Life Cycle Assessment -(I,CA)
In the LCA, the environmental burdens of sending one kilogram of organic .waste to different disposal routes are considered..
The SLF. option is preferable to ,hazardous waste incineration for most parameters.- This is because the SLF reptaces conventional cement kiln fuels, coal and petroleum- coke. From data available, the SLF route can result -in somewhat higher emissions of..inorganic halogen compounds ,and semi-volatile and volatile metal compounds. than : incineration, though this might depend on the total, quantity and retention is in any case high in .both disposal options.
Recycling of solvents is environmentally preferable to incineration on. almost. every count. Recovery of solvent to leave a dry residue is preferable, to recovery at 60-70 .percent with incineration .. of residues. However, recycling does not necessarily show a consistent environmental advantage over sending SLF ‘to cement kilns. This depends on the solvent.
Incinerators are designed for very-high retention of certain contaminants, such as sulphur or halogens. The retention in cement kilns, although high, ‘may not be as good. If the concentration- of. such .contaminants in a .unit of SLF is particularly.high, then the other advantages of the SLF route-may be outweighed.. Tentative suggestions are therefore made in the. report for contaminant. levels at which wastes should be excluded from SLF. Administration of such an. exclusion scheme would be difficult, however.
R&D Technical Report P274 iv
Economics
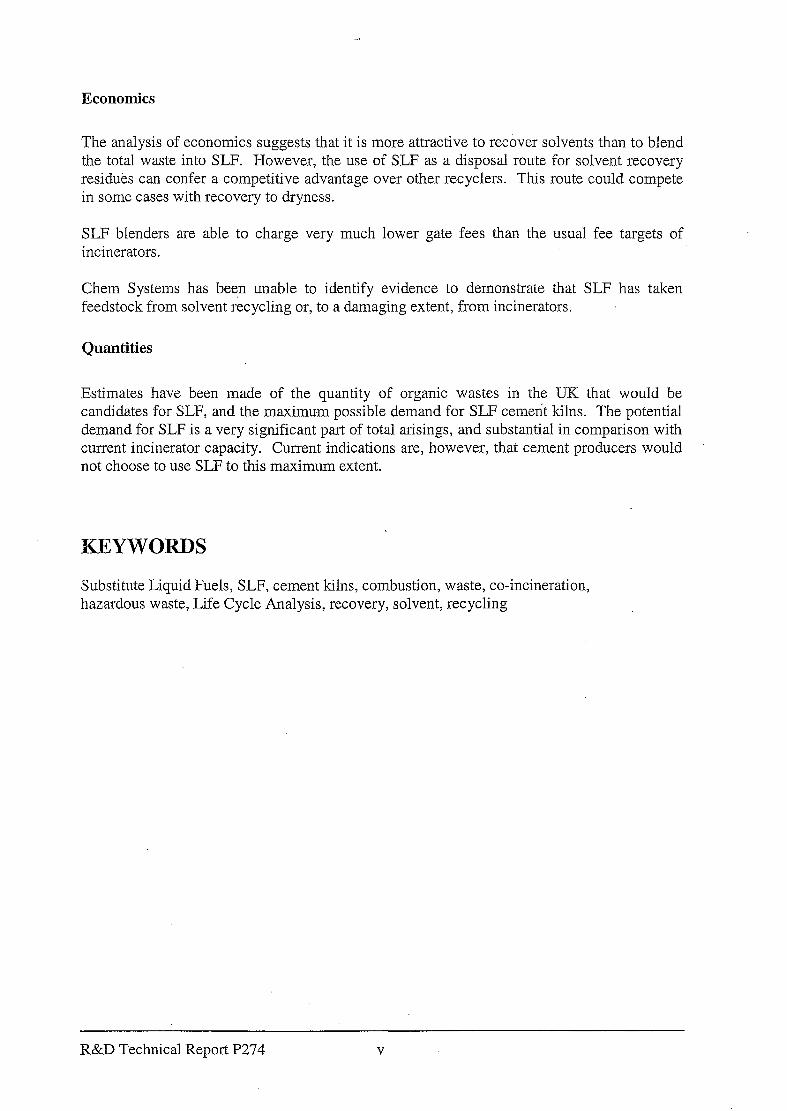
The analysis of economics suggests that it is more attractive to recover solvents than to blend the total waste into SLF. However, the use of SLF as a disposal route for solvent recovery residues can confer a competitive advantage over other recyclers. This route could compete in some cases with recovery to dryness.
SLF blenders are able to charge very much lower gate fees than the usual fee targets of incinerators.
Chem Systems has been unable to identify evidence to demonstrate that SLF has taken feedstock from solvent recycling or, to a damaging extent, from incinerators.
Quantities
Estimates have been made of the quantity of organic wastes in the UK that would be candidates for SLF, and the maximum possible demand for SLF cement kilns. The potential demand for SLF is a very significant part of total arisings, and substantial in comparison with current incinerator capacity. Current indications are, however, that cement producers would not choose to use SLF to this maximum extent.
Substitute Liquid Fuels, SLF, cement kilns, combustion, waste, co-incineration, hazardous waste, Life Cycle Analysis, recovery, solvent, recycling
R&D Technical Report P274 V
1. INTRODUCTION
1.1 Background
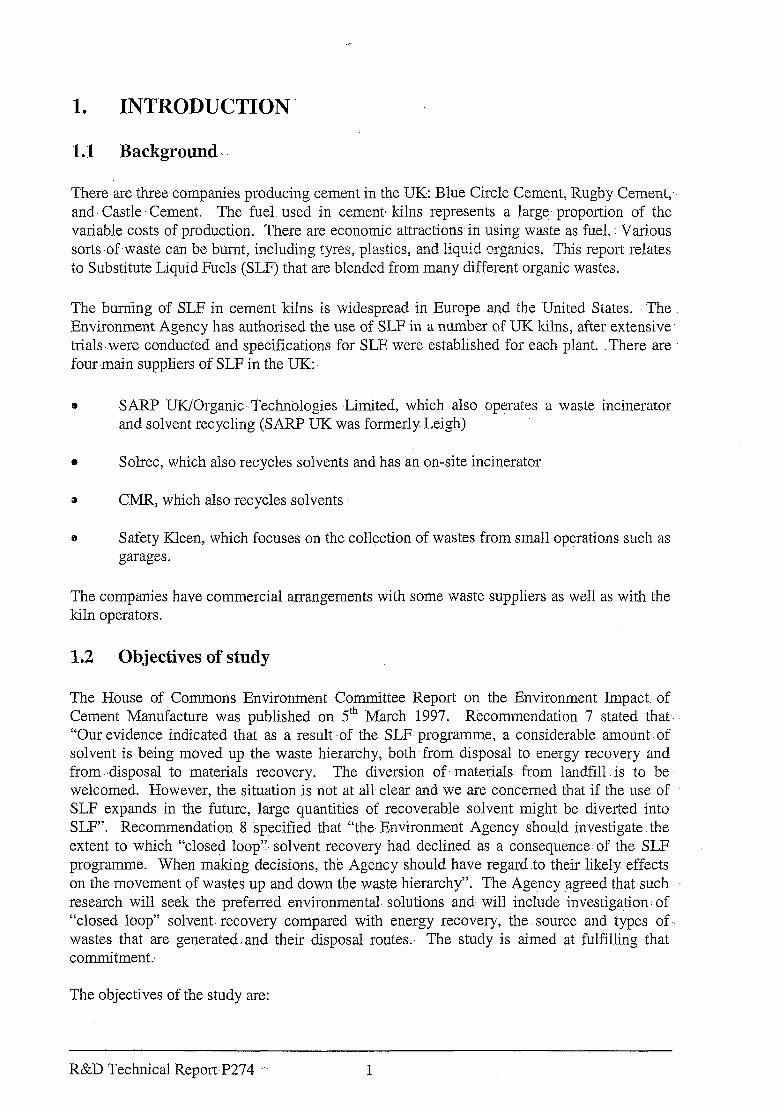
There are three companies producing cement in the UK: Blue Circle Cement, Rugby Cement;. and- Castle. Cement. The fuel used in cement, kilns represents a large. proportion of the variable costs of production. There are economic attractions-in using waste as fuel. : Various sorts ,of waste can be burnt, including tyres, p!astics: and liq& u 11lA nrganics. This report relates to Substitute.Liquid Fuels (SLF) that are blended from many different organic wastes.
The burnmg of SLF in cement kilns is widespread in Europe and the United States. The Environment Agency has authorised the use of SLF in a number of UK kilns, after extensive trials-.were conducted and specifications for. SLF were established for each plant. -There are four main suppliers of SLF in the UK:
0 SARP UK/Organic Technologies Limited, which also operates a waste incinerator and solvent recycling (SARP UK was formerly Leigh)
a Solrec, which also recycles solvents and has an on-site incinerator
a CMR, which also recycles solvents
43 Safety Kleen, which focuses on the collection of wastes from small operatio:ns such as garages.
The companies have commercial arrangements with some waste suppliers as -well as with the kiln operators.
1.2 Objectives of study
The House of Commons Environment Committee Report on the Environment Impact. of Cement Manufacture was published on 5th March 1997. Recommendation 7 stated that- “Our evidence indicated that as a result -of the SLF programme, a considerable amount,.of solvent is being moved up the waste hierarchy, both-from disposal to energy recovery and from -disposal to materials recovery. The diversion of- materials from landfill is to be : welcomed. However, the situation is not at all clear and we are concerned that if the use of SLF expands in the future, large quantities of recoverable solvent might be diverted into SLF”. Recommendation 8 specified that “the- Environment Agency should investigate. the extent to which “closed loop’r- solvent recovery had declined as a consequence: of the SLF programme. When making decisions, the Agency should have regard to their likely effects on the movement of wastes up and down the .waste hierarchy”. The Agency agreed that such research will seek the preferred environmental solutions and- will include investigation : of “closed loop” solvent. recovery compared with energy. recovery, the source and types of .I wastes that are generated. and their disposal routes The study is aimed-at fulfilling that commitment.
The objectives of the study are:
R&D Technical Report,P274 .I 1
l to provide information on the sources, composition and volumes of materials used to make SLF
l to evaluate environmental options and especially identify those waste streams that are unsuitable for blending in SLF
l to assess the extent to which large quantities of recoverable wastes might be diverted into SLF in the future and the trend historically.
1.3 Study outline
The study consists of the following parts:
l Section 3: a review of the type of wastes used in SLF and their compositions, with a commentary on quantities arising
a Section 4: an environmental Life Cycl’e Assessment’?o~compare the SLF: route with recycling and incineration, leading to possible conclusions on wastes to be excluded from SLF
8 Section 5: an analysis of the economics of disposal routes and recycling, plus a review of future trends
0 Section 6: conclusions.
R&D Technical Report P274 2
2. WASTE STREAMS
2.1 Sources
2.1.1 General
Wastes used in the preparation of SLF arise from many sources.. The .main categories of .’ waste and the industries from. which they originate are. noted below. In Section -3.2, illustrative compositions of different wastes used in SLF are presented. ‘Broad estimates of available quantities are given in Section 3.3.
One element of methodology in this report. should be noted. For any type of source of waste, the exact chemical constituents and the composition can ‘vary very widely. For. example, wastes might-be almost all liquid organics, or may be aqueous washings. One of the purposes of this report is to assess whether any wastes should be excluded from SLF on environmental grounds. It is simply not meaningful, because of the variability in composition, to base such recommendations on. generic definitions of waste type orsource. Any exclusions must be based on chemical analysis and- other properties such as energy content.. For this reason, exact characterisation of individual wastes is less important than broad definitions and trends.
2.1.2 Types of organic compounds
The wastes that are candidates for SLF,: are combustible .because they contain organic compounds. These organic compounds fall into several categories..
Solvents
Solvents are organic compounds used for dissolving other materials. They are used .in three ways:
0 as part of a formulated product from which the solvent is intended to evaporate on use
9 to dissolve contaminantsin cleaning operations
l to facilitate chemical processes.
Chemically, solvents may. be broadly categorised as hydrocarbons - both aliphatic and ~ aromatic, oxygenates, and chlorinated solvents.’
The main commercial solvents are listed in Table 2.1. There are many other compounds,that can be used as solvents but that tend to be more limited in their;use.
R&D Technical Report P274 ‘-. 3
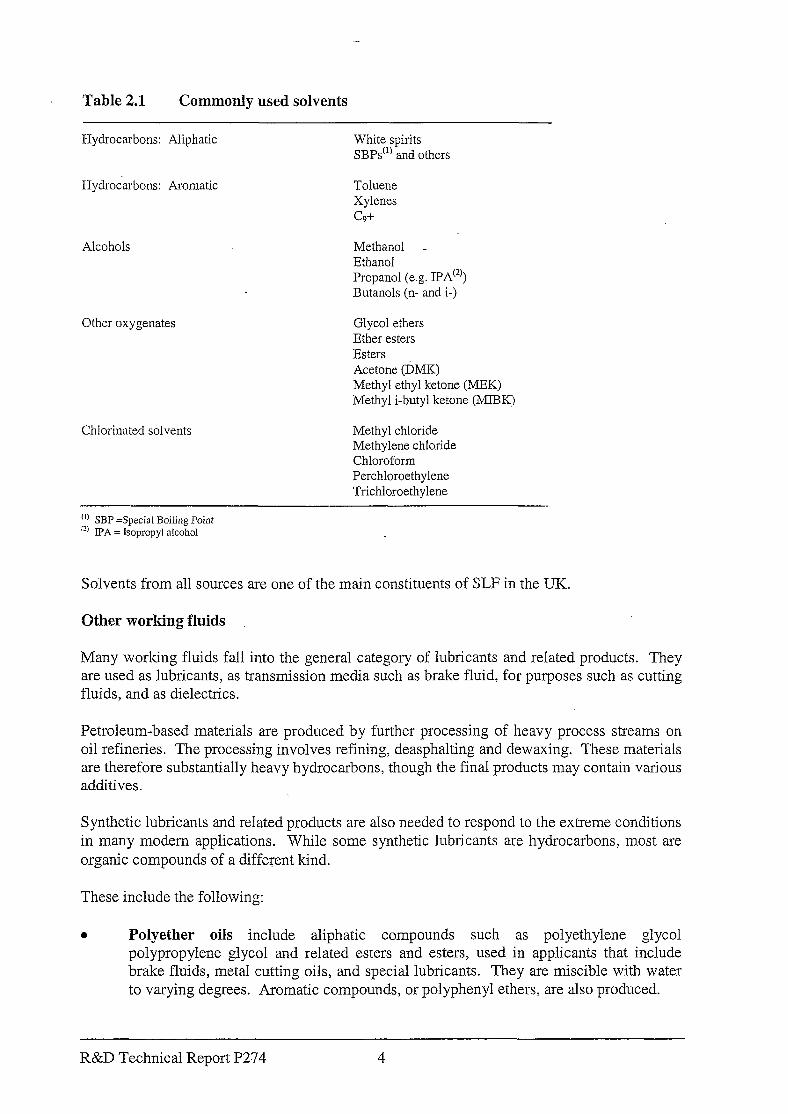
Table 2.1 Commonly used solvents
Hydrocarbons: Aliphatic Whit2 spirits SBPs’” and others
Hydrocarbons: Aromatic Toluene Xylenes c9+
Alcohols
Other oxygenates
Chlorinaied solvents
Methanol - Ethanol Propanol (e.g. IPA”‘) Butanols (n- and i-)
Glycol ethers Ether esters Esters Acetone (DMK) Methyl ethyl ketone (,MEK) Methyl i-butyl ketone (IMIBK)
Methyl chloride Methylene chloride Chloroform Perchloroethylene Trichloroethylene
(I) SBP =Special Boiling Point “) IP4 = Isopropyl alcohol
Solvents from all sources are one of the main constituents of SLF in the UK.
Other working fluids
Many working fluids fall into the general category of lubricants and related products. They are used as lubricants, as transmission media such as brake fluid, for purposes such as cutting fluids, and as dielectrics.
Petroleum-based materials are produced by further processing of heavy process streams on oil refineries. The processing involves refining, deasphalting and dewaxing. These materials are therefore substantially heavy hydrocarbons, though the final products may contain various additives.
Synthetic lubricants and related products are also needed to respond to the extreme conditions in many modem applications. While some synthetic lubricants are hydrocarbons, most are organic compounds of a different kind.
These include the following:
0 Polyether oils include aliphatic compounds such as polyethylene glycol polypropylene glycol and related esters and esters, used in applicants that include brake fluids, metal cutting oils, and special lubricants. They are miscible with water to varying degrees. Aromatic compounds, or polyphenyl ethers, are also produced.
R&D Technical Report P274 4
l Ester oils are-esters of carboxylic acids, and are used as-jet-engine lubricants etc.
l Phosphoric acid. esters (with. alcohols or phenols) are. used as fire resistant fluids, plasticisers, and lubricants.
l Silicone and related compounds include.. silicone oils, ,which contain., alkyl .or aryl groups.
* Halogenated.compounds include-chlorinated paraffins and.other chlorinated material. Environmental pressures have acted against. chlorinated materials in some areas. Fluorinated.compounds can be very effective and stable lubricants.
Fuels
Liquid .fuels may report to..waste streams,-if heavily contaminated. The ,organic chemical compounds are primarily mixed hydrocarbons, plus some oxygenates such as MTBE (methyl tert-butyl ether).
Biomass
Biomass is a possible type of organic waste, originating from, for example, processing of food and drink or as sludge-from wastewater treatment. The main organic constituents will be primarily compounds such as cellulose, fat and proteins.
Other chemicals ‘.
“Other: chemicals” covers an almost unlimited..range of compounds. that .are used in the manufacture of chemical products or form part of chemical products. In addition to the compounds mentioned-- above, as solvents or other working. fluids, there are biocides, pharmaceutical actives, pigments and dyes,. surfactants and- other detergent components, plastics or resins, and many specialised performance chemicals such as fire..retardants ‘or plasticisers, plus all-the .intermediates associated with .production.
The range of compounds is too wide to be characterised. It includes aliphatics, aromatics and polyaromatics, and compounds with oxygen, nitrogen, sulphur,- phosphorus, halogens and many other elements.
2.1.3 Generic types of waste source
The organic compounds can arise as wastes in several basic ways:
8 Working fluids such as solvents -or lubricants may become contaminated,-degraded or i diluted and be unfit for use.
l Some processing operations produce.by-products for which there is no technically or economically feasible.method of use or recovery.
R&D Technical Report P274 5
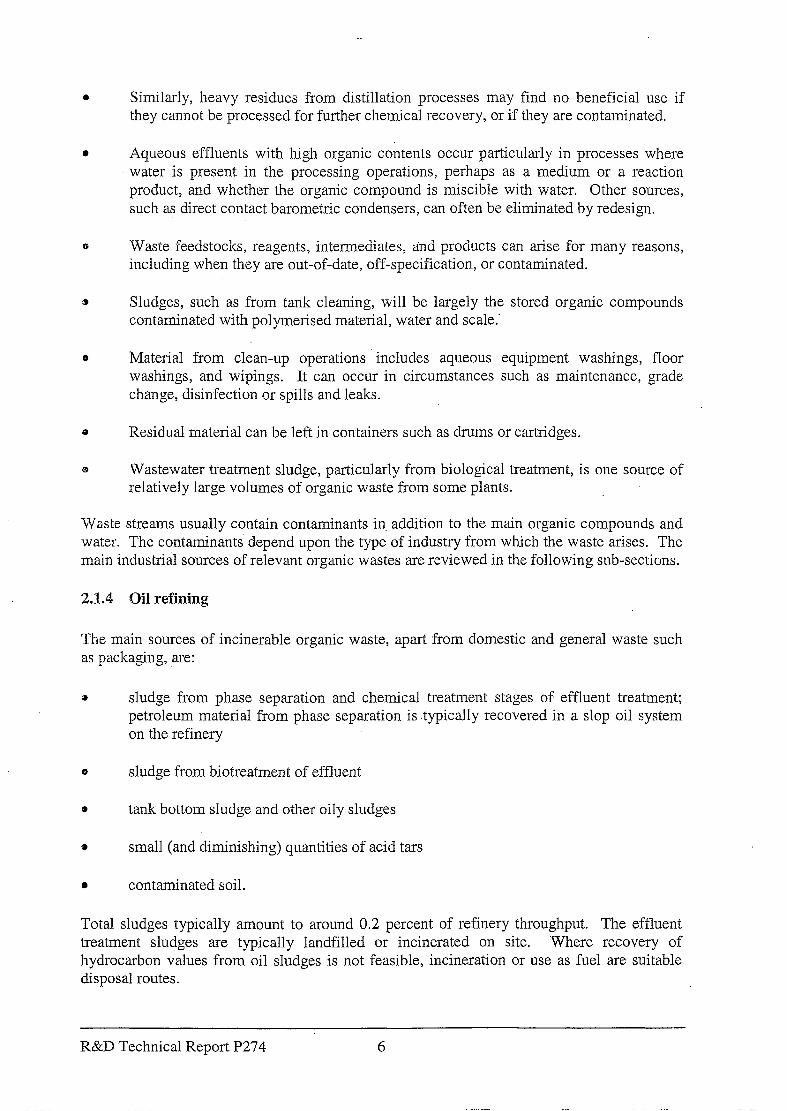
0 Similarly, heavy residues from distillation processes may find no beneficial use if they cannot be processed for further chemical recovery, or if they are contaminated.
0 Aqueous effluents with high organic contents occur particularly in processes where water is present in the processing operations, perhaps as a medium or a reaction product, and whether the organic compound is miscible with water. Other sources, such as direct contact barometric condensers, can often be eliminated by redesign.
0 Waste feedstocks, reagents, intermediates, and products can arise for many reasons, including when they are out-of-date, off-specification, or contaminated.
9 Sludges, such as from tank. cleaning, will be largely the stored organic compounds contaminated with polymerised material, water and scale..
0 Material from clean-up operations includes aqueous equipment washings, floor washings, and wipings. It can occur in circumstances such as maintenance, grade change, disinfection or spills and leaks.
0 Residual material can be left in containers such as drums or cartridges.
0 Wastewater treatment sludge, particularly from biological treatment, is one source of relative1.y large volumes of organic waste from some plants.
FVaste streams usually contain contaminants in, addition to the main organic compounds and water. The contaminants depend upon the type of industry from which the waste arises. The main industrial sources of relevant organic wastes are reviewed in the following sub-sections.
2.1.4 Oil refining
The main sources of incinerable organic waste, apart from domestic and general waste such as packaging, are:
0 sludge from phase separation and chemical treatment stages of effluent treatment; petroleum material from phase separation is .typically recovered in a slop oil system on the refinery
0 sludge from biotreatment of effluent
a tank bottom sludge and other oily sludges
0 small (and diminishing) quantities of acid tars
0 contaminated soil.
Total sludges typically amount to around 0.2 percent of refinery throughput. The effluent treatment sludges are typically landfilled or incinerated on site. ‘Where recovery of hydrocarbon values from oil sludges is not feasible, incineration or use as fuel are suitable disposal routes.
R&D Technical Report P274 6
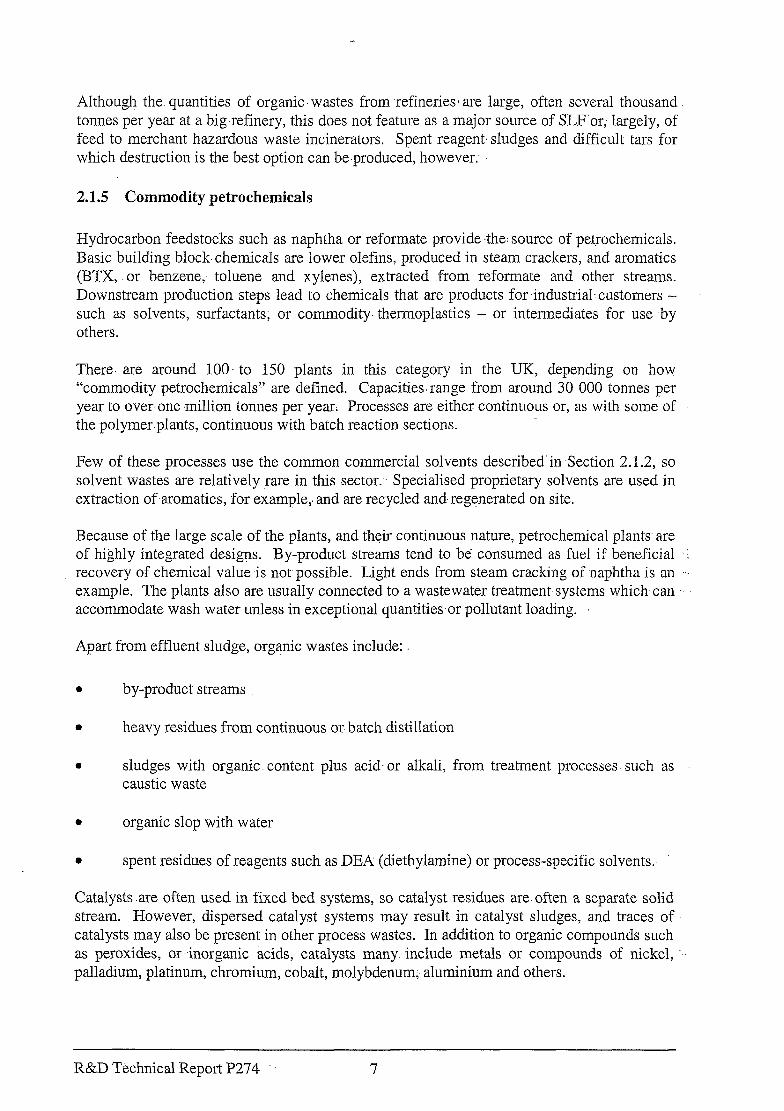
Although the. quantities of organic wastes from refineries2 are large, often several thousand tonnes per year at a big.refinery, this does not feature as a major source of SLF’or; largely, of feed to merchant hazardous waste incinerators. Spent reagent, sludges and difficult tars for which destruction is the best option can be.produced, however.-
2.1.5 Commodity petrochemicals
Hydrocarbon feedstocks such as naphtha or reformate provide the: source of petrochemicals. Basic building block,chemicals are lower olefins, produced in steam crackers, and aromatics (BTX, or benzene, toluene and xylenes), extracted from reformate and other streams. Downstream production steps lead to chemicals that are products for industrialcustomers - such as solvents, surfactants; or commodity. thermoplastics - or intermediates for use .by others.
There. are around IOO. to 150 plants in this category in the UK, depending on how “commodity petrochemicals” are defined. Capacities~range from around 30 000 tonnes per year to over one ,million tonnes per year; Processes are either continuous or, as wi.th some of the polymer.plants, continuous with batch reaction sections.
Few of these processes use the common commercial solvents described’in .Section 2.1.2, so solvent wastes are relatively rare in this sector. Specialised proprietary solvents are used in extraction of aromatics, for example,. and are recycled and-regenerated on site.
Because of the large scale of the plants, and their continuous nature,-petrochemical plants are of highly integrated designs. By-product streams tend to be consumed as fuel if beneficial ‘1 recovery of chemical value is not-possible., Light ends from steam cracking of naphtha is an ‘. example. The plants also are usually connected to a wastewater treatment systems which-can accommodate wash water unless in exceptional quantities or pollutant loading.
A.part from effluent sludge, organic wastes include:
l by-product streams
0 heavy residues from continuous or. batch distillation
l sludges with organic. content plus acid. or alkali, from treatment processes- such as caustic waste
l organic slop with water
l spent residues of reagents such as DEA (diethylamine) or process-specific solvents.
Catalysts .are often used in fixed bed systems, so catalyst residues are often a separate solid stream. However, dispersed catalyst systems may result in catalyst sludges, and traces of.. catalysts may also be present in other process wastes. In addition to organic compounds such as peroxides, or inorganic acids, catalysts many include metals- or compounds of nickel, palladium, platinum, chromium, cobalt, molybdenum, aluminium and others.
R&D Technical Report P274 7
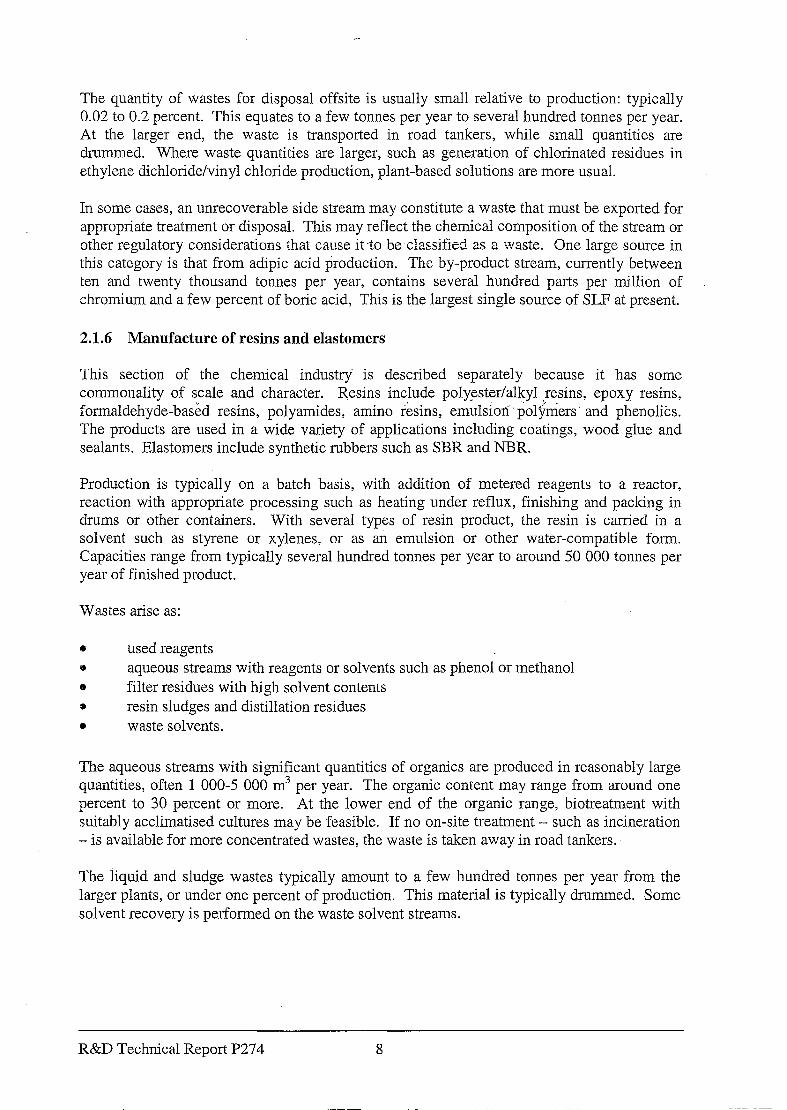
The quantity of wastes for disposal offsite is usually small relative to production: typically 0.02 to 0.2 percent. This equates to a few tonnes per year to several hundred tonnes per year. At the larger end, the waste is transported in road tankers, while small quantities are drummed. Where waste quantities are larger, such as generation of chlorinated residues in ethylene dichloride/vinyl chloride production, plant-based solutions are more usual.
In some cases, an unrecoverable side stream may constitute a waste that must be exported for appropriate treatment or disposal. This may reflect the chemical composition of the stream or other regulatory considerations that cause it -to be-classified as a waste. One large source in this category is that from adipic acid production, The by-product stream, currently between ten and twenty thousand tonnes per year, contains several hundred parts per million of chromium and a few percent of boric acid, This is the largest single source of SLF at present.
2.1.6 Manufacture of resins and elastomers
This section of the chemical industry’ is described separately because it has some commonality of scale and character. Resins include polyester/alkyl resins, epoxy resins, formaldehyde-based resins, polyamides, amino resins, emulsion ’ poleers and phenol&. The products are used in a wide variety of applications including coatings, wood glue and sealants. Elastomers include synthetic rubbers such as SBR and NBR.
Production is typically on a batch basis, with, addition of metered reagents to a reactor, reaction with appropriate processing such as heating under reflux, finishing and packing in drums or other containers.. With several types of resin product, the resin is carried in a solvent such as styrene or xylenes, or as an emulsion or other water-compatible form. Capacities range from typically several hundred tonnes per year to around 50 000 tonnes per year of finished product.
Wastes arise as:
* used reagents e aqueous streams with reagents or solvents such as phenol or methanol a filter residues with high solvent contents 0 resin sludges and distillation residues l waste solvents.
The aqueous streams with significant quantities of organics are produced in reasonably large quantities, often 1 000-5 000 m3 per year. The organic content may range from around one percent to 30 percent or more. At the lower end of the organic range, biotreatment with suitably acclimatised cultures may be feasible. If no on-site treatment - such as incineration - is available for more concentrated wastes, the waste is taken away in road tankers..
The liquid and sludge wastes typically amount to a few hundred tonnes per year from the larger plants, or under one percent of production. This material is typically drummed. Some solvent recovery is performed on the waste solvent streams.
R&D Technical Report P274 8
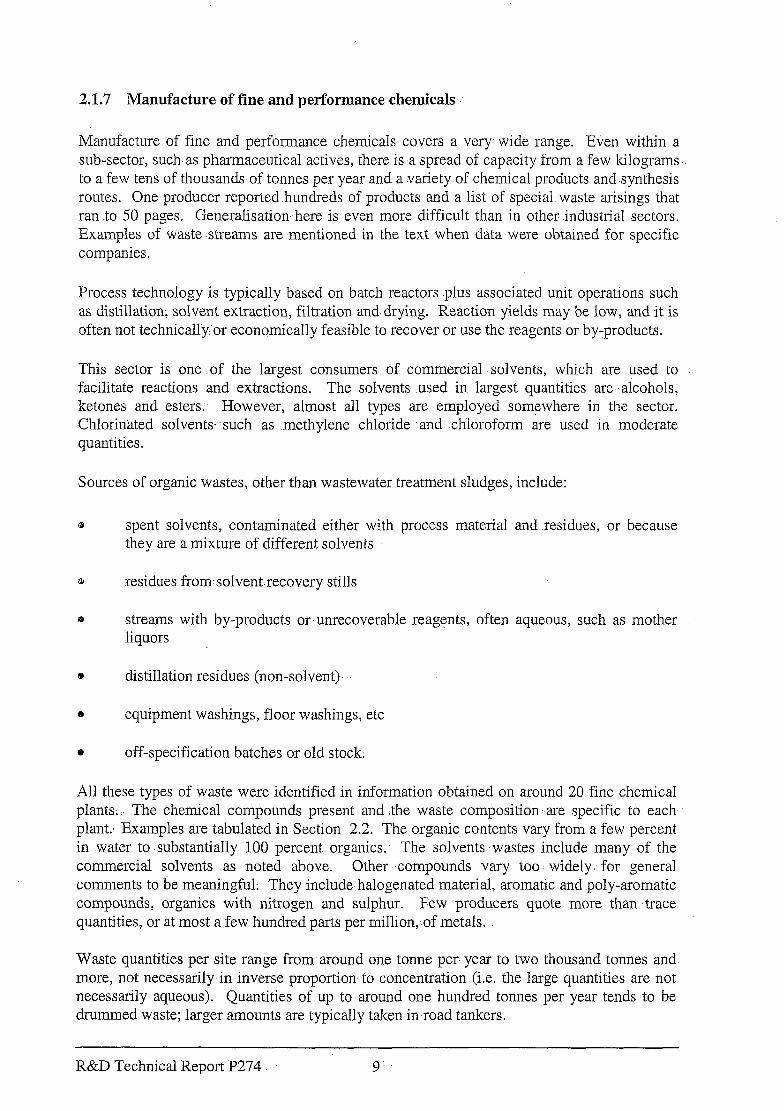
2.1.7 Manufacture of fine and performance chemicals.
Manufacture of fine and performance chemicals covers a very wide range. Even within a sub-sector, such-as pharmaceutical actives, there is-a spread of capacity from a few kilograms . . to-a few tens of thousands-of tonnes per year and a variety.of chemical products andsynthesis routes. One producer reported hundreds of products and a list of special waste arisings that ran to 50 pages. Generalisation here is even more difficult than in other industrial sectors. Examples of waste-streams are mentioned in the text when data-were obtained for specific companies.
Process technology is typically based on batch reactors plus associated unit operations such as distillation: solvent extraction;filtration and drying. Reaction yields may be low, and it is often not technically or- economically feasible to recover or use the reagents or by;products.
This sector is one of the largest consumers of commercial -solvents, which are used to facilitate -reactions and ,extractions. The solvents used in largest quantities are alcohols: ketones and esters. However, almost all types are employed som?where in the sector. Chlorinated solvents. -such as methylene chloride and chloroform are used in moderate quantities.
Sources of organic wastes, other than wastewater treatment sludges, include:
6 spent solvents, contaminated either with process material and residues, or because they are a mixture of different solvents
Q residues from:solvent.recovery stills
B streams with by-products or’unrecoverable reagents, often aqueous, such as mother liquors
d distillation residues (non-solvent)- .’
8) equipment washings, floor washings, etc
0 off-specification batches or old stock.
All these types of waste were identified in information obtained on around 20 fine chemical plants;.. The chemical compounds present and the. waste composition. are specific to each- plant., Examples are tabulated in.Section 2.2. The organic contents vary from a few percent in water to .substantially 100 percent organics. The solvents ‘wastes include many of the commercial solvents as noted above. Other compounds vary too widely,. for general comments to be meaningful: They include halogenated material, aromatic .and poly-aromatic compounds, organics with nitrogen and sulphur. Few producers quote more than trace quantities, or at most a few hundred parts per million,-of metals.
Waste quantities per site range from around one tonne per year to two thousand tonnes and. more, not necessarily-in inverse proportion to concentration (i.e. the large quantities are not necessarily aqueous). Quantities of up to around one hundred tonnes per year tends to be drummed waste; larger amounts are typically taken in road tankers..
R&D Technical Report P274 : 9:
Incineration is the most frequently used form of disposal for the waste examined. In-house incinerators are used for large quantities, usually a few hundred tonnes per year at least. When the process requires a vents incinerator, there can be synergy in also incinerating liquid wastes. Heat recovery can offset economics. Companies with in-house incinerators export to merchant incinerators when the waste is not suitable for the in-house equipment. Reasons may be regulatory - if the in-house incinerator is not authorised for halogenated waste, for example - or technical. One company cited corrosion problems with fluorinated material as a difficulty. Iodine and brominecan- present a problem because of -the coloured plume. (Merchant incinerators have similar problems but usually have the advantage of very high efficiency gas cleaning, and-the ability to blend different types of wastes).
Reasons for selecting or considering the SLF-to-cement kiln route are mainly economic, although the ability of the cement kiln chemistry to fix materials such as halogens was also noted by companies. One company cited a concern, however, with the urban setting of the nearest cement kiln and possible environmental concerns or perceptions.
The cost of merchant incineration varies with composition. If the fuel vahie of wastes with high calorific value, such as relatively large glycol ethers and methanol streams, are recognised then merchant incineration can be economically reasonable.
Landfill is not a -usual disposal option for regulatory and technical reasons. However, one company did quote an example of an alkaline aqueous stream with ten percent methanol. This is sent to treatment and landfill rather than incineration because of its very low flash point. ,4nother company is considering a solidification process for a largely anhydrous material that is polymerisable.
One form of on-site treatment of aqueous organic wastes is wet air oxidation to produce a stream treatable by normal means. None of the sites contacted employed this technique, however.
In most cases of solvent use, there is some recycle within the process and recovery either on-site or externally. A possible exception is in the production of pharmaceutical actives and products, when the chance of cross-contamination rules against re-use within the process. This does not necessarily prevent recovery by external recycling companies for lower grade applications, however.
Quantities of waste in this sector are large, related to production, because of low yields in many processes. However, it should be noted that some companies have achieved notable reductions by process and management techniques. Over a period of around five years, reductions in excess of 50 percent are quoted.
2.1.8 Manufacture of formulated products
Formulated products are those in which components are blended together, often with physical treatment such as grinding but with a minimum of chemical reaction. Examples of formulated products are coatings, cleaning products, cosmetics and agrochemicals. Organic compounds in formulated product include solvents, and functional materials such as film-forming agents or biocide actives.
R&D Technical Report P274 10
Waste from formulation, operations are typically a small percentage of production, and. consist of:
a used solvent, some-of which may be recyclable by. external specialists
0 waste reagents and products (includes off-specification and out of, date materials)
0 washings.
Waste reagents and product quantities are typically *up to lOO.tonnes per year from a plant, and other wastes - perhaps partly aqueous - up to around SOO.tonnes per year. The waste is usually drummed for disposal.
The chemical composition reflects the constituents o-f the relevant products.
Pigments in coatings and inks are of particular ,relevance because many. are metals or compounds of metals. In metal-effect pigments; such as in automobile finishes, the pigment consists of flakes of metal such as copper, copper/zinc, aluminium bronzes, zinc alloys, etc. Whiteners include. titanium: dioxide, often used as a lightener in printing inks,. and. zinc sulphide compounds. Coloured pigments include oxides of iron and- chromium, iron/cyanide. compounds, lead and ‘zinc chromates; molybdates and bismuth. compounds. i Metal phosphates - zinc, chromium,. aluminium, barium, etc - are. commonly .used as corrosion- resistant materials. Inorganic extenders,such as calcium carbonate may also be present.
Organic pigments take many forms, such .as phthalocyanines, quinacridone pigments, anthraquinone pigments and azo-compounds. .-Organo-metallic compounds are used in some applications, such as textile dyes.
The other. generic chemical type of particular interest is biocides, because. of their direct or long term effect or: because -.of possible concerns relating to products of combustion on .~ t disposal. In practice there has ,been a significant shift away from chlorinated compounds with probable long term.environmental effects-such as DDT, aldrin and dieldrin, and lindane. Organophosphates, carbamates, and pyrethroids are other categories.
Agrochemicals may be carried in solvents, primarily aromatic and aliphatic hydrocarbons in comparable quantities ‘in this sector. There-is, however, a strong and continuing trend from solvent-based (emulsifable concentrate). formulations to newer types such as emulsions in water or suspension concentrates.
2.1.9 Use of sblvent :products
Solvents may evaporate in use, such .as in coating systems, or be.used- in liquid form as in some forms of cleaning. Liquid residues may arise from -both. Some major sources are described below.
Paint wastes
Paints- are examples- of products. where. the solvent evaporates. A traditional solvent-based ‘I . paint -may contain around 70 percent solvent by weight, -though this is substantially:reduced
R&D Technical Report P274. 11
in modem formulations. Even water based coatings usually contain some solvent, usually lower than ten percent. Depending on the type of paint, the solvents are typically white spirit or aromatic hydrocarbons and oxygenates. The oxygenates include alcohols, ketones and esters. A mixture of solvents is often used in the formulation to provide the right rate of drying.
Another important constituent is pigment. While the pigment is intended to remain with the coating, some will be in any wastes, with possible trace presence of metal compounds, as noted above for the manufacture of formulated products.
Paint wastes can arise from the formulation operation, such as on grade changes. For applications, industrial coating operations include vehicle painting, wood coating (furniture), can coating and coil coating (for metal products such as white goods). Vehicle refinishing (resprays) is another large application. The wastes from these operations might arise on colour changes, such as in a car spray line, or the cleaning up of spills or paint that has missed its target. Operations in this type of industry may produce relatively clean solvent material of restricted solvent type and composition plus a dirtier stream with substantial ,i non-solvent contaminants. The dirtier stream could typically be ladenwith pi,ments. Paint wastes are typically a few tonnes to 50 tonnes per year; they are usually drummed.
Printing wastes
There are several types of printing, -with flexography, gravure (non-publication) and screen printing representing the largest users. The industry sectors are flexible packaging, decoration (such as wallpaper), and publications. As a sector, printing uses very much less solvent than paints and coatings (see Section 2.3). The solvents used in printing include alcohols (methanol to butanol), various hydrocarbons such as white spirit and toluene, and oxygenates such as MEK (methyl ethyl ketone) and ethyl acetate. Water based inks are increasingly used where technically possible.
Solvent used for cleaning or waste inks may be produced. Copper is cited as a characteristic contaminant, though other pigment components such as iron blue and phthalocyanine pigments could also be expected.
Adhesives
Industrial adhesives can take several forms, such as contact adhesives, polyurethanes or nitrile systems. Typical industrial applications include sticking on soles of shoes, furniture assembly, or production of tapes and labels. This sector is comparable to that of printing inks in quantities of solvent used. Solvents include toluene, hexane, esters, ketones and some chlorinated solvents. Water based adhesives are well established where technically feasible, and use glycol ethers or similar solvents.
Wastes from manufacture and industrial applications include cleaning wastes and contaminated adhesives. Chlorinated waste is reported by one SLF blender to be sent as a single stream. Wastes are typically sent for disposal in lots of a few (205 litre) drums at a time.
R&D Technical Report P274 12
Surface cleaning
Surface cleaning primarily relates to the removal of contaminants from metal surfaces: This covers a number of .industrial sectors, such as automotive, aerospace,- precision engineering and electronics. The cleaning may be in the liquid phase or;,more usually-for smaller pieces, in the vapour phase -with continuously condensed and reboiled solvent.-. Chlorinated hydrocarbons have been. the predominant solvents used, mainly trichloroethylene and. perchloroethylene. Ozone depleting compounds such as methyl chloroform (1 ,l,l-trichloroethane) and CFCs: are no:. used, or should not be.. Non-chlorinated solvents are also used,-including white spirit and ketones, though fire risks require,consideration.
Aqueous cleaning systems are widely employed, though-not ideal for all applications, and are largely inorganic in nature.
When the organic solventsLare heavily contaminated with soil, they are either distilled on site or sent to an external company. The solvent residues are typically sent to incineration. The residues may be contaminated with metals and soil components- such as greases and dirt. These wastes are usually drummed.
Dry cleaning
Dry cleaning of textiles is performed largely. with perchloroethylene as solvent, in facilities ranging from small retail shops to centralised plants. Recovery of the solvent is required for environmental and occupational health reasons. The dirt and fabric-from the textiles builds up in the solvent until disposal is required.: The residual.material. contains, typically, sodium monoleate detergent, dirt and a minor proportion of perchloroethylene. It is usually despatched in drum quantities for recovery.
If hydrocarbon dry cleaning solvents are used, the residue.is incinerable.
Other solvent users
There are various other solvent using applications from which waste. solvents or waste products can arise. They include:
0 timber,preservation, where wastes may contain creosote and other active biocides%r, usually,. a hydrocarbon solvent
0 pipeline flushing,. where methanol- can be used resulting in occasional. large volumes of waste methanol
0 film-coating for diverse end uses, such as masking film, drawing office film; andifoil printers.
2.1.10 Waste treatment and disposal :.
There are two sources of relevance in the waste treatment and disposal sector;
R&D Technical Report P274 13
l Solvent recyclers recover solvents -either mixed or as single solvents - in distillation processes. The still residues contain the contaminants present in the dirty solvent and quantities of the solvent itself. These residues forrn a significant feed source for SLF. Distillation can proceed to different depths of recovery, and this topic is addressed further in Section 3 of this report.
e Waste contractors perform a collection round service, Material supplied to an SLF blender or an incinerator may come from several sources, which makes it very difficult to identify the original wastes.
A further possible source of material for use in cement kilns is sludge from sewage treatment. This would be available. in very large quantities. However, sewage sludge is taken as being outside the scope of SLF. The issues connected with its use are not those raised by the House of Commons Environment Committee.
2.1.11 Oil wastes
Oily wastes arise as sludges from tanks or from oil/water separators on process plants, as noted above. Another important waste source is used lubricating oil, the largest volume working fluid described at the beginning of this section. Although lube oil production accounts for under one percent of total crude oil processing, the used lube oil is the main form of waste petroleum product. Unlike fuels, where the product is suSstantially destroyed in use, around half of lube oil usage is potentially recoverable as waste oil. Information in this section is drawn largely from a recent report by the European oil industry association CONCAWE.
Lube oil markets fall into three categories: vehicles, industrial and marine. In terms of on-shore waste generation, the marine market can largely be ignored. The vehicle market is predominately for engine oils, split about evenly between passenger cars and heavy duty diesel engines. Transmission oils, gear oils and greases are also part of the vehicle market. An important factor in the efficiency of collection and proper disposal is the extent to which passenger car owners perform their own oil changes.
The industrial lube oil market includes process oils, which are consumed in use, hydraulic oils, metalworking oils, gear oil, compressor oil and others. More specialised applications often require synthetic compounds that are not necessarily only hydrocarbons, as noted in Section 2.1.2.
Contaminants in use lube oils arise from several sources. Traces of metals such as iron, chromium, nickel, aluminium and copper arise from wear of engine or bearings. Detergent and other additives contribute up to a few thousand parts -per million of calcium, zinc or phosphorus. Sulphur, at 0.2-1.0 percent, arises from the base oil itself or from combustion products. Lead contamination, originating as it does from leaded gasoline, is likely to decline from 100-l 000 ppm. Similarly, chlorine content will be reduced with the declining use of chlorinated solvents and of leaded petrol, to which chlorinated compounds are added as lead scavengers. Polycyclic aromatic hydrocarbons arise from incomplete combustion of the fuel. Water, at five to ten percent, is a combustion product, and light hydrocarbons, also at five to ten percent, originate from fuels.
R&D Technical Report P274 14
There are several disposal.routes for collected lube oils;:in addition to illegal dumping. They include:
a burning in space heaters, cement kilns or waste incinerators
l reclaiming : of. segregated oils of known composition by simple processing, and returning to the original use
B reprocessing for use as fuel: either ,mild reprocessing for use in road.stone plants or fuel blending; or severe processing to produce good quality industrial fuels
a re-refining to a virgin base oil substitute; in which there are several types of process technology.
.While lube ,oils and- similar--working fluids. are not c a main, source of. SLF in the UK, in Germany around one-third of collected lube.oils are sent to cement kilns.
Waste lube oils and other working fluids usually arise in small quantities in a large number of facilities such as garages, machine shops,- .etc.: Specialist -waste contractors service this market in-the UK.
2.2 Waste compositions
A selection of contaminant-concentrations of wastes used in SLF is given in Table 2.2. The data include information given in confidence by SLF blenders, and merchant incinerator companies Information is presented as available. Full analyses are not essential for waste disposal companies, nor required for consignment notes, In particular;the absence of data on metals in the table does not necessarily imply an absence of metals.
R&D Technical Report P274 I. 15
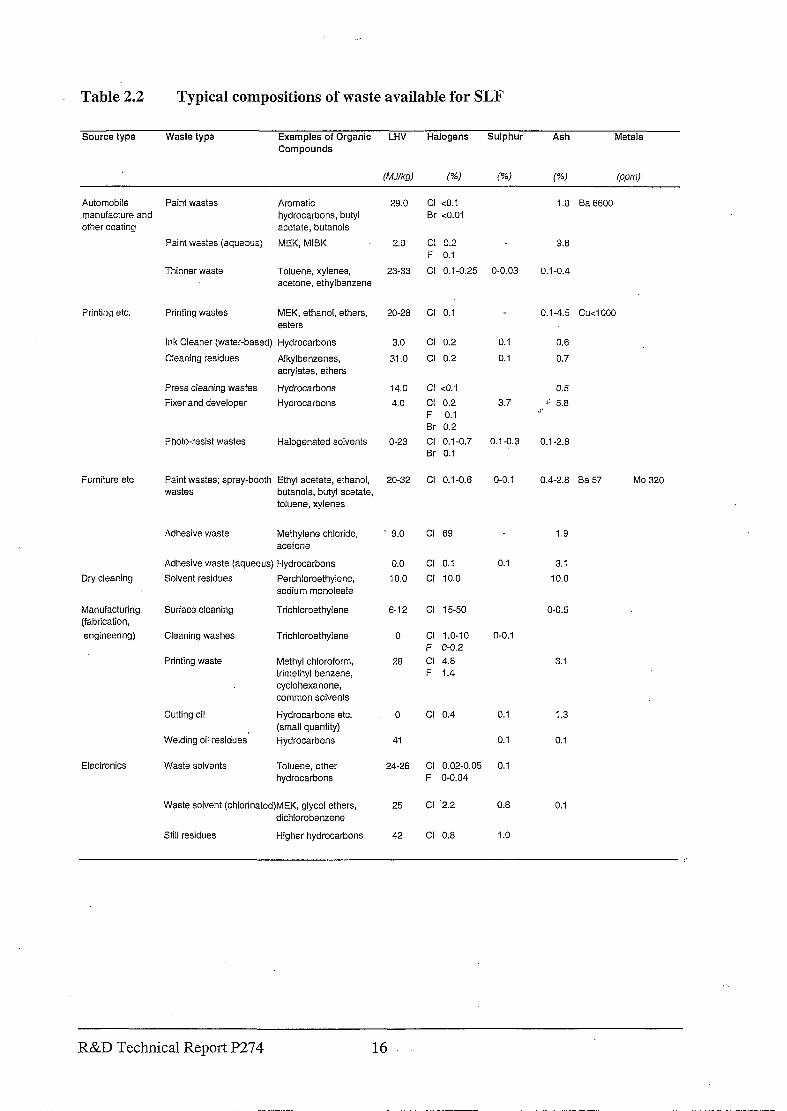
Table 2.2 Typical compositions of waste available for SLF
Source type Waste type Examples of Organic Compounds
LHV Halogens Sulphur Ash Metals
Automobile manufacture and other coating
Printing etc.
Furniture etc
Dry cleaning
Manufacturing (fabrication,
engineering)
Paint wastes Aromaiic hydrocarbons, butyl acetate, butanols
Paint wastes (aqueous; MEK, MIBK
Thinner waste Toluene, xylenes, acetone, ethylbenzene
29.0 Cl co.1 Br <O.Ol
2.0
23-33
Cl 0.2 F 0.1
Cl 0.1-0.25
Printing wastes MEK, ethanol, ethers,
esters
Ink Cleaner (water-based) Hydrocarbons
Cleaning residues Alkylbenzenes, acrylates, ethers
Press cleaning wastes Hydrocarbons
Fixer and developer Hydrocarbons
20-28
3.0
31.0
14.0
3.0
Photo-resist wastes Halogenated solvents O-23
Pa.int wastes; spray-booth Ethyl acetate, ethanol, wastes butanols, butyl acetate,
toluene, xylenes
20-32
Cl 0.1
Cl 0.2
Cl 0.2
Cl co.1
Cl 0.2 F 0.1 Br 0.2
Cl 0.1-0.7 Br 0.1
Cl 0.1-0.6
Adhesive waste Methylene chloride, acetone
Adhesive waste (aquecus) Hydrocarbons
Solvent residues Perchloroethylene, sodium monoleate
9.0
0.0
10.0
Surface cleaning
Cleaning washes
Printing waste
Cutting oil
Welding oil residues‘
Trichloroethylene
Trichloroethylene
Methyl chloroform, trimethyl benzene, cyclohexanone, common solvents
Hydrocarbons etc. (small quantity)
Hydrocarbons
6-12
0
28
Cl 69
Cl 0.1
Cl 10.0
Cl 15-50
Cl 1.0-10 F O-O.2
Cl 4.8 F 1.4
0 Cl 0.4
41
o-0.03
0.1
0.1
3.7
0.1-0.3
o-o.1
0.1
o-o.1
0.1
0.1
Waste solvents Toluene, other
hydrocarbons
24-26 Cl 0.02-0.05 0.1 F O-0.04
Waste solvent (chlorinated)MEK, glycol ethers, dichlorobenzene
25 Cl -2.2 0.8
Still residues Higher hydrocarbons 42 Cl 0.8 1.0
1.0 Ba 6600
9.8
0.1-0.4
0.1-45 cu<1000
0.6
0.7
0.1-2.8
0.4-2.8 Ba 57 MO 320
1.9
3.1
10.0
o-o.5
3.1
1.3
0.1
0.1
R&D Technical Report P274
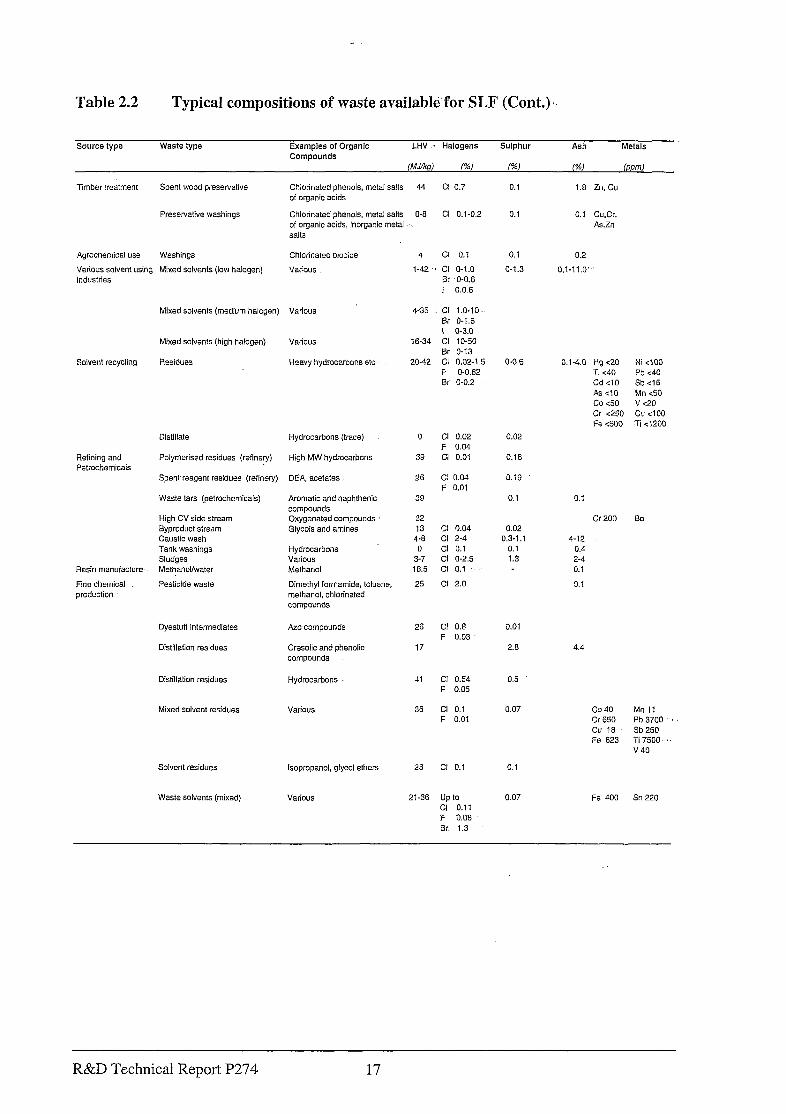
Table 2.2 Typical compositions of waste availabk’for SLF (Cdnt.)
source type waste type Examples of Organic
Compounds
LHV . . Halogens Sulphur Ash Metals
Timber treatment Spent wood preservative
Preservative washings
Agrcchemical use Weshings
Various solvent using Mixed solvents (10~~ halogen)
indus!ries
Mixed solvents (medium halogen)
Mixed solvents (high halogen) Various
Soiverlt recycling Residues Heavy hydrocarbons etc
Distillate
Refining and Pctrochemicais
Polymerised residues (refinery)
Spentreagent residues (refinsry)
‘Waste tars (ps!rochemicals)
Rosin manuiacture
F!na chemicsl
prodcction
High CV side stream
Syproduct stream Caustic wash Tank washings
Sludges
MethanoWwater
Pesticide waste
Dyestuff intermediates
Distillation residues
Distillation residuss
Mixed solvent residues
Solvent residues
Waste solvents (mixed)
Chlorinated phenols, metal sa!ts 44 Cl 0.7
oi organic acids
Chlorinated phenols, metal salts O-B Cl 0.1-0.2
of organic acids, inorganic metai , salts
Chlorinated txo~ioe
Vacxs
Hydrocarbons (trace)
High MW hydrccaioons
DEA, acetates
Aromatic and naphthenic
compounds Oxygenated compounas
Glycols and amines
Hydrocarbons Valio”s
Methanol
Dimethyl formsnide, tolusne,
methanol, chlorfnated
compounds
Azo compounds
Cresok and phenolfc
compounds
Hydrocarbons
4 Cl 0.1
l-42,. Cl 31.0
Sr O-O.6 I 0.0.6
&35 Cl 1.0-10.
Er O-l.6 I O-3.0
16-34 Cl 10-50
E3r o-13 20-42 Cl 0.02-1s
i= O-0.62 Br O-O.2
0 Cl 0.02 F 0.04
39 Cl 0.01
26 c1 0.04
F 0.01
39
32 13 Cl 0.04
4-6 Cl 2-4
0 Cl 0.1 3-7 Cl o-2.5
18.5 Cl 0.1
25 Cl 2.0
0.1
0.1
0.;
o-1.3
O-0.6
0.02
0.16
0.19
0.1
0.02
0.3-1.1 0.1 1.3
26 Cl 0.6 0.01
F 0.03
17 2.6
.I1 Cl 0.54 0.5 F 0.05
3s Cl 0.1 0.07
F 0.01
Isopropanol, glycol ethers 26 Cl 0.1 0.1
Various 21-36 Up to Cl 0.11 F 0.08
Br 1.3
0.07
1.8 Zn, C”
0.1 Cu,Cr,
AS,Zfl
0.2
0.1-11.0‘
0.1-4.0 Hg c20 Ni cl00 TI <40 Pb <40
Cd <lO Sb cl5
As <?O Mn <50 co c50 v c20
Cr ~250 Cu cl00
Fe <SO0 Ti ~1200
0.1
0200 El0
4-12
0.4 2-4
0.1
5.1
4.4
co 40 Mn I1
Cr 650 Pb 3700 * cu 1s Sb 250
Fe 823 Ti7500 v40
Fe 400 Sn 220
R&D Technical Report P274 17
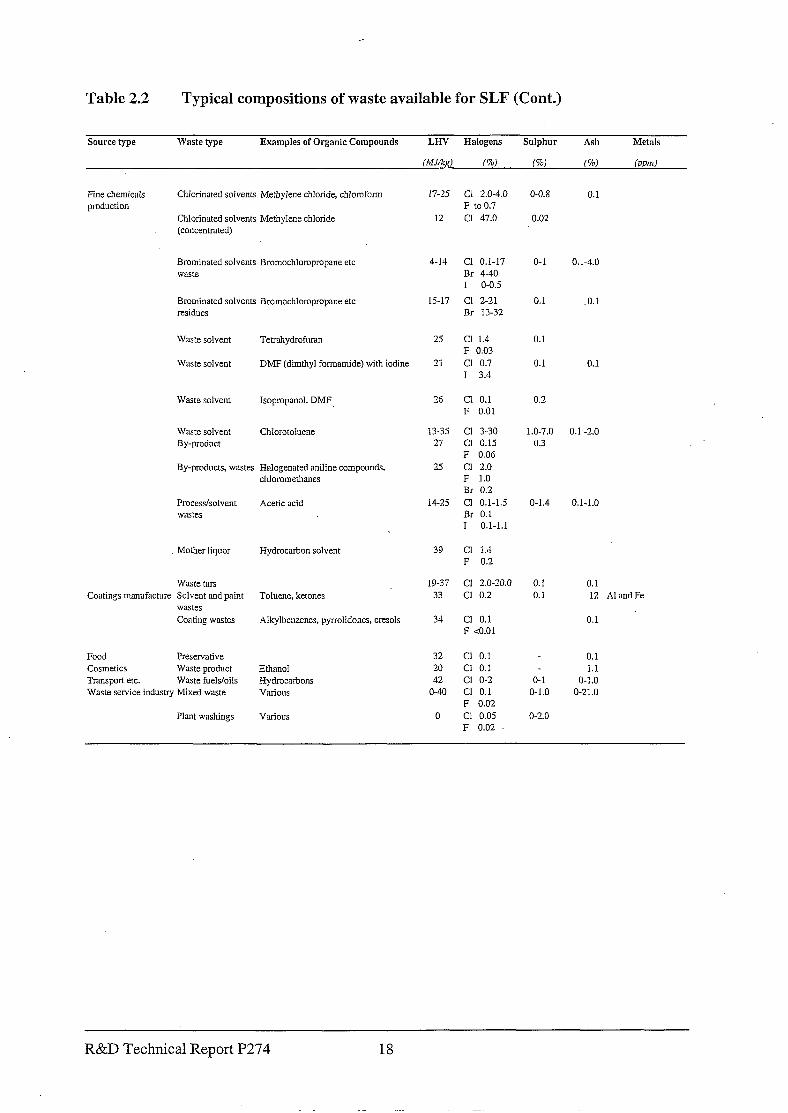
Table 2.2
Source type
Typical compositions of waste available for SLF (Cont.)
Waste type Examples of Organic Compounds LHV Halogens Sulphur
WW f%b) m
Ash Metals
Cc/oJ (PPW
Fine chemicals production
Chlorinated solvents Methylene chloride, chloroform
Chlorinated solvents Methylene chloride (concentrated)
Brominated solvents Bromochlompropane etc waste
Bruminated solvents Bromochloropropane etc residues
waste solvent Tetrahydrofuran
Waste solvent DMF (dimthyl formamide) with iodine
Waste solvent Isopmpanol, DMF
Waste solvent Chlorotoluene By-product
By-products, wastes Halogenated aniline compounds, chloromethanes
Process/solvent wastes
Acetic acid
Mother liquor Hydrocarbon solvent
Waste tars Coatings manufacture Solvent and paint Toluene, ketones
wastes Coating wastes Alkylbenzenes, pyrrolidones, cresols
Food Preservative Cosmetics Waste product Ethanol Transport etc. Waste fuels/oils Hydrocarbons Waste service industry Mixed waste various
Plant washing various
17-25 Cl 2.0-4.0 F to 0.7
12 Cl 47.0
4-14 Cl 0.1-17 Br 4-40 I o-o.5
15-17 Cl 2-21 Br 13-32
25 Cl 1.4 F 0.03
21 Cl 0.7 I 3.4
26 Cl 0.1 F 0.01
13-35 Cl 3-30 21 Cl 0.15
F 0.06 25 Cl 2.0
F 1.0 Br 0.2
14-23 - Cl 0.1-1.5 Br 0.1 I 0.1-1.1
39 Cl 1.4 F 0.2
19-37 Cl 2.0-20.0 33 Cl 0.2
34 Cl 0.1 F do.01
32 Cl 0.1 20 Cl 0.1 42 Cl o-2
O-40 Cl 0.1 F 0.02
0 Cl 0.05 F 0.02
O-O.8
0.02
o-1
0.1
0.1
0.1
0.2
1.0-7.0 0.3
o-1.4
0.1 0.1
O-l O-1.0
O-2.0
0.1
0.140
.O.l
0.1
0.1 -2.0
0.1-1.0
0. I 12 AlandFe
0.1
0.1 1.1
O-1.0 O-21.0
R&D Technical Report P274
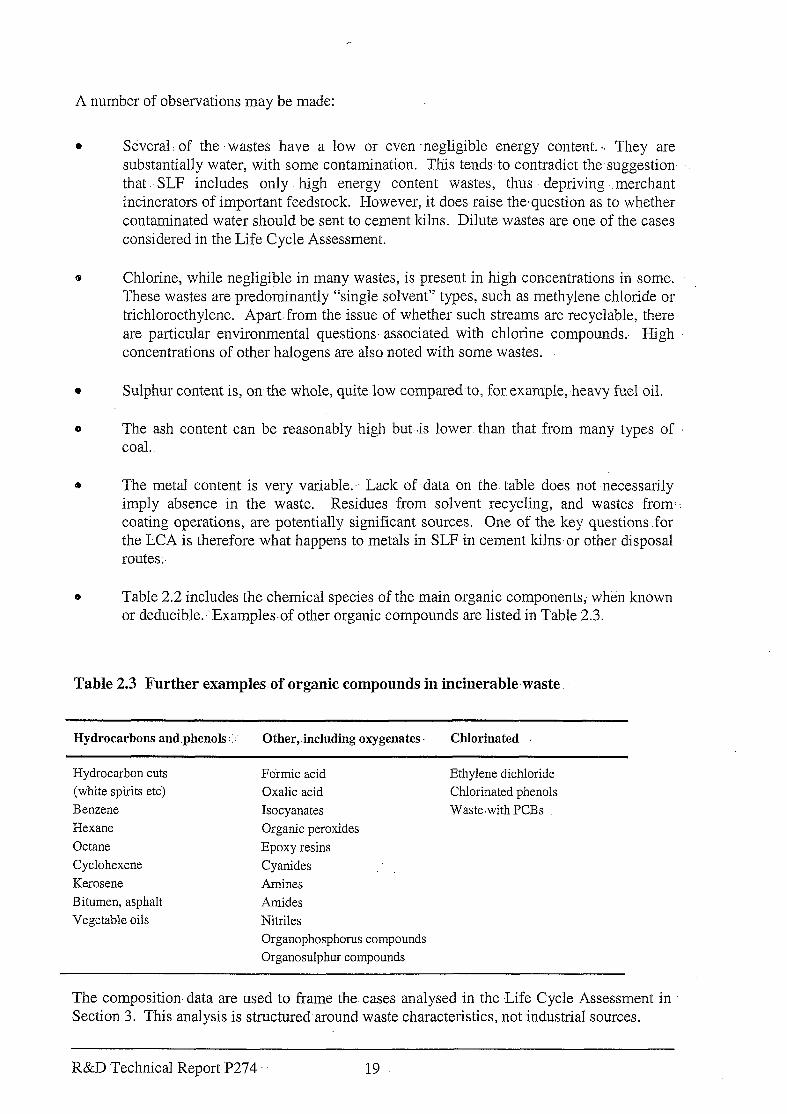
A number of observations may be made:
l Several: of the .wastes have a low or even negligible energy content. ‘. They are substantially water, with some contamination. This tends to contradict the suggestion that. SLF includes only high energy content wastes, thus depriving -merchant incinerators of important feedstock. However, it does raise the,question as to whether contaminated water should be sent to cement kilns. Dilute wastes are one of the cases considered in the Life Cycle Assessment.
Chlorine: while negligible in many wastes, is present in high concentrations in some. These wastes are predominantly “single solvent” types, such as methylene chloride or trichloroethylene. Apart: from the issue of whether such streams are recyclable, there are particular environmental questions- associated with chlorine compounds. High concentrations of other halogens are also noted with some wastes.
0 Sulphur content is, on the whole, quite low compared.to, for example,,heavy fuel oil.
0 The ash content can be reasonably high but is lower. than that from many types of coal.
0 The metal content is very variable. Lack of-data on the table does not necessarily imply absence in the waste. Residues from solvent recycling, and wastes from-: coating operations, are potentially significant sources. One of the key questions for the LCA is therefore what happens to metals in SLF in cement kilnsor other disposal routes.-
0 Table 2.2 includes the chemical species of the main organic components, when known or deducible..‘Examples of other organic compounds are listed in Table 2.3.
Table 2.3 Further examples-of organic compounds in incinerable waste
Hydrocarbons and-phenols :::. Other, including oxygenates. Chlorinated
Hydrocarbon cuts (white spirits etc)
Benzene
Hexane Octane
Cyclohexene
Kerosene
Bitumen, asphalt Vegetable oils
Formic acid
Oxalic acid
Isocyanates Organic peroxides
Epoxy resins
Cyanides Amines
Amides
Nitriles Organophosphorus compounds
Organosulphur compounds
Ethylene dichloride Chlorinated phenols.
Waste.with PCBs
The composition- data are used to frame the cases analysed in the ,Life Cycle Assessment in Section 3. This analysis is structured around waste characteristics, not industrial sources.
R&D Technical Report P274.. 19
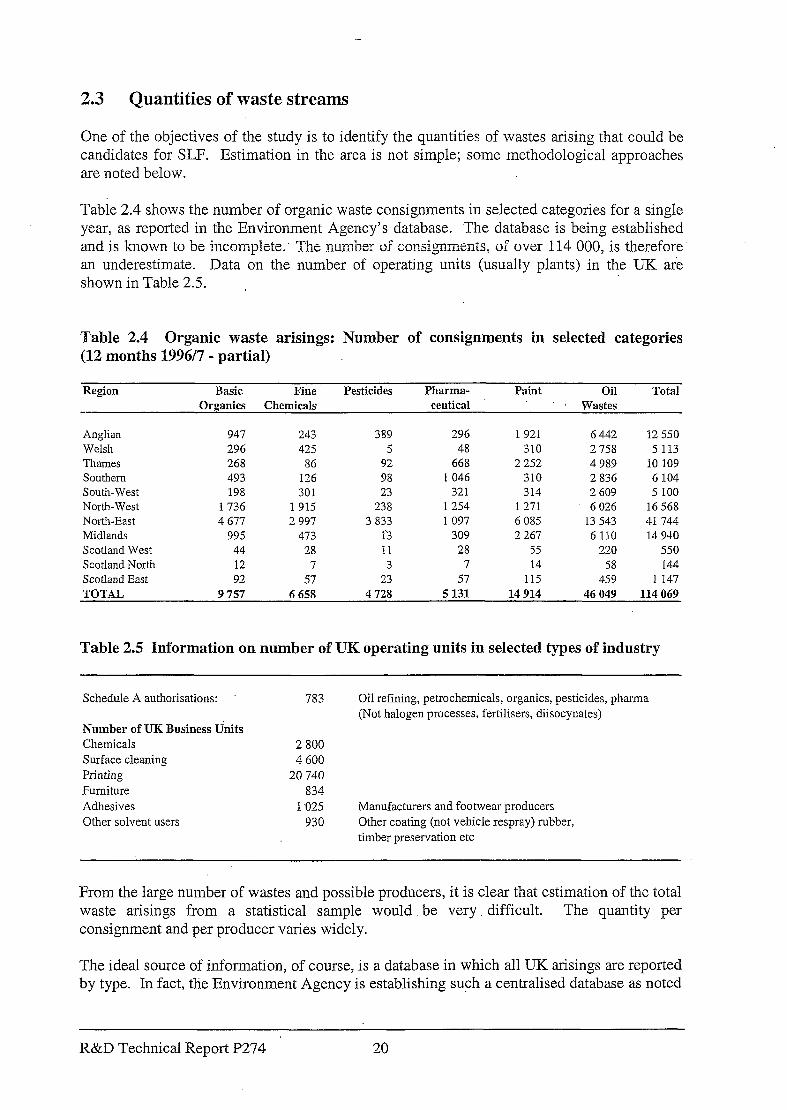
2.3 Quantities of waste streams
One of the objectives of the study is to identify the quantities of wastes arising that could be candidates for SLF. Estimation in the area is not simple; some methodological approaches are noted below.
Table 2.4 shows the number of organic waste consignments in selected categories for a single year: as reported in the Environment Agency’s database. The database is being established and is known to be incomplete.’ The number of consignments, of over I14 000, is therefore. an underestimate. Data on the number of operating units (usually plants) in the UK are shown in Table 2.5. ,
Table 2.4 Organic waste arisings: Number of consignments in selected categories (12 months 1996/7 - partial)
Region Basic Fine Pesticides PIrdrma- Paint Oil Total Organics Chemicals ceutical : Wastes
Anglian 947 243 389 296 1921 6442 12550
Welsh 296 425 5 48 310 2758 5 113
Thames 268 86 92 668 2252 4989 10 109 SOUthem 493 126 98 1046 310 2836 6104
South-West 198 301 23 321 314 2609 5 100 North-West 1736 1 915 238 1254 1271 6026 16 568 North-East 4677 2997 3 833 1 097 6085 13 543 41 744 Midlands 995 473 1‘3 309 2267 6110 14 940
Scotland West 44 28 11 28 5.5 220 550
Scotland North 12 7 3 7 14 58 144
Scotland East 92 57 23 57 11s 459 1 147
TOTAL 9757 6658 4728 5 131 14 914 46049 114 069
Table 2.5 Information on number of UK operating units in selected types of industry
Schedule A authorisations:
Number of UK Business I&its Chemicals Surface cleaning Printing Furniture Adhesives Other solvent users
783 Oil refining, petrochemicals, organics, pesticides, pharrna (Not halogen processes, fertilisers, diisocynates)
2 800 4 600
20 740 834
1’025 930
Manufacturers and footwear producers Other coating (not vehicle respray) rubber, timber preservation etc
From the large number of wastes and possible producers, it is clear that estimation of the total waste arisings from a statistical sample would be very. difficult. The quantity per consignment and per producer varies widely.
The ideal source of information, of course, is a database in which all UK arisings are reported by type. In fact, the Environment Agency is establishing such a centralised database as noted
’ R&D Technical Report P274 20
above, but the system- wasnot completely operational at thetime this report was compiled. The Environment Agency database is, with these limitations~ .a valuable source of information.
A similar source could be a nationalwaste inventory reported by another country. The Toxic.. Release Inventory of the United States is not very.helpful in this respect as it covers only specified pollutants and is aggregated by site. Germany provides. a more promising basis, with special waste quantities broken down by .industry and by waste type. Conversion factors are needed to relate German quantities to UK quantities. These can be only approximate, but,, -.. once more; the estimates are.useful indications..
These estimation methods are basically “bottom-up”, derived from reports of waste quantities. The other approach is “top-down”.
A top-down approach could involve obtainin g data on consumption. or ,production of .’ particular -materials, :from quoted- statistics or by other forms. of estimation. : The quantities going to various destinations, such as atmospheric emissions or liquid organic wastes, are then derived- using .available correlations. Top-down-methods tend to be’morez useful -in estimating total organic content rather than total,waste quantities. The .water or solids content, :I’ may vary very widely, for example.
None of these methods is ideal, and the definition of waste types is not consistent. For these reasons, a combination of techniques is used in this report, in the knowledge that -the results will ,not match exactly. A degree of comfort may be achieved in some instances, or the. uncertainties highlighted in others.
A review of estimates of waste quantities by different methods is presented below, under the follcwing headings:
0 Environment Agency Database 8 Germany waste statistics 0 Chemical industry.estimates 0 Solvent waste 0 Waste oil l Summary. of estimates of waste quantities.
2.3.1 Environment Agency database.
The records in the Environment Agency database are split down by the-categories identified in the European Waste Catalogue. As.noted above, the information drawn from theedatabase is incomplete and the areas of incompleteness can not be identified.
Chem Systems used information for a recent 12 .months supplied by‘the Environment Agency in an Access database. Date. were extracted for all, categories that are, in general, potential candidates for SLF. This amounts to several tens of thousands of consignments: The data were converted to tonnes from the various units quoted: cubic metres, cubic yards, gallons,. kilograms and litres. Some -very large consignments were omitted where it was likely that units had been misquoted or were for very dilute wastes.
R&D Technical Report P274 21
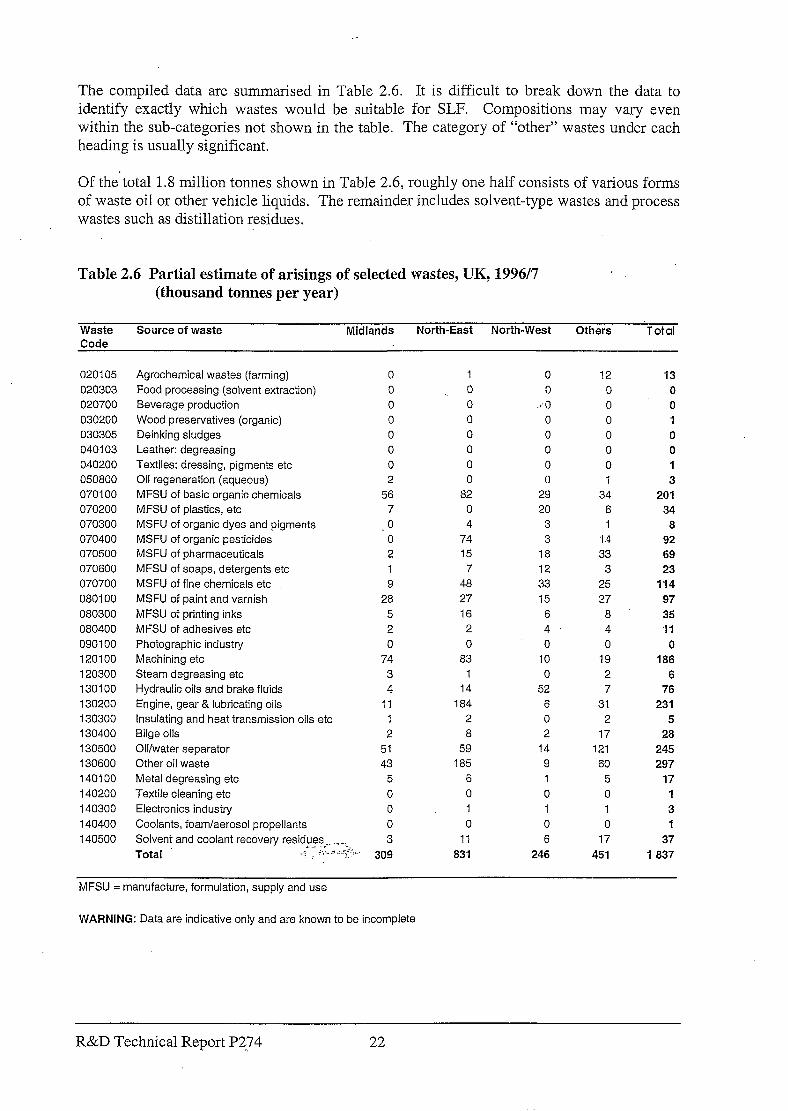
The compiled data are summarised in Table 2.6. It is difficult to break down the data to identify exactly which wastes would be suitable for SLF. Compositions may vary even within the sub-categories not shown in the table. The category of “other” wastes under each heading is usually significant.
Of the total 1.8 million tonnes shown in Table 2.6, roughly one half consists of various forms of waste oil or other vehicle liquids. The remainder includes solvent-type wastes and process wastes such as distillation residues.
Table 2.6 Partial estimate of arisings of selected wastes, UK, 1996/7 (thousand tonnes per year)
Waste Code
Source of waste Midlands North-East North-West Others ‘Total
020105 020303 020700 030200 030305 040103 040200 050800 070100 070200 070300 070400 070500 070600
070700 080100 080300 080400 090100 120100 120300 130100 130200 130300 130400 130500 130600 140100 140200 140300 140400
140500
Agrochemical wastes (farming) Food processing (solvent extraction) Severage production Wood preservatives (organic) Deinking sludges Leather: degreasing Textiles: dressing! pigments etc Oil regeneration (aqueous) MFSU of basic organic chemicals MFSU of plastics, etc MSFU of organic dyes and pigments MSFU of organic pesticides MSFU of pharmaceuticals MFSU of soaps, detergents etc MSFU of fine chemicals etc MSFU of paint and varnish
MFSU of printing inks MFSU of adhesives etc Photographic industry Machining etc Steam degreasing etc Hydraulic oils and brake fluids Engine, gear & lubricating oils Insulating and heat transmission oils etc Bilge oils Oil/water separator Other oil waste Metal degreasing etc Textile cleaning etc Electronics industry Coolants, foam/aerosol propellants Solvent and coolant recovery residues _ ___. Total
<.-.? .-. i.
0 1 0 12 13 0 0 0 0 0 0 0 .!'O 0 0 0 0 0 0 1 0 0 0 0 0 0 0 0 0 0 0 0 0 0 1 2 0 0 1 3
56 82 29 34 201 7 0 20 6 34
.O 4 3 1 8 0 74 3 3 4 92 2 15 18 33 69 1 7 12 3 23 9 48 33 25 114
28 27 i5 27 97 5 16 6 8 35 2 2 4 4 ‘11 0 0 0 0 0
74 83 10 19 186 3 1 0 2 6 4 14 52 7 76
11 184 6 31 231 1 2 0 2 5 2 8 2 17 28
51 59 14 121 245 43 185 9 60 297
5 6 1 5 17 0 0 0 0 1 0 1 1 1 3 0 0 0 0 1
3 11 6 17 37
309 831 246 451 1 837
MFSU = manufacture, formulation, supply and use
WARNING: Data are indicative only and are known to be incomplete
R&D Technical Report P2:?4 22
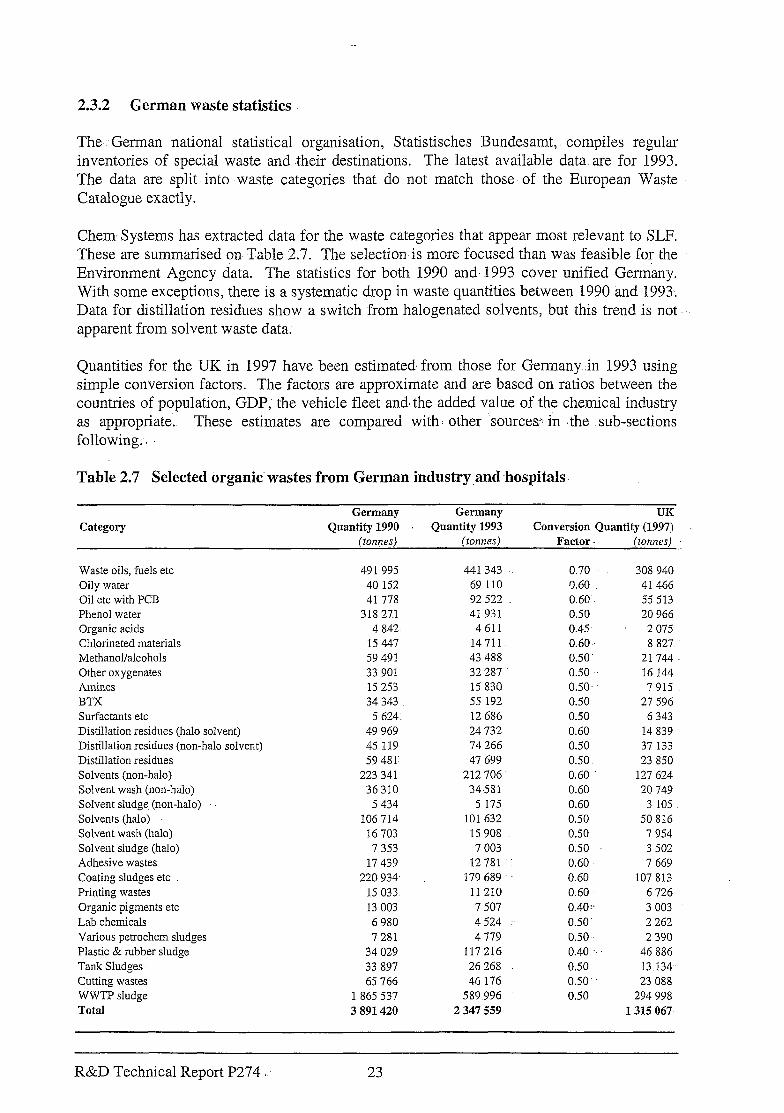
2.3.2 German waste statistics
The German national statistical organisation, Statistisches Bundesamt; : compiles regular inventories of special -waste and their destinations. The latest available data are for 1993. The data are split- into waste categories that do not match those of the European Waste Catalogue exactly.
Chem, Systems has extracted data for the waste categories that appear most relevant to SLF. These are summarised on. Table 2.7. The selection is more focused than was feasible for the Environment Agency data. The statistics for both 1990 and- 1993 cover unified Germany. With some exceptions, there is a systematic drop in waste quantities between 1990 knd 1993,. Data for distillation residues show a switch from halogenated solvents, but this trend is not apparent from solvent waste data.
Quantities for the UK in 1997 have been estimated, from those for Germany :in -1993 using simple conversion factors. The factors are approximate and are based on ratios between the countries of population, GDP, the vehicle fleet and, the added value of the chemical industry as appropriate.. These estimates are compared with i other .sources+ in .the sub-sections following..
Table 2.7 Selected organic. wastes from German industry.and hospitals
Category Germany Germany UK
Quantity 1990 , Quantity 1993 Conversion Quantity (1997). (tonnes) (tonnes) Factor. (tonnes)
Waste oils, fuels etc Oily water Oil etc with PCB Phenol water Organic acids Chlorinated materials Methanol/alcohols Other oxygenates Amines BTX Surfactants etc Distillation residues (halo solvent) Distillation residues (non-halo solvent) Distillation residues Solvents (non-halo) Solvent wash (non-halo) Solvent sludge (non-halo) Solvents (halo) Solvent wash (halo) Solvent sludge (halo) Adhesive wastes Coating sludges etc Printing wastes Organic pigments etc Lab chemicals Various petrochem sludges Plastic & rubber sludge Tank Sludges Cutting wastes WWTP sludge Total
491 995 441343 40 152 69 110 41778 92522
318 27.1 41931 4 842 4611
15 447 14711. 59 491 43 488 33 901 32 287 15 253 15 830 34 343 55 192
5 624 12 686 49 969 24 732 45 119 74 266 59 481. 47 699
223 341 212 706 36 310 34-581
5 434 5 175 106 714 101 632
16 703 15 908 7 353 7 003
17 439 12781 .’ 220 9% 179 689
15 033. 11210 13 003 7 507 6 980 4 524 7 281 4 779
34 029 117 216
33 897 26268 65 766 46 176
1 865 537 589.996 3 891420 2 347 39
0.70 308 940 0.60 41 466 0.60 55 513 0.50 20 966 0.45 2 075 0.60, 8 827 0.50. 21744 0.50 .c 16 144 0.50 7915. 0.50 27 596 0.50 6 343 0.60 14 839 0.50 37 133 0.50 23 850 0.60 127 624 0.60 20 749 0.60 3 105 0.50 50 816 0.50 I 954 0.50 3 502 0.60 7 669 0.60 107 813 0.60 6 726 0.40:~ 3 003 0.50 2 262 0.50. 2 390 0.40 ‘. 46 886 0.50 13 134. 0.50 23 088 0.50 294 998
1315 067.
R&D Technical Report P274 ,. 23
2.3.3 Chemical industry estimates
SLF-type wastes from the chemical industry include both solvent wastes and others described in Section 2.1. The solvent wastes from the chemical industry arise primarily from fine chemical producers, including those manufacturing pharmaceutical active ingredients.
Data aggregated across the sector are not available from producer organisations sources such as the Chemical Industries Association and the Association of the British Pharmaceutical Industry.
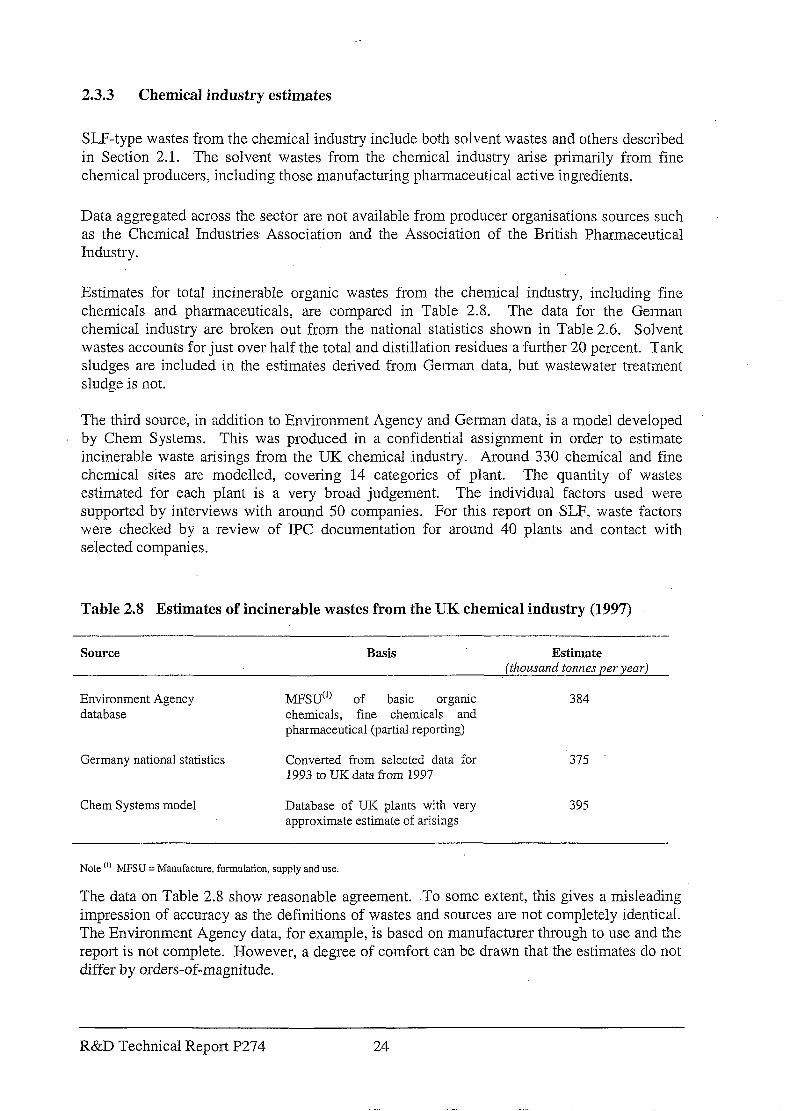
Estimates for total incinerable organic wastes from the chemical industry, including fine chemicals and pharmaceuticals, are compared in Table 2.8. The data for the German chemical industry are broken out from the national statistics shown in Table 2.6. Solvent wastes accounts for just over half the total and distillation residues a further 20 percent. Tank sludges are included in the estimates derived from German data, but wastewater treatment sludge is not.
The third source, in addition to Environment Agency and German data, is a model developed by Chem Systems. This was produced in a confidential assignment in order to estimate incinerable waste arisings from the UK chemical industry. Around 330 chemical and fine chemical sites are modelled, covering 14 categories of plant. The quantity of wastes estimated for each plant is a very broad judgement. The individual factors used were supported by interviews with around 50 companies. For this report on SLF, waste factors were checked. by a ,review of IPC documentation for around 40 plants and contact with selected companies.
Table 2.8 Estimates of incinerable wastes from the UK chemical industry (1997)
Source Basis Estimate (thousand tonnes per year}
Environment Agency database
MFSU”’ of basic organic chemicals, fine chemicals and pharmaceutical (partial reporting)
384
Germany national statistics Converted from selected data for 1993 to UK data from 1997
.375
Chem Systems model Database of UK plants with very approximate estimate of arisings
395
Note (I) MFSU = Manufacture, formulation, supply and use.
The data on Table 2.8 show reasonable agreement. .To some extent, this gives a misleading impression of accuracy as the definitions of wastes and sources are not completely identical. The Environment Agency data, for example, is based on manufacturer through to use and the report is not complete. However, a degree of comfort can be drawn that the estimates do not differ by orders-of-magnitude.
R&D Technical Report P274 24
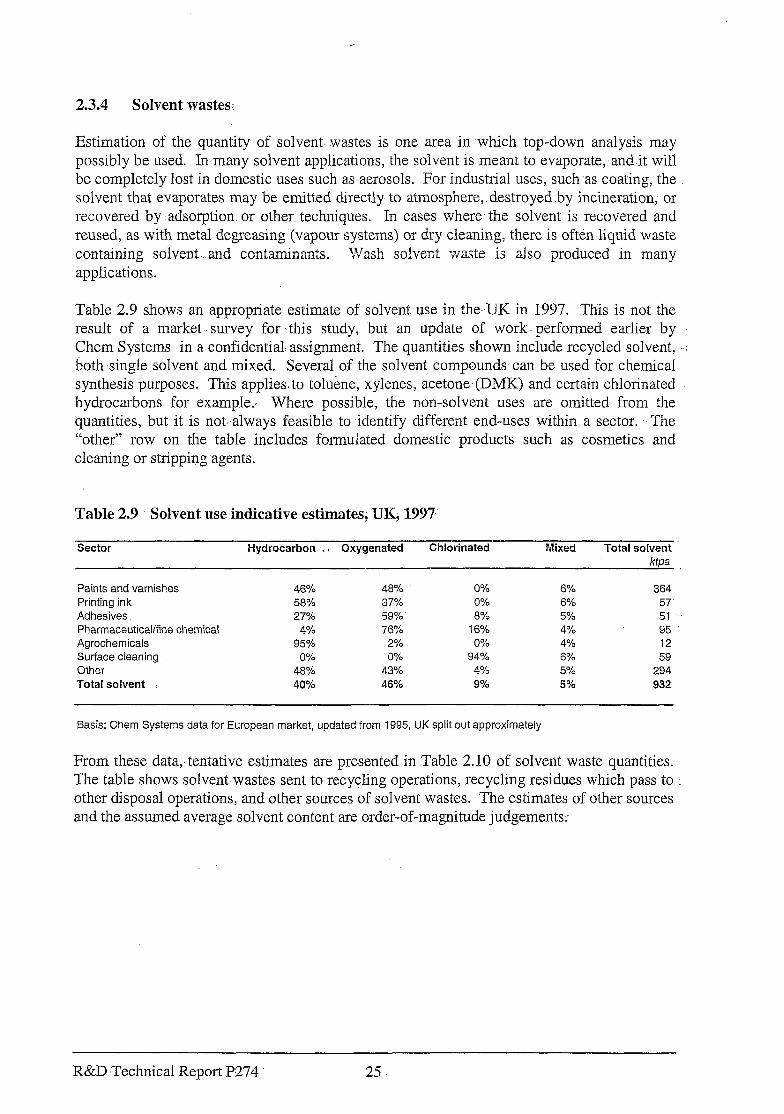
2.3.4 Solvent wastes:
Estimation of the quantity of solvent. ,wastes is one area in -which top-down analysis may possibly be used. In-many solvent applications, the solvent is meant to evaporate, and-it will be completely lost in domestic uses such as aerosols. For industrial uses, such as coating, the solvent that evaporates may be emitted directly to atmosphere,. destroyed .by incineration; or recovered by adsorption or other. techniques. In cases where the solvent is recovered and reused, as with metal degreasing (vapour systems) or dry cleaning, there is often liquid waste containing solvent. and contaminants. VTn-l-., ;I? ii??‘1 * so!yer,t yv:a;:e is also produced in many applications.
Table 2.9 shows an appropriate estimate of solvent use in the- UK in 1997. This is not the result of a market-. survey for this study, ‘but an update of work performed earlier by Chem Systems in a confidential. assignment. The quantities shown include recycled solvent, ..’ both single solvent and mixed. Several of the solvent compounds can be used for chemical synthesis purposes. This applies. to toluene, xylenes, acetone (DMK) and.certain chlorinated hydrocarbons for example., Where possible, the non-solvent uses are omitted from the quantities, but it is not..always feasible to identify different end-uses within a sector. ---The “other” row on the table includes formulated- domestic products such as cosmetics and cleaning or stripping agents.
Table 2.9 Solvent use-indicative estimates, UK+ 1997,
Sector Hydrocarbon . , Oxygenated Chlorinated Mixed Total solvent ktpa
Paints and varnishes Printing ink Adhesives Pharmaceutical/fine chemical Agrochemicals Surface cleaning Other Total solvent :
46% 58% 27%
4% 95%
0% 48% 40%
48% 0% 6% 364 37% 0% 6% 57 59% 8% 5% 51 ..’
76% 16% 4% 95 .’ 2% 0% 4% 12 0% 94% 6% 59
43% 4% 5% 294 46% 9% 5% 932
Basis: Chem Systems data for European market, updated from 1995, UK split out approximately
From-these data,.tentative estimates are presented in Table 2.10 of solvent waste quantities. The table showssolvent.wastes sent to recycling operations, recycling residues which pass to other disposal operations, and other sources of solvent wastes. The estimates of other sources and the assumed average solvent content are order-of-magnitude judgements.
R&D -Technical Report P274 25.
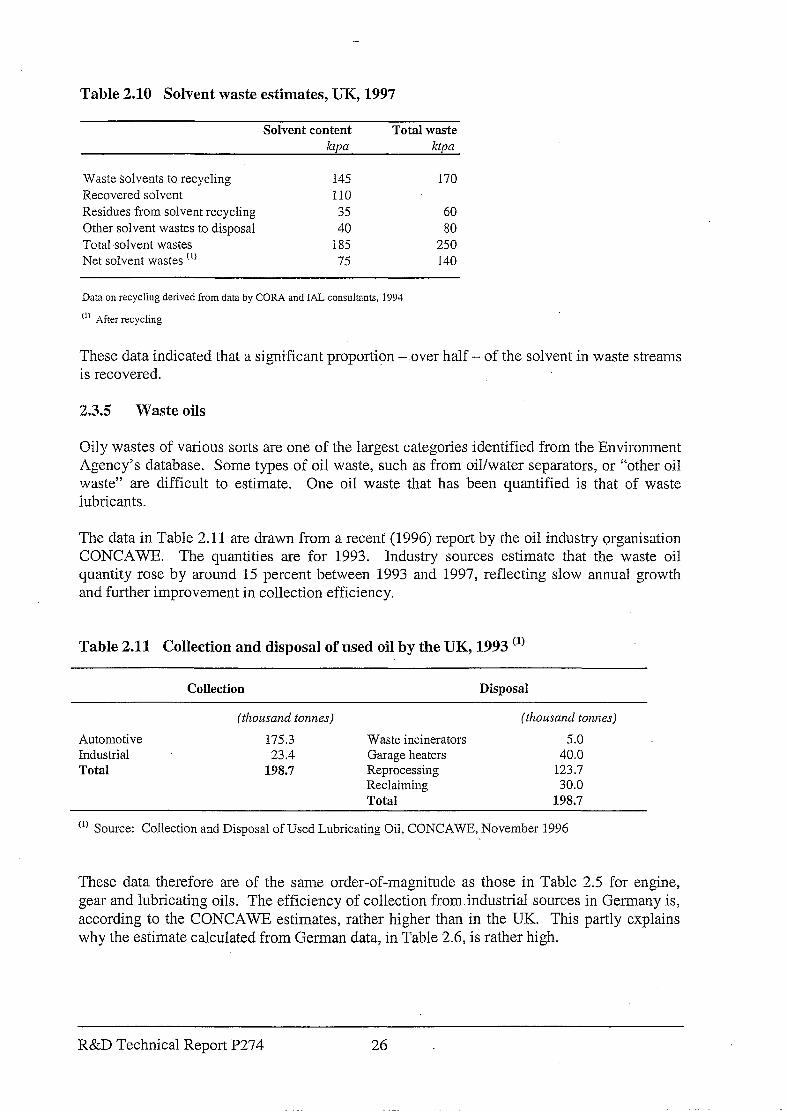
Table 2.10 Solvent waste estimates, UK, 1997
Solvent content Total waste ktwa k&a
Waste Solvents to recycling 145 170 Recovered solvent 110 Residues from solvent recycling 35 60 Other solvent wastes to disposal 40 80 Total solvent wastes 185 250 Net solvent wastes “) 75 140
Data on recycliug derived from data by CORA and IAL consultants, 1994
(‘I After recycling
These data indicated that a significant proportion ---over half - of the solvent in waste streams is recovered.
2.3.5 Waste oils
Oily wastes of various sorts are one of the largest categories identified from the Environment Agency’s database. Some types of oil waste, such as from oil/water separators, or “other oil waste” are difficult to estimate. One oil waste that has been quantified is that of waste iubricants.
The data in Table 2.11 are drawn fro-m a recent (1996) report by the oil industry organisation CONCAWE. The quantities are for 1993. Industry sources estimate that the waste oil quantity rose by around 15 percent between 1993 and 1997, reflecting slow annual growth and further improvement in collection efficiency.
Table 2.11 Collection and disposal of used oil by the UK, 1993 (‘)
Collection Disposal
Automotive Industrial Total
(thousand tonnes)
175.3 23.4
198.7
Waste incinerators Garage heaters Reprocessing Reclaiming Total
(thousand tonnes)
5.0 40.0
123.7 30.0
198.7
w Source: Collection and Disposal of Used Lubricating Oil, CONCAWE, November 1996
These data therefore are of the same order-of-magnitude as those in Table 2.5 for engine, gear and lubricating oils. The efficiency of collection from.industrial sources in Germany is, according to the CONCAWE estimates, rather higher than in the UK. This partly explains why the estimate calculated from German data, in Table 2.6, is rather high.
R&D Technical Report P274 26
2.3.6 Summary of waste <quantities.
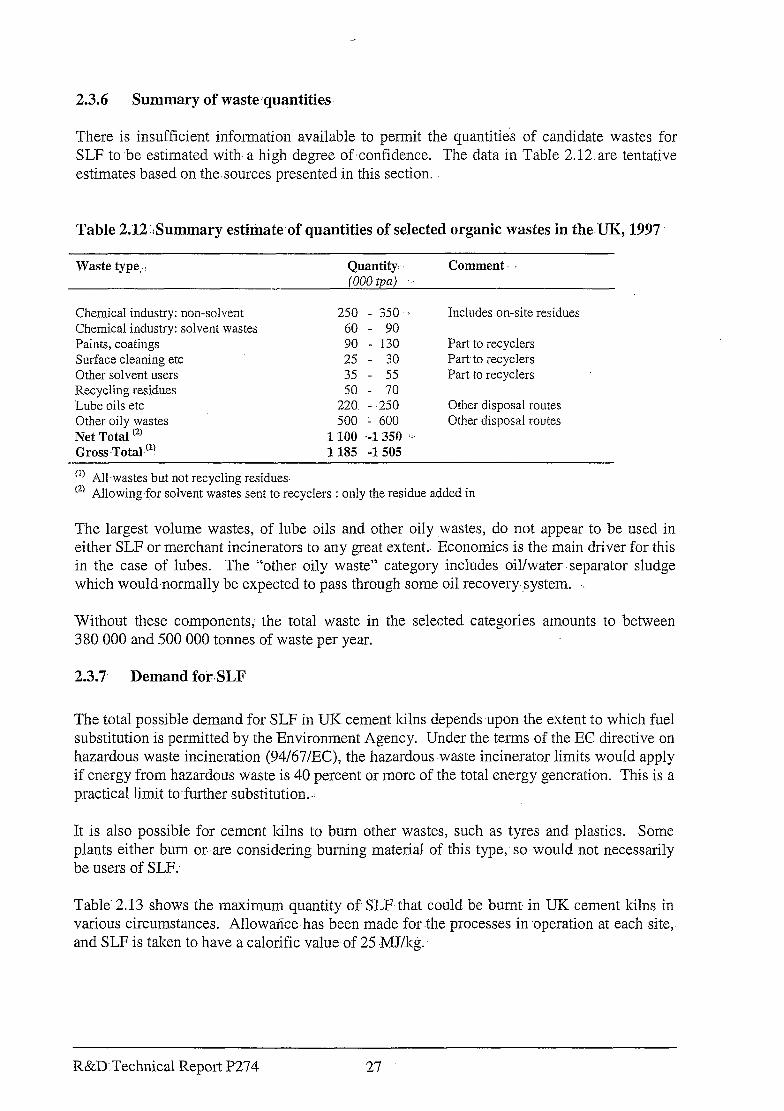
There is insufficient information available to permit the quantities of candidate wastes for SLF to be estimated with, a high degree of confidence. The data in Table 2.12. are tentative estimates based on the.sources presented in this section.
Table 2.12 :Summary estimate-of quantities of selected organic wasles in the-UK, 1997
Waste type,.. Quantity (000 p)
Comment.
Chemical industry: non-solvent Chemical industry: solvent wastes Paints, coatings Surface cleaning etc Other solvent users Recycling residues ‘Lube oils etc Other oily wastes Net Total !‘I Gross-Total (*)
250 - 350 Includes on-site residues 60 - 90 90 - 130 Part to recyclers 25 - 30 Part to iecyclers 35 - 55 Part to recyclers 50 - 70
220 - 250 Other disposal routes 500 - 600 Other disposal routes
1100 .-l 350 ‘.. 1185 -1505
(I) All,wastes but not recycling residues @) Allowing for solvent wastes sent to recyclers : only the residue added in
The largest volume wastes, of lube oils and other oily wastes, do not appear to be used in either SLF or merchant incinerators to any great extent.- Economics is the main driver for this in the case of lubes. The “other oily waste” category includes oil/water ‘separator sludge which would-normally be expected to pass through some oil recovery system. ‘.
Without these components, the total waste in the selected categories am.ounts to between 380 000 and 500 000 tonnes of waste per year.
2.3.7. Demand for-SLF
The total possible demand for SLF in UK cement kilns depends upon the extent to which fuel substitution is permitted by the Environment Agency. Under the terms of the-EC directive on hazardous waste incineration (94/67/EC), the hazardous waste incinerator limits would apply if energy from hazardous waste is 40 percent or more of the total energy generation. This is a practical limit to,further substitution,
It is also possible for cement kilns to bum other wastes, such as tyres and plastics. Some plants either bum or..are considering burning material of this type, so would not necessarily be users of SLF:
Table’ 2.13 shows the maximum quantity of SLF that could be burnt, in UK cement kilns in various circumstances. Allowance-has been made for -the processes in operation at each site, and SLF is taken to have a calorific value of 25 MJ/kg..
R&D:Technical Report P274 27
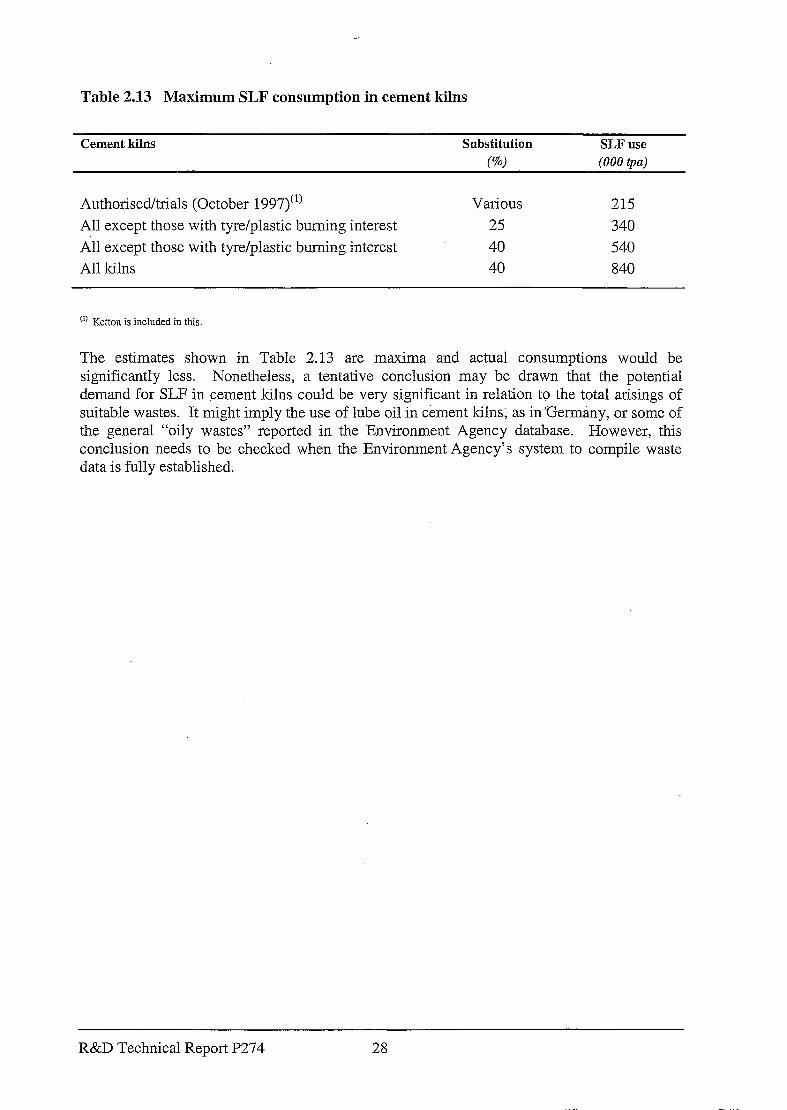
Table 2.13 Maximum SLF consumption in cement kilns
Cement kilns Substitution SLF use
(%) (000 @a)
Authorised/trials (October 1997)“’ All except those with tyre/plastic burning interest
All except those with tyre/plastic burning interest
All kilns
various 215 25 340 40 540
40 840
(I) Ketton is included in this.
The estimates shown in Table 2.13 are maxima and actual consumptions would be significantly less. Nonetheless, a tentative conclusion may be drawn that the potential demand for SLF in cement kilns could be very significant in relation to the total arisings of suitable wastes. It might imply the use of lube oil in cement kilns; as inGermany, or some of the general “oily wastes” reported in the Environment Agency database. However, this conclusion needs to be checked when the Environment Agency’s system to compile waste data is fully established.
R&D Technical Report P274 28
4. 3. Life- Cycle Assessment -(LCA)
3.1 Approach
3.15 Introduction to LCA
The-report on the environmental-Life Cycle Assessment is presented in!the following parts:..
8 Section 3.1: the methodology underlying the analysis
0 Section 3.2: the specifics of the systemsstudied in the-review of SLF
8. Section 3.3: the Life Cycle Inventory data and the conclusions to be drawn. from them
8 Section 3.4: consideration of environmental impact issues
8 Section 3.5: conclusions of the.LCA.
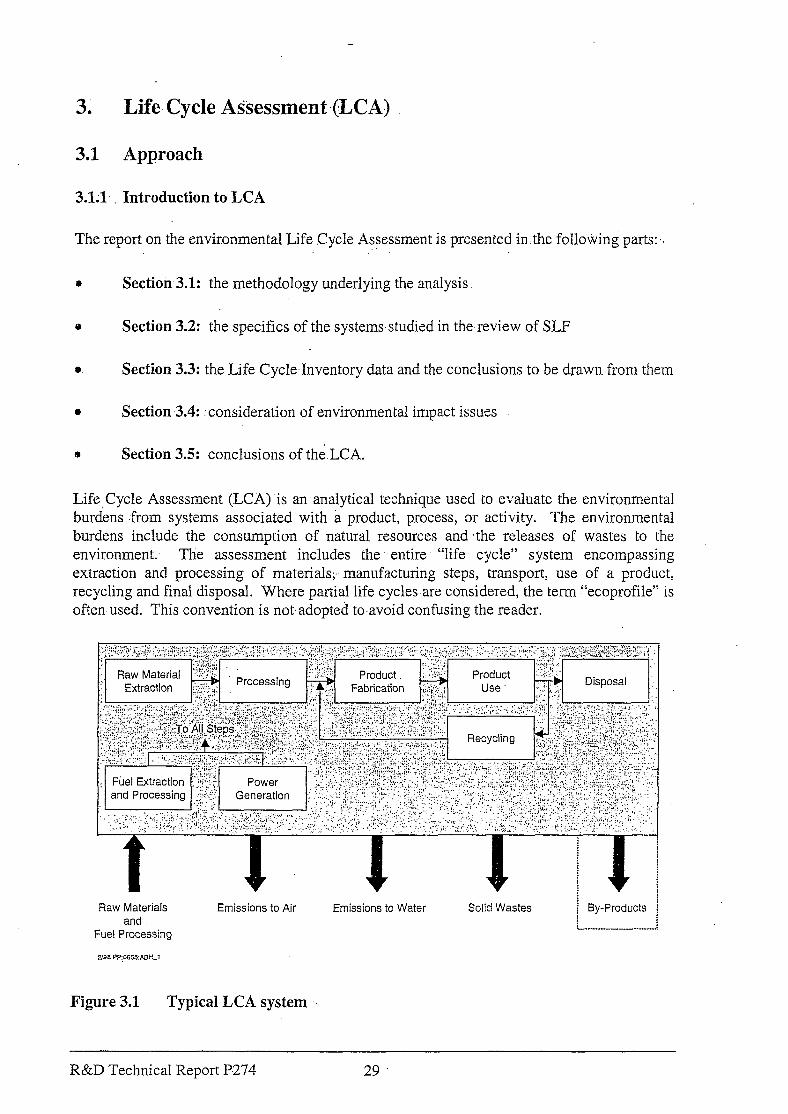
Life Cycle Assessment (LCA) .is an analytical technique used to evaluate the environmental burdensfrom systems associated with a product, process, or activity. The environmental burdens include the consumption of natural resources and the releases of wastes to the environment.- The assessment includes the entire “life cycle” system encompassing extraction and processing of materials;- manufacturing steps, transport, use of a product, recycling and final disposal.. Where partial life cycles are considered, the term “ecoprofile” is oftenused. This convention is not-adopted to.avoid confusing the reader.
Raw Materials and
Fuel Processing
ZIG8 PP:OS55:AaHI1
Emissions to Air Emissions to Water Solid Wastes i By-Products
i-.----.---i
Figure 3.1 Typical LCA system
R&D Technical Report P274 29
The total environmental burdens include those arising from the generation of power and the use of transport, as Figure 3.1 indicates.
Life Cycle Assessment proceeds in several stages, usually categorised as follows:
0 goal definition and scoping
l Life Cycle Inventory &CT), in which th e data on consumptions of resources, emissions and other relevant factors are collected and calculated
0 Impact Assessment, where the LCI data are related in some way to actual environmental impacts
0 utilisation, such as an assessment of the possibilities for impact improvement.
The analytical framework for the study of SLF is reviewed in Section 3.1.2 below. Notes on the methodology employed are given in Section 3.1.3; non-specialist readers may care to skip. this part.
3.1.2 Analytical framework
All LCA is ultimately used for comparisons, whether between products, policy options, or improvement possibilities,
An essential part of a meaningful analysis is a definition of the appropriate comparisons. The study into the use of SLF in cement kilns has features that are different to many LCA studies relating to product life cycles or recycling options, for example. The basic principles used in the SLF study are therefore outlined here.
(4 Basic question
The question to be answered is, for different types of waste, is it environmentally preferable to direct waste tof
e SLF blenders and then a cement kiln, where it displaces coal or petcoke as fuel
l an alternative form of disposal, primarily high temperature incineration
0 recovery of solvent values for recycling, displacing the need for production of new solvent?
This question is not the same. as whether a kiln or incinerator burning SLF operates within limits set by regulators, and the data requirements are different.
(b) Options compared
The disposal options compared in the study are:
l high temperature incinerators
R&D Technical Report P274 30
l use as SLF in cement kilns
0 recycling of solvent value.
In each case, the wastes considered are those arising after- all on-site recovery or processing has occurred.
(c) Options excluded
The option of landfill of the SLF-type waste is not included in the analysis. There is a strong trend to exclude organic wastes from landfill and this is expected to be further formalised in the EU Landfill Directive.. The conventional. terms of reference for LCAs assume that all operations comply with the.law or other regulatory standards. It is beyond the remit of a study on SLF to reconsider the technical basis.of landfill exclusion criteria that have been extensively analysed -by others in international fora. In essence,- the disposal options considered are those . . judged to be permissible in the current and coming _ regulatory environment.
It should also be noted that there are ,practical difficulties in including, landfill in the LCA. While the -fate of components of putrescible waste can be modelled,: the data on chemical organic wastes are not clear. For example, there is evidence that some-vinyl chloride may .be emitted as a result-of chlorinated solvents in land:fill, but the research data are not, available to define to what extent this occurs. The final outcome will also depend upon the total mixture in the landfill. There is a difference too in the nature of environmental problems associated with-landfill and other disposal routes. With landfill,. the emphasis is on containment over a long period, with possible risks of failure to contain or risks of.fire.hazards. With a disposal route such as incineration, much of the environmental- burden occurs in a very short period. While LCA methodology does provide some structure for considering trade-offs between differenttypes of impacts, it is difficult, to avoid a mixed message in these circumstances.
Another option for disposal of organic wastes is that of discharge .to sewer or directly to surface water as aqueous effluent. This is excluded from the LCA for the same two reasons. as for landfill: this would not normally be a permissible disposal- route and,.- of. secondary importance - there are practical difficulties in modelling it;
Chem Systems is not aware of waste streams. that could be plausibly blended into SCF instead of being sent- to sewer. As with landfill, ,if disposal to sewer is not permitted by regulators, it should not be considered as a disposal-route in the LCA.
The environmental impact of discharge to water - whether or not via a treatment system - will be. heavily- dependent on the chemical species present... Degradability. (aerobic -and anaerobic), sorption characteristics, acute. toxicity,.. and long term effects including bio- accumulation are all relevant. As the .European Commission has shown in the work on ecolabelling of laundry detergents; it is an enormous undertaking to compile these data even for a limited rate of compounds; The actual environmental- consequences depend also on the state of the receiving,watercourse and the nature of the aquatic ecosystem.
It would therefore .be very difficult. to incorporate disposal to sewer or watercourse in the LCA in a meaningful manner.
R&D Technical Report P274.. 31 ‘. I
The focus on disposal routes other than landfill and discharge to sewer is consistent with the concerns expressed by the House of Commons Environment Committee.
System configuration
The systems to be compared are shown in simplified form on Figure 3.2. The selection of systems may appear strange, but it must be remembered that it is not the absolute impacts that are of interest, but the differences between options. For example, all the systems include a cement kiln even when SLF is not sent to this destination. This is to permit the calculation of the difference between a cement kiln using conventional fuel and one using SLF.
The first system - the incineration option - includes the high temperature incineration of the SLF.type waste in a merchant incinerator. It is assumed that this is an incremental load on an incinerator that is already running with a balanced bum menu, and does not displace anything else. No allowance is made for the possibility that more lqw-energy wastes (non-SLF) may be economically incinerated if the SLF waste has a high energy content ‘and acts as a support fuel. That would be an economic, not an environmental, argument. If the low-energy non- SLF wastes are suitable for incineration then they should most probably be excluded in any case from other disposal routes such as landfill. This is a broader issue of regulation and motivation than is appropriate for this report. However, one case is considered where a substantially hydrocarbon SLF waste is used to displace fuel in the incinerator. This case therefore models an incinerator with an energy.deficit because it is burning other low energy (non-SLF) wastes.
System I also includes the cement kiln, using traditional non-SLF fuels: coal and petcoke.
The second system is when the waste is used as SLF in cement kilns. In this case, the incinerator is omitted because, in System I, SLF is taken as an incremental incinerator ioad rather than a substitute for other materials.
It should be noted that petcoke could be considered an unavoidable product from refineries of certain configurations. In. other words, the petcoke would be burnt somewhere if not in a cement kiln. This factor is not taken into account in System II. The petcoke might be burnt on some other facility, such as a furnace with flue gas desulphurisation, where impacts would be different. In addition, petcoke is not an essential product of refineries; refinery configurations could be altered in the long term so that petcoke is not made. Only one T-K refinery currently produces petcoke. These arguments do not apply to coal. If it is not bought, it is not mined.
System III shows the SLF-type -waste passing to a solvent recycling facility. In some instances, the SLF-type waste could be residues from solvent recycling, so that the question is one of deeper recovery on the recycling plant. However, the simplification is made that the choice is between recycling and not recycling. As the processing effort increases for higher recovery rates, this approach may understate the environmental burdens .of the recycling operation. This is considered in the review of results.
System III also shows the displacement of the requirement to make new solvent, one of the main benefits of recycling. This shows up in the LCI as negative environmental burdens. In
R&D Technical Report P274 32
effect, this is an expression of the difference between making new solvent and not making it. The same answer could be achieved by including the production of new solvent in System I and.11, and,omitting it from System III: This latter form of presentation was.rejected because it could mask -comparison between cement:kiln and incinerator routes. Finally, -System III includes the cement kiln continuing to use coal and petcoke.
The target of the analysis is to find the.difference between the environmental impacts of the. three systems.
(4 Scope of systems
The interest in this LCA is in the.use or disposal of SLF-type.wastes by different routes.. The incremental:- changes are of relevance rather than the total impacts of, ‘for example, manufacturing cement. However, some appreciation of total processes is required before the incremental. changes can be assessed. For example, the type of fuel or waste burnt will. influence the.need to.grind solid fuels and therefore the power consumed..
Chem Systems has therefore reviewed information provided in confidence by operators to check whether such factors could be significant. :.
In general; however, the analysis is made.on the basis of a factors relevant to a unit of SLF waste. Different waste compositions are considered in different comparisons.
A fuller description of’ system boundaries is given under the.heading of Methodology below.
(f) Calculation methods
Where possible, LCAs should be based on real measured data that are directly applicable to the subject studied.-- Where processes have more than one output, the measured quantities-are divided between outputs using various allocation techniques.
For the LCA on SLF. disposal routes, important questions are those below.
l What is the destination (e.g. air, solid. waste)- of metals, halogens,. sulphur, etc,
entering incinerators, kilns or recycling plants?
0 What is the impact of the pollutants in these different destinations? For example, will:
metals leach out of solids?
0 What happens if Iow energy materials are fed to kilns or incinerators?
These questions are not answered easily. : Data from trial runs with SLFin cement kilns in the UK and elsewhere,-for example,. tend to show significant variation and it is difficult to form quantitative conclusions. Emissions are also usually measured on other types of operation, such as incinerators. However, data to identify the effect of increments of waste of specified composition are not generally available.
R&D Technical Report-P274 33
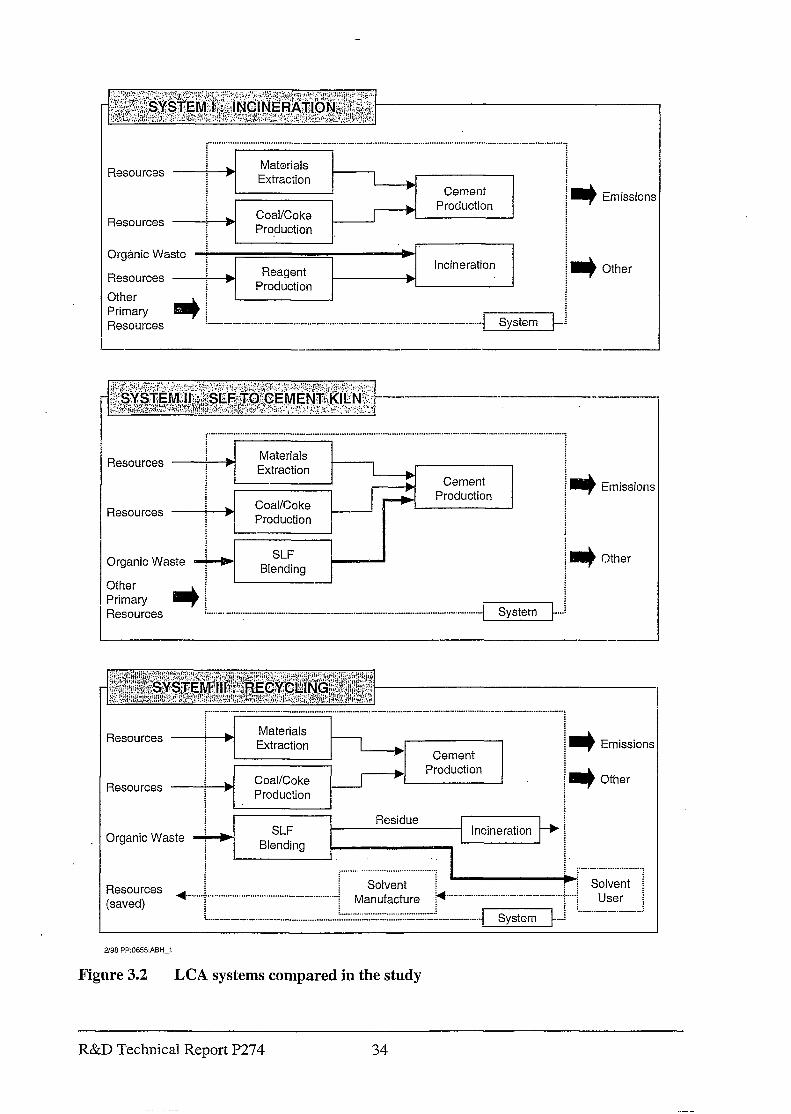
Coal/Coke
t
-.I Production
-
Materials ’ Extraction
i ._.. -- *_... -.- ._..._._._..__l___l_--.,- - ___._.,_-.._._. -._.- l_..-.l.l~ i-i-.. System
N Emission:
-L Other
Resources
Resources
“̂“-.--- .-..,..- - .._._ “““_” .___.,l..,._l.l_.” .,.__._.., “.” .__...._.._...-..-.-. I .-.-....-...-.I.. - -..-.... ““_..-.,
I I
Materials ’ Extraction 1 + Cement
Coal/Coke A -b Production
’ Production I I
Organic Waste y SLF
Blending
L-.--.-...- ..--_._. ---..-.-.- . . ..-... - -................................-.... I Svstem I--
* Emissions
* Other
~-.-..- -...-...---. ‘: 7 Solvent i ,-./ i User i
L-~~~-~~~~
Figure 3.2 LCA systems compared in the study
R&D Technical Report P274
The approach taken is therefore .to use the best available data for partitioning of pollutants between media. When conclusions are dependent on the assumptions of partitioning, thisis considered in the review of results.
Some variables, such as volume of flue gas and quantity of carbon dioxide,-can be estimated .- from the waste analysis, and this forms part of the calculation method.
It is therefore necessary to model. the technical operations in a way that is usually not required in LCA. In practice, emissions- are very-dependent on the.-c ontrol -of the operation. ‘. The changes predicted by the (rather crude) -modelling .used for SLF. disposal would apply to facilities that are controlled well and run steadily.
(g) : Limitation ‘.:.:
There is one very important limitation. to the analytical technique. The SLF. specification : imposed by-the Environment Agency - on each cement kiln authorised to use it - relates to blended SLI?up to a certain quantity.. One purpose of the study is to review whether.there are some wastes that should not be;permitted to be blended into SLF.’ :-This requires the analysis of the impact of .a small quantity of wastes of...specified ,composition. However, the environmental impact of the subject waste may depend upon the quantity. Certain pollutants- will be.absorbed in cement clinker up to a quantity - theory suggests -. at which, breakthrough- occurs.
This discontinuity.in the effect of certain pollutants versus quantity meansthat:
b extreme caution is needed in drawing inferences on the impact of small quantities of
component wastes in total ,SLF.
8 the principle of-exclusion of certain wastes from a blend.may be difficult to justify
rigorously.
3.1.3 Methodology
These notes relate-to detailed issues of LCA methodology. Some readers may-swish to skip this and turn to Section 3.2.
(a> Goals
The purpose of the LCA is to identify the environmental impactsassociated with the different ways of disposing of SLF-type wastes.
Data are intended to relate to systems and facilities.in the United.Kingdom in or around 1997. The plants from which- information. was obtained comply with currentIlK environmental regulations. They represent actual good practice rather than. necessarily state-of-the-art;. > althoughin some cases these are the same.
R&D Technical Report P274 35
More generalised data have been used, for example, for internationally traded commodities such as solvents. Good current EU practice is the basis here.
(W Functional units
Any LCA analysis is based on a “functional unit” to permit comparison of systems fulfilling -the same need.
The functional unit for this study is disposai of one kilogram of SLFAtype waste before any blending or processing. Different chemical compositions of waste are used in various cases.
(c) I Systems boundaries
The boundaries of the systems studied are:
s where the SLF-type waste arises in drtunmed form or loaded into road tankers
.a where raw materials including fuels (including for power and transport) are extracted from the environment; burdens involved in exploration, establishment of extraction facilities and infrastructure, and activities such as agricultural nurseries are outside the boundaries
9 where emissions to air and water occur? after any on-site treatment of wastes
bD where final residual wastes are landfilled.
Emissions and solid wastes from waste incineration are included. Leachate and gas from landfill are not considered. As noted in Section 3.1.2, the SLF-type wastes should not be landfilled; any final residues sent to landfill will be substantially inert in this analysis.
The life cycle includes transport by appropriate means between stages, and operations for the production of power and fuel from primary sources. General operating burdens, such as from space heating or site transport, are included where possible.
The following exclusions apply:
a Production of capital equipment is excluded. This is likely to introduce a possible significant inaccuracy only in transport, where a sensitivity check has been performed to ensure that the effect of this omission is small.
9 Activities of humans involved in the operations, such as travel to work, are excluded as being largely independent of the system.
0 Upstream production burdens of minor materials are excluded when they are less than two percent of the total feedstock mass; they are added in as the closest analogous material, however, and possible environmental issues in upstream production are considered qualitatively.
R&D Technical Report P274 36
(d) Data sources
Data have been obtained from several sources.
0 Information has been received from several of the parties. with an interest in SLF, including blenders, cement plants, recyclers and incinerators. Part of the information is publicly. available, but some is not... The data. are not broken out .by plant: .and represent typical rather than individual facilities.
8 Chem Systems’. in-house technoeconomic data include considerable information on processing operations.. Most are based on information from production companies or have been subsequently confirmed by them. The focus of these data is on material usage,-utility consumptions, and major effluents. Emissions data are supplemented as necessary from: environmental auditing work;: from data supplied .in the course of technical studies and,:where these are not available,- by engineering calculation. This source is particularly useful for the burdens involved in producing new solvents.
8 Information compiled in the course of, other LCA studies is another source. This includes data and models from Chem Systems? own LCA studies and industry ecoprofiles produced by associations such as CEFIC.
6 Technical literature is a final source. This is useful, not so much for basic data such as energy consumptions, but. to ,assist in mod.elling. the. combustion. of SLF and assessing impacts.
W Calcblation of the inventory.. ‘.
Some principles are outlined in Section 3.2, on .analytical framework; indicating the-need for technical modelling of some of the most important aspects of this LCA;
Other points relating to calculation methods are as follows:
8 a broad check for mass balance consistency-is made for each operation in the systems
8 where .one operation results in more than one product, the burdens of the operation are shared over all the products with a beneficial end-use, usually on the basis of mass
8 the LCI is calculated using an Excel spreadsheet model$for maximum flexibility.
Reporting of Life Cycle Inventory
The LCI information is presented as follows:
8 total masses of feedstocks are noted; the data- for coal, oil and gas do include the consumption -of these materials for processing energy and standard energy models- have been used for this
R&D Technical Report P274 37
0 energy use is split into non-renewable feedstock, processing energy, and transport; it is expressed as LHV (Lower Heating Value)
0 emissions to air, water and solid wastes to land are reported as masses.
One methodological point of note is that the energy content of the waste itself is not shown in the LCI. Some analysts prefer to record energy content of wastes because the energy is still available for use if the waste is recycled, for example. Others recognise that the practical utility of the calorific value is lost in many circumstances, such as dispersion in an inert medium.
As elsewhere in the analysis of SLF use, the emphasis is on the difference between options rather than the absolute values. With solvent recycling, for example, the solvent passing to the consumer will have the same energy content in the system with recycling and the system with use of new solvent.
It is desirable in an LCI to quote emissions data broken downinto individualspecies as far as possible. In reality, it is very difficult to get consistent reporting of this sort. Many producers simply do not record the. appropriate data and LCI or ecoprofile data produced by others are often expressed in a condensed format. Data have been recorded in as much detail as possible by Chem Systems. However, it would be erroneous to draw conclusions that may be affected by the completeness of data available from different operations. The emissions are therefore presented in a restricted number of categories. Some of these are themselves aggregates, such as hydrocarbons or dissolved-solids. Where a process-specific emission is known to occur, but is not reported elsewhere, this is noted in the analysis.
(g) Environmental Impact Assessment
Many of the conclusions in an LCA can be drawn from the Life Cycle Inventory. If there are trade-offs between options, or, if prioritisation of impacts is required, then further analysis may be required. It is important to note that LCA is usually not location-specific. In other words, impact assessment techniques as used to date typically exclude considerations of actual conditions of the receiving media or ecosystem, and the dispersion characteristics of the emitted stream. When analyses are used to inform longer term policy decisions, it is not appropriate to produce results that depend on the peculiarities of any site. Such factors would, of course, be considered by Inspectors in reviewing IPC and BPEO for a site.
There are no scientifically exact methods of converting the LCI data into an assessment of the overall environmental benefits or penalties of different systems. Several techniques are used.
A first step is often to group burdens into categories of contributions to particular environmental issues. Carbon dioxide and methane contribute to global warming, for example. Sulphur dioxide is a contributor to acid rain and to human health issues. All contributors to a single issue can be expressed as a common currency. Global warming agents can be expressed in kilograms of CO2 by using global warming potentials. Other weighting factors may be less scientifically supportable. Considerable academic work has been performed in this field by the University of Leiden and others.
R&D Technical Report P274 38
Other analytical steps may address two further questions.
a How great a contribution does the system studied make to the total issue, regionally or globally? What percentage of European. global.. warming burdens is emitted, : compared to what percentage of total tropospheric ozone precursors, for example?
a How important is each environmental issue ? Is acid rain a more serious problem than eutrophication, for example?
There are strong areas of commonality between this type of methodology-and elements of the approach proposed for BPEO assessments for. IPC 1 (Technical Guidance.. Note El). The BPEO methodology does not cover as broad a range of issues as are usually addressed in LCA. It.also requires estimation of the contribution of the process to, forexample, ambient air concentrations. This implies some formof dispersion modelling, which would take into account plant-specific factors.
The approach taken in the LCA onSLF is therefore:
0 to draw conclusions as far as possible from the LCI alone
0 to use relevant factors- from the BPEO methodology in any further assessment of options.
32 Life Cycle hventory Calculation
3.2.1. Wastes and Fuels Studied
One purpose of the study is to identify types of-waste that should not be used in SLF. It is almost impossible to do this by namingZcertain sources and categories of waste because the compositions differ widely within each ,category. Therefore; the identification of excluded, wastes must be based on composition or other definable properties.
Hypothetical waste compositions have been constructed to,illustrate the influence of different components on the total results. There are some instances in which the presence of one element affects the impact of another. Mostly,.. however, the elements’ can. be treated as independent. Therefore, only a few metals are included in the:analysis. The messages from the LCI are extended to other metals in the review of results.
‘Table 3.1 contains the hypothetical waste compositions. The organic compounds include:
l typical blended SLF;. with. composition derived from limits set by : the Environment .- Agency (although these differ between kilns)
0 a high hydrocarbon (and.high energy) waste, such as a waste hydrocarbon solvent, with the chemical species taken as toluene
R&D Technical Report P274. 39
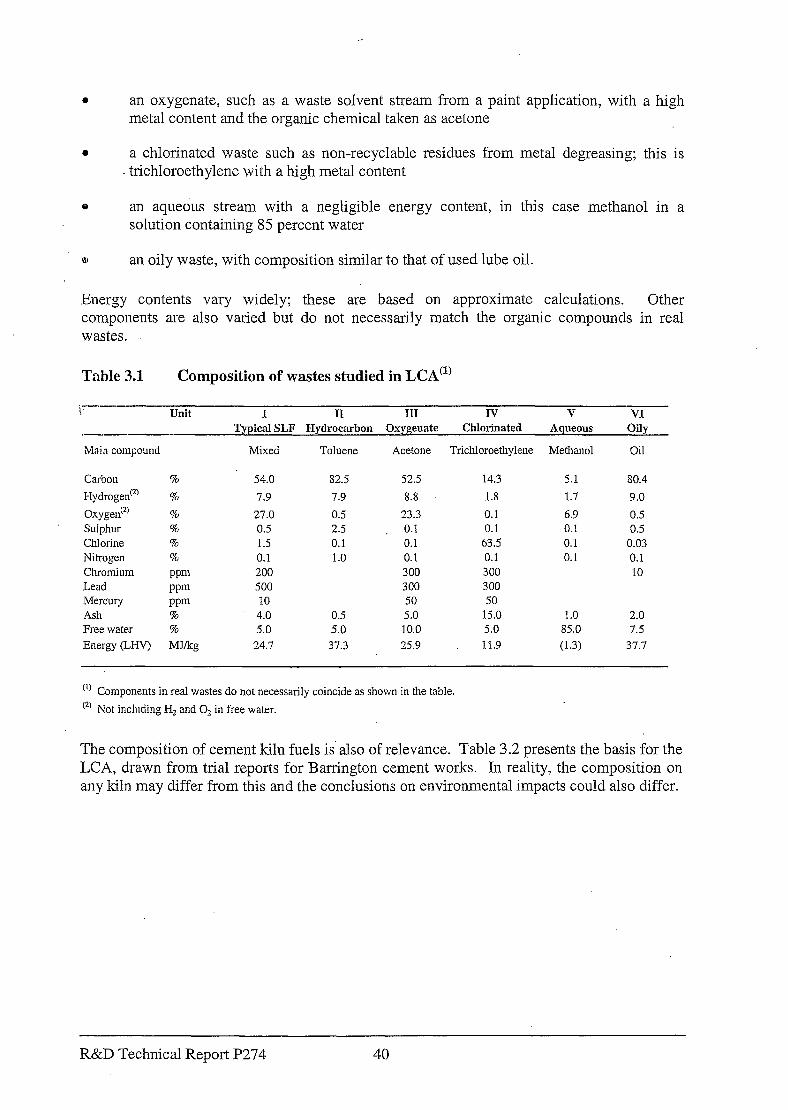
0 an oxygenate, such as a waste solvent stream from a paint application, with a high metal content and the organic chemical taken as acetone
0 a chlorinated waste such as non-recyclable residues from metal degreasing; this is trichloroethylene with a high metal content
ta an aqueous stream with a negligible energy content, in this case methanol in a solution containing 85 percent water
0l an oily waste, with composition similar to that of used lube oil.
Energy contents vary widely; these are based on approximate calculations. Other components are also varied but do not necessarily match the organic compounds in real wastes.
Table 3.1 Composition of wastes studied in LCA”’
y-” Unit I II III IV V VI
Typical SLF Hydrocarbon Osygenate Chlorinated Aqueous .-- Oily
Main compound Mixed Toluene Acetone Trichloroethylene Methanol Oil
Carbon % 54.0
Hydrogen(” % 7.9
Oxyged” % 27.0
Sulphur % 0.5
Chlorine % 1.5 Nitrogen % 0.1 Chromium .wm 200
Lead mm 500 Mercury ppm 10 Ash % 4.0 Free water % 5.0
Energy (LHV) MJ/kg 24.7
82.5
7.9
0.5
2.5
0.1 . 1.0
0.5 5.0
37.3
52.5 14.3
8.8 1.8
23.3 0.1
0.1 0.1
0.1 63.5
0.1 0.1 300 300
300 300
50 50
5.0 15.0 10.0 5.0
25.9 11.9
5.1
1.7
6.9 0.1 0.1 0.1
1.0 2.0 85.0 7.5
(1.3) 37.7
80.4
9.0
0.5
0.5
0.03
0.1 10
(I) Components in real wastes do not necessarily coincide as shown in the table.
@) Not including Hz. and O2 in free water.
The composition of cement kiln fuels is. also of relevance. Table 3.2 presents the basis for the LCA, drawn from trial reports for Barrington cement works. III reality, the composition on any kiln may differ from this and the conclusions on environmental impacts could also differ.
R&D Technical Report P274 40
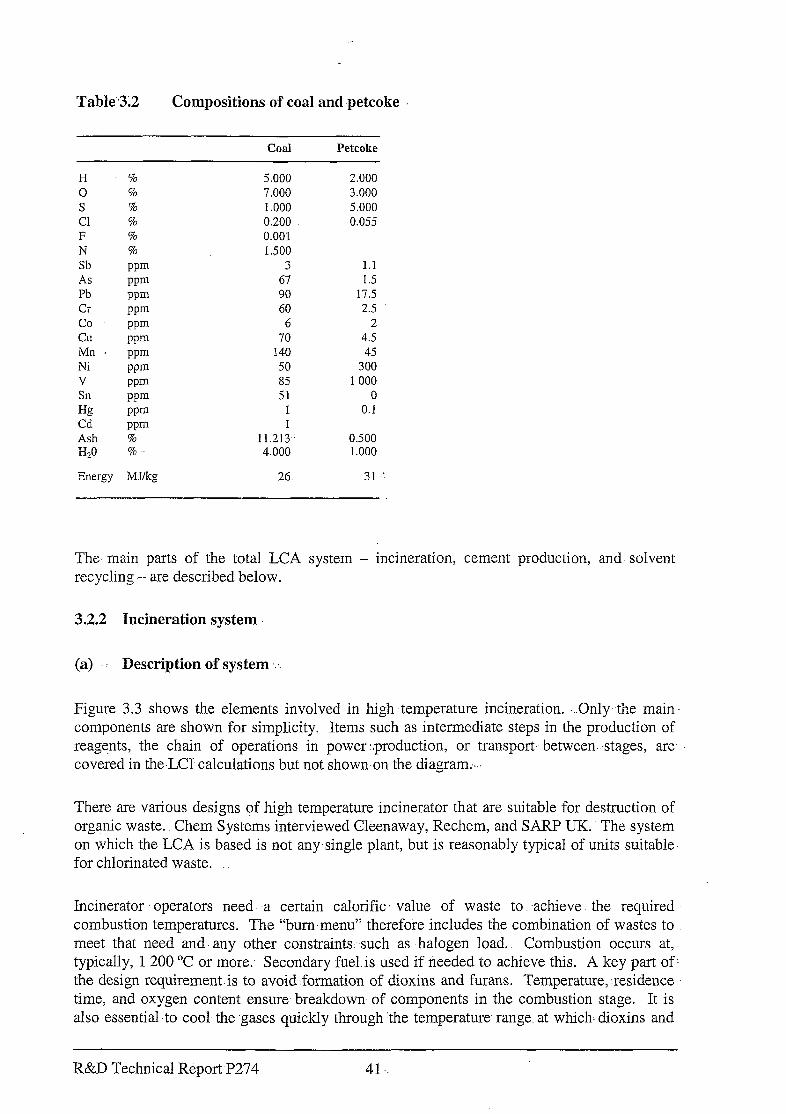
Table ,3;2 Compositions-of coal and petcoke
Coal Petcoke
H 8 5.000 0 % 7.000 S % 1 .ooo Cl % 0.200 F % 0.001 N % 1.500 Sb PPm 3 As mm 67 Pb mm 90 Cl- mm 60 co mm 6 cu ppm 70 Mn mm 140 Ni iw 50 V wm 85 Sn Ppnl 51 Hg wm 1 Cd mm 1 Ash % 11.213.. H,O %‘o- 4.000
Energy MJ/kg 26.
2.000
3.000
5.000
0.055
1.1 1.5
17.5 2.5
2 4.5 45
300 1 000
0 0.1
0.500 1.000
31 ,:
The main parts of the total LCA system - incineration, cement production, and. solvent recycling -- are described below.
3.2.2 Incineration system
(a) Description of system ‘.’
Figure 3.3 shows the elements involved in high -temperature incineration. . ..Only. the main. components are shown for simplicity. Items such as intermediate steps in the production of reagents, the chain of operations in power:.production, or transport between--stages, are covered in the.LCI calculations but not shown on the diagram;..,
There are various designs of high temperature incinerator that are suitable for destruction of organic waste. Chem Systems interviewed Cleenaway, Rechem, and SARP UK. The system on which the LCA is based is not any.single plant, but is reasonably typical of units suitable. for chlorinated waste.
Incinerator operators need a certain calorific. value of waste to .achieve the required combustion temperatures. The “bum menu” therefore includes the combination of wastes to meet that need and any other constraints. such as halogen load.. Combustion occurs at, typically, 1 200 “C or more. Secondary fuel.is used if,needed to achieve this. A key part of. the design requirement is to avoid formation of dioxins and furans. Temperature, residence time, and oxygen content ensure. breakdown- of components in the combustion stage. It is also essential ,to cool the gases quickly through the temperature. range at which: dioxins and
R&D Technical Report P274 41
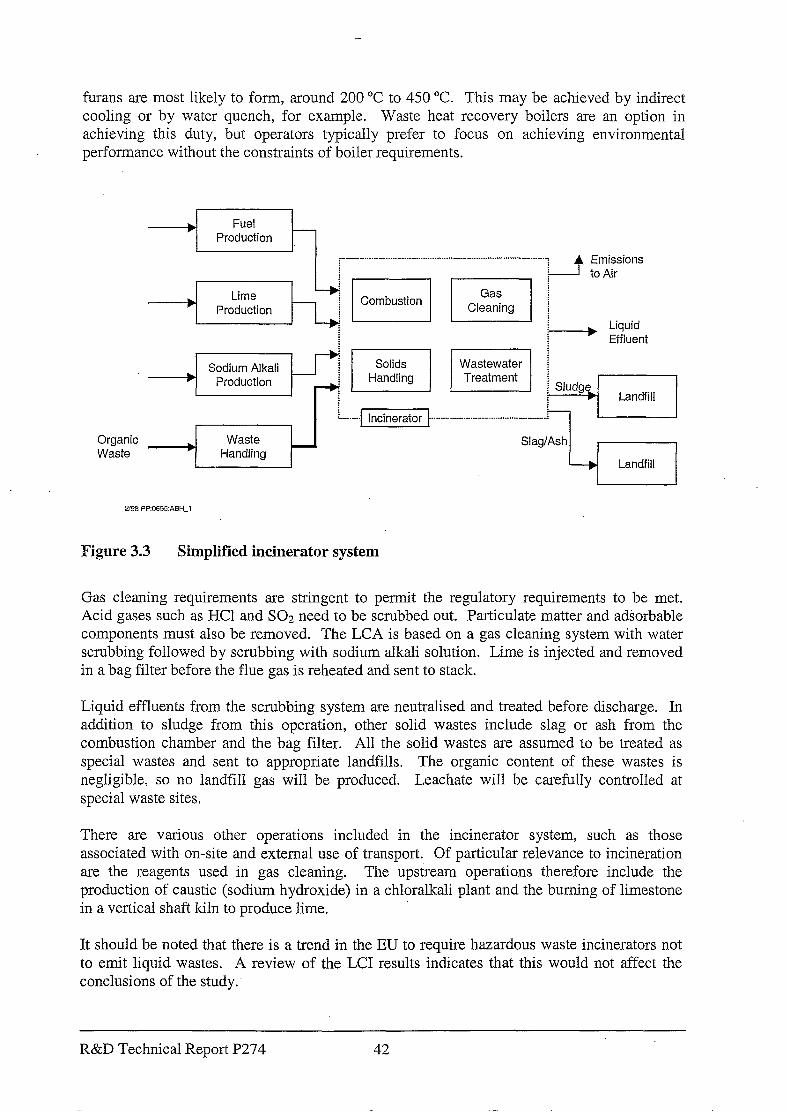
furans are most likely to form, around 200 “C to 450 “C. This may be achieved by indirect cooling or by water quench, for example. Waste heat recovery boilers are an option in achieving this duty, but operators typically prefer to focus on achieving environmental performance without the constraints of boiler requirements.
2’98 ?P:0655:ABH-1
Figure 3.3 Simplified incinerator system
Gas cleaning requirements are stringent to permit the regulatory requirements to be met. Acid gases such as HCl and SO2 need to be scrubbed out. Particulate matter and adsorbable components must also be removed. The LCA is based on a gas cleaning system with water scrubbing followed by scrubbing with sodium alkali solution. Lime is injected and removed in a bag filter before the flue gas is reheated and sent to stack.
Liquid effluents from the scrubbing system are neutralised and treated before discharge. In addition to sludge from this operation, other solid wastes include slag or ash from the combustion chamber and the bag filter. All the solid wastes are assumed to be treated as special wastes and sent to appropriate landfills. The organic content of these wastes is negligible, so no landfill gas will be produced. Leachate will be carefully controlled at special waste sites.
There are various other operations included in the incinerator system, such as those associated with on-site and external use of transport. Of particular relevance to incineration are the reagents used in gas cleaning. The upstream operations therefore include the production of caustic (sodium hydroxide) in a chloralkali plant and the burning of limestone in a vertical shaft kiln to produce lime.
It should be noted that there is a trend in the EU to require hazardous waste incinerators not to emit liquid wastes. A review of the LCI results indicates that this would not affect the conclusions of the study..
R&D Technical Report P274 42
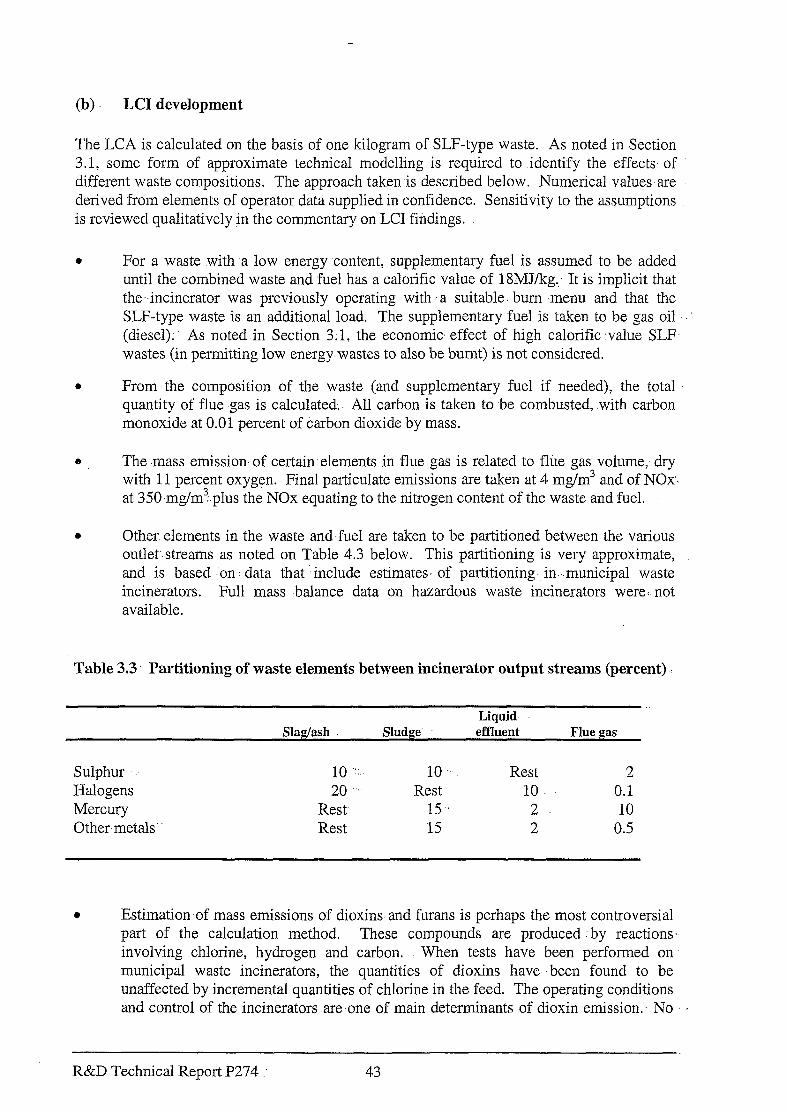
(b) LCI development
The LCA is calculated on the basis of one kilogram of SLF-type waste. As noted in Section 3.1, some form of approximate technical modellin g -is required to identify the effects- of different waste compositions. The approach taken is described below. Numerical values-are derived from elements of operator data supplied in confidence. Sensitivity to the assumptions is reviewed qualitatively in the commentary on LCI findings.
l For a waste .with a low energy content, supplementary fuel is assumed to be added until the combined waste and fuel has a calorific value of 18MUkg: It is implicit that the-.incinerator was previously operating with a suitable. bum menu and that the SLF-type waste is an additional load. The supplementary fuel is taken to be gas oil ” (diesel);. As noted -in Section 3.1, the economic, effect of high calorific :value SLF wastes (in permitting low energy wastes to also be burnt) is not considered.
l From-the composition of the waste (and supplementary fuel if needed), the total quantity of flue .gas is calculated; All carbon is taken to be combusted, .with carbon monoxide at 0.01 percent of carbon dioxide by mass.
e The -mass emission. of certain elements in flue gas is related to flue gas volume,- dry with 11 percent oxygen. Final particulate emissions are taken at 4 mg/m3 and of NOx. at 350~mg/m?plus the NOx equating to the nitrogen content of the waste and fuel.
l Other. elements in the waste and fuel are taken to be partitioned between the various outlet streams as noted on Table 4.3 below. This partitioning is very approximate; and is based ‘on: data that ‘include estimates- of partitioning in. .municipal waste incinerators. Full mass -balance data on hazardous waste incinerators were;.not available.
Table 3.3 Partitioning of waste elements between incinerator output streams (percent)
Slag/ash Sludge. Liquid
effluent Flue gas
Sulphur 10 :I:, 10 ‘. Rest 2 Halogens 20 ” Rest 10 0.1 Mercury Rest. 15 2 10 Other,metals’ Rest 15 2 0.5
l Estimation of mass emissions of dioxinsand furans is perhaps the most controversial part of the calculation method. These compounds are produced by reactions: involving .chlorine, hydrogen and carbon. When tests have been performed on municipal waste incinerators, the quantities of dioxins have -been found to -be unaffected by incremental quantities of chlorine in the feed. The operating conditions and control of the incinerators are.one of main determinants of dioxin emission.. No
R&D Technical Report P274 43
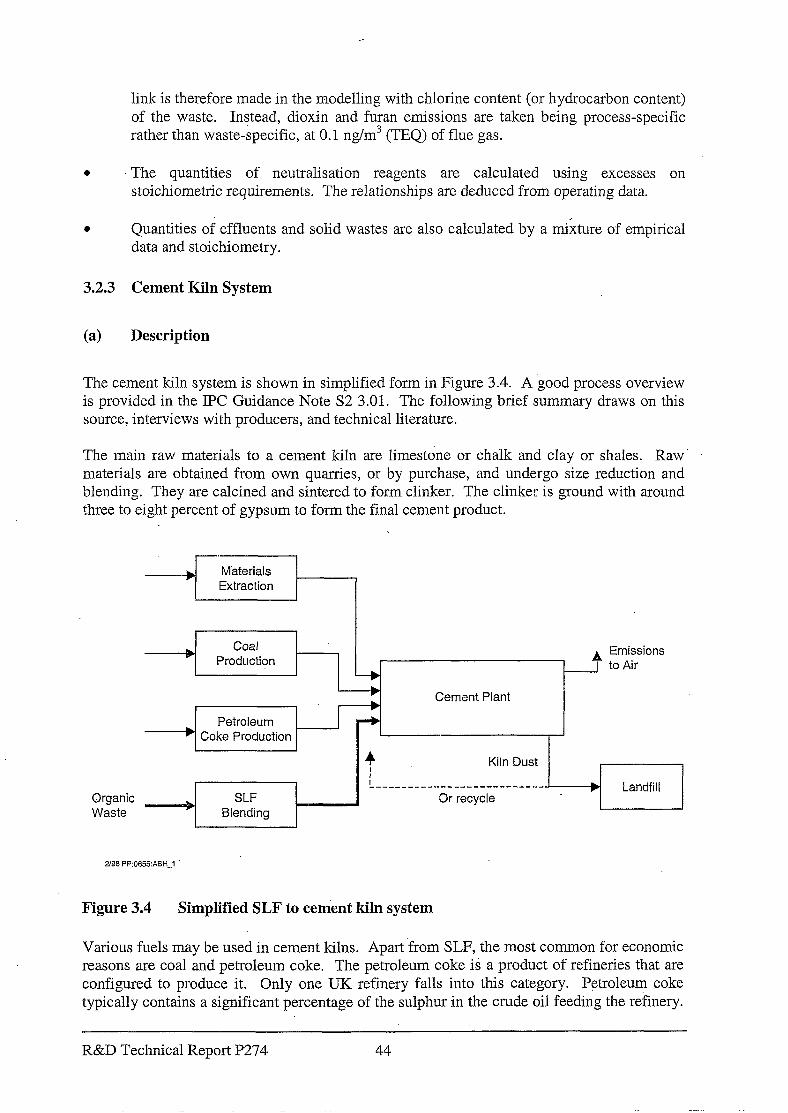
link is therefore made in the modelling with chlorine content (or hydrocarbon content) of the waste. Instead, dioxin and furan emissions are taken being process-specific rather than waste-specific, at 0.1 rig/m’ (TEQ) of flue gas.
l The quantities of neutralisation reagents are calculated using excesses on stoichiometric requirements. The relationships are deduced from operating data.
l Quantities of effluents and solid wastes are also calculated by a mixture of empirical data and stoichiometry.
3.2.3 Cement Kiln System
(a) Description
The cement kiln system is shown in simplified form in Figure 3.4. A good process overview is provided in the IPC Guidance Note S2 3.01. The following brief summary draws on this source, interviews with producers, and technical literature.
The main raw materials to a cement kiln are limestone or chalk and clay or shales. Raw materials are obtained from own quarries, or by purchase, and undergo size reduction and blending. They are calcined and sintered to form clinker. The clinker is ground with around three to ei.ght percent of gypsum to form the final cement product.
Emissions to Air
Petroleum ’ Coke Production
Cement Plant
Organic Waste
? Kiln Dust
I _-_______________---------- b Landfill
b SLF Or recycle
Blending
X8 PP:0655:ABH-1
Figure 3.4 Simplified SLF to cement kiln system
Various fuels may be used in cement kilns. Apart from SLF, the most common for economic reasons are coal and petroleum coke, The petroleum coke is a product of refineries that are configured to produce it. Only one UK refinery falls into this category. Petroleum coke typically contains a significant percentage of the sulphur in the crude oil feeding the refinery.
R&D Technical Report P274 44
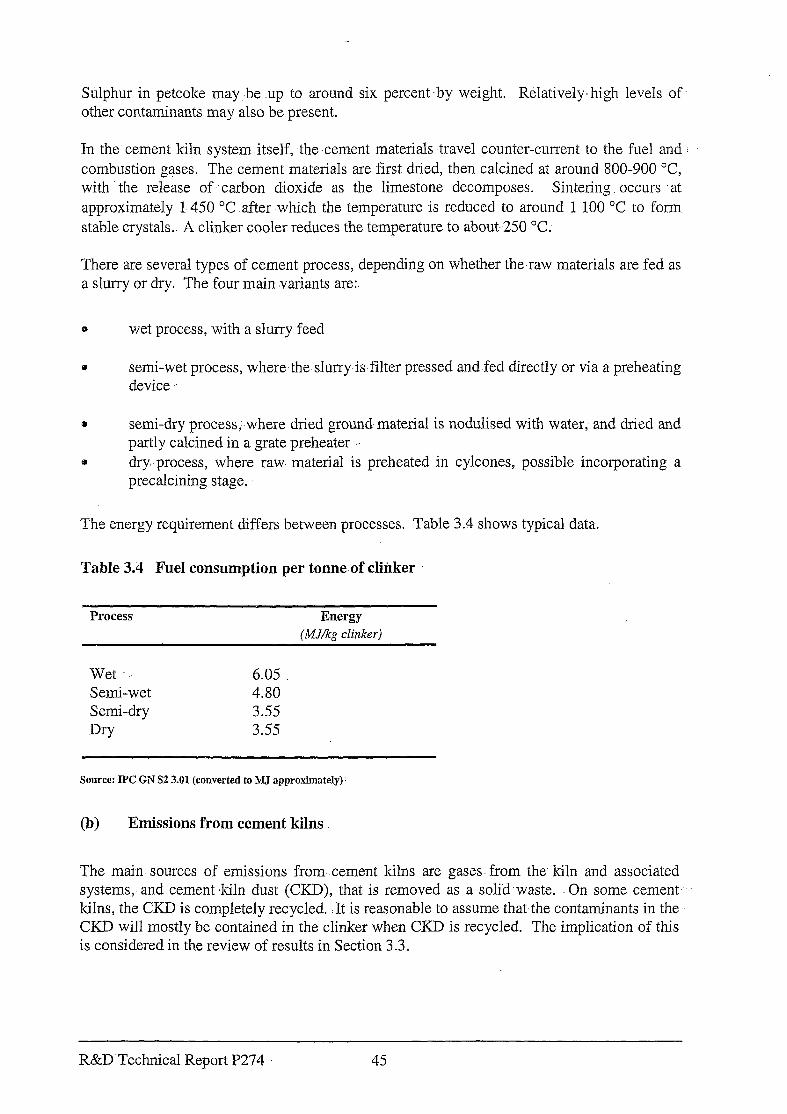
Sulphur in petcoke may be up to around six percent by weight. Relatively- high levels -of. other contaminants may also be present.
In the: cement kiln system-itself, the cement materials travel counter-current to the fuel and : combustion gases. The cement materials are first dried, then calcined at around 800-900 “C, with ‘the release of carbon dioxide as the limestone decomposes. Sintering occurs .at approximately l-450 “C after which the temperature is reduced to around 1 100 “C to form stable crystals. A clinker cooler reduces the temperature to about-250 “C;
There are several types of cement process, depending on whether the-raw materials are fed as a slurry or dry. The four main variants are:
3 wet process, with-a slurry feed
9 semi-wet process, where.the slurry,is filter pressed and fed directly or via a preheating device
3 semi-dry process; where dried ground-material is nodulised with water; and dried and partly calcined in a grate preheater -.
Q dry..process, where raw. material is preheated in cylcones, possible incorporating a precalcining stage.
The energy requirement differs between processes. Table 3.4 shows typical data.
Table 3.4 Fuel consumption per tonne.of clihker
Process Energy (MT/kg clinker)
Wet 6.05 Semi-wet 4.80 Semi-dry 3.55
Dry 3.55
Source: IPC GN S2 3.01 (converted to MJ approximately).
(b) Emissions from cement kilns
The main sources of emissions from .cement kilns are gases from the- kiln and associated systems,, and cement ,kiln dust (CKD), that is removed as a soli.d.waste. On some cement- kilns, the CKD is completely recycled. :It is reasonable to assume that the contaminants in the CKD will mostly be contained in the clinker when CKD is recycled. The implication of this is considered in the review of results in Section 3.3.
R&D Technical Report P274 45
The focus of the SLF study is the impact of changes in fuel composition, not the impact of the total cement production operation. The technical issues are complex and are not easily quantifiable.
Sulphur oxides
Sulphur compounds occur in various forms both in the raw materials and in the fuels. A very large proportion of the sulphur in the fuels is likely to convert to sulphur dioxide (SOz) in the hot part of the kiln. Significant proportions of sulphur in the raw materials will also be converted to gaseous SO?. As the kiln gas moves to the feed end, SO2 will be absorbed.
In a wet process kiln, the reabsorption occurs in the dust cloud and in zones fitted with chains at the wet feed end. The total retention varies with the particular chemistry, operating conditions and design features of the kiln. The total retention may be in excess of 90 percent but could be as low as 70 percent.
Retention is usually higher in a preheater or a precalciner dry process plant. Here, unreacted lime in cyclone preheaters acts as an adsorbent. Sulphur present as sulphides will tend to be released at lower temperatures where free lime content is lower, and so absorption of this material will not be effective. Sometimes, a gas by-pass is operated to avoid problems of choking in the cyclones. This can be a source of high SO2 emissions unless abated.
‘When considering a unit of additional sulphur in fuel, it is reasonable to suggest a sulphur removal efficiently in a preheater/precalciner system of up to, say, 95 percent. For the wet process, scrubbing efficiency (as opposed to the total retention) is less clear. From the Environment Agency report on the Barrington works, an efficiency of less than 70 percent could be inferred. In both cases, it must be recognised that SO2 absorption relies on the natural alkalinity of the raw materials and so there must be some sulphur loading at which .breakthrough would occur.
Nitrogen oxides
Nitrogen oxides produced in cement kilns are primarily thermal NOx rather than those derived from nitrogen in the fuel. Up to 60 percent of fuel in precalciner kilns is burnt in the calciner stage, at temperatures too low for high rates of NOx formation. In the wet process, all fuel is burnt in the sintering zone, at 1 450 “C when NOx will be generated.
Chlorine
Chlorine in the raw materials and the fuels fed to the kiln system can form volatile compounds with metals such as potassium. These can condense or be absorbed in clinker or CKD in cooler parts of the kiln. Empirical data (Burning Hazardous Waste in Cement Kilns, ETI, 1992) suggest that a substantial increase in chlorine content of the fuel will result in increased gaseous emissions of chlorine compounds measured as HCI. However, this does depend upon the total quantity of chlorine entering the kiln. Chlorine content is actually added intentionally to some cement kilns to balance the chemistry. The Environment Agency imposes low chlorine limits (typically 1.5 percent) on blended SLF.
R&D Technical Report P274 46
Metals
rVIetals and their compounds fall into three classes:
l refractory (relatively non-volatile), including barium, beryllium, chromium, arsenic, nickel, vanadium; aluminium, titanium, calcium, iron, manganese and copper
0 semi-volatile, such as antimony; cadmium, lead, selenium, zinc, potassium, and sodium.
e volatile, such as mercury and thallium.
Kiln exhaust gases typically contain under Oil percent of refractory metals and under 0.5 percent of semi-volatile metals-entering the kiln.
However, the presence of chlorine has been shown to influence the emission of semi-volatile. metals,-in tests on SLF usage- (the ET1 report cited above). With-,heavily chlorinated SLF, there is a tendency for increased emissions of lead,and cadmium.for example;
Emissions of volatile’metals such as mercury tend to increase with the content in the fuel;
One further point to note is that the retained metals tend to concentrate in the kiln dust(CKD) : because of the cycle of. volatilisation and condensation. .. Tests on CKD indicate that leachability of metals is very low,. irrespective of the.kiln fuel used: If CKD is recycled, the contaminants will be spread over the mass of the clinker.
Oiganics
The very high temperatures of the sintering zone ensures very high destruction efficiencies of. organic materials, which should be comparable to those in high temperature rincinerators. The “de nova” formation of dioxins. and furans can occur-in a temperature range of around .. 200 “C to 450 “C, as the gases cool. It could be .argued lhat .the residence time in this. temperature ,range is longer for a kiln than an incinerator, -so dioxin formation could be greater. Measurements on the Barringtonworks indicated initially rather high dioxin figures with SLF, which -dropped to very low and consistent levels in later runs. This is taken to reflect the influence of operating conditions as there is no consistent relationship with fuel composition in the tests. In’.practice, the concentration of dioxins in flue gas is similarfor cement kilns and incinerators.
(c) LCI Development .
The calculation of the -LCI for one kilogram of SLF. entering a cement kiln follows very similar principles to those used for incineration.
R&D Technical Report -P274 47
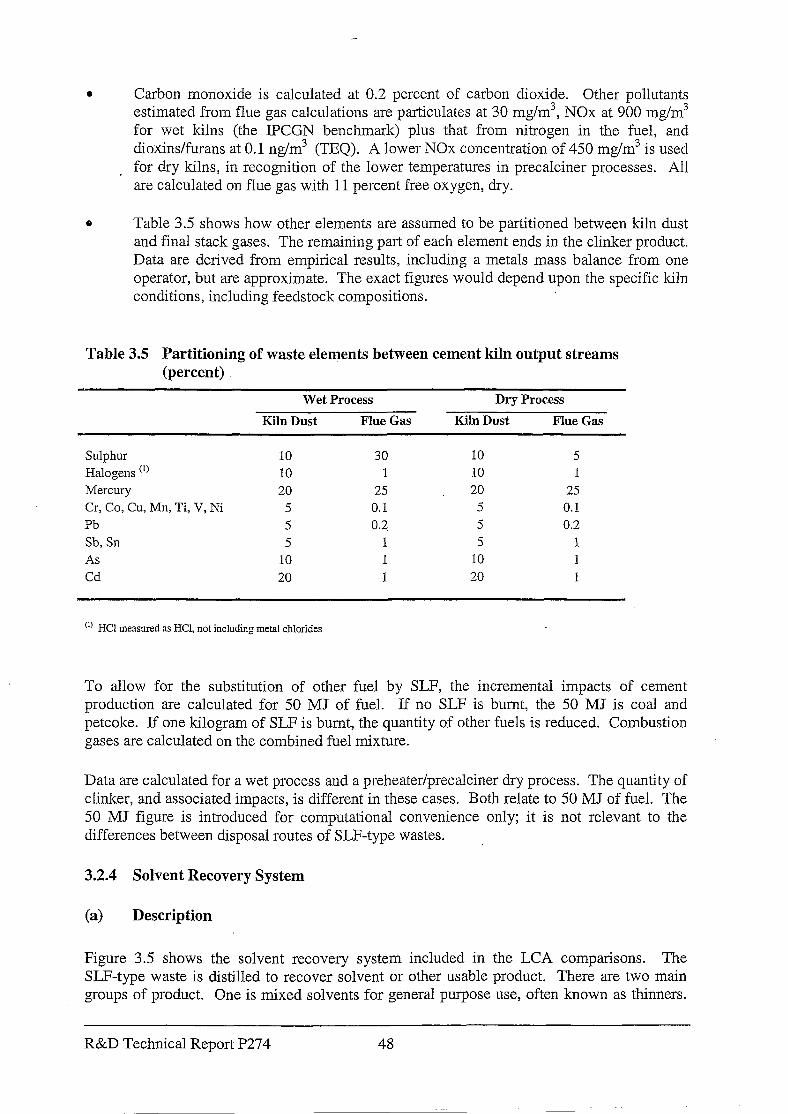
l Carbon monoxide is calculated at 0.2 percent of carbon dioxide. Other pollutants estimated from flue gas calculations are particulates at 30 mg/m3, NOx at 900 mg/m3 for wet kilns (the IPCGN benchmark) plus that from nitrogen in the fuel, and dioxins/furans at 0.1 rig/m’ (TEQ). A lower NOx concentration of 450 mg/ms is used for dry kilns, in recognition of the lower temperatures in precalciner processes. All are calculated on flue gas with 11 percent free oxygen, dry.
e Table 3.5 shows how other elements are assumed to be partitioned between kiln dust and final stack gases. The remaining part of each element ends in the clinker product. Data are derived from empirical results, including a metals mass balance from one operator, but are approximate. The exact figures would depend upon the specific kiln conditions, including feedstock compositions.
Table 3.5 Partitioning of waste elements between cement kiln output streams (percent)
Wet Process Dry Process
Kiln Dust Flue Gas Kiln Dust Flue Gas
Sulphur Halogens (I) Mercury Cr, Co, Cu, Mn, Ti, V, Ni l’b Sb, Sn As Cd
10 10 20
5 5 5
10 20
30 10 5 1 10 1
25 20 25 0.1 5 0.1 0.2 5 0.2
1 5 1 1 10 1 1 20 1
(I) HCl measured as HCI, not including metal chlorides
To allow for the substitution of other fuel by SLF, the incremental impacts of cement production are calculated for 50 MJ of fuel. If no SLF is burnt, the 50 MJ is coal and petcoke. If one kilogram of SLF is burnt, the quantity of other fuels is reduced. Combustion gases are calculated on the combined fuel mixture.
Data are calculated for a wet process and a preheater/precalciner dry process. The quantity of clinker, and associated impacts, is different in these cases. Both relate to 50 MJ of fuel. The 50 MJ figure is introduced for computational convenience only; it is not relevant to the differences between disposal routes of SLF-type wastes.
3.2.4 Solvent Recovery System
(a) Description
Figure 3.5 shows the solvent recovery system included in the LCA comparisons. The Z&F-type waste is distilled to recover solvent or other usable product. There are two main groups of product. One is mixed solvents for general purpose use, often known as thinners.
R&D Technical Report P274 48
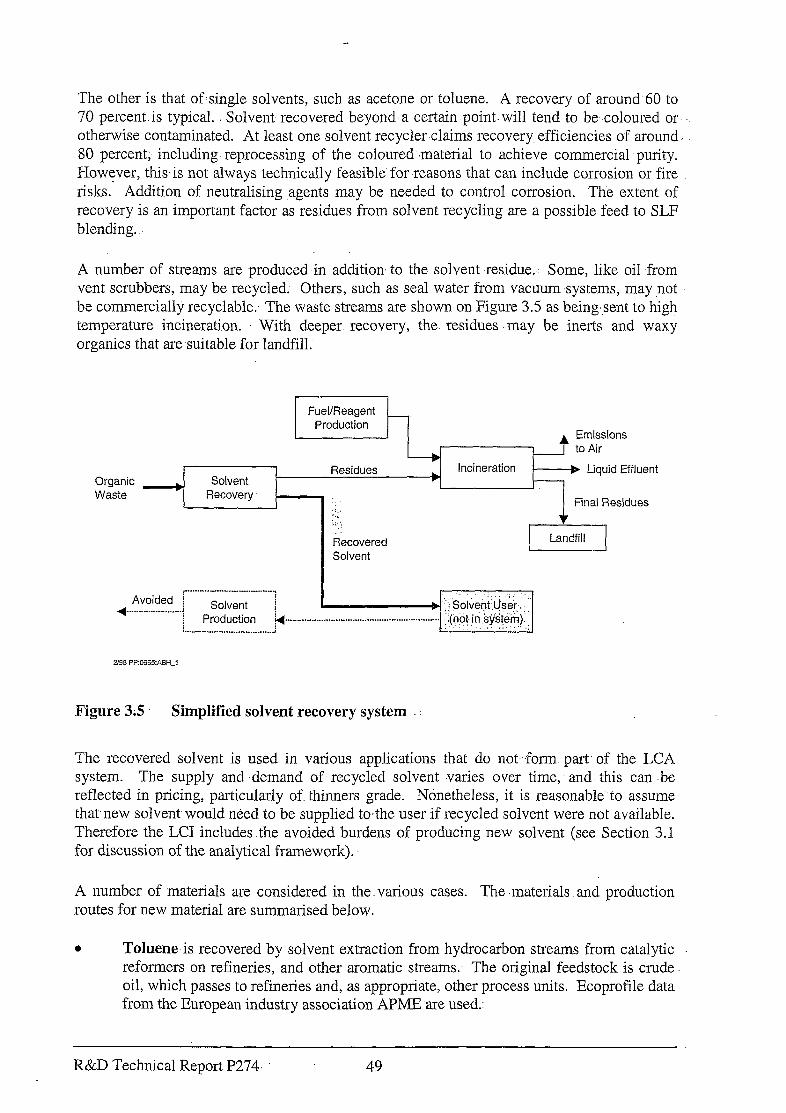
The other is that of-single solvents, such as acetone or toluene. A recovery of around 60 to 70 percent. is typical. Solvent recovered beyond a certain point. will tend to be. coloured or otherwise contaminated. At least one solvent recyclerclaims recovery. efficiencies of around 80 percent; including reprocessing of the coloured ,material to achieve commercial purity. However, this-is not always technically feasible’ for reasons that can include corrosion or fire risks. -Addition of neutralising agents may be needed to control corrosion. The extent of recovery is an important factor as residues from solvent recycling are a possible feed to SLF blending.
A number of streams are produced in addition. to the solvent residue.-: Some, like oil -from vent scrubbers, may be recycled. Others, such as seal water from vacuumsystems, may .not be commercially recyclable.- The waste streams are shown on Figure 3.5 as being,sent to high temperature incineration. With deeper. recovery, the. residues may be inerts and waxy organics that are-suitable for landfill.
Fuel/Reagent _ Production
Emissions to Air
Organic Waste
Solvent ’ Recovery
Residues
‘..
Incineration b Liquid Effluent
Final Residues
k&covered Solvent
Figure 3.5 Simplified solvent recovery system :
The recovered solvent is used in various applications that do not form part of the LCA system. The supply and demand of recycled solvent varies over time, and- this can -be reflected in pricing, particularly of thinners grade. Nonetheless, it is reasonable..to assume that new solvent-would need to be supplied tosthe user if recycled solvent were not available. Therefore the LCI includes .the avoided burdens of producing new solvent (see Section 3.1 for discussion of the analytical framework).
A number. of materials are considered in the. various cases. The .materials and production routes for new material are summarised below.
l Toluene-is recovered by solvent extraction from hydrocarbon streams from catalytic reformers on refineries, and other aromatic streams.- The original feedstock is crude oil, which passes to refineries and, as appropriate, other process units. Ecoprofile data from the European industry association APMEare used:
R&D Technical Report P274. 49
l Acetone is produced mainly as a co-product with phenol. The main feedstocks to the production of phenol and acetone are propylene and benzene, with cumene as an intermediate. Chem Systems’ in-house data are used for this step. Propylene is one
. of the products from the steam cracking of naphtha and other hydrocarbons. Benzene is produced by several processes, including extractive distillation of another product stream from steam cracking. APME data are used for the production of propylene and benzene starting with crude oil.
0 Trichloroethylene is typically produced on integrated complexes where ethylene and chlorine are used primarily to manufacture ethylene dichloride (EDC) and VCM. Chem Systems’ data are used for the production of trichloroethylene itself, and APME data for upstream steps.
v Methanol is produced by the manufacture of synthesis gas from natural gas, followed by catalytic synthesis. Chem Systems’ in-house data are used for the LCI.
One of the hypothetical waste streams is an oily waste, such as used lube oil. In the UK, the most common form of recovery is by light processing and use as fuel. The process involves settling, aided by chemicals and warming, with disposal of sludge. Recovered fuel is typically used to dry limestone or hard rock for roadstone production, instead of gas oil. In the LCI, this is treated as a sub-set of incineration where the SLF is a substitute for usual fuel (see Section 3.5.4).
(b) LCI Development
In the case considered, the solvent residues are sent to incineration. To analyse this, the composition of the residue is calculated assuming that substantially all the unwelcome components remain in the residue. The incineration model is then run using this composition.
Data for the recycling process and supporting transport and other elements are taken from information supplied by operating companies.
3.3 Life Cycle Inventory Results
3.3.1 Incineration and SLF to Cement Kilns
The Life Cycle Inventory data are expressed in units of mass per kilogram of SLF waste. The data are calculated back to show total mass of coal extracted from the environment, for example, and total emissions from the full system considered. Operations such as power generation are included, so that use of materials and emissions associated with all operations in the systems are in the inventory. This explains the presence on the inventory tables of some burdens that may not be associated with the core disposal options.
R.&D Technical Report P274 50
It is important to note that the systemscompared are defined in a way that permits the differences between the disposal routes for waste to be identified... For example, the cement. kiln. impacts included in each system are those corresponding to the consumption of 50 MJ of fuel. This is to permit the displacement of conventional fuel with SLF of differing energy contents to be considered:. The absolute values of burdens of each system are therefore not of primary importance. For definition of Systems I to III, see Section 3.1.
The LCI results for.a comparison between incineration (System I) and SLF’ in a cement kiln:. (System It) are shown in -Table 3.6. The data are based on a wet process cement kiln. System I includes a cement kiln using conventional.fuel only. If the differences are positive, or if System II impacts are lower than 100 percent of System 1: then there is an advantage in the SLF route.
The basis of the numerical values in Table 3.6 may not- be obvious. The .following points may be of assistance.
0 The absolute.values of environmental burdensfrom the cement kiln relate,to 50 MJ of cement kiln fuel (see above) while those for the incinerator are for one kilogram of SLF-type waste. The absolute values relating to the cement kiln are therefore systematicaIly higher. than for the incinerator.
0 The cement kiln data include the combustion of some conventional fuels - coal and ‘. petcoke -- even when SLF is also burnt. The emission.of SOZ, for example, from burning SLF-type,:waste cannot .be directly compared for an incinerator and cement kiln by examining absolute values in the table: the difference is the importance figure..
e Data in Table 3;6 include those relating to auxiliary operations within the system. For. example, the. total cement kiln system includes the processing operations necessary to ‘: i produce petcoke. Power generation and production of transportfuel are also included. Emissions may be .significantly higher from the system than from the cement kiln itself:. This explains the presence of emissions to water in the cement kilnsystem, and relatively high levels of hydrocarbon emissions to air, for example..
R&D Technical Report P274 51
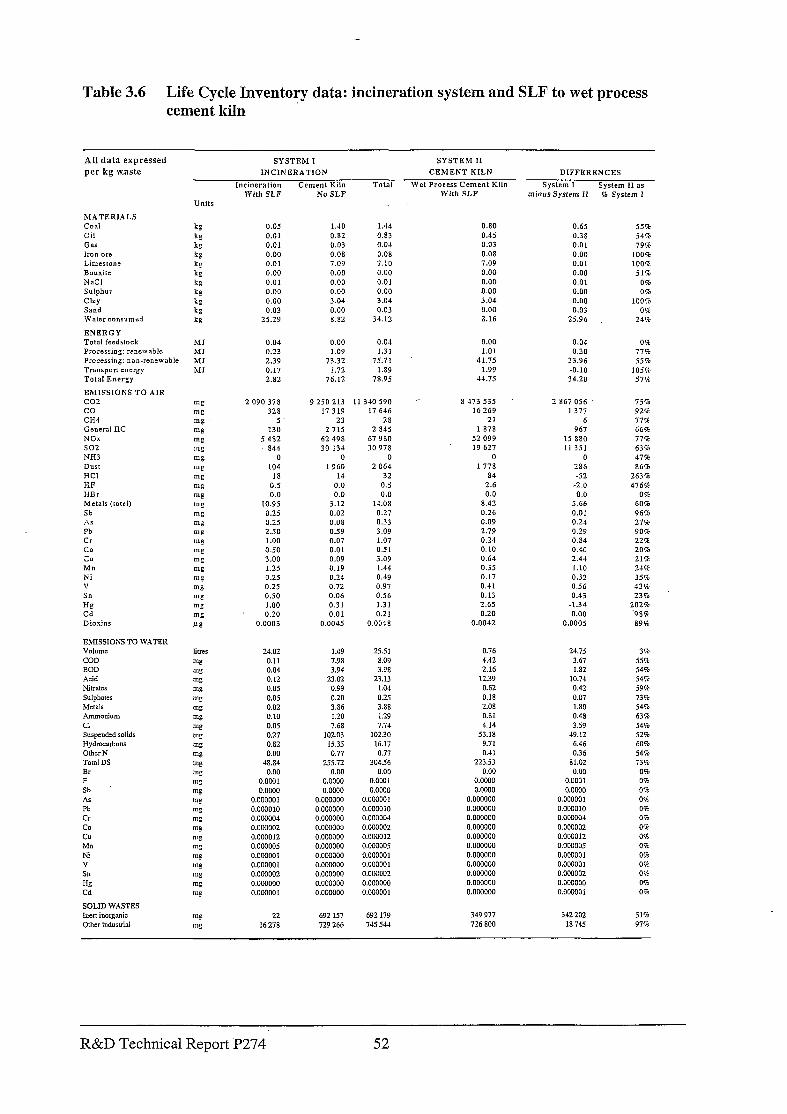
Table 3.6 Life Cycle Inventory data: incineration system and SLF to wet process cement kiln
All data expressed
per kg w.aste
SYSTEM 1 SYSTEM II
INClNERATlON CEMENT KILN DIFFERENCES
incinerstion Cement Kiln Total Wet Process Cement Kiln System I System II as With SLF No SLF With SLF minus System II 5 System I
0.05 0.01 0.01 0.00 0.01 0.00 0.01 0.00 0.00 0.03
25.29
1.40 1.44 0.82 0.03
0.83 0.04
0.08 0.08 7.09 7.10 0.00 0.00
0.00 0.01 0.00 0.00 3.04 3.04
0.00 0.03
8.82 34.12
0.80 0.45 0.03
0.08 7.09 0.00 0.00 0.00 3.04
0.00 8.16
0.65 55% 0.38 54%. 0.01 79% 0.00 100% 0.01 100% 0.00 .il% 0.01 05% 0.00 0% 0.00 1005% 0.03 0%
25.96 24%
0.04
0.23 2.39
0.17 2.82
0.00 1.09
0.04 1.31
73.32 75.71
1.72 1.89
76.12 78.95
0.00 0.04 0% 1.01 0.30 77%
41.75 33.96 55% 1.99 -0.10 105%
44.75 34.20 57%
2 090 378 328
5 li0
5 482 a44
0 104
la 0.5 0.0
10.95 0.25 0.25 2.50 1 .oo 0.50
3.00 1.25 0.25
0.25
0.50 1 .oo 0.20
0.0003
9250213 11340590 8 473535
17319 17 646 16269
23 2 715
62498 30134
0
1960 14
0.0 0.0
3.12 0.02 0.08 0.59 0.07
0.01 0.09 0.19 0.25 0.72 0.06
0.3 1 0.01
0.0045
28 2845
67980
30 978 0
2064
21 1878
32
0.5 0.0
14.08 0.27 0.33 3.09
1.07
52099
I9 627 0
1778 84
2.6
0.0
8.42 0.26
2 867056
1377 6
967
15 880 11351
0 286 -52
-2.0
0.0
0.09 2.79
5.66
0.01
0.51 3.09
0.24 0.10 0.64
0.24 0.29 0.84
1.44
0.49
0.97
0.35
0.17
0.40 2.44
0.56
1.31
0.41 0.13 2.65
1.10 0.32
0.56 0.43
-1.34 0.21 0.20 0.00
O.OG48 0.0042 0.0005
75%
97-P
77% 66%
77% 63%
47%
86% 263% 476%
OS
60%
96% 27%
90% 2252
20% 21%
24% 35%
53% 238
202% .9ack a9’;z
24.02 1.49 0.11 7.98 0.04 3.94 0.12 23.02
0.05 0.99
O.Oi 0.20
0.02 3.86 0.10 1.20 0.05 7.68 0.27 10103
0.82 15.35 0.00 0.77
48.84 255.72
0.00 0.00
O.OWl o.ooQo
0.0 0.0000 0.000001 o.oooGo4
0.000010 o.oooooo o.oowo4 o.ocm3oo
o.owoo2 0.000003
o.owo12 0.000000 O.OOQOO5 o.ooQoQo
0.000001 o.owwo
o.oomo1 o.omoo
0.000002 o.oooooo
0.000000 o.ooawo
0.000001 o.oomoo
25.51 8.09
3.98 23.13
l.oj 0.X 3.88 1.29
1.74
102.30 16.17
0.77 304.56
0.00 o.ow 1 o.owo
o.ooooo1 o.oGQo1o
0.76
4.42
2.16 12.39
24.75 3.67
0.62 0.18
I.82 10.74
2.08 0.81
4.14 53.18
9.71 0.41
223.53
0.00 0.0000
0.0000 0.000040
0.42
0.07 i.ao
0.48
3.59
49.12 6.46
036 81.02
0.00 0.0001 o.owo
o.owoo1
0.000004
O.Owm2 o.oooo12 0.00+X05 0.000001 0.000001 o.occoo2 o.ooQooo 0.0w001
o.oooooo 0.000000 0.000000 0.000000 0.000000 0.000000 0.000000 o.ooaloo
o.ocoo1o 0.000004 o.owoo2
o.offio12 O.OWOOS 0.000001
0.000000 0.000000
0.000001 o.oww2
0.000000 0.00300I
3% 55%
544
54% 59%
73% 5Ec
63%
54%
i2Cn 60% 54%
73%
0% 0%
0%
0% Or,
Or,
0% 00 0%
0%
OR 0%
0% 0%
22 692157 692 179 349 977 342202 51%
16278 129266 745544 726800 la 14j 97%
MATERIALS Coal Oil Gus Iron ore
NaCl Sulphur Clay Snnd Water c~nrumcd
ENERGY Total feedsrock Processing: rrncwablc Processing: nan-rcnewsblc Tr2lnsprxt energy Total Energy
EMISSIONS TO AIR co2 co CH4 Gcncral HC NOx so2
NH3 Dust HCI HF HBr Metals (total) Sb ,A P Pb Cr CO zu rvlll Xi V Sn
H8 Cd Dioxinr
EMISSIONS TO WATER V0l”lll.Z
COD BOD Acid Nitrates Sulpharcs Metals Ammonium Cl Surwcndsd solids Hydrocarbons OtbcrN Total DS Br F Sh AS Pb Cr CO CU ,&In Ni ” Sn
a Cd
SOLID WASTES Inen inorganic Other industrial
R&D Technical Report P274 52
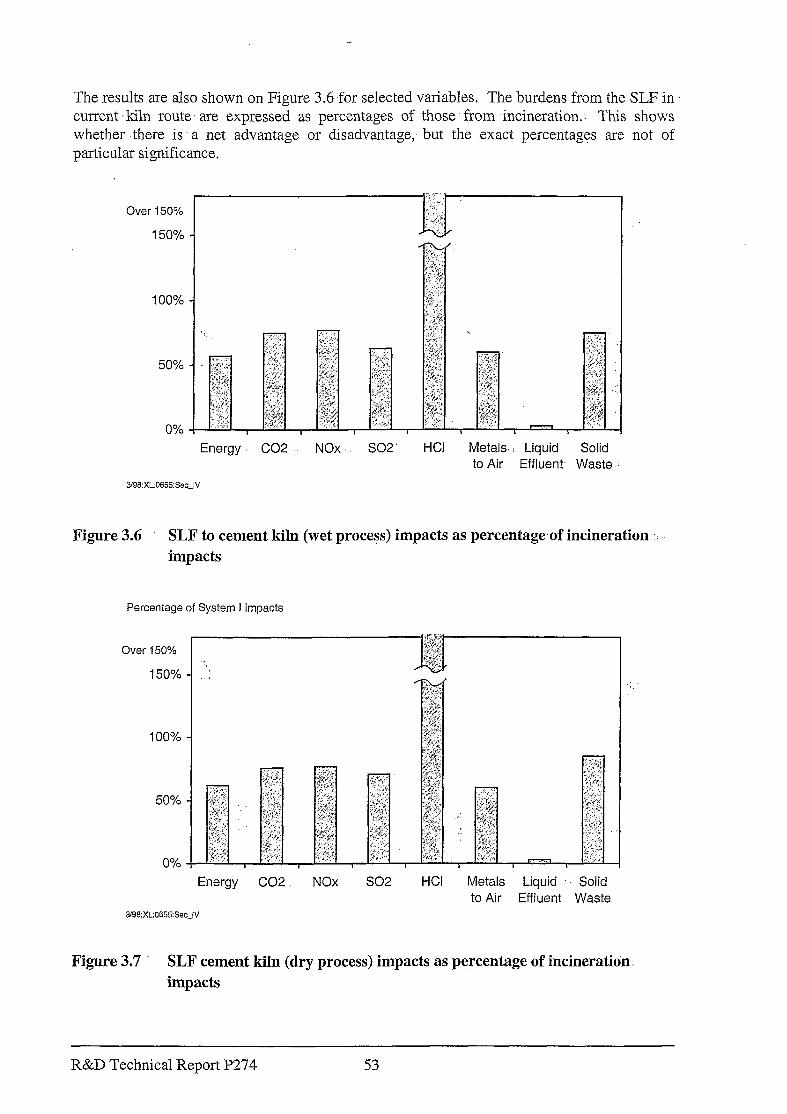
The results are also shown on Figure 3.6 .for selected variables. The burdens from the SLF in ‘ current ‘kiln- route are expressed as percentages of those from incineration.. This shows whether there is a net advantage or disadvantage,- but the exact percentages are not of particular significance.
Over 150%
150% -
Energy. CO2
3/96:Xw665:Sec~lV
NOx so2 HCI Metals. I Liquid Solid
to Air Effluent- Waste . .
Figure 3.6 SLF to cement kiln (wet proce!s) impacts as percentage.of incineration ‘. impacts
Percentage of System I impacts
Over 150% . .
150% ‘.
I
100%
50%
0%
Energy co2. NOx so2 HCI Metals Liquid Solid
to Air Effluent Waste 396:XL:0655:SecJJ
Figure 3.7 SLF cement kiln (dry process) impacts as percentage of incineration. impacts
R&D Technical Report P274 53
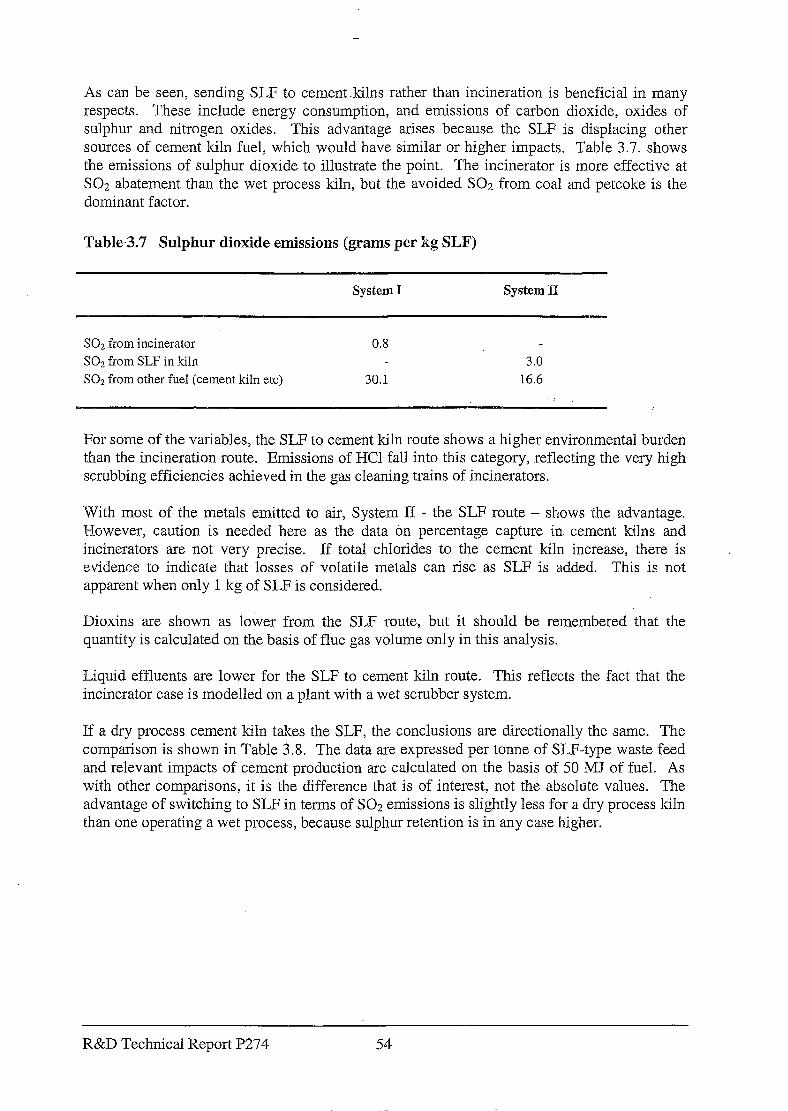
As can be seen, sending SLF to cement kilns rather than incineration is beneficial in many respects. These include energy consumption, and emissions of carbon dioxide, oxides of sulphur and nitrogen oxides. This advantage arises because the SLF is displacing other sources of cement kiln fuel, which would have similar or higher impacts. Table 3.7. shows the emissions of sulphur dioxide to illustrate the point. The incinerator is more effective at SO2 abatement than the wet process kiln, but the avoided SO2 from coal and petcoke is the dominant factor.
Table-3.7 Sulphur dioxide emissions (grams per kg SLF)
System I System II
SO2 from incinerator 0.8 SO2 from SLF in kiln 3.0 SOI from other fuel (cement kiln etc) 30.1 16.6
For some of the variables, the SLF to cement kiln route shows a higher environmental burden than the incineration route. Emissions of HCl fall into this category, reflecting the very high scrubbing efficiencies achieved in the gas cleaning trains of incinerators.
With most of the metals emitted to air, System II - the SLF route - shows the advantage.. Wowever, caution is needed here as the data on percentage capture in. cement kilns and incinerators are not very precise. If total chlorides to the cement kiln increase, there is evidence to indicate that losses of volatile metals can rise as SLF is added. This is not apparent when only 1 kg of SLF is considered.
.
Dioxins are shown as lower from the SLF route, but it should be remembered that the quantity is calculated on the basis of flue gas volume only in this analysis.
Liquid effluents are lower for the SLF to cement kiln route. This reflects the fact that the incinerator case is modelled on a plant with a wet scrubber system.
If a dry process cement kiln takes the SLF, the conclusions are directionally the same. The comparison is shown in Table 3.8. The data are expressed per tonne of SLF-type waste feed and relevant impacts of cement production are calculated on the basis of 50 M.J of fuel. As with other comparisons, it is the difference that is of interest, not the absolute values. The advantage of switching to SLF in terms of SO;! emissions is slightly less for a dry process kiln than one operating a wet process, because sulphur retention is in any case higher.
R&D Technical Report P274 54
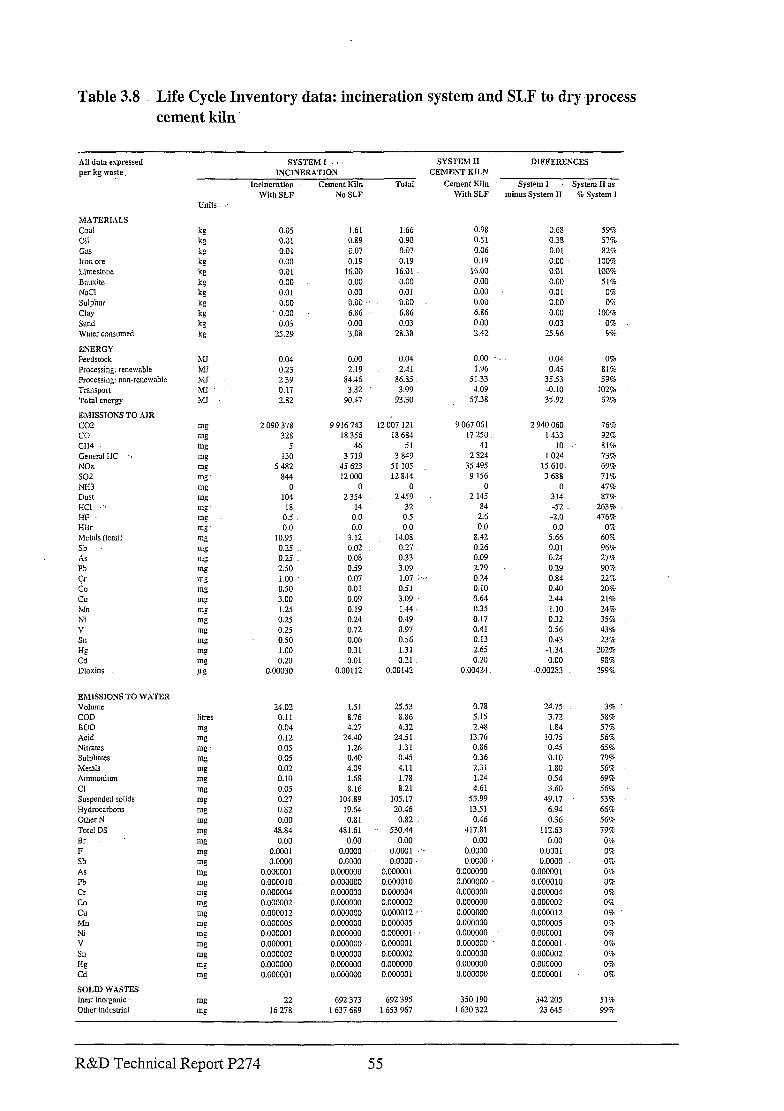
Table 3.8 Life Cycle Inventory data: incineration system and SLF to dry-process cement kiln.
All data expressed
perk: waste
MATERIALS
COZI Oil
Gns
Iron ore Limestone
BXUXite
NKI
Sulghui
my
Sand Water consumed
ENERGY
Feedstock Processing: rencwab!e
PmcEssing: non-renewable
T;ar&&!part
Total energy
EMISSIONS TO AIR
co2 CO
CH4 GcnenlHC
NO?.
so2
NII3 DUG
HCI ,‘:
Hl-
HI% Metals (1mtnl)
Sb
As P5
CT co cu
bhl Ni
v
SII
H?Z Cd
I)ioxios
EMlSSlONS TO WATER VOIWIK
COD
BOD Acid
Nitrates Sulphates
Metals Ammoninm
Cl Suspended solids
Hydroczrbons
Other N
Total DS
Br
F Sb
AS
Pb
Cr CO
CU
:&In Ni V
Sll
HE Cd
SOLID WASTES hen inorganic
Other industrial
SYSTEM I : . SYSTEM II DIFFERENCES
INCINERATION CEMENT KILN
Incineration Cement Kiln
With SLF No SLF
Total Cement Kiln System I Svstem II as
With SLF minu; System II 70 System I
o.oi 1.61 1.66 0.98
0.01 0.89 0.90 0.51
0.01 2.07 0.07 0.06
0.00 0.19 0.19 0.19
0.01 16.00 16.01 16.00
0.00 0.00 0.00 0.00
0.01 0.00 0.01 0.00
0.00 0.00 0.00 0.00
0.00 6.86 6.86 6.86
0.03 0.00 0.03 0.00
25.29 3.08 28.38 2.42
0.68 5970
0.38 i7%
0.01 82%
0.00 100%
0.01 100%
0.00 517G
0.0 1 OI 0.00 0%
0.00 :cm
0.03 0%
X.96 9%
0.04 0.00 0.04 0.00 0.04 0%
0.23 2.19 2.41 1.96 0.45 81%
2.39 84.46 86.85 51.33 35.53 i970
0.17 3.82 3.99 4.09 -0.10 102%
2.82 90.47 93.30 57.38 3i.92 62%
2 090 378 9916743 12007 121 9 067 061 2 940 060
328 18 356 18 684 17 750 1433
5 46 51 41 10
130 3719 3 849 2 524 1 024
5 482 45 623 51 1oi 35 495 15 610
844 120w 12844 9 Ii6 3 688
0 0 0 0 0
104 2 354 2459 2 145 314
18 14 32 84 32
0.5 0.0 0.i 2.6 -2.0
0.0 0.0 0.0 0.0 0.0
10.95 3.12 14.08 8.42 5.66
0.25 0.02 0.27 0.26 0.01 0.25 0.08 0.33 0.09 0.24
250 oi9 3.09 2.79 0.29
1.00 0.07 1.07 ‘.’ 0.24 0.84 0.50 0.01 0.5 1 0.10 0.40
3.00 0.09 3.09 0.64 2.44
1.25 0.19 !.44, 0.35 1.10
0.3 0.24 0.49 0.17 032
0.25 0.72 0.97 0.41 056
0.50 0.06 0.56 0.13 0.43
1.00 0.3 I 1.31 2.6i -1.34
0.20 0.01 0.21 0.20 0.00
0.00030 0.00112 0.00142 0.00424. -0.00283
76% 92%
81%
73 92 69%
71%
47% 87%
263% 4?61
0% 60%
96% 27% 90%
22%
20% 21%
247c
35%
43 % 23%
202%
98% 299%
24.02 1.51
0.11 8.76
0.04 4.27 0.12 24.40
0.05 1.26
0.05 0.40
0.02 4.09
0.10 1.6s
O.Oi 8.16 0.27 104.89
0.82 19.64
0.00 0.8 1
48.84 481.61
0.00 0.00
0.0001 o.occo
o.oocQ o.ocm
o.ccuoo1 o.ccoooo
0.000010 0.000000
o.ooow4 0.000000 0.000002- 0.000000
0.000012 o.woooo
o.ooooc5 0.000000 O.OccWI 0.000000
o.ooow1 0.000000
0.M10002 o.caoooo
o.oowal 0.000000
0.000001 o.ooococ
2z.53 0.78
8.86 5.15
4.32 2.48
24.i 1 13.76
1.31 0.86
0.45 0.36
4.11 2.3 1 1.78. 1.24
8.21 4.61
105.:7 55.99
20.46 13.51
0.82 0.46 i30.44 417.81
0.00 0.W
0.0001 .” 0.0000
0.0000 0.0000
0.000001 0.000000 0.000010 o.oocooo
0.060004 o.oooocc
0.000002 o.oocQoo
0.000012 o.oooooo
o.oowo5 0.000000
o.calOo1- o.ocQooo 0.000001 0.000000
0.000002 o.ooocoo
0.000000 0.000000
0.000001 0.000000
24.75 3%
3.72 i8%
I .a4 ii%
10.75 i68 0.4i 65%
0.10 79%
1.80 56% 054 69%
3.60 56%
49.17 53%
6.94 66%
0.36 56F 112.63 797c
0.00 0% 0.0001 OR
0.0000 0%
0.000001 0% 0.000010 0s
o.ooow4 0%
0.000002 0% 0.000012 0%
0.000005 0%
0.000001 0% 0.000001 0%
0.000002 0%
0.000000 0%
o.oooM)1 0%
22 692 373 692 395 3iO 190 342 205 51%
16 278 1637 689 1653 967 1630 322 23 645 99%
R&D Technical Report P274 55
Waste variants
The comparison of incineration and SLF above is based on the typical SLF composition shown in Table 3.1. A number of other cases are also considered, with various compositions. These cases are analysed for two reasons. Firstly, the environmental costs and benefits of recycling various solvent materials are examined. Secondly, the impacts of other factors, such as sulphur content, are also considered. In practice, there is some inter-relationship between the different components in a cement kiln and this affects emissions. However, this applies to the total loading in the kiln: not to the individual small parts of fuel load considered in the LCI. The interaction between components is therefore not modelled and comments on their influence are given elsewhere.
A wet process cement kiln is the basis of these comparisons.
Hydrocarbon waste
The hydrocarbon-based waste is taken to consist of toluene with other components. A high sulphur level of 2.5 percent is included. This waste is an example of a high calorific value waste. Other composition details are given on Table 3.1; the metal content is taken as being low.
Life Cycle Inventory results are presented in Table 3.9. For System III, the impacts of reprocessing and disposal of residue to incineration are shown. The environmental burdens associated with the production of new toluene are shown as negative because they are avoided if recycled toluene is used instead. The negative figure is the difference between the burdens of systems with and without recycling. A solvent recovery of 65 percent is used in the calculation. The cement kiln using coal and petcoke is included in System IlI and System I, incineration, as in the other comparisons.
The results show a consistent environmental advantage of recycling over incineration. In several instances, however, the benefits of using SLF are higher than those of recycling. This is due to the displacement of other cement kiln fuels compared to the relatively small burdens of producing new toluene to replace that recycled. In addition, many of the atmospheric pollutants in the recycling case arise from incineration of the residues, and for non-hydrocarbon materials are essentially the same as those from incineration of the total waste. Figure 3.8 shows the relationship in graphical form.
The results would be similar for recovery of general solvents - thinners - which can be taken as replacing white spirits or other petroleum cuts.
R&D Technical Report P274 56
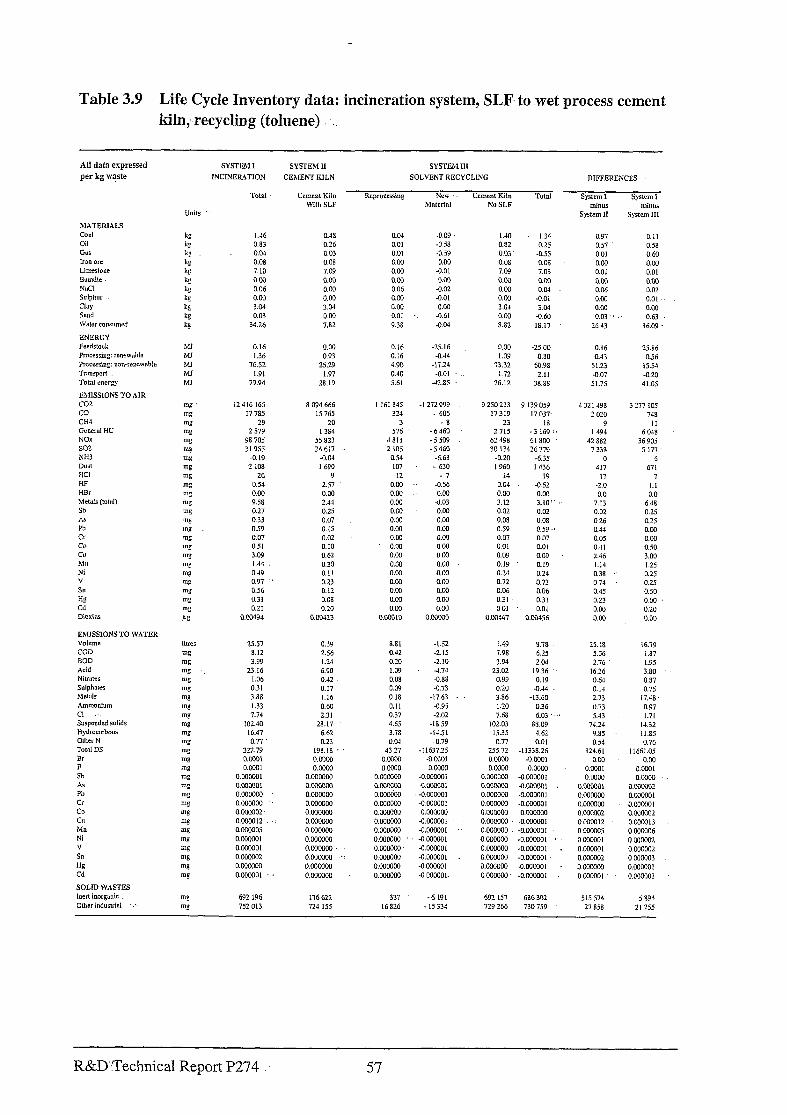
Table 3.9 Life Cycle Inventory data: incineration system, SLF. to wet process cement kiln; recycling (toluene) . . .
SYsrEM 1 SY~EhlII
INCINER\TION CELlEN,- KILN
Cement Kiln with SLF
SY.VEAl 111
SOLYEhT RECYCLING DIFFERENCES
Rqmmrsing NW Cmmt Kiln TlXd System 1 System I No SLF
126 0.48 0.04 d.W
0.83 0.26 0.01 -0.58
0.03 003 0.01 -3.59 0.08 0.08 0.w 0.00
7.10 7.09 0.00 -0.01
0.W 0.00 0.M 0.00
0.06 0.03 0.06 -0.02
0.w 0.00 0.00 -0.01
3.04 3.04 0.30 0.W 0.03 0.00 0.0, -0.61
34.26 7.82 9.38 -0.04
I.40 .. I.3 o.s2 0.2S 0.03 -0.55 0.08 0.08
7.09 7.08 0.W 0.0 0.00 0.04
O.Pi 3.57 0.0, 0.w
0.00 -0.01 3.0: i.04 0.00 -0.60 8.82 18.17
0.01 0.01 0.W 0.W 0.06 0.02 0.w 0.01 .. 0.W 0.00
0.0: L 0.63 26 43
0.16 0.00 0.16 -25.16 1.36 0.93 O.L6 -0.44
76.52 25.?9 4.90 -,,a4
1.91 1.97 0.40 -0.0,
79.94 25.19 5.61 -12.8.F
000 -25 00 I.09
x.32 1.72
76.12
o.so 60.98
2.1,
38.88
0.16 25.16 0.43 0.56
51.23 15.54 -0.07 -0.20
51.75 41.05
12416 165 s w.4 666 17 785 15 765
29 20 2 879 L3SJ
98 705 55 823
31955 24 6i7 4.19 -0.04
2 108 1 690 26 9
0.54 2.57 0.w 0.00 9.58 2.44 0.27 0.25 0.33 0.07 0.59 0.07 0.5, 3.09 1.4, 049 0.97 O.Xi 0.3, 0.21
0.00494
0. IS 0.02 0.10 0.62 0.30 0.11
0.23 0.12 o.oa 0.20
O.W$23
1 161 845 -I 272 999 9250213 9 139059 4 32, 498 3 277 105 324 - 606 17319 17 037 2 020 748
3 -8 23 18 9 II 576 -6460 7.715 -3169 . I 494 6048
4811 -5509 62 498 518W 42 882 36 905 2 105 -5460 30 13 26779 7 338 5 177
0.54 -6.68 -0.20 -6.35 0 6 107 - 630 L 960 1436 417 67,
12 -7 i4 19 n 7 0.00 -0.56 0.04 -0.52 -2.0 1.1 0.00 0.W 0.w 0.W 0.0 0.0 0.M 4.03 3.12 3.10” 7.13 6.48 0.W 0.W 0.02 0.02 0.02 0.25 0.w 0.W 0.08 008 026 0.25 0.00 0.W 0.59 0.59 .I 0.11 0.00 0.W r7.M 0.07 0.07 0.05 0.w 0.00 OW 0.0, 0.0, 0.41 0.50 0.W OW 0.09 0.09 2.46 3.w 0.00 0.00 0.19 0.19 1.14 I .25 0.M 0.w 0.21 0.24 0.38 0.25 0.w 0.00 0.72 0.72 074 0.25 0.w 0.W 0.06 0.06 0.45 0.50 0.W 0.00 0.31 0.31 0.2: 0-W 0.w 0.W 001 0.0, 0.00 0.20
0.wo10 O.CWR30 O.col47 0.00456 0.M 0.w
25.57 8.12 3.99
23.16 1.06
0.3, 3.88 1.33
7.74 102.40
16.47
0.39 2.56 1.24
6.90 0.42 0.17 1.16 0.60 2.31
28.,7
0.77
322.79 O.WOl O.WQ,
O.WcmI O.WWOI o.wcml O.WWW O.wmO?
6.62 0.23
198.18 O.WM O.WM
O.WMW
O.WWM o.www
8.51 0.42 0.20 1.09 0.08 0.09
0.18 0.11 0.37 4.65
3.78 0.04
43 27 0.W 0.0300
o.wwo?l O.MWW o.tiw O.WOOM O.CXKXX O.MCWl O.WWW O.MWW o.www
O.WCOW o.www
-t.S* -2. IS -2.10 4.7:
-0.88 -0.73
-17.53 il.95 -2.02
+x59 -IJ.jl
-0.79 -i1637.25
-O.WO, o.ww
-O.WWJi -O.MWOI
1.49 5.78 7.98 6.25 3.94 2.04
23.02 19.36 0.99 0.19 0.20 -0.44 3.86 -13.60 1.20 0.36 7.68 6.03 .‘.i
102.03 85.09 1.535 4.62
0.n 0.0, 255.72 -11338.26 O.WtO -o.wo, o.ww O.WCU
o.wocw -O.wwOI o.woow -0.wwo1 O.McKnl 4.WWOI
25. L8 16.iP
5.56 1.87 2.76 1.95
16.26 3.80 0.6, 0.37 0.14 0.75 2.73 17.48 0.73 0.97 5.43 1.7,
74.21 14.32 9.85 11.85 0.54 0.76
124.6, 11661.05 0.w 0.W
O.WQI O.CWL o.ww o.ww
O.WWOI o.wwo2 O.WOOCO O.MWO,
o.oKow O.WWOI O.WoW2 0.4mO2 OWWOI? o.ccm13 O.WWCS O.WwO6
O.WWOl o.umQ2 O.WWOl o.oocW2
o.ffiwo2 OMWO3 O.wwoO O.WOWI O.WWOl O.MWO?
-O.WMOl o.wcccQ -o.wwo, o.www O.WWW o.wcmo
-O.MWO, o.oooow -0.wcoo1 -O.MowI O.ooc~ -o.wMo,
-0 OGWO,. o.woow -O.moM)I
-5191 592 157 686302 5L5 574 5 894 - 15334 729 266 730 759 27 858 21255
CH4 Gsnerd HC NOX
o.www o.wm O.MWW
O.WCWl O.WWM o.wffiw
omw12 o.owlos O.WWOI O.WWOl
awwoz O.Mxy)W
O.WWOl
692 196 176 622 752 013 724 155
R&D’.Technical Report P274 57
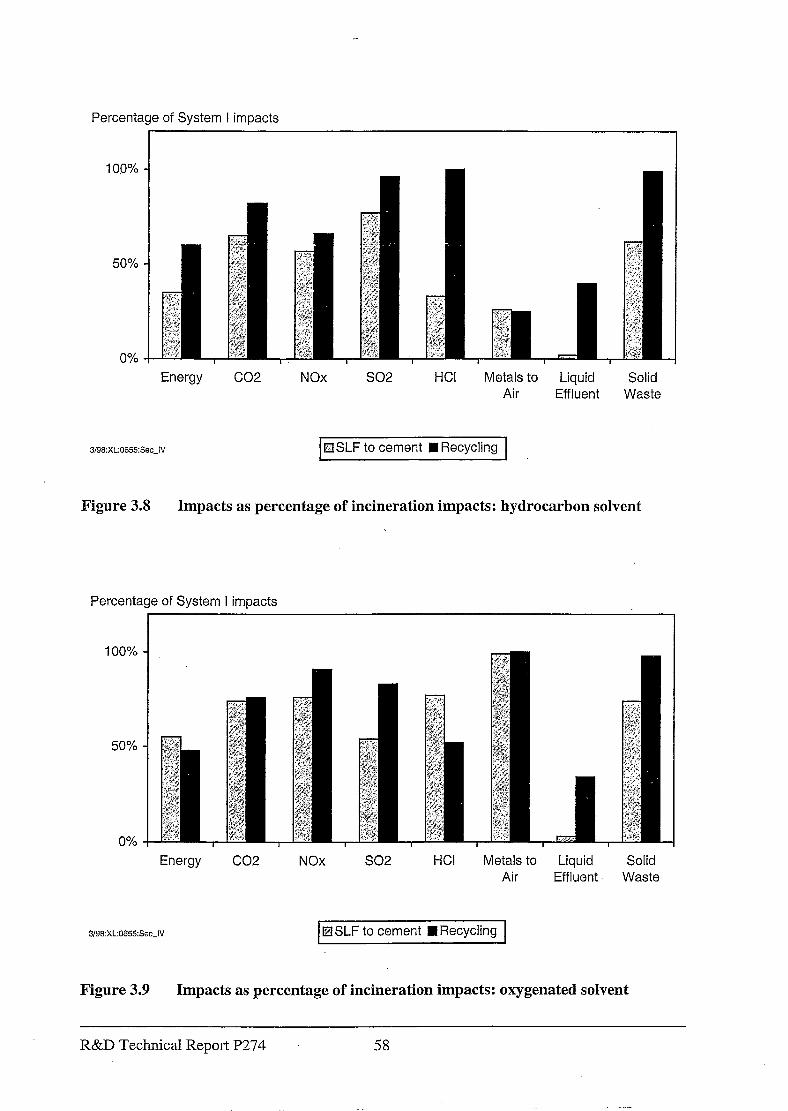
Percentage of System I impacts
10.0%
50%
0%
Energy co2 NOx HCI Metals to Liquid Solid Air Effluent Waste
EISLF to cement n Recycling
Figure 3.8 Impacts as percentage of incineration impacts: hydrocarbon solvent
Percentage of System I impacts
Energy NOx HCI Metals to Liquid Solid Air Effluent Waste
3/96:XL:0655:Sec_lV IZl SLF to cement w Recycling
Figure 3.9 Impacts as percentage of incineration impacts: oxygenated solvent
R&D Technical Report P274 58
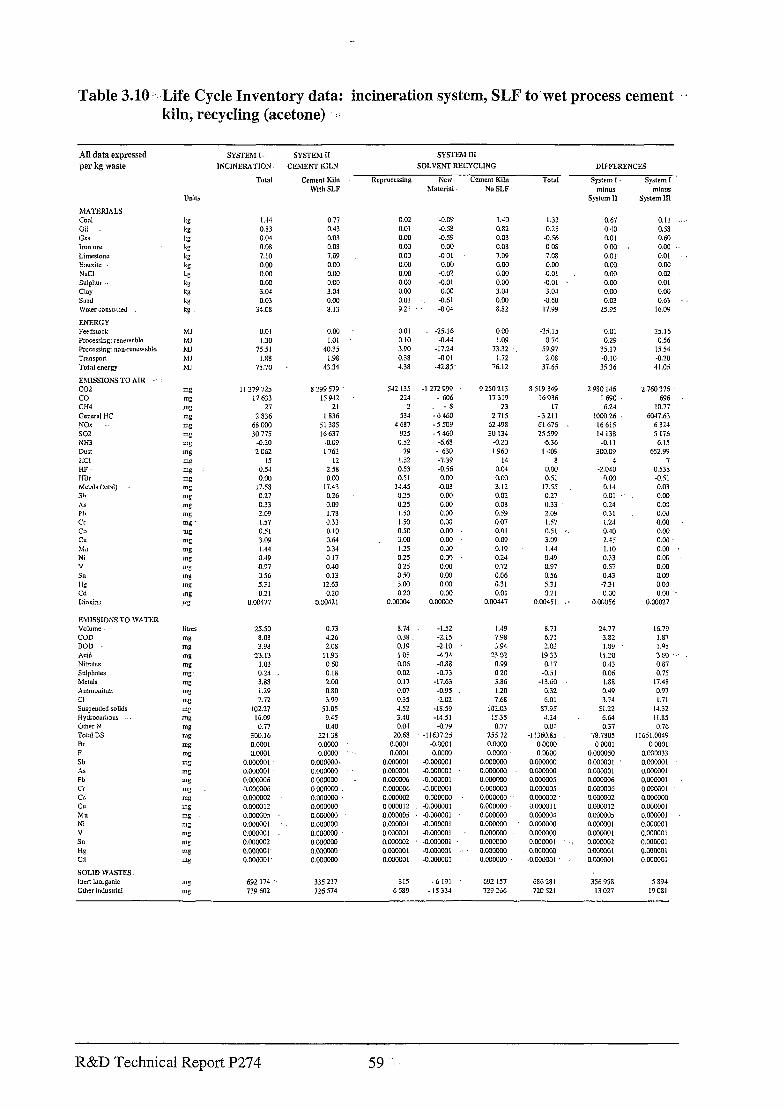
Table 3.10 -Life Cycle Inventory data: incineration system, SLF to’wet process cement .‘. kiln; recycling (acetone) ::
AU data expressed per kg waste
SYSTEJI I SYSTEbl II SYsTEhl II1
INCINERiTION CEMENT KILN SOLVEi,TRECYCLING DIFFEKENCES
T”,d Cement Kiln RCpr”CSSi”g NW Cement Icon TOtA Srstm I Srrtcm 7
With SLF hlatcrial No SLF llli”US sptcm III
1.44 0.83 0.04 0.03 7.10 0.00 O.CQ
077 0.-13
0.00 3.04 0.03
34.08
0.03 0.08
7.w 0.00 0.00 0.00 3.04 0.W 8.l3
0.02 -0.09 1.40 I.33 0.67 0.11 ..’ 0.01 -0.i8 0.82 0.22 010 0.58 0.W -0.55 0.03 -0.56 0.01 0.60 “.M O.CQ c-03 0 OS 003 0.K -. 0.00 -001 i.W 7.05 0.0, 0.01 0.03 0.W 0.00 0.w 0.00 0.w: 0.X -0.02 0.00 -0.01 0.00 0.02 0.W -0.01 0.W -0.01 0.M 0.01 0.00 0.00 3.04 3.04 0.00 0.M 0.0, -0.61 0.00 4.60 0.03 0.63 9.21 -004 S.J2 17.99 25.93 16.00
0.01 0.w 0.07 -25.16 O.cO -25.15 0.01 25.16 1.30 1.01 0.10 -0.4: LO9 0.74 0.29 OS6
75.51 40.35 3.50 -17.21 73.32 S9.97 35.17 IS.54 !.88 :.98 0.38 -0.01 :.72 2.08 -0.10 -0.20
73.70 43.31 4.38 -12.85 x.12 3i.65 55 36 41.05
It 279725 I7 633
27
2 536 68 Wo 30 775
-0.20
2 062 1s
0.51 0.00
17.53 0.27
0.33 2.09 1.57 OS1 3x9 l.li
0.49 0.97 OS6 5.31 0.21
0.00477
3 299 579
Ii 942 21
L 336 51385 16637
-0.09 I 762
12
2.53 0.W
17.13 0.26 0.09 1.73 0.53 o.,o 0.64 0.34 0 Ii O.JO 0.13
12.63 0.20
3x321
542 135 -I 272 999 9250213 5519349 2 930 146 ‘1760 376 221 606 17319 16936 1 690 696
7 -9 23 17 6.24 10.7i 53-t - 6 160 2715 -3211 !OW.26 6047.63
.t 687 -5509 62 493 61 676 16 615 6 321 925 -i&o 50 133 2.5 s99 14 138 S li6
0.2 -6.65 -0.20 -6.36 -0.11 6.12 79 - 630 1 960 I 409 3cQo9 652.99
1.2 -7.39 14 8 4 7 023 -0.56 0.01 ml -2.010 OS35 0.51 0.00 O.CO 031 0.00 -031
*+.-15 6.03 3.12 17.55 0.14 0.03 0.25 0.00 0.02 0.27 !I.01 0.W 0.25 0.M 0.08 11.33 0.21 0.03 1.50 0.W 0.59 2.05 031 O.&l LSO 0.03 0.07 I .57 I.z;I n.al 0.50 0.W 0.01 OSI 0.10 0.03
I :i.cQ 0.W 0.09 3.09 2.U 0.0 1.25 0.00 0.19 I.4.l I.10 0.w
0.25 0.31 0.24 0.49 0.33 0 00 025 0.M 0.72 0.97 037 0.00 o.so 0.00 0.M 0.56 0.13 0.M 3.M 0.M 0.51 5.31 -7.31 0.00 0.20 0.w 0.01 3.2 I c.00 0.30
o.wm o.wcco o.w-117 0.001.?, O.WXX6 O.OOGZ
25.50 8.03 3.93
23.13 1.03 0.24 3.33 1.29 7.72
102.27 16.09
0.77
0.13 4.26 2.08
11.93 060 0.18 2.00 0.30 3.99
51.05
300.16
O.OOQI 0.0001
o.oQ#lo1 O.coLY)OI
9-a 0.10
221.38
O.CiOl O.MW
o.wm~ o.wGxm
S.i* 6.21 2.0;
19.33 0.17
-051 -13.60
0.32 6.01
57.95 4.21 0.01
.1 Lj60.8S O.OOW O.ObM
O.OQwoO O.OQQQiX OXAM o.wcQo5 O.OOCQO2 J.wcQI I
24.77 3.82 I.89
,I.20 0.43 0.06 1.38 0.49 3.i4
51.22 6.6-2 0.37
75.7305 0 0301
O.CQM50 O.MMOI
O.CW306 O.CQWCC o.ccwo6 O.CCOQiX o.oOcoo2 O.WOQOQ O.CQM12 o.cQww
o.McccQ I o.wm
o.ooMw O.OOOCC 0.m O.CQlXBl
3.74 -M?. 1.49 0.38 -2.1s 7.98 0.19 -2.LO 3.94 I .oi -4.71 2: .02 0.06 -0.33 0.99 0.02 -0.73 020 0.17 -17.63 3.86 0.07 -0.95 1.20 0.3 -2.02 7.64 J.92 -18.59 iO2.03 3.40 -lS.Sl :5.35 0.04 -0.79 a.77
20.68 -11637.25 2x72 O.WOl -0.OC-3, O.OOW 0.0001 o.oow o.cQw
O.OOCCfH d.ooowI o.wcQcm o.wooo1 .o.MouoI 0.W O.wwo6 -0.000001 O.CQQQCQ O.WwO6 -0.KlCQO1 O.WWOC O.WLXQ2 O.CWXA 0.McQ00 0 mw12 -o.MouoI o.cQww~ O.ix)MOS -0.cQoo01 0000000 O.WMx)I -0.000001 0.m o.wwot -O.wwOI o.cQcQcQ o.wMn2 -0.03MxlI O.WCQOO o.mt -O.wMxII O.MwoO O.cxmOl -o.wooo: o.woow
OGQOOM O.OQWCO O.OOCCQI 0.000300 ~O.Moo0l
“.0X0,6 O.MC-306 0.m O.OOCQ12 o.cQmoi O.CGwOI O.WKOl o.ow302 0.ffiooo1 0.mx0l
16.79 1.37 1.9s
3.80 0.37 0.7.?
17.48 0.97 1.71
ll.32 ll.Si
076 11661.M19
oalo, o.coD333
O.cowOL O.cQcQOl 0.00MOl O.W(xiol
o.wcQcQ O.MJWOI O.cQQoQI O.OOCCQI OCQOCQI O.WOQOl O.oOOQO1 OCOCCQI
692 174 335 217 315 -6 191 692 157 686281 356 958 S 894
739 602 126 574 6 539 - I5334 729 266 720 S2t 13027 19081
Pb Cr
R&D Technical Report P274
The waste examined.has a fairly high sulphur content of 2.5 percent. A sensitivity analysis using Chem Systems’ computer model suggests that SO2 emissions will be worse in the SLF case for sulphur contents in excess of around 3.5 percent. This confirms the obvious: emissions of SO2 will increase if SLF contains more sulphur per MJ than the other fuels, after allowing for differences in retention between cement kilns and incinerators.
Oxygenated waste
Acetone is the main component of the hypothetical waste taken as an example of oxygenated solvents. Relatively high metal contents, of chromium, lead, and mercury are also included.
The methodology is the same as for the hydrocarbon waste, and the results are given in Table 3.10 and Figure 3.9. Recycling shows a benefit over incineration. As with toluene, the net avoided burdens from recycling are broadly comparable to those avoided by displacing coke and petcoke in the cement kiln.
Chlorinated waste
A very highly chlorinated material is the next hypothetical waste considered. It is taken as being largely trichloroethylene, with a high solids content (see Table 3.1).
Several different factors affect the burdens in the different disposal routes.. In the incinerator, the high chlorine content of the waste results in a high consumption’of lime per unit waste, with associated production burdens. In addmon, supplementary fuel (or other waste) is required to make up the calorific value.
In the cement kiln,. the low calorific value of the waste means that it displaces smaller quantities of coal and petcoke than in the cases reviewed above.
The inventory is presented in Table 3.11, and selected burdens are compared on Figure 3.10. The net benefits of avoided burdens from incineration and from burning conventional cement kiln fuels are broadly comparable. The big exception is in the emissions of HCl. Here, the SLF to cement kiln route is worse than incineration by a factor of around five, reflecting the very high scrubbing efficiency in the incinerator. Figure 3.10 is limited to 200 percent (a factor of two) for reasons of presentation. The inventory does not show a corresponding increase in dioxins from the cement kiln because the relationship between chlorine content and dioxin levels is not established; dioxin quantities are calculated on the basis of flue gas volume. The HCl emissions are reduced in the recycling route because most of the chlorine is retained as part of the recycled trichloroethylene.
R&D Technical Report P274 60
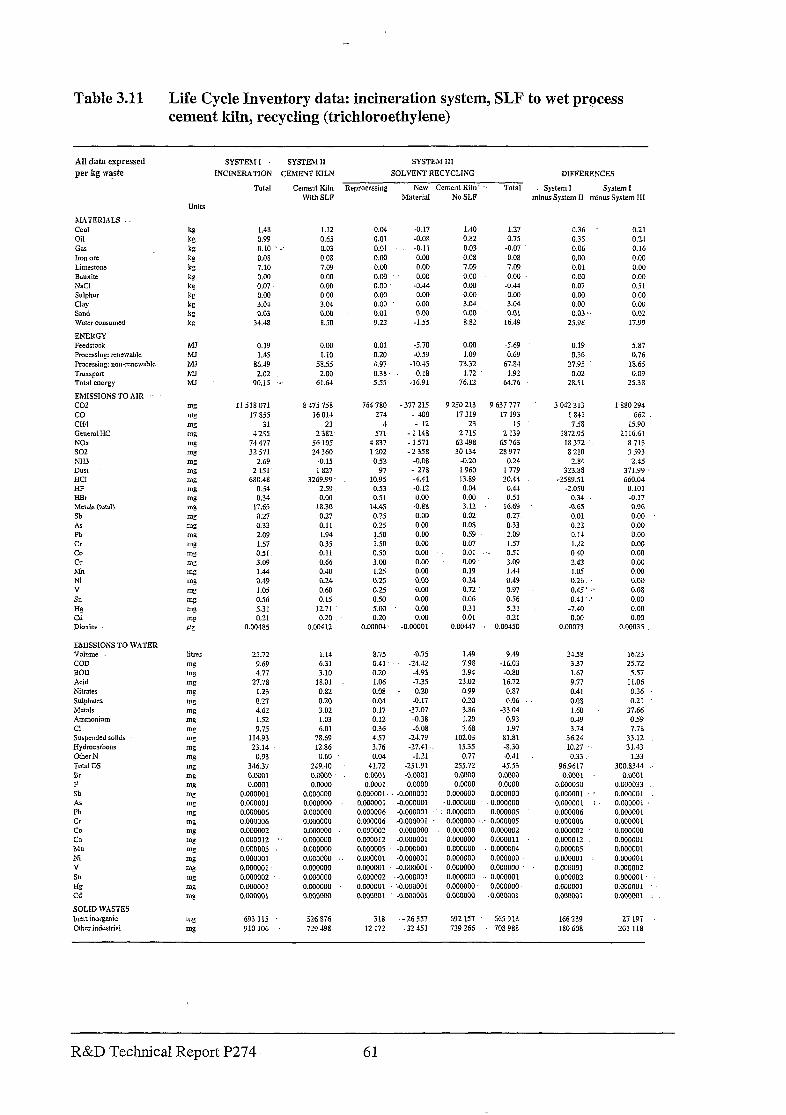
Table 3.11 Life Cycle Inventory data: incineration system, SLF to wet process cement kiln, recycling (trichloroethylene)
All data expressed
per kg W?Sk
SYSTEM1 SYSTEM II SYSTEM III
INCINERATION CEMENT KILN SOLVENT RECYCLING DIFFERENCES
TOtal Cement Kiln Reprocessing New Cement Kiln. ‘. Total System1 System I With SLF No SLF minusSystem II minusSystem
1.48 1.12 0.99 0.65 0.10 : Il.03 0.08 0.08 7.10 7.09 0.W 0.00 0.07 0.00 0.00 0.00 3.04 3.04 0.03 0.00
34.48 8.50
0.04 -0.17 1.40 1.7-i 0.01 -0.08 0.82 0.73 0.01 -0.11 0.03 -o.oi 0.00 0.00 0.08 0.08 0.00 0.00 7.09 7.09 0.W 0.W 0.00 0.00 0.00 -0.44 0.00 -0.44 0.00 0.00 0.00 0.00 0.00 0.00 3.04 3.04 0.01 0.00 OGO 0.01 9.22 -1.55 8.82 16.49
0.36 0.35 0.06 0.00 0.01 o.co 0.07 0.00 0.00 0.03 I.
25.98
0.21 0.2-L 0.16 0.00 0.00 0.00 0.51 0.00 003 0.02
17.99
0.19 0.00 0.01 -5.70 0.00 -5.69 0.19 5.a7 1 A5 1.10 0.20 -0.59 1.09 0.69 0.36 0.76
86.49 5855 4.97 -10.45 73.32 67.84 27.95 18.65 2.02 2.00 0.38 -0.18 I.72 I.92 0.02 0.09
90.15 61.64 555 -16.91 76.12 64.76 28.51 25.38
11518071 8475758 764780 37855 16011 274
31 23 4 4 2% 23x2- 571
74477 56 105 4837 32 571 24360 1202
2.69 -0.15 0.52 2 151 1827 97
680.48 3269.99‘ 10.95 0.54 259 0.53 0.3: 0.00 0.51
17.65 1830 14.45 0.2i 0.27 0.25 0.33 0.11 0.25 2.09 1.94 J.50 1.5i 0.35 1.50 0.51 0.11 0.50 3.09 0.66 3.M) 1.44 0.40 1.25 0.49 0.24 0.25 1.05 0.60 0.25 0.56 0.15 0.50 5.31 12.71 mu 0.2, 0.20 0.20
O.OQ485 0.00412 o.woo4
-377 215 9 2So213 9 637777 - 400 17319 17 193
- 12 23 15 - 1148 271s 2 139 -1571 62498 65763 -2358 30134 28 977
-0.08 -0.20 0.24 - 275 1960 1779 -4.41 13.89 20.44 -0.12 0.0s 0.44 0.00 0.09 0.51
-0X8 3.12 16.69 0.00 0.32 0.27 0.00 0.08 0.33 0.W 0.59 2.09 0.00 0.07 I.57 0.00 0.01 0.51 0.09 0.09 3.09 0.00 0.19 1.44 0.W 0.24 0.49 0.00 0.72 0.97 0.00 0.06 0.56 0.W 0.31 5.31 0.W 0.01 0.21
-0.ooo01 0.00447 0.00450
3 042313 I a41 758
1872.95 18372 . .
8210 2.84
323.85 -2589.51
-2.050 0.34
-0.65 0.01 0.22 0.14 I.22 0 10 2.4? LOS 0.26 0.45' :. 0.41 ...
-7.40 0.W
O.WO73
1880294 662
IS.90 2116.61
8713 3 593
2.u 311.99 ‘ 660.04
0.101 -0.17
0.96 0.00 0.00 0.00 0.00 0.00 0.W 0.00 0.00 0.08 0.00 0.00 0.00
o.cm35.
24.72 9.69 4.77
27.78 I.23
0.27 4.62 1.52 9.75
114.93 23.14
0.93 346.37 OmoI o.wo1
0.M10001 o.wooo1 O.WwO6 0.000006 o.OOooo2 0.000012 O.OOOOOS 0.000001 0.w0001 0.000002 0.000001 o.wocO1
1.14 6.31 3.10
15.01 0.82 0.20 3.02 1.03 6.01
78.69 12.86
0.60 249.:0 o.woo o.woo
0.000000 0.000000 0.000000 O.WWW o.omooo o.owooo
8.75 0.41 0.20 1.06 0.08 0.01 0.17 0.12 0.36 4.57 3.76 0.04
41.72 O.ouol 0.0001
0.omo01~ o.ooGoo1 0.1X0006
-0.75 1.49 9.49 -24.42 7.98 -16.03
-4.93 3.94 -0.80 -7.35 23.02 16.72 -0.243 0.99 0.87 -0.17 0.20 0.06
-37.07 3.86 -33.04 -0.38 1.20 0.95 -6.08 7.68 1.97
-21.79 102.03 81.81 -27.41 1.535 -8.30
-1.21 0.77 -0.41 -251.91 255.72 4553 -O.WOl o.owo o.cAoo 0.0000 o.woo 0.0000
-0.w0001 o.wwoo 0.000000 -0.000001 ~0.000000~ o.uooooo -0.w0001 o.woooo o.OOoO!l5
21.58 3.37 1.67 9.17 0.41 0.03 1.60 0.49 3.74
36.24 10.27
0.33 96.9617
0.0001 O.WOOSO 0.000001 ‘. 0.000001 .i 0.000006
lb.23 25.77
5.57 11.06
0.36 0.21
37.66 0.59 7.78
33.12 31.43
1.33 300.8344 :
0.0001 0.000033 0.000001 o.Goooo1 O.Mx)Wl 0.w0001 0.000000 o.ouooo1 0.000001 0.000001 o.wooo2 0.ou0001~ o.oQooo1 O.owM)l :
O.WOOO6 -0.w0001 0.000002 o.ooowo 0.000012 -0.w0001
o.woooo o.ooowo
0.000005 o.ocmO2
0.000006 o.Oc+loo2 o.oooo12
0.000000 o.wooos -O.wOOOl o.ocuow . o.wooo1 -0.000001
O.WOUW o.oooo11 0.000000 o.woQo4 o.oowoo o.woooo o.woooo 0.000000 0.000000 o.wooo1 o.ccilOoo o.woooo 0.000000 -0.w0001
o.mo5 O.WWOI
o.ooowo o.wooo1 -0.cwl01 0.000004 0.000002 '-0.000001 o.woooo o.eQooo1 -0.000001 O.WOOOO 0.090001 -0.w0001 0.000001
693 115 S26376 318 --X557 692157 665918 166239 2i 197 910 106 729498 12 172 -32451 729266 708988 180 608 201118
co CH4 G:,,nenl HC NOX SO2 NH3 Dust HCI HP HBr Metal* (total) Sb As Ph Cr CO CU hi" Ni V Sn Hg Cd Diaxim
EMISSIONS TO WATER Volum= COD BOD Acid h?tmtes
Ammonium
Cl Suspended solids Hydrocarbons OthcrN Total DS Br F Sb AS Pb Cr CO CU M” Ni v Sll
HE Cd
SOLID WASTES hcrtinorgenic
Othcrindustrial
R&D Technical Report P274
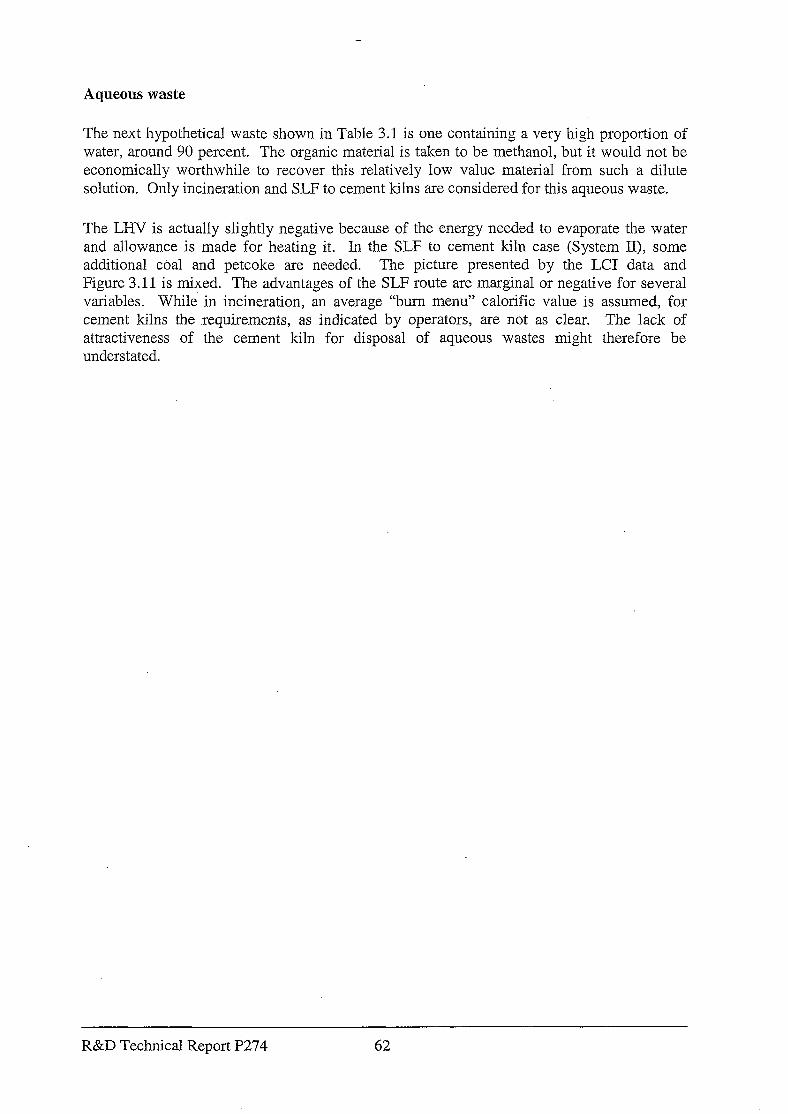
Aqueous waste
The next hypothetical waste shown in Table 3.1 is one containing a very high proportion of water, around 90 percent. The organic material is taken to be methanol, but it would not be economically worthwhile to recover this relatively low value material from such a dilute solution. Only incineration and SLF to cement kilns are considered for this aqueous waste.
The LHV is actually slightly negative because of the energy needed to evaporate the water and allowance is made for heating it. In the SLF to cement kiln case (System II), some additional coal and petcoke are needed. The picture presented by the LCI data and Figure 3.11 is mixed. The advantages of the SLF route are marginal or negative for several variables. While in incineration, an average “bum menu” calorific value is assumed, for cement kilns the requirements, as indicated by operators, are not as clear. The lack of attractiveness of the cement kiln for disposal of aqueous wastes might therefore be understated.
R&D Technical Report R274 62
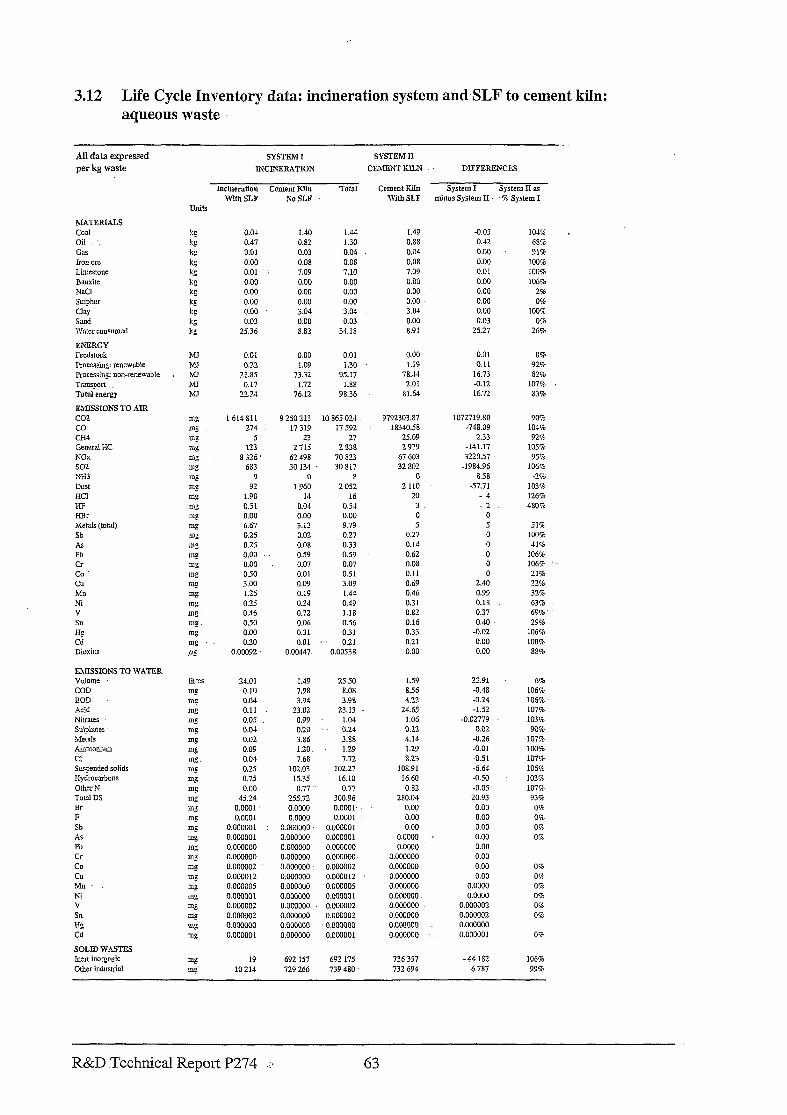
3.12 Life Cycle Inventory data: incineration system and SLF to cement kiln: aqueous waste
811 data expressed SYSTEM I SYSTEM II
per kg waste INCINERATION CEMENTKlL?i DIFFERENCES
EMISSIOKS TO AIR co2 co CH4 Geceral HC NOX so2 m3 Dust HCI HP HBr Metals (ml) Sb AS Pb CT co cu Mn Ni V Sn
H9 Cd Dioxin
EMJ.SSIOKS TO WATER VOl!!blC COD BOD
Amnlonium
Cl Suspended solids Hydrocarbons
Other N Tod DS Br F Sb As Pb
Cr CO cu Mn. Ni v Sll Hg Cd
SOLID WASTES Inen inorganic Other indusnial
Incineration Cement Elln TOlid With SLF NoSLF
Cement Eiln System I System II as With SLF minus System II ,?o System I
0.04
0.47 0.01 0.00 0.01
0.00 0.00 0.00 0.00 0.03
25.36
1.40 1.44 0.82 1.30 0.03 0.04
1.49 0.88
0.04 0.08 7.09 0.00 0.00
0.00 3.04 0.00 8.91
-O.Oi 0.42
0.08 0.08 7.09 7.10 0.00 0.00 0.00 0.00 0.00 0.00 3.04 3.04 0.00 0.03 S.82 34.18
0.00
0.00 0.01 0.00 0.00
0.00 0.00 0.03
25.27
1044 . 68%
91% 100% 100%
106% 2%
0% 100%
0% 26%
0.01 0.22
21.85 0.17
22.24
0.00 0.01 7.09 1.30
7332 9117 1.72 1.88
76.12 98.36
0.00 1.19
78.tl 2.01
81.64
0.11 16.73 -0.12 16.12
0% 92% 82%
107% . 83%
1614Sll 274
5 123
8326 683
9 92
1.90
Oil 0.00 6.67 0.25 0.25
0.00 0.00
050 3.00 1.25
0.25 0.46
050 0.00
0.20 0.00092
9 250 213 10 865 024 17319 17592
23 27 2715 2838
62498 70823 30134 30817
0 8 1960 2052
14 16 0.04 0.54 0.00 0.00 3.12 9.79 0.02 0.27 0.08 0.33 0.59 0.59 0.07 0.07 0.01 0.51 0.09 3.09 0.19 1.44
0.24 0.49 0.72 1.18 0.06 0~56 031 0.31 0.01 0.21
0.00447 0.00538
9792303.87 18340.58
25.09 2 979
67603 32802
0 2110
20 3 0 5
0.27 0.14 0.62 0.08 0.11 0.69 0.46 0.3 1 0.82 0.16 0.33 0.21 0.00
1072719.80 -748.09
2.33 -141.17
3220.57 -1984.96
8.58 -57.71
-4 -2
0 5 0 0 0 0 0
2.40 0.99
90% lOJ%
92% lOi%
95% 106%
-2% 103% 126% 480%
0.18 0.37 0.40
-0.02 0.00 0.00
51% 100%
41’7, 106% 106% '.
21% 22% 32% 63!% 69%. 296
106% 100%
88%
24.01 1.49 25.50 1.59
0.10 7.98 8.08 856
0.04 3.94 3.98 4.22
0.11 23.02 23.13 : 24.65
0.05 0.99 1.04 1.06
0.04 0.20 0.24 0.22
0.02 3.86 3.88 4.14
0.09 1.20. 1.29 1.29 0.04 7.68 7.12 8.23 0.25 102.03 102.27 108.91 0.75 li3i 16.10 16.60 0.00 0.77" 0.77 0.82
45.24 255.72 300.96 280.04
0.ooo1~ 0.0000 O.OcQl- .’ 0.00
O.OWl o.oooo 0.0001 0.00 o.ooow1 o.moilo 0.0oQoQ1 0.00 0.000001 o.oooQoo o.moo1 o.oooa 0.000000 0.000000 0.000000 0.0000 o.oomoo 0.000000 o.oommo 0.000000 o.oocQo2 o.owooo o.OQOao2 o.owooo 0.000012 o.ooflooo 0.000012 o.oooooo o.ooooo5 0.000000 0.000005 O.oowM) o.owoo1 0.000000 o.wooo1 0.0ooo00 o.owoo2 0.0oml0' o.lnxQo2 0.000000 o.ooool2 o.oooooo o.owoo2 o.owooo o.ooowo o.oooooo 0.000000 o.ocoooo
O.OOGall 0.000000 o.owoo1 o.ooooOo
23.91 -0.48 -0.24 -1.52
-0.02779 0.02
-0.26 -0.01 -0.51
-6.64 -0.50 -0.05
20.93 0.00 0.00
0.00 0.00 0.00 0.00 0.00 0.00
0.0000 o.ooou
O.OGlOO2 0.000002 0.000000 0.000001
6% 106% 106% 107w 103%
90% 107% IOOI
107% 106% 103% 107%
93%
OR 0% 0% 0%
0% OF 070 0% 070 0%.
0%
19 692157 692175 736357 -44182 106%
10 214 729266 739480 732694 6787 99%
R&D Technical Report P274 .:‘ 63
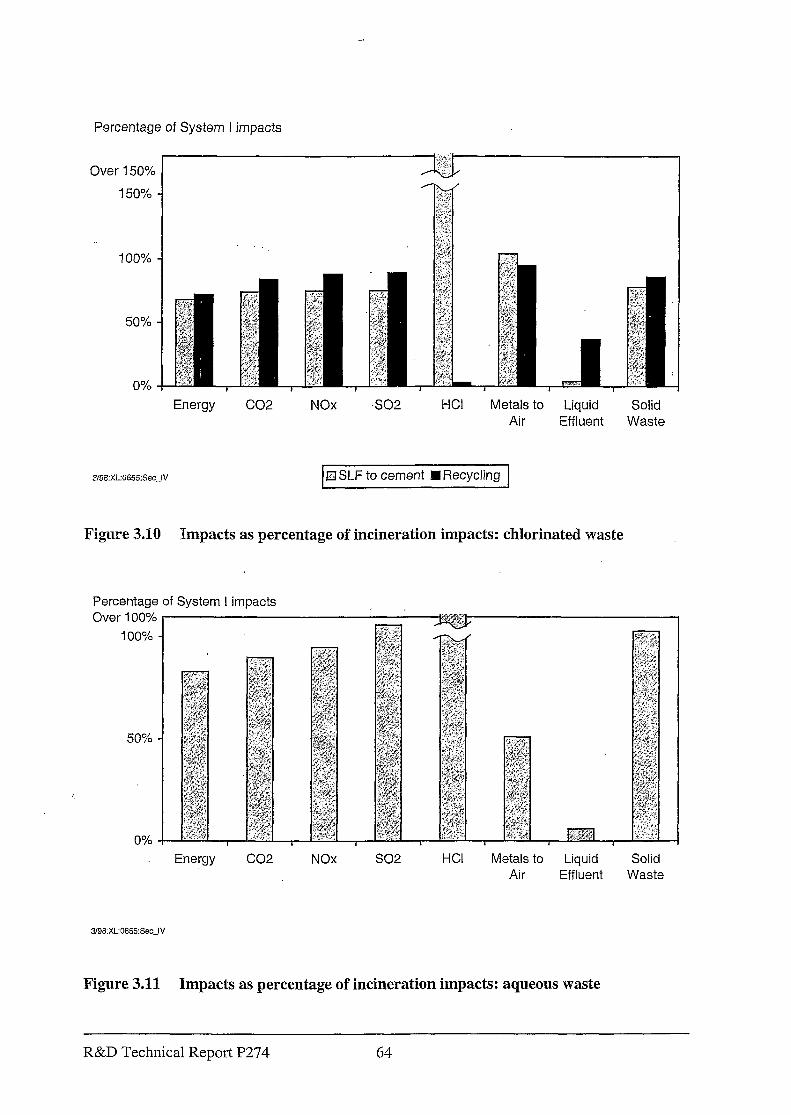
Percentage of System I impacts
Over 150%
150%
100%
50%
0%
Energy co2 NOx HCI Metals to Liquid Solid Air Eff bent Waste
El SLF to cement q Recycling
Figure 3.10 Impacts as percentage of incineration impacts: chlorinated waste
Percentage of System I impacts
Energy co2 NOx so2 HCI Metals to Liquid Solid Air Effluent Waste
3/98:XL0655:Sec~IV
Figure 3.11 Impacts as percentage of incineration impacts: aqueous waste
R&D Technical Report P274 64
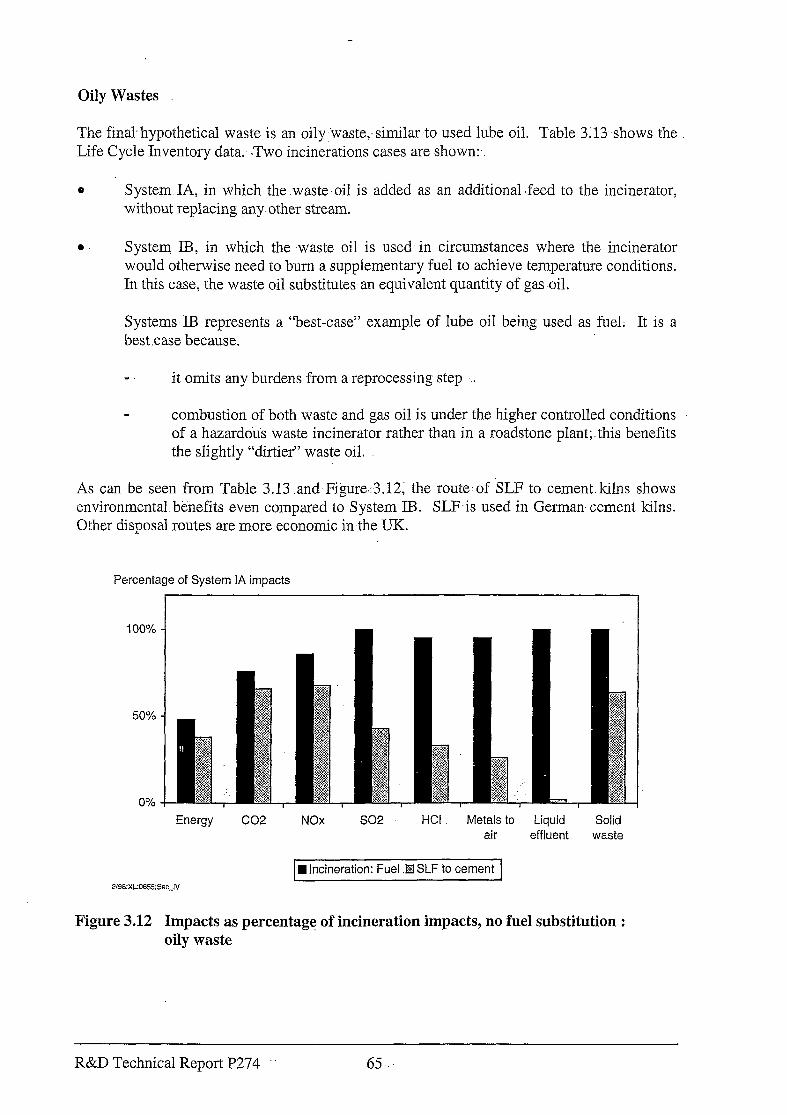
Oily Wastes
The final-hypothetical waste is an oily-waste,-similar-to used lube oil. Table 3;13 shows the Life Cycle Inventory data. :Two incinerations cases are shown:
0 System IA, in which the .waste.oil is added as an additional ,feed to the incinerator, without replacing any other stream.
l . System IB, in which the waste oil- is used in circumstances where the incinerator would otherwise need to burn a supplementary fuel to achieve temperature conditions. In this case: the waste oil substitutes an equivalent quantity of gas-oil.
Systems IB represents a “best-case” example of lube oil being used as fuel. It is a bestcase because.
it omits any burdens from a reprocessing step I
combustion of both waste and gas oil is under the higher controlled conditions of a hazardous waste incinerator rather than in a roadstone plant;.this benefits the slightly “dirtier?’ waste oil.
As can be seen from Table 3.13 .and-Figure,:3.12, the routezof SLF to cement.kilns shows environmental benefits even compared to System IB. SLF-is used in German cement kilns. Other disposal routes are more economic in-the UK.
Percentage of System IA impacts
100%
50%
0%
Energy co2 NOx HCI Metals to Liquid Solid air effluent waste
n incineration: Fuel .kZfSLF to cement
Figure 3.12 Impacts as percentage of incineration impacts, no fuel substitution : oily waste
R&D Technical Report P274 65
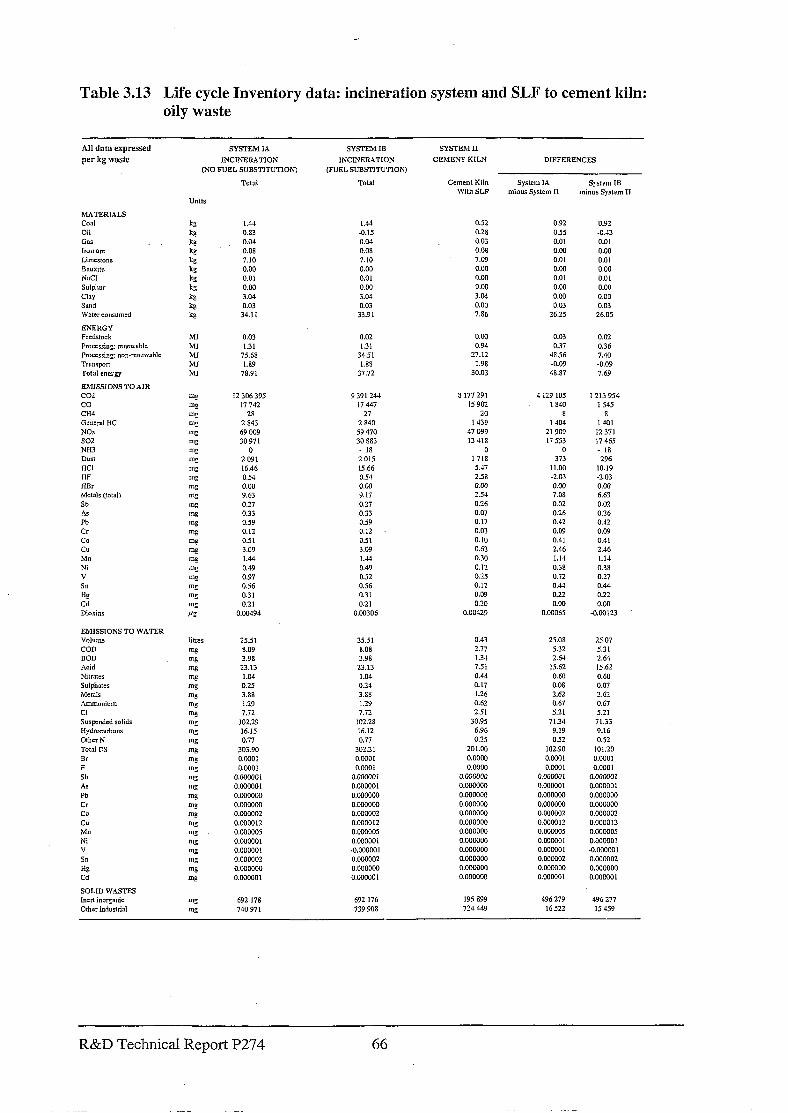
Table 3.13 Life cycle Inventory data: incineration system and SLF to cement kiln: oily waste
SYSTEM IA SYSTEh, IB SYsrEhI II
INCINERATION INCWER&TIOS CEME&T KILN DIFFERENCES
(NO F”EL SUBSTITUTION) (FUEL SUBSTITUTION)
TOtal TOtal Cement Kiln System IA Sysstem 16 With SLF minus System II minus system II
1.44 1.44 0.83 -0.15 0.01 0.04
0.52 0.28
0.08 i.10
0.00 0.01
0.w
0.03
7.10 0.00 0.01
0.03
0.w
3.04 0.03
33.91
7.09 0.00
0.00
3.04 0.03
0.00 3.o.r
34.11
0.00
7.86
0.92 0.92 055 -0.4 0.01 0.01 0.W 0.00 0.01 0.01 0.00 0.00 0.01 0.01
0.00 0.00 0.00 0.00 0.03 0.03
26.25 26.05
0.03 I.31
75.68 1.89
78.91
0.02 1.31
3451 1.85
37.72
0.00 0.03 0.02 0.94 0.37 0.36
27.12 4856 7.40 1.98 -0.09 -0.09
30.03 48.87 7.69
I2 306 395 17 742
28
2 843 69 009 30 971
0 2091 16.46
0.54 0.00 9.63
0.27 0.33 0.59 0.12
051
9391244 37447
27
2 840 59 470 30 883
- 18 2 015 15.66
0.54 0.w 9.17
3.09 1.44 0.49 0.97 0.56 0.31 0.21
0.00494
0.27 0.33 059
0.12 051
3.09 1.44 0.49 0.52 0.56 0.31
0.21 0.00306
8 177 291 3 129 105 1213 954 15 902 1E40 1545
20 8 8 1439 I 404 1401
47 099 219W 12 371 13 418 17 553 17 465
0 0 - 18 1718 373 296 5.47 II.00 IO.19 2i8 -2.03 -2.03 0.00 0.00 0.W 2.54 7.08 6.63 0.26 0.02 0.02 0.07 0.26 0.26 0.17 0.42 0.42 0.03 0.09 0.09 0.10 0.41 0.41 0.52 2.46 2.46 0.30 1.14 1.14 0.12 0.38 0.38 0.3 0.72 0.27 0.12 0.44 0.44 0.03 0.22 0.22 0.20 0.00 0.00
o.w429 O.WO65 -0.W123 .
2551 8.09 3.98
23.13
1.04 0.25 3.88 1.29
7.72 102.29
16.15 0.77
303.90 O.WOl
O.WOl O.Woml
O.WWOl
25.51 8.08 3.98
23.13
1.04 0.24 3.88
1.29 7.72
102.28
16.12 0.77
302.21 O.WOI
0.0001
0.43
2.77 I.34
7.51 0.44 0.17 1.26
0.62 2.51
30.95 6.96 0.25
201.00
o.ww
o.woooo o.woooo 0.000002
0.000001
o.wooo1 o.www o.www
O.WWl? o.wWO5
o.www o.woow o.wwo2
O.WWOl o.oowo1 o.oowo2
o.wwQo O.WWOl
o.ww12 O.OOw305
O.WWOl -O.OWWl o.WOoo2
o.woow O.WWOI
25.08 25.07 532 531 2.6-1 2.64
IS.62 15.62 0.60 0.60 0.08 0.07
2.62 2.62 0.67 0.67 5.21 5.21
7134 7133 9.19 9.16 0.52 0.52
102.90 101.20 O.WOl O.WOI
O.ooOl 0.0001 0.000001 O.WWOl O.WOOOl O.WWOl
O.WCCOl 3.WWW
o.ooww o.mw 0.000002 o.wwo2 O.WWl? 0.000012
0.wcQ0i o.wwo5 O.WwOI O.WWOI O.WWOI -0.ooaw1 O.WWO2 o.wwo2 O.WWW o.www o.oowo1 0.00w01
692 178 692 176 195 899 496 279 496 277
740 971 739 908 724 449 16522 15 459
hWTERIALS cm,
Oil ciar
ho,, on Limcaonc Ba”X,tC
Pj,CI
Sulphur CIUY Sand
Water conr”m:d
E,MISSIONS TO AIR CO?
co CH4 General HC
NO% so2 NH3 Dust
HCI HF HBI-
.hlcta,z (total) Sb ,
; Cr
CO CU Mn
Ni ”
Sn
HS Cd
Dioxins
EhllSSIOKS TO WATER
Volur*c COD BOD
Sb AS Pb
Cr CO CU Mn W v Sn HS Cd
SOLID WASTES he* inorganic
Orherindunrid
R&D Technical Report P274
3.3.2 Other options
Two further sensitivity cases are relevant:-..
0 deeper solvent.recovery 0 use of other clean fuel in the cement kiln.::
For both of these, the oxygenated waste is used as illustration..
Deeper solvent recovery
With the deeper solvent recovery, a recovery of 80 percent of total waste feed is assumed. Instead of passing to an incinerator, the residuesaresent to landfill.
The results of this sensitivity case are summarised on Figure 3.13. The deeper recycle case shows lower impacts than the case with 65 percent recovery. In particular, the-loss of metal- . . compounds to atmosphere is reduced by avoiding the need to incinerate residues.
This analysis relates-to the reprocessing of the total waste, not to the incremental benefits of moving from- 65 percent to 80 percent recovery.
Clean fuel ‘-
If a cleaner fuel than coal or petcoke were used in the cement kilns, the burdens avoided by use of SLFi would: be, lower. Natural gas. can be used and is on some plants in the United States. The economics of production and fuel costs in Europe make gas burning an ... unattractive option for cement producers.. The case is included to illustrate the technical comparisons rather than as a practical solution.
The inventory is presented in Table 3.14 and summarised on Figure 3.14. It is apparent that the impacts are significantly reduced when natural. gas is used .in the .kiln. For several parameters, the benefits of switching to natural gas are comparable to, or lower than, those of redirecting organic wastes from incineration to SLF.
R&D Technical Report P274 67
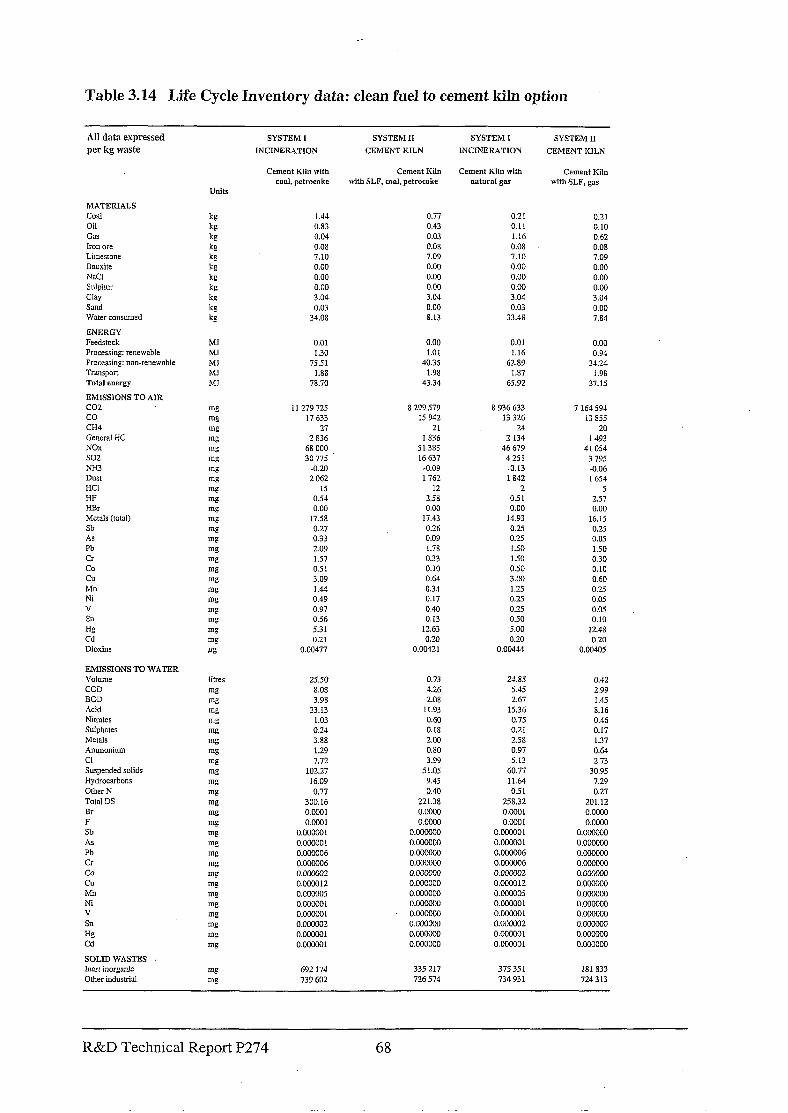
Table 3.14 Life Cycle Inventory data: clean fuel to cement kiln option
All data expressed SYSTE,M 1 SYSTEM II SYSTEM I SYSTEM 11
per kg waste INCINEIWTION CEMENT KILN INCINERATION CEMENT KILN
Cement Kiln with
coal, petrocoke
Cement Kiln Cement Kiln with Cement Kiln with SLF, coal, petrocoke natural gas with SLF, gas
MATERIALS
C&l Oil
GE
Jron ore
Limestone
Bauxite NaCl
Sdphllr
Clay Sand
Water consumed
1.44 0.77 0.21 0.21 0.83 0.43 0.11 0.10 0.04 0.03 1.16 0.62
0.08 0.08 0.08 0.08 7.10 7.09 7.10 7.09 0.00 0.00 0.00 0.00
0.00 0.00 0.00 0.00
0.00 O.Oil 0.00 0.00 3.04 3.04 3.04 3.04 0.03 0.00 0.03 0.00
34.08 8.13 33.48 7.84
ENERGY Feedstock
Processing: renewable
Processing: non-renewable TGUEp0lt
Total energy
EMISSIONS TO AIR CO2 co
CH4
Geneml HC NOx
so2
NH3 Dust
HCI HF
HBr Metals (total)
Sb
AS Pb
CI
CO CU
Mn
Ni V
SKl
Hg Cd
Dioxins
0.01 0.00 0.01 0.00 1.30 1.01 1.16 0.94
7551 40.35 62.89 34.24
1.88 1.98 1.87 1.98
78.70 43.34 65.92 37.15
II 279725 8 299 579 8 936 633 7 164591 I7 633 15 942 13 326 13 855
27 21 24 20
2 836 1836 2 134 1493 68 000 51385 46 679 41054 30 7x I6 637 4251 3 795
5.20 5.09 -0.13 -0.06 2 062 1762 1842 1654
15 12 2 5 OS4 IS8 OS 1 2.57 0.00 0.00 0.00 0.00
1758 17.43 14.93 16.15 0.27 0.26 0.25 0.25 0.33 0.09 0.25 0.05
2.09 1.78 IS0 I.50
1.57 0.33 1.50 0.30 0.51 0.10 0.50 0.10
3.09 0.64 3.w 0.60
1.44 0.34 1.25 0.25 0.49 0.17 0.25 0.05
0.97 0.40 0.25 0.05
Oi6 0.13 OS0 0.10 5.31 12.63 5.00 12.48
0.21 0.20 0.20 0.20
o.OQ477 0.00421 0.00444 0.00405
Eh?XSIONS TO WATER Volume
COD
BOD Acid
Nitrates
Sulphates Metals
Ammonium
Cl
Suspended solids
Hydrocarbons
Other N
Total DS Br
F
Sb
AS
Pb
Cr CO
CU
Mn Ni
V
SD
HE Cd
25SO 0.73 24.85 0.42
8.08 4.26 5.45 2.99
3.98 2.08 2.67 1.45 23.13 11.93 15.36 8.16
1.03 0.60 0.75 0.46 0.24 0.18 0.21 0.17
3.88 2.00 ?.i8 1.37
1.29 0.80 0.97 0.64
7.72 3.99 5.13 2.73
102.27 51.05 60.77 30.95 16.09 9.45 11.64 7.29
0.77 0.40 0.51 0.27
300.16 221.38 258.32 201.12
O.ccQl 0.0000 O.ooOl O.OCOO
O.CCOl O.OKHl O.QOOl 0.04300
O.cOOM)l O.wooM) O.OOCCO1 o.ocJoooo
O.OOwOl o.oL-mxl O.Ooccol o.ooom O.woM)6 0.000000 O.OCOCO6 0.00W00
O.OOC0O6 o.mo O.ooMx)6 O.ooMxx)
O.Mxxx2 O.oooMx) o.caxi?2 o.ooLxm
o.OroO12 0.000000 O.OWO12 o.ooomo
O.OCGOO5 O.OOCOM 0.000005 O.Mxx)OO
0.0%0X O.oMxxx) O.ooMH)l O.WoooO
o.ocOOo1 o.MMooo 0.OaxO1 O.OOOOVO
O.OOOOO2 O.wOwO O.OOEOZ O.coooM3
O.OtXOOl O.Mxxxx) 0.000001 O.ooMxH)
0.Oca3O1 O.oOwM) O.oooWI O.OOOOCQ
SOLID\VAsTEs
Inert inorpdc Other industrial
692 174
739 602
335 217 375 351 181833 726 574 734 93 1 724313
R&D Technical Report P274 68
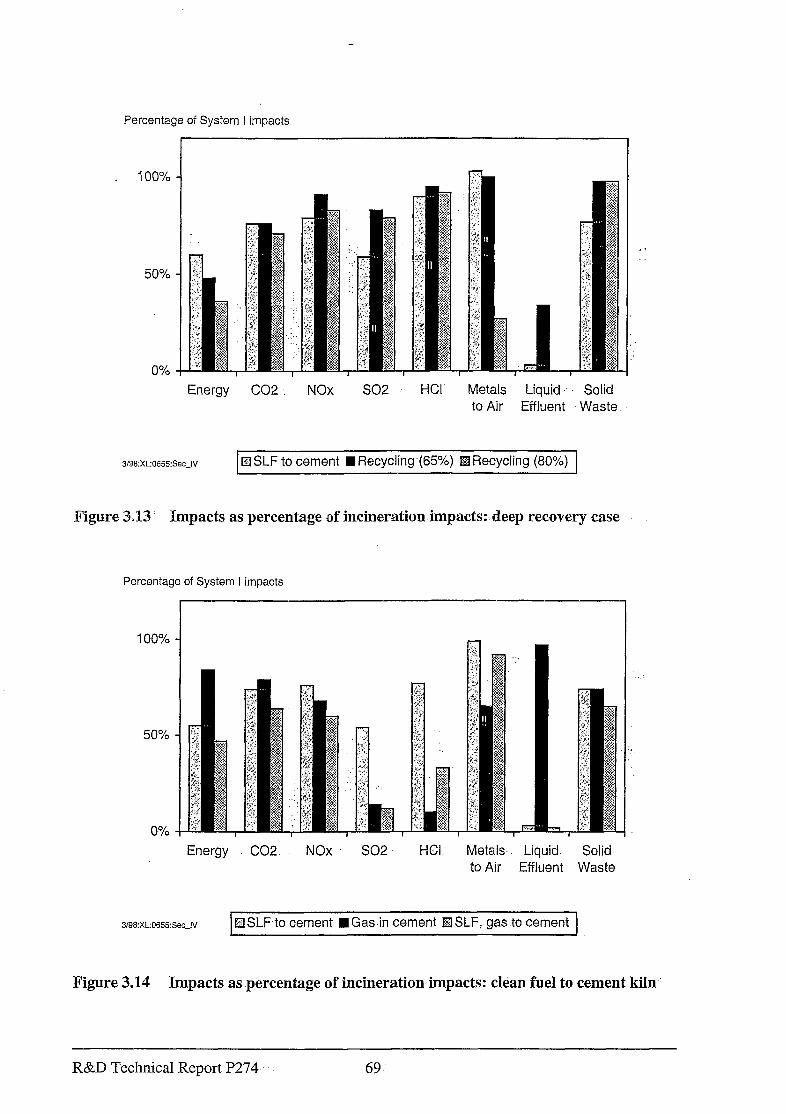
Percentage of System I impacts
100%
50%
0%
Energy CO2. NOx so2 HCI Metals Liquid .. Solid to Air Effluent Waste
3/38:XL0655:Se~~IV 1 fZl SLF to cement H Recycling (65%) H Recycling (80%) 1
Figure 3.13 Impacts as percentage of incineration impacts: deep recovery case
Percentage of System I impacts
100%
50%
0%
Energy CO2 NOx SO2- HCI Metals Liquid. to Air Effluent z:iE
q SLF to cement n Gas-in cement !ZlSLF, gas.to cement
Figure 3.14 Impacts as.percentage of incinerationimpacts: clean fuel to cement kiln.
R&D Technical Report P274 69
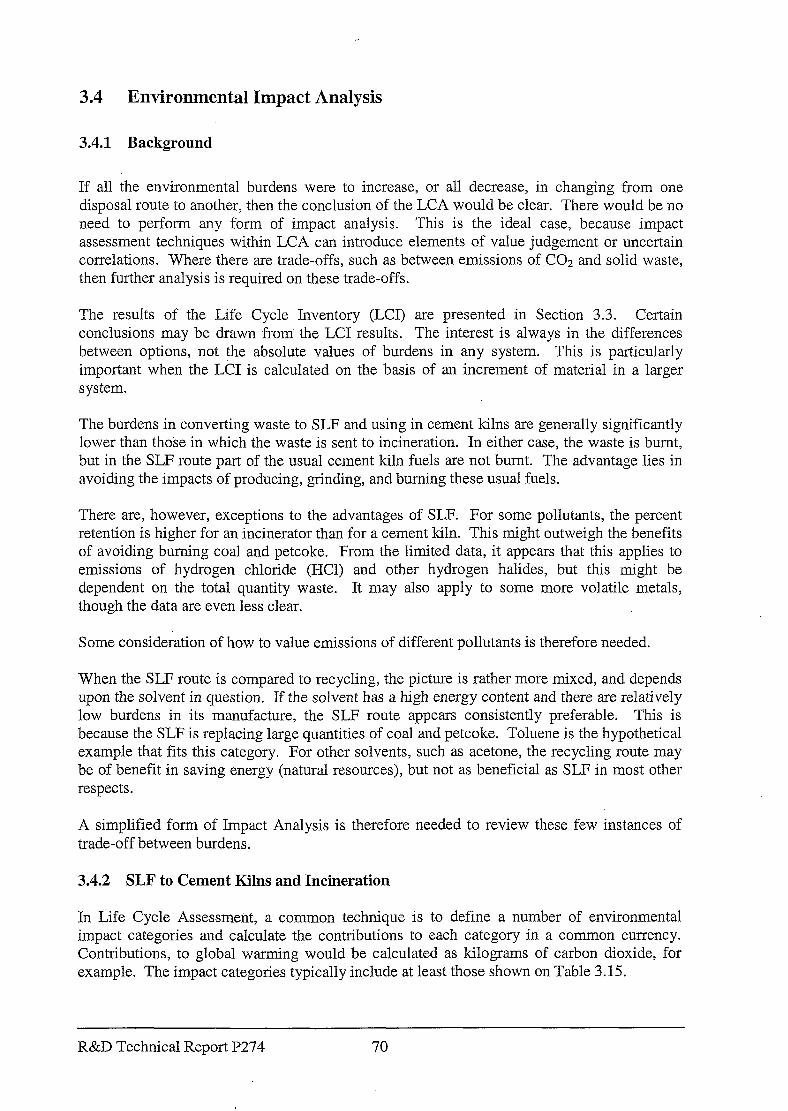
3.4 Environmental Impact Analysis
3.4.1 Background
If all the environmental burdens were to increase, or all decrease, in changing from one disposal route to another, then the conclusion of the LCA would be clear. There would be no need to perform any form of impact analysis. This is the ideal case, because impact assessment techniques within. LCA can introduce elements of value judgement or uncertain correlations. Where there are trade-offs, such as between emissions of CO2 and solid waste, then further analysis is required on these trade-offs.
The results of the Life Cycle Inventory (LCI) are presented in Section 3.3. Certain conclusions may be drawn from the LCI results. The interest is always in the differences between options, not the absolute values of burdens in any system. This is particularly important when the LCI is calculated on the basis of an increment of material in a larger system.
The burdens in converting waste to SLF and using in cement kilns are generally significantly lower than those in which the waste is sent to incineration. In either case, the waste is burnt, but in the SLF route part of the usual cement kiln fuels are not burnt. The advantage lies in avoiding the impacts of producing, grinding, and burning these usual fuels.
There are, however, exceptions to the advantages of SLF. For some pollutants, the percent retention is higher for an incinerator than for a cement kiln. This might outweigh the benefits of avoiding burning coal and petcoke. From the limited data, it appears that this applies to emissions of hydrogen chloride @Xl) and other hydrogen halides, but this might be dependent on the total quantity waste. It may also apply to some more volatile metals, though the data are even less clear.
Some consideration of how to value emissions of different pollutants is therefore needed.
When the SLF route is compared to recyclin g, the picture is rather more mixed, and depends upon the solvent in question. If the solvent has a high energy content and there are relatively low burdens in its manufacture, the SLF route appears consistently preferable. This is because the SLF is replacing large quantities of coal and petcoke. Toluene is the hypothetical example that fits this category. For other solvents, such as acetone, the recycling route may be of benefit in saving energy (natural resources), but not as beneficial as SLF in most other respects.
A simplified form of Impact Analysis is therefore needed to review these few instances of trade-off between burdens.
3.4.2 SLF to Cement Kilns and Incineration
In Life Cycle Assessment, a common technique is to define a number of environmental impact categories and calculate the contributions to each category in a common currency. Contributions, to global warming would be calculated as kilograms of carbon dioxide, for example. The impact categories typically include at least those shown on Table 3.15.
R&D Technical Report P274 70
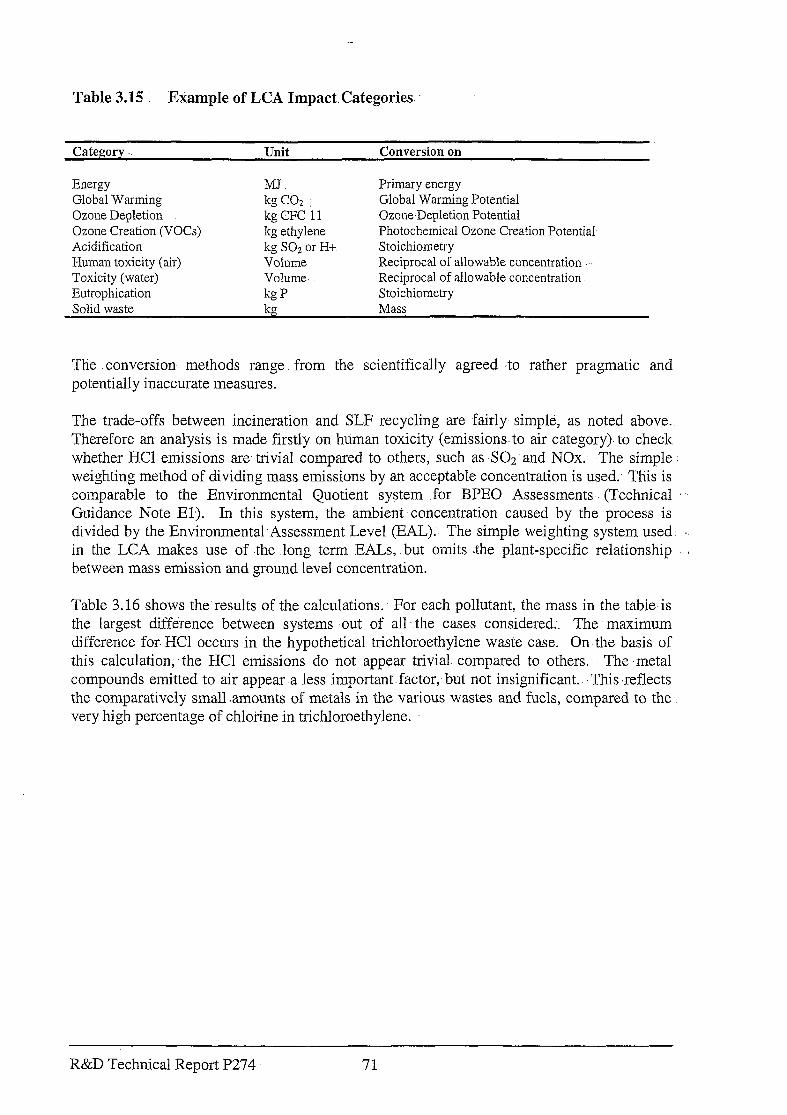
Table 3.15 1 Example of LCA Impact. Categories.
Category Unit Conversion on
Energy Global Warming Ozone Depletion Ozone Creation (VOCs) Acidification Human toxicity (air) Toxicity (water) Eutrophication Solid waste
MJ kg CO? kg CFC 11 kg ethylene kg SO2 or H+ Volume Volume. kgP kg
Primary energy Global Warming Potential Ozone-Depletion Potential Photochemical Ozone Creation Potential- Stoichiometry Reciprocal of allowable concentration . Reciprocal of allowable concentration Stoichiometry Mass
The .conversion: methods range. from the scientifically agreed .to rather pragmatic and potentially inaccurate measures.
Tlle trade-offs between incineration and SLF recycling are fairly- simple, as noted above. Therefore an analysis is made firstly on human toxicity (emissions. to air category)- to check whether HCl emissions are trivial compared to others, such as -SOz.and NOx: -The simple : weighting method of dividing mass emissions by an acceptable concentration is used. This is comparable to -the Environmental Quotient system .for BPEO Assessments (Technical Guidance Note El). In this system, the ambient concentration caused by the -process is divided by the Environmental Assessment Level (EAL). The simple weighting system used in the LCA makes use of the long term EALs, but omits the plant-specific relationship between mass emission and ground level. concentration.
Table 3.16 shows the results of the calculations. For each pollutant, the mass in the table-is the largest difference between systems -out of all. the cases considered.. The maximum difference for- HCl occurs in the hypothetical trichloroethylene waste case. On the basis of this calculation;. the HCl emissions do not appear. trivial compared to others. The -metal compounds emitted to air appear a less important factor, but not insignificant.. ‘This ,reflects -the comparatively small .amounts of metals in the various wastes and fuels, compared to the very high percentage of chlorine in trichloroethylene.
R&D Technical Report P274 71
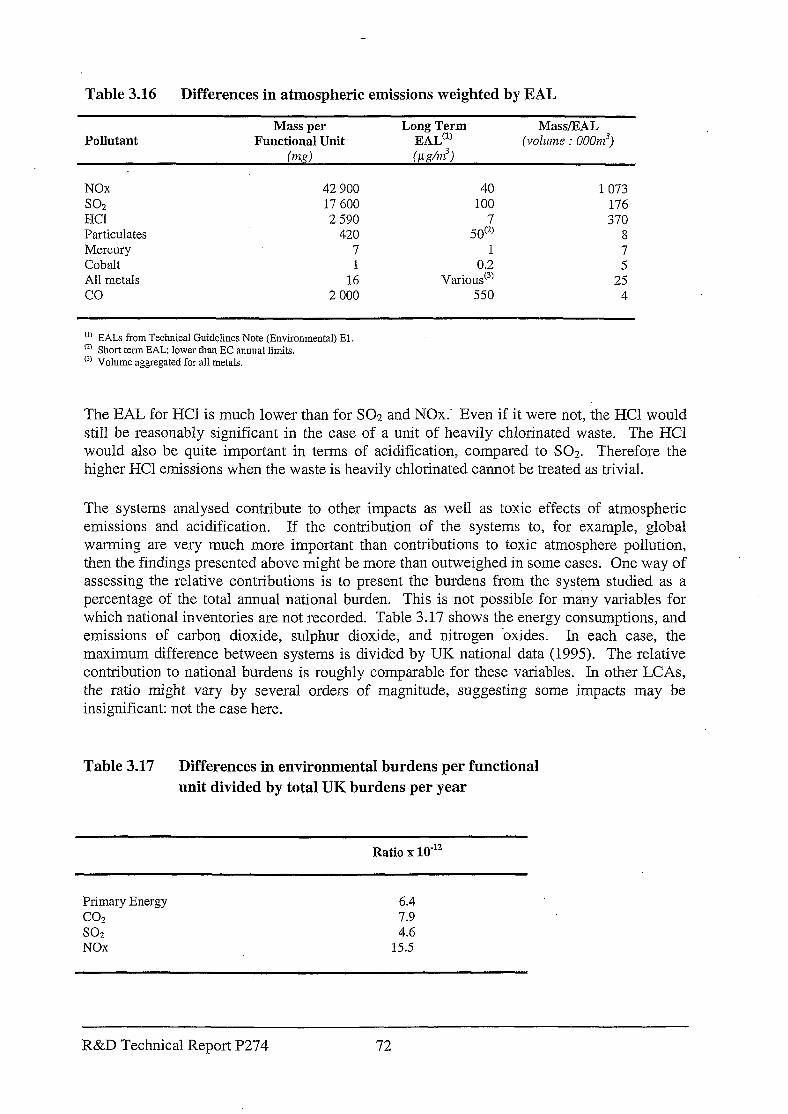
Table 3.16 Differences in atmospheric emissions weighted by EAL
Mass per Long Term MaWEAL Pollutant Functional Unit EAL’:’ (volume : OOOm3)
NOx 42 900 so2 17 600 HCI 2 590 Particulates 420 Mercury 7 Cobalt 1 All metals 16 co 2 000
40 1 073 100 176
j()Z 370 8 1 7
Variou?’ 25 5
550 4
(‘I EALs from Technical Guidelines Note (Environmental) El. ” Short term EAL; lower than EC annual limits. (‘) Volume aggregated for all metals.
The EAL for HCl is much lower than for SO2 and NOx.. Even if it were not, the HCl would still be reasonably significant in the case of a unit of heavily chlorinated waste. The HCl would also be quite important in terms of acidification, compared to SOZ. Therefore the higher HCl emissions when the waste is heavily chlorinated cannot be treated as trivial.
The systems analysed contribute to other impacts as well as toxic effects of atmospheric emissions and acidification. If the contribution of the systems to, for example, global warming are ‘very much more important than contributions to toxic atmosphere pollution, then the findings presented above might be more than outweighed in some cases. One way of assessing the relative contributions is to present the burdens from the system studied as a percentage of the total annual national burden. This is not possible for many variables for which national inventories are not recorded. Table 3.17 shows the energy consumptions, and emissions of carbon dioxide, sulphur dioxide, and nitrogen bxides. In each case, the maximum difference between systems is divided by UK national data (1995). The relative contribution to national burdens is roughly comparable for these variables. In other LCAs, the ratio might vary by several orders of magnitude, suggesting some impacts may be insignificant: not the case here.
Table 3.17 Differences in environmental burdens per functional unit divided by total UK burdens per year
Ratio x 10ml”
Primary Energy 6.4 co2 7.9 so2 4.6 NOx 15.5
R&D Technical Report P274 72
A final’step in the analysis could be to attach different ratings of importance to each environmental issue. Is global warming a more serious problem than human health, for example? This type of approach is. different to. justify scientifically, but several methodologies are available,including economic valuation of impacts. Because of the limited nature of the trade-offs in this LCA, and the uncertainties in valuation methods, this is not .. pursued further.
If constituents, such as halogens or more volatile -.metals, are present .at significant concentrations in the organic waste, then the SLF route. may show disadvantages in the relevant emissions. The simplified analysis of environmental impact suggests that these “trade-off’ factors are not -insignificant for halogens. They should, be included in any consideration of wastes to be excluded from the SLF,route.-
3.4.3 Recycling and SLF
An impact analysis for recycling and SLF would be very complex as the data are different -for each solvent. It is clear from Table 3.17 above that the saving of primary energy resources is not trivial compared to other. impacts, so that. any trade-off between resource consumption and pollution cannot be ignored.
It would be:very difficult to produce a definition of wastes that should-be recycled rather than sent -to SLF, based on environmental impact analysis. For practical purposes,. the following qualitative points are .made:
l recycling is environmentally preferable to incineration on almost every count
l recovery of a high percentage of solvent, leaving a dry residue: that can. be landfilled, is preferable to recovery at 60 to.70 percent and incineration of residues.
0 economics (see Section 5) will encourage recycling of mixed solvents where possible, although will not necessarily encourage deep recovery with dry. residues
0 the economics of single solvent recovery are substantially. better than those of SLF. blending.
3.4.4 1 Liquid and solid’wastes
The simplified review presented above focuses on atmospheric emissions and, to a lesser extent, consumption of hydrocarbon resources. A. brief, commentary i is needed on aqueous effluent and solid wastes.
Aqueous effluents
Aqueous effluents. arise mainly, in the cases considered, as incinerator scrubber effluents. As the incinerator option i is less environmentally. beneficial than SLF.: in several other respects, the importance of aqueous effluents does not need to be examined in detail.
R&D Technical Report P274- 73
In addition, the masses of pollutants in the effluent, such as metals, are generally rather lower than those emitted to atmosphere. The effluent stream is saline, and this could constitute an environmental burden for some receiving water bodies. However, annual quantities are very low compared to certain major inorganic chemical production processes, and there is no indication that salinity of incinerator effluent is a cause of concern.
SoEd wastes
A large part of the contaminants in organic waste become part of the solid streams, both clinker product and residues.
In the LCA, it is assumed that solid wastes of this sort would be sent to special waste landfills, with careful control and treatment of leachate. Tests on cement kiln dust (CKD) (Reference: Burning Hazardous Waste in Cement Kilns, ETI, 1992) indicate that leachability is acceptably low whether conventional fuel or SLF: is used. If the CKD is recycled, the contaminants largely remain in the clinker product. This needs to meet product specifications appropriate to its use in construction.
Neither aqueous effluents nor solid wastes are identified as a major environmental factor in the LCA.
3.3 Conclusions of Life Cycle Assessment (LCA)
3.5.1 Basis of analysis
The LCA is calculated to show the differences in environmental impact if one kilogram of waste is sent to different disposal routes. For the liquid organic wastes of relevance to SLF, landfill or disposal to surface water are taken not to be options within the current and expected regulatory framework. The disposal routes considered are therefore incineration, blending to SLF for use in cement kilns, and recycling.
3.5.2 Incineration and SLF to cement kilns
Blending organic wastes into SLF and burning in cement kilns is preferable to disposal by incineration for most of the parameters considered in the LCA. This is because the SLF is replacing conventional cement kiln fuels, coal and petcoke. Very similar advantages, or greater for some variables, could be gained by burning natural gas in cement kilns. This is cited to illustrate the technical analysis, not as an economically viable option.
For organic wastes of similar composition to typical blended SLF, there are some exceptions to the advantages of the SLF route. The key determinant is the retention of contaminants in the waste by the cement kiln and by the incinerator. Incinerators have very efficient gas cleaning trains. The analysis suggests that emissions of halogen compounds to atmosphere, expressed as HX, will be higher for the SLF route than for incineration if the SLF contains a
R&D Technical Report P274 74
moderate halogen content. A similar argument probably applies to semi-volatile. and .volatile metals, though the data on retention efficiencies are not clear.
3.5.3 Varying~waste compositions
(a) Concentrations of contaminants~in waste
The study is intended to review -whether some wastes should. be excluded from SLF. Different waste compositions were used -in the LCA; the net impact. of an incremental quantity of-the waste is examined. However, as noted in Section 3.1.2, the impact could depend upon .the quantity of the waste. Some contaminants -may be, absorbed in clinker up to a certain quantity, above which breakthrough occurs. Metal compounds and halogen compounds-are examples of this phenomenon. This means that caution is needed in drawing inferences on the impact- of small quantities of component :.wastes in total SLF: It.!also suggests that the principle of excluding certain wastes from a blend.may be difficult.to justify rigorously. These reservations are very relevant to,the following discussion of results.
The LCA results indicate that the concentration of contaminants in the organic waste need to be lower than .those. in the alternative cement kiln fuels if the SLF route is to show an advantage. This should be expressed on fhe basis of energy units,- such as g?ams per MJ - rather than weight percent.
The sulphur limit of blended SLF.is usually very much lower than- the alternative cement kiln’ fuels, leading 10 reduced SOz emissions.- If-sulphur is increased to around 0.75 g per MJ: the SLF route .will not be advantageous in terms of SO? emissions because there would be no advantage over the usual-cement- kiln -fuels. In practice; of course, the quality y:of the usual fuels:varies, so that the break-point quality of SLF theoretically also varies. between plants and the fuel of the time.
A similar argument applies to halogens:, .Highly chlorinated wastes in sufficient quantities will give rise to more HCI from. cement .,kilns than from : incinerators; There is an understandable concern-that dioxin emissions might also rise with increased chlorine content. Incinerators ‘are designed to minimise dioxin formation while cement kilns are production plants with a different design emphasis. In practice, both cement -kilns and incinerators can be operated with dioxins reliably controlled to under O;l.ng/m3.
For oxides of nitrogen, the quantity of thermal:NOx created-depends on factors such as flue gas volume, temperature, and :oxygen content. If the SLF is sent to the cement kiln, it displaces conventional fuels and the processing operations necessary to produce them. When SLF is added to an incinerator running on a previously balanced bum menu, there is an additional, NOx load.. The net effect is a reduction in NOx:,emissions when :the waste is routed to cement kilns. The nitrogen -content- of the waste. influences the quantity of fuel NOx: There is, however, no clear reason to distinguish between, cement. kilns and incinerators in the case of fuel NOx.
Both cement kilns-:-and incinerators exhibit very high retention. :of metals: On .the data available, it is likely that high concentrations of semi-volatile .and .volatile metals would lead to increased emissions.in the SLFroute.- The bulk of the metals remain in solid residues and,
R&D Technical Report P274 75
in the case of cement, in the clinker product. Leachability is not identified as a problem. Incinerator residues and the cement kiln dust (where produced) will in any case be landfilled with appropriate controls.
(b) Aqueous wastes
If pure water were sent to an incinerator or a cement kiln, additional fuel could be needed in both cases. The incinerator would be the preferred route because of cleaner fuel and better retention than cement kilns. This is assuming the use of low sulphur gas oil in the incinerator, as quoted to Chem Systems by an operator, and coal plus petcoke in cement kilns.
However, in a case considered with 90 percent water, the SLF route shows a mixture of environmental advantage and disadvantage, depending on the parameter examined.
Cc> Total and incremental load
The LCA is calculated on the basis of one kilogram of organic waste to permit the effects of different waste types to be analysed.
In practice, there are factors that relate to the total cement kiln loading. The total quantity of acid gases might exceed the capacity of alkaline materials to retain them, for example.. There are also interactions, such as if high chlorine loadings tend to lead to higher emissions of lead and some other metals in the form of volatile chlorides, as reported in the literature.
These factors cannot be considered meaningfully when considering individual wastes that are blended into SLF.
3.54 Recycling
The analysis of solvent recovery and recycling is complex as the avoided burdens of new solvent vary with the type of solvent.
0 Recycling is environmentally preferable to incineration on almost every count.
8 Recovery of a high percentage of solvent, leaving a dry residue, is environmentally preferable to recovery at 60-70 percent with incineration of residues.
0 Recycling is not necessarily preferable to the SLF route. This depends on the solvent type. The comparison between recycling and SLF shows trade-offs in some areas.
It is not easy to define wastes that should be recycled rather than sent to SLF for environmental reasons. However, it should be noted that there is an economic incentive to recycle solvents (see Section 4), particularly single solvents rather than solvent mixtures. Because an economic incentive is in place, it is not proposed to attempt to define “recoverable” wastes that should not be blended into SLF.
R&D Technical Report P274 76
3.55 Excluded wastes
The Environment.Agency has set standards for blended SLF at certain cement works. The standard is different for each plant, reflecting the characteristics of each. As the Life Cycle AssesSment indicates, the use of this SLF is of environmental benefit for most variables, in comparison with other disposal routes.
Some SLF.blenders have their .own guidelines for the exclusion of wastes. These include materials that’ are perceived to be of particular ,sensitivity to the .public, such as PCBs; Materials that are highly .toxic,: or clinical wastes, may also be excluded to reduce risks to employees and. the public arising from handlin, Q and transfer. Such restrictions are commendable, but are not part of the Life Cycle Assessment study. The risks of handling and transfer would occur .whichever. disposal route were selected, if comparable -equipment is used in each.
Proposals for excluded wastes must be expressed in terms of <compositions. Exclusion of wastes from certain sources of ,certain types would be insufficiently precise because of the range of compositions in each-category.
It must-also be recognised that any exclusion limit,will exclude the whole waste, not only the particulti component. .A waste that is pure hydrocarbon plus four percent sulphur .might be. excluded on the grounds of sulphur content. Other than .the-increase in SO2 emissions, .there would be significant advantages in. the -SLF, disposal route for such a waste.. Individual component Jimits therefore need. to be set high; at a level where- the :component pollution would be serious compared to other environmental advantages.
Restrictions already imposed -by the Environment -Agency on blended SLF are the main tool for controlling environmental burdens. They can- take account of the specific details’of the kiln andyfactors relating to the.total mass flows rather than a small increment of waste. The. principle of excluding individual .wastes is difficult to justify rigorously because the net impact may depend on the total quantity..
If it is required to also exclude specific individual wastes, then the criteria could-be:
0 wastes of significantly worse quality than usual cement kiln fuels, so there is a disadvantage in blending in SLF
l wastes of -very low calorific values, for the same-reasons
0 wastes with a high halogen content, because incineration offers better retention (on- available data) - if used in large quantities.
a wastes with high ,concentrations of ..volatile or semi-volatile metals,. for .the same reason - if.used in large quantities
R&D Technical Report P274 77 ..
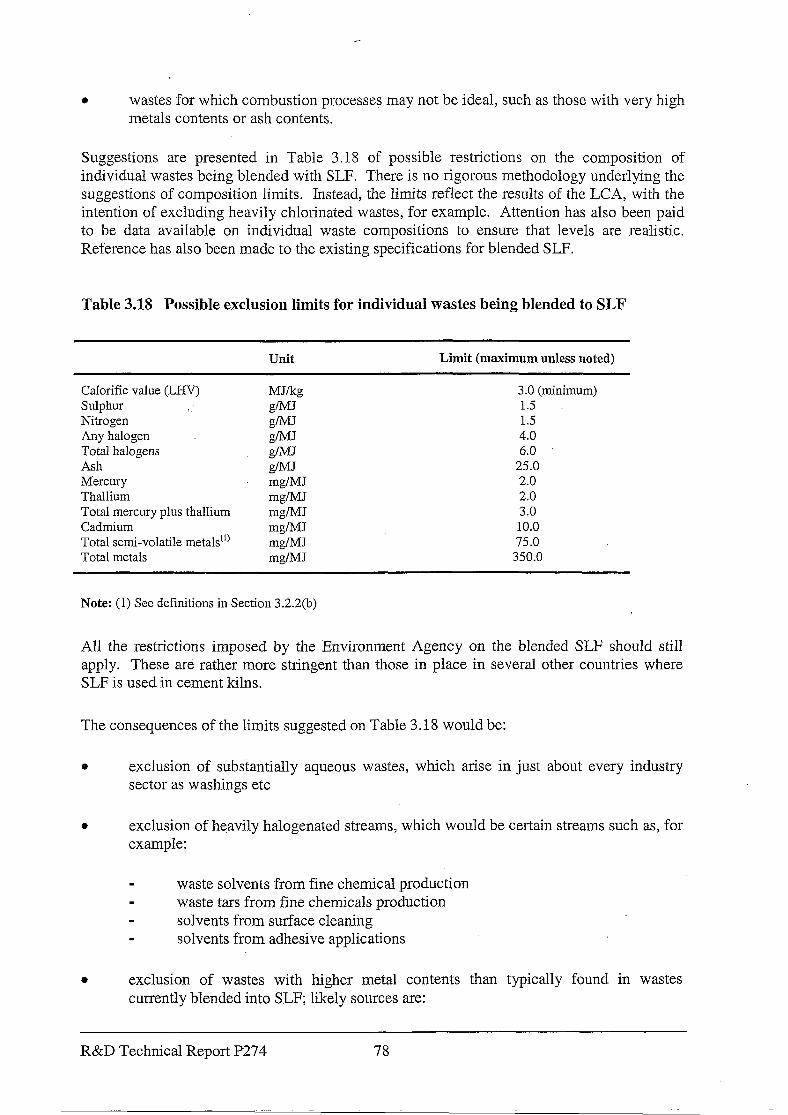
l wastes for which combustion processes may not be ideal, such as those with very high metals contents or ash contents.
Suggestions are presented in Table 3.18 of possible restrictions on the composition of individual wastes being blended with SLF. There is no rigorous methodology underlying the suggestions of composition limits. Instead, the limits reflect the results of the LCA, with the intention of excluding heavily chlorinated wastes, for example. Attention has also been paid to be data available on individual waste compositions to ensure that levels are realistic. Reference has also been made to the existing specifications for blended SLF.
Table 3.18 Possible exclusion limits for individual wastes being blended to SLF
Unit Limit (maximum unless noted)
CaIorific value (LHV) Sulphur Nitrogen Any halogen Total halogens Ash Mercury Thallium Total mercury plus thallium Cadmium Total semi-volatile metals(‘) Total metals
MJlkg
flJ
$i: ~ILMJ
k?MJ mg/MJ w/MJ mg/MJ mg/MJ mg/MJ mg/MJ
3.0 (minimum) 1.5 1.5 4.0 6.0
25.0 2.0 2.0 3.0 10.0 75.0 350.0
Note: (1) See definitions in Section 3.2.2(b)
All the restrictions imposed by the Environment Agency on the blended SLF should still apply. These are rather more stringent than those in place in several other countries where SLF is used in cement kilns.
The consequences of the limits suggested on Table 3.18 would be:
0 exclusion of substantially aqueous wastes, which arise in just about every industry sector as washings etc
0 exclusion of heavily halogenated streams, which would be certain streams such as, for example:
m waste solvents from fine chemical production waste tars from fine chemicals production
M solvents from surface cleaning m solvents from adhesive applications
l exclusion of wastes with higher metal contents than typically found in wastes currently blended into SLF; likely sources are:
R&D Technical Report P274 78
m coatings waste with high metallic. pigment content,. --such. as from the automotive industry
residues from solvent recycling.
There are practical points relating to any control.. of individual,. component wastes entering SLF.
a Wastes delivered to SLF blenders may be supplied by waste contractors from a collection round. The waste may .be a bulked-up mixture of material.-from several sources. Restrictions to prevent “inappropriate” wastes from entering these streams would be difficult in administrative terms. Conversely, any limits on individual waste components could be circumvented if wastes are supplied to the.: blender as a bulked-up mixture.
e The correct approach for any cement kilncould-depend .upon the exact chemistry .and other factors relating-: to that kiln. For example, some kilns actually, require an addition- of chloride content when insufficient is present in the-feedstock. This is of relevance mainly to the total blended SLF. :--Some consideration is needed, however, of how to give inspectors room for discretion if a kiln has a demonstrably. high. retention of specific pollutants or other special features.
9 Exclusion of specific wastes would,reqtiire more analysis than.is currently performed by blenders when producing SLF.. Metal content is typically not analysed- for each : consignment, for example. There- would be substantial practical and economic difficulties in any exclusion -system, although. regulation on a spot check basis is. an option to consider.
R&D Technical Report P274 79
4. Economic and Market Issues
4.1 Economics
4.1.1’ Introduction,
The .main question is whether the market for SLF in cement kilns provides an economic incentive to use disposal routes ,with higher environmental impacts than others. Specific points are:
l whether. recyclable ,‘wastes might be sent as SLF : to cement kilns. or-, incinerators instead of being recycled
0 whether ,high CV incinerable wastes are attracted into SLP rather than. being sent to merchant incinerators, making it more difficult -for. incinerator., operators to burn a mixture of wastes economically.
There are various cost and price elements of relevance, and these are reviewed-below: All cost estimates are only approximate. Although Chem Systems received data in confidence from a number of operators,- the information presented here is typical rather than specific to any site.- The figures have been altered slightly to aid confidentiality, but not to an extent that affects directional conclusions. It should also be recognised that costs will vary with waste type..
4.1.2 Solvent prices
Solvents may be recovered from. organic wastes either as single solvents, such as acetone, or as a mixture, often termed thinners.
The price achieved for recycled single solvent is related to that for new solvent. Depending on the quality: of the recycled material. and the needs of the application, recycled solvent typically commands a price of ,50 to 70 percent of that of new solvent.
Bulk production- of new solvents is essentially a commodity business in which prices. are related to production costs and the -balance of capacity and. consumption.. Prices of new solvents tend to fluctuate with the industry business cycle, as Figure 4.1 illustrates. As recycling economics.are not as strongly linked to the chemical industry cycle, this means that the margin available to recyclers should also.fluctuate.
R&D.Technical Report P274 * 80
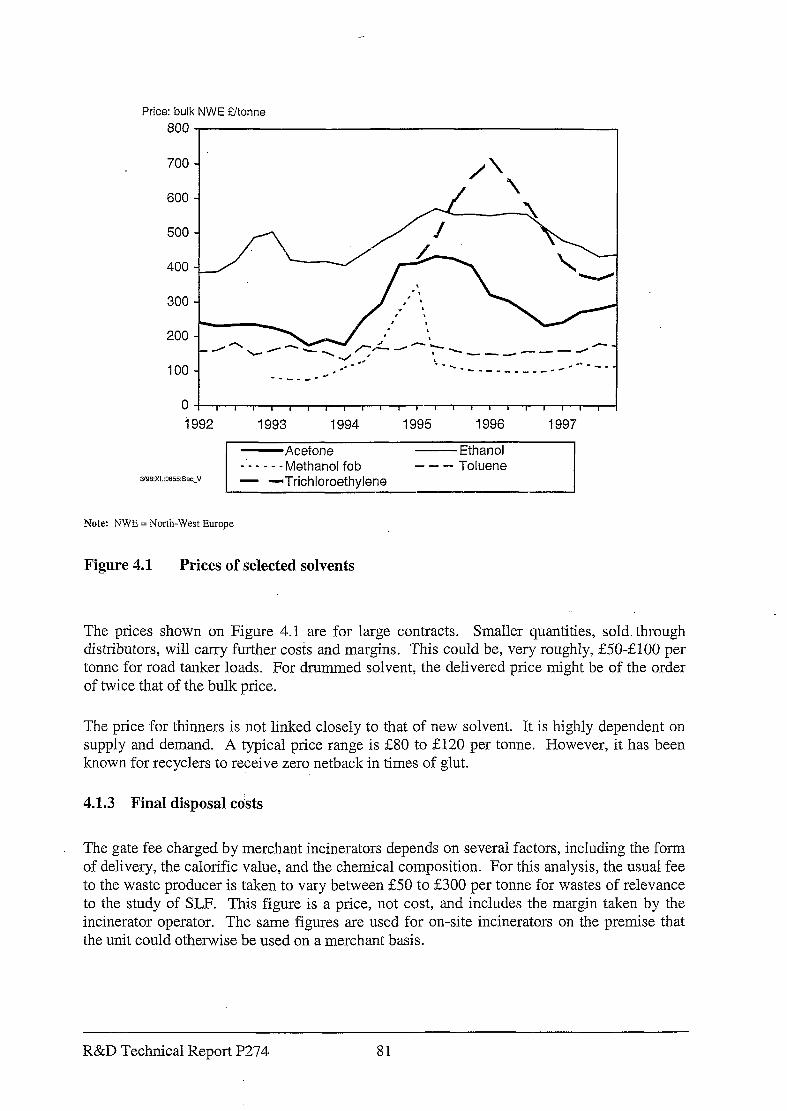
Price: bulk NWE fltonne
800
600
i992
3/9R:XL:0655:SecJ
1993 1994 1995 1996 1997
-Acetone -Ethanol - - . _ _ -Methanol fob - - - Toluene - -Trichloroethylene
Note: N’ME = North-West Europe
Figure 4.1 Prices of selected solvents
The prices shown on Figure 4.1 are for large contracts. Smaller quantities, sold. through distributors, will carry further costs and margins. This could be, very roughly, &50-El00 per tonne for road tanker loads. For drummed solvent, the delivered price might be of the order of twice that of the bulk price.
The price for thinners is not linked closely to that of new solvent. It is highly dependent on supply and demand. A typical price range is &SO to El20 per tonne. However, it has been known for recyclers to receive zero netback in times of glut.
4.1.3 Final disposal cdsts
The gate fee charged by merchant incinerators depends on several factors, including the form of delivery, the calorific value, and the chemical composition. For this analysis, the usual fee to the waste producer is taken to vary between 550 to BOO per tonne for wastes of relevance to the study of SLF. This figure is a price, not cost, and includes the margin taken by the incinerator operator. The same figures are used for on-site incinerators on the premise that the unit could otherwise be used on a merchant basis.
R&D Technical Report P274 81
In compliance with regulatory trends, landfill should not be considered as a long term option for liquid solvent wastes. and. similar. With. deep recovery of solvent (see below), a solid : residue is left that can be,landfilled. The landfill -may be on-site or external. A cost range of &5 to &30 per tonne is assumed, to the waste producer.‘.
4.1.4, SLF prices and.costs
For a cement kiln operator, the SLF displaces other fuels: ‘There are,additional set up costs -in burning, SLF,. such as the need .for .tankage and pumps, and running costs that .include analytical work. Cement kiln -operators-are-also aware that the provider ‘of SLF would .face the cost of alternative means of disposal if the material were sent elsewhere. It is Chem Systems’ understandin g that the cement kiln’may pay a price for the SLF or may charge a gate fee. This is typically the subject of a confidential- formula that includes the energy content, and :makes allowance for unwelcome components. The kiln chemistry dictates which components are unwelcome; in some cases they might include chlorine, for example.
A range of &20 fee to 520 credit’is taken as typical for SLF.
The production costs of SLF are not insignificant. Material supplied in drums must be removed in a drum handling facility. Extensive analysis is needed .of the wastes and the. material must be blended to meet the SLF specification established by the. Environment Agency. For drum handlin g, costs of 215 to 225 per tonne are assumed.. The cost of SLF blending is taken as &25 to &45 per tonne. These figures include site overhead as well as direct costs, but not depreciation and margin.
4.1.5 Recycling costs
Two cases of recycling are reviewed. ..The first is the case in which recovery is around 65 percent, and the residue can be handled as a liquid. There is then a choice of disposing of. the residues by sending to incineration, or by blending into SLF.
In the second case, the solvent recovery. proceeds until a dry residue is produced. CSolvent: recovery might be around 80 percent and the residue.can be.sent to landfill.::
Recycling is performed.on batch stills. Figure 4.2 .indicates the diminishing recovery with time as the -distillation progresses. The cost of processing.. a tonne g of waste increases significantly as the percentage recovery increases. The s solvent recovered at higher percentage recovered tends to be coloured, and needs further processing to achieve commercial clarity.
The cost of processing one tonne .of waste is taken as &40 to 560 per -tonne for recovery at 65 percent,,.and.&60 to &90 per tonne at 80 percent. As with SLF processing, this does -not include depreciation and margin. The costs of drum handling need to be added for drummed waste.
R&D Technical Report P274 82
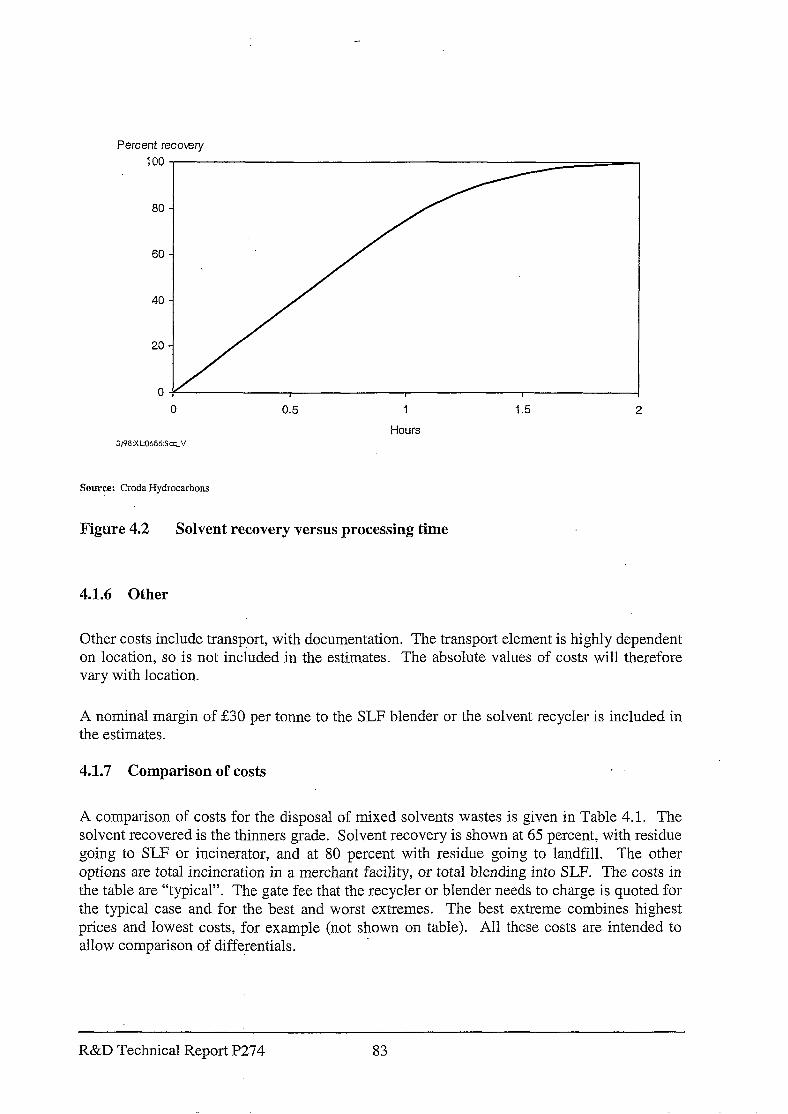
Percent recovery
0 0.5 1 1.5 2
Hours 3m:xLo655:sez~v
Source: Croda Hydrocarbons
Figure 4.2 Solvent recovery versus processing time
4.1.6 Other
Other costs include transport, with documentation. The transport element is highly dependent on location, so is not included in the estimates. The absolute values of costs will therefore vary with location.
A nominal margin of E30 per tonne to the SLF blender or the solvent recycler is included in the estimates.
4.1.7 Comparison of costs
A comparison of costs for the disposal of mixed solvents wastes is given in Table 4.1. The solvent recovered is the thinners grade. Solvent recovery is shown at 65 percent, with residue going to SLF or incinerator, and at 80 percent with residue going to landfill. The other options are total incineration in a merchant facility, or total blending into SLF. The costs in the table are “typical”. The gate fee that the recycler or blender needs to charge is quoted for the typical case and for the best and worst extremes. The best extreme combines highest prices and lowest costs, for example (not shown on table). All these costs are intended to allow comparison of differentials.
R&D Technical Report P274 83
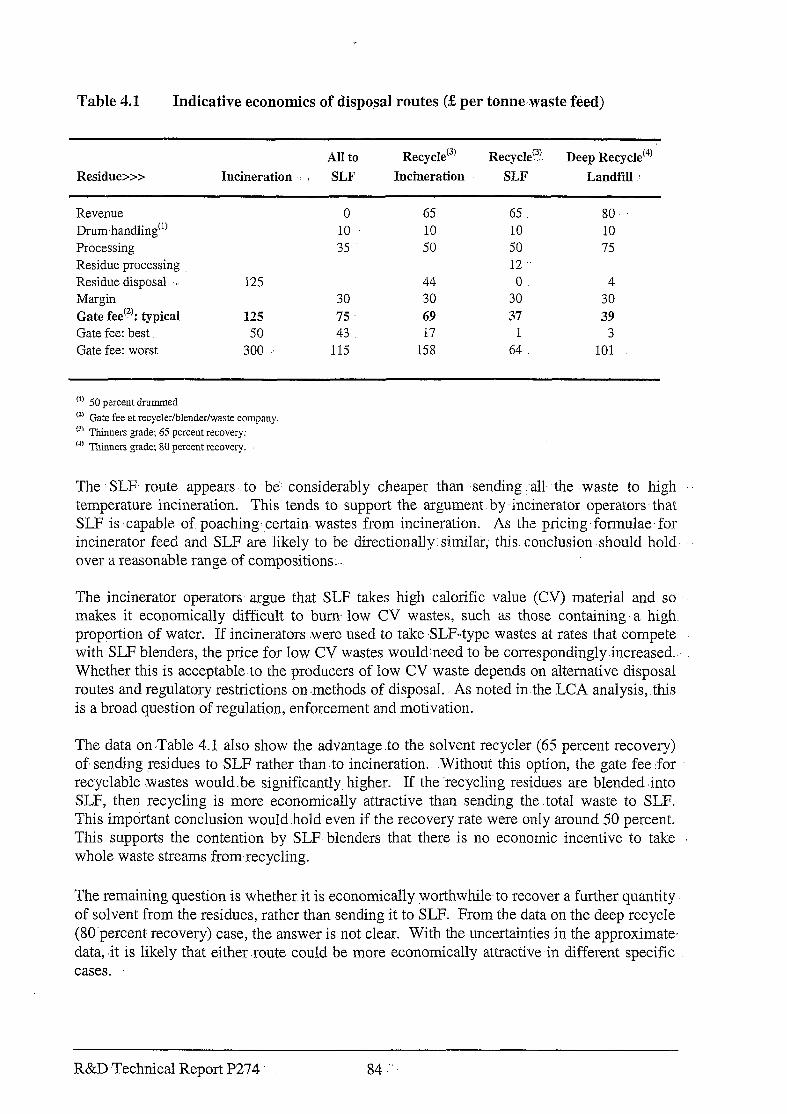
Table 4.1 Indicative economics of disposal routes (S per tonne,waste f&d)
Residue>>>
All to RecycleC3’ Recycle?!. Deep RecycleC4’
Incineration C SLF Incineration SLF Landfill .:
Revenue Drum handling”’ Processing Residue processing Residue disposal I’ Margin Gate fee’“: typical Gate fee: best Gate fee: worst
0 65 10 10 35 50
125 44 30 30
125 75 69 50 43 17
300 ‘. 115 158
65 : 10 50 12 ‘. 0.
30 37
1 64
80 10 75
4 30 39
3 101
(*) 50 percent drummed
(” Gate fee at recycler/blender/waste company.
13’ Thinners grade; 65 percent recovery.
i4) Thinners grade; 80 percent recovery.
The SLF- route appears to be considerably cheaper than ,sending .-all ,the waste to high temperature incineration. This tends to support the argument by -incinerator operators that SLF is -capable of poaching-.certain- wastes from incineration. As the pricing.formulae- for incinerator feed and.SLF are likely to be directionally:similai-; this. conclusion should hold- over a reasonable range of compositions.
The incinerator operators argue that SLF takes high calorific value (CV) material and so makes it economically difficult to bum low CV wastes, such as those containing. a high. proportion of water. If incinerators were used to take -SLF-type wastes at rates that compete with SLF blenders, the price for low CV wastes. would:need to be correspondingly.increased.- Whether this is acceptable-to the producers of low CV waste depends on alternative disposal routes and regulatory restrictions on .methods of disposal. As noted in the LCA analysis, this is a broad question of regulation, enforcement and motivation.
The data on ,Table 4.1 also show the advantage .to the- solvent recycler (65 percent recovery) of. sending residues to SLF rather than to incineration.. .Without this option, the gate fee :for recyclable -wastes would-be significantly higher. If the recycling residues are blended.into SLF, then recycling is more economically attractive than sending the .total waste to SLF. This imp&ant conclusion would.hold even if the recovery rate were only around 50 percent. This supports the contention by SLF blenders that there is no economic incentive to take whole waste streams from recycling.
The remaining question is whether it is economically worthwhile-to recover a further quantity of solvent from the residues, rather than sending it to SLF. From the data on the deep recycle (80 percent recovery) case, the answer is not clear. With the uncertainties in the approximate, data, it is likely that either .route could be more economically attractive-in different specific cases.
R&D Technical Report P274 84 :’
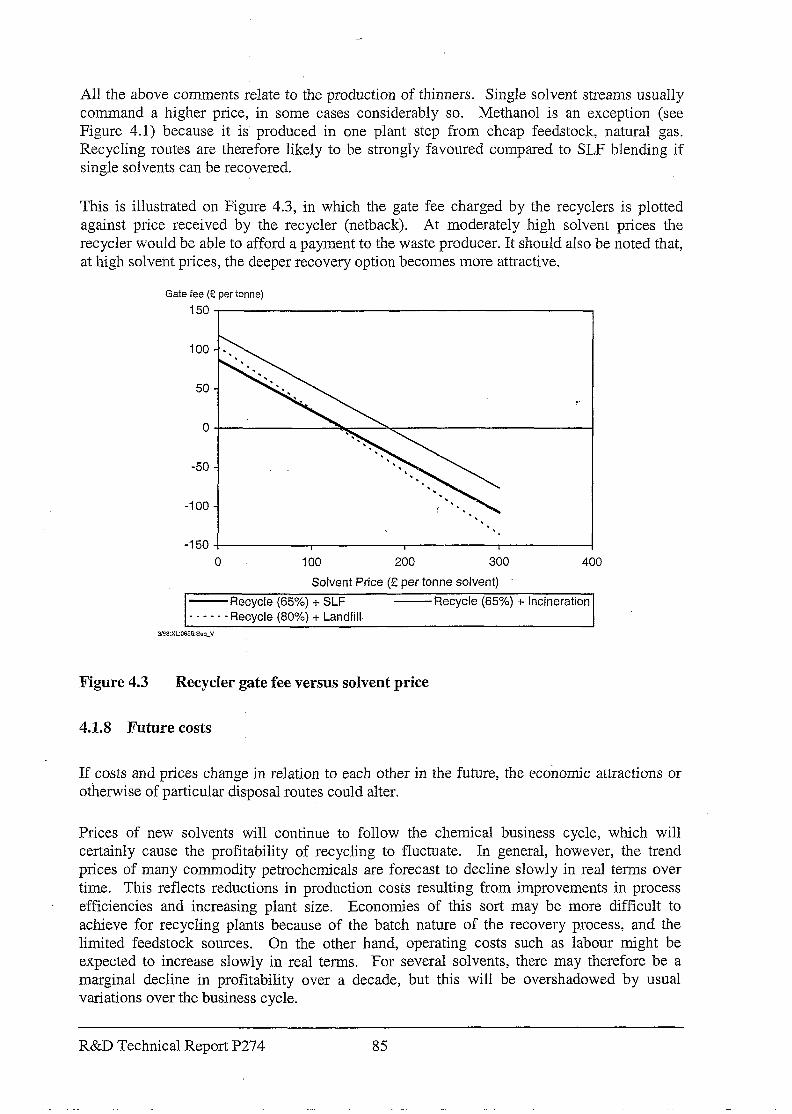
All the above comments relate to the production of thinners. Single solvent streams usually command a higher price, in some cases considerably so. Methanol is an exception (see Figure 4.1) because it is produced in one plant step from cheap feedstock, natural gas. Recycling routes are therefore likely to be strongly favoured compared to SLF bIending if single solvents can be recovered.
This is illustrated on Figure 4.3, in which the gate fee charged by the recyclers is plotted against price received by the recycler (netback). At moderately high solvent prices the recycler would be able to afford a payment to the waste producer. It should also be noted that, at high solvent prices, the deeper recovery option becomes more attractive.
Gate fee (f per tonne)
150
-150 ! I I 0 100 200 400
Solvent Price (f per tonne solvent)
-Recycle (65%) + SLF -Recycle (65%) + Incineration -_-__ -Recycle (80%) + Landfill.
Figure 4.3 Recycler gate fee versus solvent price
4.1.8 Future costs
If costs and prices change in relation to each other in the future, the economic attractions or otherwise of particular disposal routes could alter.
Prices of new solvents will continue to follow the chemical business cycle, which will certainly cause the profitability of recycling to fluctuate. In general, however, the trend prices of many commodity petrochemicals are forecast to decline slowly in real terms over time. This reflects reductions in production costs resulting from improvements in process efficiencies and increasing plant size. Economies of this sort may be more difficult to achieve for recycling plants because of the batch nature of the recovery process, and the limited feedstock sources. On the other hand, operating costs such as labour might be expected to increase slowly in real terms. For several solvents, there may therefore be a marginal decline in profitability over a decade, but this will be overshadowed by usual variations over the business cycle.
R&D Technical Report P274 85
The price of SLF will remain within the range.of a credit of the avoided cost of other kiln fuels and a debit of the alternative disposal route for the waste producer. Supply and demand: may affect the,price in the loiiger term. At present, however,- the sale of SLF seems to be linked. to formulae rather than pricing as a commodity ,in a free market; This -reflects :the degree -of commitment: on both sides and the need for reliable supply of a tightly specified material.
Supply and demand-will be the major factor in determining incinerator prices. Where there is. competition, for wastes, such as with SLF, the incinerators might need to drop the -gate fee. The mainquestion, however, is whether pressure will be-increased to move wastes away from. landfill: .This would increase demand for incineration; for which additional capacity might be needed.
The future relationship of the cost elements, is therefore difficult to predict as it is contingent on .several factors. Some of these factors, relating to supply :and,demand, are reviewed in Section 4.2.
4.2 Waste Supply and Disposal : :!
4.2.1 : Aim
The main topic of interest is whether the blending- of .organic waste into SLF! has deprived recycling or incineration of feedstocks, or will do so in the future. The quantity of SLF for cement kilns has risen to around 70 000 to 80 000 tons per year since:the first authorisations. A further quantity is used in lime kilns, which is not covered here.
The following indications have been compiled to assist in answering this question. However, insuffIcient information is available for a fully accurate analysis.
4.2.2 Solvent Recycling
Table 4.2 indicates the quantities of feedstock processed by the-member companies of CORA (Chemical and Oii Recovery,,Association). The data are for 1990 to 1994. CORA compiles the data on an occasional basis and has not supplied more recent information.
R&D-Technical Report P274 86
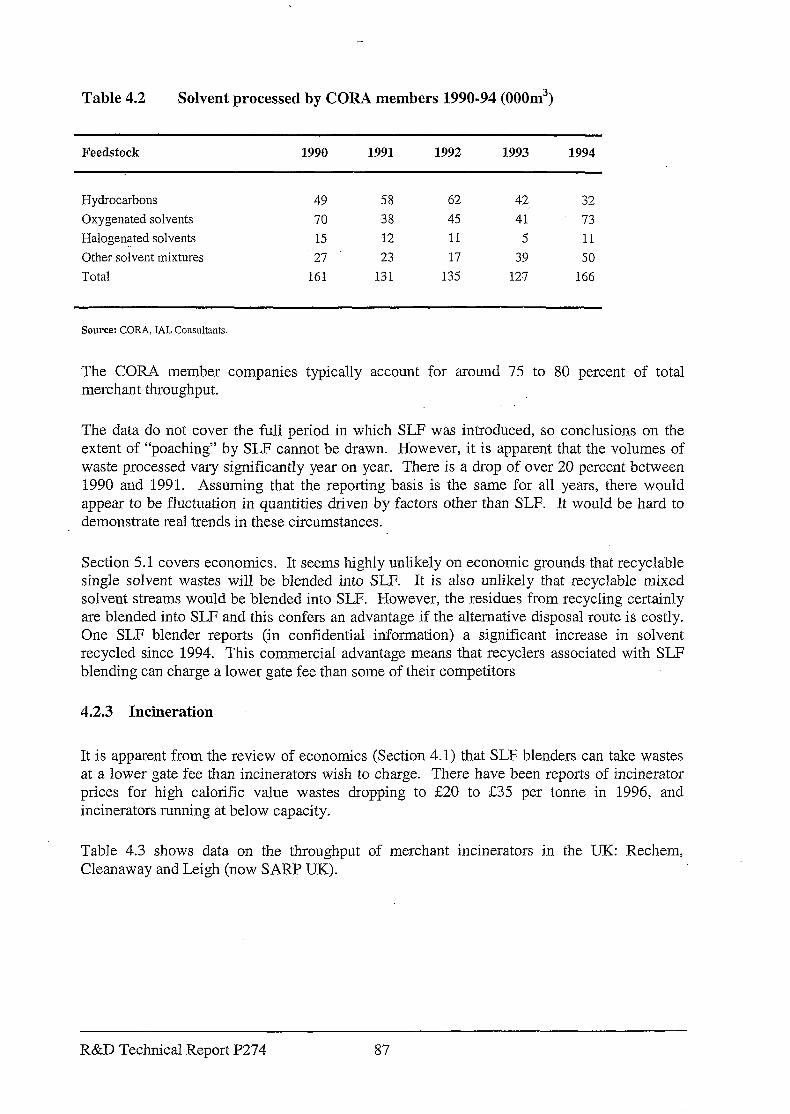
Table 4.2 Solvent processed by CORA members 1990-94 (OOOm3)
Feedstock 1990 1991 1992 1993 1994
Hydrocarbons 49 58 62 42 32
Oxygenated solvents 70 38 45 41 73
Halogenated solvents 1.5 12 11 5 11
Other solvent mixtures 27 23 17 39 50
Total 161 131 135 127 166
Source: CORA, IAL Consultants.
The CORA member companies typically account for around 75 to 80 percent of total merchant throughput.
The data do not cover the full period in which SLF was introduced, so conclusions on the extent of “poaching” by SLF cannot be drawn. However, it is apparent that the volumes of waste processed vary significantly year on year. There is a drop of over 20 percent between 1990 and 1991. Assuming that the reporting basis is the same for all years, there would appear to be fluctuation in quantities driven by factors other than SLF. It would be hard to demonstrate real trends in these circumstances.
Section 5.1 covers economics. It seems highly unlikely on economic grounds that recyclable single solvent wastes will be blended into SLF. It is also unlikely tha.t recyclable mixed solvent streams would be blended into SLF. However, the residues from recycling certainly are blended into SLF and this confers an advantage if the alternative disposal route is costly. One SLF blender reports (in confidential information) a significant increase in solvent recycled since 1994. This commercial advantage means that recyclers associated with SLF blending can charge a lower gate fee than some of their competitors
4.2.3 Incineration
It is apparent from the review of economics (Section 4.1) that SLF blenders can take wastes at a lower gate fee than incinerators wish to charge. There have been reports of incinerator prices for high calorific value wastes droppin g to 220 to 235 per tonne in 1996, and incinerators running at below capacity.
Table 4.3 shows data on the throughput of merchant incinerators in the TJK: Rechem, Cleanaway and Leigh (now SARP UK).
R&D Technical Report P274 87
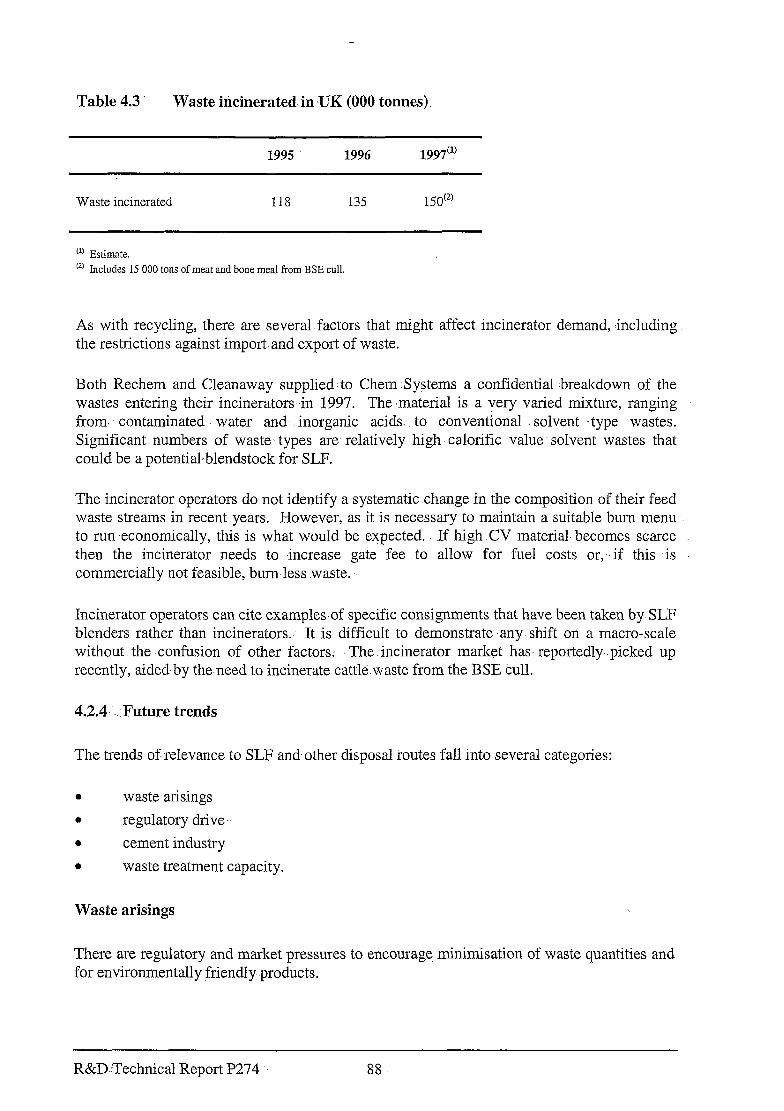
Table 4.3 Waste incinerated. in ,lJK (000 tonnes)
1995 1996 1997’1’
Waste incinerated 118 135 150C2’
(‘) Estimate. (‘I Includes 15 000 tons of meat and bone meal from BSE cull.
As with recycling, there are several factors that might affect incinerator demand, :including the restrictions against import and export of waste.
Both Rechem and Cleanaway supplied, to Chem Systems a confidential .breakdown of the wastes entering their incinerators in 1997. The material is a very varied mixture, ranging from--- contaminated -water and, inorganic acids. to conventional , solvent type wastes. Significant numbers of waste. types are relatively high calorific value solvent wastes that could be a potentialsblendstock for SLF.
The incinerator operators do not identify a systematic change in the composition of their feed waste streams in recent years. However, as it is necessary to maintain a suitable burn menu to run .economically, this is what would be expected. If high CV material. ‘becomes scarce then the incinerator needs to increase gate’ fee to allow for fuel costs or; if this is commercially not feasible, bum.Iess waste..
Incinerator operators can cite examples-of specific consignments that have been taken by SLF blenders rather than incinerators.. It is difficult to demonstrate .any shift on a macro-scale without the confusion of other factors. The incinerator market has. reportedly.- picked up recently, aided by the-need to incinerate cattlewaste from the BSE cull.
42.4 :Future trends
The trends of:relevance to SLF and- other disposal routes fall into several categories:
0 waste arisings 0 regulatory drive l cement industry 0 waste treatment capacity.
Waste arisings
There are regulatory and market pressures to encourage minimisation of waste quantities and for environmentally friendly-products.
R&D.:Technical Report P274 88
In several solvent applications, the move to low-solvent, aqueous or dry systems is well established. This applies to formulated products such as coatings, inks, adhesives and agrochemicals. The shift is also apparent in surface cleaning and electronics. This trend will continue where technically feasible.
There is also current pressure to reduce emissions of VOCs (Volatile Organic Compounds), including in solvent applications. Companies may choose to retain solvent-based systems and introduce abatement. The abatement techniques may be containment, destruction, or recovery from the air stream. If recovery is used, it is even possible that the quantities of dirty solvent requiring recycle could increase.
The use of some solvents, particularly chlorinated products, is likely to decline in some areas because of health or environmental concerns and perceptions.
Non-solvent wastes include those from processing operations, such as distillation residues. Producers will minimise these for economic reasons as well as to satisfy regulatory pressures. There will be notable exceptions to this trend,. arising from expansion of plants.. A .further factor could occur if Inspectors classify more by-product streams as wastes, which could place more waste into the external disposal market.
Waste oils are a large source of organic wastes (see Section 2.3). There is no reason to anticipate a decline in the quantity of waste oils produced from transport-related sources.
The quantities of wastes are not well established, so it is not possible to forecast arisings. Chem Systems’ judgement on broad trends is summarised in Table 4.4. Trends in solvent use are based on market analysis for new solvents in Western Europe. Waste minimisation possibilities are based on quoted achievements and targets in the industry world-wide. Arisings of oil wastes are expected to grow broadly with GDP.
The trend data are indicative only, but they su ggest a net future decline in the quantities of organics in the UK wastes that might be candidates for SL*F.
R&D Technical Report P274 89
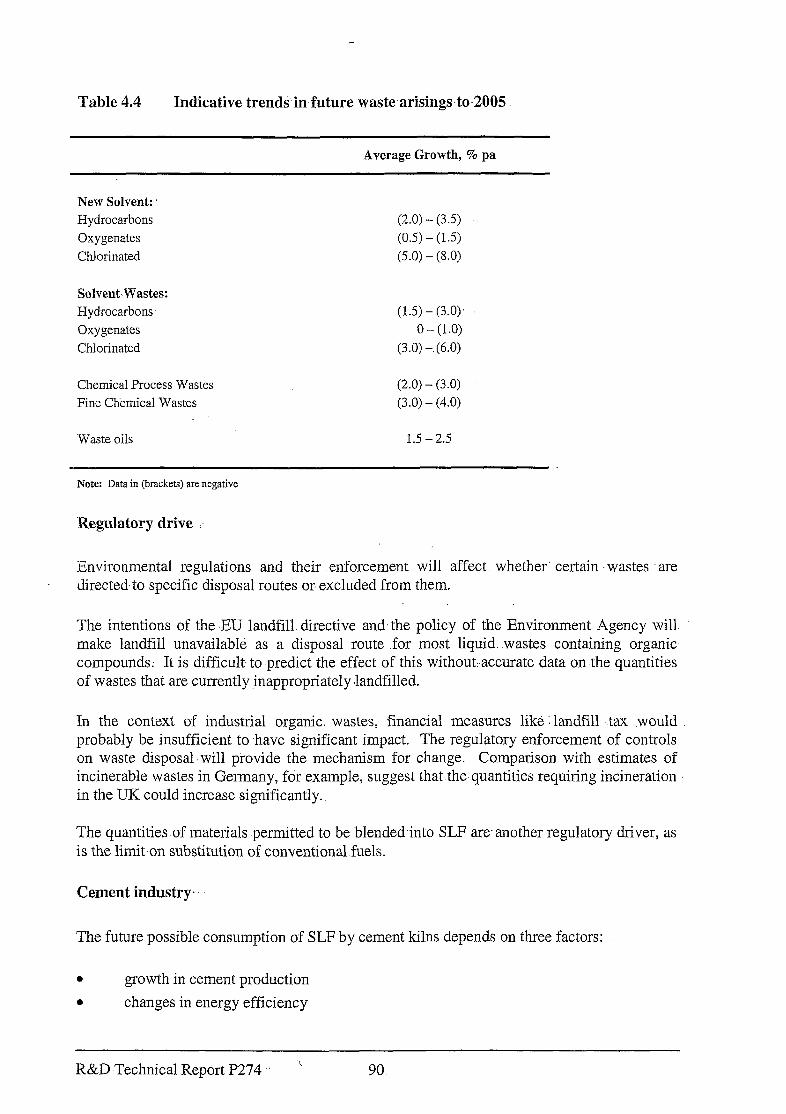
Table 4.4 Indicative trends’in-future waste arisingsto.2005
Average Growth, % pa
New Solvent: Hydrocarbons
Oxygenates
Chlorinated
SolvenbWastes: Hydrocarbons Oxygenates
Chlorinated
Chemical Process Wastes
Fine Chemical Wastes
Waste oils
(2.0) - (3.5)
(0.5) - (1.5)
(5.0) - (5.0)
(1.5) - (3.0) 0 - (1.0)
(3.0) -.(6.0)
(2.0) - (3.0) (3.0) - (4.0)
1.5 - 2.5
Note: Data in (brackets) are negative
Regulatory drive :
Environmental regulations and their enforcement will affect whether‘ certain ‘wastes are directed to specific disposal routes or- excluded from them.
The intentions of the .EU landfill. directive and.the policy of the Environment Agency will. make landfill unavailable as a disposal route .for most liquid. wastes containing organic compounds; It is difficult. to -predict the effect of this withoutaccurate data on the quantities of wastes that are currently inappropriately .landfilled.
In the context of industrial organic. wastes, financial measures like ‘landfill .tax would probably be insufficient to -have significant impact. The regulatory enforcement of controls- on waste disposal .will provide the mechanism for change. Comparison with estimates of incinerable wastes in Germany, for example, suggest that the-quantities requiring incineration in the UK could increase significantly.
The quantities of materials permitted to be blendedinto SLF are.another regulatory driver, as is the limit-on substitution of conventional fuels.
Cement industry
The future possible consumption of SLF by cement kilns depends on three factors:
0 growth in cement production a changes in energy efficiency
R&D Technical Report P274 “\ 90
0 producers’ wish to substitute fuels.
Cement is a mature industry. The demand is very heavily dependent on construction activity. The production peaked at around 17 million tons in 1989 and has recently been around 13 million tons per year. The cycles cannot be predicted with any confidence. The trend growth is likely to be low, at around one to two percent per year.
The energy efficiency of the kilns is very dependent on the type of process, and this is strongly influenced by the characteristics of the feedstock supply. Chem Systems understands that rationalisation in the number of plants is likely to continue, and that new plants with wet feed may be semi-wet processes rather than wet. The average energy consumption in UK kilns decreased from around 7.5 GJ/tonne clinker in 1961 to around 4.4 GJ/tonne in 1991. This trend is expected to continue to some extent.
The producers are not necessarily committed to the maximum possible substitution of usual fuels with SLF. There are product quality issues to be addressed, and stringent environmental requirements relating to the SLF composition. In addition,-as noted in Section2.3, there are other waste-derived fuels such as tyres and plastics that can be used.
The potential demand for SLF, based on current capacities and processes, is shown on Table 2.12. Even allowing for some improvement in energy efficiency and the supply of other wastes, there is a potential maximum demand for SLF well in excess of 400 000 tons per year.
Waste treatment capacity
The economics of solvent recycling, combined with a probable slow decline in waste arisings, mean that recycling capacity is likely to be in place to satisfy UK demand.
Incinerator capacity is more difficult to predict. However, at least one merchant incinerator is considering expansion of .hazardous waste incineration capacity. Provided that the wastes are directed by regulation to incineration, pricing of disposal must adjust in the marketplace to support reinvestment. Overview
The arisings of-several categories of organic wastes should tend to diminish in coming years because of environmental pressures. Landfill is likely to be excluded as a disposal route in many instances, so that the quantities of wastes for incineration or SLF are expected to increase.
The maximum quantity of SLF that could be used in cement kilns is very significant compared to the current merchant incineration market, and could cause distortion of pricing or other factors. On present indications, it is unlikely that current producers will choose to maximise the use of SLF to this extent.
R&D Technical Report P274 91
5. SUMMARY AND CONCLUSIONS
5.1 General
This section of the report is a succinct summary of the findings-of the study into the use of -. Substitute Liquid Fuels (SLF) in-cement kilns:
It covers:
l sources of waste that could.be blended into-SLF : l a Life Cycle Assessment (LCA) on the use of SLF l a commentary on economic and market issues a conclusions and possible criteria for.exclusion of wastes from SLF.
5.2 Waste Streams.
The waste streams that are used in SLF; or are potential: sources of SLF, fall into several main categories.
0 Solvent wastes arise from many sources, including fme chemical production and the s industrial application of products that. contain solvents,- such as coating, adhesives, metal cleaning and others; In practice, a large part of the solvent wastes is sent to recyclers. The residues from recycling is a significant category of SLF:waste. Most of the existing-SIF blenders are also recyclers.
8 Non-solvent arisings, primarily from the chemical industry,: include by-products, reagents, feedstocks and process wastes. This covers a very wide range of,. compounds. One chemical by-product, from an adipic acid plant, is a major SLF stream.
s Used-lubricating oils, and similar are extensively fed to cement kilns .in Germany. Other disposal routes are used in the UK, but this is a possible contributor to SLF.
l Many wastes are classified ,as oily wastes in the Environment Agency’s developing database. Total quantities are large, but insufficient information is available to determine whether this too could be a source of SLF.
Compositions
The Environment Agency imposes very tight,specifications on, the SLF blend .that. is supplied to each cement kiln that uses it. However, the compositions of the wastes that are, blended into SLF vary widely, even-when from similar sources. This suggests that any criteria for excluding wastes from SLF‘must be based on composition and properties, not waste source.
R&D Technical Report P274 .. 92
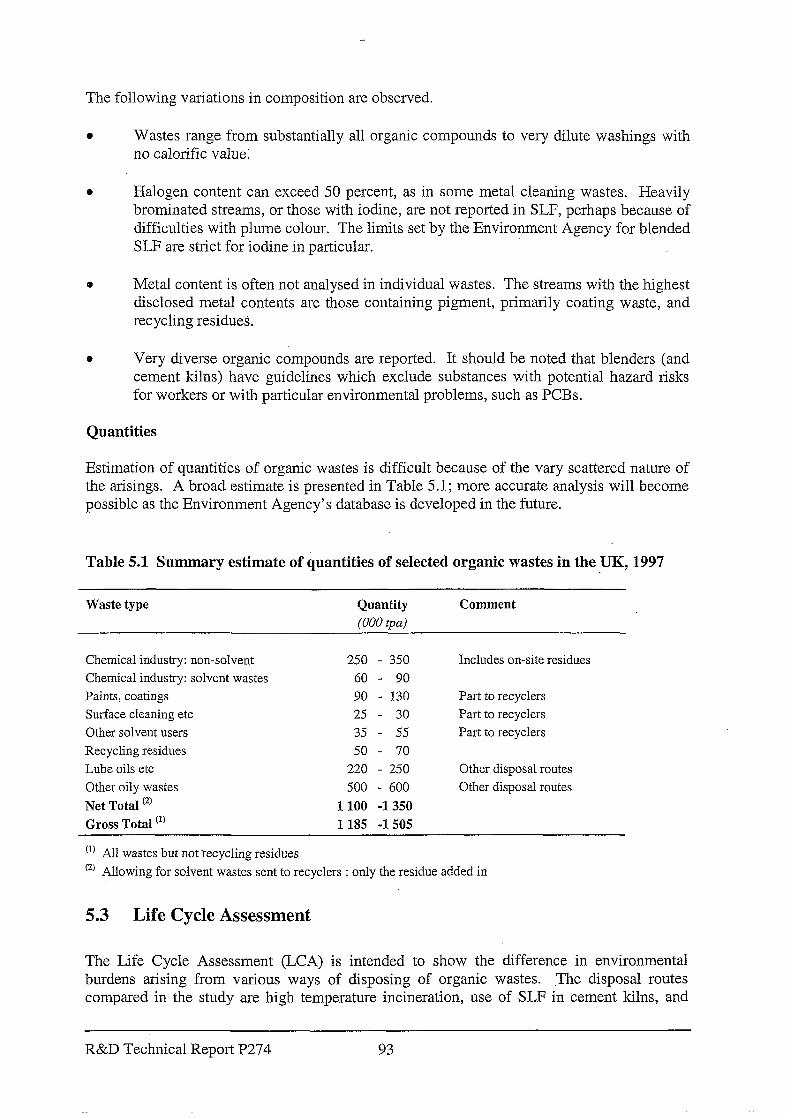
The following variations in composition are observed.
a Wastes range from substantially all organic compounds to very dilute washings with no calorific value:
a Halogen content can exceed 50 percent, as in some metal cleaning wastes. Heavily brominated streams, or those with iodine, are not reported in SLF, perhaps because of difficulties with plume colour. The limits set by the Environment Agency for blended SLF are strict for iodine in particular.
a Metal content is often not analysed in individual wastes. The streams with the highest disclosed metal contents are those containing pigment, primarily coating waste, and recycling residues.
l Very diverse organic compounds are reported. It should be noted that blenders (and cement kilns) have guidelines which exclude substances with potential hazard risks for workers or with particular environmental problems, such as PCBs.
Quantities
Estimation of quantities of organic wastes is difficult because of the vary scattered nature of the arisings. A broad estimate is presented in Table 5.1; more accurate analysis will become possible as the Environment Agency’s database is developed in the future.
Table 5.1 Summary estimate of iuantities of selected organic wastes in the UK, 1997
Waste type Quantity (000 tpa)
Comment
Chemical industry: non-solvent Chemical industry: solvent wastes
Paints, coatings
Surface cleaning etc
Other solvent users
Recycling residues Lube oils etc
Other oily wastes
Net Total (2)
Gross Total (I)
250 - 350
60 - 90
90 - 130
25 - 30
35 - 55
50 - 70
220 - 250
500 - 600
1100 -1350
1185 -1505
Includes on-site residues
Part to recyclers
Part to recyclers Part to recyclers
Other disposal routes
Other disposal routes
(‘) All wastes but not recycling residues
(‘) Allowing for solvent wastes sent to recyclers : only the residue added in
5.3 Life Cycle Assessment
The Life Cycle Assessment (LCA) is intended to show the difference in environmental burdens arising from various ways of disposing of organic wastes. .The disposal routes compared in the study are high temperature incineration, use of SLF in cement kilns, and
R&D Technical Report P274 93
solvent recycling. Landfill ‘and discharge to sewer or surface water are not--considered as legitimate disposal options: for -economic reasons, waste components, would not *be sent to incineration, for example, in preference to landfill unless regulations required.:it. To permit. .( an analysis.to be made of the influence of different components in the waste, the LCA was performed for a number of wastes representing a range of specified compositions.
Blending organic .wastes into SLF and burning in cement kilns is preferable to disposal by incineration for.most of the parameters considered in the LCA. This-.is largely because the SLF is replacing conventional cement .kiln‘ fuels, coal and.petroleum coke;. Both cement kilns and high temperature incinerators -are very effective ways of. disposing of organics in terms of destruction efficiency, and. containment of secondary pollutants such as acid gases and metals.
Although- the cement kiln route is preferable to incineration for .almost every parameter, there are possible exceptions. From available data, it seems likely that the. containment of hydrogen halides is more complete on an incinerator (fitted-with specific abatement) than in a cement kiln which relies on -the alkalinity of the raw materials. I Volatile.. and, semi-volatile metals may follow this pattern too. However, it should be noted that to provide a definitive analysis, a component mass .balance is necessary;.and there is uncertainty and variability in available-data. Nevertheless, most data suggest that metal. compounds are released only ,at very low concentrations, and halogen compounds:at low concentrations.
The evaluation of solvent-recovery and recycling.is complex as the analysis is.different for every solvent compound. However, the following conclusions are drawn from the analysis.
l Recycling is preferable to incineration on almost every count.;,
8 Recovery of a high percentage of solvent;- to leave a dry-residue, is environmentally preferable to 60-70 percent recovery with incineration of residues.
9 Recycling is not necessarily environmentally preferable to the SLF route. This depends on the solvent type. The .comparison between recycling and SLF shows trade-offs insome areas.
The comparison of disposal routes for a typical oxygenated waste is shown on Figure 5.1. The .figure shows selected burdensfor systems including SLF used in cement-kilns and recycling, expressed as a percentage of burdens from a system including incineration of the subject waste.
R&D.Technical Report P274 94
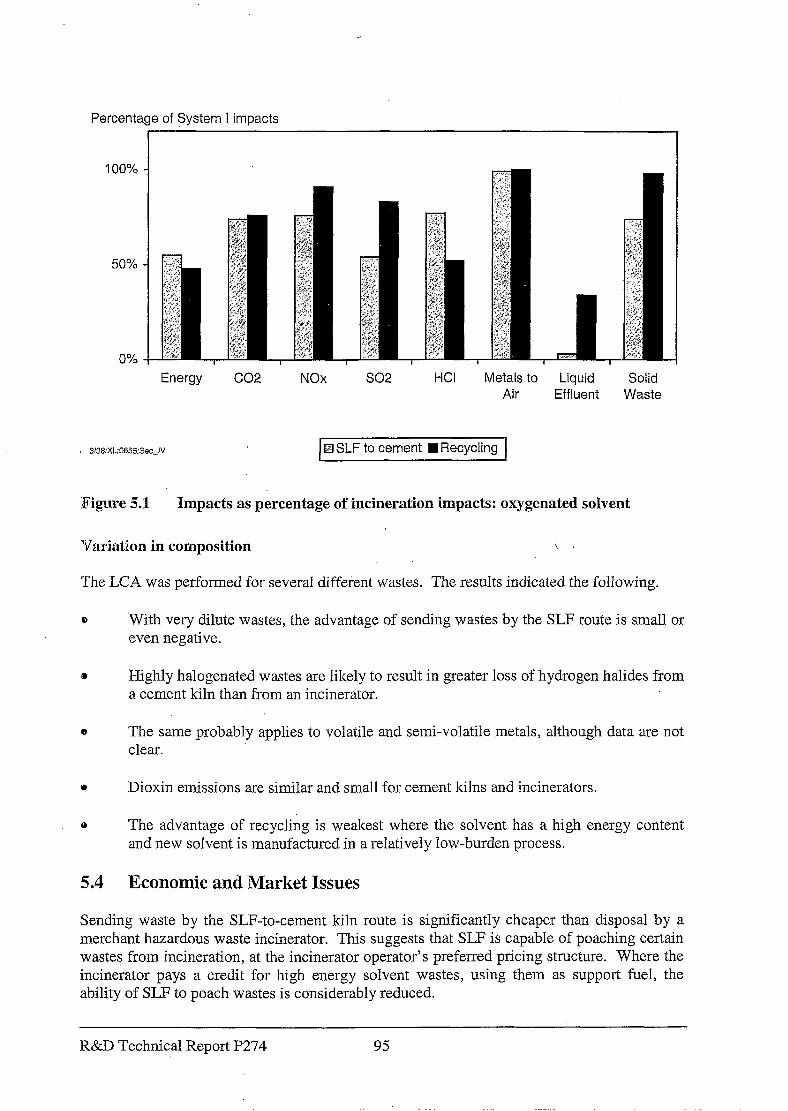
Percentage of System I impacts
Energy co2 NOx HCI Metals to Liquid Solid Air Effluent Waste
, 3/98:XL:G655:Sec~lV 1 El SLF to cement 1 Recycling
Figure 5.1 Impacts as percentage of incineration impacts: oxygenated solvent
Variation in cornposition : .
The LCA was performed for several different wastes. The results indicated the following.
0 .With very dilute wastes, the advantage of sending wastes by the SLF route is small or even negative.
d, Highly halogenated wastes are likely to result in greater loss of hydrogen halides from a cement kiln than from an incinerator.
43 The same probably applies to volatile and semi-volatile metals, although data are not clear.
0 Dioxin emissions are similar and small for cement kilns and incinerators.
0 The advantage of recycling is weakest where the solvent has a high energy content and new solvent is manufactured in a relatively low-burden process.
5.4 Economic and Market Issues
Sending waste by the SLF-to-cement kiln route is significantly cheaper than disposal by a merchant hazardous waste incinerator. This suggests that SLF is capable of poaching certain wastes from incineration, at the incinerator operator’s preferred pricing structure. Where the incinerator pays a credit for high energy solvent wastes, using them as support fuel, the ability of SLF to poach wastes is considerably reduced.
R&D Technical Report P274 95
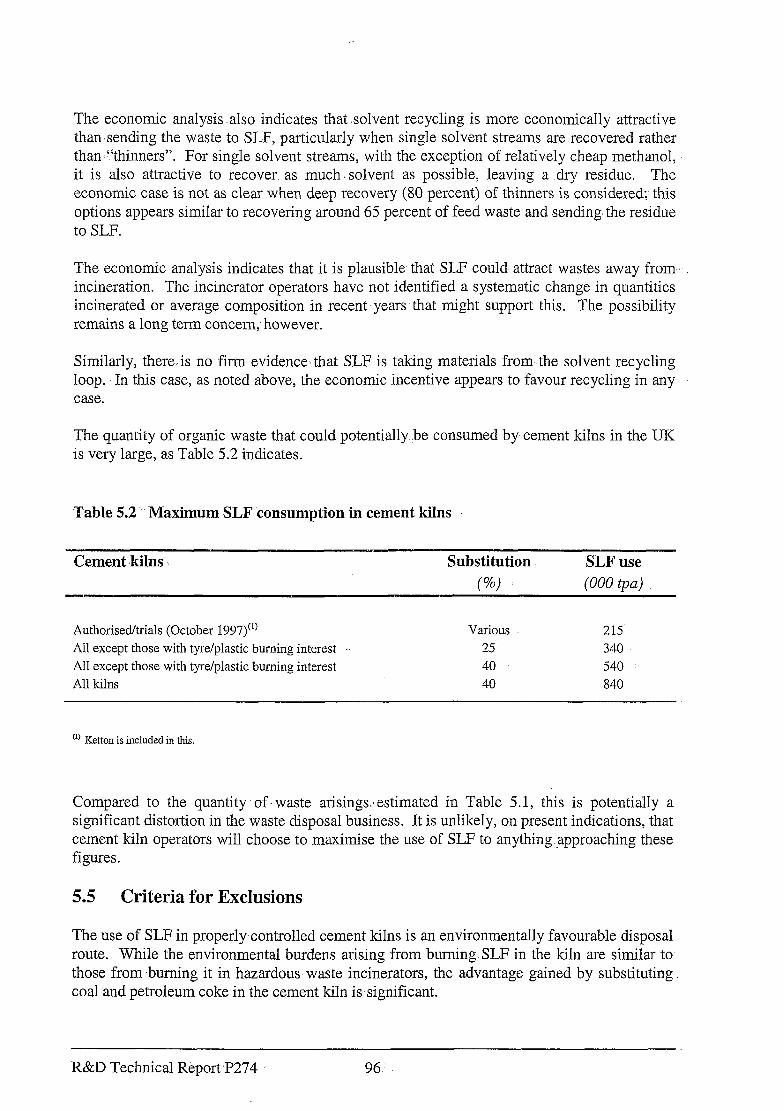
The economic analysis. also indicates that solvent recycling is more economically attractive than sending the waste to SLF, particularly when single solvent streams are recovered rather than “thinners”. For single solvent streams, with the exception of relatively cheap methanol, it is also attractive to recover. as much. solvent as possible, leaving a .dry residue. The economic case is not as clear when deep recovery (80 percent) of thinners is considered; this options appears similar to recovering around 65 percent of feed waste and sending the residue to SLF.
The economic analysis indicates that it is plausible, that SLF could, attract wastes away from incineration. .The incinerator operators have not identified a systematic change in quantities incinerated or average composition in recent -years. that might support this. The possibility remains a long term concern, however.
Similarly, there.is no firm evidence> that SLF is taking materials from -the solvent recycling loop. In this case, as noted above, the economic incentive appears to favour recycling in any case.
The quantity of organic waste that could potentially..be consumed by cement kilns in the UK is very large, as Table 5.2 indicates.
Table 5.2..’ Maximum-SLF consumption in cement kilns
Cement kilns Substitution SLF use (9%) : (000 tpa)
Authorised/trials (October 1997)“’ Various 215’ All except those with tyre/plastic burning interest ‘. 25 340 All except those with tyre/plastic burning interest 40 540 All kilns 40 840
(‘) Ketton is included in this.
Compared to the quantity. of waste arisings- estimated in Table 5.1, this is potentially a significant distortion in the waste disposal business. It is unlikely, on present indications, that cement kiln operators will choose to maximise the use of SLF to anything approaching these figures.
5.5 Criteria for Exclusions
The use of SLF in properly-controlled cement kilns is an environmentally favourable disposal route. While the environmental burdens arising from burning SLF in the kiln are similar to those from .buming it in hazardous waste incinerators, the advantage gained by-substituting coal and petroleum coke in the cement kiln is significant.
R&D .Technical Report .P274 96:
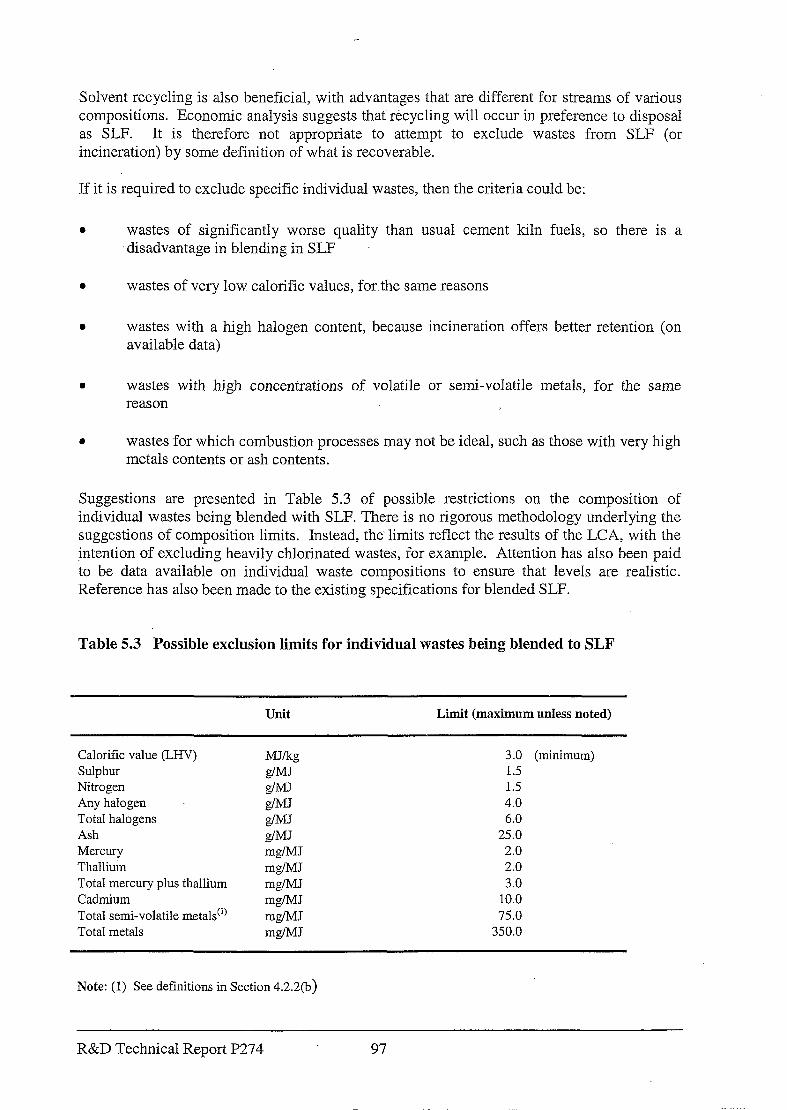
Solvent recycling is also beneficial, with advantages that are different for streams of various compositions. Economic analysis suggests that recycling will occur in preference to disposal as SLF. It is therefore not appropriate to attempt to exclude wastes from SLF (or incineration) by some definition of what is recoverable.
If it is required to exclude specific individual wastes, then the criteria could be:
0 wastes of significantly worse quality than usual cement kiln fuels, so there is a disadvantage in blending in SLF
a wastes of very low calorific values, for the same reasons
l wastes with a high halogen content, because incineration offers better retention (on available data)
a wastes with high concentrations of volatile or semi-volatile metals, for the same reason
0 wastes for which combustion processes may not be ideal, such as those with very high metals contents or ash contents.
Suggestions are presented in Table 5.3 of possible restrictions on the composition of individual wastes being blended with SLF. There is no rigorous methodology underlying the suggestions of composition limits. Instead, the limits reflect the results of the LCA, with the intention of excluding heavily chlorinated wastes, for example. Attention has also been paid to be data available on individual waste compositions to ensure that levels are realistic. Reference has also been made to the existing specifications for blended SLF.
Table 5.3 Possible exclusion limits for individual wastes being blended to SLF
Unit Limit (maximum unless noted)
Calorific value (LHV) Sulphur Nitrogen Any halogen Total halogens Ash Mercury Thallium Total mercury plus thallium Cadmium Total semi-volatile metals”’ Total metals
M.J/kg
$;
Em-J
gi
mMJ mg/MJ m@JJ mg/M.J
mg/MJ mg/MJ
3.0 (minimum) 1.5 1.5 4.0 6.0
25.0 2.0 2.0 3.0
10.0 75.0
350.0
Note: (1) See definitions in Section 4.2.2(b)
R&D Technical Report P274 97
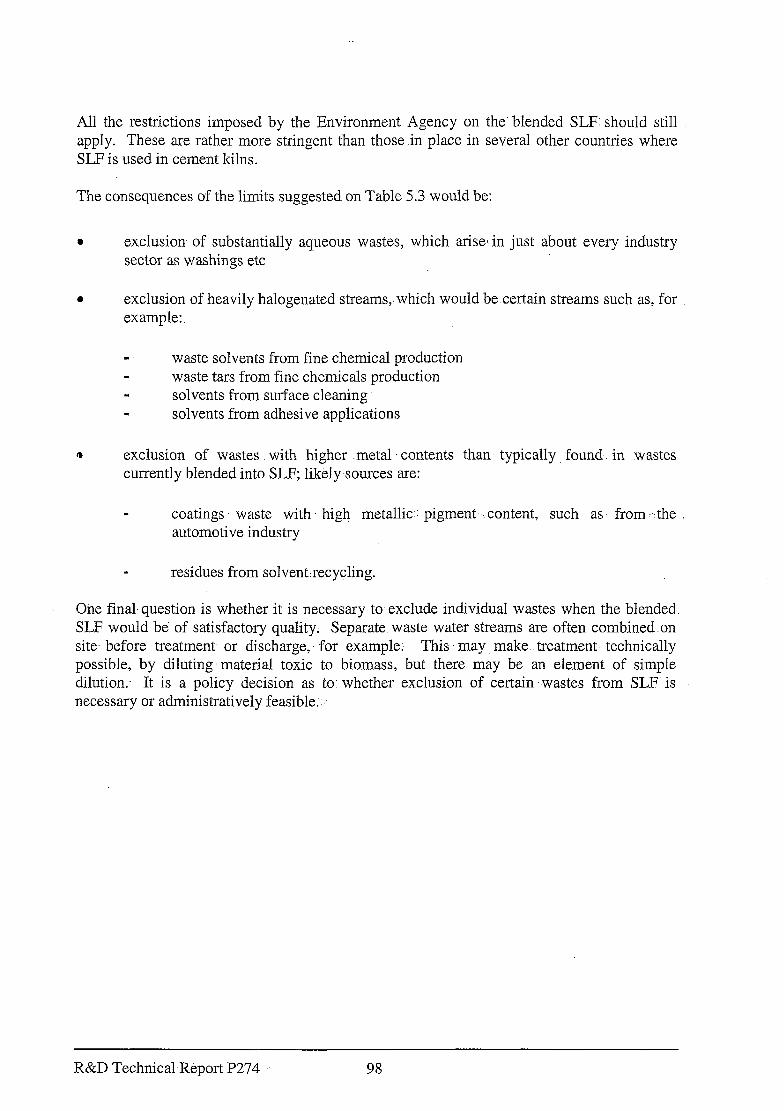
All the restrictions imposed by .the Environment Agency on the blended SLF. should still apply. These are rather more stringent than those in place in several other countries where SLF is used in cement kilns.
The consequences of the limits suggested on Table 5.3 would be:
0 exclusion of substantially aqueous wastes, which arises in just about every industry sector as washings etc
l exclusion of heavily halogenated-streams,.which would be certain streams such as, for example:
waste solvents from fine chemical production m waste tars from fine chemicals production - solvents from surface cleaning M solvents from adhesive applications
I) exclusion of wastes with higher .metal contents than typically. found. in wastes currently blended into SLF; likely sources are:
” coatings waste with high metallic:: pigment ‘content, such as from ,-the : automotive industry
m residues from solventrecycling.
One final, question is whether it is necessary to-exclude individual wastes when the blended. SLF would be of satisfactory quality. Separate waste water streams are often combined on site- before treatment or discharge, for example; This may make. treatment. technically possible, by diluting ‘material toxic to biomass, but there may be an element of simple dilution.- It is a policy decision as to -whether exclusion of certain ,.wastes from SLF. is necessary or administratively feasible::
R&D Technical-Report P274 98
BIBLIOGRAPHY
ASSOCIATION TECHNIQUE DE. L’INDUSTRIE DES ‘LIANTS HYDRAULIQUES: The French Experience on Co-Combustion in Cement Kilns, DGXII Workshop, 1997,
BOUSTEAD, I Dr,. A report for the Association of Plastics Manufacturers- in Europe (APME), Eco-profiles of the European Plastics Industry, Various Reports 1993,1995
BRITISH CEMENT ASSOCIATION: UK Cement Manufacture and the Environment
CIMENT D’OBOURG SA, Waste Co-processing in Industry, 1996
CLEANAWAY: The Responsible‘Incineration of Hazardous Waste
CONCAWE: Report l/95 Oil Refinery Waste, Disposal methods: Quantities and Costs 1993
CONCAWE: Report 5/96 Collection and Disposal of Used Lubricating Oil, 1996
ENVIRONMENT AGENCY: Report of the Substitute Fuels Trials ‘Assessment .Panel . . . . . (relating to). . ; . . . Kiln 4 at Rugby Cement, Barrington, October 1995
ENVIRONMENTAL AGENCY: The use of Substitute Liquid Fuels in Cement Kilns’ - Progress Report from the Environment Agency to the House of Commons Environment Committee, October ,1997
ENVIROlNMENTAL TOXICOLOGY INTERNATIONAL: All Fired Up- - Burning Hazardous Waste in Cement Kilns, 1992
ETSU: Waste Combustion in Cement Kilns, ETSU.- B/EW/00497/27/REP; Contractor - McLellan
EURITS: Methodology for the Determination of Technical Co-incineration Criteria, 1996
EURH’S: The Incineration of Hazardous Waste, 1997
EVANS P, Croda Hydrocarbons: 100 percent Recycling, the First Option (paper)
IAL CONSULTANTS: Industrial Solvents Recycling in the UK; I996 :I
IPC GUIDANCE NOTE S2 3.01: Cement-Manufacture, Lime Manufacture, and Associated .- Processes, 1996
SCHNEIDER~M: The-Environmental Impact of Co-combustion in Cement Kilns, Belgirate, 1997 .-
STATISTISCHE BUNDESAMT, Germany: Fachserie 19; ,Reihe 1.2, Abfallbeseitigungi im Produzierenden Gerwerbe und in Krankenhausem, 1993
R&D ,Technical Report P274 99
TECHNICAL GUIDANCE NOTE (ENVIRONMENTAL) El: Best Practicable Environmental Option Assessments for Integrated Pollution Control
ZEEVALKINK Dr J A.; ALKEMADE Mrs M M C, The Materials and Energy Potential Method for the Quantitative distinction between Valorization and Elimination in the Cement Industry, TNO-MEP-R96/302,1996.
R&D Technical Report P274 100