Embed Size (px)
Citation preview

REPORT
Greenhouse Gas Emissions Assessment The Substitution of Fossil Fuels with Woody Biomass in
the Northwest Territories
Prepared for Government of the Northwest Territories
Attention: Walters Tubua Climate Change Specialist
Environment Division Dept. of Environment and Natural Resources
By Anastassia Manuilova and Mark Johnston Saskatchewan Research Council
Environment and Forestry
SRC Publication No. 13069-1C11
March 31st, 2011


REPORT
Greenhouse Gas Emissions Assessment The Substitution of Fossil Fuels with Woody Biomass in
the Northwest Territories
Prepared for Government of the Northwest Territories Attention: Walters Tubua
Climate Change Specialist Environment Division
Dept. of Environment and Natural Resources
By Anastassia Manuilova and Mark Johnston Saskatchewan Research Council
Environment and Forestry
SRC Publication No. 13069-1C11
March 31st, 2011
Saskatchewan Research Council 125 – 15 Innovation Blvd. Saskatoon, SK S7N 2X8
Tel: 306.933.5400 Fax: 306.933.7817


EXECUTIVE SUMMARY
The use of bioenergy is expanding rapidly around the world due to rising oil prices and
the introduction of climate change policies. Previous research on bioenergy production
from perennial woody biomass has shown promise both in terms of net greenhouse gas
(GHG) reductions and other environmental and socio-economic benefits, especially if
woody biomass residues are utilized as feedstock and efficient energy conversion
technologies such as combustion for heat or co-generation of heat and power are
employed.
While bioenergy is often assumed to be carbon-neutral, the net reduction of GHG and
other emissions and wastes is often significantly less than 100%. CO2 of fossil origin as
well as other air emissions may be emitted due to the use of transportation or biomass
pre-treatment options. The amount of emissions and wastes released depends on various
factors, such as efficiency of the equipment, pre-treatment methods applied,
transportation distances, etc. Thus, an evaluation methodology based on life cycle
thinking (“cradle-to-grave” approach) is considered the best approach to estimate the
environmental impacts associated with existing and future deployment of biomass
combustion projects.
Three scenarios were analyzed in this study:
Scenario 1: Forest bioenergy for home and district heating – production of thermal
energy from locally-sourced woody biomass (firewood and woodchips) in the NWT.
Scenario 2: Pellet bioenergy for home and district heating – production of thermal energy
from imported and locally produced wood pellets.
Scenario 3: Heating oil energy for home and district heating – production of thermal
energy from imported heating oil.
Wood chips produced from locally sourced woody biomass showed the lowest GHG
emissions over the full life cycle, followed by locally produced wood pellets and wood
pellets imported from Alberta. Wood pellets imported from BC and locally produced
firewood combusted in residential conventional technology stove have the highest GHG
emissions after heating oil. Based on the life cycle results, we recommend local wood

chips and pellets production as one of the strategies for reduction of fossil GHG
emissions.
We also conclude that harvesting biomass for bioenergy in the NWT is sustainable given
the relatively low demand, which represents a small fraction of the territories’ sustainable
timber yield. In addition, sustainability will be achieved if best practices are followed
regarding the values outlined in the CCFM Criteria: protection of biodiversity and water
and soil quality; maintenance of forest health, productivity and carbon storage; and
equitable distribution of benefits to local communities. However, there may be site-
specific sustainability questions related to, for example, intensive willow harvesting in
riparian areas and impacts of harvesting on caribou habitat.
Future research should include a full Life Cycle Assessment of bioenergy production, and
a forest landscape carbon balance analysis using the Carbon Budget Model of the
Canadian Forest Sector.

Greenhouse Gas Emissions Assessment. The Substitution of Fossil Fuels With Woody Biomass in the Northwest Territories March, 2011
Table of Contents Page
EXECUTIVE SUMMARY .............................................................................................................................5 ABBREVIATIONS .........................................................................................................................................4 1. Introduction ..............................................................................................................................................6 2. Study Goal and Scope ..............................................................................................................................8
2.1 Objectives and intended application ..................................................................................................... 8
2.2 General description of the system ........................................................................................................ 9
2.3 Systems function and functional unit ................................................................................................. 13
2.4 System boundaries .............................................................................................................................. 13
2.5 Life Cycle Inventory data quality, sources and assumptions.............................................................. 14
2.6 Greenhouse gas assessment methodology .......................................................................................... 17
2.7 Contribution and sensitivity analyses ................................................................................................. 17
3. METHODOLOGY ................................................................................................................................. 19 3.1 Greenhouse gas emissions assessment or carbon footprint ................................................................ 19
3.2 Greenhouse gas accounting protocol .................................................................................................. 20
3.3 Sustainable forest management and biomass production ................................................................... 21
3.4 Black carbon ....................................................................................................................................... 21
4. FOREST SUSTAINABILITY ............................................................................................................... 26 4.1 Introduction ........................................................................................................................................ 26
4.2 Criteria and indicators of sustainable forest management .................................................................. 26
4.3 The criteria ......................................................................................................................................... 27
5. FOREST CARBON MODELING ......................................................................................................... 34 6. GREENHOUSE GAS EMISSIONS ASSESSMENT RESULTS .......................................................... 39
6.1 Life Cycle Inventory .......................................................................................................................... 39
6.2 Results ................................................................................................................................................ 39
7. CONCLUSIONS AND RECOMMENDATIONS ................................................................................. 50 REFERENCES .............................................................................................................................................. 53 APPENDIX A ............................................................................................................................................... 60 APPENDIX B ................................................................................................................................................ 62
B.1 Woody biomass harvesting operations ............................................................................................... 63
B.2 Sawmill operations ............................................................................................................................. 64
B.3 Pellet plant operations ........................................................................................................................ 66
B.4 Transportation of pellets to the NWT ................................................................................................. 67
B.5 Wood consumption for municipal and residential heating in the NWT ............................................. 67
B.6 Heating oil production and transportation to the NWT ...................................................................... 68
B.7 Production of thermal energy ............................................................................................................. 69
B.8 Waste management ............................................................................................................................ 70
APPENDIX C ................................................................................................................................................ 72 APPENDIX D ............................................................................................................................................... 79
SRC Publication No. 13069-1C11 1

March, 2011 Greenhouse Gas Emissions Assessment. The Substitution of Fossil Fuels With Woody Biomass in the Northwest Territories
List of Figures and Tables
Page Figure 2.1 Schematic diagram of activities within the life cycle of generation of thermal energy from locally-
sourced woody biomass. ................................................................................................................. 10 Table 2.1 Wood pellets supply to the NWT. ................................................................................................... 11 Figure 2.2 Schematic diagram of activities within the life cycle of generation of thermal energy from
imported wood pellets. .................................................................................................................... 11 Figure 2.3 Schematic diagram of pelletization process. ................................................................................... 12 Figure 2.4 Schematic diagram of activities within the life cycle of generation of thermal energy from heating
oil. ................................................................................................................................................... 13 Table 2.2 Data sources and assumptions for processes in the system boundaries........................................... 15 Table 2.3 1996 and 2007 Intergovernmental Panel on Climate Change global warming potential factors
across 100 year time horizon for carbon dioxide, methane and nitrous oxide. ............................... 17 Figure 3.1 Black carbon sources and warming potentials (Bachmann, 2009). ................................................. 22 Table 3.1 Black and organic carbon emissions from controlled combustion of heavy fuel oil and wood in
residential applications. ................................................................................................................... 23 Table 3.2 Black and organic carbon global warming potentials. .................................................................... 25 Table 4.1. The six Criteria of Sustainable Forest Management (adapted from CCFM 2003) .......................... 28 Table 5.1 Density, heat content and yield, and emissions per cubic metre of woody biomass. ...................... 34 Table 5.2 Heating and wood volume requirements for communities listed in the AEA Report (AEA 2010). 35 Table 5.3 Summarized community bioenergy demand and associated emissions. ......................................... 36 Figure 5.1 Carbon “yield curve” based on data in the Forest Resource Assessment for the Dehcho Region and
using conversion factors from IPCC (2003).................................................................................... 38 Figure 6.1 Comparison of all scenarios under study. ....................................................................................... 40 Figure 6.2 Contribution analysis of Scenario 1. ............................................................................................... 41 Figure 6.3 Contribution analysis of Scenario 2. ............................................................................................... 42 Figure 6.4 Sensitivity analysis of transportation distance. ............................................................................... 42 Figure 6.5 Contribution analysis of Scenario 3. ............................................................................................... 43 Figure 6.6 Scenario 1: Biogenic CO2 emissions. .............................................................................................. 44 Figure 6.7 Scenario 2: Biogenic CO2 emissions. .............................................................................................. 44 Figure 6.8 Fossil and biogenic GHG emissions – comparison of all scenarios under study. ........................... 45 Table 6.1 Black and organic carbon emissions from controlled combustion of heavy fuel oil and wood in
residential applications. ................................................................................................................... 46 Figure 6.9 Global warming potential ranges for black and organic carbon emitted from combustion of wood
chips, firewood, wood pellets and heating oil. ................................................................................ 47 Figure 6.10 Sensitivity analysis for wood pellets: global warming potential ranges for black and organic
carbon emitted from combustion of wood chips, firewood, wood pellets and heating oil. ............. 48 Figure 6.11 Sensitivity analysis for firewood: global warming potential ranges for black and organic carbon
emitted from combustion of wood chips, firewood, wood pellets and heating oil. ......................... 48 Figure 6.12 Sensitivity analysis for wood chips: global warming potential ranges for black and organic carbon
emitted from combustion of wood chips, firewood, wood pellets and heating oil. ......................... 49 Figure 6.13 Sensitivity analysis for heating oil: global warming potential ranges for black and organic carbon
emitted from combustion of wood chips, firewood, wood pellets and heating oil. ......................... 49 Table A.1 Carbon yield curves calculated from data in The Forestry Corp. (2010). ....................................... 61 Table B.1 Energy consumption and GHG emissions for harvesting, sawmill and pellet plant operations. ..... 65 Table B.2 Parameters for biomass pelletization. .............................................................................................. 66
2 SRC Publication No. 13069-1C11

Greenhouse Gas Emissions Assessment. The Substitution of Fossil Fuels With Woody Biomass in the Northwest Territories March, 2011
Table B.3 Wood pellets supply to the NWT. ................................................................................................... 67 Table B.4 Total emissions over the life cycle of heating oil, per unit of energy delivered to end users, by
pollutant (kg/MJ)............................................................................................................................. 68 Table B.5 Combustion emission factors for firewood, kg/tonne. .................................................................... 69 Table B.6 Combustion emission factors for wood chips, kg/MJ of useful energy. ......................................... 70 Table B.7 Combustion emission factors for wood pellets, kg/tonne. .............................................................. 70 Table D.1 GHG assessment results for firewood at residential, advanced technology, catalytic stove ........... 80 Table D.2 GHG assessment results for firewood at residential, conventional technology stove ..................... 80 Table D.3 GHG assessment results for wood chips at industrial boiler 50KW ............................................... 81 Table D.4 GHG assessment results for wood chips at industrial boiler 300KW ............................................. 81 Table D.5 GHG assessment results for wood pellets bulk imported from AB, at industrial boiler 50kW ....... 82 Table D.6 GHG assessment results for wood pellets bagged imported from AB, at residential stove ............ 83 Table D.7 GHG assessment results for wood pellets bagged imported from AB, at residential stove ............ 84 Table D.8 GHG assessment results for wood pellets bagged imported from BC, at residential stove............. 85 Table D.9 GHG assessment results for wood pellets bagged imported from BC, at residential stove............. 85 Table D.10 GHG assessment results for heating oil, at industrial boiler ........................................................... 86 Table D.11 GHG assessment results for wood pellets bulk NWT, at industrial boiler 50kW .......................... 86 Table D.12 GHG assessment results for wood pellets bulk NWT, at industrial boiler 50kW ........................... 87 Table D.13 GHG assessment results for wood pellets bagged NWT, at residential stove ................................. 87 Table D.14 GHG assessment results for wood pellets bagged NWT, at residential stove ................................. 88 Table D.15 Black and organic carbon assessment results for Koch et al, 2007. ................................................ 89 Figure D.1 Comparison of all scenarios under study. ....................................................................................... 90
SRC Publication No. 13069-1C11 3

March, 2011 Greenhouse Gas Emissions Assessment. The Substitution of Fossil Fuels With Woody Biomass in the Northwest Territories
ABBREVIATIONS
AEA Arctic Energy Alliance
BAU Business-as-usual
BC Black Carbon
C Carbon
C&I Criteria and Indicators
CCAR California Climate Action Registry
CCFM Canadian Council of Forest Ministers
CDM Clean Development Mechanism
CH4 Methane
CO2 Carbon Dioxide
CO2e Carbon dioxide equivalent
GHG Greenhouse Gas
GNWT The Government of the Northwest Territories
GWP Global Warming Potential
IPCC Intergovernmental Panel on Climate Change
ISO International Organization for Standardization
LCA Life Cycle Assessment
LCI Life Cycle Inventory
LCIA Life Cycle Impact Assessment
MCCS Manomet Center for Conservation Sciences
N2O Nitrous Oxide
NFD National Forestry Database
NWT Northwest Territories
OC Organic Carbon
PAS Publicly Available Specification
U.S. DOE/EIA United States Department of Energy/Energy Information Administration
U.S. EPA United States Environmental Protection Agency
UNFCCC United Nations Framework Convention on Climate Change
VCS The Voluntary Carbon Standard
WBCSD World Business Council for Sustainable Development
WRI World Resource Institute
4 SRC Publication No. 13069-1C11

Greenhouse Gas Emissions Assessment. The Substitution of Fossil Fuels With Woody Biomass in the Northwest Territories March, 2011
Fuels heating values Wood pellets 19,700 MJ per tonne Heating oil 38.4 MJ per litre Firewood 16,400 MJ per tonne (18% moisture content) Wood chips 15,200 MJ per tonne (20% moisture content)
SRC Publication No. 13069-1C11 5

March, 2011 Greenhouse Gas Emissions Assessment. The Substitution of Fossil Fuels With Woody Biomass in the Northwest Territories
1. INTRODUCTION
The use of bioenergy is expanding rapidly around the world due to rising oil prices and the
introduction of climate change policies. Previous research on bioenergy production from
perennial woody biomass has shown promise both in terms of net greenhouse gas (GHG)
reductions and other environmental and socio-economic benefits, especially if woody biomass
residues are utilized as feedstock and efficient energy conversion technologies such as
combustion for heat or co-generation of heat and power are employed.
While bioenergy is often assumed to be carbon-neutral, the net reduction of GHG and other
emissions and wastes is often significantly less than 100%. CO2 of fossil origin as well as other
air emissions may be emitted due to the use of transportation or biomass pre-treatment options.
The amount of emissions and wastes released depends on various factors, such as efficiency of
the equipment, pre-treatment methods applied, transportation distances, etc. Thus, an evaluation
methodology based on life cycle thinking (“cradle-to-grave” approach) is considered the best
approach to estimate the environmental impacts associated with existing and future deployment
of biomass combustion projects.
The recent study of using forest wood for energy in Massachusetts, US (MCCS, 2010) showed
that the situation with carbon-neutrality of bioenergy is even more complex. Using wood to
produce energy results in an initial “carbon debt”, because burning wood releases more CO2 into
the atmosphere per unit of energy than fossil fuels. However, when forests grow back and
recapture CO2 from the atmosphere, the “carbon dividend” is realized. The length of time it
takes to get carbon dividends depends on the type of biomass used to produce energy, the fossil
fuel that biomass replaces, the bioenergy combustion technology and the forest management
practices. For example, using forest biomass in district heating in Massachusetts can provide
carbon dividends within 10 to 20 years.
The Government of the Northwest Territories (NWT) is committed to increasing use of biomass
energy to replace fossil fuels as outlined in the 2010 NWT Biomass Energy Strategy (NWT,
2010). The locally-sourced wood and imported wood pellets are increasingly being used for
generation of thermal energy in home and district heating applications in the NWT. Biomass is a
renewable source of energy if managed in the sustainable manner. However, the greenhouse gas
implications of using biomass in home and district heating applications in the NWT should be
studied from the life cycle perspective. Carbon footprints of fossil fuel energy need to be
6 SRC Publication No. 13069-1C11
Greenhouse Gas Emissions Assessment. The Substitution of Fossil Fuels With Woody Biomass in the Northwest Territories March, 2011
compared to carbon footprints of woody biomass energy to provide information on which energy
planning decisions in the NWT will be based.
The goal of this study is to conduct a thorough comparison of the overall greenhouse gas
emissions associated with the generation of thermal energy from different sources in the
Northwest Territories.
The following questions are answered by the study:
1. What are the atmospheric greenhouse gas implications of shifting energy production in
the Northwest Territories from heating oil to locally grown woody biomass or imported
wood pellets?
2. What are the environmental benefits and drawbacks of different biomass combustion
applications (such as home heating and district heating)?
3. What is the NWT forest carbon dynamics?
4. What monitoring and measurement programs need to be in place to ensure sustainability
of local forests?
The study follows the LCA methodology defined in the ISO 14000 standards (ISO 14040 and
14044 standards, 2006) for the estimation of greenhouse gas emissions. The study also follows
the PAS 2050 – Specification for GHG Emissions of Goods and Services (PAS 2050, 2008)
greenhouse gas accounting protocol and takes into consideration the Greenhouse Gas Protocol
Product / Supply Chain Initiative of World Resource Institute (WRI) and World Business
Council for Sustainable Development (WBCSD) (WRI/WBCSD, 2010).
The report consists of the following parts:
Chapter 2 – Goal and scope definition;
Chapter 3 – Methodology;
Chapter 4 - Forest sustainability assessment;
Chapter 5 – Forest carbon modeling;
Chapter 6 – Greenhouse gas emissions assessment results;
Chapter 7 - Conclusions and recommendations.
SRC Publication No. 13069-1C11 7

March, 2011 Greenhouse Gas Emissions Assessment. The Substitution of Fossil Fuels With Woody Biomass in the Northwest Territories
2. STUDY GOAL AND SCOPE
This section of the report provides a general description of the system under study, definition of
the system boundaries and functional unit. Data quality, assumptions and GHG assessment
methodology including black carbon analysis are also discussed.
2.1 Objectives and intended application
The project has the following objectives:
• Using the “cradle-to-grave” approach, develop greenhouse gas emission inventories
associated with thermal energy generation from heating oil, imported and locally grown
wood pellets and locally-sourced forest wood in the Northwest Territories;
• Provide a comparative study results with recommendations on how to minimize the GHG
emissions from woody biomass energy sources and fossil fuels in the Northwest
Territories;
• Provide information on the Northwest Territories forest carbon dynamics and
sustainability;
• Identify the mechanisms that the forest manager can use to present sustainability of forest
use within the scope of internationally recognized standards.
The assessment of greenhouse gas emissions from three systems is conducted using the “cradle-
to-grave” approach. The following scenarios are studied:
Scenario 1: Forest bioenergy for home and district heating– production of thermal energy
from locally-sourced woody biomass in the NWT;
Scenario 2: Pellet bioenergy for home and district heating – production of thermal energy
from imported and locally produced wood pellets;
Scenario 3: Heating oil energy for home and district heating – production of thermal
energy from imported heating oil.
The study is intended to provide results specific to the Northwest Territories wood sources,
biomass combustion technologies used for home and district heating, and the fossil fuel that
forest biomass replaces (i.e. heating oil).
The results of this study are intended for the internal use by the Government of the NWT to
improve understanding of the GHG implications associated with replacement of fossil fuels with
biomass.
8 SRC Publication No. 13069-1C11

Greenhouse Gas Emissions Assessment. The Substitution of Fossil Fuels With Woody Biomass in the Northwest Territories March, 2011
2.2 General description of the system
This section provides a general description of the system under study.
Scenario 1: Forest bioenergy
Biomass in the NWT is available from the following sources (NWT Biomass Energy Strategy,
2010; Lakusta, 2011):
• Harvest of green wood from the merchantable forest. Merchantable volume data are
available from the NWT Forest Inventory and can be converted to biomass using the
volume to biomass conversion factors from Boudewyn et al (2007).
• Black wood from recent burns. The National Forestry Database (NFD, 2011) provides
estimates of area burned for NWT. It can be combined with volume estimates from the
forest inventory and the conversion factors from Boudewyn et al. (2007) to determine
how much biomass this represents.
• Harvest of 20-40 year old willows from river flats. This is a localized biomass resource
that has not been quantified but may provide opportunities for a few communities.
• Decked wood salvaged from incidental land uses, e.g. oil and gas activity, other land
uses. Note that in many cases there is no regeneration requirement for these areas and the
carbon debt generated by using this material will remain negative.
• Use of waste wood fibre from other processes, e.g. sawmill residues, wood in landfills.
In this scenario two options are reviewed:
• 1A: Firewood bioenergy. Green wood from the merchantable forest is harvested; split
firewood is prepared in the forest and transported by truck to the customers. The current
estimated market for firewood is approximately 15,000 m3/year or 7,500 t/year1
(Lakusta, 2011).
• 1B: Wood chips bioenergy. In this option it is assumed that woody biomass from the
sources described above is chipped on site by a mobile wood chipper. Wood chips are
then transported by truck to the customers. No wood chips are used for heating purposes
in the NWT now. However, it is expected that local wood chips will be used as a fuel in a
number of proposed district heating systems.
1 Average seasoned firewood density is assumed to be 500 kg/m3.
SRC Publication No. 13069-1C11 9

March, 2011 Greenhouse Gas Emissions Assessment. The Substitution of Fossil Fuels With Woody Biomass in the Northwest Territories
Life cycle stages included in this scenario are woody biomass harvesting or collection, firewood
preparation/ biomass size reduction by a mobile wood chipper, firewood/ wood chips
transportation to a bioenergy facility, combustion and waste management (Figure 2.1).
Figure 2.1 Schematic diagram of activities within the life cycle of generation of thermal energy from locally-sourced woody biomass.
Scenario 2: Pellet bioenergy
Wood pellets are usually made of residual materials such as sawmill residues (sawdust, planer
shavings) and diseased and insect-killed trees and forest logging residues.
2A: Current scenario
Currently, the NWT wood pellets consumption is estimated at 12,000 – 13,000 tonnes per year2
(La Crete, 2011; Pinnacle, 2011; Premium, 2011). Wood pellets are imported from the LaCrete
pellet mill in Northern Alberta and from Pinnacle Pellet’s mill and Premium Pellet mill in central
BC (Table 2.1). Pellets from LaCrete are imported primarily in bulk form by truck to service
institutional customers. The majority of Pinnacle and Premium pellets come in a bag form for
home heating market. Residential houses are not designed for wood pellets fuel and
homeowners have to use pellets in bagged form (FPInnovations, 2009).
2 Data for 2010 received directly from the wood pellets suppliers.
Firewood/ Wood chips production
•Forest harvesting •Biomass size
reduction
Firewood/ Wood chips transportation
•Firewood/ Wood chips transport by truck
Firewood/ Wood chips combustion
•Production of thermal energy for municipal and home heating
•Waste management
10 SRC Publication No. 13069-1C11

Greenhouse Gas Emissions Assessment. The Substitution of Fossil Fuels With Woody Biomass in the Northwest Territories March, 2011
Table 2.1 Wood pellets supply to the NWT.
Material Location Quantity, tpy (2010)
Mode of transport
Type of packaging
Distance, km
Source
Wood pellets
Le Crete pellet mill, Alberta
12,000 Super B-train trucks (payload 42 t, 8-axle)
90% Bulk 10% Bagged
824 La Crete, 2011
Pinnacle and Premium pellet mills, BC
600 45
Freight trailer (payload 30 t and 45 t)
100% Bagged
1,800 Pinnacle, 2011 Premium, 2011
Note: Retail shops, such as Wal-Mart and Canadian Tire carry bagged pellets for residential use. These pellets come
mainly from Pinnacle Pellet and Premium Pellet, BC. However, some originate from AB, MB and even US (Arctic,
2010).
The pellet bioenergy scenario life cycle activities include biomass harvesting, biomass
transportation to a sawmill, sawmill operations, transportation to a pellet facility, pelletization,
transportation of pellets to a combustion facility, combustion of pellets, and waste management
(plastic and wood ash) (Figure 2.2).
Figure 2.2 Schematic diagram of activities within the life cycle of generation of thermal energy from imported wood pellets.
It should be noted that the main output from sawmill is lumber; co-products are sawdust and
shavings, bark and other wood residues. Shavings and sawdust are transported to the pellet mill
for pellets production. In this study, allocation for products from sawmill (i.e. allocation of
Forest harvesting
•Forest harvesting
Sawmill
•Lumber (main product) •Shavings and
dust (co-product to pellet mill)
Pellet mill
•Pellets (bulk and bagged) •Plastic bag
production (bagged pellets)
Combustion
•Thermal energy for municipal and home heating •Waste
management
SRC Publication No. 13069-1C11 11

March, 2011 Greenhouse Gas Emissions Assessment. The Substitution of Fossil Fuels With Woody Biomass in the Northwest Territories
environmental impacts associated with main product and co-products production) is based on
green mass.
Wood pellets at LaCrete (spruce) and Pinnacle mills (spruce, pine) are produced from clean, dry
wood-waste fiber from neighbouring sawmills. A schematic of wood pelletization process is
shown in Figure 2.3.
Figure 2.3 Schematic diagram of pelletization process.
The manufacture of wood pellet is a simple process. The raw material arrives to a pellet mill in a
variety of partially processed states (i.e. chips, shavings, sawdust). The raw material is then dried
and ground into a uniform size. It is subsequently compressed and formed into pellets. Pellets are
then cooled to allow the natural bonding agents (resins in the wood) to set. Once the pellets have
hardened, any loose material is screened out and fed back into the pelletization process. Pellets
are then ready to be distributed to the market. Pellets are supplied to customers in bulk or bagged
form (pellets are typically packaged in 40 lbs (18 kg) bags).
2B: Future scenario
In this scenario it is assumed that wood pellets will be produced from the locally sourced wood
in the NWT in the near future. The local green wood will be harvested for this purpose. It is
assumed that the green wood harvested for this purpose will go towards wood pellets production.
Scenario 3: Heating oil energy
Current thermal energy source in the NWT is #2 heating oil. This scenario is a business-as-usual
scenario that is used to estimate GHG emissions reductions due to the use of bioenergy instead of
fossil fuel. The heating oil energy scenario life cycle activities include crude oil extraction,
crude oil transportation to the refinery, conversion into heating oil, heating oil transportation to a
combustion facility, and combustion (Figure 2.4).
Transport and storage of raw
materials Drying Grinding Pelletizing Cooling Screening Storage
12 SRC Publication No. 13069-1C11

Greenhouse Gas Emissions Assessment. The Substitution of Fossil Fuels With Woody Biomass in the Northwest Territories March, 2011
Figure 2.4 Schematic diagram of activities within the life cycle of generation of thermal energy from heating oil.
More information on scenarios described above can be found in Appendix B: Life Cycle
Inventory Supporting Information.
2.3 Systems function and functional unit
The main function of the system under study is to produce thermal energy for home and district
heating in the NWT. In order to compare carbon footprints of three scenarios a common
functional unit should be selected – a unit that provides a reference to which the input and output
data are normalized. Functional unit for this study is 1 MJ of thermal energy3 produced from
the NWT locally-sources wood, imported pellets or heating oil.
2.4 System boundaries
The system boundary defines the unit processes to be included in the system. Temporal,
geographical and technological boundaries are also defined here.
All life cycle activities from resource extraction (e.g., crude oil, wood) and production (e.g.,
pellets, wood chips, firewood, #2 heating oil production) through generation of thermal energy
are included, as well as all transportation stages. Material and energy inputs needed for
equipment manufacture, facility construction, and labour are not included in the study, except for
the processes taken from Ecoinvent database, such as transportation and waste management
(Ecoinvent Centre, 2009). Exclusion of these activities is common practice where it is expected
that these processes have far smaller environmental implications than the operations of the
facilities (Baumann and Tillman, 2004).
3 Net thermal energy
Heating oil production
•Extraction •Transport to refinery • Conversion into
heating oil
Transportation
•Heating oil transportation to the NWT
Combustion
•Thermal energy for municipal and home heating
SRC Publication No. 13069-1C11 13

March, 2011 Greenhouse Gas Emissions Assessment. The Substitution of Fossil Fuels With Woody Biomass in the Northwest Territories
Temporal and geographical boundaries
The thermal energy generation from pellets and heating oil pathways are relevant to the time
frame 2009 to 2010, while the pathway utilizing locally-sourced biomass is relevant post-2012
but could be implemented prior to that time.
Most of the processes included in the system boundaries occur in the Northwest Territories,
Alberta and British Columbia. However, some unit processes may occur in other Canadian
provinces and the US.
Technological boundaries
There are several types of boiler technologies that are currently in use in the NWT. This study
evaluates only the most frequently used technologies/configurations for generation of thermal
energy.
2.5 Life Cycle Inventory data quality, sources and assumptions
Data quality requirements specify the characteristics of the data needed for the study.
Description of data quality, sources and assumptions is important to understand the reliability of
the study results and properly interpret the outcome of the study (ISO, 2006).
Data sources and quality
Several different methods of data collection were available, such as questionnaires, personal
interaction and both peer-reviewed and un-reviewed literature. Modelling a life cycle is a
complex task involving several assumptions that are at the discretion of the analyst. To ensure
proper LCA technique, the analyst should clearly document all employed data, sources,
assumptions and supporting literature.
The majority of the data used in this project is specific to the Northwest Territories, Alberta and
British Columbia in terms of process contribution. In the absence of the NWT data, information
was drawn from western Canadian sources, followed by Canadian sources, North American
sources and, finally, from pre-existing life cycle databases; most notably Ecoinvent v2.1. The
Ecoinvent library is a European database considered to be the most comprehensive and up-to-
date inventory currently available (Ecoinvent Centre, 2009). Canadian data was directly
substituted into the Ecoinvent library where possible, and the default European data remained
when Canadian data was unavailable.
14 SRC Publication No. 13069-1C11

Greenhouse Gas Emissions Assessment. The Substitution of Fossil Fuels With Woody Biomass in the Northwest Territories March, 2011
Data used in this study is no older than 5 years from the onset of the analysis (2010). Sources of
data include, but are not limited to: Intergovernmental Panel on Climate Change (IPCC),
Environment Canada’s National Greenhouse Gas Inventory (Environment Canada, 2008),
GHGenius, and scientific publications. All data adheres to the specifications listed in the 2006
ISO 14040 and 14044 standards.
Data sources for main processes within system boundaries are presented in Table 2.2. More
information on life cycle inventory data, assumptions and data sources can be found in Appendix
B: Life Cycle Inventory Supporting Information.
Table 2.2 Data sources and assumptions for processes in the system boundaries.
Process Assumptions Source
Wood harvesting (forest road construction, forest harvesting and wood delivery to the forest product conversion facility)
Diesel consumption: 7.1 L/m3 or 273 MJ/m3 of wood
Sambo, 2002
Firewood processing (splitting) Diesel consumption: 6.6 L/tonne firewood
Paul et al., 2003
Transport of firewood to customers 75 km; Truck 16 t payload Pa, 2010 Swiss Centre for Life Cycle Inventories et al., 2008
Size reduction by mobile wood chipper Diesel consumption: 1.7 L/tonne of biomass
Jones et al., 2010
Wood chips drying 10.3 kWh/m3 of wood chips Mikko, 2005
Transport of wood chips to customers 75 km; Truck 22.8 t payload Swiss Centre for Life Cycle Inventories et al., 2008
Sawmill operations Details provided in Appendix B, Table B.1
Nyboer and Jaccard, 2010 Pa, 2010
Pellet plant operations Details provided in Appendix B, Table B.1
Pa, 2010
Plastic bag production Bag weight: 63.5 g Polyethelene
Bulldog, 2011 Swiss Centre for Life Cycle Inventories et
SRC Publication No. 13069-1C11 15

March, 2011 Greenhouse Gas Emissions Assessment. The Substitution of Fossil Fuels With Woody Biomass in the Northwest Territories
Process Assumptions Source al., 2008
Transport of pellets from AB 824 km; Super B-train trucks (payload 42 t, 8-axle)
La Crete, 2011 Swiss Centre for Life Cycle Inventories et al., 2008
Transport of pellets from BC 1800 km, Freight trailer (payload 30 t and 45 t)
Pinnacle, 2011 Premium, 2011 Swiss Centre for Life Cycle Inventories et al., 2008
Locally produced wood pellets Details provided in Appendix B, Table B.2
Zhang et al., 2010
Transport of locally produced pellets 150 km; Truck 22.8 t payload
Swiss Centre for Life Cycle Inventories et al., 2008
Heating oil upstream and combustion processes
Details provided in Appendix B, Table B.4
GHGenius, 2010
Firewood combustion Details provided in Appendix B, Table B.5
SGA, 2000
Wood chips combustion Details provided in Appendix B, Table B.6
Swiss Centre for Life Cycle Inventories et al., 2008
Wood pellets combustion Details provided in Appendix B, Table B.7
Johansson et al., 2004 Swiss Centre for Life Cycle Inventories et al., 2008
Plastic bag waste management Municipal landfill Swiss Centre for Life Cycle Inventories et al., 2008
Wood ash waste management from institutional boilers
Municipal landfill Swiss Centre for Life Cycle Inventories et al., 2008
NWT electricity production mix Electricity mix: Diesel (51.27%), Hydro (32.16%), Natural gas (16.56%)
MKJA, 2011
16 SRC Publication No. 13069-1C11

Greenhouse Gas Emissions Assessment. The Substitution of Fossil Fuels With Woody Biomass in the Northwest Territories March, 2011
2.6 Greenhouse gas assessment methodology
Emissions accounted for in this study are fossil and biogenic carbon dioxide (CO2), fossil
methane and biogenic methane (CH4), nitrous oxide (N2O) and black and organic carbon.
The goal of this study is to quantify the GHG emissions (e.g. Global Warming impact category)
from three scenarios described above. The results are presented as carbon dioxide equivalents
(CO2-e). An attempt is made to include the black carbon (a product of incomplete combustion of
heavy petroleum products and other sources such as biomass, etc.) emissions to the analysis.
The global warming effects were analyzed across 100 year time horizons with the 1996 and 2007
IPCC GWP factors. Table 2.3 shows the difference between GWP factors across time periods
for carbon dioxide, methane and nitrous oxide.
Table 2.3 1996 and 2007 Intergovernmental Panel on Climate Change global warming potential factors across 100 year time horizon for carbon dioxide, methane and nitrous oxide.
GHG
2007 Global warming potential factors
1996 Global warming potential factors
100 year 100 year
Carbon dioxide 1 1 Methane 25 21 Nitrous oxide 298 310
Source: IPCC, 1996 and IPCC, 2007.
2.7 Contribution and sensitivity analyses
In the final stage of the analysis, the results of the impact assessment phase are interpreted. Two
major analyses are conducted in determining the validity of the results:
• Contribution analysis - a measure of the effect each process has on the complete
environmental profile of the life cycle. The processes that make up the largest portions of
the total impact assessment are then subjected to rigorous data quality checks and
sensitivity analyses;
SRC Publication No. 13069-1C11 17
March, 2011 Greenhouse Gas Emissions Assessment. The Substitution of Fossil Fuels With Woody Biomass in the Northwest Territories
• Sensitivity analysis - determines the effect of changing parameters and assumptions on
the final results. It is essential to determine whether the final results are resistant to small
changes through the life cycle. If results fluctuate greatly during a sensitivity analysis,
results are not reliable and the life cycle should be reassessed.
18 SRC Publication No. 13069-1C11

Greenhouse Gas Emissions Assessment. The Substitution of Fossil Fuels With Woody Biomass in the Northwest Territories March, 2011
3. METHODOLOGY
3.1 Greenhouse gas emissions assessment or carbon footprint
Woody biomass is considered a renewable fuel compared to fossil fuels such as heating oil.
Wood fuel is also considered to be carbon neutral if it originates from sustainably managed
forests. However, as mentioned earlier, bioenergy production from woody biomass needs to be
studied from the life cycle perspective to take into account carbon emissions from upstream and
downstream life cycle stages (e.g. wood processing and transportation).
Life cycle assessment (LCA) methodology to estimate greenhouse gas emissions is used in this
study. LCA is a method for examining the environmental effects of a product or process across
its lifespan. It is a “cradle-to-grave” analysis in which complex systems are broken down into
elementary flows. The flows are then grouped and categorized based on the effects they have on
the environment. LCA studies must adhere to the principles set by the International
Organization for Standardization (ISO); specifically ISO 14040 (ISO, 2006a) and ISO 14044
(ISO, 2006b). ISO regulations ensure that the limitations of LCA are both recognized and
minimized. Furthermore, the standards certify that LCA results are presented in a concise and
transparent manner.
Benefits include that LCA:
- Assesses not only the product or process itself, but also the upstream and downstream
effects allowing for an investigation of the full life cycle. This life cycle approach also
avoids shifting of burdens upstream or downstream that may be ignored in a more
traditional analysis;
- Must adhere to the principles set by the International Organization for Standardization
(ISO); specifically ISO 14040 and ISO 14044. ISO regulations ensure that the limitations
of LCA are both recognized and minimized. Furthermore, the standards certify that LCA
results are presented in a concise and transparent manner; and
- Assist with decision-making. For a company, LCA can facilitate in identifying low-
hanging fruit to improve efficiencies, but may also help a company in demonstrating the
“greenness” of their product over an alternative. For governments, LCA can assist in
policy development.
SRC Publication No. 13069-1C11 19

March, 2011 Greenhouse Gas Emissions Assessment. The Substitution of Fossil Fuels With Woody Biomass in the Northwest Territories
SimaPro computer modeling software was used to conduct LCA. SimaPro is currently the most
widely used and sophisticated LCA computer modelling system available. The software, which
was developed in the Netherlands in 1990, includes thousands of processes and substances across
several inventories, as well as methods for impact assessment.
In this study we quantify the GHG emissions (CO2, CH4 and N2O) associated with local wood
feedstock production, transportation, and use for home heating and district heating. We also
compare GHG emissions associated with the substitution of local woody biomass feedstock or
imported wood pellets for heating oil.
3.2 Greenhouse gas accounting protocol
There are a wide variety of GHG programs that include a role for forests and thus provide some
guidance on forest GHG accounting. For example:
• National GHG Inventories under the United Nations Framework Convention on Climate Change
(UNFCCC)
• Guidelines for National GHG Inventories by the Intergovernmental Panel on Climate Change
(IPCC)
• Clean Development Mechanism (CDM) forest projects
• The Carbon Disclosure Project (CDP)
• The Voluntary Carbon Standard (VCS)
• U.S. EPA Climate Leaders
• U.S. DOE/EIA 1605b Voluntary GHG Reporting Program
• California Climate Action Registry (CCAR).
Major greenhouse gas protocols presume that biomass is inherently carbon neutral and carbon
dioxide emitted in biomass combustion is automatically excluded from carbon footprints.
Guidance from the World Business Council for Sustainable Development and the World
Resource Institute (WRI at el., 2006) recognizes that there is problem with carbon neutrality of
biomass. However, it still excludes biomass carbon-combustion emissions from its footprint
definitions. Current guidance and practice are problematic since they defy common sense,
contravene UNFCCC rules and ISO standards and ignore a large body of research. Thus, in this
study will follow the PAS 2050 – Specification for GHG Emissions of Goods and Services
greenhouse gas accounting protocol for estimation of emissions from all life cycle stages other
20 SRC Publication No. 13069-1C11

Greenhouse Gas Emissions Assessment. The Substitution of Fossil Fuels With Woody Biomass in the Northwest Territories March, 2011
than biomass combustion. Biomass combustion carbon footprint is evaluated using “carbon debt”
- “carbon dividend” approached developed by the Massachusetts Department of Energy and
Resources and Manomet Center for Conservation Sciences (MCCS, 2010). This approach takes
into account an initial “carbon debt” when wood is used to produce energy. However, when
forests grow back and recapture CO2 from the atmosphere, the “carbon dividend” is realized.
This study estimates the length of time it takes to get carbon dividends based on the type of
biomass used to produce energy.
3.3 Sustainable Forest Management and Biomass Production
In addition to the impacts of bioenergy production, the sustainability of the biomass feedstock
should be considered. This includes both the production or collection of biomass and the indirect
effects such as land use change, impacts on biodiversity and impacts on soil and water quality.
A range of biomass sources could be considered, including pellets, harvesting native forests and
using existing sources of residue (e.g. from forest product harvesting or right-of-way clearing).
This report provides guidance on the key questions and considerations required to assess the
long-term sustainability of these feedstocks. This analysis is integrated with the bioenergy
production LCA to provide a system-wide perspective on bioenergy sustainability. The
Canadian Council of Forest Ministers Criteria and Indicators of Sustainable Forest Management
(Canadian Council of Forest Ministers, 2003) is used to structure this component of the project.
3.4 Black Carbon
The incomplete combustion of hydrocarbons results in soot. Soot is mainly composed of black
carbon and organic carbon, with smaller proportions of sulphur and other chemicals (Bachmann,
2009). There are instances where soot and black carbon have been interchangeable used to imply
black carbon (Ramaswamy et al, 2001).
The major source of black carbon emissions and their percentage contributions are open biomass
burning (including wild fires and intentional burning in agriculture) – 42%, coal and oil burned
in industrial and mobile use - 40%, and biofuels for residential use – 18% (Bachmann, 2009).
Black carbon is rarely emitted alone, but with a mixture of other constituents. Its proportion with
regards to the other elements influences soot’s global warming potentials due to the cooling
SRC Publication No. 13069-1C11 21

March, 2011 Greenhouse Gas Emissions Assessment. The Substitution of Fossil Fuels With Woody Biomass in the Northwest Territories
potential of some other constituents. Hence, emissions from diesel combustion, which appear
black because of the higher concentration of black carbon have a higher global warming
potential than soot from open biomass burning which usually appears blue, brown or gray
because of higher organic carbon particles content (Bachmann, 2009). The major black carbon
sources and their respective warming potentials are presented in Figure 3.1.
It is generally accepted that black carbon to organic carbon ratio is more in fossil fuels compared
to biomass fuels like wood which have a higher organic carbon to black carbon ratio (Bahner et
al, 2007). Organic carbon can lead to reductions in temperature. Since it has been demonstrated
that biomass emissions contain a higher organic carbon content than black carbon, there may
actually be a net benefit to global warming by the use of biomass as fuel, particularly if
improvements are made to even lower the black carbon emitted from their use.
Figure 3.1 Black carbon sources and warming potentials (Bachmann, 2009).
It is difficult to say what the percentage of un-burnt carbon comes from biomass combustion.
One major factor being that the efficiency of the combusting system or technology/configuration
plays a vital part in the amount of soot released.
Nussbaumer et al (2008) have indicated that there is a high mass concentration of particle
emissions in automatic wood boilers for natural wood chips (100 mg/m3 at 13 vol.%) and even
significantly higher for fuels such as bark. A well designed and operated automatic wood
0
0.2
0.4
0.6
0.8
1
1.2
1.4
1.6
1.8
2
Openburning
Residential(Biofuel)
Industry Power On-RoadTransport
Residential(Coal)
Residential(Other)
Non-RoadTransport
Ratio
of B
lack
car
bon
to O
rgan
ic C
arbo
n
Generally More warming
22 SRC Publication No. 13069-1C11

Greenhouse Gas Emissions Assessment. The Substitution of Fossil Fuels With Woody Biomass in the Northwest Territories March, 2011
combustion system will yield mainly inorganic matter like salts, while those from wood stoves in
poor operating conditions will largely result in soot and organic substances.
Even though the IPCC (1996) does recommend a value of 1% for unoxidized carbon for fossil
fuels, the same may not necessarily apply to biomass. More so, it highlights that cases abound
where there are variations even up to 10%. However, with appropriate technology, it is possible
to curtail black carbon emissions substantially (Hill, 2009; Bond and Sun, 2005).
The black and organic carbon emissions from heavy fuel oil combustion and residential wood
burning are presented in Table 3.1. These numbers are applied in this study.
Table 3.1 Black and organic carbon emissions from controlled combustion of heavy fuel oil and wood in residential applications.
Type of fuel BC (g/kg) OC (g/kg) BC % OC %
Heavy fuel oil 0.07 0.015 0.007 0.0015
Biofuel: Wood 0.3 - 1.4 1.7 -7.8 0.03 – 0.14 0.17 – 0.78 BC – black carbon; OC – organic carbon.
Source: Adapted from Bond et al. 2003.
The significance of soot (including black carbon) in influencing climate change has only recently
being given much attention. Some authors hold the position that black carbon is second to CO2 in
terms of contribution to global warming (Ramanathan & Carmichael, 2008; Raffensperger,
2008).
Unlike other greenhouse gases that actually allow sunlight to pass through the atmosphere to the
earth but only absorb the radiated component of heat energy and reemitting it in the air, soot
particles absorb sunlight and warm the atmosphere by radiating the heat energy by conduction
and radiation, making it a very potent warming agent (Bachmann, 2009).
One important distinction between the climate change potentials of soot/black carbon is that
unlike GHGs whose emissions can have effects for the next hundred years, those from black
carbon rarely last more than a few weeks (Moore, 2009). Another difference is that the black
SRC Publication No. 13069-1C11 23

March, 2011 Greenhouse Gas Emissions Assessment. The Substitution of Fossil Fuels With Woody Biomass in the Northwest Territories
carbon effect/influence is much more local/regional unlike the global effect of traditional GHGs
(Bahner et al, 2007).
A view held by some experts is that black carbon reduces the reflective coefficient of ice,
resulting in an accelerated melting of the ice (Hansen & Nazarenko, 2004; Raffensperger, 2008).
This school of thought also believes that up to 25% percent of observed global warming,
particularly regarding melting ice is attributed to soot (Hansen & Nazarenko, 2004).
It is reckoned that on a mass basis, an ounce of black carbon particle can absorb more than a
million times more radiant energy than an ounce of CO2, however, because the concentrations of
CO2 are usually higher as well as possessing a lifetime more than 2500 times that of black
carbon, CO2 is still considered a greater threat (Jacobson, 2010)
Bond and Sun (2005) highlighted much uncertainty in estimating GWP. They however proffer
that in terms of CO2 equivalents, GWPBC,100 ranges between 210 to 1500 and GWPBC,20 ranges
between 690 to 4700. The central value for GWPBC,100 being 680. Findings from other
researchers, presented by Hill (2009) are included in Table 3.2 as GWP for 20 and 100 years for
both black carbon and organic carbon (the negative signs indicating a cooling effect).
24 SRC Publication No. 13069-1C11

Greenhouse Gas Emissions Assessment. The Substitution of Fossil Fuels With Woody Biomass in the Northwest Territories March, 2011
Table 3.2 Black and organic carbon global warming potentials.
Author GWP20 GWP100
BC CO2-e OC CO2-e BC CO2-e OC CO2-e
Global GWP
Hansen et al, 2007 2000 500
BC: Bond and Sun, 2005 OC: Bond et al, 2004
2200 -250 680 -75
Jacobson, 2007 (lower bound estimate)
4480 1500
Reddy and Boucher, 2007 480
Schulz et al, 2006 1600 -240 460 -69
North America GWP
Reddy and Boucher, 2007 1500 430
Koch et al, 2007 1900 -150 550 -42
Naik et al, 2007 3200 -310 920 -88 BC – black carbon; OC – organic carbon. Negative signs indicate a cooling effect.
Source: Adapted from Hill, 2009
In this study, Koch et al, 2007 GWP factors are applied (GWPBC,100 = 550 and GWPOC,100 = -42).
A sensitivity analysis is conducted and a range of results based on other GWP factors is given.
SRC Publication No. 13069-1C11 25

March, 2011 Greenhouse Gas Emissions Assessment. The Substitution of Fossil Fuels With Woody Biomass in the Northwest Territories
4. FOREST SUSTAINABILITY
4.1 Introduction
In addition to reductions in GHGs, other environmental considerations also play a role in a
decision regarding the use of biomass for energy production. In the case of biomass harvested
from existing forest stands, long-term sustainability is a key consideration. Forests provide
multiple values for society, including forest products, wildlife habitat and contributing to clean
water and productive soils. These values must be maintained while using forest biomass for
energy production. In this project we use the Criteria and Indicators of Sustainable Forest
Management (C&I) developed by the Canadian Council of Forest Ministers (CCFM) to
characterize the values associated with forests in NWT and to assess needs for forest
sustainability as plans for harvesting woody biomass for energy production are developed. The
purpose of this report is to summarize the C&I and to use them as a framework for determining
how harvesting of woody biomass for energy production can be done in a way that ensures long-
term sustainability of forest values.
4.2 Criteria and indicators of sustainable forest management
In the early 1990s an initiative was launched among temperate and boreal countries to develop
and implement internationally agreed criteria and indicators for sustainable forest management.
The Montréal Process began in June 1994, in Geneva, with the first meeting of the Working
Group on Criteria and Indicators for the Conservation and Sustainable Management of
Temperate and Boreal Forests. The Canadian Council of Forest Ministers released its first
framework of C&I for Sustainable Forest Management in 1995, and subsequent reports in 1997
and 2000. In 2003, the CCFM released an updated C&I framework, and in 2006, the CCFM
released its report on national progress toward sustainable forest management (CCFM 2011).
The Canadian Criteria and Indicators Framework is a science-based framework used to define
and measure Canada's progress in sustainable forest management. The criteria represent forest
values that Canadians want to enhance or sustain, while the indicators identify scientific factors
used to assess the state of the forests and measure progress over time. In this report we use the
six Criteria to summarize the forest values and use the Criteria to identify sustainability
requirements related to harvesting woody biomass for energy production in NWT. The more
26 SRC Publication No. 13069-1C11

Greenhouse Gas Emissions Assessment. The Substitution of Fossil Fuels With Woody Biomass in the Northwest Territories March, 2011
detailed Indicators can be used to measure progress toward sustainability, but we limit this
discussion to the Criteria level since forest harvesting for bioenergy purposes has not yet been
implemented on a large scale in NWT and local-level indicators remain to be identified.
The principles underlying the C&I framework include the following (CCFM 2003):
1. The need to manage forests as ecosystems in order to maintain their natural processes;
2. The recognition that forests simultaneously provide a wide range of environmental, economic,
and social benefits to Canadians;
3. The view that an informed, aware, and participatory public is important in promoting
sustainable forest management; and,
4. The need for forest management to evolve to reflect the best available knowledge and
information.
4.3 The Criteria
The Criteria are made up of six aspects of forest ecosystems and management that are considered
to be essential to ensuring sustainability (Table 4.1). In the following section the Criteria are
reviewed with respect to how they can help ensure forest sustainability in the context of
harvesting forest biomass for energy production in NWT.
SRC Publication No. 13069-1C11 27

March, 2011 Greenhouse Gas Emissions Assessment. The Substitution of Fossil Fuels With Woody Biomass in the Northwest Territories
Table 4.1. The six Criteria of Sustainable Forest Management (adapted from CCFM 2003)
Criterion Explanation
1. Biological Diversity Maintain ecosystem, species and genetic diversity
2. Ecosystem Condition
and Productivity
Maintain forest health and capacity for growth
3. Soil and Water Minimize soil disturbance and impacts to water quality
and quantity
4. Role in Global
Ecological Cycles
Maintain forests’ ability to sequester carbon
5. Economic and Social
Benefits
Maintain the value of both timber and non-timber forest
products to local and national economies
6. Society’s Responsibility Maintain Aboriginal and treaty rights; maintain forest-
based community well-being; use fair, effective and
informed decision-making processes
4.3.1 Criterion 1: Biological Diversity
The conservation of biological diversity is a critical component of sustainable forest management
regardless of forest use and forest type. Biological diversity as used in the C&I framework
includes ecosystem diversity, species diversity and genetic diversity. Maintenance of the natural
range of ecosystems, and the ability of their components to react to external forces and
processes, provides the equilibrium required for the maintenance of species diversity. Changes in
ecosystems necessarily cause changes in species populations and distribution. Knowing that
certain species are vulnerable or threatened may suggest changes in forest management and other
measures to restore biological diversity. Maintenance of genetic diversity ensures that species
maintain viability through their capacity to evolve and adapt to change.
28 SRC Publication No. 13069-1C11

Greenhouse Gas Emissions Assessment. The Substitution of Fossil Fuels With Woody Biomass in the Northwest Territories March, 2011
Natural resources management falls under the GNWT Sustainable Development Policy 52.05:
“The Government of the Northwest Territories shall promote economic development, which
maintains harvestable resources at sustainable levels, essential ecological processes and natural
diversity.”(GNWT 2005a)
As indicated by this policy, biodiversity conservation will be promoted if harvesting is carried
out at sustainable levels. For example, the Forest Resource Assessment for the Dehcho Region,
Mackenzie River Lowlands (The Forestry Corp 2010) provides sustainable harvesting levels for
fuelwood and sawlog/log home production. Considerations for protected areas and caribou
habitat are also included in this assessment. This approach should be adopted in other areas that
may be subject to biomass harvesting for bioenergy production, although further work will be
required by GNWT to develop specific harvesting guidelines for the protection of caribou
habitat. In addition, further consideration will need to be given to any species that fall within the
Species at Risk Act. Finally, harvesting upland forests will be based on existing knowledge of
these ecosystem’s structure and function, e.g. the NWT Ecosystem Classification System4.
However, harvesting for woody biomass in other areas, e.g. riparian willow stands, will require
detailed knowledge of the role of these ecosystems in maintaining biodiversity, and how
sustainable harvesting can be carried out.
Criterion 2: Ecological Condition and Productivity
This criterion is focused on maintaining the productivity of the forest and the extent of forest
cover; reducing the area affected by insects and disease; and ensuring that all harvested areas are
promptly regenerated. As mentioned above, resource assessments and forest management plans
that focus on sustainable harvest levels and require prompt regeneration and a free-to-grow
standard are an important tool in ensuring long-term productivity [under the Forest Management
Act and Regulations, a regeneration plan is required for commercial timber harvesting licenses
(GNWT 2004)]. Sustainability is also linked to the extent of insects and disease that reduce
productivity and result in mortality. GNWT should review their existing forest pest monitoring
program, particularly where forest biomass harvesting may occur in areas not previously
considered for forest management.
4 The GNWT Ecosystem Classifications for the Taiga Plains, Taiga Shield and Cordillera Ecozones are available on-line: http://www.enr.gov.nt.ca/_live/pages/wpPages/Ecosystem_Classification.aspx.
SRC Publication No. 13069-1C11 29

March, 2011 Greenhouse Gas Emissions Assessment. The Substitution of Fossil Fuels With Woody Biomass in the Northwest Territories
This criterion also deals with reducing the area subject to forest fire disturbance. Given the
relatively low population of NWT and the importance of fire as a natural ecological process,
GNWT will determine the best mix of fire suppression and prescribed natural fire that will meet
the sustainable development goals referred to above. According to Fire Management Policy
52.07 of GNWT, the following principles guide this decision making:
“(1) Fire should be recognized as a significant and natural phenomenon in the forests of the
Northwest Territories and
(2) Fire management should strive to attain forest management and other land use objectives in a
manner that considers environmental, social and economic criteria.” (GNWT 2005b).
In addition, fire-killed timber should be considered as a source of bioenergy feedstock in areas
where the logistics are reasonable (e.g. near communities) but only to the extent that dead and
down woody material is not required for maintenance of biodiversity and ecosystem function.
Research will likely be required to determine how much fire killed timber can be used as
feedstock without compromising its ecological value, e.g. Donato et al. (2006).
Criterion 3: Soil and Water
Criterion 3 deals with conserving soil and water resources as forest management activities are
implemented. This generally includes guidelines on minimizing impacts of road construction,
skid trails and other access development; reducing the impacts of harvesting in riparian zones;
and managing forest harvesting at the landscape scale to reduce impacts to watersheds and water
supply. For bioenergy harvesting, normal operating guidelines under the Forest Management
Regulations (GNWT 2004) and associated policies should be sufficient for upland forest stands.
If harvesting is considered in riparian zones, e.g. in fast-growing willow stands, the impacts to
adjacent water bodies need to be carefully regulated to avoid impacts to water quality, fish
habitat etc.
Criterion 4: Role in Global Ecological Cycles
This criterion largely deals with maintaining the ability of the forest to continue sequestering
carbon as a means of mitigating climate change. Key issues for this criterion are maintaining the
health and productivity of the forest, prompt regeneration, and monitoring forest condition to
30 SRC Publication No. 13069-1C11

Greenhouse Gas Emissions Assessment. The Substitution of Fossil Fuels With Woody Biomass in the Northwest Territories March, 2011
determine potential impacts of dieback, insects, disease, fire etc. GNWT should also consider
how to minimize the permanent loss of forest cover (i.e. deforestation) due to developments such
as permanent roads and pipelines, notwithstanding the need for economic development. Analyses
should be carried out of the impact of these developments on the landscape carbon balance in
NWT forests. It will also be important to carry out a Life Cycle Assessment of bioenergy
production (as included in this project) to determine the net impacts of substituting woody
biomass for fossil fuels. Woody biomass is often assumed to be “carbon-neutral” but this
depends on the details of the conversion technology used, the amount of transportation required,
whether the biomass comes from forested areas that will be regenerated, and other factors. Once
plans for use of forest biomass are more firmly developed, GNWT may be interested in using
tools such as the Carbon Budget Model of the Canadian Forest Sector (freely available from the
Canadian Forest Service) to determine the effects of natural disturbance and forest management
activities, including harvesting for bioenergy, on the carbon balance of NWT forests.
Carbon accounting for bioenergy development needs to include both the role of the forest in
sequestering carbon and the role of the bioenergy system in producing GHG emissions. When
both the forest and the bioenergy system are included, the system as a whole may be nearly
carbon-neutral relative to fossil fuel use, since the uptake of carbon by re-growing trees
compensates for the emissions due to bioenergy production. A recent study in Massachusetts
(MCCS 2010) developed the concepts of “carbon debt” and “carbon dividend”. This describes
the carbon balance of an integrated forest management-bioenergy system relative to the use of
fossil fuels for energy production. In the forest-bioenergy system, the relative carbon balance is
at first negative due to tree harvesting (a carbon debt) but becomes positive as the trees re-grow
following harvest and begin to sequester increasing amounts of carbon. At some point,
depending on species and growth rates, the system pays back the carbon debt through
sequestration. After that point the system generates a carbon dividend as sequestration continues.
Figure 4.1 shows a hypothetical example of the carbon balance and how it changes over time. In
this example, the C debt has been recovered at about 35 years, and the system realizes a C
dividend after that point (BAU refers to “business-as-usual” i.e. an unharvested stand).
It is important to note that this is a stand-level analysis. If harvesting for bioenergy is occurring
across the landscape at different times, this kind of analysis would need to be integrated across
time and space, similar to a traditional wood supply analysis. In addition, this analysis applies to
SRC Publication No. 13069-1C11 31

March, 2011 Greenhouse Gas Emissions Assessment. The Substitution of Fossil Fuels With Woody Biomass in the Northwest Territories
stands that are replanted after harvest in a traditional sustainable forest management system. The
C dividend will not occur in stands that are harvested but not replanted, e.g. those cleared for
pipeline rights-of-way or road construction. In this scenario, the emissions associated with
harvesting are not included because the harvesting is being done for a different reason. However,
the offsets realized from replanting the forest are not available so that the system may remain
more GHG-intensive than a fossil fuel-based system. Similarly, salvage harvesting for bioenergy
in fire-killed stands will not realize the carbon dividend unless they are replanted following
harvest. There may be an advantage to harvesting fast-growing willow stands since willow
readily reproduces through coppicing, but GNWT should investigate what these re-growth rates
will be to determine the extent and timing of the C dividend.
Figure 4.1 Carbon recovery in stands harvested for biomass, relative to emissions from fossil fuel. BAU, business-as-usual (adapted from MCCS 2010).
-25
-20
-15
-10
-5
0
0 10 20 30 40 50 60 70 80 90 100
C St
orag
e (t)
Years
Carbon Recovery
Biomass C minus BAU C
Fossil Fuel C Emissions
Point of Equal Cumulative C Flux
Biomass C Debt Relative to Fossil Fuel
Biomass C Dividend Relative to Fossil Fuel
32 SRC Publication No. 13069-1C11

Greenhouse Gas Emissions Assessment. The Substitution of Fossil Fuels With Woody Biomass in the Northwest Territories March, 2011
Criterion 5: Economic and Social Benefits
This criterion deals with economic and social benefits from the forest. These include economic
values from timber production, value-added forest products, non-timber forest products and
values from non-market products and services (where these can be quantified). For bioenergy
harvesting, the net costs of the entire bioenergy production system, i.e. an integrated Life Cycle
Cost Analysis needs to be completed to determine the overall economic benefits, rather than
considering only the forest harvesting component. However, there are some harvesting scenarios
in which costs of biomass harvesting and transport may render the entire system uneconomic.
Studies of using post-harvest residues for bioenergy have found that in some jurisdictions
transportation costs may be prohibitive beyond a haul distance of about 100 km (Bradley 2010),
although this will vary depending on the details of location.
Criterion 6: Society’s Responsibility
Criterion 6 is mainly concerned with ensuring that Aboriginal treaty rights are maintained as a
cornerstone of forest management, and that forest-based communities (Aboriginal and non-
aboriginal communities) participate in informed, fair and effective decision-making. GNWT has
a long history of Aboriginal involvement in decision-making, and bioenergy development
provides a number of opportunities for both Aboriginal and non-aboriginal communities.
Replacing expensive fossil-fuel energy systems with bioenergy systems based on local biomass
should reduce costs, and provide opportunities to residents through training and employment at
these facilities. This will help in developing more resilient and self-sufficient communities.
SRC Publication No. 13069-1C11 33

March, 2011 Greenhouse Gas Emissions Assessment. The Substitution of Fossil Fuels With Woody Biomass in the Northwest Territories
5. FOREST CARBON MODELING
This section describes the analysis of bioenergy production under Scenario 1 (see Goal and
Scope section of the report). In this scenario it is assumed that woody biomass from the sources
described in Scenario 1 would be chipped on site by a mobile wood chipper. Wood chips are
then transported by truck to the customers for thermal energy production.
Data used in the following calculations are shown in Table 5.1.
Table 5.1 Density, heat content and yield, and emissions per cubic metre of woody biomass.
Units Deciduous Coniferous
Woody biomass (m3) 1 1
Wood density1 (kg m-3) 401 393
Heat Content2 (MJ kg-1) 20 20
Heat Content (MJ) 8020 7860
Conversion Efficiency 0.8 0.8
Heat Yield (MJ) 6416 6288
C Emissions3 (kg) 215.5 215.5
CO2e Emissions4 (kg) 791 791 Notes: 1 Wood density is on an oven-dry basis; values for deciduous are averages for aspen, poplar and birch; values for coniferous are averages for spruce and pine 2 Heat content is on an oven-dry basis; data from US Department of Energy, Oak Ridge National Laboratory, Biomass Energy Data Book, http://cta.ornl.gov/bedb/index.shtml 3 Data from MCCS 2010 4 Calculated as C emissions X 3.667 (IPCC 2007)
Using the data in Table 5.1, the wood volumes required to satisfy the heating requirements for
communities listed in the AEA Report (AEA 2010) were calculated (Table 5.2).
34 SRC Publication No. 13069-1C11

Greenhouse Gas Emissions Assessment. The Substitution of Fossil Fuels With Woody Biomass in the Northwest Territories March, 2011
Table 5.2 Heating and wood volume requirements for communities listed in the AEA Report (AEA 2010).
Community1 Annual Heating Demand (MJ)
Wood Volume Required (m3)2
All Weather Roads
Enterprise 5,543,000 683
Kakisa 1,266,000 156
Fort Providence 14,120,000 1,739
Fort Resolution 12,588,000 1,550
Jean Marie River 2,944,000 363
Behchoko 27,196,000 3,349
Dettah 4,728,000 582
Fort Liard 7,871,000 969
Wrigley 2,092,000 258
Fort McPherson 14,892,000 1,834
Tsiigehtchic 5,533,000 681
Yellowknife 24,847,200 3,060
Subtotal 123,620,200 15,224
Ice Roads
Trout Lake 1,590,000 196
What'i 8,546,000 1,052
Nahanni Butte 1,621,000 200
Gameti 2,716,000 334
Wekweeti 4,453,000 548
SRC Publication No. 13069-1C11 35

March, 2011 Greenhouse Gas Emissions Assessment. The Substitution of Fossil Fuels With Woody Biomass in the Northwest Territories
Community1 Annual Heating Demand (MJ)
Wood Volume Required (m3)2
Tulita 7,711,000 950
Deline 10,921,000 1,345
Norman Wells 24,959,000 3,074
Fort Good Hope 6,277,000 773
Colville lake 944,000 116
Aklavik 16,168,000 1,991
Tuktoyaktuk 17,408,000 2,144
Subtotal 103,314,000 12,723
Grand total 226,934,200 27,948 Notes: 1 Community data from AEA report (AEA, 2010) except Yellowknife which came from the North Slave Fire report. 2 Based on 0.000123153 m3 MJ-1
These data area summarized in Table 5.3, along with the associated emissions. Revised demand
refers to the increased wood volume required to compensate for the 80% conversion efficiency
of the bioenergy technology assumed in the study.
Table 5.3 Summarized community bioenergy demand and associated emissions.
Annual
fuelwood demand (m3)
Conversion efficiency
Revised demand
(m3)
C emissions (kg m3)
Total C emissions
(kg)
Total C emissions
(t)
Total C emissions (t CO2e)1
27,948 0.8 34,934 215 7,528,22 7,528 27,629 Notes 1 Calculated as C emissions X 3.667 (IPCC 2007)
It is beyond the scope of this study to carry out a formal wood supply analysis to determine the
optimum location and timing of bioenergy harvesting for GNWT. The ideal tool for this purpose
36 SRC Publication No. 13069-1C11

Greenhouse Gas Emissions Assessment. The Substitution of Fossil Fuels With Woody Biomass in the Northwest Territories March, 2011
would be the Carbon Budget Model of the Canadian Forest Sector, freely available from the
Canadian Forest Service (Kurz et al. 2009). In this report, data from the Forest Resource
Assessment for the Dehcho Region (The Forestry Corp. 2010) was used to calculate an age-
class-weighted mean volume per hectare (69 m3 ha-1). Using this value, a harvest area of
approximately 500 ha per year would be required to supply these communities with 34,934 m3 in
perpetuity. Note that the sustainable annual allowable cut for the Dehcho region is 279,202 m3,
or approximately 8 times that required the level of bioenergy production shown in Table 5.3. In
general, the sustainability of bioenergy feedstock from NWT forests does not appear to be in
doubt. In addition, total NWT emissions for 2008 were 1,448,508 t CO2e (Environment Canada
2010), while emissions from this level of bioenergy development would be approximately
27,629 t CO2e, i.e. about 2% of overall emissions. However, location-specific issues may arise,
for example the long-term sustainability of willow harvesting in some locations. In addition, the
plans for harvesting fire-killed trees in the North Slave fire area for bioenergy production near
Yellowknife will require some kind of forest renewal plan to ensure long-term sustainability.
The study from Massachusetts (MCCS 2010) shows how harvesting generates a “carbon debt”
relative to fossil fuel use in the forest decades following harvest, but the debt is eventually
recovered as the forest grows back and sequesters increasing amounts of carbon. For NWT, the
best way to determine the rate of recovery of the carbon debt is to use yield curves. These show
the rate of wood volume growth over time for each species or forest cover type (i.e. species
groups that generally occur together on the landscape). The Forest Resource Assessment for the
Dehcho Region (The Forestry Corp. 2010) provides yield curves for generalized conifer and
deciduous species groups. These were converted into the equivalent amount of carbon (tonnes C
ha-1) using conversion factors in the IPCC Good Practice Guidance for Land Use, Land Use
Change and Forestry (IPCC 2003). The curves are shown in Figure 5.1 (Table A1 in Appendix A
shows the calculation results). According to these curves, the average rate of carbon
sequestration is about 0.2 t C ha-1 yr-1. Assuming that 500 ha are harvested annually, it would
take about 70-75 years of regrowth to sequester the annual emissions from this level of
bioenergy production. However, the use of faster growing planting stock and forest management
practices may shorten this break-even point. In addition, once a large-scale harvest operation is
in place, over time the landscape becomes a mosaic of forest patches of varying ages – some
SRC Publication No. 13069-1C11 37

March, 2011 Greenhouse Gas Emissions Assessment. The Substitution of Fossil Fuels With Woody Biomass in the Northwest Territories
recently harvested and some older, depending on the harvest date. Over time the landscape-level
carbon pool comes into a dynamic equilibrium so that there is always carbon on the landscape
even though some areas are being harvested every year. Note also that this analysis only includes
merchantable stem biomass, as the assumption in this report is that only stem wood would be
harvested for bioenergy production.
Figure 5.1 Carbon “yield curve” based on data in the Forest Resource Assessment for the Dehcho Region and using conversion factors from IPCC (2003).
38 SRC Publication No. 13069-1C11

Greenhouse Gas Emissions Assessment. The Substitution of Fossil Fuels With Woody Biomass in the Northwest Territories March, 2011
6. GREENHOUSE GAS EMISSIONS ASSESSMENT RESULTS
6.1 Life Cycle Inventory
Life cycle inventory models have been developed to quantify and compare GHG emissions for
the following scenarios. These scenarios are described in details in the Goal and Scope session of
the report.
Scenario 1: Forest bioenergy for home and district heating– production of thermal energy from
locally-sourced woody biomass in the NWT.
1A: Firewood bioenergy;
1B: Wood chips bioenergy.
Scenario 2: Pellet bioenergy for home and district heating – production of thermal energy from
imported and locally produced wood pellets.
2A: Imported wood pellets bioenergy;
2B: Locally produced wood pellet bioenergy.
Scenario 3: Heating oil energy for home and district heating – production of thermal energy from
imported heating oil.
Detailed description of the life cycle inventory data used in this study is presented in Appendix
B: Life Cycle Inventory Supporting Information.
6.2 Results
All results are presented per MJ of net thermal energy produced.
Analysis of fossil greenhouse gas emissions5
Figure 6.1 presents overall comparison of all studied scenarios (please also see Figure D.1 in
Appendix D). As it can be seen from the Figure 6.1, wood chips produced from locally sourced
woody biomass have the lowest GHG emissions, followed by locally produced wood pellets,
wood pellets imported from Alberta and locally produced firewood. Wood pellets imported from
BC and firewood combusted in residential conventional technology stove have the highest GHG
emissions after heating oil. A summary of global warming impacts is also given in Appendix D.
5 It should be noted that only GHG emissions of fossil origin are presented here. This also includes biogenic methane emissions in line with greenhouse gas accounting protocols and standards.
SRC Publication No. 13069-1C11 39

March, 2011 Greenhouse Gas Emissions Assessment. The Substitution of Fossil Fuels With Woody Biomass in the Northwest Territories
Figure 6.1 Comparison of all scenarios under study.
Contribution analysis: Scenario 1
The comparison of GHG emissions from bioenergy production from firewood and wood chips is
presented in Figure 6.2. Two technologies for residential combustion of firewood were
compared. These are advanced technology catalytic stove and conventional technology stove.
Fossil GHG emissions from these technologies are shown in Figure 6.2. The detailed results are
presented in Appendix D. Conventional technology stove has higher emissions from combustion
stage due to lower efficiency compared to advanced technology stove.
Combustion of wood chips in two industrial boilers (50kW and 300kW) was modeled. The
GHG emissions from 50kW boiler are slightly higher than that of the 300kW boiler (see Figure
6.2 and Appendix D). It should be noted that most institutional boilers in the NWT range from
300kW to 1.5MW.
14.2
25.8
2.4 2.1
11.5 13.3
19.0
8.0 9.8
100
0
10
20
30
40
50
60
70
80
90
100
Fossil global warming (% of heating oil)
%
Firewood, at residential, advancedtechnology, catalytic stove
Firewood, at residential,conventional technology stove
Wood chips, at industrial boiler50KW
Wood chips, at industrial boiler300KW
Wood pellets bulk imported fromAB, at industrial boiler 50kW
Wood pellets bagged importedfrom AB, at residential stove
Wood pellets bagged importedfrom BC, at residential stove
Wood pellets bulk NWT, atindustrial boiler 50kW
Wood pellets bagged NWT, atresidential stove
Heating oil, at industrial boiler
40 SRC Publication No. 13069-1C11

Greenhouse Gas Emissions Assessment. The Substitution of Fossil Fuels With Woody Biomass in the Northwest Territories March, 2011
Figure 6.2 Contribution analysis of Scenario 1.
Fossil GHG emissions originate mainly from combustion of firewood or wood chips. Ash
disposal stage contributes to less than 1% of global warming impact.
Wood chips resulted in much lower GHG emissions compared to firewood due to lower
emissions from the combustion stage. The production stage of firewood and wood chips resulted
in similar amounts of GHG emissions.
The impact from the combustion of firewood is much higher compared to the impact from
combustion of wood chips. This is mainly due to the efficiencies of the combustion process.
Firewood is assumed to be combusted in the residential stove, while wood chips – in a high
efficiency industrial boiler.
Contribution analysis: Scenario 2
GHG assessment of locally produced wood pellets and wood pellets imported from AB and BC
is presented in Figure 6.3. Most of the GHG emissions for imported pellets originate from
pellets production and transportation stages. Transportation of wood pellets from AB and BC
contribute to approximately half of the global warming impact from wood pellets life cycle.
Since transportation has such a significant impact on global warming, sensitivity analysis on
transportation distance was conducted. Results are presented in Figure 6.4.
0
0.005
0.01
0.015
0.02
0.025
Firewood,advanced
technologystove
Firewood,conventionaltechnology
stove
Wood chips, atindustrial
boiler 50KW
Wood chips,industrial
boiler 300kW
Glob
al w
arm
ing,
kg
CO2-
e
Scenario 1: Forest bioenergy (fossil GHG emissions)
Ash disposal
Production
Combustion
SRC Publication No. 13069-1C11 41

March, 2011 Greenhouse Gas Emissions Assessment. The Substitution of Fossil Fuels With Woody Biomass in the Northwest Territories
Figure 6.3 Contribution analysis of Scenario 2.
Polyethylene bag production, ash disposal and polyethylene bad disposal life cycle stages
contribute to less than 1% of the total life cycle impact.
GHG emissions from combustion stage of wood pellets are slightly lower compare to firewood
and wood chips combustion emissions. This is due to higher heating value of wood pellets
(19,700 MJ/tonne pellets). Combustion of wood pellets in residential stoves is also less efficient
than combustion in institutional boilers, resulting in higher GHG emissions.
Figure 6.4 Sensitivity analysis of transportation distance.
0.0000.0020.0040.0060.0080.0100.0120.0140.0160.018
Pelletsbulk, AB,industrial
boiler
Pelletsbagged,
AB,residential
stove
Pelletsbagged, BC,residential
stove
Pelletsbulk, NWT,industrial
boiler
Pelletsbagged,
NWT,residential
stove
Glob
al w
arm
ing,
kg
CO2-
e Scenario 2: Pellets bioenergy (fossil GHG emissions)
Bag disposal
Ash disposal
Polyethelene bag production
Transport
Pellets production
Combustion
0
0.002
0.004
0.006
0.008
0.01
0.012
500 700 1000 1500 2000
kg C
O2e
km
Transportation distance - sensitivity analysis
42 SRC Publication No. 13069-1C11
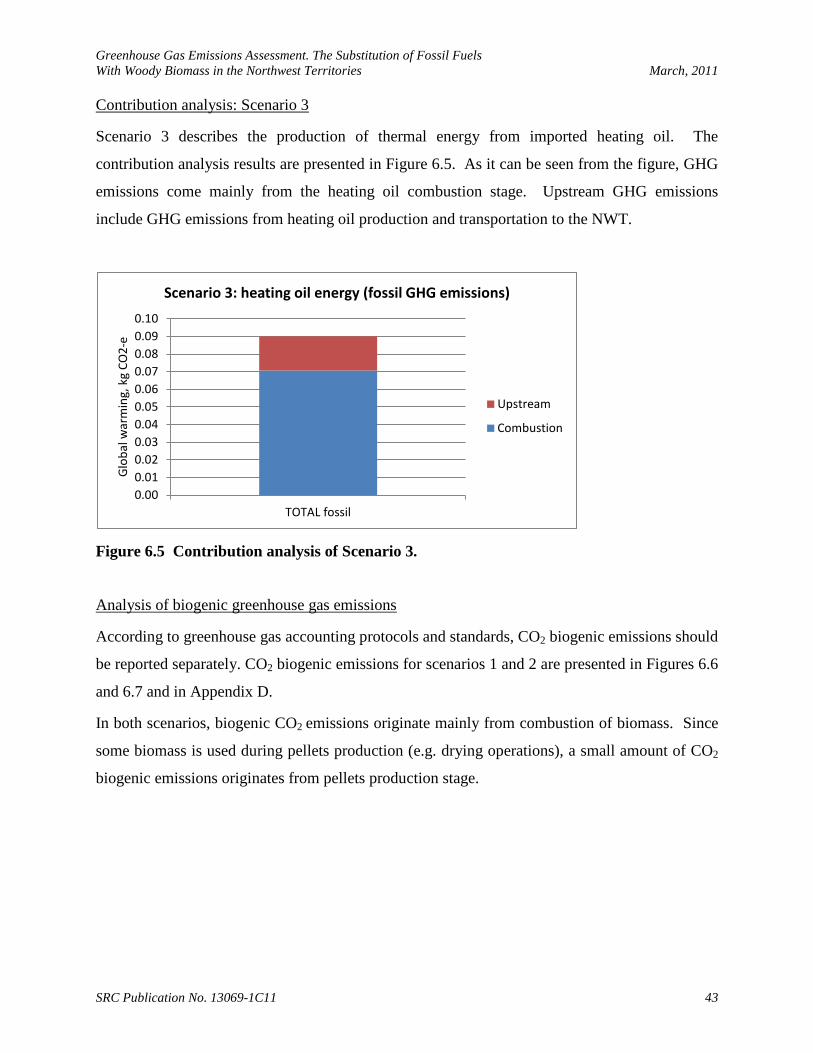
Greenhouse Gas Emissions Assessment. The Substitution of Fossil Fuels With Woody Biomass in the Northwest Territories March, 2011
Contribution analysis: Scenario 3
Scenario 3 describes the production of thermal energy from imported heating oil. The
contribution analysis results are presented in Figure 6.5. As it can be seen from the figure, GHG
emissions come mainly from the heating oil combustion stage. Upstream GHG emissions
include GHG emissions from heating oil production and transportation to the NWT.
Figure 6.5 Contribution analysis of Scenario 3.
Analysis of biogenic greenhouse gas emissions
According to greenhouse gas accounting protocols and standards, CO2 biogenic emissions should
be reported separately. CO2 biogenic emissions for scenarios 1 and 2 are presented in Figures 6.6
and 6.7 and in Appendix D.
In both scenarios, biogenic CO2 emissions originate mainly from combustion of biomass. Since
some biomass is used during pellets production (e.g. drying operations), a small amount of CO2
biogenic emissions originates from pellets production stage.
0.000.010.020.030.040.050.060.070.080.090.10
TOTAL fossil
Glob
al w
arm
ing,
kg
CO2-
e
Scenario 3: heating oil energy (fossil GHG emissions)
Upstream
Combustion
SRC Publication No. 13069-1C11 43

March, 2011 Greenhouse Gas Emissions Assessment. The Substitution of Fossil Fuels With Woody Biomass in the Northwest Territories
Figure 6.6 Scenario 1: Biogenic CO2 emissions.
Figure 6.7 Scenario 2: Biogenic CO2 emissions.
Both fossil and biogenic GHG emissions for all scenarios under study are presented in Figure
6.8. It should be noted that according to current GHG accounting guidance, CO2 biogenic
emissions should be accounted separately from all other GHG emissions. The graph presents
contribution of fossil and biogenic emissions to the total GHG emissions from the life cycle of
different fuels.
0
0.02
0.04
0.06
0.08
0.1
0.12
0.14
Firewood, advanced technologystove
Wood chips, industrial boiler300kW
Glob
al w
arm
ing,
kg
CO2-
e Scenario 1: Forest bioenergy (biogenic CO2 emissions)
Ash disposal
Production
Combustion
00.010.020.030.040.050.060.070.080.09
0.1
Pellets bulk,AB,
industrialboiler
Pelletsbagged, AB,residential
stove
Pelletsbagged, BC,residential
stove
Pellets bulk,NWT,
industrialboiler
Pelletsbagged,
NWT,residential
stove
Glob
al w
arm
ing,
kgC
O2-
e
Scenario 2: Pellets bioenergy (biogenic CO2 emissions)
Bag disposal
Ash disposal
Polyethelene bagproductionTransport
Pellets production
Combustion
44 SRC Publication No. 13069-1C11

Greenhouse Gas Emissions Assessment. The Substitution of Fossil Fuels With Woody Biomass in the Northwest Territories March, 2011
Figure 6.8 Fossil and biogenic GHG emissions – comparison of all scenarios under study.
0.00
0.02
0.04
0.06
0.08
0.10
0.12
0.14
Firewood, atresidential,advanced
technology,catalytic
stove
Firewood, atresidential,
conventionaltechnology
stove
Wood chips,at industrialboiler 50KW
Wood chips,at industrial
boiler300KW
Wood pelletsbulk
importedfrom AB, atindustrial
boiler 50kW
Wood pelletsbagged
importedfrom AB, atresidential
stove
Wood pelletsbagged
importedfrom BC, atresidential
stove
Wood pelletsbulk NWT, at
industrialboiler 50kW
Wood pelletsbaggedNWT, at
residentialstove
Heating oil,at industrial
boiler
kg C
O2
e/M
J Fossil and biogenic GHG emissions
Fossil global warming Biogenic global warming
SRC Publication No. 13069-1C11 45

March, 2011 Greenhouse Gas Emissions Assessment. The Substitution of Fossil Fuels With Woody Biomass in the Northwest Territories
Black and organic carbon assessment results
Emissions factors in Table 6.1 were used to estimate black and organic carbon emissions from
firewood, wood chips, pellets and heating oil.
Table 6.1 Black and organic carbon emissions from controlled combustion of heavy fuel oil and wood in residential applications.
BC – black carbon; OC – organic carbon.
Source: Adapted from Bond et al. 2003.
Koch et al., 2007 GWP factors were applied (GWPBC,100 = 550 and GWPOC,100 = -42) to calculate
global warming impact (Figure 6.9). A sensitivity analysis was conducted and a range of results
based on GWP factors from other authors is presented in Figures 6.10-6.13. GWP factors
obtained from Naik et al, 2007, Schulz et al, 2006, Bond and Sun, 2005 (BC), and Bond et al,
2004 (OC) studies were used to conduct the sensitivity analysis (see Table 3.2).
Applying a lower limit for black carbon estimation, the contribution of black carbon emissions to
total GHG emissions from combustion range from 7.5 to 9.6% depending on the wood fuel type.
If organic carbon emissions are subtracted from black carbon emissions, this results in 4-6% of
black carbon emissions.
There is a huge uncertainty with calculation of black carbon emissions from biomass combustion
using lower and upper limits that resulted in the wide spread of results for black and organic
carbon. In our opinion, lower limit values are more applicable in this study since the combustion
occurs in the controlled environment. For more information on black carbon results, please see
Appendix D. It should be noted that contribution of black carbon emissions from biomass
combustion can be significant. Further research in this area is recommended.
Type of fuel BC (g/kg) OC (g/kg)
Heavy fuel oil 0.07 0.015
Biofuel: Wood 0.3 - 1.4 1.7 -7.8
46 SRC Publication No. 13069-1C11

Greenhouse Gas Emissions Assessment. The Substitution of Fossil Fuels With Woody Biomass in the Northwest Territories March, 2011
Note: OC (organic carbon), BC (black carbon), UL (upper limit), LL (lower limit).
Figure 6.9 Global warming potential ranges for black and organic carbon emitted from combustion of wood chips, firewood, wood pellets and heating oil.
-0.03 -0.02 -0.01 0.00 0.01 0.02 0.03 0.04 0.05 0.06
Wood pellets
Heating oil
Firewood
Wood chips
kg CO2e /MJ
Koch et al 2007, 100yr GWP CO2 e
OC UL
OC LL
BC UL
BC LL
SRC Publication No. 13069-1C11 47

March, 2011 Greenhouse Gas Emissions Assessment. The Substitution of Fossil Fuels With Woody Biomass in the Northwest Territories
Figure 6.10 Sensitivity analysis for wood pellets: global warming potential ranges for black and organic carbon emitted from combustion of wood chips, firewood, wood pellets and heating oil.
Figure 6.11 Sensitivity analysis for firewood: global warming potential ranges for black and organic carbon emitted from combustion of wood chips, firewood, wood pellets and heating oil.
-0.03 -0.02 -0.01 0.00 0.01 0.02 0.03
Bond
Schulz
Naik
kg CO2 e /MJ
Wood Pellets
OC UL
OC LL
BC UL
BC LL
-0.03 -0.02 -0.01 0.00 0.01 0.02 0.03 0.04
Bond
Schulz
Naik
kg CO2 e /MJ
Firewood
OC UL
OC LL
BC UL
BC LL
48 SRC Publication No. 13069-1C11

Greenhouse Gas Emissions Assessment. The Substitution of Fossil Fuels With Woody Biomass in the Northwest Territories March, 2011
Figure 6.12 Sensitivity analysis for wood chips: global warming potential ranges for black and organic carbon emitted from combustion of wood chips, firewood, wood pellets and heating oil.
Figure 6.13 Sensitivity analysis for heating oil: global warming potential ranges for black and organic carbon emitted from combustion of wood chips, firewood, wood pellets and heating oil.
-0.03 -0.02 -0.01 0.00 0.01 0.02 0.03 0.04
Bond
Schulz
Naik
kg CO2 e /MJ
Wood Chips
OC UL
OC LL
BC UL
BC LL
-0.0002 -0.0001 0.0000 0.0001 0.0002 0.0003 0.0004 0.0005 0.0006
Bond
Schulz
Naik
kg CO2 e /MJ
Heating Oil
OC UL
OC LL
BC UL
BC LL
SRC Publication No. 13069-1C11 49

March, 2011 Greenhouse Gas Emissions Assessment. The Substitution of Fossil Fuels With Woody Biomass in the Northwest Territories
7. CONCLUSIONS AND RECOMMENDATIONS
1. Three scenarios were analyzed in this study:
a. Scenario 1: Forest bioenergy for home and district heating – production of
thermal energy from locally-sourced woody biomass (firewood and woodchips) in
the NWT.
b. Scenario 2: Pellet bioenergy for home and district heating – production of thermal
energy from imported and locally produced wood pellets.
c. Scenario 3: Heating oil energy for home and district heating – production of
thermal energy from imported heating oil.
2. The study followed the LCA methodology defined in the ISO 14000 standards for the
estimation of greenhouse gas emissions. It also followed the PAS 2050 and the WRI
/WBCSD greenhouse gas accounting protocols.
3. The full life cycle of firewood, wood chips, pellets and heating oil starting from
harvesting of wood in the forest/extraction of crude oil through production of the product
to combustion and final disposal of wastes was evaluated.
4. Wood chips produced from locally sourced woody biomass showed the lowest GHG
emissions over the full life cycle, followed by locally produced wood pellets, wood
pellets imported from Alberta and locally produced firewood. Wood pellets imported
from BC and firewood combusted in residential conventional technology stove have the
highest GHG emissions after heating oil.
5. Transportation of wood pellets from AB and BC contribute to approximately half of the
global warming impact from wood pellets life cycle.
6. Based on the life cycle results, local wood chips and pellets production may be
recommended as one of the strategies for reduction of fossil GHG emissions.
7. Advanced technology catalytic stove and conventional technology stove used for
residential combustion of wood were compared. Conventional technology stove has
higher GHG emissions from combustion stage due to lower efficiency compared to
advanced technology stove.
50 SRC Publication No. 13069-1C11

Greenhouse Gas Emissions Assessment. The Substitution of Fossil Fuels With Woody Biomass in the Northwest Territories March, 2011
8. Residential stoves have lower efficiencies compared to institutional boilers. This resulted
in higher GHG emissions from combustion of different type of wood fuels in residential
applications.
9. Fossil GHG emissions and biogenic CO2 emissions were presented separately, as
required by international GHG protocols and standards (e.g. PAS 2050). Biogenic CO2
emissions originate mainly from combustion of biomass.
10. The Criteria and Indicators of Sustainable Forest Management developed by the
Canadian Council of Forest Ministers was used to assess the sustainability of biomass
harvesting. In general, we conclude that harvesting biomass for bioenergy in the NWT is
sustainable given the relatively low demand, which represents a small fraction of the
territories’ sustainable timber yield. In addition, sustainability will be achieved if best
practices are followed regarding the values outlined in the CCFM Criteria: protection of
biodiversity and water and soil quality; maintenance of forest health, productivity and
carbon storage; and equitable distribution of benefits to local communities. However,
there may be site-specific sustainability questions related to, for example, intensive
willow harvesting in riparian areas and impacts of harvesting on caribou habitat. GNWT
should undertake more detailed site assessments in areas where these concerns are likely
to arise, and also revise forest pest monitoring plans to include new biomass harvesting
areas. If fire-killed trees are harvested for bioenergy production, a forest renewal program
for these areas should be developed before harvesting is implemented. Finally, a more
detailed analysis of the impacts of biomass harvesting on landscape-level carbon storage
should be undertaken before large-scale harvesting is implemented. The Carbon Budget
Model of the Canadian Forest Sector is ideal for this purpose and is freely available from
the Canadian Forest Service.
11. Black and organic carbon emissions from combustion of firewood, wood chips, pellets
and heating oil were evaluated. Applying a lower limit for black carbon estimation, the
contribution of these emissions to total GHG emissions from combustion range from 4 to
6% depending on the wood fuel type. There is a huge uncertainty with calculation of
black carbon emissions from biomass combustion using lower and upper limits that
resulted in the wide spread of results for black and organic carbon. Lower limit values
would be more applicable in this study since the combustion occurs in the controlled
SRC Publication No. 13069-1C11 51
March, 2011 Greenhouse Gas Emissions Assessment. The Substitution of Fossil Fuels With Woody Biomass in the Northwest Territories
environment. The contribution of black carbon emissions from biomass combustion can
be significant. Further research in this area is recommended.
12. This study was limited to GHG emissions only. More research is necessary to investigate
other environmental effects. This would allow for a more complete and true comparison
of different scenarios. As an example, typical flue gas from combustion of fuels contains
considerable amounts of nitrogen oxides (NOx), sulphur dioxide (SO2) and particulate
matter, three compounds related to air pollution. If the life cycle of carbon approach is
used these compounds are neglected, as they do not contribute to climate change. Thus,
it makes sense to include relevant non-greenhouse gas emissions, such as air pollutants
(e.g. NOx, particles, SOx), especially when comparing different fuels (e.g. biomass,
heating oil) for use in combustion applications. The full Life Cycle Assessment (LCA)
study is recommended. The following impact categories in addition to global warming
would be assessed if the full LCA is conducted: respiratory effects, aquatic acidification,
aquatic eutrophication, terrestrial acidification and nitrification, land occupation, non-
renewable energy, mineral extraction, human toxicity, ionizing radiation, ozone layer
depletion, photochemical oxidation, aquatic ecotoxicity, and terrestrial ecotoxicity.
Biomass use in combined heat and power application or for co-generation should also be
evaluated. We also recommend an analysis of the forest landscape carbon balance using
the Carbon Budget Model of the Canadian Forest Sector. This model uses traditional
forest inventory data (or other data if inventory is not available) and determines the
annual carbon balance of the forest under any number of user-defined scenarios. These
may include the effects of fire, insect outbreaks and harvesting for forest products or
bioenergy. The model is freely available from the Canadian Forest Service, Pacific
Forestry Centre.
52 SRC Publication No. 13069-1C11

Greenhouse Gas Emissions Assessment. The Substitution of Fossil Fuels With Woody Biomass in the Northwest Territories March, 2011
REFERENCES
Arctic Energy Alliance - AEA. (2010) NWT Community Wood Pellet District Heating Study.
Arctic Energy Alliance, Yellowknife, NT.
Arctic Energy Alliance (2009) NWT Community Wood Pellet Study. Supply and Transport
Options for Wood Pellets. Prepared for GNWT Environment and Natural Resources.
Bachmann J. (2009) Black Carbon: A science/Policy Primer. Pew Center on Global Climate
Change: Arlington.
Bahner M.A., Weitz K. A., Zapata A. and DeAngelo B. (2007) Use of Black carbon and Organic
Carbon Inventories for Projections and Mitigation Analysis. US Environmental
Protection Agency 16th Annual International Emission Inventory Conference Emission
Inventories: “Integration, Analysis, and Communications” Raleigh, May 14-17, 2007.
Available at http://www.epa.gov/ttn/chief/conference/ei16/session3/k.weitz.pdf,
Accessed on 17 January 2011.
Baumann, H. and Tillman, A. (2004) The Hitch Hiker’s Guide to LCA. Studentlitteratur AB,
Lund, Sweden.
Bond T.C. and Sun H. (2005). Can reducing Black carbon Emissions Counteract Global
warming? Environmental Science & Technology, v. 39, No. 16, pp. 5291-5296.
Bond T.C., Streets D.G., Yarber K.F., Nelson S.M. Woo J, and Klimont Z. (2003). A
Technology-Based Global Inventory of Black and Organic Carbon Emissions from
Combustion. Journal of Geophysical Research. Available at
http://www.cgrer.uiowa.edu/ACESS/papers/Bond_bc_jgr_revised.pdf.
Bond, T., Venkataraman, C., and Masera, O. (2004) Global atmospheric impacts of residential
fuels. Energy For Sustainable Development, v. 8 no. 3, pp. 54-66.
Boudewyn, P., X. Song, S. Magnussen and M.D. Gillis. 2007. Model-based, volume-to-biomass
conversion for forested and vegetated land in Canada. Information Report BC-X-411.
Natural Resources Canada, Canadian Forest Service, Pacific Forestry Centre, Victoria,
BC. pp 124.
SRC Publication No. 13069-1C11 53

March, 2011 Greenhouse Gas Emissions Assessment. The Substitution of Fossil Fuels With Woody Biomass in the Northwest Territories
Bradley, D. (2010) Canada Report on Bioenergy. Canadian Bioenergy Association, Ottawa, ON.
Available on-line:
http://www.bioenergytrade.org/downloads/canadareportonbioenergy2010sept152010.pdf.
Canadian Council of Forest Ministers. (2003) Defining Sustainable Forest Management in
Canada: Criteria and Indicators 2003. Canadian Council of Forest Ministers Secretariat,
Ottawa, ON. Available on-line at: http://www.ccfm.org.
Carr, J. (2011) Personal communication with John Carr. Arctic Energy Alliance.
CCFM - Canadian Council of Forest Ministers. (2003) Defining Sustainable Forest Management
In Canada: Criteria and Indicators. Canadian Council of Forest Ministers, Ottawa, ON.
Available on-line: http://www.ccmf.org/pdf/CI_Booklet_e.pdf.
CCFM - Canadian Council of Forest Ministers. (2011) CCFM Web page “SFM in Canada -
Criteria and Indicators”. Canadian Council of Forest Ministers, Ottawa, ON. Available
on-line: http://www.ccmf.org/english/coreproducts-criteria_in.asp.
Donato, D.C., J.B. Fontaine, J.L. Campbell, W.D. Robinson, J.B. Kauffman and B.E. Law.
(2006) Post-wildfire logging hinders regeneration and increases fire risk. Science 311:
352.
Ecoinvent Centre (2009) Swiss Centre for Life Cycle Inventories Website. Available at:
http://www.ecoinvent.ch/.
Environment Canada (2008) National Inventory Report 1990-2006 - Greenhouse Gas Sources
and Sinks in Canada.
Environment Canada. (2010) National Inventory Report 1990-2008: Greenhouse Gas Sources
and Sinks in Canada. Environment Canada, Canada’s Greenhouse Gas Emissions,
available on-line at: http://www.ec.gc.ca/ges-ghg/default.asp?lang=En&n=1357A041-1.
FPInnovations. (2009) NWT Wood Pellet Pre-feasibility Analysis. Prepared for The Government
of the Northwest Territories by BW McCloy and Associates Inc. November 2009.
GHGenius. (2010) GHGenius model 3.19. Available at http://www.ghgenius.ca/.
Government of the Northwest Territories. (2004) Forest Management Regulations. GNWT,
Environment and Natural Resources, Yellowknife NT.
54 SRC Publication No. 13069-1C11

Greenhouse Gas Emissions Assessment. The Substitution of Fossil Fuels With Woody Biomass in the Northwest Territories March, 2011
Government of the Northwest Territories. (2005a) Policy 52.05: Sustainable Development.
GNWT, Environment and Natural Resources, Yellowknife NT.
Government of the Northwest Territories. (2005b) Policy 52.07: Forest Fire Management.
GNWT, Environment and Natural Resources, Yellowknife NT.
Hansen J., and Nazarenko L. (2004) Soot climate forcing via snow and ice albedos, PNAS 2004
vol 1, no.2, pp. 423-428.
Hansen, J., Sato, M., Kharecha, P., Russell, G., Lea, D., and Sidall, M. (2007) Climate change
and trace gases. Transactions of the Royal Society A., v. 365, pp. 1925-1954.
Hill B. L. (2009). The Carbon Dioxide-Equivalent Benefits of Reducing Black Carbon
Emissions from U.S. Class 8 Trucks Using Diesel Particulate Filters: A Preliminary
Analysis. Clean Air Task Force: Boston.
Intergovernmental Panel on Climate Change - IPCC. (2003) Good Practice Guidance for Land
Use, Land Use Change and Forestry. IPCC National Greenhouse Gas Inventories
Programme, Technical Support Unit, Hayama, Japan.
Intergovernmental Panel on Climate Change - IPCC. (2007) Chapter 2: Changes in Atmospheric
Constituents and in Radiative Forcing. IPCC Fourth Assessment Report.
Intergovernmental Panel on Climate Change, Working Group I Report “The Physical
Science Basis”, 212pp.
IPCC (1996) Revised 1996 IPCC Guidelines for National Greenhouse Gas Inventories Reference
Manual, Volume 3. Energy, Prepared by Eggleston S., Garnier J., Mobley D., and
Mareckova K., (1996). Available at http://www.ipcc-
nggip.iges.or.jp/public/gl/invs6a.html. Accessed 13 January 2011.
IPCC. Intergovernmental Panel on Climate Change (2007) Chapter 2: Changes in Atmospheric
Constituents and in Radiative Forcing. IPCC Fourth Assessment Report. Working Group
I Report “The Physical Science Basis”, 212pp.
ISO - International Organization for Standardization (2006) 14040. Environmental Management
- Life cycle assessment - Principles and Framework.
SRC Publication No. 13069-1C11 55

March, 2011 Greenhouse Gas Emissions Assessment. The Substitution of Fossil Fuels With Woody Biomass in the Northwest Territories
ISO - International Organization for Standardization 14040. Environmental Management - Life
cycle assessment - Principles and Framework. 2006.
ISO - International Organization for Standardization 14044.Environmental Management - Life
Cycle Assessment - Requirement and Guidelines. 2006.
Jacobson, M. Z. (2010) Short-term effects of controlling fossil-fuel soot, biofuel soot and gases,
and methane on climate, Arctic ice, and air pollution health, J. Geophys. Res., v. 115,
D14209, doi:10.1029/2009JD013795.
Johansson, L. S., Leckner, B., Gustavsson, L., Cooper, D., Tullin, C., and Potter, A. (2004)
Emission characteristics of modern and old-type residential boilers fired with wood logs
and wood pellets. Atmospheric Environment, v. 38 (25), 13,
doi:10.1016/j.atmosenv.2004.04.020.
Jones, G., Loeffler, D., Calkin, D. and Chung, W. (2010). Forest treatment residues for thermal
energy compared with disposal by onsite burning: Emissions and energy return. Biomass
and Bioenergy 34, 737 – 746.
Koch, D., T. C. Bond, D. Streets, N. Unger, and G. R. van der Werf (2007) Global impacts of
aerosols from particular source regions and sectors, Journal of Geophysical Research-
Atmospheres, 112, D02205.
Kurz, W.A., C.C. Dymond, T.M. White, G. Stinson, C.H. Shaw, G.J. Rampley, C. Smyth, B.N.
Simpson, E.T. Neilson, J.A. Trofymow, J. Metsaranta, M.J. Apps. 2009. CBM-CFS3: A
model of carbon-dynamics in forestry and land-use change implementing IPCC
standards. Ecological Modelling 220: 480-504.
Lakusta, T. (2011) Personal communication with Tom Lakusta, Manager, Forest Resources,
Government of the Northwest Territories. 06 Jan 2011.
MCCS - Manomet Center for Conservation Sciences. (2010) Biomass Sustainability and Carbon
Policy Study. Natural Capital Initiative, Manomet Center for Conservation Sciences,
Brunswick ME, USA.
Mikko, H. (2005) Moisture in wood fuels and drying of wood chips. North Karelia Polytechnic.
56 SRC Publication No. 13069-1C11

Greenhouse Gas Emissions Assessment. The Substitution of Fossil Fuels With Woody Biomass in the Northwest Territories March, 2011
MKJA - M. K. Jaccard and Associates, Inc. (2011) An Exploration into the Impact of Carbon
Pricing in the Northwest Territories: Revised Reference Case & Quantitative Policy
Analysis. Prepared for the Government of the Northwest Territories.
Moore F.C. (2009) Climate Change and Air Pollution: Exploring the Synergies and Potential for
Mitigation in Industrializing Countries, Sustainability 2009, v. 1, pp. 43-54;
doi:10.3390/su1010043. Available at www.mdpi.com/journal/sustainability. Accessed
on 17 January 2011.
Naik, V., D. L. Mauzerall, L. W. Horowitz, M. D. Schwarzkopf, V. Ramaswamy, and M.
Oppenheimer (2007) On the sensitivity of radiative forcing from biomass burning
aerosols and ozone to emission location, Geophysical Research Letters, 34, L03818.
NFD (National Forestry Database). 2011. Data on area burned in forest fires 1990-2008 in the
Northwest Territories. Available on-line at: http://nfdp.ccfm.org/fires/jurisdictional_e.php
Accessed 02 February 2011.
Nussbaumer T., Czasch C., Klippel N., Johansson L. and Tullin C. (2008) Particulate Emissions
from biomas Combustion in IEA Countries: Survey on Measurements and Emission
Factors. Swiss Federal Office of Energy: Zurich.
NWT Biomass Energy Strategy. (2010) Environment and Natural Resources. Government of the
Northwest Territories.
Nyboer, J. And Jaccard, I. (2010) A Review of Energy Consumption and Related Data in the
Canadian Wood Products Industry: 1990, 1995 to 2008. Canadian Industrial Energy End-
Use Data and Analysis Centre (CIEEDAC). pp.78.
Pa (2010) Development of British Columbia Wood Pellet Life Cycle Inventory and its
Utilization in the Evaluation of Domestic Pellet Applications. University of British
Columbia, Vancouver, December 2010.
Paul, K., Booth, T., Elliott, A., Jovanovic, T., Polglase P. And Kirschbaum, M. (2003) Life
Cycle Assessment of Greenhouse Gas Emissions from Domestic Woodheating. Prepared
for the Australian Greenhouse Office and Environment Australia by CSIRO Forestry and
Forest Products.
SRC Publication No. 13069-1C11 57

March, 2011 Greenhouse Gas Emissions Assessment. The Substitution of Fossil Fuels With Woody Biomass in the Northwest Territories
Pinnacle Renewable Energy Group (2011). Personal communication with Kim Beckman,
Manager Sales & Marketing. Pinnacle Renewable Energy Group, BC.
Premium Pellet Mills (2011). Personal communication with Premium Pellet Mills, BC.
Publicly Available Specification 2050. (2008) Specification for assessment of the life cycle
greenhouse gas emissions of goods and services. London. BSI British Standards. ISBN
978 0 580 50978 0; 2008. 29 October 2008.
Rafferensperger L. (2008) Black Carbon Emerges as a Main Contributor to Global Warming,
Earthtrends. Available at http://earthtrends.wri.org/updates/node/295. Accessed on 13
January 2011.
Ramanathan V., and Carmichael G. (2008) Global and regional climate changes due to black
carbon, Nature Geoscience 1, 221-227 doi: 10.1038/ngeo156.
Ramaswamy V., Boucher O., Haigh J., Hauglustaine D., Haywood J., Myhre G., Nakajima T.,
Shi G.Y., and Solomon S. (2001) Observed Climate Variability and Change. In: Climate
Change 2001: The Scientific Basis. Contribution of Working Group I to the Third
Assessment Report of the Intergovernmental Panel on Climate Change [Houghton,
J.T.,Y. Ding, D.J. Griggs, M. Noguer, P.J. van der Linden, X. Dai, K. Maskell, and C.A.
Johnson (eds.)]. Cambridge University Press, Cambridge, United Kingdom and New
York, NY, USA, 881pp. Available at http://www.ipcc.ch/ipccreports/tar/wg1/pdf/TAR-
06.PDF. Accessed on 17 January 2011.
Reddy, M. and Boucher, O. (2007) Climate impact of black carbon emitted from energy
consumption in the world’s regions. Geophysical Research Letters, v.34, L11802.
Sambo, S.M. (2002) Fuel consumption for ground-based harvesting systems in western Canada.
Advantage, v. 3, no. 29.
Schulz et al (2006) Radiative forcing by aerosols from the AeroCom present-day and pre-
industrial simulations. Atmospheric Chemistry and Physics, v.6, pp. 5225-5246.
SGA Energy. (2000) Emission Factors and Uncertainties for CH4 and N2O from Fuel
Combustion. Unpublished report prepared by SGA Energy Limited for the Greenhouse
Gas Division, Environment Canada. Available at http://www.ec.gc.ca/ges-
ghg/default.asp?lang=En&n=8688E3C4-1. Accessed on March 16th, 2011.
58 SRC Publication No. 13069-1C11

Greenhouse Gas Emissions Assessment. The Substitution of Fossil Fuels With Woody Biomass in the Northwest Territories March, 2011
Swiss Centre for Life Cycle Inventories et al. (2008) US-EI (EcoInvent processes with US
electricity). Available at http://www.ecoinvent.ch/.
The Forestry Corp. (2010) Forest Resource Assessment for the Dehcho Region, Mackenzie River
Lowlands. The Forestry Corp., Edmonton AB.
Zhang, Y., McKechnie, J., Cormier, D., Lyng, R., Mabee, R., Ogino, R. and MacLean, H. (2010)
Life Cycle Emissions and Cost of Producing Electricity from Coal, Natural Gas, and
Wood Pellets in Ontario, Canada. Environmental Science Technology, 44, pp. 538-544.
WRI - World Resource Institute et al. (2006) The greenhouse gas protocol: the land use, land-use
change and forestry guidance for GHG Project Accounting. 1-56973-631-6; 2006.
October 2006.
WRI/WBCSD. (2010) Product accounting and reporting standard. November 2010.
SRC Publication No. 13069-1C11 59
March, 2011 Greenhouse Gas Emissions Assessment. The Substitution of Fossil Fuels With Woody Biomass in the Northwest Territories
APPENDIX A
FOREST CARBON MODELING RESULTS
60 SRC Publication No. 13069-1C11

Greenhouse Gas Emissions Assessment. The Substitution of Fossil Fuels With Woody Biomass in the Northwest Territories March, 2011
Table A.1 Carbon yield curves calculated from data in The Forestry Corp. (2010).
Carbon in merchantable biomass (tC ha-1)
Stand Age Conifer Deciduous Total
0 0.0 0.0 0.0
10 0.1 0.3 0.4
20 0.4 1.3 1.8
30 1.1 2.9 3.9
40 2.0 4.6 6.6
50 3.2 6.2 9.4
60 4.7 7.5 12.1
70 6.6 8.1 14.7
80 9.0 8.0 17.1
90 12.0 7.8 19.7
100 14.8 7.3 22.2
110 17.5 6.8 24.3
120 19.9 6.3 26.2
130 20.4 5.7 26.1
140 20.6 5.2 25.8
150 20.6 4.7 25.3
160 20.4 4.3 24.7
170 20.1 3.8 24.0
180 19.8 3.4 23.2
190 19.3 3.1 22.4
200 18.9 2.7 21.6
Reference number: PM 010888 61

March, 2011 Greenhouse Gas Emissions Assessment. The Substitution of Fossil Fuels With Woody Biomass in the Northwest Territories
APPENDIX B
LIFE CYCLE INVENTORY – SUPPORTING INFORMATION
62 SRC Publication No. 13069-1C11

Greenhouse Gas Emissions Assessment. The Substitution of Fossil Fuels With Woody Biomass in the Northwest Territories March, 2011
B.1 Woody biomass harvesting operations
Harvesting wood for wood pellets production
In this study, the wood for imported pellet production is supplied from sustainably managed
forests in western Canada (mainly in AB and BC). The main species of wood used for pellets
production are spruce and pine.
Forest harvesting data which includes forest road construction, forest harvesting and wood
delivery to the forest product conversion facility (here sawmill) was obtained from Sambo 2002
and Pa 2010. The data is based on the survey of the Forest Engineering Research Institute of
Canada (FERIC) member companies (Sambo 2002). Wood in western Canada is harvested by
four ground-based harvesting systems: full-tree (53%); cut-to-length at roadside (7%), cut-to-
length at-the-stump (8%); and cut-to-length with harvesters and forwarders (14%). An average
harvested area of 24 ha has a merchantable timber volume of 244 m3/ha (or volume of 5,856 m3).
An average one-way haul distance is approximately 100 km. An estimated diesel fuel
consumption to deliver 1 m3 of wood to the sawmill in western Canada is 7.1 L/m3 or 273
MJ/m3, from which hauling operations use 51% of all fuel consumed (Sambo 2002).
Pa 2010 recalculated diesel fuel consumption from MJ/m3 of wood to MJ/tonne of pellets
produced from the sawmill by-products (e.g. chips, shavings, sawdust). The recalculated energy
consumption in MJ/tonne of pellets and corresponding GHG emissions from harvesting
operations are presented in Table B.1.
Harvesting wood for firewood production
The local wood is harvested for firewood in this scenario. A number of small size businesses
produce firewood in the NWT. Several businesses were contacted, however, they could not
provide data on diesel consumption for firewood harvesting and processing. Thus, the data from
the literature was used.
The density of the green wood with the moisture content of 50% is assumed to be 840 kg/m3.
Using Sambo (2002) estimate of 3.5L of diesel or 134 MJ for the production of 1 m3 of green
timber (note: hauling is not included), 6.8L of diesel or 262 MJ is required to produce 1 tonne of
firewood with 18% of moisture content. The green lumber is transported over 5 km to the log
processing facility where it is allowed to dry and then processed. Diesel consumption for
processing the wood was assumed to be 6.6 L/tonne (Paul et al., 2003). The seasoned firewood
Reference number: PM 010888 63

March, 2011 Greenhouse Gas Emissions Assessment. The Substitution of Fossil Fuels With Woody Biomass in the Northwest Territories
is then delivered to customers by a small truck. An average transportation distance
(recommended distance) of 75 km was assumed (Pa, 2010).
Harvesting wood for wood chips production
The local wood is harvested and chopped by a mobile wood chipper in this scenario. Wood may
come from different sources (green wood from the merchantable forest, black wood from recent
burns, 20-40 year old willows from river flats). However, here it is assumed that all wood in this
scenario comes from the merchantable forest. This green biomass typically has a moisture
content of 50% and is allowed to air dry to 30% moisture content prior to grinding and hauling
offsite (Jones et al., 2010). An average hauling distance of 100 km is assumed (Sambo, 2002).
Estimated diesel fuel consumption to harvest and haul 1 m3 of wood is 7.1 L/m3 or 273 MJ/m3
(Sambo 2002) or 325 MJ/tonne of wood chips (8.5L/tonne of wood chips). Size reduction
occurs in the forest by a mobile wood chipper. Diesel consumption for grinding biomass was
assumed at 1.7 L/tonne of biomass or 65.37 MJ/tonne of biomass (Jones et al., 2010). The
moisture content of the wood influences the energy content of the fuel. Wood chips need to be
dried to 20% moisture content before combustion. Electricity consumption for wood chips
drying to 20% moisture content was estimated at 10.3 kWh/m3 of wood chips (Mikko, 2005).
Using the bulk density of wood chips of 350 kg/m3, it amounts to 29.43 kWh/tonne of wood
chips. It is assumed that heat for drying comes from woody biomass combustion. Wood chips
are then transported via a distance of 75 km to customers by five axle tractor-trailers, each with a
22.8 tonne payload.
B.2 Sawmill operations
Imported wood pellets
The data on energy consumption for sawmill operations is based on Nyboer and Jaccard 2010
and Pa 2010. Production of lumber at the sawmill involves the following steps: wood
preparation, sawing, kiln drying, planning and trimming. Wood residues such as bark, sawdust,
shavings and wood chips are generated during these processing stages. Some of the residues are
also used onsite as a hog fuel. The recalculated energy consumption (MJ/tonne of pellets) and
associated GHG emissions (kg/tonne of pellets) from sawmill operations are given in Table B.1.
64 SRC Publication No. 13069-1C11

Greenhouse Gas Emissions Assessment. The Substitution of Fossil Fuels With Woody Biomass in the Northwest Territories March, 2011
Table B.1 Energy consumption and GHG emissions for harvesting, sawmill and pellet plant operations.
Harvesting Sawmill Pellet plant
Energy consumption, MJ/tonne of pellets
Electricity - 186 490
Natural gas - 135 -
Heavy fuel oil - 14.57 -
Diesel 689 42.86 23.49
Propane - 3.68 6.16
Steam - 47.55 -
Wood waste - 271 1059
Gasoline - - -
Emissions, kg/tonne of pellets
Harvesting Sawmill Pellet plant
CO2, fossil 62.40 19.70 8.33
CO2, biogenic 0.427 26.70 102.0
CH4 0.0894 0.0446 0.0506
CH4, biogenic - 0.00255 0.00981
N2O 0.00777 0.00228 0.00640
Source: Adapted from Pa 2010.
Reference number: PM 010888 65
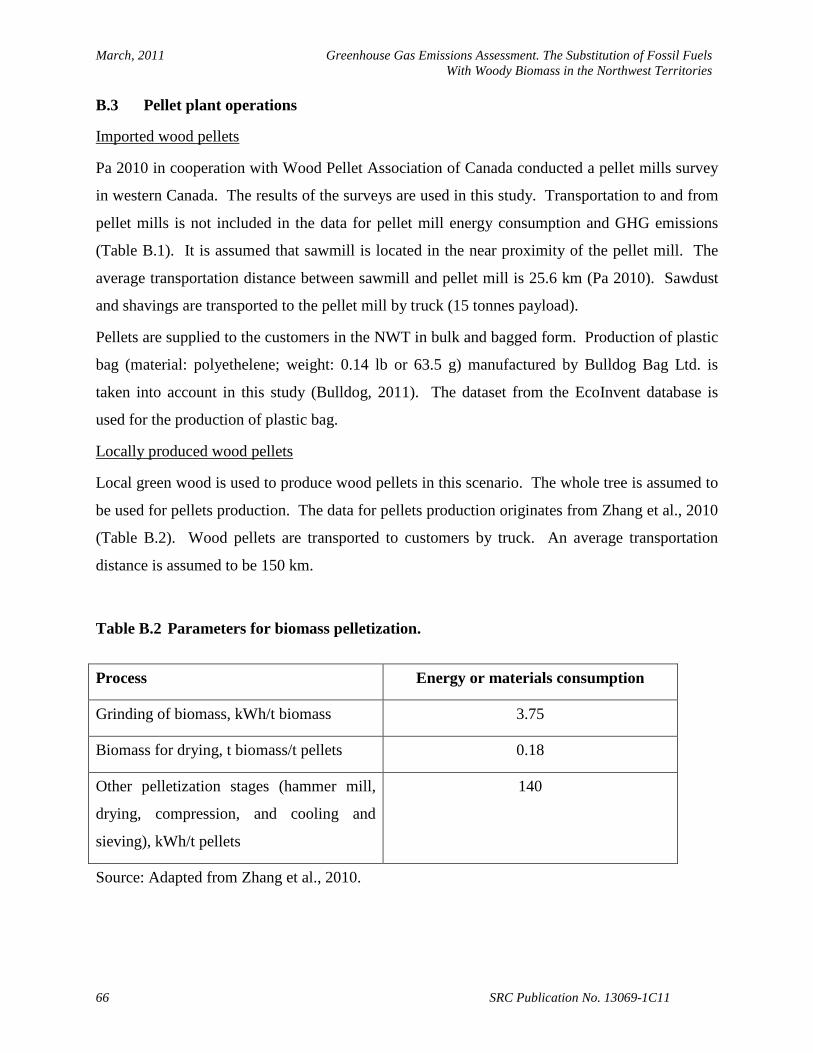
March, 2011 Greenhouse Gas Emissions Assessment. The Substitution of Fossil Fuels With Woody Biomass in the Northwest Territories
B.3 Pellet plant operations
Imported wood pellets
Pa 2010 in cooperation with Wood Pellet Association of Canada conducted a pellet mills survey
in western Canada. The results of the surveys are used in this study. Transportation to and from
pellet mills is not included in the data for pellet mill energy consumption and GHG emissions
(Table B.1). It is assumed that sawmill is located in the near proximity of the pellet mill. The
average transportation distance between sawmill and pellet mill is 25.6 km (Pa 2010). Sawdust
and shavings are transported to the pellet mill by truck (15 tonnes payload).
Pellets are supplied to the customers in the NWT in bulk and bagged form. Production of plastic
bag (material: polyethelene; weight: 0.14 lb or 63.5 g) manufactured by Bulldog Bag Ltd. is
taken into account in this study (Bulldog, 2011). The dataset from the EcoInvent database is
used for the production of plastic bag.
Locally produced wood pellets
Local green wood is used to produce wood pellets in this scenario. The whole tree is assumed to
be used for pellets production. The data for pellets production originates from Zhang et al., 2010
(Table B.2). Wood pellets are transported to customers by truck. An average transportation
distance is assumed to be 150 km.
Table B.2 Parameters for biomass pelletization.
Process Energy or materials consumption
Grinding of biomass, kWh/t biomass 3.75
Biomass for drying, t biomass/t pellets 0.18
Other pelletization stages (hammer mill,
drying, compression, and cooling and
sieving), kWh/t pellets
140
Source: Adapted from Zhang et al., 2010.
66 SRC Publication No. 13069-1C11

Greenhouse Gas Emissions Assessment. The Substitution of Fossil Fuels With Woody Biomass in the Northwest Territories March, 2011
B.4 Transportation of pellets to the NWT
Wood pellets currently used in the NWT come primarily from the LaCrete pellet mill in La
Crete, Northern Alberta. The remainder comes from BC pellet mills, Premium Pellet and
Pinnacle Pellet (Table B.3). Pellets from LaCrete are trucked as there is no rail access in La
Crete (La Crete, 2011). The transportation distance for LaCrete pellets is estimated at 824 km
(Google maps). The majority of Pinnacle pellets come in a bag form for home heating market.
All bagged pellets from BC are also transported by truck. Bagged pellets are placed on wooden
pallets and transported in standard freight trailers. The transportation distance for pellets
imported from BC is estimated at 1,800 km.
Table B.3 Wood pellets supply to the NWT.
Material Location Quantity, tpy (2010)
Mode of transport
Type of packaging
Distance, km
Source
Wood pellets
Le Crete pellet mill, Alberta
12,000 Super B-train trucks (payload 42 t, 8-axle)
90% Bulk 10% Bagged
824 La Crete, 2011
Pinnacle and Premium pellet mills, BC
600 45
Freight trailer (payload 30 t and 45 t)
100% Bagged
1,800 Pinnacle, 2011 Premium, 2011
Note: Retail shops, such as Wal-Mart and Canadian Tire carry bagged pellets for residential use. These pellets come
mainly from Pinnacle Pellet and Premium Pellet, BC. However, some originate from AB, MB and even US (Arctic,
2010).
B.5 Wood consumption for municipal and residential heating in the NWT
Community energy profiles prepared by the Arctic Energy Alliance6 were used to calculate
wood consumption for residential heating. Both firewood and wood pellets consumption was
combined in the energy profiles (Lakusta, 2011). The estimated amount of wood (firewood and
6 http://www.aea.nt.ca/resources/map/
Reference number: PM 010888 67

March, 2011 Greenhouse Gas Emissions Assessment. The Substitution of Fossil Fuels With Woody Biomass in the Northwest Territories
wood pellets) used for residential heating in the NWT in 2007-2008 was approximately 10,000
tonnes (Appendix C, Table C.1). The current estimated market for firewood in the NWT is
about 7,500 t/year (Lakusta, 2011). Bagged wood pellets consumption in 2010 was
approximately 1,845 t/yr (Table B.3). This value does not include wood pellets purchased at the
retail stores such as Wal-Mart and Canadian Tire.
B.6 Heating oil production and transportation to the NWT
Heating oil is commonly delivered by tank truck to residential, commercial and municipal
buildings and stored in above-ground storage tanks. Heating oil comes to NWT from the US and
Alberta. It is delivered to the NWT by rail and truck; by ocean tanker or rail and then,
distributed by tug and barge. Heating oil production and combustion data originates from the
GHGenius (GHGenius, 2010). The upstream emissions include emissions from all
transportation activities involved (Table B.4).
Table B.4 Total emissions over the life cycle of heating oil, per unit of energy delivered to end users, by pollutant (kg/MJ).
Emission Total emission, kg/MJ
Upstream emissions, kg/MJ
Combustion emissions, kg/MJ
Carbon dioxide (CO2), fossil 0.0862 0.0157 0.0705
Carbon dioxide (CO2), biogenic 0.000475 0.000475 0
Methane (CH4) 0.000122 0.000120 0.00000282
Nitrous oxide (N2O) 0.000000977 0.000000667 0.00000031
Source: Adapted from GHGenius, 2010.
68 SRC Publication No. 13069-1C11

Greenhouse Gas Emissions Assessment. The Substitution of Fossil Fuels With Woody Biomass in the Northwest Territories March, 2011
B.7 Production of thermal energy
Institutional buildings heating
The wood pellet systems installed in the NWT currently range from 300kW to 1.5MW (Arctic,
2010). The most common types of wood boilers are KOB and BINDER with efficiencies of up
to 92%. There are plans to install district heating systems in some NWT communities that
initially can use imported wood pellets before a locally harvested biomass supply in a form of
wood chips is established.
The following energy content of heating fuels was used in this study:
Wood pellets 19,700 MJ per tonne,
Heating oil 38.4 MJ per litre,
Firewood 16,400 MJ per tonne (18% moisture content),
Wood chips 15,200 MJ per tonne (20% moisture content).
Residential building heating
Wood and pellets stoves and furnaces are used for residential buildings heating.
Tables B.5-B.7 summarize the combustion emission factors of the various types of boilers and
furnaces.
Table B.5 Combustion emission factors for firewood, kg/tonne.
CO2, biogenic
CH4, biogenic N2O
Wood stove, residential
Advanced technology or catalytic control
1503 (0.0917 kg/MJ)
6.9 (0.000421 kg/MJ)
0.16 (0.0000097 kg/MJ)
Conventional 1503 (0.0917 kg/MJ)
15 (0.000915 kg/MJ)
0.16 (0.0000097 kg/MJ)
Source Based on carbon and moisture
content of firewood
SGA, 2000 SGA, 2000
Reference number: PM 010888 69

March, 2011 Greenhouse Gas Emissions Assessment. The Substitution of Fossil Fuels With Woody Biomass in the Northwest Territories
Table B.6 Combustion emission factors for wood chips, kg/MJ of useful energy.
CO2, biogenic CH4, biogenic
N2O
Boiler, industrial
50kW 0.127 8.75E-7 3.75E-6
300kW 0.124 4.88E-7 3.05E-6 Source Swiss Centre for
Life Cycle Inventories et al.,
2008
Swiss Centre for Life Cycle
Inventories et al., 2008
Swiss Centre for Life Cycle Inventories et al.,
2008
Table B.7 Combustion emission factors for wood pellets, kg/tonne.
CO2, biogenic CH4, biogenic
N2O
Boiler, industrial
50kW 1731 (0.0878 kg/MJ)
0.078 (0.0000039
kg/MJ)
0.058 (0.0000029 kg/MJ)
Pellet stove, residential
1731 (0.0878 kg/MJ)
1.11 (0.000056
kg/MJ)
0.071 (0.0000037 kg/MJ)
Source Based on carbon and moisture
content of wood pellets
Johansson et al., 2004
Swiss Centre for Life Cycle Inventories et al.,
2008
B.8 Waste management
The only solid waste from wood combustion is ash. Currently, ash from institutional boilers is
deposited at the municipal landfill. Residential consumers usually spread ash in their gardens.
There are two grades of pellets, Premium and Standard. Standard grade pellets produce less than
3% ash, while Premium pellets produce less than 1% ash (Arctic, 2010). Most pellets produced
in western Canada exceed the Premium standard.
In this study, it is assumed that 1% ash is produced from pellets combustion. The amount of ash
from firewood and wood chips combustion is also assumed to be 1%. All ash from institutional
boilers is deposited to the municipal landfill. Dataset for disposal of wood ash to the municipal
70 SRC Publication No. 13069-1C11

Greenhouse Gas Emissions Assessment. The Substitution of Fossil Fuels With Woody Biomass in the Northwest Territories March, 2011
landfill originates from the Ecoinvent database (Swiss Centre for Life Cycle Inventories et al.,
2008).
Plastic bags from bagged pellets for residential use are not recycled at the moment. It is assumed
that all plastic bags end up at the municipal landfill. The disposal of plastic bags to the
municipal landfill dataset is taken from the Ecoinvent database (Swiss Centre for Life Cycle
Inventories et al., 2008).
Reference number: PM 010888 71

March, 2011 Greenhouse Gas Emissions Assessment. The Substitution of Fossil Fuels With Woody Biomass in the Northwest Territories
APPENDIX C
BIOENERGY AND FOSSIL FUEL ENERGY DATA
72 SRC Publication No. 13069-1C11

Greenhouse Gas Emissions Assessment. The Substitution of Fossil Fuels With Woody Biomass in the Northwest Territories March, 2011
Location/city Total amount of energy
Wood Fuel oil Wood Fuel oil Wood Pellets Fuel oil
7 (MJ) % of Energy Energy (MJ) Tonnes Million Liters Wekweti 19,000,000 9 36 1,710,000 684,000,000 86.80 18 Homes 100 40 1,710,000 273,600,000 86.80 7 Other Buildings 0 60 0 410,400,000 0.00 11
Sachs Harbour 31,000,000 0 46 0 1,426,000,000 0.00 37 Homes 40 0 570,400,000 0.00 15 Other Buildings 60 0 855,600,000 0.00 22
Ulukhaktok 70,000,000 0 51 0 3,570,000,000 0.00 93 Homes 0 45 0 1,606,500,000 0.00 42 Other Buildings 55 0 1,963,500,000 0.00 51
Paulatuk 39,000,000 0 59 0 2,301,000,000 0.00 60 Homes 0 40 0 920,400,000 0.00 24 Other Buildings 60 0 1,380,600,000 0.00 36
Tuktoyaktuk 190,000,000 2 25 3,800,000 4,750,000,000 192.89 124 Homes 100 50 3,800,000 2,375,000,000 192.89 62 Other Buildings 0 50 0 2,375,000,000 0.00 62
Tsiigehtchic 29,000,000 4 46 1,160,000 1,334,000,000 58.88 35 Homes 100 40 1,160,000 533,600,000 58.88 14 Other Buildings 0 60 0 800,400,000 0.00 21
7Energy profiles of communities from the Arctic Energy Alliance Resource map http://www.aea.nt.ca/resources/map/. Energy content of heating oil = 38.4 MJ per liter, Heat content of wood pellets = 19,700 MJ per tonne.
Reference number: PM 010888 73
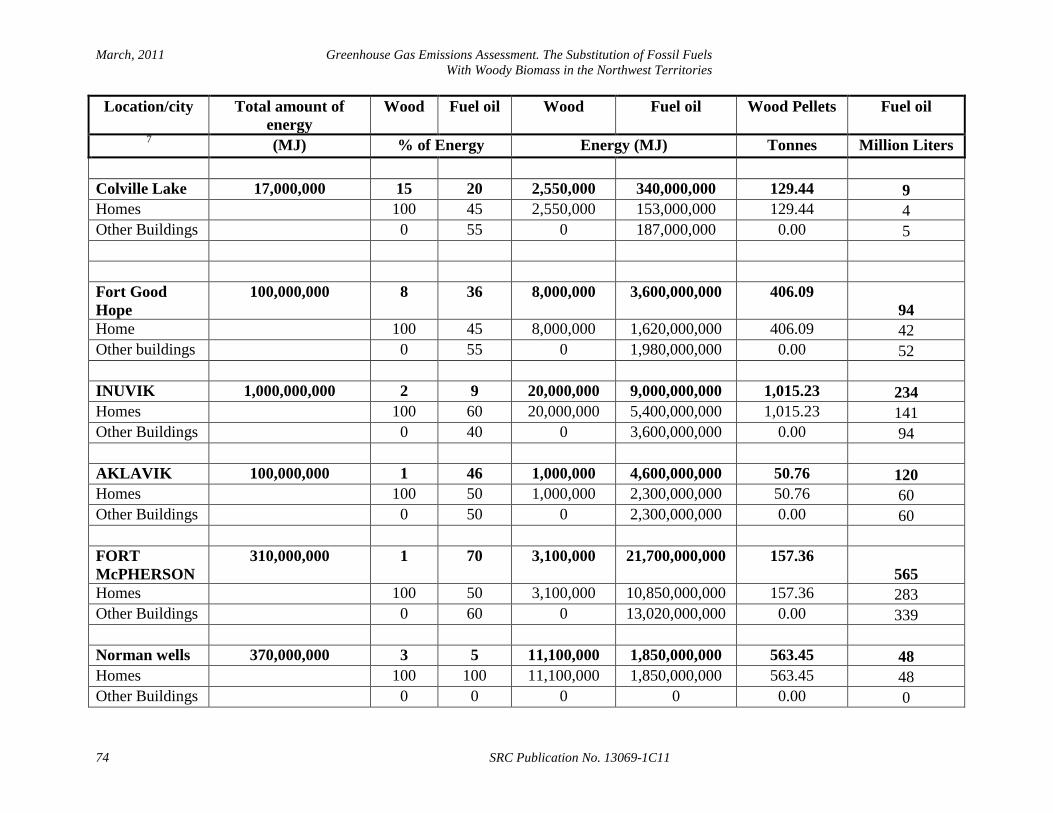
March, 2011 Greenhouse Gas Emissions Assessment. The Substitution of Fossil Fuels With Woody Biomass in the Northwest Territories
Location/city Total amount of energy
Wood Fuel oil Wood Fuel oil Wood Pellets Fuel oil
7 (MJ) % of Energy Energy (MJ) Tonnes Million Liters
Colville Lake 17,000,000 15 20 2,550,000 340,000,000 129.44 9 Homes 100 45 2,550,000 153,000,000 129.44 4 Other Buildings 0 55 0 187,000,000 0.00 5
Fort Good
Hope 100,000,000 8 36 8,000,000 3,600,000,000 406.09
94 Home 100 45 8,000,000 1,620,000,000 406.09 42 Other buildings 0 55 0 1,980,000,000 0.00 52
INUVIK 1,000,000,000 2 9 20,000,000 9,000,000,000 1,015.23 234 Homes 100 60 20,000,000 5,400,000,000 1,015.23 141 Other Buildings 0 40 0 3,600,000,000 0.00 94
AKLAVIK 100,000,000 1 46 1,000,000 4,600,000,000 50.76 120 Homes 100 50 1,000,000 2,300,000,000 50.76 60 Other Buildings 0 50 0 2,300,000,000 0.00 60
FORT McPHERSON
310,000,000 1 70 3,100,000 21,700,000,000 157.36 565
Homes 100 50 3,100,000 10,850,000,000 157.36 283 Other Buildings 0 60 0 13,020,000,000 0.00 339
Norman wells 370,000,000 3 5 11,100,000 1,850,000,000 563.45 48 Homes 100 100 11,100,000 1,850,000,000 563.45 48 Other Buildings 0 0 0 0 0.00 0
74 SRC Publication No. 13069-1C11

Greenhouse Gas Emissions Assessment. The Substitution of Fossil Fuels With Woody Biomass in the Northwest Territories March, 2011
Location/city Total amount of energy
Wood Fuel oil Wood Fuel oil Wood Pellets Fuel oil
7 (MJ) % of Energy Energy (MJ) Tonnes Million Liters
Tutlita 96,000,000 5 39 4,800,000 3,744,000,000 243.65 98 Homes 100 45 4,800,000 1,684,800,000 243.65 44 Other Buildings 0 55 0 2,059,200,000 0.00 54
Deline 96,000,000 6 38 5,760,000 3,648,000,000 292.39 95 Homes 100 45 5,760,000 1,641,600,000 292.39 43 Other Buildings 0 55 0 2,006,400,000 0.00 52
GAMETI 34,000,000 10 37 3,400,000 1,258,000,000 172.59 33 Homes 100 45 3,400,000 566,100,000 172.59 15 Other Buildings 0 55 0 691,900,000 0.00 18
WRIGLEY 27,000,000 11 29 2,970,000 783,000,000 150.76 20 Homes 100 50 2,970,000 391,500,000 150.76 10 Other Buildings 0 50 0 391,500,000 0.00 10
WHA TI 47,000,000 10 33 4,700,000 1,551,000,000 238.58 40 Homes 100 45 4,700,000 697,950,000 238.58 18 Other Buildings 0 55 0 853,050,000 0.00 22
BEHCHOKO 250,000,000 6 41 15,000,000 10,250,000,000 761.42 267 Homes 100 50 15,000,000 5,125,000,000 761.42 133 Other Buildings 0 50 0 5,125,000,000 0.00 133
FORT SIMPSON
450,000,000 4 32 18,000,000 14,400,000,000 913.71 375
Reference number: PM 010888 75

March, 2011 Greenhouse Gas Emissions Assessment. The Substitution of Fossil Fuels With Woody Biomass in the Northwest Territories
Location/city Total amount of energy
Wood Fuel oil Wood Fuel oil Wood Pellets Fuel oil
7 (MJ) % of Energy Energy (MJ) Tonnes Million Liters Homes 99 26 17,820,000 3,744,000,000 904.57 98 Other Buildings 1 74 180,000 10,656,000,000 9.14 278
DETTAH 27,000,000 11 27 2,970,000 729,000,000 150.76 19 Homes 100 60 2,970,000 437,400,000 150.76 11 Other Buildings 0 40 0 291,600,000 0.00 8
LUTSELK'E 50,000,000 6 39 3,000,000 1,950,000,000 152.28 51 Homes 100 47 3,000,000 916,500,000 152.28 24 Other Buildings 0 53 0 1,033,500,000 0.00 27
FORT RESOLUTION
75,000,000 7 52 5,250,000 3,900,000,000 266.50
102 Homes 100 72 5,250,000 2,808,000,000 266.50 73 Other Buildings 0 28 0 1,092,000,000 0.00 28
FORTH PROVIDENCE
122,000,000 8 26 9,760,000 3,172,000,000 495.43
83 Homes 100 60 9,760,000 1,903,200,000 495.43 50 Other Buildings 0 40 0 1,268,800,000 0.00 33
JEAN MARIE RIVER
13,000,000 9 25 1,170,000 325,000,000 59.39 8
Homes 100 50 1,170,000 162,500,000 59.39 4 Other Buildings 0 50 0 162,500,000 0.00 4
76 SRC Publication No. 13069-1C11

Greenhouse Gas Emissions Assessment. The Substitution of Fossil Fuels With Woody Biomass in the Northwest Territories March, 2011
Location/city Total amount of energy
Wood Fuel oil Wood Fuel oil Wood Pellets Fuel oil
7 (MJ) % of Energy Energy (MJ) Tonnes Million Liters
NAHANNI BUTTE
18,000,000 14 22 2,520,000 396,000,000 127.92 10
Homes 100 49 2,520,000 194,040,000 127.92 5 Other Buildings 0 51 0 201,960,000 0.00 5
KAKISA 9,000,000 13 28 1,170,000 252,000,000 59.39 7 Homes 100 58 1,170,000 146,160,000 59.39 4 Other Buildings 0 42 0 105,840,000 0.00 3
HAY RIVER 840,000,000 5 19 42,000,000 15,960,000,000 2,131.98 416 Homes 100 75 42,000,000 11,970,000,000 2,131.98 312 Other Buildings 0 25 0 3,990,000,000 0.00 104
FORT LIARD 75,000,000 11 9 8,250,000 675,000,000 418.78 18 Homes 100 58 8,250,000 391,500,000 418.78 10 Other Buildings 0 42 0 283,500,000 0.00 7
TROUT LAKE
17,000,000 15 22 2,550,000 374,000,000 129.44 10
Homes 100 45 2,550,000 168,300,000 129.44 4 Other Buildings 0 55 0 205,700,000 0.00 5
ENTERPRISE 18,000,000 7 58 1,260,000 1,044,000,000 63.96 27 Homes 100 60 1,260,000 626,400,000 63.96 16 Other Buildings 0 40 0 417,600,000 0.00 11
Reference number: PM 010888 77

March, 2011 Greenhouse Gas Emissions Assessment. The Substitution of Fossil Fuels With Woody Biomass in the Northwest Territories
Location/city Total amount of energy
Wood Fuel oil Wood Fuel oil Wood Pellets Fuel oil
7 (MJ) % of Energy Energy (MJ) Tonnes Million Liters FORT SMITH 530,000,000 5 54 26,500,000 28,620,000,000 1,345.18 745 Homes 100 50 26,500,000 14,310,000,000 1,345.18 373 Other Buildings 0 50 0 14,310,000,000 0.00 373
Totals for regions outside Yellowknife
213,450,000 148,186,000,000
10,835.03 3859
Total for homes outside Yellowknife 213,270,000 76,337,450,000 10,825.89 1988 Totals for other building outside Yellowknife
180,000 71,848,550,000 9.14 1871
78 SRC Publication No. 13069-1C11

Greenhouse Gas Emissions Assessment. The Substitution of Fossil Fuels With Woody Biomass in the Northwest Territories March, 2011
APPENDIX D
GHG ASSESSMENT RESULTS
Reference number: PM 010888 79

March, 2011 Greenhouse Gas Emissions Assessment. The Substitution of Fossil Fuels With Woody Biomass in the Northwest Territories
Table D.1 GHG assessment results for firewood at residential, advanced technology, catalytic stove. GWP, 1996, kg CO2-e GWP, 2007, kg CO2-e
Residential
Total Combustion Firewood production Total Combustion Firewood production
Carbon dioxide, biogenic 9.17E-02 9.17E-02 3.41E-06 9.17E-02 9.17E-02 3.41E-06
Carbon dioxide, fossil 8.65E-04 0.00E+00 8.65E-04 8.65E-04 0.00E+00 8.65E-04
Methane, biogenic 8.84E-03 8.84E-03 3.99E-08 1.05E-02 1.05E-02 4.75E-08
Methane, fossil 7.92E-05 0.00E+00 7.92E-05 9.43E-05 0.00E+00 9.43E-05
Nitrous oxide 3.02E-03 3.01E-03 1.70E-05 2.91E-03 2.89E-03 1.63E-05
TOTAL 1.05E-01 1.04E-01 9.65E-04 1.06E-01 1.05E-01 9.79E-04
TOTAL biogenic CO2 9.17E-02 9.17E-02 3.41E-06 9.17E-02 9.17E-02 3.41E-06
TOTAL fossil8 1.28E-02 1.18E-02 9.61E-04 1.44E-02 1.34E-02 9.76E-04
Table D.2 GHG assessment results for firewood at residential, conventional technology stove. GWP, 1996, kg CO2-e GWP, 2007, kg CO2-e
Total Combustion Firewood production Total Combustion Firewood production
Carbon dioxide, biogenic 9.17E-02 9.17E-02 3.41E-06 9.17E-02 9.17E-02 3.41E-06
Carbon dioxide, fossil 8.65E-04 0.00E+00 8.65E-04 8.65E-04 0.00E+00 8.65E-04
Methane, biogenic 1.92E-02 1.92E-02 3.99E-08 2.29E-02 2.29E-02 4.75E-08
Methane, fossil 7.92E-05 0.00E+00 7.92E-05 9.43E-05 0.00E+00 9.43E-05
Nitrous oxide 3.02E-03 3.01E-03 1.70E-05 2.91E-03 2.89E-03 1.63E-05
TOTAL 1.15E-01 1.14E-01 9.65E-04 1.18E-01 1.17E-01 9.79E-04
TOTAL biogenic CO2 9.17E-02 9.17E-02 3.41E-06 9.17E-02 9.17E-02 3.41E-06
TOTAL fossil 2.32E-02 2.22E-02 9.61E-04 2.67E-02 2.58E-02 9.76E-04
8 Total fossil category includes biogenic methane emissions.
80 SRC Publication No. 13069-1C11

Greenhouse Gas Emissions Assessment. The Substitution of Fossil Fuels With Woody Biomass in the Northwest Territories March, 2011
Table D.3 GHG assessment results for wood chips at industrial boiler 50KW. GWP, 1996, kg CO2-e GWP, 2007, kg CO2-e
Total Combustion Wood chips production
Ash disposal Total Combustion Wood chips production
Ash disposal
Carbon dioxide, biogenic 1.28E-01 1.27E-01 8.93E-04 1.10E-06 1.28E-01 1.27E-01 8.93E-04 1.10E-06
Carbon dioxide, fossil 8.41E-04 0.00E+00 8.33E-04 7.87E-06 8.41E-04 0.00E+00 8.33E-04 7.87E-06
Methane, biogenic 2.17E-05 1.84E-05 1.91E-07 3.17E-06 2.59E-05 2.19E-05 2.27E-07 3.78E-06
Methane, fossil 6.64E-05 0.00E+00 6.64E-05 0.00E+00 7.90E-05 0.00E+00 7.90E-05 0.00E+00
Nitrous oxide 1.19E-03 1.16E-03 2.60E-05 5.77E-08 1.14E-03 1.12E-03 2.50E-05 5.54E-08
TOTAL 1.30E-01 1.28E-01 1.82E-03 1.22E-05 1.30E-01 1.28E-01 1.83E-03 1.28E-05
TOTAL biogenic CO2 1.28E-01 1.27E-01 8.93E-04 1.10E-06 1.28E-01 1.27E-01 8.93E-04 1.10E-06
TOTAL fossil 2.12E-03 1.18E-03 9.26E-04 1.11E-05 2.09E-03 1.14E-03 9.37E-04 1.17E-05 Table D.4 GHG assessment results for wood chips at industrial boiler 300KW. GWP, 1996, kg CO2-e GWP, 2007, kg CO2-e
Total Combustion Wood chips production Ash disposal Total Combustion Wood chips
production
Ash disposal
Carbon dioxide, biogenic 1.25E-01 1.24E-01 8.93E-04 1.10E-06 1.25E-01 1.24E-01 8.93E-04 1.10E-06
Carbon dioxide, fossil 8.41E-04 0.00E+00 8.33E-04 7.87E-06 8.41E-04 0.00E+00 8.33E-04 7.87E-06
Methane, biogenic 1.36E-05 1.02E-05 1.91E-07 3.17E-06 1.62E-05 1.22E-05 2.27E-07 3.78E-06
Methane, fossil 6.64E-05 0.00E+00 6.64E-05 0.00E+00 7.90E-05 0.00E+00 7.90E-05 0.00E+00
Nitrous oxide 9.72E-04 9.46E-04 2.60E-05 5.77E-08 9.34E-04 9.09E-04 2.50E-05 5.54E-08
TOTAL 1.27E-01 1.25E-01 1.82E-03 1.22E-05 1.27E-01 1.25E-01 1.83E-03 1.28E-05
TOTAL biogenic CO2 1.25E-01 1.24E-01 8.93E-04 1.10E-06 1.25E-01 1.24E-01 8.93E-04 1.10E-06
TOTAL fossil 1.89E-03 9.56E-04 9.26E-04 1.11E-05 1.87E-03 9.21E-04 9.37E-04 1.17E-05
Reference number: PM 010888 81

March, 2011 Greenhouse Gas Emissions Assessment. The Substitution of Fossil Fuels With Woody Biomass in the Northwest Territories
Table D.5 GHG assessment results for wood pellets bulk imported from AB, at industrial boiler 50kW. GWP, 1996, kg CO2-e GWP, 2007, kg CO2-e
Total Combustion Wood pellets
production,
bulk
Transport Ash
disposal
Total Combustion Wood pellets
production,
bulk
Transport Ash disposal
Carbon dioxide,
biogenic
9.44E-02 8.78E-02 6.55E-03 1.29E-05 8.44E-07 9.44E-02 8.78E-02 6.55E-03 1.29E-05 8.44E-07
Carbon dioxide, fossil 1.14E-02 0.00E+00 4.58E-03 4.40E-03 6.07E-06 1.14E-02 0.00E+00 4.58E-03 4.40E-03 6.07E-06
Methane, biogenic 9.81E-05 8.19E-05 1.32E-05 3.89E-07 2.46E-06 1.17E-04 9.75E-05 1.57E-05 4.64E-07 2.93E-06
Methane, fossil 1.99E-04 0.00E+00 1.97E-04 2.81E-06 0.00E+00 1.99E-04 0.00E+00 2.34E-04 3.35E-06 0.00E+00
Nitrous oxide 1.14E-03 8.99E-04 1.58E-04 4.67E-05 4.43E-08 1.10E-03 8.64E-04 1.52E-04 4.48E-05 4.26E-08
TOTAL 1.07E-01 8.88E-02 1.15E-02 4.46E-03 9.42E-06 1.07E-01 8.88E-02 1.15E-02 4.46E-03 9.88E-06
TOTAL biogenic CO2 9.44E-02 8.78E-02 6.55E-03 1.29E-05 8.44E-07 9.44E-02 8.78E-02 6.55E-03 1.29E-05 8.44E-07
TOTAL fossil 1.28E-02 9.81E-04 4.95E-03 4.45E-03 8.57E-06 1.28E-02 9.62E-04 4.98E-03 4.45E-03 9.04E-06
82 SRC Publication No. 13069-1C11

Greenhouse Gas Emissions Assessment. The Substitution of Fossil Fuels With Woody Biomass in the Northwest Territories March, 2011
Table D.6 GHG assessment results for wood pellets bagged imported from AB, at residential stove. GWP, 1996, kg CO2-e
Total Combustion Wood pellets production,
bagged
Transport Polyethelene bag
production
Ash disposal Bag disposal
Carbon dioxide, biogenic 9.44E-02 8.78E-02 6.55E-03 1.29E-05 2.30E-06 8.44E-07 1.87E-08
Carbon dioxide, fossil 9.27E-03 0.00E+00 4.58E-03 4.40E-03 2.80E-04 6.07E-06 5.84E-06
Methane, biogenic 1.19E-03 1.18E-03 1.32E-05 3.89E-07 3.70E-07 2.46E-06 2.35E-10
Methane, fossil 1.99E-04 0.00E+00 1.97E-04 2.81E-06 0.00E+00 0.00E+00 0.00E+00
Nitrous oxide 1.35E-03 1.15E-03 1.58E-04 4.67E-05 4.37E-09 4.43E-08 1.94E-08
TOTAL 1.06E-01 9.01E-02 1.15E-02 4.46E-03 2.83E-04 9.42E-06 5.88E-06
TOTAL biogenic CO2 9.44E-02 8.78E-02 6.55E-03 1.29E-05 2.30E-06 8.44E-07 1.87E-08
TOTAL fossil 1.20E-02 2.32E-03 4.95E-03 4.45E-03 2.80E-04 8.57E-06 5.86E-06
Reference number: PM 010888 83

March, 2011 Greenhouse Gas Emissions Assessment. The Substitution of Fossil Fuels With Woody Biomass in the Northwest Territories
Table D.7 GHG assessment results for wood pellets bagged imported from AB, at residential stove. GWP, 2007, kg CO2-e
Total Combustion Wood pellets production,
bulk
Transport Polyethelene bag
production
Ash disposal Bag disposal
Carbon dioxide, biogenic 9.44E-02 8.78E-02 6.55E-03 1.29E-05 2.30E-06 8.44E-07 1.87E-08
Carbon dioxide, fossil 9.27E-03 0.00E+00 4.58E-03 4.40E-03 2.80E-04 6.07E-06 5.84E-06
Methane, biogenic 1.42E-03 1.40E-03 1.57E-05 4.64E-07 4.40E-07 2.93E-06 2.80E-10
Methane, fossil 2.37E-04 0.00E+00 2.34E-04 3.35E-06 0.00E+00 0.00E+00 0.00E+00
Nitrous oxide 1.30E-03 1.10E-03 1.52E-04 4.48E-05 4.20E-09 4.26E-08 1.87E-08
TOTAL 1.07E-01 9.03E-02 1.15E-02 4.46E-03 2.83E-04 9.88E-06 5.88E-06
TOTAL biogenic CO2 9.44E-02 8.78E-02 6.55E-03 1.29E-05 2.30E-06 8.44E-07 1.87E-08
TOTAL fossil 1.22E-02 2.50E-03 4.98E-03 4.45E-03 2.80E-04 9.04E-06 5.86E-06
84 SRC Publication No. 13069-1C11

Greenhouse Gas Emissions Assessment. The Substitution of Fossil Fuels With Woody Biomass in the Northwest Territories March, 2011
Table D.8 GHG assessment results for wood pellets bagged imported from BC, at residential stove. GWP, 1996, kg CO2-e
Total Combustion Wood pellets
production, bagged
Transport Polyethelene bag
production
Ash disposal Bag disposal
Carbon dioxide, biogenic 9.44E-02 8.78E-02 6.55E-03 2.77E-05 2.30E-06 8.44E-07 1.87E-08
Carbon dioxide, fossil 1.43E-02 0.00E+00 4.58E-03 9.43E-03 2.80E-04 6.07E-06 5.84E-06
Methane, biogenic 1.19E-03 1.18E-03 1.32E-05 8.38E-07 3.70E-07 2.46E-06 2.35E-10
Methane, fossil 1.99E-04 0.00E+00 1.97E-04 2.81E-06 0.00E+00 0.00E+00 0.00E+00
Nitrous oxide 1.40E-03 1.15E-03 1.58E-04 9.69E-05 4.37E-09 4.43E-08 1.94E-08
TOTAL 1.11E-01 9.01E-02 1.15E-02 9.56E-03 2.83E-04 9.42E-06 5.88E-06
TOTAL biogenic CO2 9.44E-02 8.78E-02 6.55E-03 2.77E-05 2.30E-06 8.44E-07 1.87E-08
TOTAL fossil 1.71E-02 2.32E-03 4.95E-03 9.53E-03 2.80E-04 8.57E-06 5.86E-06
Table D.9 GHG assessment results for wood pellets bagged imported from BC, at residential stove.
GWP, 2007, kg CO2-e
Total Combustion Wood pellets
production, bulk
Transport Polyethelene bag
production
Ash disposal Bag disposal
Carbon dioxide, biogenic 9.44E-02 8.78E-02 6.55E-03 2.77E-05 2.30E-06 8.44E-07 1.87E-08
Carbon dioxide, fossil 1.43E-02 0.00E+00 4.58E-03 9.43E-03 2.80E-04 6.07E-06 5.84E-06
Methane, biogenic 1.42E-03 1.40E-03 1.57E-05 9.98E-07 4.40E-07 2.93E-06 2.80E-10
Methane, fossil 2.37E-04 0.00E+00 2.34E-04 3.35E-06 0.00E+00 0.00E+00 0.00E+00
Nitrous oxide 1.35E-03 1.10E-03 1.52E-04 9.31E-05 4.20E-09 4.26E-08 1.87E-08
TOTAL 9.44E-02 8.78E-02 6.55E-03 2.77E-05 2.30E-06 8.44E-07 1.87E-08
TOTAL biogenic CO2 9.58E-02 8.92E-02 6.57E-03 2.87E-05 2.74E-06 3.77E-06 1.90E-08
TOTAL fossil 1.73E-02 2.50E-03 4.98E-03 9.53E-03 2.80E-04 9.04E-06 5.86E-06
Reference number: PM 010888 85
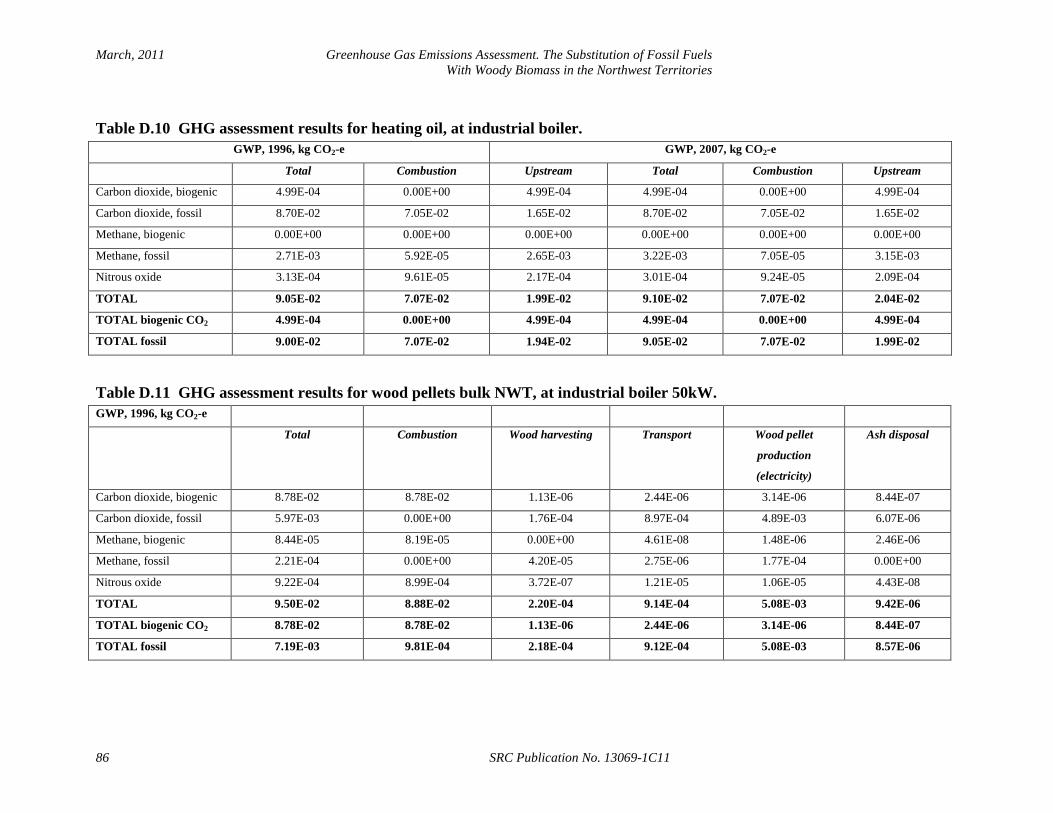
March, 2011 Greenhouse Gas Emissions Assessment. The Substitution of Fossil Fuels With Woody Biomass in the Northwest Territories
Table D.10 GHG assessment results for heating oil, at industrial boiler. GWP, 1996, kg CO2-e GWP, 2007, kg CO2-e
Total Combustion Upstream Total Combustion Upstream
Carbon dioxide, biogenic 4.99E-04 0.00E+00 4.99E-04 4.99E-04 0.00E+00 4.99E-04
Carbon dioxide, fossil 8.70E-02 7.05E-02 1.65E-02 8.70E-02 7.05E-02 1.65E-02
Methane, biogenic 0.00E+00 0.00E+00 0.00E+00 0.00E+00 0.00E+00 0.00E+00
Methane, fossil 2.71E-03 5.92E-05 2.65E-03 3.22E-03 7.05E-05 3.15E-03
Nitrous oxide 3.13E-04 9.61E-05 2.17E-04 3.01E-04 9.24E-05 2.09E-04
TOTAL 9.05E-02 7.07E-02 1.99E-02 9.10E-02 7.07E-02 2.04E-02
TOTAL biogenic CO2 4.99E-04 0.00E+00 4.99E-04 4.99E-04 0.00E+00 4.99E-04
TOTAL fossil 9.00E-02 7.07E-02 1.94E-02 9.05E-02 7.07E-02 1.99E-02
Table D.11 GHG assessment results for wood pellets bulk NWT, at industrial boiler 50kW. GWP, 1996, kg CO2-e
Total Combustion Wood harvesting Transport Wood pellet
production
(electricity)
Ash disposal
Carbon dioxide, biogenic 8.78E-02 8.78E-02 1.13E-06 2.44E-06 3.14E-06 8.44E-07
Carbon dioxide, fossil 5.97E-03 0.00E+00 1.76E-04 8.97E-04 4.89E-03 6.07E-06
Methane, biogenic 8.44E-05 8.19E-05 0.00E+00 4.61E-08 1.48E-06 2.46E-06
Methane, fossil 2.21E-04 0.00E+00 4.20E-05 2.75E-06 1.77E-04 0.00E+00
Nitrous oxide 9.22E-04 8.99E-04 3.72E-07 1.21E-05 1.06E-05 4.43E-08
TOTAL 9.50E-02 8.88E-02 2.20E-04 9.14E-04 5.08E-03 9.42E-06
TOTAL biogenic CO2 8.78E-02 8.78E-02 1.13E-06 2.44E-06 3.14E-06 8.44E-07
TOTAL fossil 7.19E-03 9.81E-04 2.18E-04 9.12E-04 5.08E-03 8.57E-06
86 SRC Publication No. 13069-1C11

Greenhouse Gas Emissions Assessment. The Substitution of Fossil Fuels With Woody Biomass in the Northwest Territories March, 2011
Table D.12 GHG assessment results for wood pellets bulk NWT, at industrial boiler 50kW. GWP, 2007, kg CO2-e
Total Combustion Wood harvesting Transport Wood pellet production (electricity) Ash disposal
Carbon dioxide, biogenic 8.78E-02 8.78E-02 1.13E-06 2.44E-06 3.14E-06 8.44E-07
Carbon dioxide, fossil 5.97E-03 0.00E+00 1.76E-04 8.97E-04 4.89E-03 6.07E-06
Methane, biogenic 1.00E-04 9.75E-05 0.00E+00 5.49E-08 1.76E-06 2.93E-06
Methane, fossil 2.63E-04 0.00E+00 5.00E-05 3.28E-06 2.10E-04 0.00E+00
Nitrous oxide 8.86E-04 8.64E-04 3.58E-07 1.17E-05 1.02E-05 4.26E-08
TOTAL 9.50E-02 8.88E-02 2.27E-04 9.14E-04 5.12E-03 9.88E-06
TOTAL biogenic CO2 8.78E-02 8.78E-02 1.13E-06 2.44E-06 3.14E-06 8.44E-07
TOTAL fossil 7.22E-03 9.62E-04 2.26E-04 9.12E-04 5.11E-03 9.04E-06
Table D.13 GHG assessment results for wood pellets bagged NWT, at residential stove.
GWP, 1996, kg CO2-e
Total Combustion Wood
harvesting
Transport Polyethelene
bag
production
Wood pellet
production
(electricity)
Ash
disposal
Bag
disposal
Ash
disposal
Bag
disposal
Carbon dioxide, biogenic 8.78E-02 8.78E-02 1.13E-06 2.44E-06 2.30E-06 3.14E-06 8.44E-07 1.87E-08 8.44E-07 1.87E-08
Carbon dioxide, fossil 6.25E-03 0.00E+00 1.76E-04 8.97E-04 2.80E-04 4.89E-03 6.07E-06 5.84E-06 6.07E-06 5.84E-06
Methane, biogenic 1.18E-03 1.18E-03 0.00E+00 4.55E-08 3.70E-07 1.48E-09 2.46E-06 2.35E-10 2.93E-06 2.80E-10
Methane, fossil 2.21E-04 0.00E+00 4.20E-05 2.75E-06 0.00E+00 1.77E-04 0.00E+00 0.00E+00 0.00E+00 0.00E+00
Nitrous oxide 1.17E-03 1.15E-03 3.72E-07 1.21E-05 4.37E-09 1.06E-05 4.43E-08 1.94E-08 4.26E-08 1.87E-08
TOTAL 9.66E-02 9.01E-02 2.20E-04 9.14E-04 2.83E-04 5.08E-03 9.42E-06 5.88E-06 9.88E-06 5.88E-06
TOTAL biogenic CO2 8.78E-02 8.78E-02 1.13E-06 2.44E-06 2.30E-06 3.14E-06 8.44E-07 1.87E-08 8.44E-07 1.87E-08
TOTAL fossil 8.82E-03 2.32E-03 2.18E-04 9.12E-04 2.80E-04 5.08E-03 8.57E-06 5.86E-06 8.82E-03 2.32E-03
Reference number: PM 010888 87

March, 2011 Greenhouse Gas Emissions Assessment. The Substitution of Fossil Fuels With Woody Biomass in the Northwest Territories
Table D.14 GHG assessment results for wood pellets bagged NWT, at residential stove. GWP, 2007, kg CO2-e
Total Combustion Wood
harvesting
Transport Polyethelene
bag production
Wood pellet
production
(electricity)
Ash
disposal
Bag
disposal
Carbon dioxide,
biogenic 8.78E-02 8.78E-02 1.13E-06 2.44E-06 2.30E-06 3.14E-06 8.44E-07 1.87E-08 Carbon dioxide, fossil
6.25E-03 0.00E+00 1.76E-04 8.97E-04 2.80E-04 4.89E-03 6.07E-06 5.84E-06 Methane, biogenic
1.40E-03 1.40E-03 0.00E+00 5.42E-08 4.40E-07 1.76E-09 2.93E-06 2.80E-10 Methane, fossil
2.63E-04 0.00E+00 5.00E-05 3.28E-06 0.00E+00 2.10E-04 0.00E+00 0.00E+00 Nitrous oxide
1.12E-03 1.10E-03 3.58E-07 1.17E-05 4.20E-09 1.02E-05 4.26E-08 1.87E-08 TOTAL
9.69E-02 9.03E-02 2.27E-04 9.14E-04 2.83E-04 5.11E-03 9.88E-06 5.88E-06 TOTAL biogenic CO2 8.78E-02 8.78E-02 1.13E-06 2.44E-06 2.30E-06 3.14E-06 8.44E-07 1.87E-08 TOTAL fossil
9.04E-03 2.50E-03 2.26E-04 9.12E-04 2.80E-04 5.11E-03 9.04E-06 5.86E-06
88 SRC Publication No. 13069-1C11

Greenhouse Gas Emissions Assessment. The Substitution of Fossil Fuels With Woody Biomass in the Northwest Territories March, 2011
Table D.15 Black and organic carbon assessment results for Koch et al, 2007. kg CO2 e /MJ
BC LL BC UL OC LL OC UL
Wood pellets 0.00838 0.03909 -0.00362 -0.01663
Heating oil 0.00085 0.00085 -0.00001 -0.00001
Firewood 0.01006 0.04695 -0.00435 -0.01998
Wood chips 0.01086 0.05066 -0.00470 -0.02155
Reference number: PM 010888 89

March, 2011 Greenhouse Gas Emissions Assessment. The Substitution of Fossil Fuels With Woody Biomass in the Northwest Territories
Figure D.1 Comparison of all scenarios under study.
0.00
0.01
0.02
0.03
0.04
0.05
0.06
0.07
0.08
0.09
Fossil global warming
kg C
O2
e/M
J
Firewood, at residential, advanced technology,catalytic stove
Firewood, at residential, conventional technologystove
Wood chips, at industrial boiler 50KW
Wood chips, at industrial boiler 300KW
Wood pellets bulk imported from AB, at industrialboiler 50kW
Wood pellets bagged imported from AB, atresidential stove
Wood pellets bagged imported from BC, atresidential stove
Wood pellets bulk NWT, at industrial boiler 50kW
Wood pellets bagged NWT, at residential stove
Heating oil, at industrial boiler
90 SRC Publication No. 13069-1C11