Embed Size (px)
Citation preview
SUBSTATION SURVEILLANCE
USING RADIO FREQUENCY
INTERFERENCE (RFI)
MEASUREMENTS Eduardo Pabuna
WESTCO ELECTRICAL

SUBSTATION SURVEILLANCE USING RADIO FREQUENCY INTERFERENCE (RFI) MEASUREMENTS
• Introduction.
• Partial Discharge – a precursor to failure.
• Radio Frequency Interference (RFI)
detection - understanding what we are
measuring.
• Complimentary EMI detection techniques
using different sensors
• Case studies
• Conclusions
Agenda
SUBSTATION SURVEILLANCE USING RADIO FREQUENCY INTERFERENCE (RFI) MEASUREMENTS
A successful substation asset management strategy depends
heavily on predictive maintenance assessments conducted
periodically:
Surveillance based techniques to identify potential sites of
insulation degradation
Followed by more investigative and invasive quantitative
techniques
Adds value to the maintenance work, selectively identifying
and replacing those items of plant that have deteriorated
significantly.
Identifies HV apparatus that presents a potentially safety
hazard to staff and public.
Cost effective and non expert use.
Key Drivers
SUBSTATION SURVEILLANCE USING RADIO FREQUENCY INTERFERENCE (RFI) MEASUREMENTS
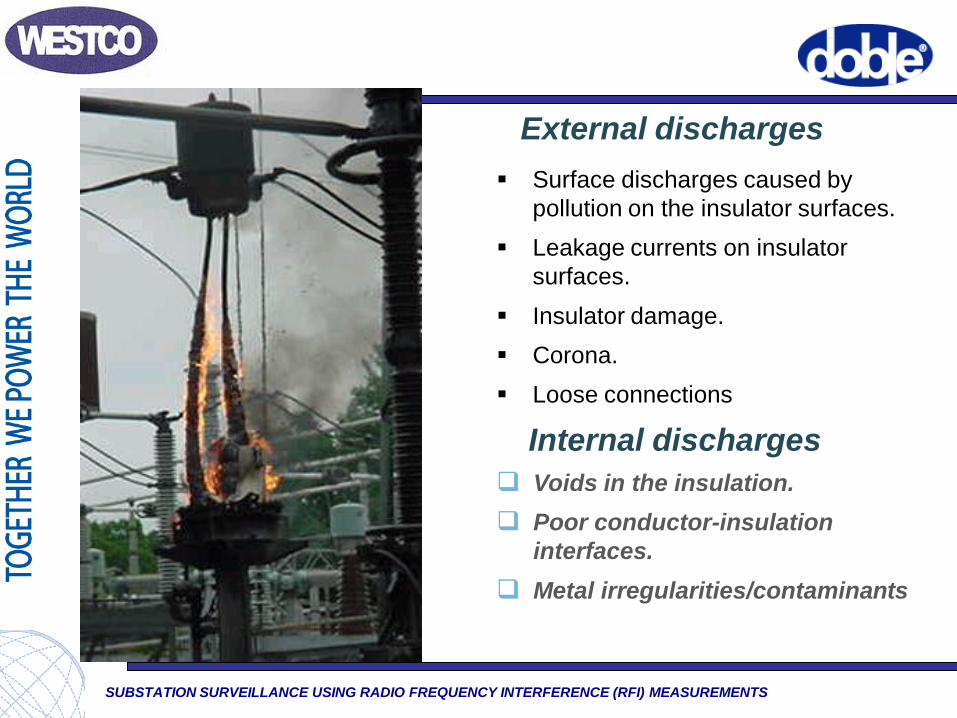
Surface discharges caused by
pollution on the insulator surfaces.
Leakage currents on insulator
surfaces.
Insulator damage.
Corona.
Loose connections
External discharges
Voids in the insulation.
Poor conductor-insulation
interfaces.
Metal irregularities/contaminants
Internal discharges
PDS100 – PD Surveyor
PD Detection by RFI/EMI
SUBSTATION SURVEILLANCE USING RADIO FREQUENCY INTERFERENCE (RFI) MEASUREMENTS
Partial Discharge (1)
• PD occurs when insulation defects exist which produce
distorted and enhanced electric field stress.
• Causes of PD in insulation system:
Voids in epoxy resins, polymers, paper
Bubbles in liquids/oils
Metal depositions/irregularities/contaminants
Electrodes and insulation surfaces
Poor terminations/loose joints
• Environmental stresses can act to accelerate the
deterioration of the insulation system in HV apparatus.
SUBSTATION SURVEILLANCE USING RADIO FREQUENCY INTERFERENCE (RFI) MEASUREMENTS
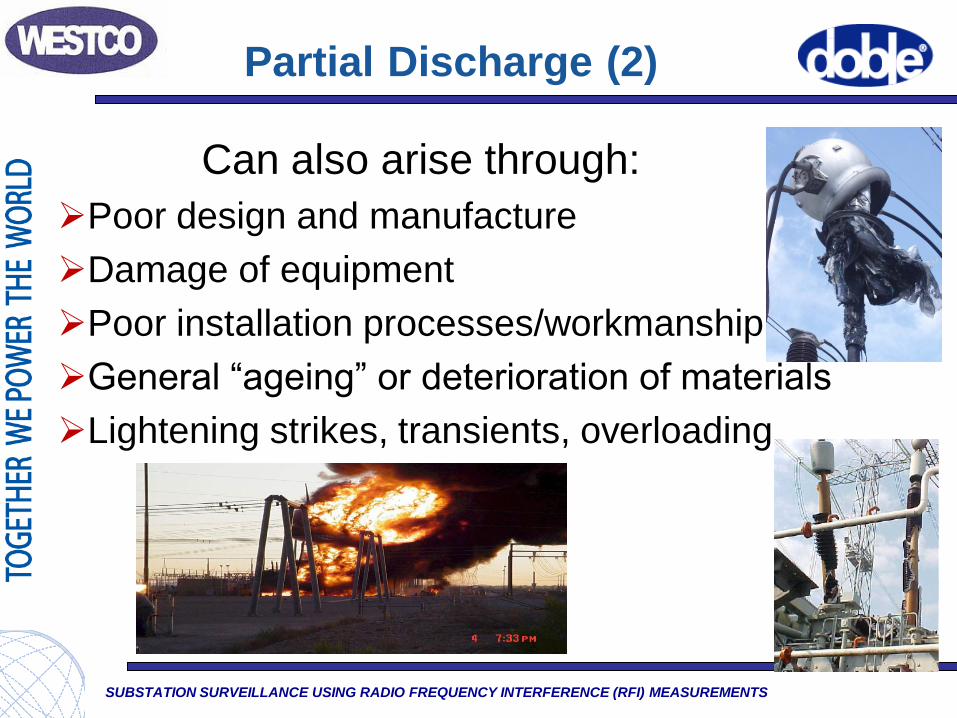
Partial Discharge (2)
Can also arise through:
Poor design and manufacture
Damage of equipment
Poor installation processes/workmanship
General “ageing” or deterioration of materials
Lightening strikes, transients, overloading

SUBSTATION SURVEILLANCE USING RADIO FREQUENCY INTERFERENCE (RFI) MEASUREMENTS
Partial Discharge (3)
• PD is a symptom of
degradation
• Once present – it
dominates as it’s own
“inherent” stress
degradation mechanism
• Precursor to complete
insulation failure and
breakdown
poor preparation
Cable Termination Area
poor preparation
poor
preparation
erosion traces
SUBSTATION SURVEILLANCE USING RADIO FREQUENCY INTERFERENCE (RFI) MEASUREMENTS
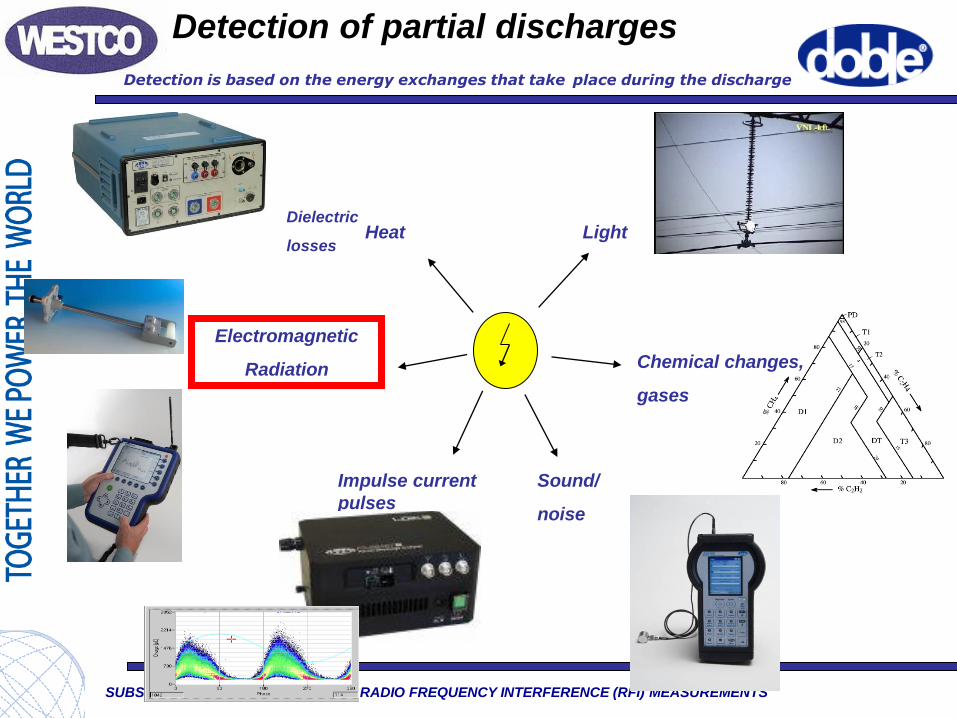
Detection of partial discharges
Detection is based on the energy exchanges that take place during the discharge
Heat Light
Chemical changes,
gases
Sound/
noise
Electromagnetic
Radiation
Impulse current
pulses
Dielectric
losses
SUBSTATION SURVEILLANCE USING RADIO FREQUENCY INTERFERENCE (RFI) MEASUREMENTS
RFI Emissions
IEC60270 measurements
– Quantify “apparent charge” involved in PD event
– Integration of current pulse
– Requires physical connection to measure current
pulse
RFI measurements
– Radiated signals depends on the dynamics of
charge motion
– Signals generated when charge is accelerated, e.g.
• Charge oscillation
• Charge movement
– PD current pulse comprises moving charges thus
radiation will ensue
SUBSTATION SURVEILLANCE USING RADIO FREQUENCY INTERFERENCE (RFI) MEASUREMENTS
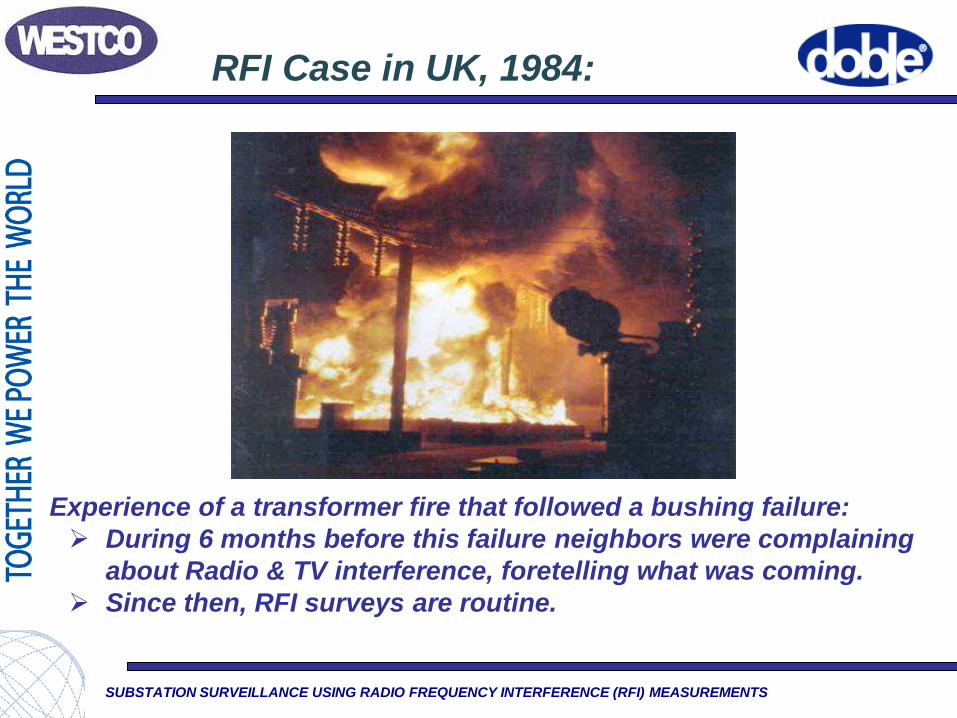
RFI Case in UK, 1984:
Experience of a transformer fire that followed a bushing failure:
During 6 months before this failure neighbors were complaining
about Radio & TV interference, foretelling what was coming.
Since then, RFI surveys are routine.
SUBSTATION SURVEILLANCE USING RADIO FREQUENCY INTERFERENCE (RFI) MEASUREMENTS
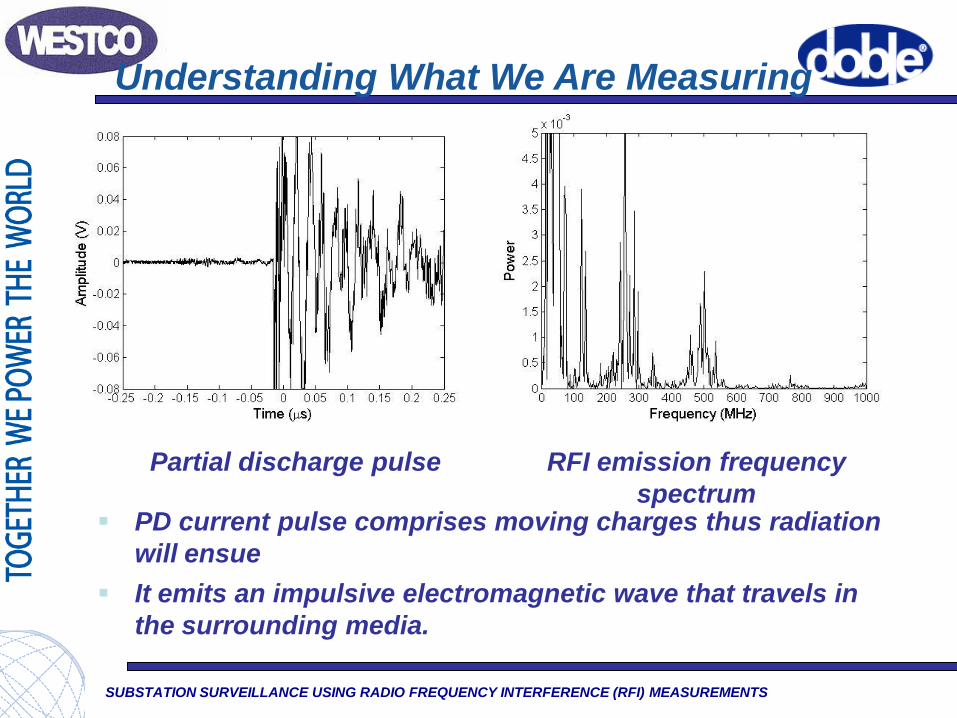
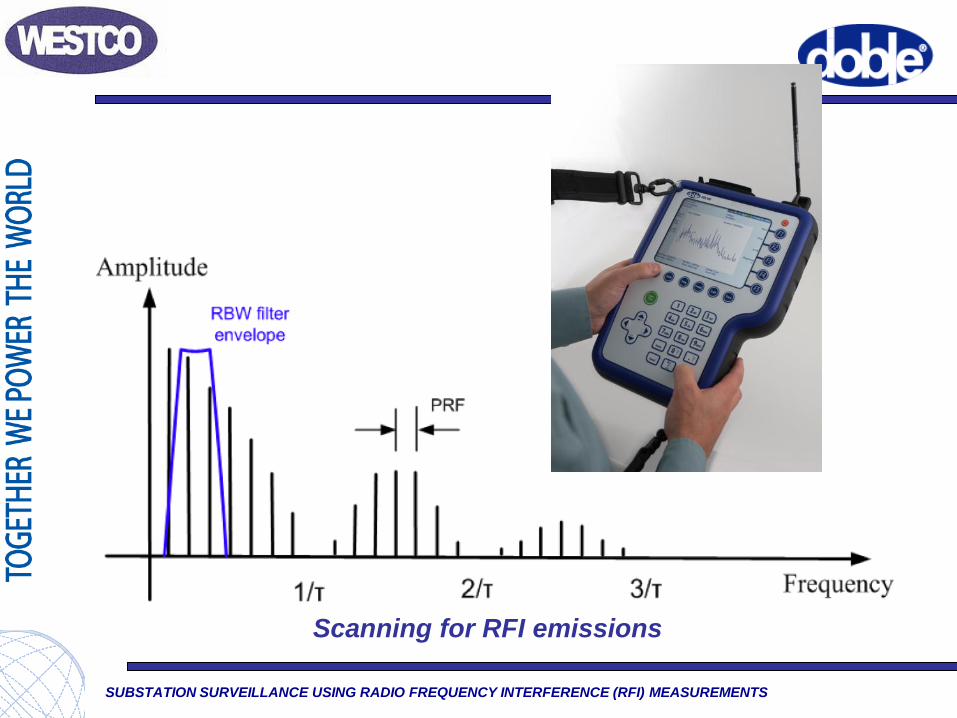
Partial discharge pulse RFI emission frequency
spectrum PD current pulse comprises moving charges thus radiation
will ensue
It emits an impulsive electromagnetic wave that travels in
the surrounding media.
Understanding What We Are Measuring
SUBSTATION SURVEILLANCE USING RADIO FREQUENCY INTERFERENCE (RFI) MEASUREMENTS
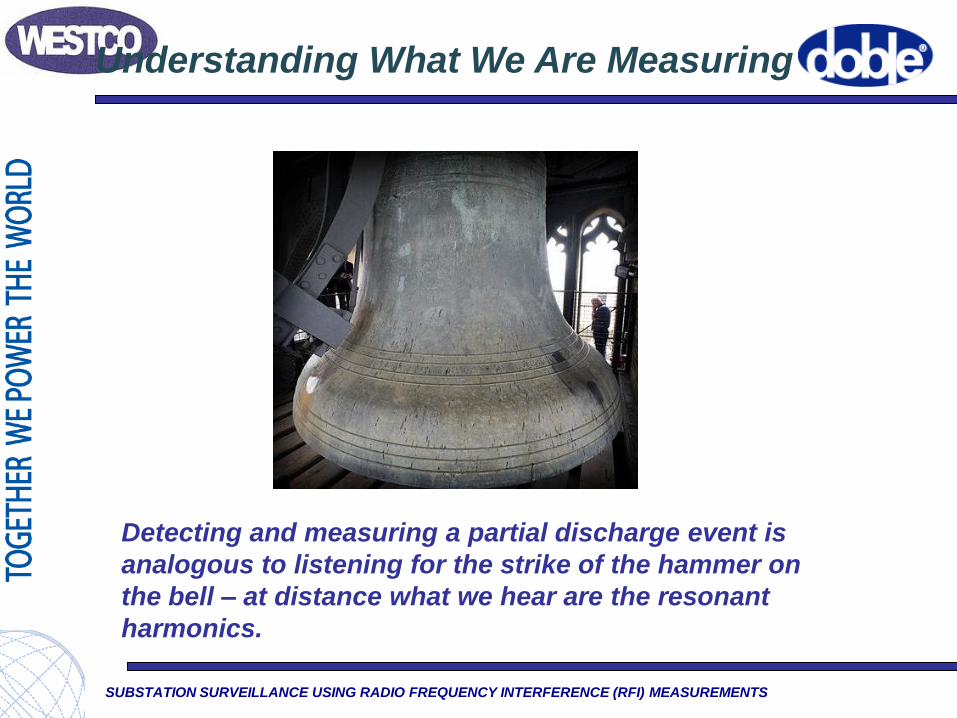
Understanding What We Are Measuring
Detecting and measuring a partial discharge event is
analogous to listening for the strike of the hammer on
the bell – at distance what we hear are the resonant
harmonics.
SUBSTATION SURVEILLANCE USING RADIO FREQUENCY INTERFERENCE (RFI) MEASUREMENTS
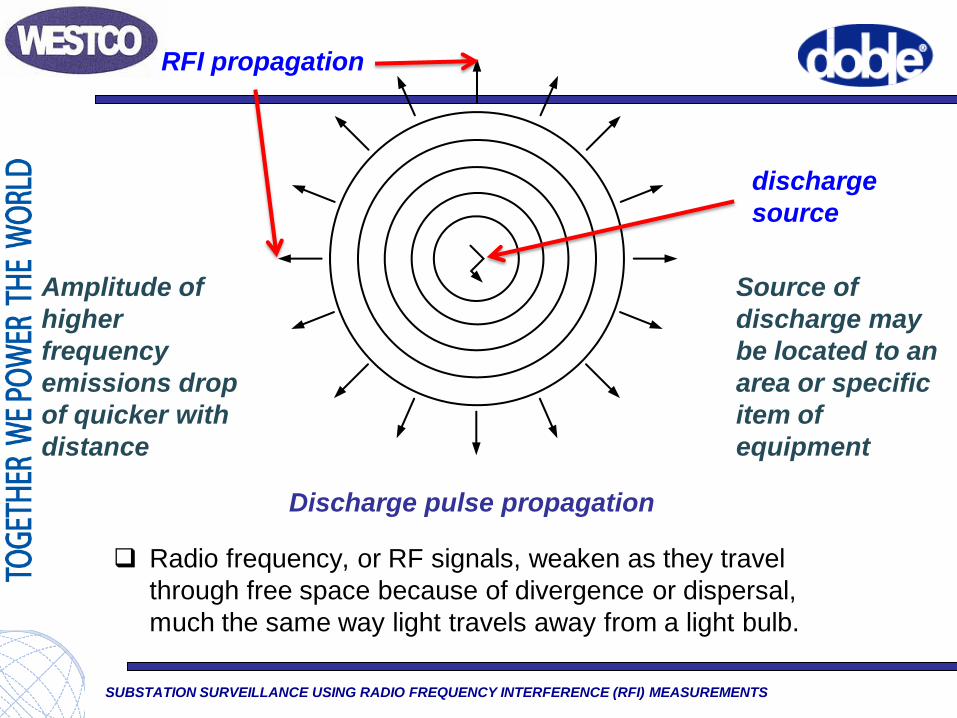
Discharge pulse propagation
discharge
source
RFI propagation
Amplitude of
higher
frequency
emissions drop
of quicker with
distance
Source of
discharge may
be located to an
area or specific
item of
equipment
Radio frequency, or RF signals, weaken as they travel
through free space because of divergence or dispersal,
much the same way light travels away from a light bulb.
SUBSTATION SURVEILLANCE USING RADIO FREQUENCY INTERFERENCE (RFI) MEASUREMENTS
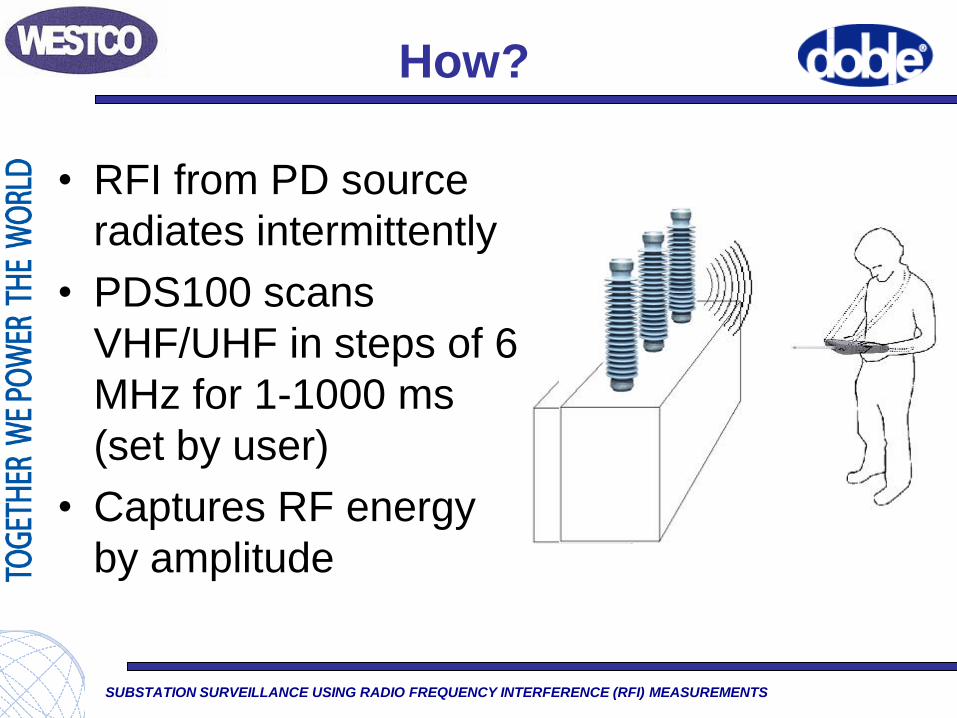
How?
• RFI from PD source
radiates intermittently
• PDS100 scans
VHF/UHF in steps of 6
MHz for 1-1000 ms
(set by user)
• Captures RF energy
by amplitude
SUBSTATION SURVEILLANCE USING RADIO FREQUENCY INTERFERENCE (RFI) MEASUREMENTS
Scanning for RFI emissions
SUBSTATION SURVEILLANCE USING RADIO FREQUENCY INTERFERENCE (RFI) MEASUREMENTS
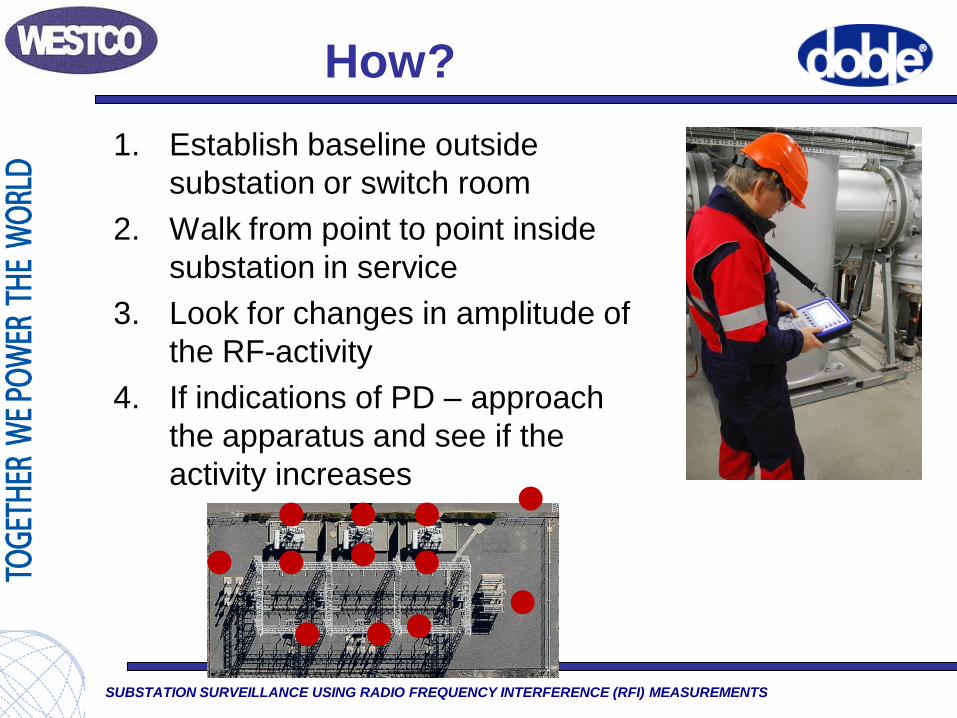
How?
1. Establish baseline outside
substation or switch room
2. Walk from point to point inside
substation in service
3. Look for changes in amplitude of
the RF-activity
4. If indications of PD – approach
the apparatus and see if the
activity increases
SUBSTATION SURVEILLANCE USING RADIO FREQUENCY INTERFERENCE (RFI) MEASUREMENTS
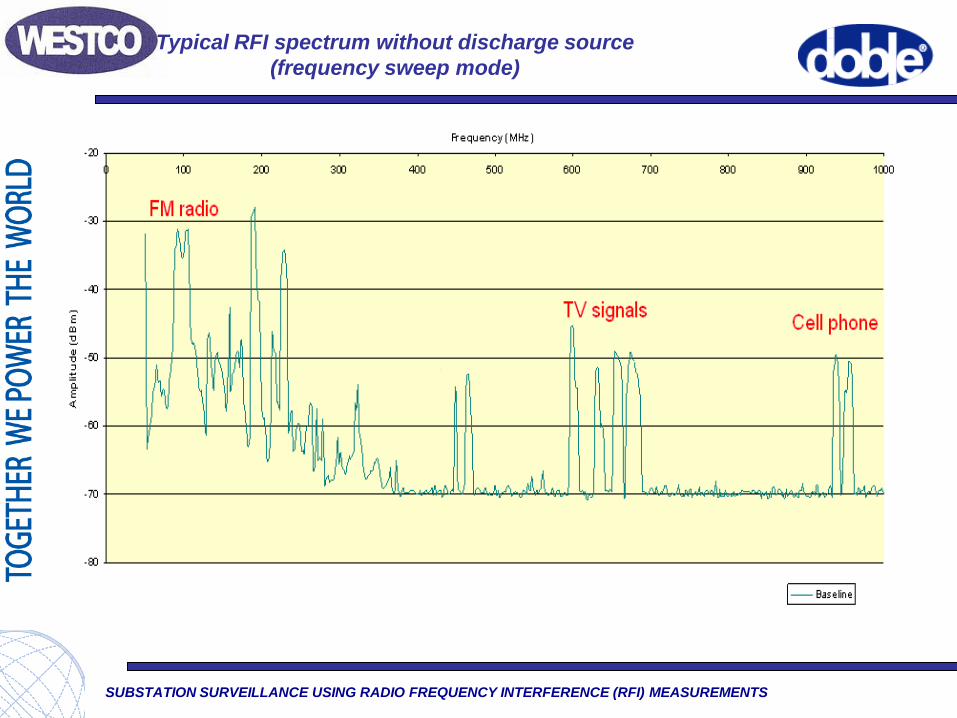
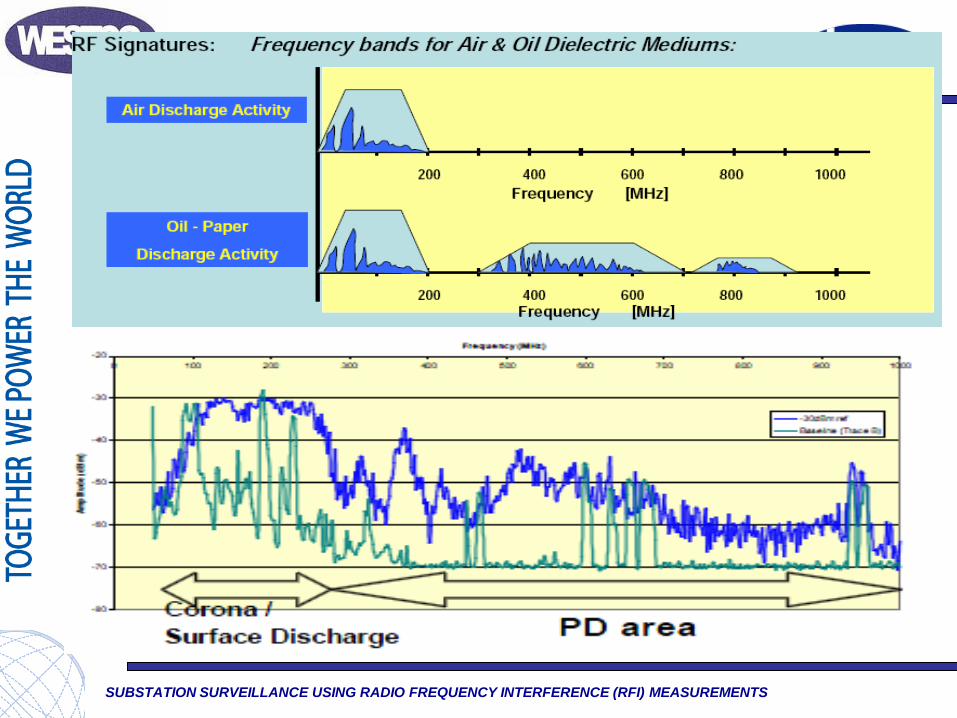
Typical RFI spectrum without discharge source
(frequency sweep mode)
SUBSTATION SURVEILLANCE USING RADIO FREQUENCY INTERFERENCE (RFI) MEASUREMENTS
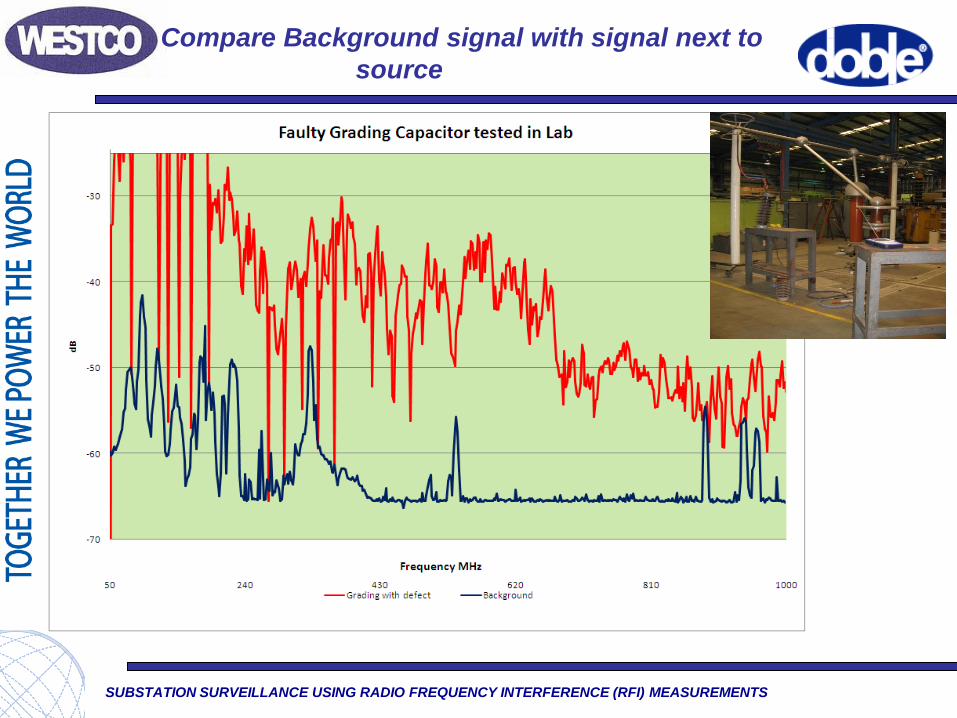
Compare Background signal with signal next to
source
SUBSTATION SURVEILLANCE USING RADIO FREQUENCY INTERFERENCE (RFI) MEASUREMENTS

SUBSTATION SURVEILLANCE USING RADIO FREQUENCY INTERFERENCE (RFI) MEASUREMENTS
Frequency Range Contributions
1) Corona in air around sharp metal will be dominant up to 10
MHz but will go as high as ~250 MHz
1) Surface discharge on dirty porcelains will dominate from
10 to 250 MHz. Heavily influenced by time of year, rain
washing etc.
3) PD will extend RFI up to 1GHz on the PDS100 (but actually
can go much higher).
The higher the frequency the greater the attenuation
Localization of PD requires the using the attenuation to your
advantage!
The closer you get to the source of PD the more sensitive
(elevated) the higher frequencies
SUBSTATION SURVEILLANCE USING RADIO FREQUENCY INTERFERENCE (RFI) MEASUREMENTS
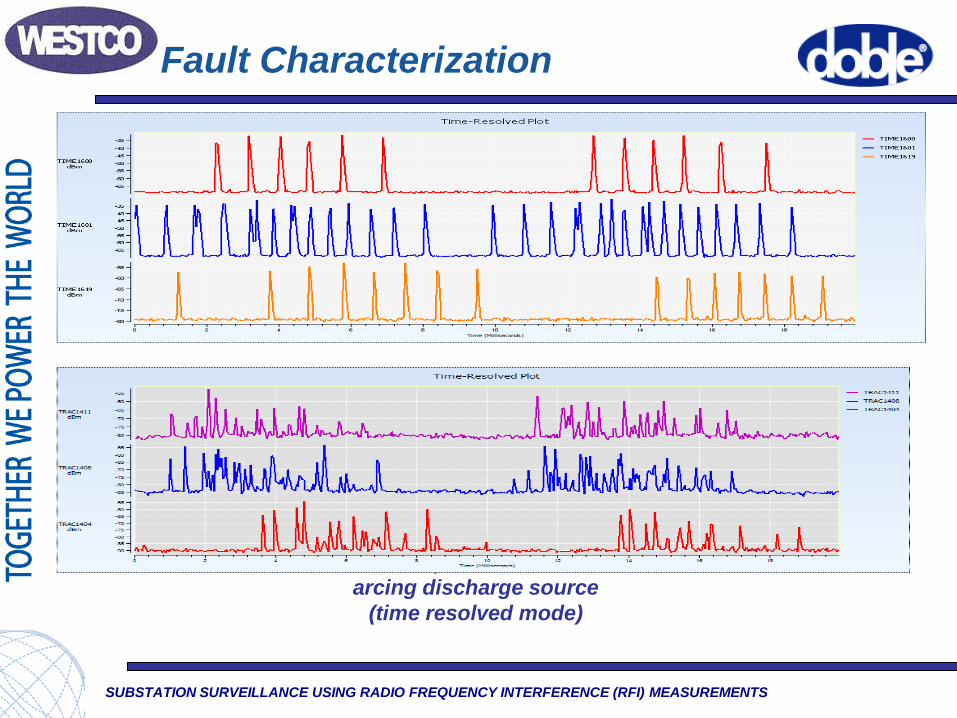
Fault Characterization
Measured impulse events from an
arcing discharge source
(time resolved mode)
SUBSTATION SURVEILLANCE USING RADIO FREQUENCY INTERFERENCE (RFI) MEASUREMENTS
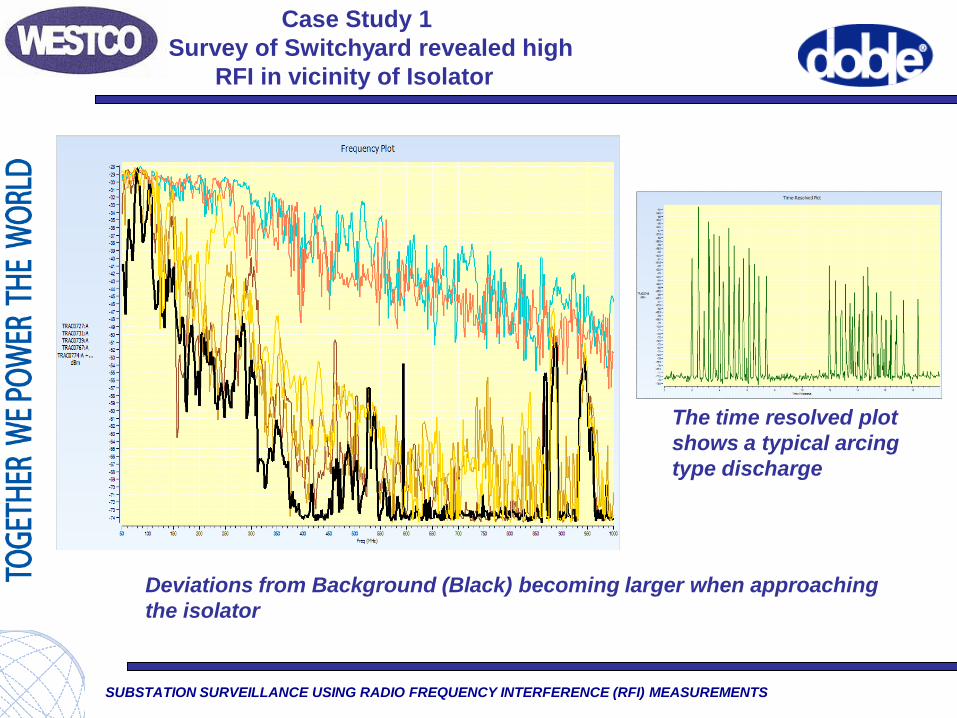
Case Study 1
Survey of Switchyard revealed high
RFI in vicinity of Isolator
Deviations from Background (Black) becoming larger when approaching
the isolator
The time resolved plot
shows a typical arcing
type discharge
SUBSTATION SURVEILLANCE USING RADIO FREQUENCY INTERFERENCE (RFI) MEASUREMENTS
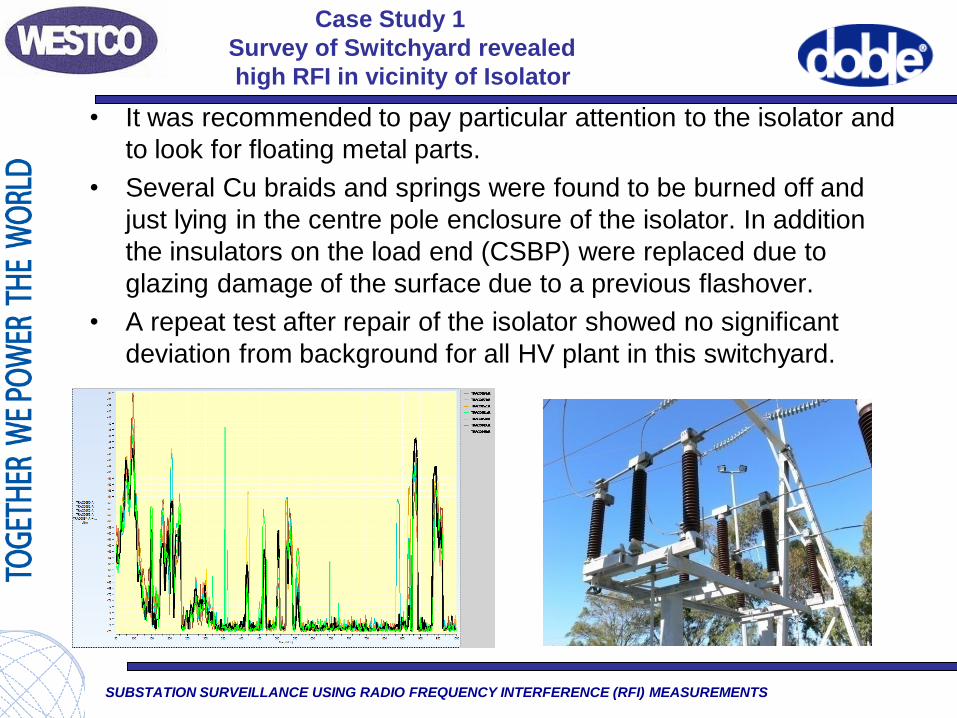
• It was recommended to pay particular attention to the isolator and
to look for floating metal parts.
• Several Cu braids and springs were found to be burned off and
just lying in the centre pole enclosure of the isolator. In addition
the insulators on the load end (CSBP) were replaced due to
glazing damage of the surface due to a previous flashover.
• A repeat test after repair of the isolator showed no significant
deviation from background for all HV plant in this switchyard.
Case Study 1
Survey of Switchyard revealed
high RFI in vicinity of Isolator
SUBSTATION SURVEILLANCE USING RADIO FREQUENCY INTERFERENCE (RFI) MEASUREMENTS
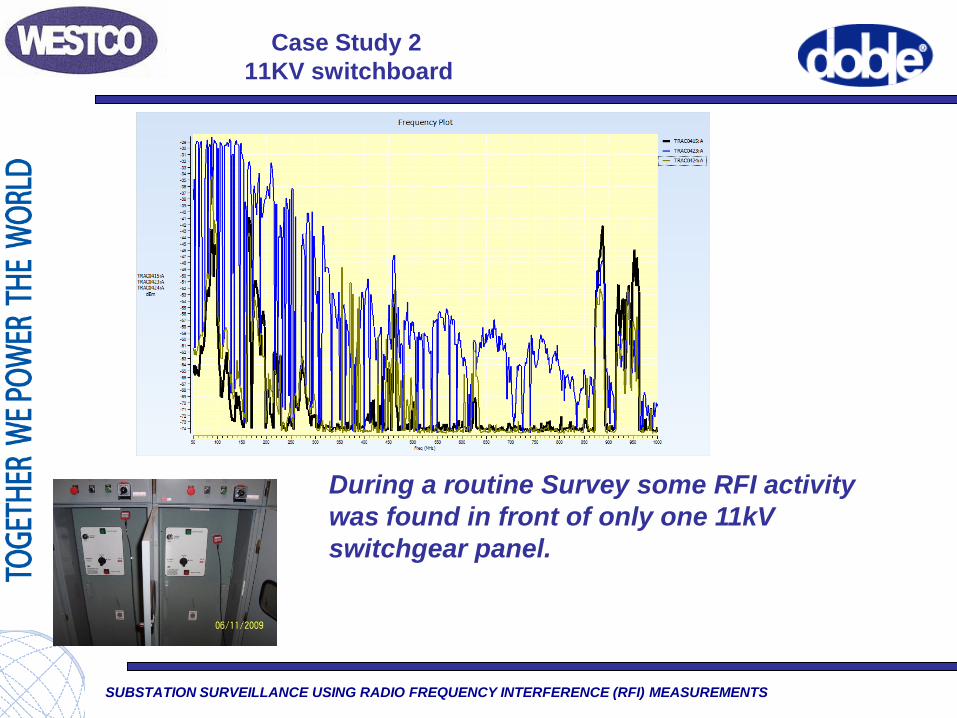
Case Study 2
11KV switchboard
During a routine Survey some RFI activity
was found in front of only one 11kV
switchgear panel.
SUBSTATION SURVEILLANCE USING RADIO FREQUENCY INTERFERENCE (RFI) MEASUREMENTS
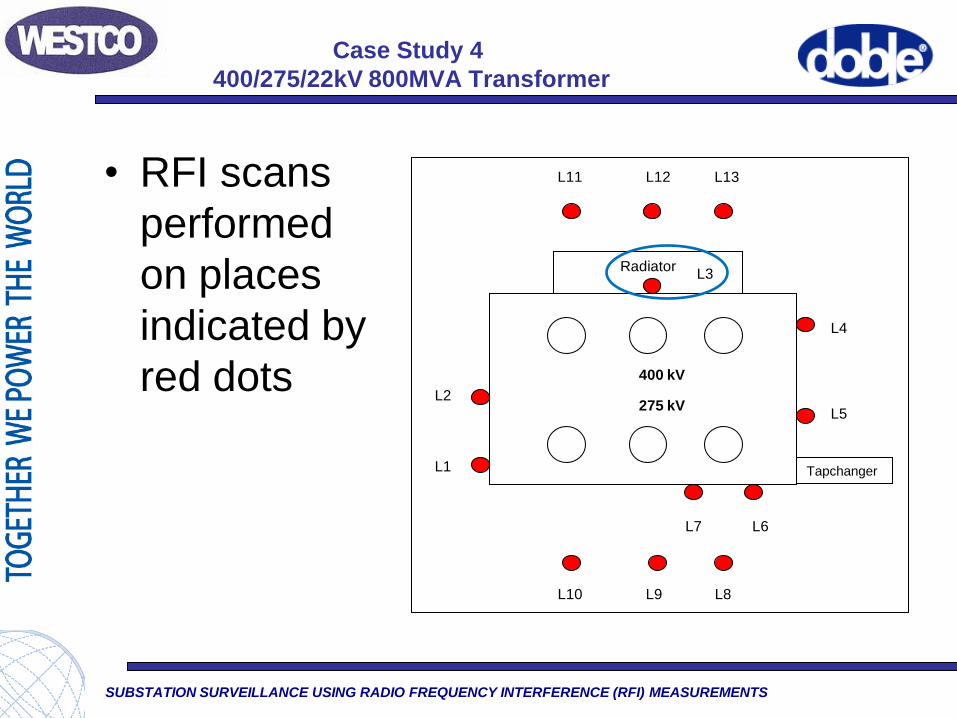
Case Study 4
400/275/22kV 800MVA Transformer
• RFI scans
performed
on places
indicated by
red dots
Radiator
400 kV
275 kV
Tapchanger
L7
L2
L1
L5
L4
L3
L8 L9
L6
L10
L11 L12 L13

SUBSTATION SURVEILLANCE USING RADIO FREQUENCY INTERFERENCE (RFI) MEASUREMENTS
Case Study 4
400/275/22kV 800MVA Transformer
The PD scans at location L3 and the baseline is shown .
The PD measurements showed increases in amplitudes
when compared with the baseline measurement
indicating evidence of discharge activity.
SUBSTATION SURVEILLANCE USING RADIO FREQUENCY INTERFERENCE (RFI) MEASUREMENTS
Case Study 4
400/275/22kV 800MVA Transformer
SUBSTATION SURVEILLANCE USING RADIO FREQUENCY INTERFERENCE (RFI) MEASUREMENTS
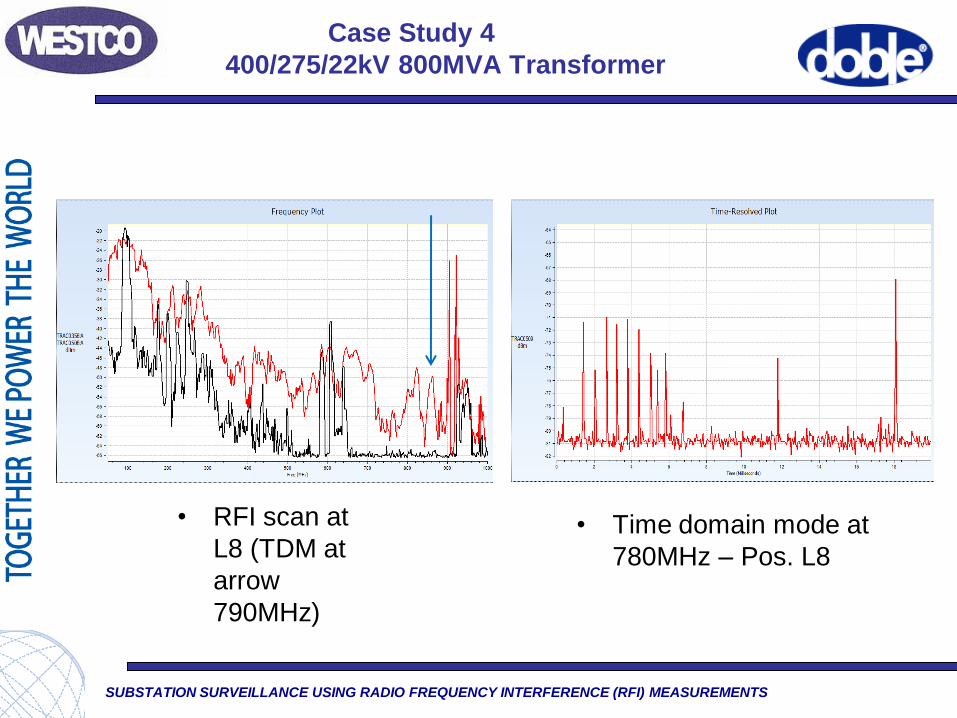
Case Study 4
400/275/22kV 800MVA Transformer
• RFI scan at
L8 (TDM at
arrow
790MHz)
• Time domain mode at
780MHz – Pos. L8
SUBSTATION SURVEILLANCE USING RADIO FREQUENCY INTERFERENCE (RFI) MEASUREMENTS
Case Study 4
400/275/22kV 800MVA Transformer
• Clear signs of severe PD
• The transformer failed 2 weeks after this
survey
SUBSTATION SURVEILLANCE USING RADIO FREQUENCY INTERFERENCE (RFI) MEASUREMENTS
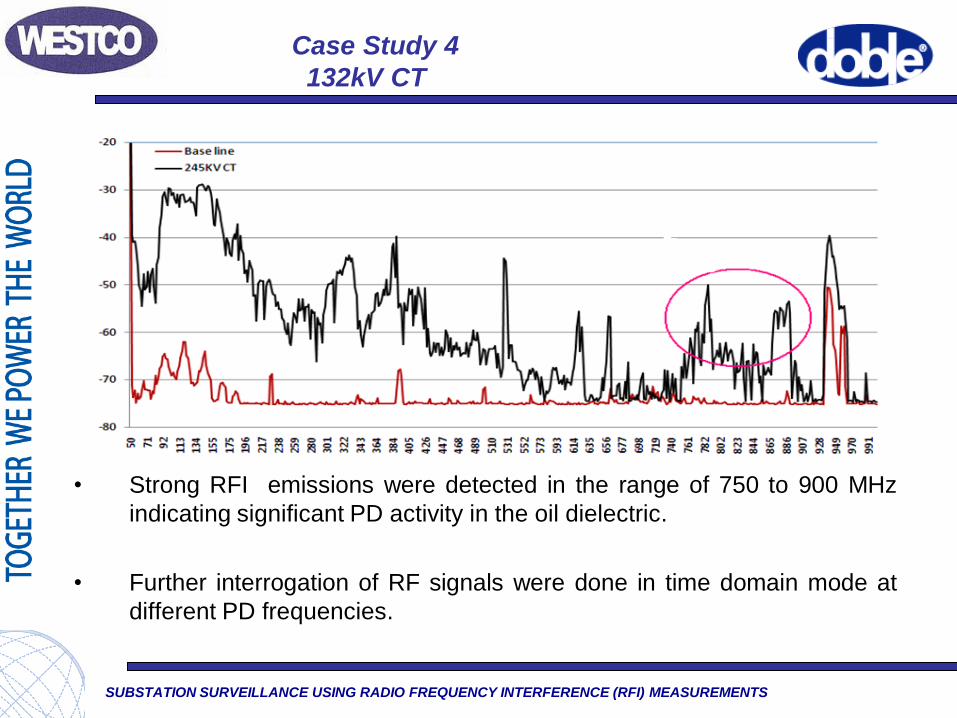
• Strong RFI emissions were detected in the range of 750 to 900 MHz
indicating significant PD activity in the oil dielectric.
• Further interrogation of RF signals were done in time domain mode at
different PD frequencies.
Case Study 4
132kV CT
SUBSTATION SURVEILLANCE USING RADIO FREQUENCY INTERFERENCE (RFI) MEASUREMENTS
Case Study 4
132kV CT
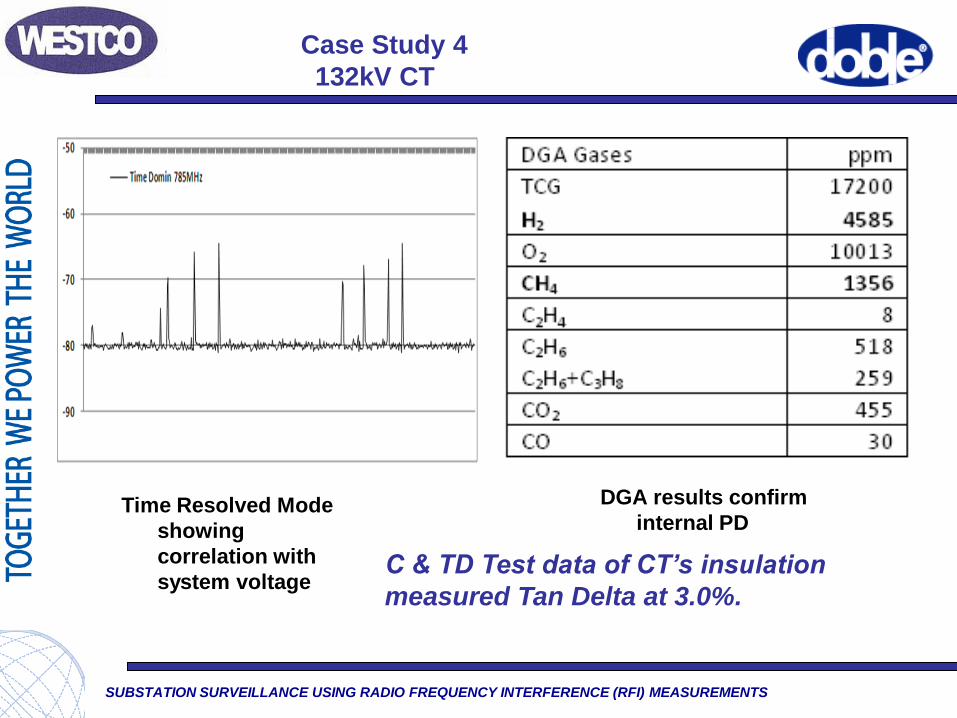
Time Resolved Mode
showing
correlation with
system voltage
DGA results confirm
internal PD
C & TD Test data of CT’s insulation
measured Tan Delta at 3.0%.
SUBSTATION SURVEILLANCE USING RADIO FREQUENCY INTERFERENCE (RFI) MEASUREMENTS
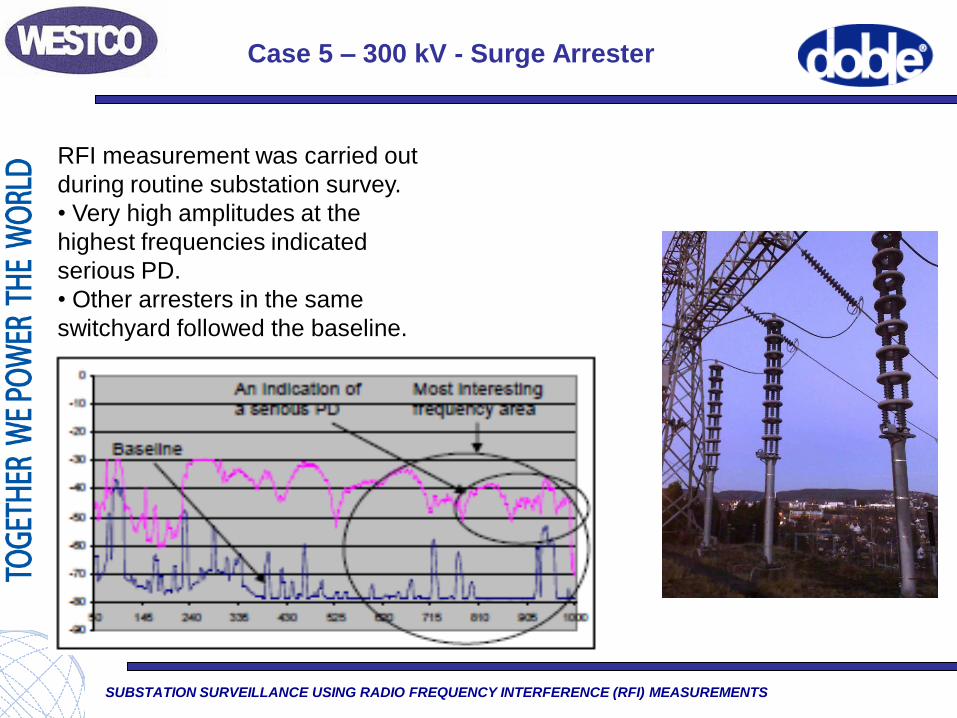
Case 5 – 300 kV - Surge Arrester
RFI measurement was carried out
during routine substation survey.
• Very high amplitudes at the
highest frequencies indicated
serious PD.
• Other arresters in the same
switchyard followed the baseline.
SUBSTATION SURVEILLANCE USING RADIO FREQUENCY INTERFERENCE (RFI) MEASUREMENTS
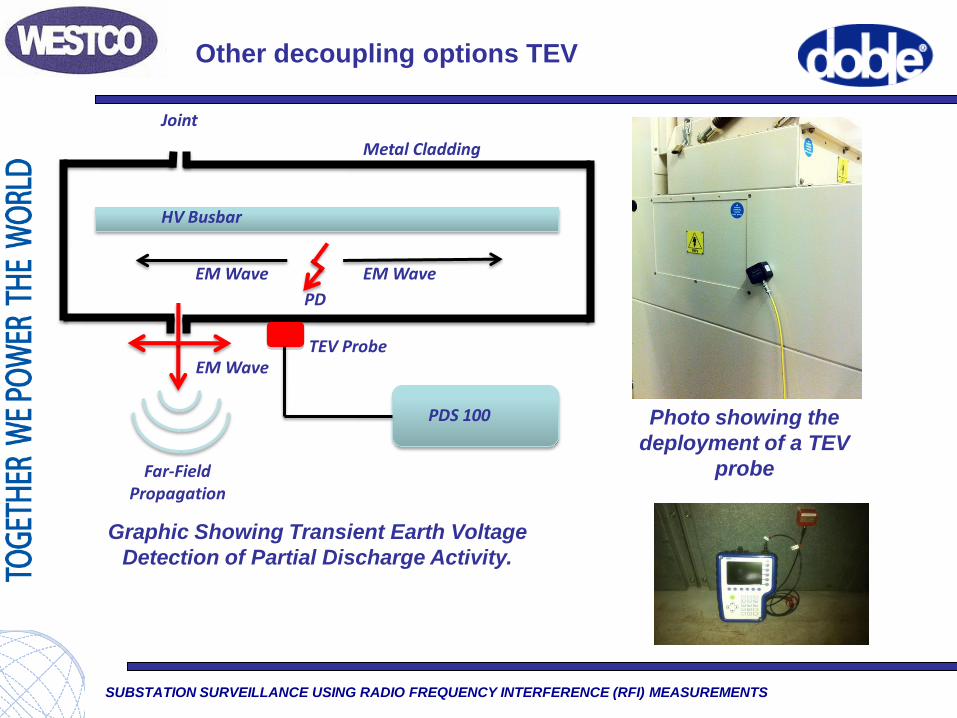
EM Wave EM Wave
PD
HV Busbar
EM Wave
Joint
TEV Probe
PDS 100
Metal Cladding
Photo showing the
deployment of a TEV
probe
Graphic Showing Transient Earth Voltage
Detection of Partial Discharge Activity.
Far-Field Propagation
Other decoupling options TEV
SUBSTATION SURVEILLANCE USING RADIO FREQUENCY INTERFERENCE (RFI) MEASUREMENTS
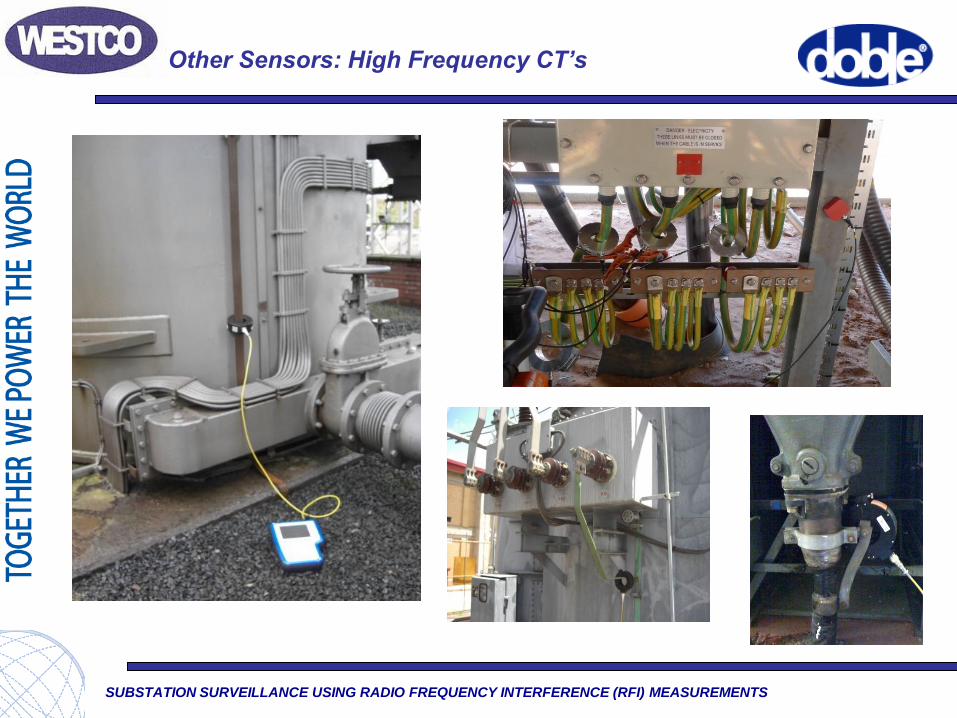
Other Sensors: High Frequency CT’s

SUBSTATION SURVEILLANCE USING RADIO FREQUENCY INTERFERENCE (RFI) MEASUREMENTS
UHF Plate Sensors (Mounted in Hatch)
UHF Drain Valve Sensors
UHF Transformer Sensors
SUBSTATION SURVEILLANCE USING RADIO FREQUENCY INTERFERENCE (RFI) MEASUREMENTS
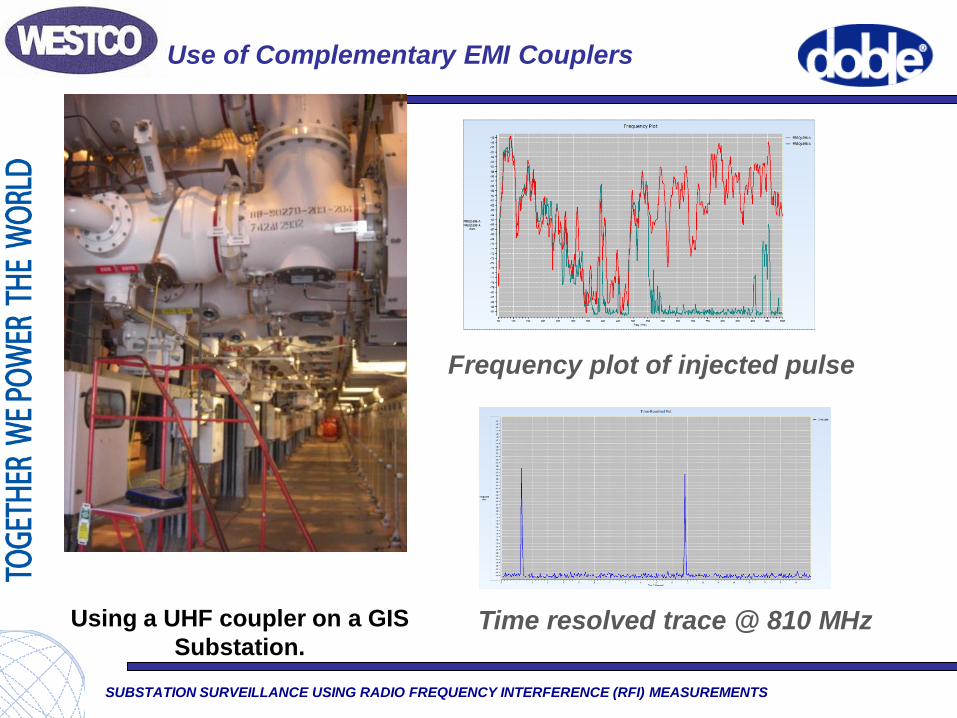
Use of Complementary EMI Couplers
Using a UHF coupler on a GIS
Substation. Time resolved trace @ 810 MHz
Frequency plot of injected pulse

SUBSTATION SURVEILLANCE USING RADIO FREQUENCY INTERFERENCE (RFI) MEASUREMENTS
Example of a Detected GIS Defect
Frequency trace for a
floating particle
Time resolved trace @ 871 MHz;
-repetition rate 1 s-1 UHF signal @ 2.5 GSs-1
SUBSTATION SURVEILLANCE USING RADIO FREQUENCY INTERFERENCE (RFI) MEASUREMENTS
• Impulsive broadband emissions are a
characteristic of insulation defects in HV
substations.
• The PDS100 instrument platform is
specifically designed for substation
surveillance and can greatly assist in early
stage recognition and reporting of PD.
• RFI offers a routine non-invasive and cost-
effective surveillance technique.
Summary
SUBSTATION SURVEILLANCE USING RADIO FREQUENCY INTERFERENCE (RFI) MEASUREMENTS
Thank You!
QUESTION?


![Report on Ichchhapore substation Substation...2014/07/06 · Date:02/02/2018 Report on Ichchhapore substation Substation: SubstationEquipment: 1] PowerTransformer: A](https://img.pdfslide.us/doc/110x75/6082a7423c38c8542368e070/report-on-ichchhapore-substation-substation-20140706-date02022018-report.jpg)