Embed Size (px)
Citation preview
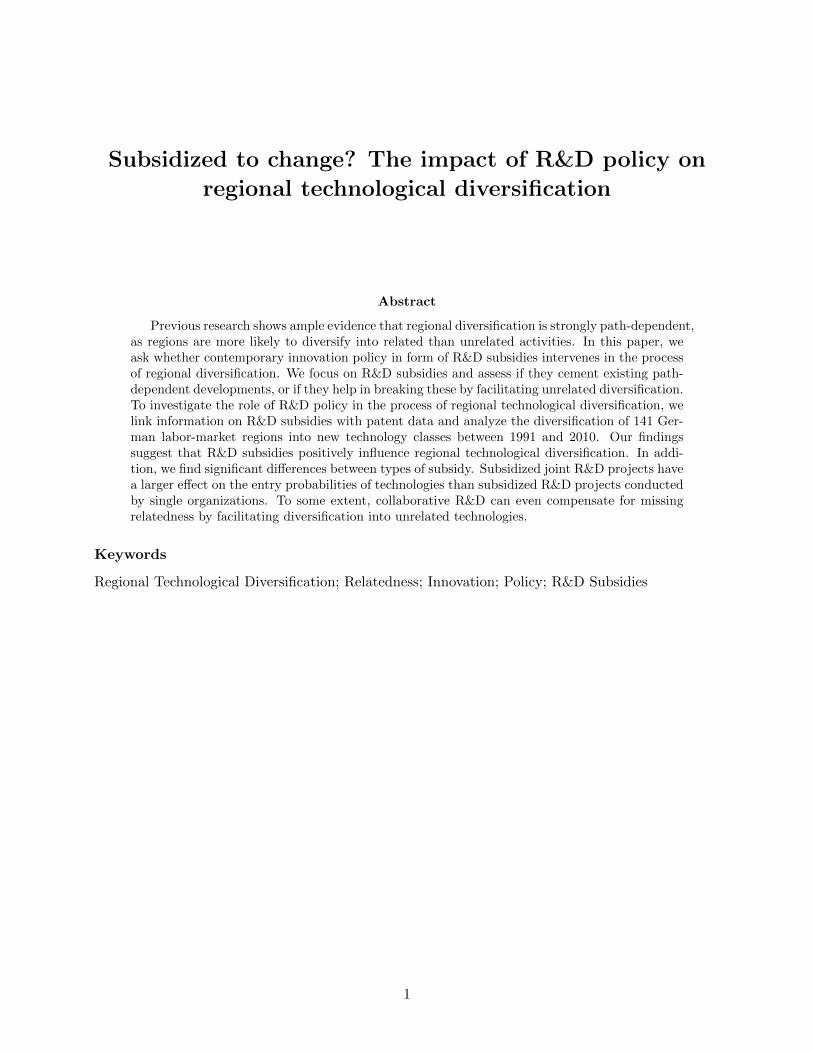
Subsidized to change? The impact of R&D policy on
regional technological diversification
Abstract
Previous research shows ample evidence that regional diversification is strongly path-dependent,as regions are more likely to diversify into related than unrelated activities. In this paper, weask whether contemporary innovation policy in form of R&D subsidies intervenes in the processof regional diversification. We focus on R&D subsidies and assess if they cement existing path-dependent developments, or if they help in breaking these by facilitating unrelated diversification.To investigate the role of R&D policy in the process of regional technological diversification, welink information on R&D subsidies with patent data and analyze the diversification of 141 Ger-man labor-market regions into new technology classes between 1991 and 2010. Our findingssuggest that R&D subsidies positively influence regional technological diversification. In addi-tion, we find significant differences between types of subsidy. Subsidized joint R&D projects havea larger effect on the entry probabilities of technologies than subsidized R&D projects conductedby single organizations. To some extent, collaborative R&D can even compensate for missingrelatedness by facilitating diversification into unrelated technologies.
Keywords
Regional Technological Diversification; Relatedness; Innovation; Policy; R&D Subsidies
1
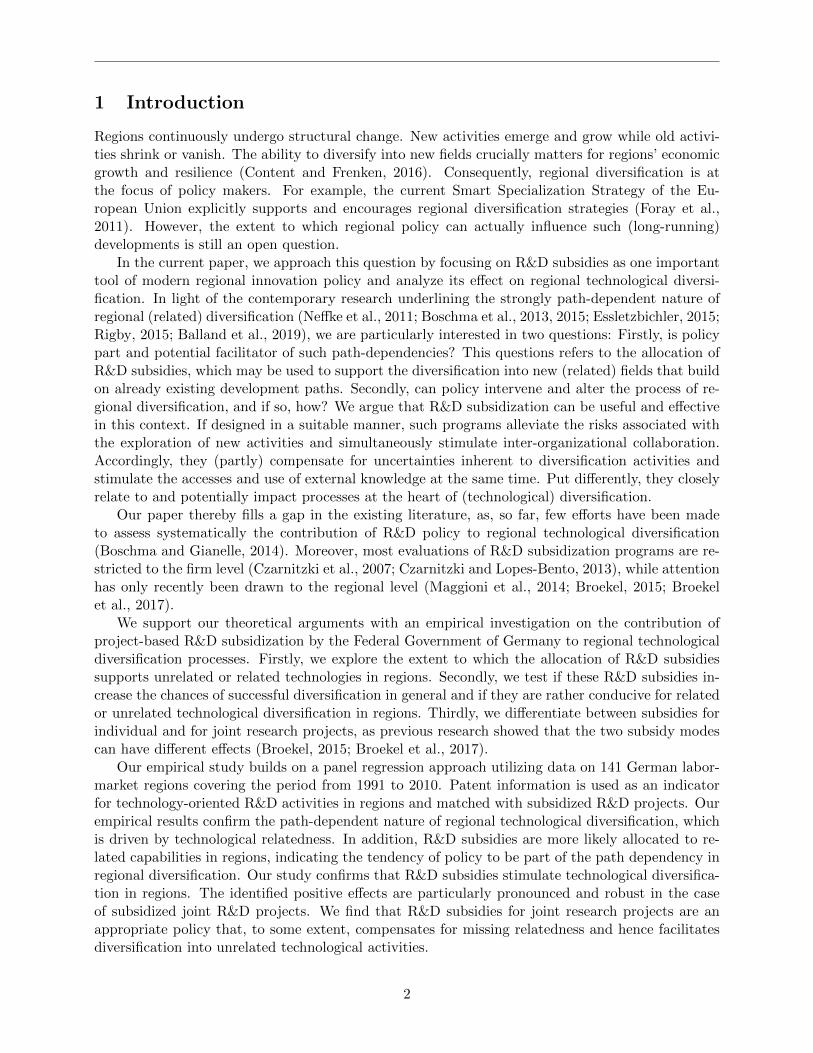
1 Introduction
Regions continuously undergo structural change. New activities emerge and grow while old activi-ties shrink or vanish. The ability to diversify into new fields crucially matters for regions’ economicgrowth and resilience (Content and Frenken, 2016). Consequently, regional diversification is atthe focus of policy makers. For example, the current Smart Specialization Strategy of the Eu-ropean Union explicitly supports and encourages regional diversification strategies (Foray et al.,2011). However, the extent to which regional policy can actually influence such (long-running)developments is still an open question.
In the current paper, we approach this question by focusing on R&D subsidies as one importanttool of modern regional innovation policy and analyze its effect on regional technological diversi-fication. In light of the contemporary research underlining the strongly path-dependent nature ofregional (related) diversification (Neffke et al., 2011; Boschma et al., 2013, 2015; Essletzbichler, 2015;Rigby, 2015; Balland et al., 2019), we are particularly interested in two questions: Firstly, is policypart and potential facilitator of such path-dependencies? This questions refers to the allocation ofR&D subsidies, which may be used to support the diversification into new (related) fields that buildon already existing development paths. Secondly, can policy intervene and alter the process of re-gional diversification, and if so, how? We argue that R&D subsidization can be useful and effectivein this context. If designed in a suitable manner, such programs alleviate the risks associated withthe exploration of new activities and simultaneously stimulate inter-organizational collaboration.Accordingly, they (partly) compensate for uncertainties inherent to diversification activities andstimulate the accesses and use of external knowledge at the same time. Put differently, they closelyrelate to and potentially impact processes at the heart of (technological) diversification.
Our paper thereby fills a gap in the existing literature, as, so far, few efforts have been madeto assess systematically the contribution of R&D policy to regional technological diversification(Boschma and Gianelle, 2014). Moreover, most evaluations of R&D subsidization programs are re-stricted to the firm level (Czarnitzki et al., 2007; Czarnitzki and Lopes-Bento, 2013), while attentionhas only recently been drawn to the regional level (Maggioni et al., 2014; Broekel, 2015; Broekelet al., 2017).
We support our theoretical arguments with an empirical investigation on the contribution ofproject-based R&D subsidization by the Federal Government of Germany to regional technologicaldiversification processes. Firstly, we explore the extent to which the allocation of R&D subsidiessupports unrelated or related technologies in regions. Secondly, we test if these R&D subsidies in-crease the chances of successful diversification in general and if they are rather conducive for relatedor unrelated technological diversification in regions. Thirdly, we differentiate between subsidies forindividual and for joint research projects, as previous research showed that the two subsidy modescan have different effects (Broekel, 2015; Broekel et al., 2017).
Our empirical study builds on a panel regression approach utilizing data on 141 German labor-market regions covering the period from 1991 to 2010. Patent information is used as an indicatorfor technology-oriented R&D activities in regions and matched with subsidized R&D projects. Ourempirical results confirm the path-dependent nature of regional technological diversification, whichis driven by technological relatedness. In addition, R&D subsidies are more likely allocated to re-lated capabilities in regions, indicating the tendency of policy to be part of the path dependency inregional diversification. Our study confirms that R&D subsidies stimulate technological diversifica-tion in regions. The identified positive effects are particularly pronounced and robust in the caseof subsidized joint R&D projects. We find that R&D subsidies for joint research projects are anappropriate policy that, to some extent, compensates for missing relatedness and hence facilitatesdiversification into unrelated technological activities.
2
The remainder of the study is organized as followss Section 2 provides an overview of the existingliterature on regional diversification and R&D policy. We describe our data and empirical approachin Section 3. The empirical results are part of Section 4. The paper concludes with a discussion ofour results regarding their implications for regional innovation policy in Section 5.
2 R&D subsidies and regional diversification
2.1 R&D subsidies and diversification
R&D policy programs are justified by knowledge creation and innovation being important produc-tion factors for economic growth. Nevertheless, knowledge creation suffers from significant marketfailures (Nelson, 1959; Arrow, 1962; McCann and Ortega-Argiles, 2013). For instance, firms cannotfully benefit from their R&D investments, as new knowledge might lack appropriability and spillsover to third parties, giving rise to positive externalities. Similarly, R&D projects are characterizedby significant uncertainty making, ex-ante calculations of investments into R&D a difficult task.Increasing complexity of technologies also requires efforts exceeding individual firms’ capabilities.Accordingly, collaboration with other organizations becomes a necessity, which raises the dangerof moral hazard and unintended knowledge spillover (Hagedoorn, 2002; Cassiman and Veugelers,2002; Broekel, 2015). In sum, private R&D investments are likely to fall short of a social optimum.This motivates and justifies public intervention, which seeks to close the gap between actual andsocially desired levels of knowledge creation by supporting R&D activities.
There are numerous instruments policy may use to achieve this goal. Among the most prominentand frequently used are project-based R&D subsidies (Aschhoff, 2008). These are intended toincrease R&D activities of organizations regarding innovation input and output. Concerning theinput, one major question is whether firms use public subsidies as a complementary and additionalfinancial source to realize R&D projects or if they ”crowd out” private investments. The largebody of empirical research finds mixed results. Although a general crowding-out effect cannot beruled out and depends largely on firm characteristics, the majority of studies find evidence foradditionality effects (Busom, 2000; Czarnitzki and Hussinger, 2004; Zuniga-Vicente et al., 2014).Regarding innovation output, public subsidies seem to stimulate R&D activities. A number ofstudies show the positive effect of R&D subsidies on firms’ innovativeness (Czarnitzki et al., 2007;Czarnitzki and Hussinger, 2018; Ebersberger and Lehtoranta, 2008). That is, significant parts ofprivate R&D activities would not have been realized without subsidization, implying that publicsubsidies seem to complement private R&D.
Yet the design of R&D subsidization programs offers a lot of flexibility, which allows for substan-tial ”fine-tuning” of initiatives. For instance, subsidization can be restricted to specific organizations(location, size, industry), to selected fields (technologies, sectors), or to particular modes of R&D(individual or joint). Policy can also decide about starting dates and time periods of support.Usually, R&D subsidies are granted through competitive bidding procedures (Aschhoff, 2008), andthey are targeted at innovative self-discovery processes (Hausmann and Rodrik, 2003) with thestimulation of inter-organizational knowledge exchange becoming an increasingly important feature(Broekel and Graf, 2012).
All of these features are used in contemporary policies to varying degrees. For instance, theEU-Framework programmes (EU-FRP) are focused on supporting R&D and on stimulating interre-gional as well as international knowledge diffusion by exclusively supporting collaborative projects(Scherngell and Barber, 2009; Maggioni et al., 2014). Another example of R&D subsidization withspecific features is the German BioRegio contest. This initiative focused on advancing one partic-ular technology (biotechnology) and rewarded proposals building on and stimulating intra-regional
3
collaboration (Dohse, 2000).While most empirical studies have examined at the effects of R&D subsidies at the firm level
evaluating their allocation and impact, we seek to extend this perspective in this study. More pre-cisely, we argue that project-based R&D subsidization may play a role in regional diversificationprocesses. Interestingly, linking policy to regional diversification has rarely been done in the litera-ture. An exception concerns the case study by Coenen et al. (2015) that investigates opportunities,barriers, and limits of regional innovation policy aiming at the renewal of mature industries. Theauthors show, for the case of the forest industry in North Sweden, that regional innovation pol-icy can accompany the process of regional diversification by supporting the adoption and creationof related technologies. Our study complements this approach by focusing on a particular policy,namely, R&D subsidies and their effects on regional diversification.
2.2 Regional diversification and relatedness
Regional diversification is in the focus of contemporary innovation policy. For instance, the EU’sSmart Specialization strategy aims at fostering (technological) diversification around regions’ coreactivities (Foray et al., 2011). Thereby, policy seeks to exploit the benefits associated with diver-sification. For instance, diversification positively relates to the level of income, allowing regionsto climb the ladder of economic development (Imbs and Wacziarg, 2003). Diversified regions are,moreover, less likely to run into the trap of cognitive lock-ins (Grabher, 1993) and are less prone tosuffer from exogenous shocks because of portfolio effects (Frenken et al., 2007). Regional R&D com-petences in multiple fields also give rise to synergies increasing the exploitation and experimentationof technological opportunities (Foray et al., 2011).
A large stream of literature increasingly devotes its research to the path-dependent feature ofregional diversification expressed by the crucial role of relatedness (Hidalgo et al., 2007; Boschmaand Frenken, 2011; Neffke et al., 2011; Hidalgo et al., 2018). Concepts such as related diversificationand regional branching (Boschma and Frenken, 2011) highlight that regional diversification is not arandom process but that existing capabilities influence the development of future capabilities. Theso-called ”principle of relatedness” (Hidalgo et al., 2018) is not only working at the individual levelof firms (Teece et al., 1994; Breschi et al., 2003) but shows its importance at different spatial scales.For example, Hidalgo et al. (2007) show that nations are more likely to diversify into new exportproducts that are related to their existing product portfolio. Neffke et al. (2011) transferred thisapproach to the regional level. By relying on information about products of Swedish manufacturingfirms, they show that new industries do not emerge randomly across space. Rather, they are morelikely to emerge in regions where related capabilities already exist. Essletzbichler (2015) confirmsthis finding for industrial diversification in US metropolitan areas. Similar results are obtainedby Boschma et al. (2013) for the export profile of Spanish regions. By comparing the impact ofrelatedness for different spatial levels, the authors also show related industries to play a more crucialrole at the regional compared to the national level. (Rigby, 2015) and (Boschma et al., 2015) analyzeregional diversification in US metropolitan areas. Both find that technology entries are positively,and exits are negatively, correlated with their relatedness to regions’ technology portfolios.
The ample empirical evidence for related diversification being the norm rather than the ex-ception reveals the dominant role of path dependency in diversification processes. By building onrelated capabilities, economic actors follow existing technological trajectories, rely on establishedroutines, and build on familiar knowledge (Nelson and Winter, 1982; Dosi, 1988). Building on ex-isting capabilities rather than exploring completely new ones reduces uncertainties and risks whileincreasing the likelihood of successful diversification.
The path dependency in regional diversification certainly has substantial advantages. For in-
4
stance, regions can specialize and build competitive advantages in certain activities providing themwith important growth opportunities (Martin and Sunley, 2006; Boschma and Frenken, 2006). Thecontinuous specialization of the Silicon Valley into information and communication technologies isa prominent example of successful related diversification along a promising path (Storper et al.,2015). Nevertheless, related diversification can also lead to regional lock-ins by following maturepaths with little future prospects, such as in the German Ruhr-Area (Grabher, 1993). Diversifica-tion into unrelated activities can prevent such lock-ins by broadening the set of regional capabilities.In addition, it increases regional resilience toward external shocks (Frenken et al., 2007). Yet unre-lated diversification requires the exploration of new knowledge, which is uncertain, risky, and lesspromising.
2.3 R&D subsidies and regional diversification
Can project-based R&D subsidies impact regional diversification? If so, how? Firstly, diversifica-tion requires organizations to leave existing routines by exploring new activities involving novel (atleast to the organization) knowledge and technologies. It further implies less foresight on potentialoutcomes and lower abilities to plan R&D processes as well as commercialization possibilities. Ex-isting routines are less helpful in designing financial plans, selecting appropriate suppliers, or buyingneeded equipment. Consequently, diversification-oriented R&D can be expected to represent a riskyand uncertain undertaking. Organizations therefore show a tendency to avoid diversification intocompletely new activities. R&D subsidies can to some extent compensate the risks associated withdiversification and induce actors to explore new activities (Fier et al., 2006). We therefore arguethat organizations are highly likely to use R&D subsidies for (risky) diversification activities.
Secondly, the effects of project-based R&D subsidies unfold beyond the individual organization(Broekel, 2015; Maggioni et al., 2014). Organizations are embedded into regional economies throughlabor mobility, collaboration, social networks, input-output linkages, and other types of interactions.This is highlighted in various approaches, including regional innovation systems, learning regions,and clusters (Cooke, 1998; Florida, 1995; Porter, 2000). Accordingly, knowledge and competencesthat are acquired in subsidized projects are more likely to be picked up and utilized by other regionalactors. In this sense, R&D subsidies present a resource inflow into the region’s innovation system,which supports its general innovation activities, including those oriented toward diversification.
Thirdly, regional diversification frequently takes place through spin-off and start-up processes(Boschma and Wenting, 2007; Klepper, 2007; Boschma and Frenken, 2011). At the same time, spin-offs in particular have been identified as frequent and above-average recipients of R&D subsidies(Cantner and Kosters, 2012). The added value of the support thereby exceeds what has beendiscussed above. Fier et al. (2006) identified subsidies to support university spin-outs by addingcredibility and strengthening public relations. Under the assumption that there is no discriminationagainst spin-offs active in technologies new to a region, R&D subsidies thereby directly supportregional diversification.
Fourthly, many R&D subsidization initiatives seek to advance particular technologies (e.g.,biotechnology). Announcing such initiatives signals to economic actors that these technologies are(at least in the eyes of policymakers) promising and may offer economic potential. If effective, thisis likely to stimulate actors to expand already-existing activities in these technologies or diversifyinto these activities.
In sum, R&D subsidies alleviate risks of research activities with uncertain outcomes. Therefore,they encourage riskier research, expand R&D resources, and exert particular benefits for spin-offsas well as spin-outs. In turn, all these contribute to regional diversification. Notably, the discussedeffects are largely independent of the policy being designed to support diversification. Naturally,
5
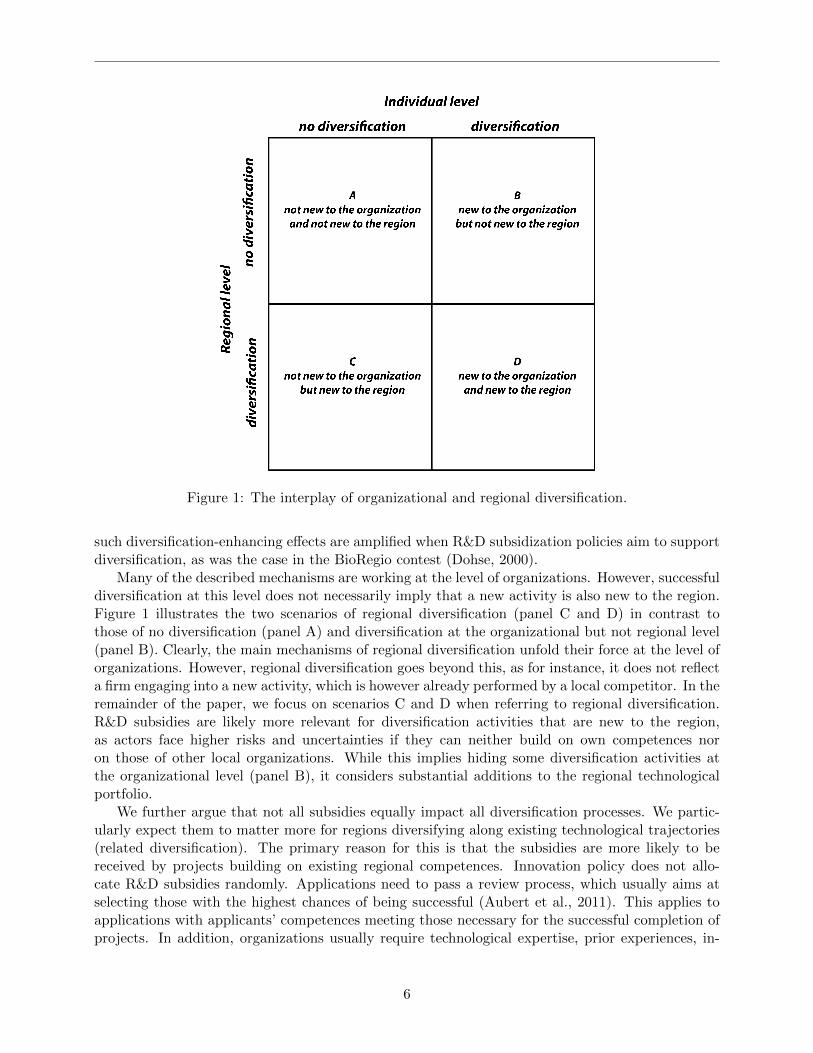
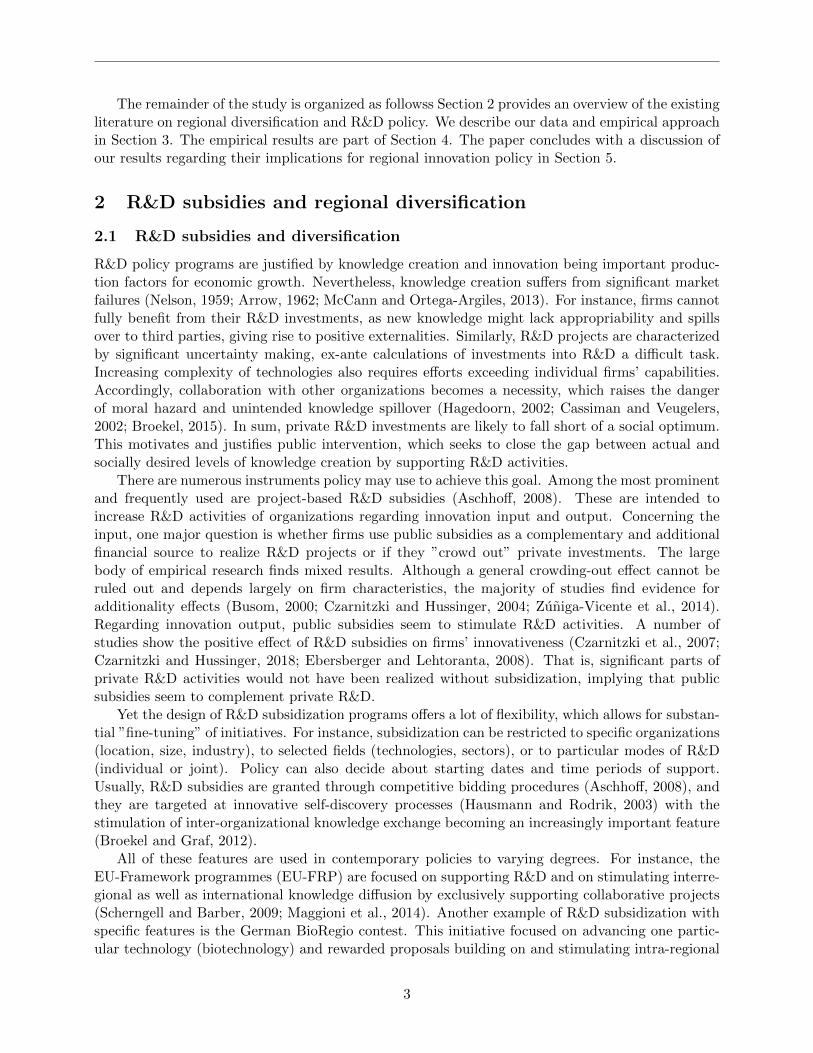
Figure 1: The interplay of organizational and regional diversification.
such diversification-enhancing effects are amplified when R&D subsidization policies aim to supportdiversification, as was the case in the BioRegio contest (Dohse, 2000).
Many of the described mechanisms are working at the level of organizations. However, successfuldiversification at this level does not necessarily imply that a new activity is also new to the region.Figure 1 illustrates the two scenarios of regional diversification (panel C and D) in contrast tothose of no diversification (panel A) and diversification at the organizational but not regional level(panel B). Clearly, the main mechanisms of regional diversification unfold their force at the level oforganizations. However, regional diversification goes beyond this, as for instance, it does not reflecta firm engaging into a new activity, which is however already performed by a local competitor. In theremainder of the paper, we focus on scenarios C and D when referring to regional diversification.R&D subsidies are likely more relevant for diversification activities that are new to the region,as actors face higher risks and uncertainties if they can neither build on own competences noron those of other local organizations. While this implies hiding some diversification activities atthe organizational level (panel B), it considers substantial additions to the regional technologicalportfolio.
We further argue that not all subsidies equally impact all diversification processes. We partic-ularly expect them to matter more for regions diversifying along existing technological trajectories(related diversification). The primary reason for this is that the subsidies are more likely to bereceived by projects building on existing regional competences. Innovation policy does not allo-cate R&D subsidies randomly. Applications need to pass a review process, which usually aims atselecting those with the highest chances of being successful (Aubert et al., 2011). This applies toapplications with applicants’ competences meeting those necessary for the successful completion ofprojects. In addition, organizations usually require technological expertise, prior experiences, in-
6
frastructure, and matching qualifications to write convincing applications. Such is more likely givenwhen organizations are active in similar or related activities (Blanes and Busom, 2004; Aschhoff,2008).
This is not restricted to the organizational level. For instance, Broekel et al. (2015b) showthat even when controlling for organizational characteristics, being located in a regional cluster (ofrelated activities) increases the chances of receiving R&D subsidies (at least in the case of EU-FRP). One of the reasons for this is that organizations located within clusters ”are more likelyto learn about subsidization programs, which is probable to translate into higher application rates”(Broekel et al., 2015b, p. 1433). It seems reasonable to assume that this especially applies to policyinitiatives related to activities of the organizations within the cluster. Consequently, we expectthat R&D policy plays a role in the path dependency in regional diversification by preferentiallyallocating public resources to related, rather than to unrelated, capabilities in regions. Our firsthypothesis reads as follows:
H1a: Project-based subsidization of R&D positively influences technological diversification in regions.
H1b: Project-based subsidization of R&D is more likely to contribute to related diversification.
While these arguments refer to R&D subsidies in general, we argue that the influence of R&Dpolicy depends on its specific mode. Previous research has shown that the effects of R&D subsidiza-tion differ between subsidies granted to individual- and joint-research projects (Broekel and Graf,2012; Broekel, 2015). In contrast to subsidies for individual projects, supporting joint R&D projectshas a greater potential for stimulating the exploration of new knowledge and activities, as theserequire organizations to collaborate. Consequently, such support is likely to alter organizations’ andregions’ embeddedness into intra-regional and inter-regional knowledge networks (Fier et al., 2006;Wanzenbock et al., 2013; Broekel, 2015; Topfer et al., 2017). For instance, (Broekel et al., 2017)measure the technological similarity of partners in subsidized projects and find these to be ratherheterogeneous. Firms are also shown to particularly add science organizations to their portfolio ofcollaboration partners when participating in subsidized R&D projects (Fier et al., 2006).
The utilization of subsidies to explore new knowledge is further highlighted by the location of col-laboration partners. In Germany, only 12% of collaborations established by joint projects subsidizedby the federal government connect partners within the same region (Broekel and Mueller, 2018).In the case of the EU-FRP for biotechnology, this figure is as small as one percent (Broekel et al.,2015b). Accordingly, project-based subsidies are frequently employed to establish or strengthenrelations with dissimilar actors from different regions, which is crucial and typical for diversificationactivities (Hagedoorn, 1993; Boschma and Frenken, 2011; van Oort et al., 2015). We therefore ex-pect subsidies for joint (collaborative) research to have stronger effects than individual grants, dueto their impact on collaboration and knowledge networks. As collaborative R&D subsidies facilitateknowledge exchange between new and heterogeneous actors, we particularly expect joint-researchprojects to increase the likelihood of unrelated diversification in regions. Our second hypothesissummarizes these arguments as follows:
H2a: Subsidized joint R&D projects contribute to a larger extent to technological diversification inregions than do individual R&D projects.
H2b: Subsidized joint R&D projects facilitate regional diversification into unrelated activities.
7
3 Data and methods
3.1 Measuring regional diversification
To study the relationship between R&D subsidies and regional diversification, we focus on 141German labor-market regions (LMR), as defined by Kosfeld and Werner (2012). Moreover, ourdata cover the years from 1991 to 2010. In a common manner, we use patent data to approximatetechnological activities (Boschma et al., 2015; Rigby, 2015; Balland et al., 2019). Despite well-discussed drawbacks (Griliches, 1990; Cohen et al., 2000), patents entail detailed information aboutthe invention process, such as the date, location, and technology, all of which are fundamental forour empirical analysis. We extract patent information from the OECD REGPAT Database, whichcovers patent applications at the European Patent Office (EPO). Based on inventors’ residences, weassign patents to the corresponding LMR. For smaller regions in particular, annual patent countsare known to fluctuate, strongly challenging robust estimations. We therefore aggregate our datainto four 5-year periods (1991-1995, 1996-2000, 2001-2005, 2006-2010).
Technologies are classified according to the International Patent Classification (IPC). The IPCsummarizes hierarchically eight classes at the highest and more than 71,000 classes at the lowestlevel. We aggregate the data to the four-digit IPC level, which differentiates between 630 distincttechnology classes. The four-digit level represents the best trade-off between a maximum numberof technologies and sufficiently large patent counts in each of these classes.
Previous studies relied on the location quotient (LQ), also called reveal technological advantage(RTA), to identify diversification processes. For example, LQ values larger than one signal theexistence of technological competences in a region, and values below signal their absence. Successfuldiversification is then identified when the LQ grows from below one to above one between two periods(Boschma et al., 2015; Rigby, 2015; Cortinovis et al., 2017; Balland et al., 2019). We refrain fromthis approach for two important reasons. Firstly, being a relative measure, the LQ approach allowstechnologies to ”artificially” emerge in regions simply by decreasing patent numbers in other regions.Secondly, the LQ is normalized at the regional and technology levels, which can interfere with theinclusion of regional and technology fixed effects in panel regressions.
We therefore rely on an alternative and more direct approach to assess diversification processesby concentrating on absolute changes in regional patent numbers. More precisely, we create thebinary dependent variable Entry with a value of 1 if we do not observe any patents in technology k inregion r and period t, and a positive value in the subsequent period t+1. We intensively checked thedata for random fluctuations between subsequent periods, which can inflate the number of observedentries. The aggregation of regional patent information into 5-year periods, however, eliminatedsuch cases almost completely.
3.2 Information on R&D subsidies
Our main explanatory variable, Subsidies, represents the sum of R&D projects in technology classk and region r at time t. The so-called Foerderkatalog of the German Federal Ministry of Educationand Research (BMBF) serves as our data source. The BMBF data cover the largest parts of project-based R&D support at the national level in Germany (Czarnitzki et al., 2007; Broekel and Graf,2012) and have been used in a number of previous studies (Broekel and Graf, 2012; Broekel et al.,2015a,b; Cantner and Kosters, 2012; Fornahl et al., 2011). The data provide detailed informationon granted individual and joint R&D projects, such as the starting and ending dates, the location ofthe executing organization, and a technological classification called Leistungsplansystematik (LPS).
The LPS is a classification scheme developed by the BMBF and consists of 47 main classes.The main classes are, similarly to the IPC, disaggregated into more fine-grained subclasses, which
8
comprise 1,395 unique classes at the most detailed level. To create the variable Subsidies, we needto match the information on R&D subsidies with the patent data. Both are based on differentclassification schemes (IPC and LPS), which prevents a direct matching. Moreover, there is noexisting concordance of the two classifications.
We therefore develop such a concordance. For this, we reduce the information contained in theFoerderkatalog by excluding classes that are irrelevant for patent-based innovation activities. Thisprimarily refers to subsidies in the fields of social sciences, general support for higher education,gender support, and labor conditions. Next, we utilize a matched-patent-subsidies-firm databasecreated by the Halle Institute of Economic Research. This database includes 325,497 patent appli-cations by 5,398 German applicants between 1999 and 2017. It also contains information on 64,156grants of the Foerderkatalog with 10,624 uniquely identified beneficiaries. In this case, beneficiariesrepresent so-called executive units (”Ausfuhrende Stelle”) (see Broekel and Graf, 2012).
In this database, grant beneficiaries and patent applicants are linked by name-matching. Hence,the IPC classes of their patents can be linked to the LPS classes of their grants. In principle, thisinformation allows for a matching of the most fine-grained level of the IPC and LPS. In this case,however, the majority of links are established by a single incidence of IPC classes coinciding withLPS classes, i.e., there is only one organization with a patent in IPC class k and a grant in LPSclass l. Moreover, the concordance is characterized by an excessive number of zeros, as only fewmatches of the 71, 000 (IPC) ∗ 1, 395 (LPS) cases are realized.
To render the concordance more robust, we therefore establish the link on a more aggregatedlevel, which also makes the concordance correspond to the data employed in this study. Moreprecisely, we aggregate the IPC classes to the four-digit level and the LPC to the 47 main classesdefined in (BMBF, 2014). It is important to note that, not all LPS main classes are relevantfor patent-based innovation (e.g., arts and humanities). We eliminate such classes and eventuallyobtain 30 LPS main classes that are matched to 617 out of 630 empirically observed IPC classes.For these, we calculate the share of organizations Sl,k with grants in LPS l that also patent in IPCk:
Sl,k =nl,k∑Xlx=1 nx
(1)
with nl,k being the number of organizations with at least one patent in k and grant in l. Xl is thetotal number of organizations with grants in l. On this basis, we calculate the number of subsidizedprojects, Subsidiesl,k, assigned to region r and technology k by multiplying the number of grants inl acquired by regional organizations with patents in k with Sl,k. Following the discussion in Section2, we calculate Subsidies in three versions: on the basis of all subsidized projects (Subsidiesk,r),
for individual projects (SubsidiesSinglek,r ), and considering only joint projects (SubsidiesJointk,r ) intechnology class k and region r.
3.3 Relatedness density
Our second most important explanatory variable is relatedness. We follow the literature in con-structing this variable as a density measure (Hidalgo et al., 2007; Rigby, 2015; Boschma et al.,2015). More precisely, relatedness density reveals how well technologies fit to the regional technol-ogy landscape. It is constructed in two steps.
Firstly, we measure technological relatedness between each pair of technologies. The literaturesuggests four major approaches: (i) entropy-based (Frenken et al., 2007), (ii) input-output linkages(Essletzbichler, 2015), (iii) spatial co-occurrence (Hidalgo et al., 2007), and (iv) co-classification(Engelsman and van Raan, 1994). We follow the fourth approach and calculate technological relat-edness between two technologies (four-digit patent classes) based on their co-classification pattern
9
http://peeg.wordpress.com
Papers in Evolutionary Economic Geography
# 20.03
Subsidized to change? The impact of R&D policy on regional technological diversification
Lars Mewes and Tom Broekel
(co-occurrence of patent classes on patents). The cosine similarity gives us a measure of technolog-ical relatedness between each technology pair (Breschi et al., 2003).
Secondly, we determine which technologies belong to regions’ technology portfolios at a giventime. Straightforwardly, we use patent counts with positive numbers indicating the presence of atechnology in a region. Following Hidalgo et al. (2007), we measure relatedness density on this basisas:
Densityk,r =
∑m xm ρk,m∑
m ρk,m∗ 100 (2)
where Density stands for relatedness density. ρ indicates the technological relatedness between tech-nology k and m, while xm is equal to 1 if technology m is part of the regional portfolio (Patents > 0)and 0 otherwise (Patents = 0). Consequently, we obtain a 141 x 630 matrix including the related-ness density for each of the 630 IPC classes in all 141 LMRs indicating their respective relatednessto the existing technology portfolio of regions.
3.4 Control variables
In addition to R&D subsidies and relatedness density, the empirical literature has identified anumber of other determinants of regional technological diversification. Firstly, knowledge spilloverfrom adjacent regions can potentially impact regional diversification processes (Boschma et al.,2013). We account for these potential spatial spillovers and include technological activities inneighboring regions (Neighbor Patentsk,r) as a spatially lagged variable. The variable counts thenumber of patents in technology k of all neighboring regions s of region r. Regions s and r areneighbors if they share a common border.
We also control for a number of time-varying regional and technology characteristics that influ-ence regional diversification processes. Firstly, regional diversification is dependent on the devel-opment stage of regions (Petralia et al., 2017). Hence, economically well performing regions havemore opportunities to diversify into new and more advanced activities than less developed regions.We follow existing approaches and use the gross domestic product per capita (Regional GDPr, logtransformed) to control for the economic performance of regions (Petralia et al., 2017; Balland et al.,2019). Secondly, the size of the region also plays a role. Regions with a larger working force tendto be more successful in terms of diversification (Boschma et al., 2015; Balland et al., 2019). Wetherefore include the number of employees in a region (Regional Employmentr, log transformed)in our empirical model. Both variables, Regional GDPr and Regional Employmentr, are obtainedfrom the German Arbeitskreis ”Volkswirtschaftliche Gesamtrechnungen der Lander” (August 2018).Thirdly, we also consider the number of regional patents (Regional Patentsr) to control for thesize of the regional patent stock, which also serves as a measure of regions’ overall technologicalcapabilities. Fourthly, diverse regions with larger sets of capabilities have more opportunities tomove into new fields than regions with narrow sets (Hidalgo et al., 2007). The regional diversity(Regional Diversityr) variable detects this and is defined as the number of technologies k with pos-itive patent counts in a region. Lastly, the size of technologies is controlled for by considering thenumber of patents in a given technology (Technology Sizek). Descriptive statistics and correlationsfor all variables are reported in Table 1.
3.5 Empirical model
We follow an established approach in the literature on regional diversification to set up our empiricalmodel (Boschma et al., 2015; Balland et al., 2019). More precisely, we rely on panel regressionsto explain the status of technological diversification in a region. Our basic model is specified as
10
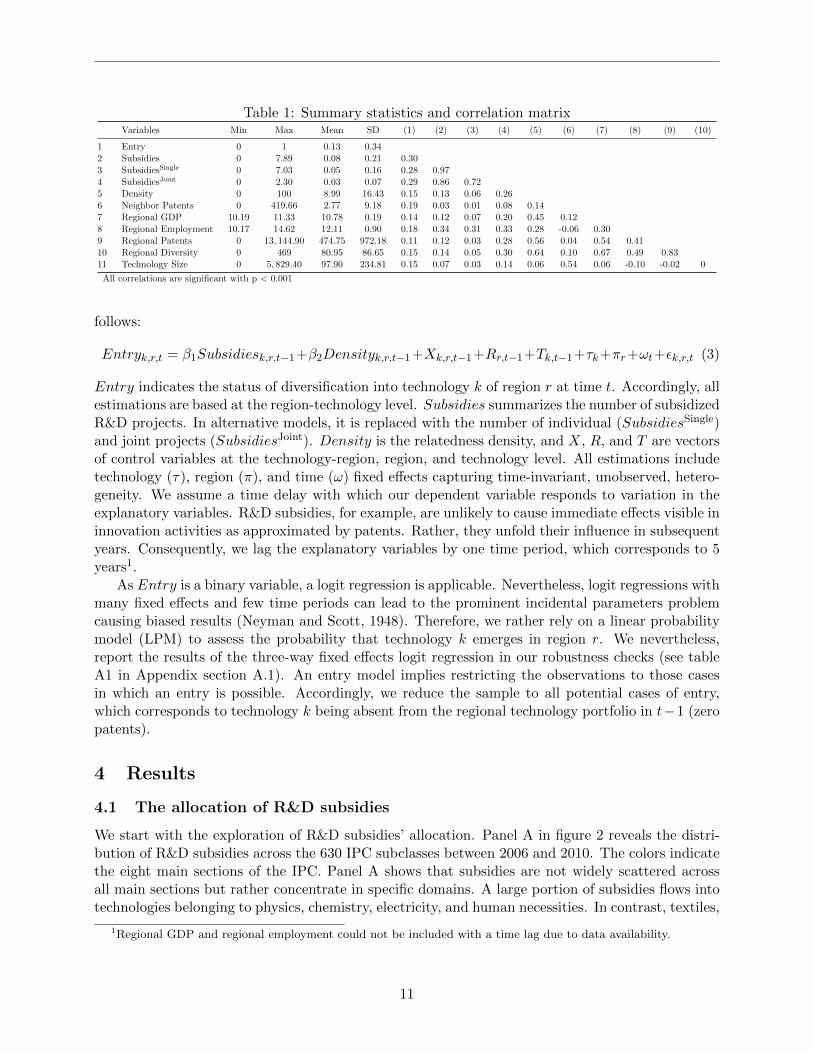
Table 1: Summary statistics and correlation matrixVariables Min Max Mean SD (1) (2) (3) (4) (5) (6) (7) (8) (9) (10)
1 Entry 0 1 0.13 0.342 Subsidies 0 7.89 0.08 0.21 0.303 SubsidiesSingle 0 7.03 0.05 0.16 0.28 0.974 SubsidiesJoint 0 2.30 0.03 0.07 0.29 0.86 0.725 Density 0 100 8.99 16.43 0.15 0.13 0.06 0.266 Neighbor Patents 0 419.66 2.77 9.18 0.19 0.03 0.01 0.08 0.147 Regional GDP 10.19 11.33 10.78 0.19 0.14 0.12 0.07 0.20 0.45 0.128 Regional Employment 10.17 14.62 12.11 0.90 0.18 0.34 0.31 0.33 0.28 -0.06 0.309 Regional Patents 0 13, 144.90 474.75 972.18 0.11 0.12 0.03 0.28 0.56 0.04 0.54 0.4110 Regional Diversity 0 469 80.95 86.65 0.15 0.14 0.05 0.30 0.64 0.10 0.67 0.49 0.8311 Technology Size 0 5, 829.40 97.90 234.81 0.15 0.07 0.03 0.14 0.06 0.54 0.06 -0.10 -0.02 0
All correlations are significant with p < 0.001
follows:
Entryk,r,t = β1Subsidiesk,r,t−1+β2Densityk,r,t−1+Xk,r,t−1+Rr,t−1+Tk,t−1+τk+πr+ωt+εk,r,t (3)
Entry indicates the status of diversification into technology k of region r at time t. Accordingly, allestimations are based at the region-technology level. Subsidies summarizes the number of subsidizedR&D projects. In alternative models, it is replaced with the number of individual (SubsidiesSingle)and joint projects (SubsidiesJoint). Density is the relatedness density, and X, R, and T are vectorsof control variables at the technology-region, region, and technology level. All estimations includetechnology (τ), region (π), and time (ω) fixed effects capturing time-invariant, unobserved, hetero-geneity. We assume a time delay with which our dependent variable responds to variation in theexplanatory variables. R&D subsidies, for example, are unlikely to cause immediate effects visible ininnovation activities as approximated by patents. Rather, they unfold their influence in subsequentyears. Consequently, we lag the explanatory variables by one time period, which corresponds to 5years1.
As Entry is a binary variable, a logit regression is applicable. Nevertheless, logit regressions withmany fixed effects and few time periods can lead to the prominent incidental parameters problemcausing biased results (Neyman and Scott, 1948). Therefore, we rather rely on a linear probabilitymodel (LPM) to assess the probability that technology k emerges in region r. We nevertheless,report the results of the three-way fixed effects logit regression in our robustness checks (see tableA1 in Appendix section A.1). An entry model implies restricting the observations to those casesin which an entry is possible. Accordingly, we reduce the sample to all potential cases of entry,which corresponds to technology k being absent from the regional technology portfolio in t−1 (zeropatents).
4 Results
4.1 The allocation of R&D subsidies
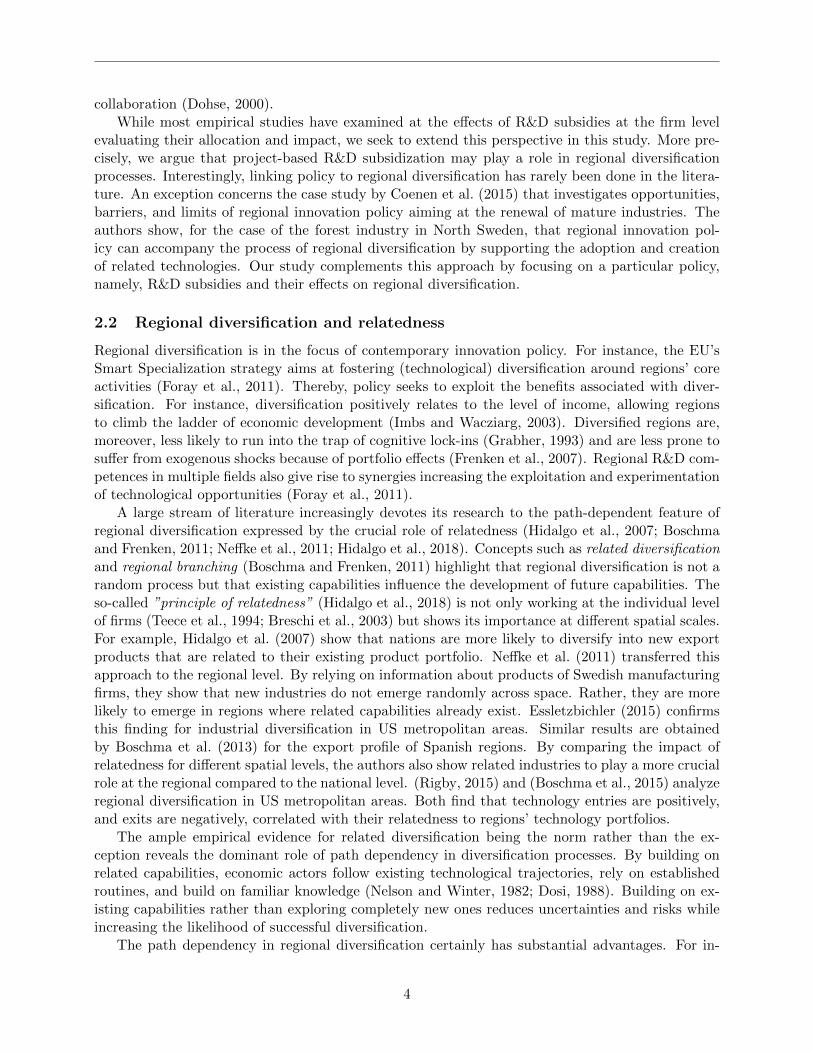
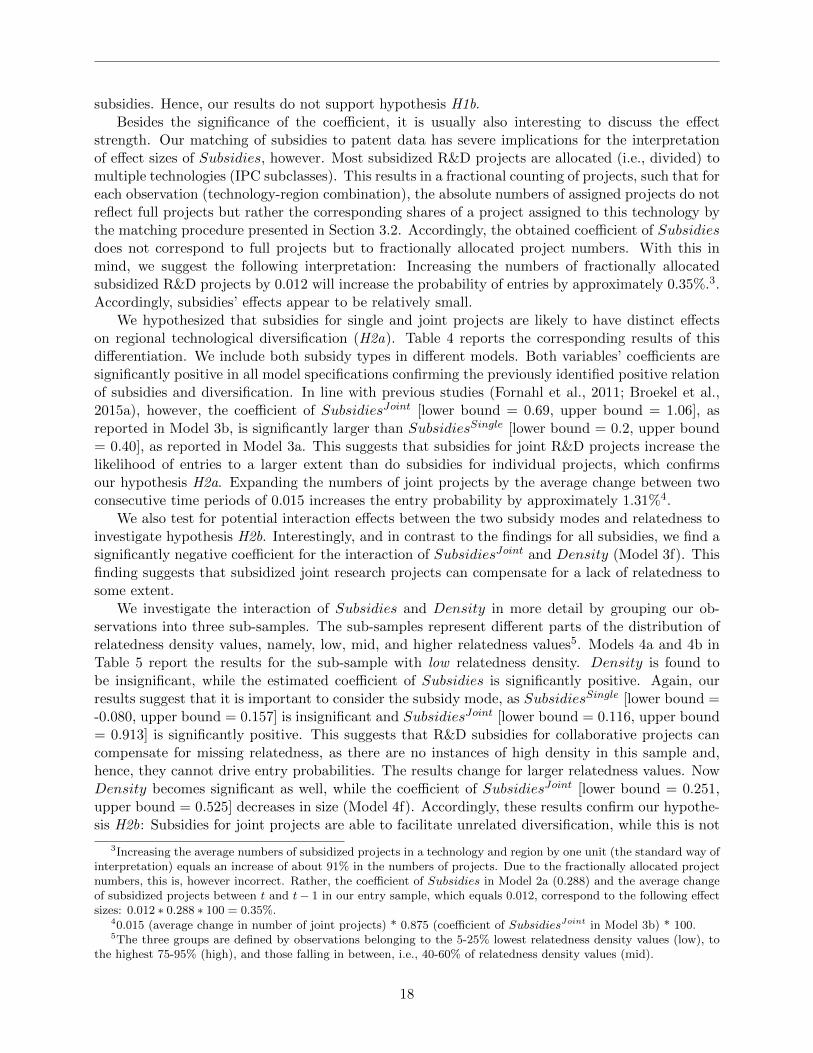
We start with the exploration of R&D subsidies’ allocation. Panel A in figure 2 reveals the distri-bution of R&D subsidies across the 630 IPC subclasses between 2006 and 2010. The colors indicatethe eight main sections of the IPC. Panel A shows that subsidies are not widely scattered acrossall main sections but rather concentrate in specific domains. A large portion of subsidies flows intotechnologies belonging to physics, chemistry, electricity, and human necessities. In contrast, textiles,
1Regional GDP and regional employment could not be included with a time lag due to data availability.
11
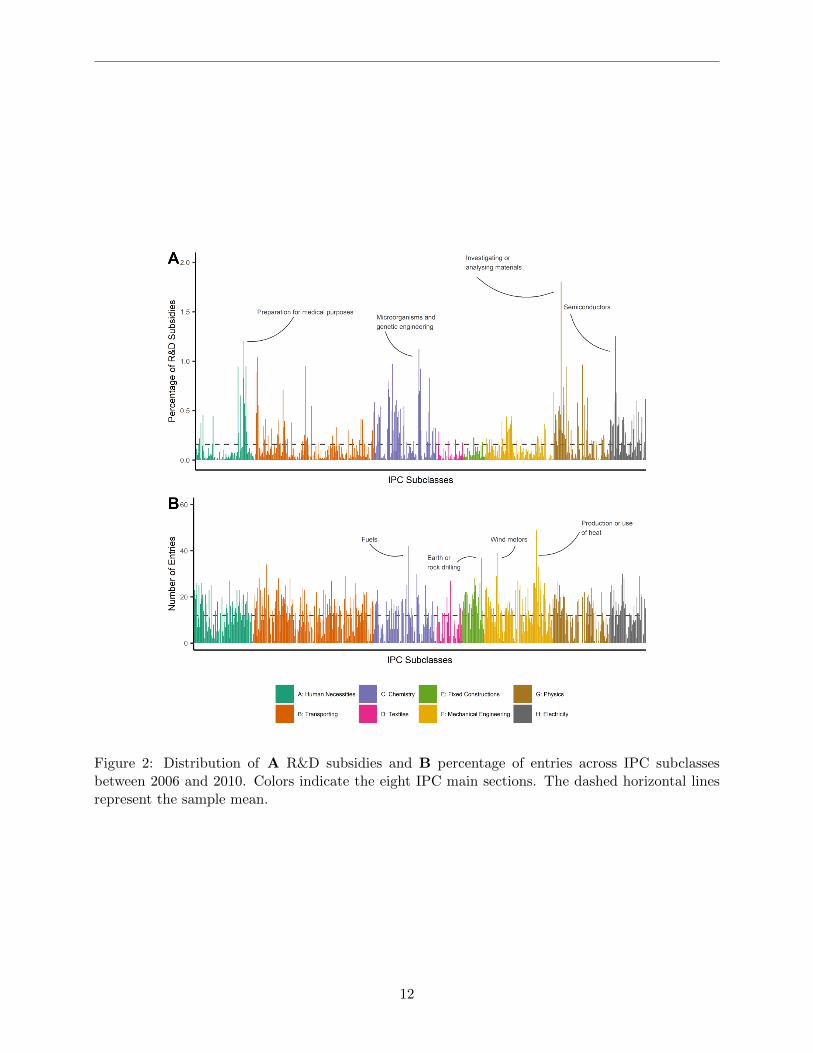
Figure 2: Distribution of A R&D subsidies and B percentage of entries across IPC subclassesbetween 2006 and 2010. Colors indicate the eight IPC main sections. The dashed horizontal linesrepresent the sample mean.
12
mechanical engineering, and construction technologies receive considerably less subsidies. IPC sub-classes, such as G01N (Investigating or Analysing Material), H01L (Semiconductors), A61K (Prepa-ration for Medical Purposes), and C12N (Microorganisms and Genetic engineering) are among themost strongly subsidized technologies.
Panel B of Figure 2 shows how frequently technologies emerge in regions. Larger entry num-bers indicate that many regions diversified into the according technologies. This reflects the spatialdiffusion of these technologies within Germany. Entry numbers vary considerably between technolo-gies, with each IPC subsection being characterized by low- and high-entry technologies. The visualinspection of Figure 2 reveals that subsidies are not necessarily allocated to technologies with thehighest numbers of entries. For example, technologies in mechanical engineering and fixed construc-tion show large numbers of entries and receive comparatively few subsidies. In other cases, thereseems to be some alignment. For instance, the top four technologies with the highest entry num-bers (F24J = Production of use of heat, C10L = Fuels, F03D = Wind motors, and E21B = Earthand rock drilling) represent technological fields related to renewable energy production or energyusage. Renewable energies have become very popular in Germany and are still strongly subsidizedto support the transition from fossil energy sources to renewables (Jacobsson and Lauber, 2006).This is also reflected in our data, as in this case, subsidization seems to correspond to technologicalentry.
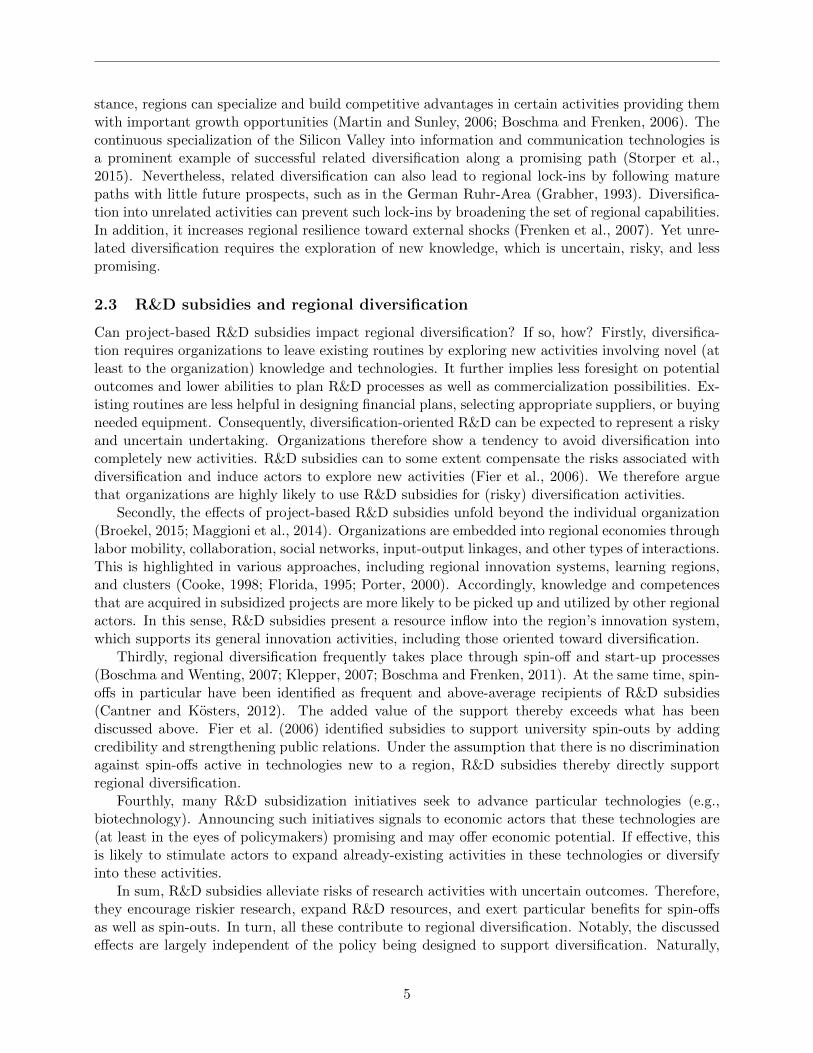
Another interesting aspect to look at is the relationship between subsidy allocation and related-ness density. Figure 3 visualizes relatedness density differentiated by subsidized and non-subsidizedprojects over all four time periods (panel A to D). It is striking that relatedness density substantiallydiffers between subsidized and non-subsidized technologies. Subsidized technologies are on averagecharacterized by higher relatedness densities than the non-subsidized ones. Notably, this differencehas grown over time. This suggests that R&D policy is increasingly subsidizing related technologiesin regions.
We expand the visual inspection of the relationship between subsidy allocation and relatednessdensity with a linear panel regression. Subsidies (and its disaggregation into SubsidiesSingle andSubsidiesJoint ) serves as the dependent variable and Density as the main explanatory variable.Fixed effects and additional control variables capture potential confounders. Table 2 reports theresults. They clearly support the previous visual interpretation. Technologies in regions are morelikely to receive R&D subsidies when they are related to existing regional capabilities.
In sum, the results for the allocation of subsidies in Germany suggest that contemporary project-based R&D subsidization has a tendency to support path-dependent, related diversification in re-gions.
4.2 The relationship between R&D subsidies and technological diversificationin regions
The link between R&D subsidies and technological diversification in regions is at the center of thepresent paper. Figure 4 maps entry rates2(panel A), the average relatedness density (panel B),the spatial allocation of R&D subsidies (panel C), and the number of patents (panel D) across the141 German regions. The maps highlight a number of interesting spatial patterns. Firstly, entryrates tend to be larger in regions with higher patenting activities. For example, South Germany,with Munich and Stuttgart as innovative regions, is characterized by particularly high entry rates.Similar patterns are also observed for the West of Germany with Cologne and North Germany withHamburg and Hanover as centers of innovation and technological entries. Nevertheless, some regions
2Entry rates correspond to the number of realized entries divided by the number of potential entries.
13
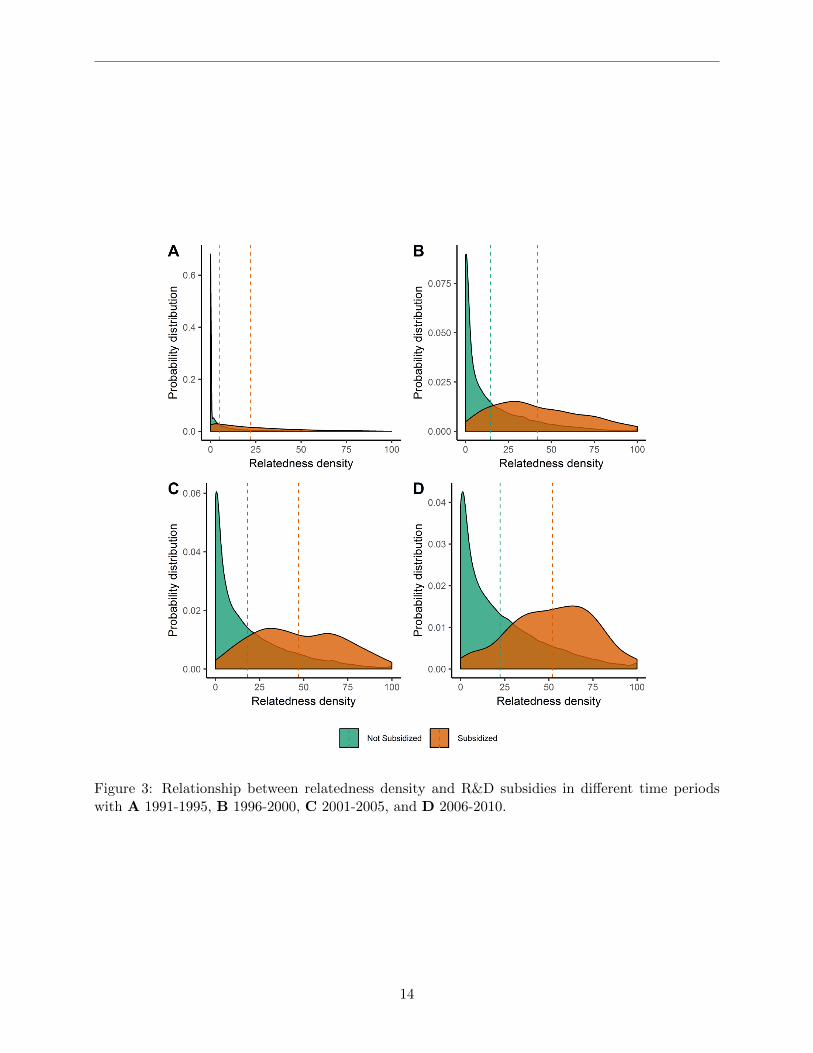
Figure 3: Relationship between relatedness density and R&D subsidies in different time periodswith A 1991-1995, B 1996-2000, C 2001-2005, and D 2006-2010.
14
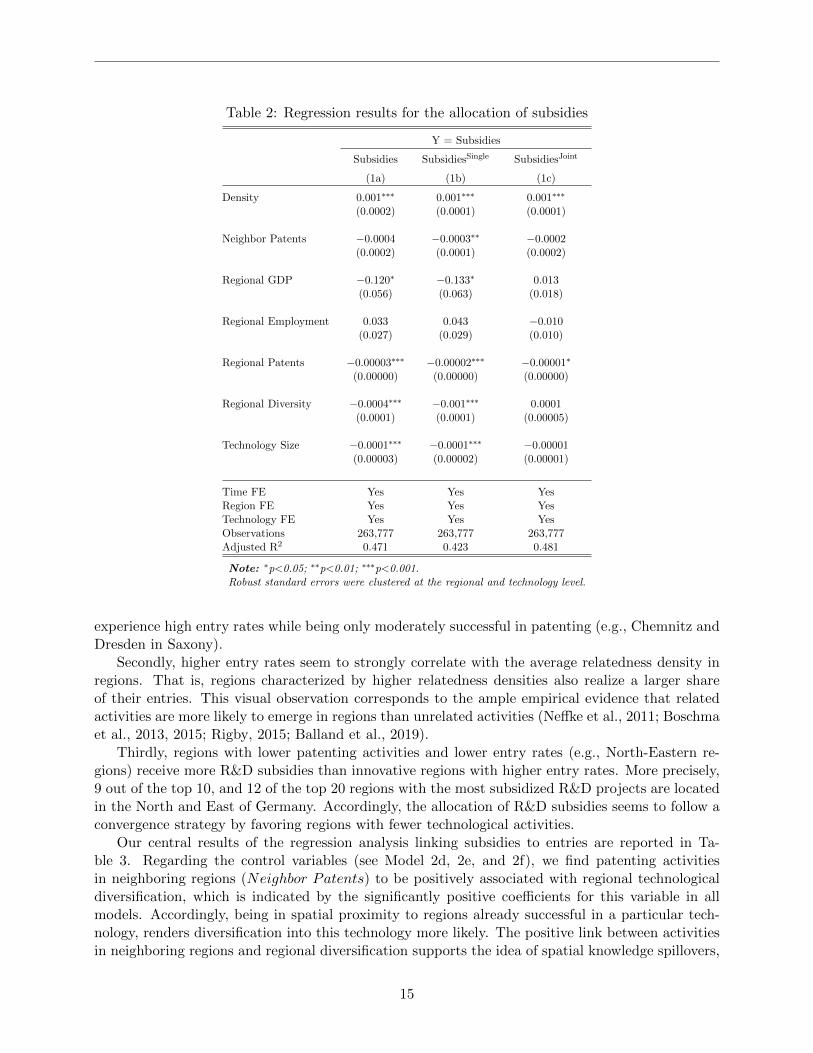
Table 2: Regression results for the allocation of subsidies
Y = Subsidies
Subsidies SubsidiesSingle SubsidiesJoint
(1a) (1b) (1c)
Density 0.001∗∗∗ 0.001∗∗∗ 0.001∗∗∗
(0.0002) (0.0001) (0.0001)
Neighbor Patents −0.0004 −0.0003∗∗ −0.0002(0.0002) (0.0001) (0.0002)
Regional GDP −0.120∗ −0.133∗ 0.013(0.056) (0.063) (0.018)
Regional Employment 0.033 0.043 −0.010(0.027) (0.029) (0.010)
Regional Patents −0.00003∗∗∗ −0.00002∗∗∗ −0.00001∗
(0.00000) (0.00000) (0.00000)
Regional Diversity −0.0004∗∗∗ −0.001∗∗∗ 0.0001(0.0001) (0.0001) (0.00005)
Technology Size −0.0001∗∗∗ −0.0001∗∗∗ −0.00001(0.00003) (0.00002) (0.00001)
Time FE Yes Yes YesRegion FE Yes Yes YesTechnology FE Yes Yes YesObservations 263,777 263,777 263,777Adjusted R2 0.471 0.423 0.481
Note: ∗p<0.05; ∗∗p<0.01; ∗∗∗p<0.001.Robust standard errors were clustered at the regional and technology level.
experience high entry rates while being only moderately successful in patenting (e.g., Chemnitz andDresden in Saxony).
Secondly, higher entry rates seem to strongly correlate with the average relatedness density inregions. That is, regions characterized by higher relatedness densities also realize a larger shareof their entries. This visual observation corresponds to the ample empirical evidence that relatedactivities are more likely to emerge in regions than unrelated activities (Neffke et al., 2011; Boschmaet al., 2013, 2015; Rigby, 2015; Balland et al., 2019).
Thirdly, regions with lower patenting activities and lower entry rates (e.g., North-Eastern re-gions) receive more R&D subsidies than innovative regions with higher entry rates. More precisely,9 out of the top 10, and 12 of the top 20 regions with the most subsidized R&D projects are locatedin the North and East of Germany. Accordingly, the allocation of R&D subsidies seems to follow aconvergence strategy by favoring regions with fewer technological activities.
Our central results of the regression analysis linking subsidies to entries are reported in Ta-ble 3. Regarding the control variables (see Model 2d, 2e, and 2f), we find patenting activitiesin neighboring regions (Neighbor Patents) to be positively associated with regional technologicaldiversification, which is indicated by the significantly positive coefficients for this variable in allmodels. Accordingly, being in spatial proximity to regions already successful in a particular tech-nology, renders diversification into this technology more likely. The positive link between activitiesin neighboring regions and regional diversification supports the idea of spatial knowledge spillovers,
15
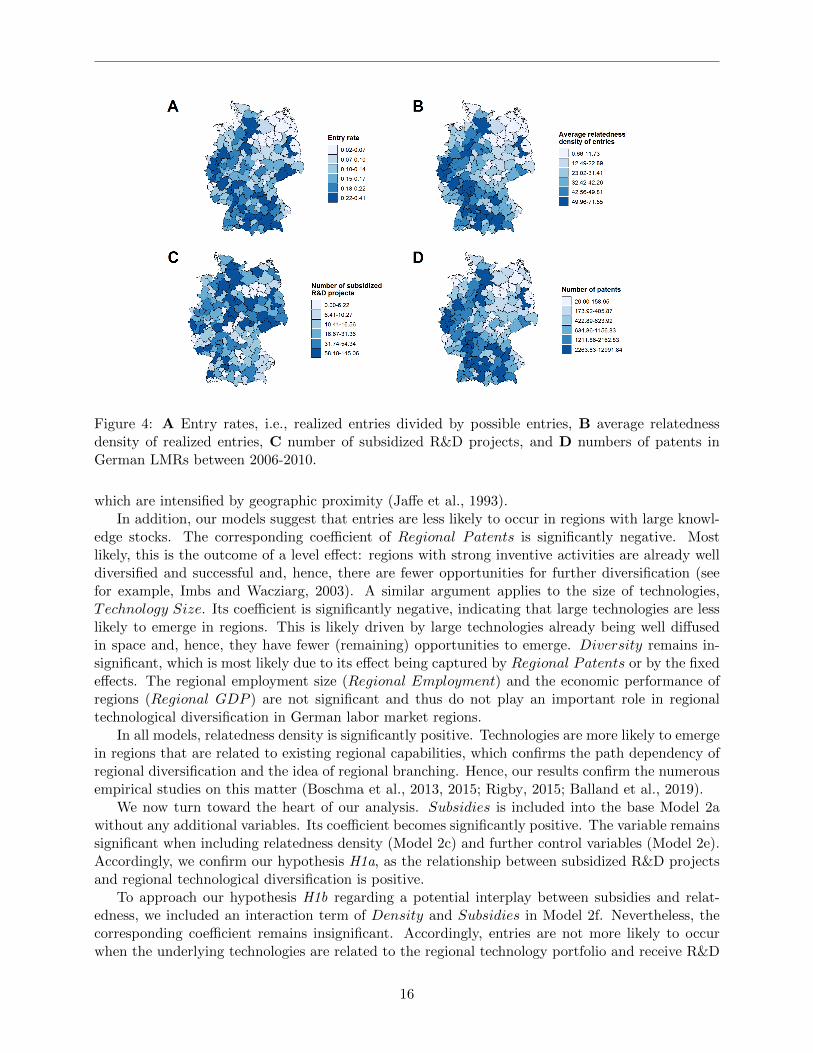
Figure 4: A Entry rates, i.e., realized entries divided by possible entries, B average relatednessdensity of realized entries, C number of subsidized R&D projects, and D numbers of patents inGerman LMRs between 2006-2010.
which are intensified by geographic proximity (Jaffe et al., 1993).In addition, our models suggest that entries are less likely to occur in regions with large knowl-
edge stocks. The corresponding coefficient of Regional Patents is significantly negative. Mostlikely, this is the outcome of a level effect: regions with strong inventive activities are already welldiversified and successful and, hence, there are fewer opportunities for further diversification (seefor example, Imbs and Wacziarg, 2003). A similar argument applies to the size of technologies,Technology Size. Its coefficient is significantly negative, indicating that large technologies are lesslikely to emerge in regions. This is likely driven by large technologies already being well diffusedin space and, hence, they have fewer (remaining) opportunities to emerge. Diversity remains in-significant, which is most likely due to its effect being captured by Regional Patents or by the fixedeffects. The regional employment size (Regional Employment) and the economic performance ofregions (Regional GDP ) are not significant and thus do not play an important role in regionaltechnological diversification in German labor market regions.
In all models, relatedness density is significantly positive. Technologies are more likely to emergein regions that are related to existing regional capabilities, which confirms the path dependency ofregional diversification and the idea of regional branching. Hence, our results confirm the numerousempirical studies on this matter (Boschma et al., 2013, 2015; Rigby, 2015; Balland et al., 2019).
We now turn toward the heart of our analysis. Subsidies is included into the base Model 2awithout any additional variables. Its coefficient becomes significantly positive. The variable remainssignificant when including relatedness density (Model 2c) and further control variables (Model 2e).Accordingly, we confirm our hypothesis H1a, as the relationship between subsidized R&D projectsand regional technological diversification is positive.
To approach our hypothesis H1b regarding a potential interplay between subsidies and relat-edness, we included an interaction term of Density and Subsidies in Model 2f. Nevertheless, thecorresponding coefficient remains insignificant. Accordingly, entries are not more likely to occurwhen the underlying technologies are related to the regional technology portfolio and receive R&D
16
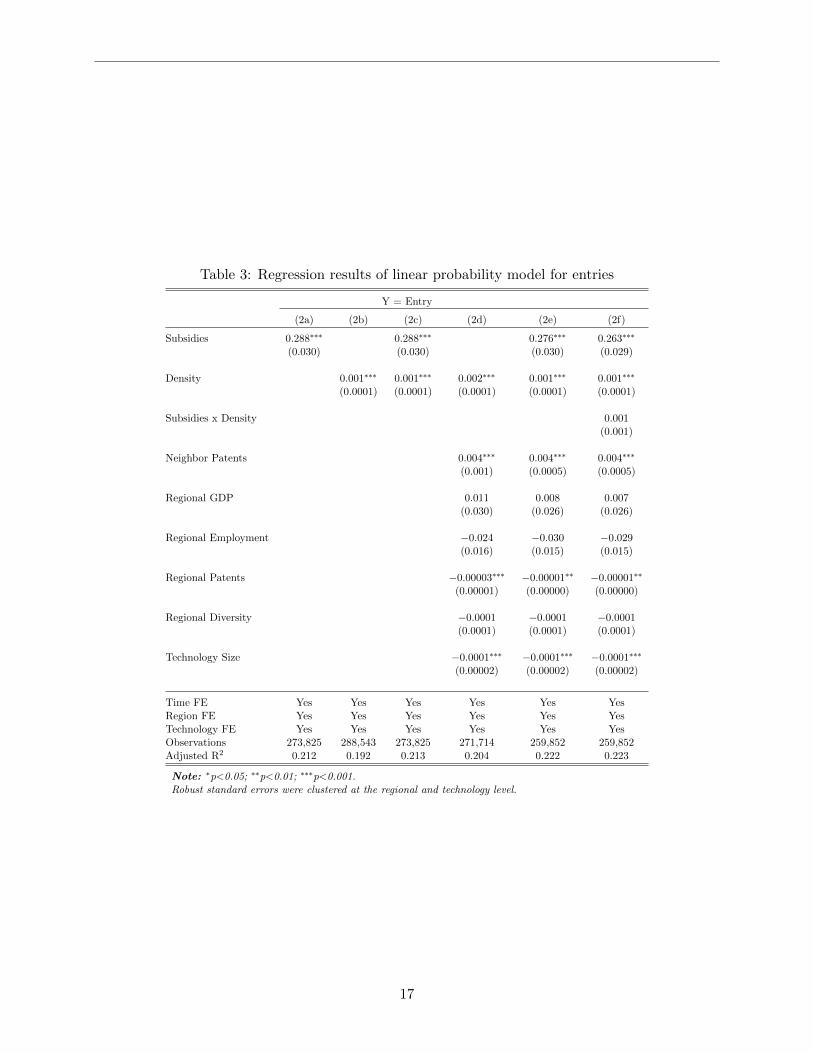
Table 3: Regression results of linear probability model for entries
Y = Entry
(2a) (2b) (2c) (2d) (2e) (2f)
Subsidies 0.288∗∗∗ 0.288∗∗∗ 0.276∗∗∗ 0.263∗∗∗
(0.030) (0.030) (0.030) (0.029)
Density 0.001∗∗∗ 0.001∗∗∗ 0.002∗∗∗ 0.001∗∗∗ 0.001∗∗∗
(0.0001) (0.0001) (0.0001) (0.0001) (0.0001)
Subsidies x Density 0.001(0.001)
Neighbor Patents 0.004∗∗∗ 0.004∗∗∗ 0.004∗∗∗
(0.001) (0.0005) (0.0005)
Regional GDP 0.011 0.008 0.007(0.030) (0.026) (0.026)
Regional Employment −0.024 −0.030 −0.029(0.016) (0.015) (0.015)
Regional Patents −0.00003∗∗∗ −0.00001∗∗ −0.00001∗∗
(0.00001) (0.00000) (0.00000)
Regional Diversity −0.0001 −0.0001 −0.0001(0.0001) (0.0001) (0.0001)
Technology Size −0.0001∗∗∗ −0.0001∗∗∗ −0.0001∗∗∗
(0.00002) (0.00002) (0.00002)
Time FE Yes Yes Yes Yes Yes YesRegion FE Yes Yes Yes Yes Yes YesTechnology FE Yes Yes Yes Yes Yes YesObservations 273,825 288,543 273,825 271,714 259,852 259,852Adjusted R2 0.212 0.192 0.213 0.204 0.222 0.223
Note: ∗p<0.05; ∗∗p<0.01; ∗∗∗p<0.001.Robust standard errors were clustered at the regional and technology level.
17
subsidies. Hence, our results do not support hypothesis H1b.Besides the significance of the coefficient, it is usually also interesting to discuss the effect
strength. Our matching of subsidies to patent data has severe implications for the interpretationof effect sizes of Subsidies, however. Most subsidized R&D projects are allocated (i.e., divided) tomultiple technologies (IPC subclasses). This results in a fractional counting of projects, such that foreach observation (technology-region combination), the absolute numbers of assigned projects do notreflect full projects but rather the corresponding shares of a project assigned to this technology bythe matching procedure presented in Section 3.2. Accordingly, the obtained coefficient of Subsidiesdoes not correspond to full projects but to fractionally allocated project numbers. With this inmind, we suggest the following interpretation: Increasing the numbers of fractionally allocatedsubsidized R&D projects by 0.012 will increase the probability of entries by approximately 0.35%.3.Accordingly, subsidies’ effects appear to be relatively small.
We hypothesized that subsidies for single and joint projects are likely to have distinct effectson regional technological diversification (H2a). Table 4 reports the corresponding results of thisdifferentiation. We include both subsidy types in different models. Both variables’ coefficients aresignificantly positive in all model specifications confirming the previously identified positive relationof subsidies and diversification. In line with previous studies (Fornahl et al., 2011; Broekel et al.,2015a), however, the coefficient of SubsidiesJoint [lower bound = 0.69, upper bound = 1.06], asreported in Model 3b, is significantly larger than SubsidiesSingle [lower bound = 0.2, upper bound= 0.40], as reported in Model 3a. This suggests that subsidies for joint R&D projects increase thelikelihood of entries to a larger extent than do subsidies for individual projects, which confirmsour hypothesis H2a. Expanding the numbers of joint projects by the average change between twoconsecutive time periods of 0.015 increases the entry probability by approximately 1.31%4.
We also test for potential interaction effects between the two subsidy modes and relatedness toinvestigate hypothesis H2b. Interestingly, and in contrast to the findings for all subsidies, we find asignificantly negative coefficient for the interaction of SubsidiesJoint and Density (Model 3f). Thisfinding suggests that subsidized joint research projects can compensate for a lack of relatedness tosome extent.
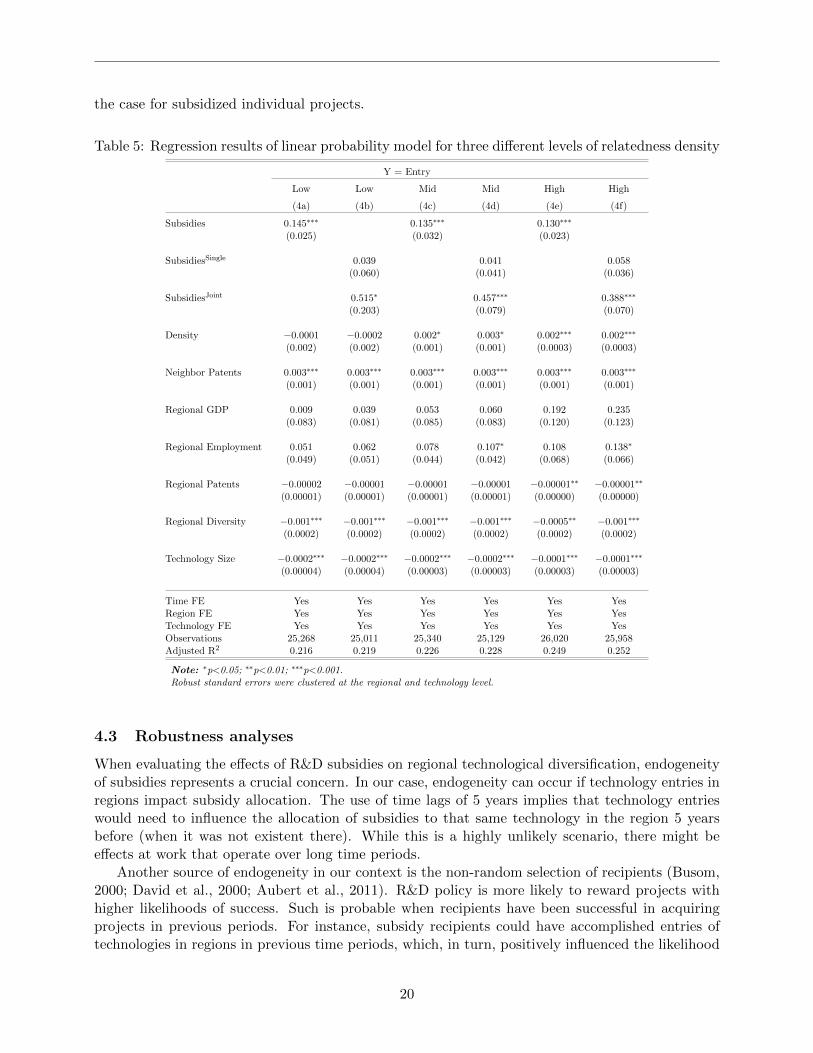
We investigate the interaction of Subsidies and Density in more detail by grouping our ob-servations into three sub-samples. The sub-samples represent different parts of the distribution ofrelatedness density values, namely, low, mid, and higher relatedness values5. Models 4a and 4b inTable 5 report the results for the sub-sample with low relatedness density. Density is found tobe insignificant, while the estimated coefficient of Subsidies is significantly positive. Again, ourresults suggest that it is important to consider the subsidy mode, as SubsidiesSingle [lower bound =-0.080, upper bound = 0.157] is insignificant and SubsidiesJoint [lower bound = 0.116, upper bound= 0.913] is significantly positive. This suggests that R&D subsidies for collaborative projects cancompensate for missing relatedness, as there are no instances of high density in this sample and,hence, they cannot drive entry probabilities. The results change for larger relatedness values. NowDensity becomes significant as well, while the coefficient of SubsidiesJoint [lower bound = 0.251,upper bound = 0.525] decreases in size (Model 4f). Accordingly, these results confirm our hypothe-sis H2b: Subsidies for joint projects are able to facilitate unrelated diversification, while this is not
3Increasing the average numbers of subsidized projects in a technology and region by one unit (the standard way ofinterpretation) equals an increase of about 91% in the numbers of projects. Due to the fractionally allocated projectnumbers, this is, however incorrect. Rather, the coefficient of Subsidies in Model 2a (0.288) and the average changeof subsidized projects between t and t− 1 in our entry sample, which equals 0.012, correspond to the following effectsizes: 0.012 ∗ 0.288 ∗ 100 = 0.35%.
40.015 (average change in number of joint projects) * 0.875 (coefficient of SubsidiesJoint in Model 3b) * 100.5The three groups are defined by observations belonging to the 5-25% lowest relatedness density values (low), to
the highest 75-95% (high), and those falling in between, i.e., 40-60% of relatedness density values (mid).
18
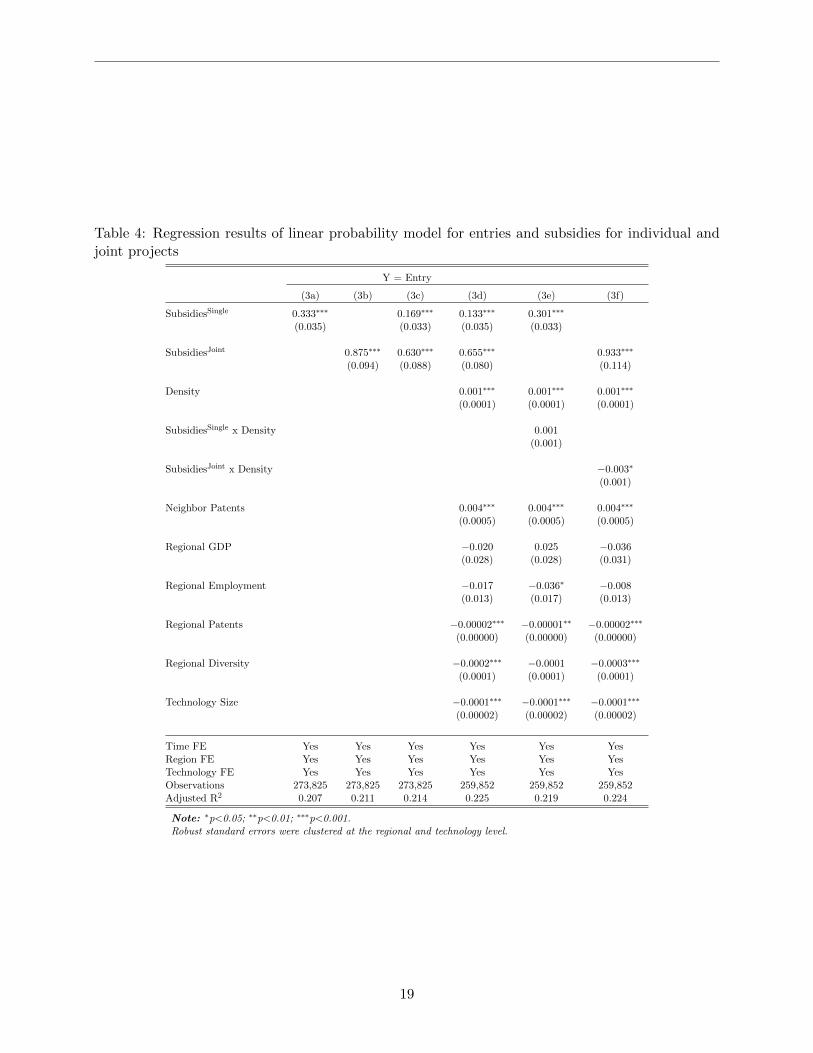
Table 4: Regression results of linear probability model for entries and subsidies for individual andjoint projects
Y = Entry
(3a) (3b) (3c) (3d) (3e) (3f)
SubsidiesSingle 0.333∗∗∗ 0.169∗∗∗ 0.133∗∗∗ 0.301∗∗∗
(0.035) (0.033) (0.035) (0.033)
SubsidiesJoint 0.875∗∗∗ 0.630∗∗∗ 0.655∗∗∗ 0.933∗∗∗
(0.094) (0.088) (0.080) (0.114)
Density 0.001∗∗∗ 0.001∗∗∗ 0.001∗∗∗
(0.0001) (0.0001) (0.0001)
SubsidiesSingle x Density 0.001(0.001)
SubsidiesJoint x Density −0.003∗
(0.001)
Neighbor Patents 0.004∗∗∗ 0.004∗∗∗ 0.004∗∗∗
(0.0005) (0.0005) (0.0005)
Regional GDP −0.020 0.025 −0.036(0.028) (0.028) (0.031)
Regional Employment −0.017 −0.036∗ −0.008(0.013) (0.017) (0.013)
Regional Patents −0.00002∗∗∗ −0.00001∗∗ −0.00002∗∗∗
(0.00000) (0.00000) (0.00000)
Regional Diversity −0.0002∗∗∗ −0.0001 −0.0003∗∗∗
(0.0001) (0.0001) (0.0001)
Technology Size −0.0001∗∗∗ −0.0001∗∗∗ −0.0001∗∗∗
(0.00002) (0.00002) (0.00002)
Time FE Yes Yes Yes Yes Yes YesRegion FE Yes Yes Yes Yes Yes YesTechnology FE Yes Yes Yes Yes Yes YesObservations 273,825 273,825 273,825 259,852 259,852 259,852Adjusted R2 0.207 0.211 0.214 0.225 0.219 0.224
Note: ∗p<0.05; ∗∗p<0.01; ∗∗∗p<0.001.Robust standard errors were clustered at the regional and technology level.
19
the case for subsidized individual projects.
Table 5: Regression results of linear probability model for three different levels of relatedness density
Y = Entry
Low Low Mid Mid High High
(4a) (4b) (4c) (4d) (4e) (4f)
Subsidies 0.145∗∗∗ 0.135∗∗∗ 0.130∗∗∗
(0.025) (0.032) (0.023)
SubsidiesSingle 0.039 0.041 0.058(0.060) (0.041) (0.036)
SubsidiesJoint 0.515∗ 0.457∗∗∗ 0.388∗∗∗
(0.203) (0.079) (0.070)
Density −0.0001 −0.0002 0.002∗ 0.003∗ 0.002∗∗∗ 0.002∗∗∗
(0.002) (0.002) (0.001) (0.001) (0.0003) (0.0003)
Neighbor Patents 0.003∗∗∗ 0.003∗∗∗ 0.003∗∗∗ 0.003∗∗∗ 0.003∗∗∗ 0.003∗∗∗
(0.001) (0.001) (0.001) (0.001) (0.001) (0.001)
Regional GDP 0.009 0.039 0.053 0.060 0.192 0.235(0.083) (0.081) (0.085) (0.083) (0.120) (0.123)
Regional Employment 0.051 0.062 0.078 0.107∗ 0.108 0.138∗
(0.049) (0.051) (0.044) (0.042) (0.068) (0.066)
Regional Patents −0.00002 −0.00001 −0.00001 −0.00001 −0.00001∗∗ −0.00001∗∗
(0.00001) (0.00001) (0.00001) (0.00001) (0.00000) (0.00000)
Regional Diversity −0.001∗∗∗ −0.001∗∗∗ −0.001∗∗∗ −0.001∗∗∗ −0.0005∗∗ −0.001∗∗∗
(0.0002) (0.0002) (0.0002) (0.0002) (0.0002) (0.0002)
Technology Size −0.0002∗∗∗ −0.0002∗∗∗ −0.0002∗∗∗ −0.0002∗∗∗ −0.0001∗∗∗ −0.0001∗∗∗
(0.00004) (0.00004) (0.00003) (0.00003) (0.00003) (0.00003)
Time FE Yes Yes Yes Yes Yes YesRegion FE Yes Yes Yes Yes Yes YesTechnology FE Yes Yes Yes Yes Yes YesObservations 25,268 25,011 25,340 25,129 26,020 25,958Adjusted R2 0.216 0.219 0.226 0.228 0.249 0.252
Note: ∗p<0.05; ∗∗p<0.01; ∗∗∗p<0.001.Robust standard errors were clustered at the regional and technology level.
4.3 Robustness analyses
When evaluating the effects of R&D subsidies on regional technological diversification, endogeneityof subsidies represents a crucial concern. In our case, endogeneity can occur if technology entries inregions impact subsidy allocation. The use of time lags of 5 years implies that technology entrieswould need to influence the allocation of subsidies to that same technology in the region 5 yearsbefore (when it was not existent there). While this is a highly unlikely scenario, there might beeffects at work that operate over long time periods.
Another source of endogeneity in our context is the non-random selection of recipients (Busom,2000; David et al., 2000; Aubert et al., 2011). R&D policy is more likely to reward projects withhigher likelihoods of success. Such is probable when recipients have been successful in acquiringprojects in previous periods. For instance, subsidy recipients could have accomplished entries oftechnologies in regions in previous time periods, which, in turn, positively influenced the likelihood
20
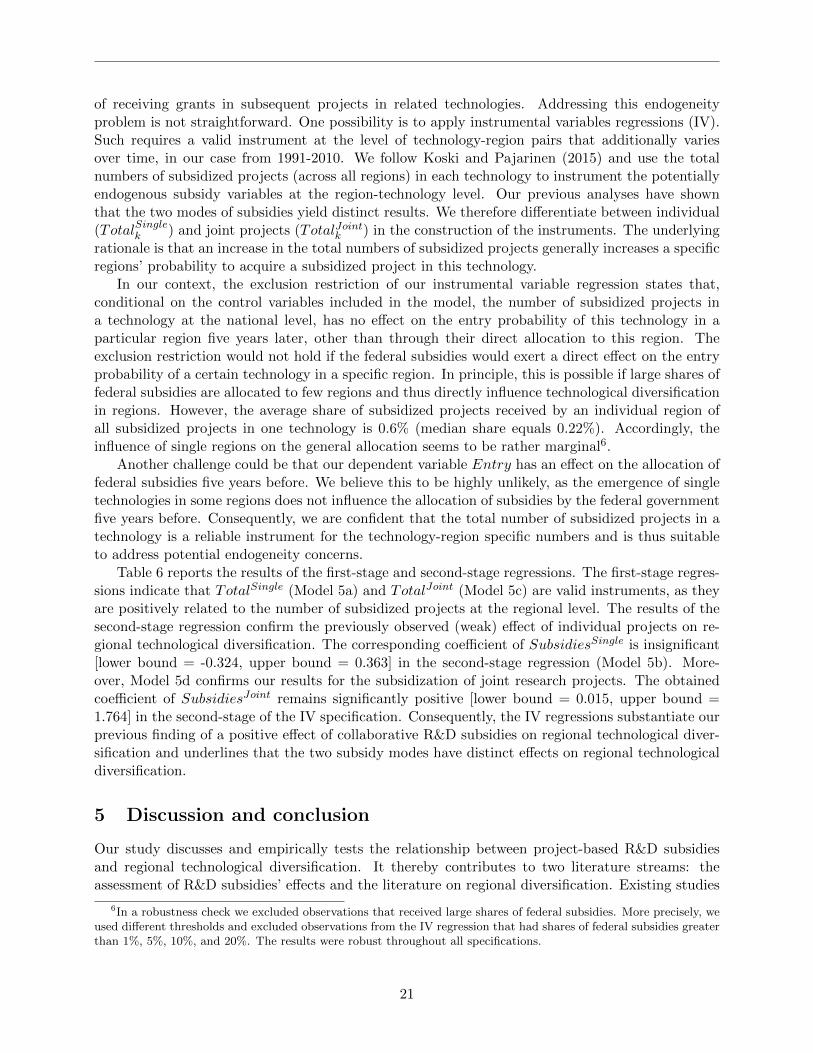
of receiving grants in subsequent projects in related technologies. Addressing this endogeneityproblem is not straightforward. One possibility is to apply instrumental variables regressions (IV).Such requires a valid instrument at the level of technology-region pairs that additionally variesover time, in our case from 1991-2010. We follow Koski and Pajarinen (2015) and use the totalnumbers of subsidized projects (across all regions) in each technology to instrument the potentiallyendogenous subsidy variables at the region-technology level. Our previous analyses have shownthat the two modes of subsidies yield distinct results. We therefore differentiate between individual(TotalSinglek ) and joint projects (TotalJointk ) in the construction of the instruments. The underlyingrationale is that an increase in the total numbers of subsidized projects generally increases a specificregions’ probability to acquire a subsidized project in this technology.
In our context, the exclusion restriction of our instrumental variable regression states that,conditional on the control variables included in the model, the number of subsidized projects ina technology at the national level, has no effect on the entry probability of this technology in aparticular region five years later, other than through their direct allocation to this region. Theexclusion restriction would not hold if the federal subsidies would exert a direct effect on the entryprobability of a certain technology in a specific region. In principle, this is possible if large shares offederal subsidies are allocated to few regions and thus directly influence technological diversificationin regions. However, the average share of subsidized projects received by an individual region ofall subsidized projects in one technology is 0.6% (median share equals 0.22%). Accordingly, theinfluence of single regions on the general allocation seems to be rather marginal6.
Another challenge could be that our dependent variable Entry has an effect on the allocation offederal subsidies five years before. We believe this to be highly unlikely, as the emergence of singletechnologies in some regions does not influence the allocation of subsidies by the federal governmentfive years before. Consequently, we are confident that the total number of subsidized projects in atechnology is a reliable instrument for the technology-region specific numbers and is thus suitableto address potential endogeneity concerns.
Table 6 reports the results of the first-stage and second-stage regressions. The first-stage regres-sions indicate that TotalSingle (Model 5a) and TotalJoint (Model 5c) are valid instruments, as theyare positively related to the number of subsidized projects at the regional level. The results of thesecond-stage regression confirm the previously observed (weak) effect of individual projects on re-gional technological diversification. The corresponding coefficient of SubsidiesSingle is insignificant[lower bound = -0.324, upper bound = 0.363] in the second-stage regression (Model 5b). More-over, Model 5d confirms our results for the subsidization of joint research projects. The obtainedcoefficient of SubsidiesJoint remains significantly positive [lower bound = 0.015, upper bound =1.764] in the second-stage of the IV specification. Consequently, the IV regressions substantiate ourprevious finding of a positive effect of collaborative R&D subsidies on regional technological diver-sification and underlines that the two subsidy modes have distinct effects on regional technologicaldiversification.
5 Discussion and conclusion
Our study discusses and empirically tests the relationship between project-based R&D subsidiesand regional technological diversification. It thereby contributes to two literature streams: theassessment of R&D subsidies’ effects and the literature on regional diversification. Existing studies
6In a robustness check we excluded observations that received large shares of federal subsidies. More precisely, weused different thresholds and excluded observations from the IV regression that had shares of federal subsidies greaterthan 1%, 5%, 10%, and 20%. The results were robust throughout all specifications.
21
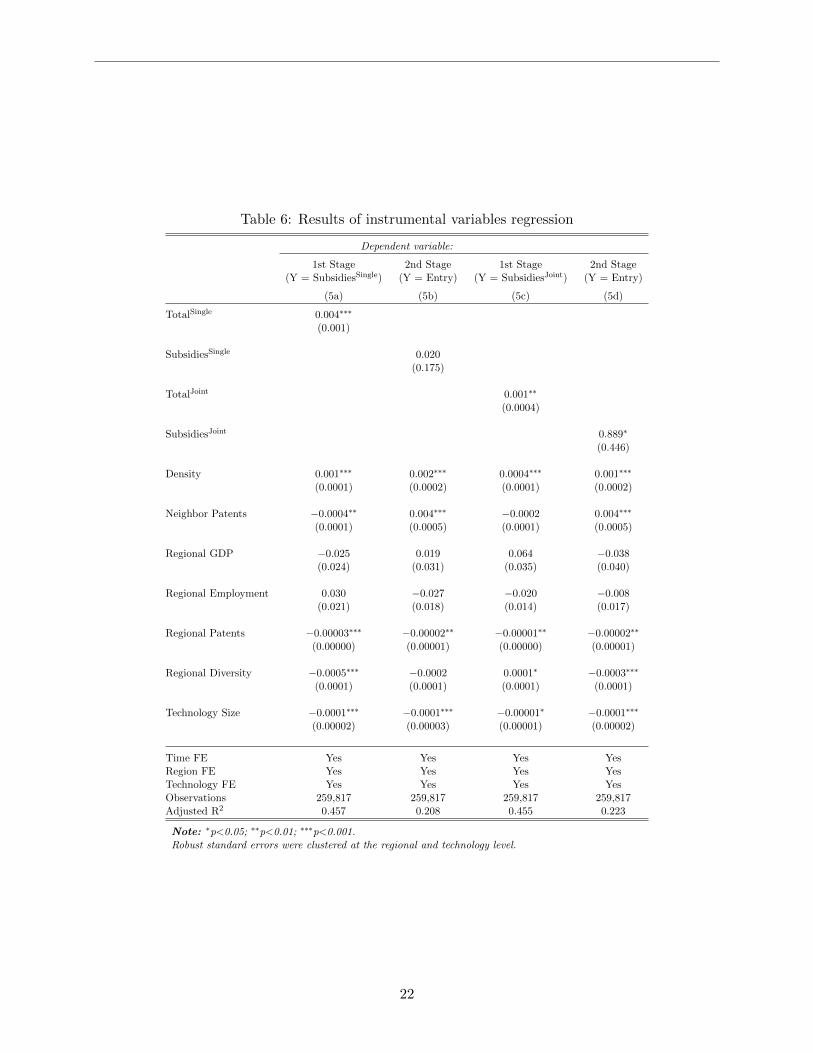
Table 6: Results of instrumental variables regression
Dependent variable:
1st Stage 2nd Stage 1st Stage 2nd Stage(Y = SubsidiesSingle) (Y = Entry) (Y = SubsidiesJoint) (Y = Entry)
(5a) (5b) (5c) (5d)
TotalSingle 0.004∗∗∗
(0.001)
SubsidiesSingle 0.020(0.175)
TotalJoint 0.001∗∗
(0.0004)
SubsidiesJoint 0.889∗
(0.446)
Density 0.001∗∗∗ 0.002∗∗∗ 0.0004∗∗∗ 0.001∗∗∗
(0.0001) (0.0002) (0.0001) (0.0002)
Neighbor Patents −0.0004∗∗ 0.004∗∗∗ −0.0002 0.004∗∗∗
(0.0001) (0.0005) (0.0001) (0.0005)
Regional GDP −0.025 0.019 0.064 −0.038(0.024) (0.031) (0.035) (0.040)
Regional Employment 0.030 −0.027 −0.020 −0.008(0.021) (0.018) (0.014) (0.017)
Regional Patents −0.00003∗∗∗ −0.00002∗∗ −0.00001∗∗ −0.00002∗∗
(0.00000) (0.00001) (0.00000) (0.00001)
Regional Diversity −0.0005∗∗∗ −0.0002 0.0001∗ −0.0003∗∗∗
(0.0001) (0.0001) (0.0001) (0.0001)
Technology Size −0.0001∗∗∗ −0.0001∗∗∗ −0.00001∗ −0.0001∗∗∗
(0.00002) (0.00003) (0.00001) (0.00002)
Time FE Yes Yes Yes YesRegion FE Yes Yes Yes YesTechnology FE Yes Yes Yes YesObservations 259,817 259,817 259,817 259,817Adjusted R2 0.457 0.208 0.455 0.223
Note: ∗p<0.05; ∗∗p<0.01; ∗∗∗p<0.001.Robust standard errors were clustered at the regional and technology level.
22
on the effects of R&D subsidies primarily focus on their general contribution to innovation activitiesand their potential stimulation of R&D efforts, efficiency, and outputs. In this study, we argue thatthey may also support technological diversification, despite not necessarily being intended to doso. Accordingly, R&D subsidies may induce additional (positive) effects that have not yet beenconsidered in existing evaluations. With respect to the literature on regional diversification, ourstudy adds a crucial perspective that remains underdeveloped. While (related) diversification isempirically well investigated (Hidalgo et al., 2007; Rigby, 2015; Boschma et al., 2015; Essletzbichler,2015), little attention has been paid to the role of R&D policy in this context. Although we are notevaluating contemporary R&D policies’ general support for regional diversification, our study drawsattention toward potential side effects of other, not directly diversification-related R&D policies.
We complement our arguments with an empirical study on the technological diversification ofGerman regions and project-based R&D subsidization of the federal government. Our empiricalresults for the allocation of these R&D subsidies show their allocation tends to be positively biasedtoward regions offering related competences. Accordingly, R&D policy seems to be part of the pathdependency in regional diversification, as it manifests related activities. This suggests a rather risk-averse allocation strategy. As related activities have greater chances of becoming successful thanother activities (Neffke et al., 2011; Boschma et al., 2015; Rigby, 2015), supporting such minimizesthe chances of failure (see discussions in Dohse (2000); Cantner and Kosters (2012); Aubert et al.(2011)). Most likely, it is the competitive character of the allocation process through which thisrisk aversion is implemented. When evaluating applications, applicants’ and applications’ qualityare relatively easy to assess and evaluate. Therefore, they are likely to be weighted more stronglythan less ”objective” aspects, such as novelty and future development potentials.
From the perspective of the literature on related variety (Frenken et al., 2007; Neffke et al.,2011) and the Smart Specialization strategy of the EU (Foray et al., 2011), our findings have tobe evaluated as evidence for a positive contribution of the R&D subsidization policy to regions’future growth and prosperity. By allocating subsidies to technologies related to regions’ existingportfolios, R&D subsidies support the emergence and growth of related variety. This has beenargued and empirically shown to stimulate regional (related) technological diversification, which, inturn, has been confirmed to matter for regions’ long-term economic growth (Frenken et al., 2007;Neffke et al., 2011; Kogler et al., 2013).
However, our study raises a crucial question rarely discussed in this context: Should policy, infact, try to (directly or indirectly) facilitate related diversification? Put differently, is related diver-sification truly troubled by market failures justifying policy intervention? The regional branchingmechanism suggests that related technologies are the most likely to emerge in regions (Boschmaand Frenken, 2010). In addition, one may argue that regional branching implies that diversificationis a path-dependent process that eventually leads to a thinning out of regional knowledge diversity.This in turn makes lock-in scenarios more likely, which are to be avoided due to their negativeimpact on growth and future developments.
In contrast, from a market-failure perspective, it can be argued that stimulating unrelated diver-sification should be the focus of R&D policy, to break the constraints of existing path dependencies.Supporting unrelated diversification policy increases regional knowledge diversity. Through a port-folio effect, diversity will render regions more resilient to external shocks, which is proposed as one ofthe main goals of innovation policy (Martin, 2012). In addition, regional technological diversity laysthe foundation for unexpected and uncommon knowledge recombination, which frequently formsthe basis for breakthrough inventions (Uzzi et al., 2013; Kim et al., 2016).
In accordance to this perspective, our empirical results do not hint at a multiplicative effect ofR&D subsidies and relatedness. In contrast, our findings suggest the existence of a substitutionalrelationship between relatedness and R&D subsidies at the regional level. Hence, R&D subsidies
23
contribute to regions diversifying into unrelated activities to some extent.In addition, our results reveal the importance of differentiating between subsidies for individual-
and joint-research projects (Broekel, 2015). Subsidies for joint R&D projects exert a much strongereffect on regional technological diversification than those for individual projects. The differencebecomes even more pronounced when applying instrumental variable regressions. In particular,subsidies for joint R&D projects are also able to compensate for missing relatedness to some extent.Similar is not observed for individual R&D subsidies. Most likely, it is their stimulation of interac-tions between new and heterogeneous actors from different regions facilitating inter-organizationallearning that explains their advantage in this context. This adds to existing research showing theirhigher effectiveness for stimulating innovation activities in general (Fornahl et al., 2011; Broekel,2015; Broekel et al., 2017). It also begs the question of why the majority of projects subsidized bythe German federal government do not yet involve inter-organizational collaboration (Broekel andGraf, 2012).
Our paper opens a number of avenues for future research. The scope of our study is limited totechnological diversification in regions, approximated by patent data. Although patent data havetheir justification and are often used in this context (Boschma et al., 2015; Rigby, 2015; Ballandet al., 2019), they also limit our analysis to technologies that can be patented. It is thereforeimportant to study the link between subsidies and other forms of diversification to improve ourunderstanding of policy impact on regional diversification. For instance, this concerns sectoraldiversification measured with information on the occupational composition in regions, representinga crucial next step for future research.
Additionally, R&D policy still lacks the appropriate tools to identify promising but underdevel-oped technologies and for evaluating the spatial context in which they (best) evolve. We believe thatour paper takes a step in that direction by showing that regional branching helps in understandingthe economic transformation of regions. Moreover, we provide an empirical set-up for evaluatingthe role of a specific policy tool (R&D subsidies) in this context.
24
References
Arrow, K. J. (1962). The Economic Implications of Learning by Doing. The Review of EconomicStudies, 29(3):155.
Aschhoff, B. (2008). Who Gets the Money? The Dynamics of R&D Project Subsidies in Germany.Technical Report 08-018, Centre for European Economic Research.
Aubert, C., Falck, O., and Heblich, S. (2011). Subsidizing National Champions: An EvolutionaryPerspective. In Gollier, C. and Woessmann, L., editors, Industrial Policy for National Champions,pages 63–88. The MIT Press.
Balland, P.-A., Boschma, R., Crespo, J., and Rigby, D. L. (2019). Smart specialization policy inthe European Union: relatedness, knowledge complexity and regional diversification. RegionalStudies, 53(9):1252–1268.
Blanes, J. V. and Busom, I. (2004). Who participates in R&D subsidy programs? Research Policy,33(10):1459–1476.
BMBF (2014). Bundesbericht Forschung und Innovation 2014. Technical report, Bundesministeriumfur Bildung und Forschung (BMBF).
Boschma, R., Balland, P.-A., and Kogler, D. F. (2015). Relatedness and technological change incities: the rise and fall of technological knowledge in US metropolitan areas from 1981 to 2010.Industrial and Corporate Change, 24(1):223–250.
Boschma, R. and Frenken, K. (2006). Why is economic geography not an evolutionary science?Towards an evolutionary economic geography. Journal of Economic Geography, 6(3):273–302.
Boschma, R. and Frenken, K. (2010). The Spatial Evolution of Innovation Networks: A ProximityPerspective. In Boschma, R. and Martin, R., editors, The Handbook of Evolutionary EconomicGeography. Edward Elgar Publishing, Cheltenham, UK ; Northampton, MA.
Boschma, R. and Frenken, K. (2011). Technological relatedness and regional branching. In Bathelt,H., Feldman, M. P., and Kogler, D. F., editors, Dynamic Geographies of Knowledge Creation,Diffusion and Innovation, pages 64–81. Routledge, New York.
Boschma, R. and Gianelle, C. (2014). Regional branching and smart specialisation policy. Luxem-bourg. Publications Office. OCLC: 1044411439.
Boschma, R., Minondo, A., and Navarro, M. (2013). The Emergence of New Industries at theRegional Level in Spain: A Proximity Approach Based on Product Relatedness. Economic Ge-ography, 89(1):29–51.
Boschma, R. and Wenting, R. (2007). The spatial evolution of the British automobile industry:Does location matter? Industrial and Corporate Change, 16(2):213–238.
Breschi, S., Lissoni, F., and Malerba, F. (2003). Knowledge-relatedness in firm technological diver-sification. Research Policy, 32(1):69–87.
Broekel, T. (2015). Do Cooperative Research and Development (R&D) Subsidies Stimulate RegionalInnovation Efficiency? Evidence from Germany. Regional Studies, 49(7):1087–1110.
25
Broekel, T., Brachert, M., Duschl, M., and Brenner, T. (2017). Joint R&D Subsidies, RelatedVariety, and Regional Innovation. International Regional Science Review, 40(3):297–326.
Broekel, T., Brenner, T., and Buerger, M. (2015a). An Investigation of the Relation betweenCooperation Intensity and the Innovative Success of German Regions. Spatial Economic Analysis,10(1):52–78.
Broekel, T., Fornahl, D., and Morrison, A. (2015b). Another cluster premium: Innovation subsidiesand R&D collaboration networks. Research Policy, 44(8):1431–1444.
Broekel, T. and Graf, H. (2012). Public research intensity and the structure of German R&D net-works: a comparison of 10 technologies. Economics of Innovation and New Technology, 21(4):345–372.
Broekel, T. and Mueller, W. (2018). Critical links in knowledge networks – What about proximitiesand gatekeeper organisations? Industry and Innovation, 25(10):919–939.
Busom, I. (2000). An Empirical Evaluation of The Effects of R&D Subsidies. Economics of Inno-vation and New Technology, 9(2):111–148.
Cantner, U. and Kosters, S. (2012). Picking the winner? Empirical evidence on the targeting ofR&D subsidies to start-ups. Small Business Economics, 39(4):921–936.
Cassiman, B. and Veugelers, R. (2002). R&D Cooperation and Spillovers: Some Empirical Evidencefrom Belgium. The American Economic Review, 92(4):1169–1184.
Coenen, L., Moodysson, J., and Martin, H. (2015). Path Renewal in Old Industrial Regions:Possibilities and Limitations for Regional Innovation Policy. Regional Studies, 49(5):850–865.
Cohen, W., Nelson, R., and Walsh, J. (2000). Protecting Their Intellectual Assets: Appropriabil-ity Conditions and Why U.S. Manufacturing Firms Patent (or Not). Technical Report w7552,National Bureau of Economic Research, Cambridge, MA.
Content, J. and Frenken, K. (2016). Related variety and economic development: a literature review.European Planning Studies, 24(12):2097–2112.
Cooke, P. (1998). Introduction: Origins of the Concept. In Braczyk, H.-J., Cooke, P., and Hei-denreich, M., editors, Regional Innovation Systems - The Role of Governances in a GlobalizedWorld, pages 2–25. UCL Press, London.
Cortinovis, N., Xiao, J., Boschma, R., and van Oort, F. G. (2017). Quality of government andsocial capital as drivers of regional diversification in Europe. Journal of Economic Geography,17(6):1179–1208.
Czarnitzki, D., Ebersberger, B., and Fier, A. (2007). The relationship between R&D collaboration,subsidies and R&D performance: Empirical evidence from Finland and Germany. Journal ofApplied Econometrics, 22(7):1347–1366.
Czarnitzki, D. and Hussinger, K. (2004). The Link Between R&D Subsidies, R&D Spending andTechnological Performance. Technical Report 04-56, Centre for European Economic Research.
Czarnitzki, D. and Hussinger, K. (2018). Input and output additionality of R&D subsidies. AppliedEconomics, 50(12):1324–1341.
26
Czarnitzki, D. and Lopes-Bento, C. (2013). Value for money? New microeconometric evidence onpublic R&D grants in Flanders. Research Policy, 42(1):76–89.
David, P. A., Hall, B. H., and Toole, A. A. (2000). Is public R&D a complement or substitute forprivate R&D? A review of the econometric evidence. Research Policy, 29(4-5):497–529.
Dohse, D. (2000). Technology policy and the regions — the case of the BioRegio contest. ResearchPolicy, 29(9):1111–1133.
Dosi, G. (1988). Sources, Procedures, and Microeconornic Effects of Innovation. Journal of Eco-nomic Literature, 26(3):1120–1171.
Ebersberger, B. and Lehtoranta, O. (2008). Effects of Public R&D Funding. Technical Report 100,VTT Technical Research Centre of Finland.
Engelsman, E. and van Raan, A. (1994). A patent-based cartography of technology. ResearchPolicy, 23(1):1–26.
Essletzbichler, J. (2015). Relatedness, Industrial Branching and Technological Cohesion in USMetropolitan Areas. Regional Studies, 49(5):752–766.
Fier, A., Aschhoff, B., and Lohlein, H. (2006). Behavioural additionality of public R&D funding inGermany. In OECD Government R&D Funding and Company Behaviour, Measuring BehaviouralAdditionality, pages 127–149.
Florida, R. (1995). Toward the learning region. Futures, 27(5):527–536.
Foray, D., David, P. A., and Hall, B. H. (2011). Smart specialization. From academic idea to politicalinstrument , the surprising career of a concept and the difficulties involved in its implementation.Technical Report 001, Management of Technology and Entrepreneurship Institute.
Fornahl, D., Broekel, T., and Boschma, R. (2011). What drives patent performance of Germanbiotech firms? The impact of R&D subsidies, knowledge networks and their location: Whatdrives patent performance of German biotech firms? Papers in Regional Science, 90(2):395–418.
Frenken, K., Van Oort, F., and Verburg, T. (2007). Related Variety, Unrelated Variety and RegionalEconomic Growth. Regional Studies, 41(5):685–697.
Grabher, G., editor (1993). The Embedded firm: on the socioeconomics of industrial networks.Routledge, London ; New York.
Griliches, Z. (1990). Patent Statistics as Economic Indicators: A Survey. Technical Report 3301,National Bureau of Economic Research, Cambridge, MA.
Hagedoorn, J. (1993). Understanding the rationale of strategic technology partnering: Nterorgani-zational modes of cooperation and sectoral differences. Strategic Management Journal, 14(5):371–385.
Hagedoorn, J. (2002). Inter-firm R&D partnerships: an overview of major trends and patterns since1960. Research Policy, 31(4):477–492.
Hausmann, R. and Rodrik, D. (2003). Economic development as self-discovery. Journal of Devel-opment Economics, 72(2):603–633.
27
Hidalgo, C. A., Balland, P.-A., Boschma, R., Delgado, M., Feldman, M. P., Frenken, K., Glaeser,E., He, C., Kogler, D. F., Morrison, A., Neffke, F., Rigby, D., Stern, S., Zheng, S., and Zhu, S.(2018). The Principle of Relatedness. In Morales, A. J., Gershenson, C., Braha, D., Minai, A. A.,and Bar-Yam, Y., editors, Unifying Themes in Complex Systems IX, pages 451–457. SpringerInternational Publishing, Cham.
Hidalgo, C. A., Klinger, B., Barabasi, A.-L., and Hausmann, R. (2007). The Product Space Con-ditions the Development of Nations. Science, 317(5837):482–487.
Imbs, J. and Wacziarg, R. (2003). Stages of Diversification. American Economic Review, 93(1):63–86.
Jacobsson, S. and Lauber, V. (2006). The politics and policy of energy system transforma-tion—explaining the German diffusion of renewable energy technology. Energy Policy, 34(3):256–276.
Jaffe, A. B., Trajtenberg, M., and Henderson, R. (1993). Geographic Localization of KnowledgeSpillovers as Evidenced by Patent Citations. The Quarterly Journal of Economics, 108(3):577–598.
Kim, D., Cerigo, D. B., Jeong, H., and Youn, H. (2016). Technological novelty profile and invention’sfuture impact. EPJ Data Science, 5(1).
Klepper, S. (2007). Disagreements, Spinoffs, and the Evolution of Detroit as the Capital of the U.S.Automobile Industry. Management Science, 53(4):616–631.
Kogler, D. F., Rigby, D. L., and Tucker, I. (2013). Mapping Knowledge Space and TechnologicalRelatedness in US Cities. European Planning Studies, 21(9):1374–1391.
Kosfeld, R. and Werner, A. (2012). Deutsche Arbeitsmarktregionen – Neuabgrenzung nach denKreisgebietsreformen 2007–2011. Raumforschung und Raumordnung, 70(1):49–64.
Koski, H. and Pajarinen, M. (2015). Subsidies, the Shadow of Death and Labor Productivity.Journal of Industry, Competition and Trade, 15(2):189–204.
Maggioni, M. A., Uberti, T. E., and Nosvelli, M. (2014). Does intentional mean hierarchical?Knowledge flows and innovative performance of European regions. The Annals of Regional Sci-ence, 53(2):453–485.
Martin, R. (2012). Regional economic resilience, hysteresis and recessionary shocks. Journal ofEconomic Geography, 12(1):1–32.
Martin, R. and Sunley, P. (2006). Path dependence and regional economic evolution. Journal ofEconomic Geography, 6(4):395–437.
McCann, P. and Ortega-Argiles, R. (2013). Modern regional innovation policy. Cambridge Journalof Regions, Economy and Society, 6(2):187–216.
Neffke, F., Henning, M., and Boschma, R. (2011). How Do Regions Diversify over Time? Indus-try Relatedness and the Development of New Growth Paths in Regions. Economic Geography,87(3):237–265.
Nelson, R. R. (1959). The Simple Economics of Basic Scientific Research. Journal of PoliticalEconomy, 67(3):297–306.
28
Nelson, R. R. and Winter, S. G. (1982). An evolutionary theory of economic change. The BelknapPress of Harvard Univ. Press, Cambridge, Mass. OCLC: 255191816.
Neyman, J. and Scott, E. L. (1948). Consistent Estimates Based on Partially Consistent Observa-tions. Econometrica, 16(1):1.
Petralia, S., Balland, P.-A., and Morrison, A. (2017). Climbing the ladder of technological develop-ment. Research Policy, 46(5):956–969.
Porter, M. E. (2000). Locations, clusters, and company strategy. In Clark, G. L., Feldman, M. P.,and Gertler, M. S., editors, The Oxford handbook of economic geography, pages 253–274. OxfordUniversity Press, Oxford.
Rigby, D. L. (2015). Technological Relatedness and Knowledge Space: Entry and Exit of US Citiesfrom Patent Classes. Regional Studies, 49(11):1922–1937.
Scherngell, T. and Barber, M. J. (2009). Spatial interaction modelling of cross-region R&D collabo-rations: empirical evidence from the 5th EU framework programme. Papers in Regional Science,88(3):531–546.
Storper, M., Kemeny, T., Makarem, N. P., and Osman, T. (2015). The rise and fall of urbaneconomies: lessons from San Francisco and Los Angeles. Innovation and technology in the worldeconomy. Stanford Business Books, Stanford, California. OCLC: 928689919.
Teece, D. J., Rumelt, R., Dosi, G., and Winter, S. (1994). Understanding corporate coherence.Journal of Economic Behavior & Organization, 23(1):1–30.
Topfer, S., Cantner, U., and Graf, H. (2017). Structural dynamics of innovation networks in GermanLeading-Edge Clusters. The Journal of Technology Transfer.
Uzzi, B., Mukherjee, S., Stringer, M., and Jones, B. (2013). Atypical Combinations and ScientificImpact. Science, 342(6157):468–472.
van Oort, F., de Geus, S., and Dogaru, T. (2015). Related Variety and Regional Economic Growthin a Cross-Section of European Urban Regions. European Planning Studies, 23(6):1110–1127.
Wanzenbock, I., Scherngell, T., and Fischer, M. M. (2013). How do firm characteristics affectbehavioural additionalities of public R&D subsidies? Evidence for the Austrian transport sector.Technovation, 33(2-3):66–77.
Zuniga-Vicente, J. A., Alonso-Borrego, C., Forcadell, F. J., and Galan, J. I. (2014). Assessing theEffect of Public Subsidies on Firm R&D Investment: A Survey. Journal of Economic Surveys,28(1):36–67.
29
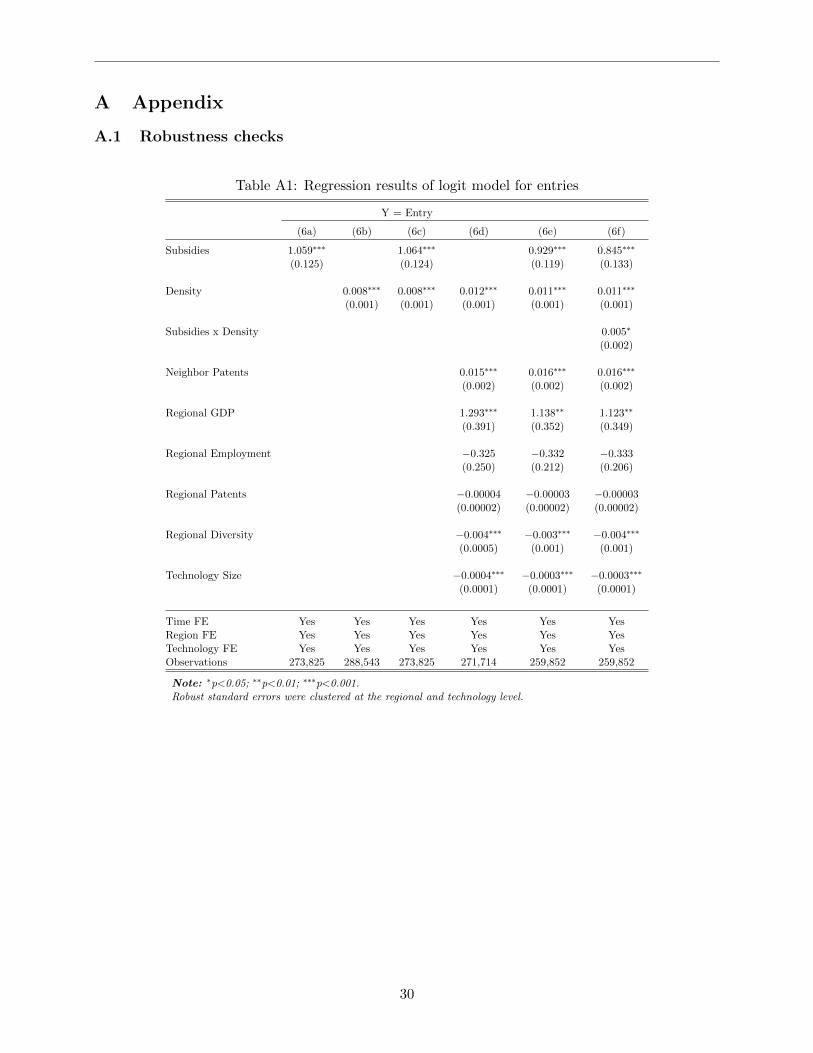
A Appendix
A.1 Robustness checks
Table A1: Regression results of logit model for entries
Y = Entry
(6a) (6b) (6c) (6d) (6e) (6f)
Subsidies 1.059∗∗∗ 1.064∗∗∗ 0.929∗∗∗ 0.845∗∗∗
(0.125) (0.124) (0.119) (0.133)
Density 0.008∗∗∗ 0.008∗∗∗ 0.012∗∗∗ 0.011∗∗∗ 0.011∗∗∗
(0.001) (0.001) (0.001) (0.001) (0.001)
Subsidies x Density 0.005∗
(0.002)
Neighbor Patents 0.015∗∗∗ 0.016∗∗∗ 0.016∗∗∗
(0.002) (0.002) (0.002)
Regional GDP 1.293∗∗∗ 1.138∗∗ 1.123∗∗
(0.391) (0.352) (0.349)
Regional Employment −0.325 −0.332 −0.333(0.250) (0.212) (0.206)
Regional Patents −0.00004 −0.00003 −0.00003(0.00002) (0.00002) (0.00002)
Regional Diversity −0.004∗∗∗ −0.003∗∗∗ −0.004∗∗∗
(0.0005) (0.001) (0.001)
Technology Size −0.0004∗∗∗ −0.0003∗∗∗ −0.0003∗∗∗
(0.0001) (0.0001) (0.0001)
Time FE Yes Yes Yes Yes Yes YesRegion FE Yes Yes Yes Yes Yes YesTechnology FE Yes Yes Yes Yes Yes YesObservations 273,825 288,543 273,825 271,714 259,852 259,852
Note: ∗p<0.05; ∗∗p<0.01; ∗∗∗p<0.001.Robust standard errors were clustered at the regional and technology level.
30
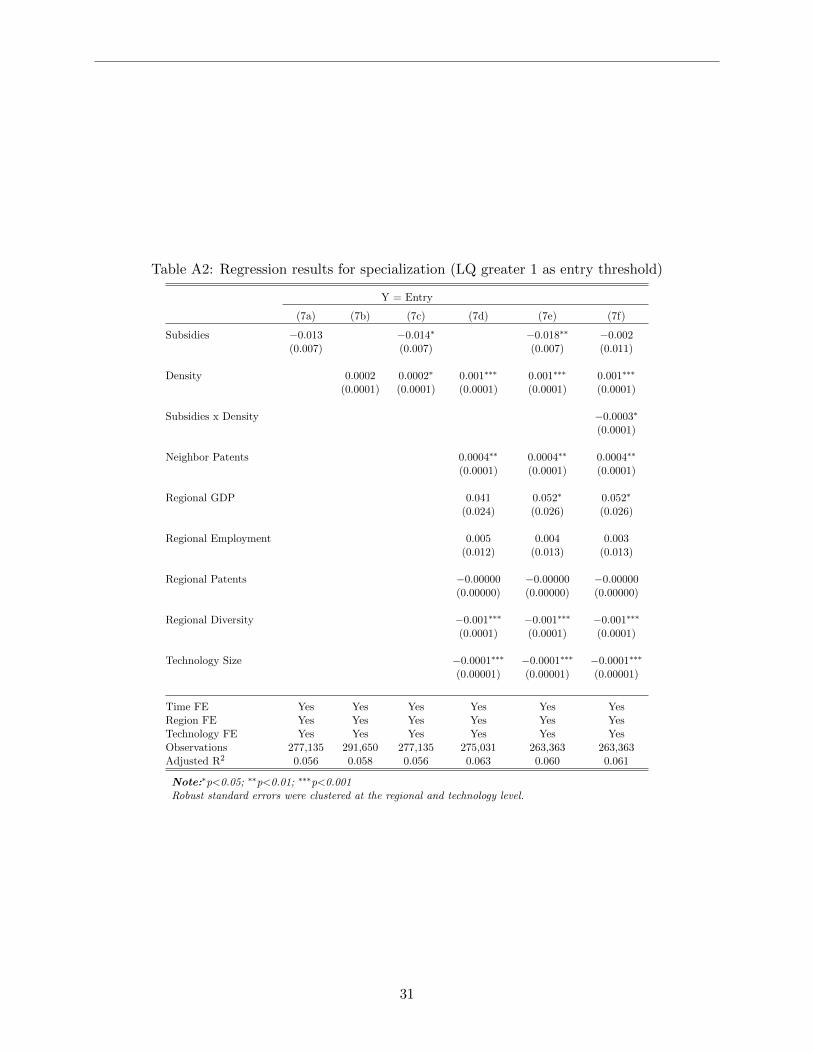
Table A2: Regression results for specialization (LQ greater 1 as entry threshold)
Y = Entry
(7a) (7b) (7c) (7d) (7e) (7f)
Subsidies −0.013 −0.014∗ −0.018∗∗ −0.002(0.007) (0.007) (0.007) (0.011)
Density 0.0002 0.0002∗ 0.001∗∗∗ 0.001∗∗∗ 0.001∗∗∗
(0.0001) (0.0001) (0.0001) (0.0001) (0.0001)
Subsidies x Density −0.0003∗
(0.0001)
Neighbor Patents 0.0004∗∗ 0.0004∗∗ 0.0004∗∗
(0.0001) (0.0001) (0.0001)
Regional GDP 0.041 0.052∗ 0.052∗
(0.024) (0.026) (0.026)
Regional Employment 0.005 0.004 0.003(0.012) (0.013) (0.013)
Regional Patents −0.00000 −0.00000 −0.00000(0.00000) (0.00000) (0.00000)
Regional Diversity −0.001∗∗∗ −0.001∗∗∗ −0.001∗∗∗
(0.0001) (0.0001) (0.0001)
Technology Size −0.0001∗∗∗ −0.0001∗∗∗ −0.0001∗∗∗
(0.00001) (0.00001) (0.00001)
Time FE Yes Yes Yes Yes Yes YesRegion FE Yes Yes Yes Yes Yes YesTechnology FE Yes Yes Yes Yes Yes YesObservations 277,135 291,650 277,135 275,031 263,363 263,363Adjusted R2 0.056 0.058 0.056 0.063 0.060 0.061
Note:∗p<0.05; ∗∗p<0.01; ∗∗∗p<0.001Robust standard errors were clustered at the regional and technology level.
31