Embed Size (px)
Citation preview
186
American Economic Journal: Applied Economics 3 (October 2011): 186–214http://www.aeaweb.org/articles.php?doi=10.1257/app.3.4.186
Recent research on agricultural performance in developing countries has impor-tant implications for policies of subsidized provision of agricultural inputs,
such as seeds and fertilizers and their effects on productivity and farmer incomes (Andrew Foster and Mark Rosenzweig 1996, 2010; Timothy G. Conley and Christopher R. Udry 2010; Esther Duflo, Michael Kremer, and Jonathan Robinson 2010). Much of this literature has focused on incentives of farmers to adopt new technologies and the diffusion of such technologies via processes of individual and social learning. These papers examine econometric evidence for underutilization of new technologies and underlying causes, such as lack of knowledge among farmers concerning effectiveness of new seed varieties, free riding on information generated by adoption efforts of neighbors, credit constraints, and self-control problems. All of these factors constitute sources of market failure that can provide possible rationales
* Bardhan: Department of Economics, University of California, Berkeley, CA 94720 (e-mail: [email protected]); Mookherjee: Department of Economics, Boston University, 270 Bay State Road, Boston, MA 02215 (e-mail: [email protected]). Research support was provided by the MacArthur Foundation Inequality Network and National Science Foundation Grant No. SES-0418434. Monica Parra Torrado, Neha Kumar, and Michael Luca provided outstanding research assistance. We thank officials of the West Bengal government who granted access to the data. We also thank Sankar Bhaumik, Sukanta Bhattacharya, Bhaswar Moitra, and Biswajeet Chatterjee for leading different data collection teams, and Indrajit Mallick and Sandip Mitra who helped us collect other relevant data. We are especially grateful to Asim Dasgupta for his encouragement, help, and advice. For useful discussions and comments, we thank the referees, Debu Bandyopadhyay, Abhijit Banerjee, Eli Berman, Sam Bowles, James Boyce, Maitreesh Ghatak, Bhaswar Moitra, Sandip Mitra, T. N. Srinivasan, MacArthur Foundation Inequality Network members, and seminar participants at Brown University, the University of California-San Diego, Monash University, Stanford University, Tufts University, and the World Bank. The data can be downloaded from http://dvn.iq.harvard.edu/dvn/dv/macarthur/faces/study/StudyPage.xhtml?globalId=hdl:1902.1/15603.
† To comment on this article in the online discussion forum, or to view additional materials, visit the article page at http://www.aeaweb.org/articles.php?doi=10.1257/app.3.4.186.
Subsidized Farm Input Programs and Agricultural Performance: A Farm-Level Analysis of West Bengal’s
Green Revolution, 1982–1995†
By Pranab Bardhan and Dilip Mookherjee*
We examine the role of delivery of subsidized seeds and fertilizers in the form of agricultural minikits by local governments in three successive farm panels in West Bengal spanning 1982–1995. These programs significantly raised farm value added per acre, account-ing for almost two-thirds of the observed growth. The estimates are robust to possible endogeneity of program placement, controls for farm and year effects, other programs of agricultural development, local weather, and price shocks. The effects of the kits delivery pro-gram overshadowed the effects of other rural development programs, including the tenancy registration program Operation Barga. (JEL O13, Q12, Q16, Q18)
ContentsSubsidized Farm Input Programs and Agricultural Performance: A Farm-Level Analysis of West Bengal’s Green Revolution, 1982–1995† 186
I. Background and Data 189A. Farm Service Delivery Programs 190B. Land Reform Programs 191C. Data 192D. Descriptive Statistics 194II. Regression Specification 198III. OLS Estimates 201IV. Controlling for Endogeneity of Program Implementation 202V. Effects of Operation Barga 204VI. Cropping Patterns and Distributional Impacts 210VII. Conclusion 213References 213
VOL. 3 NO. 4 187BArdhAN ANd MOOkhErJEE: FArM iNpuT prOgrAMs iN WEsT BENgAL
for government programs of subsidized delivery of seeds and fertilizers. This gives rise to the need for empirical evidence concerning effectiveness of such programs in raising agricultural productivity.
This paper provides empirical estimates of the effectiveness of subsidized farm input programs, based on the experience of the Indian state of West Bengal dur-ing the last two decades of the twentieth century, when it witnessed rapid growth in foodgrains production and yields. This period, sometimes referred to as West Bengal’s Green Revolution, transformed its status from one of the lowest perform-ing states in India in the 1970s to the best performing in succeeding decades. The annual rate of growth in foodgrains production rose from 1.7 percent in the 1970s to 3.4 percent in the 1980s and 4.6 percent in the early 1990s (Georges K. Lieten 1992; Anamitra Saha and Madhura Swaminathan 1994; Sunil Sengupta and Haris Gazdar 1996). This transformation was characterized by the rising production of rice, increased cropping intensities, and rapid diffusion of high-yielding rice vari-eties. It was also accompanied by the growth of rural wages and a marked drop in head-count measures of poverty. During this period local government offices of the agriculture department of the West Bengal state government delivered subsidized agricultural minikits to farmers containing mainly seeds (rice, potato, oilseeds, and other vegetables), some fertilizers, and insecticides. Other rural development programs included a land redistribution and a tenancy registration program that protected sharecroppers from eviction and regulated their cropshares, creation of village roads and irrigation facilities that employed local workers, and provision of subsidized credit to poor and low-caste households to enable them to invest in income earning assets.
Using a series of three successive farm panels covering the period between 1982–1995, we examine the role of the minikit program in generating farm pro-ductivity growth in West Bengal during these years, while controlling for the other programs being simultaneously implemented. Specifically, we estimate the effects of the provision of minikits at the village level in any given year on productivity in randomly chosen individual farms in the same village in subsequent years. This can be interpreted as the reduced-form impact on average farm productivity in the vil-lage, which incorporates diffusion and spillover from treated farms to other farms in the village. It avoids the econometric challenges in identifying incentives and patterns of learning at the micro level (e.g., see Foster and Rosenzweig (2010) for a lucid discussion), at the cost of not learning the precise channels through which the programs may have operated. We control for fixed farmer characteristics, year dummies, as well as village-level time-varying variables, such as rainfall, price of rice, and various complementary rural development policies pursued by state and local governments.
Our OLS double difference estimate of the effect of distributing one kit per household in a village is a 42–49 percent increase in value added per acre of a representative farm in that village in subsequent years, statistically significant at 1 percent. This estimate turns out to be robust to potential endogeneity of program placement, thus addressing concerns that program placements may have responded to unobserved time-varying shocks in the village that raised demands among farm-ers for such input subsidy programs and independently raised farm productivity at
188 AMEricAN EcONOMic JOurNAL: AppLiEd EcONOMics OcTOBEr 2011
the same time. We instrument program placement in any given village by district, state, and national level determinants of the scale of the program at the state level, and political economy determinants of its allocation across jurisdictions.1
Of the various agricultural development programs in West Bengal, we focus on the minikit program partly because our results show it to be the most effective, and we are able to check the robustness of the estimates to possible endogeneity of pro-gram placement. But it is important to highlight that it was one of a whole package of programs. The OLS estimates show that many other programs were also effective to a lesser degree.
In particular, we examine in some detail the effect of the tenancy registration program called Operation Barga, whose role in raising rice yields in West Bengal over a similar period has been studied by Abhijit V. Banerjee, Paul J. Gertler, and Maitreesh Ghatak (2002). Our analysis differs from the latter study by focusing on effects on productivity at the farm level (rather than at the district level) by using different measures of productivity (value added per acre, rather than rice yields) and program intensity (proportion of cultivable land in the village covered by the pro-gram, rather than proportion of sharecroppers in the village registered). In addition, we control for other rural development programs being implemented at the same time, and examine robustness with respect to possible endogeneity of the imple-mentation rate of Operation Barga. For the latter purpose, we use an instrument set which includes external determinants of political competition in local government (gram panchayat (gp)) elections interacted with lagged incumbency patterns (fol-lowing the political economy analysis of West Bengal’s land reforms in our earlier work, Bardhan and Mookherjee 2010). For reasons explained in further detail in the paper, the instruments affected minikit delivery and Operation Barga in different ways, generating sufficient independent fluctuations in placement of the two pro-grams to enable us to identify their respective effects.
We obtain a statistically significant OLS estimate of the impact of Operation Barga on farm productivity, with a 1 percent increase in area covered by the program generating an increase in value added per acre for a representative farm in the vil-lage in subsequent years by 0.4 percent. However, the IV estimate of the effect of Operation Barga turns out to be approximately half the OLS estimate, and fails to be statistically significant, unlike the estimates of the minikits program. Besides, the scale of Operation Barga in terms of cultivable area registered was small, generating a predicted impact on farm productivity that was substantially smaller than that of the minikits program.
We thereafter examine cropping pattern and intra-village distributional effects of the minikit and tenancy registration programs. The land reforms increased effects
1 The rationale for this identification strategy is the following. The scale of the program at the level of the state as a whole fluctuated from year to year, reflecting resources available to the department of agriculture at the state level. The minikits were subsequently allocated across different districts by state-level bureaucrats, and filtered down to district and block offices of the state agriculture department, eventually allocated across and within villages in any given block as a result of discussions between local village governments (gram panchayats (GPs)) and block-level agriculture officials. This was an inherently political process, affected by the inclination of state-level politicians at higher levels of government to allocate the program across districts and blocks. We interact measures of lagged political competition and incumbency at the local level with scales of various programs at the state level to predict yearly flows of input provision to different villages.
VOL. 3 NO. 4 189BArdhAN ANd MOOkhErJEE: FArM iNpuT prOgrAMs iN WEsT BENgAL
on cropping patterns and adoption of high-yielding rice varieties, while the minikit program had no discernible effect on either of these. We find no evidence of any adverse distributional effect of the minikit program. It did not affect marginal or small farms any differently than larger farms, nor did it affect the wage rate for hired workers, while it significantly raised employment of these workers. In contrast Operation Barga had no observable effect on marginal farms below 1.25 acres, pos-sibly because most tenant farms exceeded this size. Moreover, Operation Barga had no significant effect on wages and employment of hired workers in owner-cultivated farms, while reducing these in tenant farms by inducing substitution of hired by family labor.
Apart from minikits and tenancy registration, other programs with a significant effect on farm productivity included minor irrigation schemes of the local govern-ment and subsidized credit distribution through the IRDP program. This period wit-nessed substantial growth in private investment in shallow tubewells as well. The role of private and public investments in minor irrigation was examined in a previous paper (Bardhan, Mookherjee, and Neha Kumar 2009), which provided evidence of complementarities between the tenancy registration program and private investments.
Section I describes the setting of West Bengal agriculture and government poli-cies, the nature of the data, and some useful descriptive statistics. Section II explains the regression specification, followed by Section III which presents the basic set of OLS estimates. Section IV examines robustness of the OLS estimate of effec-tiveness of the minikit program to potential endogeneity concerns. Section V then examines the effects of Operation Barga. Section VI examines effects of the minikits and Operation Barga on cropping patterns and distribution of benefits within the vil-lage, while Section VII concludes.
I. Background and Data
West Bengal is a state in eastern India with a population exceeding 80 million, over two-thirds of which live in rural areas. Approximately half of the rural popula-tion owned cultivable land and were engaged in farming in the early 2000’s. The remaining population relied on employment in agricultural and nonagricultural labor markets. With regard to levels of per capita income or indices of human devel-opment, West Bengal ranks in the middle among Indian states. From the early 1950s until the mid-1960s the state government was dominated by a center-right party, the Indian National Congress. From 1966 until 1971 coalition governments formed, in which some left parties (including the Communist Party of India (Marxist) or CPM) played a part. This was followed by a period in the first half of the 1970s when the Congress returned to power in the state government. Throughout this period, poli-cies of rural development were administered by bureaucrats of various state govern-ment ministries.
In 1977, a Left Front coalition headed by the CPM won an absolute majority in the state government, and subsequently has managed to retain this majority until 2011. Soon upon assuming power, the Left Front government delegated delivery of development and welfare programs to a newly created three-tier system of directly elected local governments called panchayats, of which the gram panchayats (GPs)
190 AMEricAN EcONOMic JOurNAL: AppLiEd EcONOMics OcTOBEr 2011
form the bottom-most layer. A GP typically oversees a jurisdiction of 10–15 hamlets (mouzas), thus operating at the village level, while upper tiers correspond to block and district levels. During this period a number of rural development programs jointly sponsored by the national and state governments were initiated throughout India. The West Bengal GPs played an important role in lobbying higher level pan-chayats for resources under various development programs, and in selecting benefi-ciaries of these programs within their jurisdictions. They also participated actively in the implementation of land reform programs at the local level in collaboration with farmer organizations by identifying landowners and tenants within villages, appropriating land from those owning more than the legislated land ceilings and distributing corresponding land titles (pattas) to the poor, and registering tenants under Operation Barga. Further details of these rural development programs are described below.
A. Farm service delivery programs
Besides their role in implementing land reforms, the principal responsibilities entrusted to the panchayats included:
• Administration of the two principal poverty alleviation schemes: the Integrated Rural Development Program (IRDP), which gave subsidized credit to the poor; and employment programs such as Food for Work (FFW), National Rural Employment Program (NREP), Rural Labour Employment Guarantee Program (RLEGP) in the 1980s, which were merged into the Jawahar rozgar Yojana (JRY) from 1989 onward;
• Distribution of subsidized agricultural inputs in the form of minikits containing seeds, fertilizers and pesticides;
• Selection and construction of local infrastructure projects (including roads and irrigation); and
• Miscellaneous welfare schemes (old-age assistance, disaster relief, housing pro-grams for the poor, etc.).
The bulk of the resources for these programs were devolved to the local govern-ments under various schemes sponsored by the central and state government. The resources percolated down from the central government to GPs through the state government, its district-wide allocations, and then through the upper tiers of the panchayats at the block and district levels. Upper tiers of the panchayats selected their allocation across different GPs. The responsibility of the latter was either to allocate them across households and farms within their jurisdiction or to recom-mend beneficiaries to local implementing agencies, such as government banks and agriculture offices.
The agricultural minikits were disbursed at throwaway prices to beneficiaries selected by the local government by the agriculture office in the relevant block (the tier of local government intermediate between the village and district). Table 2 shows that approximately one out of every seven households in the early 1980s received kits in any given year, a rate that progressively fell to approximately half
VOL. 3 NO. 4 191BArdhAN ANd MOOkhErJEE: FArM iNpuT prOgrAMs iN WEsT BENgAL
that amount in the late 1990s. Panel A in Table 3 describes the content of the kits: mainly rice seeds, followed by seeds for potato, oilseeds, vegetables, and lentils, as well as some fertilizers and insecticides.
Subsidized credit was provided by state-owned banks under the Integrated Rural Development Program (IRDP) from 1978 onward. The target groups were sched-uled castes and tribes, agricultural workers, artisans, marginal and small farmers owning less than five acres of land. Part of the loan consisted of a subsidy, which did not need to be repaid. The proportion of the loan constituting the subsidy was highest (50 percent) for scheduled castes and tribes, and lower (ranging from 25 to 33 percent) for others depending on how much land they owned. Panel B of Table 3 shows that the subsidy component for the IRDP loans amounted to approximately Rs 29 per household per year over the period 1978–1998, at 1993 prices. The major-ity of the recipients were landless workers who did not operate farms. Hence, the expected impact of the credit program on farm productivity is likely to be smaller compared with the minikit program.
Apart from selecting beneficiaries of the kit and IRDP program, GPs were responsible for building and maintaining local infrastucture, such as roads, medium irrigation, and school buildings under the aegis of the Jawahar Rozgar Program (JRY) or its predecessor programs FFW, NREP, and RLEGP. These programs pro-vided employment and a source of earnings for poor households (also selected by the GPs). The scale of these programs per village for selected years is indicated in Table 2.
A detailed discussion of these programs and their targeting is contained in an ear-lier paper (Bardhan and Mookherjee 2006). That paper showed that within villages these programs were targeted fairly well by GPs, though the inter-village allocations exhibited biases against villages with a high proportion of landless and low-caste groups.
B. Land reform programs
There were two principal land reform programs. The first represents appropria-tion of lands (a process known as vesting) above the legislated ceilings from large landowners, and subsequent distribution of this land to the landless in the form of titles to small land plots (called pattas). Most of the vesting had been carried out prior to 1978.2 According to the Left Front government’s own admission, it had been unable to markedly increase the extent of land vested over the amount available in 1978. Hence, its main initiative has been the distribution of vested land in the form of land titles. For the state as a whole, P. S. Appu (1996, Appendix IV3) estimates the extent of land distributed until 1992 at 6.72 percent of its operated area, against a national average of 1.34 percent.3 However, many of the distributed land titles pertained to very small plots. In our sample villages, the average plots distributed
2 We were able to get data on the time pattern of vesting in 34 of our sample villages, where we found 70 percent had been vested prior to 1978.
3 Only one other state (Jammu and Kashmir) achieved a higher percentage, with the vast majority of states distributing less than 1.5 percent of operated area.
192 AMEricAN EcONOMic JOurNAL: AppLiEd EcONOMics OcTOBEr 2011
were approximately half an acre in size. Since large landowners would be expected to select their least productive land to hand over to the land reform authorities, one would also expect the distributed plots to be of low quality.
The other land reform program was Operation Barga, involving registration of tenancy contracts. Upon assuming reins of the state government in 1977, the Left Front government amended the 1971 Land Reforms Act, which made sharecropping hereditary, rendered eviction by landlords a punishable offense, and shifted the onus of proof concerning identity of the actual tiller to the landlord. Subsequently they initiated a mass mobilization drive with the assistance of farmer unions (kisan sabha) and newly empowered local governments to identify sharecropping ten-ants and induce them to register their contracts with the local Land Records office. Registration was also accompanied by a floor on the share accruing to tenants, amounting to 75 percent (replaced by 50 percent if the landlord paid for all non-labor inputs). Over 1 million tenants were registered by 1981, up from 242,000 in 1978 (Lieten 1992, Table 5.1), increasing to almost 1.5 million by 1990. Lieten (1992) estimates, on the basis of different assumptions concerning the actual num-ber of sharecroppers in the state, that upward of 80 percent of all sharecroppers were registered in the state by the early 1990s. Banerjee, Gertler, and Ghatak (2002) estimate this proportion to be around 65 percent, while our estimate is about 48 per-cent. Nevertheless, the proportion of farmland and farmers that were registered was substantially smaller, owing to the relatively low incidence of tenancy during the period in question, as explained in more detail below.
C. data
Our study is based on data from cost of cultivation surveys carried out by the Department of Agriculture of the state government. These surveys were carried out for the purpose of estimating agricultural costs of principal crops in the state. These are aggregated at the state level and eventually sent to the Commission for Agricultural Costs and Prices at the central government in New Delhi, which uses this information to set procurement prices for agricultural commodities on a cost-plus basis.
A number of reasons make the data from these surveys especially reliable. First, the surveys are not used by the government to estimate agricultural production lev-els in the state. So they are not subject to reporting biases that have been argued to afflict published statistics of the state government used by most previous studies (including Timothy Besley and Robin Burgess 2000; and Banerjee, Gertler, and Ghatak 2002).4 Second, the surveys were based on a stratified random sample of farms in West Bengal, selecting blocks randomly within each district, then selecting
4 James K. Boyce (1987) and S. Datta Ray (1994) have raised considerable doubt about the reliability of agri-cultural output data of the West Bengal state government. They describe how the West Bengal state government has often shifted between agricultural statistics collected from sample surveys and crop cutting surveys initiated by P. C. Mahalanobis in the 1940s, and those based on subjective ‘eye estimates’ from the state Directorate of Agriculture. These concerns are aggravated by the frequent use of published statistics by the West Bengal state government to claim credit for their policies in generating a high rate of agricultural growth during the 1980s and the first half of the 1990s.
VOL. 3 NO. 4 193BArdhAN ANd MOOkhErJEE: FArM iNpuT prOgrAMs iN WEsT BENgAL
pairs of neighboring villages randomly within blocks, and finally selecting a ran-dom sample of eight farms in each village, stratifying by landholdings. Every five years the samples were redrawn and freshly chosen. Each selected farm was visited on a bi-weekly basis for five successive years. Trained investigators measured the principal outputs and inputs of farms on a weekly basis, and every year filed an assessment of costs on various items, following prescribed norms by the agriculture department. Prices of main inputs and outputs were also collected at the farm-year level. Self-provided inputs were imputed costs based on their market prices, with careful treatment of depreciation of fixed assets, such as farm equipment and pumps.
Unfortunately we were not able to locate all the detailed farm-level records, resulting in some gaps in coverage. Detailed farm records could be located for three successive five year panels, spanning 1982–1985, 1986–1990, and 1991–1995, respectively. Within each panel, data is available for eight farms in each village for between three to five years. A farm corresponds to an operational holding cultivated by a single household, with multiple plots and crops. The data is organized by crop for each farm in any given year, including revenues from products and by-products sold, and expenditures on various inputs. Prices and quantities are not always sepa-rately available.
We were not successful in getting access to the farm-level data for a number of villages in the sample, owing to the nature of the rotating panel design and dif-ferences in record keeping practices across various local offices of the Agriculture department responsible for conducting the cultivation surveys.5 This is especially true for the 1982–1985 panel, where data was available from only six districts.6 The data coverage for the post-1985 period is better, with 10 districts in the 1986–1990 panel and 12 in the 1991–1995 panel.7 Altogether 16 districts are represented in the sample, but only two districts are represented in all three panels. Hence, we shall present the descriptive statistics and decompositions for the three panels separately. The size of the sample also varies across the panels, with 20 villages represented in the first panel, 29 in the second panel, and 35 in the third panel. Altogether there are 550 farms represented for an average of 4 years each, generating data for approxi-mately 2,200 farm-years.
The farm data is complemented by village data collected from a variety of sources. We carried out household surveys in these villages, with a complete enumeration of land holdings, cultivation, caste, literacy, and occupation of all households in the village for two years: 1978 and 1998. Another dataset pertains to composition and activities of local governments, spanning the period 1978–2004. These include composition of elected GPs and details of infrastructure programs and yearly bud-gets of these GPs. We visited local land reform offices to obtain data on yearly land reform implementation (land titles distributed and tenants registered, including names of beneficiaries and cultivation areas involved). Visits to local lead banks and block development offices generated yearly data on distribution of IRDP credit and
5 Approximately 20 villages had to be dropped owing to missing farm-level records. These villages, however, did not vary significantly from included villages with respect to any of the program levels.
6 These were 24 Parganas (South), Coochbehar, Birbhum, Purulia, Bankura, and Jalpaiguri.7 The 1986–1990 sample did not cover Birbhum, Jalpaiguri, Malda, Medinipur, Hugli, and Bardhaman. The
1991–1996 sample left out Purulia, Bankura, and Jalpaiguri.
194 AMEricAN EcONOMic JOurNAL: AppLiEd EcONOMics OcTOBEr 2011
agricultural minikits in each village. GP records yielded yearly allocation of spend-ing and scale of various infrastructure projects. We also collected data on rainfall from local recording centers of the state Meteorological department, leading eco-nomic indicators at the district or regional level from published statistics of the state government (annual West Bengal Economic Review), and outcomes of elections to the state and national legislatures in each constituency spanning the sample areas (West Bengal Election Statistics).
D. descriptive statistics
Summary statistics concerning the villages in our sample are provided in Table 1. The sample includes 89 villages in 57 GP jurisdictions. Each GP consists of 10–20 elected members of a council governing administration of the jurisdiction of the GP, which usually consists of 8–15 villages or mouzas. On average, each district com-prises 20 blocks and 200 GPs.
Table 1 shows statistics pertaining to village demographics and land distributions at the beginning and end of the sample period, based on an indirect household sur-vey administered in each village in 1998.8 It also shows the extent of land reform
8 The latter involved selection of voter lists for 1978 and 1998, and interviews with four or five different senior citizens in each village to identify the land and demographic status of each household for those two years,
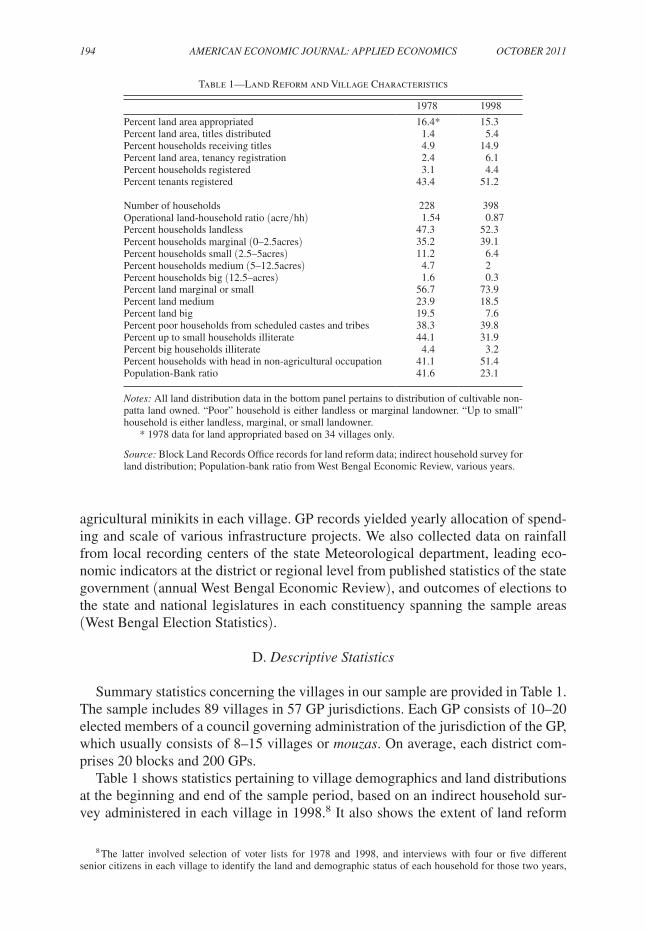
Table 1—Land Reform and Village Characteristics
1978 1998
Percent land area appropriated 16.4* 15.3Percent land area, titles distributed 1.4 5.4Percent households receiving titles 4.9 14.9Percent land area, tenancy registration 2.4 6.1Percent households registered 3.1 4.4Percent tenants registered 43.4 51.2
Number of households 228 398Operational land-household ratio (acre/hh) 1.54 0.87Percent households landless 47.3 52.3Percent households marginal (0–2.5acres) 35.2 39.1Percent households small (2.5–5acres) 11.2 6.4Percent households medium (5–12.5acres) 4.7 2Percent households big (12.5–acres) 1.6 0.3Percent land marginal or small 56.7 73.9Percent land medium 23.9 18.5Percent land big 19.5 7.6Percent poor households from scheduled castes and tribes 38.3 39.8Percent up to small households illiterate 44.1 31.9Percent big households illiterate 4.4 3.2Percent households with head in non-agricultural occupation 41.1 51.4Population-Bank ratio 41.6 23.1
Notes: All land distribution data in the bottom panel pertains to distribution of cultivable non-patta land owned. “Poor” household is either landless or marginal landowner. “Up to small” household is either landless, marginal, or small landowner.
* 1978 data for land appropriated based on 34 villages only.
source: Block Land Records Office records for land reform data; indirect household survey for land distribution; Population-bank ratio from West Bengal Economic Review, various years.
VOL. 3 NO. 4 195BArdhAN ANd MOOkhErJEE: FArM iNpuT prOgrAMs iN WEsT BENgAL
implemented in the sample villages, based on the official land records. The pro-portion of households registered under Operation Barga by 1998 was 4.4 percent. Aggregating the 2 programs, the land reforms affected about 8 percent of opera-tional land area and 11 percent of the households between 1978 and 1998.
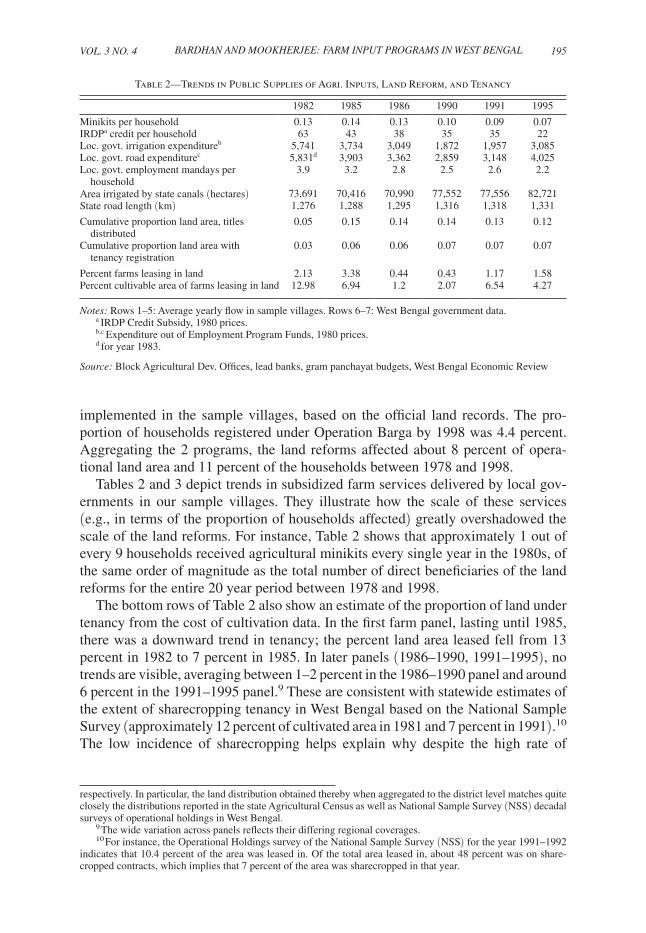
Tables 2 and 3 depict trends in subsidized farm services delivered by local gov-ernments in our sample villages. They illustrate how the scale of these services (e.g., in terms of the proportion of households affected) greatly overshadowed the scale of the land reforms. For instance, Table 2 shows that approximately 1 out of every 9 households received agricultural minikits every single year in the 1980s, of the same order of magnitude as the total number of direct beneficiaries of the land reforms for the entire 20 year period between 1978 and 1998.
The bottom rows of Table 2 also show an estimate of the proportion of land under tenancy from the cost of cultivation data. In the first farm panel, lasting until 1985, there was a downward trend in tenancy; the percent land area leased fell from 13 percent in 1982 to 7 percent in 1985. In later panels (1986–1990, 1991–1995), no trends are visible, averaging between 1–2 percent in the 1986–1990 panel and around 6 percent in the 1991–1995 panel.9 These are consistent with statewide estimates of the extent of sharecropping tenancy in West Bengal based on the National Sample Survey (approximately 12 percent of cultivated area in 1981 and 7 percent in 1991).10 The low incidence of sharecropping helps explain why despite the high rate of
respectively. In particular, the land distribution obtained thereby when aggregated to the district level matches quite closely the distributions reported in the state Agricultural Census as well as National Sample Survey (NSS) decadal surveys of operational holdings in West Bengal.
9 The wide variation across panels reflects their differing regional coverages.10 For instance, the Operational Holdings survey of the National Sample Survey (NSS) for the year 1991–1992
indicates that 10.4 percent of the area was leased in. Of the total area leased in, about 48 percent was on share-cropped contracts, which implies that 7 percent of the area was sharecropped in that year.
Table 2—Trends in Public Supplies of Agri. Inputs, Land Reform, and Tenancy
1982 1985 1986 1990 1991 1995
Minikits per household 0.13 0.14 0.13 0.10 0.09 0.07IRDPa credit per household 63 43 38 35 35 22Loc. govt. irrigation expenditureb 5,741 3,734 3,049 1,872 1,957 3,085Loc. govt. road expenditurec 5,831d 3,903 3,362 2,859 3,148 4,025Loc. govt. employment mandays per household
3.9 3.2 2.8 2.5 2.6 2.2
Area irrigated by state canals (hectares) 73,691 70,416 70,990 77,552 77,556 82,721State road length (km) 1,276 1,288 1,295 1,316 1,318 1,331
Cumulative proportion land area, titles distributed
0.05 0.15 0.14 0.14 0.13 0.12
Cumulative proportion land area with tenancy registration
0.03 0.06 0.06 0.07 0.07 0.07
Percent farms leasing in land 2.13 3.38 0.44 0.43 1.17 1.58Percent cultivable area of farms leasing in land 12.98 6.94 1.2 2.07 6.54 4.27
Notes: Rows 1–5: Average yearly flow in sample villages. Rows 6–7: West Bengal government data.a IRDP Credit Subsidy, 1980 prices.b,c Expenditure out of Employment Program Funds, 1980 prices. d for year 1983.
source: Block Agricultural Dev. Offices, lead banks, gram panchayat budgets, West Bengal Economic Review
196 AMEricAN EcONOMic JOurNAL: AppLiEd EcONOMics OcTOBEr 2011
registration of tenants (over 50 percent), the proportion of land area covered by the tenancy registration program was only of the order of 4 percent.
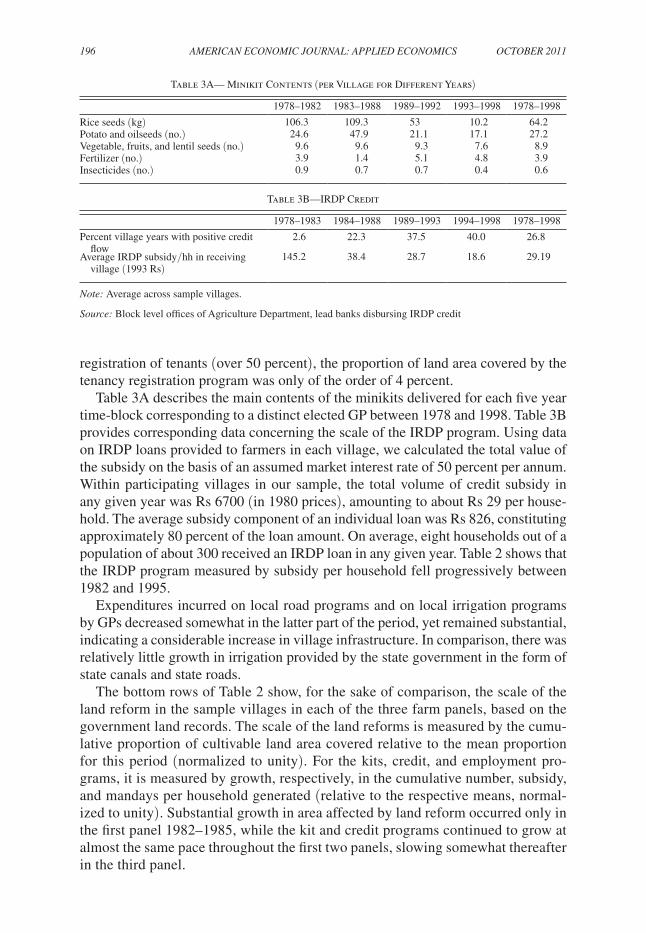
Table 3A describes the main contents of the minikits delivered for each five year time-block corresponding to a distinct elected GP between 1978 and 1998. Table 3B provides corresponding data concerning the scale of the IRDP program. Using data on IRDP loans provided to farmers in each village, we calculated the total value of the subsidy on the basis of an assumed market interest rate of 50 percent per annum. Within participating villages in our sample, the total volume of credit subsidy in any given year was Rs 6700 (in 1980 prices), amounting to about Rs 29 per house-hold. The average subsidy component of an individual loan was Rs 826, constituting approximately 80 percent of the loan amount. On average, eight households out of a population of about 300 received an IRDP loan in any given year. Table 2 shows that the IRDP program measured by subsidy per household fell progressively between 1982 and 1995.
Expenditures incurred on local road programs and on local irrigation programs by GPs decreased somewhat in the latter part of the period, yet remained substantial, indicating a considerable increase in village infrastructure. In comparison, there was relatively little growth in irrigation provided by the state government in the form of state canals and state roads.
The bottom rows of Table 2 show, for the sake of comparison, the scale of the land reform in the sample villages in each of the three farm panels, based on the government land records. The scale of the land reforms is measured by the cumu-lative proportion of cultivable land area covered relative to the mean proportion for this period (normalized to unity). For the kits, credit, and employment pro-grams, it is measured by growth, respectively, in the cumulative number, subsidy, and mandays per household generated (relative to the respective means, normal-ized to unity). Substantial growth in area affected by land reform occurred only in the first panel 1982–1985, while the kit and credit programs continued to grow at almost the same pace throughout the first two panels, slowing somewhat thereafter in the third panel.
Table 3A— Minikit Contents (per Village for Different Years)
1978–1982 1983–1988 1989–1992 1993–1998 1978–1998
Rice seeds (kg) 106.3 109.3 53 10.2 64.2Potato and oilseeds (no.) 24.6 47.9 21.1 17.1 27.2Vegetable, fruits, and lentil seeds (no.) 9.6 9.6 9.3 7.6 8.9Fertilizer (no.) 3.9 1.4 5.1 4.8 3.9Insecticides (no.) 0.9 0.7 0.7 0.4 0.6
Table 3B—IRDP Credit
1978–1983 1984–1988 1989–1993 1994–1998 1978–1998
Percent village years with positive credit flow
2.6 22.3 37.5 40.0 26.8
Average IRDP subsidy/hh in receiving village (1993 Rs)
145.2 38.4 28.7 18.6 29.19
Note: Average across sample villages.
source: Block level offices of Agriculture Department, lead banks disbursing IRDP credit
VOL. 3 NO. 4 197BArdhAN ANd MOOkhErJEE: FArM iNpuT prOgrAMs iN WEsT BENgAL
The separate contribution of the different programs can be estimated precisely only if they were not highly intercorrelated with one another. The partial correla-tions were low and statistically insignificant at the 10 percent level. For instance, a regression of the Barga implementation rate on the other programs yielded a coef-ficient of −0.145 with respect to the minikit program ( p-value of 0.25), −0.100 with respect to the credit program ( p-value of 0.32), and 0.065 with respect to the land title distribution program ( p-value of 0.27), after controlling for village fixed effects, year dummies, and other controls used in each regression. Interestingly, the sign of the partial correlation between the tenancy reform and the farm service programs was negative. It was not the case, therefore, that GPs implementing one of these intensively in a given year were doing the same with the other programs at the same time. This helps disentangle their respective contributions to year-to-year changes in farm productivity.
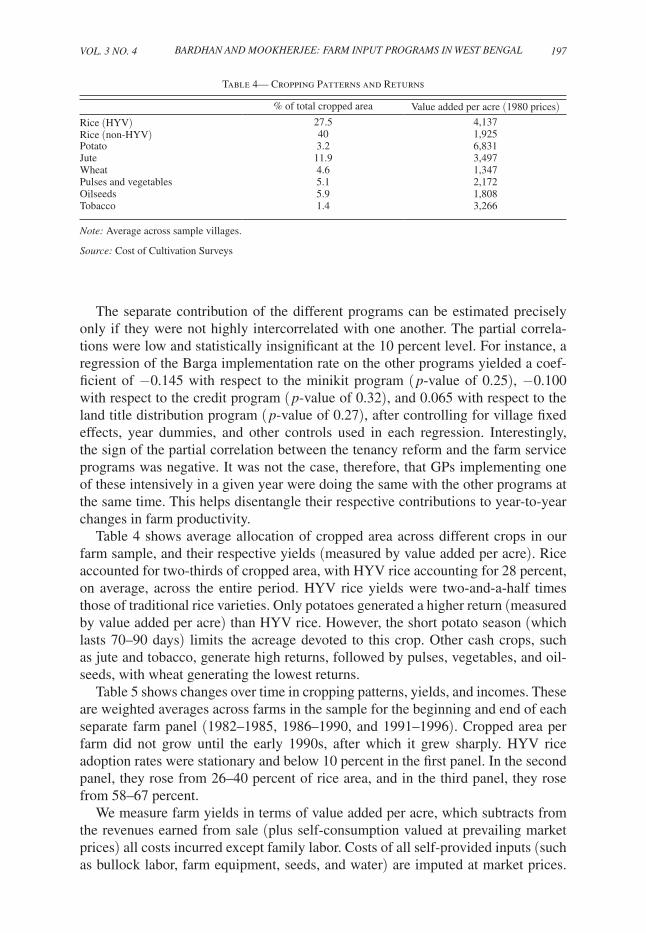
Table 4 shows average allocation of cropped area across different crops in our farm sample, and their respective yields (measured by value added per acre). Rice accounted for two-thirds of cropped area, with HYV rice accounting for 28 percent, on average, across the entire period. HYV rice yields were two-and-a-half times those of traditional rice varieties. Only potatoes generated a higher return (measured by value added per acre) than HYV rice. However, the short potato season (which lasts 70–90 days) limits the acreage devoted to this crop. Other cash crops, such as jute and tobacco, generate high returns, followed by pulses, vegetables, and oil-seeds, with wheat generating the lowest returns.
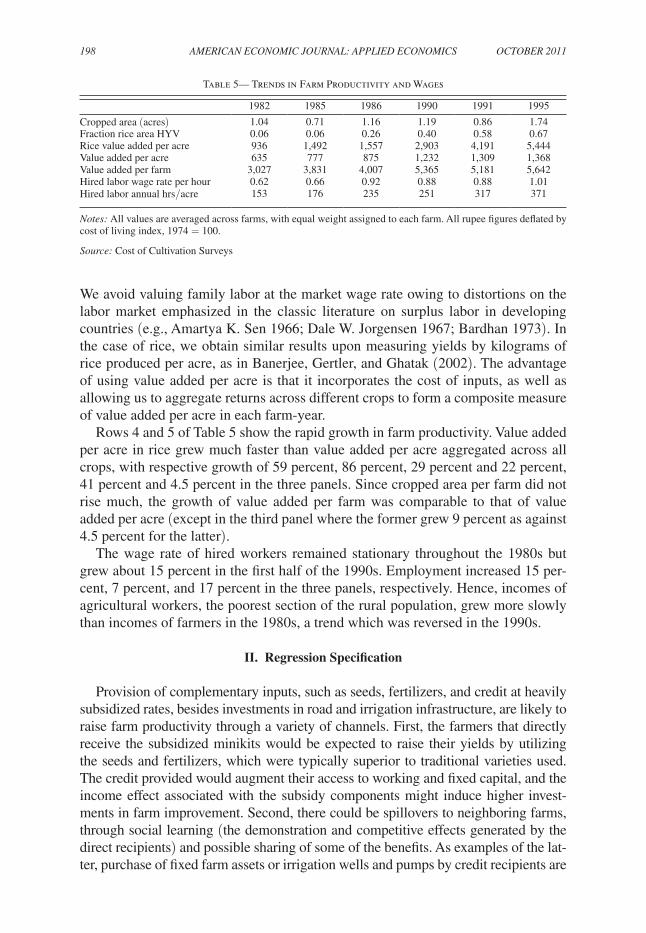
Table 5 shows changes over time in cropping patterns, yields, and incomes. These are weighted averages across farms in the sample for the beginning and end of each separate farm panel (1982–1985, 1986–1990, and 1991–1996). Cropped area per farm did not grow until the early 1990s, after which it grew sharply. HYV rice adoption rates were stationary and below 10 percent in the first panel. In the second panel, they rose from 26–40 percent of rice area, and in the third panel, they rose from 58–67 percent.
We measure farm yields in terms of value added per acre, which subtracts from the revenues earned from sale (plus self-consumption valued at prevailing market prices) all costs incurred except family labor. Costs of all self-provided inputs (such as bullock labor, farm equipment, seeds, and water) are imputed at market prices.
Table 4— Cropping Patterns and Returns
% of total cropped area Value added per acre (1980 prices)Rice (HYV) 27.5 4,137Rice (non-HYV) 40 1,925Potato 3.2 6,831Jute 11.9 3,497Wheat 4.6 1,347Pulses and vegetables 5.1 2,172Oilseeds 5.9 1,808Tobacco 1.4 3,266
Note: Average across sample villages.
source: Cost of Cultivation Surveys
198 AMEricAN EcONOMic JOurNAL: AppLiEd EcONOMics OcTOBEr 2011
We avoid valuing family labor at the market wage rate owing to distortions on the labor market emphasized in the classic literature on surplus labor in developing countries (e.g., Amartya K. Sen 1966; Dale W. Jorgensen 1967; Bardhan 1973). In the case of rice, we obtain similar results upon measuring yields by kilograms of rice produced per acre, as in Banerjee, Gertler, and Ghatak (2002). The advantage of using value added per acre is that it incorporates the cost of inputs, as well as allowing us to aggregate returns across different crops to form a composite measure of value added per acre in each farm-year.
Rows 4 and 5 of Table 5 show the rapid growth in farm productivity. Value added per acre in rice grew much faster than value added per acre aggregated across all crops, with respective growth of 59 percent, 86 percent, 29 percent and 22 percent, 41 percent and 4.5 percent in the three panels. Since cropped area per farm did not rise much, the growth of value added per farm was comparable to that of value added per acre (except in the third panel where the former grew 9 percent as against 4.5 percent for the latter).
The wage rate of hired workers remained stationary throughout the 1980s but grew about 15 percent in the first half of the 1990s. Employment increased 15 per-cent, 7 percent, and 17 percent in the three panels, respectively. Hence, incomes of agricultural workers, the poorest section of the rural population, grew more slowly than incomes of farmers in the 1980s, a trend which was reversed in the 1990s.
II. Regression Specification
Provision of complementary inputs, such as seeds, fertilizers, and credit at heavily subsidized rates, besides investments in road and irrigation infrastructure, are likely to raise farm productivity through a variety of channels. First, the farmers that directly receive the subsidized minikits would be expected to raise their yields by utilizing the seeds and fertilizers, which were typically superior to traditional varieties used. The credit provided would augment their access to working and fixed capital, and the income effect associated with the subsidy components might induce higher invest-ments in farm improvement. Second, there could be spillovers to neighboring farms, through social learning (the demonstration and competitive effects generated by the direct recipients) and possible sharing of some of the benefits. As examples of the lat-ter, purchase of fixed farm assets or irrigation wells and pumps by credit recipients are
Table 5— Trends in Farm Productivity and Wages
1982 1985 1986 1990 1991 1995
Cropped area (acres) 1.04 0.71 1.16 1.19 0.86 1.74Fraction rice area HYV 0.06 0.06 0.26 0.40 0.58 0.67Rice value added per acre 936 1,492 1,557 2,903 4,191 5,444Value added per acre 635 777 875 1,232 1,309 1,368Value added per farm 3,027 3,831 4,007 5,365 5,181 5,642Hired labor wage rate per hour 0.62 0.66 0.92 0.88 0.88 1.01Hired labor annual hrs/acre 153 176 235 251 317 371
Notes: All values are averaged across farms, with equal weight assigned to each farm. All rupee figures deflated by cost of living index, 1974 = 100.
source: Cost of Cultivation Surveys
VOL. 3 NO. 4 199BArdhAN ANd MOOkhErJEE: FArM iNpuT prOgrAMs iN WEsT BENgAL
likely to be accompanied by offers to rent these to their neighbors, raising access and lowering cost of water and farm equipment rentals to the latter.11
The cost of cultivation data for farms does not include the names of the house-holds involved, which prevents us from merging it with the data collected from the village surveys. As a result, we cannot identify whether a particular farm was a direct beneficiary of any of the programs. We estimate the effect of variations in pro-gram intensity measured at the village level on subsequent productivity growth in a sample of randomly selected farms located in the village, without regard to whether these farms were direct beneficiaries of the programs.
In any case, the key question of interest concerns the effectiveness of the village-level interventions. With regard to the effect of various farm service programs, mod-els of social learning in agriculture (e.g., Foster and Rosenzweig 1995) lead us to expect diffusion of benefits to neighbors, resulting in the spread of benefits to the entire village, which would persist into future years. Programs which augmented credit access (Operation Barga or IRDP) helped contribute to the stock of fixed capital assets in the village whose effect would also persist into the future. One can similarly view the benefits of social learning from minikit distribution (which were accompanied by demonstrations by state agriculture officers in the farms of recipi-ents) as an increase in the stock of “knowledge capital” concerning best practices with regard to use of new varieties of seeds, fertilizers, and insecticides.
Models of social learning (Foster and Rosenzweig 1995) indicate the appropriate specification of the effects of the various farm service programs that ought to distin-guish between current and lagged program effects, plus interactions between these. Effects of one’s own past adoption would differ from neighbor’s adoption, but this cannot be incorporated owing to our inability to identify direct recipients of the farm services. Separation of current and lagged effects into their respective effects and interactions between them requires a nonlinear model, which is difficult to estimate with a reduced form estimation approach. The estimation of lagged effects as distinct from current effects also raises some econometric complications, which we avoid by using a single cumulative measure of program implementation until the current year.12
With regard to the tenancy registration program, the implementation is measured by the cumulative proportion of land in the village registered until any given year. This is a first approximation for the probability that a randomly selected farm would have been registered under the program. Even for tenants that did not register, the option of registering would be expected to generate a reduction in Marshallian sharecropping distortions. Nevertheless, these improvements in farmer incentives would arise only in tenant farms. So we include an interaction between a dummy for whether or not the farm leases in land with the implementation rate of Operation Barga in the village. This picks up the differential effect of the program on tenant
11 We explore the role of such spillovers operating through investments in groundwater capacity in a companion paper Bardhan, Mookherjee, and Kumar (2009).
12 Specifically, we would lose considerable degrees of freedom in using lagged effects as distinct from current effects, owing to the large number of programs (there would be at least five additional variables to include in the regression, corresponding to the five programs). Controls for endogeneity would require a corresponding expansion in the number of instruments. Besides, there is the problem of potential bias in the estimation of lagged effects in the presence of serially correlated errors.
200 AMEricAN EcONOMic JOurNAL: AppLiEd EcONOMics OcTOBEr 2011
and owner-cultivator farms, representing the direct effect of the reform on the for-mer. The registration rate by itself thus represents the spillover effect on owner-culti-vated farms located in the same village, resulting from social learning, competitive, or general equilibrium effects.
The set of variables representing implementation rates of different programs therefore include cumulative values up to the previous year of minikits being dis-tributed in the village per household, proportion of cultivable land distributed in the form of pattas, and registered under Operation Barga, respectively. We control for other programs with a possible bearing on farm productivity, such as IRDP credit subsidy delivered per household, mandays of employment generated per household in the village generated by the concerned GP in the same year, as this (rather than the cumulative of past values) represents the effect on the wages and productivity of hired workers (via their effect on their outside options on the labor market). We include as additional controls cumulative GP expenditures (in constant 1980 prices) per household on local irrigation and road projects, representing investments in rel-evant infrastructure by the local government.
The OLS regression specification
(1) V fvt = β 1 E v, t−1 + β 2 B v, t−1 + β 3 L fvt × B v, t−1
+ β 4 p v, t−1 + β 5 L fvt + β 6 A fvt + β 7 A fvt 2 + β 8 c vt + γ f + δ t + ϵ fvt
explains value added per acre V fvt in farm f located in village v in year t in terms of E v, t−1 , a vector of cumulative (per household) delivery in village v until year t − 1 of minikits, IRDP credit subsidy, GP expenditures on local road and irriga-tion projects, and employment mandays per household in the current year. Also included among predictors are B v, t−1, the cumulative proportion of agricultural land registered under Operation Barga in the village until year t − 1, and p v, t−1, the cumulative proportion of cultivable land in village v distributed till year t − 1 in the form of land titles ( pattas). Additional farm-level controls include tenancy status ( L fvt denotes the dummy for whether farm f in village v in year t leased in land) and farm size ( A fvt is the gross cropped area in the farm in year t).13 The coefficient β 3 represents the differential impact of the tenancy reform on tenant farms, relative to pure owner cultivated farms. The effect on the latter, represented by the coefficient β 2 , thus represents spillover or general equilibrium effects of the tenancy reform on nontenant farms in the village. c vt includes additional time-varying village controls, such as the annual rainfall at the nearest weather station, the log of the rice price received by the farmer, and canals and roads provided by the state government in the district. Finally, a farm dummy is included to pick up unobservable farmer-level characteristics, such as wealth, education, and farming
13 The theoretical literature indicates that agency problems with respect to hired labor, in conjunction with credit market imperfections, may cause farms to rely on family labor as far as possible (Mukesh Eswaran and Ashok Kotwal 1986). Given family size, increases in cropped area cause increasing reliance on hired labor, which therefore tends to increase agency problems and lower farm profits. On the other hand, there may be various sources of technological scale economies or diseconomies. We thus allow for nonlinear effects of scale by including both acreage and its square.
VOL. 3 NO. 4 201BArdhAN ANd MOOkhErJEE: FArM iNpuT prOgrAMs iN WEsT BENgAL
skills, while year dummies represent the effect of common macro shocks affect-ing all farms in the state in the same way.
III. OLS Estimates
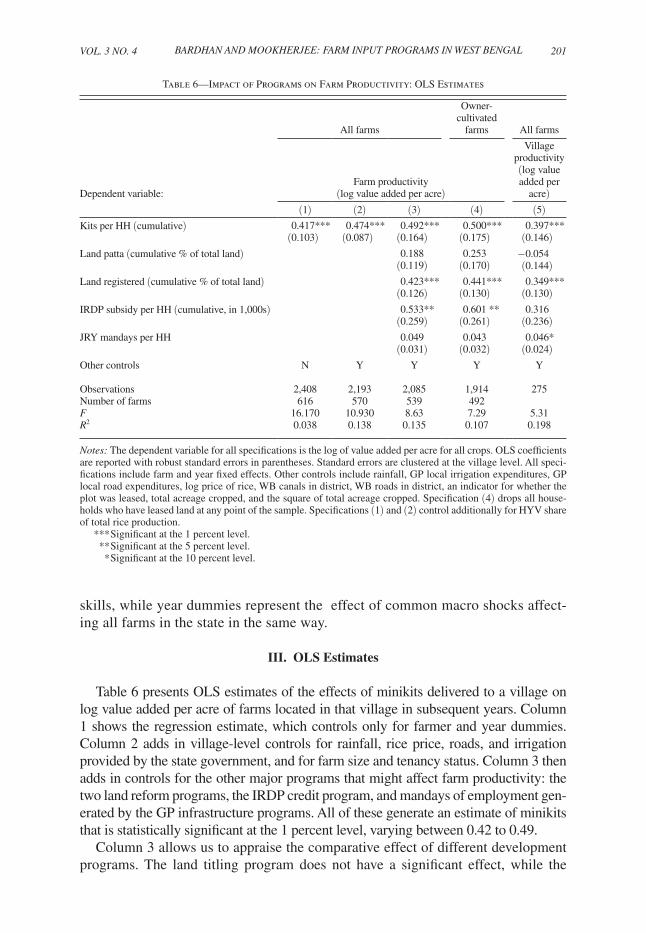
Table 6 presents OLS estimates of the effects of minikits delivered to a village on log value added per acre of farms located in that village in subsequent years. Column 1 shows the regression estimate, which controls only for farmer and year dummies. Column 2 adds in village-level controls for rainfall, rice price, roads, and irrigation provided by the state government, and for farm size and tenancy status. Column 3 then adds in controls for the other major programs that might affect farm productivity: the two land reform programs, the IRDP credit program, and mandays of employment gen-erated by the GP infrastructure programs. All of these generate an estimate of minikits that is statistically significant at the 1 percent level, varying between 0.42 to 0.49.
Column 3 allows us to appraise the comparative effect of different development programs. The land titling program does not have a significant effect, while the
Table 6—Impact of Programs on Farm Productivity: OLS Estimates
All farms
Owner-cultivated
farms All farms
Dependent variable:Farm productivity
(log value added per acre)
Village productivity (log value added per
acre)(1) (2) (3) (4) (5)
Kits per HH (cumulative) 0.417*** (0.103)
0.474*** (0.087)
0.492*** (0.164)
0.500*** (0.175)
0.397*** (0.146)
Land patta (cumulative % of total land) 0.188 (0.119)
0.253 (0.170)
−0.054 (0.144)
Land registered (cumulative % of total land) 0.423*** (0.126)
0.441*** (0.130)
0.349*** (0.130)
IRDP subsidy per HH (cumulative, in 1,000s) 0.533** (0.259)
0.601 ** (0.261)
0.316 (0.236)
JRY mandays per HH 0.049 (0.031)
0.043 (0.032)
0.046* (0.024)
Other controls N Y Y Y Y
Observations 2,408 2,193 2,085 1,914 275Number of farms 616 570 539 492F 16.170 10.930 8.63 7.29 5.31r2 0.038 0.138 0.135 0.107 0.198
Notes: The dependent variable for all specifications is the log of value added per acre for all crops. OLS coefficients are reported with robust standard errors in parentheses. Standard errors are clustered at the village level. All speci-fications include farm and year fixed effects. Other controls include rainfall, GP local irrigation expenditures, GP local road expenditures, log price of rice, WB canals in district, WB roads in district, an indicator for whether the plot was leased, total acreage cropped, and the square of total acreage cropped. Specification (4) drops all house-holds who have leased land at any point of the sample. Specifications (1) and (2) control additionally for HYV share of total rice production.
*** Significant at the 1 percent level. ** Significant at the 5 percent level. * Significant at the 10 percent level.
202 AMEricAN EcONOMic JOurNAL: AppLiEd EcONOMics OcTOBEr 2011
effects of IRDP and of Operation Barga are both statistically significant, with coef-ficients of 0.4 and 0.5, respectively. The lack of significance of the titling program is not surprising, as the distributed plots were small and poor in quality. In con-trast plots registered were larger. The average size registered in these villages was approximately 1.5 acres, three times as large as the average plot distributed. Note, however, that the effect of Operation Barga shown is the effect on the average farm in the village, irrespective of whether or not it was leasing land. Given the small fraction of farms and farmland that were leasing in land, this represents mainly a spillover effect on nontenant farms, which comprise about 90 percent of the sample. To confirm this interpretation, column 4 runs the same regression for the sample consisting only of pure owner-cultivated farms, and obtains similar estimates.
Standard errors in columns 1–3 were clustered at the village level, to incorpo-rate the possibility of correlation across farms in the same village in unobserved time-varying sources of farm productivity. To check for possible serial correlation in errors, we also clustered standard errors at the farm level and found the significance patterns unchanged. Finally, column 5 presents the corresponding village-level regression. It uses as the dependent variable the average farm productivity in the vil-lage, obtained by weighting productivity of farms by their respective cropped areas. This is to check if standard errors of the regression run at the individual farm level were underestimated owing to correlation in errors across farms in the same village, despite clustering standard errors at the village level (Stephen G. Donald and Kevin Lang 2007). The magnitude of the effect of minikits and Operation Barga is slightly attenuated, but they remain significant at 5 percent.
IV. Controlling for Endogeneity of Program Implementation
We now examine robustness of the estimates in Table 6 to possible endogene-ity of program implementation. It is conceivable that villages with farmers more motivated to raise productivity would have lobbied their elected panchayat repre-sentatives to try to get more minikits from higher level panchayats. If so, the OLS estimate of the effect of rising minikit provision in the village would be proxying for unobserved time-varying productivity-raising efforts of local farmers unrelated to minikit procurement.
As explained previously the minikits were distributed through the hierarchy of the state government across district and block offices of the agriculture department, and then distributed across villages within any given block through a process of con-sultation with concerned GP officials. Lobbying by the GP officials with the block agricultural officers would be expected to play a part in determining how many kits were allocated to the concerned GP. The GP officials would also have a say in the allocation of kits across villages and farmers within those villages. Similarly, offi-cials in the block and district panchayats would be able to influence the allocation of the kits across different regions within their jurisdiction.
The allocation of kits to any given village would thus be expected to depend partly on the scale of the program in the state as a whole, as well as the party composition of the concerned GP. Party composition would matter in two ways. A GP dominated either by the Left Front or the Congress would be less subject to
VOL. 3 NO. 4 203BArdhAN ANd MOOkhErJEE: FArM iNpuT prOgrAMs iN WEsT BENgAL
problems of divided control and inter-party conflict, thus facing less problems in collective action in lobbying higher level governments. Moreoever, the party composition in the GP often mirrors that in the higher level panchayats. A Left-dominated GP is more likely to arise in a region where the Left Front dominates, and the higher level panchayats are also likely to be dominated by the Left Front. If kits are allocated in a partisan manner by the latter, a block-level panchayat domi-nated by the Left Front would allocate more kits to Left-dominated GPs compared to Congress-dominated GPs within its jurisdiction. On the other hand, if the kits are offered to woo “swing” voters, more kits may be allocated to constituencies that are divided rather than dominated by one of the two parties. Hence, the allocation to a given GP may not be monotonically related to the fraction of its officials that belong to the Left Front.
We therefore allow for possible nonlinearities in the relation of kits allocation to the Left Front share of the concerned GP. Our regression specification for kits allo-cated to village v in year t is then
(2) k vt = μ 1 L s vt + μ 2 L s vt 2 + μ 2 k t
s × L s vt + μ 3 k t s × L s vt
2 + μ t + μ v ′ + ϵ vt
k ,
where L s vt is the Left share in the GP associated with village v in year t; k t s denotes
the state average for kits allocation per household in year t; μ t is a year dummy; μ v ′ is a village dummy; and ϵ vt
k is a white noise process.
The village-year varying predictor of kits delivery here is the Left share of GP seats in the same year, which, however, cannot serve as an instrument since unob-served shocks affecting farm productivity growth in the village may be correlated with the outcome of GP elections. We therefore need to predict the latter.
In our previous work on this issue, we have found that factors at the district and national levels that affect the relative popularity of the Left Front and Congress, combined with lagged incumbency in the GP, are successful in predicting the suc-cess of the Left in any given GP election (Bardhan and Mookherjee 2010). The popularity of the Congress at the national level is proxied by iN c t , the number of seats it secured in the preceding elections to the national Parliament. Within West Bengal (where the Left Front has a far more significant presence), the relative popu-larity of the Left Front is measured by AVs d vt , the vote share difference between the candidates of the two parties in the preceding elections to the state legislature, averaged across all constituencies in the district in which the village happens to belong. These elections to the national and state legislatures typically occur two or three years prior to the local GP elections. Swings in iN c t and AVs d vt thus represent the effect of state and national level events on the relative loyalties of voters to the two parties, which affect their competitive position in local elections. Since a district typically contains about 2,000–3,000 villages, these measures of popularity of the parties are unlikely to be driven by factors specific to any given village.
We predict local GP composition on the basis of these measures of relative popu-larity of the two parties, in addition to and interacted with lagged GP composition, which represents the effect of local incumbency patterns:
(3) L s vt = δ 1 L s v, t−1 + δ 2 iN c t × L s v, t−1 + δ 3 AVs d vt + δ v ′ + ϵ vt 2 ,
204 AMEricAN EcONOMic JOurNAL: AppLiEd EcONOMics OcTOBEr 2011
where L s v, t−1 denotes Left share in the previous GP administration; δ v ′ is a GP fixed effect; and ϵ vt
2 is an independently and identically distributed GP-year shock. Note
that GP elections are held once every five years, so the incumbency variable L s v, t−1 represents the share of the Left not in the current GP, but the one preceding the cur-rent one, which is no longer in office (and was elected five to ten years ago). As shown in Bardhan and Mookherjee (2010), this Arellano-Bond specification of the dynamics of the GP composition (i.e., the lack of serial correlation in the errors, after controlling for the GP fixed effect) is not rejected by the data.
Combining equations (3) and (2), we obtain a prediction of the kits delivered to a village in any given year as a function of lagged incumbency, its square, and interactions with measures of relative popularity of the two parties at the district and national levels, and with the scale of the program for the state as a whole:
(4) k vt = ν 1 k t s × L s v, t−1 + ν 2 k t
s × L s v, t−1 2 + ν 3 k t
s × iN c t × L s v, t−1
+ + ν 4 k t s × AVs d vt + ν 5 L s v, t−1 + ν 6 L s v, t−1
2 + ν 7 iN c t × L s v, t−1
+ ν 8 AVs d vt × L s v, t−1 × iN c t + ν 9 AVs d vt + ν 10 AVs d vt
× L s v, t−1 + ν 11 AVs d vt × L s v, t−1 2 + ν v + ν t ′ + ϵ vt ′ ,
where we ignore some higher order terms. The identification assumption is that these time-varying fluctuations in these predictors of GP composition and scale of the program at the state level are uncorrelated with unobserved time-varying shocks to farm productivity in a given village. This is plausible once we have controlled for all state-sponsored programs for rural development that may have an impact of farm productivity in the second-stage regression.
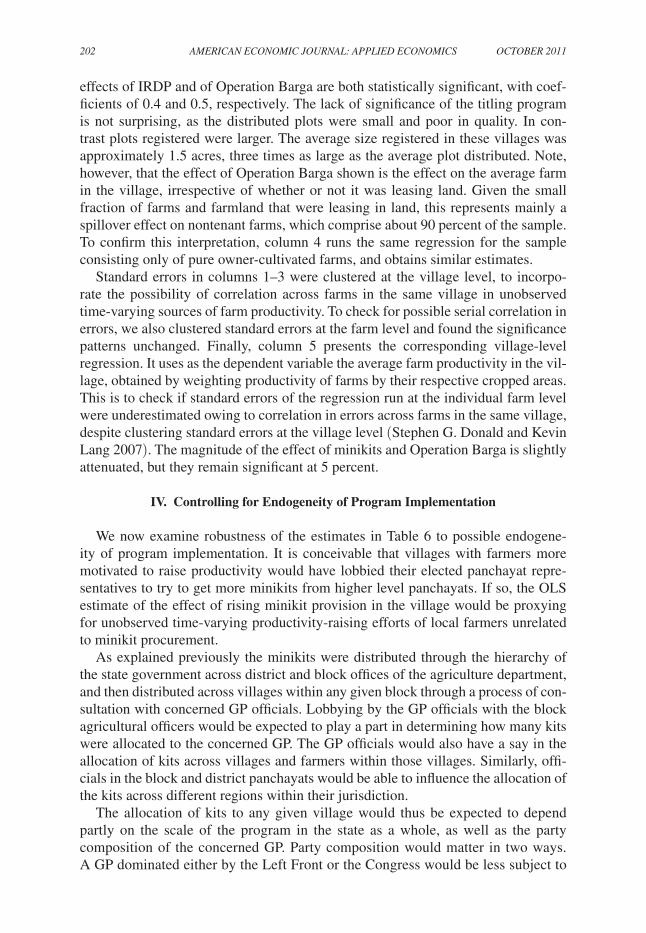
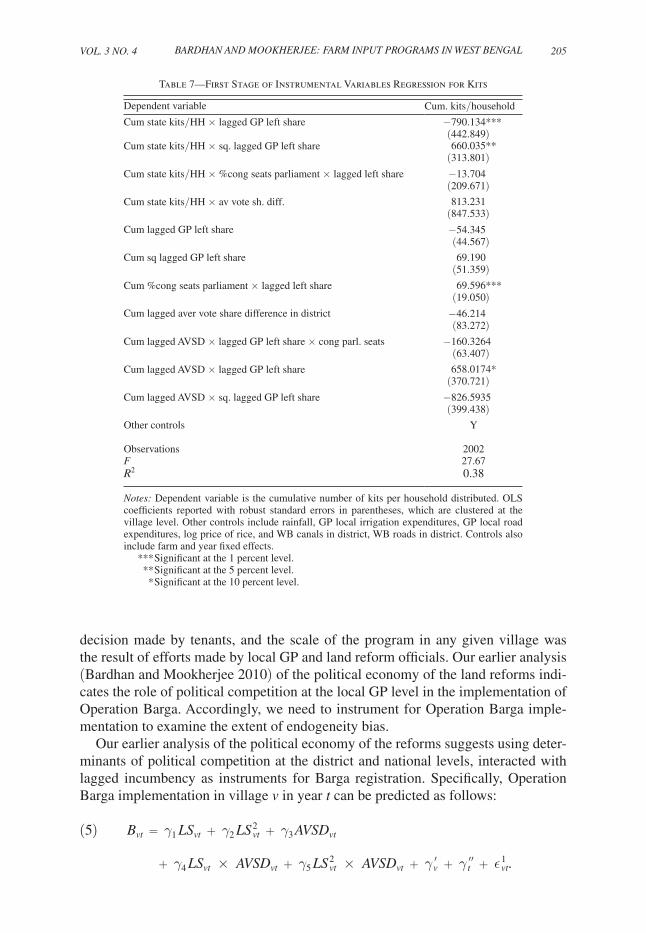
Table 7 presents the estimated first-stage equation, with all corresponding vari-ables cumulated up to any given year. We see a U-shaped pattern with respect to GP composition, suggesting the role of collective action problems within the GP com-bined with partisan distribution of kits by higher level governments. The regression has an r2 of 0.38 and an F statistic of 27.7, indicating that the instruments do explain a substantial portion of the observed variation in kits delivered.
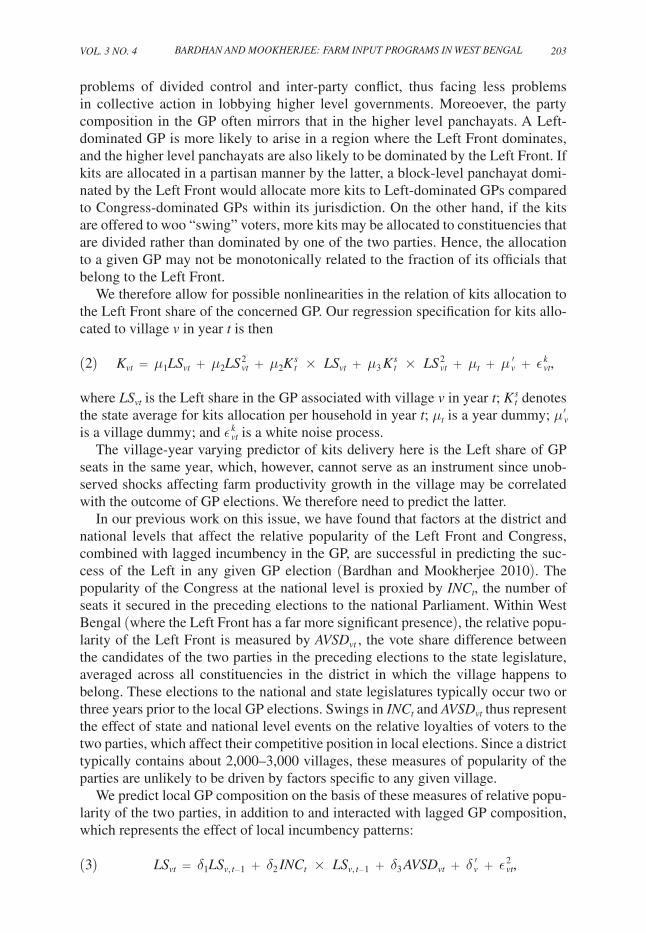
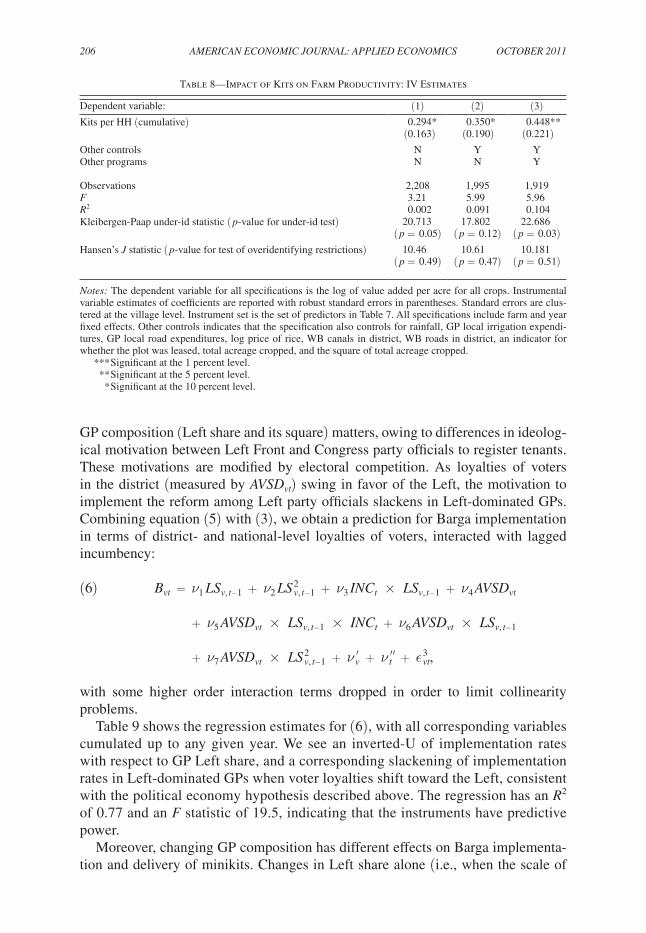
Table 8 presents the second-stage equation for effect of kits on farm productivity, first without village controls, then adding in these controls and other productivity related programs in the subsequent columns. All three versions show the effect of kits to be statistically significant at the 10 percent level. Adding in the controls and other programs, it is significant at 5 percent, and its magnitude is almost the same as the OLS estimate in Table 6. Tests for the rank condition for identification, and of overidentifying restrictions, are not rejected.
V. Effects of Operation Barga
The OLS estimates in Table 6 showed Operation Barga was the other program with consistently significant effect on farm productivity. The OLS estimate is poten-tially vulnerable to endogeneity bias, both because registration was a voluntary
VOL. 3 NO. 4 205BArdhAN ANd MOOkhErJEE: FArM iNpuT prOgrAMs iN WEsT BENgAL
decision made by tenants, and the scale of the program in any given village was the result of efforts made by local GP and land reform officials. Our earlier analysis (Bardhan and Mookherjee 2010) of the political economy of the land reforms indi-cates the role of political competition at the local GP level in the implementation of Operation Barga. Accordingly, we need to instrument for Operation Barga imple-mentation to examine the extent of endogeneity bias.
Our earlier analysis of the political economy of the reforms suggests using deter-minants of political competition at the district and national levels, interacted with lagged incumbency as instruments for Barga registration. Specifically, Operation Barga implementation in village v in year t can be predicted as follows:
(5) B vt = γ 1 L s vt + γ 2 L s vt 2 + γ 3 AVs d vt
+ γ 4 L s vt × AVs d vt + γ 5 L s vt 2 × AVs d vt + γ v ′ + γ t ″ + ϵ vt
1 .
Table 7—First Stage of Instrumental Variables Regression for Kits
Dependent variable Cum. kits/household
Cum state kits/HH × lagged GP left share −790.134***(442.849)
Cum state kits/HH × sq. lagged GP left share 660.035**(313.801)
Cum state kits/HH × %cong seats parliament × lagged left share −13.704(209.671)
Cum state kits/HH × av vote sh. diff. 813.231(847.533)
Cum lagged GP left share −54.345(44.567)
Cum sq lagged GP left share 69.190(51.359)
Cum %cong seats parliament × lagged left share 69.596***(19.050)
Cum lagged aver vote share difference in district −46.214(83.272)
Cum lagged AVSD × lagged GP left share × cong parl. seats −160.3264(63.407)
Cum lagged AVSD × lagged GP left share 658.0174*(370.721)
Cum lagged AVSD × sq. lagged GP left share −826.5935(399.438)
Other controls Y
Observations 2002F 27.67r2 0.38
Notes: Dependent variable is the cumulative number of kits per household distributed. OLS coefficients reported with robust standard errors in parentheses, which are clustered at the village level. Other controls include rainfall, GP local irrigation expenditures, GP local road expenditures, log price of rice, and WB canals in district, WB roads in district. Controls also include farm and year fixed effects.
*** Significant at the 1 percent level. ** Significant at the 5 percent level. * Significant at the 10 percent level.
206 AMEricAN EcONOMic JOurNAL: AppLiEd EcONOMics OcTOBEr 2011
GP composition (Left share and its square) matters, owing to differences in ideolog-ical motivation between Left Front and Congress party officials to register tenants. These motivations are modified by electoral competition. As loyalties of voters in the district (measured by AVs d vt ) swing in favor of the Left, the motivation to implement the reform among Left party officials slackens in Left-dominated GPs. Combining equation (5) with (3), we obtain a prediction for Barga implementation in terms of district- and national-level loyalties of voters, interacted with lagged incumbency:
(6) B vt = ν 1 L s v, t−1 + ν 2 L s v, t−1 2 + ν 3 iN c t × L s v, t−1 + ν 4 AVs d vt
+ ν 5 AVs d vt × L s v, t−1 × iN c t + ν 6 AVs d vt × L s v, t−1
+ ν 7 AVs d vt × L s v, t−1 2 + ν v ′ + ν t ″ + ϵ vt
3 ,
with some higher order interaction terms dropped in order to limit collinearity problems.
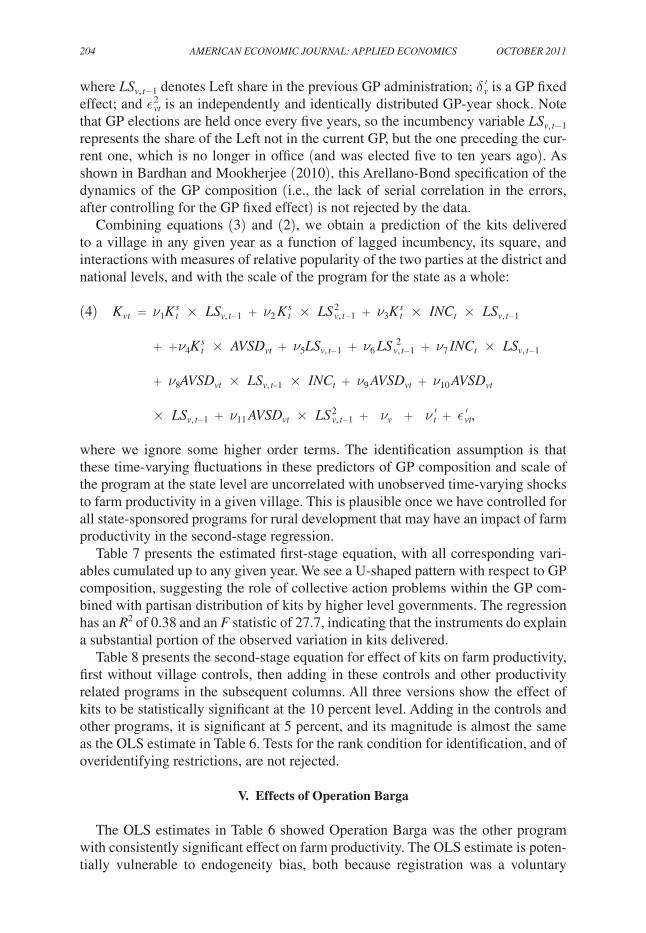
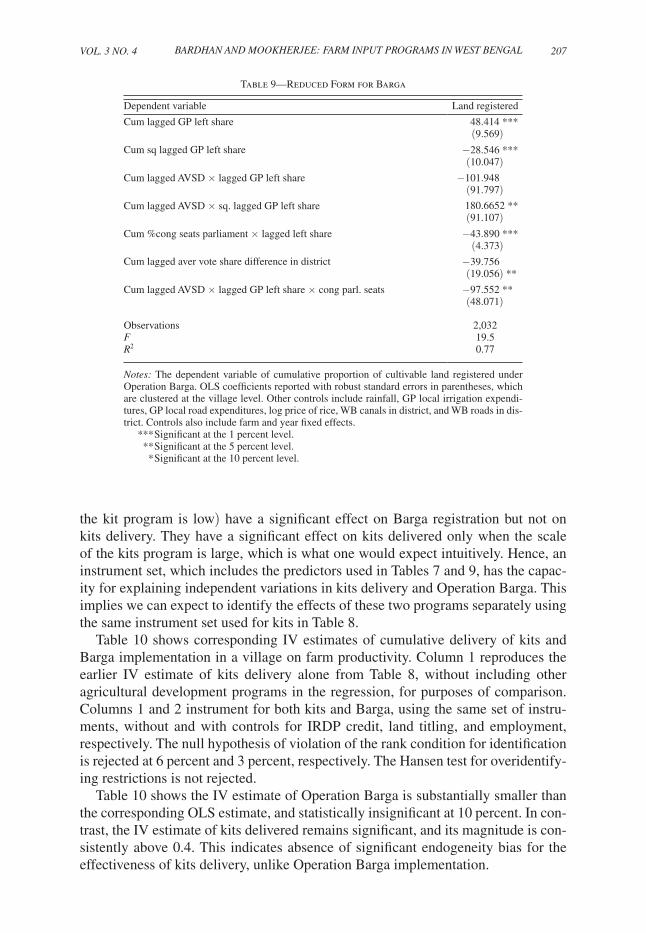
Table 9 shows the regression estimates for (6), with all corresponding variables cumulated up to any given year. We see an inverted-U of implementation rates with respect to GP Left share, and a corresponding slackening of implementation rates in Left-dominated GPs when voter loyalties shift toward the Left, consistent with the political economy hypothesis described above. The regression has an r2 of 0.77 and an F statistic of 19.5, indicating that the instruments have predictive power.
Moreover, changing GP composition has different effects on Barga implementa-tion and delivery of minikits. Changes in Left share alone (i.e., when the scale of
Table 8—Impact of Kits on Farm Productivity: IV Estimates
Dependent variable: (1) (2) (3)Kits per HH (cumulative) 0.294*
(0.163)0.350*
(0.190)0.448**
(0.221)Other controls N Y YOther programs N N Y
Observations 2,208 1,995 1,919F 3.21 5.99 5.96r2 0.002 0.091 0.104Kleibergen-Paap under-id statistic ( p-value for under-id test) 20.713
( p = 0.05)17.802
( p = 0.12)22.686
( p = 0.03)Hansen’s J statistic ( p-value for test of overidentifying restrictions) 10.46
( p = 0.49)10.61
( p = 0.47)10.181
( p = 0.51)
Notes: The dependent variable for all specifications is the log of value added per acre for all crops. Instrumental variable estimates of coefficients are reported with robust standard errors in parentheses. Standard errors are clus-tered at the village level. Instrument set is the set of predictors in Table 7. All specifications include farm and year fixed effects. Other controls indicates that the specification also controls for rainfall, GP local irrigation expendi-tures, GP local road expenditures, log price of rice, WB canals in district, WB roads in district, an indicator for whether the plot was leased, total acreage cropped, and the square of total acreage cropped.
*** Significant at the 1 percent level. ** Significant at the 5 percent level. * Significant at the 10 percent level.
VOL. 3 NO. 4 207BArdhAN ANd MOOkhErJEE: FArM iNpuT prOgrAMs iN WEsT BENgAL
the kit program is low) have a significant effect on Barga registration but not on kits delivery. They have a significant effect on kits delivered only when the scale of the kits program is large, which is what one would expect intuitively. Hence, an instrument set, which includes the predictors used in Tables 7 and 9, has the capac-ity for explaining independent variations in kits delivery and Operation Barga. This implies we can expect to identify the effects of these two programs separately using the same instrument set used for kits in Table 8.
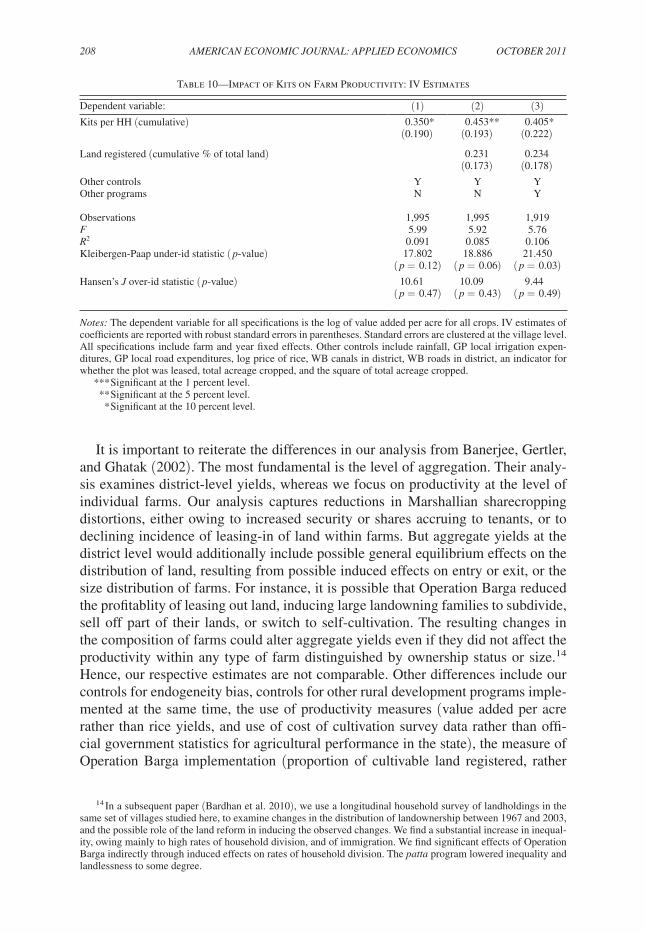
Table 10 shows corresponding IV estimates of cumulative delivery of kits and Barga implementation in a village on farm productivity. Column 1 reproduces the earlier IV estimate of kits delivery alone from Table 8, without including other agricultural development programs in the regression, for purposes of comparison. Columns 1 and 2 instrument for both kits and Barga, using the same set of instru-ments, without and with controls for IRDP credit, land titling, and employment, respectively. The null hypothesis of violation of the rank condition for identification is rejected at 6 percent and 3 percent, respectively. The Hansen test for overidentify-ing restrictions is not rejected.
Table 10 shows the IV estimate of Operation Barga is substantially smaller than the corresponding OLS estimate, and statistically insignificant at 10 percent. In con-trast, the IV estimate of kits delivered remains significant, and its magnitude is con-sistently above 0.4. This indicates absence of significant endogeneity bias for the effectiveness of kits delivery, unlike Operation Barga implementation.
Table 9—Reduced Form for Barga
Dependent variable Land registered
Cum lagged GP left share 48.414 ***(9.569)
Cum sq lagged GP left share −28.546 ***(10.047)
Cum lagged AVSD × lagged GP left share −101.948(91.797)
Cum lagged AVSD × sq. lagged GP left share 180.6652 **(91.107)
Cum %cong seats parliament × lagged left share −43.890 ***(4.373)
Cum lagged aver vote share difference in district −39.756(19.056) **
Cum lagged AVSD × lagged GP left share × cong parl. seats −97.552 **(48.071)
Observations 2,032F 19.5r2 0.77
Notes: The dependent variable of cumulative proportion of cultivable land registered under Operation Barga. OLS coefficients reported with robust standard errors in parentheses, which are clustered at the village level. Other controls include rainfall, GP local irrigation expendi-tures, GP local road expenditures, log price of rice, WB canals in district, and WB roads in dis-trict. Controls also include farm and year fixed effects.
*** Significant at the 1 percent level. ** Significant at the 5 percent level. * Significant at the 10 percent level.
208 AMEricAN EcONOMic JOurNAL: AppLiEd EcONOMics OcTOBEr 2011
It is important to reiterate the differences in our analysis from Banerjee, Gertler, and Ghatak (2002). The most fundamental is the level of aggregation. Their analy-sis examines district-level yields, whereas we focus on productivity at the level of individual farms. Our analysis captures reductions in Marshallian sharecropping distortions, either owing to increased security or shares accruing to tenants, or to declining incidence of leasing-in of land within farms. But aggregate yields at the district level would additionally include possible general equilibrium effects on the distribution of land, resulting from possible induced effects on entry or exit, or the size distribution of farms. For instance, it is possible that Operation Barga reduced the profitablity of leasing out land, inducing large landowning families to subdivide, sell off part of their lands, or switch to self-cultivation. The resulting changes in the composition of farms could alter aggregate yields even if they did not affect the productivity within any type of farm distinguished by ownership status or size.14 Hence, our respective estimates are not comparable. Other differences include our controls for endogeneity bias, controls for other rural development programs imple-mented at the same time, the use of productivity measures (value added per acre rather than rice yields, and use of cost of cultivation survey data rather than offi-cial government statistics for agricultural performance in the state), the measure of Operation Barga implementation (proportion of cultivable land registered, rather
14 In a subsequent paper (Bardhan et al. 2010), we use a longitudinal household survey of landholdings in the same set of villages studied here, to examine changes in the distribution of landownership between 1967 and 2003, and the possible role of the land reform in inducing the observed changes. We find a substantial increase in inequal-ity, owing mainly to high rates of household division, and of immigration. We find significant effects of Operation Barga indirectly through induced effects on rates of household division. The patta program lowered inequality and landlessness to some degree.
Table 10—Impact of Kits on Farm Productivity: IV Estimates
Dependent variable: (1) (2) (3)Kits per HH (cumulative) 0.350*
(0.190)0.453**
(0.193)0.405*
(0.222)
Land registered (cumulative % of total land) 0.231(0.173)
0.234(0.178)
Other controls Y Y YOther programs N N Y
Observations 1,995 1,995 1,919F 5.99 5.92 5.76r2 0.091 0.085 0.106Kleibergen-Paap under-id statistic ( p-value) 17.802
( p = 0.12)18.886
( p = 0.06)21.450
( p = 0.03)Hansen’s J over-id statistic ( p-value) 10.61
( p = 0.47)10.09
( p = 0.43)9.44
( p = 0.49)
Notes: The dependent variable for all specifications is the log of value added per acre for all crops. IV estimates of coefficients are reported with robust standard errors in parentheses. Standard errors are clustered at the village level. All specifications include farm and year fixed effects. Other controls include rainfall, GP local irrigation expen-ditures, GP local road expenditures, log price of rice, WB canals in district, WB roads in district, an indicator for whether the plot was leased, total acreage cropped, and the square of total acreage cropped.
*** Significant at the 1 percent level. ** Significant at the 5 percent level. * Significant at the 10 percent level.
VOL. 3 NO. 4 209BArdhAN ANd MOOkhErJEE: FArM iNpuT prOgrAMs iN WEsT BENgAL
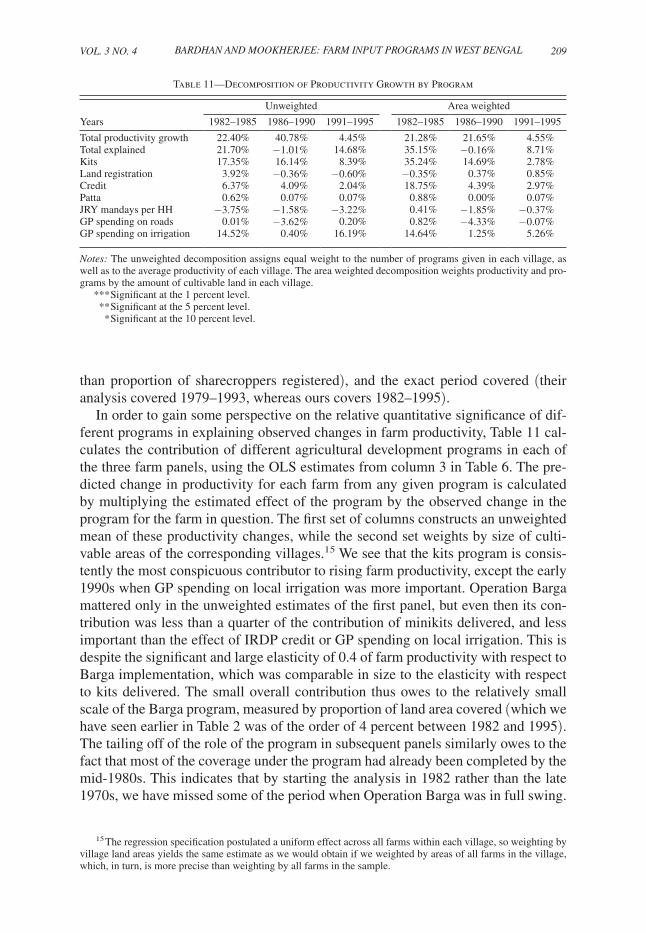
than proportion of sharecroppers registered), and the exact period covered (their analysis covered 1979–1993, whereas ours covers 1982–1995).
In order to gain some perspective on the relative quantitative significance of dif-ferent programs in explaining observed changes in farm productivity, Table 11 cal-culates the contribution of different agricultural development programs in each of the three farm panels, using the OLS estimates from column 3 in Table 6. The pre-dicted change in productivity for each farm from any given program is calculated by multiplying the estimated effect of the program by the observed change in the program for the farm in question. The first set of columns constructs an unweighted mean of these productivity changes, while the second set weights by size of culti-vable areas of the corresponding villages.15 We see that the kits program is consis-tently the most conspicuous contributor to rising farm productivity, except the early 1990s when GP spending on local irrigation was more important. Operation Barga mattered only in the unweighted estimates of the first panel, but even then its con-tribution was less than a quarter of the contribution of minikits delivered, and less important than the effect of IRDP credit or GP spending on local irrigation. This is despite the significant and large elasticity of 0.4 of farm productivity with respect to Barga implementation, which was comparable in size to the elasticity with respect to kits delivered. The small overall contribution thus owes to the relatively small scale of the Barga program, measured by proportion of land area covered (which we have seen earlier in Table 2 was of the order of 4 percent between 1982 and 1995). The tailing off of the role of the program in subsequent panels similarly owes to the fact that most of the coverage under the program had already been completed by the mid-1980s. This indicates that by starting the analysis in 1982 rather than the late 1970s, we have missed some of the period when Operation Barga was in full swing.
15 The regression specification postulated a uniform effect across all farms within each village, so weighting by village land areas yields the same estimate as we would obtain if we weighted by areas of all farms in the village, which, in turn, is more precise than weighting by all farms in the sample.
Table 11—Decomposition of Productivity Growth by Program
Unweighted Area weighted
Years 1982–1985 1986–1990 1991–1995 1982–1985 1986–1990 1991–1995
Total productivity growth 22.40% 40.78% 4.45% 21.28% 21.65% 4.55%Total explained 21.70% −1.01% 14.68% 35.15% −0.16% 8.71%Kits 17.35% 16.14% 8.39% 35.24% 14.69% 2.78%Land registration 3.92% −0.36% −0.60% −0.35% 0.37% 0.85%Credit 6.37% 4.09% 2.04% 18.75% 4.39% 2.97%Patta 0.62% 0.07% 0.07% 0.88% 0.00% 0.07%JRY mandays per HH −3.75% −1.58% −3.22% 0.41% −1.85% −0.37%GP spending on roads 0.01% −3.62% 0.20% 0.82% −4.33% −0.07%GP spending on irrigation 14.52% 0.40% 16.19% 14.64% 1.25% 5.26%
Notes: The unweighted decomposition assigns equal weight to the number of programs given in each village, as well as to the average productivity of each village. The area weighted decomposition weights productivity and pro-grams by the amount of cultivable land in each village.
*** Significant at the 1 percent level. ** Significant at the 5 percent level. * Significant at the 10 percent level.
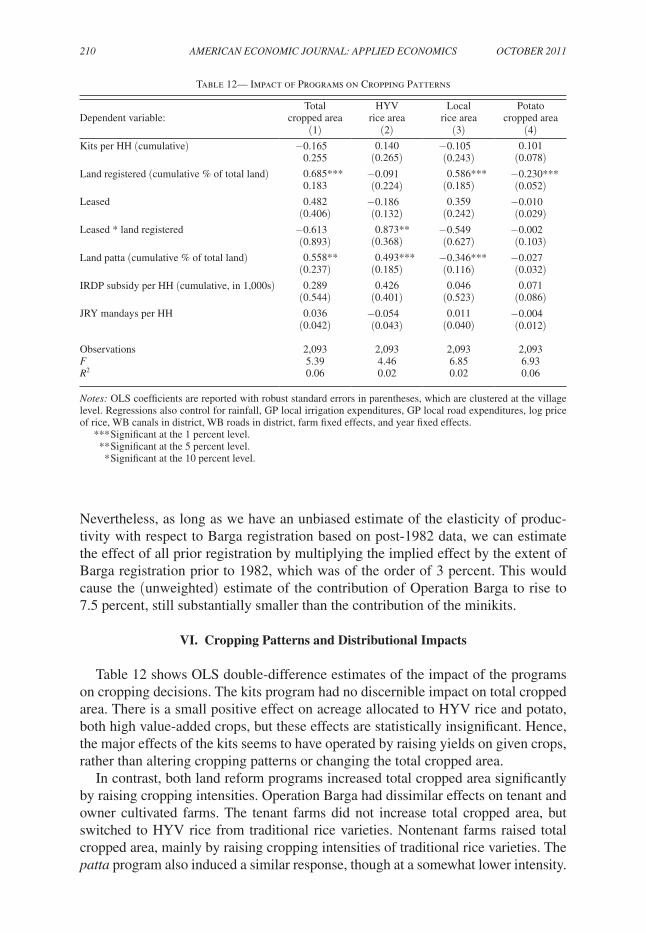
210 AMEricAN EcONOMic JOurNAL: AppLiEd EcONOMics OcTOBEr 2011
Nevertheless, as long as we have an unbiased estimate of the elasticity of produc-tivity with respect to Barga registration based on post-1982 data, we can estimate the effect of all prior registration by multiplying the implied effect by the extent of Barga registration prior to 1982, which was of the order of 3 percent. This would cause the (unweighted) estimate of the contribution of Operation Barga to rise to 7.5 percent, still substantially smaller than the contribution of the minikits.
VI. Cropping Patterns and Distributional Impacts
Table 12 shows OLS double-difference estimates of the impact of the programs on cropping decisions. The kits program had no discernible impact on total cropped area. There is a small positive effect on acreage allocated to HYV rice and potato, both high value-added crops, but these effects are statistically insignificant. Hence, the major effects of the kits seems to have operated by raising yields on given crops, rather than altering cropping patterns or changing the total cropped area.
In contrast, both land reform programs increased total cropped area significantly by raising cropping intensities. Operation Barga had dissimilar effects on tenant and owner cultivated farms. The tenant farms did not increase total cropped area, but switched to HYV rice from traditional rice varieties. Nontenant farms raised total cropped area, mainly by raising cropping intensities of traditional rice varieties. The patta program also induced a similar response, though at a somewhat lower intensity.
Table 12— Impact of Programs on Cropping Patterns
Dependent variable:Total
cropped area HYV
rice area Local
rice areaPotato
cropped area(1) (2) (3) (4)
Kits per HH (cumulative) −0.1650.255
0.140(0.265)
−0.105(0.243)
0.101(0.078)
Land registered (cumulative % of total land) 0.685***0.183
−0.091(0.224)
0.586***(0.185)
−0.230***(0.052)
Leased 0.482(0.406)
−0.186(0.132)
0.359(0.242)
−0.010(0.029)
Leased * land registered −0.613(0.893)
0.873**(0.368)
−0.549(0.627)
−0.002(0.103)
Land patta (cumulative % of total land) 0.558**(0.237)
0.493***(0.185)
−0.346***(0.116)
−0.027(0.032)
IRDP subsidy per HH (cumulative, in 1,000s) 0.289(0.544)
0.426(0.401)
0.046(0.523)
0.071(0.086)
JRY mandays per HH 0.036(0.042)
−0.054(0.043)
0.011(0.040)
−0.004(0.012)
Observations 2,093 2,093 2,093 2,093F 5.39 4.46 6.85 6.93r2 0.06 0.02 0.02 0.06
Notes: OLS coefficients are reported with robust standard errors in parentheses, which are clustered at the village level. Regressions also control for rainfall, GP local irrigation expenditures, GP local road expenditures, log price of rice, WB canals in district, WB roads in district, farm fixed effects, and year fixed effects.
*** Significant at the 1 percent level. ** Significant at the 5 percent level. * Significant at the 10 percent level.
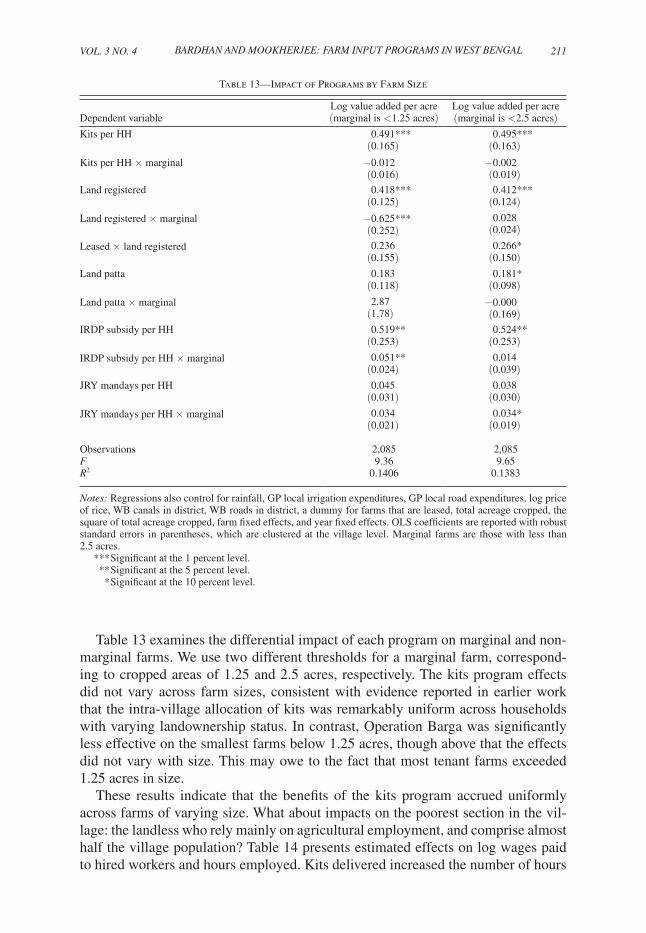
VOL. 3 NO. 4 211BArdhAN ANd MOOkhErJEE: FArM iNpuT prOgrAMs iN WEsT BENgAL
Table 13 examines the differential impact of each program on marginal and non-marginal farms. We use two different thresholds for a marginal farm, correspond-ing to cropped areas of 1.25 and 2.5 acres, respectively. The kits program effects did not vary across farm sizes, consistent with evidence reported in earlier work that the intra-village allocation of kits was remarkably uniform across households with varying landownership status. In contrast, Operation Barga was significantly less effective on the smallest farms below 1.25 acres, though above that the effects did not vary with size. This may owe to the fact that most tenant farms exceeded 1.25 acres in size.
These results indicate that the benefits of the kits program accrued uniformly across farms of varying size. What about impacts on the poorest section in the vil-lage: the landless who rely mainly on agricultural employment, and comprise almost half the village population? Table 14 presents estimated effects on log wages paid to hired workers and hours employed. Kits delivered increased the number of hours
Table 13—Impact of Programs by Farm Size
Dependent variableLog value added per acre (marginal is <1.25 acres)
Log value added per acre (marginal is <2.5 acres)
Kits per HH 0.491***(0.165)
0.495***(0.163)
Kits per HH × marginal −0.012(0.016)
−0.002(0.019)
Land registered 0.418***(0.125)
0.412***(0.124)
Land registered × marginal −0.625***(0.252)
0.028(0.024)
Leased × land registered 0.236(0.155)
0.266*(0.150)
Land patta 0.183(0.118)
0.181*(0.098)
Land patta × marginal 2.87(1.78)
−0.000(0.169)
IRDP subsidy per HH 0.519**(0.253)
0.524**(0.253)
IRDP subsidy per HH × marginal 0.051**(0.024)
0.014(0.039)
JRY mandays per HH 0.045(0.031)
0.038(0.030)
JRY mandays per HH × marginal 0.034(0.021)
0.034*(0.019)
Observations 2,085 2,085F 9.36 9.65r2 0.1406 0.1383
Notes: Regressions also control for rainfall, GP local irrigation expenditures, GP local road expenditures, log price of rice, WB canals in district, WB roads in district, a dummy for farms that are leased, total acreage cropped, the square of total acreage cropped, farm fixed effects, and year fixed effects. OLS coefficients are reported with robust standard errors in parentheses, which are clustered at the village level. Marginal farms are those with less than 2.5 acres.
*** Significant at the 1 percent level. ** Significant at the 5 percent level. * Significant at the 10 percent level.
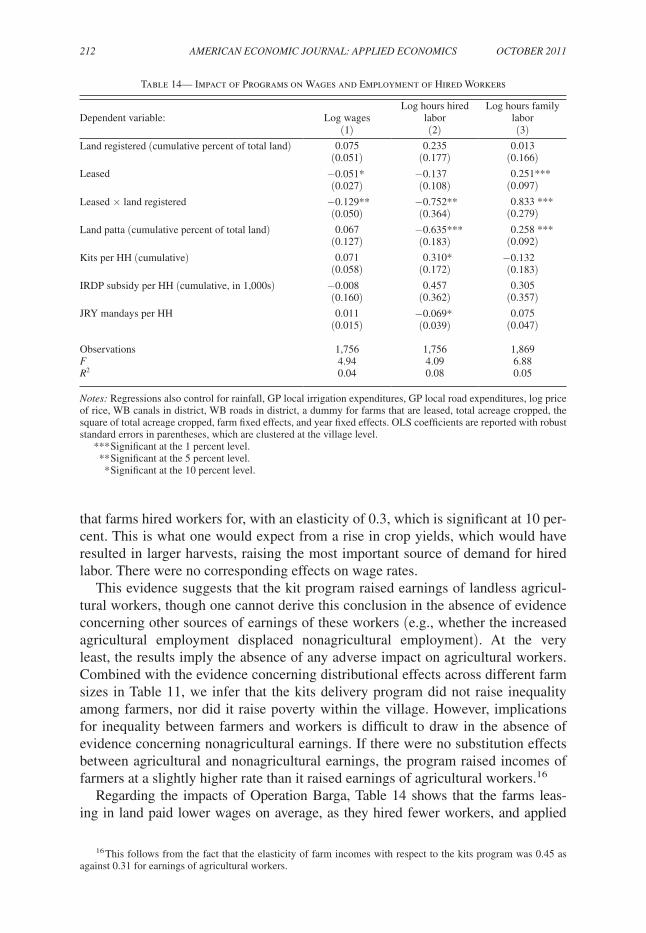
212 AMEricAN EcONOMic JOurNAL: AppLiEd EcONOMics OcTOBEr 2011
that farms hired workers for, with an elasticity of 0.3, which is significant at 10 per-cent. This is what one would expect from a rise in crop yields, which would have resulted in larger harvests, raising the most important source of demand for hired labor. There were no corresponding effects on wage rates.
This evidence suggests that the kit program raised earnings of landless agricul-tural workers, though one cannot derive this conclusion in the absence of evidence concerning other sources of earnings of these workers (e.g., whether the increased agricultural employment displaced nonagricultural employment). At the very least, the results imply the absence of any adverse impact on agricultural workers. Combined with the evidence concerning distributional effects across different farm sizes in Table 11, we infer that the kits delivery program did not raise inequality among farmers, nor did it raise poverty within the village. However, implications for inequality between farmers and workers is difficult to draw in the absence of evidence concerning nonagricultural earnings. If there were no substitution effects between agricultural and nonagricultural earnings, the program raised incomes of farmers at a slightly higher rate than it raised earnings of agricultural workers.16
Regarding the impacts of Operation Barga, Table 14 shows that the farms leas-ing in land paid lower wages on average, as they hired fewer workers, and applied
16 This follows from the fact that the elasticity of farm incomes with respect to the kits program was 0.45 as against 0.31 for earnings of agricultural workers.
Table 14— Impact of Programs on Wages and Employment of Hired Workers
Dependent variable: Log wagesLog hours hired
laborLog hours family
labor(1) (2) (3)
Land registered (cumulative percent of total land) 0.075(0.051)
0.235(0.177)
0.013(0.166)
Leased −0.051*(0.027)
−0.137(0.108)
0.251***(0.097)
Leased × land registered −0.129**(0.050)
−0.752**(0.364)
0.833 ***(0.279)
Land patta (cumulative percent of total land) 0.067(0.127)
−0.635***(0.183)
0.258 ***(0.092)
Kits per HH (cumulative) 0.071(0.058)
0.310*(0.172)
−0.132(0.183)
IRDP subsidy per HH (cumulative, in 1,000s) −0.008(0.160)
0.457(0.362)
0.305(0.357)
JRY mandays per HH 0.011(0.015)
−0.069*(0.039)
0.075(0.047)
Observations 1,756 1,756 1,869F 4.94 4.09 6.88r2 0.04 0.08 0.05
Notes: Regressions also control for rainfall, GP local irrigation expenditures, GP local road expenditures, log price of rice, WB canals in district, WB roads in district, a dummy for farms that are leased, total acreage cropped, the square of total acreage cropped, farm fixed effects, and year fixed effects. OLS coefficients are reported with robust standard errors in parentheses, which are clustered at the village level.
*** Significant at the 1 percent level. ** Significant at the 5 percent level. * Significant at the 10 percent level.
VOL. 3 NO. 4 213BArdhAN ANd MOOkhErJEE: FArM iNpuT prOgrAMs iN WEsT BENgAL
more family labor. Operation Barga widened the wage differential between tenant and nontenant farms significantly. As columns 2 and 3 show, this is accounted for by an almost one-for-one substitution of family labor for hired labor on tenant farms induced by Operation Barga. Owner-cultivated farms hired more workers (with an elasticity of 0.24) and paid higher wages (an elasticity of 0.08), though these are imprecisely estimated. Hence, it is difficult to infer the effects of Operation Barga on earnings of agricultural workers on owner-cultivated farms which comprise the majority of the sample. But the effects on worker earnings was significantly negative among those employed on tenant farms, owing to a significant reduction in the wage rates paid.
VII. Conclusion
To summarize, we have found that minikits delivered by local governments in West Bengal had a large impact on farm productivity, contributing 17 percent, 16 percent, and 8 percent, respectively, to productivity growth in each of the three periods studied (1982–1985, 1986–1990, 1991–1995). Collectively this amounts to over 40 percent growth out of a total observed growth of 67 percent. The kits had no significant effect on cropping patterns or areas, implying that they were effective principally by raising crop yields. These benefits accrued uniformly across farms of varying size, and raised agricultural earnings of hired workers by an extent slightly smaller than the effect on farm incomes. Some of the other programs also contrib-uted to rising productivity, such as tenancy registration, local government minor irrigation programs, and IRDP credit provision. But the most significant contribu-tion was made by the minikit program.
Our analysis is subject to a number of shortcomings. The coverage of the farm data in each of the panels was incomplete, though the data concerning the village programs was not subject to this problem. The coverage of the early years of Left-Front rule was thin, owing to the absence of farm-level data prior to 1982, and the limited coverage of the first panel between 1982 and 1985. Our inability to match the farmers with direct recipients of the various extension programs prevented us from separating direct effects from their diffusion. A structural model could have thrown more light on the channels by which the reform effects spread through the village, via learning, competition or induced private investments.
It is also important to reiterate that our results pertain to effects on productivity within farms, rather than to possible effects on the composition of farms distin-guished by size or ownership status. Analysis of the latter channels is beyond the scope of this paper, as it necessitates examining induced general equilibrium effects on leasing, or entry and exit of farms via the land market or patterns of household division. We are studying these in a subsequent paper (Bardhan et al. 2010).
REFERENCES
Appu, P. S. 1996. Land reforms in india: A survey of policy Legislation and implementation. New Delhi: Vikas Publishing House.
Arellano, Manuel, and Stephen Bond. 1991. “Some Tests of Specification for Panel Data: Monte Carlo Evidence and an Application to Employment Equations.” review of Economic studies, 58(2): 277–97.
214 AMEricAN EcONOMic JOurNAL: AppLiEd EcONOMics OcTOBEr 2011
Banerjee, Abhijit V., Paul J. Gertler, and Maitreesh Ghatak. 2002. “Empowerment and Efficiency: Tenancy Reform in West Bengal.” Journal of political Economy, 110(2): 239–80.
Bardhan, Pranab K. 1973. “Size, Productivity, and Returns to Scale: An Analysis of Farm-Level Data in Indian Agriculture.” Journal of political Economy, 81(6): 1370–86.
Bardhan, Pranab, Michael Luca, Dilip Mookherjee, and Francisco Pino. 2010. “Evolution of Land Distribution in West Bengal 1967–2003: Role of Land Reform.” Unpublished.
Bardhan, Pranab, and Dilip Mookherjee. 2006. “Pro-poor Targeting and Accountability of Local Gov-ernments in West Bengal.” Journal of development Economics, 79(2): 303–27.
Bardhan, Pranab, and Dilip Mookherjee. 2010. “Determinants of Redistributive Politics: An Empiri-cal Analysis of Land Reforms in West Bengal, India.” American Economic review, 100(4): 1572–1600.
Bardhan, Pranab, and Dilip Mookherjee. 2011. “Subsidized Farm Input Programs and Agricultural Per-formance: A Farm-Level Analysis of West Bengal’s Green Revolution, 1982–1995: Dataset.” Amer-ican Economic Journal: Applied Economics. http://www.aeaweb.org/articles.php?doi=10.1257/app.3.4.186.
Bardhan, Pranab, Dilip Mookherjee, and Neha Kumar. 2009. “State-led or Market-led Green Revolu-tion? Role of Private Irrigation Investment vis-a-vis Local Government Programs in West Bengal’s Farm Productivity Growth.” Boston University, Department of Economics, Institute for Economic Development Working Paper 184.
Bardhan, Pranab, and Christopher Udry. 1999. development Microeconomics. Oxford, UK: Oxford University Press.
Besley, Timothy, and Robin Burgess. 2000. “Land Reform, Poverty Reduction, and Growth: Evidence from India.” Quarterly Journal of Economics, 115(2): 389–430.
Boyce, James K. 1987. Agrarian impasse in Bengal: institutional constraints to Technological change. Oxford, UK: Oxford University Press.
Conley, Timothy G., and Christopher R. Udry. 2010. “Learning about a New Technology: Pineapple in Ghana.” American Economic review, 100(1): 35–69.
Datta Ray, S. 1994. “Growth of Agriculture in West Bengal.” Economic and political Weekly, 29(47): 2999–3000.
Donald, Stephen G., and Kevin Lang. 2007. “Inference with Difference-in-Differences and Other Panel Data.” review of Economics and statistics, 89(2): 221–33.
Duflo, Esther, Michael Kremer, and Jonathan Robinson. 2010. “Nudging Farmers to Use Fertilizer: Theory and Experimental Evidence from Kenya.” Department of Economics, MIT Working Paper.
Economic Review of West Bengal. Various years. Available from Bureau of Applied Economics and Statistics, Government of West Bengal. http.//www.wbplan.gov.in/htm/AboutUs/BAESD/Publications.htm.
Eswaran, Mukesh, and Ashok Kotwal. 1986. “Access to Capital and Agrarian Production Organisa-tion.” Economic Journal, 96(382): 482–98.
Foster, Andrew, and Mark Rosenzweig. 1995. “Learning by Doing and Learning from Others: Human Capital and Technical Change in Agriculture.” Journal of political Economy, 103 (1176–1209).
Foster, Andrew, and Mark Rosenzweig. 2010. “Microeconomics of Technology Adoption.” Yale Uni-versity Working Paper 78.
Jorgensen, Dale W. 1967. “Surplus Agricultural Labour and the Development of a Dual Economy.” Oxford Economic papers, 19(3): 288–312.
Lieten, Georges K. 1992. continuity and change in rural West Bengal. New Delhi: Sage Publications. Saha, Anamitra, and Madhura Swaminathan. 1994. “Agricultural Growth in West Bengal in the
1980s.” Economic and political Weekly, 29(13): A2–A11. Sen, Amartya K. 1966. “Peasants and Dualism with or without Surplus Labor.” Journal of political
Economy, 74(5), 425–50. Sengupta, Sunil, and Haris Gazdar. 1996. “Agrarian Politics and Rural Development in West Bengal.”
In indian development: selected regional perspectives, ed. Jean Drèze and Amartya Sen. New Delhi: Oxford University Press: 129–204.
West Bengal Election Statistics. Available from Election Commission of India. http://eci.nic.in/eci_main/statisticalreports/electionstatistics.asp.