Embed Size (px)
Citation preview
1 Copyright © 2013 by ASME
Proceedings of the ASME 2013 32nd International Conference on Ocean, Offshore and Arctic Engineering OMAE2013
June 9-14, 2013, Nantes, France
OMAE2013-11011
SUBSEA JUMPERS VIBRATION ASSESSMENT
Dhyan Deka 2H Offshore Inc.
Houston, TX, U.S.A.
Mark Cerkovnik 2H Offshore Inc.
Houston, TX, U.S.A
Nikhil Panicker 2H Offshore Inc
Houston, TX, U.S.A.
Vamsee Achanta 2H Offshore Inc
Houston, TX, U.S.A.
ABSTRACT
Subsea rigid jumpers which are used to connect flowlines
and risers to other subsea structures are inherently susceptible
to vibration because they must be flexible enough to
accommodate translation of the flowline, installation tolerances
and settlement of pipeline end terminations (PLETs.) In
locations where there are bottom currents, the jumpers can be
subjected to vortex induced vibrations. When internal flow
rates are high, they are susceptible to flow induced vibration,
and they may also be excited by slugging. In some cases, the
design constraints force the designs to be 3 dimensional and
employ strategies to enhance damping.
This paper describes a methodology for assessing subsea
jumpers for vibration induced fatigue. The method employs a
combination of transient dynamic, harmonic and modal finite
element analysis with the VIV tool SHEAR7. The methodology
is able to show generally improved VIV fatigue lives compared
to more traditional methods based on DNV-RP-F105 because of
the ability to define current loading over the jumper length and
to assess the effects of strakes and coulomb damping. Further,
the methodology is also capable of assessing the effect of tuned
vibration dampers which are sometimes used to suppress FIV.
Keywords: Jumper, VIV, Slugging, Fatigue
INTRODUCTION Subsea jumpers are rigid pipe sections that connect subsea
architecture such as pipelines to manifolds, flowlines to trees,
or pipelines to risers. The jumpers are designed with bends to
allow for expansion and contraction of the flowline or pipeline
due to changes in pressure and temperature. Jumpers are
susceptible to vibration fatigue from a variety of sources such
as external environment, internal flow turbulence and slug
movement. Anecdotal reports of jumper failure are available
and such failures have adverse effects on safety, environment,
and production. Further, remoteness of these jumpers makes
repair difficult and costly.
This paper presents practical analysis methods to
determine jumper fatigue damage. The fatigue components
studied here are VIV and slugging. VIV of risers is well studied
in the industry and empirical tools such as SHEAR7, VIVA and
VIVANA are available. In the recent years, a great deal of data
has been gathered on risers because of the high consequence of
riser failure. However, little or no data exists in the public
domain on jumper VIV response. CFD based fully coupled
analysis has been used in recent papers for jumper vibration
analysis [1]. CFD is a robust tool but is computationally
expensive. At the other end of the spectrum is the usage of the
spanning pipeline code DNV-RP-F105 [2] which is simple to
use but conservative for jumper analysis. The present work uses
the latest version of SHEAR7 (v4.7) [3] to evaluate jumper
fatigue from a sheared current profile. SHEAR7 offers
advantages over DNV-RP-F105 by allowing hydrodynamic
damping of power out zones, flexibility to include strakes and
external dampers. In addition to predicting the amplitude of
crossflow VIV, SHEAR7 v4.7 provides lift curves to simulate
first mode inline VIV.
There are two primary phenomena caused by internal fluid
slugging that can be responsible for fatigue damage of a rigid
jumper carrying multi-phase fluids. Firstly, changes of internal
fluid weight causes a change in the deflected shape of the rigid
jumper. Secondly, repetitive inertial forces are applied on the
jumper bends as the slugs pass through. In this work, the
gravity loads are calculated by tracking a slug’s position with
time and applying the change in weight as a point load on each
location that the slug passes through. Similarly, a time series of
inertial forces is calculated for each location through
application of Newton’s Second Law for a finite control
volume. It is assumed that the fluid velocity along the pipe’s
length is constant and the flow is laminar. These force
timetraces are then applied to a rigid jumper model in a
transient finite element analysis and fatigue damage is
calculated using a rainflow counting approach. Typically
slugging is described in statistical terms with the slug
frequency, length, and sometimes density being treated as
random variables. The presented approach is pragmatic for
assessment of large number of loading conditions that typical
jumper design problems often present. In this approach the
2 Copyright © 2013 by ASME
sensitivity to a range of slugging characteristics can be assessed
relatively quickly. In contrast, the CFD approach requires
considerably more effort to assess similar structural effects.
[4][5][6].
There are other sources of jumper vibration that are not
discussed in detail in this paper. These include wave induced
fatigue in shallow water depths, FIV generated from turbulence
and cyclic loading on jumper from pipeline expansion and
contraction. Turbulent flow induced vibration has been
observed in offshore fields and typically the amplitude of FIV
is small. Correct simulation of turbulence is not trivial and
requires a coupled fluid structure analysis. A recent paper [7]
recommends safety factor of 15-20 for flow induced turbulence.
The forcing function for FIV has not been well defined for
application to jumper design problems and monitoring
programs are required for FIV determination.
In the assessment of fatigue, the loading from adjacent
structure should not be overlooked. In the case of riser base
jumpers, the riser motions may result in displacements of the
jumper. For flowline jumpers, under the operational variations
of pressure and temperature, the adjacent pipeline will
experience cycles of expansion and contraction which will
generate displacement of the rigid jumper end connection. The
consequent fatigue stress cycles in the jumpers can be captured
using an FE model, and a histogram of stress can be
constructed with knowledge of the pressure and temperature
variations.
NOMENCLATURE A/D – Ratio of amplitude of motion to diameter
CFD – Computational Fluid Dynamics
FIV – Flow Induced Vibration
JIP – Joint Industry Program
PLET – Pipeline End Termination
SCF – Stress Concentration Factor
TRW – Topographic Rossby Waves
VIV – Vortex Induced Vibration
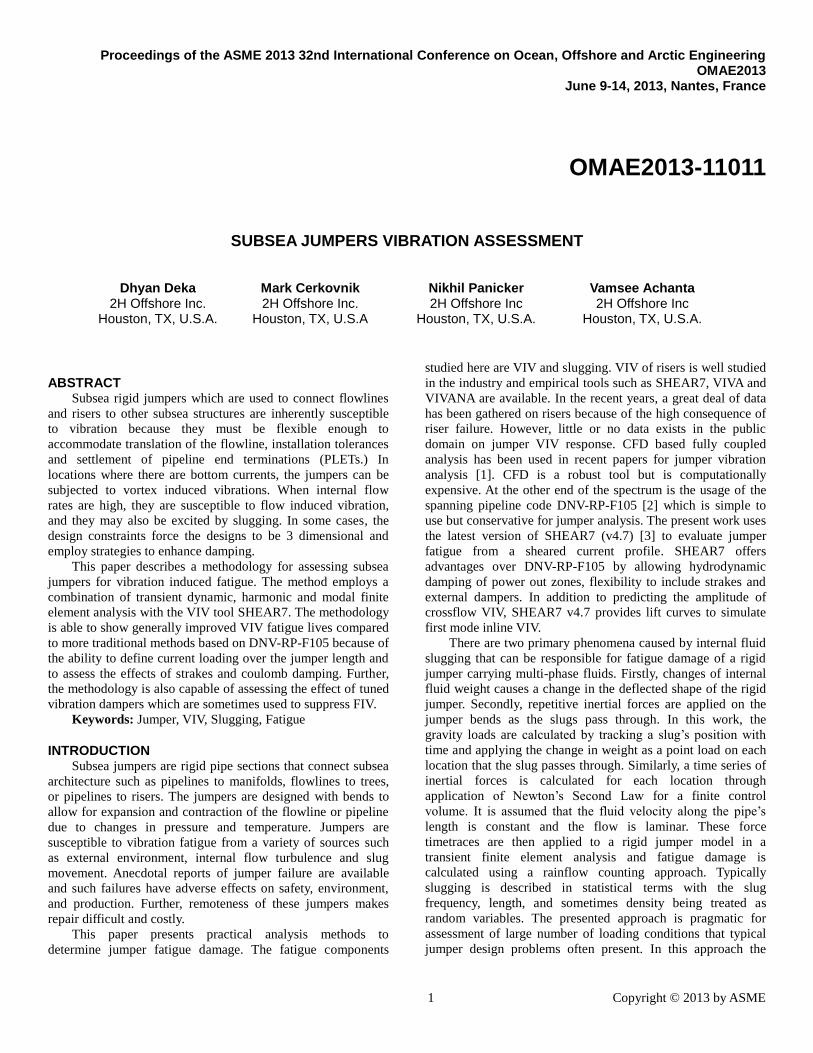
STUDIED JUMPER GEOMETRY A multi-planar jumper is selected for the study. The jumper
is shown in Figure 1. Multi-planar jumpers provide increased
flexibility compared to traditional M shapes but can be
susceptible to increased fatigue loads from bending and torsion
loads. The jumper is made of thick welded steel and is
composed of two bends in 3D space. The pipe OD is 508mm
and wall thickness is 11mm. The jumper is restrained near the
top with a clamp modeled as fixity in the present study. The
jumper is restrained in the lateral directions by a sliding clamp
in the middle of the vertical section. Seabed support is provided
in the form of grout bags in the third leg (along X axis). The
middle span (aligned close to Y axis) is unsupported. The
jumper touch down point is close to the grout support. The FE
model of the jumper includes seabed interaction using vertical
and lateral soil springs. Soil stiffness is calculated based on
small displacement dynamic pipe/soil interaction model
proposed by STRIDE JIP [8][9]. The internal fluid of the
jumper is assumed as 815 kg/m3 crude.
Figure 1 - 3D Jumper Geometry
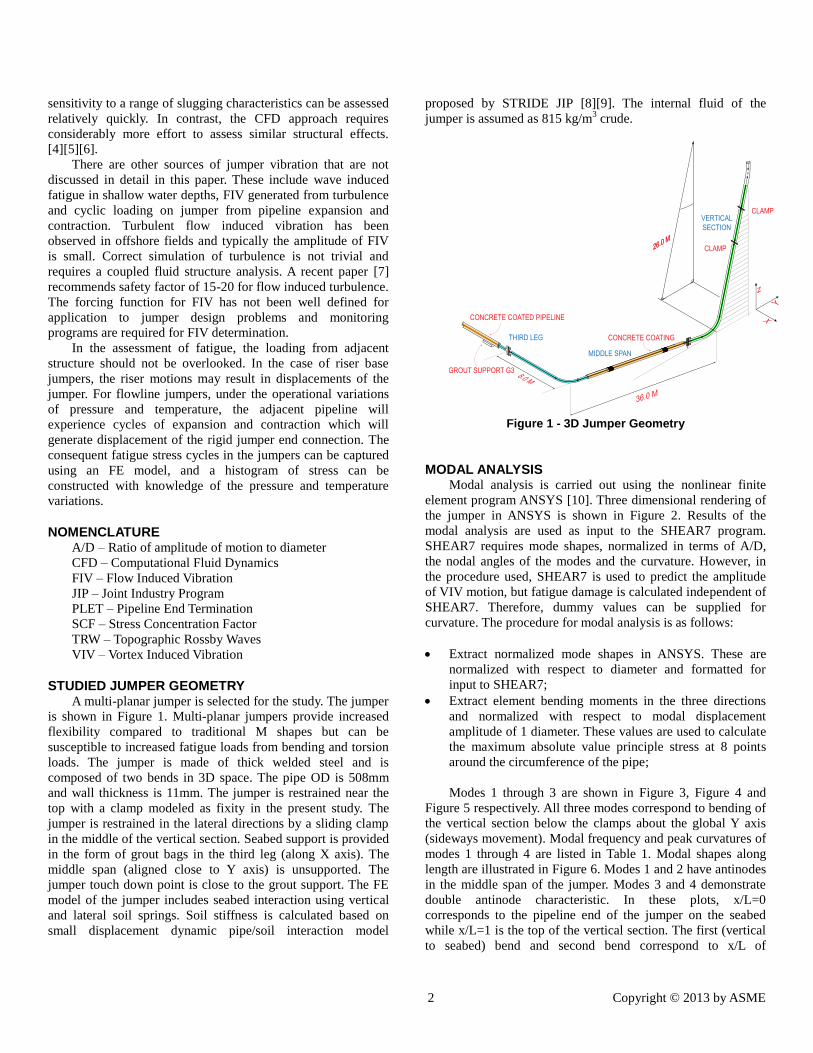
MODAL ANALYSIS Modal analysis is carried out using the nonlinear finite
element program ANSYS [10]. Three dimensional rendering of
the jumper in ANSYS is shown in Figure 2. Results of the
modal analysis are used as input to the SHEAR7 program.
SHEAR7 requires mode shapes, normalized in terms of A/D,
the nodal angles of the modes and the curvature. However, in
the procedure used, SHEAR7 is used to predict the amplitude
of VIV motion, but fatigue damage is calculated independent of
SHEAR7. Therefore, dummy values can be supplied for
curvature. The procedure for modal analysis is as follows:
Extract normalized mode shapes in ANSYS. These are
normalized with respect to diameter and formatted for
input to SHEAR7;
Extract element bending moments in the three directions
and normalized with respect to modal displacement
amplitude of 1 diameter. These values are used to calculate
the maximum absolute value principle stress at 8 points
around the circumference of the pipe;
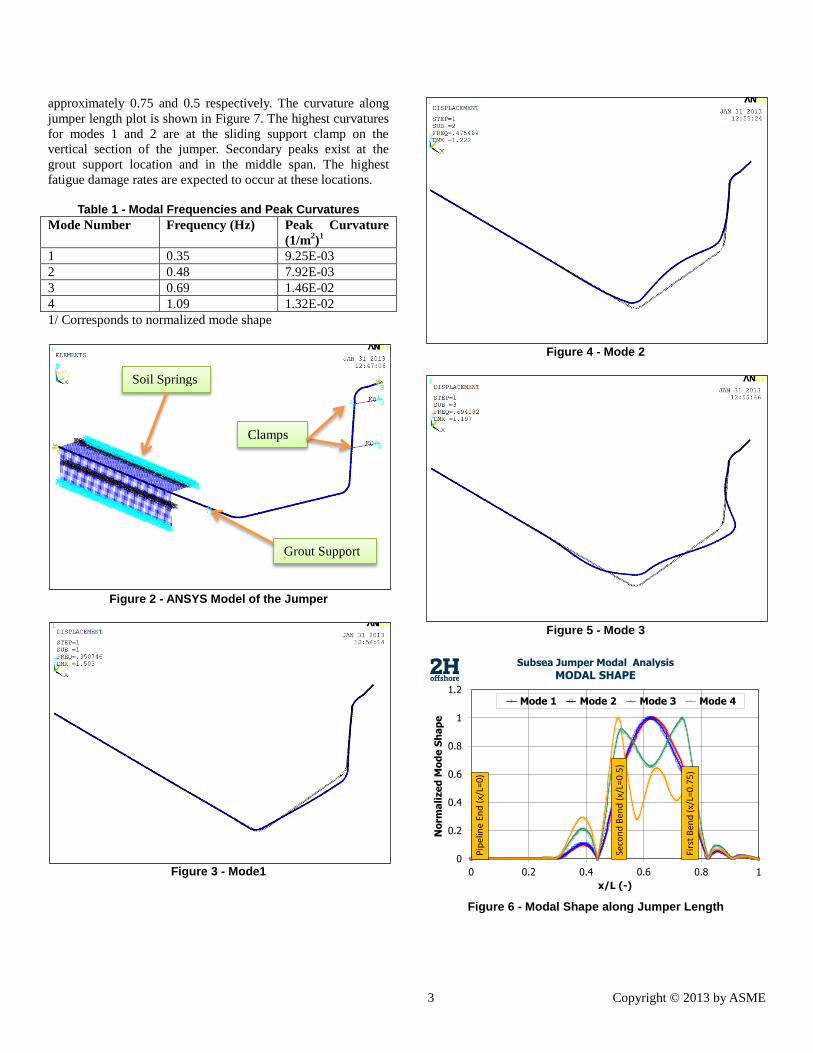
Modes 1 through 3 are shown in Figure 3, Figure 4 and
Figure 5 respectively. All three modes correspond to bending of
the vertical section below the clamps about the global Y axis
(sideways movement). Modal frequency and peak curvatures of
modes 1 through 4 are listed in Table 1. Modal shapes along
length are illustrated in Figure 6. Modes 1 and 2 have antinodes
in the middle span of the jumper. Modes 3 and 4 demonstrate
double antinode characteristic. In these plots, x/L=0
corresponds to the pipeline end of the jumper on the seabed
while x/L=1 is the top of the vertical section. The first (vertical
to seabed) bend and second bend correspond to x/L of
3 Copyright © 2013 by ASME
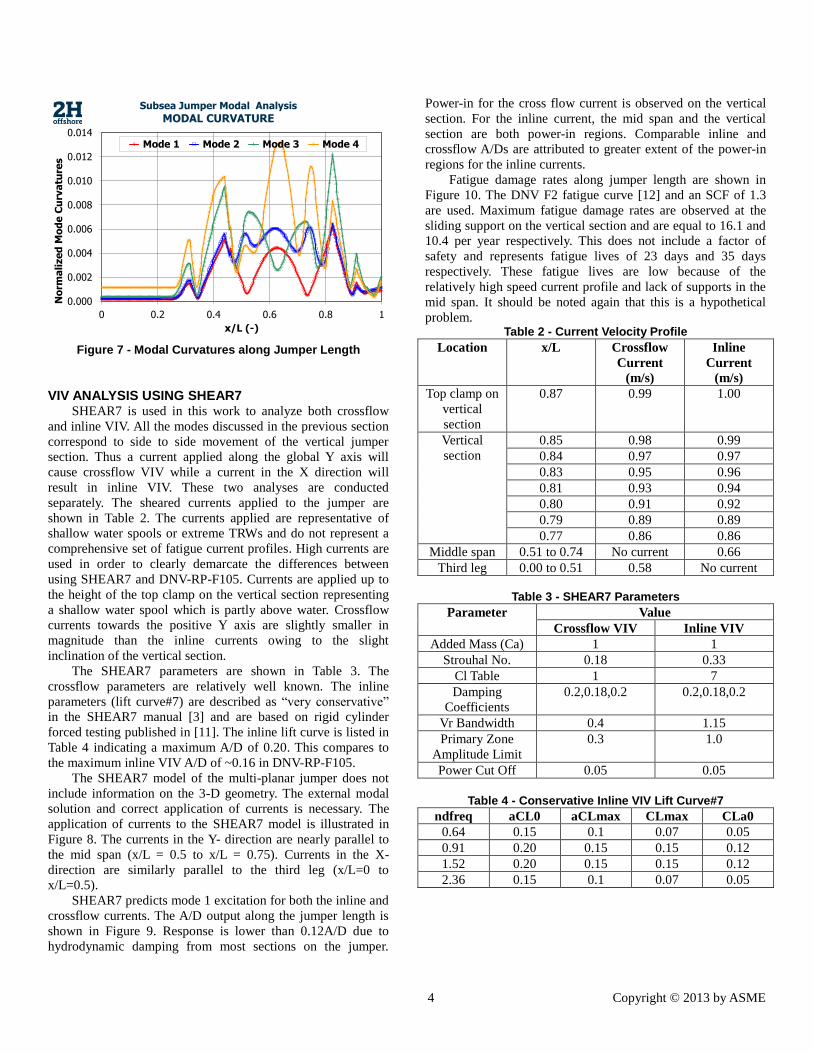
approximately 0.75 and 0.5 respectively. The curvature along
jumper length plot is shown in Figure 7. The highest curvatures
for modes 1 and 2 are at the sliding support clamp on the
vertical section of the jumper. Secondary peaks exist at the
grout support location and in the middle span. The highest
fatigue damage rates are expected to occur at these locations.
Table 1 - Modal Frequencies and Peak Curvatures
Mode Number Frequency (Hz) Peak Curvature
(1/m2)
1
1 0.35 9.25E-03
2 0.48 7.92E-03
3 0.69 1.46E-02
4 1.09 1.32E-02
1/ Corresponds to normalized mode shape
Figure 2 - ANSYS Model of the Jumper
Figure 3 - Mode1
Figure 4 - Mode 2
Figure 5 - Mode 3
Figure 6 - Modal Shape along Jumper Length
0
0.2
0.4
0.6
0.8
1
1.2
0 0.2 0.4 0.6 0.8 1
No
rma
lize
d M
od
e S
ha
pe
x/L (-)
Subsea Jumper Modal Analysis
MODAL SHAPE
Mode 1 Mode 2 Mode 3 Mode 4
Seco
nd
Ben
d (
x/L=
0.5
)
Pip
elin
e En
d (
x/L=
0)
Firs
t B
end
(x/
L=0
.75
)
Soil Springs
Grout Support
Clamps
4 Copyright © 2013 by ASME
Figure 7 - Modal Curvatures along Jumper Length
VIV ANALYSIS USING SHEAR7 SHEAR7 is used in this work to analyze both crossflow
and inline VIV. All the modes discussed in the previous section
correspond to side to side movement of the vertical jumper
section. Thus a current applied along the global Y axis will
cause crossflow VIV while a current in the X direction will
result in inline VIV. These two analyses are conducted
separately. The sheared currents applied to the jumper are
shown in Table 2. The currents applied are representative of
shallow water spools or extreme TRWs and do not represent a
comprehensive set of fatigue current profiles. High currents are
used in order to clearly demarcate the differences between
using SHEAR7 and DNV-RP-F105. Currents are applied up to
the height of the top clamp on the vertical section representing
a shallow water spool which is partly above water. Crossflow
currents towards the positive Y axis are slightly smaller in
magnitude than the inline currents owing to the slight
inclination of the vertical section.
The SHEAR7 parameters are shown in Table 3. The
crossflow parameters are relatively well known. The inline
parameters (lift curve#7) are described as “very conservative”
in the SHEAR7 manual [3] and are based on rigid cylinder
forced testing published in [11]. The inline lift curve is listed in
Table 4 indicating a maximum A/D of 0.20. This compares to
the maximum inline VIV A/D of ~0.16 in DNV-RP-F105.
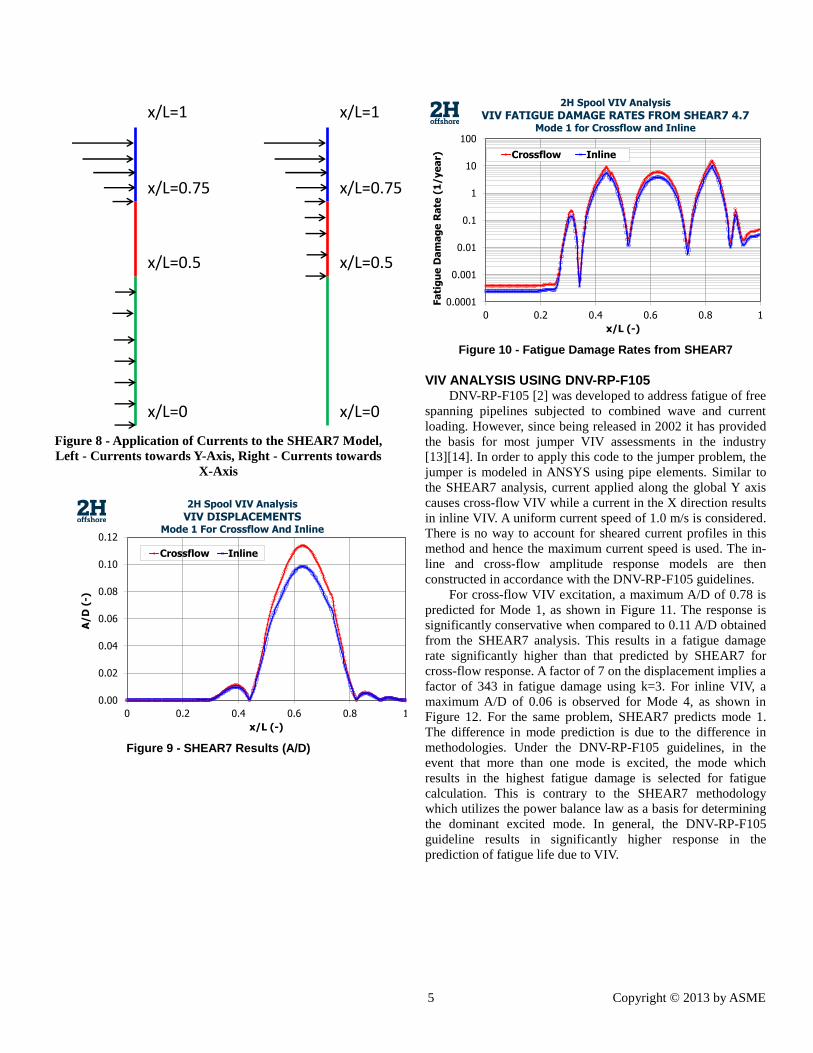
The SHEAR7 model of the multi-planar jumper does not
include information on the 3-D geometry. The external modal
solution and correct application of currents is necessary. The
application of currents to the SHEAR7 model is illustrated in
Figure 8. The currents in the Y- direction are nearly parallel to
the mid span (x/L = 0.5 to x/L = 0.75). Currents in the X-
direction are similarly parallel to the third leg (x/L=0 to
x/L=0.5).
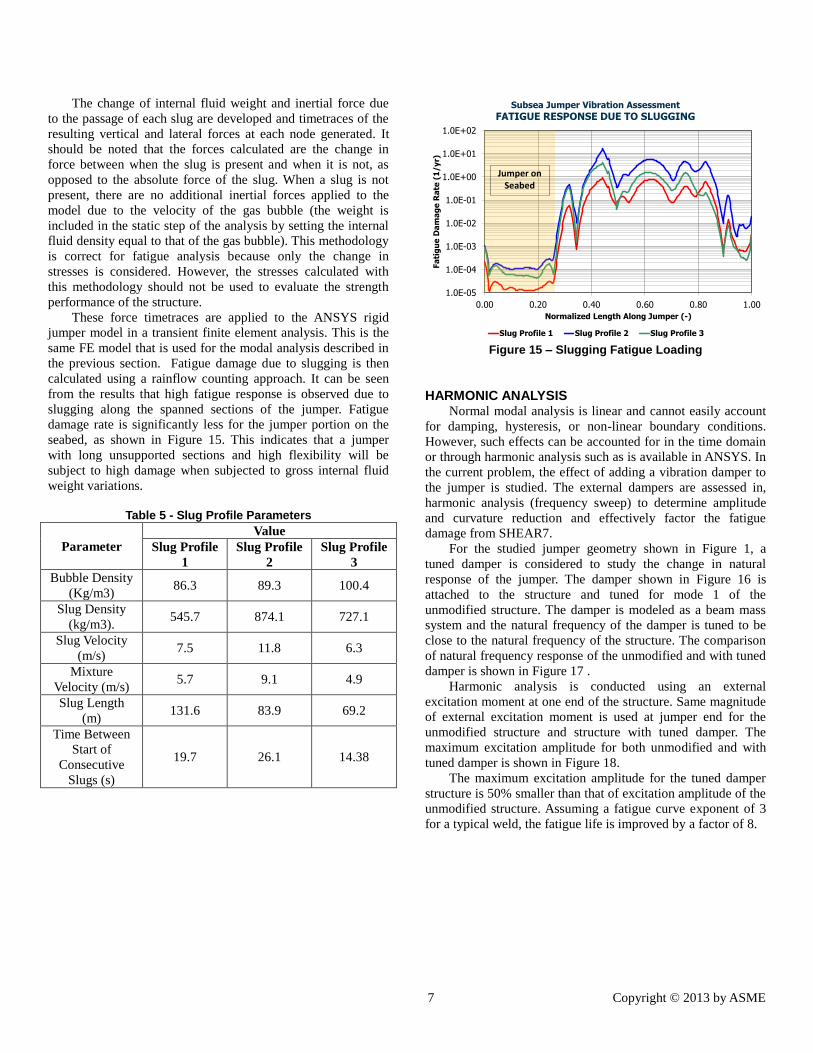
SHEAR7 predicts mode 1 excitation for both the inline and
crossflow currents. The A/D output along the jumper length is
shown in Figure 9. Response is lower than 0.12A/D due to
hydrodynamic damping from most sections on the jumper.
Power-in for the cross flow current is observed on the vertical
section. For the inline current, the mid span and the vertical
section are both power-in regions. Comparable inline and
crossflow A/Ds are attributed to greater extent of the power-in
regions for the inline currents.
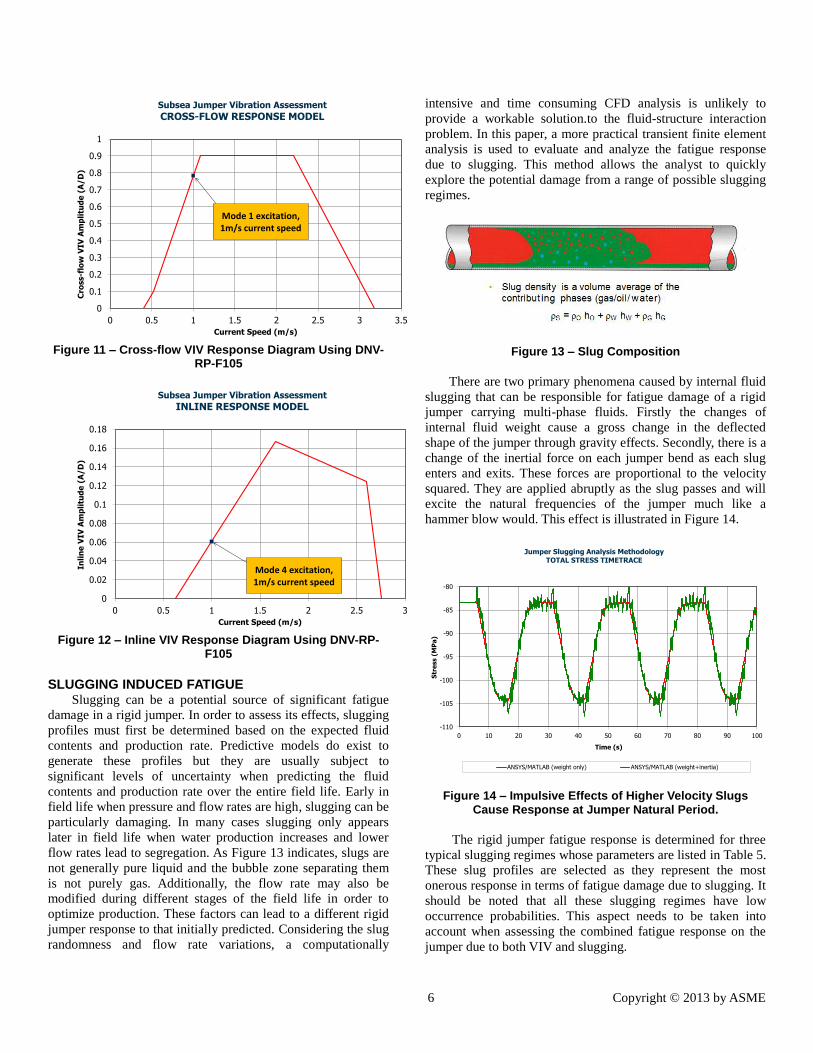
Fatigue damage rates along jumper length are shown in
Figure 10. The DNV F2 fatigue curve [12] and an SCF of 1.3
are used. Maximum fatigue damage rates are observed at the
sliding support on the vertical section and are equal to 16.1 and
10.4 per year respectively. This does not include a factor of
safety and represents fatigue lives of 23 days and 35 days
respectively. These fatigue lives are low because of the
relatively high speed current profile and lack of supports in the
mid span. It should be noted again that this is a hypothetical
problem. Table 2 - Current Velocity Profile
Location x/L Crossflow
Current
(m/s)
Inline
Current
(m/s)
Top clamp on
vertical
section
0.87 0.99 1.00
Vertical
section
0.85 0.98 0.99
0.84 0.97 0.97
0.83 0.95 0.96
0.81 0.93 0.94
0.80 0.91 0.92
0.79 0.89 0.89
0.77 0.86 0.86
Middle span 0.51 to 0.74 No current 0.66
Third leg 0.00 to 0.51 0.58 No current
Table 3 - SHEAR7 Parameters
Parameter Value
Crossflow VIV Inline VIV
Added Mass (Ca) 1 1
Strouhal No. 0.18 0.33
Cl Table 1 7
Damping
Coefficients
0.2,0.18,0.2 0.2,0.18,0.2
Vr Bandwidth 0.4 1.15
Primary Zone
Amplitude Limit
0.3 1.0
Power Cut Off 0.05 0.05
Table 4 - Conservative Inline VIV Lift Curve#7
ndfreq aCL0 aCLmax CLmax CLa0
0.64 0.15 0.1 0.07 0.05
0.91 0.20 0.15 0.15 0.12
1.52 0.20 0.15 0.15 0.12
2.36 0.15 0.1 0.07 0.05
0.000
0.002
0.004
0.006
0.008
0.010
0.012
0.014
0 0.2 0.4 0.6 0.8 1
No
rma
lize
d M
od
e C
urv
atu
res
x/L (-)
Subsea Jumper Modal Analysis
MODAL CURVATURE
Mode 1 Mode 2 Mode 3 Mode 4
5 Copyright © 2013 by ASME
Figure 8 - Application of Currents to the SHEAR7 Model,
Left - Currents towards Y-Axis, Right - Currents towards
X-Axis
Figure 9 - SHEAR7 Results (A/D)
Figure 10 - Fatigue Damage Rates from SHEAR7
VIV ANALYSIS USING DNV-RP-F105 DNV-RP-F105 [2] was developed to address fatigue of free
spanning pipelines subjected to combined wave and current
loading. However, since being released in 2002 it has provided
the basis for most jumper VIV assessments in the industry
[13][14]. In order to apply this code to the jumper problem, the
jumper is modeled in ANSYS using pipe elements. Similar to
the SHEAR7 analysis, current applied along the global Y axis
causes cross-flow VIV while a current in the X direction results
in inline VIV. A uniform current speed of 1.0 m/s is considered.
There is no way to account for sheared current profiles in this
method and hence the maximum current speed is used. The in-
line and cross-flow amplitude response models are then
constructed in accordance with the DNV-RP-F105 guidelines.
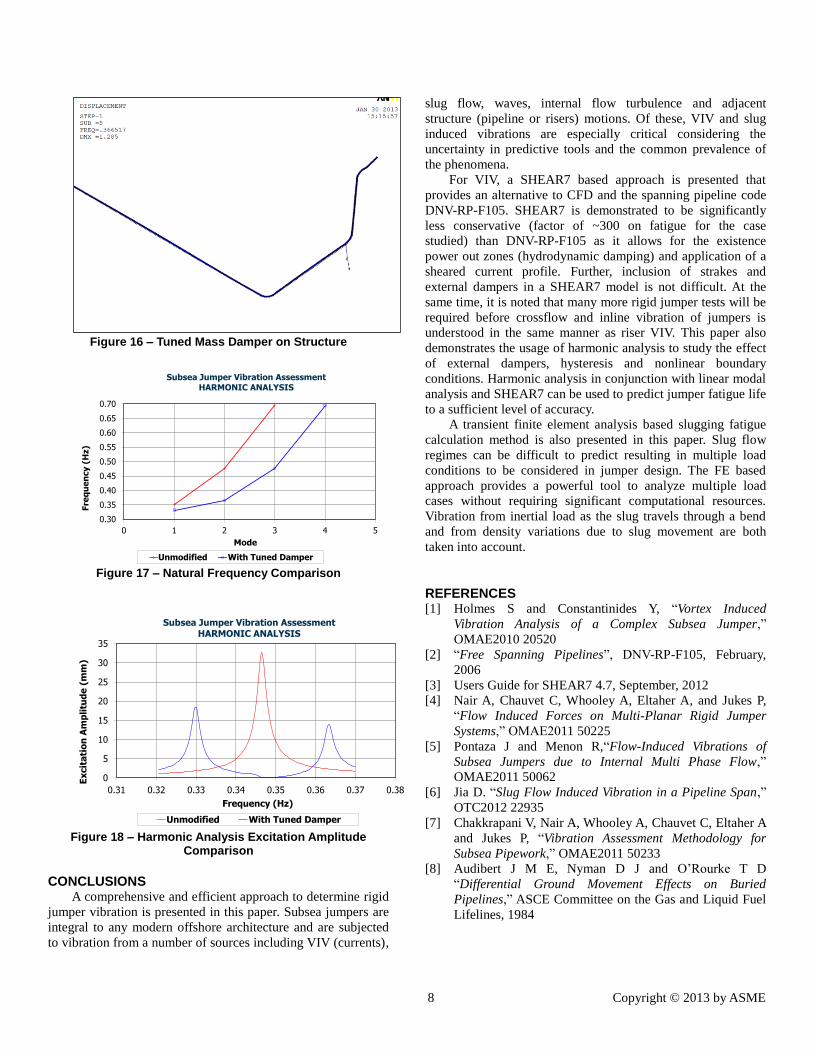
For cross-flow VIV excitation, a maximum A/D of 0.78 is
predicted for Mode 1, as shown in Figure 11. The response is
significantly conservative when compared to 0.11 A/D obtained
from the SHEAR7 analysis. This results in a fatigue damage
rate significantly higher than that predicted by SHEAR7 for
cross-flow response. A factor of 7 on the displacement implies a
factor of 343 in fatigue damage using k=3. For inline VIV, a
maximum A/D of 0.06 is observed for Mode 4, as shown in
Figure 12. For the same problem, SHEAR7 predicts mode 1.
The difference in mode prediction is due to the difference in
methodologies. Under the DNV-RP-F105 guidelines, in the
event that more than one mode is excited, the mode which
results in the highest fatigue damage is selected for fatigue
calculation. This is contrary to the SHEAR7 methodology
which utilizes the power balance law as a basis for determining
the dominant excited mode. In general, the DNV-RP-F105
guideline results in significantly higher response in the
prediction of fatigue life due to VIV.
x/L=0
x/L=0.5
x/L=1
x/L=0.75
x/L=0
x/L=0.5
x/L=1
x/L=0.75
0.00
0.02
0.04
0.06
0.08
0.10
0.12
0 0.2 0.4 0.6 0.8 1
A/D
(-)
x/L (-)
2H Spool VIV Analysis
VIV DISPLACEMENTSMode 1 For Crossflow And Inline
Crossflow Inline
0.0001
0.001
0.01
0.1
1
10
100
0 0.2 0.4 0.6 0.8 1
Fa
tig
ue
Da
ma
ge
Ra
te (
1/ye
ar)
x/L (-)
2H Spool VIV Analysis
VIV FATIGUE DAMAGE RATES FROM SHEAR7 4.7Mode 1 for Crossflow and Inline
Crossflow Inline
6 Copyright © 2013 by ASME
Figure 11 – Cross-flow VIV Response Diagram Using DNV-
RP-F105
Figure 12 – Inline VIV Response Diagram Using DNV-RP-
F105
SLUGGING INDUCED FATIGUE Slugging can be a potential source of significant fatigue
damage in a rigid jumper. In order to assess its effects, slugging
profiles must first be determined based on the expected fluid
contents and production rate. Predictive models do exist to
generate these profiles but they are usually subject to
significant levels of uncertainty when predicting the fluid
contents and production rate over the entire field life. Early in
field life when pressure and flow rates are high, slugging can be
particularly damaging. In many cases slugging only appears
later in field life when water production increases and lower
flow rates lead to segregation. As Figure 13 indicates, slugs are
not generally pure liquid and the bubble zone separating them
is not purely gas. Additionally, the flow rate may also be
modified during different stages of the field life in order to
optimize production. These factors can lead to a different rigid
jumper response to that initially predicted. Considering the slug
randomness and flow rate variations, a computationally
intensive and time consuming CFD analysis is unlikely to
provide a workable solution.to the fluid-structure interaction
problem. In this paper, a more practical transient finite element
analysis is used to evaluate and analyze the fatigue response
due to slugging. This method allows the analyst to quickly
explore the potential damage from a range of possible slugging
regimes.
Figure 13 – Slug Composition
There are two primary phenomena caused by internal fluid
slugging that can be responsible for fatigue damage of a rigid
jumper carrying multi-phase fluids. Firstly the changes of
internal fluid weight cause a gross change in the deflected
shape of the jumper through gravity effects. Secondly, there is a
change of the inertial force on each jumper bend as each slug
enters and exits. These forces are proportional to the velocity
squared. They are applied abruptly as the slug passes and will
excite the natural frequencies of the jumper much like a
hammer blow would. This effect is illustrated in Figure 14.
Figure 14 – Impulsive Effects of Higher Velocity Slugs Cause Response at Jumper Natural Period.
The rigid jumper fatigue response is determined for three
typical slugging regimes whose parameters are listed in Table 5.
These slug profiles are selected as they represent the most
onerous response in terms of fatigue damage due to slugging. It
should be noted that all these slugging regimes have low
occurrence probabilities. This aspect needs to be taken into
account when assessing the combined fatigue response on the
jumper due to both VIV and slugging.
0
0.1
0.2
0.3
0.4
0.5
0.6
0.7
0.8
0.9
1
0 0.5 1 1.5 2 2.5 3 3.5
Cro
ss-f
low
VIV
Am
pli
tud
e (
A/D
)
Current Speed (m/s)
Subsea Jumper Vibration Assessment
CROSS-FLOW RESPONSE MODEL
Mode 1 excitation, 1m/s current speed
0
0.02
0.04
0.06
0.08
0.1
0.12
0.14
0.16
0.18
0 0.5 1 1.5 2 2.5 3
Inli
ne
VIV
Am
pli
tud
e (
A/D
)
Current Speed (m/s)
Subsea Jumper Vibration Assessment
INLINE RESPONSE MODEL
Mode 4 excitation, 1m/s current speed
-110
-105
-100
-95
-90
-85
-80
0 10 20 30 40 50 60 70 80 90 100
Str
ess (
MP
a)
Time (s)
Jumper Slugging Analysis MethodologyTOTAL STRESS TIMETRACE
ANSYS/MATLAB (weight only) ANSYS/MATLAB (weight+inertia)
7 Copyright © 2013 by ASME
The change of internal fluid weight and inertial force due
to the passage of each slug are developed and timetraces of the
resulting vertical and lateral forces at each node generated. It
should be noted that the forces calculated are the change in
force between when the slug is present and when it is not, as
opposed to the absolute force of the slug. When a slug is not
present, there are no additional inertial forces applied to the
model due to the velocity of the gas bubble (the weight is
included in the static step of the analysis by setting the internal
fluid density equal to that of the gas bubble). This methodology
is correct for fatigue analysis because only the change in
stresses is considered. However, the stresses calculated with
this methodology should not be used to evaluate the strength
performance of the structure.
These force timetraces are applied to the ANSYS rigid
jumper model in a transient finite element analysis. This is the
same FE model that is used for the modal analysis described in
the previous section. Fatigue damage due to slugging is then
calculated using a rainflow counting approach. It can be seen
from the results that high fatigue response is observed due to
slugging along the spanned sections of the jumper. Fatigue
damage rate is significantly less for the jumper portion on the
seabed, as shown in Figure 15. This indicates that a jumper
with long unsupported sections and high flexibility will be
subject to high damage when subjected to gross internal fluid
weight variations.
Table 5 - Slug Profile Parameters
Parameter
Value
Slug Profile
1
Slug Profile
2
Slug Profile
3
Bubble Density
(Kg/m3) 86.3 89.3 100.4
Slug Density
(kg/m3). 545.7 874.1 727.1
Slug Velocity
(m/s) 7.5 11.8 6.3
Mixture
Velocity (m/s) 5.7 9.1 4.9
Slug Length
(m) 131.6 83.9 69.2
Time Between
Start of
Consecutive
Slugs (s)
19.7 26.1 14.38
Figure 15 – Slugging Fatigue Loading
HARMONIC ANALYSIS Normal modal analysis is linear and cannot easily account
for damping, hysteresis, or non-linear boundary conditions.
However, such effects can be accounted for in the time domain
or through harmonic analysis such as is available in ANSYS. In
the current problem, the effect of adding a vibration damper to
the jumper is studied. The external dampers are assessed in,
harmonic analysis (frequency sweep) to determine amplitude
and curvature reduction and effectively factor the fatigue
damage from SHEAR7.
For the studied jumper geometry shown in Figure 1, a
tuned damper is considered to study the change in natural
response of the jumper. The damper shown in Figure 16 is
attached to the structure and tuned for mode 1 of the
unmodified structure. The damper is modeled as a beam mass
system and the natural frequency of the damper is tuned to be
close to the natural frequency of the structure. The comparison
of natural frequency response of the unmodified and with tuned
damper is shown in Figure 17 .
Harmonic analysis is conducted using an external
excitation moment at one end of the structure. Same magnitude
of external excitation moment is used at jumper end for the
unmodified structure and structure with tuned damper. The
maximum excitation amplitude for both unmodified and with
tuned damper is shown in Figure 18.
The maximum excitation amplitude for the tuned damper
structure is 50% smaller than that of excitation amplitude of the
unmodified structure. Assuming a fatigue curve exponent of 3
for a typical weld, the fatigue life is improved by a factor of 8.
1.0E-05
1.0E-04
1.0E-03
1.0E-02
1.0E-01
1.0E+00
1.0E+01
1.0E+02
0.00 0.20 0.40 0.60 0.80 1.00
Fa
tig
ue
Da
ma
ge
Ra
te (
1/yr)
Normalized Length Along Jumper (-)
Subsea Jumper Vibration Assessment
FATIGUE RESPONSE DUE TO SLUGGING
Slug Profile 1 Slug Profile 2 Slug Profile 3
Jumper on Seabed
8 Copyright © 2013 by ASME
Figure 16 – Tuned Mass Damper on Structure
Figure 17 – Natural Frequency Comparison
Figure 18 – Harmonic Analysis Excitation Amplitude
Comparison
CONCLUSIONS A comprehensive and efficient approach to determine rigid
jumper vibration is presented in this paper. Subsea jumpers are
integral to any modern offshore architecture and are subjected
to vibration from a number of sources including VIV (currents),
slug flow, waves, internal flow turbulence and adjacent
structure (pipeline or risers) motions. Of these, VIV and slug
induced vibrations are especially critical considering the
uncertainty in predictive tools and the common prevalence of
the phenomena.
For VIV, a SHEAR7 based approach is presented that
provides an alternative to CFD and the spanning pipeline code
DNV-RP-F105. SHEAR7 is demonstrated to be significantly
less conservative (factor of ~300 on fatigue for the case
studied) than DNV-RP-F105 as it allows for the existence
power out zones (hydrodynamic damping) and application of a
sheared current profile. Further, inclusion of strakes and
external dampers in a SHEAR7 model is not difficult. At the
same time, it is noted that many more rigid jumper tests will be
required before crossflow and inline vibration of jumpers is
understood in the same manner as riser VIV. This paper also
demonstrates the usage of harmonic analysis to study the effect
of external dampers, hysteresis and nonlinear boundary
conditions. Harmonic analysis in conjunction with linear modal
analysis and SHEAR7 can be used to predict jumper fatigue life
to a sufficient level of accuracy.
A transient finite element analysis based slugging fatigue
calculation method is also presented in this paper. Slug flow
regimes can be difficult to predict resulting in multiple load
conditions to be considered in jumper design. The FE based
approach provides a powerful tool to analyze multiple load
cases without requiring significant computational resources.
Vibration from inertial load as the slug travels through a bend
and from density variations due to slug movement are both
taken into account.
REFERENCES [1] Holmes S and Constantinides Y, “Vortex Induced
Vibration Analysis of a Complex Subsea Jumper,”
OMAE2010 20520
[2] “Free Spanning Pipelines”, DNV-RP-F105, February,
2006
[3] Users Guide for SHEAR7 4.7, September, 2012
[4] Nair A, Chauvet C, Whooley A, Eltaher A, and Jukes P,
“Flow Induced Forces on Multi-Planar Rigid Jumper
Systems,” OMAE2011 50225
[5] Pontaza J and Menon R,“Flow-Induced Vibrations of
Subsea Jumpers due to Internal Multi Phase Flow,”
OMAE2011 50062
[6] Jia D. “Slug Flow Induced Vibration in a Pipeline Span,”
OTC2012 22935
[7] Chakkrapani V, Nair A, Whooley A, Chauvet C, Eltaher A
and Jukes P, “Vibration Assessment Methodology for
Subsea Pipework,” OMAE2011 50233
[8] Audibert J M E, Nyman D J and O’Rourke T D
“Differential Ground Movement Effects on Buried
Pipelines,” ASCE Committee on the Gas and Liquid Fuel
Lifelines, 1984
0.30
0.35
0.40
0.45
0.50
0.55
0.60
0.65
0.70
0 1 2 3 4 5
Fre
qu
en
cy (
Hz)
Mode
Subsea Jumper Vibration AssessmentHARMONIC ANALYSIS
Unmodified With Tuned Damper
0
5
10
15
20
25
30
35
0.31 0.32 0.33 0.34 0.35 0.36 0.37 0.38
Ex
cit
ati
on
Am
pli
tud
e (
mm
)
Frequency (Hz)
Subsea Jumper Vibration AssessmentHARMONIC ANALYSIS
Unmodified With Tuned Damper
9 Copyright © 2013 by ASME
[9] Bridge C D, Laver K, Clukey E and Evans T, “Steel
Catenary Riser Touchdown Point Vertical Interaction
Models,” OTC2004 16628
[10] ANSYS v10.0, 2006
[11] Aronsen K H, Larsen C M and Mork K, “Hydrodynamic
Coefficients from In-line VIV Experiments,” OMAE2005
67393
[12] “Fatigue Strength Analysis for Mobile Offshore Units”,
DNV CN 30.2, August, 1984
[13] Hariharan M, Cerkovnik M and Thompson H, “The
Significance of Low Velocity Near Bottom Currents on the
In-Line Vortex-Induced Vibration Response of Rigid
Subsea Jumpers,” Subsea Houston 2004
[14] Carruth A L and Cerkovnik M, “Jumper VIV – New Issues
for New Frontiers,” ISOPE2007
[15] Plouzennec S, Sonawane M, Eyles T, New Approaches to
The Design Of Rigid Jumpersfor Freestanding Hybrid
Risers, IBP1708_11, Sept. 2011.


![37424265 Directed Studies Subsea Pipelines[1]](https://img.pdfslide.us/doc/110x75/544c8b3faf7959eb138b4638/37424265-directed-studies-subsea-pipelines1.jpg)