Embed Size (px)
Citation preview

Subscription Survival
Analysis in R
useR! 2012
Nashville
June 2012
Jim Porzak – Senior Director, Business Intelligence
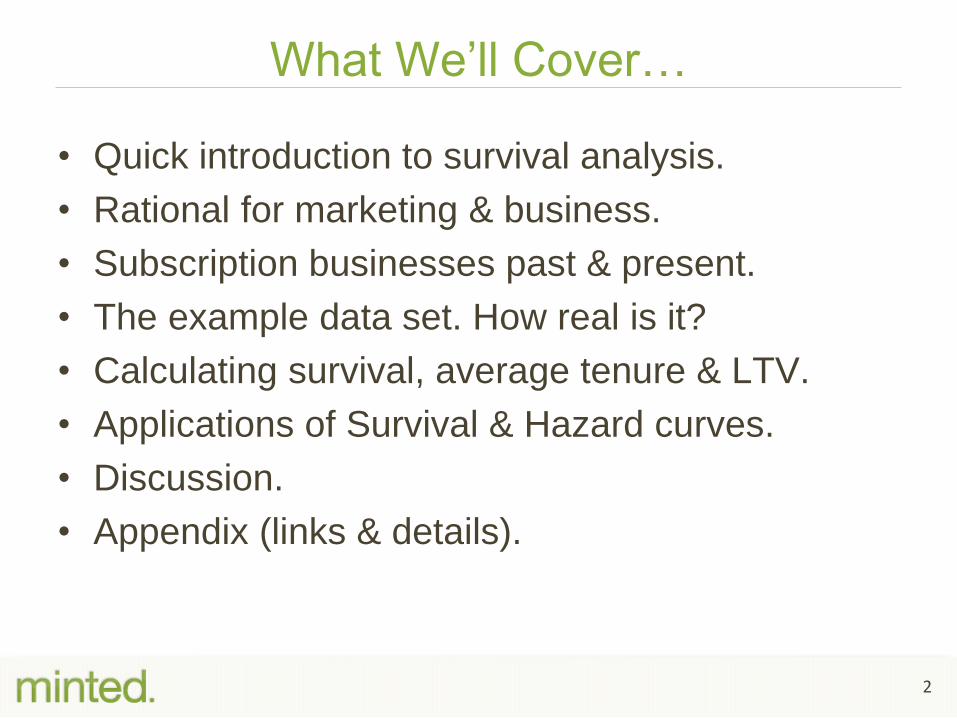
What We’ll Cover…
• Quick introduction to survival analysis.
• Rational for marketing & business.
• Subscription businesses past & present.
• The example data set. How real is it?
• Calculating survival, average tenure & LTV.
• Applications of Survival & Hazard curves.
• Discussion.
• Appendix (links & details).
2
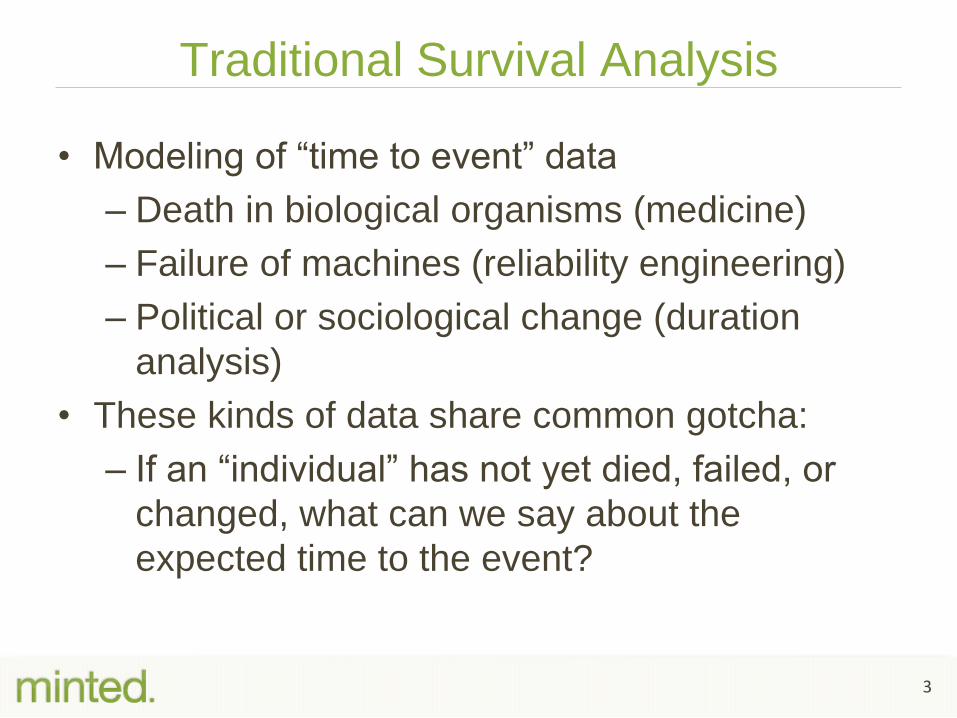
Traditional Survival Analysis
• Modeling of “time to event” data
– Death in biological organisms (medicine)
– Failure of machines (reliability engineering)
– Political or sociological change (duration
analysis)
• These kinds of data share common gotcha:
– If an “individual” has not yet died, failed, or
changed, what can we say about the
expected time to the event?
3

• All have started, some have stopped, & some continue on.
– “Right censored”
• From this kind of data we can calculate probability of stopping.
– “Hazard Ratio” = f(tenure, … )
• Probability of survival at tenure, T, is just ( 1 – cumulative hazard(T))
4
Trick: Use what we know – everything!

Classical “Bathtub” Hazard Curve
Source: http://en.wikipedia.org/wiki/Bathtub_curve
5
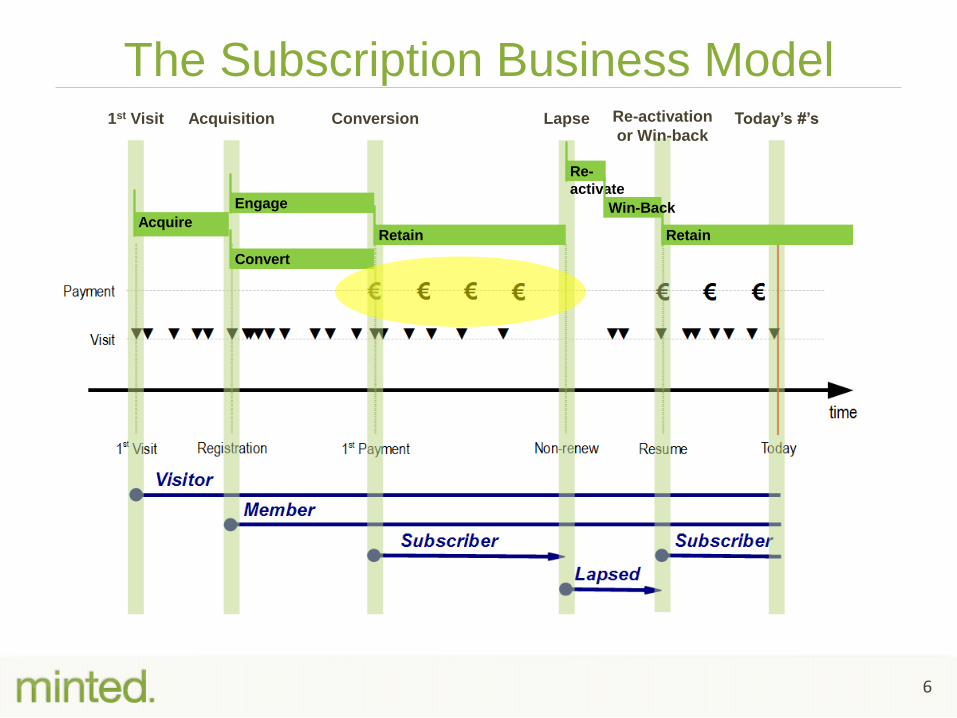
The Subscription Business Model
6
Acquisition Conversion Re-activation
or Win-back 1st Visit Lapse Today’s #’s
Acquire
Convert
Retain Retain
Engage
Re-
activate
Win-Back
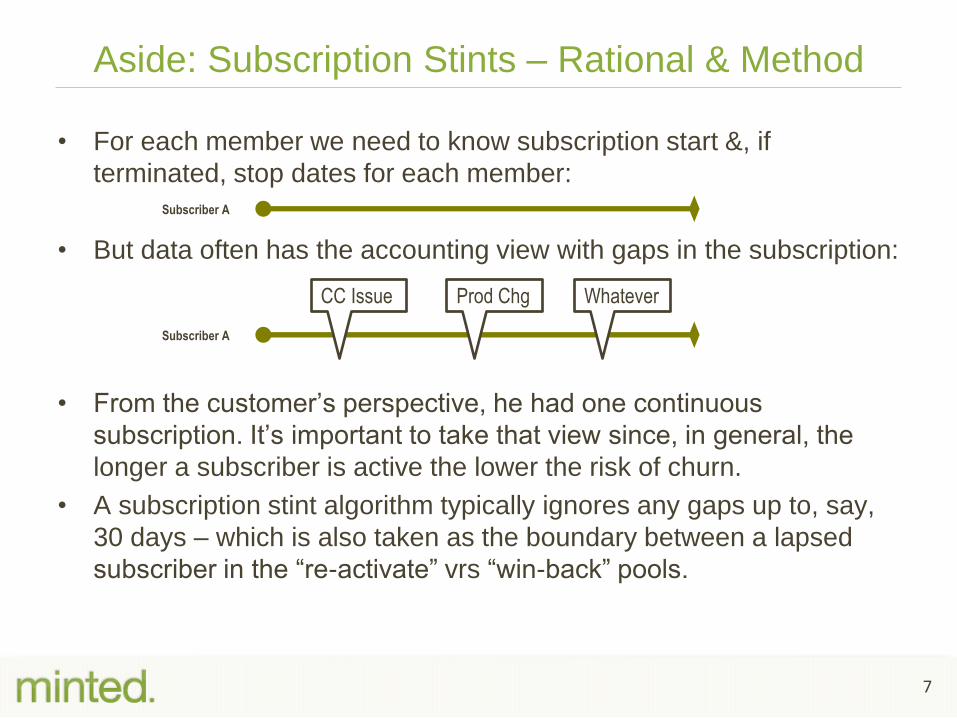
Aside: Subscription Stints – Rational & Method
• For each member we need to know subscription start &, if
terminated, stop dates for each member:
• But data often has the accounting view with gaps in the subscription:
• From the customer’s perspective, he had one continuous
subscription. It’s important to take that view since, in general, the
longer a subscriber is active the lower the risk of churn.
• A subscription stint algorithm typically ignores any gaps up to, say,
30 days – which is also taken as the boundary between a lapsed
subscriber in the “re-activate” vrs “win-back” pools.
Subscriber A
Subscriber A
CC Issue Prod Chg Whatever
7

Why Subscription Survival?
• Expected churn probability of new subscribers
– Project future subscriber count
• Especially after a successful campaign
– Define tenure segment boundaries
• Expected tenure of a new subscriber & LTV
– As function of duration, product, channel, offer
– Evaluate marketing & site tests by value not rates
• Projected value of retention efforts
– How improved renewal rates increase value
• A new way of thinking about subscribers
– Retention metrics, as used in marketing, are deceptive
(see Appendix slide)
8
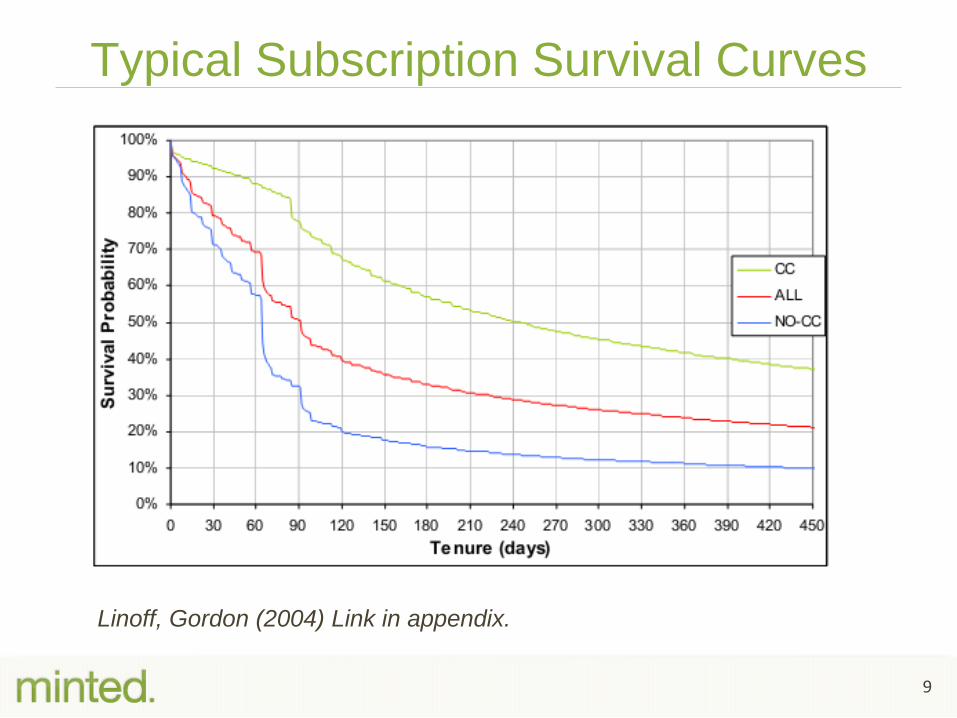
Typical Subscription Survival Curves
Linoff, Gordon (2004) Link in appendix.
9
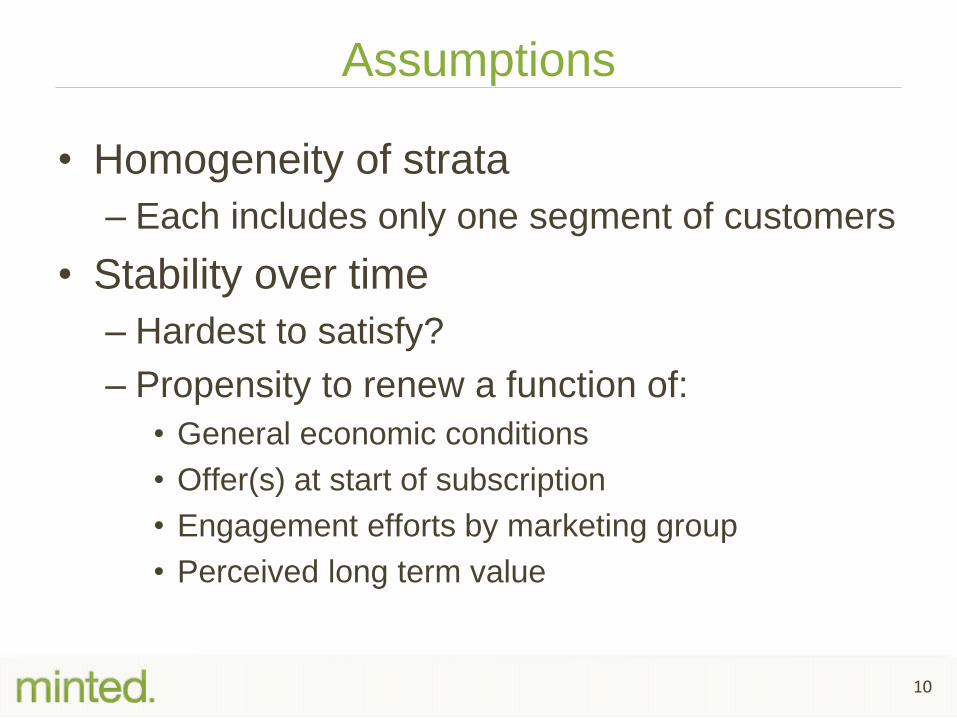
Assumptions
• Homogeneity of strata
– Each includes only one segment of customers
• Stability over time
– Hardest to satisfy?
– Propensity to renew a function of:
• General economic conditions
• Offer(s) at start of subscription
• Engagement efforts by marketing group
• Perceived long term value
10
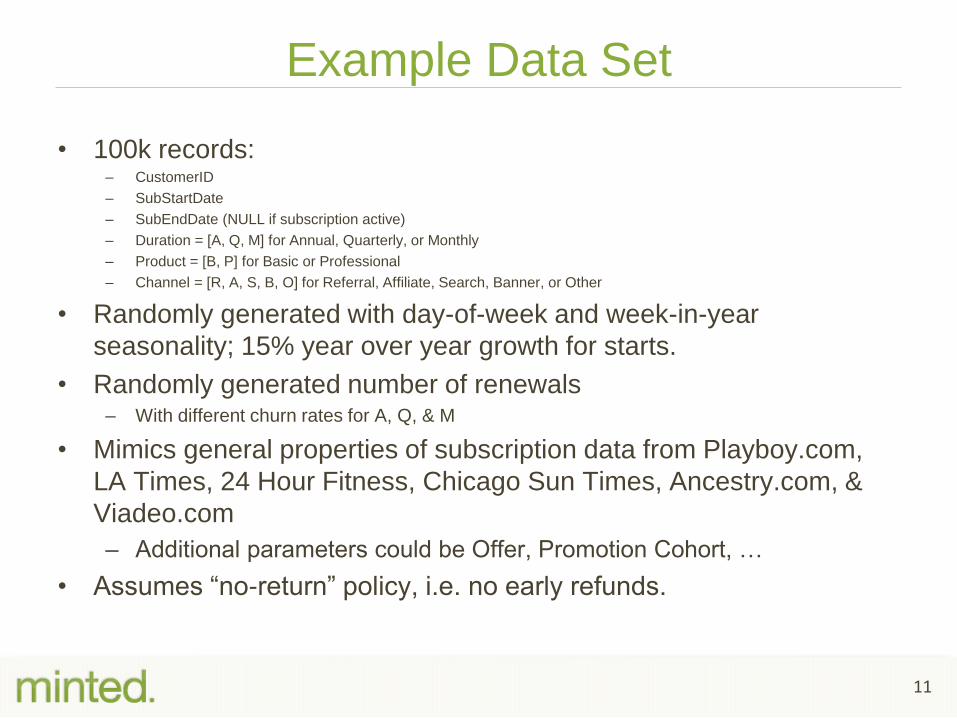
Example Data Set
• 100k records: – CustomerID
– SubStartDate
– SubEndDate (NULL if subscription active)
– Duration = [A, Q, M] for Annual, Quarterly, or Monthly
– Product = [B, P] for Basic or Professional
– Channel = [R, A, S, B, O] for Referral, Affiliate, Search, Banner, or Other
• Randomly generated with day-of-week and week-in-year
seasonality; 15% year over year growth for starts.
• Randomly generated number of renewals – With different churn rates for A, Q, & M
• Mimics general properties of subscription data from Playboy.com,
LA Times, 24 Hour Fitness, Chicago Sun Times, Ancestry.com, &
Viadeo.com
– Additional parameters could be Offer, Promotion Cohort, …
• Assumes “no-return” policy, i.e. no early refunds.
11
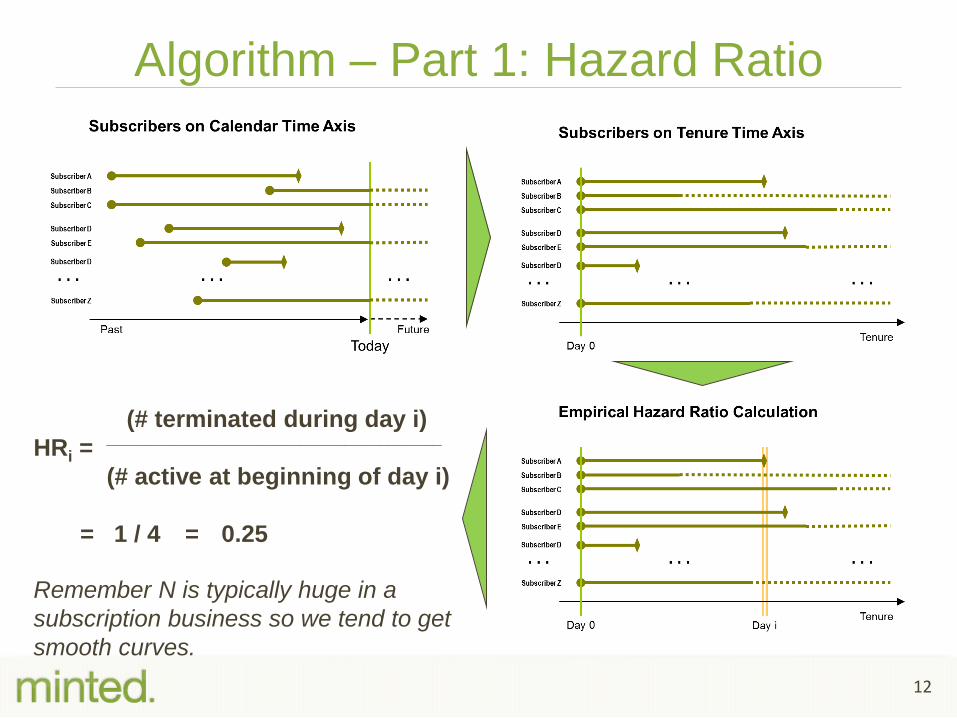
Algorithm – Part 1: Hazard Ratio
(# terminated during day i)
HRi = ______________________________________
(# active at beginning of day i)
= 1 / 4 =
0.25
Remember N is typically huge in a
subscription business so we tend to get
smooth curves.
12
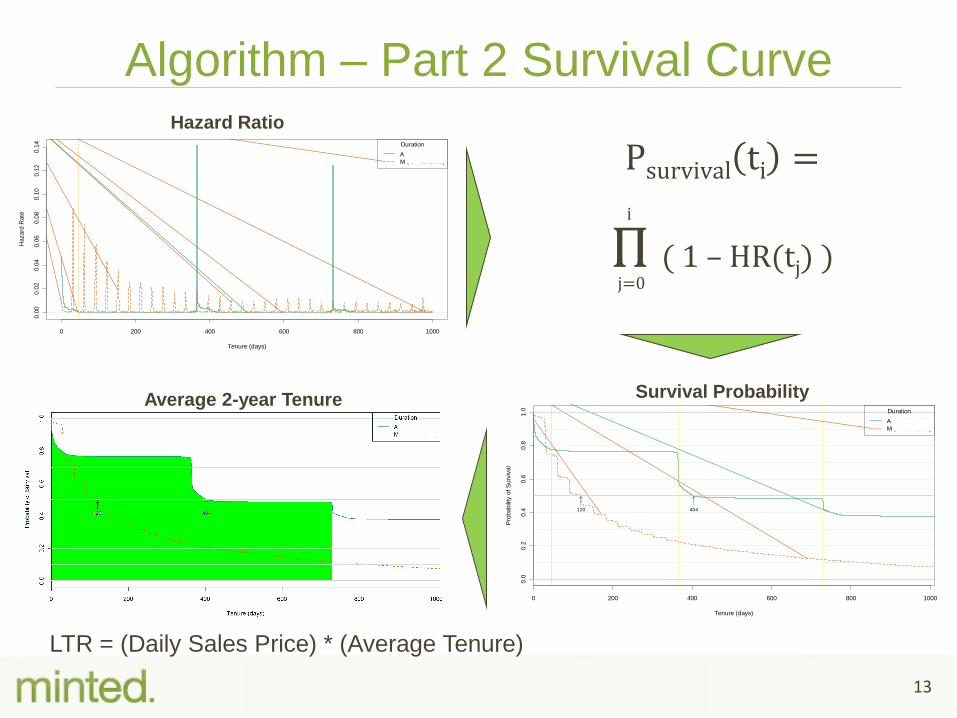
Algorithm – Part 2 Survival Curve
Psurvival ti =
i …………………………
Π ( 1 – HR(tj) ) j=0… …………………………
0 200 400 600 800 1000
0.0
00.0
20.0
40.0
60.0
80.1
00.1
20.1
4
USDeluxe Domestic Acom Hazard Rate
Subscribers since 2006-01-01 (N = 400,883 subscribers)
Tenure (days)
Hazard
Rate
Duration
A (N = 204,538)
M (N = 196,345)
Hazard Ratio
Average 2-year Tenure
0 200 400 600 800 1000
0.0
0.2
0.4
0.6
0.8
1.0
USDeluxe Domestic Acom Subscriber Survival
Subscribers since 2006-01-01 (N = 400,883 subscribers)
Tenure (days)
Pro
babili
ty o
f S
urv
ival
404120
Duration
A (N = 204,538)
M (N = 196,345)
Survival Probability
13
LTR = (Daily Sales Price) * (Average Tenure)
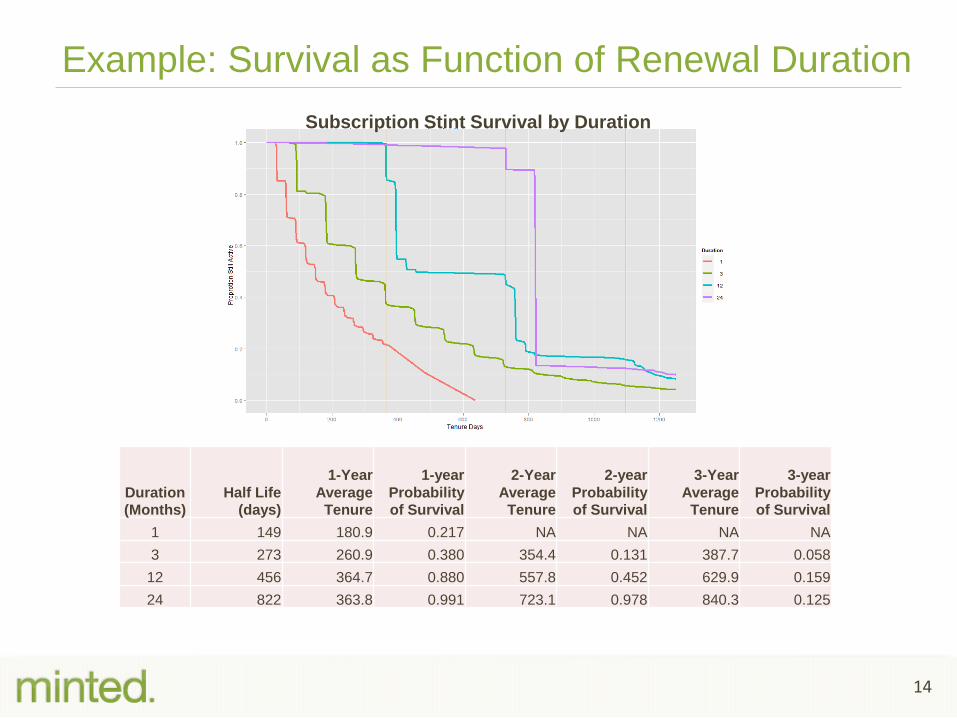
Example: Survival as Function of Renewal Duration
Duration
(Months) Half Life
(days)
1-Year
Average
Tenure
1-year
Probability
of Survival
2-Year
Average
Tenure
2-year
Probability
of Survival
3-Year
Average
Tenure
3-year
Probability
of Survival
1 149 180.9 0.217 NA NA NA NA
3 273 260.9 0.380 354.4 0.131 387.7 0.058
12 456 364.7 0.880 557.8 0.452 629.9 0.159
24 822 363.8 0.991 723.1 0.978 840.3 0.125
Subscription Stint Survival by Duration
14
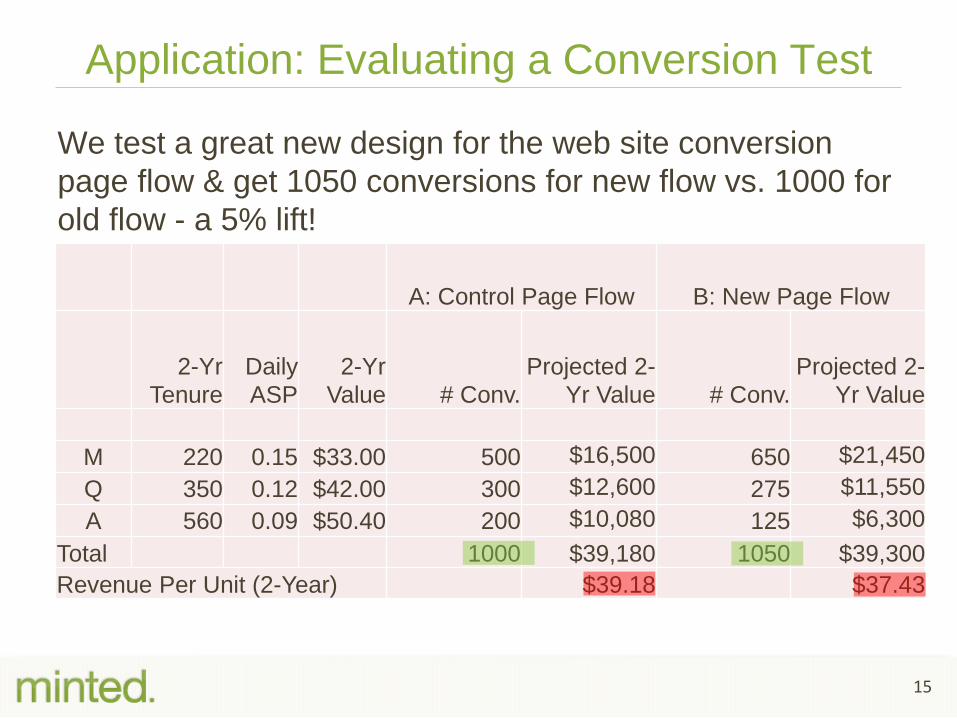
Application: Evaluating a Conversion Test
We test a great new design for the web site conversion
page flow & get 1050 conversions for new flow vs. 1000 for
old flow - a 5% lift!
A: Control Page Flow B: New Page Flow
2-Yr
Tenure Daily
ASP 2-Yr
Value # Conv. Projected 2-
Yr Value # Conv. Projected 2-
Yr Value
M 220 0.15 $33.00 500 $16,500 650 $21,450
Q 350 0.12 $42.00 300 $12,600 275 $11,550
A 560 0.09 $50.40 200 $10,080 125 $6,300
Total 1000 $39,180 1050 $39,300
Revenue Per Unit (2-Year) $39.18 $37.43
15
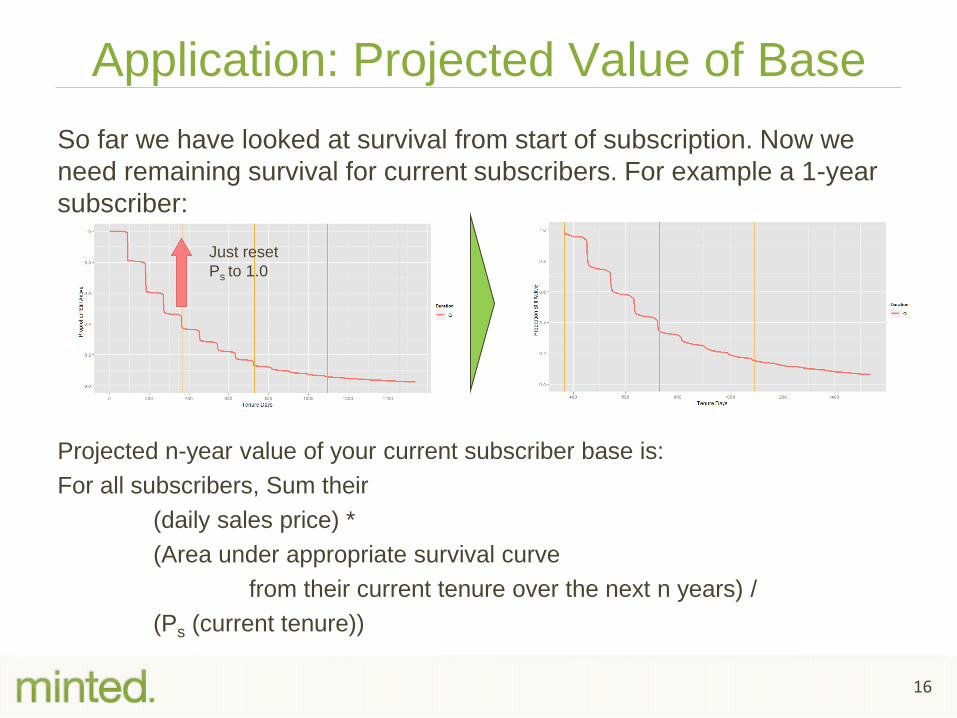
Application: Projected Value of Base
So far we have looked at survival from start of subscription. Now we
need remaining survival for current subscribers. For example a 1-year
subscriber:
Just reset
Ps to 1.0
Projected n-year value of your current subscriber base is:
For all subscribers, Sum their
(daily sales price) *
(Area under appropriate survival curve
from their current tenure over the next n years) /
(Ps (current tenure))
16
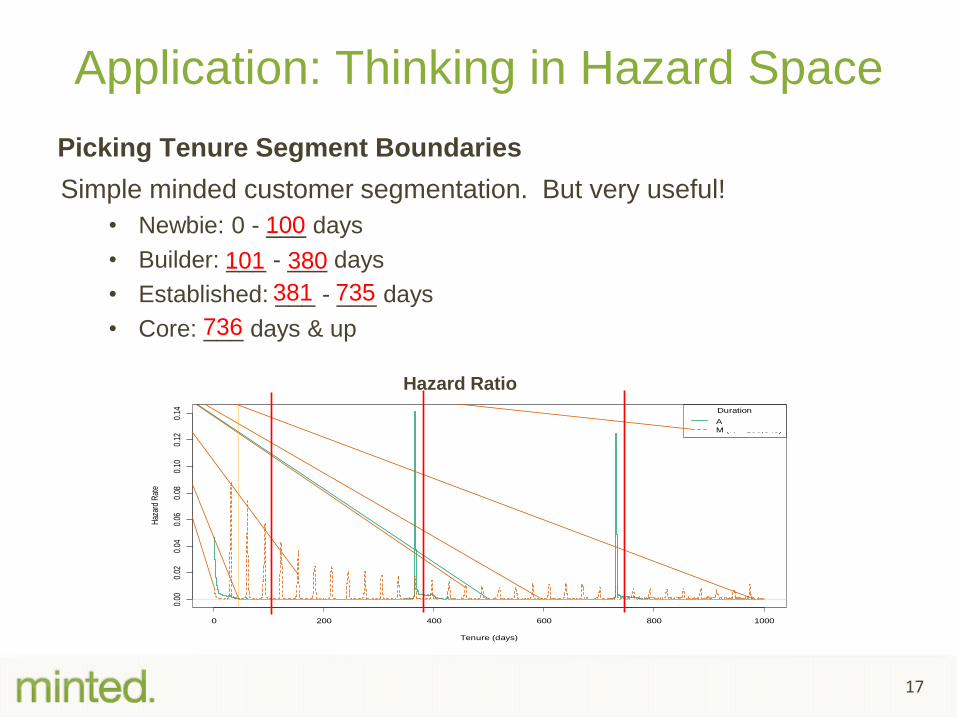
Application: Thinking in Hazard Space
Picking Tenure Segment Boundaries
Simple minded customer segmentation. But very useful!
• Newbie: 0 - ___ days
• Builder: ___ - ___ days
• Established: ___ - ___ days
• Core: ___ days & up
0 200 400 600 800 1000
0.00
0.02
0.04
0.06
0.08
0.10
0.12
0.14
USDeluxe Domestic Acom Hazard Rate
Subscribers since 2006-01-01 (N = 400,883 subscribers)
Tenure (days)
Haz
ard
Rat
e
Duration
A (N = 204,538)
M (N = 196,345)
Hazard Ratio
17
100
101 380
381 735
736
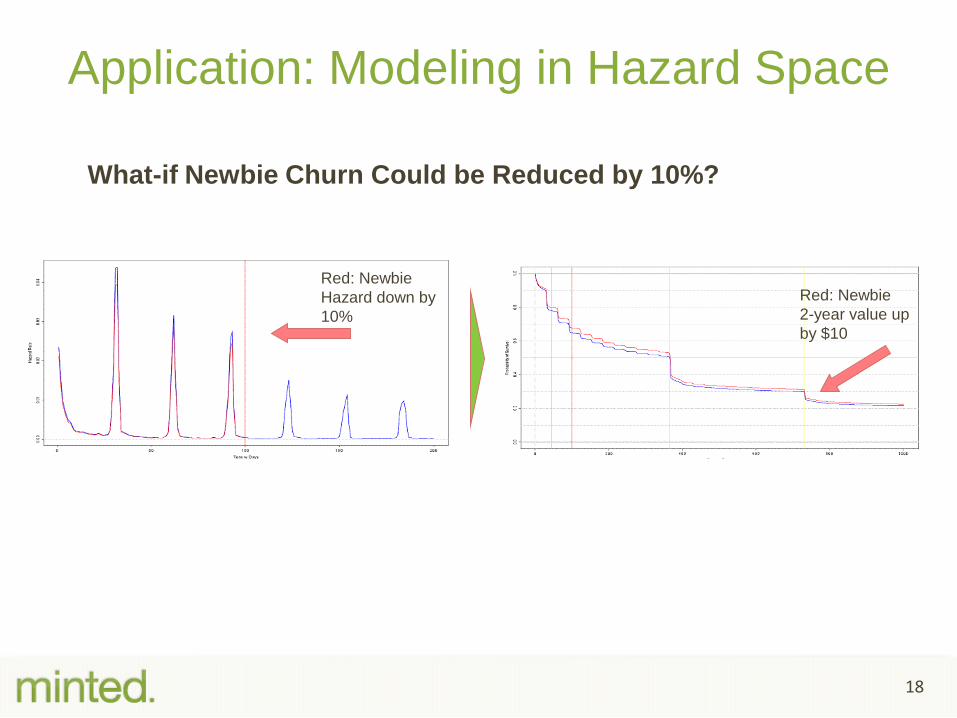
Application: Modeling in Hazard Space
What-if Newbie Churn Could be Reduced by 10%?
Red: Newbie
Hazard down by
10%
Red: Newbie
2-year value up
by $10
18
Wrap-up. What we saw.
• Introduction to classical survival
• Subscribers & calculating their hazard & survival
• Applying survival & hazard to real-world
questions
• See Appendix for links & some more details.
19
Appendix
• Links to learn more
• Retention vs Survival Curves

Subscription Survival Background
• On subscription survival for customer intelligence:
– Gordon Linoff’s 2004 Article from Intelligent Enterprise (now
InformationWeek) http://www.data-miners.com/resources/Customer-
Insight-Article.pdf
– Will Potts’ technical white paper http://www.data-
miners.com/resources/Will%20Survival.pdf
– Berry & Linoff’s white paper for SAS, emphasizes forecasting
application http://www.data-
miners.com/companion/sas/forecastingWP_001.pdf
– Chapter 10 in http://amzn.to/mRAVpp
• Background on “classical” survival analysis:
– http://en.wikipedia.org/wiki/Survival_analysis
• R packages used
– survival by Terry Therneau
– ggplot2, plyr, lubridate by Hadley Wickham, et al
– zoo, xts by Achim Zeileis, Jeffrey Ryan, et al
22

Retention vs Survival Curves
• Retention Rate = 1 – Churn Rate
• Churn Rate (typically) defined as:
(# Subscribers leaving)
(Average # subscribers) over some period.
• Which means:
– Ignores information out of period
– Not monotonically decreasing
23
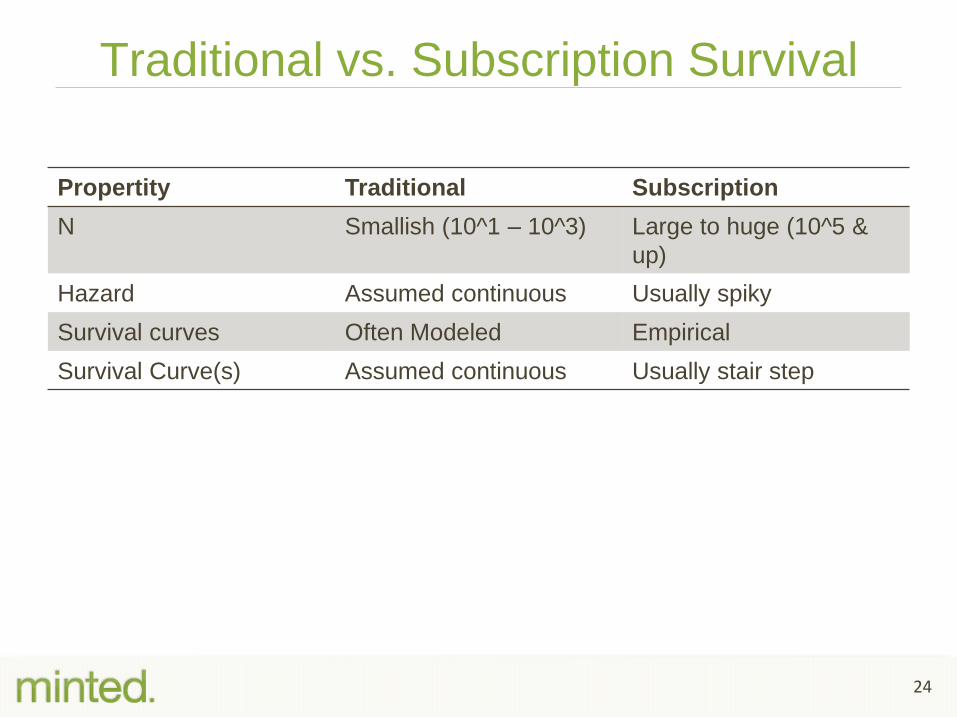
Traditional vs. Subscription Survival
Propertity Traditional Subscription
N Smallish (10^1 – 10^3) Large to huge (10^5 &
up)
Hazard Assumed continuous Usually spiky
Survival curves Often Modeled Empirical
Survival Curve(s) Assumed continuous Usually stair step
24


![Survival Analysis - University of Washingtonfaculty.washington.edu/heagerty/Courses/VA-survival/...It’s life and death... Survival function: S(t) = P [T > t] The survival function](https://img.pdfslide.us/doc/110x75/611600f94ef3f41cc655565e/survival-analysis-university-of-itas-life-and-death-survival-function.jpg)

![Subscription Order Form - AA · PDF fileSubscription Order Form [ ] One year ... Email: ... Please attach this form to a Grapevine Multiple Subscription Form](https://img.pdfslide.us/doc/110x75/5aaf93997f8b9a6b308d7b8a/subscription-order-form-aa-order-form-one-year-email-please-attach.jpg)