Embed Size (px)
Citation preview

Lincoln University Digital Thesis
Copyright Statement
The digital copy of this thesis is protected by the Copyright Act 1994 (New Zealand).
This thesis may be consulted by you, provided you comply with the provisions of the Act and the following conditions of use:
you will use the copy only for the purposes of research or private study you will recognise the author's right to be identified as the author of the thesis and
due acknowledgement will be made to the author where appropriate you will obtain the author's permission before publishing any material from the
thesis.
SUSCEPTIBILITY OF THE BREEDING EWE TO
PARASITISM
A thesis
submitted in partial fulfilment
of the requirements for the degree
of
Master of Applied Science
in the
University of Canterbury
by
R. W. McAnulty
Lincoln College
1990

Abstract of a thesis submitted in partial fu1fiIment of the
requirements for the Degree of M.App1.Sc.
Susceptibility of the breeding ewe to
parasitism
by R.W. McAnulty
One hundred and seventy, 5-year old Coopworth ewes were synchronised and mated. Pregnant
twin bearing ewes and non-pregnant ewes were then allocated to four periods of treatment,
infection timed relative to the post-parturient changes in host susceptibility to nematode infection.
These commenced either 4 weeks prior to lambing (period 1), at lambing (period 2), 6 weeks after
lambing (period 3) or 12 weeks after lambing (period 4). Within each period of infection,
pregnant ewes were further allocated to four groups (n=6) viz initial slaughter (group A); the
remaining animals were treated with anthelmintic and given either a single infection with 20,000
larvae of Ostertagia circumcincta (group B) followed by slaughter after 21 days, 4000/larvae per
day for 50 days (group C) or no infection (group D). Groups C and D were again dosed with
anthelmintic and give a single infection with 20,000 larvae on day 57 and slaughtered 21 days
later. Non-breeding ewes (group BA -n=6) were challenged on day one of each period with
. 20,OOOlarvae and slaughtered 21 days later. All ewes were housed indoors and offered a pelleted
diet. Faecal egg counts were determined weeldy. and ewe liveweight, food intake, milk
production and serum pepsinogen measured weeldy. Total WOIm counts and numbers of eggs in
utero were deteImined from samples obtained at slaughter.
A relaxation in the immune response to infection was apparent during late pregnaiIcy
(period 1) and early lactation (period 2) as judged by faecal egg counts. but appeared to be
greatest around parturition when maximum WOIm burdens occurred (period 2). Significantly
higher WOIm burdens were found in response to challenge in breeding ewes compared to non
breeding ewes at all times, except period 4. By 12 weeks after lambing WOIm burdens in
breeding ewes were similar to those found in non-breeding ewes throughout the experiment.
From mid-lactation (periods 2.3). increasing signs of host resistance to infection were evident
Host suppression of faecal egg output was seen during periods 2 and 3, with egg output being
reduced by 50% and 95% respectively, compared to that seen during period 1. Numbers of eggs
in utero per adult WOIm were 25,45 and 37 eggs/woIm in period 1,2 and 3 respectively.
Faecal egg counts (period 1) and wonn burdens (period 1 and 2) of previously
infected ewes were lower than their initially non-exposed counteIparts. Indicating that the effect
of larval stimulus during late pregnancy and lactation (periods 1 & 2), evoked a substantial
immune response in lactating ewes after rechallenge at day 57.
Parasitism reduced milk production by 10-59% and wool staple strength by 44 ·29%.
During lactation food intake, liveweight and serum pepsinogens were affected by parasitic
infection but little effect was seen prior to parturition.
keywords
Parasite, Nematode, Ostertagia circumcincta, Sheep, Wonn burdens, Breeding ewes, Milk
production, Wool, Liveweight, Food intake

List of Tables List of Figures
CONTENTS
i
Page
List of abbreviations
iii v vii
Chapter
1
2
INTRODUCTION. 1
LITERATURE REVIEW. 3
2.1
2.2
2.3
Life cycle of trichostrongyle nematode
Epidemiology of trichostrongyle nematodes.
2.2.1 Development and survival of free-living stages.
2.2.2
2.2.3
Host responses.
Hypobiosis - Inhibited or Arrested development.
2.2.3.1 Immune mediated arrest.
3
5
5
9
11
11
2.2.3.2 Seasonal arrested development. 13
2.2.3.3 Resumption of arrested or inhibited development 14
2.2.3.4 Significance of hypobiosis. 15
2.2.4 Population regulation. 16
Immunity to gastrointestinal nematode infections.
2.3.1 Immune expulsion of parasites.
2.3.1.1 Immune expulsion of larval stages.
2.3.1.2 Immune expulsion of adult worms.
2.3.2 Factors affecting host-parasite interactions.
2.3.2.1 Age and previous parasite exposure.
2.3.2.2 Physiological status of the host.
2.3.2.2.1 Theories on factors involved in the spring/post-
parturient rise
2.3.2.2.2 Changes in host resistance
2.3.2.3 Nutritional status.
2.3.2.4 Host genotype.
17
18
18
19
20
20
21
21
24
26
27
3
2.4
2.S
Significance of parasitism on the productive performance of the host
2.4.1
2.4.2
2.4.3
2.4.4
Food intake.
Liveweight.
Milk production.
Wool production.
Effects of parasitism on host metabolism.
2.S.1 Intake.
2.S.2 Physiological disturbances to gastrointestinal function in
infections with O. circumcincta.
2.S.2.1 Endogenous losses into gastrointestinal tract.
2.S.3 Mineral metabolism.
MATERIALS AND METHODS.
3.1
3.2
3.3
3.4
Experimental design.
Food and feeding.
3.2.1 Outdoors.
3.2.2 Indoors.
Parasitology parameters monitored.
3.3.1 Infectivity oflarvae.
3.3.2 Worm burdens.
3.3.3 Faecal egg counts and serum pepsinogens.
3.3.4 Eggs in utero.
Production parameters monitored.
3.4.1 Food intake.
3.4.2 Ewe liveweights.
3.4.3 Lamb liveweights.
3.4.4 Milk production.
3.4.5 Wool measurements.
3.4.S.1 Growth rate.
3.4.S.2 Fibre diameter.
ii
28
28
28
29
30
32
32
33
34
3S
36
36
38
38
38
40
40
40
40
40
41
41
41
41
41
42
42
42
4
iii
3.4.5.3 Staple strength. 42
3.5 Statistical analysis. 42
RESULTS. 44
4.1 Wonn burdens, eggs in utero and faecal egg counts. 44
4.2
4.3
4.4
4.1.1 Initial slaughter animals (Group A). 44
4.1.2 Response of breeding and non-breeding ewes to challenge infection
when brought indoors (Groups B and BA). 44
4.1.3 Response of breeding ewes to challenge infection following chronic
infection and their controls (Groups C and D). 47
Serum pepsinogens.
4.2.1 Groups C and D - Chronic challenge, day 1-50.
4.2.2 Groups Band BA - Acute challenge, day 1-21.
4.2.3 Groups C and D - Acute challenge, day 51-78.
Liveweights.
4.3.1 Liveweight trends of ewes until housed.
51
51
51
51
51
51
4.3.2 Liveweigbt response of Groups B and BA to acute challenge. 55
4.3.3 Uveweight response of Groups C and D to continuous challenge. 55
4.3.4 Liveweight response of Groups C and D to acute challenge
from day 51-78. 55
Food intake.
4.4.1 Groups C and D, day 1-50.
4.4.2 Groups Band BA, acute challenge day 1-21.
4.4.3 Groups C and D, acute challenge day 51-78.
59
59
59
59
4.5 Milk production. 59
4.6 Lamb liveweight.
4.7 Wool production.
4.7.1 Wool growth and fibre diameter.
64
64
64
iv
4.7.2 Staple strength. 64
5 DISCUSSION. 67
5.1 Recommendations for treatment. 74
5.2 Conclusions. 75
ACKNOWLEDGEMENT 76
REFERENCES 77
APPENDIX 103
List of tables
Table. Title
1 Seasonal wonn burdens of breeding ewes grazing on pasture and the wonn
burdens of breeding ewes and naive hoggets challenged at various intervals
over two years.
2 Experimental design and schedule.
3 Composition and chemical characteristics of pelleted diet.
4a Mean faecal egg counts ewes grazing at pasture before and during the four
infection periods.
4b Mean worm burdens of initial slaughter ewes (Group A), ldlled one week after
being housed indoors.
5 Mean worm burdens in breeding and non-breeding ewes and their faecal egg
counts 21 days after challenge with O. circumcincta larvae on
entry to the experiment.
6 Effect of recent chronic exposure (Group C-40000. circumcincta larvael
day for 30 days) or non-exposure (group D) on the resultant wonn burdens of
breeding ewes after challenge with 20,0000. circumcincta larvae.
7 The effect of host resistance on parasite reproduction, as gauged by total egg
output in chronically infected ewes (Group C) or eggs in utero in
acutely infected ewes (Group B).
8 Mean milk production of breeding ewes chronically (Group C) infected with
4000 O. circumcincta larvae a day for thirty days, and their controls
(Group D), for the first three infection periods.
v
Page
25
37
39
46
46
48
48
49
63

9 The effect of chronic infection, 4000 O. circumcincta larvae/day (Group C),
versus non~infection (Group D) on the wool production of breeding ewes
vi
over a fifty day period (group means). 66
vii
List of figures
Figure. title Page
1 Generalised life cycle of a Trichostrongyle nematode 4
2 Seasonal pattern and origin of infective nematode larvae on pasture grazed
bylrunbs 6
3 Mean faecal egg counts of ewes at pasture 45
4 Mean faecal egg counts (e.p.g) of breeding ewes - Groups C an D for the two
infection periods, day 1-50 and 51~ 78, for the four experimental periods where
challenge commenced 4wks prior to (period 1), at lrunbing (period 2), 6 wks
(period 3) or 12 wks (period 4) after lrunbing. 50
5 Mean weekly serum pepsinogen for infected ewes (group C) versus control ewes
(group D) , for the four, fifty day experimental periods where challenge
commenced 4wks prior to (period 1), at lrunbing (period 2),6 wks (period 3
or 12 wks (period 4) after lrunbing. 52
6 Mean weekly serum pepsinogen for breeding ewes and non-breeding ewes, for the
four twenty one day experimental periods where challenge commenced 4wks
prior to (period I), atlrunbing (period 2),6 wks (period 3) or 12 wks
(period 4) after lrunbing.
7 Mean weekly serum pepsinogen for previously infected and uninfected ewes
- day 51-78, following acute challenge with 20,000 O. circumcincta
lalVae which commenced 4wks (period I), 8 wks (period 2), 14 wks (period 3) or
53
20 wks (period 4) after lrunbing. 54
8 Adjusted mean weekly live weight (kg) for breeding ewes and non-breeding ewes
- day 1-21, challenged with 20,000 O. circumcincta larvae, for the four
experimental periods where challenge commenced 4wks prior to (period I), at
lrunbing (period 2), 6 wks (period 3) or 12 wks (period 4) after lrunbing. 56
viii
9 Adjusted mean weekly liveweights (kg) for infected and control ewes during the
four, fifty day experimental periods where challenge commenced 4wks prior to
(period 1), at lambing (period 2), 6 wks (period 3) or 12 wks (period 4)
after lambing
10 Adjusted mean weekly !iveweight (kg) for previously infected. and uninfected ewes
- day 51-78, following acute challenge with 20,000 O. circumcincta
larvae which commenced 4wks (period 1), 8 wks (period 2), 14 wks (period 3) or
20 wks (period 4) after lambing.
11 Mean weekly food intakes (gDM/kg wO.75/day) for infected and control ewes
during the four, fifty day experimental periods where challenge commenced 4wks
prior to (period 1), at lambing (period 2), 6 wks (period 3) or 12 wks
57
58
(period 4) after lambing 60
12 Mean weekly food intakes (gDM/kg wO.75/day) for breeding ewes and non-breeding
ewes, for the four twenty one day experimental periods where challenge
commenced. 4wks prior to (period 1). at lambing (period 2). 6 wks (period 3) or
12 wks (period 4) after lambing. 61
. 13 Mean weekly food intakes (gDM/kg wO.75/day) for previously infected. and
uninfected ewes - day 51-78, following acute challenge with 20,000
O. circumcincta larvae which commenced 4wks (period 1), 8 wks (period 2), 14 wks
(period 3) or 20 wks (period 4) after lambing. 62
14 Mean weekly lamb liveweights of infected ewes (group C) and control ewes
(group D) during the first three, fifty day experimental periods where ewes
were challenged 4wks prior to (period 1). at lambing (period 2), 6 wks (period 3)
or 12 wks (period 4) after lambing. 6S
List of abbreviations *
variables
CP Crude protein
DE Digestible energy
DM Dry matter
DMD Dry matter digestibility
e.p.g. Eggs per gram
OIT Oastro-intestinal tract
ME Metabolisable energy
NAN Non ammonia nitrogen
W bodyweight
wO.75 Metabolic bodyweight
Units
cm2 centimeter squared
min minute
d day
h hour
wk week
wks weeks
g gram
kg Kilogram
I Litre
mu Milliunits
MJ Megajoules
°C degrees Celsius
Statistics
f2 Coefficient of determination
S.E.D. Standard error of difference
S.E.M. Standard error of mean
L.S.D. Least significant difference
* Note: Commonly used abbreviations such as those denoting chemical elements are not
included here.
ix
1
CHAPTER ONE
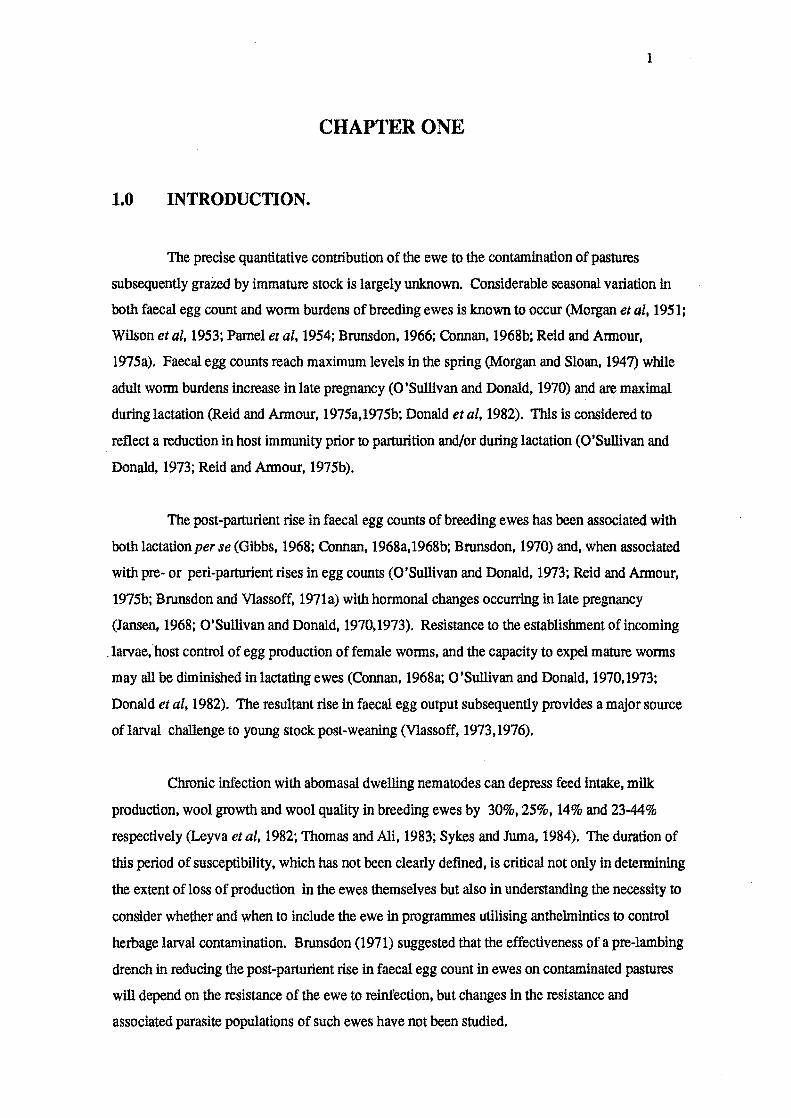
1.0 INTRODUCTION.
The precise quantitative contribution of the ewe to the contamination of pastures
subsequently grazed by immature stock is largely unknown. Considerable seasonal variation in
both faecal egg count and wonn burdens of breeding ewes is known to occur (Morgan etal, 1951;
Wilson et ai, 1953; Parnel et ai, 1954; Brunsdon, 1966; Connan, 1968b; Reid and Annour,
1975a). Faecal egg counts reach maximum levels in the spring (Morgan and Sloan, 1947) while
adult wonn burdens increase in late pregnancy (O'Sullivan and Donald, 1970) and are maximal
during lactation (Reid and Annour, 1975a,1975b; Donald etal, 1982). This is considered to
reflect a reduction in host immunity prior to parturition and/or during lactation (O'Sullivan and
Donald, 1973; Reid and Annour, 1975b).
The post-parturient rise in faecal egg counts of breeding ewes has been associated with
both lactation per se (Gibbs, 1968; Connan, 1968a,1968b; Brunsdon, 1970) and, when associated
with pre- or peri-parturient rises in egg counts (O'Sullivan and Donald, 1973; Reid and Annour,
1975b; Brunsdon and Vlassoff, 1971a) with honnonal changes occurring in late pregnancy
(Jansen, 1968; O'Sullivan and Donald, 1970,1973). Resistance to the establishment of incoming
. laIVae, host control of egg production of female wonns, and the capacity to expel mature wonns
may all be diminished in lactating ewes (Connan, 1968a; O'Sullivan and Donald, 1970,1973;
Donald et ai, 1982). The resultant rise in faecal egg output subsequently provides a major source
oflarval challenge to young stock post-weaning (Vlassoff, 1973,1976).
Chronic infection with abomasal dwelling nematodes can depress feed intake, milk
production, wool growth and wool quality in breeding ewes by 30%, 25%, 14% and 23-44%
respectively (Leyva et ai, 1982; Thomas and Ali, 1983; Sykes and Juma, 1984). The duration of
this period of susceptibility, which has not been clearly defined, is critical not only in detennining
the extent of loss of production in the ewes themselves but also in understanding the necessity to
consider whether and when to include the ewe in programmes utilising anthelmintics to control
herbage larval contamination. Brunsdon (1971) suggested that the effectiveness of a pre-lambing
drench in reducing the post-parturient rise in faecal egg count in ewes on contaminated pastures
will depend on the resistance of the ewe to reinfection, but changes in the resistance and
associated parasite populations of such ewes have not been studied.
2
The following trial investigated the·changes in the susceptibility of breeding ewes,
maintained under typical pasture grazing management conditions, between late pregnancy and 12
weeks post-parturition in terms of larval development and host performance and the importance
of presence or absence of larval challenge for the re-establishment of resistance after parturition.
This investigation concentrated on the effects of Ostertagia circumcincta infection in
breeding ewes. O. circumcincta was chosen because it had been identified as the predominate
parasite species during the spring and early summer period (Bruns don, 1971; Brunsdon and
Vlassoff, 1971a,1971b). Previous studies at Lincoln College (Leyva, Henderson and Sykes,
1982; Sykes and Juma, 1984) have used O. circumcincta infections in breeding ewes and these
have produced some intriguing results .
3
CHAPTER TWO
2.0 LITERATURE REVIEW
2.1 LIFE CYCLE OF TRICHOSTRONGYLE NEMATODES.
The life cycle of Ostertagia circumcincta has been described in detail by Threlkeld
(1934). There are similarities between the life cycle of O. circumcinctaand those of other
trlchostrongyle parasites, the exception to this being members of the genus Nematodirus.
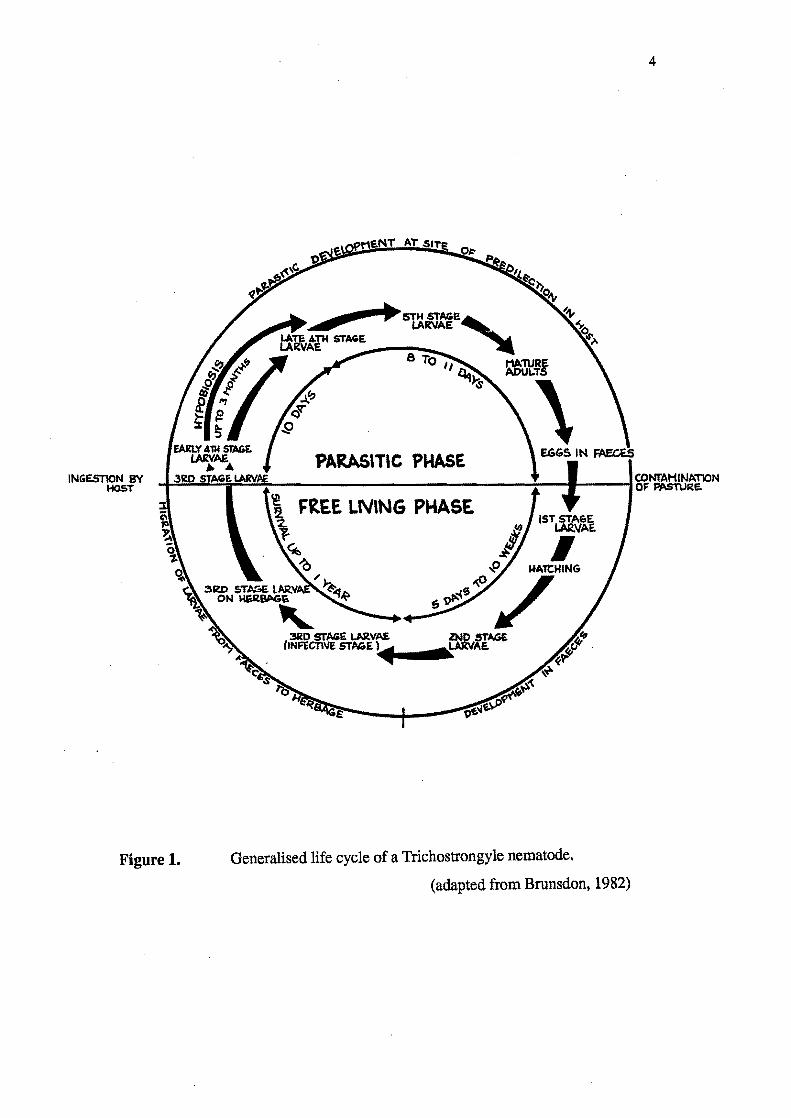
Development from egg to adult worm generally follows that shown in figure 1. Eggs
are passed out into the digesta of the sheep by the adult female worm and then are passed out onto
the pasture within the faecal pellet. Development into Ll and L21arvae occurs within the faecal
mass, these two larval stages being free~living. The larvae then develop into L3 larvae (infective
larvae) still within the faeces. It is at this stage that migration out of the faecal mass occurs via
water films onto the pasture. The length of time the L3 larvae survive on pasture is determined
by the environmental conditions they are exposed to. These third stage larvae are non-feeding,
and are 'infective' to the host.
Contact with a host at this stage is essential to ensure continuation of the life cycle. If
infective larvae are ingested by the grazing host (sheep), larvae pass through the rumen and
exsheathe on entry to the abomasum. In the abomasum exsheathed larvae enter the mucosa to
develop into a L4larvae inside the gastric pits of the abomasum. If development of the L4 stage ,
is not inhibited, they emerge onto the mucosal surface and develop into LS larvae (immature
adults) which will then develop into mature adult worms capable of reproducing to produce eggs
for the next generation of the parasite.
The minimum period from egg to egg can be as little as 28 days, with a minimum
development time of 17-21 days from time of ingestion of infective larvae to detection of eggs in
the sheep faeces.
4
PARA.SlTIC Pf.4ASE INGESTlON 8'i
HOST -I!-=::...1Iii=~~=--____________ ---;:'--I~_--ICONTAHINAT\ON OF PASTUR.E.
Figure 1. Generalised life cycle of a Trichostrongyle nematode.
(adapted from Brunsdon, 1982)

5
2.2 EPIDEMIOLOGY OF TRICHOSTRONGYLE NEMATODES
2.2.1 DEVELOP:MENT AND SURVIVAL OF FREE-LIVING STAGES
The factors which affect transmission of parasites include the host, the climate, and the
inter-relationship of environmental factors which affect survival and development of the free
living stages of the parasites. Pasture larval levels depend on the number of eggs being deposited
on the pasture, and the capacity for those eggs and pre-infective stages to develop and survive.
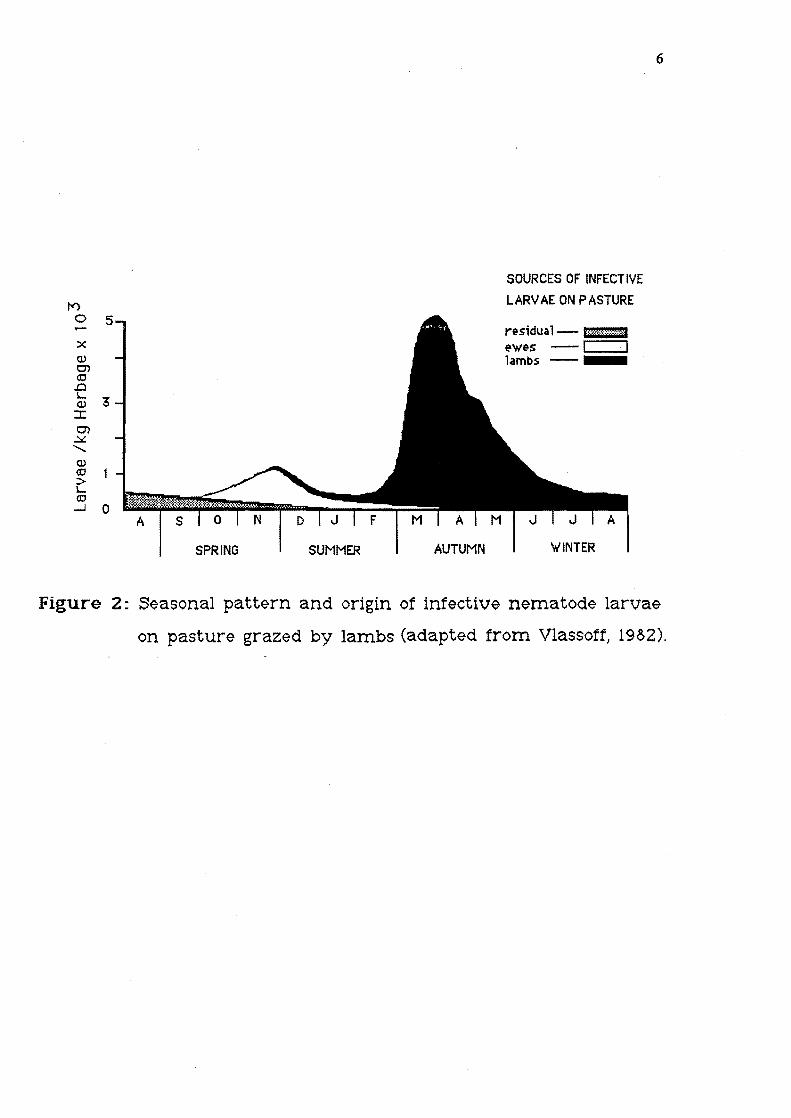
Climatic conditions are a major factor which detennine the seasonal availability of
infective larvae on the pasture. Favourable periods for development of recently deposited eggs
generally occur from October until May, dependant on location (Vlassoff, 1973), when a mean air
temperature of over 10 0 C occurs. The relationship between temperature. moisture status
(rainfall, soil moisture) and larval availability is important. A broad two peak pattern in the
seasonal availabilIty of infective larvae was reported by Vlassoff (1973), The occurrence and
magnitude of these peaks varied from year to year. but generally there was a small rise in spring
followed by a second larger rise in late summer/autumn. Larval availability declines. in mid
summer (January-February), due to high maximum air temperatures and high rates of evaporation
(Vlassoff. 1973) and little egg development occurs over winter (June to September). Based on
this infonnation Brunsdon (1976) established a generalised pattern of pasture larval
contamination. which suggests that animals can be exposed to a level of infection between 200
and 5000 1arvae/kg fresh herbage throughout the year (figure 2).
Different temperature requirements for egg development of the various trichostrongyle
genera have been reported. with O. circumcincta developing at 4-30 • C (Crofton. 1965).
Trichostrongylus colubrijormis between 0-6 to 35 0 C (Gibson and Everett, 1967). and
Haemonchus contortus at 18·40 0 C (Dinaburg. 1944). Temperature alone tends to limit the range
of H. contortus in the south island of New Zealand. There is little difference between the various
genera in the capacity of their infective larvae to survive temperature fluctuations on pasture.
Moisture is required for migration of larvae from the faecal pellets/pats onto herbage
where chances of contact with a grazing host are increased. Presence of surface vegetation has
been associated with greater larval survival probably through maintenance of more favourable
I<")
o 5
x Q) Ci (C .0
~ 3 ::I: Ci ~ ......... Q) (C
> I.... (C
-I 0
SPRING SUMMER AUTUMN
SOURCES OF INFECTIVE
LARVAE ON PASTURE
res;dua 1- '~'··4{{····Mj
~wes - :::1 iii. lambs -.
'HINTER
6
Figure 2: S~asonal patt~rn and origin of inf~ctive nematod~ larvae
on pasture grazed by lambs (adapted from VlassoffJ 19&2).
7
conditions of moisture (Furman, 1944). Vegors (1960) found that development of pre-infective
stages was greater in taller herbage than short, and larvae were vulnerable to ultraviolet light. It
has been suggested that taller swards conserve moisture at or close to ground level and lessen the
effects of direct sunlight on larvae (Goldberg, 1968).
Vlassoff (1982) summarised the distribution of third stage larvae within the sward and
suggested that 50% of any larval population can be found in a zone between the root matt layer
and the first 2 cm of the sWard. Very little information is available on the effects ofirrigation on
egg and larval development and survival. Rose (1962) found the stage of development of pre
infective larvae at time of dispersal (water application), was the major factor determining
subsequent larval survival. It was found that irrigation did not provide 'ideal' or optimum
conditions for development of eggs into larvae, but larval migration from faecal pats and larval
mortality were increased (Young and Anderson, 1981). Flood irrigation resulted in enhanced
migration of third stage larvae from faecal pellets onto herbage (Bullick and Andersen, 1978) and
increased both the proportion of H. contorms larvae which survived, and the ability of those
larvae to survive for longer periods. Honess and Bergstrom (1966) reported higher levels of
infective larvae on irrigated pastures and a change in ratio of species with an increase percentage
of Nematodirus spp present.
Migration of larvae is thought to be a random process (Crofton, 1965); larvae can
migrate up to 100 cm from faecal pats but 90% are generally found within 10 cm (Skinner and
Todd, 1980). The importance of soil as a reservoir for infective larvae and a source of infection
was first suggested by Bairden et al (1979) and AI Saqur et at (1983). The presence of third stage
trichostrongyle larvae in the soil has been reported by many authors (Tripathi, 1974; Levine and
Todd, 1975; Callinan, 1978,1979; Skinner and Todd, 1980; Young and Trajshman, 1980).
Studies by AI Saqur et al (1983) suggested that larvae migrate from soil into root matt layer for
periods of up to 12 months after previous grazing. Outbreaks of clinical parasitic bronchitis in
calves were associated with movement of larvae from the soil to herbage (Duncan et at, 1979).
However only small numbers of infective larvae of sheep gastro-intestinal nematodes have been
found in the soil (Rose and Small, 1985).
The specific epidemiology of nematode parasites is very much influenced by local
climate. Studies of Michel (1976), Vlassoff (1982), Young and Anderson (1981), Anderson et al
(1983), Waller et al (1981) and Callinan (1978) provide much needed basic information on which
an understanding of factors affecting parasite transmission can be based.
8
The seasonal succession of the different larval species on pastUre in New Zealand has
been studied by Brunsdon (1963a) and Vlassoff (1973). They reported a spring larval peak for
Nematodirus spp, a spring/summer peak for Ostertagia spp, a summer/autumn peak for H.
contortus (Brunsdon 1963) and a autumn/winter peak for Trichostrongylus spp. In temperate
regions of the world infective larvae have been found to over winter on pasture (Salisbury and
Arundel, 1970; Donald and Waller, 1973; Boag and Thomas, 1971; Gibson and Everett, 1972;
Reid and Armour, 1975). Considerable numbers of infective larvae were found to over winter on
pasture in New Zealand (Vlassoff, 1976).
Overwintered larvae which originate from eggs deposited in the autumn by lambs
(Vlassoff 1973), are considered by Brunsdon (1976b) and Vlassoff (1976) to be one of the major
contributors to the spring peak and one of the first sources of infection for the next lamb crop.
Similar studies overseas have shown the importance of this as a source of infection for young
lambs. The rise in faecal egg count in breeding ewes around parturition and during lactation,
have also been identified as a source of infection to lambs (Brunsdon 1964a, 1967, 1970a, 1971a;
Brunsdon and Vlassoff, 1971a, 1971b). Larvae develop from eggs shed during the post-parturient
rise and combine with the overwintering larvae to form the spring rise. Similar studies by
Salisbury and Arundel (1970), Donald and Waller (1973), Heath and Michel (1969), Boag and
Thomas (1971), Thomas and Boag (1973), and Gibson and Everett (1972b) confirm this as an
important source of infection. Opinions differ as to the relative importance of the two sources of
~ the spring rise. Recent studies by Familton et al (1986) indicate that adult sheep, from March
onwards contribute to the autumn/winter build up of pasture larval populations and are a major
source of infection for lambs at weaning. Boag and Thomas (1971) and Gibson and Everett
(1972) suggested that contamination from the ewe post lambing was the major factor in
subsequent lamb infections.
In Australia Salisbury and Arundel (1970) found that Ostertagia infection came
predominantly from ewe contamination post-parturition, with Trichostrongylus infection
originating from both the ewe and residual pasture larval population. In New Zealand Vlassoff
(1976) considered that both ewe and residual contamination for both Ostertagia spp and
Trichostrongylus spp are of similar importance. The above studies reflect the importance of even
small differences in climate, and how the individual developmental requirements of each species
influence parasite transmission from one generation to the next in any given environment
9
2.2.2 HOST RESPONSES
Apart from environmental factors, pasture larval levels are ultimately dependent on the
number of eggs deposited on the pasture. Host resistance and its influence on the WOIm
population, its structure and fecundity are important factors in eventual transmission rates of the
parasite population. The epidemiological importance of the host as a source of environmental
contamination and the factors which regulate the host parasite population have a great bearing on
the reproductive success of the parasite. Studies have shown that the establishment of an
infection and various aspec~ of parasite development, including reproduction and expulsion of
the parasite, may be affected by host response mediated by immunological mechanisms.
Host immunity tends to limit the size of the adult population by eliminating developing
stages (Urquhart et ai, 1962), and by reducing survival of adult WOImS in the face of continuous
larval challenge, resulting in constant turnover of the adult population (Michel, 1963; Waller and
Thomas, 1978a).
Animals with previous experience had lower WOIm burdens when compared to initially
non-infected animals when challenged with N. spathiger (Dineen et ai, 1965). A similar
reduction in total WOIm numbers of O. circumcincta was reported by Elliott and Durham (1976).
Clearly, previous experience develops or primes an immune response to further challenge. The
structure of the parasite population in the host can be affected by a number of host mediated
responses, which inc1ude;- resistance to establishment of new infections, effects on various aspects
of parasite development including reproduction and expulsion of parasites.
Resistance to establishment of a new infection has been reviewed by Michel (1969b);
there is considerable evidence suggesting that WOImS do fail to establish in a host. This response
has been reported for N. spathiger (Donald et ai, 1964). In studies with O. ostertagi resistance to
establishment increased with experience of infection (Michel, 1970b;, Michel et ai, 1973). Other
studies have indicated that as dose rates of infecti ve larvae increase establishment rates fall
(Gibson and Parfitt, 1973). Resistant lambs challenged with T. colubriformis (Chiejina and
Sewell, 1974a) and H. contortus larvae (Miller et ai, 1983) were found to reject those larvae
within 24-48 hours of challenge indicating that the immune system can target incoming third
larval stage.
Reductions in parasite fecundity were first reported by Gibson (1953) and Donald et al
(1964). They found that in the later stages of experimental infections oflambs, very few eggs

10
were observed in faeces from animals harbouring large wonn burdens. A decline in numbers of
eggs per adult female wonn were reported in calves infected with O. ostertag;, as duration of
infection increased (Michel, 1963). Reductions in the length of female wonns and observations
of increased incidence of reduced vulval flaps indicated developmental arrest (Michel,
1967b,1969a). Similar changes have been reported in female wonns from lambs infected with O.
circumcincta (Dunsmore, 1960; Coop et aI, 1977), T. axel (Ross 1970), and H. contortus (Christie
and Brambell, 1966; Christie 1970). Hong et al (1986) using O. circumcincta infections in lambs
reported a reduction in vulval flaps in response to the host immune system, and these flapless
wonns fonned a distinct group of smaller sized wonns in the wonn burden.
Development of host resistance as a resplt of exposure to infective larvae has been
associated with the onset of arrested development. It was later shown that once larvae were
arrested they could resume development at a later time (Gordon, 1948; Michel; 1952, Gibson,
1953) (see section 2.4.1).
A sudden fall in faecal egg count of lambs continually infected with H. contortus larvae
was first observed and tenned 'Self cure' by Stoll (1929). 'Self cure' also results in expulsion of
adult wonns, and may eliminate incoming larvae (Gordon, 1948; Stewart, 1950). Classically,
'Self cure' occurs in sheep when a dose of infective larvae is superimposed on an established
adult wonn burden in a sensitized animal. 'Self cure' is a dramatic immunological event which
occurs irregularly and infrequently, and is thought not to be significant in the field as part of the
. immunological process regulating and controlling level of parasite burden. Interestingly' Self
cure' elicited by H. contortus larvae also eliminated other abomasal parasites i.e O. circumcincta
and T. axei, as well as T. colubrlformis from the small intestine, while stimulation of 'Self cure'
by T. colubriformis larvae in sensitized sheep, does not appear to cause expulsion of abomasal
parasites. This led Dineen (1978) to suggest that antigenic material from the larvae passed down
the small intestines, but reverse traffic did not occur.
Gordon (1948) originally stated that "an anthelmintic factor in young pasture" was
responsible and 'Self cure' always followed a period of rainfall. Gordons views gained some
support when Allonby and Urquhart (1973) found 'Self cure' occurred following a period of
significant rainfall in sheep grazing 'parasite free' pasture as well as infected pasture, but this
could also reflect an increase in larval intake even on 'parasite free' pasture. The influence of diet
and nutritional status of the host will be discussed later (see section 2.4.2.2).
11
2.2.3 HYPOBIOSIS - INHIBITED OR ARRESTED DEVELOPMENT
An important factor affecting the parasite population structure in sheep is the
phenomenon of inhibition of development at a precise point in the life cycle. Hypobiosis has
been defined as .. a temporary cessation of development by nematodes at a precise point in their
early parasitic development, where such an interruption contains a facultative element" (Michel,
1974). This phenomenon was first characterised by Sommerville (1953,1954) for O.
circumcincta and extensive reviews (Michel, 1974; Schad, 1977; Gibbs, 1986) have highlighted
such aspects as:
1. Species of nematode.
2. Factors responsible for induction of arrest as well as factors influencing resumption
of development.
3. Implications of hypobiosis in respect to its epidemiological significance, i.e adaptive
and population regulation.
It is Michel's view that nearly all nematode species have an innate capacity to interrupt
their development at an early stage. This is achieved by depressing their metabolic activity which
then extends their survival. Gibbs (1986) refers to two types of hypo bios is; immune mediated
hypobiosis - (inhibited development), and seasonal hypobiosis - (arrested development).
Definitions and tenns in the literature have varied to describe these phenomenon and their usage
indicates the particular views of individual researchers.
2.2.3.1 IMMUNEMBDIATED ARREST
There is evidence that host-mediated factors are associated with the onset of arrested
development. Larger numbers of arrested larvae have been found in unexposed naive animals
after challenge, than in animals with previous exposure to infection (Ross, 1963; Donald et al.
1964; Dineen et al. 1965a,1965b). More recently it has been found that innate resistance
(conferred by its genotype), as expressed in the older animal, also increases the proportion of
arrested larvae (Michel, 1976; Gibson and Parfitt, 1972). The number oflarvae administered in
the challenge dose is another factor; Dunsmore (1960) and Connan (1969) were able to show that
a high single dose of O. circumcincta larvae was more likely to cause arrest of those larvae than a
smaller dose. The effect of a challenge infection upon an existing sensitizing infection increased
the level of arrest in larvae (Dineen and Wagland, 1966; Adams, 1983).
12
It is hard to distinguish arrested wonns from other immature wonns and it appears there
are no adequate means of establishing whether a particular larva is arrested. Rod shaped
crystalline bodies reported by Blitz and Gibbs (1971) as characteristic of arrested H. contortus
larvae, have since been recorded by other wotkers in other species. However not all arrested
larvae display such characteristics. Nonnally it is unifonnity of a population of arrested larvae
that provides the most satisfactory criterion. Development appears to be arrested at a precise
point, which is characteristic for each species. Typically, where both arrested and developing
larvae are present, the size distribution is bimodal. The population consists of two readily
separate parts of which one, displays a wide variation in size and represent the developing larvae,
while the other varies little about a characteristic size and consists of arrested larvae.
Michel (1978) pointed out that many experimental results which purport to show
arrested development, as a consequence of host resistance, on further examination demonstrate
that adult wonns are lost more rapidly from resistant than from susceptible animals, thus leading
to an accumulation of arrested larvae. Further agreement for this point of view comes from Gibbs
(1986), who argues one would expect some morphological evidence of deleterious effects on
these larvae. Examination of the literature that deals with immune-mediated arrest gives very
little infonnation on physiological or other changes that are specifically associated with larvae
under going immune-mediated arrest. Studies by Bird et al (1978) and Waller et al (1978a) found
that the ultrastructure, chemical configuration, occurrence and significance of inclusion bodies in
larvae, were not related to increasing age of host, host responses or to increasing exposure and
furthennore were not related to seasonal fluctuations in numbers of arrested larvae.
That arrested development can be a consequence of the host immune response was
demonstrated, when cortisone treatment or whole body irradiation of sheep substantially reduced
the proportion of arrested larvae present after challenge with Ostertagia larvae (Dunsmore 1961).
The nature of this response in the host which dictates larval development is not known. Recent
studies (Smith et ai, 1984) suggest an active immune response could be involved. They were
able, using hyper-immunised sheep and naive controls that were challenged with 10,000 O.
circumcincta larvae. to provoke a measurable immune response in gastric lymph in primed
recipients only. Analysis of the wonn burden data revealed a low establishment level of 10%
combined with a high level of larval arrest in hyper-immune animals compared to naive animals
where 46% establishment was seen with very few larvae arrested. They concluded that arrested
development oflarvae and the manifestations of a mucosal immune response were a function of
the challenge dose.

13
2.2.3.2 SEASONAL ARRESTED DEVELOPMENT
Other workers, primarily Anderson et al (1965). have suggested that seasonal factors
might be important in the induction of arrested development in some species. This type of
hypobiosis appears to be a facultative, innate developmental response primarily ensuring
transmission for the species. A strong argument as to the function of seasonal arrested
development exists in the literature. Seasonal related hypobiosis peooits survival during periods
of adversity, it could also serve as a highly adaptive population mechanism (Schad, 1977). In
some nematode species it is primarily a mechanism peOOitting survival over seasons unfavourable ... for external development or transmission as free-living fooos (Blitz and Gibbs. 1972a,1972b,
Michel, 1974). It has been suggested that this fooo of hypo bios is represents a seasonal adaptation
for arrest and is analogous to diapause development seen in insects (Aooour and Bruce, 1974;
Horack. 1981).
The occurrence of large numbers of arrested larvae of O. circumcincta during the winter
months has been reported by James and Johnstone (1967a,1976b), Connan (1968a), Reid and
Aooour (1972,1975), Mckenna (1973). Seasonal arrest appears to occur in response to a stimulus
that is usually environmental. This stimulus may be single or multifactorial in nature. Chilling of
L3 larvae of O.pstertagi was suggested as a possible stimulus for inducing arrest by Aooour et al
(1969), this was later confiooed by Aooour and Bruce (1974). On the other hand experience of
natural conditions on pasture induced a greater degree of arrest than storage of larvae at constant
low temperatures (Michel et aI, 1974). Exposure of larvae to gradually falling fluctuations in
temperature and decreasing day length were found to be most effective in inducing arrest with O.
ostertagi (Aooour 1978). Exposure of H. contortus L3 larvae to autumn conditions was
responsible for inducing arrest at the U stage (Blitz and Gibbs, 1972a; McKenna, 1973).
Fernando et al (1971) and Hutchinson et al (1972) showed that the rabbit stomach wooo,
Ostertagia cuniculi could be induced, by storage of infective L3 larvae at low temperatures, to
arrest. Watkins and Fernando (1984) used this infoooation to select for propensity to arrest and
were able, over several generations, to increase the degree of arrest displayed by 0 cuniculi.
In tropical and sub tropical areas seasonally induced hypobiosis is usually linked to the
onset of hot dry conditions, in marked contrast to the conditions which induce arrest in temperate
regions of the world (Blitz and Gibbs, 1972a). In Australia arrested development of O.
circumcincta tends to reach maximum levels in larvae ingested in spring (James and Johnstone,
1967a; Anderson, 1972; Southcott et ai, 1976). These larvae remain arrested until mid-summer
but mature by autumn. High levels of arrested O. circumcincta larvae have been reported during
14
the hot summer months in Iraq (Altaif and Issa, 1983). In Australia O. ostertagi also displays
peak arrest in spring (Anderson. 1968; Smeal et al. 1977).
Exposure of third stage larvae to a reducing photoperiod was found to induce arrest of
larvae (Gibbs, 1973; Connan, 1975). This conflicts with the results of Cremers and Eysker
(1975) who failed to induce arrested development oflarvae by exposure to a reducing
photoperiod. Speculation also exists as to the possible role of moisture and humidity as factors
involved in inducing larvae arrest. When two different levels of moisture (high and low) were
supplied in the larval culturing process, it was found the that degree of arrest displayed by the
larvae was also altered (Connan, 1978). It appears that an innate capability for seasonal arrested
development is present in some nematode strains but not in others, it is possible that parasite
related factors may be responsible for induction of arrest. These include wonn interactions which
have been extensively reviewed by Schad (1977).
There is evidence that genetic control of arrest occurs, different propensity for arrest
apparently existing between different stains of the same nematode species occurring in different
geographical locations (Gordon, 1974; Smeal et ai, 1980). Smeal et al (1980) attributed these
differences in levels of arrest to genetic diversity between the two populations, probably the result
of different climatic conditions. Subsequently Smeal and Donald (1981,1982) confinned these
fmdings and also showed management practices, such as rotational grazing of pastures could act
in maintaining these differences. Therefore it is likely that the factors governing the propensity
. for arrest are plastic and that the facility to alter development to adapt to various environmental
constraints is readily acquired.
2.2.3.3. RESUMPTION OF ARRESTED OR INIDBITED DEVELOPMENT
It appears a variety offactors can lead to larval arrest, Michel (1978) suggested a
number of factors can initiate resumption of development. It is suggested that inhibited
development is similar to the diapause phenomenon seen in insects (Annour, Jennings and
Urquhart, 1969; Biltz and Gibbs, 1 972a). Annour and Bruce (1974) found that inhibited O.
ostertagi larvae developed spontaneously and synchronously, Gibbs (1968) and Connan (1978)
reported similar fmdings using H. contortus in sheep. In contrast Michel, Lancaster, and Hong
(1976a,1976b) suggested that inhibited larvae resumed development at a constant rate. The
suggestion that suppression of host resistance triggered arrested larvae to resume development
was discounted by Blitz and Gibbs (1971), who transferred 'arrested larvae' into wonn free
susceptible sheep and found they did not resume development. In addition, there is a lack of
15
strong evidence that the use of immuno-suppressive drugs will stimulate resumption of
development. Gibbs (1968), using chloroambicil and adrenocorticotrophic honnone, and
Prichard et al (1974) using a corticosteroid (dexamethasone trlmethylacetate) were unable to
initiate resumption of development of hypobiotic larvae. They concluded that a depression of
immunity was not responsible for the resumption of development of arrested larvae.
Similarly, the view that larvae are stimulated to develop by the endocrinal changes of
lactation, is not supported by the available evidence. Larvae resume development in male and
female sheep, and in breeding and barren ewes at more or less the same time (Blitz and Gibbs,
1972a,1972b). In the lactating animal it can be argued that any larvae ingested will develop into
adult wonns, due to the reduced immunological competence of the ewe, as suppression of
immune expulsion of adult wonns is known to occur in the lactating animal.
2.2.3.4 SIGNIFICANCE OF HYPOBIOSIS
Irrespective of the mechanism of inhibited development of nematodes this phenomenon
is very important for the epidemiology of gastro-intestinal nematode infections in ruminants. It
has long been considered to be closely involved with host resistance and regulation of
populations. It was assumed that host regulation caused arrested development, and relaxation of
immunity allowed development to resume. Basically hypobiosis was regarded as a host-regulated
phenomenon. to limit the size and pathogenicity of populations of wonns that accumulate during
. a period of increasing larVal availability.
This concept was then expanded to include the naive host. Dineen (1978) proposed that
control of larval development could be exerted by immunological responses to fluctuating levels
of parasite antigen, which only operate when a threshold level is reached or exceeded. So when
large numbers oflarvae and/or wonns are developing within a host, larvae become arrested, as
adult wonns are lost they are replaced by arrested larvae which resume development.
Recognition of the importance of seasonal factors in invoking arrest (Anderson et ai,
1965; Blitz and Gibbs, 1972a,1972b; Michel, 1974), led to suggestions that inhibited
development is primarily a mechanism pennitting survival of the parasite during periods of
unfavourable climatic conditions, for external development. This view considers hypobiosis to be
a nonnally occurring feature of the nematode life cycle, which evolved when species were
confronted by periods of adverse environmental conditions which limited survival and
transmission. It has also been suggested that this may serve as a highly adaptive mechanism for
16
regulation of parasite populations, i.e. larvae become donnant at a time when the environment is
degenerating for the host thus increasing the host chances of survival as well as the parasite.
Hypobiosis is important for a parasite species at the extreme of its range where the
environment may barely pennit its continued existence (e.g H. contortus in a cold temperate
climate). Nematodirus spp on the other hand utilise a different option to ensure transmission,
with larval development occulTing within the egg which is resistant to desiccation and cold
temperatures. Hypobiosis allows transfer from one breeding season to the next where the host has
extensive migratory habits. Gibbs (1982) speculated that with hypobiosis, maturation oflarvae
coincides with the availability of susceptible host neonates, and this is in many instances a great
advantage to the parasite to enter the host population. Hypobiosis is an adaptive process, which is
a means of synchronising parasite development with changes taking place in its environment,
either externally or in the host.
2.2.4 POPULATION REGULATION
Dependant on the way the parasite population is regulated, the wonn burden mayor
may not be a direct reflection of the current rate of larval intake. A single anthelmintic treatment
of sheep on contaminated pasture may remove a large egg laying population, which mayor may
not be replaced.
Little is known of the dynamics of host parasite interactions. From limited data it
appears that there are differences in regulatory processes of important Trichostrongylid genera
(Anderson and May, 1978). The studies of Michel and co workers (Michel, 1976,1982) have
established that O. ostertagi populations are regulated mainly by a continuous density-dependant
loss of wonns, combined with an increasing resistance to establishment of incoming larvae, so
that the rate of replacement of adults lost falls; ultimately a decline in population numbers occurs,
reflecting a state of constant turnover.
Whether O. circumcincta in sheep is regulated in the same way is not yet clear. although
Gibson and Whitehead (1981) and Waller and Thomas (1978a) reported evidence of turnover of
O. circumcincta populations in lambs. There was some indication that wonn loss was detennined
by rate of larval intake. From the work of Gibson et al (1970). Gibson and Parfitt (1973).
Chiejina and Sewell (1974a,1974b), and Waller and Thomas (1981) it appears clear that
Trichostrongylus spp populations are regulated by the accumulation of adult wonns, which is first
limited by a reduction in the establishment of incoming larvae. There follows a period of stable

17
worm burdens. until adults are finally expelled. In this period of stable worm burdens the host is
unable to expel adults but can exclude incoming larvae. H. contortus it would appear, is
regulated in a similar way to T. colubriformis (Barger et aI1985).
With any natural infection the resultant worm burden is not merely a reflection of the
size or species of the larval challenge. A more complete picture of the resultant worm burden, its
magnitude and composition. and any resultant pasture contamination which may arise from an
infection depends on many factors. The interaction between environment factors, host factors,
and the larvae themselves influence the final outcome of any infection and regulate parasite
transmission.
The importance of host parasite interactions such as, the age and previous worm
exposure of the host, the nutritional and physiological status of the host, and the host genotype
affect the outcome on any infection; these will be discussed later (see section 2.3.2).
2.3 IMMUNITY TO GASTRO-INTESTINAL INFECTIONS
"In natural host parasite relationships the immune response represents the most
effective control against parasitism by the species adapted to life within the environment specified
by the host genotype U (Wakelin, 1986). A parasite population is regulated by immunologically
mediated, often worm density-dependant, responses which influence establishment, survival and
fecundity. An important :feature of the host parasite relationship is the considerable individual
variation seen in worm burdens, where a relatively small proportion of a parasitised population
can harbour the majority of the worms (Schad and Anderson, 1985) while the majority of the
population harbour very few worms.
Adult sheep are considered to be more resistant to parasitism than younger sheep (see
section 2.3.2.2). It appears that even in mature sheep immunity is affected by a number of factors
including nutrition, previous worm experience and genotype of the sheep. The lactating and the
malnourished animals are more susceptible than non-lactating, well nourished animals (Dargie,
1980). Resistance to infection is developed in the face of continuous challenge. When acquired,
the length of time an animal maintains its resistance, in the absence of challenge is not known.
Dineen and Wagland (1966) and Wagland and Dineen (1967) suggest that resistance diminishes
with time after challenge.
18
Development and maintenance of resistance/or immunity to larval establishment
increases as infection rates increase (Jackson and Christie, 1979,1984); use of sensitizing
infections and/or anthelmintic treatment before challenge has either enhanced or interfered with
this resistance (Smith et al, 1984).
2.3.1 IMMUNE EXPULSION OF PARASITES
2.3.1.1 IMMUNE EXPULSION OF LARVAL STAGES
In a resistant 'responsive' host the immune response may act in several ways. In the
hyper-immune animal, a host which has recently experienced and eliminated a primary infection,
larvae may be rejected soon as they enter the gut (Russell and Castro, 1979; Lee and Oglivie,
1981; Miller et ai, 1981), this is called rapid expulsion (Bell and McGregor, 1980; Miller, 1984),
Chiejina and Sewell (197 4b) reported rejection of T. colubrlformis larvae within 48 hours of
challenge and Miller et al (1983) found that H. contortus larvae had penetrated the mucus but not
the mucosa. It has been suggested that mucus plays a role in inhibiting the establishment of
infective larvae in rats ( Miller and Nawa, 1979; Carroll et ai, 1984; Uber et ai, 1980; Miller et ai,
1981). Resistance has been associated with a massive infiltration of the mucosa by mast cells and
globule leukocytes by Miller et ai (1981). Similar results were reported by Smith et al (1984)
using O. circumcincta infections in sheep. They found larvae were rejected within 48 hours of
challenge and concluded that the elimination of larvae was associated with a local immediate
hypersensitivity reaction.
Corticosteroid-mediated suppression of immune exclusion was reviewed by Miller
(1984). It was found that corticosteroid treatment decimated mucosal mast cell production and
resistance to infection was abrogated. Corticosteroids inhibit rapid expulsion of nematodes in
rodents (Miller and Huntley, 1982; Bell et ai, 1982) by blocking immune exclusion and by
reducing the extent of mucus trapping.
Miller et al (1983) suggested three possible mechanisms of immune exclusion;
a)A1terations to the membranes of the surface epithelial cells may disorient the
incoming larvae.
b)Mucus itself may exert a barrier function which is augmented by local
hypersensitivity reactions.
c)The products of mast cell secretions, most notably leukotrienes, may exert a direct
paralysing effect on the parasites.
19
All three are compatible with Miller's concept of mast cell-mediated hypersensitivity reactions.
Gastro-intestinal nematodes can be eliminated after they have established but before
they reach patency (Christie et ai, 1964; Dineen and Wagland, 1966; Adams, 1982). This
mechanism is distinct from rapid expulsion as the larvae have reached their niche and are then
expelled. Expulsion often occurs at a particular stage of the parasites growth cycle. Adams
(1982) found responses to infection with H. contortus were consistent with a stage specific
immune response between day 4 and 7 after infection. Miller (1984) interpreted the work of
Michel (1970a) to suggest that stage specific immune responses were directed against the larval
stages of O. ostertagi in the presence of adult worms. Similar findings have been reported by
Chiejina and Sewell (1974a,1974b) and Jackson et al (1983) with resistance to third stage larvae
developing in the presence of adult worms.
Stewart (1953,1955) reported that 'self-cure', a sudden ingestion of a large dose of
infective larvae, has been associated with expulsion from the abomasum of an existing population
of homologous and heterologous worms. This indicates a stage specific response associated with
an immediate hypersensitivity reaction.
2.3.1.2 IMMUNE EXPULSION OF ADULTS
Expulsion of established adult worms which have achieved patency may occur over a
period of time. Individuai hosts vary greatly in their susceptibility to challenge and presumably
in the rate in which they eliminate the worm burden. Adult worms are lost from as early as day
16 after challenge (Armour et ai, 1966; Ritchie et ai, 1966) but persistence of adult worms
appears to vary with the nature of the challenge. For example, continuous infections of T.
vitrinus in sheep have persisted for up to 14 weeks, although the population of adults worms was
declining (Jackson et ai, 1983). With single infections adult worms persist for longer. For
example, Adams and Beh (1981) found H. contortus worm burdens peaked 10 weeks after
challenge but adult worms were still present 55 weeks after challenge.
Several events are associated with, or occur prior to, worm expulsion and are immune
mediated responses. Reduction in fecundity is generally associated with onset of host resistance
and precedes expulsion. Miller (1984) suggested this can result from overcrowding as described
by Krupp (1961). However, Oglivie and Jones (1971) found that, as the host becomes resistant,
worms which had ovulated ceased to ovulate. Gibbs and Barger (1986) reported a decline with
time in faecal egg counts of ewes with constant adult worm burdens.
20
Stunting of worms, to be distinguished from arrested development, appears to be caused
by host immunity (Dobson, 1982). It was suggested by Michel (1963) thatlate arrival in an
infection, resulted in an inability of those worms to achieve normal size. However, there is also a
suggestion that worms may shrink prior to and during the course of expulsion (Michel, 1963).
Dobson (1982) transferred worms into immune serum and found stunting of worms occurred.
MOIphological evidence of worm damage as a consequence of the immune response was
first described by Oglivie and Hockley (1969). Martin and Lee (1970) reported crystalline
structures in the intestinal tract of N. battus in lambs which were becoming resistant Evidence of
morphological damage to the worms was first reported by Oglivie and Hockley (1969).
Crystalline structures in the intestinal tract of N. battus worms in resistant lambs were reported by
Martin and Lee (1970) to be a consequence of the immune response. Structural damage to worm
gut cells was induced by incubating worms in prostaglandin E2 (Kelly and Dineen, 1972).
2.3.2 FACTORS AFFECTING HOST-PARASITE INTERACTIONS
2.3.2.1 AGE AND PREVIOUS PARASITE EXPOSURE
Young hosts are generally more susceptible to infection than adults, although the cause
of this age related susceptibility has yet to be clearly identified. It is generally accepted that
lambs under 6 months of age are less capable of developing a strong protective immunity than
older animals (Gibson, 1952; Menton et aI, 1962; Urquhart et aI, 1966; Gibson and Parfitt, 1977;
Chiejina and Sewell, 1974a,1974b). Studies in Australia by Dineen et al (1978) and Windon et al
(1980) have shown that a percentage of young lambs, termed fast responders, are capable of
responding as vigorously as mature animals to vaccination with irradiated larvae. Dineen and
Windon (1980) and Windon and Dineen (1981) found that the capacity for an early response,
displayed by the fast responders, was heritable. It appears that different individuals become
responsive at different times, until eventually all are capable of responding.
Adult sheep are considered to be more resistant to parasitism than younger sheep.
Resistance to infection is developed in the face of continuous challenge. When acquired, the
length of time an animal maintains its resistance, in the absence of challenge is not known.
Dineen and Wagland (1966) and Wagland and Dineen (1967) suggested that resistance
diminished with time after challenge.
21
Development and maintenance of resistance and/or immunity to larval establishment
increases as infection rates increase (Smith et ai, 1984; Jackson and Christie, 1979); use of
sensitizing infections and/or anthelmintic treatment before challenge has either enhanced or
interfered with this resistance (Smith et al, 1984).
2.3.2.2 PHYSIOLOGICAL STATUS OF THE HOST
Considerable seasonal variation in both faecal egg count and worm burdens of breeding
ewes occurs (Morgan et al, 1951; Wilson et al, 1953; Parnell et ai, 1954; Brunsdon, 1966;
Connan, 1968a; Reid and Annour, 1975a). Faecal egg counts of breeding ewes reach maximum
levels in the spring(Morgan and Sloan, 1947) while adult wonn burdens increase in late
pregnancy (O'Sullivan and Donald, 1970) to reach maximum levels during lactation (Reid and
Annour, 1975a,1975b; Donald et ai, 1982). This reflects an apparent reduction in host immunity
prior to parturition and/or lactation (O'Sullivan and Donald, 1973; Reid and Annour, 1975b),
Increased susceptibility of lactating animals is well established (Dunsmore, 1965,1966;
Connan, 1968a,1968b; O'Sullivan and Donald, 1970,1973) as a consequence of a suppression of
immune responsiveness (Connan, 1970,1972; Dineen and Kelly, 1972; O'Sullivan, 1974), and it
is suggested this is connected with changes in host honnonal status, Resistance to the
establishment of incoming larvae, controls on egg production of female wonns, and the ,capacity
to expel mature wonns are all diminished in lactating ewes (Connan, 1968a; O'Sullivan and
Donald, 1970,1973; Donald et ai, 1982), The resultant rise in faecal egg output provides a major
source oflarval challenge to young stock post-weaning (Vlassoff, 1973,1976),
2.3.2.2.1 Theories on factors involved in the spring/post-parturient rise
. Several theories have been proposed, discredited, and altered as infonnation on the
factors involved with the spring/post-parturient rise increases. Initially Soulsby (1957) suggested
that the ewe's resistance in spring was diminished due to lack of antigenic stimulation, with low
levels oflarval challenge experienced in mid to late winter. However, both Crofton (1958) and
Gordon (1973) demonstrated that ewes lambing in autumn also displayed a post-parturient rise.
Field et al (1960) found ewes housed indoors over winter also displayed a spring rise in faecal
egg count in the absence of larval challenge.
Stress of pregnancy and parturition were next referred to as possible factors involved in
the post-parturient rise, named by Crofton (1958), this was supported by the studies of Morgan et

22
al (1951), and Soulsby (1957). The absence of a post-parturient rise in ewes which aborted
(Dunsmore, 1965; Brunsdon and Vlassoff, 1971a) and where lambs were born dead or removed at
birth, seriously questioned this theory, especially as Crofton (1958) and Brunsdon (1964a)
reported observing a spring rise in egg counts of non-reproductive sheep.
It was then suggested that lactation and/or associated factors had an important part in
the aetiology of this phenomenon (Crofton, 1958; Gibbs, 1968; Connan, 1968b; Brunsdon and
Vlassoff, 1971a). Good evidence exists that the post-parturient rise in faecal output is due to a
temporary relaxation of the ewes immune system brought about by events associated with
lactation (Connan, 1968a; O'Sullivan and Donald, 1970; Dineen and Kelly, 1972; Soulsby, 1979;
Leyva et al. 1982) .. In contrast to the post-parturient rise reported by many authors (Gibbs, 1968;
Connan, 1968a,1968b; Brunsdon, 1970; Leyva et al. 1982) the occurrence of a peri-parturient rise
in ewes, grazing naturally (Reid and Armour, 1975a,1975b; Brunsdon and Vlassoff, 1971a) or
when experimentally infected (O'Sullivan and Donald. 1973), suggested an association with
hormonal changes in late pregnancy and not simply lactation (Jansen, 1968; O'Sullivan and
Donald, 1970,1973).
However, when lactation was prevented or prematurely terminated the ewe re
established an effective immune response and was capable of rejecting a worm burden to a certain
degree and restricting the fecundity of the remaining parasites. This clearly questions the sole
role of lactation in the spring rise.
Reid and Armour (1975b) suggested that maturation of arrested larvae prior to lambing
was responsible for the initial rise in faecal egg output while the ingestion of overwintering
larvae, during lactation, were responsible for the major increase in egg production post lactation.
Activation of larvae by a low plane of nutrition has been suggested by Connan (1971), Brunsdon
(1967) and Lewis and Stauber (1969), while Blitz and Gibbs (1971) and Blitz (1972) suggested an
alteration of the hormonal balance was responsible for larval activation.
Blitz and Gibbs (l972a) suggested a diapause mechanism for H. contortus via a
seasonal stimulus derived from within the larvae, supporting views of Fernando et al (1971) and
Armour and Bruce (1974). Gibbs (1982) extended this view and postulated that the spring rise
was a two phase phenomenon. Phase one results in maturation of arrested larvae in all classes of
sheep. In non-lactating animals the developing larvae are removed by a self-cure like reaction
and are expelled. Phase two only occurs in the lactating animal where an infection establishes
23
and develops giving rise to a high egg/ova production (Blitz and Gibbs, 1972b), coinciding with
the period of immune relaxation associated with lactation.
Michel (1974,1976) put forward the view that the relationship between physiological
status of the ewe and activation of inhibited larvae disrupted the natural turnover of the worm
population, implying that there is a regular uptake of infective larvae and a fairly regular loss,
except in lactating ewes. Michel argued that all events involving the post-parturient rise could be
explained by postulating that normal mortality of adult worms was suspended in lactating
animals, prolonging the life span of reproducing adults in lactating animals. It seems however,
that this may not be the sole mechanism operating.
Observations of higher post-parturient rises in ewes with multiple lambs Jansen (1977),
Leyva et al (1982), and McSporran and Andrewes (1988) poses the question as to why this
should occur. More interestingly McSporran and Andrewes (1988) found a correlation between
number of lambs born and the magnitude of the post-parturient rise but not with the number of
lambs reared. Connan (1972) suggested that litter size and degree of immune suppression
displayed by the ewe were correlated.
Robinson (1959) reported levels of plasma corticosteroids fell during pregnancy and
then increased during lactation. Using corticosteroid injections Jansen (1977) produced a rise in
faecal egg count of barren ewes, in contrast to Soulsby (1966) who failed to. Jansen (1977)
" concluded that the high levels of plamsa corticosteroids produced during lactation, result in either
a lowering of host immunity or stimulates adult worms to continue egg production, it is
questionable which event occurs first. Corticosteroids are commonly used in experimental
infections to increase faecal egg production, how this is operates is at present unknown. Timing
of the corticosteroids injection appears to be critical. If given prior to larval challenge expulsion
of larvae can occur (Adams, 1982), whereas if given after challenge egg production may be
increased (Adams, 1983).
The role of prolactin in the post-parturient rise has been suggested by Soulsby (1979).
McSporran and Andrewes (1988) administered parlodel (Bromocryptine) to ewes at lambing to
eliminate secretions of prolactin and no effect on subsequent faecal egg production was seen.
They concluded that prolactin secretion during lactation had no influence on the expression of the
post-parturient rises.

24
Nutrition may influence the magnitude of the post-parturient rise (paver et ai, 1955;
Spedding and Brown, 1957; Connan, 1971). Ewes severely stressed during winter exhibit large
spring rises.
2.3.2.2.2 Changes in host resistance
While the mechanism which controls the spring/post-parturient rise in breeding ewes is
still uncertain, it is generally accepted that lactation of the ewe is a major factor in maintaining the
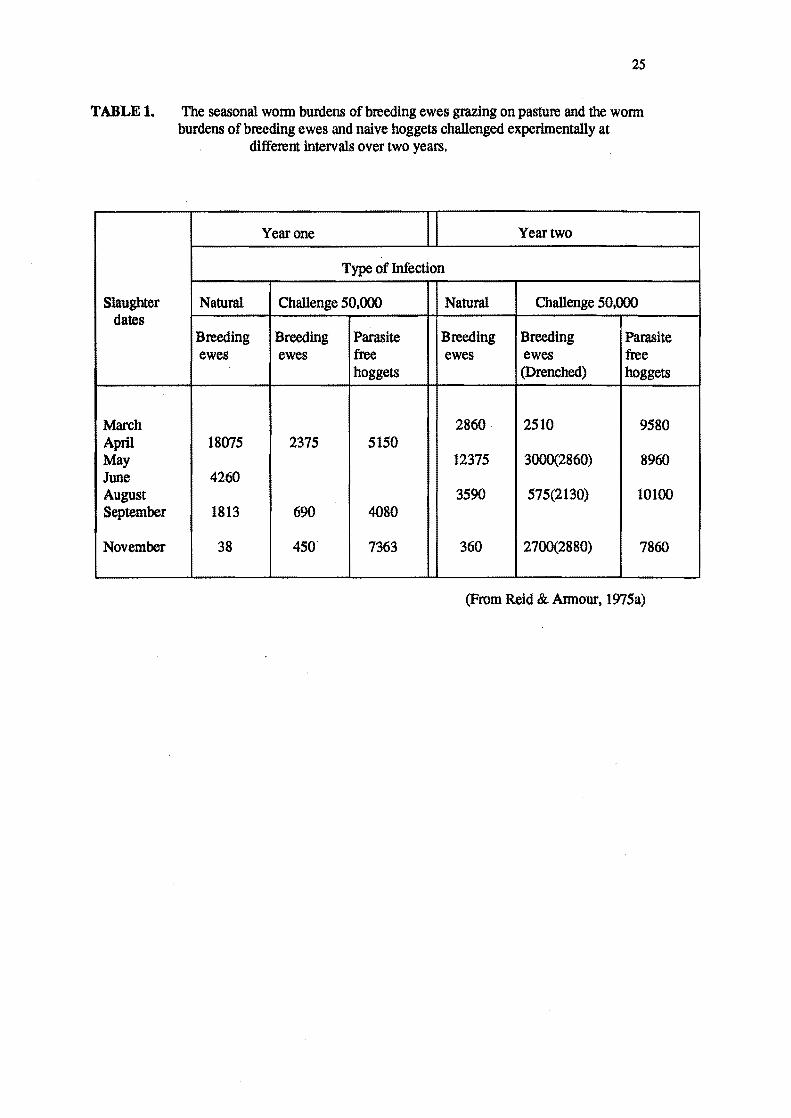
spring rise. Precise changes in host resistance during the breeding season are generally unknown.
Reid and Annour (1975a,1975b) provided evidence that a partial reduction only occurs in the
breeding ewe. They found resistance to a 50,000 O. circumcinctalarval challenge varied from 6
weeks pre-lambing to 6 weeks post-lambing (see Table 1). When breeding ewes and naive
hoggers were challenged with 50,000 O. circumcincta lower worm burdens were displayed by the
breeding ewes at all times of challenge (Table 1). However, even during lactation the breeding
ewe had substantially lower worm burdens than naive hoggers (Table 1). Reid and Armour
(1975b) concluded that the breeding ewe, when subjected to continuous larval intake, still showed
some degree of resistance, and any loss of resistance to establishment of infection, or relaxation
of control on parasite fecundity, which occurs in late pregnancy and lactation, is only partial.
Housing of ewes prior to lambing may result in a higher post-parturient rise when
compared to ewes grazing at pasture (Brunsdon, 1967), suggesting that exposure to challenge
maintains the immune response. Leyva et al (1982) reported a significant pregnancy treatment
intemction, where ewes infected during pregnancy had lower faecal egg counts and greater
productivity in the face of continuous challenge during lactation. t
Studies in New Zealand have shown that a number of nematode species can be the
major contributors to the spring rise, e.g. H. contortus (Brunsdon and Vlassoff, 1971b),
Ostertagia spp (Brunsdon, 1971), Trichostrongylus spp (Brunsdon, 1971). H. contortus and
Ostertagia spp have been found to contribute equally to the spring rise in some New Zealand
studies (Tetley, 1949; Brunsdon, 1970; Brunsdon and Vlassoff, 1971a,1971b). Overseas,
especially in the United Kingdom, it appears that Ostertagia spp are the dominant genus in the
spring rise (Dunsmore, 1965; Connan, 1968a). However, in Europe H. contortus is generally the
more dominant species in the spring rise (Jansen, 1978).
Brunsdon (1970) suggested that the susceptibility oflambing ewes to new infections
was species specific and that the composition of worm burdens were not a reflection of available
25
TABLE 1. The seasonal wonn burdens of breeding ewes grazing on pasture and the wonn
Slaughter dates
March April May June August September
November
burdens of breeding ewes and naive hoggets challenged experimentally at different intervals over two years.
Year one II Year two
Type of Infection
Natural Challenge 50,000 Natural Challenge 50,000
Breeding Breeding Parasite Breeding Breeding Parasite ewes ewes free ewes ewes free
hoggets (Drenched) hoggets
2860· 2510 9580 18075 2375 5150
12375 3000(2860) 8960 4260
3590 575(2130) 10100 1813 690 4080
38 450 7363 360 2700(2880) 7860
(From Reid & Annour, 1975a)

26
larval challenge. Strong evidence exists that the various Trichostrongylid genera elicit different
immune responses in lactating ewes (Gibbs and Barger, 1986). It appears that ewes in late
pregnancy and lactation are more susceptible than dry ewes to infections with Ostertagia and
Trichostrongylus, but no more susceptible than dry ewes to Haemonchus infections.
2.3.2.3 NUTRITIONAL STATUS OF THE HOST
Feed intake, both in quantitative and qualitative tenns, can affect the animal's
susceptibility to the effects of paraSitism. Lucker and Neumayer (1947) demonstrated that poorly
fed sheep infected with hookwonn developed more severe anaemia than did well fed sheep.
Better fed animals harbour considerably fewer wonns than do malnourished animals. A similar
effect was noted by Gibson (1963) and Steel, Wagland and Dineen (1984) whereby sheep on a
higher plane of nutrition had a smaller wonn burden, at post mortem, than did sheep on a low
plane of nutrition. Whether the lower wonn burdens were a result of failure of parasites to
become established or enhancement of the sheeps ability to reject an established parasite
population was not detennined.
Crompton et al (1981) found that protein malnourished rats infected with
Nippostrongylus brasiliensis showed a greater decline in feed intake than did rats fed the same
diet supplemented with casein. Dobson and Bawden (1974) concluded that low protein diets fed
to sheep impaired their resistance to infection by Oesophagostomum columbianum. This
appeared to be a manifestation of an impaired immunological cellular reaction to the establishing
parasites. Duncombe et ai (1981) reported similar findings with rats infected with N. brasiliensis
when offered a low protein diet. Establishment of H. contortus in Finn-Dorset sheep was
influenced by dietary protein, with higher faecal egg output when compared to animals fed on a
higher protein diet (Abbott et ai, 1985a,1985b). Bown (1986) and Poppi (1986) suggested that
when interpreting results of experimental studies, investigating nutrition x parasite interactions,
that the nutritional and physiological status of the animal prior to infection has an important
influence on the susceptibility of that animal to parasitism (Dargie 1980).
Steel, Wagland and Dineen (1984), found lambs fed a low protein diet for 3 months
prior to infection, did not develop resistance to T. colubriformis, a similar group oflambs fed a
higher protein diet showed rapid development of immunity and rejection of parasite. When two
levels of protein were supplied at the same time as infection of parasites an immunological
response developed, but this was slower and less effective at lower protein levels. This suggests
27
that nutritional status of sheep prior to infection is an important factor which determines their
susceptibility to parasitism.
2.3.2.4 HOST GENOTYPE
Genetically determined differences in resistance to gastro-intestinal infections have been
recognised by several early workers (Ounies-Ross, 1932; Gregory, Miller and Stewart, 1940;
Evans and Whitlock, 1964). Reviews by Albers (1981) and Dargie (1982) provided ample
detailed evidence of significant individual and breed variation in susceptibility to infection, as
measured by parasitic burden and inability to resist pathogenic effects of infection. Most studies
involved natural field infections and assessment was based on numbers of eggs per gram of
faeces. The distinction between resistance to pathogenic effects of infection and resistance to
infection as assessed by parasitological parameters is essential in evaluating the usefulness of
genetic manipulation of the host genome for parasite resistance. This lead Albers (1981) to define
resistance as "reaction or state of the host which directly affects the parasite and may be innate
or acquired" which is expressed by prevention or suppression of establishment and/or
development of infection and the expulsion of parasites. Albers and Gray (1987) then defined
resilience as "the ability to maintain a relatively undepressed production level when infected. "
Evidence suggests that the genotype of the host influences the outcome of a parasitic
infection. Breeds of sheep and cattle do appear to differ in their susceptibility to infection with
. gastro-intestinal nematodes. Lloyd and SouIsby (1987) observed that Scottish Blackface sheep
were more resistance than Finn Dorset sheep to both primary and secondary infections with H.
contortu3. There is an abundance of reports on genetic control of resistance in laboratory animal
model systems, indicating genetic factors affect host resistance (Wakelin, 1980). Evidence that
genetic factors playa important role in the resistance of ruminants, especially sheep, to infection
with gastro-intestinal nematodes is provided by studies of breed differences (preston and
Allonby, 1978,1979; Altaif and Dargie, 1978), differences between sire groups within breeds
(Windon et ai, 1980; Donald et ai, 1982) and the association of susceptibility with lymphocyte
antigens (Outteridge et ai, 1985). Windon et al (1980) were able to separate lambs into
'responder' and 'non-responders' based on immunisation with irradiated larvae. Progeny of
'responder' sires were found to be more resistant after immunisation, than the progeny of 'non
responder' sires, and progeny resistance was increased through selection of both sire and dam
responsiveness. Further studies showed the capacity of lambs to respond to vaccination and
challenge with T. colubriformis is highly heritable (Dineen and Windon, 1980). Outteridge et al
(1985) using the same line of sheep demonstrated an association between ovine lymphocyte
28
antigen (SY1) and the response to vaccination against T. colubrijormis. A simUar association
between SY1 antigen and low faecal egg count was also noted amongst the progeny.
2.4 SIGNIFICANCE OF PARASITISM ON THE PRODUCTIVE
PERFORMANCE OF SHEEP
2.4.1 FOOD INTAKE
Reductions in voluntary food intake, or inappetence, is an important factor in acute or
chronic parasitism .. The degree of inappetence can vary considerably with the level and duration
of parasitism. Reductions in intake from 10-20% in young growing animals and mature breeding
ewes have been recorded (Sykes and Coop, 1976,1977; Steel et ai, 1980; Steel et ai, 1982;
Symons et ai, 1981; Leyva et ai, 1982; Thomas and Ali, 1983; Sykes and Juma, 1984).
Studies using single experimental doses oflarvae i.e. O. circumcincta, show a marked
reduction in food intake within the second and third weeks after infection (Horak and Clark,
1964; Jayawickrama and Gibbs, 1967). Sub clinical parasitism studies of Coop et al (1977),
using low continuous experimental challenge, caused 20% reductions in food intake of lambs.
Suggestions by Steel (1978) that the degree of the reduction in food intake is dependant upon the
number of infective larvae ingested have been confinned by Steel et at (1980), and Coop et al
. (1982). Steel et al (1980). and Coop et al (1982) using three different levels of T. coluhriformis
or O. circumcincta infection respectively, found food intake decreased as larval intake increased.
Low daily levels of infection resulted in depression of the food intake of breeding ewes, of
between 11-16% (Leyva et ai, 1982; Thomas and Ali, 1983; Sykes and Juma, 1984). Levya et at
(1982) obselVed a reduction in feed intake during lactation, but not during pregnancy. It seems
that intake may be particularly sensitive to infection when the animal is operating close to
physiological limits i.e. rapidly growing lambs and lactating ewes.
2.4.2 LIVEWEIGHT
Reductions in growth rate of between 10-50% as a result of abomasal infections with O.
circumcincta (Coop, Sykes and Angus, 1982) and intestinal infections, with T. coluhrijormis and
T. vitrinus (Sykes and Coop, 1976,1977; Sykes, Coop and Angus, 1979; Steel, Symons and Jones,
1980; Steel, Jones and Symons, 1982) have been reported.

29
Monospecific infections are rare in the field and it cannot be assumed the effects of
multiple infections are simply additive (Steel et ai, 1982). Sykes et al (1988) demonstrated the
effects of concurrent infections on host production were multiplicative in nature. with a 94 g/day
reduction in body weight gain as a result of mixed infection, twice that expected if the effects
were simply additive.
Many authors have examined the effects on liveweight of frequent anthelmintic
treatment on part of a flock, a smaller number have compared production of frequently treated
animals grazing separately from untreated animals. A 30% reduction in live weight gain of young
lambs grazing' contaminated' (more than 200 larvae kg/fresh herbage) versus 'safe' pastures,
drenched at 3, 6,or 9 weekly intelVals, were reported by McAnulty et al (1982) but little
improvement in liveweight gain was obtained by increasing the drench frequency. Gibson and
Parfitt (1976) and Coop et al (1982) reported that drenching at intelVals of 1 or 3 weeks
respectively, did not restore all the adverse effects of T. colubrijormis infection. Considerable
evidence exists that intake of larvae per se may reduce liveweight. Immune ewes exposed to
lalVal infested pastures (40ooL/day) were found by Brunsdon et al (1986) to have suffered a
significant weight loss, despite displaying zero faecal egg counts and no signs of clinical disease.
Reports of substantial losses in bodyweight of lactating ewes have been associated with
parasitism (Leyva et ai, 1982; Thomas and Ali, 1983; Sykes and Juma, 1984), with Thomas and
Ali (1983) reporting a 12.8 kg weight loss in infected ewes compared to 0.5kg loss in the control
ewes. Little effect of parasitic infection on liveweight has been recorded in the pregnant ewe
(Leyva et ai, 1982; Thomas and Ali, 1983).
2.4.3 MILK PRODUCTION
Connan (1973) suggested that the 'spring rise' might be associated with a decrease in
milk production. Restani (1965) and DalVill, Arundel and Brown (1978) reported anthelmintic
treatment may have a beneficial effect on milk production since lamb liveweights increased.
Infection with 12,000 H. contortus lalVae reduced milk. production in a single ewe from 500z
(1.5kg) to I10z (0.3kg) per day (Gordon. 1950). Thomas and Ali (1983) infected ewes with H.
contortus daily and found milk production was reduced by 23%. Leyva et al (1982) and Sykes
and Juma (1984) reported reductions of 17% and 8% respectively in the milk production of ewes,
in response to a daily challenge of 4000 O. circwncincta larvae. Liveweight gain of lambs was
also affected with a 11 % reduction reported by Sykes and Juma (1984). Munro (1955) and Owen
30
(1957) both demonstrated a highly significant correlation between milk yield and lamb growth
rate.
2.4.4 WOOL PRODUCTION
The detrimental effects of parasitism on wool production were initially reported by
Carter et at (1946). They found clean wool growth was reduced by 59% during the last 14 days
of an 87 day infection period. Sub-clinical worm infections in lambs, grazing pasture, were found
to reduce clean fleece weight by 17% (Spedding and Brown, 1957).
Early studies in New Zealand (B runs don 1963,1964b,1966) and Australia (Gordon,
1964; Anderson, 1972; Anderson et aI, 1976) suggested young stock grazing on pasture suffered
large reductions in wool production due to parasitism. These studies found reductions of up to
45 % in the wool production of parasitised lambs compared to treated animals. fu these studies
the reductions observed in wool production could be considered to be an under estimation of the
effect of helminth infection, as both treated and untreated animals grazed together thereby
exposing treated animals to re-infection. Later studies by Johnstone et al (1976a,1976b) and
Thompson et al (1978) reported reductions of 34 and 46%, respectively, from groups oflambs
grazing separate pastures. Coop et al (1984) continuously challenged young lambs over two 10
week periods and wool production was reduced as a result of infection by 45%.
Wool production of adult sheep is also reduced by helminth infections (Donald, 1979),
but these reductions are less pronounced than those recorded in young stock. Southcott et al
(1967) and Barger and Southcott (1975) suppressively drenched ewes at fortnightly intervals and
found wool production was increased by 8 and 10 % respectively compared to non-treated ewes.
A 17% reduction in wool production due to parasite infection was reported by Barger (1973) who
attributed this to the cost of mounting a immune response. He found a negative relationship
existed between wool growth and worm burden (il = 0.58 p< 0.01), in that those 'resistant'
animals which had rejected their worm burdens suffered a greater loss in wool production.
Barger, Southcott and Williams (1973) reported an 11 % decrease in wool production of
three year old Merino wethers when challenged with H. contortus larvae. On rechallenge wool
production of the wethers was reduced by 12.5%. So far this is one of the few studies to show an
effect of helminth infection on wool growth in 'resistant' sheep. fu contrast, Steel et al (1980)
failed to reduce wool production of young 'resistant' lambs over a twelve week infection period.
31
Some of the effects of parasitism on wool production of sheep can be explained on the
basis of a reduction in food intake. However other studies using pair fed, uninfected controls
have demonstrated lower liveweight gains (Sykes and Coop, 1976,1977) and wool growth
(Barger et ai, 1973) in infected animals. Uniform reductions in both fibre length and diameter
were reported by Bnmsdon (1964b) in parasitised lambs grazing pasture. Lipsen and Bacon
(1976) suggested that occasionally pronounced local reductions which occur in fibre diameter, are
due to temporary high levels of parasitic infection. Using a mixed infection in weaner lambs they
found that fleece weight, fibre diameter and staple length were reduced by 21,8, and 9%,
respectively. However, Hansford (1987) suggested that long term chronic parasitism tended to
have more effect on wool growth than staple strength.
A possibility exists that there is a delay between time of infection and the effects of that
infection to be seen on wool production. Wool production of previously infected animals when
compared to control animals was reduced by 26% during a ten week period after drenching (Coop
et ai, 1984). They suggested either a carry over of the effects of infection on wool production, or
diversion of essential nutrients into growth at the expense of wool production, as liveweight
increased soon after drenching. In many trials the largest reductions in wool growth occurred in
the last sampling period (Carter et ai, 1946; Steel et ai, 1980; Leyva et ai, 1982; Coop et ai,
1984).
Studies on the effect of parasitism on the productivity of pregnant and lactating ewes
have mainly evaluated the production responses to pre- and post-lambing drenching and
subsequent benefits from a reduction in pasture larval levels. Results have been variable and
inconsistent. However they suggest a slight improvement in ewe wool weights. Bnmsdon
(1964b) reported a wool growth response to a pre-lambing drench once in every three years, but
in other studies (Lewis and Stauber, 1969; Leaning et ai, 1970; Donnelly et ai, 1972) there were
no Significant effects. However by running treated and non-treated animals together on
contaminated pastures, ewes were subjected to immediate reinfection after drenching and little
benefit was obtained by drenching pre-lambing.
It is clear that pregnancy and lactation per se have an effect on wool production, and
the combined effect can vary from a 10% to 25% reduction in wool production (Stevens and
Wright, 1952; Brown et ai, 1966). From the limited data available it is apparent that the
depressing effect of gastro-intestinal nematodes on wool growth is greater in lambing ewes than
in their non-reproductive counterparts. Morris et al (1977) and Waller et al (1978a,1978b)
reported differences of up to 40% in wool production during a year and speculated this could be
32
due to a temporary partial loss of immunity to parasitic infection during lactation as described by
O'Sullivan and Donald (1970).
Experimental infection of breeding ewes indoors (Leyva et al, 1982) and outdoors on
clean pasture (Sykes and Juma, 1984), produced substantial reductions in the wool production of
the breeding ewe; with wool production being reduced by 20 and 13 % respectively. Along with
the reduced wool growth Leyva et al (1982) found fibre diameter was reduced by 7% during
lactation. Staple strength of wool grown in late-pregnancy and during lactation, was reduced by
14 and 45%, respectively and by 23% over the combined period. Leyva et al (1982) suggested
that the demands oflactation caused a probable protein deficiency which may lead to reductions
in fibre diameter and wool weight and that these effects were similar to effects associated with
general ewe under-nutrition (Nicols, 1933; Roe, Southcott and Turner, 1959; Sumner and
Wickham, 1969).
2.5 EFFECTS OF PARASITISM ON HOST METABOLISM
2.5.1 INTAKE
Subclinical parasitism probably accounts for greater production losses than clinical
levels of parasitism. A major effect of sub-clinical parasitism is anorexia which follows a
particular pattern dependi?g on the type of infection. Early studies used large single larval doses;
later studies have used a more realistic approach, one that simulates the challenge likely on
pasture, using low continuous larval intakes.
The cause of intake depression is not clear. This topic has been recently reviewed by
Symons (1985) and Poppi (1986); pain and discomfort and hormones, in particular
cholecystokinin (CCK) and gastrin, have been implicated in intake depression associated with O.
circumcincta and H. contortus infections. CCK infusion can depress intake, and CCK is elevated
in infected lambs (Symons and Hennesey, 1981). The role of CCK in regulation ofintake even in
non-infected animals is not, however, clear. Tichen (1982) has linked changes in a range of
hormones including gastrin and somatostatin, with possible effects on intake, digestive tract
motility and metabolism. Pain or neural feed back mechanism have been suggested by Poppi
(1986) but none have been studied.
Sykes (1983) postulated that the depression of intake may be related to nutritional
requirements in that parasitism induces a calcium and/or phosphorous mineral deficiency, with
33
concomitant effect on skeletal development. He proposed that lack of skeletal development could
influence nutrient requirement and hence intake of infected animals,
Kemyer et at (1983) suggested that 'learned' taste aversion may contribute to anorexia,
In their experiments rats exposed to N. brasiliensis while on a diet with a particular flavour,
subsequently rejected that diet in favour of another when offered a choice, This implied that the
rats associated the period of infection with food flavour and disliked the association.
2.5.2 PHYSIOLOGICAL DISTURBANCE TO GASTRO-INTESTINAL
FUNCTION IN INFECTIONS WITH O,circumcincta
Pathophysiological effects of experimental infections with single or multiple doses of O.
circumcincta larvae start within four days of their administration, when larvae become established
in gastric mucosa (McLeay,Anderson,Bingley and Titchen, 1973; Anderson,Blake and Titchen,
1976; Anderson,Hansky and Titchen, 1981). The sequence of pathological and biochemical
changes have been described in detail by Armour et al (1966). Infection in the abomasum,
particularly with O. circumcincta and H. contortus results in damage to parietal and chief cells,
caused by fourth stage larvae as they develop and emerge from the gastric glands. Acid secretion
is impaired and pH of the abomasum can rise from 1.8-3 to 6-7. Conversion of pepsinogen to
active proteolytic enzyme is curtailed when pH levels rise to 3.54.0. Leakage of pepsinogen into
plasma occurs as a result of damage to cell junctional complexes in abomasal infections with T.
axei, H. contortus and O. circumcincta. In general pH of abomasal digesta rises to 7.0 within 10
to 14 days after infection.
The rise in plasma pepsinogen seen in calves infected with O. ostertagi (Jennings et ai,
1966) was thought to be a consequence of increased mucosal permeability within the abomasum.
Increased mucosa permeability was demonstrated by Mulligan et al (1963) and Murray (1969) to
occur when larval stages emerged from the mucosa. However Anderson et al (1985) showed
clearly that transfer of adult worms alone induced reductions in food intake and elevated plasma
pepsinogen and gastrin within 24 hours of transfer, and further increases in plasma pepsinogen
and gastrin occurred when pH rose between 5-7 days after transfer. McKellar et al (1986)
transferred adult O. ostertagia into the abomasum of calves and suggested that the resultant
elevation in pepsinogen activity may be mediated by excretory/secretory products of the parasite.
Serum gastrin rises substantially within 2-3 weeks of first infection. In Ostertagia infections the
rise in plamsa gastrin is probably due to direct stimulus. As Anderson et al (1985) found the rise
in gastrin preceded the rise in pH of abomasal contents, Nicholls et al (1985) reported similar
34
findings with H. contortus infections. It is suggested by Fox et al (1988) that gastrin is secreted
in an attempt to stimulated acid production and lower gastric pH.
2.5.2.1 Endogenous losses into gastro-intestinal tract
A distinctive feature of gastro-intestinal parasitism is the loss of protein into the gastro
intestinal tract (Holmes, 1986) Increased losses of plasma into the gastro-intestinal tract have
been observed in abomasal infections with O. circumcincta (Holmes and MacLean, 1971;
Symons et ai, 1981; Steel et ai, 1982), H. contortus (Dargie, 1975), and in small intestinal
infections with T. colubriformis (Barker, 1973; Steel et ai, 1980; Symons et ai, 1981). This
leakage of plasma proteins appears to be related to larval intake (Steel, 1978).
Reductions in apparent nitrogen digestibility in both ostertagiasis and trichostrongylosis
have been reported (parkins et ai, 1973; Sykes and Coop, 1977; Steel et ai, 1980; Steel and
Hogan, 1972; Barger, 1973; Steel, 1978; Sykes et aI1979). With relatively low levels of
infection with O. circumcincta it was found that apparent nitrogen digestibility was significantly
reduced (Sykes and Coop, 1977; Symons et ai, 1981). This is in contrast to trichostrongylosis
where Roseby (1973), Sykes and Coop (1977) and Poppi et al (1985) found no significant effect
of infection on apparent nitrogen digestibility. It seems there is a threshold level of larval intake
above which apparent nitrogen digestibility is impaired by T. colubriformis infections.
Impaired abomasal secretion of acid and pepsinogen, due to parasitic damage of
abomasal mucosal cells, has been reported to result in decreased protein digestion (Aouour et ai,
1966; McLeay et ai, 1973; Symons et ai, 1981). Steel et al (1980) observed that 80% of the
endogenous nitrogen lost from the abomasum was apparently reabsorbed before it reached the
large intestine. This indicates that, overall, the digestion and abs01ption of protein was not
significantly altered by infection. Though apparent digestibility of nitrogen is reduced in
parasitised animals, true digestion and absorption of protein is not affected. Symons and Jones
(1970) found true absorption of casein and 14C labelled Chlorella protein was not affected by
infection with T. colubriformis in sheep, and Poppi et al (1981) also demonstrated using 35S
labelled rumen bacterial protein, that true digestion and absorption of protein was not affected by
T. colubrijormis infections in sheep.
In studies using concurrent infections of O. circumcincta and T. colubrijormis, Steel et
al (1982) found compensatory digestion and absorption appeared to occur as effectively in
. concurrent infections as for mono speCific infections. However it must be remembered that faecal

35
nitrogen does not necessary reflect the true endogenous nitrogen absorption from the small
intestine due to microbial degradation of the extra NAN (non ammonia nitrogen) in the large
intestine and subsequent absorption of the resulting ammonia (Roseby, 1977). Therefore, if true
digestion and absorption of protein is apparently not affected by parasitism, the increased nitrogen
content of ileal digesta in infected aniinals. is a result of increased protein of endogenous origin in
the gastro-intestinal tract.
2.5.3 MINERAL :METABOLISM
It has been demonstrated that skeletal growth and mineralization of bone are impaired
by parasitism ( Sykes et al, 1975,1977; Sykes and Coop, 1976,1977; Coop and Field, 1973). The
results of Sykes et al (1975) suggested the calcium and phosphorus metabolism were altered by
parasitism. A reduction in the efficiency of use of dietary Ca and P in parasite infected animals
were reported by Shearer and Stewart (1933) and Franklin, Gordon and MacGregor (1946).
Reveron et al (1974) and Sykes and Coop (1976) suggested parasitism affected absorption of Ca
and P from the gastro-intestinal tract. Later studies using O. circumcincta and T. colubrijormis
infections found absorption of Ca and P from the gastro-intestinaltract and plasma Ca levels were
unchanged (Wilson and Field, 1983; Poppi et ai, 1985). In both those studies faecal excretion of
ea was elevated in parasitised animals, this was considered to be due to endogenous Ca loss into
the gastro-intestinal tract~ "'±
Phosphorus metabolism of animals infected with T. colubrijormis is markedly altered.
Reveron et al (1974) and Sykes and Coop (1976) reported an apparent reduction in absorption of
P. Wilson and Field (1983) found that true absorption of 32p in the small intestine was reduced
by about 33% in infected animals. However. infections with O. circumcincta are associated with
osteoporosis, but it appears that this parasite does not affect P absorption nor affect plasma P
levels (Wilson and Field. 1983). Also, mineral metabolism does not appear to greatly affected by
ostertagiasis (Wilson and Field, 1983), it seems that osteoporosis in Ostertagia spp infections is
caused by a reduction in bone matrix synthesis, demonstrated by Sykes et al (1977). This may be
in response to a change in partitioning of protein synthesis between the tissues.
36
CHAPTER THREE
3.0 MATERIALS AND METHODS
3.1 EXPERIMENTAL DESIGN
One hundred and seventy. 5-year old Coopworth ewes were selected from a
common pool and grazed at pasture five weeks prior to mating. Mating was synchronised
by implantation of C.I.D.R. devices (9% (0.3g) Progesterone. A.H.I. Plastics Moulding
Co .• Hamilton, N.Z) in all ewes. Individual mating dates were recorded. Between 60 and
64 days after mating the presence of corpora lutea in marked ewes was determined by
laproscopy for pregnancy diagnosis. Pregnant sheep were then allocated hierarchically
according to bodyweight to four groups (n=24) of animals. Barren ewes were allocated to
. four corresponding groups (n=6) of animals on the same basis.
One group of pregnant and one group of non-pregnant ewes, were then allocated to
each of four periods of infection which commenced, respectively, 4 weeks prior to (period
1), or two days (period 2) or 6 or 12 weeks (periods 3 and 4, respectively) after lambing.
Fourteen days before commencement of each infection period. ewes were brought indoors
into individual pens and allowed 9 days to adapt to indoor feeding. Ewes were drenched
. with anthelmintic (lvermectin, M.S.D.) 7 days prior to commencement of infection.
At each infection period the 24 pregnant ewes were then allocated. on the same
basis as discussed above, to one of 4 treatment groups. The first (Group A) was slaughtered
to determine total worm burden. The second (Group B) was treated with anthelmintic 7
days prior to challenge, infected with 20,000 O. circumcincta larvae and killed after a
further twenty one days for total worm burden. The third (Group C) was treated with
anthelmintic 7 days prior to challenge infection commenced with 4,000 O. circumcincta
larvae per day and which continued for 30 days. The fourth group (Group D) were controls
for Group C and received the same treatment regimen but without receiving the 30 day
trickle infection.
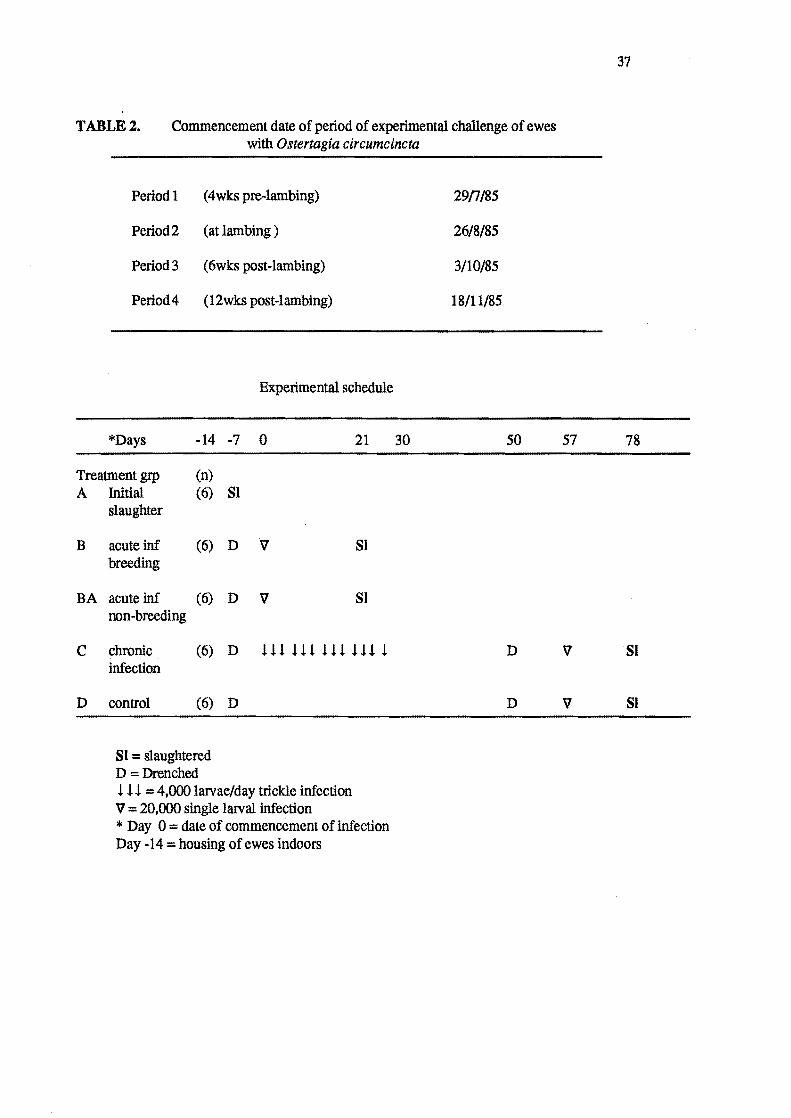
TABLE 2. Commencement date of period of experimental challenge of ewes with Ostertagia circumcincta
Period 1 (4wks pre-lambing)
Period 2 (at lambing)
Period 3 (6wks post-lambing)
Period 4 (12wks post-lambing)
Experimental schedule
"'Days -14 -7 0 21
Treatment grp (n) A Initial (6) 81
slaughter
B acute inf (6) D 'iJ 81 breeding
BA acute inf (6) D 'iJ 81 non-breeding
C chronic (6) D lH lH lH Ull infection
D control (6) D
81 = slaughtered D = Drenched III = 4,000 larvae/day trickle infection 'iJ = 20,000 single larval infection '" Day 0 = date of commencement of infection Day -14 = housing of ewes indoors
30
26/8/85
3/10/85
18/11/85
50
D
D
37
57 78
'iJ 81
'iJ 81
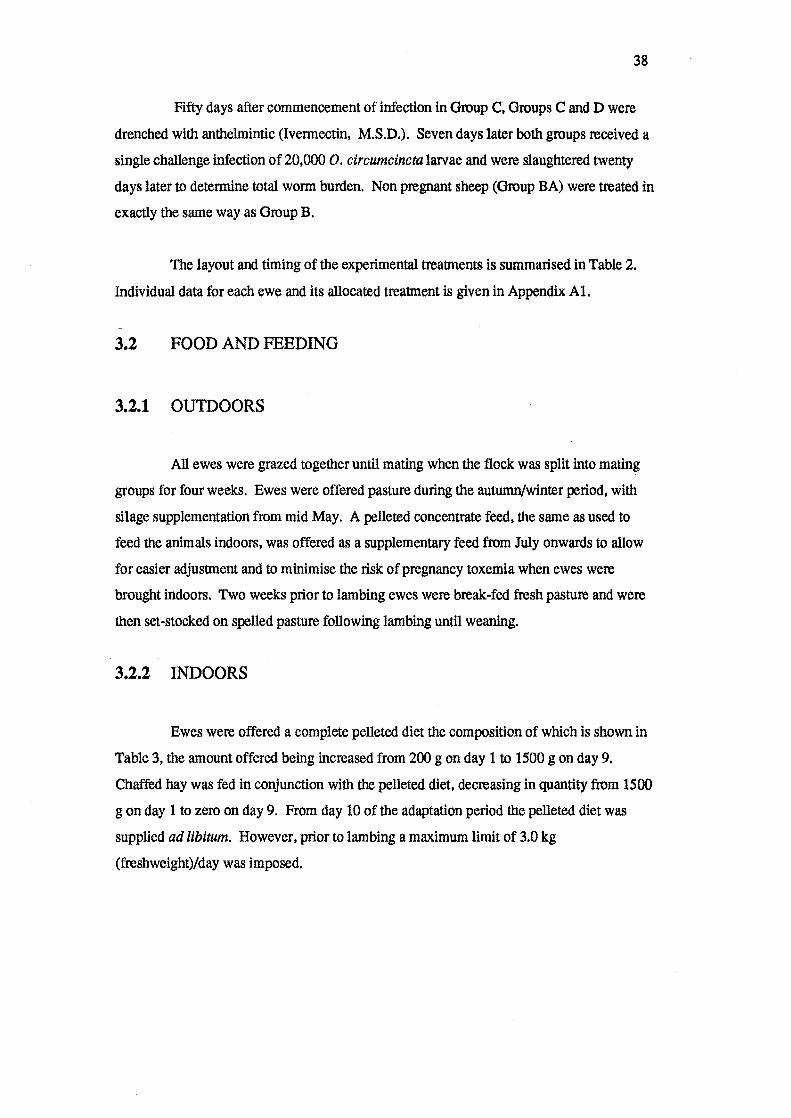
38
Fifty days after commencement of infection in Group C, Groups C and D were
drenched with anthehnintic (Ivermectin, M.S.D.). Seven days later both groups received a
single challenge infection of 20,000 O. circumcincta larvae and were slaughtered twenty
days later to determine total worm burden. Non pregnant sheep (Group BA) were treated in
exactly the same way as Group B.
The layout and timing of the experimental treatments is summarised in Table 2.
Individual data for each ewe and its allocated treatment is given in Appendix At.
3.2 FOOD AND FEEDING
3.2.1 OUTDOORS
All ewes were grazed together until mating when the flock was split into mating
groups for four weeks. Ewes were offered pasture during the autumn/winter period, with
silage supplementation from mid May. A pelleted concentrate feed, the same as used to
feed the animals indoors, was offered as a supplementary feed from July onwards to allow
for easier adjustment and to minimise the risk of pregnancy toxemia when ewes were
brought indoors. Two weeks prior to lambing ewes were break-fed fresh pasture and were
then set-stocked on spelled pasture following lambing until weaning.
3.2.2 INDOORS
Ewes were offered a complete pelleted diet the composition of which is shown in
Table 3, the amount offered being increased from 200 g on day 1 to 1500 g on day 9.
Chaffed hay was fed in conjunction with the pelleted diet, decreasing in quantity from 1500
g on day 1 to zero on day 9. From day 10 of the adaptation period the pelleted diet was
supplied ad libitum. However, prior to lambing a maximum limit of 3.0 kg
(freshweight)/day was imposed.
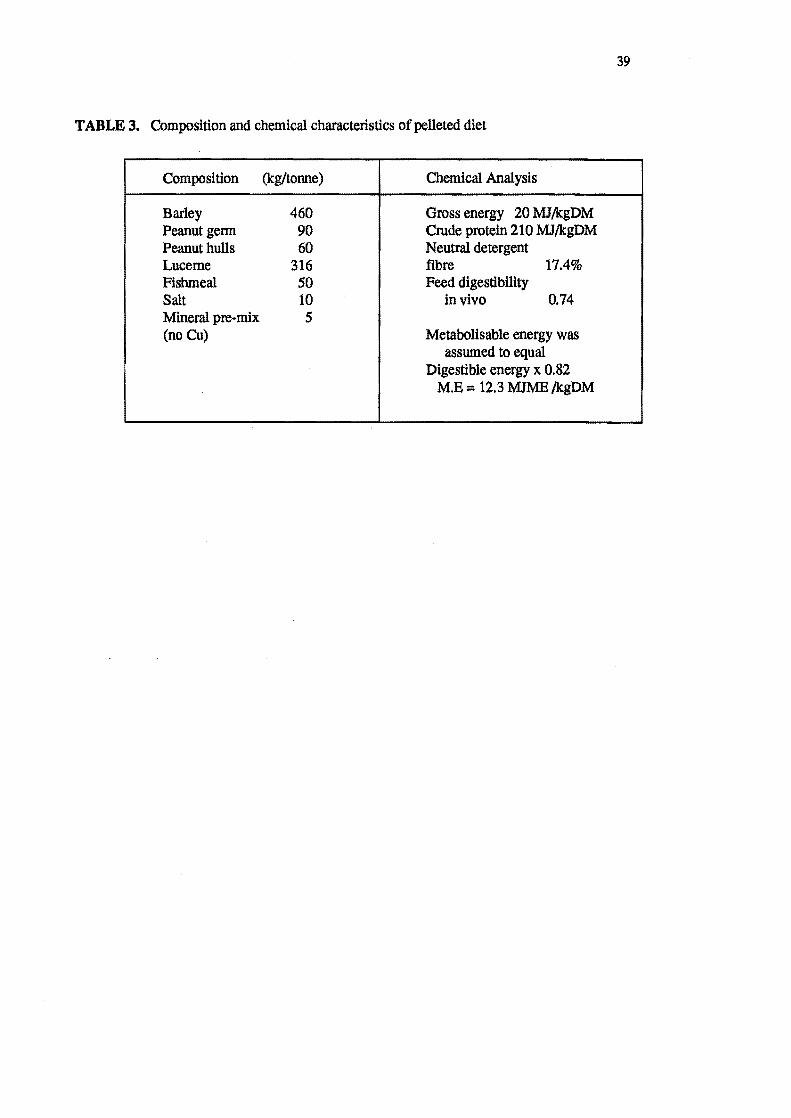
39
TABLE 3. Composition and chemical characteristics of pelleted diet
Composition (kg/tonne) Chemical Analysis
Barley 460 Gross energy 20 MJ/kgDM Peanut germ 90 Crude protein 210 MJ/kgDM Peanut hulls 60 Neutral detergent Lucerne 316 fibre 17.4% Fishmeal 50 Feed digestibility Salt 10 in vivo 0.74 Mineral pre~mix 5 (no Cu) Metabolisable energy was
assumed to equal Digestible energy x 0.82
M.E = 12.3 MJME /kgDM
40
3.3.0 PARASITOLOGICAL PARAMETERS MONITORED
3.3.1 INFECTIVITY OF LARVAE
All larvae were stored at a constant temperature (4 • C) and photoperiod in order
to ensure consistent pathogenicity. Thirty percent of infective larvae were two months of
age or less, and the remaining 70 percent were between three and four months old.
Additional animals less than 12 months of age were challenged at intervals, to supply fresh
larvae for the trial. Faecal egg counts in these animals consistently rose to levels in excess
of 1,100 epg after challenge with 10,000 larvae, indicating good and consistent
pathogenicity of infective larvae.
3.3.2 WORM BURDENS
At slaughter the abomasal contents and washings were collected for detennination
of wonn burden (Robertson and Elliott, 1966) and the abomasum then digested in acidified
pepsin solution (Herlick, 1956) to recover immature larval stages. In addition, washings and
contents of the first five metres of the small intestine of Group A sheep were subjected to
the same procedures.
3.3.3 FAECAL EGG COUNTS AND SERUM PEPSINOGENS
Blood and faecal samples were collected at weekly intervals from animals housed
indoors and at fortnightly intervals from animals grazing at pasture. Blood was collected
into vacutainers (Terumo Corporation, Tokyo, Japan) allowed to clot at room temperature
and the serum separated and stored at -20 0 C. Serum pepsinogen levels were detennined by
a modification of the method of Mylrea & Hotson (1969) and activity expressed as
milliunits (mu) of tyrosine where 1mu = 1m-mol Tyrosine/ L plasmal min at 37 • C. Faecal
samples were processed by a modified McMaster method (Vlassoff, 1973) and values
expressed as eggs per gram fresh weight (e.p.g.).
3.3.3 EGGS IN UTERO
The number of eggs per adult female wonn was estimated for all Group B animals
where 50 adult female wonns were collected after the wonn burden analysis. The female
41
worms were soaked in lactophenol blue overnight to clear the specimens and then mounted
on slides. The number of eggs in utero was then recorded by examination under a
compound binocular microscope.
3.4.0 PRODUCTION PARAMETERS MONITORED
3.4.1 FOOD INTAKE
All ewes were offered feed ad libitum except those housed indoors before
parturition. as already outlined (see section 3.2.2). Ad libitum feeding was maintained by
offering 120% of the previous days consumption on a fresh weight basis. Food offered and
refused was recorded daily. A feed sample was taken each day and this and refusals (bulked
within each week) used for dry matter analysis (72 h at 100 • C).
3.4.2 EWE LIVEWEIGHTS
All ewes housed indoors during treatment periods were weighed weekly at 8.30am
before feeding. Ewe liveweights were monitored at fortnightly intervals from animals
grazing at pasture.
3.4.3 LAMB LIVEWEIGHTS
All lambs were weighed within 8 hours of birth. and at weaning. Lamb liveweight
was measured weekly during lactation. The weight used during periods of measurements of
milk intake was that recorded. pre-suckling at 7.30am.
3.4.4 MILK PRODUCTION
Milk. yield was estimated weekly by the lamb suckling technique described by
Owen (1957) during a period of 12 h. Lambs were removed from their mothers for 4 h
periods. starting a 3.30 am, and then allowed to suckle at 4 h intervals over the next 16 h.

42
3.4.5 WOOL MEASUREMENTS
3.4.5.1 GROWTH RATE
All sheep allocated to groups C and D had a patch (100 cm2) delineated on their
right mid side with the top margin approximately 20 em from the mid-line and the rear
margin over the last rib, on June 301985. Two samples were collected from each animal,
the first prior to experimental infection, and the second at the conclusion of the fifty day
period of chronic infection (50 days growth). Wool growth has therefore been expressed as
mg/100cm2/day.
3.4.5.2 FIBRE DIAMETER
Average fibre diameter was measured using l.Og samples. during each period
using the standard airflow method (International Wool Textile Organisation, 1973). Where
only 0.5g samples were available an appropriate calibration was made using measured
samples.
3.4.5.3 STAPLE STRENGTH
Staples on a left mid side patch were marked by dye-banding (Chapman and
Wheeler, 1963). Dye was applied at day 0 and day 50 of each 50 day experimental period
and samples removed 28 days after the latter infections were terminated. Staple strength
was estimated using a pendulum dead weight tester (Ross, 1960) after conditioning for 48 h
at constant humidity. Staples were prepared as described by Ross and Miekle (1986), with a
minimum of seven and a maximum of ten staples being broken per animal. The dye-banded
line corresponding to the start of infection was clamped in one jaw and that corresponding to
the end of infection in the other. Staple strength results were expressed as g/tex (cN/tex) for
a mean ten samples per animal.
3.5 STATISTICAL ANAL YSIS
Data manipulation and analysis of variance, regression, and co-variance analysis
were accomplished using the Genstat statistical software package- (Release V5.0-2A;
Rothamstead Experimental Station, England). The experimental data were analysised as a 2

43
x 4 randomised block design. Significant differences between group means for all
parameters were detennined by use of S.E.M and L.S.D. were appropriate. Orthogonal
polynomials (Rowell & Walters, 1976; Little & Hills, 1978) were employed to deal with
consecutive observations of each parameter over time, as these were not independent and the
residual degrees of freedom were reduced accordingly, by use of a conservative F test or
regression analysis.
Milk production data was analysised using a least squares approach on software
package (Harvey, 1985).

44
CHAPTER FOUR
4.0 RESULTS
Five animals died during the experiment. All were infected animals, one in period
1, three in period 2, and one in period 3. Four of the animals from periods 1 and 2 of
infection were replaced. However, the three animals used in period 2 lambed 4 weeks later
and it appears were not as severely affected by infection compared to the remaining three
members of that Group (period 2 Group C).
4.1 WORM BURDENS, EGGS IN UTERO and FAECAL EGG COUNTS
Individual worm burdens of all ewes in Groups B,BA,C,D and Group A are given
in Appendices A4a and A4b, respectively.
4.1.1 Initial slaughter animals (Group A)
Faecal egg counts of ewes at pasture (Figure 3) tended to mirror the rise in worm
burdens of animals slaughtered at intervals off pasture Group A (Table 4b). Faecal egg
counts rose gradually to a peak of 520 epg by eleven weeks post-lambing and then declined
rapidly"(Figure 3). Worm burdens recovered from Group A ewes at slaughter increased
gradually during the trial (Table 4b). No significant differences occurred between the total
worm burdens of group A ewes for periods 1 to 3. However, worm burdens acquired by
Group A ewes period 4 (slaughtered at 11 wk post parturition) were significantly higher
than those of periods 1,2, and 3 (p < 0.001). No significant differences were found in the
small intestinal burdens of ewes between the four periods of infection.
4.1.2 Response of breeding and non-breeding sheep to challenge infections when
brought indoors (Groups B and BA)
Worm burdens of breeding (Group B) and non-breeding (Group BA) ewes after
challenge with 20,000 O. circumcincta larvae and egg counts on day 20 after infection,
followed the pattern of changes in worm burdens of sheep from pasture ( Table 5). Eggs in
utero for Group B ewes during periods 1 to 3 of infection are given in Table 7. Numbers of
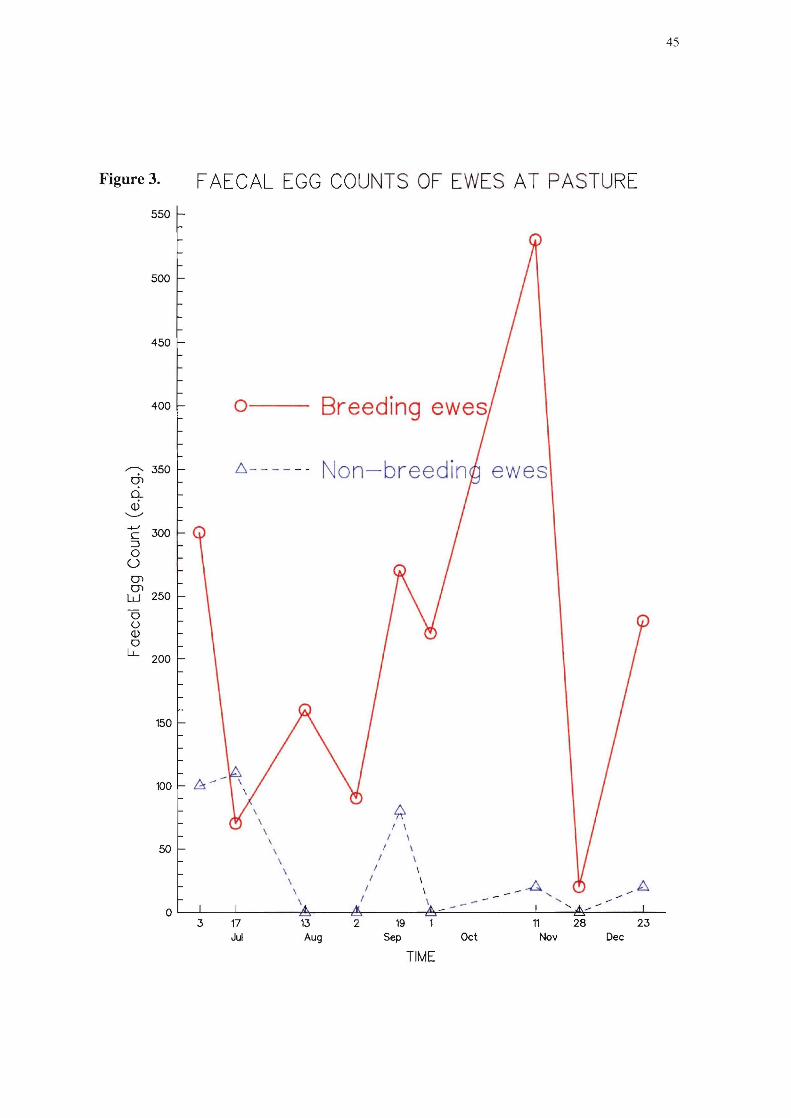
Figure 3.
550
500
450
400
~ 350 01 0..
~ 300 ::J o
U 01 01
W 250
o o (]) o
LL 200
150
100
50
0
45
FAECAL EGG COUNTS OF EWES AT PASTURE
0--- Breeding ewes
6- - - - - - Non- breedin ewes
~ I \
I \
\ I \
\ I \
\ I \
\ I \ _ A \ I \ ....
\ I \
3 17 13 2 19 11 28 23 Jul Aug Sep Oct Nov Dec
TIME
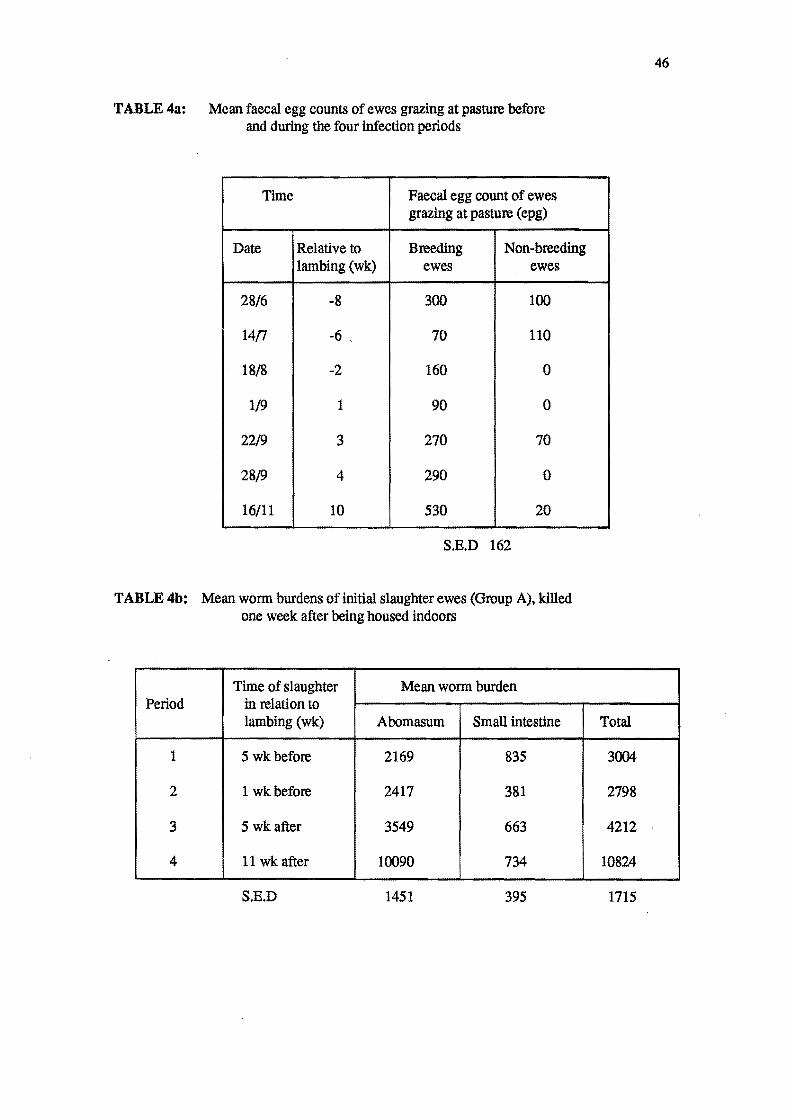
TABLE 4a: Mean faecal egg counts of ewes grazing at pasture before and during the four infection periods
Time Faecal egg count of ewes grazing at pasture (epg)
Date Relative to Breeding Non~breeding
lambing (wk) ewes ewes
28/6 -8 300 100
14n -6 70 110
18/8 -2 160 0
1/9 1 90 0
22/9 3 270 70
28/9 4 290 0
16/11 10 530 20
S.E.D 162
TABLE 4b: Mean wonn burdens of initial slaughter ewes (Group A), killed one week after being housed indoors
Time of slaughter Mean wonn burden Period in relation to
lambing (wk) Abomasum Small intestine
1 5 wkbefore 2169 835
2 1 wkbefore 2417 381
3 5 wkafier 3549 663
4 11 wk after 10090 734
S.E.D 1451 395
46
Total
3004
2798
4212
10824
1715
47
eggs in utero per adult female worm increased to a maximum of 45 eggs per female and
then decline to 38 by period 3. There was a significant effect of time of infection on
numbers of eggs per adult female (p <0.05). Mean faecal egg counts of Group B and BA
ewes are given in Table 5. Individual faecal egg counts of ewes in Groups B and BA are
given in Appendix A3. The number of worms established in breeding ewes was greatest
between 5 weeks prior to and after lambing, being significantly greater than at 11 weeks
after lambing (p <0.01). Eggs were seen in faeces only when infection occurred
immediately before or around parturition (periods 1 and 2). Non-breeding ewes exhibited
lower worm establishment at all times except during week 11 of lactation. Moreover, at no
time were eggs detected in their faeces.
4.1.3 Response of breeding ewes to challenge infection following chronic
infection and their controls (Groups C and D)
Worm burdens and faecal egg counts of Groups C and D after challenge with
20,000 O. circumcincta lazvae following chronic infection of the former are given in Table
6. Individual faecal egg counts of ewes in Groups C and D are given in Appendix A2.
Whether compared within period groups or according to stage of lactation, ewes with
continuous exposure to O. circumcincta (Group C) had lower (p <0.01) worm burdens
following challenge than their contemporaries. Ewes maintained without larval challenge
for 7 weeks (Group D) allowed greater establishment (p <0.01) of worms during periods 1
and 2. 3 and 7 weeks afierparturition. By 14 weeks after parturition, however, this
difference between groups had disappeared.
The mean egg production of Groups C and D during the four periods of infection
are given in Figure 4. There was a marked reduction in the magnitude and duration of the
rise in faecal egg counts recorded in Group C ewes (chronically infected) challenged with a
trickle infection from infection periods I to 4 (Figure 4). The time required for the infection
to develop to patency. as gauged by faecal egg counts, increased over the duration of the
trial (Figure 4). By comparison faecal egg counts of control ewes (Group D) were only
recorded on two occasions throughout the experiment and these arose from three animals in
infection period one.
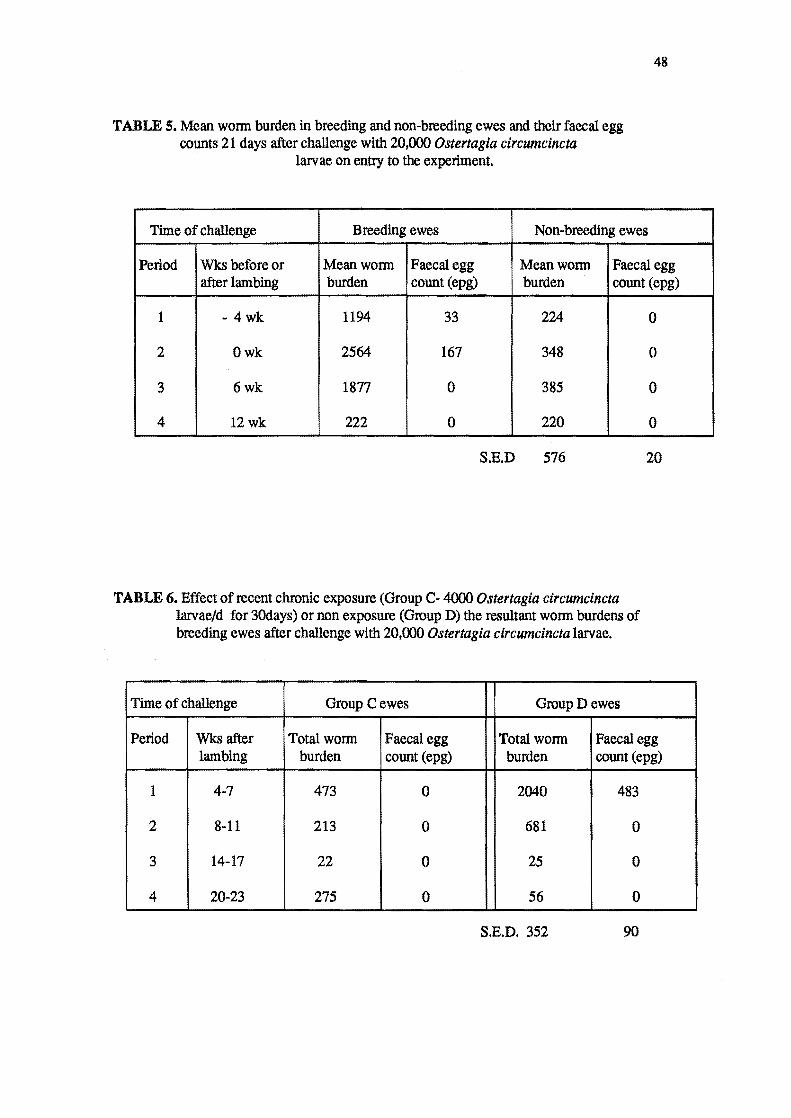
TABLE 5. Mean worm burden in breeding and non-breeding ewes and their faecal egg counts 21 days after challenge with 20,000 Ostertagia circumcincta
. laIVae on entry to the experiment.
48
Time of challenge Breeding ewes Non-breeding ewes
Period Wks before or Mean worm Faecal egg Mean worm Faecal egg after lambing burden count (epg) burden count (epg)
1 - 4wk 1194 33 224 0
2 Owk 2564 167 348 0
3 6wk 1877 0 385 0
4 12wk 222 0 220 0
S.E.D 576 20
TABLE 6. Effect of recent chronic exposure (Group C- 4000 Ostertagia circumcincta laIVae/d for 3Odays) or non exposure (Group D) the resultant worm burdens of breeding ewes after challenge with 20,000 Ostertagia circumcincta laIVae.
Time of challenge Group Cewes Group D ewes
Period Wks after Total worm Faecal egg Total worm Faecal egg lambing burden count (epg) burden count (epg)
1 4-7 473 0 2040 483
2 8-11 213 0 681 0
3 14-17 22 0 25 0
4 20-23 275 0 56 0
S.E.D. 352 90
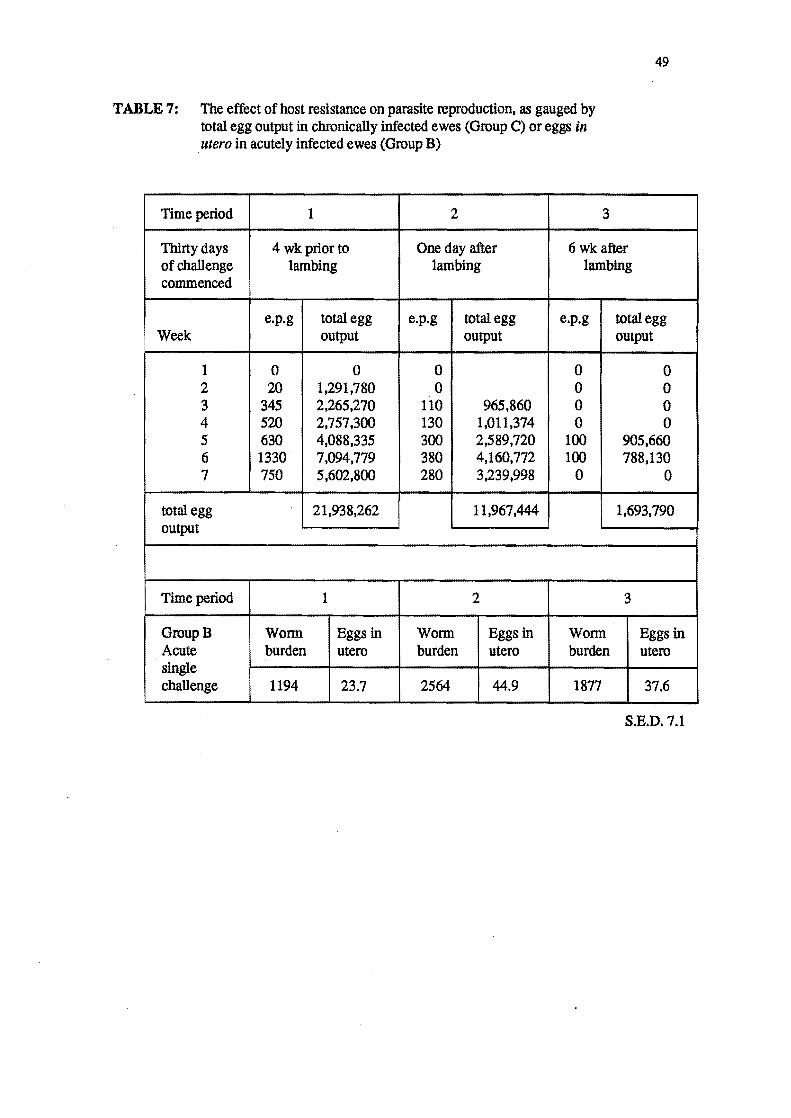
49
TABLE 7: The effect of host resistance on parasite reproduction. as gauged by total egg output in chronically infected ewes (Group C) or eggs in . utero in acutely infected ewes (Group B)
Time period 1 2 3
Thirty days 4 wkpriorto One day after 6 wk after of challenge lambing lambing lambing commenced
e.p.g total egg e.p.g total egg e.p.g total egg Week output output output
1 0 0 0 0 0 2 20 1.291.780 0 0 0 3 345 2.265,270 110 965.860 0 0 4 520 2.757.300 130 1.011.374 0 0 5 630 4.088.335 300 2,589.720 100 905,660 6 1330 7,094.779 380 4.160,772 100 788,130 7 750 5,602.800 280 3,239,998 0 0
total egg 21,938.262 11,967.444 1.693,790 output
Time period 1 2 3
GroupB Wonn Eggs in Wonn Eggs in Wonn Eggs in Acute burden utero burden utero burden utero single challenge 1194 23.7 2564 44.9 1877 37.6
S.E.D.7.1
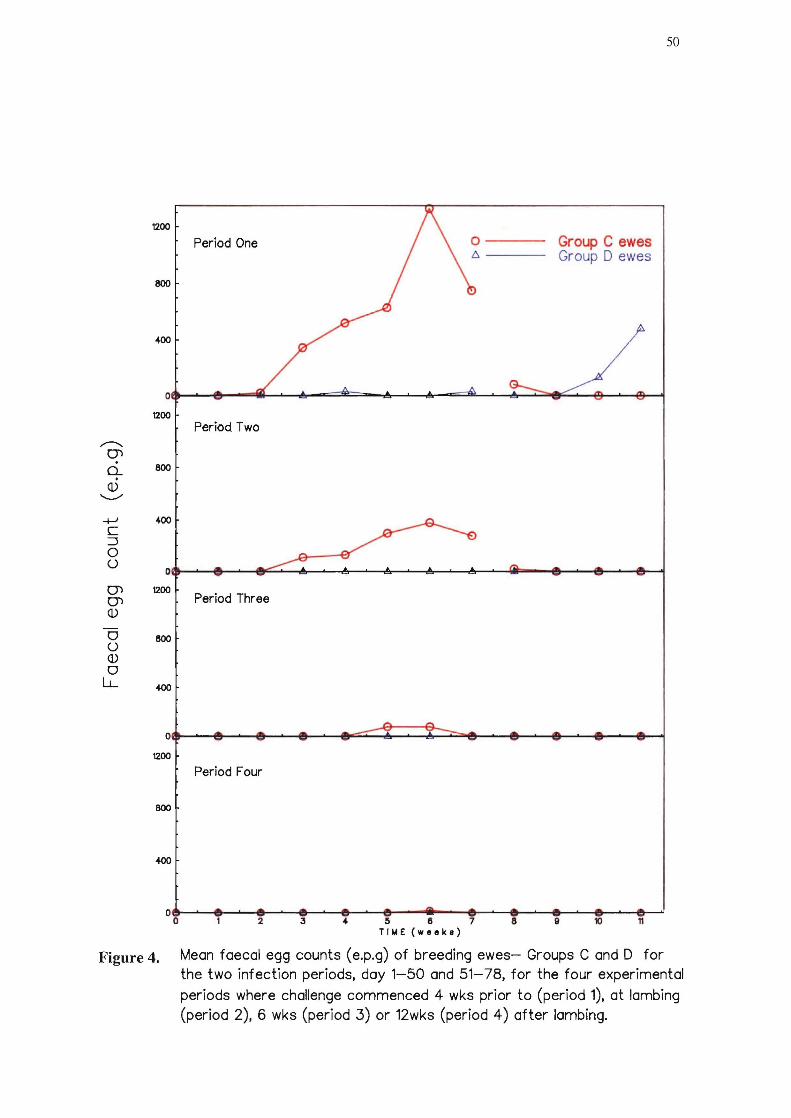
,..--...,. Q)
0.. . Q)
"-..../
-+-' C ::J 0 U
Q) Q) Q)
0 U Q) 0
LL
1200
BOO
0
1200
BOO
0
1200
BOO
400
Period One
Period Two
Period Three
0 ----t;,.---
Group C ewes Group 0 ewes
oa-~-e~~&-~~~~~~~~~~~~~-4~--~~-e~~e-~
1200
Period Four
800
2 3 4 5 8 7 10 11 TIME (weeke)
50
Figure 4. Mean faecal egg counts (e.p.g) of breeding ewes- Groups C and 0 for the two infection periods, day 1-50 and 51-78, for the four experimental
periods where challenge commenced 4 wks prior to (period 1), at lambing (period 2), 6 wks (period 3) or 12wks (period 4) after lambing.
51
4.2.0 SERUM PEPSINOGEN
4.2.1 Groups C and D-Day 1-50
The mean pepsinogen levels in Group C and D ewes are shown in Figure 5.
Individual serum pepsinogen of ewes in Groups C and D are given in Appendix AS.
Pepsinogen levels in infected ewes were significantly (p<0.0l) higher than in the control
ewes during all four periods of infection. Mean serum pepsinogen values in control groups
remained at about 100 milliunits/l. Values in infected animals (Group C), during periods
one to four, were greatest 2 to 3 weeks after infection commenced and then declined
gradually until the infection was terminated.
4.2.2 Groups Band BA - Acute challenge day 1-21.
Individual serum pepsinogen of ewes in Groups B and BA are given in Appendix
A 7. The mean pepsinogen levels in Group B and BA ewes are shown in Figure 6. No
significant differences between Groups B and BA were found after challenge with 20,000
larvae during any of the infection periods.
4.2.3 Groups C and D - Acute challenge day 51-78.
The mean pepsinogen levels in Group C and D ewes are shown in Figure 7.
Individual serum pepsinogen of ewes in Groups C and D are given in Appendix A6. A
significant interaction between time of infection and recent exposure to infection was seen
in response to challenge with 20.000 larvae during any of the infection periods. Mean
serum pepsinogens of Group C ewes were higher than those seen in Group D ewes in period
I and higher than those seen in Group C and D ewes during period 2,3 and 4 of infection
4.3.0 BODYWEIGHT
4.3.1 Bodyweight trends of ewes until housed.
In general ewe liveweight was maximal at lambing, declined during lactation and
subsequently increased gradually until the end of the trial. Bodyweights of ewes brought
indoors at the start of periods 1 and 2 were increasing on pasture, with maximal
bodyweights occurring at lambing. Bodyweights of ewes that lambed at pasture decreased

..-E
"--'"
c (J) O'l o c .-en 0.. (J)
0....
E ::J L (J)
if)
eoo
400
200
0
eoo
400
200
0
eoo
400
200
0
eoo
400
200
Period One
~ Period Two
Period Three
Period Four 0
6.
0 0 a-----~----~~----o
/ : ~"
Infected ewes (group C)
Control ewes (group 0)
52
o~----~------~----~------~------~------------~ o
Figure 5.
2 3 "
7 TIME (w •• ka)
Mean weekly serum pepsinogens for infected ewes (group C) versus control ewes (group D) during the four. fifty day experimental periods where challenge commenced 4 wks prior to (period 1). at lambing (period 2). 6 wks (period 3) or 12 wks (period 4) after lambing.
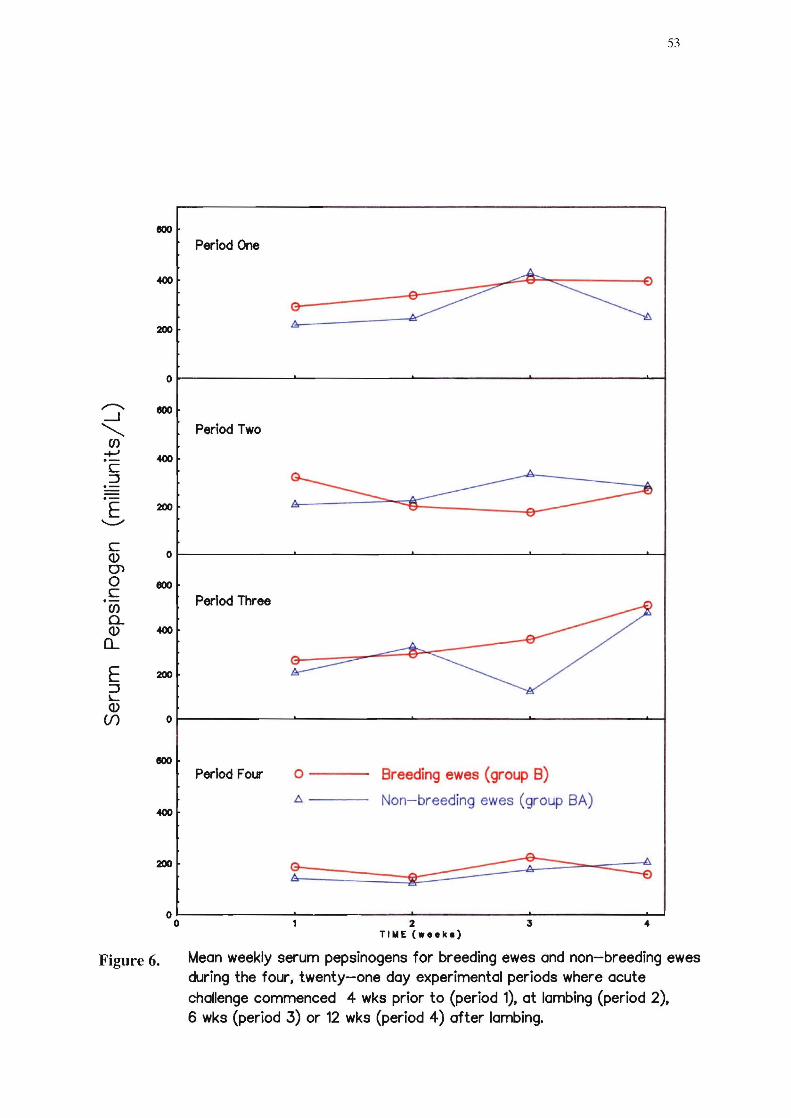
53
eoo Period One
200
200
o~----------~----------~------------~----------~ o
Figure 6.
2 J 4 TIME ( ••• ke)
Mean weekly serum pepsinogens for breeding ewes and non-breeding ewes during the four. twenty-one day experimental periods where acute challenge commenced 4 wks prior to (period 1). at lambing (period 2). 6 wks (period 3) or 12 wks (period 4) after lambing.
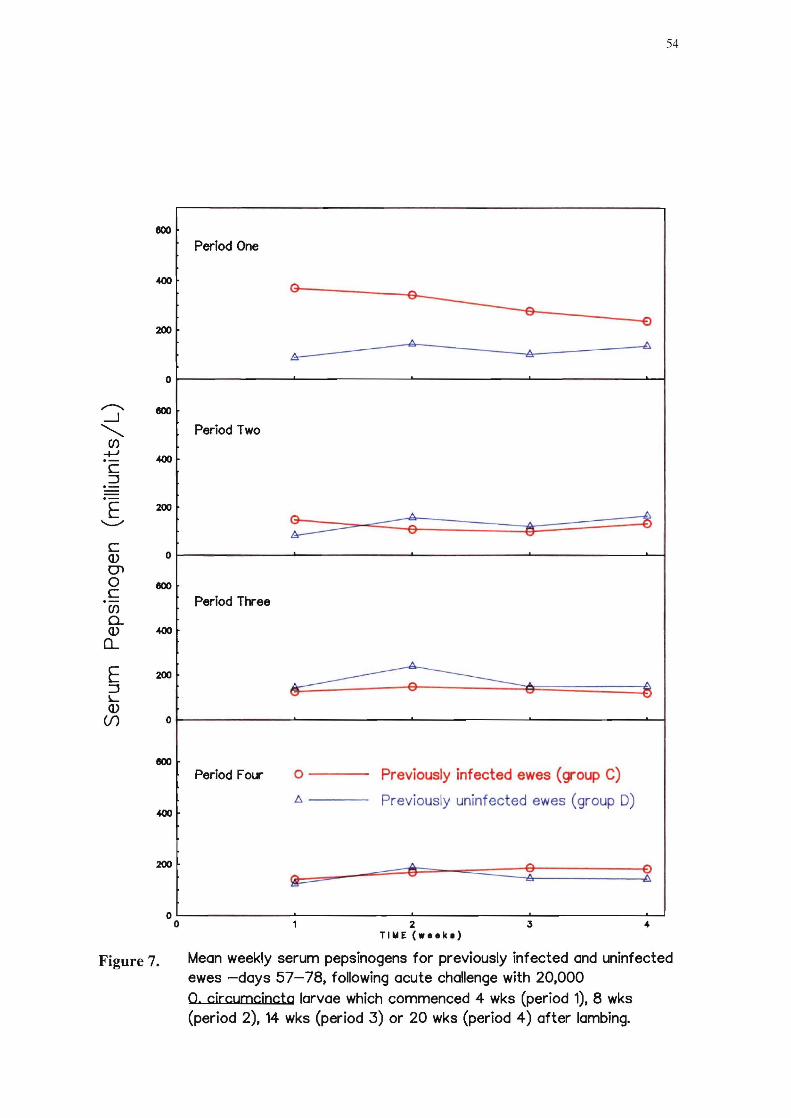
r---.. ---.J ~
Cf) -+-J .-C ::J .-.-E
""-.-/
C Q) 0"'1 0 C .-Cf)
Q.. Q)
D-
E ::J L Q)
(f)
eoo
200
0
eoo
400
200
0
eoo
400
200
0
eoo
200
o o
Figure 7.
54
Period One
G-- 0 ______
9 - -E>
~A -8 A
Period Two
~ -==- ~ @J -:$
Period Ttree
~:~~ ~
Period Four 0 Previously infected ewes (group C)
A Previously uninfected ewes (group D)
@:===~ --- @J 2 2
2 TI .. E (.eeke)
Mean weekly serum pepsinogens for previously infected and uninfected ewes -days 57-78, following acute challenge with 20,000 O. circumcincto larvae which commenced 4 wks (period 1), 8 wks (period 2), 14 wks (period 3) or 20 wks (period 4) after lambing.
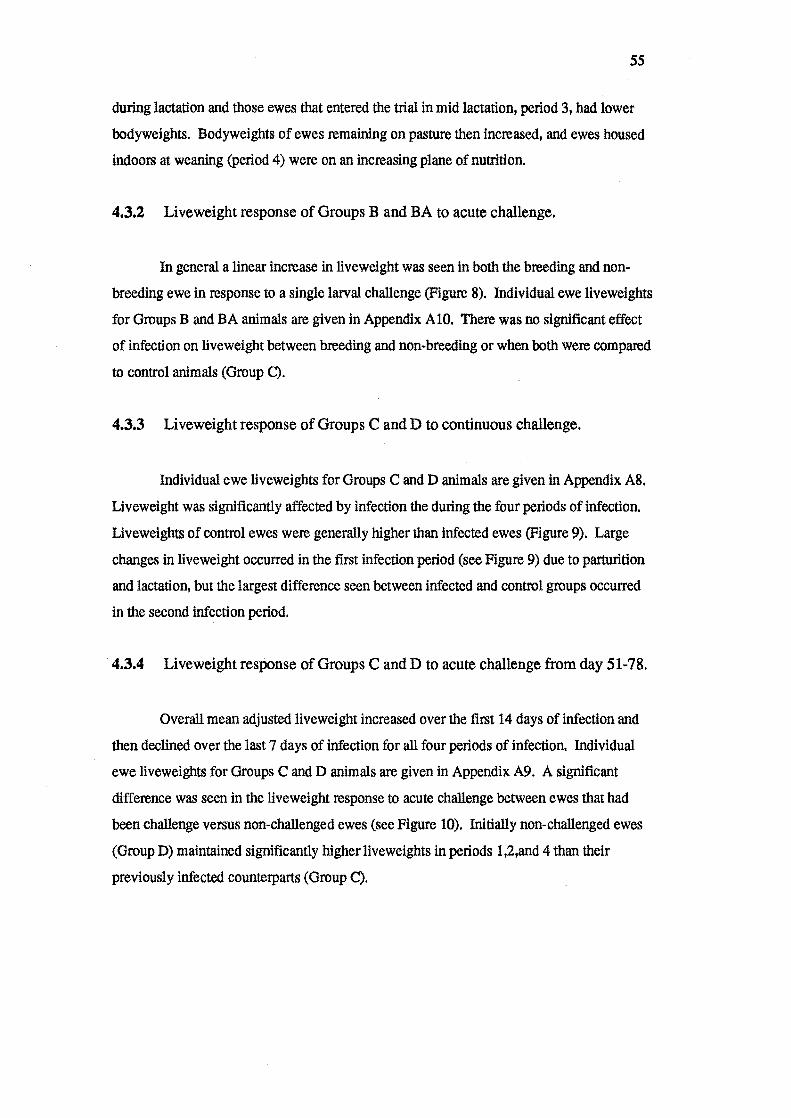
55
during lactation and those ewes that entered the trial in mid lactation, period 3, had lower
bodyweights. Bodyweights of ewes remaining on pasture then increased, and ewes housed
indoors at weaning (period 4) were on an increasing plane of nutrition.
4.3.2 Liveweight response of Groups Band BA to acute challenge.
In general a linear increase in liveweight was seen in both the breeding and non
breeding ewe in response to a single larval challenge (Figure 8). Individual ewe liveweights
for Groups B and BA animals are given in Appendix A 10. There was no significant effect
of infection on liveweight between breeding and non-breeding or when both were compared
to control animals (Group C).
4.3.3 Liveweight response of Groups C and D to continuous challenge.
Individual ewe liveweights for Groups C and D animals are given in Appendix A8.
Liveweight was significantly affected by infection the during the four periods of infection.
Liveweights of control ewes were generally higher than infected ewes (Figure 9). Large
changes in liveweight occurred in the first infection period (see Figure 9) due to parturition
and lactation, but the largest difference seen between infected and control groups occurred
in the second infection period.
·4.3.4 . Liveweight response of Groups C and D to acute challenge from day 51-78.
Overall mean adjusted liveweight increased over the first 14 days of infection and
then declined over the last 7 days of infection for all four periods of infection. Individual
ewe liveweights for Groups C and D animals are given in Appendix A9. A significant
difference was seen in the live weight response to acute challenge between ewes that had
been challenge versus non-challenged ewes (see Figure 10). Initially non-challenged ewes
(Group D) maintained Significantly higher liveweights in periods 1,2,and 4 than their
previously infected countetparts (Group C).
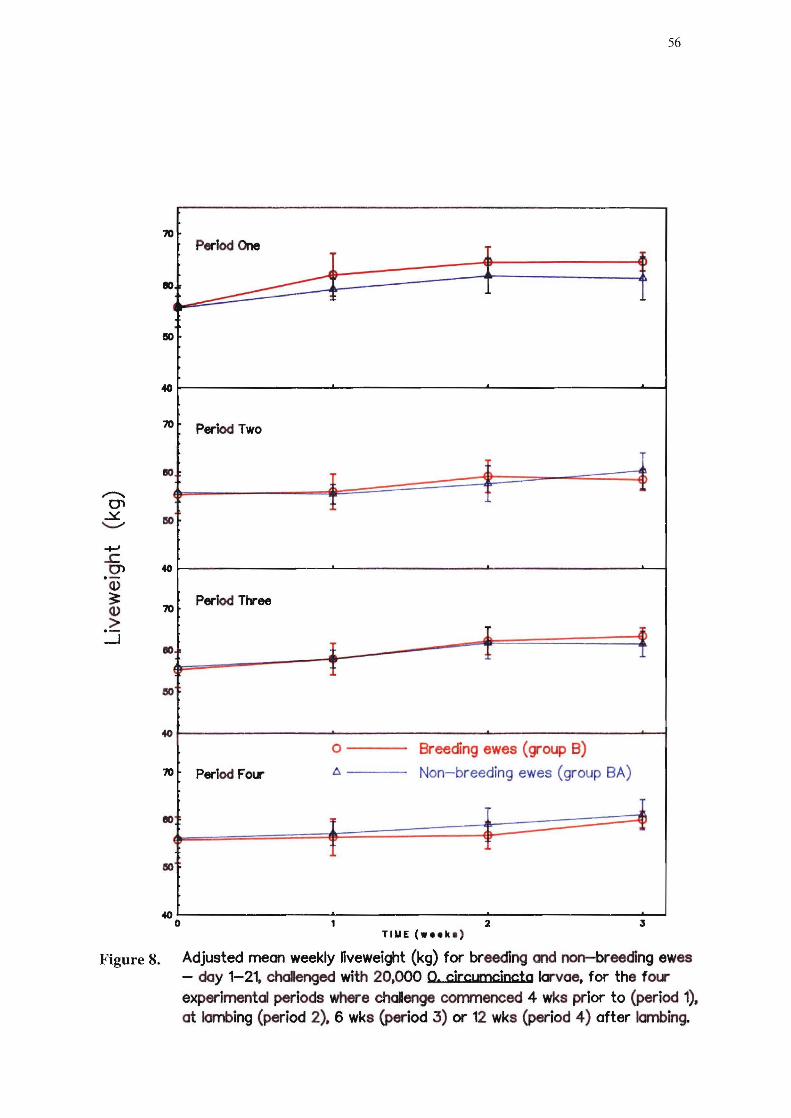
70
110
I
110
40
70
110
110
40
70
110
40
70
110
110
40 o
Period One
Period Two
I I
Period Three
I I
0
Period Foll" l::.
I I
56
1 '" ~
1 --i.
I I
Breeding ewes (group B)
Non-breeding ewes (group SA)
1 x
2 TIUE ( ... k 8)
Figure 8. Adjusted mean weekly nveweight (kg) for breeding and non-breeding ewes - day 1-21. challenged with 20.000 o. circumciocta larvae. for the foLl'" experimental periods where chaJenge commenced 4 wks prior to (period 1), at lambing (period 2). 6 wks (period 3) or 12 wks (period 4) after lanbing.

~
01 ~ "'-"" +J .£ 01
'V ~ <1> > .-
---l
~ ~------------------------------------------------,
Period One
40 ~
Period Two 10
eo
40 eo
Period Ttree 10
eo
4O ~----~----~~----~----~------------~------~~ 80
Period F 0l6'
110 0 ----
l:. ----
Infected ewes (group C) Control ewes (group D)
4O ~----~----~~----~----~------------~------~~ o 2 3 " a • 7 TIME (wuk_)
Figure 9. Adjusted mean weekly fiveweights (kg) for infect ed and control ewes during the four. fifty day experimental periods where challenge corrmenced 4 wks prior to (period 1). at lanbing (period 2). 6 wks (period 3) or 12 wks (period 4) after lambing.
57

70 PerIod One
--====::: tlU1
50
40
70 Period Two ... I
~ I I ::lit I
~ I
50
40
70 PerIod llree
...l. 1: ;a;:
• "" :r .. au-:
50
40
70 PerIod Fotr
I 110 I
0 Previously infected ewes (group C) I!O ~ Previously Uninfected ewes (group D)
40 o 2 TIME (.eeke)
Figure 10. Adjusted meoo weekly liveweight (kg) for previously infected ood uninfected ewes- days 51-78. following acute challenge with 20,000 O. circumcinc10 larvae which commenced 4 wks (period 1). 8wks (period 2). 14 wks (period 3) or 20 wks (period 4) after lambing.
58
I

S9
4.4.0 FOOD INTAKE
4.4.1 Groups C and D-Day 1-50
4.4.2 Groups Band BA - Acute challenge day 1-21.
Individual ewe DMintakes of Groups B and BA animals are given in Appendix
A14. Mean daily food DM intakes (gDM/kg WO.75/day) for Groups C and D are shown in
Figure 12. Non-breeding ewes Group B had significant higher food intakes during all four
periods of infection. When intakes of Group B and BA ewes were compared with the
intakes of Group D ewes, infection caused a depression in intake. Mean intakes for Group
B and BA ewes were significantly lower than those of the equivalent Group D ewes in
periods 2 and 3.
4.4.3 Groups C and D- Acute challenge day 51-78.
Individual ewe DM intakes of Groups C and D animals are given in Appendix A13.
Mean daily food DM intakes (gDM/kg wD·7S /day) for Groups C and D are shown in Figure
13. A significant interaction between time of infection and recent exposure to infection was
seen. With intakes of Group D ewes higher than those of Group C ewe during period I but
lower than during period 2.
4.5 MILK PRODUCTION
Mean twelve hourly milk. production of infected and control sheep is given in Table
8. Individual milk yields of ewes in Groups C and D are given in Appendix All. There
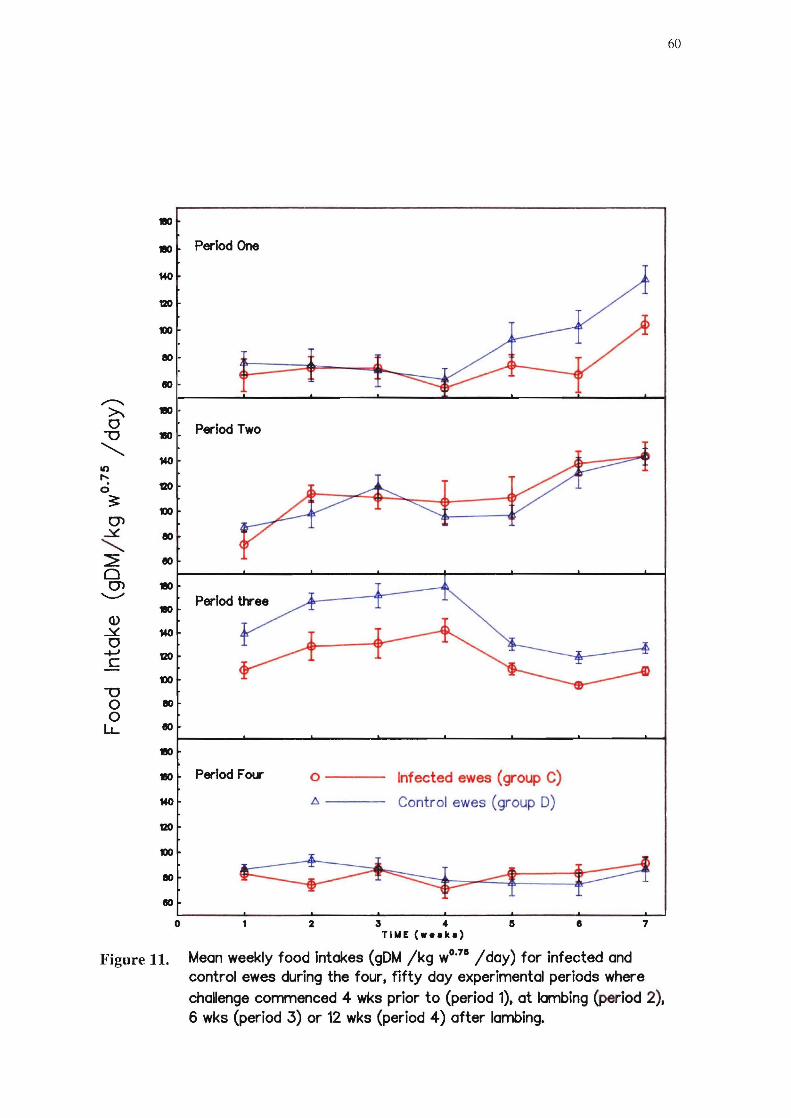
.,
., 140
eo-
eo ,.-...... >. ., 0
-0 1110
'-..... 140
10 ..... 0 120
~ 1)0
0'1 ~ eo '-..... L eo 0 0'1 .,
"--" ., <l) ~ 140 0
-+-' 120 C
1)0
-0 0 eo 0
LL eo ., 1110
140
120
1)0
eo
eo 0
Figure 11.
Period One
Period Two
Period three
Period Fotr 0 ---
t:. ---
Infected ewes (group C)
Control ewes (group D)
2 3 4 TIME (w.aka)
e 7
Mean weekly food intakes (gDM /kg WO.75 /day) for infected and
control ewes during the four. fifty day experimental periods where challenge commenced 4 wks prior to (period 1). at lambing (period 2). 6 wks (period 3) or 12 wks (period 4) after lambing.
60
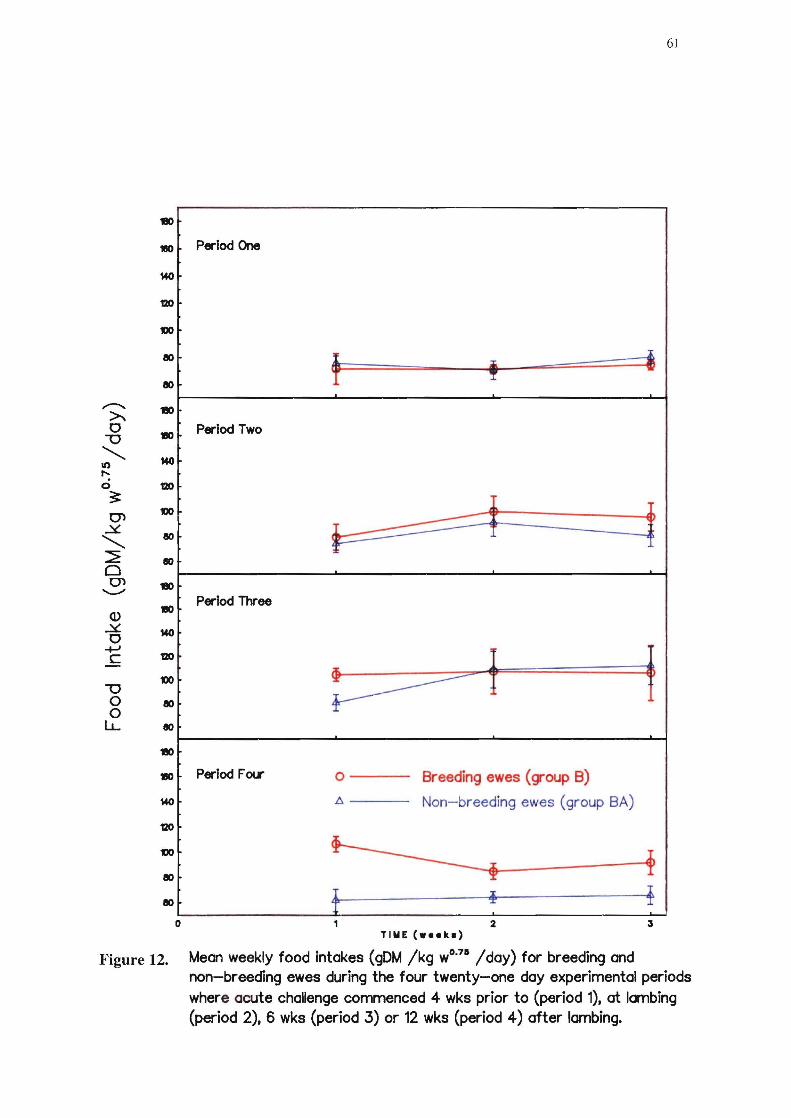
61
110
1110 Period One
140 ,
120
IJO
110
110 ; , -1
,..-..,. 110
~ 0
""0 1110 Period Two
........... 140 II)
'" 0 120 3: O'l
IJO
:x. 80
........... ~ eo 0
~ ~ O'l 110
"--/
(l) 1110
Period Three
:x. 140 0 -+-' C 120
IJO ""0 0 110 0 ~t f
LL eo
110
1110 Period F 0\1' 0 Breeding ewes (group B)
140 A Non-breeding ewes (group BA)
120
IJO
110
t-J. :r. I 'r
110 I :r I
T -r T
o 2 3 TIME ( ... k.)
Figure 12. Mean weekly food intakes (gOM /kg wo.n /day) for breeding and non-breeding ewes during the four twenty-one day experimental periods where acute challenge commenced 4 wks prior to (period 1). at lambing (period 2). 6 wks (period 3) or 12 wks (period 4) after lambing.
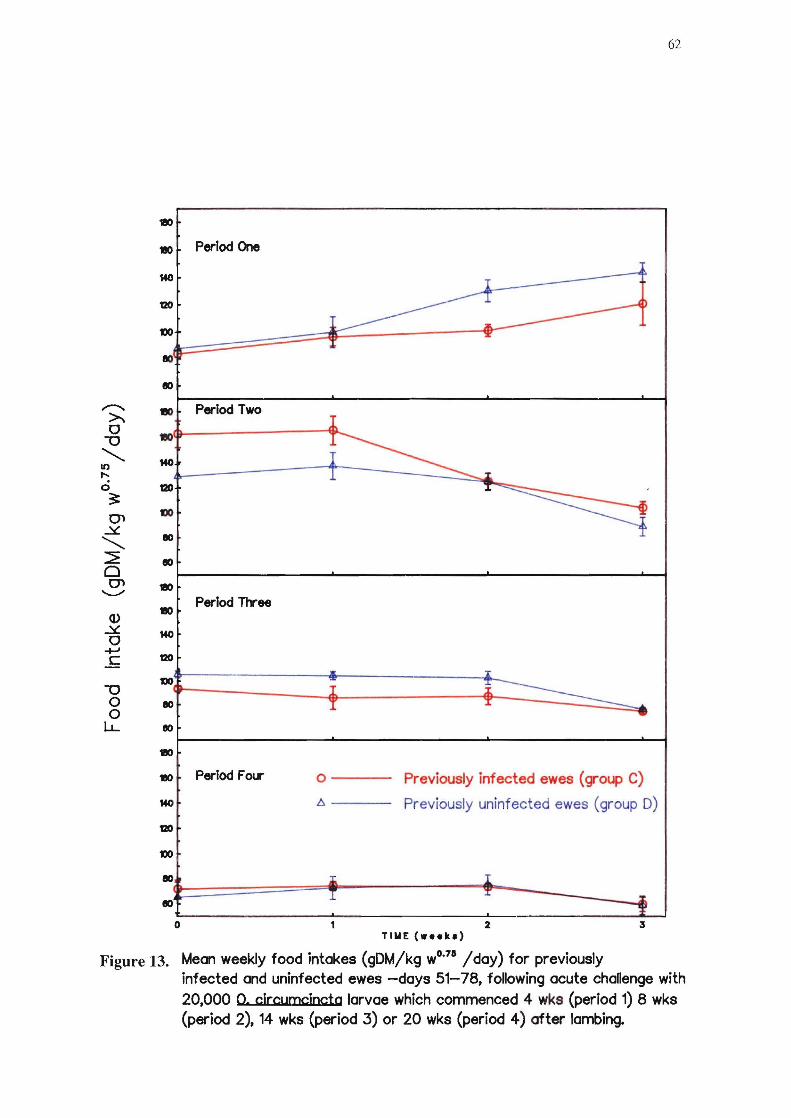
1110
1110
140
flO
1)()
110
110
~ 1110 ~ 0
1110 -0
"- 140 It) ,... 0 flO 3: ~
1)()
~ 110 '-.....
::E 110 0 ~ 1110
'-'"
(l) 1110
~ 140 0 -+-' C flO
1)()
-0 0 110 0
u.. eo
1110
1110
140
flO
1)()
110
110
Figure 13.
0
Period One
Period Two
Period Three
Period Fotr 0---
6.---
Previously infected ewes (group C)
Previously uninfected ewes (group D)
2 3 TIME (week.)
Mean weekly food intakes (gDM/kg WO.7D /day) for previously
62
infected and uninfected ewes -days 51-78, following acute chanenge with 20,000 O. circumcincto larvae which commenced 4 wks (period 1) 8 wks (period 2), 14 wks (period 3) or 20 wks (period 4) after lambing.
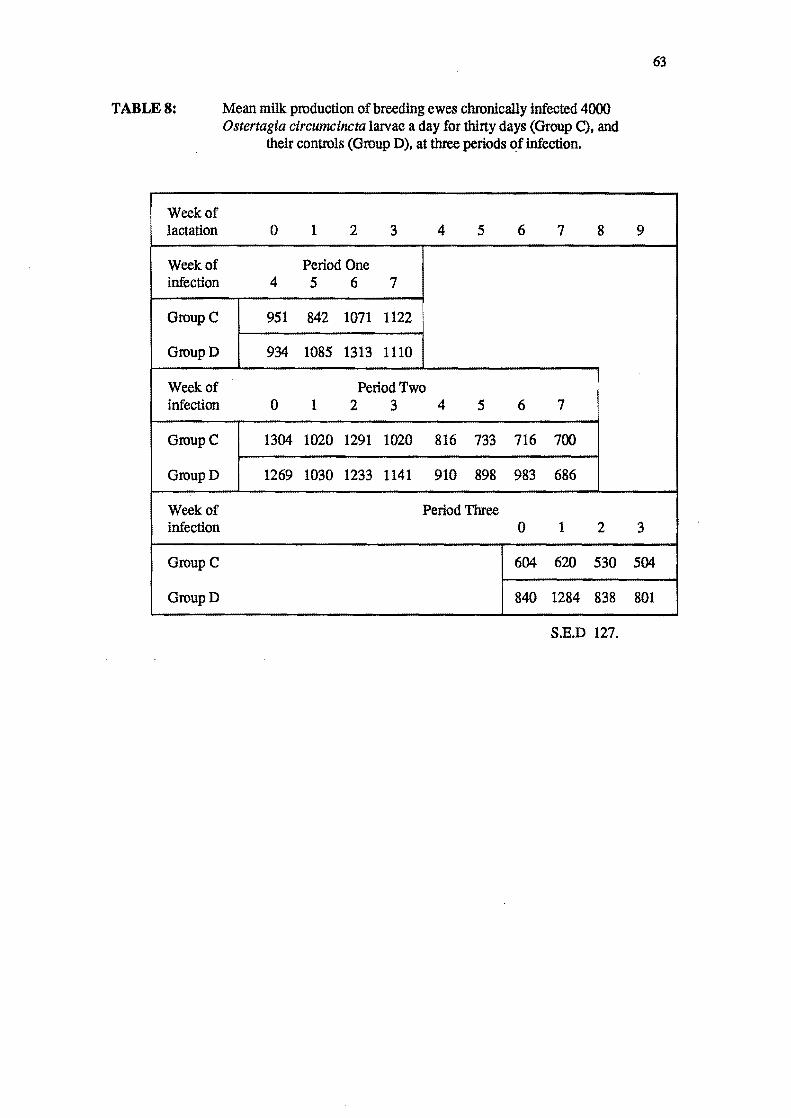
TABLES:
Week of lactation
Week of infection
Groupe
GroupO
Week of infection
Groupe
GroupO
Week of infection
Groupe
GroupO
Mean milk production of breeding ewes chronically infected 4000 Ostertagia circumcincta larvae a day for thirty days (Group C), and
their controls (Group 0), at three periods of infection.
0 1 2 3 4 5 6 7 8
Period One 4 5 6 7
951 842 1071 1122
934 1085 1313 1110
Period Two 0 1 2 3 4 5 6 7
1304 1020 1291 1020 816 733 716 700
1269 1030 1233 1141 910 898 983 686
Period Three 0 1 2
604 620 530
840 1284 838
S.E.O 127.
63
9
3
504
801
64
was a significant effect of infection on milk production during all three periods of infection
(p <0.01 in each case). Differences in milk production occurred during weeks 2,3,and 4 of
lactation in period 1. In period 2 a 10% reduction in milk. production of infected sheep was
seen by week 3 of lactation. and this increased to 27% by the sixth week of lactation. The
largest reductions in milk. production of infected sheep, ranging from 28 to 50%. occurred
during period 3 corresponding to week 7 to 9 of lactation.
4.6 LAMB GROWTH RATES
Individual birth weights and live weights of lambs for Group C and D ewes (periods
I to 3) are given in Appendix A15 and mean values are given in Figure 14. Liveweights of
Group D lambs were Wgher than those of Group C lambs but there was no significant effect
of infection on lamb growth rate within any infection period.
4.7 WOOL PRODUCTION
4.7.1 WOOL GROWTH and FIBRE DIAMETER
The changes in growth and fibre diameter are given in Table 9. Individual ewe
clean fleece weights and fibre diameter of ewes in Groups C and D are given in Appendix
A 16. There was no effect of infection during any period of challenge on wool growth or
fibre diameter (Table 9). There was a significant effect of time on wool growth and fibre
diameter, with both increasing with each period of infection, reflecting the seasonal effect
on both these parameters.
4.7.2 STAPLE STRENGTH
The mean staple strength of wool grown during each period of infection is given in
Table 9. Individual staple strength of Group C and D ewes are given in Appendix A17.
There was a Wgbly significant effect of infection on tensile strength of wool grown in
periods 1 and 2 of the trial. With reductions of 44 and 29% in the tensile strength of wool
from infected animals compared to control animals.
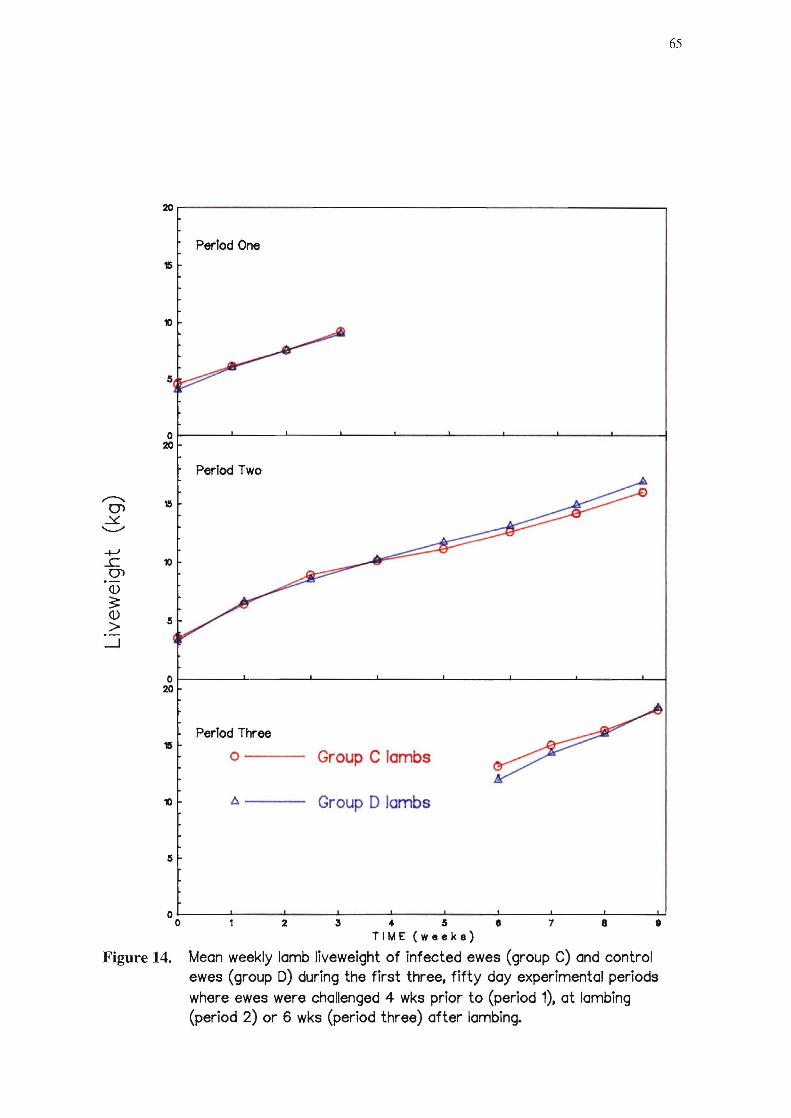
~ r---------------------------------------------------.
PerIod One
15
0 ~-
PerIod Two
r--. 15 01 .Y '--"
+-' ...c 10 01 <])
3: <])
5 > ..-J
0 20
PerIod Three 15
0 Group C lambs
A Group D lambs
O~ __ ~~ __ ~ ____ ~ ____ ~ ____ ~ ____ J-____ L-____ L-__ --U
o 2 3 4 5 e 7 a 8 TIME (weeks)
Figure 14. Mean weekly lamb liveweight of infected ewes (group C) and control ewes (group D) during the first three. fifty day experimental periods where ewes were challenged 4 wks prior to (period 1). at lambing (period 2) or 6 wks (period three) after lambing.
65

TABLE 9: The effect of chronic infection 4000 Ostertagia circumcincta lalVae /day (Group e), or non infection (Group D) on wool production of breeding ewes, over a fIfty day period (group means).
Clean fleece Fibre diameter Staple strength Time weight (mg/day) (p.) (gnn/Tex) period
66
Groupe GroupD Groupe GroupD Groupe GroupD
1 29.1 33.9 36.0 34.5 1.62 2.85
2 60.9 60.6 35.4 36.9 2.77 3.85
3 94.4 92.9 37.9 37.5 4.14 3.95
4 110.8 114.4 40.0 39.8 3.78 4.45
S.E.D 10.6 S.E.D 1.4 S.B.DO.53

67
CHAPTER FIVE
5.0 DISCUSSION
The pattern of infection in the field prior to animals coming indoors was typical of that
expected in a temperate climatic zone with lambing occurring in early spring. The apparent
increase in pasture larval levels from period 3 to period 4, as reflected by the large increase in
worm burdens of Group A (period 4) ewes, was typical of that reported by Vlassoff (1976) and
Vlassoff and Brunsdon (1981). In these terms, the sheep can be considered to have experienced a
low trickle infection until at least 6 weeks after lambing.
Absence of immature stages (early and late lAs) in the worm burdens of ewes challenged
with a single infection, suggests that once established, development to adult stage in dry and
breeding sheep, occurred within twenty one days. Jackson et al (1988) found very little arrested
or retarded worms, with a strain of O. circumcincta larvae which inhibited readily in immune
animals, in ewes challenged during late pregnancy. With a single challenge infection. worm
burdens generally remain stable for approximately four weeks before worm numbers decline
(Hong et al. 1986). Jackson et al (1988) found that in the peri-parturient ewe, with O.
circumcincta infections, worm burdens did not appear to decline with time after infection while T.
vttrinus infections did. The complete absence of lA larvae suggests that no arrested development
. occurred, due to effects of chilling larvae or host resistance. It is likely that a host mediated
immune response was directed against the incoming larvae in the 'resistant' animals viz Group
BA similar to that reported by Chiejina and Sewen (1974) and Miller et al (1983).
The worm burden established is a function of the larval challenge and the change in
susceptibility of the host. The non-breeding ewes clearly showed that the challenge experienced
was within their resistance capabilities. On the other hand breeding ewes, as shown by Group A,
suffered considerably higher establishment of worms populations. Moreover the data shows very
clearly that the loss of resistance by the breeding ewes, compared to non-breeding ewes, occurred
prior to as wen as after parturition, with generally 5-10 fold greater worm burdens occurring in
breeding than in non-breeding ewes (cfGroup Band BA, respectively). Variation seen in worm
burdens of Group B ewes over time, probably reflects a change in susceptibility of the ewe
confirming the observations of Connan (1968a) and Reid and Armour (1975a,1975b). This is
reflected in the proportion oflarvae which established in Group B ewes (Table 4), with a
maximum of 12.4% and a minimum of 1.1 % of the infective dose establishing. By 12 weeks
post-lambing, the larval establishment rates in breeding ewes are comparable to those seen in
68
non-breeding ewes throughout the experiment. These establishment rates are higher than those
reported by Reid and Annour (1975b), who used a higher challenge dose of 50,000 O.
circumcincta lalVae, but similar levels of wonn burden were found. Jackson et al (1988) using a
10,000 challenge dose reported a higher maximum establishment rate of 26% in peri-parturient
ewes. An inverse relationship between increasing dose rate and percentage establishment
reported by Jackson and Christie (1979) may partly explain this.
In contrast to reports of a post-parturient rise in faecal egg count of ewes (Gibbs, 1968;
Connan, 1968a; Brnnsdon, 1970; Brunsdon and Vlassoff, 1971a), sigp.ificant faecal egg counts
from experimental animals both indoors and at pasture were recorded during late pregnancy. The
occurrence of a peri-parturient rise has been confinned by O'Sullivan and Donald (1973) and
Reid and Annour (1975a). Using a similar infection regimen, but challenging ewes 6 weeks prior
to parturition (2 weeks earlier than that used here), Leyva et al (1982) found, that during
pregnancy, ewes were almost completely resistant to the development of infection to patency.
However, when ewes were challenged after parturition, an almost identical post-parturient rise
was recorded in this study and those of Leyva et al (1982). This suggests the ewes in this study
were more susceptibility to challenge than ewes challenged by Leyva et al (1982) prior to
parturition. The different response may be due to differences between larval cultures or, due to
breed differences of the sheep.
A major difference between the studies of Leyva et al (1982), Thomas and Ali (1983) and
this study is initially in the experimental design. Both Leyva et al (1982) and Thomas and Ali
(1983) utilised a cross-over design, with drenching tenninating the infection at parturition. When
an infection is allowed to develop before and over parturition, as in this study, the resultant faecal
egg production increases substantially compared to a 6 week challenge given prior to or after
lambing (Leyva et aI, 1982).
Maximum rates of parasite establishment appeared to be reached at some time between
parturition and 3 weeks afterwards (see Table 5 & 6), this parallels the peak seen in the
reproductive rate of the individual adult female wonn (Table 7). This indicates a significant
increase in the chances of parasite sUlVival and transmission, and suggests a marked reduction in
the ewes immune response. The reduction in the ewes immune response was still apparent 6
weeks after parturition, confinning previous suggestions of Reid and Annour (1975), Leyva et al
(1982), Sykes and Jurna (1983) and Thomas and Ali (1984) but by this stage host resistance to
infection in this study was increasing. However, the possibility exists that the relaxation in the
ewes immune system starts before parturition. Larvae which develop immediately prior to
69
parturition appear to rapidly reach reproductive status. Increased establishment and/or increased
reproductive potential of adult wonns may account for the faecal egg pattern displayed by ewes
infected prior to parturition. This has not been seen by other workers, possibly because other
studies (Leyva et ai, 1982; Sykes and Juma, 1983; Thomas and Ali, 1984) have drenched ewes at
parturition there by eliminating the parasites, reducing faecal egg production and damage due to
larval establishment. The suspension of adult wonn loss as suggested by Michel (1976) and
shown by Jackson et al (1988) to occur prior to parturition, may also be responsible for the
substantial faecal egg count rise of Group C ewes (period 1). It is possible that this may occur up
to 6 weeks before parturition (Jackson et aI, 1988) and after parturition as well. It appears that a
'window effect' may occur, with a narrow period of marked immune depression occurring at/or
around parturition and either side of this the immune response gradually decreases prior to and
increases after parturition. Therefore any larval infection which develops before or after this
period, encounters a more responsive immune system albeit still impaired as compared to that of a
resistant animal (Jackson et ai, 1988), but capable of suppressing egg production and reducing
establishment of larvae.
It is more difficult to reconcile the fact that the greatest wonn burdens were established at
pasture in lactating animals 11 weeks after lambing, while in the chronically infected ewes the
greatest faecal egg production occurred in a three week period immediately after lambing. It may
well reflect a greater susceptibility at this stage or reflects a very high pasture larval level at this
time. These ewes had lambed out doors and had suffered large reductions in bodyweight due to
. the demands oflactation.The wonn burdens established after specific larval challenge at these
stages .(Group B), however, suggest that greatest susceptibility occurred 5 weeks before and
after lambing. Twelve weeks after lambing substantial host resistance displayed by Groups BA
and B to a single challenge may indicate the high wonn burdens in Group A ewes were a result of
a very high larval challenge at pasture combined with a low nutritional status.
In addition to evidence for an effect of the host on establishment of infection, there was
also evidence for delayed establishment and maturation of wonns by the host. The time required
for patency of infection to develop, as gauged by faecal egg count data from periods 2,3, and 4,
increased over the infection periods (Figure 2, Table 7) from 3 to 7+ weeks suggesting that the
host from parturition on, is able to delay egg production of female wonns by delaying wonn
development and/or maturation. The minimum time for eggs to appear in the faeces has generally
been considered to be seventeen days (Threlkeld 1934). However, fourteen days after infection
(period 1) eggs were found in the faeces which indicated either rapid development or failure in
anthelmintic treatment. Leyva et al (1982) reported virtually complete suppression of faecal egg
70
production in pregnant ewes infected with 4000 O. circumcincta larvae which they attributed to
delayed wonn development. Sykes and Juma (1984) reported similar findings in lactating ewes.
Despite the absence of immature larval stages in animals slaughtered after a single challenge, it is
dangerous to assume that with continuous trickle infections the same will apply. Jackson et al
(1988) found little evidence for arrested or retarded development oflarvae in ewes infected 2,4
and 6 weeks before parturition.
A decline seen in faecal egg counts in response to trickle infections, with time of
infection and changes in number of eggs in utero indicates an increasing host response to
challenge. Total egg output per ewe produced in period 2 and 3 were reduced by 50% and 95%
respectively when compared to that produced during period I in response to a trickle infection
(Table 7), indicating that host suppression of faecal egg output occurred from mid-lactation.
Gibbs and Barger (1986) reported a similar suppression of egg output with a decline in faecal egg
output of lactating ewes were wonn burdens remained constant Differences in numbers of eggs
in utero of O. circumcincta wonn where found in ewes challenged during periods 1,2 and 3
(Table 7) indicating increased host resistance from mid-lactation. On. the other hand O'Sullivan
and Donald (1973) reported a relaxation of host control on parasite fecundity. with egg
production per adult female T. colubriformis increasing during lactation and a subsequent rise in
faecal egg production. O'Sullivan and Donald (1970), found numbers of eggs in utero did not
vary with time. Interestingly the increase in numbers of eggs in utero from period 1 to 2, contrasts
with the decrease in total egg production. This suggests suppression of egg output was
operational during the later stages of period 2, possibly from 3 weeks post-lambing.
There was evidence that re-establishment of resistance after its loss around parturition
was dependent on continuing larval challenge. Recent exposure prior to challenge was found to
markedly reduce wonn burdens of lactating ewes, 4 and 8 weeks after parturition (Table 6). On
the other hand ewes challenged 14 weeks post-lambing, with 9 weeks of non-exposure to larval
challenge, were not disadvantaged in mounting an immune response (Table 6); in fact wonn
burdens were comparable to those seen in non-breeding ewes challenged from pasture (Table 5).
Faecal egg counts (period 1) and wonn burdens (periods I and 2) of previously infected ewes
were lower than their non exposed counterparts, indicating that larval stimulus during late
pregnancy and early lactation (periods 1 and 2) evoked a substantial immune response. Lactating
ewes, with recent larval exposure during pregnancy, were found by Leyva et al(1982) to be more
resistant as judged by faecal egg count, food intake response and bodyweight than their non
exposed counterparts. Results obtained in period 1 and 2 may be consistent with the concept
that resistance diminishes with time after previous infection (Dineen and Wagland, 1966;
Wagland and Dineen, 1967) but worm burdens for periods 3 and 4 did not differ.
71
It appears however that an immune response to challenge within one week of drenching
can be enhanced by removal of a sensitising infection with anthelmintic (Donald et ai, 1964;
Smith et ai, 1984). Smith et al (1984) suggested that this was an active immune response,
responsible for the elimination of worm burdens in lambs. Interestingly there was a Significant
effect of previous larval exposure or non exposure on live weight response to challenge in the
present work. Those ewes which had recent exposure (Group D) were able to reduce their worm
burdens but appeared to suffer a production cost in the process, when compared to Group C ewes.
Barger (1973) suggested there was a production cost associated with mounting an immune
response to challenge.
If resistance did diminish over a period of non-exposure to infection then worm burdens
of Group B (housed for 2 weeks) should be markedly lower than those of Group D (housed for 9
weeks). Worm burdens of Group B ewes were in fact higher than those of the equivalent Group
D ewes. The comparison may well be confounded by the superior bodyweights of Group D ewes
at challenge. It is possible that the increased nutritional state of lactating ewes enhances the
immune response (Gibson 1963). Care must therefore be taken when comparing worm burdens
of Group C and D ewes with those of Group B ewes.
. It is generally accepted that level of nutrition influences the effect of the parasite on the
host (Dargie, 1980), with sheep on a higher plane of nutrition displaying smaller parasite burdens
than sheep on a lower plane of nutrition (Gibson, 1963; Steel et ai, 1984; Bown et ai, 1986). In
addition a high or low plane of nutrition prior to challenge may affect subsequent host parasite
relationships, for example Steel et al (1984) found a high plane of nutrition pre-experimentally
reduced parasite worm burdens. The effect of dietary protein concentrations on parasite
establishment or survival have been shown by higher faecal egg counts in animals on low protein
diets (Downey et ai, 1969.1972; Preston and Allonby 1918; Bown, 1986) and higher worm
burdens of animals on low protein diets (Dobson and Bawden, 1914; Steel et al, 1984; Abbott et
al, 1985a,1985b; Bown, 1986).
Protein content of the diet (210 g CP/kg DM) used in this study was slightly higher than
that used indoors by Leyva et al (1982) or outdoors by Sykes and Juma (1984). With the shorter
duration of infection. lower overall challenge and a similar level of feeding it can be expected that
effects on ewe productivity would be smaller than those reported by Leyva et al (1982) or Sykes
72
and Juma (1984). Where comparisons can be made the faecal egg count data were lower, but
there are no worm burden data to compare.
Differences in bodyweight change which occurred during late pregnancy and lactation
were not as great as those reported by Sykes and Juma (1983) and Thomas and Ali (1983) though
bodyweight changes were very similar to those reported by Leyva et al (1982). They were,
however, substantial and significant in terms of whole sheep flock productivity. In general effects
of infection on liveweight were smaller than comparable studies (Leyva et ai, 1982; Sykes and
Juma,1984). However ME intakes were twice those reported (21.5 MJME/day versus
1O.7MJME/day) by Leyva et al (1982) during late-pregnancy and during lactation (31.7-37.0
versus 16.7-21.7 MJME/day). This higherlevel of intake may account for the better productive
performance of ewes as gauged by liveweight
In all infection periods except period I, pepsinogen levels rose within 14 days of
infection similar to that reported for infections in young lambs (Armour, Jarrett and Jennings,
1966; Coop, Sykes and Angus, 1977,1982; Sykes and Coop, 1977). Pepsinogen levels did not
rise until after the third week of infection during late pregnancy, confirming observations of
Sykes and Juma (1984) which suggested a delay in larval development, but in contrast to the rise
after seven days reported by Jeffcoate et al (1988) in ewes challenged 3 weeks prior to parturition.
Serum pepsinogen levels were substantially lower than those found by Leyva et al (1982)
indoors, but similar to levels reported to similar larval challenges by Sykes and Juma (1984)
. outdoors.
The reductions in liveweight gain, feed intake and milk production of the ewes, supports
. previous data (Leyva et ai, 1982; Thomas and Ali, 1983; Sykes and Juma, 1984) in indicating the
susceptibility of the performance of mature breeding sheep to the effect of infection on
productivity. The effects on feed intake were greatest around parturition (period 1 and 2),
reflecting the greater worm establishment at these times.
Leyva et al (1982) reported a 16% reduction in food intake during lactation but not
during pregnancy. In contrast we found reductions in food intake were more marked in period 1,
occurring from parturition on, but not during period 2. Intakes of three animals in period 2
(Group C) were reduced by infection, however the three replacement animals intakes were not
reduced. The productive performance of these three animals was different from the original
animals and this tends to mask any significant effects of infection on animal productivity in
period two. If these 3 animals are excluded infection has significant effects intake in periods 1,2

73
and 3. These reductions in intake are in fact similar in magnitude to effects in naive young lambs
using the same rate of infection (Sykes and Coop, 1977). Interestingly in period 4, when the ewes
were resistant to challenge, intake was not significantly depressed by infection even though there
was, evidence for parasite induced tissue damage in elevated serum pepsinogen as previously
reported (Anderson, 1973; Yakoob et ai, 1983). The response of ewes in period four is similar to
that reported by Reid and Armour (1975a) who suggested that the ewe, although allowing few
parasites to establish, was, nevertheless under considerable challenge and at higher rates of
challenge production losses may well occur (Anderson, 1972,1973; Brunsdon et ai, 1986).
Milk production of control ewes (periods 1 & 2) were higher than those reported by
Leyva et al (1982) where similar methods to estimate milk production were used, possibly due to
the higher ME intakes in this experiment. Infection reduced milk production during all three
periods of challenge, greatest reductions occurred in period 3 with 52. 36,and 37 % drop in milk
production due to infection in weeks 7,8,and 9 oflactation. The effects on milk production
during periods one and two are of similar magnitude to those reported by Leyva et al (1982),
Sykes and Juma (1984) and Thomas and Ali (1983). However, the reductions in milk production
in late lactation (period 3) are greater than any previous reports and the first to examine the
effects of infection in late lactation. In the third period of infection the low nutritional status of
these animals at the commencement of infection is reflected by their bodyweights (Figure 8.) and
this may help to explain the large decrease recorded in milk production.
No reductions in wool growth occurred in this study. The lack of an effect of infection
on wool growth was surprising in view of the findings of Leyva et al (1982) and Sykes and Juma
(1984), where infection reduced wool growth and wool fibre diameter by 20% and 7%
respectively. Leyva et al (1982) and Sykes and Juma (1984) found significant reductions in wool
growth occur in weeks 3-6 of lactation. It is possible that the magnitude of challenge was
insufficient to cause a significant decrease in wool growth. Reduced wool growth rates reported
by Barger et al (1973), Barger and Southcott (1975) and Carter et al (1946) in resistant adult
animals, occurred under conditions of high larval challenge with T. colubrij'ormis infections using
approximately 21,000, 12,000 or 2300 larvae per day.
Fibre diameter of infected sheep during lactation was not significantly reduced by
infection, in contrast to the findings of Leyva et al (1982). In period one, commencing one month
after the winter solstice occurred, wool growth rates were low and several animals failed to grow
sufficient amounts of wool to allow reliable analysis of fibre diameter, possibly leading to the
apparent discrepancy in the fibre diameter values seen during this period.

74
Large reductions found in wool tensile strength during the first two periods of challenge
occurred when the breeding ewe was most susceptible to infection and when worm burdens were
at or near maXimum levels. It is surprising that infection did not effect wool growth or fibre
diameter, which are major factors that ultimately determine wool tenderness. Leyva et al (1982)
suggested that increased wool tenderness may have a hormonal basis as a result of increased
adreno-cortical activity (Linder and Ferguson, 1956; Panaretto et ai, 1975) or a specific protein
deficiency brought about by increased protein demands during lactation (Robinson et ai, 1979)
and due to parasitism (Bown, 1986), that is responsible for weakening of the wool fibre.
Reductions in tensile strength of 44% and 29% occurred during late pregnancy and
lactation respectively, confirming previous reports (Leyva et ai, 1982); interestingly, the period of
greatest reductions (44%) in tensile strength occurred from a larval infection acquired before
parturition and allowed to reach patency until 3 weeks post-lambing (period 1) compared to a
29% reduction when infection was acquired after parturition (period 2). This contrasts with the
findings of Leyva et al (1982) where greatest reductions (44%) occurred from larvae acquired
after parturition.
5.1 RECOMMENDATIONS FOR TREATMENT
The duration of peri-parturient and post-parturient relaxation in immunity to any species
will affect the ewes contribution to pasture contamination which is an important factor in parasite
epidemiology. In planning anthelmintic strategies success depends on the ewe's likely resistance
to re-infection when grazing contaminated pastures.
It appears that drenching of lactating ewes at tailing 3 to 4 weeks post-lambing will
eliminate the majority of the post-parturient rise and reduce subsequent pasture contamination.
By 6 weeks post-lambing the ewe is still susceptible to infection but faecal egg production
appears to be suppressed. Pre-lambing drenching has given variable results in many studies
(Leaning et al,1970; Brunsdon and Adams, 1975; Brunsdon, 1981). From this study the ewe's
resistance to challenge is diminished from as early as 4 weeks pre-lambing. Production losses
will occur if the ewe is exposed to larval challenge at this time with a resultant peri-parturient rise
in faecal egg count of the ewes being observed and in this situation a pre-lambing drench would
be effective. Under New Zealand conditions it appears that high pasture larval levels are mainly
encountered post-lambing, since most studies have observed a post-parturient rise in the field. It
has been suggested by Morely and Donald (1986) that advancing lambing date could confer
significant control advantages, by reducing larval intakes when the ewe is most susceptible to
75
challenge and thereby reducing faecal egg contamination. However, the feed demands of
lactating ewes have to match the feed supply make this impractical on pasture. Pasture larval
levels are highest during the months of July, August and September (Familton et ai, 1986),
therefore no benefits are likely to be gained from advancing the time oflambing. Drenching of
breeding ewes between late pregnancy and tailing is of little value if pasture larval levels are high
as the ewe will become rapidly re-infected although some temporary benefit may be gained in
production.
Use of slow release anthelmintic devices pre-lambing could provide effective control of
faecal egg contamination thus reducing pasture larval levels post-weaning, and provide significant
production gains in both ewe and lamb production. There exists the possibility that previous
parasitic exposure is beneficial, but at a cost, in the performance of the ewe to a subsequent
challenge post-lambing, in eliminating newly acquired infections and thus reducing faecal egg
contamination and therefore lower pasture larval levels.
5.2 CONCLUSIONS
These fmdings are of considerable practical significance. Results of this study, confirm
ewes in late pregnancy, at parturition, and during lactation are more susceptible than non-breeding
ewes to infection with O. circumcincta. Pregnant and lactating ewes were impaired in their
ability to mount an immune response to incoming larvae. Greatest susceptibility to larval
infection occurred at or around parturition, with susceptibility appearing to increase from 4 weeks
before parturition and decrease gradually back to normal levels between 3-6 and 12 weeks post
parturition. The change in the lactating ewe's immune status brought about by a combination of
recent parasite exposure and removal of the adult worm burden by drenching, may explain the
success or failure of pre-lambing drenching programmes, suggesting that a partial reduction in the
ewes immune status may occur. Drenching at tailing will improve ewe productive performance,
eliminate faecal egg production and therefore reduce pasture larval contamination. Drenching at
this time should not markedly increase development of anthelmintic resistance as the ewe's
resistance increases from 3-6 weeks after parturition, suppression of faecal egg output will occur
reducing the risk. By moving ewes to 'clean' pasture after drenching the ewes susceptibility to
challenge will not be affected if subsequently the ewes are grazed on 'contaminated I pasture after
weaning but preferably 12 weeks after lambing.
Nutritional status of the animal and its implications on the ewes immune status and resistance to
re-infection pre and post lambing warrant further investigation.
76
ACKNOWLEDGEMENTS
I would like to extend my sincere gratitude to my supervisor, Professor A.R. Sykes, for
his supelVision and guidance throughout the course of this investigation. I am also indebted to Dr
A.S. Familton who as my associate supelVisor, provided enthusiasm and extremely useful
discussion at all stages of this study.
The work embodied in this thesis was funded by MSD Agvet NZ Ltd. I wish to thank
MSD Agvet NZ Ltd for their support and commitment to parasitology research and in particular
Dr W.B. McPherson for his efforts in supporting this project.
I am also indebted to the late Mr J.G. Hollick for his assistance in obtaining facilities
and equipment and for his skilled assistance with slaughter procedures. My thanks also are
extended to Mr N.P. Jay and the staff of the Johnstone Memorial Laboratory for their technical
help during the experiment, in particular, the patient and tireless assistance of Ms A. Lewis and
Ms S. Bos are gratefully acknowledged. Without their commitment, these investigations would
not have been possible. I am also grateful for the expert help provided by Mr M.J. Keeley, Mr
D.A. Herrick and Mr S. Kirsopp. I am indebted to Ms P. Gibb and the staff of the Analytical
Laboratories for their advice and considerable help with chemical analysis.
I wiSh to thank the Department of Wool Science for the use of the Wool Laboratory for
processing and measurement of wool parameters is gratefully acknowledged and in particular Mrs
J.J Nicol and Mr F Aitken for their advice and assistance.
I am also indebted to my Fellow post graduates Mr Tan Chee Mun, Osman Mahgoub
Gaafar, DrP.D. Muir, Ms H. Collins for their valuable advice, support and encouragement and
their help with slaughter procedures and sampling at unsociable hours.
I wish to thank the staff of the Centre of Computing and Biometrics at Lincoln College
in particular Mr J.R. Sedcole for statistical advice and Ms B. Gissing, for advice and assistance
with preparation of this thesis.

77
Many people generously provided help and advice throughout this investigation and
though it is not possible to acknowledge them all personally, their contributions are greatly
appreciated.
Finally, I am grateful to my family. whose love, encouragement and personal sacrifice,
allowed me to complete this study. In particular my wife Rosemary who spent many weekends
helping, and my two sons Timothy and Benjamin who have given me an added incentive.to
finish.
78
REFERENCES
ABBOIT, E.M.; PARKINS, J.J.; HOLMES, P.H. (1985a) Influence of dietary protein on
parasite establishment in Finn Dorset and Scottish Blackface lambs given a single
moderate infection of Haemonchus contortus. Research in Veterinary Science 38: 6-13.
ABBOIT, E.M.; PARKINS, J.J.; HOLMES, P.H. (1985b) Influence of dietary protein on
pathophysiology of ovine haemonchosis in Finn Dorset and Scottish Blackface lambs
given a single moderate infection. Research in Veterinary Science 38: 54-60.
ADAMS, D.B. (1982) Time of onset and target of immune reactions in sheep with acquired
immunity against Haemonchus contortus. International Journal/or Parasitology 12:
439-442.
ADAMS, D.B. (1983) Investigation with dexamethasone of the processes which moderate
immunity against the nematode, Haemonchus contortus, in sheep. Australian Journal
Experimental Biological and Medical Science 61: 345-353.
ADAMS, D.B.; BEH,K.J. (1981) Immunity acquired by sheep from an experimental infection
with Haemonchus contortus. InternationalJournal/or Parasitology 11: 381-386.
ALBERS, G.A.A. (1981) Genetic resistance to experimental Cooperia oncophora infection in
calves. M ededelinger Landbouwho geschool 81-1.
ALBERS, G.AA.; GRAY, G.D. (1987) Breeding for worm resistance: A perspective.
International Journal/or Parasitology 17: 559-566.
ALLONBY, E.W.; URQUHART, G.M. (1973) Self-cure of Haemonchus contortusinfections
under field conditions. Parasitology 66: 43-53.
AL SAQUR, A.; BAIRDEN, K.; ARMOUR, J.; GEITINBY, G. (1982) Population study of
bovine Ostertagia spp infective on herbage and in soil. Research in Veterinary Science
32: 322-337.
ALTAIF, K.I.; DARGIE, J.D. (1978) Genetic resistance to helminths: The influence of breed and
haemoglobin type on the response of sheep in primary infections with Haemonchus
contortus. Parasitology 77: 161-175.
ALTAIF, K.I.; ISSA, W.H. (1983) Seasonal fluctuations and hypobiosis of gastro-intestinal
nematodes of Awassi lambs in Iraq. Parasitology 86: 301-310.
ANDERSON, N. (1968) Bovine ostertagiasis of Victorian beef cattle. Victorian Veterinary
Proceedings 26: 43-44.
ANDERSON, N. (1972) Trichostrongylid infections of sheep in a winter rainfall region. I
Experimental studies in the west district of Victoria 1966-67. Australian Journal 0/
Agricultural Research 24: 1113-1129.
79
ANDERSON, N. (1973) Trichostrongylid infections of sheep in a winter rainfall region. n. Epizootiological studies in the west district of Victoria 1967-68. Australian Journal of
Agricultural Research 24: 559-615.
ANDERSON, N.; BLAKE, R.; TICHEN, D.A. (1976) Effect ofa series of infections of
Ostertagia circumcincta on gastric secretion of sheep. Parasitology 72: 1-12.
ANDERSON, N.; DONALD, A.D.; WALLER, PJ. (1983) Epidemiology and control of parasite
gastroenteritis of cattle in the temperate climatic zone. In The epidemiology and control of
gastrointestinal parasites of cattle in Australia (Editors Anderson, N. & Waller, P.J.).
C.S.I.R.O. Australia pp 47-64.
ANDERSON, N.; ARMOUR, J.; JENNINGS, J.; RITCHIE, J.S.D.; URQUHART,G.M. (1965)
Inhibited development of Ostertagia ostertagi. Veterinary Record 77: 146-147.
ANDERSON, N.; HANSKY, J.; TIT CHEN, D.A. (1981) Effect of Ostertagia circumcincta
infections on plasma gastrin in sheep. Parasitology 82: 761-770.
ANDERSON, N.; HANSKY, J.; TITCHEN, D.A. (1985) Effects of plasma pepsinogen, gastrin
and pancreatic polypeptide of Ostertagia spp. transferred directly into the abomasum of
sheep. International Journalfor Parasitology 15: 159-165.
ANDERSON, N.; MORRIS, R.S.; TAGGART, I.K. (1976) An economic analysis of two
schemes for anthebnintic control ofhebninthiasis in weaned lambs. Australian Veterinary
Journal 52: 174-180.
ANDERSON, R.M.; MAY, R.M. (1978) Regulation and stability of host-parasite population
interactions. I. Regulatory processes. Journal of Animal Ecology 47: 219-247 .
. ARMOUR, J. (1978) Arrested development in cattle nematodes with special reference to
Ostertagia ostertagi. In Facts and Reflections III (Editor Borgsteede, F.H.M.). Workshop
on Arrested Development of Nematodes in Sheep and Cattle. Central Veterinary Institute,
Lelystad, Netherlands, pp 77-88.
ARMOUR, J.; BRUCE, R.G. (1974) Inhibited development in Ostertagia ostertagi infections
a diapause phenomenon in a nematode. Parasitology 69: 161-174.
ARMOUR, J.; JARRETT, W.F.H.; JENNINGS, F.W. (1966) Experimental Ostertagia
circumcincta infection in sheep: Development and pathogenesis of a single infection.
American Journal of Veterinary Research 27: 1267-78.
ARMOUR, J.; JENNINGS, F.W.; URQUHART, G.M. (1969) The inhibition of Ostertagia
ostertagi the early fourth larval stages. I. The seasonal incidence. Research in Veterinary
Science 10: 232-237.
BAIRDEN, K.; PARKINS, JJ.;ARMOUR, J. (1979) Bovine ostertagiasis : A changing
epidemiological pattern? Veterinary Record 105 : 33-35.
80
BARGER, LA. (1973) Trichostrongylosis and wool growth. L Feed digestibility and mineral
absorption in infected sheep. Australian Journal 0/ Experimental Agriculture andAnlmal
Husbandry 13: 4247.
BARGER, LA.; Le JAMBRE, L.F.; GEORGI, J.R; DAVIES, H.I. (1985) Regulation of
Haemonchus contortus populations in sheep exposed to continuous infection.
International Journal/or Parasitology 15: 529~533.
BARGER, LA.; SOUTHCOTT, W.H.; WILLIAMS, V.J. (1973) The wool growth response of
infected sheep to parenteral and duodenal cystine and cystine supplementation. Australian
Journal 0/ Experimental Agriculture and Animal Husbandry 13: 351-359.
BARGER, I.A.; SOUTHCOTT, W.H. (1975) The wool growth response of resistant grazing
sheep to a larval challenge. Australian Journal 0/ Experimental Agriculture and Animal
Husbandry 15: 167-172.
BARKER, LK. (1973) A study of the pathogenesis of Trichostrongylus colubriformis infection in
lambs with observations on the contribution of gastro-intestinal plasma loss. International
Journal/or Parasitology 4: 153-163.
BELL, R.G.; McGREGOR, D.O. (1980) Requirement for two discrete stimuli for induction of
the intestinal rapid expulsion response against Trichinella spiralis in rats. lrifection and
Immunity 29: 186~193.
BELL, R.G.; McGREGOR, D.O.; ADAMS, L.S. (1982) Trichinella spiralis : characterisation and
strain distribution of rapid expulsion in inbred mice. Experimental Parasitology 53: 301-
314.
BIRD, A.F.; WALLER, P.J.; DASH, K.M.; MAJOR, G. (1978) Observations on crystals found
in the intestinal cells of Haemonchus contortus and in the intestinal lumen of Ostertagia
ostertagi. InternationalJournal/or Parasitology 8: 69~74.
BLITZ, N.M. (1972) Studies on the arrested development of Haemonchus contortus (Rudolphi,
1823) nematode in sheep. Dissertation Abstracts International. 32B: 3718.
BLITZ, N.M.; GIBBS, H.C. (1971) Morphological characterisation of the stage of arrested
development of Haemonchus contortus in sheep. Canadian Journal o/Zoology 49: 991-
995.
BLITZ, N.M.: GIBBS, H.C. (1972a) Studies on the arrested development of Haemonchus
contortus in sheep. I. The induction of arrested development. International Journal/or
Parasitology 2: 5~ 12.
BLITZ, N.M.; GIBBS, H.C. (1972b) Studies on the arrested development of Haemonchus
contortus in sheep. II. Termination of arrested development and the spring rise
phenomenon. International Journal/or Parasitology 2: 13-22.
BOAG, B.; THOMAS, RJ. (1971) Epidemiological studies on gastro-intestinal nematode
parasites of sheep. Research in Veterinary Science 12: 132-139.
BOAG, B.; THOMAS, RJ. (1977) Epidemiological studies on gastro-intestinal nematode
parasites of sheep; The seasonal number of generations and succession of species.
Research in Veterinary Science 22: 62-67.
81
BOWN. M.D. (1986) Protein metabolism in parasite infected lambs. Ph.D. Thesis, University of
Canterbury, New Zealand.
BOWN, M.D.: POPPI, D.P.; SYKES, A.R (1986) The effect ofpost-ruminal infusion of protein
or energy on the pathology of Trichostrongylus colubri/ormis infection and body
composition in lambs. Proceedings of New Zealand Society of Animal Production 46:
27-30.
BROWN, G.H.; TURNER, A.N: YOUNG, S.S.Y.; DOLLING, C.H.S. (1966) Vital statistics for
an experimental flock of Merino sheep. III. Factors affecting wool and body
characteristics, including the effect of age of ewe and its possible interaction with method
of selection. Australian Journal of Agricultural· Research 17: 557-581.
BRUNSDON. RV. (1963) The seasonal availability to grazing sheep of infective
Trichostrongyle larvae on pasture. New Zealand Veterinary Journal 11: 86-89.
BR UNSDON, R V. (1964a) The seasonal variation in the nematode egg counts of sheep: A
comparison of the spring rise phenomenon in breeding and unmated ewes. New Zealand
Veterinary Journal 12: 75-80.
BRUNSDON, RV. (1964b) The effect of nutrition on the establishment and persistence of
trichostrongyle infestation. New Zealand Veterinary Journal 12: 108-111.
BRUNSDON, R.V. (1966) A comparison of the spring rise phenomenon in the faecal nematode
egg counts of housed sheep with that of sheep grazing infective pasture. New Zealand
Veterinary Journal 4: 145-151.
BRUNSDON, RV. (1967) The spring rise phenomenon: The relationship between the time of
lambing and the commencement of the rise in faecal worm egg counts. New Zealand
Veterinary Journal 15: 35-40.
BRUNSDON, RV. (1970) The spring rise phenomenon: Seasonal changes in the worm burdens
of breeding ewes and in the availability of pasture infection. New Zealand Veterinary
Journal 18: 47-54.
BRUNSDON, RV. (1971) The post-parturient rise in the faecal nematode egg count of ewes:
Some host-parasite relationships. New Zealand Veterinary Journal 19: 100-107.
BRUNSDON, R.V. (1976) Response to the anthelmintic treatment oflambs at weaning: The
relative importance of various sources of contamination in Trichostrongyle infections.
New Zealand Journal of Experimental Agriculture 4: 275-279.

BRUNSDON, R.V. (1981) Control of internal parasites the present state ofp1ay. Ruakura
Farmers Conference Proceedings 1981 pp 115-123.
82
BRUNSDON, RV. (1982) Host/Parasite Interrelationships in Trichostrongylid Infections. In
Internal parasites of sheep (Editor Ross, A.D.). Animal Industries Workshop, Lincoln
College pp 21-24.
BRUNSDON, RV.; ADAMS, J.L. editors (1975) Internal parasites and animal production
Occasional publication No 4, New Zealand Society of Animal Production. Editorial
Services Ltd, Wellington 53 p.
BRUNSDON, RV.; VLASSOFF, A. (1971a) The post-parturient rise: A comparison of the
pattern and relative generic composition of strongyle egg output from lactating and non
lactating ewes. New Zealand Veterinary Journal 19: 19-25.
BRUNSDON, RV.; VLASSOFF, A. (1971b) The post-parturient rise: A comparison of the
pattem and relative generic composition of faecal egg counts in ewes and wethers. New
Zealand Veterinary Journal 19: 32-37.
BRUNSDON, RV.; VLASSOFF,A.; WEST, C.J. (1986) Effect of natural trichostrongylid
challenge on breeding ewes. New Zealand Journal of Experimental Agriculture 14: 37-41.
BULLICK, G.R.; ANDERSEN, P.L. (1978) Effect of irrigation on survival of third-stage
Haemonchus contortus larvae (Nematoda: Trichostrongylidae). The Great Basin
Naturalist 38: 369-378.
CALLINAN, A.P.L. (1978) The ecology of the free-living stages of Ostertagia circumclncta.
International Journalfor Parasitology 8: 233-237.
CALLINAN, A.P.L. (1979) The ecology of the free-living stages of Trichostrongylus vitrinus.
International Journal/or Parasitology 9: 133-136.
CARROLL, S.M.; MAYRHOFER, G.; DAWKINS, H.J.S.; GROVE, D.I. (1984) Kinetics of
intestinal lamina propria mast cells, globule leucocytes, intraeptheliallymphocytes, globet
cells and eosinophils in murine strongyloidiasis. International Archives of Allergy and
Applied Immunology 74: 311-317.
CARTER, H.B.; FRANKLIN, M.C.; GORDON, H.McL. (1946) Effect on wool production of a
mild infestation with Trichostrongylus coluhriformis in sheep. Australian Journal of the
Councilfor Scientific and Industrial Research 19: 61-64.
CHAPMAN, RE.; WHEELER, J.L. (1963) Dyebanding : A technique for fleece growth studies.
Australian Journal of Science 26: 53-54.
CHIEJINA, S.N.; SEWELL,M.M.H. (1974a) Experimental infections with Trichostrongylus
colubriformis (Giles 1882) Loos 1905 in lambs: Worm burden, growth rate, and host
resistance resulting from prolonged escalating infections. Parasitology 69: 301-314.
83
CIDEJINA, S.N.; SEWELL,M.M.H. (1974b) Wonn burdens, acquired resistance and liveweight
gains in lambs during prolonged daily infections with Trichostrongylus colubri/ormis
(Giles 1882) Loos, 1905. Parasitology 69: 315-327.
CHRISTIE, M.G. (1970) The fate of Haemonchus contorms and their effect on conditions in the
ovine abomasum. Journal of Comparative Pathology 80: 89-100.
CHRISTIE, M.G.; BRAMBELL, M.R. (1966) Acquired resistance to Haemonchus contorms in
young lambs. Journal of Comparative Pathology 76: 207-216.
CHRISTIE, M.G.; BRAMBELL, M.R.; CHARLESTON, W.A.G. (1964) Wonn populations in
young sheep dosed daily with 10,000 larvae of Haemonchus contorms. Journal of
Comparative Pathology 74: 435446.
CLUNIES-ROSS, 1. (1932) Observations on the resistance of sheep to infestation by the stomach
wonn, Haemonchus contortus. Journal of the Councilfor Scientific and Industrial
Research 5: 73-80.
CONNAN, R.M. (1968a) Studies on the wonn populations in the alimentary tract of breeding
ewes. Journal of Helminthology 42: 9-28.
CONNAN, R.M. (1968b) The post-parturient rise in faecal egg count of ewes, its aetiology and
epidemiological significance. World Review of Animal Production 4:53-58.
CONNAN, R.M. (1969) Studies on the inhibition of development of Ostertagia spp in lambs.
Journal of Helminthology 43: 287-292.
CONNAN, R.M. (1970) The effect of host lactation on the self cure of Ntppostrongylus
brasiliensis in rats. Parasitology 61: 27-37 .
. CONNAN, R.M. (1971) The effect of the plane of nutrition on parasitism by Ostertagia spp in
the lactating ewe. Journal of Helminthology 45: 177-187.
CONNAN, R.M. (1972) The effect of host lactation on a seasonal infection of Nippostrongylus
brastliensis in rats. Parasitology 64: 229-233.
CONNAN, R.M. (1973) The influence of anthelmintic treatment of ewes on the relative
proportions of gastrointestinal parasites. Veterinary Record 92: 513-514.
CONNAN, R.M. (1975) Inhibited development in Haemonchus contortus. Parasitology 71:
239-246.
CONNAN, R.M. (1978) Arrested development in Haemonchus contorms. In Facts and
reflections III (Editor Borgsteede, F.H.M.). Central Veterinary Institute, Lelystad, pp 53-
62.
COOP, R.L.; ANGUS, K.W.; HUTCHINSON, G.; WRIGHT, S. (1984) Effect of anthelmintic
treatment on the productivity oflambs infected with the intestinal nematode,
Trichostrongylus colubri/ormis. Research in Veterinary Science 36: 71-75.
84
COOP, RL; FIELD, AC. (1983) Effect of intake on growth rate, food intake and quality of the
skeleton in young growing lambs infected with the intestinal nematode Triclwstrongylus
colubrlformis. Research in Veterinary Science. 35: 175-181.
COOP, RL.; SYKES, AR; ANGUS, K.W. (1977) The effect of a daily intake of Ostertagia
circumcincta larvae on bodyweight, food intake and concentration of serum constituents in
sheep. Research in Veterinary Science 23: 76-83.
COOP, RL.; SYKES, AR; ANGUS, K.W. (1982) The effect of three levels of Ostertagia
circumcincta larvae on growth rate, food intake and body composition of growing lambs.
Journal of Agricultural Science, Cambridge. 98: 247-255.
CREMMERS, H.J.W.M.; EYSKER, M. (1975) Experimental induction of inhibited development
of Haemonchus contortus in the Netherlands. Tropical and Geographical Medicine 27:
229.
CROFI'ON, H.D. (1958) Nematode parasite populations in sheep on lowland farms. V. Further
observations on the post-parturient rise and a discussion of its significance. Parasitology
48: 243-250.
CROFI'ON, H.D. (1965) Ecology and biological plasticity of sheep nematode. I. The effect of
temperature on the hatching of eggs of some nematode parasites of sheep. Cornell
Veterinarian 5: 242-250.
CROMPTON, D.W.T.; WALTERS,D.E.; ARNOLD, S. (1981) Changes in the food intake and
body weight of protein malnourished rats infected with Nippostrongylus brasiliensis
(Nematoda). Parasitology 82: 23-28.
DARGIE, J.D. (1975) Applications of radioistope techniques to the study of red cell and plasma
protein metabolism in helminth disease of sheep. In Pathogenic Process in Parasitic
Infections (Edited by Taylor AE.R & Miller R). Blackwell Scientific, Oxford pp 1-26.
DARGIE, ID. (1980) The pathophysiology effects of gastro-intestinal and liver parasite in
sheep. In Digestive Physiology and Metabolism in Ruminants (Editors Ruckerbusch, Y.;
Thivend, P.). A VI, Connecticut. pp 349-371.
DARGIE, J.D. (1982) Influence of genetic factors on the resistance of ruminants to gastro
intestinal nematode and trypanosome infections. In Animals Models in Parasitology
(Editor Owen, D.). MacMillian Press pp 17-51.
DARVILL, F.M.; ARUNDEL, J.H.; BROWN, P.B. (1978) The effect of anthelmintic treatment
of maiden ewes in the periparturient period on pasture contamination and production of
prime lambs. Australian Veterinary Journal 54: 575-584.
DINABURG, AG. (1944) Development and survival under outdoor conditions of eggs and
larvae of the common ruminant stomach wonn Haemonchus contortus. Journal of
Agricultural Research 69: 421.
85
DINEEN, J.K. (1978) The nature and role of immunological control in gastro-intestinal
helminthosis. In The epidemiology and control of gastro-intestinal parasites of sheep in
Australia (Editors Donald, A.D.; Southcott, W.H. & Dineen, J.K.). C.S.I.RO. Division
Animal Health Australia pp 121-135.
DINEEN, J.K.; DONALD, A.D.; WAGLAND, B.M; OFFFNER, J. (1965) The dynamics of the
host-parasite relationship. m. The response of sheep to primary infection with
Haemonchus contortus. Parasitology 55: 515-525.
DINEEN, J.K.; DONALD, A.D.; WAGLAND, B.M; TURNER, J.H. (1964) The dynamics of the
host-parasite relationship. II. The response of sheep to primary and secondary infection
with Nematodirus spathiger. Parasitology 55: 163-171.
DINEEN, J.K.; GREGG, P.; LASCELLES, A.K. (1978) The response oflambs to vaccination at
weaning with irradiated Trichostrongylus colubrijormis larvae: Segregation into
'responders' and I non-responders'. International Journalfor Parasitology 8: 59-63.
DINEEN, J.K.; KELLY,J.D. (1972) The suppression of rejection of Nippostrongylus brasiliensis
in lactating rats: The nature of the immunological defect. Immunology 22: 1-12.
DINEEN, J.K.; WAGLAND, B.M. (1966) The dynamics of the host-parasite relationship IV.
The response of sheep to graded and repeated infection with Haemonchus contortus.
Parasitology 56: 639-650.
DINEEN,J.K.; WINDON, RG. (1980) The effect of sire selection on the response of lambs to
vaccination with irradiated Trichostrongylus colubrijormis larvae. International Journal
for Parasitology 10: 189-196.
DOBSON, C. (1982) Passive transfer of immunity with serum in mice infected with
Nematospiroides dub/us influence of quality and quantity of immune serum. International
Journalfor Parasitology 12: 201-213.
DOBSON. C.; BAWDEN, RJ. (1974) Studies on the immunity of sheep to Oesophagostomum
columbianum: Effects of low protein diet on resistance to infection and cellular reactions in
the gut. Parasitology 69: 239-255.
DONALD, A.D.; (1979) Effects of parasite and disease on wool growth. In Physiological and
environmental limitations to wool growth (Editors Black J.L. & Reis P.J.). University of
New England. Atmidale N.S.W., 2351 Australia pp 99-114.
DONALD, A.D.; DINEEN, J.K.; TURNER, J.H.; WAGLAND, B.M. (1964) The dynamics of
the host-parasite relationship. I. Nematodirus spathiger infection in sheep. Parasitology
54: 527-544.
DONALD, A.D.; MORELY, F.H.W.; WALLER, P.J.; AXELSEN, A.; DOBSON,RJ.;
DONNELLY, J.R (1982) Effects of reproduction, genotype and anthelmintic treatment of
ewes on Ostertagia spp populations. International Journalfor Parasitology 12: 403-411.

86
DONALD, A.D.; WALLER, P.J. (1973) Gastro-intestinal nematode parasite population in ewes
and lambs and the origin and time course of infective larval availability in pastures.
International Journaljor Parasitology 3: 219-233.
DONNELLY, J.R.; McKINNEY, G.T.; MORELY, F.H.W. (1972) Lamb growth and ewe
production following anthelmintic drenching before and after lambing. Proceedings of the
Australian Society of Animal Production 9: 392-396.
DOWNEY, N.E.; CONNOLLY, J.F; O'SHEA, I. (1969) Experimental ostertagiasis in lambs fed
high and low protein (N x 6.25) grass meal. Veterinary Record 85: 201-202.
DOWNEY, N.E.; CONNOLLY, J.F; O'SHEA, I. (1972) Experimental ostertagiasis and the
effect of diet on resistance in sheep. Irish Journal of Agricultural Research 11: 11-29.
DUNCAN, J.L.; ARMOUR, J.; BAmDEN, K.; URQUHART, G.M.; JORGENSEN, R. (1979)
Studies on the epidemiology of bovine parasitic bronchitis. Veterinary Record 104: 274.
DUNCOMBE, V.M.; BOLIN, T.D.; DAVIES, A.E.; KELLY, J.D. (1981) Delayed expulsion of
the nematode Nippostrongylus brasiliensis from rats on low protein diet: The role of a
bone marrow derived component. American Journal of Clinical Nutrition 34: 400-403.
DUNSMORE, J.D. (1960) Retarded development of Ostertagia species in in lambs: Wonn
burden, growth rate, and host resistance resulting from prolonged escalating infections
sheep. Nature (London) 186: 986-987.
DUNSMORE, J.D. (1961) Effect of whole~body irradiation and cortisone on the development of
Ostertagia spp in sheep. Nature (London) 186: 986-987.
DUNSMORE, J.D. (1965) Ostertagia spp in lambs and pregnant ewes. Journal of Helminthology
39: 159-184.
DUNSMORE, J.D. (1966) Topographical distribution of Ostertagia spp in the abomasum of
sheep. Journal of Helminthology 40: 39-44.
ELLIOTI, D.C.; DURHAM, PJ.K. (1976) Experimental Ostertagia spp infections of sheep:
Populations and lesions in previously wonn free and previously exposed animals.
Veterinary Parasitology 2: 167-175.
EV ANS, J.V.; WHITLOCK. J.H (1964) Genetic relationship between maximum haematocrit
type in sheep. Science 145: 1318.
FAMILTON, A.S.; NICOL, A.M.; McANULTY, R.W. (1986) Epidemiology ofintemal
parasitism of sheep on irrigated pasture and the possible control measures. Proceedings of
the Sheep and Beef Cattle Society of the New Zealand Veterinary Association 15: 210-219.
FERNANDO, M.A.; STOCKDALE, P.H.G.; ASLTON, G.C. (1971) Factors contributing to the
retardation of development of Obeliscoides cuniculi in rabbits. Parasitology 63: 21-29.
87
FIELD, A.C.; BRAMBELL, M.R.; CAMPBELL, J.A. (1960) Spring rise in faecal wonn egg
counts of housed sheep and its importance in nutritional experiments. Parasitology 50:
387-399.
FOX, M.T.; PITT, S.R.; GERRELLI, D.; JACOBS, D.E. (1988) Effect of diet on gastrin
response to Ostertagia ostertagi infection in the calf. International Journalfor
Parasitology 18: 547-548.
FRANKLIN, M.C.; GORDON, H.McL.; MacGREGOR, C.H. (1946) A study of the nutritional
and biochemical effects on sheep of infestations with Trichostrongylus colubriformis.
Journal of the Councilfor Scientific and Industrial Research of Australia 19: 46-60.
FURMAN, D.P. (1944) Effects of environment upon the free-living stages of Ostertagia
circumcincta (Stadehnann) Trichostrongylidae : II. Field experiments. American Journal
of Veterinary Research 5: 147-153.
GIBBS, H.C. (1968) Some factors involved in the 'spring rise' phenomenon in sheep. In
Proceedings of the 3rd International Conference of the World Association for the
Advancement ofVeteriIiary Parasitology (Editor SouIsby, E.J.L.). Lyons, France, July
1968 pp 160-173.
GIBBS, H.C. (1973) Transmission of parasites with reference to the strongyles of domestic sheep
and cattle. Canadian Journal of Zoology 51: 281-289.
GIBBS, H.C. (1982) Mechanisms ofsUlvival of nematode parasites with emphasis on
hypobiosis. Veterinary Parasitology 11: 25-48.
GIBBS, H.C. (1986) Hypobiosis in parasitic nematodes - An update. Advances in Parasitology
25: 129-174.
GIBBS, H.C.; BARGER, LA. (1986) Haemonchus contortus and othertrichostrongylid
infections in parturient, lactating and dry ewes. Veterinary Parasitology 22: 57-66.
GIBSON, T.E. (1952) The development of acquired resistance by sheep to infestations with the
nematode Trichostrongylus axei. Journal of Helminthology 26: 43-53.
GIBSON, T.E. (1953) The effect of repeated anthehnintic treatment with phenothiazine on the
faecal egg count of housed horse with some obselVations on the life cycle of Trichonema
spp in the horse. Journal of Helminthology 27: 29-40.
GIBSON, T.E. (1963) The influence of nutrition on the relationship between gastro-intestinal
parasites and their hosts. Proceedings of the Nutrition Society 22: 15-20.
GIBSON, T.E.; EVERETT, G. (1967) The ecology of the free-living stages of Trichostrongylus
colubriformis. ParaSitology 57: 533-537.
GIBSON, T.E.; EVERETT, G. (1972) The acquisition of Trichostrongylid infection by grazing
lambs. Research in Veterinary Science 13: 268-271.
88
GIDSON, T.E.; EVERETI, G. (1971) The effect of resistance on the faecal egg output of sheep
and on pasture larval infection. British Veterinary Journal 133: 559-563.
GIDSON, T.E.: PARFITT, J.W. (1972) The effect of age on the development by sheep of
resistance to Trichostrongylus colubrijormis. Research in Veterinary Science 13: 529-535.
GIDSON, T.E.: PARFITT, J.W. (1973) The development of resistance to Trichostrongylus
colubrijormis by lambs under conditions of continuous infection. Research in Veterinary
Science 15: 220-223.
GmSON, T.E.; PARFITT J.W. (1976) The effect of anthelmintic treatment on the development
of resistance to Ostertagia circumcincta in sheep. Journal of Comparative Pathology 86:
547-555.
GIDSON, T.E.; PARFITT, J.W.: EVERETI. G. (1970) The effect of the anthelmintic treatment
of the development of resistance to Trichostrongylus colubriformis in sheep. Research in
Veterinary Science 11: 138-145.
GmSON, T.E.; WHITEHEAD, J.D. (1981) Changes in the worm burden oflambs under
continuous infection with Ostertagia circumcincta. British Veterinary Journal 137: 192-
195.
GOLDBERG, A. (1968) Development and survival on pasture of gastro-intestinal nematode
parasites of cattle. The Journal of Parasitology 54: 856-862.
GORDON, H.McL. (1948) The epidemiology of parasitic diseases with special reference to
studies with nematode parasites of sheep. Australian Veterinary Journal 24: 17-45.
GORDON, H.McL. (1950) Some aspects of parasitic gastro-enteritis of sheep. Australian
Veterinary Journal 26: 14-28.
GORDON, H.McL. (1954) Some aspects of parasitic gastro-enteritis of sheep. Australian
Veterinary Journal 26: 14-28.
GORDON, H.McL. (1964) Studies of resistance to Trichostrongylus colubriformis in sheep.
Influence of quantitative reduction in the ration. Australian Veterinary Journal 40: 55-61.
GORDON, H.McL. (1973) Epidemiology and control of gastro-intestinal nematodes in
ruminants. Advances in Veterinary Science and Comparative Medicine 17: 395-437.
GORDON, H.McL. (1974) Hypobiosis, haemonchosis and the hytherograph. Proceedings of the
Third International Congress for Parasitology 2: 750-751.
GREGORY, P.W.; MILLER, RF.; STEWART, M.A. (1940) An analysis of environment and
genetic factor influencing stomach infestation in sheep. Journal of Genetics 39: 391-400.
HANSFORD, K. (1987) Collation and analysis of available information on additional
measurements relevant to improved management of sheep. Report for sheep management
implications of sale with additional measurements committee. Australian Wool council.
University of New South Wales. 59 p.
89
HARVEY, W.R. (1985) Users guide for LSMLMW. Ohio State University 46p.
HEATH, G.B.S.; MICHEL, J.F. (1969) A contribution to the epidemiology of parasitic gastro
enteritis in lambs. Veterinary Record 85: 305-308.
HERLICH, H. (1956) A digestion method for post-mortem recovery of nematodes from
ruminants. Proceedings 0/ Helminthology Society o/Washington 23: 102-103.
HOLMES, P.H. (1986) Pathophysiology of nematode infections. Proceedings of the Sixth
International Congress for Parasitology, Editor Howell, M.J. Australian academy of
science, Canberra 1986 pp 443-451.
HOLMES, P.H.: MacLEAN, J.M. (1971) The pathophysiology of ovine ostertagiasis: A study of
the changes in plasma protein metabolism following single infections. Research in
Veterinary Science 12: 265-271.
HONESS, R.F.; BERGSTROM, R.C (1966) Trichostrongylosis of cattle in Wyonming.
University o/Wyoming, Agricultural Experimental Station Bulletin 2: 3-29.
HONG, C.; MICHEL,J.F.; LANCASTER, M.B. (1986) Populations of Ostertagia circumcincta
in lambs following a single infection. International Journaljor Parasitology 16: 63-67.
HORACK, LG. (1981) The similarity between arrested development in parasitic nematodes and
diapause in insects. Journal o/the South A/rican Veterinary Association 59: 299-303.
HORACK, LG.; CLARK, R. (1964) The pathological physiology of Ostertagia circumcincta
infestations. Onderstepoort Journal o/Veterinary Research 31: 163-176.
HUTCHINSON, G.W.; LEE, E.H.; FERNANDO, M.A. (1972) Effects of variations in
temperature on infective larvae and their relationship to inhibited development of
Obeliscoides cuniculi in mbbits. Parasitology 65: 333-342.
JACKSON, F.: ANGUS, K.W., COOP, R.L. (1983) The development of mOlphological changes
in the small intestine of lambs continuously infected with Trichostrongylus vitrinus.
Research in Veterinary Science 34: 301-304.
JACKSON, F.; CHRISTIE, M.G. (1979) Observations on the egg output resulting from
continuous low infection with Ostertagia circumcincta in lambs. Research in Veterinary
Science 27: 244-245.
JACKSON, F.; CHRISTIE, M.G. (1984) Further observations on faecal egg output in lambs
dosed continuously with Ostertagia circumcincta. Research in Veterinary Science 36:
375-377.
JACKSON, F.; JACKSON, E.; WILLIAMS, J.F. (1988) Susceptibility of the peri-parturient ewe
to infection with Trichostrongylus vitrinus and Ostertagia circumcincta. Research in
Veterinary Science 45: 213-218.
JANSEN, J. (1968) Enkele waarnemign omtreat de "spring rise" bij schaper. Tijdschr
Diergeneeskd 93: 422-430.
JANSEN, J. (1977) The spring rise phenomenon in sheep. ill. Egg counts in animals with
corticosteroids and in barren ewes. Helminthologia 14: 271-276.
90
JANSEN, 1. (197B) The significance oflactation period number for the spring rise phenomenon
in sheep. Parasitology 77: xvii.
JAMES, P.S.; JOHNSTONE, I.L (1967a) Studies with Ostertagia circumcincta in sheep. I. The
epidemiology of mature adults and arrested larvae. Journal of Helminthology 41: 137-150.
JAMES, P.S.; JOHNSTONE, I.L (1967b) Ovine ostertagiasis. Australian Veterinary Journal 43:
379-383.
JAYAWICKRAMA, S.D.; GIBBS, H.C. (1967) Studies on ostertagiasis in sheep. Canadian
Veterinary Journal 8: 29-38.
JEFFCOATE, I.A.; HOLMES, P.R.; FISHWICK, G.; BOYD, J.; BAIRDEN, K.; ARMOUR, J.
(1988) Effects oftrichostrongyle larval challenge on the reproductive perfonnance of
immune ewes. Research in Veterinary Science 45: 234-239.
JENNINGS, F.W.; ARMOUR, J.; LAWSON, D.D.; ROBERTS, R. (1966) Experimental
Ostertagia ostertagi infections in calves: studied with abomasal cannulas. American
Journal of Veterinary Research 27: 1249-1257.
JOHNSTONE, I.L; BOWEN, F.L.; SMART, K.E. (1976a) Production in merino weaners
following anthelmintic therapy. New South Wales Veterinary Proceedings 12: 31-34.
JOHNSTONE, I.L.; DARVAILL, F.M.; BOWEN, F.L.; BROWN, P.R.; SMART, K.E. (1976b)
Optimum production from parasite control. Gross margins in a merino weaner sheep
enterprise with different levels of parasite contro1. Proceedings of the Australian Society
of Animal Production 11: 369-372.
KELLY, J.D.; DINEEN, J.K. (1972) The cellular transfer of immunity to Nippostrongylus
brasiliensis in inbred rats (Lewis strain). Immunology 22: 199-210.
KEMYER, A.; CROMPTON, D.W.T.; SAHAKIAN, BJ. (1983) Parasite-induced learned taste
adversion involving Nippostrongylus in rats. Parasitology 86: 455-466.
KRUPP, I. (1961) Effects of crowding and superinfection on habitat selection and egg production
in Ancylostoma caninum. Journal of Parasitology 47: 957-961.
LEANING, W.H.D.; CAIRNS, G.C.; McKENZIE, J.K.; HUNTER, W.R. (1970) Drenching of
pregnant ewes and its effect on their wool production and lamb growth rate. Proceedings
New Zealand Society of Animal Production 30: 52-64.
LEE, G.B.; OGILVIE, B.M. (1981) The mucus layer in intestinal nematode infections. In The
Mucosal Immune Systems in Health and Disease (Editors Ogra, P.L. & Bienenstock, J.).
Ross Laboratories, Columbus pp 175-187.
91
LEVINE, N.D.; TODD, KS. (1975) Micrometeorological factors involved in development and
survival of free-living stages of the sheep nematodes Haemonchus contortus and
Trichostrongylus colubriformis. International Journal of Biometeorology 19: 174-183.
LEWIS, KH.C.; STAUBER, V.V (1969) Effects of pre-lambing anthelmintic drenching on
production of ewes and the development of wonn parasitism in lambs. Proceedings New
Zealand Society of Animal Production 29: 177-191.
LEYVA, V.; HENDERSON, AE.; SYKES, AR (1982) Effect of daily infection with
Ostertagia circumcincta larvae on food intake, milk production, and wool growth in sheep.
Journal of Agriculture Science, Cambridge 99: 249-259.
LINDEN, H.R.; FERGUSON, KA (1956) Influence of the adrenal cortex on wool growth and
its relation to 'break' and 'tenderness' of the fleece. Nature (London) 177: 188-189.
LIPSON, M.; BACON-HALL, RE. (1976) Some effect of various parasite populations in sheep
and the processing perfonnance of wool. Wool Technology and Sheep Breeding 23: 18-20.
LITTLE, T.M.; HILLS, F.G. (1978) Agricultural experimentation: Design and analysis. Wiley
and Sons Inc., U.S.A 350 p.
LLOYD, S.; SOULSBY, E.J.L. (1987) Immunobiology of gastrointestinal nematodes of
ruminants. Chapter one. In Immune responses in parasitic infections. Volume I:
Nematodes pp 1-49.
LUCKER, J.T.; NEUMAYER, E.M (1947) An experiment on the relationship of diet to
hookwonn disease in lambs. American Journal of Veterinary Research 8: 400-412.
McANULTY, RW.; CLARK, V.R; SYKES, AR. (1982) The effect of clean pasture and
anthelmintic frequency on growth rates oflambs on irrigated pastures. Proceedings New
Zealand Society of Animal Production 42: 187-188.
McKELLAR, Q.; DUNCAN, J.L.; ARMOUR, J.; LINDSAY, F.E.F.; McWILLIAM, P. (1986)
Further studies on the response to transplanted adult Ostertagia ostertagi in calves.
Research in Veterinary Science 42: 29-34.
McKENNA, P.B. (1973) The effect of storage on the infectivity and parasitic development of
third-stage Haemonchus contortus larvae in sheep. Research in Veterinary Science 14:
312-316.
McLEAY, L.M; ANDERSON, N.; BINGLEY, J.B.; TITCHEN, D.A (1973) Effects on
abomasal function of Ostertagia circumcincta infections in sheep. Parasitology 66: 241-
257.
McSPORRIN, KD.; ANDREWES, W.G.K (1988) Parasites and honnones and Autumn lambing
sheep. In 18th Proceedings of the Sheep and Beef Cattle Society of the New Zealand
Veterinary Association, Lincoln New Zealand. pp 150-159.
92
MARTIN, J.; LEE, D.L. (1976) ObseIvation on the crystals found in the intestine of Nematodirus
battus during the development of immunity to this nematode in lambs. Parasitology 72:
75-80.
MENTON, V.J.A; PEACOCK, R; POYNTER, D.; SlL VERMAN, P.H.; TERRY, R.I. (1962)
The influence of age on the naturally acquired resistance to Haemonchus contortus in
lambs. Research in Veterinary Science 3: 308-314.
MICHEL, J. (1952) Self-cure in infections of Trichostrongylus retortae/ormis and its causation.
Nature (London) 169: 881.
MICHEL J.F. (1963) The phenomena of host resistance and the course of infection of Ostertagia
ostertagi in calves. Parasitology 53: 63-84.
MICHEL, J.F. (1967a) Immunity to helminths associated with tissues. In Immunity to parasites.
British Society for Parasitology, 6th Symposia (Editor A.E.R. Taylor). London pp 67-89.
MICHEL, IF. (1967b) Morphological changes in a parasitic nematode due to acquired resistance
of the host. Nature (London) 215: 520-521.
MICHEL, I.F. (1969a) Some observations in the worm burdens of calves infected daily with
Ostertagia ostertagi. Parasitology 59: 575-595.
MICHEL, J.F. (1969b) Epidemiology of some nematode infection of grazing animals. Advances
in Parasitology 7: 211-282.
MICHEL, IF. (1970a) Adult worms as a factor in the inhibition of development of Ostertagia
ostertagi. International Journal/or Parasitology 1: 31-36.
MICHEL, J.F. (1970b) The regulation of populations of Ostertagia ostertagi in calves.
Parasitology 61:435447.
MICHEL, IF. (1974) Epidemiology of some nematode infections of grazing animals. Advances
in Parasitology 12: 279-366.
MICHEL, J.F. (1976) Epidemiology and control of some nematode infections of grazing
animals. Advances in Parasitology 14: 355-397.
MICHEL, J.F. (1978) Tropical themes in the study of arrested development. InFacts and
Reflections III. Workshop on arrested development of nematodes of sheep and cattle
(F.H.M. Borgsteede, editor). Central Veterinary Institute, Lelystad Netherlands pp 7-17.
MICHEL, J,F. (1982) Some thoughts on the control of parasitic gastro-enterltis. In Biology and
control of endoparasites (Editors Symons, L.E.A.; Donald, A.D. & Dineen, lK.).
Academic Press, Sydney, Australia pp 113-131.
MICHEL, J.F.; LANCASTER, M.B.; HONG, C. (1973) Inhibition of development : Variation
within a population of Ostertagia ostertagi. Journal o/Comparative Pathology 83: 351-
356.
93
MICHEL, J.F.; LANCASTER, M.B.; HONG, C. (1974) Studies on arrested development of
Ostertagia ostertagi and Cooperia oncophora. Journal of Comparative Pathology 84:
539-554.
MICHEL, J.F.; LANCASTER, M.B.; HONG, C. (1976a) ObselVations on the resumed
development of arrested Ostertagia ostertagi in naturally infected cattle. Journal of
Comparative Pathology 86: 73-80.
MICHEL, J.F.; LANCASTER, M.B.; HONG, C. (1976b) The resumed development of arrested
Ostertagia ostertagi in experimental infected calves. Journal of Comparative Pathology
86: 615-619.
MILLER, H.RP. (1984) Protective mucosal response against gastro-intestinal nematodes in
ruminants and laboratory animals. Veterinary Immunology and Immunopathology 6: 167-
259.
MILLER, H.RP.; HUNTLEY, J.F.: WALLACE. G.R. (1981) Immune exclusion and mucus
trapping during the rapid expUlsion of Nippostrongylus brasiliensis from primed rats.
Immunology 44: 419-429.
MILLER, H.R.P.: HUNTLEY, IF. (1982) Protection against nematodes by intestinal mucus. In
Mucus in Health and Disease (Editors Chantler, E.N.: Elder, J.B. & Elstein, M.). Plenum,
New York. pp 243-257.
MILLER, H.RP.; JACKSON, F.; NEWLANDS, D.; APPLEYARD, W.T. (1983) Immune
exclusion, a mechanism of protection against the ovine nematode Haemonchus contortus.
Research in Veterinary Science 35: 357-363.
MILLER, H.RP.; NA W A, Y. (1979) Nippostrongylus brasiliensis: Intestinal goblet cell
response in adoptively immunised rats. Experimental Parasitology 47: 81-90.
MORLEY, F.H.W.; DONALD, A.D. (1986) Farm management and systems of helminth control
Veterinary Parasitology. 6: 105-134.
MORRIS, RS.; ANDERSON, N.; McTAGGART, I.K. (1977) An economic analysis of two
schemes for the control of helminthiasis in breeding ewes. Veterinary Parasitology 3:
349-363.
MORGAN, D.O.; SLOAN, J.E.N. (1947) Research on helminths in hill sheep with reference to
seasonal variations in worm egg output. Scottish Agriculture 27: 28-35.
MORGAN, D.O.: PARNELL, I.W.: RAYSKI, C. (1951) The seasonal variations in the worm
burden of Scottish hill sheep. Journal of Helminthology 25: 177-212.
MULLIGAN, W.; DALTON, R.G, ANDERSON, N. (1963) Ostertagiasis in cattle. Veterinary
Record 75: 1014.
MUNRO, J. (1955) Studies on the milk yield of Scottish Blackface ewes. Journal of
Agricultural Science, Cambridge 46: 131-136
94
MURRAY, M. (1969) Structural changes in bovine ostertagiasis with increased penneability of
the bowel wall to macromolecules. Gastroenterology 56: 763-772.
MYLREA, P.J.; HOTSON, I.K. (1969) Serum pepsinogen activity and the diagnosis of bovine
ostertagiasis. British Veterinary Journal 125: 379-388.
NICOLS, J.E. (1933) Fibre growth phases in a sample of Merino wool. Journal of Textile
Institute 24: t333.
NICOLLS, C.D.: LEE, D.L.; ADRIAN, T.E.: BLOON, S.R.; CARE, A.D. (1985) Endocrine
effects of Haemonchus contortus infection in lambs. Regulating peptides supplement 11:
85.
OOILIVE, B.M.: JONES, V.E. (1971) Nippostrongylus brasiliensis: A review of immunity and
the host-parasite relationship in the rat. Experimental Parasitology 29: 138-177.
OOILIVE, B.M.; HOCKLEY, D.J. (1969) Effects of Nippostrongylus brasiliensis adult wonns:
reversible and irreversible changes in infectivity, reproduction and morphology. Journal
of Parasitology 45: 1073-1084.
O'SULLIVAN, B.M.: DONALD, A.D. (1970) A field study of nematode parasite population in
the lactating ewe. Parasitology 61: 301-315.
0' SULLIVAN, B.M.; DONALD, A.D. (1973) Response to infection with Haemonchus
contortus and Trichostrongylus colubrijormis in ewes of different reproductive status.
International Journalfor Parasitology 3: 521-530.
O'SULLIV AN, B.M. (1974) Effects oflactation on Trichostrongylus colubrijormis infections in
the guinea pig. International Journalfor Parasitology 4: 177-181.
. OUTTERIDGE, P.M.; WINDON, O.W.; DINEEN, J.K. (1985) An association between a
lymphocyte antigen in sheep and the response to vaccination against the parasite
Trichostrongylus colubrijormis. International Journalfor Parasitology 15: 121-127.
OWEN, J.B. (1957) A study of the lactation and growth of hill sheep in their native environment
and under lowland conditions. Journal of Agricultural Science, Cambridge 48: 387-412.
PANARETIO, B.A.; CHAPMAN, R.E.: DOWNES, A.M.; REIS, PJ.; WALLACE, A.L.C.
(1975) Some effects of three glucocorticoid analogues on wool growth and their efficacy
as defleecing agents in sheep. Australian Journal of Experimental Agriculture and Animal
Husbandry 15: 193-202.
PARKINS, J.J.; HOLMES, P.H.: BREMNER, K.C. (1973) The pathophysiology of ovine
ostertagiasis: Some nitrogen balance and digestibility studies. Research in Veterinary
Science 14: 21-28.
PARNELL, I.W.; RAYSKI, C.; DUNN, A.M.; MACINTOSH, O.M. (1954) A survey of
helminths of Scottish hill sheep. Journal of Helminthology 28: 53-110.
9S
PAVER, H.; PARNELL, I.W.; MORGAN, D.O. (1955) Some factors influencing the seasonal
variation in wonn egg counts in Scottish hill sheep. Journal o/Comparative Pathology
65: 220-235.
POPPI, D.P. (1986) The use of isotopic methods in nutrition x parasite interactions. In
International symposium on the use of nuclear techniques in studies of animal production
and health in different environments. F.A.O. I.A.B.C. -Vienna, Austria 17-21 March 1986
pp 393-407.
POPPI, D.P.; McRAE, J.C.: CORRIGALL, W. (1981) Nitrogen digestion in sheep infected with
intestinal parasites. Proceedings 0/ the Nutrition Society 40: 116A.
POPPI, D.P.: McRAE, J.C.: BREWER, A.C.: DEWEY, P.J.S.; WALKER, A. (1985) Calcium
and phosphorus absorption in lambs exposed to Trichostrongylus colubriformis. Journal
of Comparative Pathology 95: 453-464.
PRESTON, J.M.; ALLONBY, E.W. (1978) The influence of breed on the susceptibility of sheep
and goats to a single experimental infection with Haemonchus conforms. Veterinary
Record 103: 509-512.
PRESTON, J.M.; ALLONBY, E.W. (1979) The influence of breed on susceptibility of sheep to
Haemonchus contortus infections in Kenya. Research in Veterinary Science 26: 134-139.
PRICHARD, R.K.; DONALD, A.D.; HENNESSEY, D.R. (1974) The effect of corticosteroid
treatment on the development of inhibited Ostertagia ostertagi larvae. Research in
Veterinary Science 16: 267-269.
REID, J.F.S.: ARMOUR, J. (1972) Seasonal fluctuations and inhibited development of gastro
intestinal nematodes of sheep. Research in Veterinary Science 13: 225-229.
REID, J.F.S.; ARMOUR, J. (1975a) Studies in Scottish hill sheep. Journalo/Comparative
Pathology 85: 163-170.
REID, J.F.S.: ARMOUR, J. (1975b) Seasonal variations in the gastro-intestinal nematode
populations of Scottish hill sheep. Research in Veterinary Science 18: 303-313.
RESTANI, R. (1965) Prove di bonifica igienico-saratodoria di allevannente ovini della Marsiea.
Veterinaria Italiana 16: 178-188.
REVERON, A.E.; TOPPS, J.H.; GELMAN, A.L. (1974) Mineral metabolism and skeletal
development oflambs infected with Trichostrongylus colubriformis. Research in
Veterinary Science 16: 310-319.
RITCHIE, J.D.S.; ANDERSON, N.: ARMOUR, J.; JARRETT, W.F.H.: JENNINGS, F.W.;
URQUHART, G.M. (1966) Experimental Ostertagia ostertag; infections in calves:
parasitology and pathogenesis of a single infection. American Journal 0/ Veterinary
Research 27: 659-667.
96
ROBINSON, J.J.; McHATIIE, I.; CALDERON CORTES, J.F.; THOMPSON, J.L. (1979)
Further studies on the response oflactating ewes to dietary protein. Animal Production 29:
257-269
ROBINSON, K.W. (1959) Adrenal cortical function in the pregnant sheep. Nature (London) 183:
690-691.
ROBERTSON, T.G.; ELLIOTI, D.C. (1966) Laboratory assessment of worm parasite
populations in sheep. New Zealand Journal of Agricultural Research 9: 350-358.
ROE, R.; SOUTHCOTI, W.H.; TURNER, H.N. (1959) Grazing management of native pastures
in New England region of New South Wales. I. Pasture and sheep production with special
reference to systems of grazing and internal parasite. Australian Journal of Agricultural
Research 10: 530-544.
ROSE, J.H. (1962) Further observations on the free-living stages of Ostertagia ostertagi in
cattle. Journal of Comparative Pathology 72: 11-18.
ROSE, AH.; SMALL, A.J. (1985) The distribution of the infective larvae of gastro-intestinal
nematodes in soil and on herbage and vertical migration of Trichostrongylus vitrinus
larvae through the soil. Journal of Helminthology 59: 127-135.
ROSEBY, F.B. (1973) Effects of Trichostrongylus colubrijormis (Nematoda) on sheep. I. Feed
Intake, digestion and utilisation. Australian Journal of Agricultural Research 24: 947-953.
ROSEBY, F.B. (1977) Effects of Trichostrongylus colubrijormis (Nematoda) on sheep. III.
Digesta flow and fermentation. Australian Journal of Agricultural Research 28: 155-164.
ROSS, D.A (1960) Staple strength. I. The measurement of staple strength. New Zealand
Journal of Agricultural Research 3: 503-525.
ROSS, D.A; MELKE, H.E. (1985) The processing significance of variations in staple strength
within and between fleeces. Proceedings of the 7th International Wool Textile Research
Conference. Tokyo 2: 45-54.
ROSS, J.G. (1963) Experimental infections of calves with the nematode parasite Ostertagia
ostertagi. Veterinary Record 75: 129-132.
ROSS, J.G. (1970) Investigations of acquired immunity to Trichostrongylus axei infections in
seven-month old lambs. British Veterinary Journal 126: 648-651.
ROWELL, R.G.; WALTERS, D.E. (1976) Analysing data with repeated observations on each
experimental unit. Journal of Agricultural Science, Cambridge 87: 423-432.
RUSSELL, D.A; CASTRO, G.A. (1979) Physiological characterization of a biphasic immune
response to Trichinella spiralis in rats. Journal of Infectious Diseases 139: 304-312.
SALISBURY, J.R.; ARUNDEL, J.H. (1970) Peri-parturient deposition of nematode eggs by
ewes and residual pasture contamination as sources of infection for lambs. Australian
Veterinary Journal 46: 523-529.

97
SCHAD, O.A. (1977) The role of arrested development in the regulation of nematode
populations. In Regulation of parasite populations (Editor Esch, O.W.). Academic press,
New York. pp 111p167.
SCHAD, O.A.: ANDERSON, R.M. (1985) Predisposition to hookworm infections in man.
Science 228: 1537-1540.
SHEARER, O.D; STEWART, J. (1933) The effects of nematode infestations on the metabolism
of the host. Part III. Effects on mineral nutrition. Report of the director of the institute of
animal pathology, University of Cambridge 3: 87-129.
SKINNER, W.D.: TODD, K.S. (1980) Lateral migration of Haemonchus contortus laIVae on
pasture. American Journal of Veterinary Research 41: 395p398.
SMEAL, M.O.; DONALD, A.D. (1981) Effects on inhibition of development of the transfer of
Ostertagia ostertagi between geographical regions of Australia. Parasitology 82: 389p399.
SMEAL, M.O.: DONALD, A.D. (1982) Inhibition of development of Ostertagia ostertagi -
effect of temperature on the infective laNal stage. Parasitology 85: 27p32.
SMEAL, M.O.: FRASER, O.C.: ROBINSON, 0.0. (1980) Seasonal changes in the structure of
nematode populations of cattle in New South Wales in relation to inhibited laIVal
development. Australian Veterinary Journal 56: 80-86.
SMEAL, M.O.; HOTSON,I.K.; MYLREA, P.1.; JACKSON, A.R.; CAMPBELL, N.J.; KIRTON,
H.C. (1977) Studies on nematode infections of beef cattle in New South Wales.
Australian Veterinary Journal 56: 74-79.
SMITH, W.D.; JACKSON, F.; JACKSON, E.; WILLIAMS, J.; WILLADSEN, S.M.; FEHILLY,
C.B. (1984) Resistance to Haemonchus contortus transferred between genetically
histocompatible sheep by immune lymphocytes. Research in Veterinary Science 37: 199p
204.
SOMERVILLE, R.I. (1953) Development of Ostertagia circumcincta in the abomasum of the
sheep. Nature (London) 171: 482-483.
SOMERVILLE, R.I. (1954) The histotropic phase of the nematode parasite Ostertagia
circumcincta. Australian Journal of Agricultural Research 5: 130-140.
SOULSBY, E.1.L. (1957) Studies on the serological response in sheep to naturally acquired
gastro-intestinal nematodes. II. Response in a low growth flock. Journal of Helminthology
31: 145-160.
SOULSBY, E.J.L. (1966) The mechanisms of immunity to gastro-intestinal nematodes. In
Biology of Parasites (Editor Soulsby, E.1.L.). Academic Press, New York. pp 255-276.
SOULSBY, E.1.L. (1979) The immune system and helminth infection in domestic species.
Advances in Veterinary Science and Comparative Medicine 23: 71-97.

98
SOUTHCOIT, W.H.; HEATH, D.D; LANGLANDS, J.P. (1967) Relationship of nematode
infection to efficiency of wool production. Journal of the British Grasslands Society 22:
117-120.
SOUTHCOIT, W.H.; MAJOR, G.W.; BARGER, LA. (1975) Seasonal pasture contamination
and availability of nematodes for grazing sheep. Australian Journal of Agricultural
Research 27: 277-286.
SPEDDING, C.R.W.; BROWN, T.H. (1957) A study of sub-clinical worm infestations in sheep.
Part III. The effect on wool production. Journal of Agricultural Science, Cambridge 49:
229-233.
STEEL, J.W. (1978) Inter-relationships between gastrointestinal helminth infection, nutrition and
impaired productivity in the ruminant In Recent Advances in Animal Nutrition (Editor
Farrell, DJ.). University of New England Press, Armidale, NSW pp 98-109.
STEEL, J.W.; WAGLAND, B.M.; DINEEN, J.K (1984) Effect of plane of nutrition on
development of resistance to Trichostrongylus colubriformis in weaner lambs. Abstracts
joint conference of New Zealand Society for Parasitology and Australian Society for
Parasitology, Christchurch 27-30 August, 1984, New Zealand pg 27.
STEEL, J.W.; JONES, W.O; SYMONS, L.E.A. (1982) Effects of concurrent infection of
Trichostrongylus colubriformis on the productivity and physiological and metabolic
responses of lambs infected with Ostertagia circumcincta. Australian Journal of
Agricultural Research 33: 131-140.
STEEL, J.W.; HOGAN, J.P. (1972) Pathophysiology of helminth infections. Digestive
physiology and metabolism in ruminants. Annual Report C.S.I.R.O. Division of Animal
Health. pp 75.
STEEL,J.W.; SYMONS, L.E.A.; JONES, W.O. (1980) Effects oflarval intake on the
productivity and physiological and metabolic response oflambs infected with
Trichostrongylus colubriformis. Australian Journal of Agricultural Research 31: 821-838.
STEVENS, P.G.; WRIGHT, G.M. (1952) Some variations in the fleece of Romney Marsh stud
ewes. Proceedings of the New Zealand Society of Animal Production 11: 18-22.
STEWART, D.F. (1950) Studies on resistance of sheep to infestation with Haemonchus
contortus and Trichostrongylus spp. and on the immunological reactions of sheep exposed
to infestation. IV. The antibody response to natural infestation in grazing sheep and the
'self cure' phenomenon. Australian Journal of Agricultural Research 1: 427-439.
STEWART, D.F. (1953) Studies on the resistance of sheep to infestation with Haemonchus
contortus and Trichostrongylus spp on the immunological reactions of sheep exposed to
infestations. Australian Journal of Agricultural Research 4: 100-117.
99
STEWART, D.P. (1955) Self-cure in nematode infestations in sheep. Nature (London) 176:
1273-1274.
STOLL, N.R (1929) Studies with the strongyloid nematode Haemonchus contortus. I. Acquired
resistance of hosts under natural reinfection conditions out of doors. American Journal of
Hygiene 10: 384-418.
SUMNER, R.M.W.; WICKHAM, G.H. (1969) Some effects of an increased stocking level on
wool growth. Proceedings of the New Zealand Society of Animal Production 29: 208.
SYKES, A.R (1978) The effect of subclinical parasitism in sheep. Veterinary Record 102: 32-
34.
SYKES, A.R (1983) Effects of parasitism on metabolism in the sheep. In Sheep Production
(Editor Haresign, W.). 35th Nottingham University Easter School, Butterworths, London
pp 317-334.
SYKES, A.R.; COOP, R.L. (1976) Intake and utilization of food by growing lambs with parasitic
damage to the small intestine caused by daily dosing with Trichostrongylus colubriformis
larvae. Journal of Agricultural Science, Cambridge 86: 507-515.
SYKES, A.R; COOP, R.L. (1977) Intake and utilization of food by growing sheep with
abomasal damage caused by daily dosing with Ostertagia circumcincta larvae. Journal of
Agricultural Science, Cambridge 88: 671-677.
SYKES, A.R; JUMA, M.H. (1984) Effect of chronic experimental infection with Ostertagia
circumcincta and anthelmintic therapy on the performance of lactating sheep at pasture.
New Zealand Journal of Experimental Agriculture 12: 243-249 .
. SYKES, A.R; COOP, RL.; ANGUS, K.W. (1975) Experimental production of osteoporosis in
growing lambs by continuous dosing with Trichostrongylus colubriformis larvae. Journal
of Comparative Pathology 85: 549-559.
SYKES, AR; COOP, RL.; ANGUS, K.W. (1977) The influence of chronic Ostertagia
c irc umcincta infections on the skeleton of growing sheep. Journal of Comparative
Pathology 87: 521-529.
SYKES, AR.; COOP, R.L.; ANGUS, K.W. (1979) Chronic infection with Trichostrongylus
vitrinus in sheep. Some effects on food utilisation, skeletal growth and certain serum
constituents. Research in Veterinary Science 26: 372-377.
SYKES, A.R; POPPI, D.P.; ELLIOTT, D.C. (1988) Effect of concurrent infection with
Ostertagia circumcincta and Trichostrongylus colubriformis on the performance of
growing lambs consuming fresh herbage. Journal of Agricultural Science, Cambridge
110: 532-541.
SYMONS, L.E.A. (1985) Anorexia: Occurrence, pathophysiology and possible causes in
parasitic infections. Advances in Parasitology 24: 103-133.

100
SYMONS, L.E.A.: HENNESSY, D.R (1981) Cholecystokinin and anorexia in sheep infected by
the intestinal nematode Trichostrongylus colubrlformis. International Journalfor
Parasitology 11: 55-58.
SYMONS, L.E.A.: JONES, W.O. (1970) Nematospiroides dubius, Nippostrongylus brasiliensis
and Trichostrongylus colubrtjormis: protein digestion in infected animals. Experimental
Parasitology 27: 496-506.
SYMONS, L.E.A.: STEEL, J.W.; JONES, W.O. (1981) Effect oflevel oflarval intake on the
productivity and physiological and metabolic response oflambs infected with Ostertagia
circumcincta. Australian Journal of Agricultural Research 32: 139-148.
TETLEY, J.H. (1949) Rhythms in nematode parasitism of sheep. New Zealand Department
Scientific Industrial Research bulletin No 96 214 p.
THOMAS, RJ.; ALI,D.A. (1983) The effect of Haemonchus contortus infection on the pregnant
and lactating ewe. International Journalfor Parasitology 13: 393-398.
THOMAS, RJ.; BOAG, B. (1973) Epidemiological studies on the gastro-intestinal nematode
parasites of sheep. The control of infection in lambs on contaminated pasture. Research in
Veterinary Science 15: 238-249.
THOMPSON, RL.; EGEN, J.K.: McLAUGHLIN, J.W. (1978) The influence ofintemal
parasites upon growth and productivity of weaner sheep. Proceedings of the Australian
Society of Animal Production 12: 274.
THRELKELD, W.L. (1934) The life history of Ostertagia circumcincta. Virginia Agricultural
Experimental Station Technical Bulletin 52: 1-24 .
. TITCHEN, D.A. (1982) Hormonal and physiological changes in helminth infestations. In
Biology and Control of Endoparasites (Editors Symons, L.E.A: Donald, A.D & Dineen,
J.K.). Academic press, New York pp 257-275.
TRIPATHI, J.C. (1974) Longevity and migration of infective larvae of some common nematodes
of goats in different types of soil. Indian Journal of Animal Science 44: 104-108.
UBER, C.L.; ROTH, RL; LEVY, D.A. (1980) Expulsion of Nippostrongylus brasiliensis by
mice deficient in mast cells. Nature (London) 287: 226-228.
URQUHART, G.M.; JARRETT, W.P.H.; MULLIGAN, W. (1962) Helminth immunity.
Advances in Veterinary Science 7: 87-129.
URQUHART, G.M.: JARRETT, P. W.H.; JENNINGS, P.W.; McINTYRE, W.I.M.:
MULLIGAN, W.; SHARP, N.C.C. (1966) Immunity to Haemonchus contortus infections.
Relationship between age and successful vaccination with irradiated larvae. American
Journal of Veterinary Research 27: 1741-1645.
VEGORS, H.H. (1960) The effect offorage height on the development of cattle nematode larvae.
Journal of Parasitology 46: 39-40.
101
VLASSOFF, A. (1973) Seasonal incidence of infective Trichostrongyle larvae on pasture grazed
by lambs. New Zealand Journal oj Experimental Agriculture 1: 293-301.
VLASSOFF, A. (1976) Seasonal incidence of infective Trichostrongyle larvae on pasture grazed
by lambs: The contribution of the ewe and the role of residual pasture infestation as a
source of infection to the lamb. New Zealand Journal oj Experimental Agriculture 4: 281-
284.
VLASSOFF, A. (1982) Biology and population dynamics of the free-living stages of
gastrointestinal nematodes of sheep. In Control of internal parasites in sheep (Editor Ross,
A.D.). Animals Industry Workshop, Lincoln college pp 11-20.
VLASSOFF, A.; BRUNSDON, R.V. (1981) Control of gastro-intestinal nematodes. Advantages
of preventive over a protective anthelmintic drenching programme for lambs on pasture.
New Zealand Journal oj Experimental Agriculture 9: 221-225.
W AGLAND, B.M.; DINEEN, J.K. (1967) The dynamics of the host-parasite relationship. VI.
Regeneration of the immune response in sheep infected with Haemonchus contortus.
Parasitology 57: 59-65.
W AKELIN, D. (1980) Genetic control of immunologically mediated resistance to helminth
infections. In Genetic Control of Natural Resistance to Infection and Malignancy (Editors
Sleamene, E.; Kanshawn, P.A.L. & Landy, M.). Academic press, pp 55-66.
WAKELIN, D. (1986) The role of the immune response in helminth population regulation. In
Parasitology- Quo Vadit? Proceedings of the Sixth International Congress for Parasitology
(Editor Howell, M.J.). Australian academy of science, Canberra 1986 pp 549-557 .
. WALLER, P.J.; THOMAS, R.J. (1978a) Nematode parasitism in sheep in North-East England:
The epidemiology of Ostertagia species. International Journaljor Parasitology 8: 275-
283.
WALLER, P.J.; THOMAS, R.J. (1978b) Host-induced effects on the morphology of Ostertagia
circumcincta in grazing sheep. International Journaljor Parasitology 8: 365-370.
WALLER, P.J.; THOMAS, R.J. (1981) The natural regulation of Trichostrongylus spp
populations in young grazing sheep. Veterinary Parasitology 9: 47-55.
WALLER, P.J.; DONALD, A.D.; DOBSON, R.J. (1981) Arrested development of intestinal
Trichostrongylus spp in grazing sheep and seasonal changes in the relative abundance T.
colubrijormis and T. vitrinus. Research in Veterinary Science 30: 213-216.
WALLER, P.J.; AXELSEN, A.; DONALD, A.D.; MORELY, F.H.W.; DOBSON, R.J.;
DONNELLY, J.R. (1978a) Effect of helminth infection and nutritional factors on growth
of lambs and wool production of ewes. Proceedings oj the Australian Society jor Animal
Production 12: 275.
102
WALLER, P.I.; AXELSEN, A.; DONALD, A.D.; MORBLY .. F.H.W.; DOBSON, R.J.;
DONNELLY, lR. (1978b) Effects of helminth infection on the pre-weaning production of
ewes and lambs: Comparison between safe and contaminated pasture. Australian
Veterinary Journal 64: 357-362.
WALLER, P.I.; DOBSON, R.I.; DONALD, A.D; THOMAS, R.I. (1981) Populations of
strongyloid nematodes in pastures: comparison between direct pasture sampling and tracer
lambs as estimators oflarval abundance. International Journal Parasitology 8: 477-491.
WATKINS, A.RJ.; FERNANDO, M.A. (1984) Arrested development of the rabbit stomach
worm Obeliscoides cuniculi: manipulation of the ability to arrest through process of
selection. International Journal Parasitology 14: 359-570.
WILSON, A.L.; MORGAN, D.O.; PARNELL, I.W.; RAYSKI, C. (1953) Helminthological
investigations on an Argyleshire hill farm. British Veterinary Journal 109: 179-190.
WILSON, W.D.; FIELD, A.C. (1983) Absorption and secretion of calcium and phosphorus in
the alimentary tract oflambs infected with daily doses of Trichostrongylus colubriformis
or Ostertagia circumcincta. Journal of Comparative Pathology 61: 65-73.
WINDON, R.G.; DINEEN, lK (1981) The effect of selection of both sire and dam on the
response of Fl generation lambs to vaccination with irradiated Trichostrongylus
colubriformis larvae. International Journal for Parasttology 11: 11-18
WINDON, R.O.; DINEEN, lK.; KELLY, lD. (1980) The segregation oflambs into responder
and non-responder: response to vaccination with irradiated Trichostrongylus colubriformis
larvae before weaning. International Journal Parasitology 10: 65-73.
YAKOOB, A.; HOLMES, P.H.; ARMOUR, 1 (1983) Pathophysiology of gastrointestinal
trichostrongyles in sheep: plasma losses and changes in plasma pepsinogen levels
associated with parasitic challenge of immune animals. Research in Veterinary Science
34: 305-309.
YOUNG, R.R.; ANDERSON, N. (1981) The ecology of the free-living stages of Ostertagia
ostertagi in a winter rainfall region. Australian Journal of Agricultural Research 32: 371-
388.
YOUNG, R.R.; TRAJSTMAN, A.C. (1980) A rapid technique for the recovery of strongyloid
infective larvae from pasture and soU samples. Parasitology 80: 425-431.
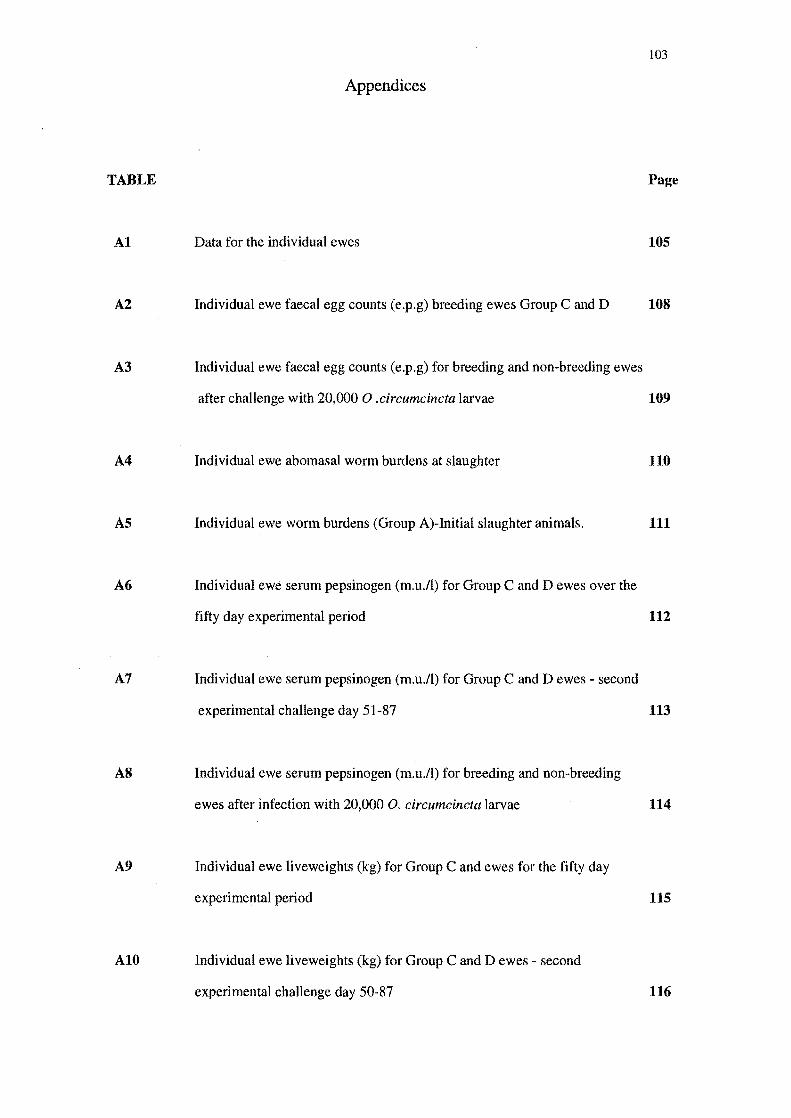
103
Appendices
TABLE Page
A1 Data for the individual ewes 105
A2 Individual ewe faecal egg counts (e.p.g) breeding ewes Group C and D 108
A3 Individual ewe faecal egg counts (e.p.g) for breeding and non-breeding ewes
after challenge with 20,000 0 .circumcincta larvae 109
A4 Individual ewe abomasal worm burdens at slaughter 110
A5 Individual ewe worm burdens (Group A)-Initial slaughter animals. 111
A6 Individual ewe serum pepsinogen (m.u.!l) for Group C and D ewes over the
fifty day experimental period 112
A7 Individual ewe serum pepsinogen (m.u.!l) for Group C and D ewes - second
experimental challenge day 51-87 113
A8 Individual ewe serum pepsinogen (m.u.!l) for breeding and non-breeding
ewes after infection with 20,000 O. circumcincta larvae
A9 Individual ewe liveweights (kg) for Group C and ewes for the fifty day
experimental period
A10 Individual ewe liveweights (kg) for Group C and D ewes - second
experimental challenge day 50-87
114
115
116
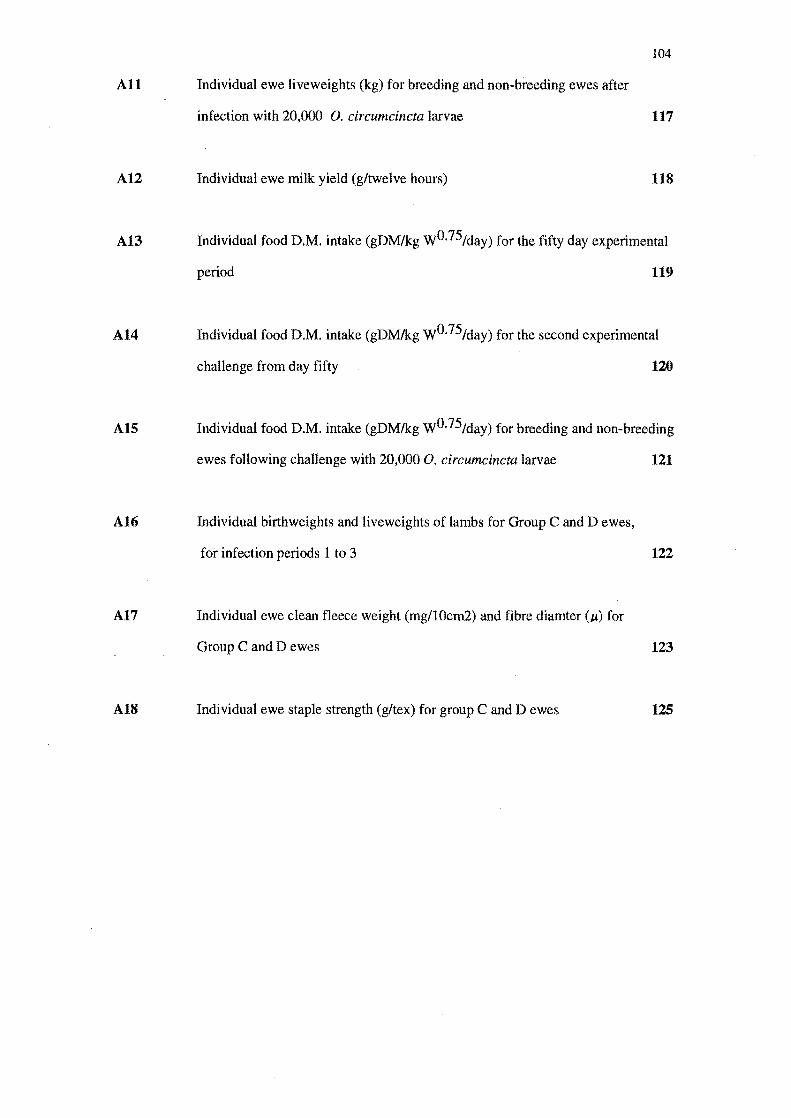
All Individual ewe liveweights (kg) for breeding and non-breeding ewes after
infection with 20,000 O. circumcincta larvae
A12 Individual ewe milk yield (g/twelve hours)
104
117
118
A13 Individual food D.M. intake (gDM/kg WO.75/day) for the fifty day experimental
period 119
A14 Individual food D.M. intake (gDMlkg WO.75/day) for the second experimental
challenge from day fifty 120
A15 Individual food D.M. intake (gDMlkg WO.75/day) for breeding and non-breeding
ewes following challenge with 20,000 O. circumcincta larvae 121
A16 Individual birthweights and liveweights of lambs for Group C and D ewes,
for infection periods 1 to 3
A17 Individual ewe clean fleece weight (mg/lOcm2) and fibre diamter (Jl) for
Group C and D ewes
A18 Individual ewe staple strength (g/tex) for group C and D ewes
122
123
125
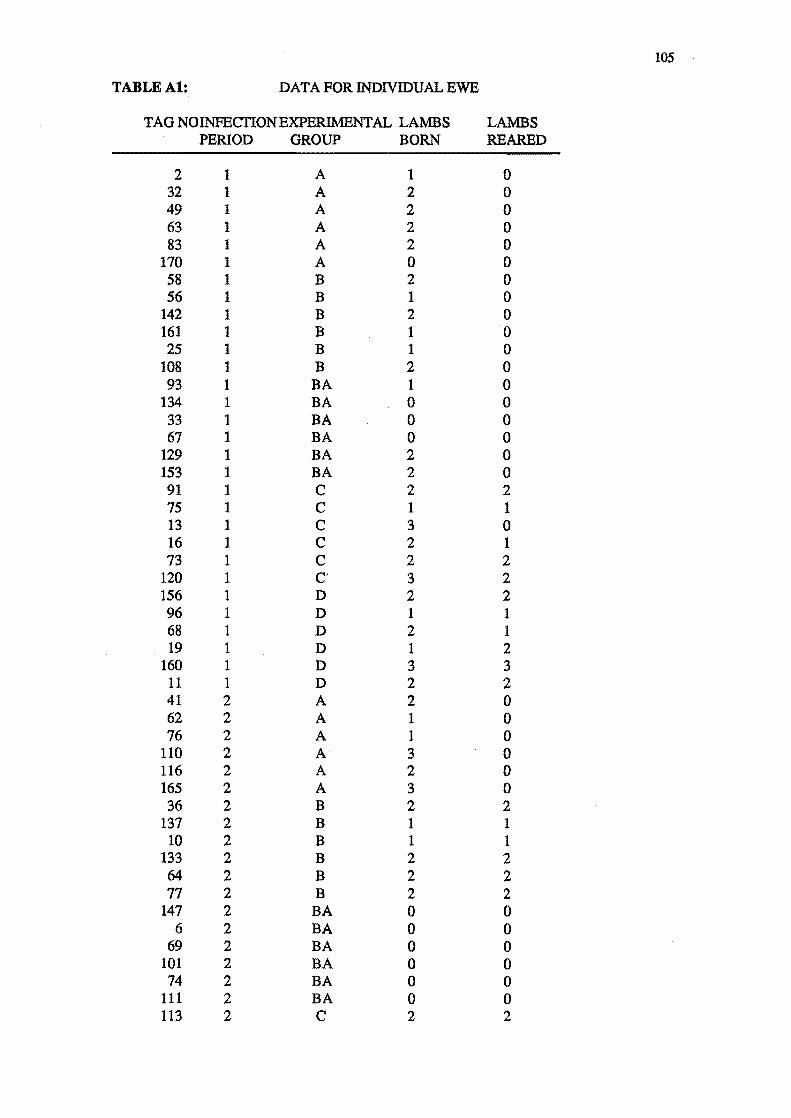
105
TABLEA1: DATA FOR INDIVIDUAL EWE
TAG NOINFECflONEXPERIMENTAL LAMBS LAMBS PERIOD GROUP BORN REARED
2 1 A 1 0 32 1 A 2 0 49 1 A 2 0 63 1 A 2 0 83 1 A 2 0
170 1 A 0 0 58 1 B 2 0 56 1 B 1 0
142 1 B 2 0 161 1 B 1 0 25 1 B 1 0
108 1 B 2 0 93 1 BA 1 0
134 1 BA 0 0 33 1 BA 0 0 67 1 BA 0 0
129 1 BA 2 0 153 1 BA 2 0 91 1 C 2 2 75 1 C 1 1 13 1 C 3 0 16 1 C 2 1 73 1 C 2 2
120 1 C' 3 2 156 1 D 2 2 96 1 D 1 1 68 1 D 2 1 19 1 D 1 2
160 1 D 3 3 11 1 D 2 2 41 2 A 2 0 62 2 A 1 0 76 2 A 1 0
110 2 A 3 0 116 2 A 2 0 165 2 A 3 0 36 2 B 2 2
137 2 B 1 1 10 2 B 1 1
133 2 B 2 2 64 2 B 2 2 77 2 B 2 2
147 2 BA 0 0 6 2 BA 0 0
69 2 BA 0 0 101 2 BA 0 0 74 2 BA 0 0
111 2 BA 0 0 113 2 C 2 2
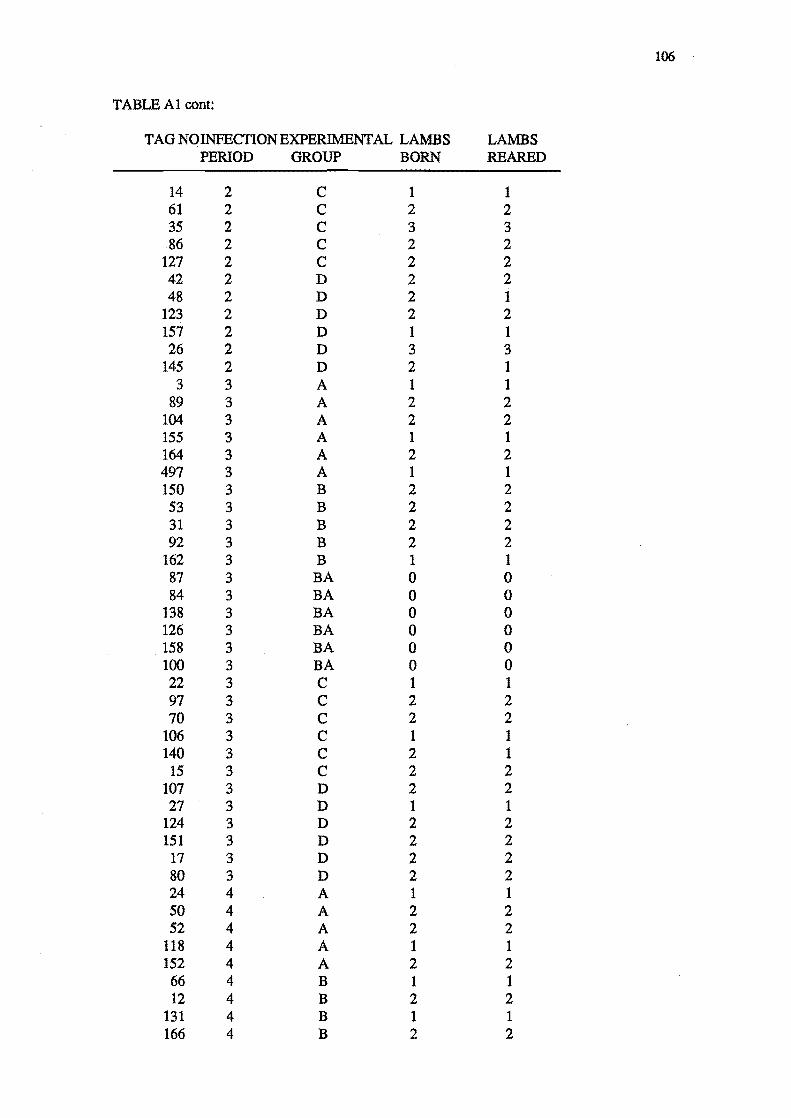
106
TABLE Al cont:
TAG NOINFECfIONEXPERIMENTAL LAMBS LAMBS PERIOD GROUP BORN REARED
14 2 C 1 1 61 2 C 2 2 35 2 C 3 3 86 2 C 2 2
127 2 C 2 2 42 2 D 2 2 48 2 D 2 1
123 2 D 2 2 157 2 D 1 1 26 2 D 3 3
145 2 D 2 1 3 3 A 1 1
89 3 A 2 2 104 3 A 2 2 155 3 A 1 1 164 3 A 2 2 497 3 A 1 1 150 3 B 2 2 53 3 B 2 2 31 3 B 2 2 92 3 B 2 2
162 3 B 1 1 87 3 BA 0 0 84 3 BA 0 0
138 3 BA 0 0 126 3 BA 0 0 158 3 BA 0 0 100 3 BA 0 0 22 3 C 1 1 97 3 C 2 2 70 3 C 2 2
106 3 C 1 1 140 3 C 2 1
15 3 C 2 2 107 3 D 2 2 27 3 D 1 1
124 3 D 2 2 151 3 D 2 2
17 3 D 2 2 80 3 D 2 2 24 4 A 1 1 50 4 A 2 2 52 4 A 2 2
118 4 A 1 1 152 4 A 2 2 66 4 B 1 1 12 4 B 2 2
131 4 B 1 1 166 4 B 2 2
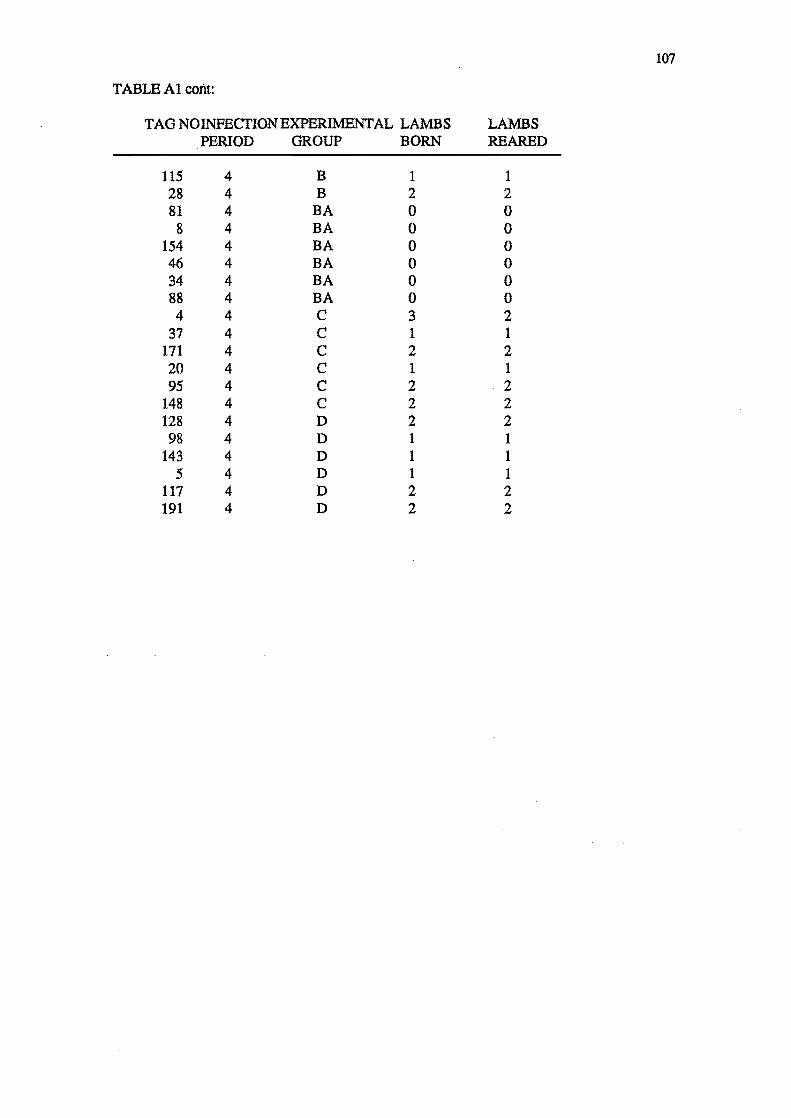
107
TABLE Al cont:
TAG NOlNFECfIONEXPERIMENTAL LAMBS LAMBS PERIOD GROUP BORN REARED
115 4 B 1 1 28 4 B 2 2 81 4 BA 0 0
8 4 BA 0 0 154 4 BA 0 0 46 4 BA 0 0 34 4 BA 0 0 88 4 BA 0 0 4 4 C 3 2
37 4 C 1 1 171 4 C 2 2 20 4 C 1 1 95 4 C 2 2
148 4 C 2 2 128 4 D 2 2 98 4 D 1 1
143 4 D 1 1 5 4 D 1 1
117 4 D 2 2 191 4 D 2 2

108
TABLEA2: INDIVIDUAL EWE FAECAL EGG COUNTS (E.Q.g} BREEDING EWES GROUP C AND D
WEEKS OF INFECTION EWENol 1 2 3 4 5 6 7 8 9 10 11
1C 156 0 0 0 0 0 0 0 0 0 200 0 1C 96 0 0 0 0 0 0 0 0 0 200 300 1C 68 0 0 0 0 0 0 100 0 0 0 200 1C 19 0 0 0 200 0 0 0 0 0 0 0 1C 160 0 0 0 0 0 0 0 0 0 200 2000 1C 11 0 0 0 0 0 0 100 0 0 200 400 1D 91 0 0 0 0 0 200 0 0 0 0 0 1D 75 0 0 0 0 0 0 0 0 0 0 0 1D 13 0 0 1300 0 100 1000 800 0 0 0 0 1D 16 0 0 0 200 200 700 100 0 0 0 0 1D 73 0 100 800 2700 2500 3800 3000 500 0 0 0 1D 120 0 0 0 500 0 300 0 0 0 0 0 2C 42 0 0 0 0 0 0 0 0 0 0 0 2C 48 0 0 0 0 0 0 0 0 0 0 0 2C 123 0 0 0 0 0 0 0 0 0 0 0 2C 157 0 0 0 0 0 0 0 0 0 0 0 2C 26 0 0 0 0 0 0 0 0 0 0 0 2C 145 0 0 0 0 0 0 0 0 0 0 0 2D 113 0 0 200 200 0 0 600 0 0 0 0 2D 14 0 0 0 300 100 200 300 100 0 0 0 2D 127 0 0 500 300 1300 800 100 100 0 0 0 2D 35 0 0 0 0 400 1000 700 0 0 0 0 2D 86 0 0 0 0 0 300 0 0 0 0 0 2D 61 0 0 0 0 0 0 0 0 0 0 0 3C 107 0 0 0 0 0 0 0 0 0 0 0 3C 27 0 0 0 0 0 0 0 0 0 0 0 3C 124 0 0 0 0 0 0 0 0 0 0 0 3C 151 0 0 0 0 0 0 0 0 0 0 0 3C 17 0 0 0 0 0 0 0 0 0 0 0 3C 80 0 0 0 0 0 0 0 0 0 0 0 3D 22 0 0 0 0 0 0 0 0 0 0 0 3D 97 0 0 0 0 DIED 3D 70 0 0 0 0 0 0 0 0 0 0 0 -3D 106 0 0 0 0 400 0 0 0 0 0 0 3D 140 0 0 0 0 0 0 0 0 0 0 0 3D 15 0 0 0 0 0 400 100 0 0 0 0 4C 128 0 0 0 0 0 0 0 0 0 0 0 4C 98 0 0 0 0 0 0 0 0 0 0 0 4C 143 0 0 0 0 0 0 0 0 0 0 0 4C 5 0 0 0 0 0 0 0 0 0 0 0 4C 117 0 0 0 0 0 0 0 0 0 0 0 4C 191 0 0 0 0 0 0 0 0 0 0 0 4D 0 0 0 0 0 0 0 0 0 0 0 4D 37 0 0 0 0 0 0 0 0 0 0 0 4D 181 0 0 0 0 0 0 0 0 0 0 0 4D 20 0 0 0 0 0 0 0 0 0 0 0 4D 98 0 0 0 0 0 0 0 0 0 0 0 4D 119 0 0 0 0 0 0 0 0 0 0 0
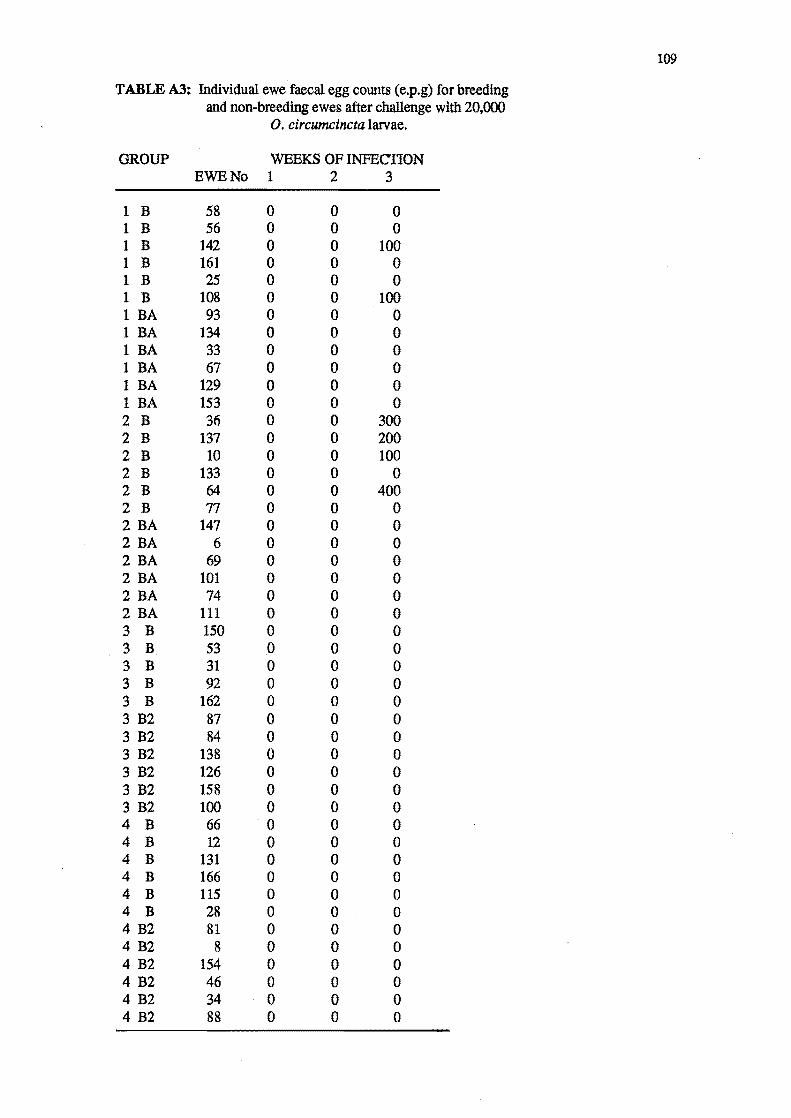
109
TABLE A3: Individual ewe faecal egg counts (e.p.g) for breeding and non-breeding ewes after challenge with 20,000
O. circumcincta larvae.
GROUP WEEKS OF INFECI10N EWE No 1 2 3
1 B 58 0 0 0 1 B 56 0 0 0 1 B 142 0 0 100 1 B 161 0 0 0 1 B 25 0 0 0 1 B 108 0 0 100 1 BA 93 0 0 0 1 BA 134 0 0 0 1 BA 33 0 0 0 1 BA 67 0 0 0 1 BA 129 0 0 0 1 BA 153 0 0 0 2 B 36 0 0 300 2 B 137 0 0 200 2 B 10 0 0 100 2 B 133 0 0 0 2 B 64 0 0 400 2 B 77 0 0 0 2 BA 147 0 0 0 2 BA 6 0 0 0 2 BA 69 0 0 0 2 BA 101 0 0 0 2 BA 74 0 0 0 2 BA 111 0 0 0 3 B 150 0 0 0 3 B 53 0 0 0 3 B 31 0 0 0 3 B 92 0 0 0 3 B 162 0 0 0 3 B2 87 0 0 0 3 B2 84 0 0 0 3 B2 138 0 0 0 3 B2 126 0 0 0 3 B2 158 0 0 0 3 B2 100 0 0 0 4 B 66 ·0 0 0 4 B 12 0 0 0 4 B 131 0 0 0 4 B 166 0 0 0 4 B 115 0 0 0 4 B 28 0 0 0 4 B2 81 0 0 0 4 B2 8 0 0 0 4 B2 154 0 0 0 4 B2 46 0 0 0 4 B2 34 0 0 0 4 B2 88 0 0 0
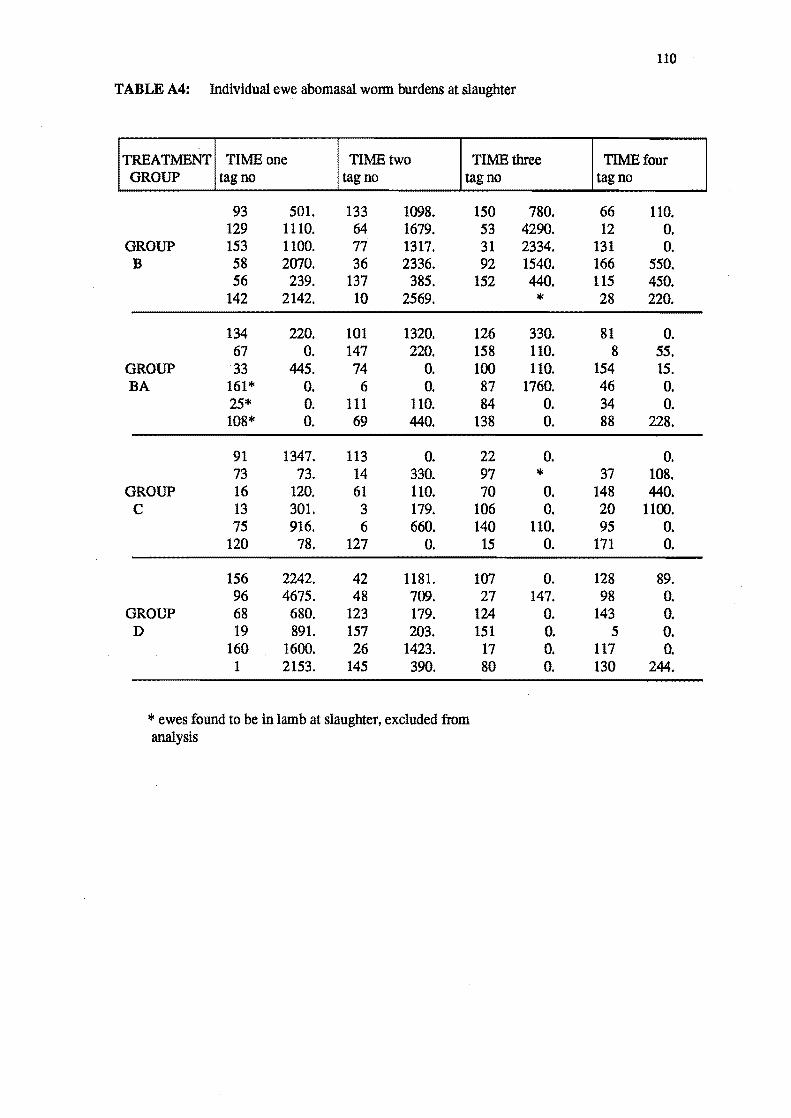
TABLE A4: Individual ewe abomasal wonn burdens at slaughter
TREATMENT TIME one TIME two TIME three GROUP tag no tag no tag no
93 501. 133 1098. 129 1110. 64 1679.
GROUP 153 1100. 77 1317. B 58 2070. 36 2336.
56 239. 137 385. 142 2142. 10 2569.
134 220. 101 1320. 67 O. 147 220.
GROUP 33 445. 74 O. BA 161* O. 6 O.
25* O. 111 110. 108* O. 69 440.
91 1347. 113 O. 73 73. 14 330.
GROUP 16 120. 61 110. e 13 301. 3 179.
75 916. 6 660. 120 78. 127 O.
156 2242. 42 1181. 96 4675. 48 709.
GROUP 68 680. 123 179. D 19 891. 157 203.
160 1600. 26 1423. 1 2153. 145 390.
... ewes found to be in lamb at slaughter, excluded from analysis
150 53 31 92
152
126 158 100 87 84
138
22 97 70
106 140
15
107 27
124 151
17 80
780. 4290. 2334. 1540. 440.
Ii<
330. 110. 110.
1760. O. O.
O. Ii<
O. O.
110. O.
O. 147.
O. O. O. O.
110
TIME four tag no
66 110. 12 O.
131 O. 166 550. 115 450. 28 220.
81 O. 8 55.
154 15. 46 O. 34 O. 88 228.
O. 37 108.
148 440. 20 1100. 95 O.
171 O.
128 89. 98 O.
143 O. 5 O.
117 O. 130 244.

TABLE AS: Individual ewe wonn burdens (Group A) -Initial slaughter animals
TREATMEN r'TAG ABOMASUM SMALL GROUP NO INTESTINE
1A 49 1032 220 1A 83 3308 110 1A 170 269 22 1A 2 276 1100 1A 63 5424 2460 1A 32 220 110 2A 41 1218 0 2A 62 5395 164 2A 76 1940 770 2A 110 2510 582 2A 116 349 0 2A 165 3090 770 3A 3 110 0 3A 89 4145 1100 3A 104 2998 1210 3A 155 149 110 3A 164 4484 349 3A 497 8060 1210 4A 24 9091 573 4A 50 9465 1650 4A 52 11197 220 4A 118 14362 990 4A 152 6334 238
111
TOTAL WORM BURDEl'
1252 4408 292
1376 7884 330
1218 5559 2710 3092 349
3860 110
5245 4208 259
4835 9270 9664
11115 11417 15352 6572

112
TABLE A6: Individual ewe serum pepsinogen (m.u /1) for Group C and D ewes over the fifty day experimental period
GROUP WEEKSOFINFECflON EWE No 0 1 2 3 4 5 6 7
1C 91 28.7 127.4 127.4 257.9 127.1 132.5 100.9 305.8 1C 75 532.3 336.4 636.6 439.8 427.3 533.2 480.7 1C 13 310.1 61.0 90.9 221.1 241.7 127.1 67.3 46.1 1C 16 100.8 56.1 137.6 145.3 158.0 140.2 1C 73 578.9 259.1 262.9 475.9 370.0 509.5 649.0 569.3 1C 120 351.6 491.0 300.2 706.0 1037.0 925.2 825.8 1085.7 1D 156 111.1 15.3 27.4 12.4 17.4 13.7 43.6 66.0 1D 96 418.6 155.5 132.1 104.6 170.7 109.6 124.6 191.8 1D 68 307.5 152.9 93.4 90.9 138.3 68.5 71.0 97.2 1D 19 * 148.2 150.7 69.8 206.6 42.4 63.5 133.3 1D 60 183.5 28.7 34.9 38.7 28.7 47.3 46.1 46.1 1D 11 173.1 47.3 38.6 29.9 29.9 48.6 62.3 54.8 2C 113 239.6 484.5 62.0 89.2 163.1 168.2 117.2 152.5 2C 14 112.1 137.0 153.8 240.3 178.3 247.2 301.1 286.9 2C 61 78.8 563.2 474.0 242.1 188.7 180.9 369.6 313.5 2C 35 55.6 135.1 181.0 234.5 160.2 183.5 113.7 2C 86 98.2 211.5 211.9 214.5 344.1 169.3 215.2 231.3 2C 127 71.1 71.1 104.5 156.3 293.1 73.7 142.7 49.1 2D 42 112.4 73.7 86.6 65.9 95.6 72.8 321.1 165.4 2D 48 130.5 118.9 112.4 67.2 93.0 120.0 67.2 80.1 2D 123 32.3 42.7 36.4 23.3 24.6 31.0 48.4 23.3 2D 157 139.5 106.0 .125.3 149.9 125.3 78.8 86.6 86.6 2D 26 81.4 69.8 113.7 74.9 49.1 37.5 42.6 98.2 2D 145 28.4 36.2 29.7 297.2 22.0 47.8 104.7 20.7 3C 22 162.8 191.2 258.4 573.7 317.9 597.0 315.3 1/1
3C 97 217.1 217.1 395.4 1248.2 Died 3C 70 * 108.5 232.6 196.4 268.8 253.3 338.5 1/1
3C 106 155.0 235.2 377.3 625.4 617.6 622.8 625.4 1/1
3C 140 219.7 361.8 609.9 602.1 542.7 416.1 330.8 1/1
3C 15 271.3 211.9 330.8 418.6 121.5 147.3 237.7 1/1
3D 107 129.2 215.9 137.0 98.2 90.5 188.7 1/1
3D 27 139.6 108.5 341.1 279.1 204.2 188.6 204.2 1/1
3D 124 82.7 137.0 173.1 191.2 144.7 121.5 1/1
3D 51 351.5 377.3 134.4 268.8 245.5 217.1 235.2 1/1
3D 17 211.9 155.1 155.1 232.6 230.0 377.3 1/1
3D 80 95.6 108.5 152.5 178.3 80.1 72.4 1/1
4C 4 163.7 482.4 343.7 284.3 344.6 213.3 202.4 4C 37 68.9 101.2 40.9 43.1 62.5 66.8 4C 181 252.0 118.4 263.6 178.7 213.2 273.5 4C 20 120.6 144.5 146.4 422.1 228.3 239.0 260.6 4C 95 58.1 125.0 84.0 146.4 198.1 150.7 109.8 4C 344 189.5 400.6 495.3 499.6 869.7 299.3 62.5 4D 128 107.7 45.2 187.4 36.6 36.6 193.8 4D 98 241.2 152.9 144.3 96.9 168.0 90.5 124.9 4D 143 66.8 88.3 68.9 71.1 53.8 51.7 92.6 4D 5 75.7 92.6 90.5 62.5 86.1 174.4 142.1 4D 117 127.1 103.4 101.2 99.1 66.8 92.6 79.7 4D 191 161.5 133.5 122.8 127.1 109.8 75.4 129.2
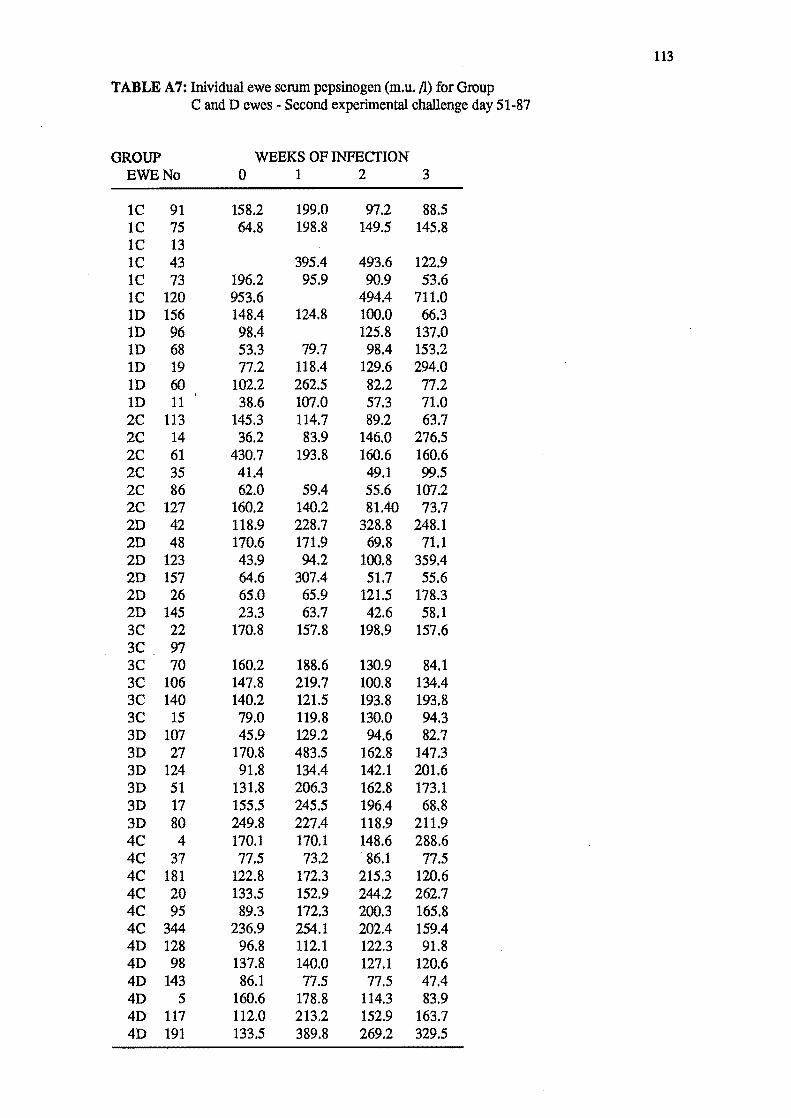
113
TABLE A7: lnividual ewe serum pepsinogen (m.u. /1) for Group C and D ewes ~ Second experimental challenge day 51 ~87
GROUP WEEKS OF INFECI'ION EWE No 0 1 2 3
1C 91 158.2 199.0 97.2 88.5 1C 75 64.8 198.8 149.5 145.8 1C 13 lC 43 395.4 493.6 122.9 lC 73 196.2 95.9 90.9 53.6 lC 120 953.6 494.4 711.0 ID 156 148.4 124.8 100.0 66.3 ID 96 98.4 125.8 137.0 ID 68 53.3 79.7 98.4 153.2 ID 19 77.2 118.4 129.6 294.0 ID 60 102.2 262.5 82.2 77.2 ID 11 38.6 107.0 57.3 71.0 2C 113 145.3 114.7 89.2 63.7 2C 14 36.2 83.9 146.0 276.5 2C 61 430.7 193.8 160.6 160.6 2C 35 41.4 49.1 99.5 2C 86 62.0 59.4 55.6 107.2 2C 127 160.2 140.2 81.40 73.7 2D 42 118.9 228.7 328.8 248.1 2D 48 170.6 171.9 69.8 71.1 2D 123 43.9 94.2 100.8 359.4 2D 157 64.6 307.4 51.7 55.6 2D 26 65.0 65.9 121.5 178.3 2D 145 23.3 63.7 42.6 58.1 3C 22 170.8 157.8 198.9 157.6 3C 97 3C 70 160.2 188.6 130.9 84.1 3C 106 147.8 219.7 100.8 134.4 3C 140 140.2 121.5 193.8 193.8 3C 15 79.0 119.8 130.0 94.3 3D 107 45.9 129.2 94.6 82.7 3D 27 170.8 483.5 162.8 147.3 3D 124 91.8 134.4 142.1 201.6 3D 51 131.8 206.3 162.8 173.1 3D 17 155.5 245.5 196.4 68.8 3D 80 249.8 227.4 118.9 211.9 4C 4 170.1 170.1 148.6 288.6 4C 37 77.5 73.2 86.1 77.5 4C 181 122.8 172.3 215.3 120.6 4C 20 133.5 152.9 244.2 262.7 4C 95 89.3 172.3 200.3 165.8 4C 344 236.9 254.1 202.4 159.4 4D 128 96.8 112.1 122.3 91.8 4D 98 137.8 140.0 127.1 120.6 4D 143 86.1 77.5 77.5 47.4 4D 5 160.6 178.8 114.3 83.9 4D 117 112.0 213.2 152.9 163.7 4D 191 133.5 389.8 269.2 329.5
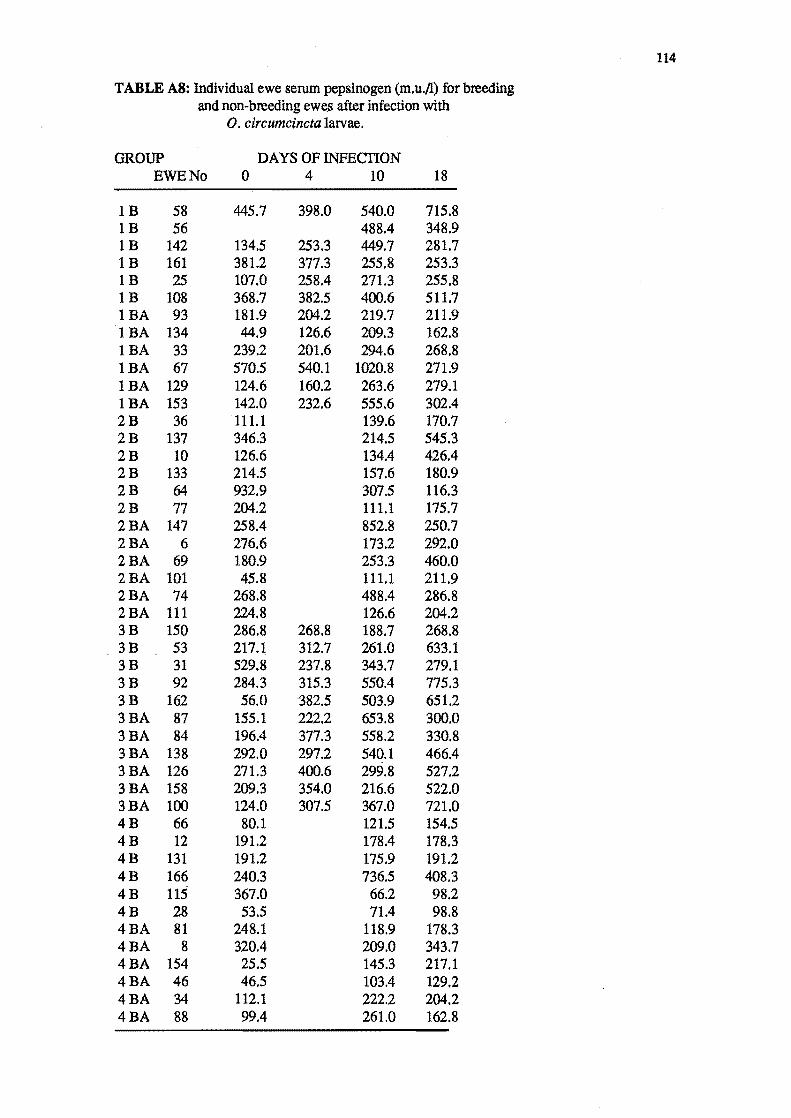
114
TABLE AS: Individual ewe serum pepsinogen (m.u.ll) for breeding and non~breeding eweS after infection with
O. circumcincta larvae.
GROUP DAYS OF INFECTION EWE No 0 4 10 18
lB 58 445.7 398.0 540.0 715.8 1B 56 488.4 348.9 1B 142 134.5 253.3 449.7 281.7 1B 161 381.2 377.3 255.8 253.3 1B 25 107.0 258.4 271.3 255.8 1B 108 368.7 382.5 400.6 511.7 1BA 93 181.9 204.2 219.7 211.9 1BA 134 44.9 126.6 209.3 162.8 1BA 33 239.2 201.6 294.6 268.8 1BA 67 570.5 540.1 1020.8 271.9 1BA 129 124.6 160.2 263.6 279.1 1BA 153 142.0 232.6 555.6 302.4 2B 36 111.1 139.6 170.7 2B 137 346.3 214.5 545.3 2B 10 126.6 134.4 426.4 2B 133 214.5 157.6 180.9 2B 64 932.9 307.5 116.3 2B 77 204.2 111.1 175.7 2BA 147 258.4 852.8 250.7 2BA 6 276.6 173.2 292.0 2BA 69 180.9 253.3 460.0 2BA 101 45.8 111.1 211.9 2BA 74 268.8 488.4 286.8 2BA 111 224.8 126.6 204.2 3B 150 286.8 268.8 188.7 268.8 3B 53 217.1 312.7 261.0 633.1 3B 31 529.8 237.8 343.7 279.1 3B 92 284.3 315.3 550.4 775.3 3B 162 56.0 ~82.5 503.9 651.2 3BA 87 155.1 222.2 653.8 300.0 3BA 84 196.4 377.3 558.2 330.8 3BA 138 292.0 297.2 540.1 466.4 3BA 126 271.3 400.6 299.8 527.2 3BA 158 209.3 354.0 216.6 522.0 3BA 100 124.0 307.5 367.0 721.0 4B 66 80.1 121.5 154.5 4B 12 191.2 178.4 178.3 4B 131 191.2 175.9 191.2 4B 166 240.3 736.5 408.3 4B 115 367.0 66.2 98.2 4B 28 53.5 71.4 98.8 4BA 81 248.1 118.9 178.3 4BA 8 320.4 209.0 343.7 4BA 154 25.5 145.3 217.1 4BA 46 46.5 103.4 129.2 4BA 34 112.1 222.2 204.2 4BA 88 99.4 261.0 162.8

115
TABLEA9: Individual ewe llveweights (kg) for Group C and D ewes for the ftfty day experimental period
GROUP WEEKSOFINFECfION EWE No 0 1 2 3 4 5 6 7
1 C 91 64.0 67.5 69.5 72.5 62.5 66.5 60.5 59.5 1 C 75 55A 65.5 69.5 74.5 64.5 59.5 56.5 65.5 1 C 13 60.0 65.0 66.0 67.5- 53.5 54.5 55.5 56.5 1 C 16 72.0 74.5 77.5 81.0 74.5 75.5 79.5 78.0 1 C 73 ·51.0 51.5 52.0 53.5 43.5 37.5 40.5 41.0 1 C 120 60.0 66.0 68.0 70.0 72.0 56.5 56.5 58.5 1 D 156 65.3 72.0 70.5 64.5 54.5 56.5 59.0 58.0 1 D 96 55.5 57.0 61.5 66.5 56.5 55.0 54.5 54.0 1 D 68 50.0 56.5 62.0 67.0 56.0 54.0 51.5 57.5 1 D 19 60.0 58.0 61.0 65.0 67.0 47.5 47.5 49.5 1 D 160 65.0 72.0 72.0 70.5 58.5 59.0 61.0 59.0 1 D 11 55.0 62.5 66.0 70.0 73.5 65.5 60.5 65.0 2 C 113 52.0 47.0 50.5 50.0 51.0 54.5 57.5 57.5 2 C 14 54.0 56.5 57.0 58.0 50.0 52.0 54.0 56.5 2 C 61 48.0 47.5 47.0 47.5 49.5 48.0 49.0 52.5 2 C 35 61.5 55.0 55.5 48.5 45.0 46.0 46.0 46.0 2 C 86 74.5 66.5 70.0 68.5 62.0 66.5 69.5 70.0 2C 127 55.0 53.0 56.0 60.5 61.5 59.0 60.5 61.0 2D 42 60.0 55.0 58.0 56.8 54.0 52.0 56.0 57.5 2D 48 57.0 55.5 56.0 56.0 54.0 56.5 61.0 64.0 2D 123 44.0 45.0 48.0 54.0 54.0 53.5 55.0 56.5 2D 157 59.6 58.0 53.0 55.5 55.5 56.0 56.5 60.0 2D 26 64.5 58.5 61.0 60.8 56.0 59.0 61.5 63.0 2D 145 69.0 66.0 61.5 64.0 60.0 60.0 62.0 67.0 3C 22 38.0 45.0 45.5 57.5 57.0 51.0 53.0 54.5 3 C 97 41.5 47.5 48.0 30.5 Died 3C 70 46.5 46.0 48.5 46.0 59.5 53.0 55.0 56.0 3 C 106 46.0 47.0 52.0 47.0 52.5 57.5 59.0 60.0 3 C 140 49.0 52.0 54.0 57.5 56.5 59.5 62.5 63.5 3 C 15 42.0 41.5 44.0 46.0 50.0 50.5 51.5 51.0 3D 107 50.0 54.0 59.0 56.5 56.0 64.0 64.0 64.5 3D 27 48.5 53.0 56.0 56.5 57.0 60.5 64.5 66.0 3D 124 42.0 45.5 47.5 49.0 50.0 52.0 56.0 56.0 3D 151 47.0 45.0 45.5 47.0 50.5 52.0 55.5 56.5 3D 17 43.0 45.0 48.0 48.5 54.5 55.0 57.0 60.0 3D 80 48.0 49.0 51.5 52.0 55.0 56.0 59.5 61.5 4 C 4 54.5 55.0 55.5 52.5 56.5 59.0 61.0 62.0 4 C 37 52.0 55.5 57.5 63.0 63.0 67.0 71.0 72.5 4 C 181 38.0 38.5 47.0 52.0 51.0 53.0 60.0 61.5 4 C 20 57.5 57.5 57.5 59.0 58.5 60.5 61.5 64.5 4 C 95 63.5 62.0 63.0 63.5 66.0 71.0 71.0 73.0 4C 344 52.0 55.0 57.0 60.5 61.0 60.0 64.0 66.5 4D 128 39.0 43.5 47.5 52.0 52.5 53.0 59.5 63.0 4D 98 63.0 65.0 67.0 69.0 72.0 74.0 77.0 77.5 4D 143 69.0 69.0 75.5 76.5 77.0 74.0 81.0 81.0 4D 5 66.5 65.0 68.0 69.0 70.0 71.0 70.0 69.0 4D 117 65.0 70.0 74.0 73.0 70.0 75.5 77.0 78.0 4D 191 49.5 47.0 47.5 51.0 50.0 53.0 55.0 53.5

116
TABLE AIO: Individual ewe liveweights (kg) for Group C and D ewes -Second experimental challenge day 51-87
GROUP WEEKSOFINFECflON EWE No 0 1 2 3
1 C 91 60.0 61.0 61.0 62.0 1 C 75 67.5 70.0 71.0 67.0 1 C 13 64.5 69.5 69.5 66.7 1 C 16 74.5 77.5 81.0 74.5 1 C 73 41.0 44.5 46.0 46.5 1 C 120 63.0 61.0 61.5 56.0 1 D 156 62.0 68.0 68.0 66.0 1 D 96 47.5 52.5 55.0 56.5 1 D 68 56.5 64.0 64.0 61.5 1 D 19 49.0 54.5 60.0 55.5 1 D 160 53.0 58.0 55.0 50.5 1 D 11 64.0 64.0 63.5 63.5 2 C 113 56.0 57.0 62.5 64.5 2C 14 59.0 63.0 63.5 65.0 2 C 61 52.5 54.5 58.0 60.5 2C 35 47.5 47.0 48.5 53.0 2 C 86 70.0 72.0 73.5 75.5 2 C 127 64.5 64.0 63.0 68.0 2D 42 57.0 60.5 64.0 65.0 2D 48 63.5 65.0 67.0 69.0 2D 123 56.5 60.0 63.5 64.5 2D 157 53.5 63.0 65.0 66.0 2D 26 61.0 60.5 65.0 65.0 2D 145 58.5 60.5 62.5 63.0 3 C 22 54.0 57.0 59.0 57.5 3 C 97 3 C 70 55.0 59.0 62.0 63.0 3 C 106 57.0 59.5 61.0 64.5 3 C 140 63.0 65.0 65.5 63.5 3 C 15 52.5 54.5 57.5 57.5 3D 107 64.5 65.5 68.0 70.0 3D 27 65.0 68.0 73.0 73.0 3D 124 59.5 60.0 64.0 64.0 3D 151 55.0 58.0 61.0 60.0 3D 17 60.0 62.0 65.5 65.0 3D 80 60.0 63.0 66.0 64.5 4 C 4 63.0 64.5 65.0 61.5 4 C 37 74.5 76.5 78.5 72.5 4 C 181 62.0 65.0 65.5 64.9 4 C 20 60.0 62.5 65.0 60.5 4 C 95 71.5 77.0 74.5 69.2 4C 344 67.0 69.0 70.0 68.4 4D 128 62.5 66.0 70.0 65.0 4D 98 80.0 84.0 82.5 80.3 4D 143 75.0 80.5 86.0 81.4 4D 5 66.0 66.0 70.5 70.2 4D 117 76.0 73.0 79.0 76.0 4D 191 55.0 60.0 62.0 57.6
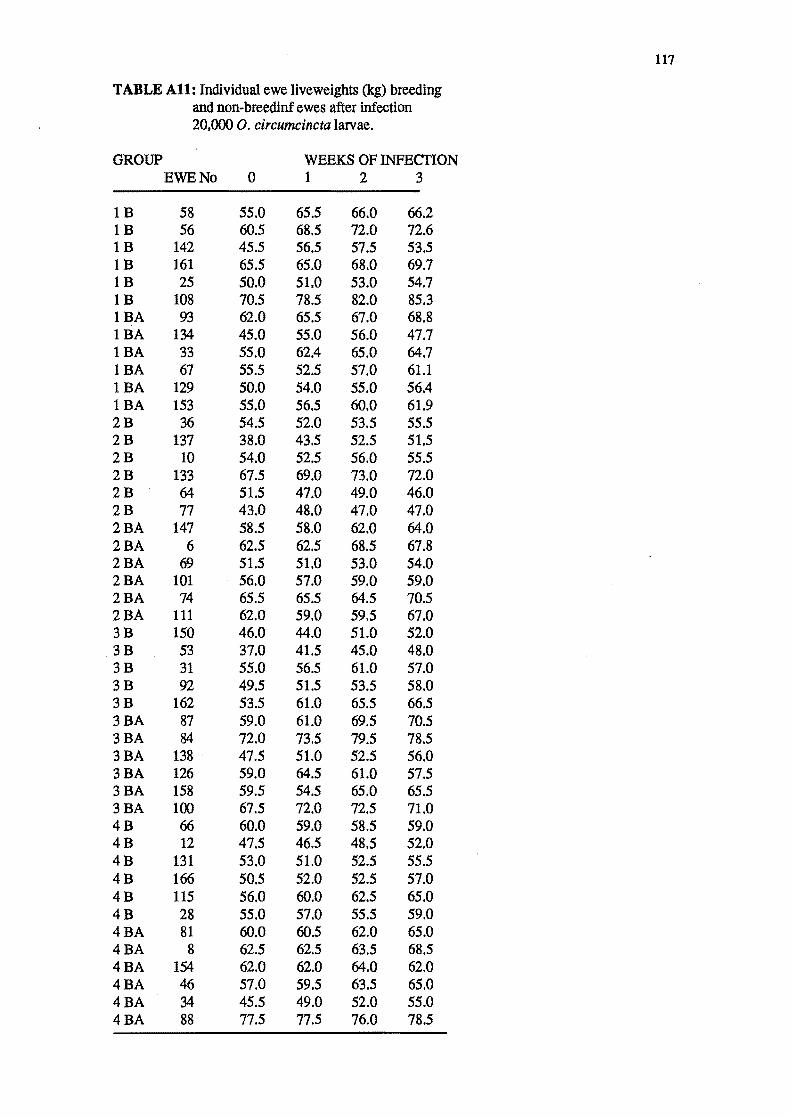
117
TABLE All: Individual ewe liveweights (kg) breeding and non-breedinf ewes after infection 20,000 O. circumcincta larvae.
GROUP WEEKS OF INFECTION EWE No 0 1 2 3
1B 58 55.0 65.5 66.0 66.2 1B 56 60.5 68.5 72.0 72.6 1B 142 45.5 56.5 57.5 53.5 1B 161 65.5 65.0 68.0 69.7 1B 25 50.0 51.0 53.0 54.7 1B 108 70.5 78.5 82.0 85.3 1BA 93 62.0 65.5 67.0 68.8 1BA 134 45.0 55.0 56.0 47.7 1BA 33 55.0 62.4 65.0 64.7 1BA 67 55.5 52.5 57.0 61.1 1BA 129 50.0 54.0 55.0 56.4 1BA 153 55.0 56.5 60.0 61.9 2B 36 54.5 52.0 53.5 55.5 2B 137 38.0 43.5 52.5 51.5 2B 10 54.0 52.5 56.0 55.5 2B 133 67.5 69.0 73.0 72.0 2B 64 51.5 47.0 49.0 46.0 2B 77 43.0 48.0 47.0 47.0 2BA 147 58.5 58.0 62.0 64.0 2BA 6 62.5 62.5 68.5 67.8 2BA 69 51.5 51.0 53.0 54.0 2BA 101 56.0 57.0 59.0 59.0 2BA 74 65.5 65.5 64.5 70.5 2BA 111 62.0 59.0 59.5 67.0 3B 150 46.0 44.0 51.0 52.0 3B 53 37.0 41.5 45.0 48.0 3B 31 55.0 56.5 61.0 57.0 3B 92 49.5 51.5 53.5 58.0 3B 162 53.5 61.0 65.5 66.5 3BA 87 59.0 61.0 69.5 70.5 3BA 84 72.0 73.5 79.5 78.5 3BA 138 . 47.5 51.0 52.5 56.0 3BA 126 59.0 64.5 61.0 57.5 3BA 158 59.5 54.5 65.0 65.5 3BA 100 67.5 72.0 72.5 71.0 4B 66 60.0 59.0 58.5 59.0 4B 12 47.5 46.5 48.5 52.0 4B 131 53.0 51.0 52.5 55.5 4B 166 50.5 52.0 52.5 57.0 4B 115 56.0 60.0 62.5 65.0 4B 28 55.0 57.0 55.5 59.0 4BA 81 60.0 60.5 62.0 65.0 4BA 8 62.5 62.5 63.5 68.5 4BA 154 62.0 62.0 64.0 62.0 4BA 46 57.0 59.5 63.5 65.0 4BA 34 45.5 49.0 52.0 55.0 4BA 88 77.5 77.5 76.0 78.5
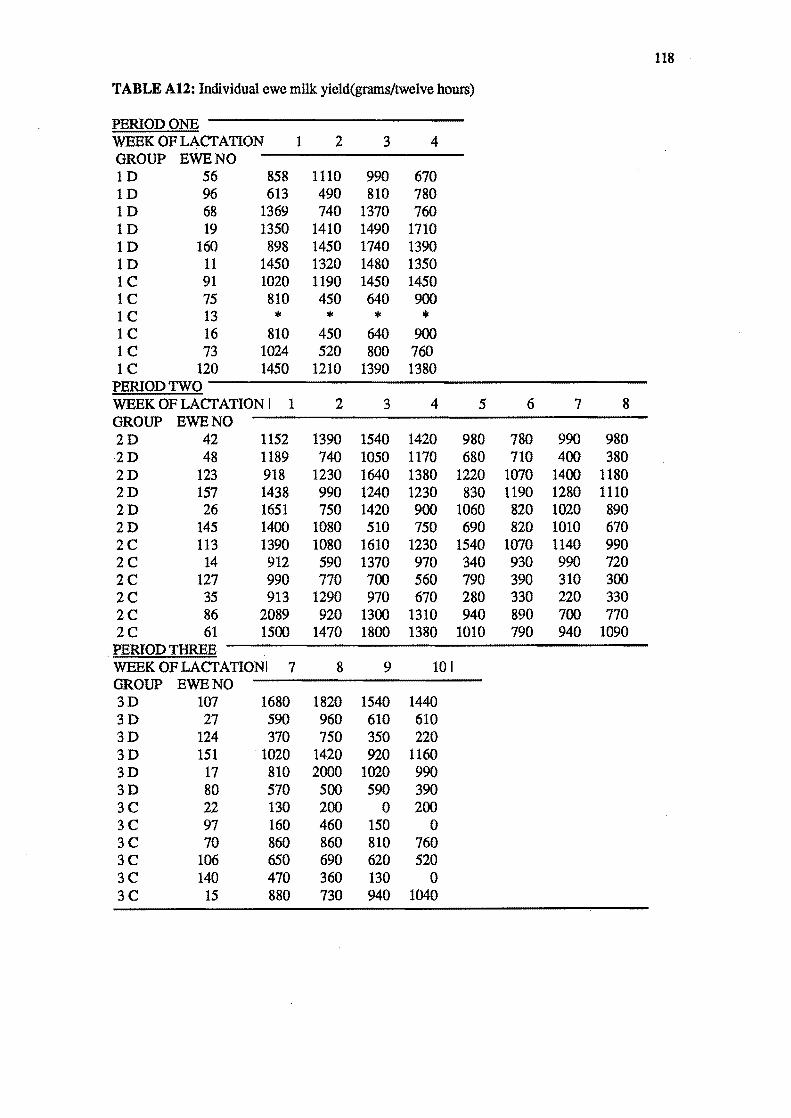
118
TABLE A12: Individual ewe milk yield(grams/twelve hours)
PERIOD ONE WEEK OF LACfATION I 2 3 4 GROUP EWENO ID 56 858 1110 990 670 ID 96 613 490 810 780 ID 68 1369 740 1370 760 ID 19 1350 1410 1490 1710 ID 160 898 1450 1740 1390 ID 11 1450 1320 1480 1350 lC 91 1020 1190 1450 1450 lC 75 810 450 640 900 lC 13 II< II< II< II<
lC 16 810 450 640 900 IC 73 1024 520 800 760 lC 120 1450 1210 1390 1380
PERIOD TWO WEEK OF LACfATION I 1 2 3 4 5 6 7 8 GROUP EWENO 2D 42 1152 1390 1540 1420 980 780 990 980 2D 48 1189 740 1050 1170 680 710 400 380 2D 123 918 1230 1640 1380 1220 1070 1400 1180 2D 157 1438 990 1240 1230 830 1190 1280 1110 2D 26 1651 750 1420 900 1060 820 1020 890 2D 145 1400 1080 510 750 690 820 1010 670 2C 113 1390 1080 1610 1230 1540 1070 1140 990 2C 14 912 590 1370 970 340 930 990 720 2C 127 990 770 700 560 790 390 310 300 2C 35 913 1290 970 670 280 330 220 330 2C 86 2089 920 1300 1310 940 890 700 770 2C 61 1500 1470 1800 1380 1010 790 940 1090
PERIOD THREE WEEK OF LACfATIONI 7 8 9 101 GROUP EWENO 3D 107 1680 1820 1540 1440 3D 27 590 960 610 610 3D 124 370 750 350 220 3D 151 1020 1420 920 1160 3D 17 810 2000 1020 990 3D 80 570 500 590 390 3C 22 130 200 0 200 3C 97 160 460 150 0 3C 70 860 860 810 760 3C 106 650 690 620 520 3C 140 470 360 130 0 3C 15 880 730 940 1040
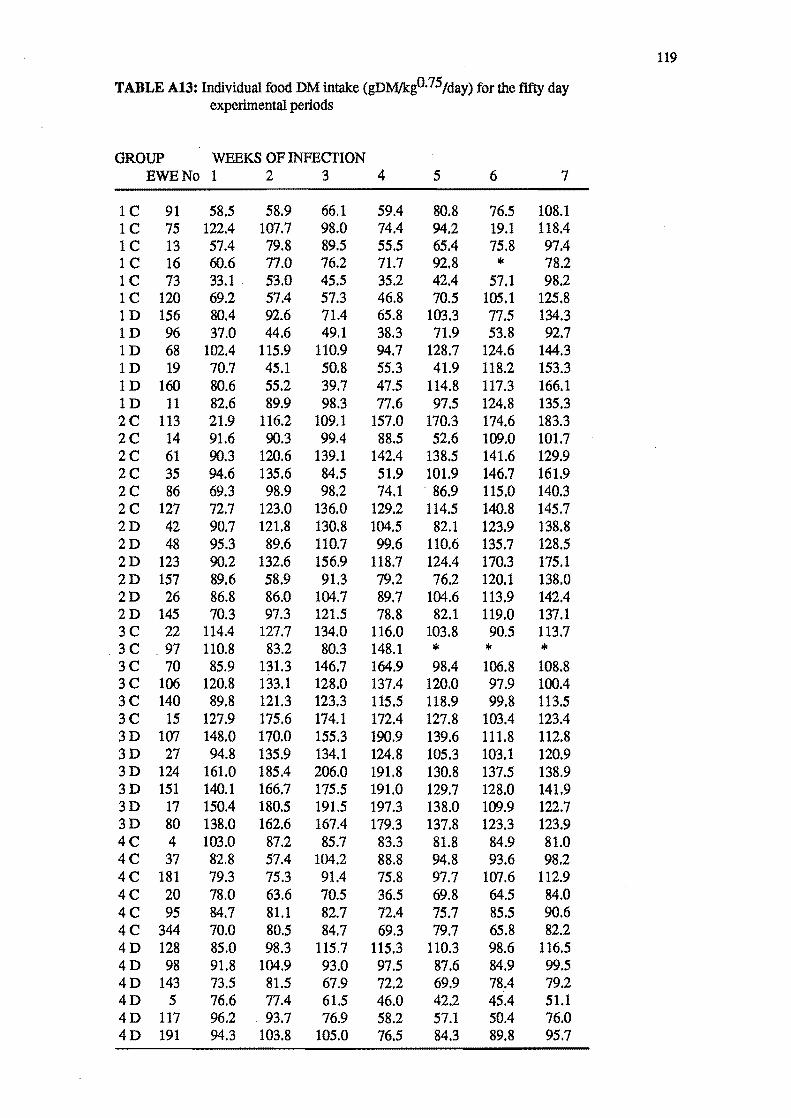
119
TABLE A13: Individual food DM intake (gDM/kgO.75/day) for the fifty day experimental periods
GROUP WEEKS OF INFECfION EWE No 1 2 3 4 5 6 7
1C 91 58.5 58.9 66.1 59.4 80.8 76.5 108.1 1C 75 122.4 107.7 98.0 74.4 94.2 19.1 118.4 1C 13 57.4 79.8 89.5 55.5 65.4 75.8 97.4 1C 16 60.6 77.0 76.2 71.7 92.8 II< 78.2 1C 73 33.1 53.0 45.5 35.2 42.4 57.1 98.2 1C 120 69.2 57.4 57.3 46.8 70.5 105.1 125.8 1D 156 80.4 92.6 71.4 65.8 103.3 77.5 134.3 1D 96 37.0 44.6 49.1 38.3 71.9 53.8 92.7 1D 68 102.4 115.9 110.9 94.7 128.7 124.6 144.3 1D 19 70.7 45.1 50.8 55.3 41.9 118.2 153.3 1D 160 80.6 55.2 39.7 47.5 114.8 117.3 166.1 1D 11 82.6 89.9 98.3 77.6 97.5 124.8 135.3 2C 113 21.9 116.2 109.1 157.0 170.3 174.6 183.3 2C 14 91.6 90.3 99.4 88.5 52.6 109.0 101.7 2C 61 90.3 120.6 139.1 142.4 138.5 141.6 129.9 2C 35 94.6 135.6 84.5 51.9 101.9 146.7 161.9 2C 86 69.3 98.9 98.2 74.1 ·86.9 115.0 140.3 2C 127 72.7 123.0 136.0 129.2 114.5 140.8 145.7 20 42 90.7 121.8 130.8 104.5 82.1 123.9 138.8 20 48 95.3 89.6 110.7 99.6 110.6 135.7 128.5 20 123 90.2 132.6 156.9 118.7 124.4 170.3 175.1 20 157 89.6 58.9 91.3 79.2 76.2 120.1 138.0 20 26 86.8 86.0 104.7 89.7 104.6 113.9 142.4 20 145 70.3 97.3 121.5 78.8 82.1 119.0 137.1 3C 22 114.4 127.7 134.0 116.0 103.8 90.5 113.7 3C 97 110.8 83.2 80.3 148.1 II< * * 3C 70 85.9 131.3 146.7 164.9 98.4 106.8 108.8 3C 106 120.8 133.1 128.0 137.4 120.0 97.9 100.4 3C 140 89.8 121.3 123.3 115.5 118.9 99.8 113.5 3C 15 127.9 175.6 174.1 172.4 127.8 103.4 123.4 30 107 148.0 170.0 155.3 190.9 139.6 111.8 112.8 30 27 94.8 135.9 134.1 124.8 105.3 103.1 120.9 30 124 161.0 185.4 206.0 191.8 130.8 137.5 138.9 30 151 140.1 166.7 175.5 191.0 129.7 128.0 141.9 3D 17 150.4 180.5 191.5 197.3 138.0 109.9 122.7 3D 80 138.0 162.6 167.4 179.3 137.8 123.3 123.9 4C 4 103.0 87.2 85.7 83.3 81.8 84.9 81.0 4C 37 82.8 57.4 104.2 88.8 94.8 93.6 98.2 4C 181 79.3 75.3 91.4 75.8 97.7 107.6 112.9 4C 20 78.0 63.6 70.5 36.5 69.8 64.5 84.0 4C 95 84.7 81.1 82.7 72.4 75.7 85.5 90.6 4C 344 70.0 80.5 84.7 69.3 79.7 65.8 82.2 4D 128 85.0 98.3 115.7 115.3 110.3 98.6 116.5 4D 98 91.8 104.9 93.0 97.5 87.6 84.9 99.5 4D 143 73.5 81.5 67.9 72.2 69.9 78.4 79.2 40 5 76.6 77.4 61.5 46.0 42.2 45.4 51.1 40 117 96.2 93.7 76.9 58.2 57.1 50.4 76.0 40 191 94.3 103.8 105.0 76.5 84.3 89.8 95.7
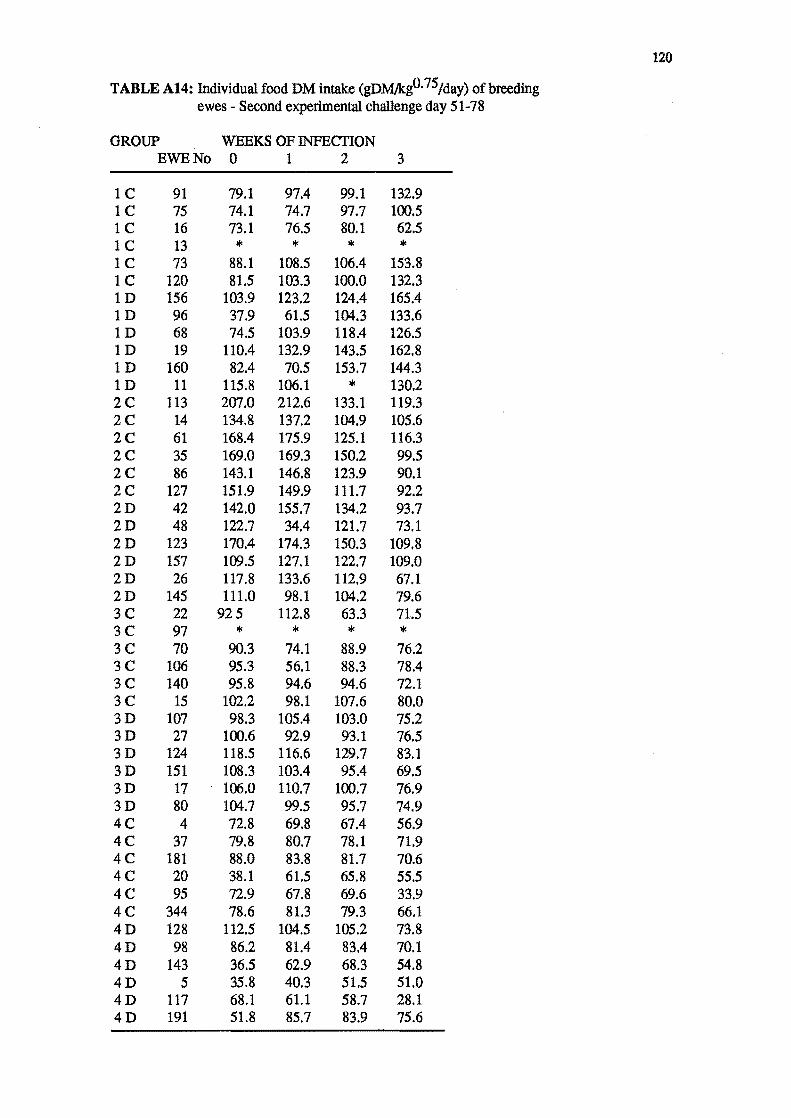
120
TABLE A14: Individual food DM intake (gDM/kgO.75/day) of breeding ewes - Second experimental challenge day 51-78
GROUP WEEKS OF INFECTION EWE No 0 1 2 3
1C 91 79.1 97.4 99.1 132.9 1C 75 74.1 74.7 97.7 100.5 1C 16 73.1 76.5 80.1 62.5 1C 13 '" '" If< If<
1C 73 88.1 108.5 106.4 153.8 1C 120 81.5 103.3 100.0 132.3 1D 156 103.9 123.2 124.4 165.4 1D 96 37.9 61.5 104.3 133.6 1D 68 74.5 103.9 118.4 126.5 1D 19 110.4 132.9 143.5 162.8 1D 160 82.4 70.5 153.7 144.3 1D 11 115.8 106.1 If< 130.2 2C 113 207.0 212.6 133.1 119.3 2C 14 134.8 137.2 104.9 105.6 2C 61 168.4 175.9 125.1 116.3 2C 35 169.0 169.3 150.2 99.5 2C 86 143.1 146.8 123.9 90.1 2C 127 151.9 149.9 111.7 92.2 2D 42 142.0 155.7 134.2 93.7 2D 48 122.7 34.4 121.7 73.1 2D 123 170.4 174.3 150.3 109.8 2D 157 109.5 127.1 122.7 109.0 2D 26 117.8 133.6 112.9 67.1 2D 145 111.0 98.1 104.2 79.6 3C 22 925 112.8 63.3 71.5 3C 97 '" If< If< If<
3C 70 90.3 74.1 88.9 76.2 3C 106 95.3 56.1 88.3 78.4 3C 140 95.8 94.6 94.6 72.1 3C 15 102.2 98.1 107.6 80.0 3D 107 98.3 105.4 103.0 75.2 3D 27 100.6 92.9 93.1 76.5 3D 124 118.5 116.6 129.7 83.1 3D 151 108.3 103.4 95.4 69.5 3D 17 106.0 110.7 100.7 76.9 3D 80 104.7 99.5 95.7 74.9 4C 4 72.8 69.8 67.4 56.9 4C 37 79.8 80.7 78.1 71.9 4C 181 88.0 83.8 81.7 70.6 4C 20 38.1 61.5 65.8 55.5 4C 95 72.9 67.8 69.6 33.9 4C 344 78.6 81.3 79.3 66.1 4D 128 112.5 104.5 105.2 73.8 4D 98 86.2 81.4 83.4 70.1 4D 143 36.5 62.9 68.3 54.8 4D 5 35.8 40.3 51.5 51.0 4D 117 68.1 61.1 58.7 28.1 4D 191 51.8 85.7 83.9 75.6
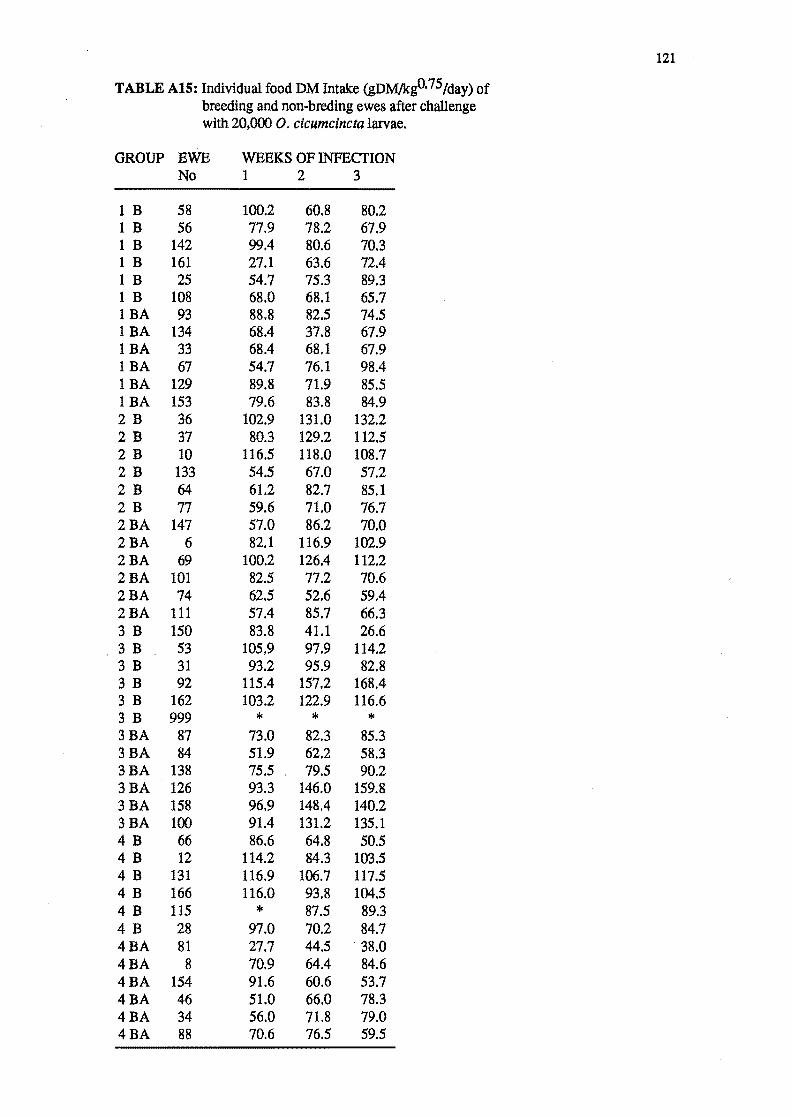
121
TABLE AI!: Individual food DM Intake (gDM/kgO.75/day) of breeding and non-breding ewes after challenge with 20,000 O. cicumcincta larvae.
GROUP EWE WEEKSOFINFECfION No 1 2 3
1 B 58 100.2 60.8 80.2 1 B 56 77.9 78.2 67.9 1 B 142 99.4 80.6 70.3 1 B 161 27.1 63.6 72.4 1 B 25 54.7 75.3 89.3 1 B 108 68.0 68.1 65.7 IBA 93 88.8 82.5 74.5 IBA 134 68.4 37.8 67.9 IBA 33 68.4 68.1 67.9 IBA 67 54.7 76.1 98.4 IBA 129 89.8 71.9 85.5 IBA 153 79.6 83.8 84.9 2B 36 102.9 131.0 132.2 2B 37 80.3 129.2 112.5 2B 10 116.5 118.0 108.7 2B 133 54.5 67.0 57.2 2 B 64 61.2 82.7 85.1 2B 77 59.6 71.0 76.7 2BA 147 57.0 86.2 70.0 2BA 6 82.1 116.9 102.9 2BA 69 100.2 126.4 112.2 2BA 101 82.5 77.2 70.6 2BA 74 62.5 52.6 59.4 2BA 111 57.4 85.7 66.3 3 B 150 83.8 41.1 26.6 3 B 53 105.9 97.9 114.2 3 B 31 93.2 95.9 82.8 3 B 92 115.4 157.2 168.4 3 B 162 103.2 122.9 116.6 3 B 999 * * * 3BA 87 73.0 82.3 85.3 3BA 84 51.9 62.2 58.3 3BA 138 75.5 79.5 90.2 3BA 126 93.3 146.0 159.8 3BA 158 96.9 148.4 140.2 3BA 100 91.4 131.2 135.1 4B 66 86.6 64.8 50.5 4B 12 114.2 84.3 103.5 4B 131 116.9 106.7 117.5 4B 166 116.0 93.8 104.5 4B 115 * 87.5 89.3 4B 28 97.0 70.2 84.7 4BA 81 27.7 44.5 38.0 4BA 8 70.9 64.4 84.6 4BA 154 91.6 60.6 53.7 4BA 46 51.0 66.0 78.3 4BA 34 56.0 71.8 79.0 4BA 88 70.6 76.5 59.5
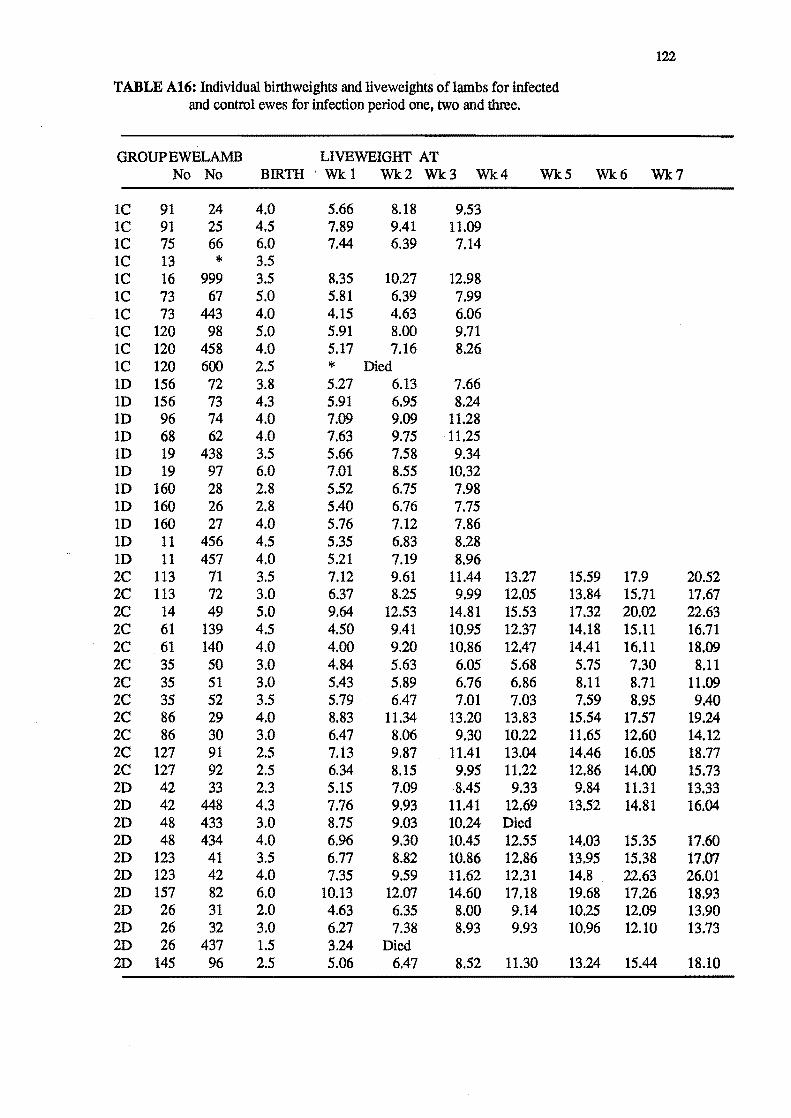
122
TABLE A16: Individual birthweights and liveweights of lambs for infected and control ewes for infection period one, two and three.
GROUPEWELAMB LIVEWEIGHT AT No No BIRTH . Wkl Wk2 Wk3 Wk4 Wk5 Wk6 Wk7
lC 91 24 4.0 5.66 8.18 9.53 lC 91 25 4.5 7.89 9.41 11.09 lC 75 66 6.0 7.44 6.39 7.14 lC 13 *' 3.5 lC 16 999 3.5 8.35 10.27 12.98 lC 73 67 5.0 5.81 6.39 7.99 lC 73 443 4.0 4.15 4.63 6.06 lC 120 98 5.0 5.91 8.00 9.71 lC 120 458 4.0 5.17 7.16 8.26 lC 120 600 2.5 *' Died ID 156 72 3.8 5.27 6.13 7.66 ID 156 73 4.3 5.91 6.95 8.24 1D 96 74 4.0 7.09 9.09 11.28 1D 68 62 4.0 7.63 9.75 11.25 1D 19 438 3.5 5.66 7.58 9.34 ID 19 97 6.0 7.01 8.55 10.32 ID 160 28 2.8 5.52 6.75 7.98 ID 160 26 2.8 5.40 6.76 7.75 ID 160 27 4.0 5.76 7.12 7.86 ID 11 456 4.5 5.35 6.83 8.28 ID 11 457 4.0 5.21 7.19 8.96 2C 113 71 3.5 7.12 9.61 11.44 13.27 15.59 17.9 20.52 2C 113 72 3.0 6.37 8.25 9.99 12.05 13.84 15.71 17.67 2C 14 49 5.0 9.64 12.53 14.81 15.53 17.32 20.02 22.63 2C 61 139 4.5 4.50 9.41 10.95 12.37 14.18 15.11 16.71 2C 61 140 4.0 4.00 9.20 10.86 12.47 14.41 16.11 18.09 2C 35 50 3.0 4.84 5.63 6.05 5.68 5.75 7.30 8.11 2C 35 51 3.0 5.43 5.89 6.76 6.86 8.11 8.71 11.09 2C 35 52 3.5 5.79 6.47 7.01 7.03 7.59 8.95 9.40 2C 86 29 4.0 8.83 11.34 13.20 13.83 15.54 17.57 19.24 2C 86 30 3.0 6.47 8.06 9.30 10.22 11.65 12.60 14.12 2C 127 91 2.5 7.13 9.87 11.41 13.04 14.46 16.05 18.77 2C 127 92 2.5 6.34 8.15 9.95 11.22 12.86 14.00 15.73 2D 42 33 2.3 5.15 7.09 ·8.45 9.33 9.84 11.31 13.33 2D 42 448 4.3 7.76 9.93 11.41 12.69 13.52 14.81 16.04 2D 48 433 3.0 8.75 9.03 10.24 Died 2D 48 434 4.0 6.96 9.30 10.45 12.55 14.03 15.35 17.60 2D 123 41 3.5 6.77 8.82 10.86 12.86 13.95 15.38 17.07 2D 123 42 4.0 7.35 9.59 11.62 12.31 14.8 22.63 26.01 2D 157 82 6.0 10.13 12.07 14.60 17.18 19.68 17.26 18.93 2D 26 31 2.0 4.63 6.35 8.00 9.14 10.25 12.09 13.90 2D 26 32 3.0 6.27 7.38 8.93 9.93 10.96 12.10 13.73 2D 26 437 1.5 3.24 Died 2D 145 96 2.5 5.06 6.47 8.52 11.30 13.24 15.44 18.10
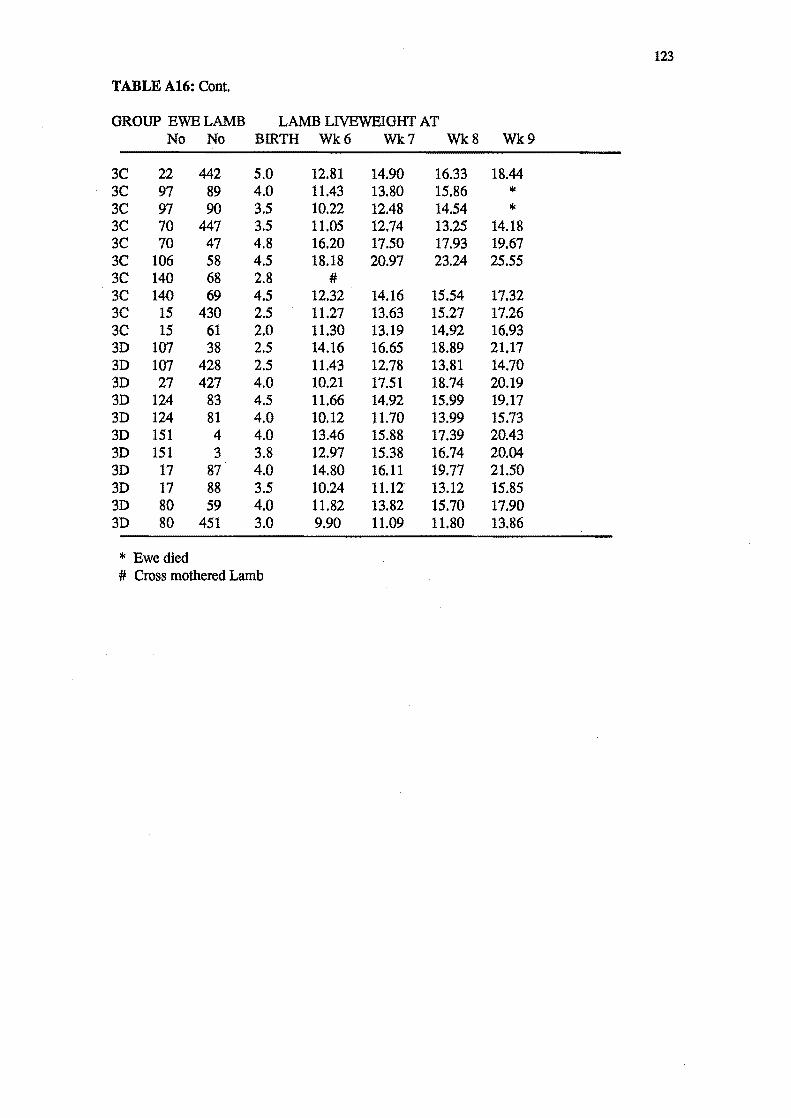
123
TABLE A16: Cant.
GROUP EWE LAMB LAMB LIVEWEIGHT AT No No BIRTH Wk6 Wk7 Wk8 Wk9
3C 22 442 5.0 12.81 14.90 16.33 18.44 3C 97 89 4.0 11.43 13.80 15.86 II<
3C 97 90 3.5 10.22 12.48 14.54 II<
3C 70 447 3.5 11.05 12.74 13.25 14.18 3C 70 47 4.8 16.20 17.50 17.93 19.67 3C 106 58 4.5 18.18 20.97 23.24 25.55 3C 140 68 2.8 # 3C 140 69 4.5 12.32 14.16 15.54 17.32 3C 15 430 2.5 11.27 13.63 15.27 17.26 3C 15 61 2.0 11.30 13.19 14.92 16.93 3D 107 38 2.5 14.16 16.65 18.89 21.17 3D 107 428 2.5 11.43 12.78 13.81 14.70 3D 27 427 4.0 10.21 17.51 18.74 20.19 3D 124 83 4.5 11.66 14.92 15.99 19.17 3D 124 81 4.0 10.12 11.70 13.99 15.73 3D 151 4 4.0 13.46 15.88 17.39 20.43 3D 151 3 3.8 12.97 15.38 16.74 20.04 3D 17 87 4.0 14.80 16.11 19.77 21.50 3D 17 88 3.5 10.24 11.12' 13.12 15.85 3D 80 59 4.0 11.82 13.82 15.70 17.90 3D 80 451 3.0 9.90 11.09 11.80 13.86
* Ewe died # Cross mothered Lamb

124
TABLE Ai7: Individual ewe clean fleece weight (mgl1Ocm2) and fibre diameter (It) for breeding ewes- Group C and D.
A VERAGE FIBRE DIAMETER WOOL GROWTH (mglday) GROUP TAG NO PRE-TRIAL INFECTION TAG NO PRE-TRIAL INFECTION
1 2 PERIOD 1 2 PERIOD
1 C 1 91 41.1 37.8 1 91 1.361 1 C 2 75 43.8 38.9 2 75 2.824 1 C 3 13 39.0 32.9 3 13 2.031 1 C 4 16 41.6 35.4 4 16 1.525 1 C 5 73 40.8 >Ie 5 73 0.787 1 C 6 120 36.7 >Ie 6 120 0.191 1 D 1 156 41.1 33.9 1 156 1.126 1 D 2 96 40.5 33.6 2 96 1.648 1 D 3 68 36.4 34.3 3 68 1.895 1 D 4 19 43.6 33.4 4 19 0.751 1 D 5 160 39.2 30.0 5 160 1.360 1D 6 11 39.6 38.5 6 11 3.403 2C 1 113 38.3 31.0 32.8 1 113 5.068 3.228 2C 2 14 41.0 >Ie 35.0 2 14 1.683 3.639 2C 3 61 42.5 37.9 38.4 3 61 8.953 3.736 2C 4 35 43.6 34.8 35.5 4 35 2.945 2.013 2C 5 86 44.8 >Ie 35.8 5 86 0.181 1.661 2C 6 127 39.4 37.1 36.7 6 127 6.197 3.059 2D 1 42 37.4 30.5 34.2 1 42 3.141 2.990 2D 2 48 40.6 32.2 33.4 2 48 3.987 2.363 2D 3 123 42.6 35.5 36.3 3 123 4.468 2.612 2D 4 157 37.6 35.4 40.6 4 157 1.480 4.515 2D 5 26 45.1 >Ie 40.9 5 26 0.934 3.004 2D 6 145 43.3 32.0 35.8 6 145 1.135 2.705 3 C 1 22 42.3 35.8 39.6 1 22 2.723 3.563 3C 2 97 41.5 35.0 died 2 97 3.241 died 3 C 3 70 39.7 33.4 36.4 3 70 4.896 4.050 3C 4 106 44.8 39.3 41.2 4 106 6.125 4.642 3C 5 140 42.1 34.1 40.1 5 140 2.220 4.416 3C 6 15 43.7 34.8 35.8 6 15 2.996 6.926 3D 1 107 39.4 35.2 37.4 1 107 2.783 5.036 3D 2 27 39.6 37.6 38.1 2 27 5.441 5.929 3D 3 124 40.4 29.5 34.1 3 124 2.118 4.720 3D 4 151 41.8 34.6 37.1 4 151 5.720 4.568 3D 5 17 39.9 37.3 39.0 5 17 4.714 4.097 3D 6 80 39.3 31.0 35.8 6 80 2.279 3.526 4C 1 4 43.8 39.0 43.4 1 4 7.018 5.093 4C 2 37 43.0 37.7 42.9 2 37 8.640 5.497 4C 3 171 35.1 31.6 33.1 3 171 9.445 4.578 4C 4 20 42.8 40.0 41.4 4 20 0.353 7.355 4C 5 95 40.8 36.6 39.4 5 95 8.485 5.763 4C 6 148 41.0 35.0 39.5 6 148 8.494 4.946 4D 1 128 42.2 35.0 39.8 1 128 9.377 6.038 4D 2 98 37.9 34.2 38.2 2 98 7.448 5.806 4D 3 143 42.1 39.0 3 143 8.278 4D 4 5 42.1 38.7 41.3 4 5 9.200 5.529 4D 5 117 41.8 35.6 39.8 5 117 7.238 5.966 4D 6 130 37.0 41.0 6 130 8.051 5.251
>Ie insufficent wool for airflow measurement of average fibre diameter
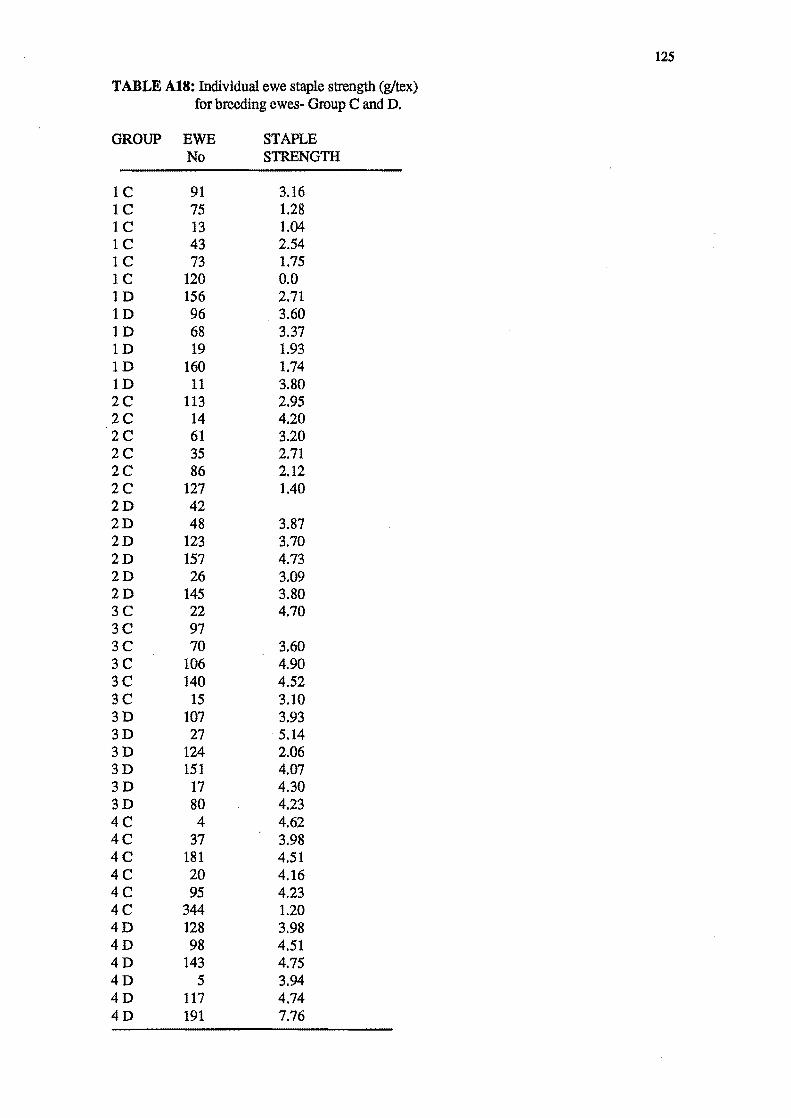
125
TABLE Al8: Individual ewe staple strength (g!tex) for breeding ewes- Group C and D.
GROUP EWE STAPLE No STRENGTH
IC 91 3.16 1C 75 1.28 1C 13 1.04 1C 43 2.54 1C 73 1.75 1C 120 0.0 1D 156 2.71 1D 96 3.60 1D 68 3.37 1D 19 1.93 1D 160 1.74 ID 11 3.80 2C 113 2.95 2C 14 4.20 2C 61 3.20 2C 35 2.71 2C 86 2.12 2C 127 1.40 2D 42 2D 48 3.87 2D 123 3.70 2D 157 4.73 2D 26 3.09 2D 145 3.80 3C 22 4.70 3C 97 3C 70 3.60 3C 106 4.90 3C 140 4.52 3C 15 3.10 3D 107 3.93 3D 27 5.14 3D 124 2.06 3D 151 4.07 3D 17 4.30 3D 80 4.23 4C 4 4.62 4C 37 3.98 4C 181 4.51 4C 20 4.16 4C 95 4.23 4C 344 1.20 4D 128 3.98 4D 98 4.51 4D 143 4.75 4D 5 3.94 4D 117 4.74 4D 191 7.76