Embed Size (px)
Citation preview

Subprime Spillover: Foreclosures Cost Neighbors $202 Billion;
40.6 Million Homes Lose $5,000 on Average
____________________________________________________________________________ CRL Issue Paper Rev. January 18, 2008 In our December 2006 study, “Losing Ground,” CRL predicts that millions of American households will lose their homes to foreclosures in the subprime mortgage market.1 “Losing Ground” focuses on the direct impact of subprime foreclosures, but it does not attempt to quantify how those foreclosures affect neighboring homes and larger communities. In other words, it does not address the “spillover” effect where foreclosures themselves further depress local housing prices. In this report, we estimate how many homes—including families who are paying their mortgage on time—will suffer a decline in property values because of foreclosures in their neighborhoods. We also estimate the monetary value of these losses in terms of lower property value and a reduced tax base for communities. Background When a home goes into foreclosure, the negative effects extend beyond individual families losing their homes to surrounding neighbors and the wider community. Published research by Immergluck and Smith (2006) indicates that a foreclosure on a home lowered the price of other nearby single-family homes, on average, by 0.9 percent. They also reported that the downward pressure on housing prices extended to houses that sold within two years of the foreclosure. Further, Immergluck and Smith found this negative impact was cumulative; that is, each additional foreclosure on the block lowered values an additional 0.9 percent. The impact was even higher in lower-income neighborhoods, where each foreclosure dropped home values by an average of 1.44 percent.2 For this analysis, CRL used the most conservative estimate of a 0.9 percent home value decline per foreclosure. We also utilize our estimates of projected foreclosures from our “Losing Ground” study that, as described on page 4, also are quite conservative compared to subsequent estimates offered by independent economists and investment banks. Further, our findings understate the total foreclosure “spillover” impact because we only include counties located in Metropolitan Statistical Areas (MSAs). A typical MSA comprises a core urban area with a population of 50,000 or more, together with adjacent communities that are economically or socially linked to that core area. Approximately 76 percent of the U.S. population lives in an MSA.3 Key Findings We project that, nationally, foreclosures on subprime home loans originated in 2005 and 20064 will have the following impact on the neighborhoods and communities in which they occur:
• 40.6 million neighboring homes will experience devaluation because of subprime
foreclosures that take place nearby. • The total decline in house values and tax base from nearby foreclosures will be $202
billion. • Homeowners living near foreclosed properties will see their property values
decrease $5,000 on average.
1

These national results are the aggregation of CRL estimates of the foreclosure spillover impact for 56,777 census tracts or similar geographies.5 In each geography assessed, the cost to neighbors is affected by three factors: the number of projected subprime foreclosures, the density of local housing units, and the current value of those homes. (See “Methodology” on page 4 for further details on our analysis.) Our calculations of the lost wealth through reduced property values by neighbors is also a loss of tax base to the larger community. Thus, we use the terms reduction in property values and loss of tax base interchangeably in this report. As shown in Chart 1 below, 24 states and 38 counties will experience declines of over $1 billion each in local house prices and tax bases. Appendix 1 outlines CRL estimates of the spillover impact for every state and for all counties located in Metropolitan Statistical Areas. It is beyond the scope of this research to analyze the spillover impact of subprime foreclosures on African-American and Latino homeowners in particular, but we note that communities of color will be especially harmed, since these communities receive a disproportionate share of subprime home loans.
Chart 1 Top States and Counties Facing Declines in House Values and Local Tax Bases
due to Subprime Foreclosures
Number of Neighboring
Homes Experiencing Devaluation
Decrease in House Values/Tax Base from Foreclosure
Effect ($ millions)
UNITED STATES 40,621,895 201,533
STATES (in order of reduction in house values & tax base)
California 7,505,584 60,631
New York 3,552,642 36,841
Florida 3,667,230 20,281
Illinois 2,536,938 15,440
New Jersey 1,781,424 11,070
Maryland 1,220,574 6,863
Arizona 1,201,327 4,913
Massachusetts 1,013,548 4,520
Virginia 1,035,979 3,933
Pennsylvania 1,684,475 3,723
Nevada 557,286 3,697
Texas 2,283,390 2,785
Washington 846,526 2,767
District of Columbia 223,797 2,425
Hawaii 167,942 2,353
Michigan 1,414,411 2,148
Colorado 748,652 1,800
Ohio 1,392,990 1,612
2

Number of Neighboring
Homes Experiencing Devaluation
Decrease in House Values/Tax Base from Foreclosure
Effect ($ millions)
Oregon 466,877 1,442
Minnesota 545,773 1,275
Connecticut 441,018 1,153
Wisconsin 557,251 1,075
Georgia 630,218 1,028
Missouri 705,446 1,014 COUNTIES (in order of reduction in house values & tax base)
Los Angeles CA 2,545,978 27,257 Cook IL 1,794,433 13,746 Kings NY 740,141 12,743 Miami-Dade FL 786,452 10,488 Queens NY 670,186 9,254 Orange CA 670,470 5,750 Bronx NY 411,929 4,903 Maricopa AZ 961,548 4,354 Broward FL 642,030 4,313 New York NY 398,746 3,845 San Diego CA 634,465 3,661 Clark NV 477,090 3,413 Alameda CA 379,590 3,209 San Bernardino CA 423,605 2,990 Hudson NJ 223,345 2,862 Riverside CA 398,158 2,805 Prince Georges MD 267,802 2,553 Santa Clara CA 293,272 2,527 District of Columbia DC 223,797 2,425 Honolulu HI 167,942 2,353 Essex NJ 232,685 2,033 Nassau NY 271,875 1,935 Philadelphia PA 597,771 1,922 Suffolk MA 231,447 1,831 Sacramento CA 357,729 1,769 San Francisco CA 156,181 1,473 Contra Costa CA 201,419 1,433 King WA 344,478 1,406 Bergen NJ 214,273 1,366 Westchester NY 176,387 1,300 Baltimore city MD 267,744 1,205 Passaic NJ 120,958 1,152 Fairfax VA 201,596 1,118
3

Number of Neighboring
Homes Experiencing Devaluation
Decrease in House Values/Tax Base from Foreclosure
Effect ($ millions)
Montgomery MD 193,543 1,110 San Joaquin CA 152,937 1,104 Richmond NY 141,174 1,086 Palm Beach FL 308,885 1,057 Wayne MI 608,977 1,024
Methodology Estimating the Number of Homes Lost to Foreclosure Subprime loans are not evenly distributed across neighborhoods. Rather, the distribution of subprime loans is highly correlated with such neighborhood characteristics as minority concentration and income. The geographic distribution of subprime home loans is available from annual Home Mortgage Disclosure Act (HMDA) data.6 For the majority of subprime home loans originated in the U.S., HMDA provides information on the census tract in which the property is located.7 For each census tract within a metropolitan statistical area or metropolitan division, we identify the number of subprime loans originated during 2005 and 2006.8 The number of subprime loan originations is then multiplied by the predicted cumulative foreclosure rate for the MSA in which the census tract is located to yield the number of expected subprime foreclosures associated with the census tract.9
How Do CRL Foreclosure Projections Compare to Other Estimates? Every credible quantification of subprime foreclosures reveals that the problem is severe. CRL’s December 2006 “Losing Ground” study estimated that one out of every five subprime mortgages made in 2005 and 2006 ultimately will end in foreclosure. This projection refers to actual homes lost, not late payments or foreclosures started but not completed. As shown below, CRL’s estimate is in line with—in fact, quite conservative compared to—other credible projections:
Loans Analyzed # Loans in
Analysis
Projected Foreclosure
Rate
# Projected Homes Lost to
Foreclosure
CRL10Subprime loans, owner-occupied homes, 2005
through 3Q 2006 5,800,000 19.4% 1,115,000
All adjustable rate mortgages (ARMs) issued
in 2004 & 2005 7,700,000 14.3% 1,100,000 First American
Real Estate Solutions 11 Subprime ARMs with
scheduled rate resets in Oct-Dec 2006
450,000 Up to 50% Up to 225,000
Lehman Brothers12
Subrime loans, 2006 vintage only 4,000,000 30% 1,200,000
Moody’s Economy.com13
All loans Not disclosed Not disclosed 2,000,000
Credit Suisse14 Current outstanding subprime loans Not disclosed 36% 1,520,000
4

Calculating the “Spillover” Effect To assess the impact of foreclosed subprime loans on neighboring homes, we obtained data on the local housing unit densities and median house prices for each census tract.15 Assuming that the predicted foreclosures within each census tract are evenly distributed throughout the tract, we calculated the number of houses expected to be within an eighth of mile of each foreclosure. Immergluck and Smith (2006)16 found that foreclosures of home loans have a significant impact on nearby property values. Their “most conservative estimates indicate that each conventional foreclosure within an eighth of a mile of a single-family home results in a decline of 0.9 percent in value.” Therefore, we estimate that each foreclosed property will cause the value of these neighboring homes to decline by 0.9 percent.17 We then aggregate this loss of equity within MSAs to the county, state and the US levels.18 We estimate that that this lost home value translates into a decrease in the tax base in these counties. Conclusion By any measure, the epidemic of home losses is severe, and will not only harm the families who lose their homes, but also nearby homeowners who suffer drops in their property values and communities who suffer the impact of lower tax revenues. Further, while the rate of subprime foreclosures is alarming today, the worst is still ahead. With as many as two million foreclosures predicted to occur in the next two to three years, it is imperative that Congress take action to assist homeowners struggling today and enact common-sense regulations to ensure this disaster does not happen again. Notes 1 Ellen Schloemer, Wei Li, Keith Ernst, and Kathleen Keest, Losing Ground: Foreclosures in the Subprime Market
and Their Cost to Homeowners, Center for Responsible Lending at 16 (December 2006), available at http://www.responsiblelending.org.
2 Dan Immergluck and Geoff Smith, The External Costs of Foreclosure: The Impact of Single-Family Mortgage
Foreclosures on Property Values, p. 57, 69, 72, 75Housing Policy Debate (17:1) Fannie Mae Foundation (2006) at http://www.fanniemaefoundation.org/programs/hpd/pdf/hpd_1701_immergluck.pdf.
3 Metropolitan statistical areasare geographic entities defined by the U.S. Office of Management and Budget for use
by Federal statistical agencies in collecting, tabulating, and publishing Federal statistics. For more details, see http://www.census.gov/population/www/estimates/metroarea.html
4 In CRL’s “Losing Ground” paper, for loans originated during 2005 and 2006, we projected 1.1 million
foreclosures in the US. In the current study, our foreclosure estimates limited to first lien, owner-occupied subprime loans reported in 2005 and 2006 HMDA as “higher-cost” loans, secured by a property located in a MSA. The resulting number of foreclosures in this slightly smaller geography is estimated at 923,034.
5 Specifically, Block Numbering Areas (BNAs), which are geographic entities similar to census tracts and delineated
in counties (or the statistical equivalents of counties) without census tracts. 6 For the first time in 2004, lenders were required to report the spread between the APR of designated loans and the
yield on a U.S. Treasury security of comparable maturity. Specifically, lenders submitted this information on first lien loans if the spread was at or above three percentage points. In this study, we refer to loans with APRs high enough to require the disclosure of this spread as subprime loans.
5

6
7 According to Census Bureau, “Census tracts are small, relatively permanent geographic entities within counties…
Generally, census tracts have between 2,500 and 8,000 residents and boundaries that follow visible features.” Since, “census tracts are to be as homogeneous as possible with respect to population characteristics, economic status, and living conditions”, they are the observation units of our study.
8 All figures in this analysis cover only originated conventional home loans to owner-occupants, in a Metropolitan
Statistical Area or Metropolitan Division, secured by a first-lien on a 1- to 4-unit home, as disclosed under HMDA.
9 Subprime foreclosure rates vary across geographical locations. In addition to the difference on risky loan terms,
foreclosures are more likely in housing markets with lower house price growth. This geographical variation on foreclosure rates is incorporated into our study at MSA level. See Appendix 5 of Losing Ground (note 1), p. 48. CRL projected lifetime foreclosure rates for 378 MSAs. For the remaining 9 MSAs in the HMDA data, we assume the same foreclosure rate as the US average foreclosure rate (19.4%).
10 See Schloemer et al, note 1. 11 Christopher L. Cagan, Mortgage Payment Reset: The Issue and the Impact, First American CoreLogic (March 19,
2007) and quoted in Subprime Borrowers to Lose Homes at Record Pace as Rates Rise, Bloomberg.com (September 19, 2007), available at http://www.facorelogic.com/uploadedFiles/Newsroom/Studies_and_Briefs/Studies/20070048Mortgage PaymentResetStudy_FINAL.pdf and http://www.bloomberg.com/apps/news?pid=email_en&refer=finance&sid=akOEPec30TR4, respectively.
12 Mortgage Finance Industry Overview, Lehman Brothers Equity Research (December 22, 2006). 13 Mark Zandi, Statement before the House Judiciary Committee United States House of Representatives
(October 30, 2007) available at http://judiciary.house.gov/OversightTestimony.aspx?ID=1188 14 Market Tabs, Credit Suisse Fixed Income Research (October 26, 2007). 15 Data collected from the Summary File 3 database of 2000 Census. 16 See Immergluck et al, note 2. 17 For a census tract, let A be the area size in square miles, B be the number of foreclosed subprime loans, C be the
number of housing units, and D be the median house price. Let G=64A/π. Then the number of neighboring homes experiencing devaluation is given by
⎩⎨⎧
<÷×≥
=G Bif G,BC
G Bif C,H (1).
GBDC009.0I
The dollar amount of decrease in house value/tax base from foreclosure effect is given by
÷×××= (2). 18 In 2005 HMDA data, there are total of 387 MSAs. For these MSAs, there are total of 1,158 counties and 53,293
census tracts. In 2006 HMDA data, there are total of 387 MSAs. For these MSAs, there are total of 1,158 counties and 53,245 census tracts. Combining both years yields 56,777 census tracts.

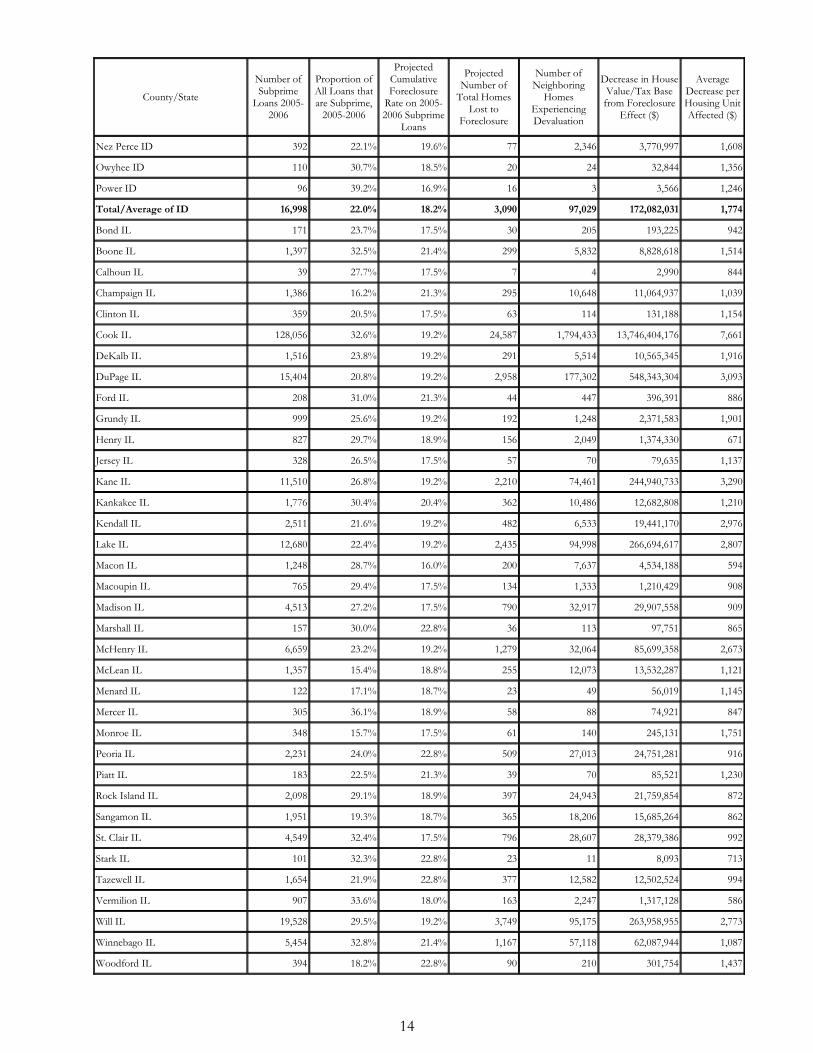
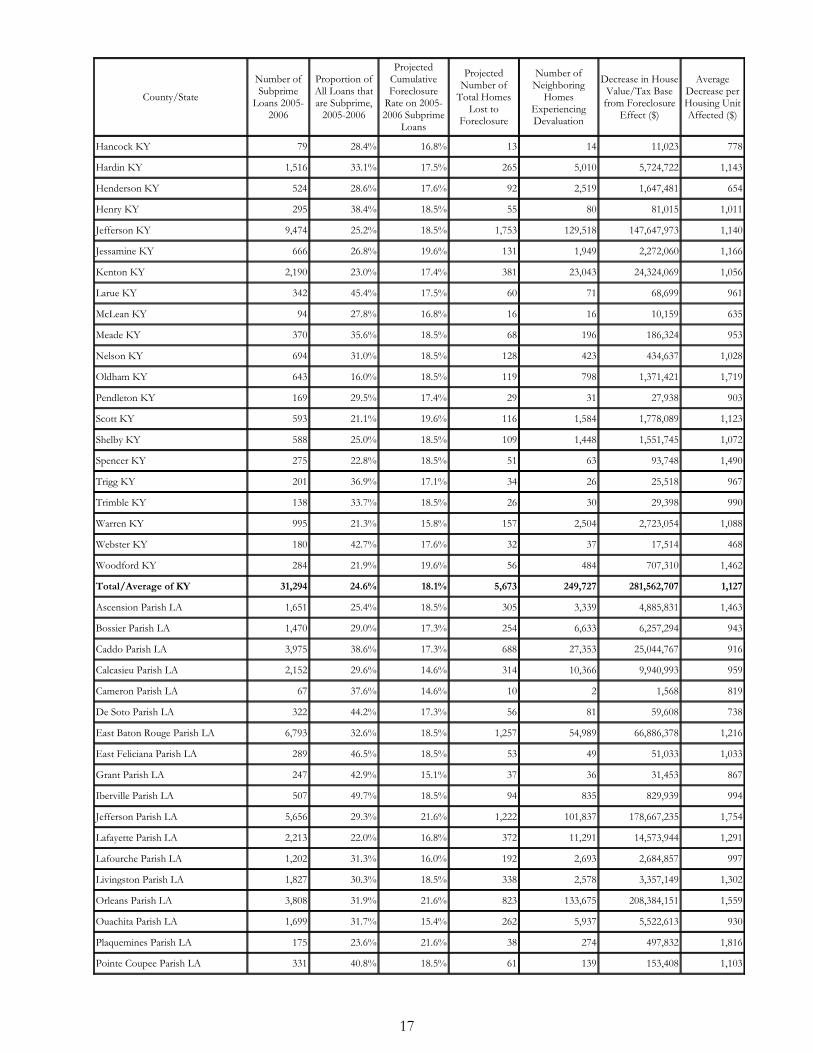
Appendix 1: Foreclosure “Spillover” Impact on Neighboring Homes and Local Tax Bases by County and State
Revision 1-18-2008 The analysis underlying this table is conducted at the census tract level and then aggregated to larger geographies of interest. The previous version of this table aggregated all census tracts in an MSA wholly or partially within a county to the county and state level. This created some confusion for readers. Consequently, we are revising the results using weighting factors provided by the U.S. Census Bureau to provide an estimate only for homes within the formal county boundaries. In addition, we wish to stress that reductions in a county's tax base can deviate from reductions in house values where appraised value deviates from market value. For example, this may occur when changes in appraised values are restricted by law.
County/State
Number of Subprime
Loans 2005-2006
Proportion of All Loans that are Subprime,
2005-2006
Projected Cumulative Foreclosure
Rate on 2005-2006 Subprime
Loans
Projected Number of
Total Homes Lost to
Foreclosure
Number of Neighboring
Homes Experiencing Devaluation
Decrease in House Value/Tax Base
from Foreclosure Effect ($)
Average Decrease per Housing Unit Affected ($)
Anchorage Borough AK 3,539 21.9% 17.1% 605 42,768 98,997,774 2,315
Fairbanks North Star Borough AK 884 23.5% 16.7% 148 3,630 6,539,397 1,801
Matanuska-Susitna Borough AK 1,331 25.8% 17.1% 228 1,006 2,051,898 2,040
Total/Average of AK 5,754 22.9% 17.0% 980 47,404 107,589,070 2,270
Autauga AL 543 22.4% 16.9% 92 1,342 1,546,906 1,153
Bibb AL 241 39.1% 16.5% 40 31 29,529 944
Blount AL 847 32.2% 16.5% 140 236 267,929 1,133
Calhoun AL 1,619 34.1% 15.8% 256 3,143 2,869,378 913
Chilton AL 618 38.0% 16.5% 102 263 279,298 1,064
Colbert AL 860 32.2% 19.4% 167 3,035 2,546,568 839
Elmore AL 882 22.3% 16.9% 149 643 757,354 1,178
Etowah AL 1,514 34.3% 15.8% 239 3,831 2,601,689 679
Geneva AL 317 43.0% 15.4% 49 60 43,821 731
Greene AL 99 60.0% 15.5% 15 7 5,291 736
Hale AL 158 33.4% 15.5% 24 19 16,347 865
Henry AL 251 37.6% 15.4% 39 51 48,988 961
Houston AL 1,294 29.6% 15.4% 199 3,491 3,776,405 1,082
Jefferson AL 12,754 34.2% 16.5% 2,104 83,343 90,111,463 1,081
Lauderdale AL 1,001 26.2% 19.4% 194 3,617 3,171,510 877
Lawrence AL 433 40.5% 14.9% 65 112 100,090 892
Lee AL 1,290 21.4% 17.6% 227 3,171 4,323,345 1,363
Limestone AL 894 24.5% 16.0% 143 745 817,464 1,097
Lowndes AL 115 45.6% 16.9% 19 8 5,409 675
Madison AL 4,090 24.0% 16.0% 654 18,693 20,604,499 1,102
Mobile AL 6,491 36.8% 17.6% 1,142 38,592 43,179,259 1,119
Montgomery AL 2,950 31.5% 16.9% 499 23,690 25,392,889 1,072
Morgan AL 1,578 32.7% 14.9% 235 5,087 4,696,246 923
Russell AL 682 41.0% 17.0% 116 2,360 2,042,380 865
Shelby AL 2,853 18.8% 16.5% 471 6,312 11,651,930 1,846
St. Clair AL 1,279 27.3% 16.5% 211 638 889,323 1,395
7

County/State
Number of Subprime
Loans 2005-2006
Proportion of All Loans that are Subprime,
2005-2006
Projected Cumulative Foreclosure
Rate on 2005-2006 Subprime
Loans
Projected Number of
Total Homes Lost to
Foreclosure
Number of Neighboring
Homes Experiencing Devaluation
Decrease in House Value/Tax Base
from Foreclosure Effect ($)
Average Decrease per Housing Unit Affected ($)
Tuscaloosa AL 1,867 23.5% 15.5% 289 6,016 7,098,769 1,180
Walker AL 814 37.3% 16.5% 134 515 516,628 1,002
Total/Average of AL 48,334 29.8% 16.6% 8,015 209,052 229,390,708 1,097
Benton AR 3,099 20.1% 18.4% 570 5,959 7,928,711 1,330
Cleveland AR 82 41.6% 15.8% 13 4 2,502 603
Craighead AR 1,043 29.4% 15.2% 159 2,194 2,079,555 948
Crawford AR 916 39.9% 15.8% 145 775 712,300 919
Crittenden AR 601 39.8% 17.9% 108 2,790 2,083,440 747
Faulkner AR 1,089 23.1% 17.4% 189 2,187 2,564,759 1,172
Franklin AR 268 49.4% 15.8% 42 47 33,303 705
Garland AR 1,059 24.2% 17.1% 181 3,215 3,118,143 970
Grant AR 184 31.6% 17.4% 32 88 86,429 980
Jefferson AR 673 35.8% 15.8% 106 3,028 2,032,697 671
Lincoln AR 76 48.1% 15.8% 12 27 18,483 687
Lonoke AR 868 32.0% 17.4% 151 803 932,426 1,162
Madison AR 275 41.2% 18.4% 51 72 73,597 1,029
Miller AR 466 37.7% 14.8% 69 2,017 1,442,564 715
Perry AR 75 32.5% 17.4% 13 8 6,462 785
Poinsett AR 395 62.2% 15.2% 60 281 166,940 593
Pulaski AR 4,311 26.7% 17.4% 750 31,083 33,222,152 1,069
Saline AR 1,141 23.8% 17.4% 199 2,157 2,395,103 1,110
Sebastian AR 1,314 31.0% 15.8% 208 6,795 5,283,020 777
Washington AR 2,491 21.9% 18.4% 458 7,819 9,997,720 1,279
Total/Average of AR 20,426 26.4% 17.2% 3,516 71,351 74,180,307 1,040
Coconino AZ 1,025 15.7% 12.0% 123 2,112 5,935,713 2,811
Maricopa AZ 130,941 28.4% 21.1% 27,629 961,548 4,354,493,937 4,529
Pima AZ 19,205 23.9% 21.6% 4,148 186,010 430,547,982 2,315
Pinal AZ 12,463 30.6% 21.1% 2,630 18,795 59,825,951 3,183
Yavapai AZ 3,422 20.0% 19.6% 671 8,293 18,520,938 2,233
Yuma AZ 3,357 27.7% 16.7% 561 24,568 44,049,898 1,793
Total/Average of AZ 170,413 27.6% 21.0% 35,761 1,201,327 4,913,374,417 4,090
Alameda CA 22,022 17.8% 21.3% 4,691 379,590 3,209,331,506 8,455
Butte CA 2,880 21.5% 20.2% 582 13,921 35,180,029 2,527
Contra Costa CA 23,451 19.3% 21.3% 4,995 201,419 1,433,191,205 7,115
El Dorado CA 2,906 15.4% 21.0% 610 8,973 34,797,505 3,878
Fresno CA 22,625 32.2% 23.5% 5,317 190,811 732,517,048 3,839
Imperial CA 4,953 40.0% 13.5% 669 19,712 55,220,070 2,801
Kern CA 27,632 36.0% 24.2% 6,687 157,124 786,543,277 5,006
Kings CA 3,139 34.6% 17.6% 552 20,361 44,912,558 2,206
Los Angeles CA 176,557 26.3% 22.0% 38,843 2,545,978 27,257,444,619 10,706
8

County/State
Number of Subprime
Loans 2005-2006
Proportion of All Loans that are Subprime,
2005-2006
Projected Cumulative Foreclosure
Rate on 2005-2006 Subprime
Loans
Projected Number of
Total Homes Lost to
Foreclosure
Number of Neighboring
Homes Experiencing Devaluation
Decrease in House Value/Tax Base
from Foreclosure Effect ($)
Average Decrease per Housing Unit Affected ($)
Madera CA 4,209 33.0% 20.9% 880 15,473 47,159,626 3,048
Marin CA 1,377 7.0% 16.7% 230 14,262 110,369,956 7,739
Merced CA 8,092 32.5% 25.0% 2,023 38,900 142,562,221 3,665
Monterey CA 6,160 21.3% 20.4% 1,257 52,234 419,598,107 8,033
Napa CA 1,536 14.1% 16.4% 252 11,276 48,482,111 4,300
Orange CA 37,985 17.2% 22.8% 8,661 670,470 5,750,060,854 8,576
Placer CA 5,620 15.1% 21.0% 1,180 37,067 151,639,311 4,091
Riverside CA 81,576 31.4% 22.6% 18,436 398,158 2,804,543,196 7,044
Sacramento CA 38,404 26.4% 21.0% 8,065 357,729 1,769,137,711 4,945
San Benito CA 1,247 22.4% 19.3% 241 8,787 52,176,233 5,938
San Bernardino CA 81,137 35.3% 22.6% 18,337 423,605 2,989,697,004 7,058
San Diego CA 42,146 17.3% 21.4% 9,019 634,465 3,661,377,161 5,771
San Francisco CA 3,117 8.7% 16.7% 521 156,181 1,472,954,929 9,431
San Joaquin CA 23,719 30.3% 23.4% 5,550 152,937 1,104,302,126 7,221
San Luis Obispo CA 2,094 11.6% 13.6% 285 9,774 37,841,451 3,872
San Mateo CA 6,191 11.7% 16.7% 1,034 117,151 950,357,299 8,112
Santa Barbara CA 3,838 15.2% 19.6% 752 44,688 224,321,571 5,020
Santa Clara CA 17,764 13.3% 19.3% 3,428 293,272 2,526,741,252 8,616
Santa Cruz CA 2,098 12.2% 14.5% 304 19,839 103,677,075 5,226
Shasta CA 3,154 23.1% 19.7% 621 13,197 31,617,857 2,396
Solano CA 12,794 25.9% 23.8% 3,045 97,550 780,078,382 7,997
Sonoma CA 5,290 13.3% 21.1% 1,116 56,653 260,492,938 4,598
Stanislaus CA 17,406 29.8% 17.1% 2,976 115,051 506,525,419 4,403
Sutter CA 2,147 25.7% 17.6% 378 12,351 29,541,118 2,392
Tulare CA 11,089 35.4% 22.2% 2,462 68,324 221,718,653 3,245
Ventura CA 11,250 16.1% 17.6% 1,980 114,188 730,421,895 6,397
Yolo CA 2,737 19.7% 21.0% 575 24,471 90,249,143 3,688
Yuba CA 2,182 31.5% 17.6% 384 9,640 24,171,840 2,508
Total/Average of CA 722,524 24.0% 21.7% 156,937 7,505,584 60,630,954,254 8,078
Adams CO 9,327 31.7% 20.6% 1,921 89,104 204,685,008 2,297
Arapahoe CO 10,158 25.3% 20.6% 2,093 136,918 355,668,478 2,598
Boulder CO 1,984 10.2% 16.8% 333 18,829 47,618,657 2,529
Clear Creek CO 187 21.7% 20.6% 39 69 141,387 2,063
Denver CO 10,400 25.1% 20.6% 2,142 196,017 597,819,732 3,050
Douglas CO 4,146 13.7% 20.6% 854 19,306 52,450,588 2,717
El Paso CO 9,573 23.2% 18.4% 1,761 95,598 175,833,933 1,839
Elbert CO 490 20.9% 20.6% 101 91 243,756 2,681
Gilpin CO 124 21.7% 20.6% 26 25 52,757 2,153
Jefferson CO 7,203 18.2% 20.6% 1,484 105,067 231,971,129 2,208
Larimer CO 3,156 15.3% 15.8% 499 19,506 37,166,515 1,905
9

County/State
Number of Subprime
Loans 2005-2006
Proportion of All Loans that are Subprime,
2005-2006
Projected Cumulative Foreclosure
Rate on 2005-2006 Subprime
Loans
Projected Number of
Total Homes Lost to
Foreclosure
Number of Neighboring
Homes Experiencing Devaluation
Decrease in House Value/Tax Base
from Foreclosure Effect ($)
Average Decrease per Housing Unit Affected ($)
Mesa CO 2,677 24.4% 19.2% 514 17,618 31,776,106 1,804
Park CO 490 25.7% 20.6% 101 50 104,998 2,092
Pueblo CO 3,624 37.9% 17.5% 634 30,903 36,289,473 1,174
Teller CO 472 21.6% 18.4% 87 299 652,353 2,181
Weld CO 4,564 25.5% 19.5% 890 19,254 27,766,859 1,442
Total/Average of CO 68,575 22.2% 19.7% 13,479 748,652 1,800,241,728 2,405
Fairfield CT 12,552 19.5% 10.5% 1,318 118,494 424,638,223 3,584
Hartford CT 13,234 24.8% 14.2% 1,879 128,713 260,004,353 2,020
Middlesex CT 1,943 16.8% 14.2% 276 8,872 16,529,626 1,863
New Haven CT 15,299 27.4% 16.0% 2,448 159,366 399,428,512 2,506
New London CT 4,045 22.9% 15.1% 611 20,585 43,140,252 2,096
Tolland CT 1,555 17.7% 14.2% 221 4,988 9,614,145 1,927
Total/Average of CT 48,628 23.0% 13.9% 6,753 441,018 1,153,355,110 2,615
District of Columbia DC 9,432 20.9% 22.8% 2,150 223,797 2,424,999,273 10,836
Total/Average of DC 9,432 20.9% 22.8% 2,150 223,797 2,424,999,273 10,836
Kent DE 2,828 27.1% 17.6% 498 6,521 12,891,361 1,977
New Castle DE 9,490 24.7% 14.1% 1,338 84,094 207,488,483 2,467
Total/Average of DE 12,318 25.2% 14.9% 1,836 90,615 220,379,843 2,432
Alachua FL 2,600 21.0% 18.0% 468 15,365 21,684,777 1,411
Baker FL 318 28.8% 16.1% 51 86 125,675 1,466
Bay FL 2,383 23.7% 9.9% 236 8,802 15,568,238 1,769
Brevard FL 13,163 26.5% 16.4% 2,159 85,130 159,902,598 1,878
Broward FL 64,192 35.2% 17.9% 11,490 642,030 4,312,654,435 6,717
Charlotte FL 4,016 27.9% 15.3% 614 20,631 36,692,701 1,779
Clay FL 4,245 27.9% 16.1% 683 14,685 28,919,983 1,969
Collier FL 7,427 25.7% 13.2% 980 29,252 129,496,121 4,427
Duval FL 22,775 34.3% 16.1% 3,667 177,609 300,566,524 1,692
Escambia FL 5,354 32.4% 14.0% 750 29,142 37,257,312 1,278
Gadsden FL 675 42.9% 14.0% 95 210 263,528 1,255
Gilchrist FL 145 31.3% 18.0% 26 22 32,156 1,442
Hernando FL 5,442 33.7% 16.8% 914 23,021 39,061,013 1,697
Hillsborough FL 34,700 32.7% 16.8% 5,830 260,290 674,460,992 2,591
Indian River FL 2,848 25.7% 19.4% 553 13,726 26,890,703 1,959
Jefferson FL 172 34.6% 14.0% 24 13 16,984 1,268
Lake FL 7,270 28.4% 18.8% 1,367 20,446 39,575,612 1,936
Lee FL 23,844 35.4% 14.4% 3,434 96,196 226,618,601 2,356
Leon FL 3,318 22.0% 14.0% 465 15,908 24,244,571 1,524
Manatee FL 6,678 24.4% 15.6% 1,042 57,967 121,174,590 2,090
Marion FL 7,165 31.8% 17.0% 1,218 16,080 25,583,046 1,591
Martin FL 2,029 19.4% 11.5% 233 8,145 24,966,368 3,065
10

County/State
Number of Subprime
Loans 2005-2006
Proportion of All Loans that are Subprime,
2005-2006
Projected Cumulative Foreclosure
Rate on 2005-2006 Subprime
Loans
Projected Number of
Total Homes Lost to
Foreclosure
Number of Neighboring
Homes Experiencing Devaluation
Decrease in House Value/Tax Base
from Foreclosure Effect ($)
Average Decrease per Housing Unit Affected ($)
Miami-Dade FL 87,773 42.0% 19.6% 17,204 786,452 10,488,113,377 13,336
Nassau FL 966 21.3% 16.1% 156 1,367 3,414,746 2,497
Okaloosa FL 2,903 21.8% 15.6% 453 19,494 40,813,147 2,094
Orange FL 34,836 32.2% 18.8% 6,549 255,307 740,516,349 2,900
Osceola FL 12,082 39.9% 18.8% 2,271 40,220 134,369,200 3,341
Palm Beach FL 34,108 28.1% 14.4% 4,912 308,885 1,057,403,283 3,423
Pasco FL 14,121 32.0% 16.8% 2,372 84,678 168,390,489 1,989
Pinellas FL 21,877 28.8% 16.8% 3,675 310,826 712,899,509 2,294
Polk FL 16,548 38.6% 10.9% 1,804 44,944 69,017,977 1,536
Santa Rosa FL 2,485 23.1% 14.0% 348 4,392 8,015,811 1,825
Sarasota FL 8,378 23.9% 15.6% 1,307 59,526 147,322,658 2,475
Seminole FL 10,176 25.1% 18.8% 1,913 93,739 234,503,991 2,502
St. Johns FL 2,704 16.0% 16.1% 435 6,118 16,431,919 2,686
St. Lucie FL 11,573 37.3% 11.5% 1,331 36,645 68,365,954 1,866
Volusia FL 14,968 33.2% 15.4% 2,305 79,778 145,188,656 1,820
Wakulla FL 484 30.2% 14.0% 68 102 171,937 1,684
Total/Average of FL 496,741 32.4% 16.8% 83,400 3,667,230 20,280,695,532 5,530
Baker GA 15 50.0% 16.1% 2 1 526 764
Barrow GA 1,794 34.6% 16.2% 291 1,889 2,376,303 1,258
Bartow GA 1,637 28.5% 16.2% 265 1,424 1,844,899 1,296
Bibb GA 2,527 39.6% 16.5% 417 12,084 10,205,982 845
Brantley GA 91 36.0% 16.3% 15 10 10,095 979
Brooks GA 243 49.9% 16.5% 40 45 37,847 833
Bryan GA 381 18.5% 18.7% 71 128 243,947 1,908
Burke GA 201 41.7% 16.7% 34 20 16,908 826
Butts GA 411 35.5% 16.2% 67 152 161,700 1,067
Carroll GA 2,219 35.7% 16.2% 359 1,945 2,226,024 1,145
Catoosa GA 1,173 31.5% 18.1% 212 2,802 2,994,458 1,069
Chatham GA 3,733 27.0% 18.7% 698 33,163 46,044,284 1,388
Chattahoochee GA 31 48.4% 17.0% 5 5 4,427 881
Cherokee GA 3,759 20.0% 16.2% 609 9,307 16,752,699 1,800
Clarke GA 1,005 22.8% 17.3% 174 4,280 5,881,275 1,374
Clayton GA 7,544 52.7% 16.2% 1,222 46,512 54,269,523 1,167
Cobb GA 11,128 22.3% 16.2% 1,803 68,771 115,934,710 1,686
Columbia GA 1,197 16.7% 16.7% 200 3,955 5,942,412 1,502
Coweta GA 2,079 22.8% 16.2% 337 1,972 2,947,573 1,495
Crawford GA 123 43.2% 16.5% 20 16 14,967 944
Dade GA 260 34.1% 18.1% 47 85 86,330 1,020
Dawson GA 414 25.2% 16.2% 67 141 247,358 1,759
DeKalb GA 15,467 35.2% 16.2% 2,506 115,708 184,523,833 1,595
11

County/State
Number of Subprime
Loans 2005-2006
Proportion of All Loans that are Subprime,
2005-2006
Projected Cumulative Foreclosure
Rate on 2005-2006 Subprime
Loans
Projected Number of
Total Homes Lost to
Foreclosure
Number of Neighboring
Homes Experiencing Devaluation
Decrease in House Value/Tax Base
from Foreclosure Effect ($)
Average Decrease per Housing Unit Affected ($)
Dougherty GA 1,145 41.7% 16.1% 184 4,987 4,527,022 908
Douglas GA 3,345 36.4% 16.2% 542 7,193 9,585,344 1,333
Echols GA 25 39.1% 16.5% 4 1 1,427 1,100
Effingham GA 816 27.0% 18.7% 153 349 589,788 1,690
Fayette GA 1,675 20.7% 16.2% 271 2,942 6,290,369 2,138
Floyd GA 1,019 29.1% 16.3% 166 2,216 2,019,883 911
Forsyth GA 2,190 13.7% 16.2% 355 3,097 6,986,380 2,256
Fulton GA 17,704 26.4% 16.2% 2,868 142,211 315,728,770 2,220
Glynn GA 1,134 24.3% 16.3% 185 2,648 4,227,554 1,597
Gwinnett GA 15,234 26.1% 16.2% 2,468 72,643 121,285,265 1,670
Hall GA 2,505 24.4% 19.1% 478 4,864 7,640,604 1,571
Haralson GA 528 34.1% 16.2% 86 194 185,587 957
Harris GA 482 23.5% 17.0% 82 95 159,953 1,688
Heard GA 252 51.5% 16.2% 41 31 28,400 909
Henry GA 5,105 31.8% 16.2% 827 7,916 11,825,557 1,494
Houston GA 1,807 29.1% 17.1% 309 7,069 7,188,739 1,017
Jasper GA 270 34.9% 16.2% 44 36 37,172 1,026
Jones GA 460 35.5% 16.5% 76 221 232,650 1,054
Lamar GA 297 38.9% 16.2% 48 86 82,599 956
Lanier GA 155 51.3% 16.5% 26 28 24,377 866
Lee GA 406 24.5% 16.1% 65 211 301,859 1,433
Liberty GA 655 40.3% 18.3% 120 2,409 2,692,255 1,117
Long GA 110 48.2% 18.3% 20 10 10,858 1,041
Lowndes GA 1,193 29.7% 16.5% 197 4,553 4,649,949 1,021
Madison GA 371 33.2% 17.3% 64 146 171,268 1,169
Marion GA 89 43.4% 17.0% 15 6 6,024 951
McDuffie GA 237 38.2% 16.7% 40 115 119,246 1,038
McIntosh GA 171 37.0% 16.3% 28 19 24,770 1,303
Meriwether GA 446 47.8% 16.2% 72 91 74,390 821
Monroe GA 404 32.3% 16.5% 67 85 93,907 1,106
Murray GA 463 33.9% 18.0% 83 350 415,926 1,190
Muscogee GA 2,872 36.6% 17.0% 488 24,111 25,524,487 1,059
Newton GA 3,084 40.6% 16.2% 500 3,614 4,630,484 1,281
Oconee GA 337 14.6% 17.3% 58 213 453,421 2,133
Oglethorpe GA 301 40.1% 17.3% 52 49 57,007 1,171
Paulding GA 3,568 29.9% 16.2% 578 4,001 5,265,352 1,316
Pickens GA 535 28.5% 16.2% 87 258 360,923 1,397
Pike GA 319 31.6% 16.2% 52 62 82,070 1,329
Richmond GA 2,171 36.0% 16.7% 363 12,749 13,511,526 1,060
Rockdale GA 2,192 38.5% 16.2% 355 5,583 8,933,860 1,600
12

Number of Subprime
Loans 2005-2006
County/State
Proportion of All Loans that are Subprime,
2005-2006
Projected Cumulative Foreclosure
Rate on 2005-2006 Subprime
Loans
Projected Number of
Total Homes Lost to
Foreclosure
Number of Neighboring
Homes Experiencing Devaluation
Decrease in House Value/Tax Base
from Foreclosure Effect ($)
Average Decrease per Housing Unit Affected ($)
Spalding GA 1,176 39.8% 16.2% 191 2,030 1,972,625 972
Terrell GA 331 75.2% 16.1% 53 74 47,292 635
Twiggs GA 93 47.2% 16.5% 15 10 7,018 722
Walker GA 1,370 38.5% 18.1% 248 2,680 2,302,433 859
Walton GA 1,672 28.0% 16.2% 271 1,232 1,670,445 1,356
Whitfield GA 1,122 26.2% 18.0% 202 2,276 3,025,295 1,329
Worth GA 188 41.0% 16.1% 30 39 32,956 844
Total/Average of GA 139,456 28.8% 16.5% 22,987 630,218 1,027,853,169 1,631
Honolulu HI 9,256 19.4% 20.6% 1,907 167,942 2,352,721,872 14,009
Total/Average of HI 9,256 19.4% 20.6% 1,907 167,942 2,352,721,872 14,009
Benton IA 395 25.4% 17.8% 70 241 198,096 823
Black Hawk IA 1,472 20.7% 17.9% 263 12,169 9,919,410 815
Bremer IA 228 15.2% 17.9% 41 163 170,678 1,049
Dallas IA 777 16.1% 18.9% 147 1,071 1,212,312 1,132
Dubuque IA 791 16.0% 16.7% 132 7,497 7,301,632 974
Grundy IA 159 21.8% 17.9% 28 22 20,642 949
Guthrie IA 275 40.6% 18.9% 52 34 27,727 814
Harrison IA 271 32.8% 17.5% 47 137 120,692 878
Johnson IA 541 8.9% 18.1% 98 3,292 4,805,898 1,460
Jones IA 270 25.3% 17.8% 48 253 231,829 917
Linn IA 2,378 18.7% 17.8% 423 22,823 24,092,152 1,056
Madison IA 327 27.3% 18.9% 62 425 445,307 1,047
Mills IA 254 31.9% 17.5% 44 306 338,448 1,105
Polk IA 7,226 24.4% 18.9% 1,366 73,225 90,452,933 1,235
Pottawattamie IA 1,754 32.1% 17.5% 307 14,656 14,277,576 974
Scott IA 2,571 27.8% 18.9% 486 25,873 26,390,734 1,020
Story IA 561 15.0% 17.5% 98 1,993 2,824,851 1,417
Warren IA 699 24.4% 18.9% 132 1,329 1,699,082 1,278
Washington IA 249 21.9% 18.1% 45 252 244,761 973
Woodbury IA 1,469 32.2% 17.4% 256 12,405 9,717,107 783
Total/Average of IA 22,667 22.5% 18.3% 4,146 178,166 194,491,865 1,092
Ada ID 6,186 17.9% 18.5% 1,144 47,769 94,636,051 1,981
Bannock ID 979 20.7% 16.9% 165 7,421 8,073,274 1,088
Boise ID 113 21.3% 18.5% 21 2 4,996 2,130
Bonneville ID 1,387 22.9% 17.1% 237 8,401 10,238,350 1,219
Canyon ID 4,458 31.2% 18.5% 825 20,856 34,587,291 1,658
Franklin ID 162 28.6% 17.1% 28 10 12,069 1,184
Gem ID 305 27.1% 18.5% 56 367 584,506 1,591
Jefferson ID 342 24.2% 17.1% 58 137 179,994 1,316
Kootenai ID 2,468 21.2% 17.9% 442 9,693 19,958,094 2,059
13
Number of Subprime
Loans 2005-2006
County/State
Proportion of All Loans that are Subprime,
2005-2006
Projected Cumulative Foreclosure
Rate on 2005-2006 Subprime
Loans
Projected Number of
Total Homes Lost to
Foreclosure
Number of Neighboring
Homes Experiencing Devaluation
Decrease in House Value/Tax Base
from Foreclosure Effect ($)
Average Decrease per Housing Unit Affected ($)
Nez Perce ID 392 22.1% 19.6% 77 2,346 3,770,997 1,608
Owyhee ID 110 30.7% 18.5% 20 24 32,844 1,356
Power ID 96 39.2% 16.9% 16 3 3,566 1,246
Total/Average of ID 16,998 22.0% 18.2% 3,090 97,029 172,082,031 1,774
Bond IL 171 23.7% 17.5% 30 205 193,225 942
Boone IL 1,397 32.5% 21.4% 299 5,832 8,828,618 1,514
Calhoun IL 39 27.7% 17.5% 7 4 2,990 844
Champaign IL 1,386 16.2% 21.3% 295 10,648 11,064,937 1,039
Clinton IL 359 20.5% 17.5% 63 114 131,188 1,154
Cook IL 128,056 32.6% 19.2% 24,587 1,794,433 13,746,404,176 7,661
DeKalb IL 1,516 23.8% 19.2% 291 5,514 10,565,345 1,916
DuPage IL 15,404 20.8% 19.2% 2,958 177,302 548,343,304 3,093
Ford IL 208 31.0% 21.3% 44 447 396,391 886
Grundy IL 999 25.6% 19.2% 192 1,248 2,371,583 1,901
Henry IL 827 29.7% 18.9% 156 2,049 1,374,330 671
Jersey IL 328 26.5% 17.5% 57 70 79,635 1,137
Kane IL 11,510 26.8% 19.2% 2,210 74,461 244,940,733 3,290
Kankakee IL 1,776 30.4% 20.4% 362 10,486 12,682,808 1,210
Kendall IL 2,511 21.6% 19.2% 482 6,533 19,441,170 2,976
Lake IL 12,680 22.4% 19.2% 2,435 94,998 266,694,617 2,807
Macon IL 1,248 28.7% 16.0% 200 7,637 4,534,188 594
Macoupin IL 765 29.4% 17.5% 134 1,333 1,210,429 908
Madison IL 4,513 27.2% 17.5% 790 32,917 29,907,558 909
Marshall IL 157 30.0% 22.8% 36 113 97,751 865
McHenry IL 6,659 23.2% 19.2% 1,279 32,064 85,699,358 2,673
McLean IL 1,357 15.4% 18.8% 255 12,073 13,532,287 1,121
Menard IL 122 17.1% 18.7% 23 49 56,019 1,145
Mercer IL 305 36.1% 18.9% 58 88 74,921 847
Monroe IL 348 15.7% 17.5% 61 140 245,131 1,751
Peoria IL 2,231 24.0% 22.8% 509 27,013 24,751,281 916
Piatt IL 183 22.5% 21.3% 39 70 85,521 1,230
Rock Island IL 2,098 29.1% 18.9% 397 24,943 21,759,854 872
Sangamon IL 1,951 19.3% 18.7% 365 18,206 15,685,264 862
St. Clair IL 4,549 32.4% 17.5% 796 28,607 28,379,386 992
Stark IL 101 32.3% 22.8% 23 11 8,093 713
Tazewell IL 1,654 21.9% 22.8% 377 12,582 12,502,524 994
Vermilion IL 907 33.6% 18.0% 163 2,247 1,317,128 586
Will IL 19,528 29.5% 19.2% 3,749 95,175 263,958,955 2,773
Winnebago IL 5,454 32.8% 21.4% 1,167 57,118 62,087,944 1,087
Woodford IL 394 18.2% 22.8% 90 210 301,754 1,437
14

Number of Subprime
Loans 2005-2006
County/State
Proportion of All Loans that are Subprime,
2005-2006
Projected Cumulative Foreclosure
Rate on 2005-2006 Subprime
Loans
Projected Number of
Total Homes Lost to
Foreclosure
Number of Neighboring
Homes Experiencing Devaluation
Decrease in House Value/Tax Base
from Foreclosure Effect ($)
Average Decrease per Housing Unit Affected ($)
Total/Average of IL 233,691 28.6% 19.2% 44,977 2,536,938 15,439,710,395 6,086
Allen IN 5,003 27.7% 17.4% 871 45,426 35,503,102 782
Bartholomew IN 834 21.7% 17.1% 143 3,056 3,513,467 1,150
Benton IN 117 33.2% 17.4% 20 10 7,160 750
Boone IN 673 18.3% 16.9% 114 2,046 2,430,612 1,188
Brown IN 240 23.2% 16.9% 41 66 85,436 1,304
Carroll IN 244 25.1% 17.4% 42 173 147,948 853
Clark IN 1,729 27.8% 18.5% 320 11,123 11,338,278 1,019
Clay IN 359 28.9% 17.5% 63 569 418,564 736
Dearborn IN 754 23.0% 17.4% 131 793 989,347 1,248
Delaware IN 1,524 32.1% 17.9% 273 10,482 6,670,337 636
Elkhart IN 2,921 28.6% 18.7% 546 14,615 14,154,357 968
Floyd IN 900 22.5% 18.5% 167 7,242 7,619,483 1,052
Franklin IN 216 21.7% 17.4% 38 79 83,850 1,062
Gibson IN 380 28.4% 17.6% 67 916 612,116 668
Greene IN 406 32.0% 17.1% 69 696 500,014 719
Hamilton IN 3,119 14.6% 16.9% 527 9,646 16,827,903 1,745
Hancock IN 1,017 23.1% 16.9% 172 2,134 2,592,671 1,215
Harrison IN 351 19.7% 18.5% 65 122 138,550 1,132
Hendricks IN 1,999 21.2% 16.9% 338 4,690 6,609,868 1,409
Howard IN 1,516 33.2% 19.1% 290 14,418 10,456,136 725
Jasper IN 475 28.8% 17.9% 85 173 234,884 1,359
Johnson IN 2,130 24.9% 16.9% 360 11,028 14,117,144 1,280
La Porte IN 1,724 33.2% 18.5% 319 9,890 10,416,643 1,053
Lake IN 9,795 35.7% 17.9% 1,753 91,574 109,933,832 1,200
Madison IN 2,290 37.7% 18.1% 414 13,980 9,390,738 672
Marion IN 15,556 35.4% 16.9% 2,629 178,288 175,041,931 982
Monroe IN 1,057 18.6% 17.1% 181 4,121 5,445,835 1,322
Morgan IN 1,234 28.2% 16.9% 209 3,373 3,461,887 1,026
Newton IN 309 43.1% 17.9% 55 50 57,762 1,147
Ohio IN 91 26.4% 17.4% 16 73 77,846 1,070
Owen IN 328 33.7% 17.1% 56 111 116,045 1,042
Porter IN 2,431 24.1% 17.9% 435 11,194 16,283,751 1,455
Posey IN 285 23.4% 17.6% 50 725 665,872 918
Putnam IN 506 26.1% 16.9% 86 227 243,395 1,071
Shelby IN 650 29.1% 16.9% 110 3,233 2,879,814 891
St. Joseph IN 4,187 29.1% 16.7% 699 37,958 33,190,414 874
Sullivan IN 307 40.2% 17.5% 54 228 162,821 715
Tippecanoe IN 1,162 18.9% 17.4% 202 8,602 8,417,263 979
Tipton IN 254 27.5% 19.1% 49 115 97,076 844
15

Number of Subprime
Loans 2005-2006
County/State
Proportion of All Loans that are Subprime,
2005-2006
Projected Cumulative Foreclosure
Rate on 2005-2006 Subprime
Loans
Projected Number of
Total Homes Lost to
Foreclosure
Number of Neighboring
Homes Experiencing Devaluation
Decrease in House Value/Tax Base
from Foreclosure Effect ($)
Average Decrease per Housing Unit Affected ($)
Vanderburgh IN 2,211 26.0% 17.6% 389 25,647 20,397,539 795
Vermillion IN 257 35.3% 17.5% 45 672 399,691 595
Vigo IN 1,551 33.0% 17.5% 271 12,031 7,349,854 611
Warrick IN 653 18.2% 17.6% 115 1,758 2,185,033 1,243
Washington IN 380 30.6% 18.5% 70 687 526,799 767
Wells IN 372 24.4% 17.4% 65 666 535,515 804
Whitley IN 455 22.7% 17.4% 79 285 291,717 1,025
Total/Average of IN 74,952 28.0% 17.5% 13,091 544,991 542,620,299 996
Butler KS 844 25.6% 17.8% 150 2,481 2,281,340 920
Doniphan KS 89 39.4% 18.1% 16 11 8,315 763
Douglas KS 822 14.3% 18.7% 154 4,982 7,511,987 1,508
Franklin KS 481 33.9% 18.7% 90 673 620,395 922
Harvey KS 353 22.3% 17.8% 63 531 446,253 840
Jackson KS 204 26.9% 18.3% 37 59 51,303 873
Jefferson KS 313 27.7% 18.3% 57 44 46,093 1,058
Johnson KS 6,302 16.3% 18.7% 1,178 58,902 101,803,123 1,728
Leavenworth KS 1,232 28.0% 18.7% 230 6,567 5,793,784 882
Linn KS 148 34.3% 18.7% 28 11 7,910 743
Miami KS 646 27.5% 18.7% 121 374 425,976 1,139
Osage KS 357 42.2% 18.3% 65 128 114,010 894
Sedgwick KS 6,450 26.8% 17.8% 1,148 65,540 53,428,159 815
Shawnee KS 2,182 24.9% 18.3% 399 19,311 15,601,209 808
Sumner KS 410 38.5% 17.8% 73 128 92,348 720
Wabaunsee KS 99 32.9% 18.3% 18 4 2,916 792
Wyandotte KS 4,189 47.7% 18.7% 783 40,659 28,063,414 690
Total/Average of KS 25,121 24.2% 18.4% 4,612 200,403 216,298,535 1,079
Boone KY 1,619 20.2% 17.4% 282 6,942 9,653,817 1,391
Bourbon KY 218 28.3% 19.6% 43 586 582,589 994
Boyd KY 639 30.0% 16.3% 104 3,243 2,689,663 829
Bracken KY 103 31.1% 17.4% 18 16 12,578 796
Bullitt KY 1,250 28.7% 18.5% 231 3,442 4,008,206 1,164
Campbell KY 1,069 20.4% 17.4% 186 11,928 13,260,934 1,112
Christian KY 591 31.7% 17.1% 101 1,752 1,478,344 844
Clark KY 502 26.1% 19.6% 98 2,084 2,331,005 1,119
Daviess KY 986 23.2% 16.8% 166 6,256 4,916,491 786
Edmonson KY 163 36.3% 15.8% 26 28 20,743 730
Fayette KY 2,863 19.3% 19.6% 561 42,270 50,740,705 1,200
Gallatin KY 113 34.7% 17.4% 20 33 33,089 1,008
Grant KY 444 33.3% 17.4% 77 143 156,380 1,097
Greenup KY 424 26.0% 16.3% 69 1,160 944,265 814
16
Number of Subprime
Loans 2005-2006
County/State
Proportion of All Loans that are Subprime,
2005-2006
Projected Cumulative Foreclosure
Rate on 2005-2006 Subprime
Loans
Projected Number of
Total Homes Lost to
Foreclosure
Number of Neighboring
Homes Experiencing Devaluation
Decrease in House Value/Tax Base
from Foreclosure Effect ($)
Average Decrease per Housing Unit Affected ($)
Hancock KY 79 28.4% 16.8% 13 14 11,023 778
Hardin KY 1,516 33.1% 17.5% 265 5,010 5,724,722 1,143
Henderson KY 524 28.6% 17.6% 92 2,519 1,647,481 654
Henry KY 295 38.4% 18.5% 55 80 81,015 1,011
Jefferson KY 9,474 25.2% 18.5% 1,753 129,518 147,647,973 1,140
Jessamine KY 666 26.8% 19.6% 131 1,949 2,272,060 1,166
Kenton KY 2,190 23.0% 17.4% 381 23,043 24,324,069 1,056
Larue KY 342 45.4% 17.5% 60 71 68,699 961
McLean KY 94 27.8% 16.8% 16 16 10,159 635
Meade KY 370 35.6% 18.5% 68 196 186,324 953
Nelson KY 694 31.0% 18.5% 128 423 434,637 1,028
Oldham KY 643 16.0% 18.5% 119 798 1,371,421 1,719
Pendleton KY 169 29.5% 17.4% 29 31 27,938 903
Scott KY 593 21.1% 19.6% 116 1,584 1,778,089 1,123
Shelby KY 588 25.0% 18.5% 109 1,448 1,551,745 1,072
Spencer KY 275 22.8% 18.5% 51 63 93,748 1,490
Trigg KY 201 36.9% 17.1% 34 26 25,518 967
Trimble KY 138 33.7% 18.5% 26 30 29,398 990
Warren KY 995 21.3% 15.8% 157 2,504 2,723,054 1,088
Webster KY 180 42.7% 17.6% 32 37 17,514 468
Woodford KY 284 21.9% 19.6% 56 484 707,310 1,462
Total/Average of KY 31,294 24.6% 18.1% 5,673 249,727 281,562,707 1,127
Ascension Parish LA 1,651 25.4% 18.5% 305 3,339 4,885,831 1,463
Bossier Parish LA 1,470 29.0% 17.3% 254 6,633 6,257,294 943
Caddo Parish LA 3,975 38.6% 17.3% 688 27,353 25,044,767 916
Calcasieu Parish LA 2,152 29.6% 14.6% 314 10,366 9,940,993 959
Cameron Parish LA 67 37.6% 14.6% 10 2 1,568 819
De Soto Parish LA 322 44.2% 17.3% 56 81 59,608 738
East Baton Rouge Parish LA 6,793 32.6% 18.5% 1,257 54,989 66,886,378 1,216
East Feliciana Parish LA 289 46.5% 18.5% 53 49 51,033 1,033
Grant Parish LA 247 42.9% 15.1% 37 36 31,453 867
Iberville Parish LA 507 49.7% 18.5% 94 835 829,939 994
Jefferson Parish LA 5,656 29.3% 21.6% 1,222 101,837 178,667,235 1,754
Lafayette Parish LA 2,213 22.0% 16.8% 372 11,291 14,573,944 1,291
Lafourche Parish LA 1,202 31.3% 16.0% 192 2,693 2,684,857 997
Livingston Parish LA 1,827 30.3% 18.5% 338 2,578 3,357,149 1,302
Orleans Parish LA 3,808 31.9% 21.6% 823 133,675 208,384,151 1,559
Ouachita Parish LA 1,699 31.7% 15.4% 262 5,937 5,522,613 930
Plaquemines Parish LA 175 23.6% 21.6% 38 274 497,832 1,816
Pointe Coupee Parish LA 331 40.8% 18.5% 61 139 153,408 1,103
17

Number of Subprime
Loans 2005-2006
County/State
Proportion of All Loans that are Subprime,
2005-2006
Projected Cumulative Foreclosure
Rate on 2005-2006 Subprime
Loans
Projected Number of
Total Homes Lost to
Foreclosure
Number of Neighboring
Homes Experiencing Devaluation
Decrease in House Value/Tax Base
from Foreclosure Effect ($)
Average Decrease per Housing Unit Affected ($)
Rapides Parish LA 1,651 37.0% 15.1% 249 4,930 4,652,692 944
St. Bernard Parish LA 373 33.1% 21.6% 81 5,397 7,003,843 1,298
St. Charles Parish LA 757 26.9% 21.6% 164 2,994 4,943,955 1,651
St. Helena Parish LA 152 63.6% 18.5% 28 17 16,187 959
St. John the Baptist Parish LA 1,034 40.2% 21.6% 223 5,865 9,676,005 1,650
St. Martin Parish LA 1,095 51.9% 16.8% 184 579 568,578 981
St. Tammany Parish LA 3,471 20.3% 21.6% 750 12,048 22,191,570 1,842
Terrebonne Parish LA 1,405 32.1% 16.0% 225 5,302 5,805,521 1,095
Union Parish LA 282 50.1% 15.4% 43 105 71,005 677
West Baton Rouge Parish LA 300 32.5% 18.5% 56 939 910,406 970
West Feliciana Parish LA 119 27.8% 18.5% 22 21 33,973 1,587
Total/Average of LA 45,023 30.5% 18.7% 8,400 400,306 583,703,789 1,458
Barnstable MA 3,629 18.6% 19.9% 722 20,445 60,950,517 2,981
Berkshire MA 1,166 16.2% 12.0% 140 5,972 8,273,301 1,385
Bristol MA 7,818 20.8% 19.5% 1,525 99,946 321,218,252 3,214
Essex MA 10,505 19.7% 16.9% 1,775 129,095 549,401,455 4,256
Franklin MA 812 19.2% 15.4% 125 2,395 3,643,952 1,521
Hampden MA 8,636 30.8% 15.4% 1,330 80,836 166,366,190 2,058
Hampshire MA 1,094 13.9% 15.4% 168 3,177 7,148,109 2,250
Middlesex MA 13,210 14.5% 16.5% 2,180 201,932 816,181,670 4,042
Norfolk MA 6,544 14.4% 18.5% 1,211 79,181 299,335,942 3,780
Plymouth MA 9,327 22.3% 18.5% 1,725 55,214 210,177,059 3,807
Suffolk MA 8,938 23.1% 18.5% 1,654 231,447 1,831,459,276 7,913
Worcester MA 13,346 23.0% 17.3% 2,309 103,907 246,010,808 2,368
Total/Average of MA 85,025 19.6% 17.5% 14,864 1,013,548 4,520,166,531 4,460
Allegany MD 1,043 34.8% 10.9% 114 2,970 2,966,475 999
Anne Arundel MD 12,790 22.5% 19.3% 2,468 107,807 425,763,633 3,949
Baltimore MD 22,206 30.9% 19.3% 4,286 210,173 902,925,206 4,296
Baltimore city MD 18,002 44.6% 19.3% 3,474 267,744 1,205,321,878 4,502
Calvert MD 2,536 24.5% 22.8% 578 8,024 26,245,888 3,271
Carroll MD 2,972 18.4% 19.3% 574 6,453 19,329,715 2,995
Cecil MD 2,187 26.1% 14.1% 308 2,673 5,481,150 2,051
Charles MD 7,143 33.4% 22.8% 1,629 23,980 154,304,701 6,435
Frederick MD 5,469 20.9% 20.4% 1,116 25,561 103,772,487 4,060
Harford MD 6,010 24.4% 19.3% 1,160 36,952 124,005,960 3,356
Howard MD 4,441 17.0% 19.3% 857 40,958 165,482,120 4,040
Montgomery MD 16,462 19.0% 20.4% 3,358 193,543 1,109,922,059 5,735
Prince Georges MD 50,700 41.4% 22.8% 11,560 267,802 2,553,382,751 9,535
Queen Annes MD 1,044 19.6% 19.3% 201 1,227 3,933,215 3,206
Somerset MD 521 43.3% 14.7% 77 196 280,731 1,435
18

Number of Subprime
Loans 2005-2006
County/State
Proportion of All Loans that are Subprime,
2005-2006
Projected Cumulative Foreclosure
Rate on 2005-2006 Subprime
Loans
Projected Number of
Total Homes Lost to
Foreclosure
Number of Neighboring
Homes Experiencing Devaluation
Decrease in House Value/Tax Base
from Foreclosure Effect ($)
Average Decrease per Housing Unit Affected ($)
Washington MD 3,174 26.0% 20.6% 654 18,791 50,073,528 2,665
Wicomico MD 2,058 31.3% 14.7% 303 5,721 9,529,987 1,666
Total/Average of MD 158,758 29.4% 20.6% 32,716 1,220,574 6,862,721,485 5,623
Androscoggin ME 1,881 29.1% 13.5% 254 6,840 8,703,989 1,272
Cumberland ME 3,635 17.7% 17.8% 647 20,018 42,929,761 2,145
Penobscot ME 2,526 30.7% 13.3% 336 5,430 6,649,831 1,225
Sagadahoc ME 445 18.8% 17.8% 79 734 1,207,311 1,646
York ME 3,353 20.9% 17.8% 597 9,105 16,497,187 1,812
Total/Average of ME 11,840 22.1% 16.2% 1,913 42,127 75,988,080 1,804
Barry MI 1,087 27.7% 17.8% 193 527 630,344 1,197
Bay MI 1,453 26.6% 18.9% 275 13,183 10,328,334 783
Berrien MI 2,640 29.7% 15.7% 414 10,618 10,744,825 1,012
Calhoun MI 2,781 35.2% 19.2% 534 15,963 12,240,456 767
Cass MI 849 30.1% 16.7% 142 1,316 1,132,601 861
Clinton MI 1,051 21.8% 20.6% 217 1,940 2,633,748 1,358
Eaton MI 2,051 29.2% 20.6% 423 7,140 9,269,543 1,298
Genesee MI 8,976 34.6% 19.7% 1,768 72,373 59,335,623 820
Ingham MI 5,154 32.0% 20.6% 1,062 51,798 63,822,061 1,232
Ionia MI 1,191 33.0% 17.8% 212 1,988 1,803,841 907
Jackson MI 3,440 34.9% 20.0% 688 16,105 17,824,436 1,107
Kalamazoo MI 3,383 26.0% 17.5% 592 22,816 23,284,046 1,020
Kent MI 9,737 26.8% 17.8% 1,733 92,056 123,039,311 1,337
Lapeer MI 1,536 25.9% 17.5% 269 1,855 2,382,684 1,284
Livingston MI 2,602 17.7% 17.5% 455 5,409 10,044,123 1,857
Macomb MI 14,822 26.0% 17.5% 2,594 177,873 284,067,680 1,597
Monroe MI 2,205 23.4% 20.2% 445 7,792 10,787,125 1,384
Muskegon MI 3,511 36.4% 17.4% 611 22,005 16,875,106 767
Newaygo MI 786 33.5% 17.8% 140 413 427,057 1,034
Oakland MI 19,098 21.2% 17.5% 3,342 194,025 355,191,456 1,831
Ottawa MI 2,618 17.6% 19.2% 503 13,668 19,166,992 1,402
Saginaw MI 2,930 30.5% 22.0% 645 25,824 19,986,510 774
St. Clair MI 2,926 27.1% 17.5% 512 17,241 20,312,214 1,178
Van Buren MI 1,207 31.1% 17.5% 211 1,295 1,531,681 1,183
Washtenaw MI 3,532 17.5% 19.6% 692 30,212 47,078,688 1,558
Wayne MI 51,355 45.3% 17.8% 9,141 608,977 1,024,301,110 1,682
Total/Average of MI 152,921 30.1% 18.2% 27,813 1,414,411 2,148,241,595 1,519
Anoka MN 6,709 25.5% 20.2% 1,355 51,500 97,935,751 1,902
Benton MN 551 24.6% 18.4% 101 1,639 2,371,805 1,447
Carlton MN 545 25.6% 16.2% 88 527 662,803 1,258
Carver MN 1,170 16.1% 20.2% 236 3,018 7,762,386 2,572
19

Projected Cumulative Foreclosure
Rate on 2005-2006 Subprime
Loans
County/State
Number of Subprime
Loans 2005-2006
Proportion of All Loans that are Subprime,
2005-2006
Projected Number of
Total Homes Lost to
Foreclosure
Number of Neighboring
Homes Experiencing Devaluation
Decrease in House Value/Tax Base
from Foreclosure Effect ($)
Average Decrease per Housing Unit Affected ($)
Chisago MN 1,132 24.8% 20.2% 229 874 1,695,919 1,941
Clay MN 614 21.5% 17.9% 110 3,416 3,807,775 1,115
Dakota MN 6,216 20.8% 20.2% 1,256 54,044 120,791,569 2,235
Dodge MN 348 28.2% 18.3% 64 209 268,211 1,286
Hennepin MN 17,972 22.6% 20.2% 3,630 248,915 663,340,402 2,665
Houston MN 169 19.2% 18.9% 32 174 227,756 1,307
Isanti MN 1,114 32.1% 20.2% 225 608 994,686 1,637
Olmsted MN 1,337 15.1% 18.3% 245 9,837 12,889,368 1,310
Polk MN 378 30.4% 17.5% 66 426 465,786 1,094
Ramsey MN 7,712 25.8% 20.2% 1,558 111,769 258,296,498 2,311
Scott MN 2,158 19.3% 20.2% 436 8,002 17,953,899 2,244
Sherburne MN 2,164 26.8% 20.2% 437 1,790 3,602,529 2,012
St. Louis MN 2,841 26.2% 16.2% 460 15,287 15,048,791 984
Stearns MN 1,647 20.7% 18.4% 303 7,150 10,082,112 1,410
Wabasha MN 319 26.8% 18.3% 58 569 661,846 1,163
Washington MN 3,569 19.2% 20.2% 721 22,607 49,053,730 2,170
Wright MN 2,523 24.2% 20.2% 510 3,413 6,759,747 1,981
Total/Average of MN 61,188 22.8% 19.8% 12,120 545,773 1,274,673,368 2,336
Andrew MO 265 28.8% 18.1% 48 91 102,422 1,131
Bates MO 333 48.7% 18.7% 62 170 124,677 733
Boone MO 1,325 17.0% 18.1% 240 4,397 5,475,294 1,245
Buchanan MO 1,784 37.5% 18.1% 323 17,088 14,222,395 832
Caldwell MO 234 47.9% 18.7% 44 25 17,032 695
Callaway MO 489 23.6% 16.8% 82 336 307,159 915
Cass MO 2,034 28.6% 18.7% 380 4,273 5,069,650 1,186
Christian MO 1,300 22.8% 17.1% 222 1,412 1,807,335 1,280
Clay MO 4,362 26.9% 18.7% 816 27,603 32,976,113 1,195
Clinton MO 442 32.3% 18.7% 83 272 258,577 951
Cole MO 761 19.5% 16.8% 128 2,160 2,261,327 1,047
Dallas MO 254 39.6% 17.1% 43 49 43,462 894
DeKalb MO 110 32.3% 18.1% 20 9 7,434 840
Franklin MO 1,880 27.5% 17.5% 329 1,714 2,211,543 1,290
Greene MO 3,799 24.9% 17.1% 650 25,510 24,102,688 945
Howard MO 77 19.3% 18.1% 14 10 7,761 780
Jackson MO 16,556 37.0% 18.7% 3,096 169,370 179,291,288 1,059
Jasper MO 2,106 35.6% 17.5% 369 9,166 6,748,445 736
Jefferson MO 5,217 29.0% 17.5% 913 14,463 20,228,217 1,399
Lafayette MO 538 29.6% 18.7% 101 153 153,964 1,010
Lincoln MO 1,195 30.7% 17.5% 209 529 735,623 1,389
McDonald MO 309 37.8% 18.4% 57 61 49,233 805
20

Projected Cumulative Foreclosure
Rate on 2005-2006 Subprime
Loans
County/State
Number of Subprime
Loans 2005-2006
Proportion of All Loans that are Subprime,
2005-2006
Projected Number of
Total Homes Lost to
Foreclosure
Number of Neighboring
Homes Experiencing Devaluation
Decrease in House Value/Tax Base
from Foreclosure Effect ($)
Average Decrease per Housing Unit Affected ($)
Moniteau MO 177 33.5% 16.8% 30 160 128,506 803
Newton MO 876 31.0% 17.5% 153 953 874,298 917
Osage MO 173 27.1% 16.8% 29 16 14,918 956
Platte MO 1,330 21.4% 18.7% 249 6,210 10,057,690 1,620
Polk MO 496 31.9% 17.1% 85 74 73,174 983
Ray MO 576 38.9% 18.7% 108 356 342,793 964
St. Charles MO 6,779 20.6% 17.5% 1,186 48,132 81,288,732 1,689
St. Louis MO 23,691 30.9% 17.5% 4,146 220,801 366,515,369 1,660
St. Louis city MO 8,786 41.4% 17.5% 1,538 149,248 257,297,782 1,724
Warren MO 626 26.9% 17.5% 110 257 365,595 1,420
Washington MO 381 42.1% 17.5% 67 172 140,378 816
Webster MO 712 33.2% 17.1% 122 205 208,517 1,018
Total/Average of MO 89,973 30.1% 17.8% 16,049 705,446 1,013,509,391 1,437
Copiah MS 348 53.2% 18.0% 63 466 311,671 669
DeSoto MS 3,749 36.3% 17.9% 671 12,288 14,656,838 1,193
Forrest MS 886 35.7% 16.4% 145 2,992 2,631,311 879
George MS 429 57.7% 18.0% 77 141 134,093 952
Hancock MS 459 24.1% 20.2% 93 1,222 1,778,890 1,456
Harrison MS 1,965 30.1% 20.2% 397 11,498 14,179,793 1,233
Hinds MS 4,914 53.8% 18.0% 885 34,581 30,875,731 893
Jackson MS 1,667 30.4% 18.0% 300 6,114 6,790,673 1,111
Lamar MS 707 26.4% 16.4% 116 441 664,070 1,507
Madison MS 1,249 23.3% 18.0% 225 3,282 4,414,869 1,345
Marshall MS 872 58.7% 17.9% 156 392 312,403 796
Perry MS 205 63.3% 16.4% 34 18 13,460 754
Rankin MS 1,725 26.0% 18.0% 311 3,368 4,143,599 1,230
Simpson MS 398 56.2% 18.0% 72 239 173,844 726
Stone MS 190 33.6% 20.2% 38 100 99,591 997
Tate MS 498 46.7% 17.9% 89 274 270,434 989
Tunica MS 152 68.2% 17.9% 27 33 23,110 691
Total/Average of MS 20,413 36.3% 18.1% 3,698 77,449 81,474,381 1,052
Carbon MT 99 21.5% 17.4% 17 18 27,067 1,473
Cascade MT 714 22.5% 16.1% 115 5,253 5,882,110 1,120
Missoula MT 749 13.5% 17.1% 128 3,140 6,162,637 1,962
Yellowstone MT 1,188 18.4% 17.4% 207 8,378 11,916,202 1,422
Total/Average of MT 2,750 17.6% 17.0% 467 16,790 23,988,015 1,429
Alamance NC 1,751 27.9% 17.1% 299 5,690 6,130,596 1,077
Alexander NC 335 26.8% 17.6% 59 270 317,646 1,175
Anson NC 297 45.2% 18.4% 55 122 108,132 884
Brunswick NC 1,262 18.1% 16.8% 212 1,437 3,200,065 2,227
21

Projected Cumulative Foreclosure
Rate on 2005-2006 Subprime
Loans
County/State
Number of Subprime
Loans 2005-2006
Proportion of All Loans that are Subprime,
2005-2006
Projected Number of
Total Homes Lost to
Foreclosure
Number of Neighboring
Homes Experiencing Devaluation
Decrease in House Value/Tax Base
from Foreclosure Effect ($)
Average Decrease per Housing Unit Affected ($)
Buncombe NC 2,456 18.3% 17.6% 432 8,184 13,476,432 1,647
Burke NC 895 27.2% 17.6% 158 1,469 1,525,149 1,038
Cabarrus NC 2,667 24.4% 18.4% 491 9,121 11,549,706 1,266
Caldwell NC 1,044 32.4% 17.6% 184 2,125 2,019,282 950
Catawba NC 1,879 25.0% 17.6% 331 4,815 5,888,364 1,223
Chatham NC 480 15.6% 16.8% 81 274 378,946 1,381
Cumberland NC 3,722 36.2% 15.5% 577 21,061 22,899,051 1,087
Currituck NC 394 19.4% 18.0% 71 121 298,021 2,459
Davie NC 427 18.3% 16.9% 72 264 400,721 1,520
Durham NC 3,269 22.7% 16.8% 549 17,304 22,777,947 1,316
Edgecombe NC 646 50.7% 16.3% 105 1,627 1,265,639 778
Forsyth NC 4,523 24.1% 16.9% 764 19,096 22,448,114 1,176
Franklin NC 718 30.9% 17.3% 124 305 387,073 1,267
Gaston NC 3,191 31.7% 18.4% 587 11,477 12,556,601 1,094
Greene NC 128 34.9% 16.1% 21 37 31,759 850
Guilford NC 6,645 25.4% 17.5% 1,163 40,546 46,897,075 1,157
Haywood NC 760 24.1% 17.6% 134 925 1,431,649 1,548
Henderson NC 1,117 18.7% 17.6% 197 2,548 4,883,061 1,916
Hoke NC 444 40.4% 15.5% 69 324 295,266 911
Johnston NC 2,327 27.7% 17.3% 403 1,973 2,724,319 1,381
Madison NC 165 22.9% 17.6% 29 43 64,971 1,525
Mecklenburg NC 14,579 22.5% 18.4% 2,683 95,977 158,419,069 1,651
Nash NC 1,071 30.0% 16.3% 175 2,416 2,493,394 1,032
New Hanover NC 2,896 19.3% 16.8% 487 15,528 32,531,797 2,095
Onslow NC 1,292 23.4% 15.7% 203 3,317 4,120,986 1,243
Orange NC 631 10.4% 16.8% 106 1,990 4,071,499 2,046
Pender NC 526 19.7% 16.8% 88 155 346,158 2,229
Person NC 383 26.4% 16.8% 64 263 275,810 1,048
Pitt NC 1,524 21.8% 16.1% 245 4,451 5,670,998 1,274
Randolph NC 1,467 27.0% 17.5% 257 2,371 2,441,015 1,029
Rockingham NC 1,206 33.7% 17.5% 211 1,785 1,493,179 837
Stokes NC 474 27.1% 16.9% 80 327 366,525 1,119
Union NC 3,199 20.5% 18.4% 589 4,468 7,076,264 1,584
Wake NC 9,854 16.7% 17.3% 1,705 45,729 81,547,803 1,783
Wayne NC 1,002 29.7% 15.5% 155 2,291 2,228,029 973
Yadkin NC 332 25.8% 16.9% 56 149 154,353 1,034
Total/Average of NC 81,978 22.8% 17.4% 14,268 332,375 487,192,465 1,466
Burleigh ND 541 14.8% 17.5% 95 4,463 5,648,484 1,266
Cass ND 1,199 18.4% 17.9% 215 14,006 17,160,673 1,225
Grand Forks ND 497 22.3% 17.5% 87 4,551 5,480,156 1,204
22

Projected Cumulative Foreclosure
Rate on 2005-2006 Subprime
Loans
County/State
Number of Subprime
Loans 2005-2006
Proportion of All Loans that are Subprime,
2005-2006
Projected Number of
Total Homes Lost to
Foreclosure
Number of Neighboring
Homes Experiencing Devaluation
Decrease in House Value/Tax Base
from Foreclosure Effect ($)
Average Decrease per Housing Unit Affected ($)
Morton ND 228 20.3% 17.5% 40 741 812,647 1,097
Total/Average of ND 2,465 18.2% 17.7% 436 23,761 29,101,960 1,225
Cass NE 457 31.1% 17.5% 80 149 161,340 1,083
Dakota NE 230 32.2% 17.4% 40 1,129 977,997 866
Dixon NE 61 31.0% 17.4% 11 3 2,083 642
Douglas NE 6,682 25.2% 17.5% 1,169 88,296 91,413,352 1,035
Lancaster NE 2,427 17.6% 18.7% 454 31,560 34,728,117 1,100
Sarpy NE 1,682 19.9% 17.5% 294 11,437 13,952,470 1,220
Saunders NE 243 24.5% 17.5% 43 72 74,652 1,037
Seward NE 169 21.2% 18.7% 32 124 141,632 1,143
Washington NE 244 24.1% 17.5% 43 125 154,803 1,240
Total/Average of NE 12,195 22.6% 17.8% 2,165 132,896 141,606,447 1,066
Hillsborough NH 5,524 18.8% 14.3% 790 41,289 78,763,927 1,908
Rockingham NH 4,088 17.3% 15.6% 638 10,619 26,152,162 2,463
Strafford NH 1,792 21.9% 15.6% 280 5,720 9,944,156 1,739
Total/Average of NH 11,404 18.6% 15.0% 1,707 57,628 114,860,244 1,993
Atlantic NJ 6,907 29.2% 22.2% 1,533 54,870 201,140,528 3,666
Bergen NJ 9,823 17.9% 21.7% 2,132 214,273 1,366,032,650 6,375
Burlington NJ 9,614 25.4% 16.8% 1,615 62,627 180,192,732 2,877
Camden NJ 11,415 30.7% 16.8% 1,918 127,952 274,870,506 2,148
Cape May NJ 1,766 22.4% 23.5% 415 24,009 67,417,434 2,808
Cumberland NJ 3,191 37.3% 15.2% 485 16,382 26,438,751 1,614
Essex NJ 16,541 36.1% 18.3% 3,027 232,685 2,033,443,716 8,739
Gloucester NJ 6,157 24.6% 16.8% 1,034 35,540 77,471,749 2,180
Hudson NJ 8,678 27.0% 21.7% 1,883 223,345 2,862,208,497 12,815
Hunterdon NJ 1,054 11.5% 18.3% 193 3,030 10,394,520 3,431
Mercer NJ 5,573 24.0% 15.3% 853 62,975 173,260,965 2,751
Middlesex NJ 11,431 21.4% 21.4% 2,446 158,499 667,632,265 4,212
Monmouth NJ 8,881 18.4% 21.4% 1,901 104,768 399,007,461 3,808
Morris NJ 4,632 14.0% 18.3% 848 35,731 148,123,582 4,146
Ocean NJ 10,938 22.3% 21.4% 2,341 99,188 279,849,850 2,821
Passaic NJ 9,218 30.3% 21.7% 2,000 120,958 1,151,619,906 9,521
Salem NJ 1,347 29.6% 14.1% 190 4,653 7,054,282 1,516
Somerset NJ 3,905 16.8% 21.4% 836 39,457 173,258,008 4,391
Sussex NJ 3,313 22.8% 18.3% 606 11,458 35,781,643 3,123
Union NJ 11,033 30.9% 18.3% 2,019 136,752 903,579,225 6,607
Warren NJ 2,002 23.4% 20.4% 408 12,271 31,682,162 2,582
Total/Average of NJ 147,419 24.3% 19.5% 28,683 1,781,424 11,070,460,430 6,214
Bernalillo NM 9,940 23.6% 17.3% 1,720 113,116 219,834,272 1,943
Dona Ana NM 1,980 25.7% 16.9% 335 10,567 12,949,304 1,225
23

Projected Cumulative Foreclosure
Rate on 2005-2006 Subprime
Loans
County/State
Number of Subprime
Loans 2005-2006
Proportion of All Loans that are Subprime,
2005-2006
Projected Number of
Total Homes Lost to
Foreclosure
Number of Neighboring
Homes Experiencing Devaluation
Decrease in House Value/Tax Base
from Foreclosure Effect ($)
Average Decrease per Housing Unit Affected ($)
San Juan NM 1,064 28.0% 17.0% 181 4,630 7,087,710 1,531
Sandoval NM 2,502 23.9% 17.3% 433 10,784 19,351,562 1,794
Santa Fe NM 1,617 16.4% 17.3% 280 10,664 28,362,908 2,660
Torrance NM 109 37.2% 17.3% 19 14 21,739 1,554
Valencia NM 961 28.6% 17.3% 166 1,656 2,652,025 1,602
Total/Average of NM 18,173 23.4% 17.2% 3,133 151,430 290,259,520 1,917
Carson City NV 734 19.4% 22.5% 165 8,590 22,851,091 2,660
Clark NV 65,716 30.6% 23.7% 15,575 477,090 3,412,594,239 7,153
Storey NV 103 25.4% 23.2% 24 7 17,347 2,395
Washoe NV 7,778 20.2% 23.2% 1,804 71,599 261,909,755 3,658
Total/Average of NV 74,331 28.9% 23.6% 17,568 557,286 3,697,372,432 6,635
Albany NY 3,030 23.1% 17.4% 527 44,297 74,072,714 1,672
Bronx NY 8,193 35.7% 21.7% 1,778 411,929 4,902,812,920 11,902
Broome NY 1,594 26.8% 15.7% 250 15,016 14,232,042 948
Chemung NY 874 29.2% 15.5% 135 6,542 4,581,633 700
Dutchess NY 3,886 23.0% 17.1% 665 19,846 53,066,419 2,674
Erie NY 6,323 22.5% 15.6% 986 107,236 100,904,380 941
Herkimer NY 614 30.5% 14.6% 90 1,790 1,591,177 889
Kings NY 18,103 29.9% 21.7% 3,928 740,141 12,743,473,965 17,218
Livingston NY 518 27.3% 16.9% 88 923 809,407 877
Madison NY 618 23.6% 16.4% 101 1,296 1,306,951 1,008
Monroe NY 5,631 21.9% 16.9% 952 82,786 74,913,562 905
Nassau NY 18,069 25.4% 19.4% 3,505 271,875 1,934,610,816 7,116
New York NY 938 3.1% 21.7% 204 398,746 3,844,766,259 9,642
Niagara NY 1,747 26.3% 15.6% 273 15,775 13,513,797 857
Oneida NY 1,865 25.7% 14.6% 272 13,286 10,716,567 807
Onondaga NY 3,521 21.8% 16.4% 577 36,777 36,811,082 1,001
Ontario NY 828 20.2% 16.9% 140 2,416 2,259,787 935
Orange NY 6,103 27.2% 17.1% 1,044 35,856 90,026,442 2,511
Orleans NY 437 40.1% 16.9% 74 843 636,517 755
Oswego NY 1,055 31.9% 16.4% 173 2,744 2,522,579 919
Putnam NY 1,351 21.5% 21.7% 293 4,642 16,020,027 3,451
Queens NY 24,133 29.4% 21.7% 5,237 670,186 9,253,620,294 13,808
Rensselaer NY 1,971 28.1% 17.4% 343 17,376 26,871,351 1,546
Richmond NY 6,021 24.6% 21.7% 1,307 141,174 1,086,423,136 7,696
Rockland NY 2,835 20.7% 21.7% 615 36,070 155,949,800 4,324
Saratoga NY 2,506 19.5% 17.4% 436 10,396 19,198,350 1,847
Schenectady NY 2,324 28.5% 17.4% 404 34,682 51,570,891 1,487
Schoharie NY 355 29.4% 17.4% 62 107 153,956 1,442
Suffolk NY 27,690 27.8% 19.4% 5,372 235,487 997,449,150 4,236
24
Projected Cumulative Foreclosure
Rate on 2005-2006 Subprime
Loans
County/State
Number of Subprime
Loans 2005-2006
Proportion of All Loans that are Subprime,
2005-2006
Projected Number of
Total Homes Lost to
Foreclosure
Number of Neighboring
Homes Experiencing Devaluation
Decrease in House Value/Tax Base
from Foreclosure Effect ($)
Average Decrease per Housing Unit Affected ($)
Tioga NY 392 23.1% 15.7% 62 676 672,050 994
Tompkins NY 295 10.7% 17.8% 53 612 898,753 1,469
Ulster NY 2,326 24.2% 17.5% 407 8,459 16,175,565 1,912
Warren NY 881 26.8% 11.6% 102 3,324 5,113,850 1,539
Washington NY 1,056 36.2% 11.6% 122 1,886 2,422,533 1,285
Wayne NY 827 26.9% 16.9% 140 1,058 974,815 922
Westchester NY 7,375 17.4% 21.7% 1,600 176,387 1,300,273,195 7,372
Total/Average of NY 166,285 25.0% 19.4% 32,317 3,552,642 36,841,416,732 10,370
Allen OH 1,598 30.8% 17.5% 280 11,692 8,725,657 746
Belmont OH 742 28.6% 16.1% 119 2,341 1,607,127 686
Brown OH 646 32.9% 17.4% 112 225 237,484 1,053
Butler OH 5,858 26.7% 17.4% 1,019 41,765 52,818,197 1,265
Carroll OH 444 30.8% 17.1% 76 190 190,081 999
Clark OH 2,358 35.3% 17.3% 408 18,550 15,076,594 813
Clermont OH 2,942 24.0% 17.4% 512 9,632 13,932,269 1,446
Cuyahoga OH 19,223 29.6% 17.0% 3,268 344,939 451,483,303 1,309
Delaware OH 1,747 13.4% 17.6% 307 4,525 9,188,102 2,031
Erie OH 930 25.6% 15.3% 142 6,972 6,374,647 914
Fairfield OH 2,098 24.6% 17.6% 369 9,506 12,236,088 1,287
Franklin OH 16,359 27.3% 17.6% 2,879 217,800 270,727,220 1,243
Fulton OH 537 23.4% 18.1% 97 701 809,867 1,155
Geauga OH 855 15.2% 17.0% 145 842 1,777,098 2,110
Greene OH 1,505 18.9% 17.8% 268 8,225 8,720,872 1,060
Hamilton OH 11,736 27.0% 17.4% 2,042 178,968 214,872,547 1,201
Jefferson OH 919 32.1% 18.3% 168 4,841 3,464,739 716
Lake OH 3,190 22.3% 17.0% 542 28,505 37,489,540 1,315
Lawrence OH 745 29.5% 16.3% 121 2,761 2,268,980 822
Licking OH 2,320 25.9% 17.6% 408 7,626 7,995,115 1,048
Lorain OH 4,782 27.3% 17.0% 813 41,411 45,453,120 1,098
Lucas OH 6,614 28.5% 18.1% 1,197 92,443 89,951,122 973
Madison OH 559 28.2% 17.6% 98 834 758,524 909
Mahoning OH 4,105 34.6% 16.2% 665 35,516 26,433,668 744
Medina OH 2,183 19.0% 17.0% 371 7,584 11,680,244 1,540
Miami OH 1,260 23.3% 17.8% 224 2,972 3,223,119 1,084
Montgomery OH 8,138 31.1% 17.8% 1,449 99,998 97,508,735 975
Morrow OH 499 29.3% 17.6% 88 164 179,646 1,097
Ottawa OH 549 23.8% 18.1% 99 1,439 1,693,678 1,177
Pickaway OH 754 29.4% 17.6% 133 2,133 2,225,626 1,043
Portage OH 2,051 24.7% 17.3% 355 5,258 6,664,214 1,267
Preble OH 725 32.7% 17.8% 129 707 678,553 960
25

Projected Cumulative Foreclosure
Rate on 2005-2006 Subprime
Loans
County/State
Number of Subprime
Loans 2005-2006
Proportion of All Loans that are Subprime,
2005-2006
Projected Number of
Total Homes Lost to
Foreclosure
Number of Neighboring
Homes Experiencing Devaluation
Decrease in House Value/Tax Base
from Foreclosure Effect ($)
Average Decrease per Housing Unit Affected ($)
Richland OH 1,827 29.8% 18.4% 336 12,085 8,954,174 741
Stark OH 6,333 32.6% 17.1% 1,083 52,576 49,305,099 938
Summit OH 8,922 28.7% 17.3% 1,544 97,335 105,156,972 1,080
Trumbull OH 3,624 34.7% 16.2% 587 22,777 18,533,221 814
Union OH 635 20.9% 17.6% 112 818 1,174,006 1,436
Warren OH 3,004 18.9% 17.4% 523 10,177 15,267,458 1,500
Washington OH 558 24.4% 15.3% 85 1,651 1,484,324 899
Wood OH 1,364 20.6% 18.1% 247 4,503 5,952,505 1,322
Total/Average of OH 135,238 27.1% 17.3% 23,423 1,392,990 1,612,273,534 1,157
Canadian OK 1,670 27.3% 18.3% 306 8,872 8,249,013 930
Cleveland OK 2,906 25.0% 18.3% 532 21,950 23,718,048 1,081
Comanche OK 1,582 41.7% 16.8% 266 12,612 10,282,634 815
Creek OK 1,196 43.0% 17.3% 207 1,624 1,206,615 743
Grady OK 930 41.4% 18.3% 170 2,249 1,356,552 603
Le Flore OK 827 51.7% 15.8% 131 297 197,571 666
Lincoln OK 544 47.0% 18.3% 100 81 58,830 725
Logan OK 550 32.5% 18.3% 101 817 667,211 817
McClain OK 625 33.4% 18.3% 114 331 289,422 874
Oklahoma OK 10,225 31.5% 18.3% 1,871 124,748 113,425,564 909
Okmulgee OK 843 60.6% 17.3% 146 816 422,221 518
Osage OK 619 40.0% 17.3% 107 1,000 922,077 922
Pawnee OK 201 44.3% 17.3% 35 116 68,264 590
Rogers OK 1,269 30.6% 17.3% 220 2,473 2,119,636 857
Sequoyah OK 496 37.3% 15.8% 78 328 240,170 731
Tulsa OK 8,055 29.1% 17.3% 1,394 76,048 76,088,185 1,001
Wagoner OK 1,087 29.0% 17.3% 188 1,900 1,981,345 1,043
Total/Average of OK 33,625 31.8% 17.7% 5,964 256,261 241,293,359 942
Benton OR 386 11.3% 16.2% 63 1,686 3,684,870 2,185
Clackamas OR 5,659 19.0% 20.4% 1,154 50,467 160,834,276 3,187
Columbia OR 1,001 26.8% 20.4% 204 3,633 8,088,477 2,226
Deschutes OR 2,690 17.1% 14.8% 398 6,515 17,389,409 2,669
Jackson OR 2,747 19.8% 19.2% 527 19,004 48,609,538 2,558
Lane OR 4,302 21.3% 18.8% 809 34,690 72,635,011 2,094
Marion OR 4,779 27.2% 18.5% 884 48,196 94,235,601 1,955
Multnomah OR 11,332 20.8% 20.4% 2,312 199,150 700,710,909 3,519
Polk OR 1,050 22.4% 18.5% 194 4,641 9,969,753 2,148
Washington OR 7,461 18.3% 20.4% 1,522 91,694 308,953,642 3,369
Yamhill OR 1,490 23.4% 20.4% 304 7,200 16,390,113 2,276
Total/Average of OR 42,897 20.4% 19.5% 8,372 466,877 1,441,501,599 3,088
Allegheny PA 14,030 26.1% 16.3% 2,287 225,041 206,419,118 917
26

County/State
Number of Subprime
Loans 2005-2006
Proportion of All Loans that are Subprime,
2005-2006
Projected Cumulative Foreclosure
Rate on 2005-2006 Subprime
Loans
Projected Number of
Total Homes Lost to
Foreclosure
Number of Neighboring
Homes Experiencing Devaluation
Decrease in House Value/Tax Base
from Foreclosure Effect ($)
Average Decrease per Housing Unit Affected ($)
Armstrong PA 780 27.7% 16.3% 127 4,779 3,246,892 679
Beaver PA 2,369 29.3% 16.3% 386 17,971 13,938,024 776
Berks PA 5,472 22.8% 19.1% 1,045 55,457 78,655,475 1,418
Blair PA 1,559 27.8% 16.0% 249 17,954 13,398,515 746
Bucks PA 6,515 14.8% 16.7% 1,088 60,750 149,363,718 2,459
Butler PA 1,586 17.1% 16.3% 259 6,550 7,705,429 1,176
Cambria PA 1,332 24.5% 15.1% 201 6,715 4,237,550 631
Carbon PA 1,278 29.2% 20.4% 261 3,627 3,999,674 1,103
Centre PA 831 14.2% 16.8% 140 3,275 6,681,848 2,041
Chester PA 4,132 12.4% 16.7% 690 24,892 57,531,965 2,311
Cumberland PA 2,073 15.9% 18.1% 375 13,835 20,582,894 1,488
Dauphin PA 3,444 23.7% 18.1% 623 38,850 53,869,025 1,387
Delaware PA 7,399 22.3% 16.7% 1,236 118,965 310,261,933 2,608
Erie PA 2,640 25.0% 15.5% 409 31,333 24,596,157 785
Fayette PA 1,718 38.6% 16.3% 280 8,069 5,936,581 736
Lackawanna PA 2,672 26.2% 16.4% 438 30,492 38,707,663 1,269
Lancaster PA 4,358 17.6% 19.3% 841 41,286 70,475,607 1,707
Lebanon PA 1,388 19.7% 17.8% 247 13,082 14,195,862 1,085
Lehigh PA 5,466 24.0% 20.4% 1,115 67,222 199,043,456 2,961
Luzerne PA 4,350 29.2% 16.4% 713 48,650 57,849,083 1,189
Lycoming PA 1,304 24.6% 14.5% 189 7,703 6,813,983 885
Mercer PA 1,447 28.8% 16.2% 234 9,751 5,974,206 613
Montgomery PA 7,552 14.8% 16.7% 1,261 86,913 226,157,906 2,602
Northampton PA 4,527 21.1% 20.4% 924 47,731 104,878,115 2,197
Perry PA 576 21.3% 18.1% 104 261 353,976 1,355
Philadelphia PA 26,609 34.3% 16.7% 4,444 597,771 1,921,784,313 3,215
Pike PA 1,975 32.4% 18.3% 361 1,442 2,945,583 2,043
Washington PA 2,660 25.2% 16.3% 434 16,253 14,036,406 864
Westmoreland PA 4,269 24.7% 16.3% 696 32,998 31,296,038 948
Wyoming PA 302 24.3% 16.4% 50 95 128,932 1,362
York PA 6,594 22.6% 19.1% 1,259 44,765 67,793,036 1,514
Total/Average of PA 133,207 23.0% 17.2% 22,967 1,684,475 3,722,858,966 2,210
Bristol RI 483 14.4% 19.5% 94 5,065 14,010,606 2,766
Kent RI 4,199 26.4% 19.5% 819 42,040 110,666,338 2,632
Newport RI 764 13.9% 19.5% 149 8,746 27,591,890 3,155
Providence RI 14,642 32.7% 19.5% 2,855 183,453 802,320,325 4,373
Washington RI 1,528 16.7% 19.5% 298 5,119 14,226,120 2,779
Total/Average of RI 21,616 27.5% 19.5% 4,215 244,424 968,815,279 3,964
Aiken SC 1,414 23.4% 16.7% 236 3,048 3,675,908 1,206
Anderson SC 2,064 26.1% 17.9% 369 4,046 4,023,955 995
27

County/State
Number of Subprime
Loans 2005-2006
Proportion of All Loans that are Subprime,
2005-2006
Projected Cumulative Foreclosure
Rate on 2005-2006 Subprime
Loans
Projected Number of
Total Homes Lost to
Foreclosure
Number of Neighboring
Homes Experiencing Devaluation
Decrease in House Value/Tax Base
from Foreclosure Effect ($)
Average Decrease per Housing Unit Affected ($)
Berkeley SC 3,139 30.2% 18.3% 574 12,777 19,286,949 1,510
Calhoun SC 88 30.9% 17.5% 15 16 14,074 882
Charleston SC 4,925 19.8% 18.3% 901 34,585 69,336,215 2,005
Darlington SC 731 36.7% 16.7% 122 1,039 905,356 871
Dorchester SC 2,400 26.2% 18.3% 439 11,982 21,761,512 1,816
Edgefield SC 210 28.8% 16.7% 35 41 48,245 1,180
Fairfield SC 257 38.6% 17.5% 45 96 82,047 857
Florence SC 1,676 32.8% 16.7% 280 4,103 4,757,325 1,159
Greenville SC 5,182 21.9% 17.8% 922 24,824 30,095,016 1,212
Horry SC 4,593 24.8% 12.7% 583 12,471 29,641,898 2,377
Kershaw SC 743 29.4% 17.5% 130 491 558,516 1,138
Laurens SC 685 38.7% 17.8% 122 835 696,285 834
Lexington SC 3,253 24.5% 17.5% 569 10,181 14,374,751 1,412
Pickens SC 1,161 25.9% 17.8% 207 2,339 2,691,917 1,151
Richland SC 5,874 31.1% 17.5% 1,028 32,205 40,302,738 1,251
Saluda SC 117 32.9% 17.5% 20 20 18,866 935
Spartanburg SC 3,618 28.5% 18.5% 669 10,481 10,497,391 1,002
Sumter SC 1,199 36.9% 17.3% 207 2,945 3,124,329 1,061
York SC 3,452 22.8% 18.4% 635 10,786 13,926,233 1,291
Total/Average of SC 46,781 25.7% 17.3% 8,112 179,309 269,819,526 1,505
Lincoln SD 368 13.0% 18.9% 70 92 132,766 1,449
McCook SD 70 33.7% 18.9% 13 3 1,874 697
Meade SD 300 26.3% 18.0% 54 319 336,078 1,053
Minnehaha SD 1,285 16.2% 18.9% 243 12,574 14,671,054 1,167
Pennington SD 1,053 20.4% 18.0% 190 5,965 6,296,974 1,056
Turner SD 143 38.1% 18.9% 27 8 5,907 711
Union SD 142 17.4% 17.4% 25 23 30,466 1,353
Total/Average of SD 3,361 18.2% 18.5% 621 18,982 21,475,119 1,131
Anderson TN 1,091 30.2% 19.1% 208 3,552 4,082,732 1,149
Blount TN 2,043 28.6% 19.1% 390 5,889 7,516,850 1,276
Bradley TN 1,709 37.1% 17.1% 292 4,916 5,248,530 1,068
Cannon TN 169 33.5% 17.0% 29 33 34,139 1,047
Carter TN 727 35.1% 17.5% 127 1,803 1,865,533 1,035
Cheatham TN 651 29.8% 17.0% 111 305 414,242 1,360
Chester TN 268 42.9% 16.3% 44 162 138,223 853
Davidson TN 10,390 29.1% 17.0% 1,766 88,715 125,881,921 1,419
Dickson TN 786 35.1% 17.0% 134 373 488,273 1,308
Fayette TN 824 31.8% 17.9% 147 157 206,650 1,312
Grainger TN 350 38.0% 16.5% 58 122 122,566 1,007
Hamblen TN 966 33.4% 16.5% 159 2,916 2,979,123 1,022
28

County/State
Number of Subprime
Loans 2005-2006
Proportion of All Loans that are Subprime,
2005-2006
Projected Cumulative Foreclosure
Rate on 2005-2006 Subprime
Loans
Projected Number of
Total Homes Lost to
Foreclosure
Number of Neighboring
Homes Experiencing Devaluation
Decrease in House Value/Tax Base
from Foreclosure Effect ($)
Average Decrease per Housing Unit Affected ($)
Hamilton TN 5,743 31.6% 18.1% 1,039 34,514 36,686,752 1,063
Hawkins TN 696 29.4% 17.9% 125 654 729,589 1,116
Hickman TN 361 42.5% 17.0% 61 64 67,301 1,044
Jefferson TN 713 32.4% 16.5% 118 494 602,796 1,220
Knox TN 7,078 26.9% 19.1% 1,352 46,558 54,803,868 1,177
Loudon TN 777 27.6% 19.1% 148 1,008 1,253,983 1,244
Macon TN 592 52.4% 17.0% 101 162 142,652 881
Madison TN 1,958 40.2% 16.3% 319 6,699 5,594,867 835
Marion TN 738 50.3% 18.1% 134 160 160,055 1,000
Montgomery TN 2,268 36.1% 17.1% 388 6,974 7,185,456 1,030
Polk TN 316 50.6% 17.1% 54 45 42,806 946
Robertson TN 1,234 33.3% 17.0% 210 1,374 1,728,015 1,257
Rutherford TN 4,634 30.4% 17.0% 788 11,867 16,764,181 1,413
Sequatchie TN 332 47.8% 18.1% 60 61 62,530 1,022
Shelby TN 20,422 43.9% 17.9% 3,656 191,155 228,999,017 1,198
Smith TN 389 40.9% 17.0% 66 172 206,386 1,202
Stewart TN 173 36.7% 17.1% 30 39 38,373 974
Sullivan TN 1,942 26.3% 17.9% 348 7,994 7,881,890 986
Sumner TN 3,015 29.8% 17.0% 513 7,708 11,999,264 1,557
Tipton TN 1,231 39.3% 17.9% 220 1,405 1,386,379 987
Trousdale TN 98 30.4% 17.0% 17 46 43,834 960
Unicoi TN 307 37.3% 17.5% 54 1,215 1,281,426 1,055
Union TN 346 45.9% 19.1% 66 151 163,717 1,082
Washington TN 1,469 23.8% 17.5% 257 5,356 5,979,122 1,116
Williamson TN 1,836 12.2% 17.0% 312 3,587 8,779,339 2,448
Wilson TN 1,790 24.1% 17.0% 304 3,297 5,550,141 1,683
Total/Average of TN 80,432 32.1% 17.7% 14,204 441,703 547,112,525 1,239
Aransas TX 260 28.2% 16.4% 43 759 918,788 1,210
Archer TX 110 35.5% 15.6% 17 6 5,453 962
Armstrong TX 19 39.6% 17.8% 3 1 125 750
Atascosa TX 370 43.9% 17.4% 64 153 137,071 895
Austin TX 326 32.8% 17.6% 57 56 59,364 1,068
Bandera TX 191 29.5% 17.4% 33 67 89,321 1,324
Bastrop TX 889 35.5% 17.0% 151 549 681,360 1,242
Bell TX 2,577 35.0% 15.8% 407 13,178 12,211,937 927
Bexar TX 20,214 34.1% 17.4% 3,517 218,196 220,359,233 1,010
Bowie TX 933 33.8% 14.8% 138 2,431 1,817,120 748
Brazoria TX 4,434 31.3% 17.6% 780 14,147 16,685,027 1,179
Brazos TX 1,093 22.7% 15.2% 166 6,699 6,777,844 1,012
Burleson TX 176 51.2% 15.2% 27 96 65,204 677
29

County/State
Number of Subprime
Loans 2005-2006
Proportion of All Loans that are Subprime,
2005-2006
Projected Cumulative Foreclosure
Rate on 2005-2006 Subprime
Loans
Projected Number of
Total Homes Lost to
Foreclosure
Number of Neighboring
Homes Experiencing Devaluation
Decrease in House Value/Tax Base
from Foreclosure Effect ($)
Average Decrease per Housing Unit Affected ($)
Caldwell TX 320 40.5% 17.0% 54 384 363,276 947
Calhoun TX 152 35.4% 13.3% 20 432 284,328 658
Callahan TX 142 42.0% 16.0% 23 10 6,972 733
Cameron TX 4,922 52.7% 12.5% 615 22,159 16,003,471 722
Carson TX 70 45.5% 17.8% 12 2 1,232 666
Chambers TX 415 34.0% 17.6% 73 112 141,171 1,256
Clay TX 146 50.7% 15.6% 23 51 28,601 557
Collin TX 9,609 20.6% 16.9% 1,624 56,758 105,166,215 1,853
Comal TX 1,147 19.9% 17.4% 200 2,715 3,323,516 1,224
Coryell TX 561 43.8% 15.8% 89 1,796 1,718,922 957
Crosby TX 66 56.9% 16.4% 11 2 836 431
Dallas TX 35,171 39.2% 16.9% 5,944 420,405 528,914,225 1,258
Delta TX 46 43.4% 16.9% 8 17 7,794 464
Denton TX 8,565 23.1% 16.9% 1,447 46,417 68,311,572 1,472
Ector TX 1,714 51.2% 16.4% 281 15,762 13,241,140 840
El Paso TX 10,607 43.3% 15.8% 1,676 96,214 110,454,026 1,148
Ellis TX 2,380 34.8% 16.9% 402 3,418 3,555,797 1,040
Fort Bend TX 11,140 32.6% 17.6% 1,961 54,293 85,814,483 1,581
Galveston TX 4,940 34.3% 17.6% 869 37,439 38,228,986 1,021
Goliad TX 39 30.7% 13.3% 5 1 909 698
Grayson TX 1,639 38.0% 16.5% 270 3,971 2,980,638 751
Gregg TX 1,329 32.8% 14.8% 197 4,991 4,942,954 990
Guadalupe TX 1,077 23.4% 17.4% 187 2,833 3,182,739 1,123
Hardin TX 453 27.6% 17.9% 81 395 400,385 1,014
Harris TX 67,864 39.2% 17.6% 11,944 674,670 913,912,114 1,355
Hays TX 1,342 21.8% 17.0% 228 1,001 1,242,646 1,241
Hidalgo TX 9,746 54.7% 11.6% 1,131 33,658 26,267,998 780
Hunt TX 942 36.7% 16.9% 159 1,208 776,307 643
Irion TX 19 42.2% 16.4% 3 1 107 807
Jefferson TX 2,308 33.7% 17.9% 413 19,645 15,642,924 796
Johnson TX 2,114 38.3% 16.8% 355 7,027 5,904,444 840
Jones TX 188 60.5% 16.0% 30 51 22,345 436
Kaufman TX 1,835 38.0% 16.9% 310 1,147 1,163,450 1,015
Kendall TX 280 16.8% 17.4% 49 302 471,240 1,563
Lampasas TX 236 38.1% 15.8% 37 183 140,546 769
Liberty TX 727 47.5% 17.6% 128 257 220,242 856
Lubbock TX 2,753 33.8% 16.4% 451 27,796 22,265,400 801
McLennan TX 2,672 36.4% 17.1% 457 13,668 9,079,203 664
Medina TX 338 33.1% 17.4% 59 58 54,449 931
Midland TX 1,800 33.2% 16.4% 295 16,698 19,437,949 1,164
30

County/State
Number of Subprime
Loans 2005-2006
Proportion of All Loans that are Subprime,
2005-2006
Projected Cumulative Foreclosure
Rate on 2005-2006 Subprime
Loans
Projected Number of
Total Homes Lost to
Foreclosure
Number of Neighboring
Homes Experiencing Devaluation
Decrease in House Value/Tax Base
from Foreclosure Effect ($)
Average Decrease per Housing Unit Affected ($)
Montgomery TX 6,617 27.5% 17.6% 1,165 15,234 23,887,894 1,568
Nueces TX 4,152 37.1% 16.4% 681 43,305 44,116,547 1,019
Orange TX 852 35.1% 17.9% 153 1,421 1,120,949 789
Parker TX 1,585 29.3% 16.8% 266 1,608 1,649,246 1,025
Potter TX 1,123 35.1% 17.8% 200 11,036 8,120,805 736
Randall TX 1,326 23.6% 17.8% 236 15,141 16,622,194 1,098
Robertson TX 151 46.0% 15.2% 23 23 13,520 589
Rockwall TX 1,305 24.8% 16.9% 221 3,203 5,324,011 1,662
Rusk TX 525 36.3% 14.8% 78 495 412,336 834
San Jacinto TX 258 45.5% 17.6% 45 53 42,739 813
San Patricio TX 722 38.2% 16.4% 118 1,833 1,806,307 986
Smith TX 2,205 26.9% 16.1% 355 7,363 7,557,903 1,026
Tarrant TX 25,912 32.9% 16.8% 4,353 225,155 239,221,101 1,062
Taylor TX 1,242 35.5% 16.0% 199 9,331 7,023,962 753
Tom Green TX 1,025 35.6% 16.4% 168 6,957 5,587,202 803
Travis TX 8,088 18.5% 17.0% 1,375 68,877 103,650,362 1,505
Upshur TX 483 41.1% 14.8% 71 264 215,644 817
Victoria TX 732 33.0% 13.3% 97 3,834 3,080,244 803
Waller TX 433 40.0% 17.6% 76 89 93,655 1,053
Webb TX 3,521 50.1% 13.0% 458 17,943 18,104,842 1,009
Wichita TX 1,328 35.1% 15.6% 207 7,496 5,441,013 726
Williamson TX 4,338 20.2% 17.0% 737 18,019 27,624,273 1,533
Wilson TX 375 27.3% 17.4% 65 168 188,119 1,121
Wise TX 740 34.4% 16.8% 124 261 251,380 963
Total/Average of TX 292,444 33.7% 16.8% 49,000 2,283,390 2,784,639,647 1,220
Cache UT 780 16.9% 17.1% 133 2,990 4,360,891 1,459
Davis UT 4,342 20.7% 17.9% 777 28,720 54,987,427 1,915
Juab UT 128 27.5% 18.4% 24 58 96,616 1,665
Morgan UT 89 14.7% 17.9% 16 3 7,774 2,374
Salt Lake UT 18,496 25.6% 17.4% 3,218 189,508 515,750,494 2,722
Summit UT 456 11.8% 17.4% 79 300 1,634,124 5,447
Tooele UT 1,217 29.9% 17.4% 212 4,878 8,793,958 1,803
Utah UT 6,973 22.0% 18.4% 1,283 41,328 88,016,032 2,130
Washington UT 2,896 23.0% 19.7% 571 7,800 17,011,853 2,181
Weber UT 3,753 27.1% 17.9% 672 34,856 54,385,285 1,560
Total/Average of UT 39,130 23.7% 17.9% 6,985 310,442 745,044,453 2,400
Albemarle VA 807 12.8% 18.1% 146 1,744 4,154,211 2,382
Alexandria city VA 1,145 9.8% 22.8% 261 42,018 355,681,813 8,465
Amelia VA 306 33.2% 20.2% 62 39 62,121 1,585
Amherst VA 442 30.9% 17.3% 76 482 610,336 1,266
31

County/State
Number of Subprime
Loans 2005-2006
Proportion of All Loans that are Subprime,
2005-2006
Projected Cumulative Foreclosure
Rate on 2005-2006 Subprime
Loans
Projected Number of
Total Homes Lost to
Foreclosure
Number of Neighboring
Homes Experiencing Devaluation
Decrease in House Value/Tax Base
from Foreclosure Effect ($)
Average Decrease per Housing Unit Affected ($)
Appomattox VA 134 26.2% 17.3% 23 43 57,891 1,351
Arlington VA 1,112 8.0% 22.8% 254 47,219 281,034,455 5,952
Bedford VA 766 18.2% 17.3% 133 433 873,663 2,020
Bedford city VA 68 23.4% 17.3% 12 226 298,466 1,318
Botetourt VA 380 18.6% 16.5% 63 207 415,666 2,009
Bristol city VA 256 34.0% 17.9% 46 1,546 1,437,929 930
Campbell VA 633 26.5% 17.3% 110 722 1,070,180 1,483
Caroline VA 1,229 35.9% 20.2% 248 331 503,766 1,520
Charles City VA 174 40.7% 20.2% 35 32 45,902 1,420
Charlottesville city VA 324 16.6% 18.1% 59 5,980 10,525,569 1,760
Chesapeake city VA 6,000 27.0% 18.0% 1,080 41,331 96,642,867 2,338
Chesterfield VA 7,549 25.8% 20.2% 1,525 41,176 78,401,113 1,904
Clarke VA 217 15.9% 22.8% 49 86 263,596 3,069
Colonial Heights city VA 296 28.4% 20.2% 60 3,785 5,411,109 1,430
Craig VA 111 42.4% 16.5% 18 7 8,688 1,251
Cumberland VA 268 39.8% 20.2% 54 40 53,105 1,333
Danville city VA 591 42.7% 17.5% 103 5,171 4,319,420 835
Dinwiddie VA 686 41.4% 20.2% 139 958 1,341,673 1,401
Fairfax VA 13,530 13.9% 22.8% 3,085 201,596 1,117,757,141 5,545
Fairfax city VA 295 14.6% 22.8% 67 4,405 17,467,628 3,965
Falls Church city VA 51 6.6% 22.8% 12 1,469 7,863,830 5,352
Fauquier VA 1,236 17.6% 22.8% 282 845 2,893,943 3,426
Fluvanna VA 535 23.2% 18.1% 97 299 659,418 2,203
Franklin VA 680 25.2% 16.5% 112 308 557,427 1,812
Frederick VA 1,988 23.0% 17.1% 340 3,025 6,868,988 2,271
Fredericksburg city VA 232 18.2% 22.8% 53 2,710 7,537,234 2,781
Giles VA 217 28.0% 17.0% 37 49 48,907 1,002
Gloucester VA 712 24.0% 18.0% 128 653 1,462,973 2,242
Goochland VA 314 16.6% 20.2% 63 74 201,113 2,713
Greene VA 312 20.6% 18.1% 56 146 306,520 2,106
Hampton city VA 3,904 38.5% 18.0% 703 42,308 92,241,259 2,180
Hanover VA 1,298 16.8% 20.2% 262 2,926 6,779,223 2,317
Harrisonburg city VA 273 17.5% 18.1% 49 2,083 4,066,678 1,952
Henrico VA 6,237 25.3% 20.2% 1,260 47,474 87,179,062 1,836
Hopewell city VA 552 45.3% 20.2% 112 7,013 8,849,820 1,262
Isle of Wight VA 649 23.0% 18.0% 117 491 1,375,051 2,803
James City VA 801 14.4% 18.0% 144 1,410 5,124,302 3,634
King William VA 351 25.5% 20.2% 71 123 202,415 1,640
King and Queen VA 111 32.8% 20.2% 22 11 15,665 1,380
Loudoun VA 4,964 12.9% 22.8% 1,132 28,877 179,161,096 6,204
32

County/State
Number of Subprime
Loans 2005-2006
Proportion of All Loans that are Subprime,
2005-2006
Projected Cumulative Foreclosure
Rate on 2005-2006 Subprime
Loans
Projected Number of
Total Homes Lost to
Foreclosure
Number of Neighboring
Homes Experiencing Devaluation
Decrease in House Value/Tax Base
from Foreclosure Effect ($)
Average Decrease per Housing Unit Affected ($)
Louisa VA 956 31.4% 20.2% 193 229 366,582 1,600
Lynchburg city VA 866 27.5% 17.3% 150 6,699 6,694,078 999
Manassas Park city VA 760 32.5% 22.8% 173 3,365 35,819,225 10,645
Manassas city VA 1,480 31.2% 22.8% 337 12,114 73,614,561 6,077
Mathews VA 109 21.1% 18.0% 20 60 140,067 2,343
Montgomery VA 496 13.8% 17.0% 84 815 1,491,003 1,830
Nelson VA 207 23.9% 18.1% 37 36 73,979 2,037
New Kent VA 303 19.0% 20.2% 61 84 176,540 2,104
Newport News city VA 3,907 34.1% 18.0% 703 47,049 108,401,426 2,304
Norfolk city VA 5,210 36.8% 18.0% 938 71,083 188,574,425 2,653
Petersburg city VA 906 59.1% 20.2% 183 8,545 9,752,029 1,141
Pittsylvania VA 604 29.9% 17.5% 106 263 276,331 1,049
Poquoson city VA 132 14.0% 18.0% 24 385 1,193,496 3,100
Portsmouth city VA 3,570 43.3% 18.0% 643 34,781 82,816,356 2,381
Powhatan VA 499 20.6% 20.2% 101 165 365,645 2,214
Prince George VA 617 33.6% 20.2% 125 463 909,078 1,965
Prince William VA 13,268 24.2% 22.8% 3,025 76,194 432,802,461 5,680
Pulaski VA 377 27.2% 17.0% 64 471 531,594 1,129
Radford city VA 82 17.5% 17.0% 14 403 571,510 1,419
Richmond city VA 3,917 34.8% 20.2% 791 55,235 98,171,774 1,777
Roanoke VA 1,151 20.1% 16.5% 190 5,697 9,177,531 1,611
Roanoke city VA 1,902 36.3% 16.5% 314 19,538 20,454,051 1,047
Rockingham VA 787 19.6% 18.1% 142 487 910,010 1,870
Salem city VA 285 22.3% 16.5% 47 1,721 2,745,209 1,595
Scott VA 198 38.6% 17.9% 35 87 82,101 945
Spotsylvania VA 3,912 25.9% 22.8% 892 11,816 33,056,953 2,798
Stafford VA 3,418 22.3% 22.8% 779 14,078 49,966,727 3,549
Suffolk city VA 2,512 30.4% 18.0% 452 7,699 14,172,912 1,841
Surry VA 131 36.4% 18.0% 24 16 29,564 1,833
Sussex VA 169 44.9% 20.2% 34 33 39,378 1,202
Virginia Beach city VA 10,001 25.2% 18.0% 1,800 102,804 341,171,724 3,319
Warren VA 1,107 25.0% 22.8% 252 3,608 7,319,050 2,028
Washington VA 580 23.2% 17.9% 104 404 492,227 1,218
Williamsburg city VA 68 13.2% 18.0% 12 315 912,341 2,898
Winchester city VA 450 25.7% 17.1% 77 5,168 11,329,022 2,192
York VA 608 13.0% 18.0% 109 2,200 6,470,989 2,941
Total/Average of VA 128,281 22.5% 20.1% 25,796 1,035,979 3,932,905,177 3,796
Chittenden VT 1,016 10.8% 15.1% 153 5,001 9,989,651 1,997
Franklin VT 671 20.9% 15.1% 101 1,419 2,230,472 1,572
Grand Isle VT 99 20.8% 15.1% 15 40 73,150 1,836
33

County/State
Number of Subprime
Loans 2005-2006
Proportion of All Loans that are Subprime,
2005-2006
Projected Cumulative Foreclosure
Rate on 2005-2006 Subprime
Loans
Projected Number of
Total Homes Lost to
Foreclosure
Number of Neighboring
Homes Experiencing Devaluation
Decrease in House Value/Tax Base
from Foreclosure Effect ($)
Average Decrease per Housing Unit Affected ($)
Total/Average of VT 1,786 13.7% 15.1% 270 6,460 12,293,273 1,903
Asotin WA 205 19.5% 19.6% 40 2,056 2,821,463 1,372
Benton WA 1,664 20.3% 14.8% 246 9,547 11,735,586 1,229
Chelan WA 701 18.6% 11.3% 79 2,068 4,117,090 1,991
Clark WA 8,881 23.0% 20.4% 1,812 76,765 224,500,783 2,925
Cowlitz WA 1,904 28.8% 13.7% 261 9,280 15,944,613 1,718
Douglas WA 442 22.4% 11.3% 50 1,537 3,484,388 2,267
Franklin WA 1,025 29.8% 14.8% 152 3,673 4,124,861 1,123
King WA 24,780 15.7% 16.8% 4,163 344,478 1,405,641,287 4,081
Kitsap WA 3,839 20.6% 16.5% 633 24,933 60,341,493 2,420
Pierce WA 19,874 28.5% 16.5% 3,279 143,130 442,486,364 3,092
Skagit WA 1,659 21.9% 13.9% 231 5,009 12,313,079 2,458
Skamania WA 149 22.2% 20.4% 30 23 57,373 2,513
Snohomish WA 13,941 21.4% 16.8% 2,342 116,888 383,514,651 3,281
Spokane WA 6,889 22.7% 17.3% 1,192 72,344 127,986,875 1,769
Thurston WA 4,078 21.4% 15.5% 632 15,982 37,099,390 2,321
Whatcom WA 1,965 14.8% 14.7% 289 5,273 14,299,125 2,712
Yakima WA 2,545 28.0% 12.0% 305 13,541 17,030,712 1,258
Total/Average of WA 94,541 20.8% 16.6% 15,737 846,526 2,767,499,134 3,269
Brown WI 2,942 18.0% 17.0% 500 26,311 31,947,414 1,214
Calumet WI 558 17.5% 17.8% 99 1,965 2,448,616 1,246
Chippewa WI 1,024 25.6% 18.4% 188 1,331 1,443,512 1,085
Columbia WI 924 24.0% 19.7% 182 780 1,071,135 1,373
Dane WI 3,829 12.0% 19.7% 754 32,109 60,214,682 1,875
Douglas WI 720 29.3% 16.2% 117 3,278 3,101,460 946
Eau Claire WI 1,073 19.7% 18.4% 197 7,048 7,862,199 1,115
Fond du Lac WI 1,293 21.7% 18.1% 234 9,035 11,139,943 1,233
Iowa WI 351 24.2% 19.7% 69 98 122,539 1,245
Kenosha WI 3,175 27.2% 19.2% 610 28,207 55,270,703 1,959
Kewaunee WI 269 21.9% 17.0% 46 259 239,835 925
La Crosse WI 1,011 18.4% 18.9% 191 7,538 8,172,321 1,084
Marathon WI 1,444 18.5% 17.6% 254 5,737 6,109,499 1,065
Milwaukee WI 21,172 36.4% 20.4% 4,319 286,653 668,645,184 2,333
Oconto WI 691 23.2% 17.0% 117 150 159,187 1,062
Outagamie WI 1,968 16.9% 17.8% 350 17,816 20,490,647 1,150
Ozaukee WI 708 12.6% 20.4% 144 3,157 7,404,297 2,345
Pierce WI 531 19.8% 20.2% 107 692 1,311,159 1,894
Racine WI 3,584 25.5% 19.5% 699 33,923 57,806,281 1,704
Rock WI 2,999 27.4% 19.1% 573 22,770 25,583,191 1,124
Sheboygan WI 1,403 22.2% 18.3% 257 13,434 14,645,478 1,090
34

35
County/State
Number of Subprime
Loans 2005-2006
Proportion of All Loans that are Subprime,
2005-2006
Projected Cumulative Foreclosure
Rate on 2005-2006 Subprime
Loans
Projected Number of
Total Homes Lost to
Foreclosure
Number of Neighboring
Homes Experiencing Devaluation
Decrease in House Value/Tax Base
from Foreclosure Effect ($)
Average Decrease per Housing Unit Affected ($)
St. Croix WI 1,349 19.4% 20.2% 272 1,288 2,607,850 2,025
Washington WI 1,572 16.3% 20.4% 321 7,327 13,889,457 1,896
Waukesha WI 3,856 14.0% 20.4% 787 24,452 50,334,658 2,059
Winnebago WI 2,032 21.0% 17.9% 364 21,890 22,723,291 1,038
Total/Average of WI 60,478 22.6% 19.4% 11,753 557,251 1,074,744,537 1,929
Berkeley WV 2,375 25.1% 20.6% 489 7,336 12,296,910 1,676
Boone WV 217 36.8% 15.1% 33 60 51,710 865
Brooke WV 276 30.6% 18.3% 51 1,242 950,466 765
Cabell WV 832 22.5% 16.3% 136 7,299 6,289,704 862
Clay WV 79 42.9% 15.1% 12 8 5,179 626
Hampshire WV 560 41.6% 17.1% 96 82 126,343 1,538
Hancock WV 278 24.3% 18.3% 51 1,486 1,203,097 810
Jefferson WV 1,099 19.8% 22.8% 251 1,434 3,484,043 2,430
Kanawha WV 1,619 21.5% 15.1% 244 8,976 8,642,669 963
Lincoln WV 116 25.3% 15.1% 18 23 16,934 751
Marshall WV 301 27.0% 16.1% 48 769 545,879 710
Mineral WV 343 30.4% 10.9% 37 234 270,745 1,159
Monongalia WV 499 13.8% 14.9% 74 1,478 2,164,043 1,464
Morgan WV 298 21.2% 20.6% 61 164 276,457 1,690
Ohio WV 370 23.3% 16.1% 60 2,747 1,957,109 713
Pleasants WV 83 36.9% 15.3% 13 20 18,141 898
Preston WV 242 22.9% 14.9% 36 58 56,974 988
Putnam WV 488 15.9% 15.1% 74 1,004 1,620,909 1,615
Wayne WV 346 25.8% 16.3% 56 1,324 1,110,034 839
Wirt WV 53 34.4% 15.3% 8 6 4,163 746
Wood WV 775 22.4% 15.3% 119 5,141 4,226,788 822
Total/Average of WV 11,249 23.0% 17.5% 1,966 40,886 45,318,298 1,108
Laramie WY 1,342 22.6% 17.6% 236 8,964 12,349,148 1,378
Natrona WY 1,202 24.6% 17.3% 208 9,665 13,678,358 1,415
Total/Average of WY 2,544 23.5% 17.5% 444 18,630 26,027,506 1,397
Total/Average of US 4,426,331 26.3% 18.8% 831,454 40,621,895 201,532,859,912 4,961

![Knowledge is Power: Consumer Education and the Subprime ... · foreclosures are attributable to subprime mortgages.14 It is estimated that ―[a]t least one out of five subprime loans](https://img.pdfslide.us/doc/110x75/5f0abd137e708231d42d19ec/knowledge-is-power-consumer-education-and-the-subprime-foreclosures-are-attributable.jpg)