Embed Size (px)
Citation preview
The ultrafast charge-transfer-to-solvent dynamics of iodide in tetrahydrofuran. 2. Photoinduced electron transfer to counterions in
solution
Journal: The Journal of Physical Chemistry
Manuscript ID: jp-2007-12039u.R1
Manuscript Type: Article
Date Submitted by the Author:
n/a
Complete List of Authors: Bragg, Arthur; UCLA, Chem. & Biochem. Schwartz, Benjamin; University of California, Los Angeles, Chemistry and Biochemistry; The Journal of Physical Chemistry, Department of Chemistry and Biochemistry
ACS Paragon Plus Environment
Submitted to The Journal of Physical Chemistry
The ultrafast charge-transfer-to-solvent dynamics of iodide in
tetrahydrofuran. 2. Photoinduced electron transfer to
counterions in solution
Arthur E. Bragg and Benjamin J. Schwartz∗
Department of Chemistry and Biochemistry, University of California,
Los Angeles, Los Angeles, California 90095-1569
Abstract: The excited states of atomic anions in liquids are bound only by
the polarization of the surrounding solvent. Thus, the electron-detachment process
following excitation to one of these solvent-bound states, known as charge-transfer-
to-solvent (CTTS) states, provides a useful probe of solvent structure and dynamics.
These transitions and subsequent relaxation dynamics also are influenced by other
factors that alter the solution environment local to the CTTS anion, including the
presence of cosolutes, cosolvents, and other ions. In this paper, we examine the ul-
trafast CTTS dynamics of iodide in liquid tetrahydrofuran (THF) with a particular
focus on how the solvent dynamics and the CTTS electron-ejection process are al-
tered in the presence of various counterions. In weakly-polar solvents such as THF,
iodide salts can be strongly ion-paired in solution; the steady-state UV-visible ab-
sorption spectroscopy of various iodide salts in liquid THF indicates that the degree
of ion-pairing changes from strong to weak to none as the counterion is switched
from Na+ to tetrabutylammonium (t−BA+) to crown-ether-complexed Na+, respec-
tively. In our ultrafast experiments, we have excited the I− CTTS transition of these
various iodide salts at 263 nm and probed the dynamics of the CTTS-detached elec-
trons throughout the visible and near-IR. In the previous paper of this series (A.
E. Bragg and B. J. Schwartz, J. Phys. Chem. B 2008, 112, 483-494), we found that
for ‘counterion-free’ I− (obtained by complexing Na+ with a crown ether) the CTTS
electrons were ejected ∼6 nm from their partner iodine atoms, the result of signifi-
cant non-adiabatic coupling between the CTTS excited state and extended electronic
states supported by the naturally existing solvent cavities in liquid THF, which also
serve as pre-existing electron traps. In contrast, for the highly ion-paired NaI/THF
Page 1 of 41
ACS Paragon Plus Environment
Submitted to The Journal of Physical Chemistry
123456789101112131415161718192021222324252627282930313233343536373839404142434445464748495051525354555657585960
2
system, we find that ∼90% of the CTTS electrons are ‘captured’ by a nearby Na+
to form (Na+, e−)THF tight-contact pairs (TCPs), which are chemically and spec-
troscopically distinct from both solvated neutral sodium atoms and free solvated
electrons. A simple kinetic model is able to reproduce the details of the electron
capture process, with 63% of the electrons captured quickly in ∼2.3 ps, 26% cap-
tured diffusively in ∼63 ps, and the remaining 11% escaping out into the solution on
sub-ns time scales. We also find that the majority of the CTTS electrons are ejected
to within 1 or 2 nm of the Na+. This demonstrates that the presence of the nearby
cation biases the relocalization of CTTS-generated electrons from I− in THF, chang-
ing the non-adiabatic coupling to the extended, cavity-supported electronic states
in THF to produce a much tighter distribution of electron-ejection distances. In
the case of the more loosely ion-paired t−BA+-I−/THF system, we find that only
10-15% of the CTTS-ejected electrons associate with t−BA+ to form ‘loose-contact
pairs’ (LCPs), which are characterized by a much weaker interaction between the
electron and cation than occurs in TCPs. The formation of (t−BA+, e−)THF LCPs
is characterized by a coulombically induced blue-shift of the free e−THF spectrum
on a ∼5-ps time scale. We argue that the weaker interaction between t−BA+ and
the parent I− results in little change to the CTTS-ejection process, so that only
those electrons that happen to localize in the vicinity of t−BA+ are captured to
form LCPs. Finally, we interpret the correlation between electron capture yield and
counterion-induced perturbation of the I− CTTS transition as arising from changes
in the distribution of ion-pair separations with cation identity, and we discuss our
results in the context of relevant salt conductivity measurements.
I. INTRODUCTION
Charge-transfer-to-solvent (CTTS) reactions of atomic anions are amongst the simplest
solution-phase chemical reactions. These reactions are initiated by photoexcitation to bound
solvent-supported excited states that do not exist for the bare ion in the gas phase.1,2 Fol-
lowing excitation, these states relax as a result of solvent motions, leading to the generation
Page 2 of 41
ACS Paragon Plus Environment
Submitted to The Journal of Physical Chemistry
123456789101112131415161718192021222324252627282930313233343536373839404142434445464748495051525354555657585960
3
of a solvated electron, e−solv, and a solvated neutral atom:
X− hν−→ X−∗ CTTS−→ X + e−solv, (1)
where X represents an atom whose excited anion, X−∗, can undergo a CTTS reaction in
solution; these solvent-supported anionic excited states commonly are referred to as CTTS
states. Because atomic anions lack intramolecular (nuclear) degrees of freedom, the dynamics
of their photo-initiated CTTS reactions are dictated only by the solvent’s structure and
dynamic response to excitation. In turn, the solvent structure and response are strongly
dependent on the molecular identity of the solvent, the ionic strength of the solution, and
the presence of cosolutes and cosolvents. Consequently, CTTS reactions have a multivariate
sensitivity to the local solution environment, and thus are ideal probes for investigating the
microscopic dynamics of this environment and how these dynamics change with solution
composition. In this paper, we use this sensitivity to explore how ion-pair interactions
influence CTTS dynamics in weakly-polar solvents, specifically investigating how the CTTS
dynamics of I− in tetrahydrofuran (THF) are altered by the presence of salt counterions.
Since the advent of ultrafast laser sources, the CTTS reaction dynamics of several atomic
anions in a variety of solvent environments have been examined in considerable detail.1,3–15
For I−, the CTTS dynamics in polar-protic3 and polar-aprotic6 environments are very simi-
lar. CTTS excitation of I− in polar solvents leads to electron detachment near the partner
I atom on a sub-100-fs time scale.4–7 Subsequently, the nascent CTTS-ejected e−solv equili-
brates with its local solution environment over several-to-tens of picoseconds, as evidenced
by an initial dynamic blue-shift of the e−solv’s absorption spectrum.5 After (and sometimes
during) equilibration, the ejected electrons recombine with their geminate I-atom partners
on a 10’s-to-100’s-of-ps time scale to regenerate the parent I− ion.3–5 Among polar solvents,
differences in I− CTTS dynamics originate from subtle differences in the dynamics of the
solvent response, but do not reflect a qualitatively different picture of I− CTTS.16
In contrast, the CTTS dynamics of I− in weakly-polar, aprotic solvents can have a sig-
nificantly different character. In previous work, we presented the wavelength- and time-
dependent dynamics associated with the CTTS excitation of ‘counterion-free’ I− in THF.8
We found that THF-solvated electrons, e−THF, are ejected ∼380-fs following CTTS excitation
and that the ejected electrons appear with their equilibrium absorption spectrum. Fur-
thermore, we found that the ejected electrons do not undergo geminate recombination with
Page 3 of 41
ACS Paragon Plus Environment
Submitted to The Journal of Physical Chemistry
123456789101112131415161718192021222324252627282930313233343536373839404142434445464748495051525354555657585960
4
their I-atom partners on sub-nanosecond timescales. We also performed a series of com-
petitive scavenging experiments that revealed a considerably larger spatial extent to the
CTTS-excited state of I− (and thus the initial electron-ejection distance) in THF relative
to water. We interpreted these behaviors as resulting from the unusual liquid structure of
THF: unlike most fluids, liquid THF packs poorly on the molecular level, resulting in a sol-
vent structure characterized by a prevalence of electropositive solvent voids or cavities.17,18
These cavities are natural traps for excess electrons and are also associated with low-lying,
disjoint solvent-supported electronic excited states in THF that have amplitude in multiple
cavities.17 Excitation of an excess electron into these natural solvent-supported excited states
can promote relocalization into cavities located up to nanometers away from the cavity of
origin.19,20 Thus, we assigned the large effective spatial extent (∼6 nm) of the I− CTTS
excited state in THF as originating from coupling between the local CTTS excited state
and these low-lying disjoint solvent-supported electronic states.8 Furthermore, we under-
stand the lack of electron-solvation dynamics to reflect the fact that the solvent cavities in
THF are nearly optimized to solvate an excess electron.8 The CTTS excited state of I− in
water and other polar solvents, on the other hand, lies well below the conduction band,5 and
significant solvent rearrangement is required to solvate CTTS-generated solvated electrons,
which localize close to the geminate I atom.
In studies of CTTS dynamics, the goal is usually to understand the properties of the ‘free’
CTTS system (i.e., in the limit of infinite dilution) such that time-resolved measurements
reflect only the influence of the solvent on the charge-transfer process. In aqueous solutions,
this condition is achieved readily with monovalent salts at millimolar concentrations, as these
salts typically dissolve to completion21 and the high dielectric strength of water adequately
screens ion-ion interactions (i.e., the Onsager distance, rc, at which coulombic attaction
equals kBT , is on the order of a few Angstroms). On the other hand, these salts dissolve very
poorly in weakly-polar solvents like THF (Kdiss ≤ 10−5 M),22 and ion-pair interactions are
not screened even over relatively long distances (i.e., rc can be several nanometers). Thus, in
order to investigate the dynamics of ‘free’ I− in weakly polar solvents, it is necessary to screen
coulombic interactions between salt counterions. In our previous study, we accomplished this
by complexing Na+ with 18-crown-6 cyclic ether.8 Figure 1 illustrates that the I− CTTS
transition not only is affected by the polarity of the surrounding solvent medium (water vs.
THF), but also is perturbed strongly by the presence of the nearby cation.23 This figure
Page 4 of 41
ACS Paragon Plus Environment
Submitted to The Journal of Physical Chemistry
123456789101112131415161718192021222324252627282930313233343536373839404142434445464748495051525354555657585960
5
makes it clear that counterion-induced spectral shifts of the I− CTTS band depend on the
identity of the counterion: the absorption-band maximum of the ‘free’-I− CTTS transition
lies at 254 nm (red squares), whereas that for tetrabutylammonium I− and uncomplexed
Na+-I− occur at 248 nm (green circles) and 236 nm (blue diamonds), respectively.23 A
similar scenario has been noted for alkali iodides in supercritical ammonia: steady-state
absorption measurements indicate that these salts exhibit CTTS absorption from both ‘free’
and contact-pair species, and that the equilibrium between the ‘free’ and ion-paired species
may be manipulated by altering the properties of the solvent.24–27
Given the strong counterion dependence of its CTTS absorption spectrum, how should
we expect the dynamics of CTTS-excited iodide to change due to interactions with nearby
charges? This issue has been addressed to some degree for aqueous ionic solutions. In high-
dielectric liquids such as H2O, raising the ionic strength generates increased non-specific ion-
ion interactions that alter the hydration structure of CTTS anions and minimally perturb the
CTTS (and e−H2O) absorption spectrum.2,28–30 Gelabert and Gaudel first invoked counterion
stabilization of e−H2O and e−H2O-Cl geminate pairs in an attempt to explain subtleties in
the transient absorption dynamics that follow photodetachment of Cl− in aqueous NaCl
solutions.31 However, it is unclear whether these small spectral perturbations are better
assigned to specific interactions with a single Na+ counterion than to non-specific interactions
with a strong ionic atmosphere associated with the ∼1 M sample concentrations studied in
these experiments.31 In a more systematic study, Sauer et al.29 showed that increasing the
ionic strength can perturb the slow geminate recombination process that follows aqueous
I− CTTS excitation, such that the total free electron yield decreases with increased ionic
strength. Yet, despite this subtlety, the CTTS dynamics of I− in water were found to
be qualitatively similar in solutions of varied ionic strength: locally ejected e−H2O either
recombine with the geminate I atom or diffusively escape the weak attraction with the
partner atom to become free electrons in solution.29
For I− salts in THF, the sizeable shift of the I− CTTS spectrum with counterion iden-
tity due to specific ion-pair interactions seen in Figure 1 portends considerable differences
in CTTS dynamics with the identity of the dissolved salt — including the possibility of
electron transfer to the counterion. With our understanding of the CTTS dynamics of
‘free’ iodide from our previous work,8 we are now in a position to carefully examine how
the presence of counterions alters the overall CTTS process. Our goal is to use ultrafast
Page 5 of 41
ACS Paragon Plus Environment
Submitted to The Journal of Physical Chemistry
123456789101112131415161718192021222324252627282930313233343536373839404142434445464748495051525354555657585960
6
spectroscopy to explore how the extent of ion-pairing and the proximity of countercations
affects the CTTS dynamics of I− in liquid THF. We ask specifically: do the counterions
bias electron localization by altering the preexisting void structure and solvent-supported
electronic states of THF? How does this affect the ejection distance of CTTS electrons in
THF? Does ion pairing promote direct electron transfer to the counterion or induce new
electron solvation dynamics? We will show that the presence of counterions affects not only
the CTTS electron-ejection distribution, but also that proximal counterions can ‘capture’
the ejected electrons, forming either ‘tight’ or ‘loose’ cation:electron contact pairs that are
spectroscopically distinct from ‘free’ solvated electrons. These spectroscopic differences pro-
vide a convenient handle with which we can assess cation-induced changes to the CTTS
ejection dynamics. Moreover, the extensive ion-pairing of iodide salts in THF presents a
useful starting point from which we can investigate electron-attachment dynamics in liquids
in considerable detail.
The remainder of this paper is organized as follows. In Section II, we summarize our
experimental methods, which have been described in more detail elsewhere.8 Section III
presents our time-resolved investigation of various I− salts in liquid THF. We begin in
Section IIIA by discussing the steady-state spectroscopy of the solvated electron and the
various solvated electron:cation complexes that we generate through the photo-induced I−
CTTS reaction. In Section III B, we examine the CTTS dynamics of I− in the presence
of Na+ using ultrafast transient absorption spectroscopy, and demonstrate that the CTTS
excitation of I− leads almost exclusively to the formation of (Na+, e−)THF tight-contact pairs.
We also contrast the formation kinetics of (Na+, e−)THF with the geminate recombination
dynamics that follow the CTTS excitation of counterion-free I− in THF and the multiphoton
ionization of neat THF in order to gauge the CTTS-generated distribution of electrons and
cations. In Section III C, we illustrate that the CTTS excitation of I− in the presence of
tetrabutylammonium, t−BA+, leads to formation of (t−BA+, e−)THF loose-contact pairs
(LCPs). The dynamics associated with loose-contact pair formation are characterized by a
subtle spectral shift of the absorption band of LCPs relative to ‘free’ THF-solvated electron.
We analyze the wavelength-dependent transients with two different electron-capture models
that enable us to extract the absorption spectrum of the (t−BA+, e−)THF loose-contact pair.
We conclude in Section IV by discussing these results in the context of the thermodynamics
of ion pairing, contrasting our measurements with conductivity data for THF-solvated salts
Page 6 of 41
ACS Paragon Plus Environment
Submitted to The Journal of Physical Chemistry
123456789101112131415161718192021222324252627282930313233343536373839404142434445464748495051525354555657585960
7
and comparing our measured cation-dependent electron-capture yields with cation-induced
shifts in the CTTS spectra. The Appendix extensively describes the convolution methods
we use to properly fold our experimental temporal response into our kinetic electron-capture
models.
II. EXPERIMENTAL
The sample preparation and optical detection methods we use to investigate the time-
resolved CTTS dynamics of I− salts in THF have been described extensively in a recent
publication.8 Briefly, tetrahydrofuran (THF, Fischer) was dried over potassium metal under
an Ar atmosphere and was distilled freshly for use; the freshly distilled solvent was opti-
cally transparent above ∼220 nm and was free of dissolved oxygen. Tetrabutylammonium
((CH3(CH2)3)4N+) iodide, t−BA+-I− (Sigma, >99% purity), NaI (Fluka, >99.5% purity),
and 18-crown-6 cyclic ether (1,4,7,10,13,16-hexa-oxa-cyclo-octa-decane, Aldrich, >98% pu-
rity) were used as purchased and were stored in a dessicator. Sample solutions (150-200 mL,
1-7.5 mM t−BA+-I−, 5-20 mM NaI) were prepared in a nitrogen drybox to curtail oxygen
and water contamination, and were mixed via moderate sonication and/or modest heat-
ing in sealed flasks. Sample solutions were circulated through a 2-mm path length quartz
flow cell (Spectrocell) using a peristaltic pump (Cole-Parmer); solutions flowed to the sam-
ple cell through a closed-circuit tubing loop that is chemically inert to both I− and THF.
The sample flow circuit was thoroughly flushed with nitrogen prior to sample introduction.
Negligible sample oxidation occurred through the course of several hours, as verified both
spectroscopically and according to the similarity of pump-probe data taken before and after
several hours of exposing the samples to UV laser pulses. The spectroscopic signatures of
various impurities (O2, I−3 , and H2O) are well-understood,32–34 such that we could easily
identify contaminated samples. We used fresh solutions daily and replaced them in the
event that the level of accumulated byproduct or contaminants became unacceptable.
Although we could not find published information regarding the solubility of these salts
in THF, we note we were unable to prepare room-temperature solutions with t−BA+-I−
concentrations above ∼10 mM even with extensive mixing, and that solutions with concen-
trations near 10 mM were stable only for a few hours. Most of our experiments using this
salt were conducted with a 5-mM t−BA+-I concentration in THF. In contrast, we were able
Page 7 of 41
ACS Paragon Plus Environment
Submitted to The Journal of Physical Chemistry
123456789101112131415161718192021222324252627282930313233343536373839404142434445464748495051525354555657585960
8
to make NaI solutions with concentrations up to 50 mM. Though a great deal of mixing
was required to make solutions at these concentrations, we found that these solutions were
indefinitely stable to precipitation. Since the 263-nm excitation wavelength we use in our
experiments is at the very red edge of the Na+-I− CTTS transition (cf. Fig. 1), we conducted
most of our experiments at a 20-mM NaI concentration in order to maximize absorption of
the excitation light but avoid overly excessive sample concentrations. We did verify, how-
ever, that there was no concentration dependence of the NaI/THF CTTS dynamics down
to the low mM concentration range.35
Our pump-probe transient absorption experiments were carried out using a regeneratively
amplified Ti:sapphire laser (Spectra Physics) outputting ∼120-fs pulses centered near 790
nm (∼800-µJ pulse energy, 1-kHz repetition rate). Roughly one-third of of the amplified
fundamental beam was frequency-tripled to generate 263-nm pump pulses with ∼3-5 µJ
of energy in a two-stage ‘doubling-mixing’ scheme. The UV pulse intensity was controlled
quantifiably with a set of calibrated, quartz-based neutral density filters. The remaining
amplifier output was used to pump a dual-pass optical parametric amplifier (OPA, Spectra
Physics), creating tunable signal and idler beams in the 1.2-2.5 µm range; for IR-probe ex-
periments, these wavelengths were isolated and used directly. For near-IR- and visible-probe
experiments, light pulses were produced either by doubling the signal or idler outputs (cre-
ating light in the 600-700 and 920-1100 nm ranges) or by sum-frequency generation (SFG)
of either the signal or idler pulses with the remaining 790-nm fundamental light (creating
light in the 470-650 nm range). Visible and near-IR-probe wavelengths were measured di-
rectly with an Ocean Optics fiber-based spectrometer at a ∼5-nm resolution, and the signal
and idler wavelengths were measured according to the wavelength of SFG signal generated
by mixing with the 790-nm fundamental. The relative pump-probe polarization was con-
trolled for visible probe colors with a wave-plate/polarizer pair, and visible transients were
collected with the relative pump and probe polarizations set at the magic angle (54.7◦).
We were unable to set the relative UV-IR polarization to the magic angle, but IR-probe
transients recorded at both 0◦ and 90◦ relative polarization were identical across the range
of investigated probe wavelengths.
The probe beam in our experiments was directed onto a computer-controlled, variable-
delay translation stage (Newport) outfitted with a corner-cube reflector. The pump and
probe beams were collinearly recombined using a 266-nm high reflector and were focused
Page 8 of 41
ACS Paragon Plus Environment
Submitted to The Journal of Physical Chemistry
123456789101112131415161718192021222324252627282930313233343536373839404142434445464748495051525354555657585960
9
towards the sample with a 100-mm fused-silica lens, with the sample placed 2-5 cm before the
pump focus. The probe beam was collimated prior to recombination with a 1-m lens to ensure
that the probe spot-size (∼50-100-µm diameter) was well within the pump spot-size (∼200-
µm diameter). Visible absorption transients were measured with Si photodiodes (Thorlabs
DET-100) and IR transients were recorded using either InGaAs photodiodes (Thorlabs DET-
400) or InAs (Judson Technologies) photodetectors. A mechanical chopper was placed in the
pump path to actuate pump-on/pump-off detection. A small portion of the probe beam was
split off prior to the sample and was directed to a reference detector for shot-by-shot double
normalization, whereby the intensity of the probe pulse transmitted through the sample is
divided by the intensity measured on the reference detector both with and without the pump
pulse present.36 Each of the pump-probe transients presented here was collected by signal
averaging for 30 min to 2 hours. All of the transients were collected at room temperature.
We close this section by discussing limitations to our temporal resolution induced by
the nature of our samples. The volatility and hygroscopicity of THF precludes use of thin
liquid sample jets that typically are employed to limit pump-probe refractive index mismatch
(group velocity mismatch, GVM) in a liquid sample of finite width.37 Although the refractive
index of THF changes very little across the visible and near IR, the refractive index of THF
increases significantly in the near UV due to pre-resonance with strong solvent absorption
bands. We have measured a refractive index mismatch (∆n) of ∼0.2 between the 263-nm
pump and IR-probe wavelengths in THF, corresponding to a ∼1.4-ps shift in time-zero upon
passing both beams through 2 mm of the liquid.38 This refractive-index mismatch through
samples of finite width results in the convolution of ‘true’ absorption transients with the
spatial variation of time-zero across the sample width, and typically introduces artifacts such
as ‘lazy’ signal rises and broadened signal spikes that originate from coherent pump-probe
interactions with the solvent. In fitting the models presented below, we have incorporated
the effects of GVM by convolving the modelled dynamics with a sample response function
that combines the refractive index mismatch with the sample-depth-dependent attenuation
of the pump intensity. In the Appendix, we present the analytic result of this convolution
for a multiexponential, time-dependent function and also include the effects of the pump-
probe cross-correlation; we also describe a general numeric procedure for convolving these
resolution effects (induced by GVM and finite pulse widths) with model functions exhibiting
more complicated time-dependence.
Page 9 of 41
ACS Paragon Plus Environment
Submitted to The Journal of Physical Chemistry
123456789101112131415161718192021222324252627282930313233343536373839404142434445464748495051525354555657585960
10
III. THE EFFECTS OF COUNTERIONS ON THE CTTS DYNAMICS OF I− IN
THF
A. The steady-state spectroscopy of ‘tight’ and ‘loose’ cation:electron contact pairs
in THF
It is generally accepted that solvated electrons exist as cavity-bound species in solution
that have little valence interaction with surrounding solvent molecules. Figure 2 shows the
spectrum of the THF-solvated electron (red squares39–41), and for reference, the spectrum of
the hydrated electron (black curve42). The spectrum of the THF-solvated electron exhibits
a broad absorption band that peaks in the IR at 2160 nm. Simulations have assigned this
absorption spectrum as a superposition of the s-to-p-like transitions of a particle in a roughly
spherical box at low energies and transitions between the s-like ground state and low-lying
solvent disjoint states at higher energies.17
The spectroscopy of the solvated electron in weakly-polar solvents changes dramatically,
however, in the presence of cations. For example, solvated electrons in ethers and amines
are attracted to and captured by alkali cations in solution.43–48 The spectrum of the species
with stoichiometry Na0, which is formed when solvated electrons associate with Na+ in THF,
spans the visible and near-IR, peaking at 870 nm (Fig. 2, blue diamonds).43 The absorption
band of this species is both substantially blue-shifted relative to the solvated electron’s
spectrum in THF and significantly red-shifted from the gas-phase sodium D-line (at 590
nm), suggesting that the chemical nature of this species lies somewhat between that of an
unsolvated neutral atom and a solvated electron. In a recent investigation of the ultrafast
CTTS dynamics of Na− in THF, Cavanagh et al. demonstrated that this 870-nm band arises
from a (Na+, e−)THF complex that is characterized by partial removal of the excess electron
from the Na 3s orbital and thus is chemically distinct from a weakly solvated neutral sodium
atom.49 In this and future work,50 we take advantage of the strong ion-pairing between Na+
and I− in liquid THF to directly probe the mechanisms by which the (Na+, e−)THF complex
is formed from its constituent parts when Na+ captures an excess electron generated by
CTTS-excitation of a nearby I− anion.
Although Na+ in THF captures 100% of photo- or radiolytically generated electrons in
solution, excess electrons in solutions made with solvents that interact more strongly with
Page 10 of 41
ACS Paragon Plus Environment
Submitted to The Journal of Physical Chemistry
123456789101112131415161718192021222324252627282930313233343536373839404142434445464748495051525354555657585960
11
Na+, such as polyglycoldimethyl ethers (dimethoxy ether, diglyme, triglyme, etc.) are char-
acterized by an equilibrium between ‘strong’ and ‘weak’ cation-electron interactions. Thus,
electron injection into Na+ solutions of polyglycoldimethyl ethers (glymes) yields two over-
lapping transient absorption bands: the first peaks near ∼900 nm, as with (Na+, e−)THF,
and the second is slightly blue-shifted from the e−solv spectrum in the absence of Na+, peak-
ing near ∼1600-1800 nm.51,52 These two absorption bands are understood to originate from
‘tight’ and ‘loose’ electron:cation ion pairs in solution. Tight-contact pairs (TCPs), associ-
ated with the 870-nm band observed in THF, are characterized by substantial interaction of
the electron with the outer s-orbital of the alkali cation, as evidenced by significant changes
to the electron’s hyperfine constant as measured via electron spin resonance (ESR).53 On
the other hand, loose-contact pairs (LCPs) are characterized by greater solvent separation
and negligible valence interaction between the electron and the cation. The green dashed
curve in Fig. 2 corresponds to the LCP spectrum in THF extracted from the measurements
described in Section III C. The shift of the LCP spectrum relative to that of a free solvated
electron arises largely as a perturbation by the attractive coulombic potential between the
partners, and is presumed to be relatively insensitive to the cation identity.51,52 We note that
unlike the solvated electron:neutral atom contact pairs that are frequently invoked to explain
CTTS recombination dynamics,4,9 cation:electron TCPs and LCPs are spectroscopically dis-
tinct from the free e−THF. Thus, one of our goals in this work is to compare and contrast the
formation of TCP and LCP species subsequent to the CTTS excitation of iodide.
B. Ultrafast CTTS dynamics of NaI in THF and the formation of (Na+, e−)THF
tight-contact pairs.
1. The capture of CTTS-ejected electrons by Na+
Because the electron-Na+ interactions in THF are relatively well understood (cf. Fig.
2),43,45 we begin our study of the effects of counterions on the CTTS dynamics of I− in THF
by examining the ultrafast spectroscopy of NaI/THF solutions. Figure 3 plots ultrafast
absorption transients measured at representative infrared probe wavelengths following the
263-nm CTTS excitation of 20-mM NaI/THF solutions. For ease of comparison, we have
normalized each of the transients at 25 ps, a time well after the fastest dynamical processes
Page 11 of 41
ACS Paragon Plus Environment
Submitted to The Journal of Physical Chemistry
123456789101112131415161718192021222324252627282930313233343536373839404142434445464748495051525354555657585960
12
are complete. The dynamics on longer time scales, t < 500 ps, are plotted in panels (a)-
(g) (left), and the dynamics on early time scales, t < 30 ps, are shown on an expanded
scale in panels (h)-(n) (right). The observed dynamics are clearly dependent on the probe
wavelength. After an initial rise that we cannot resolve due to the pump-probe refractive-
index mismatch (see Section II and the Appendix), the transient absorption intensity at
1670, 1440, 1270, and 1185 nm decays dramatically and the transient absorption measured
at 700 and 920 nm exhibits an intensity rise on both ∼10- and ∼100-ps time scales; all
of the transients reach a constant value by ∼300 ps. Additionally, we find a relatively
flat temporal response when probing at 1080 nm at times > 30 ps (Fig. 3(l)), revealing
a quasi-isosbestic point between the decaying long-wavelength and rising short-wavelength
absorption transients.54
The NaI CTTS absorption transients plotted in Fig. 3 differ considerably from the those
we measured previously following the CTTS excitation of ‘counterion-free’ I− in THF.8
Thus, the time- and wavelength-dependent transients of NaI/THF solutions highlighted in
Fig. 3 must result from the participation of Na+ in the CTTS kinetics. As our data strongly
suggest two-state kinetics in which ejected electrons disappear to form a new species that
absorbs farther to the blue, the logical conclusion is that the CTTS-ejected electrons are
captured by proximal Na+ cations in THF to form tight-contact pairs, (Na+, e−)THF:
e− + Na+ → (Na+, e−)THF. (2)
Indeed, the (Na+, e−)THF species has negligible absorption at wavelengths longer than ∼1400
nm (cf. Fig. 2), so that decaying absorption transients collected in this spectral window
reflect changes in the population of the CTTS-ejected THF-solvated electrons. At wave-
lengths shorter than ∼1000 nm, the (Na+, e−)THF absorbs more strongly than the solvated
electron, such that transients probed in this wavelength range primarily reflect TCP for-
mation. Finally, the absorption spectra of THF-solvated electrons and (Na+, e−)THF’s have
equal cross-sections near 1080 nm (cf. Fig. 2), leading to quasi-isosbestic behavior at this
probe wavelength.54
In order to support our assignment of the dynamics seen in Fig. 3 to the reaction of CTTS-
generated electrons with Na+ (Eq. 2) and to describe the transient behavior quantitatively,
we introduce a kinetic capture model that utilizes the steady-state absorption spectroscopy
Page 12 of 41
ACS Paragon Plus Environment
Submitted to The Journal of Physical Chemistry
123456789101112131415161718192021222324252627282930313233343536373839404142434445464748495051525354555657585960
13
of e−THF and (Na+, e−)THF:
Na+, I−hν−→ Na+, I−∗ (3a)
Na+, I−∗kCTTS−→ Na+, I, e− (3b)
kf , ff−→ (Na+, e−)THF (3c)
Na+, e−ks, fs−→ (Na+, e−)THF (3d)
fesc−→ e−THF. (3e)
In this ‘delayed-ejection-with-capture’ scheme, electron ejection from the I− CTTS excited
state (I−∗) occurs with rate kCTTS. Following ejection, some of these electrons (which we
assume have the free e−THF absorption spectrum plotted with red squares in Fig. 2) are
captured by nearby Na+ to form (Na+, e−)THF (with the equilibrium absorption spectrum
plotted with blue diamonds in Fig. 2): a fraction ff are captured on a fast time scale
(with rate kf ), a fraction fs are captured on a slow time scale (with rate ks), and the
remaining fraction fesc = 1 − ff − fs escape capture on sub-nanosecond time scales.55 As
described further below, the details of the capture processes depend not only on the initial
distributon of parent Na+-I− ion pairs, but also on the distribution of the CTTS-ejected
electrons, as capture is driven by the relative diffusion of the electron and cation. Since we
do not know either the initial proximity of the sodium and iodide ions or the precise nature
of the electron-ejection distribution, we treat capture phenomenologically in this scheme
with first-order kinetics (Eqs. 3c and 3d) to describe the ∼10- and ∼100-ps time scales
apparent in the data in Fig. 3. As discussed more thouroughly below in Section III B 2, we
presume that these two time scales correspond with the capture of electrons by closely- and
further-separated Na+, respectively. Although we do not expect this simple capture model
to reproduce all of the subtleties in the data, we will show that it does quantitatively explain
most of the time and wavelength dependence of the NaI CTTS spectral transients plotted
in Fig. 3.
In accordance with Eqn. 3, the time-dependent populations of electrons, Pe−(t), and
(Na+, e−)THF TCP species, P(Na+,e−)(t), are given by
Pe−(t) = fesc + ACTTS exp{−kCTTSt}+ Af exp{−kf t}+ As exp{−kst}, and, (4a)
P(Na+,e−)(t) = ff + fs − (1 + ACTTS) exp{−kCTTSt} − Af exp{−kf t} − As exp{−kst},
(4b)
Page 13 of 41
ACS Paragon Plus Environment
Submitted to The Journal of Physical Chemistry
123456789101112131415161718192021222324252627282930313233343536373839404142434445464748495051525354555657585960
14
in which
Af =ffkCTTS
kCTTS − kf
, As =fskCTTS
kCTTS − ks
, and ACTTS = −(fesc + Af + As), (5)
give the relative amplitudes of the different capture processes.56 Thus, at any given probe
wavelength λ, the transient absorption dynamics Iλ(t) should directly reflect the population
of each species weighted by its (equilibrium) absorption cross-section at that wavelength,
εX(λ):
Iλ(t) = εe−(λ) · Pe−(t) + ε(Na+,e−)(λ) · P(Na+,e−)(t), (6)
where X represents either the solvated electron or solvated sodium cation:electron TCP.
As described in Section II and the Appendix, the large group-velocity mismatch (GVM)
between the UV-pump and IR-probe wavelengths through the finite width of the sample
introduces an instrumental response that must be folded into our kinetic model in order
to fit the data plotted in Fig. 3. This convolution introduces a dispersion-limited rise that
obscures processes at times earlier than ∼1.4 ps. Since the electron-ejection time is clearly
faster than our GVM-limited resolution, in our analysis, we fixed the electron-ejection time
scale (k−1CTTS) to 380 fs, the value that we determined previously for ‘free’ iodide.8 We note
that the dispersion-limited rise precludes any observation of direct transfer of the CTTS-
excited electron to the cation; therefore our analysis assumes that CTTS excitation always
leads to electron ejection and that there is no direct charge-transfer to the cation (CTTC).57
We justify this assumption further below in Section III B 2.
A global fit of Eqs. 4-6 to all seven of the NaI pump-probe transients is plotted as the
solid black curves in Fig. 3; we used two adjustable rates (kf and ks) and capture yields
(ff and fs) for a total of 4 fitting parameters. The best-fit parameters correspond to fast
(k−1f ) and slow (k−1
s ) capture processes that occur with 2.3 ± 0.6 and 63 ± 15 ps lifetimes,
respectively, with the fast process (ff ) binding 63 ± 3% and the slow process (fs) 26 ± 3% of
the CTTS-generated electrons; 11% (fesc) of the electrons remain uncaptured at t = 500 ps.
The reported error bars reflect the range over which χ2 increased by 25%. Figure 3 shows
that the quality of the fit is excellent at both extremes of probed wavelength range. The
relatively poor quality of the fit near 1100 nm (roughly the isosbestic point between e−THF and
(Na+, e−)THF; cf. Fig. 2) as well as the subtle differences at early delays at other wavelengths
suggest that the kinetic-capture process involves spectral dynamics that are not included in
Page 14 of 41
ACS Paragon Plus Environment
Submitted to The Journal of Physical Chemistry
123456789101112131415161718192021222324252627282930313233343536373839404142434445464748495051525354555657585960
15
our model. We believe that these spectral dynamics likely include the formation of loosely-
bound Na+-electron LCPs prior to formation of the TCP as well as solvation/thermalization
of the TCP immediately following electron capture.
2. The effects of Na+ on the CTTS ejection of electrons from I− in THF
Although our model provides a reasonable quantitative description of the (Na+, e−)THF
formation kinetics that follow I− CTTS excitation, how can we assess the degree to which
the presence of a nearby sodium cation affects the CTTS electron-ejection process? Specifi-
cally, are CTTS electrons ejected to the same distance from the I atom in the presence and
absence of Na+? To address these questions, in Fig. 4 we examine pump-probe transients
from both ‘counterion-free’ (i.e., crown-ether-complexed Na+; red squares) and Na+-paired
(blue diamonds) CTTS-excited I− in THF collected by probing the population of free sol-
vated electrons in the ∼2-µm region; the data are normalized at t = 10 ps in order to
highlight the slow relaxation processes. The red squares illustrate that negligible electron-I
recombination follows the CTTS excitation of ‘free’ I− in THF.8 The curve through this
data is the calculated electron survival probability assuming diffusive recombination via the
Smoluchowski equation58,59 with an initial 6-nm Gaussian-distributed pair separation. This
calculation clarifies why so little recombination is observed up to 500 ps after excitation: the
nascent CTTS-generated electrons from ‘free’ I− are ejected far from their I-atom partners,
a result consistent with our previous time-resolved scavenging experiments on this system.8
In contrast, fitting of the transients plotted in Fig. 3 demonstrates that ∼90% of the CTTS
electrons ejected in NaI solutions are captured by Na+ to make (Na+, e−)THF within ∼300
ps. If the ejected electrons initially localize more than a few solvent shells from Na+, then the
dynamics of (Na+, e−)THF formation should be diffusion-controlled (subject to their screened
coulombic attraction), much like the recombination of electrons and radical cations gener-
ated by solvent multiphoton ionization (MPI).60–63 Therefore, the recombination kinetics of
MPI-generated electrons/cations in THF can serve as a natural ruler against which we can
estimate the initial relative spatial distribution of e−THF-Na+ pairs associated with the slow
recombination kinetics that follow CTTS excitation of Na+-I− in THF.
The electron recombination dynamics following MPI of neat THF through both visible13
and ultraviolet8 multiphoton excitation have been studied previously by our group, and in all
Page 15 of 41
ACS Paragon Plus Environment
Submitted to The Journal of Physical Chemistry
123456789101112131415161718192021222324252627282930313233343536373839404142434445464748495051525354555657585960
16
cases we were able to fit the observed recombination kinetics using an approximate solution
to the Debye-Smoluchowski equation (DSE).60,61 We found that when the multiphoton ex-
citation provided ∼12.5 eV total energy, recombination is modelled reasonably by the DSE
solution with a reaction distance R = 11±1 A, a reaction velocity v = 1.2±0.2 m/s, and an
initial electron ejection distance r0 ≈ 40 A; for three-photon excitation at 263 nm, we found
r0 = 37±2 A. The green circles in Fig. 4 plot the ∼2-µm-probed electron population kinetics
following multiphoton ionization of neat THF at 263 nm, normalized at t = 10 ps; the solid
green curve is a fit to the data with the approximate DSE solution, yielding the parameters
stated above. The data illustrate that the recombination of solvated electrons with THF
radical cations occurs on a slower time scale than the capture of solvated electrons by Na+.
Although we anticipate a similar mechanism for electron recombination following MPI and
CTTS-electron capture by Na+, one important difference distinguishes these processes: the
initial electron-cation separation in MPI is determined simply by the excess energy avail-
able in the ionization process,64 whereas the average e−-Na+ interionic separation following
CTTS excitation of Na+-I− results from a convolution of the ejected electron/I atom pair
distribution with the equilibrium distribution of Na+-I− ion-pair separations. Thus, the dif-
fusive capture of electrons by Na+ following CTTS excitation of Na+-I− is truly a three-body
problem, and to our knowledge, no general solution to this problem exists in the literature.
The problem is further complicated by the fact that we expect the CTTS e−-ejection dis-
tribution to be affected significantly by the proximity of the sodium cation, such that there
may be no unique combination of Na+-I− and electron-iodine distributions that generate
the initial Na+-e− pair distribution.
How, then, can we estimate the average e−THF-cation separation following CTTS excitation
of NaI in THF? One approach is to simply apply the approximate (two-body) DSE solution
used for the MPI case to fit the slower of the two (Na+, e−)THF formation processes. The data
are not sufficient to constrain the fit if all three DSE parameters are allowed to vary, but if we
fix the reaction distance and velocity to be the same as those determined for recombination
following MPI (11 A and 1.2 m/s, respectively),8,13 we obtain an initial cation-electron
separation distance of 12 A. Alternatively, if we fix only the reaction distance at 11 A,
we find that the slower electron-capture process can be described by the approximate DSE
solution with an initial electron-cation separation of ∼24 ± 3 A and with v = 6 ± 2 m/s;
this latter fit is plotted as the blue short-dashed curve through the NaI data in Fig. 4. Given
Page 16 of 41
ACS Paragon Plus Environment
Submitted to The Journal of Physical Chemistry
123456789101112131415161718192021222324252627282930313233343536373839404142434445464748495051525354555657585960
17
that there are no available published values for the reaction distance and velocity of solvated
electrons interacting with Na+ in THF and that there is no guarantee that the approximate
solution to the DSE is appropriate for this three-body situation, the conclusion that we can
draw from this approach is that the slower capture process, if diffusive, starts with an initial
electron-Na+ separation of roughly 1 to 2 nm.
We can support this number for the largest electron-Na+ separation with a simple back-of-
the-envelope calculation. To first order, the time scale for geminate electron-cation recombi-
nation can be approximated by the Onsager time tc = r2c/D
′, where rc is the Onsager distance
(∼75 A in THF) and D′ is the relative diffusion constant for the diffusing electron/cation
pair (0.76 A2/ps, assuming diffusion dominated by e−THF);65 for solvated electrons in THF,
tc ≈ 7.4 ns. For the case of MPI, where we expect an initial separation distance r0 ≈ 40 A
between the electron and THF+, we would expect the diffusive recombination time scale to
be approximately
t40A ≈ tc
[40 A
rc
]2
≈ 2 ns. (7)
Figure 4 shows that roughly half of the recombination has occurred at the longest time
probed (550 ps), such that this crude method provides a reasonable estimate of the time for
recombination to be complete. In contrast, we see from the NaI transients in Fig. 3 that elec-
tron capture is complete by ∼300 ps. Since this time is much faster than the recombination
time following MPI, we expect that the initial distribution of Na+-e−THF distances must be
considerably tighter than 40 A. We thus can approximate roughly the initial electron-cation
separation for the slow capture process as
r0 ≈ 75 A
√300 ps
7.4 ns≈ 15 A. (8)
Thus, this simple estimate gives a 1.5-nm initial separation distance for the CTTS-generated
electrons and the sodium cations, in agreement with the DSE fit discussed above. Of course,
this simple analysis relies on purely diffusive motions (without coulombic attraction) to bring
the reactive pair together and also assumes that diffusion is dominated by e−THF; on both
counts, we expect this analysis to somewhat underestimate the true initial pair separation.66
Despite the simplicity of these analyses, they do allow us to conclude with confidence that
the initial separation between Na+ and the CTTS-generated electrons is unlikely to be larger
than ∼2 nm, particularly since more than 50% are captured by Na+in 2.3 ps. It is therefore
interesting to compare this ≤ 2-nm distance to the ∼6-nm electron-iodine separation that
Page 17 of 41
ACS Paragon Plus Environment
Submitted to The Journal of Physical Chemistry
123456789101112131415161718192021222324252627282930313233343536373839404142434445464748495051525354555657585960
18
we determined for the CTTS ejection of electrons from ‘free’ I− in THF.8 The fact that the
two distances are so different indicates that the presence of proximal sodium cations has a
profound influence on the CTTS-ejection process: electrons that would have been ejected
nearly 6-nm away from their ‘free’ I atom parents are confined to be ejected well within ∼1-2
nm of the sodium counterion. Although the centers of these distributions do not coincide, we
know from the CTTS spectroscopy and thermodynamics of these salts (see Section IV) that
Na+ cations are tightly ion-paired and likely reside within one or two solvent shells of the I−
ions. As a result, we anticipate that the distribution centers are not so different on the scale
of the electron-ejection distance. Thus, even the electrons that are most slowly captured are
not ejected more than ∼2 nm away from the I atom when the Na+ cation is nearby, such
that Na+ induces a dramatic collapse of the CTTS electron-ejection distribution.
Of course, this analysis applies only to the longer of the two Na+-electron capture pro-
cesses from our kinetic model (the 63-ps process). The faster, 2.3-ps capture process is
clearly too fast to be diffusion-limited, and thus must be rate-limited by the fluctuations of
the THF molecules solvating the sodium cation. We presume that Na+ not only is dipole-
solvated by the surrounding THF molecules but also that Na+-THF interactions involve
some coordination of oxygen lone pairs to the bare cation (similar interactions as those be-
tween the cation and glymes,51,52 but weaker since THF is only monodentate). We believe
that this solvation structure presents a barrier for electron attachment that inhibits faster
electron transfer. The right side of Figure 3 shows that the faster capture process is not well
described by the simple two-state kinetic interconversion model expressed by Eqn. 2. This
also points to the important role of solvent fluctuations and dynamic solvation in the faster
capture process, with the implication that electron-Na+ interactions evolve from free e−THF to
(Na+, e−)THF through one or more intermediate stages as the solvent reorganizes. On these
grounds, we argue that direct, photoinduced charge-transfer between I− and Na+, a process
that would compete with CTTS electron ejection, is highly unlikely: the solvent structure
around Na+ is simply too far from optimal to accomodate a tight-contact pair for direct
charge-transfer to occur.57 We will analyze the early-time portion of the NaI pump-probe
transients in more detail in an upcoming paper with the goal of elucidating the spectral
intermediates and dynamic solvation involved in the fast electron capture-process.50
Page 18 of 41
ACS Paragon Plus Environment
Submitted to The Journal of Physical Chemistry
123456789101112131415161718192021222324252627282930313233343536373839404142434445464748495051525354555657585960
19
C. CTTS dynamics of tetrabutylammonium iodide in tetrahydrofuran and the
formation of (t−BA+, e−)THF ‘loose-contact pairs.’
As described above, (Na+, e−)THF is characterized by a partially atomic binding inter-
action. What about cases in which electron-cation pairs are defined by weak interactions?
Unlike the case of Na+, we anticipate no valence interactions between the electron and
t−BA+, which is characterized by long, alkyl arms and a filled valence shell on the central
nitrogen atom. We also expect weaker ion-pairing between t−BA+ and I−; indeed, Fig. 1
illustrates that the steady-state absorption spectrum of I− is only weakly perturbed by the
presence of tetrabutylammonium relative to the ‘counterion-free’ anion. This suggests that
either t−BA+-I− has an increased interionic separation or that tetrabutylammonium cannot
induce a large inherent perturbation to the I− CTTS spectrum relative to Na+. In this sec-
tion, we examine the CTTS dynamics of I− in the presence of t−BA+ with the goal of using
these dynamics to assess the strength of both t−BA+-electron and t−BA+-I− interactions.
Figure 5 presents the ultrafast transient absorption dynamics of a 5-mM t−BA+-I− so-
lution in THF following CTTS excitation at 263 nm; the data are normalized at t = 40 ps
and are offset for clarity. On long timescales (panel (a)), no wavelength dependence in the
transient absorption is observed across the IR, and there is negligible decay of the absorption
even up to 1 ns after excitation.67 This wavelength independence and lack of any significant
dynamics is similar to what we observed following excitation of ‘free’ I− in THF.8 The lack
of any long-time wavelength dependence to the spectral dynamics differs significantly from
the NaI system, however, and indicates that any role played by the t−BA+ cation in elec-
tron capture or on the CTTS ejection process is not particularly dramatic. However, we
do observe a subtle wavelength dependence at early times (Fig. 5(b)): the transient absorp-
tion intensity shows a small decay at longer wavelengths (e.g., 2300 nm, pink circles) and a
small rise at shorter wavelengths (e.g., 1375 nm, gray circles) in the first 10-15 ps following
excitation. We also see (outside our GVM-limited rise) quasi-isosbestic character at inter-
mediate wavelengths (e.g., 1650/1750 nm, dark/light blue circles). These spectral dynamics
are absent with ‘counterion-free’ I− and must therefore reflect time-dependent t−BA+-e−
interactions.
What kind of t−BA+-electron interactions could be responsible for the dynamics seen in
Fig. 5? As we described in Section III A, the spectrum of electron-cation LCPs in ethers
Page 19 of 41
ACS Paragon Plus Environment
Submitted to The Journal of Physical Chemistry
123456789101112131415161718192021222324252627282930313233343536373839404142434445464748495051525354555657585960
20
(λmax ≈ 1600-1800 nm) are somewhat blue-shifted relative to that of free solvated electrons
(λmax ≈ 1900-2100 nm). If we assume that electron capture by t−BA+ in THF leads to LCP
formation, then the absorption intensity decrease at longer wavelengths signifies a reduction
in the population of free solvated electrons as they are captured by the t−BA+ cation, while
the concomitant absorption intensity increase at shorter wavelengths reflects the growth of
newly formed LCPs. Unfortunately, we cannot quantitatively model these t−BA+-electron
capture dynamics using the same kinetic scheme invoked in the previous section for electron
capture by Na+ because the equilibrium spectrum of the t−BA+-electron loose-contact pair
has not been measured independently. We do know, however, that the oscillator strength
of the electron’s absorption spectrum should remain unchanged through the capture trans-
formation e−THF → (t−BA+, e−)THF, even though LCP formation might change the peak
position and spectral shape. To simplify our analysis, we will assume that the equilibrium
spectrum of (t−BA+, e−)THF has the same shape and oscillator strength as that of the free
THF-solvated electron but with a blue-shifted peak wavelength, thereby introducing only
one spectroscopic parameter (λLCPmax ) into our kinetic modeling of the LCP capture process.
Here, we use the same well-known Gaussian-Lorentzian lineshape to describe both the e−THF
and (t−BA+, e−)THF equilibrium absorption bands.68
With this spectroscopic approximation in hand, we are now in a position to construct a
kinetic model for electron capture by t−BA+ following the CTTS excitation of t−BA+-I−
in THF. As with the case of NaI, we could simply assume that the free solvated electron
and captured contact pair are chemically distinct species and that the capture process is
reasonably modeled by a simple first-order kinetic interconversion between them. On the
other hand, we also could argue that (t−BA+, e−)THF is better thought of as a coulombically
perturbed free solvated electron, so that the spectrum of the electron should shift smoothly
to the blue as the electron-t−BA+ separation decreases. Since we do not know which
picture of the electron-capture process makes the most physical sense, we have modelled
the transients in Fig. 5 with kinetic schemes that describe both pictures. Our first scheme
assumes a kinetic interconversion between e−THF and (t−BA+, e−)THF in a manner similar
to Eq. 3, but using only a single interconversion rate (τ−1) and branching ratio (f); we
refer to this approach as the ‘kinetic-capture’ model. In this model, the spectra of e−THF
and (t−BA+, e−)THF are assumed to be static, but λLCPmax is used as a fitting parameter.
Our second scheme also invokes a single formation rate (τ−1) and capture fraction (f), but
Page 20 of 41
ACS Paragon Plus Environment
Submitted to The Journal of Physical Chemistry
123456789101112131415161718192021222324252627282930313233343536373839404142434445464748495051525354555657585960
21
incorporates a continuous spectral blue-shift between free e−THF and (t−BA+, e−)THF:
t−BA+ + e−THF
f, τ, S(t,λ)−→ (t−BA+, e−)THF. (9)
Here, S(t, λ) represents a continuously shifting Gaussian-Lorentzian band whose parameters
associated with the halfwidths are held constant, thereby fixing the band shape, but whose
peak frequency shifts according to
ω(t) = ωLCPmax + (ωfree
max − ωLCPmax ) exp(− t
τ), (10)
where ωfreemax and ωLCP
max are the initial and final peak frequencies, and τ is the spectral-shifting
time scale. We refer to this scheme as the ‘ionic-solvation’ model. We note that convolution
of the ionic-solvation model with our GVM-affected temporal response is not analytic and
must be done numerically; our procedure for carrying out this numerical convolution is
described in the Appendix. Importantly, both of our kinetic schemes incorporate only three
adjustable parameters (f , τ , and λLCPmax ), but with implicity different physics.
The non-linear least-squares fit of the ionic-solvation model to all of the t−BA+-I− pump-
probe data are plotted as the black curves in Fig. 5; the fit to the kinetic-capture model is
indistinguishable from the fit to the ionic-solvation model and thus is not shown here. The
parameters determined from the fits to both models are given in Table I; as with our fits
for the NaI/THF pump-probe transients, the error bars for each parameter are determined
by the range over which χ2 increases by 25%. The fact that the two models yield virtually
indistinguishable fits indicates that both can describe the data reasonably well, and Table
I shows that both models yield identical fitting parameters within the estimated error. In
particular, both models give λmaxLCP as lying ∼400-500 nm to the blue of the free e−THF,
in excellent agreement with previous observations of LCPs seen in other solvents;51,52 the
(t−BA+, e−)THF spectrum determined by fitting our data with the ionic-solvation model is
plotted as the green dashed curve in Fig. 2. Both models also suggest that only f ≈ 10-15%
of the CTTS-generated electrons are captured by t−BA+ to form LCPs on a τ ≈ 5-ps time
scale.
We close this section by noting that the χ2 and parameter error bars obtained by fitting
the data with the ionic-solvation model are slightly smaller (though, not significantly smaller
statistically) than those obtained by fitting with the kinetic-capture model. This suggests
that the continuous blue-shift of the ionic-solvation model may more closely capture the dy-
namics that occur following CTTS excitation of t−BA+-I− in THF than the kinetic-capture
Page 21 of 41
ACS Paragon Plus Environment
Submitted to The Journal of Physical Chemistry
123456789101112131415161718192021222324252627282930313233343536373839404142434445464748495051525354555657585960
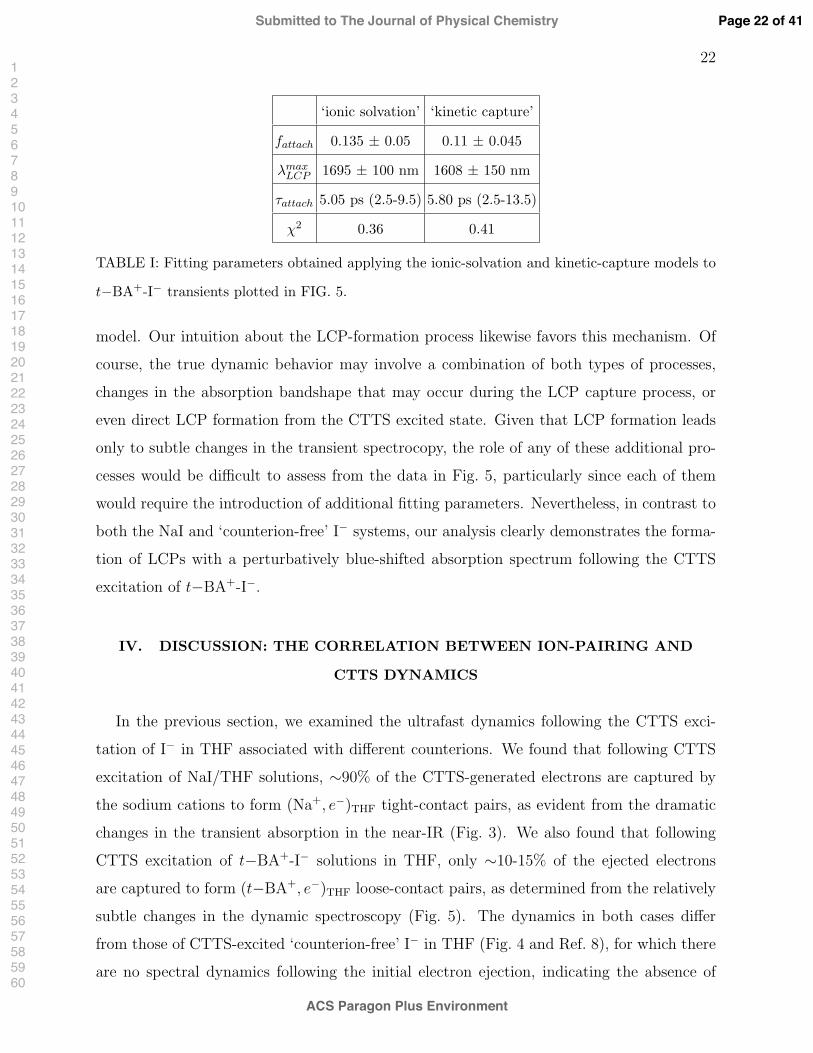
22
‘ionic solvation’ ‘kinetic capture’
fattach 0.135 ± 0.05 0.11 ± 0.045
λmaxLCP 1695 ± 100 nm 1608 ± 150 nm
τattach 5.05 ps (2.5-9.5) 5.80 ps (2.5-13.5)
χ2 0.36 0.41
TABLE I: Fitting parameters obtained applying the ionic-solvation and kinetic-capture models to
t−BA+-I− transients plotted in FIG. 5.
model. Our intuition about the LCP-formation process likewise favors this mechanism. Of
course, the true dynamic behavior may involve a combination of both types of processes,
changes in the absorption bandshape that may occur during the LCP capture process, or
even direct LCP formation from the CTTS excited state. Given that LCP formation leads
only to subtle changes in the transient spectrocopy, the role of any of these additional pro-
cesses would be difficult to assess from the data in Fig. 5, particularly since each of them
would require the introduction of additional fitting parameters. Nevertheless, in contrast to
both the NaI and ‘counterion-free’ I− systems, our analysis clearly demonstrates the forma-
tion of LCPs with a perturbatively blue-shifted absorption spectrum following the CTTS
excitation of t−BA+-I−.
IV. DISCUSSION: THE CORRELATION BETWEEN ION-PAIRING AND
CTTS DYNAMICS
In the previous section, we examined the ultrafast dynamics following the CTTS exci-
tation of I− in THF associated with different counterions. We found that following CTTS
excitation of NaI/THF solutions, ∼90% of the CTTS-generated electrons are captured by
the sodium cations to form (Na+, e−)THF tight-contact pairs, as evident from the dramatic
changes in the transient absorption in the near-IR (Fig. 3). We also found that following
CTTS excitation of t−BA+-I− solutions in THF, only ∼10-15% of the ejected electrons
are captured to form (t−BA+, e−)THF loose-contact pairs, as determined from the relatively
subtle changes in the dynamic spectroscopy (Fig. 5). The dynamics in both cases differ
from those of CTTS-excited ‘counterion-free’ I− in THF (Fig. 4 and Ref. 8), for which there
are no spectral dynamics following the initial electron ejection, indicating the absence of
Page 22 of 41
ACS Paragon Plus Environment
Submitted to The Journal of Physical Chemistry
123456789101112131415161718192021222324252627282930313233343536373839404142434445464748495051525354555657585960
23
electron-counterion and electron-iodine interactions (as well as observable electron-solvation
dynamics). The data demonstrate that the the degree of electron capture correlates directly
with the spectral shift of the I− CTTS transition induced by the counterion (cf. Fig. 1). We
believe that this correlation can be explained most generally in terms of a difference in the
strength of ion-pair interactions between the precursor-salt counterions. The work of Blan-
damer et al.23 and Sciaini et al.24–27 suggests that the blue-shift of the I− CTTS transition
that results upon substituting t−BA+ with Na+ indicates a smaller average separation of
the Na+ counterion with the nearby I− ion. Our previous work showed that the addition of
18-crown-6 ether breaks up Na+-I− ion pairs by better solvating the sodium cation, leading
to a large red-shift of the CTTS spectrum.8 Thus, the correlation we observe is that electron
capture is more efficient when the cations are initially closer to the I− ion (in which case
the CTTS transition is more strongly perturbed) than when the cations are initially far
from the I− ion (in which case the CTTS transition has undergone little counterion-induced
blueshift). In as much as the interionic separation reflects the nature of ion-pair types (con-
tact, solvent-separated, etc.), it should be possible to understand these capture yields based
on the thermodynamics of iodide-salt ion-pair formation in THF.
To explore this relationship, we examine how the electron-capture yields we observe vary
with the ion-pair and free-ion distributions determined from conductivity measurements of
salts in THF. Szwarc and coworkers have measured the conductivity of various cations in
THF and other ethers over a range of temperatures and salt concentrations and found that
salt dissociation constants for alkali cations are typically ∼10−5 M.22,69–71 These workers
also found that the solutions became highly non-ideal at concentrations above ∼100 µM,
such that the fraction of the dissolved salt that is ion-paired saturates at ∼90% in the mM
concentration range. This ∼90% pairing of sodium salts in the concentration range of our
experiments is in striking agreement with the ∼90% electron-capture yield we observed in
our NaI CTTS experiments (Fig. 3). On the other hand, pulse radiolysis experiments have
determined that Na+ cations are able to capture excess electrons with a 100% yield on the
nanosecond time scale. Thus, the ∼10% of electrons that are not captured in the first 500 ps
following CTTS excitation of Na+-I− in THF likely corresponds to the fraction of salt that
was not initially ion-paired. Our observation that the capture yield did not change with salt
concentration in the mM concentration range is also consistent with the known saturation
of ion-pairing of other sodium salts in THF.69
Page 23 of 41
ACS Paragon Plus Environment
Submitted to The Journal of Physical Chemistry
123456789101112131415161718192021222324252627282930313233343536373839404142434445464748495051525354555657585960
24
In contrast to Na+-I− pairs, the relatively small blueshift of the CTTS transition of
t−BA+ iodide in THF, along with the low electron-capture yield we observed following the
CTTS excitation of this salt (Fig. 5), suggests a significantly larger initial ion-pair separation.
Surprisingly, however, Szwarc’s conductivity studies indicate a similar degree of ion-pairing
for t−BA+ salts as for Na+ salts in THF.22 Based on conductivity data alone, we might have
predicted a substantial fraction of electron capture by t−BA+. We see two possibilities to
explain the lack of spectral dynamics we observed on the hundreds-of-picoseconds time scale
following CTTS excitation of t−BA+ iodide (Fig. 5): either all of the ejected electrons are
preferentially ejected within ∼1 solvent shell of the t−BA+ cation following CTTS excitation
(so that none are available to be diffusively captured on time scales longer than ∼5 ps) and
only a small fraction are observed to be captured, or alternatively, electrons are ejected to
a large average distance from the t−BA+ cation and only the small fraction of electrons
that happen to localize nearby a t−BA+ are captured with high probability to form LCPs.
These scenarios cannot be distinguished from the data in Fig. 5. However, in Section III B 2,
we argued in conjunction with Fig. 4 that the tightly binding Na+ cation alters the average
I− CTTS electron ejection distance from ∼6 nm to ≤ 2 nm, and it seems unlikely that
the more weakly interacting t−BA+ cation could cause an even greater contraction of the
ejection distribution. Thus, we believe that t−BA+ is unable to alter significantly the ‘free’
I− CTTS electron-ejection distribution, such that LCPs are formed only by those electrons
that happen to be ejected close to the t−BA+ cations. Logically, the degree to which the
CTTS excited state in the parent-I− solvent cavity is able to nonadiabatically couple to
the disjoint cavities that naturally exist in liquid THF depends on the proximity of the
counterion: the more a cation is able to perturb the CTTS spectrum, the more likely it is
to significantly alter the CTTS ejection distribution, and thus, the more likely it is to be
able to capture the ejected electrons. Additionally, it is important to note that although the
conductivity measurements reflect significant ion-pairing in both the Na+ and t−BA+ cases,
these measurements tell us nothing about the shape (depth or position of the minimum) of
the mean-force potential that binds the ion-pair together.
In summary, we have studied the effects of the counterion on the ultrafast CTTS dynam-
ics of I− in weakly-polar liquid THF. By switching counterions from crown-ether-complexed
Na+ to t−BA+ to Na+, we have been able to tune the degree of interaction with the I− ion
from essentially none to weak to strong, respectively. We found that depending on the degree
Page 24 of 41
ACS Paragon Plus Environment
Submitted to The Journal of Physical Chemistry
123456789101112131415161718192021222324252627282930313233343536373839404142434445464748495051525354555657585960
25
to which the ions initially interact, the counterion not only can alter the distance to which
CTTS electrons are ejected but also can participate in the the CTTS process by capturing a
significant fraction of the ejected electrons to form either tight or loose cation:electron con-
tact pairs. Our previous work showed that when there is no significant interaction between
I− and its counterion in THF, CTTS excitation of I− led to electron ejection with a ∼6 nm
average ejection distance.8 In contrast, for strongly ion-paired Na+-I−, we found that ∼90%
of the CTTS-ejected electrons were captured by the Na+ counterion to form tight-contact
pairs within ∼100 ps, and a diffusion-based argument suggests that the average separation
of Na+-e− pairs must be ≤ 2 nm. Thus, not only does the pairing with the Na+ cation cause
a significant blue-shift of the I− CTTS spectrum, it also causes a profound contraction of
the CTTS electron-ejection distribution. This contraction of the CTTS electron-ejection
distribution, however, is not simply a coulombic effect: even though conductivity data sug-
gests the degree of ion-pairing of Na+ and t−BA+ with I− is similar, we found that only
∼10-15% of the CTTS-ejected electrons were captured by tetrabutylammonium cations to
form loose-contact pairs. It appears that association with t−BA+ does not significantly alter
the CTTS electron-ejection distribution relative to ‘free’ I−, a result that is likely a direct
consequence of the fact that the initial separation of the t−BA+-I− ion-pair is relatively
large, but may also be a reflection of the different chemical character of t−BA+ relative to
Na+. Finally, our data also show that the kinetics of electron capture by Na+ and t−BA+
are significantly different: the rapid formation of weakly-interacting (t−BA+, e−)THF LCPs
is likely to be barrierless, as implied by the ‘ionic-solvation’ model, whereas the slower for-
mation of strongly-interacting (Na+, e−)THF TCPs appears to take place via interconversion
from a more rapidly formed LCP; we will examine the Na+-e−THF LCP→TCP interconversion
in greater detail in an upcoming publication.50
V. ACKNOWLEDGEMENTS
This research was funded by the National Science Foundation under grant number CHE-
0603766. The authors thank Dr. Ross E. Larsen and Molly C. Cavanagh for useful discus-
sions.
Page 25 of 41
ACS Paragon Plus Environment
Submitted to The Journal of Physical Chemistry
123456789101112131415161718192021222324252627282930313233343536373839404142434445464748495051525354555657585960
26
APPENDIX A: INCORPORATING GROUP VELOCITY MISMATCH INTO
ULTRAFAST KINETIC MODELS
When fitting kinetic models to the absorption transients associated with CTTS ejection
from I− salts in THF, it was necessary to account for a temporal response limited by the
group-velocity mismatch (GVM) between the pump and probe pulses in our relatively thick
samples (in addition to the usual finite resolution that results from temporal cross-correlation
of the pump and probe pulses). This appendix describes the mathematical procedures we
used to account properly for these effects on the ultrafast absorption transients. We will
focus most of our attention on models that assume the underlying transient absorption
dynamics, I(t), can be expressed as a linear combination of exponentials:
I(t) =∑
n
An exp {−t/τn} . (A1)
This is exactly the situation for the model we presented in Section III B to describe
(Na+, e−)THF TCP formation following the CTTS excitation of NaI/THF solutions. As
shown below, convolution of GVM effects with such a model is analytically tractable; we
also outline a generic numerical procedure applicable to kinetic models with more compli-
cated time dependence.
In the absence of a dispersive medium, the ‘zero of time,’ t0, occurs when the optical path
lengths (OPL) traveled by the pump and probe pulses are identical; the temporal pump-
probe delay is then defined as t = (OPLpr −OPLpu)/c, where c is the speed of light. When
the pump and probe pulses travel through a dispersive medium such as a liquid sample,
however, the optical path lengths are altered by the index of refraction of that medium.
Thus, after penetrating a distance x into a dispersive medium, the ‘zero of time’ is shifted
to t0(x) = t0 + ∆npr−pux/c, where ∆npr−pu = npr − npu is the difference in refractive index
in the medium between the probe and pump pulses. As a result, the absorption transient
originating at the penetration depth x in the medium begins from this shifted zero of time:
Ix(t− t0(x)) = Ix(t− t0 −∆npr−pux/c). (A2)
Since the zero of time changes as a function of x, the time-dependent signal measured in
a pump-probe experiment is a convolution of the individual signal contributions at each x
Page 26 of 41
ACS Paragon Plus Environment
Submitted to The Journal of Physical Chemistry
123456789101112131415161718192021222324252627282930313233343536373839404142434445464748495051525354555657585960
27
across the sample depth:
IGV M(t) =
∫ L(t)
0
Ix(t− t0(0)−∆npr−pux/c) · w(x)dx, (A3)
in which w(x) is the weight of the contribution from each possible sample penetration depth,
and for a sample medium of thickness D, L(t) = ct/ |∆n| if it is less than D, otherwise
L(t) = D. To best mimic the experimental conditions, we have assumed that the sample-
depth-dependent weighting of the x-dependent transients to the total signal is given by
Beer’s Law:
w(x) = exp {−αpux} /
∫ D
0
exp {−αpux} dx, (A4)
where αpu is the optical absorption of the sample at the pump wavelength and the overall
weight is normalized for the finite depth of the sample.
To develop an analytic expression for the GVM-affected pump-probe transients, we must
consider the sign of ∆npr−pu. The most-common case encountered experimentally is when
the pump pulse is retarded relative to the probe pulse upon passing through the medium
(i.e., ∆npr−pu < 0); we will refer to this case as ‘normal’ GVM. In this ‘normal’ case,
substitution of Eqs. A1, A2 and A4 into Eq. A3 yields an analytic solution to the convolution
of the dispersive sample response with the multi-exponential population kinetics:
IGV M(t) =∑
n
An
[τ+inv,n
τGV M
]exp {−t/τn}
[1− exp
{−T (t)/τ+
inv,n
}1− exp {−τcell/τGV M}
], (A5)
where τcell = |∆npr−pu|D/c, τGV M = |∆npr−pu| /(αpuc), T (t) = t if t < τcell but τcell oth-
erwise, and(τ+inv,n
)−1= τ−1
GV M + τ−1n . If we further assume that the pump-probe cross-
correlation is Gaussian with a full-width-at-half-maximum of 2σ√
ln 2, then we can perform
an additional convolution to account for the finite duration of the pump and probe pulses
and obtain an analytic expression for the total signal:
S(t) =∑
n
An
[τ+inv,n/τGV M
]2 [1− exp(−τcell/τGV M)]
·[exp
(− t
τn
+σ2
4τ 2n
)erfc
(− t
σ+
σ
2τn
)+ exp
(− t
τn′+
σ2
4τ 2n′
)[erfc
(τcell
σ− t
σ+
σ
2τn′
)− erfc
(− t
σ+
σ
2τn′
)]− exp
(− τcell
τ+inv,n
)exp
(− t
τn
+σ2
4τ 2n
)erfc
(τcell
σ− t
σ+
σ
2τn
)](A6)
Page 27 of 41
ACS Paragon Plus Environment
Submitted to The Journal of Physical Chemistry
123456789101112131415161718192021222324252627282930313233343536373839404142434445464748495051525354555657585960
28
in which (τn′)−1 = (τn)−1 + (τGV M)−1 and erfc(x) is the complementary error function.
Equation A6 (with n = 3) is the analytic form that was fit to the Na+-I− CTTS/electron
capture data in Fig. 3 using a non-linear least-squares procedure in order to obtain the
fitting parameters {An, τn} (with τ1 constrained to 380 fs) reported in Section III B.
It is also possible that ∆npr−pu > 0, such that the probe pulse is retarded relative to
the pump pulse upon entering the medium, a case that we refer to as ‘anomalous’ GVM.
In this ‘anomalous’ case, the analytic solution to IGV M(t) obtained in Eq. A5 retains the
same general form but with the substitutions τ+inv,n → τ−inv,n,
(τ−inv,n
)−1= (τGV M)−1− (τn)−1,
and τn′ → τGV M . As a result of the sign change, a discrete singularity is introduced in this
case when τn = τGV M , where the analytic expression for component n must be obtained by
taking limits:
IGV M,n(t; τn = τGV M) =
An
[1− exp(−τcell/τGV M)]· t
τGV M
· exp
(− t
τGV M
)if t ≤ τcell,
An
[1− exp(−τcell/τGV M)]· τcell
τGV M
· exp
(− t
τGV M
)otherwise.
(A7)
The cross-correlation-convolved contribution from component n in this condition is thus,
Sn(t; τn = τGV M) =
An
[1− exp(−τcell/τGV M)]· exp
(− t
τn
+σ2
4τ 2n
)·[τcell erfc
(τcell
σ− t
σ+
σ
2τn
)+
(t− σ2
2τn
)·[erfc
(τcell
σ− t
σ+
σ
2τn′
)− erfc
(− t
σ+
σ
2τn′
)]+
1√π·[exp
(−(− t
σ+
σ
2τn′
)2)− exp
(−(
τcell
σ− t
σ+
σ
2τn′
)2)]]
.
(A8)
which could be analytically fit to ultrafast transient absorption dynamics in the case of
‘anamalous’ GVM.
Of course, there are many situations in which the ultrafast absorption dynamics of a
sample are not simply modeled by a linear combination of exponentials; the ‘ionic-solvation’
model that we applied to describe the ultrafast electron capture dynamics in t−BA+- I−
solutions in Section III C is a prime example. In such cases, we must assume that the
intrinsic sample absorption dynamics are given by
I(t) =
∫ t
0
ε(t− t′)dP
dt′dt′/
∫ ∞
0
dP
dtdt, (A9)
Page 28 of 41
ACS Paragon Plus Environment
Submitted to The Journal of Physical Chemistry
123456789101112131415161718192021222324252627282930313233343536373839404142434445464748495051525354555657585960
29
where ε(t) and P (t) are the time-dependent spectral dynamics and population kinetics of
the transient absorber; from this form, I(t) can be reduced to a simple kinetic expression
if ε(t) is constant in time. To our knowledge, no analytic method exists for convoluting
the GVM-induced temporal response with time-dependent spectral shifting; thus, we have
taken a numerical approach. Since the GVM parameters that limit the temporal resolution
are known experimentally, the GVM convolution can be applied to I(t) through a standard
matrix multiplication:
IGV M(t) = AGV M
· I(t). (A10)
Here, AGV M
is an N × N matrix, with N representing the number of time-steps (δt) that
span the desired time scale. The rows of AGV M
give the (asymmetric) weighting function
in time that is associated with w(x), but with zeros along the diagonal, such that the sum-
mation involved in the matrix multiplication may approximate integration. To incorporate
this numeric convolution into a fitting routine, we computed the combined the kinetic and
spectral dynamics (I(t)) on a linear time-grid (typically δt = 20 fs, N = 30,000 points)
according to the desired model. A sparse N × N delay-dependent GVM convolution ma-
trix (AGV M
) was generated once and stored in memory. Convolution was accomplished via
Eq. A10, and IGV M(t) was then folded with the symmetric cross-correlation function us-
ing a simple numeric convolution algorithm. This procedure was then used iteratively in
a ‘forward-convolute-and-compare’ scheme to minimize the fitting parameters; this is the
procedure we employed to fit the ‘ionic solvation’ model to the t−BA+-I− data presented in
Section III C.
∗ Electronic mail:[email protected]
1 Chen, X.; Bradforth, S. E. Annu. Rev. Phys. Chem. 2008, 59, 203.
2 Blandamer, M. J.; Fox, M. F. Chem. Rev. 1970, 70(1), 59–93.
3 Vilchiz, V. H.; Chen, X.; Kloepfer, J. A.; Bradforth, S. E. Radiat. Phys. Chem. 2005, 72(2-3),
159–167.
4 Kloepfer, J. A.; Vilchiz, V. H.; Lenchenkov, V. A.; Germaine, A. C.; Bradforth, S. E. J. Chem.
Phys. 2000, 113(15), 6288–6307.
Page 29 of 41
ACS Paragon Plus Environment
Submitted to The Journal of Physical Chemistry
123456789101112131415161718192021222324252627282930313233343536373839404142434445464748495051525354555657585960
30
5 Vilchiz, V. H.; Kloepfer, J. A.; Germaine, A. C.; Lenchenkov, V. A.; Bradforth, S. E. J. Phys.
Chem. A 2001, 105(10), 1711–1723.
6 Xia, C.-G.; Peon, J.; Kohler, B. J. Chem. Phys. 2002, 117(19), 8855–8866.
7 Iglev, H.; Trifonov, A.; Thaller, A.; Buchvarov, I.; Fiebig, T.; Laubereau, A. Chem. Phys. Lett.
2005, 403(1-3), 198–204.
8 Bragg, A. E.; Schwartz, B. J. J. Phys. Chem. B 2008, 112, 483–494.
9 Barthel, E. R.; Martini, I. B.; Schwartz, B. J. J. Chem. Phys. 2000, 112(21), 9433–9444.
10 Barthel, E. R.; Martini, I. B.; Schwartz, B. J. J. Phys. Chem. B 2001, 105(49), 12230–12241.
11 Barthel, E. R.; Martini, I. B.; Keszei, E.; Schwartz, B. J. J. Chem. Phys. 2003, 118(13),
5916–5931.
12 Barthel, E. R.; Schwartz, B. J. Chem. Phys. Lett. 2003, 375(3-4), 435–443.
13 Martini, I. B.; Barthel, E. R.; Schwartz, B. J. J. Chem. Phys. 2000, 113(24), 11245–11257.
14 Wang, Z.; Shoshana, O.; Hou, B.; Ruhman, S. J. Phys. Chem. A 2003, 107(17), 3009–3016.
15 Shoshana, O.; Perez Lustres, J. L.; Ernsting, N. P.; Ruhman, S. Phys. Chem. Chem. Phys.
2006, 8(22).
16 In acetonitrile clusters, some solvated electrons react with the unsaturated solvent molecules
to form valence-bound motifs,72,73 which also has been observed in solution following CTTS
excitation of I− in acetonitrile.6.
17 Bedard-Hearn, M. J.; Larsen, R. E.; Schwartz, B. J. J. Chem. Phys. 2005, 122(13), 134506.
18 Bowron, D. T.; Finney, J. L.; Soper, A. K. J. Am. Chem. Soc. 2006, 128(15), 5119–5126.
19 Bedard-Hearn, M. J.; Larsen, R. E.; Schwartz, B. J. J. Chem. Phys. 2006, 125, 194509.
20 Martini, I. B.; Barthel, E. R.; Schwartz, B. J. Science 2001, 293(5529), 462–465.
21 There are some monovalent salts that are well-known exceptions: for instance, AgI.
22 Nicholls, D.; Sutphen, C.; Szwarc, M. J. Phys. Chem. 1968, 72(3), 1021.
23 Blandamer, M. J.; Gough, T. E.; Symons, M. C. R. Trans. Faraday Soc. 1966, 62(518P), 286.
24 Sciaini, G.; Marceca, E.; Fernandez-Prini, R. J. Phys. Chem. B 2005, 109(40), 18949–18955.
25 Sciaini, G.; Marceca, E.; Fernandez-Prini, R. J. Supercrit. Fluids 2005, 35(2), 106–110.
26 Sciaini, G.; Marceca, E.; Fernandez-Prini, R. Phys. Chem. Chem. Phys. 2006, 8(42), 4839–4848.
27 Sciaini, G.; Marceca, E.; Fernandez-Prini, R. J. Phys. Chem. B 2006, 110(18), 8921–8923.
28 Stein, G.; Treinin, A. Trans. Faraday Soc. 1960, 56, 1393.
29 Sauer, M. C.; Shkrob, I. A.; Lian, R.; Crowell, R. A.; Bartels, D. M.; Chen, X.; Suffern, D.;
Page 30 of 41
ACS Paragon Plus Environment
Submitted to The Journal of Physical Chemistry
123456789101112131415161718192021222324252627282930313233343536373839404142434445464748495051525354555657585960
31
Bradforth, S. E. J. Phys. Chem. A 2004, 108(47), 10414–10425.
30 Anbar, M.; Hart, E. J. J. Phys. Chem. 1965, 69.
31 Gelabert, H.; Gauduel, Y. J. Phys. Chem. 1996, 100(33), 13993–14004.
32 Mizuno, M.; Tanaka, J.; Harada, I. J. Phys. Chem. 1981, 85(13), 1789–1794.
33 Banin, U.; Ruhman, S. J. Chem. Phys. 1993, 98(6), 4391–4403.
34 Bragg, A. E.; Schwartz, B. J. in preparation, 2007.
35 This observation is consistent with published Kdiss values determined from conductivity mea-
surements with other alkali salts in THF:22,69,70 ion-pair ‘saturation’ is approached in the mil-
limolar concentration range. Dissolution is favored at concentrations well below 1 mM, well
below the range we can study currently with our time-resolved experiments.
36 Nguyen, T.-Q.; Martini, I. B.; Liu, J.; Schwartz, B. J. J. Phys. Chem. B 2000, 104(2), 237–255.
37 Tauber, M. J.; Mathies, R. A.; Chen, X.; Bradforth, S. E. Rev. Sci. Inst. 2003, 74.
38 This means that, in samples that did not strongly absorb the pump light, our effective time
resolution is only on the order of ∼1 ps.
39 Jou, F.-Y.; Dorfman, L. M. J. Chem. Phys. 1973, 58(11), 4715–4723.
40 Jou, F.-Y.; Freeman, G. R. Can. J. Chem. 1976, 54(23), 3693–3704.
41 Dorfman, L. M.; Jou, F.-Y.; Wageman, R. Ber. Bunsen-Ges. Phys. Chem. 1971, 75(7), 681.
42 Jou, F.-Y.; Freeman, G. R. Can. J. Chem. 1979, 57(5), 591–597.
43 Bockrath, B.; Dorfman, L. M. J. Phys. Chem. 1973, 77(8), 1002–1006.
44 Seddon, W. A.; Salmon, G. A.; Fletcher, J. W. Radiat. Res. 1974, 59(1), 111–111.
45 Klooster, J. G.; Giling, L. J.; Rettschn, R. P.; Vanvoors, J. D. Chem. Phys. Lett. 1971, 8(5),
462.
46 Renou, F.; Mostafavi, M.; Archirel, P.; Bonazzola, L.; Pernot, P. J. Phys. Chem. A 2003,
107(10), 1506–1516.
47 Renou, F.; Archirel, P.; Pernot, P.; Levy, B.; Mostafavi, M. J. Phys. Chem. A 2004, 108(6),
987–995.
48 Renou, F.; Pernot, P.; Bonin, J.; Lampre, I.; Mostafavi, M. J. Phys. Chem. A 2003, 107(34),
6587–6593.
49 Cavanagh, M. C.; Larsen, R. E.; Schwartz, B. J. J. Phys. Chem. A 2007, 111(24), 5144–5157.
50 Bragg, A. E.; Cavanagh, M. C.; Schwartz, B. J. 2007.
51 Seddon, W. A.; Fletcher, J. W.; Catterall, R.; Sopchyshyn, F. C. Chem. Phys. Lett. 1977,
Page 31 of 41
ACS Paragon Plus Environment
Submitted to The Journal of Physical Chemistry
123456789101112131415161718192021222324252627282930313233343536373839404142434445464748495051525354555657585960
32
48(3), 584–586.
52 Seddon, W. A.; Fletcher, J. W.; Sopchyshyn, F. C.; Catterall, R. Can. J. Chem. 1977, 55(19),
3356–3363.
53 Catterall, R.; Slater, J.; Symons, M. C. R. J. Chem. Phys. 1970, 52(2), 1003.
54 We note, however, that the 1080-nm transient does exhibit non-isosbestic behavior at earlier
delays (Fig. 3(l)), indicating that the fastest dynamics cannot be understood in terms of simple
two-state kinetics.
55 We do not have an independent measurement of the free-electron/TCP branching ratio on the
1-ns time scale, and must rely on the kinetics of these transients to determine this value.
56 The stoichiometry of the initial CTTS reaction, Eq. 3a, mandates that the population of the
CTTS-excited state, I−∗, decays with the same rate constant, kCTTS , at which the e− and
neutral iodine atom appear. As no spectroscopic signatures of I−∗ or I have ever been observed
at the wavelengths examined here, we neglect their population dynamics in this analysis.
57 Blandamer et al. have argued that the substantial shift of the alkali-iodide transition from
its (molecular) gas-phase charge-transfer-to-cation (CTTC) transition (at 30,000 cm−1) to the
42,600-cm−1 transition measured in THF could not arise simply from dipole solvation of a
contact-ion pair, and suggested that the alkali-iodide salts should exist as solvent-separated ion
pairs in THF, such that the solvent breaks the molecular character of the pair.23 More recently,
Sciaini et al.26 concluded that the iodide-salt absorption band associated with contact ion-pairs
in SCA does not have molecular CTTC character: since the cation is strongly coordinated
by local solvent molecules, this band is described best as a perturbed I− CTTS transition.
These interpretations are consistent with our conclusion in Section III B 2 that UV excitation
of Na+-I− in THF does not promote direct CTTC due to an appreciable solvent barrier.
58 Smoluchowski, M. Z. Phys. Chem. 1917, 92, 129.
59 Rice, S. A. Diffusion-Limited Reactions, Vol. 25 of Chemical Kinetics; Elsevier, 1985.
60 Green, N. J. B. Chem. Phys. Lett. 1984, 107(4-5), 485–488.
61 Green, N. J. B.; Pilling, M. J.; Clifford, P. Mol. Phys. 1989, 67(5), 1086–1097.
62 Clifford, P.; Green, N. J. B.; Pilling, M. J. J. Phys. Chem. 1982, 86, 1318.
63 Clifford, P.; Green, N. J. B.; Pilling, M. J. J. Phys. Chem. 1984, 88(18), 4171–4176.
64 Some evidence suggests that the THF radical cation undergoes rapid chemistry with other
solvent molecules after MPI,13 so that the electron may later combine with a radical that was
Page 32 of 41
ACS Paragon Plus Environment
Submitted to The Journal of Physical Chemistry
123456789101112131415161718192021222324252627282930313233343536373839404142434445464748495051525354555657585960
33
not from the original parent, as is the case for the multiphoton ionization of water.63,74.
65 The mobility of e−THF, µ, has been measured as 3 · 10−3 cm2/Vs.75 The e−THF diffusion constant,
D, has been calculated13 using Einstein’s relation, D = (kBT/e)µ, in which e is the elementary
charge, T is room temperature, and kB is Boltzmann’s constant.
66 Independent conductivity measurements in THF suggest that cation-solvent interactions will
limit the Na+ diffusion rate.70.
67 Given the difficulty associated with collimating and aligning IR beams at these wavelengths,
much of this small long-time decay (≤ 3%) may be due to experimental artifacts such as mis-
alignment of the translation stage; it is also possible that this small decay represents the onset
of diffusion-limited chemical reactions (scavenging, etc.) with impurities in the solution.
68 Substantial deviation from the Lorentzian lineshape occurs at higher energies. The high-energy
tail is dominated by transitions to higher-lying excited disjoint states, as determined from recent
MD simulations.17.
69 Chang, P.; Slates, R. V.; Szwarc, M. J. Phys. Chem. 1966, 70(10), 3180.
70 Bhattacharyya, D. N.; Smid, J.; Szwarc, M. J. Phys. Chem. 1964, 69(2), 608.
71 Although the conductivity experiments in refs. 70 69, and 22 studied alkali and tetrabuty-
lammonium salts of aromatic radical anions in THF, we anticipate that the dissociation of
corresponding iodide salts should not be significantly different.
72 Mitsui, M.; Ando, N.; Kokubo, S.; Nakajima, A.; Kaya, K. Phys. Rev. Lett. 2003, 91(15),
153002.
73 Shkrob, I. A.; Takeda, K.; Williams, F. J. Phys. Chem. A 2003, 106(39), 9132.
74 Goulet, T.; Jay-Gerin, J.-P. J. Chem. Phys. 1992, 96, 5076.
75 Dodelet, J.-P.; Freeman, G. R. Can. J. Chem. 1975, 53, 1263.
Page 33 of 41
ACS Paragon Plus Environment
Submitted to The Journal of Physical Chemistry
123456789101112131415161718192021222324252627282930313233343536373839404142434445464748495051525354555657585960
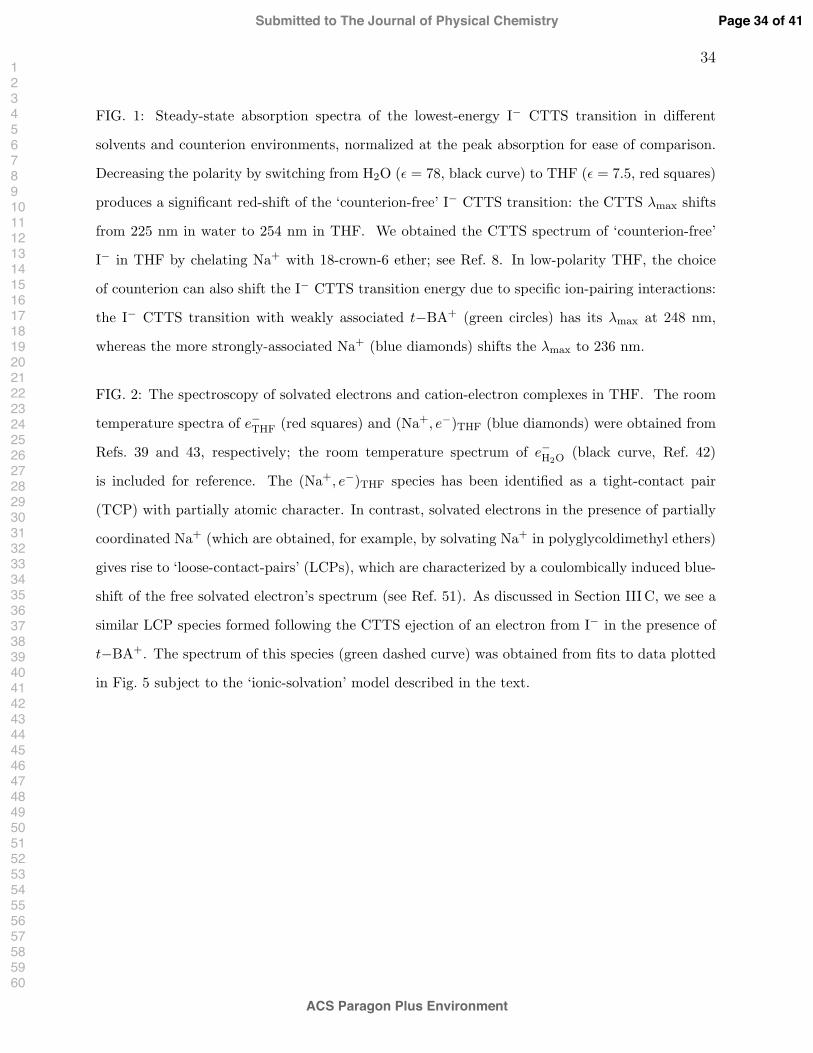
34
FIG. 1: Steady-state absorption spectra of the lowest-energy I− CTTS transition in different
solvents and counterion environments, normalized at the peak absorption for ease of comparison.
Decreasing the polarity by switching from H2O (ε = 78, black curve) to THF (ε = 7.5, red squares)
produces a significant red-shift of the ‘counterion-free’ I− CTTS transition: the CTTS λmax shifts
from 225 nm in water to 254 nm in THF. We obtained the CTTS spectrum of ‘counterion-free’
I− in THF by chelating Na+ with 18-crown-6 ether; see Ref. 8. In low-polarity THF, the choice
of counterion can also shift the I− CTTS transition energy due to specific ion-pairing interactions:
the I− CTTS transition with weakly associated t−BA+ (green circles) has its λmax at 248 nm,
whereas the more strongly-associated Na+ (blue diamonds) shifts the λmax to 236 nm.
FIG. 2: The spectroscopy of solvated electrons and cation-electron complexes in THF. The room
temperature spectra of e−THF (red squares) and (Na+, e−)THF (blue diamonds) were obtained from
Refs. 39 and 43, respectively; the room temperature spectrum of e−H2O (black curve, Ref. 42)
is included for reference. The (Na+, e−)THF species has been identified as a tight-contact pair
(TCP) with partially atomic character. In contrast, solvated electrons in the presence of partially
coordinated Na+ (which are obtained, for example, by solvating Na+ in polyglycoldimethyl ethers)
gives rise to ‘loose-contact-pairs’ (LCPs), which are characterized by a coulombically induced blue-
shift of the free solvated electron’s spectrum (see Ref. 51). As discussed in Section III C, we see a
similar LCP species formed following the CTTS ejection of an electron from I− in the presence of
t−BA+. The spectrum of this species (green dashed curve) was obtained from fits to data plotted
in Fig. 5 subject to the ‘ionic-solvation’ model described in the text.
Page 34 of 41
ACS Paragon Plus Environment
Submitted to The Journal of Physical Chemistry
123456789101112131415161718192021222324252627282930313233343536373839404142434445464748495051525354555657585960
35
FIG. 3: Absorption transients measured at selected IR wavelengths following the 263-nm excitation
of NaI/THF solutions on both long (panels (a)-(g)) and short (panels (h)-(n)) time scales; the
transients have been normalized at t = 25 ps for ease of comparison. The induced absorption at
long IR wavelengths (1670, 1440, 1270, 1185 nm) decreases over 10’s-100’s of ps and is accompanied
by a concomitant absorption increase at shorter wavelengths (700 and 920 nm), with a relatively
flat temporal response at 1080 nm. This behavior illustrates the reaction of e−THF with Na+ to
form a (Na+, e−)THF tight-contact pair (cf. Fig. 2, blue diamonds). The black curves are a global
fit to all 7 transients using a simple, two-time-scale kinetic model described in the text. According
to this model, 63 ± 3 and 26 ± 3 % of the CTTS-ejected electrons are captured by Na+ to form
TCPs with 2.3 ± 0.6 and 63 ± 15 ps lifetimes, respectively; ∼11 % of injected electrons remain
as free e−THF. The poor quality of the fit at intermediate wavelengths (e.g., 1185 and 1080 nm)
suggests that dynamic solvation processes that are not included in this model also are involved in
the capture reaction.50
FIG. 4: Comparison of time-resolved absorption transients associated with (Na+, e−)THF TCP
formation following CTTS excitation of NaI in THF (blue diamonds), geminate recombination
of e−THF with THF+ following 263-nm multiphoton ionization (MPI) of THF at 263 nm (green
circles), and geminate recombination following CTTS excitation of ‘counterion-free’ I− in THF
(red squares); all of the transients have been normalized at t = 10 ps. The (lack of) electron-I
recombination in THF is well-modelled with a solution to the Smoluchowski equation for diffusion
assuming a large (∼6 nm) initial electron-I separation (red solid curve), as supported by excited-
state scavenging experiments (Ref. 8). In contrast, the recombination of e−THF with Na+ and
THF+ is driven by conductive-diffusive motion of the electron-cation pair and is best modelled
with solutions to the Debye-Smoluchowski equation (DSE). The green dashed curve is a DSE fit to
the MPI recombination data with an initial separation (r0) of 37 ± 2 A when the reaction distance
(R) and velocity (v) are fixed at 11 A and 1.2 m/s, respectively (Refs. 8,13). The formation of
(Na+, e−)THF occurs more quickly, suggesting that the CTTS-generated electrons localize close to
Na+; the blue short-dashed curve is a DSE fit to the data with r0 = 24± 3 A and v = 6± 2 m/s
holding R fixed at 11 A. The large change in r0 in the presence (24 A) and absence (∼60 A) of
Na+ illustrates that Na+ either contracts spatial extent of the solvent cavity states coupled to the
CTTS state or directly alters the nature of the I− CTTS state.
Page 35 of 41
ACS Paragon Plus Environment
Submitted to The Journal of Physical Chemistry
123456789101112131415161718192021222324252627282930313233343536373839404142434445464748495051525354555657585960
36
FIG. 5: IR absorption transients measured after 263-nm CTTS excitation of tetrabutylammonium
iodide in THF on long (panel (a)) and short (panel (b)) time scales; the transients have been
normalized at t = 40 ps and offset vertically for clarity. Panel (a) demonstrates that the induced
absorption decay is ≤ 3% out to 1 ns, indicating that neither long-time geminate recombination nor
significant electron capture occurs in these solutions. The short-time dynamics in panel (b) show a
small absorption decay at red wavelengths with a corresponding rise at blue wavelengths, reflecting
that a small fraction (∼10-15%) of the electrons form (t−BA+, e−)THF loose-contact pairs (LCPs).
The black curves are a global fit of all 10 transients to the ‘ionic-solvation’ model described in
the text, which includes a continuous, time-dependent blue-shift of the electron spectrum as it is
captured by t−BA+ to form the LCP. We also fit the data to a ‘kinetic-capture’ model similar
to that used to describe the NaI data in Fig. 3; the fit to this model is visually indistinguishable
from the fit to the ‘ionic-solvation’ model; the fitting parameters obtained using both models are
summarized in Table I. The ionic-solvation model provides a slightly better numerical fit to the
data, and the LCP spectrum obtained from this model is plotted as the green dashed curve in Fig.
2.
Page 36 of 41
ACS Paragon Plus Environment
Submitted to The Journal of Physical Chemistry
123456789101112131415161718192021222324252627282930313233343536373839404142434445464748495051525354555657585960
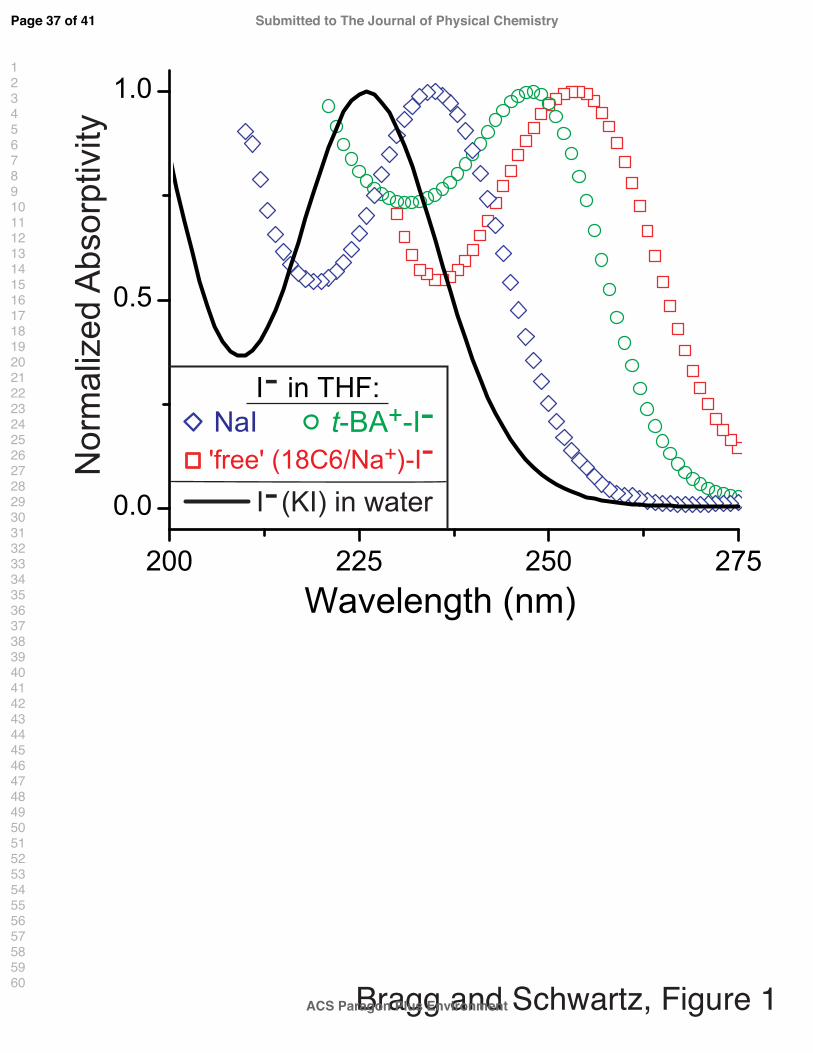
Bragg and Schwartz, Figure 1
-
-
t-BA+-I-'free' (18C6/Na+)-I-N
orm
aliz
ed A
bsor
ptiv
ity
Page 37 of 41
ACS Paragon Plus Environment
Submitted to The Journal of Physical Chemistry
123456789101112131415161718192021222324252627282930313233343536373839404142434445464748495051525354555657585960
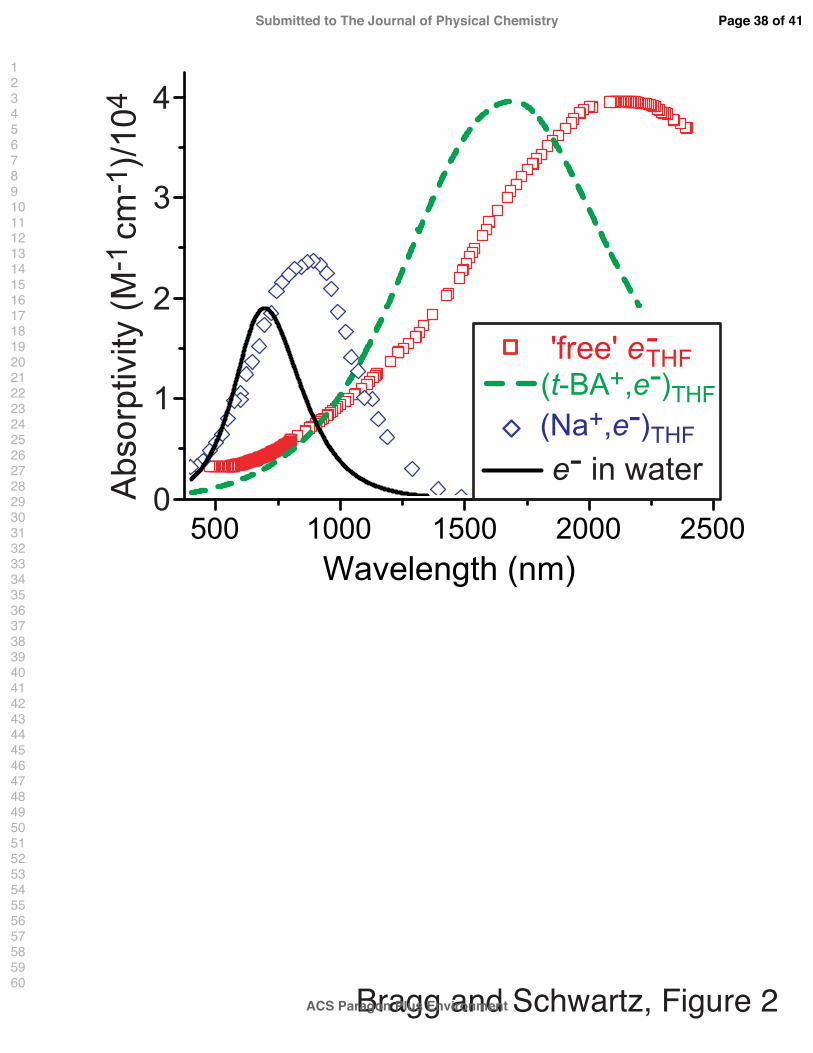
Bragg and Schwartz, Figure 2
'free' e THF
0
1
2
3
4
-
(Na+,e-)THF
(t-BA+,e-)THF
e- in water
Abs
orpt
ivity
(M
-1 c
m-1
)/10
4
Page 38 of 41
ACS Paragon Plus Environment
Submitted to The Journal of Physical Chemistry
123456789101112131415161718192021222324252627282930313233343536373839404142434445464748495051525354555657585960

Bragg and Schwartz, Figure 3
Pump-probe Delay (ps)
∆OD
(nor
mal
ized
@ 2
5 ps
) 1670 nm
1440 nm
1270 nm
1185 nm
1080 nm
920 nm
700 nm
(a)
(b)
(c)
(d)
(e)
(f)
(g)
(h)
(i)
(j)
(k)
(l)
(m)
(n)
Na+-I- in THF (20 mM) pumped at 263 nmprobe =
Page 39 of 41
ACS Paragon Plus Environment
Submitted to The Journal of Physical Chemistry
123456789101112131415161718192021222324252627282930313233343536373839404142434445464748495051525354555657585960
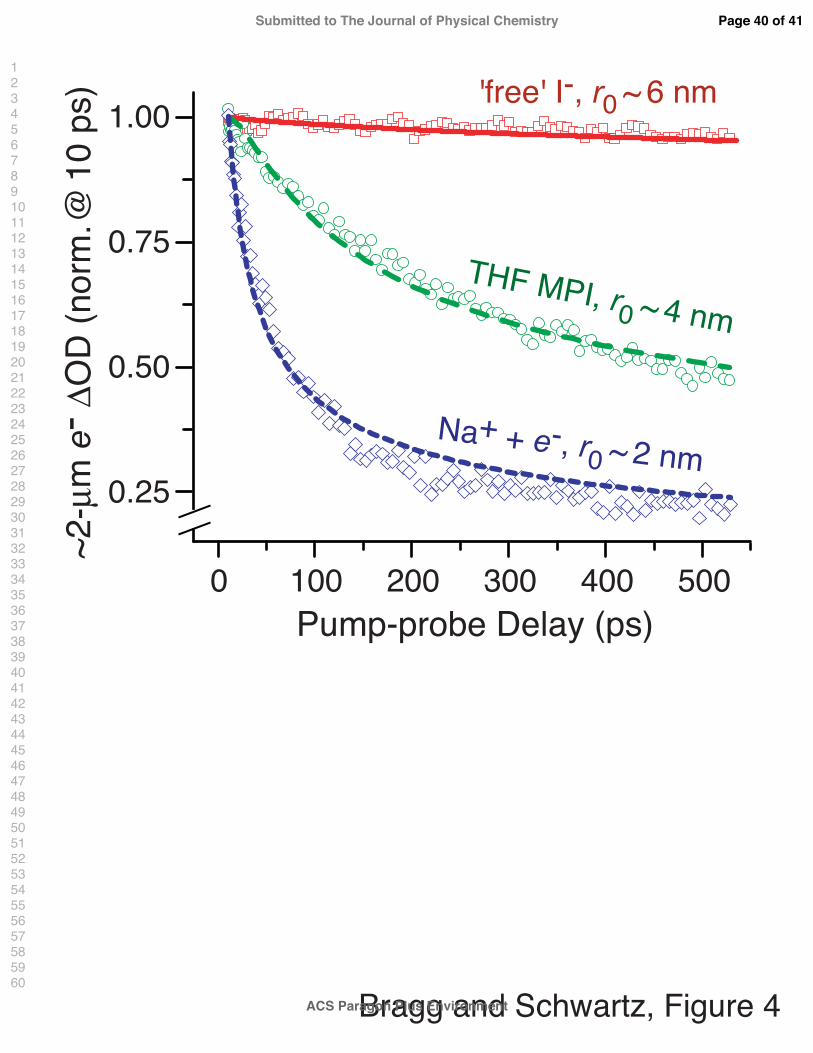
'free' I-, r0 ~ 6 nm
Na+ + e-, r0 ~ 2 nm
THF MPI, r0 ~ 4 nm
~2-µ
m e
- ∆O
D (n
orm
. @ 1
0 ps
)
Pump-probe Delay (ps)
Bragg and Schwartz, Figure 4
0 100 200 300 400 500
0.25
0.50
0.75
1.00
Page 40 of 41
ACS Paragon Plus Environment
Submitted to The Journal of Physical Chemistry
123456789101112131415161718192021222324252627282930313233343536373839404142434445464748495051525354555657585960
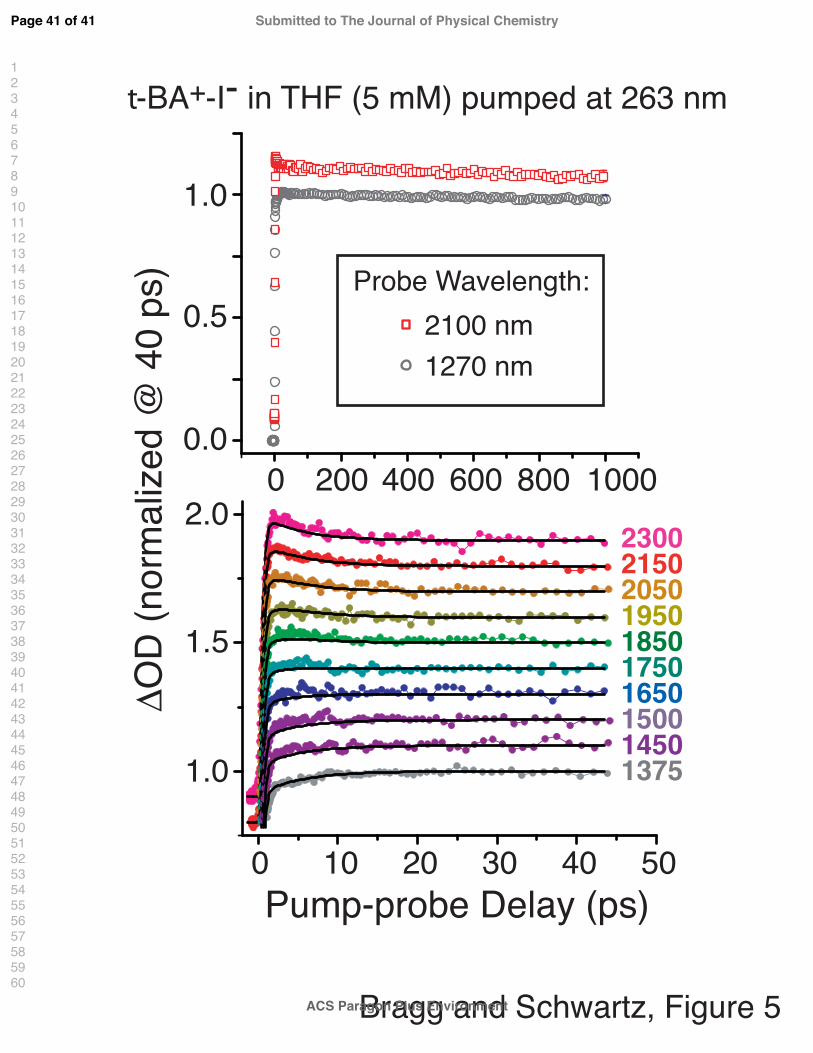
2300215020501950185017501650150014501375
Bragg and Schwartz, Figure 5
∆OD
(nor
mal
ized
@ 4
0 ps
)
Pump-probe Delay (ps)
Probe Wavelength:2100 nm1270 nm
1.0
0.5
0.00 200 400 600 800 1000
2.0
1.5
1.0
0 10 20 30 40 50
t-BA+-I- in THF (5 mM) pumped at 263 nm
Page 41 of 41
ACS Paragon Plus Environment
Submitted to The Journal of Physical Chemistry
123456789101112131415161718192021222324252627282930313233343536373839404142434445464748495051525354555657585960