Embed Size (px)
Citation preview

Multi-issue actor analysis 1
Multi-issue actor analysis: tools and models for assessing technology environments Samuel Bendahan, Giovanni Camponovo, Yves Pigneur
University of Lausanne
HEC (BFSH1) - CH-1015 Lausanne
{Samuel.Bendahan,Giovanni.Campono,Yves.Pigneur}@hec.unil.ch
ABSTRACT: In strategic prospective, scenario thinking and negotiation processes, the analysis of the actor game plays an important role. Such an analysis intends to rank the stakeholders’ positions on many strategic issues, assess the convergences and divergences, and anticipates coalitions and conflicts. Many models and tools have been proposed and used which rest on matrix analysis, game theory and simulation. The paper examines two of them: Mactor, a model of scenario planning, and a negotiation model derived from a game theory based political decision model. The paper detects the flaws, similarities and differences. Based on this comparison, the paper proposes a new model, called MASAM, with the advantages of both, but without their detected flaws. The model and its associated tool have been applied for assessing the public WLAN landscape. The paper sketches the first results which have to be integrated in a more sophisticated scenario analysis.
RÉSUMÉ: Dans les approches prospectivistes et autres processus de négociation, l’analyse du jeu des acteurs joue un rôle important. Ce type d’analyse étudie la position des acteurs, évalue leurs divergences et convergences ; on essaie notamment d’anticiper les conflits et les coalitions. Plusieurs modèles et outils ont été proposés et utilisés avec plus ou moins de succès. Cet article examine deux d’entre eux : l’un (Mactor) basé sur une analyse matricielle et destiné à s’intégrer dans une approche par scénario, l’autre, une déclinaison de modèles de négociation basés sur la théorie des jeux. Cet article détecte les similarités, les points forts et les déficiences de ces deux approches. Il propose ensuite un modèle fédérateur, avec les avantages des deux approches mais sans leurs déficiences constatées. Ce modèle a été appliqué à une évaluation du paysage technologique des réseaux publiques sans fil (WiFi). Les premiers résultats de cette évaluation sont communiqués ; ils constituent la première partie d’une démarche plus ambitieuse de construction de scénarios dans ce contexte.
KEY WORDS: actor analysis, technology assessment, forecasting, scenario, negotiation, Mactor
MOTS-CLÉS: analyse d’acteurs, innovation technologique, prévision, scénario, négociation, Mactor
Submitted to the Journal of Decision Systems (May 2003)

2 Journal of Decision Systems. Volume 12 - no 4/2003
1 Introduction
It is widely recognised that decision makers who intend to make sound decisions must base themselves on a thorough and comprehensive understanding of the current situation and its future perspectives. This task is becoming more and more difficult, as society is being characterized by a greater than ever complexity, uncertainty and pace of development. As a result, tools and decision support systems are increasingly required to support decision makers in their decision process, especially when they have to cope with the study of complex social systems .
Even though a variety of supporting tools and methodologies are available, the vast majority are either inappropriate, being over-simplistic and thus failing to deal appropriately with the rising complexity and uncertainty of the reality they model, or too complex, and hence unusable. Consequently, appropriate tools must be simple enough to be easily usable, while being sufficiently complex to match as far as possible the variety of the system they intend to model.
A classical starting point for the analysis of the current situation (of an industry) are the five forces and value chain frameworks (Porter 1980), which allow the assessment of the relative power of competitors, suppliers, buyers, new entrants and market substitutes. Thanks to its simplicity, this model has become widespread; however, it is often not sufficient to capture the complete picture of a system and its evolution, since it neglects to consider a number of important players and the long term evolution determinants of the system. At the other extreme, there are much more complex, but almost unusable, methods based on system dynamics.
The assessment of the future evolution of a system traditionally relies on various forecasting approaches, usually based on trend extrapolation. However, these are only appropriate when the uncertainty level is sufficiently low that a single future course of events can be predicted accurately enough. They are no longer suitable for the current uncertain environments (Courtney et al. 2001). One reason is that they fail to take into consideration the possibility of the players inside a system to influence the evolution of their own environments, thus causing possible discontinuities with the past (Godet 1979). On the other hand, scenario approaches, which have been conceived to address high levels of complexity and uncertainty (Dyson 1990), are often too difficult to pursue, given the lack of precise methodology and supporting tools.
Based on these observations, a number of authors have proposed a variety of multi-issue actor models, which have the merit of recognizing the importance of explicitly analyzing the effects of the actors inside a system on the key factors of its evolution and of being sufficiently simple yet tremendously powerful at the same time.

Multi-issue actor analysis 3
The purpose of this paper is twofold. Firstly, it intends to give an overview of the principal models available. Secondly, as a result of the analysis of the respective strengths and weaknesses of these models, a new model is proposed in order to capitalize on their strengths while correcting some of their flaws.
The paper is structured as follows. The next section briefly explains what multi-issue actor models are. The two following sections describe the two major approaches available in the literature and illustrate their strengths and weaknesses: the Mactor model is presented in section 3, while the Allas model is the subject of section 4. After that, section 5 proposes a new model that builds on the complementary strengths of the previously illustrated models. This new model is subsequently illustrated in section 6 on the basis of its application to the current WISP industry. Finally, section 7 concludes the paper by summarizing the principal differences between the different models.
2 Multi-issue actor models overview
Multi-actors models aim to achieve a better understanding of the system under study and its possible evolution by taking into account the interests and perspectives of all relevant stakeholders and the interrelationship between them. Essentially, these models recognize the primary role played by the actors in the evolution of their environment, since they may influence (at least to a certain extent) a number of important factors (i.e. issues) that will shape their future environment. However, it is important to bear in mind that evolution also depends on a variety of factors that cannot be controlled or influenced by the actors inside a system.
This knowledge enables the identification of a coherent set of strategies that actors are likely to follow and, by pondering the effects of these actions on the key determinant for the evolution of the system under study, gain better insights into the system’s evolution. Such information may lead to better grounded and more coherent scenarios about the future outlook of the system, as well as facilitating the choice of the most suitable strategies for a particular actor.
Two major multi-issue actor analysis approaches can be found in the literature. The first approach stems from the scenario-planning planning methodology proposed by Michel Godet (Godet 2001) and is based on system theory. This method will be extensively discussed in section 3. The second approach originates from the works of certain authors in policy making and negotiation domains, and will be the subject of section 4. A new and improved model combining aspects of both approaches is proposed in section 5.
While coming from different disciplines, both approaches share the same basic idea: the system under study is formalized as a game between multiple participants (i.e. actors) that have diverging interests (i.e. position and salience) in a set of key issues and try to influence their outcomes towards their personal preferences using

4 Journal of Decision Systems. Volume 12 - no 4/2003
the means at their disposal. The actors can attempt to influence the outcome of a particular issue either directly, by using their power to influence the issue itself (i.e. clout), or indirectly, by using their influence on other actors in order to affect their behaviour. It is useful to illustrate and give a definition of the principal common components of these models, namely actors, issues, position, salience, clout and influence. These concepts are illustrated in Figure 1.
An issue is an idea, topic, problem, or other matter that is open to discussion or dispute. Of particular interest are those issues which outcome may affect the future evolution of the system under study, especially those upon which actors having sensible diverging positions and means to influence their outcomes.
An actor can be defined as an entity that has a stake in the system under study and plays a role in its evolution by mobilizing the resources at their disposal to influence the issue outcome directly (i.e. using its "clout") or indirectly by influencing other actors (i.e. using its "influence"). The different actors are usually characterised by diverging objectives (i.e. "position") and priorities (i.e. "salience") concerning the different issues.
The position of an actor over an issue represents the actor's preferred outcome of the issue: in other words the outcome which, if realized, best suits its objectives. The position indicates the direction towards which an actor is willing to exert influence over an issue.
The salience of an actor over an issue represents the subjective importance of the issue to the actor. In other words it indicates how important is the realization of a favourable outcome of the issue to the achievement of the actor's overall objectives and, consequently, the determination with which the actor is willing to exert influence to affect the issue outcome.
The clout of an actor over an issue represents the power that the actor has to directly influence the outcome of the issue by using the different means at its disposal.
The influence of an actor over another actor represents the power that the influencing actor has to influence the behaviour of the influenced actor.
Figure 1. UML representation of the basic concepts
Multi-issue actor analysis 5
All these methods requires that this input information is provided (i.e. quantified) by a certain number of experts (i.e. persons which are knowledgeable of the field under study). Of particular interest are expert representative of the different opinions of various actors involved, since, be it true or not, it is on the basis of this opinion that this type of actor will act. A number of experts may also be useful to “cross-check” the answer with each other. Unfortunately, no precise methodology is generally provided to gather and aggregate the experts’ opinions. Possibly useful methodologies are using -directed interviews or Delphi approaches.
3 The MACTOR model
This approach stems from the works of the so-called French School of “la prospective”, and in particular from the formalized scenario planning methodology proposed by Michel Godet (Godet 2001).
Originally, the MACTOR method was developed as an answer to the increasing critics made to traditional extrapolation-based forecasting methods, which were fundamentally missing to consider the potential disruptive effect of the actors involved in a system on the key determinants its evolution (Godet 1979).
As a result, a formalized multi-issues actor methodology aiming at analysing the effects of the actors' strategies on their environment was proposed (Arcade et al. 1999). This approach actually combines two methods: the MICMAC and MACTOR methods. The former allows for a systematic identification of the key variables (i.e. issues) that will determine how the system under study evolves. The latter performs a thorough analysis of the possible actors' strategies and initiatives aiming at influencing these variables to skew the evolution towards their own preferences.
MACTOR (Matrix of Alliances and Conflicts: Tactics, Objectives and Recommendations) is based on inter-actor influence, and basically attempts to give a global vision of the importance and possible outcome of the different issues, as well as the expected actor’s strategies, relationship of power and potential alliances and conflicts.
Even though this method was originally intended to gain insights into the possible evolutions of the system under study in order to build better and more coherent scenarios, it shall be successfully applied to a variety of situations involving many actors and issues such as support decision makers to identify and choose between strategic options.
The following subsections present the MACTOR method as illustrated by (Godet 2001).

6 Journal of Decision Systems. Volume 12 - no 4/2003
3.1 The Inputs
The MACTOR method uses three principal inputs, collected in three matrixes.
The first input is the position of actors over issues, stored in the position matrix (1MAO). Position is treated as the opinion of each actor on each issue, determining whether it stands for (value of 1), against (-1) or is neutral (0) to a particular issue.
The second input is the salience of actors over issues, stored in the salience matrix. Salience represents how important each issue is to an actor, evaluated on a scale ranging from 0 (unimportant) to 4 (extremely important). Actually, this matrix is merged with the position matrix, creating the 2MAO matrix which cells are the product of the corresponding cells of the salience and position matrixes.
Finally, the last input is the influence of actors over each other, stored in the influence matrix (MID). Influence represents the power that the influential actor has over the influenced actor, measured on a scale ranging from 0 to 4, respectively meaning no influence to very high influence.
3.2 Model description
The first part of the MACTOR method is dedicated to the development of the concept of influence. While the input only includes the direct influence between actors, the model also takes into consideration indirect influence, which is exerted through the use of the influence with other intermediary actors (see Figure 2)
Figure 2: Indirect influences
Accordingly, the model computes the matrix of direct and indirect influences (MIDI [1]), which contains, for each couple of actors, the direct influence plus all the indirect influences passing from every possible intermediary actor.
( )( )∑+=c bc,ca,ba,ba, MID ,MIDmin MID MIDI [1]
A
B
C
D The influence of A on C, is the sum of the direct influence it has on C and of all indirect influences it gains through all the other third actors (here B and D)
Multi-issue actor analysis 7
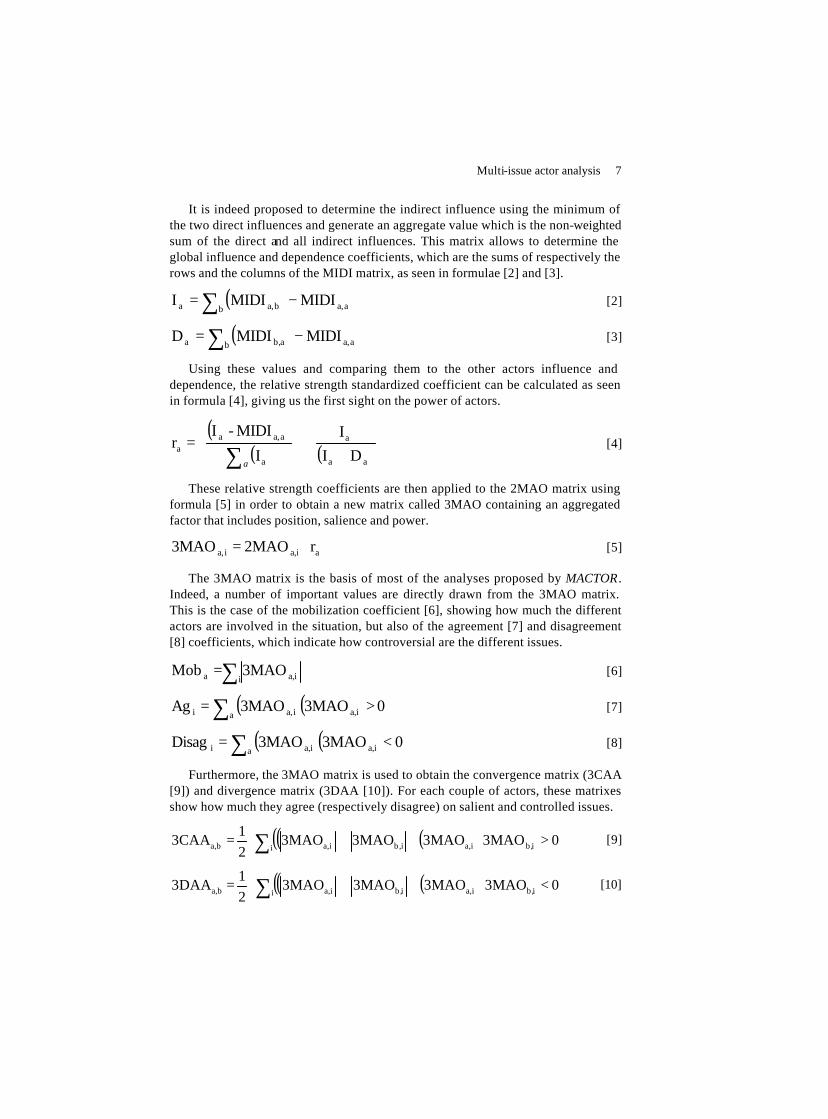
It is indeed proposed to determine the indirect influence using the minimum of the two direct influences and generate an aggregate value which is the non-weighted sum of the direct and all indirect influences. This matrix allows to determine the global influence and dependence coefficients, which are the sums of respectively the rows and the columns of the MIDI matrix, as seen in formulae [2] and [3].
( ) aa,b ba,a MIDI MIDI I −= ∑ [2]
( ) aa,b ab,a MIDI MIDI D −= ∑ [3]
Using these values and comparing them to the other actors influence and dependence, the relative strength standardized coefficient can be calculated as seen in formula [4], giving us the first sight on the power of actors.
( )( ) ( )
+
⋅
=
∑ aa
a
a
aa,aa DI
II
MIDI-I r
a
[4]
These relative strength coefficients are then applied to the 2MAO matrix using formula [5] in order to obtain a new matrix called 3MAO containing an aggregated factor that includes position, salience and power.
aia,ia, r 2MAO 3MAO ⋅= [5]
The 3MAO matrix is the basis of most of the analyses proposed by MACTOR . Indeed, a number of important values are directly drawn from the 3MAO matrix. This is the case of the mobilization coefficient [6], showing how much the different actors are involved in the situation, but also of the agreement [7] and disagreement [8] coefficients, which indicate how controversial are the different issues.
∑=i ia,a 3MAO Mob [6]
( )( )∑ >= ⋅a ia,ia,i 0 3MAO3MAO Ag [7]
( )( )∑ <= ⋅a ia,ia,i 0 3MAO3MAO Disag [8]
Furthermore, the 3MAO matrix is used to obtain the convergence matrix (3CAA [9]) and divergence matrix (3DAA [10]). For each couple of actors, these matrixes show how much they agree (respectively disagree) on salient and controlled issues.
( ) ( )( )∑ >⋅⋅+⋅=i ib,ia,ib,ia,ba, 03MAO3MAO3MAO3MAO
21
3CAA [9]
( ) ( )( )∑ <⋅⋅+⋅=i ib,ia,ib,ia,ba, 03MAO3MAO3MAO3MAO
21
3DAA [10]
8 Journal of Decision Systems. Volume 12 - no 4/2003
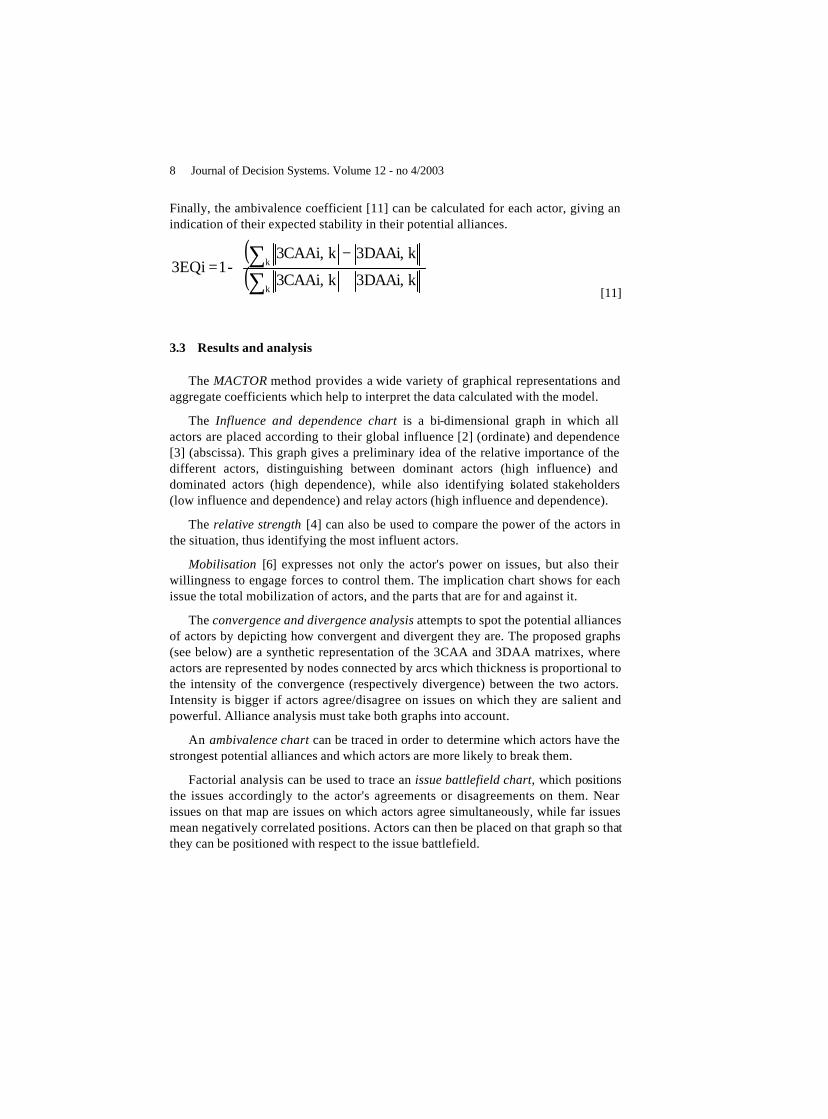
Finally, the ambivalence coefficient [11] can be calculated for each actor, giving an indication of their expected stability in their potential alliances.
( )( )
+
−=
∑∑
k
k
kDAAi,3k3CAAi,
kDAAi,3k3CAAi,-1 EQi3
[11]
3.3 Results and analysis
The MACTOR method provides a wide variety of graphical representations and aggregate coefficients which help to interpret the data calculated with the model.
The Influence and dependence chart is a bi-dimensional graph in which all actors are placed according to their global influence [2] (ordinate) and dependence [3] (abscissa). This graph gives a preliminary idea of the relative importance of the different actors, distinguishing between dominant actors (high influence) and dominated actors (high dependence), while also identifying isolated stakeholders (low influence and dependence) and relay actors (high influence and dependence).
The relative strength [4] can also be used to compare the power of the actors in the situation, thus identifying the most influent actors.
Mobilisation [6] expresses not only the actor's power on issues, but also their willingness to engage forces to control them. The implication chart shows for each issue the total mobilization of actors, and the parts that are for and against it.
The convergence and divergence analysis attempts to spot the potential alliances of actors by depicting how convergent and divergent they are. The proposed graphs (see below) are a synthetic representation of the 3CAA and 3DAA matrixes, where actors are represented by nodes connected by arcs which thickness is proportional to the intensity of the convergence (respectively divergence) between the two actors. Intensity is bigger if actors agree/disagree on issues on which they are salient and powerful. Alliance analysis must take both graphs into account.
An ambivalence chart can be traced in order to determine which actors have the strongest potential alliances and which actors are more likely to break them.
Factorial analysis can be used to trace an issue battlefield chart, which positions the issues accordingly to the actor's agreements or disagreements on them. Near issues on that map are issues on which actors agree simultaneously, while far issues mean negatively correlated positions. Actors can then be placed on that graph so that they can be positioned with respect to the issue battlefield.

Multi-issue actor analysis 9
Using these tools, it should be possible to obtain a global understanding of the battlefield, actor positions and power repartition. This information can then be exploited to ponder what particular strategies should be adopted by an actor, or to think about possible future scenarios.
3.4 Comments about the model
MACTOR provides a vast variety of useful tools and analyses to get a comprehensive and aggregate image of the situation out from a few simple inputs. The computations seem to provide a real added value as compared with the raw inputs. However, this method has a few weaknesses which should be considered.
Firstly, the concept of power is only restricted to influence between actors. Comparing to the other models, this essentially means that clout is not taken into account, which implies that all actors are supposed equally powerful on all issues, neglecting the fact that actors can have different power on the issues’ outcomes.
Secondly, the way indirect influences are handled is not appropriate. Indeed, the MIDI matrix coefficients are the sum of the direct influence and all indirect influences. The problem is that the weight of direct influences decreases with the number of actors, and, if that number is high, direct influence is completely drowned under the impact of indirect influence. In fact, one direct influence is summed to n–2 indirect influences and therefore its weight results to be 1/(n-2). This gives for example 12.5 % for 10 actors. This does not really make sense: in reality, the most important influence that an actor has on other is the direct influence, as using indirect influences can be long and actually difficult if done through many actors.
Moreover, the choice of using the minimum as the representative value for an indirect influence is also debatable, since it implies that indirect influence between

10 Journal of Decision Systems. Volume 12 - no 4/2003
two actors only depends on the smallest of the direct influences between them and the intermediary actor, without considering the amount of the other influence. A correct evaluation should take into account both influences.
Finally, the convergence and divergence graphs are actually difficult to trace pertinently and even more difficult to interpret. Not only they quickly become chaotic, even with a modest numbers of actors, but their interpretation requires considering two different graphs at the same time, which is far more difficult than if all information would be contained in only one graph.
As it will be shown in section 5, these flaws can be easily corrected while preserving the great descriptive power of the method.
4 The Allas model
Authors in policy making argue that it is reasonable to analyse policy choices using expected utility calculations considering best response strategies (Bueno de Mesquita 1994) and suggest to take into account the possibility of influencing the behaviour of other participants through negotiation (Stockman et al. 1994). Tools have been derived from these game theory models and used in forecasting processes. Other researches (Amblard, 1999) suggested multi-agent simulation based on these political decision models.
While conceived for policy making, these models based on game theory can be extended to more general decision making situations. However, while theoretically sound, these models remain complex to be used in practice.
Consequently, Allas and Georgiades (Allas et al. 2001) have devised a similar but much simpler model in order to be easy enough for managers to understand and use. For the same reason, they also provide a tool supporting the analysis of the interaction of the different actors involved on a set of common issues.
Their model was explicitly designed to help negotiators in multiparty deals. Indeed, it is meant to help them understand how the different actors can bargain on issues and conceive good negotiation strategies to specific stakeholders. Using a few simple input transformations, it gives information on the initial situation and the relationship between actors, highlighting the expected outcome of negotiation, the actors which can be best influenced and the deals that could be made with them.
The remainder of this section presents the model as described by (Allas et al. 2001).
Multi-issue actor analysis 11
4.1 The Inputs
This method only requires three actor x issue matrixes as input, which contain position, salience and clout of actors over issues.
Position shows the actors' preferred outcome on each issue, expressed on a standardized scale ranging between two extreme outcomes, a value of 0 meaning the less favourable opinion, while 100 representing the most favourable.
Salience expresses how important is an issue to an actor, measured on a scale ranging from 0 (unimportant) to 100 (most important).
Clout represents the power actors have to influence the decision on each issue, a value of 100 meaning highest influence on an issue and 0 meaning no influence.
4.2 Model Description
Unlike MACTOR, this approach performs few data transformations, the method consisting mostly on graphical analysis of the raw inputs. Therefore, only a few values are calculated in order to bring additional indications.
The first is the expected outcome , which is the average of positions weighted by salience and clout. This value represents a "pure compromise vote", that is the outcome that would result if no bargaining occurs among the parties.
This value is then used to compute the actor's dissatisfaction , which is the difference between the actor's position on an issue and its expected outcome. This value indicates the resolution to engage in negotiation to change that outcome.
The model also determines an alliance status, determining if a pair of actors are allies, enemies or neutral by comparing their positions on the different issues. Actors are considered allies on an issue if they share a similar position and enemies if they have contrasting positions.
Finally, the actor’s energy investment on an issue is estimated by the product of salience and clout, giving the combined salience and clout indicator.
4.3 Results and analysis
The model’s indicators consist in a number of graphs, traced from the point of view of a subject actor or drawn to analyse a particular issue.
Firstly, actors can be positioned on an outcome continuum graph, representing each issue as a segment upon which the actors' positions and the expected outcome are drawn, allowing a synthetic visualization of the opinions’ distribution.

12 Journal of Decision Systems. Volume 12 - no 4/2003
Secondly, the stability analysis graph compares, for a particular issue, the actors' dissatisfaction (ordinate) with their combined salience and clout (abscissa), showing the actors' determination to change or cement the expected outcome, and therefore the outcome stability. As a rule of thumb, an outcome is unstable if there are highly dissatisfied actors with high combined salience and clout.
Thirdly, a negotiation landscape can be drawn from a particular actor’s perspective (subject actor). This graph places all actors with respect to their salience (ordinate) and clout (abscissa) on a particular issue. The colour of the actor's points reflects their alliance status with the subject actor. This graph gives an intuitive image of which actor might be useful allies and which are dangerous enemies. Four types of actors can be distinguished: followers (salient but not powerful actors which can be valuable allies if little effort is required), shapers (salient and powerful actors, which can be strong allies or dangerous enemies), influencers (not salient but powerful actors which can be easy allies which can change the outcome) and by-standers (not salient and not powerful actors, which can be ignored)
Finally, the relationship analysis provides a mean to analyze the possible deals between a couple of actors, through a graph in which the issues are placed according to the salience of the two actors. The colour of the dot represents the alliance status of the two actors on the issue. The most interesting issues to negotiate are those on which an actor is far more salient than the other: these issues can be used to agree on a change of position against concessions on other issues. Issues that are salient to both actors are the most difficult to negotiate, while issues on which both actors have low salience can be disregarded.
4.4 Comments about the model
The most impressive advantage of this method is the simplicity and quality of the graphic tools it provides, which allow the user to get a reasonable amount of information without requiring any modification of the input.
Since the Allas model allows the situation to be analyzed with a large amount of detail, it is extremely useful when it comes to determine the best strategy for a particular actor, or to get some answers to specific questions concerning certain actors and issues.
However, given the lack of aggregation proposed by this model, obtaining a global understanding of the situation, i.e. taking into account each possible couple of actors and issues, would require an excessive number of graphs to be analyzed, especially if a large number of actors are involved.
Overall, the model can be described as a very useful tool for specific purposes and with really helpful graphical analysis tools. The sole fact of gathering the information required to feed the model already forces the observer to pose himself a

Multi-issue actor analysis 13
number of pertinent questions which lead him to obtain an intuitive understanding of the field. However, this model does not provide enough value-added information to obtain a sufficiently clear understanding of the global situation. For that reason, this tool could be used more effectively if it would be included into a broader set of decision support tools which permit a more aggregating and deeper analysis.
5 The MASAM model
As illustrated in the two preceding sections, the presented models have a lot of advantages and very useful ideas, while also having a few drawbacks.
Actually, these models seem to be rather complementary and provide users different kinds of information. Indeed, MACTOR attempts to give a general and comprehensive overview of the problem based on aggregating values and analyisis techniques, whereas the Allas method focuses on specific strategies for given actors and issues, using graphical interpretation tools. Moreover, one model uses influence, while the other uses clout, to represent power.
However, MACTOR boasts a few flaws as far as the data transformation is concerned, while the Allas method, though using good interpretation tools, does not take advantage at best of the hard collected input, proposing nearly no data transformation.
Based on these observations, we propose a new model called MASAM (Multi-issue Actor Strategy Analysis Model), which integrates the advantages of both models, while overcoming most of their flaws (Bendahan 2002). This model combines the inputs of the two preceding model and is capable of providing their users with all the information obtainable from them. In addition, it adds new features that help drawing more out of the input and allows the user to get a more precise interpretation, thanks to new variable combinations and visualization propositions. These additions include new inputs, a more formal standardization procedure for each step, new combined data, a broader set of aggregate indicators, new graphical solutions, and other formulae theoretically more accurate.
5.1 The Inputs
The inputs of MASAM integrate those of the two preceding model (position, salience, clout and influence) and add a new input, auto-determination, which is required to correct the problems of handling indirect influences. In addition, these inputs are treated in a more formal way: while looking more like the Allas inputs, they are still used to get aggregate values using matrix calculus.

14 Journal of Decision Systems. Volume 12 - no 4/2003
Position is standardized on a scale ranging from 0 to 100, where 0 and 100 are the extreme actor's positions and the other values are linearly determined between these values. The positions are stored in the Standardized Position matrix (SPos).
Salience, is also standardized on a scale ranging from 0 to 100. It represents the relative utility that an actor gains if the expected outcome goes closer to its position, as compared with the other actors. Salience is stored in the Standardized Salience matrix (SSal). Note that all matrix's cells must be comparable with each other.
Clout is standardized as to ensure that the sum of all actor’s clouts on an issue is 100, representing the percentage of power (direct control) that an actor has on an issue. Clout is stored in the Standardized Clout Matrix (SClo).
The influence and autodetermination are treated in a way similar to the clout each actor must be controlled 100%. Part of this control is the actor’s auto-determination, which is the power the actor has on itself. The remainder is divided between the influences of the other actors. These inputs are stored in the Standardized Direct Influence matrix (SDI): the auto-determination being the diagonal values, which were let empty in the MACTOR method.
5.2 Model Description
This section precises the new way for dealing with the influence among actors, analyzing issues and actors, and determining alliances.
5.2.1 A new way to handle influence
Once all the inputs have been collected and standardized, so that they meet the requirements mentioned above, the first step is to decide how the influences will be handled. Like in MACTOR the SDI matrix can be transformed in a new matrix, the SDII (Standardized Direct and Indirect Influence matrix), which attempts to include the indirect influences actors have on others by using intermediary actors.
However, the way influence should be taken into account depends on the situation: in some cases actors must decide fast, thus having less time to lobby and use their indirect power, while in other cases they can fully use their potential indirect control. In some circumstances, even superior order indirect influences, which includes more than one bridge actor might be exploited.
As a consequence, MASAM proposes a more flexible way to handle influence, so that the previously described cases can be taken into account. In our vision, an actor is partly autonomous, still being influenced by others to a certain extent. This autonomy is expressed by the actor’s auto-determination coefficient, while the remaining part is split among the other actors’ influence. As shown in Figure 3, actors influence other actors in order to use their clout on issues or their influence on other actors. If only direct influences are considered (left part of the figure), actors
Multi-issue actor analysis 15
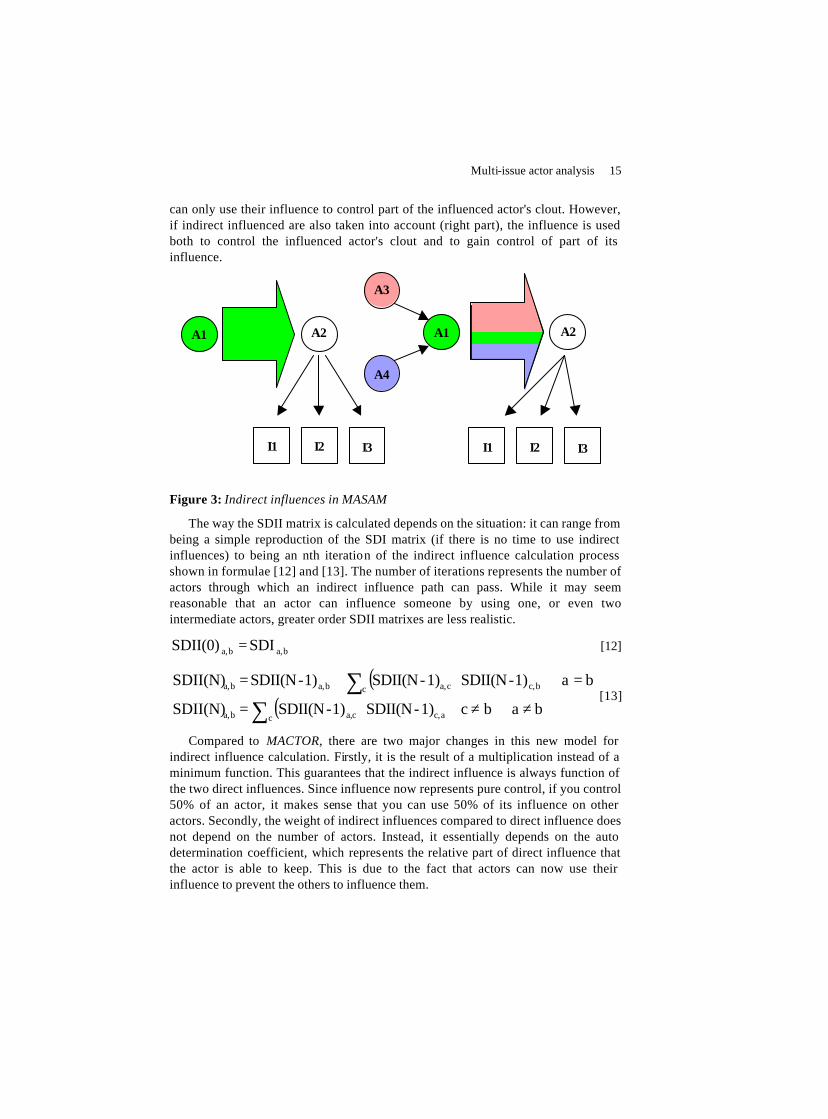
can only use their influence to control part of the influenced actor's clout. However, if indirect influenced are also taken into account (right part), the influence is used both to control the influenced actor's clout and to gain control of part of its influence.
Figure 3: Indirect influences in MASAM
The way the SDII matrix is calculated depends on the situation: it can range from being a simple reproduction of the SDI matrix (if there is no time to use indirect influences) to being an nth iteration of the indirect influence calculation process shown in formulae [12] and [13]. The number of iterations represents the number of actors through which an indirect influence path can pass. While it may seem reasonable that an actor can influence someone by using one, or even two intermediate actors, greater order SDII matrixes are less realistic.
ba,ba, SDI SDII(0) = [12]
( )( ) b a bc 1)-SDII(N1)-SDII(N SDII(N)
ba 1) -SDII(N1)-SDII(N1)-SDII(N SDII(N)
c ac,ca,ba,
c bc,ca,ba,ba,
≠∀≠∀⋅=
=∀⋅+=
∑∑
[13]
Compared to MACTOR, there are two major changes in this new model for indirect influence calculation. Firstly, it is the result of a multiplication instead of a minimum function. This guarantees that the indirect influence is always function of the two direct influences. Since influence now represents pure control, if you control 50% of an actor, it makes sense that you can use 50% of its influence on other actors. Secondly, the weight of indirect influences compared to direct influence does not depend on the number of actors. Instead, it essentially depends on the auto determination coefficient, which represents the relative part of direct influence that the actor is able to keep. This is due to the fact that actors can now use their influence to prevent the others to influence them.
A1 A2 A1 A2
A3
A4
I1 I2 I3 I2 I3 I1

16 Journal of Decision Systems. Volume 12 - no 4/2003
5.2.2 Analyzing Issues and Actors
After the influences have been set, the next step is the issue analysis. Its different parts will allow an understanding of the importance of the issues, their degree of controversy, as well as their expected outcome.
The first issue analysis is the computation of the expected outcome. There are two possible ways of proceeding: either calculate an outcome without taking the influences into account (Pure Votes, Formula [14]), or include them as they have been decided in the SDII matrix (Influenced Votes, formula [15]).
( )∑ ⋅=a ia,ia,i SCloSPos Vote [14]
( )( )∑ ∑ ⋅⋅=a b ib,ba,ia,i SCloSDII(N) SPos InfVote [15]
Once the expected outcome has been estimated, it is possible to calculate the dissatisfaction of each actor on each issue, considering the distance of the actor’s position from the issue’s expected outcomes and the actor’s salience. The dissatisfaction analysis also indicates the direction of the disagreement: a positive (respectively negative) value means that an actor prefers a higher (respectively lower) outcome. The absolute value of the coefficient represents the dissatisfaction, which indicates the utility loss of the actor. A divergence coefficient can also be calculated, representing the aggregated dissatisfaction on each issue, as shown in [16].
( )∑ ⋅=a ia,iia,i SSalInfVote - SPos Diverg [16]
The issue's relative importance can be determined using the actor’s salience.
The actors analysis then attempts to describe the power repartition between actors and identify the actors which are more likely to shape the future. For each actor, it is possible to determine a power coefficient, which estimates the power of the actor compared to the others. In order to obtain an accurate estimation, this coefficient takes into account a variety of data encompassing direct and indirect influences, clout and the issues importance. As shown in formula [17] the power of an actor is the sum of its control on all issues, weighed by the issue's importance. A powerful actor is the one that controls the important issues, either using its clout directly, or using its influence on other actors to use their clout. The true clout of an actor [18], represents the part of an issue that is controlled by a particular actor, taking both influence and clout into account.
( )( )∑ ∑⋅⋅=i c ic,ib,ba,a SSalSClo SDII(N) Power [17]
( )∑ ⋅=b ib,ba,ia, SCloSDII(N) TClo [18]

Multi-issue actor analysis 17
5.2.3 Determining alliances
The relationship analysis establishes a coefficient for each couple of actors, representing the distance between the two actors. The closer the coefficient is to zero, the more the actors have common positions. The closer the coefficient is to 1, the most different highly salient positions they have. Thus, to determine how close two actors are, there are two factors for each issue: the difference of position and the salience.
The product of the salience of the two actors will determine the strength of the implication on the coefficient. In other words, if one of the actors is not salient at all, the alliance has no sense, while if both actors attach a lot of importance to an issue, that issue's status will have a lot of impact on the coefficient. A value ζ for supposed neutral relationship must be specified, so that we know which position difference is sufficient to be characterized as a disagreement between two actor with very similar, yet not identical positions can still be allies. In our model, we arbitrarily set ζ to a default value of 40, but it should be set contingently to the studied problem. The formula for proximity is [19]. As seen later in the tool section, this alliance coefficient allows a much clearer graphical representation than the convergence and divergence graphs of MACTOR.
( )( ) ( )
( )( )∑ ⋅⋅=ℵ
ℵℵ
ℵℵ=
i ib,ia,ib,ba,ba,
ba,ba,ba,ba,
ba,ba,ba,ba,
SSalSSal - SPos - SPos With
Min - Max
Min - Alliance
ζ
[19]
5.3 A Decision Support System
In order to use the model in a more efficient and effective way, a decision support system which performs the necessary calculations and offers an explicit graphical representation of the different analyses is required.
Accordingly, we developed a prototype based on Microsoft Excel and Visual Basic for Applications (VBA). Once given all the required input, this prototype calculates all coefficients and generates graphical representations of the results. This prototype is designed as a collection of tools, the most important of which are described below. Some of the graphical solutions proposed in MACTOR and Allas methods were improved to give more valuable and pertinent information. An example of this tool’s application to a real life context is illustrated in section 6.
The influence analysis tool (see Figure 6) gives a general overview of influences and relationships between actors. It shows which actors are the most controlled and which are dominant, using directly the SDII matrix to display the true influences.
18 Journal of Decision Systems. Volume 12 - no 4/2003
The tool shows for each actor its power, and how much it is controlled by himself and others.
The issue analysis tool (see Figure 7) shows the expected outcome of each issue and the dissatisfaction of each actor with respect to each issue. This graph is actually inspired by the Allas' stability analysis, but indicates not only the stability of the situation for each issue, but also on which side of the outcome the actors are positioned, that is in which direction the issue is supposed to change. As well, the determination with which they would exert their influence also determines the dissatisfaction and thus the instability of the expected outcome The issue analysis also provides an evaluation of the relative importance of each issue.
The actor analysis tool (see Figure 8) depicts the relationship of power between actors, showing graphically for each issue, the part of control possessed by actors after having taken the influences into account. Global coefficients of power are also calculated to be used, so that the power of the different actors can be evaluated as accurately as possible.
The alliance analysis tool, principally composed by the perceptual map (see Figure 9), attempts to give a graphical representation of the actor battlefield. This representation uses the alliance coefficient for placing the actors on a bi-dimensional space. Since the number of dimensions which form the distances is higher than two, a solving algorithm based on square errors minimization is employed to calculate the actor’s coordinates. The result is a map where allies are placed near each other, while enemies are placed far away. When the represented distance differs sensibly from the true distance, a link that represent the accuracy of the distance estimation is shown, so that the observer is not misled by perception. This allows the user to see which actors have the most common interests, and which have the highest divergence. Since the alliance coefficient aggregates both agreements and disagreements, near actors on the map are also the nearest in the real situation.
In conclusion, MASAM is apparently a successful blend of the two models analysed in the previous sections: the aggregative analyses and coefficients are inspired by the MACTOR method, while the representation is inspired by the Allas model. Furthermore, the model brings more than the simple combination of both models. While the different features of both Allas and MACTOR can be easily replicated by MASAM in order to give the same kind of information, MASAM also allows the generation of additional information, such as the alliance coefficient and perceptual map, and takes advantage of more sophisticated illustration methods which enable a more precise interpretation to be drawn.
6 Illustration: assessing the WISP landscape
In order to demonstrate the previous model and give the reader a more concrete understanding of what kind of analysis are supported by the model, this section

Multi-issue actor analysis 19
illustrates its applications to the analysis of the Wireless Internet Service Provider (WISP) industry, viewed from the perspective of the current Swiss market situation. This industry has been chosen to illustrate the model because of the general interest that surrounds it and the number of open questions that have not yet been answered.
Multi-issue actor methods have already been applied to the mobile business industry as part of an European project scenario planning exercise (Aarnio et al. 2002), where the MACTOR method has been used in order to construct a base from which designing future scenarios. Insights from this research have been useful when designing this illustration study.
The WISP industry can be briefly defined as offering the provision of wireless Internet services in license free frequency bands in public spaces (Herslow et al. 2002). In other words, WISP providers offer wireless connectivity to the Internet in a variety of public locations called hotspots (such as cafés, hotels, stations, schools, etc.) through Wireless Local Area Network (WLAN) technologies.
These are wireless networks which permit to transmit data over electromagnetic waves over a free frequency band (2.4GHz and 5GHz bands) at fast data rates (>10 Mbps), over a limited range (~100 meters). In comparison, UMTS networks provide a theoretical maximum of 2Mbps (probably 384 kbps), but over a wide range of several kilometres. They are usually deployed as an access technology to provide wireless access to a core network, such as a wired LAN or the Internet.
The origins of WLAN networks go back to 1990, but become a matter of interest only later with the advent of the IEEE 802.11 standard in 1997 (2Mbps in the 2.4GHz band), its subsequent extensions 802.11b (11Mbp, 2.4GHz) and 802.11a (54Mbps, 5GHz) in 1999, and the interoperability certification services offered by WECA. With improved performance, interoperable products and rapidly decreasing prices, WLANs started to be adopted by enterprises and residential consumers as a wireless extension to their traditional LANs.
The widening diffusion of WLAN-enabled devices created an opportunity for offering public WLAN access to nomad users in public locations. This is the beginning of the WISP industry. Currently, a number of different players including incumbent from the telecom industry, venues and start ups, are trying to exploit this opportunity (Camponovo et al. 2003). Certain players even expect to exploit this technology in order to create large-scale wireless broadband networks federating many WLAN hotspots in a common network.
The future of this industry is uncertain. Some authors think that WLAN could be positioned as a competing technology to cellular data networks such as GPRS and UMTS, while others believe it will complement these networks to provide enhanced service in particular public locations (Laurent et al. 2002, Lehr et al. 2002). Some think that WLAN will be an alternative of the local loop, and pessimists forecast that WLAN will be confined to private usage as a mere LAN replacement.
20 Journal of Decision Systems. Volume 12 - no 4/2003
This uncertainty is one of the reasons of conducting a study using multi-issues actor models. In order to conduct this study, a number of preparatory steps must be made: firstly, the relevant issues and their measuring scales must be defined, then, the involved actors must be identified and finally input on the position, salience, clout and influence must be gathered through expert interviews. It is worth noting that in order to present a relatively simple example, we focused ourselves on a very limited number of issues and actors.
6.1 Issues
This study focuses on five principal issues: mobility, device, wide area WLAN, free network emergence and regulation.
- Mobility relates to how much mobile will the use of WLAN be. It can be measured on a scale ranging from stationary use (wireless connectivity within a private and limited local area), to nomadic use (non-continuous Internet connection in different public places), to mobile use (continuous Internet connection while on the move between different locations while maintaining a continuous network connection).
- Device concerns with what type of device will be used to access WISP services. It can be evaluated on a scale ranging from predominance of notebook -type to a predominance of mobile phone-type devices, with PDAs counting as an intermediate between the two. Nowadays, WLAN are principally used with notebooks, but high-end WLAN-enabled PDAs are start being produced.
- Wide Area WLAN development relates to the extent of coverage offered by WLAN networks. It can be measured on a scale ranging from a very limited coverage (few independent networks covering only a small set of venues) to a truly ubiquitous coverage through integration of WLANs with cellular networks.
- Free networks emergence reflects the extent to which free community networks arise. Community networks are groups of end users willing to share their private hotspots with each other, often inspired by an open source mentality and eventually providing free wireless Internet access to the public. This issue can be evaluated on a scale ranging from a pure commercial WISP environment to a pure community network environment, an intermediate position meaning the coexistence of both models.
- Regulation: this issue represent the tightness of the WLAN frequency allocation and related regulation policy. This issue can be measured on a range going from loose regulation (totally unregulated use of the 2.4 and 5 GHz bands) to a tight regulation (free use of the 2.4 GHz band only, regulated with tight power limitations and a licensing system for commercial WLAN service providers).

Multi-issue actor analysis 21
6.2 Actors
The study comprises 7 main categories of actors:
- Mobile network operators (MNO), which essentially include operators of GSM, GPRS and UMTS networks (e.g. Swisscom Mobile, Sunrise and Orange).
- Internet service providers (ISP) and other network operators, which include operators of fixed telephony networks (i.e. carriers such as Swisscom Fixnet, TDC, Tele 2), fixed packet-based data networks (i.e. ISPs such as Bluewin, Cablecom) and wireless Internet access networks (i.e. WISPs such as Monzoon, Cable & Wireless).
- Venues , which include a variety of property owners which provide the place where the access points that compose the network are installed such airports, hotels, cafés, shopping centres, residential areas, parks, schools, public buildings etc.
- Communities , which are free networks, built by clustering members' private hotspots together to provide access to the community members, often operated by loose federations of technology enthusiasts motivated by an open source mentality.
- Informatics-related enterprises , which include companies active on the informatics industry, whether by selling hardware, software or network equipment. Examples include Intel, Microsoft, IBM, Sun Microsystems, Cisco, Compaq
- Telephony-related enterprises , which include companies active on the informatics industry, whether by selling hardware, software or network equipment. Examples include Nokia, Ericsson, Motorola, Lucent, Nortel, Siemens, Alcatel.
- Regulator , which are the local regulation authorities.
6.3 The input data
The following input data used to illustrate this example was gathered on the basis of interviews with 5 academic experts of the field under study. It is important to make the reader aware that the opinion of these experts does not necessarily represent a veracious image of the WISP battlefield, but rather represents their own subjective views. In particular, the number of experts is fairly low and no experts representative of the different actors categories have been interviewed. This has been a deliberate choice, as the goal of this brief study is to illustrate the previously described multi-issue actor model on the basis of a real life example. To be clear, this paper does not intend to provide a full-scale study of the WISP industry.
The collecting process consisted in two subsequent steps.
In the first step, experts were requested to individually fill a questionnaire asking them to quantify the required inputs. Position was evaluated according to the scales provided in Table 1. Salience, clout and influence were to be evaluated on a scale
22 Journal of Decision Systems. Volume 12 - no 4/2003
ranging from 0 (lowest) to 4 (highest), and auto-determination coefficients were expressed in percent figures.
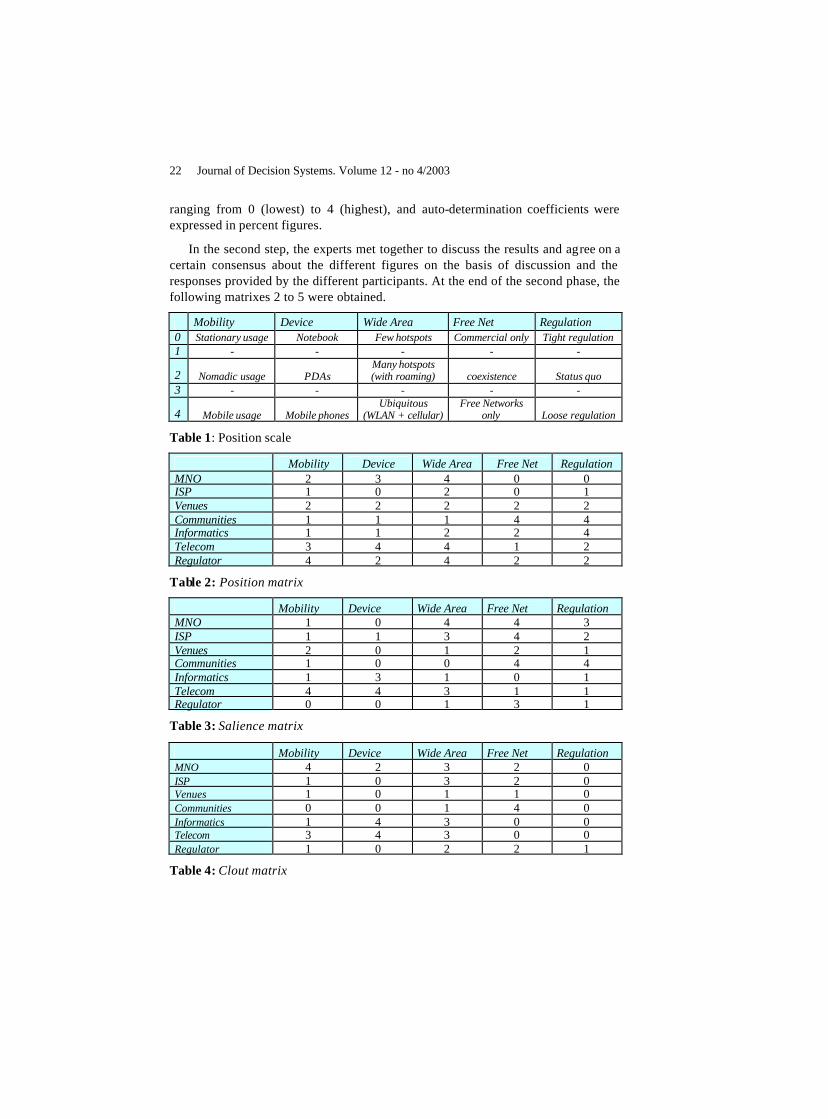
In the second step, the experts met together to discuss the results and agree on a certain consensus about the different figures on the basis of discussion and the responses provided by the different participants. At the end of the second phase, the following matrixes 2 to 5 were obtained.
Mobility Device Wide Area Free Net Regulation 0 Stationary usage Notebook Few hotspots Commercial only Tight regulation 1 - - - - -
2 Nomadic usage PDAs Many hotspots (with roaming) coexistence Status quo
3 - - - - -
4 Mobile usage Mobile phones Ubiquitous
(WLAN + cellular) Free Networks
only Loose regulation
Table 1: Position scale
Mobility Device Wide Area Free Net Regulation MNO 2 3 4 0 0 ISP 1 0 2 0 1 Venues 2 2 2 2 2 Communities 1 1 1 4 4 Informatics 1 1 2 2 4 Telecom 3 4 4 1 2 Regulator 4 2 4 2 2
Table 2: Position matrix
Mobility Device Wide Area Free Net Regulation MNO 1 0 4 4 3 ISP 1 1 3 4 2 Venues 2 0 1 2 1 Communities 1 0 0 4 4 Informatics 1 3 1 0 1 Telecom 4 4 3 1 1 Regulator 0 0 1 3 1
Table 3: Salience matrix
Mobility Device Wide Area Free Net Regulation MNO 4 2 3 2 0 ISP 1 0 3 2 0 Venues 1 0 1 1 0 Communities 0 0 1 4 0 Informatics 1 4 3 0 0 Telecom 3 4 3 0 0 Regulator 1 0 2 2 1
Table 4: Clout matrix

Multi-issue actor analysis 23
Active MNO ISP Venue Community Informatics Telecom Regulator MNO 70% 0 4 1 1 4 4 ISP 1 70% 4 4 4 1 1 Venue 1 1 50% 0 0 0 0 Community 1 1 2 80% 0 0 1 Informatics 1 2 0 1 70% 2 1 Telecom 2 0 0 0 2 60% 2 Regulator 2 1 1 4 2 3 20%
Table 5: Influence matrix
6.4 The results
The illustration of the results of the application of MASAM to the WISP industry follows the model description structure presented in section 5.2. The icons used to represent the actors and issues are respectively illustrated in Figure 4 and Figure 5.
6.4.1 Influence analysis
As a first step of the analysis of the results, it is desirable to analyze the relationships between actors. This can be done by looking at the influence graph (cf. Figure 6), which illustrates the relative power of actors to influence the industry (cf. equation 17) as well as the influence between actors (taking into account the indirect influences as seen in equation 13). Each actor is represented by a horizontal bar, the height of which is proportional to the actor's relative power. Each bar is divided into two main areas: the actor's auto-determination (the brighter surface) and the influences exerted by other actors (the darker surfaces). The length of the different areas is proportional to the relative strength of the influences.
Figure 4: Actors' icons
Figure 5: Issues' icons

24 Journal of Decision Systems. Volume 12 - no 4/2003
In the context of the WISP industry example, Figure 6 suggests that mobile network operators are by far the most important actors, since they cover the largest surface on the graph (thus being both a powerful and influent actor). They also have a sizeable coeffcient of auto-determination and therefore bear little influence from other actors. On the contrary, venues are much less important (little overall clout and power coefficient) and have a smalle r autodetermination. A particular case is the regulator, which is moderately important but, because of its role as a conciliatory actor, has the lowest auto-determination and has relatively low influence on other actors. This graph will also become useful later, when the different actors design their negotiation strategies: for example network operators might exploit their large influence on regulation authorities to change the expected outcome of certain issues.
6.4.2 Issue analysis
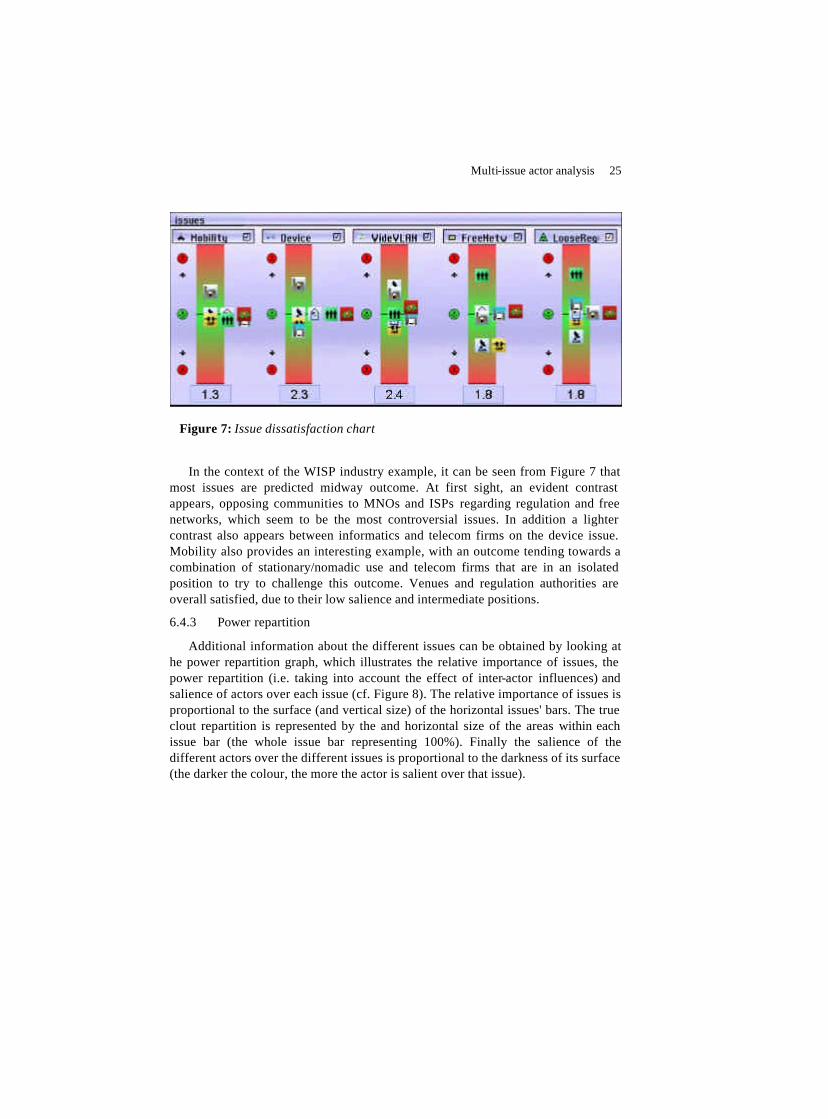
The next logical step is the analysis of issues, which can start by looking at the expected outcomes and dissatisfaction of actors towards these outcomes. For this analysis, MASAM provides the dissatisfaction chart (Figure 7), which shows each issue's expected outcome and represents them as vertical bars. Actors are positioned on these bars according to their dissatisfaction towards the expected outcome: the more dissatisfied they are, the farther they are from the middle. Actors positioned on the bottom part want the issue's outcome to lower, and those on the top want it to increase.
Figure 6: Influence graph
Multi-issue actor analysis 25
In the context of the WISP industry example, it can be seen from Figure 7 that most issues are predicted midway outcome. At first sight, an evident contrast appears, opposing communities to MNOs and ISPs regarding regulation and free networks, which seem to be the most controversial issues. In addition a lighter contrast also appears between informatics and telecom firms on the device issue. Mobility also provides an interesting example, with an outcome tending towards a combination of stationary/nomadic use and telecom firms that are in an isolated position to try to challenge this outcome. Venues and regulation authorities are overall satisfied, due to their low salience and intermediate positions.
6.4.3 Power repartition
Additional information about the different issues can be obtained by looking at he power repartition graph, which illustrates the relative importance of issues, the power repartition (i.e. taking into account the effect of inter-actor influences) and salience of actors over each issue (cf. Figure 8). The relative importance of issues is proportional to the surface (and vertical size) of the horizontal issues' bars. The true clout repartition is represented by the and horizontal size of the areas within each issue bar (the whole issue bar representing 100%). Finally the salience of the different actors over the different issues is proportional to the darkness of its surface (the darker the colour, the more the actor is salient over that issue).
Figure 7: Issue dissatisfaction chart

26 Journal of Decision Systems. Volume 12 - no 4/2003
In the context of the WISP industry example, the power repartition graph suggests that the relatively most important issue is the emergence of free networks, due to the high number of salient actors on this issue. As seen in the dissatisfaction chart above, it is possible to recognize two groups MNOs and ISPs which are against free network emergence on the one side, and communities which are in favour on the other side. The former controls approximately 50% of the clout, compared with nearly 35% of communities. These groups seems to have the possibility to obtain some support from the other players, in particular those which are not much salient: MNOs should be able to easily obtain support from telecom firms, while communities might have an harder time to convince informatics firms.
Other issues almost have the same importance, with device issue being the least important, since it basically concerns only telecom and informatics manufacturers. For this reason, this issue could be an important object of negotiation for players wanting to gain the manufacturers' support. MNOs seem ideally placed to favourably conduct such exchanges, since they have important clout on the device issue: still they seem more inclined to conduct such exchanges with telecom firms, as they have high influence over them and share common positions on many issues.
6.4.4 Alliances
This intuition can be checked by looking at the relative positioning of players taking into account all the different issues. This can be easily done by looking at the proximity map (cf. Figure 9), which illustrates the relative distance of actors based on the alliance coefficient [19] and using a square error minimization algorithm.
Figure 8: Power repartition graph

Multi-issue actor analysis 27
In the context of the WISP industry example, as can be seen in Figure 9, two main dimensions of divergence can be ientified. On the horizontal dimension a neat differenciation between communities (supporting free networks) and commercial providers (supporting commercial network.) can be identified On the vertical dimension, there is a difference related to the mobility usage of WLAN, going from mobile use (favoured by telecom and MNO) to stationary use (favoured by ISP, informatics and communities).
Overall, it is possible to distinguish 3 major groups, which seem to focus on three different possible usages of WLAN technologies. The first group focuses on free networks, and only comprises communities, which are clearly marginalized from the other players although they may get some support from some informatics-related enterprises and venues. The second group focus more on commercial public hotspot networks, and comprises principally mobile network operators and telecom-related firms. The third group mainly focuses on private WLAN and comprises ISPs and informatics-related enterprises. The regulator and veneus are somewhat in the middle of the different groups, which suggests that they could be interesting allies to use as to alter the overall direction of the industry.
6.4.5 An overall interpretation of the results
Based on the previously illustrated graphs, a general interpretation can be obtained by checking several graphs simultaneously, identifying the pertinent questions and getting pertinent answers from the model. Because of space limitations, we will focus our interpretation on the free networks issue, which is the most important and controversial one.
Figure 9: Proximity map

28 Journal of Decision Systems. Volume 12 - no 4/2003
The issue dissatisfaction chart (Figure 7) reveals that the expected outcome is 1.8. The same graph shows that two groups of actors are dissatisfied for opposite reasons. On the one hand ISPs and MNOs attach a lot of importance to paying networks. On the other hand, communities are ready to fight for free networks with great determination. This raises the question: who will win the struggle, ISP's and MNO's, or Communities ?
An answer can be obtained by looking at the other graphs. The power repartition graph (Figure 8) shows that the three diverging actors actually possess most of the power. While the other actors have limited impact, their salience is low, making them interesting partners to negotiate with, as it would be relatively easy to obtain an agreement by making concessions on other issues.
MNO's for example, have a lot of power on the device issue and are not salient on it. It can easily be seen that telecom and informatics firms would by willing to exchange support on free networks against support on the device issue. Still, on that issue, these two actors have opposing point of views and a position change from MNO's will please one of them while dissatisfying even more the other. The choice of the ally can be helped by the proximity map (Figure 9). It is clear that MNO's are nearer to Telecoms than to Informatics. Therefore Telecoms represent a more suitable ally. By granting support to the other actor on these non salient issues, both actors will also strengthen their common front on other issues, like Wide WLAN.
Anticipating this, communities should seek the Informatics' support. They should also find other allies fast, since MNOs, ISPs and telecom are already very powerful. The influence graph (Figure 6) shows that the regulator is mostly controlled by other actors and would therefore make a poor ally. Venues are not very influent, but their support could still be useful for the communities and Informatics coalition. Indeed, it seems to be a possible alliance, since on the proximity map venues are slightly nearer to communities and informatics than they are to MNO's and Telecom.
In conclusion, these analyses suggest that two main coalitions might possibly emerge, the first being composed by MNO's, ISP's and Telecoms, and the second comprising communities, Informatics and Venues. The last actor, the regulator is likely to maintain its conciliation role, trying to equally take into account the interests of the different players when designing its regulation policy. Anyway, the first coalition controls most of the surface of the power repartition graph, and are more likely to shape the industry evolution. The other coalition still has some possibilities to maybe win on a particular issue or two.
7 Conclusions
As illustrated throughout this paper, the MASAM model is actually able of providing the same information as the two previous analysed models, while drawing even more information out of the inputs. Furthermore, the fusion of the two types of
Multi-issue actor analysis 29
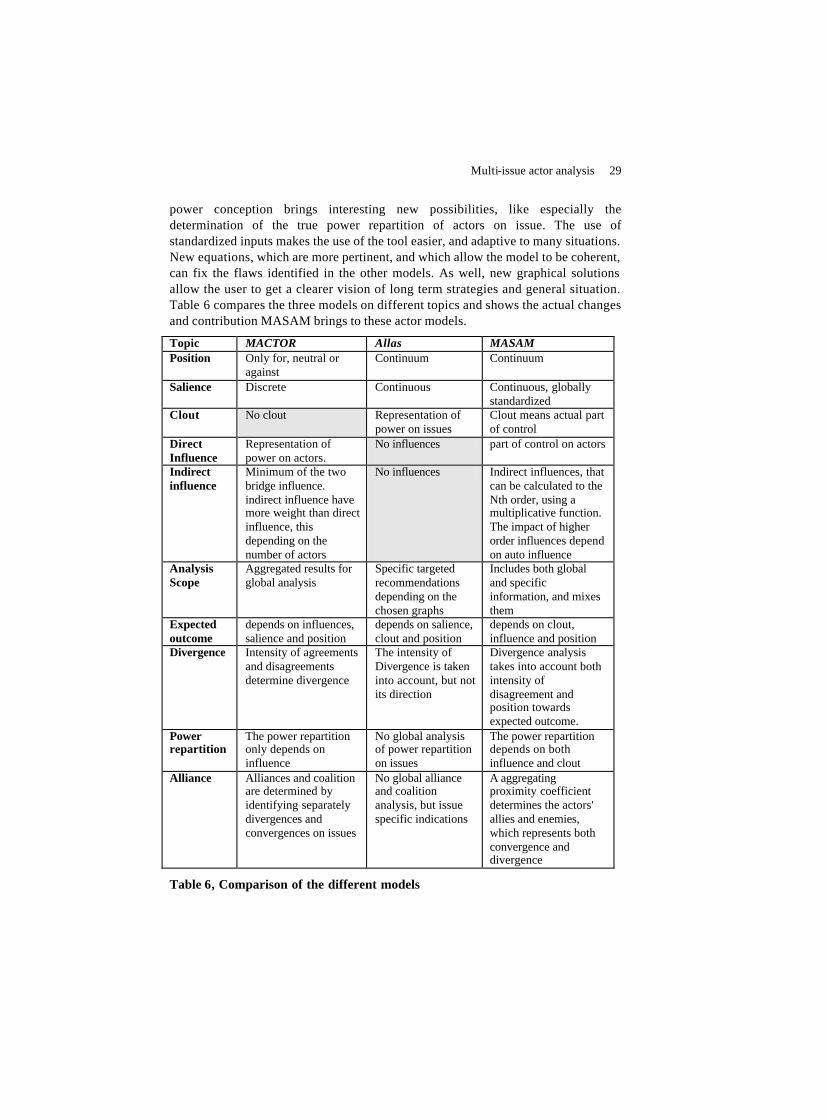
power conception brings interesting new possibilities, like especially the determination of the true power repartition of actors on issue. The use of standardized inputs makes the use of the tool easier, and adaptive to many situations. New equations, which are more pertinent, and which allow the model to be coherent, can fix the flaws identified in the other models. As well, new graphical solutions allow the user to get a clearer vision of long term strategies and general situation. Table 6 compares the three models on different topics and shows the actual changes and contribution MASAM brings to these actor models.
Topic MACTOR Allas MASAM Position Only for, neutral or
against Continuum Continuum
Salience Discrete Continuous Continuous, globally standardized
Clout No clout Representation of power on issues
Clout means actual part of control
Direct Influence
Representation of power on actors.
No influences part of control on actors
Indirect influence
Minimum of the two bridge influence. indirect influence have more weight than direct influence, this depending on the number of actors
No influences Indirect influences, that can be calculated to the Nth order, using a multiplicative function. The impact of higher order influences depend on auto influence
Analysis Scope
Aggregated results for global analysis
Specific targeted recommendations depending on the chosen graphs
Includes both global and specific information, and mixes them
Expected outcome
depends on influences, salience and position
depends on salience, clout and position
depends on clout, influence and position
Divergence Intensity of agreements and disagreements determine divergence
The intensity of Divergence is taken into account, but not its direction
Divergence analysis takes into account both intensity of disagreement and position towards expected outcome.
Power repartition
The power repartition only depends on influence
No global analysis of power repartition on issues
The power repartition depends on both influence and clout
Alliance Alliances and coalition are determined by identifying separately divergences and convergences on issues
No global alliance and coalition analysis, but issue specific indications
A aggregating proximity coefficient determines the actors' allies and enemies, which represents both convergence and divergence
Table 6, Comparison of the different models
30 Journal of Decision Systems. Volume 12 - no 4/2003
This new model, alone, offers only a partial vision of a complex studied problem, and should be integrated with other approaches. Implementing a dynamic element which could show how strategies would change the situation, or integrating other scenario planning methods are but a few possibilities to extend MASAM's capabilities.
8 Acknowledgements
We would like to thank Jean-Sébastien Monzani for the design of the graphical interface he designed for MASAM and we used in this paper.
The work presented in this paper was supported by the National Competence Center in Research on Mobile Information and Communication Systems (NCCR-MICS), a center supported by the Swiss National Science Foundation under grant number 5005-67322.
9 Bibliography
Aarnio, A., Enkeberg, A., Heikkilä, J., and Hirvola, S., "Scenarios for mobile commerce in 2006," European Fifth Framework Project IST-1999-21000, Research report 2002.
Allas, T. and Georgiades, N., New tools for negociators, in McKinsey Quarterly, vol. 2, 2001, pp. 86-97.
Amblard, F. "Modèles multi-agents pour la décision collective" Thèse DEA, Université de MOntpellier, 1999, pp. 76.
Arcade, J., Godet, M., Meunier, F., and Roubelat, F., Structural analysis with the MICMAC method & Actor's strategy with MACTOR method. CNAM, 1999, pp. 70.
Bendahan, S., "Multi-issue actor strategic analysis models," BS Thesis, Inforge, 2002.
Bueno de Mesquita, B., "Political forecasting: an expected utility method," in European Community decision making models, applications and comparisons. New Haven: Yale University Press, 1994, pp. 71-104.
Camponovo, G., Heitmann, M., Stanoevska, K., and Pigneur, Y., Exploring the WISP industry - Swiss Case Study, presented at 16th Bled eCommerce Conference, Bled, 2003.
Courtney, H., Kirkland, J., and Viguerie, P., Strategy under uncertainty, in McKnsey Quarterly, vol. December 2001, 2001, pp. 5-14.
Dyson, R. G., Strategic Planning: Models and analytical techniques. Chichester: Wiley, 1990.
Godet, M., The crisis in forecasting and the emergence of the "prospective" approach with case studies in energy and air transport . New York: Pergamon Press, 1979.

Multi-issue actor analysis 31
Godet, M., Manuel de prospective stratégique, vol. 2, 2nd ed. Paris: Dunod, 2001. Herslow, L., Navarro, C.-J., and Scholander, J., "Exploring the WISP industry -
Analysing strategies for Wireless Internet Service Providers," Master thesis, 2002.
Laurent, W., Geraci, M., Swanepoel, I., Lakin, E., Perea, C., Robilliard, M., Holden, J., and Garcia, D., "Wireless LAN: Friend or Foe ?," Banc of America Securities 2002.
Lehr, W. and McKnight, L., Wireless Internet Access: 3G vs. WiFi ? , Telecommunication Policy, pp. 351-370, 2002.
Porter, M. E., Competitive strategy : techniques for analyzing industries and competitors. New York: The Free Press, 1980.
Stockman, F. and Van Oosten, R., "The Exchange of Voting Positions: an Object-Oriented Model of Policy Networks," in European Community decision making models, applications and comparisons: Yale University Press, 1994, pp. 105-128.