Embed Size (px)
Citation preview

arX
iv:m
trl-
th/9
6070
05v1
10
Jul 1
996
Submitted to Phys. Rev. B
The GaAs Equilibrium Crystal Shape from First-Principles
N. Moll∗, A. Kley, E. Pehlke, and M. SchefflerFritz-Haber-Institut der Max-Planck-Gesellschaft, Faradayweg 4-6, D-14195 Berlin-Dahlem, Germany
(February 8, 2008)
Surface energies for different GaAs surface orientations havebeen calculated as a function of the chemical potential. Weuse an energy density formalism within the first-principlespseudopotential density-functional approach. The equilib-rium crystal shape (ECS) has been derived from the surfaceenergies for the (110), (100), (111), and (111) orientations.Under As-rich conditions all four considered surface orienta-tions exist in thermodynamic equilibrium, in agreement withexperimental observations. Moreover, our calculations allowus to decide on previous contradictory theoretical values forthe surface energies of the (111) and (111) facets.
I. INTRODUCTION
The equilibrium crystal shape (ECS) is that shapewhich, in the limit of infinitely large volume, yields theminimum free energy of a crystal. For a given arbitrarysurface orientation and unit cell the atomic reconstruc-tion that yields the lowest surface free energy can bedetermined. However, it is well known that in generalthis will not result in a thermodynamically stable situ-ation, because the surface can further lower its energyby faceting on a macroscopic scale. The ECS provides aset of surface orientations that exist in thermodynamicequilibrium. Except for some situations with degeneratesurface energies surfaces of any other orientations willfacet.
The faceting of GaAs surfaces has been studied experi-mentally. Whereas Weiss et al.1 studied the different sur-face orientations exposed on a round shaped crystal withlow-energy electron-diffraction (LEED), Notzel et al.2 in-vestigated various planar high-index surfaces with re-flection high-energy electron-diffraction (RHEED). Bothgroups observed for different high-index surface orien-tations faceting into low-index surfaces. Moreover, sur-face energies play a major role in the formation of is-lands during heteroepitaxy. For example, InAs grows onGaAs in the Stranski-Krastanov mode.3 The surface en-ergy of InAs being lower than that of GaAs, first a uni-form wetting-layer forms. During further deposition ofInAs three-dimensional islands are formed due to strainrelaxation. Recently, these quantum dots have attractedgreat interest.3,4,5,6 Besides other quantities like the elas-tic relaxation energy of the islands, the absolute InAssurface energies of the involved facets which we assumeto be similar to those of GaAs enter into the theory ofthe shape and size of the islands.
Both experimental as well as calculated absolute val-ues of the surface energy as a function of orientationare quite scarce. The surface energy has been measuredfor the GaAs (110) surface in a fracture experiment.7
Relative surface energies and the ECS of Si have beendetermined8,9, but to our knowledge no such measure-ments have been carried through for GaAs. Moreover,it is often difficult to establish whether an observed sur-face really represents thermodynamic equilibrium. Atlow temperatures faceting and therefore thermodynamicequilibration may be hindered by insufficient materialtransport. At high temperatures, kinetics may governthe surface morphologies due to evaporation.
The purpose of this work is to present the absolute val-ues for the surface energy of the GaAs (110), (100), (111),and (111) surfaces calculated from first principles, andthe ECS constructed from these data. Empirical poten-tials do not produce reliable surface properties. Ab initio
calculations have been carried out by various groups fordifferent surface orientations of GaAs. Qian et al.10 usedan ab initio pseudopotential method to calculate the ab-solute surface energy of the GaAs (110) surface. Theyfound very good agreement with the experimental cleav-age energy. Northrup and Froyen11, Qian et al.12, andOhno13 determined the (100) reconstruction with low-est energy. The absolute surface energies for these re-constructions were not given, however. Kaxiras et al.14
calculated energies for GaAs (111) reconstructions rela-tive to the surface energy of the ideal (111) surface. Forthe (111) surface Kaxiras et al.15 and Northrup et al.16
calculated relative surface energies for different (2 × 2)reconstructions. Based on their results they predictedthe (111) equilibrium reconstruction.
However, for geometrical reasons it is impossible toderive absolute surface energies for the (111) and (111)

orientations of GaAs from such total-energy calculations.Chetty and Martin17,18 solved this problem by introduc-ing an energy density, which enables the computation ofthe energies of the top and the bottom surfaces of theslab separately. Having calculated the absolute surfaceenergies for the ideal reference surfaces they transformedthe relative surface energies of Kaxiras et al.14,15 andNorthrup et al.16 to absolute surface energies. A com-parison of these absolute values, however, shows that thetwo results differ significantly. This difference is not yetunderstood, and we will come back to it in Section IVbelow.
We have calculated absolute surface energies for thedifferent orientations directly (i.e., without introducing areference surface) and consistently with one and the sameset of parameters and pseudo-potentials. Before we willdetail our results and the ECS of GaAs in Section IV,we will first give an overview of GaAs surface propertiesin Section II and describe the computational details inSection III.
II. CHEMICAL POTENTIAL AND SURFACERECONSTRUCTION
The stable surface reconstruction is the one with thelowest surface free energy. In our case the substrateconsists of two elements and thus the difference of thenumber of atoms of the two species enters as anotherdegree of freedom in addition to the atomic geometry.Non-stoichiometric surfaces are considered by allowingthe surface to exchange atoms with a reservoir, which ischaracterized by a chemical potential. The equilibriumis determined by the minimum of the free energy
γsurfaceA = Esurface −∑
i
µiNi. (1)
The surface free energy γsurfaceA of the surface area Ahas been calculated for zero temperature and pressureand neglecting zero point vibrations. The chemical po-tential µi is the free energy per particle in the reservoirfor the species i, and Ni denotes the number of particlesof the species i. The temperature dependence is ignoredbecause the contributions tend to cancel for free energydifferences.
In experiment the value of the chemical potential canbe varied over a certain interval. This interval is lim-ited by the bulk chemical potentials of the condensedphases of Ga and As12,16, corresponding to the two fol-lowing situations: On the one hand the surface can be inequilibrium with excess Ga-metal, which has the chemi-cal potential µGa(bulk), and the GaAs bulk with chemicalpotential µGaAs. On the other hand the surface can bein equilibrium with bulk As and, again, the GaAs bulk.Both reservoirs can act as sinks and sources of surfaceatoms. The upper limit of each chemical potential is
determined by the condensed phase of the respective el-ement,
µi < µi(bulk), (2)
because otherwise the elemental phase would form on theGaAs surface. Furthermore, in thermodynamic equilib-rium the sum of chemical potentials of Ga and As mustbe equal to the bulk energy per GaAs pair,
µGa + µAs = µGaAs
= µGa(bulk) + µAs(bulk) − ∆Hf . (3)
For the heat of formation we have calculated a value of0.64 eV using a plane-wave cutoff of 10 Ry which is ingood agreement with the experimental value19 of 0.74 eV.For the bulk calculations we computed the bulk energy ofGa in an orthorhombic structure12 and the bulk energyof As in a trigonal structure20.
In this work we give the surface energies in dependenceof the As chemical potential. Therefore, we write equa-tions (2) and (3) in the following form
µAs(bulk) − ∆Hf < µAs < µAs(bulk). (4)
The surface energy is calculated from the total energyEtot,
γsurfaceA = Etot − µGaAsNGa − µAs(NAs − NGa). (5)
The stoichiometry of the surface, ∆N = NAs − NGa, de-termines the slope of the surface energy versus the chem-ical potential. A consistent counting method for ∆N hasto be applied to all orientations. We apply the methodof Chetty and Martin21 which utilizes the bulk symme-tries of the crystal. For example, following their countingmethod the ideal (110) cleavage surface is stoichiometric,i.e. the difference ∆N is equal to zero. Thus the surfaceenergy of the (110) cleavage surface is independent of thechemical potential.
When the chemical potential is varied, different recon-structions with different surface stoichiometries becomethermodynamically stable. All experimentally observedreconstructions, however, fulfill certain conditions. Firstof all, GaAs surfaces favor to be semiconducting, as thisleads to a low surface energy. Surface bands in the bulkgap and especially surface bands crossing the Fermi-levelwill lead to a higher surface energy. The electron count-ing model22,23 gives a simple criterion whether a surfacecan be semiconducting or not. In the bulk the sp3 hy-bridized orbitals of GaAs form bonding and antibondingstates. At the surface there are partially filled danglingbonds. Their energies are shown schematically in Fig. 1,they are estimated from the atomic s and p eigenener-gies of either species. Compared to the dispersion of theconduction and the valence bands, the dangling bond en-ergy of the cation (Ga) falls into the conduction band andtherefore it should be empty. The dangling bond energyof the anion (As) lies in the valence band and therefore
2

−25
−20
−15
−10
−5
0E
nerg
y (e
V)
εpGa
εsGa
εsAs
εpAs
εhGa
εhAs
Conduction
Gap
Valence
FIG. 1. The energy levels of the s and p orbitals ǫs,p, ofthe sp
3 dangling-bonds ǫh, and of the conduction and valenceband. The data are from Harrison.22
it should be filled. Thus there has to occur an electrontransfer from the Ga to the As dangling bonds. For alow-energy semiconducting surface the dangling bondsin the conduction band have to be empty, exactly fillingall the dangling bonds in the valence band. Otherwisethe surface becomes metallic and has a higher surfaceenergy. Ga and As surface atoms are added to, or re-moved from, the ideal bulk-truncated polar surfaces toobtain a low-energy semiconducting surface.
Secondly, the electron transfer from the Ga danglingbonds to the As dangling bonds has consequences forthe geometry of the surface reconstructions. The surfaceGa atom which has lost an electron favors a sp2 like hy-bridization. Therefore the Ga atom relaxes inwards andforms a more planar configuration. The dangling bondof arsenic is completely filled and the As atom prefersto form bonds with its three p orbitals. Therefore thebond angle of the surface As atom is close to 90◦, andthe As atom relaxes outwards. These configurations re-semble the bond geometry of small molecules like GaH3
and AsH3 and are a general result for surfaces of III-Vsemiconductors.24
III. COMPUTATIONAL DETAILS
To determine the surface energies we carried out total-energy calculations using density-functional theory.25,26
We applied the local-density approximation to theexchange-correlation functional, choosing the parame-terization by Perdew and Zunger27 of Ceperley andAlder’s28 data for the correlation energy of the homo-geneous electron gas. The surfaces were described byperiodically repeated slabs. All computations were donewith an extended version of the computer code fhi93cp.29
The program employs ab initio pseudopotentials and aplane-wave basis-set. It was generalized to addition-ally compute the energy density according to Chetty andMartin.17
The slab geometry leads to serious problems when sur-face energies of zinc-blende structures are to be calcu-lated for arbitrary orientations. To derive the surfaceenergy from a total energy calculation both surfaces ofthe slab have to be equivalent. Though such slabs can beconstructed for the (110) and the (100) orientation, thisis impossible for the (111) orientation: The (111) andthe (111) surfaces of GaAs are inequivalent. This followsfrom the simple geometric property of the zinc-blendestructure that the Ga-As double layers are Ga and Asterminated on the top and bottom side of the slab, re-spectively. Chetty and Martin17 solved this problem byintroducing an energy density. The energy density itself,however, does not bear any physical significance, only theintegrals of the energy density over suitable parts of thesupercell (e.g., volumes bounded by bulk mirror planes)lead to well-defined, physically meaningful energies.17 Wehave checked the accuracy of this approach for our GaAsslabs: Variation of the surface reconstruction on the bot-tom side of the (100) and (111) slabs results in a negli-gible change of the surface energy of the surface on thetop (< 0.7 meV/A2).
Ab initio norm-conserving pseudopotentials were gen-erated with Hamann’s scheme.30 The cutoff radii forpseudoization have been chosen equal to 0.58 A, 0.77 A,and 1.16 A for the s, p, and d wave-functions of Ga,and equal to 0.61 A, 0.60 A, and 1.07 A for s, p, andd wave-functions of As. The semi-local pseudopotentialswere further transformed into fully separable Kleinman-Bylander pseudopotentials31, with the d potential cho-sen as the local potential. The logarithmic derivatives ofthe different potentials were examined and various trans-ferability tests32, e.g. “hardness” tests, were performed.All together the potentials showed good transferability.The structures of the bulk phases of Ga and As are welldescribed by these potentials, the theoretical lattice con-stants being only slightly smaller than the experimentalones with a relative deviation below 3.5%.
The wave functions were expanded into plane waves33
with a kinetic energy up to 10 Ry. This leads to a conver-gence error in the surface energies of less than 3 meV/A2.The electron density was calculated from special k-pointsets34, their density in reciprocal space being equivalentto 64 k-points in the whole (100) (1×1) surface Brillouin-zone.
For the (100), (111), and (111) surfaces “pseudo-hydrogen” was used to saturate the bottom surfacesof the slabs.35 Pseudo-hydrogen denotes a Coulomb-potential with a non-integer core-charge Z, together withZ electrons. The Ga and As atoms of these surfaceswere fixed at their ideal bulk positions. The Ga termi-nated surface was saturated with pseudo-hydrogen withan atomic number of Z = 1.25. On each dangling bondof a Ga surface atom one pseudo-hydrogen was placed.
3
Similarly, the As terminated surface was saturated withpseudo-hydrogen with an atomic number of 0.75. Thesaturated surfaces are semiconducting without any sur-face states in the bulk band-gap. There are two mainadvantages using this pseudo-hydrogen. First of all, theinteraction of both surfaces with each other is in thisway minimal. Secondly, the surface atoms which are sat-urated with the pseudo-hydrogen can be kept fixed atideal bulk positions. Thus thinner slabs can be used andcharge sloshing is suppressed.
For polar surfaces, such as the ideal (111) surface, a dif-ficulty arises due to charge transfer from one side of theslab to the opposite side. This charge transfer is hinderedby a semiconducting surface, e.g. the pseudo-hydrogensaturated surface at the bottom of the slab. We esti-mate the uncertainty due to charge transfer to be smallerthan 1.4 meV/A2 for a polar surface, comparing the sur-face energies of the pseudo-hydrogen saturated surfacederived from two calculations. One is carried throughwith a semiconducting surface on the top of the slab, theother one with a metallic surface.
We have carried out computations for a large vari-ety of reconstructions of the GaAs (110), (100), (111),and (111) surfaces, which have previously been suggestedin literature. Starting from some initial geometry, theatom positions in the topmost layers of the slab were re-laxed until the forces on the atoms were smaller than 50meV/A. The other layers were kept fixed at their idealbulk positions with a bulk lattice-constant of 5.56 Awhichhad been determined theoretically at the same cutoff en-ergy as the slab calculations and using 384 k-points inthe whole Brillouin-zone. This value is 1.4% smaller thanthe experimental lattice constant36 neglecting zero pointvibrations.
IV. RESULTS AND DISCUSSION
A. (110) Surface
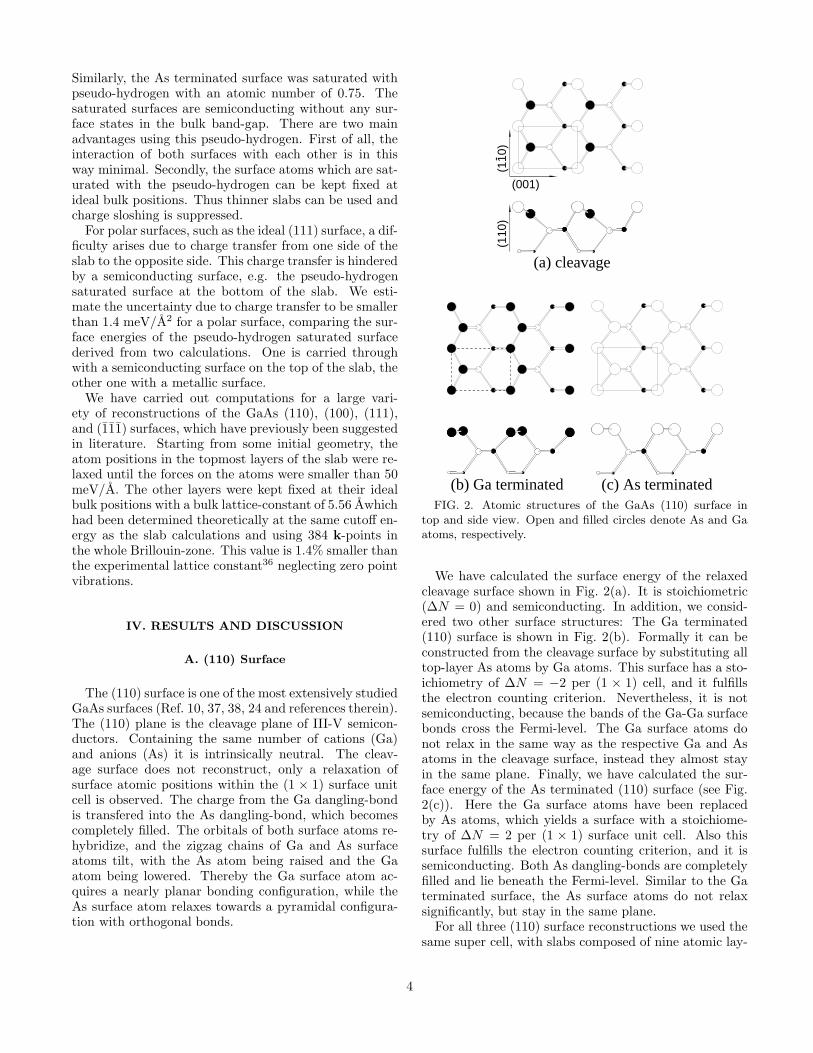
The (110) surface is one of the most extensively studiedGaAs surfaces (Ref. 10, 37, 38, 24 and references therein).The (110) plane is the cleavage plane of III-V semicon-ductors. Containing the same number of cations (Ga)and anions (As) it is intrinsically neutral. The cleav-age surface does not reconstruct, only a relaxation ofsurface atomic positions within the (1 × 1) surface unitcell is observed. The charge from the Ga dangling-bondis transfered into the As dangling-bond, which becomescompletely filled. The orbitals of both surface atoms re-hybridize, and the zigzag chains of Ga and As surfaceatoms tilt, with the As atom being raised and the Gaatom being lowered. Thereby the Ga surface atom ac-quires a nearly planar bonding configuration, while theAs surface atom relaxes towards a pyramidal configura-tion with orthogonal bonds.
(001)
(110
)-
(110
)
(a) cleavage
(b) Ga terminated (c) As terminatedFIG. 2. Atomic structures of the GaAs (110) surface in
top and side view. Open and filled circles denote As and Gaatoms, respectively.
We have calculated the surface energy of the relaxedcleavage surface shown in Fig. 2(a). It is stoichiometric(∆N = 0) and semiconducting. In addition, we consid-ered two other surface structures: The Ga terminated(110) surface is shown in Fig. 2(b). Formally it can beconstructed from the cleavage surface by substituting alltop-layer As atoms by Ga atoms. This surface has a sto-ichiometry of ∆N = −2 per (1 × 1) cell, and it fulfillsthe electron counting criterion. Nevertheless, it is notsemiconducting, because the bands of the Ga-Ga surfacebonds cross the Fermi-level. The Ga surface atoms donot relax in the same way as the respective Ga and Asatoms in the cleavage surface, instead they almost stayin the same plane. Finally, we have calculated the sur-face energy of the As terminated (110) surface (see Fig.2(c)). Here the Ga surface atoms have been replacedby As atoms, which yields a surface with a stoichiome-try of ∆N = 2 per (1 × 1) surface unit cell. Also thissurface fulfills the electron counting criterion, and it issemiconducting. Both As dangling-bonds are completelyfilled and lie beneath the Fermi-level. Similar to the Gaterminated surface, the As surface atoms do not relaxsignificantly, but stay in the same plane.
For all three (110) surface reconstructions we used thesame super cell, with slabs composed of nine atomic lay-
4
−0.6 −0.4 −0.2 0.0µAs−µAs(bulk) (eV)
40
50
60
70
80
90
100γ su
rfac
e (m
eV/Å
2 ) Ga terminated
cleavage
As terminated
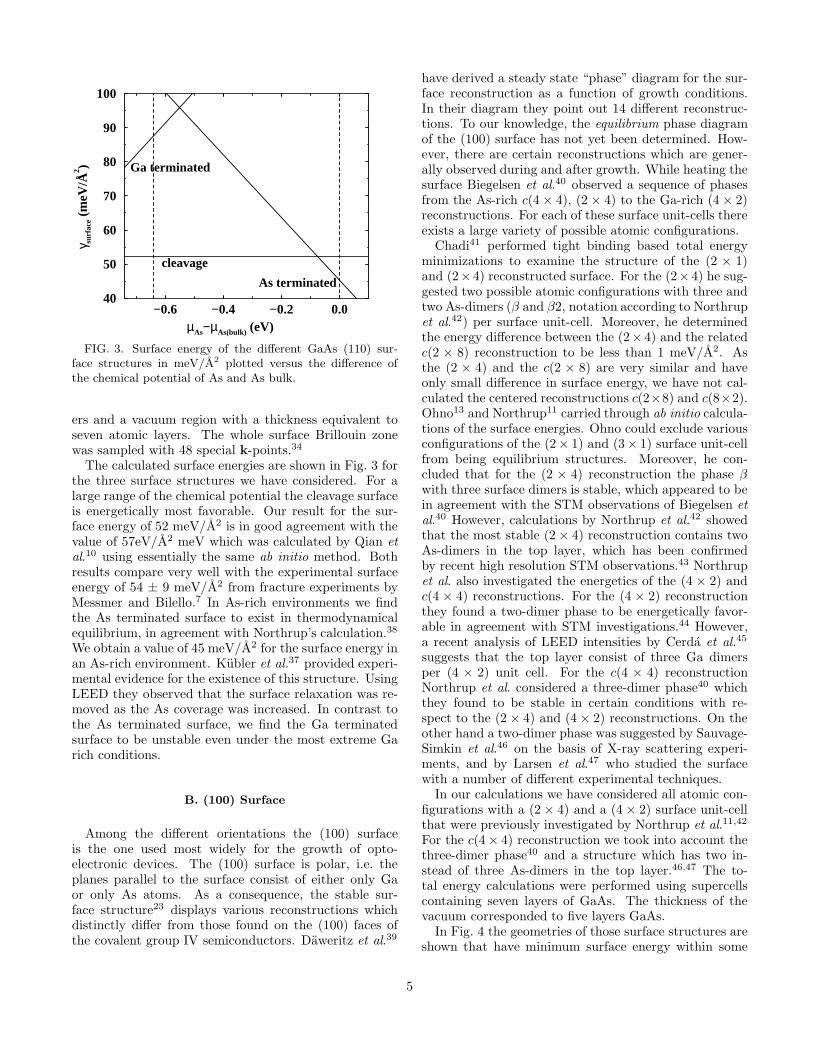
FIG. 3. Surface energy of the different GaAs (110) sur-face structures in meV/A2 plotted versus the difference ofthe chemical potential of As and As bulk.
ers and a vacuum region with a thickness equivalent toseven atomic layers. The whole surface Brillouin zonewas sampled with 48 special k-points.34
The calculated surface energies are shown in Fig. 3 forthe three surface structures we have considered. For alarge range of the chemical potential the cleavage surfaceis energetically most favorable. Our result for the sur-face energy of 52 meV/A2 is in good agreement with thevalue of 57eV/A2 meV which was calculated by Qian etal.10 using essentially the same ab initio method. Bothresults compare very well with the experimental surfaceenergy of 54 ± 9 meV/A2 from fracture experiments byMessmer and Bilello.7 In As-rich environments we findthe As terminated surface to exist in thermodynamicalequilibrium, in agreement with Northrup’s calculation.38
We obtain a value of 45 meV/A2 for the surface energy inan As-rich environment. Kubler et al.37 provided experi-mental evidence for the existence of this structure. UsingLEED they observed that the surface relaxation was re-moved as the As coverage was increased. In contrast tothe As terminated surface, we find the Ga terminatedsurface to be unstable even under the most extreme Garich conditions.
B. (100) Surface
Among the different orientations the (100) surfaceis the one used most widely for the growth of opto-electronic devices. The (100) surface is polar, i.e. theplanes parallel to the surface consist of either only Gaor only As atoms. As a consequence, the stable sur-face structure23 displays various reconstructions whichdistinctly differ from those found on the (100) faces ofthe covalent group IV semiconductors. Daweritz et al.39
have derived a steady state “phase” diagram for the sur-face reconstruction as a function of growth conditions.In their diagram they point out 14 different reconstruc-tions. To our knowledge, the equilibrium phase diagramof the (100) surface has not yet been determined. How-ever, there are certain reconstructions which are gener-ally observed during and after growth. While heating thesurface Biegelsen et al.40 observed a sequence of phasesfrom the As-rich c(4 × 4), (2 × 4) to the Ga-rich (4 × 2)reconstructions. For each of these surface unit-cells thereexists a large variety of possible atomic configurations.
Chadi41 performed tight binding based total energyminimizations to examine the structure of the (2 × 1)and (2×4) reconstructed surface. For the (2×4) he sug-gested two possible atomic configurations with three andtwo As-dimers (β and β2, notation according to Northrupet al.42) per surface unit-cell. Moreover, he determinedthe energy difference between the (2× 4) and the relatedc(2 × 8) reconstruction to be less than 1 meV/A2. Asthe (2 × 4) and the c(2 × 8) are very similar and haveonly small difference in surface energy, we have not cal-culated the centered reconstructions c(2×8) and c(8×2).Ohno13 and Northrup11 carried through ab initio calcula-tions of the surface energies. Ohno could exclude variousconfigurations of the (2× 1) and (3× 1) surface unit-cellfrom being equilibrium structures. Moreover, he con-cluded that for the (2 × 4) reconstruction the phase βwith three surface dimers is stable, which appeared to bein agreement with the STM observations of Biegelsen et
al.40 However, calculations by Northrup et al.42 showedthat the most stable (2 × 4) reconstruction contains twoAs-dimers in the top layer, which has been confirmedby recent high resolution STM observations.43 Northrupet al. also investigated the energetics of the (4 × 2) andc(4 × 4) reconstructions. For the (4 × 2) reconstructionthey found a two-dimer phase to be energetically favor-able in agreement with STM investigations.44 However,a recent analysis of LEED intensities by Cerda et al.45
suggests that the top layer consist of three Ga dimersper (4 × 2) unit cell. For the c(4 × 4) reconstructionNorthrup et al. considered a three-dimer phase40 whichthey found to be stable in certain conditions with re-spect to the (2 × 4) and (4 × 2) reconstructions. On theother hand a two-dimer phase was suggested by Sauvage-Simkin et al.46 on the basis of X-ray scattering experi-ments, and by Larsen et al.47 who studied the surfacewith a number of different experimental techniques.
In our calculations we have considered all atomic con-figurations with a (2 × 4) and a (4 × 2) surface unit-cellthat were previously investigated by Northrup et al.11,42
For the c(4 × 4) reconstruction we took into account thethree-dimer phase40 and a structure which has two in-stead of three As-dimers in the top layer.46,47 The to-tal energy calculations were performed using supercellscontaining seven layers of GaAs. The thickness of thevacuum corresponded to five layers GaAs.
In Fig. 4 the geometries of those surface structures areshown that have minimum surface energy within some
5

(110)
(110
)-
(100
)
(a) α(2x4) (b) β2(2x4)
(c) c(4x4)
(110)-
(110
)(1
00)
(d) β2(4x2)FIG. 4. Atomic structures of the GaAs (100) reconstruc-
tions.
range of the chemical potential and therefore exist inthermodynamic equilibrium. All four structures fulfillthe electron counting criterion and are semiconducting,i.e., the anion dangling bonds are filled and the cationdangling bonds are empty. Furthermore the surfaces dis-play Ga-Ga bonds and As-As bonds, both having filledbonding and empty antibonding states. The α(2× 4) re-construction (Fig. 4(a)) is stoichiometric (∆N = 0). Inthe top layer four As atoms are missing per (2 × 4) cell.The surface As atoms form two dimers. The Ga-layer un-derneath is complete, but differs from the bulk geometryby two Ga-Ga bonds which are formed between the Gaatoms in the region of the missing As dimers. Removingthe Ga atoms in the missing dimer region one obtainsthe β2(2 × 4) structure in Fig. 4(b) with a stoichiome-try of ∆N = 1
4 per (1 × 1) unit cell. The completelyAs-terminated c(4 × 4) surface shown in Fig. 4(c) has astoichiometry of ∆N = 5
4 per (1×1) unit cell. It consistsof three As-dimers which are bonded to a complete As-layer beneath. The β2(4×2) structure shown in Fig. 4(d)represents the Ga-terminated counterpart of the β2(2×4)reconstruction, with Ga atoms exchanged for As atomsand vice versa. Thus the top layer consists of two Gadimers per (4×2) cell, and the second layer lacks two Asatoms. This results in a stoichiometry of ∆N = − 1
4 per(1 × 1) cell.
Our calculated surface energies of these four phasesare shown in Fig. 5 as a function of the chemical poten-tial. We predict the same sequence of equilibrium surface
−0.6 −0.4 −0.2 0.0µAs−µAs(bulk) (eV)
40
50
60
70
80
90
100
γ surf
ace (
meV
/Å2 )
β2(4x2) α(2x4)
β2(2x4)
c(4x4)
FIG. 5. Surface energy of the different GaAs (100) recon-structions in meV/A2 plotted versus the difference of thechemical potential of As and As bulk.
structures as Northrup and Froyen11,42 as a function ofincreasing As coverage: β2(4×2), α(2×4), β2(2×4), andc(4×4). The c(4 × 4) structure with only two surfaceAs-dimers per unit cell, which we considered in additionto the structures investigated by Northrup and Froyen,turned out to be unstable. Though this structure is moreGa-rich than the c(4×4) three As-dimer structure shownin Fig. 4(c), even in the Ga-rich environment the two-dimer phase has a surface energy which is 5 meV/A2
higher than for the three-dimer phase. Due to the lackof absolute values in previous calculations, quantitativelywe can only compare energy differences between surfaceswith the same stoichiometry. Further comparison is madedifficult by the different range of the chemical potential inour versus Northrup and Froyen’s calculation11,42: Theirvalue for the heat of formation is ∆Hf = 0.92 eV, as op-posed to our smaller value of ∆Hf = 0.64 eV. Compar-ing the three dimer phase β with the two dimer phase β2,which both have the same stoichiometry, we find that thetwo dimer phase has a surface energy lower by 2 meV/A2.This agrees with the result of Northrup and Froyen whoreport an energy difference of 3 meV/A2, and it furtherconfirms the conclusion that the three dimer phase β doesnot exist in equilibrium. On the whole, the agreementwith the relative surface energies calculated by Northrupet al. is good. They can be converted to absolute surfaceenergies by shifting them by ≈ 65 meV/A2, which resultsin a diagram similar to Fig. 5.
All investigated (100) surfaces display similar atomicrelaxations which are characterized by the creation ofdimers and the rehybridization of threefold coordinatedsurface atoms. The creation of surface dimers decreasesthe number of partially occupied dangling bonds, and byrehybridization the surface gains band structure energy.The calculated bond lengths in bulk Ga and As, 2.32 A
6

and 2.50 A, respectively, can serve as a first estimate forthe respective dimer bond lengths on the GaAs surface.Our calculations yield As-dimer lengths between 2.45 and2.50 A for the α and β2 surface reconstruction. This iswithin the range of experimentally deduced values whichscatter between 2.2 and 2.9 A48,49,50 and it is similar tothe dimer lengths of 2.53 and 2.55 A which were deter-mined by Northrup et al.51 On the c(4×4) reconstructedsurface the calculated As-dimer lengths are 2.57 A forthe central dimer and 2.53 A for the two outer dimersof the three-dimer strings in the surface unit-cell. Us-ing X-ray scattering Sauvage-Simkin et al.46 determinedthese bond-lengths as 2.63 ± 0.06 A and 2.59 ± 0.06 A.Very recently Xu et al.52 suggested that the dimers onthe c(4×4) structure should be tilted by 4.3◦. However,as for the (2×4) reconstructions we find the dimers to beparallel to the surface, in agreement with several previ-ous experiments40,46. Even when starting with an initialconfiguration with surface dimers tilted by 8◦ we findthe dimers to relax back to the symmetric positions witha residual tilt angle less than 0.1◦. The Ga-Ga dimerbond length is calculated to be 2.4 A on the β2(4 × 2)reconstruction and 2.5 A on the α(2×4) structure whichagrees with previous ab initio calculations.51 From a re-cent LEED investigation of the Ga rich (100) surfaceCerda et al.45 deduced that the stable (4 × 2) recon-structed surface displays three Ga-dimers per unit cellwith unusual dimer lengths of 2.13 A and 3.45 A. In ourcalculation, however, this three dimer phase is energet-ically slightly less favorable than the two dimer phaseβ2(4 × 2) by 0.8 meV/A2. Therefore, it should not bestable at least at low temperatures. Furthermore, wefound the Ga dimer length to be 2.4 A and no local min-imum for Cerda’s unusually large dimer length.
The rehybridization of the sp3 orbitals located at thethreefold coordinated Ga-atoms drives the relaxation to-wards a preferentially flat Ga-bond configuration. Onthe Ga terminated β2(4× 2) structure this leads to a de-creased spacing between the Ga top layer and the neigh-boring As layer which amounts to roughly half of the bulkinterlayer spacing. Also on the α(2×4) and β2(2×4) sur-faces the threefold coordinated Ga atoms which bond toAs relax towards the plane of their neighboring As atoms.Together with a slight upward shift of the top layer Asatoms this leads to a steepening13 of the As dimer block.The change of the angle between the bonds of the three-fold coordinated As atoms is less pronounced. However,the trend is obvious: except for the c(4 × 4) structure,we find the As bond-angles to be always smaller than109.5◦, which is the angle of the ideal tetrahedral co-ordination. The As bonds on the c(4 × 4) surface be-have differently from those on the other three surfacesbecause the top-layer As atoms are bonded to a secondlayer which consist of As instead of Ga. A decrease of theangle between the bonds of all threefold coordinated Asatoms would require a change in the As-As bond lengths,which probably costs more energy than would be gainedfrom rehybridization.
(112)-
(110
)-
(111
)
(a) ideal (b) As adatom
(c) As trimer (d) Ga vacancyFIG. 6. Atomic structures of the GaAs (111) reconstruc-
tions.
C. (111) Surface
The polar (111) orientation of GaAs has been studiedwithin density-functional theory by Kaxiras et al.53,54,14,who computed surface energies relative to the ideal unre-constructed surface for various atomic geometries. Theyfound that under As-rich conditions an As trimer ge-ometry yields the lowest surface energy, whereas a Gavacancy reconstruction is preferred under Ga-rich condi-tions. Haberern and Pashley55 and Thornton et al.56
confirmed this experimentally. Haberern and Pashleyinterpreted their STM images to show an array of Gavacancies with a (2×2) periodicity. Thornton et al. ob-served both the As triangle model and the Ga vacancymodel in STM. Here we concentrate on the following re-constructions of the Ga terminated (111) surface: the Asadatom, the As trimer, the Ga vacancy model, and, forcomparison but not as a reference system as in previouswork, the truncated-bulk geometry.
The ideal (111) surface (see Fig. 6(a)) has a stoichiom-etry ∆N = − 1
4/(1 × 1). It does not fulfill the electroncounting criterion. Each Ga dangling-bond is filled with3/4 of an electron and therefore the ideal surface has tobe metallic. To create a neutral semiconducting surface,following the electron counting criterion one can either
7

−0.6 −0.4 −0.2 0.0µAs−µAs(bulk) (eV)
40
50
60
70
80
90
100γ su
rfac
e (m
eV/Å
2 )
Ga VacancyAs trimer
As adatom
ideal
FIG. 7. Surface energy of the different GaAs (111) recon-structions in meV/A2 plotted versus the difference of thechemical potential of As and As bulk.
add an As surface atom to, or remove a Ga surface atomfrom, every (2×2) surface unit cell. Therefore we considerthree different (2×2) reconstructions. First of all, the Asadatom model is shown in Fig. 6(b). This reconstructionis stoichiometric. The As adatom binds to the Ga surfaceatoms. It exhibits a nearly orthogonal bond configura-tion, while the Ga atom with the empty dangling bondrelaxes towards the plane of the As atoms. Secondly, weconsider the As trimer model shown in Fig. 6(c). Thismodel has a stoichiometry ∆N = 1
2/(1×1), it also fulfillsthe electron counting criterion and it is semiconducting.The three extra As atoms form a trimer with each Asatom binding to one Ga atom. The dangling-bonds ofthe As atoms are completely filled and the dangling-bondof the the Ga atom which is not bonded to As trimeratoms is completely empty. This Ga atom relaxes intothe plane of the As atoms of the layer below. Finally,we calculated the Ga vacancy model (see Fig. 6(d)). Theremoval of one Ga surface atom causes the surface to bestoichiometric. The Ga surface atoms have completelyempty dangling-bonds and relax into the plane of theAs atoms. The three As atoms surrounding the vacancyhave completely filled dangling-bonds.
We used the same super cell for the calculations of the(111) and the (111) surfaces. Only the bulk-truncatedsurface was calculated within a (1 × 1) surface unit cell,else always a (2 × 2) unit cell was used. The slab con-sisted of five (111) double layers. The vacuum region hada thickness equivalent to four (111) double layers. Thewhole Brillouin zone of the (2 × 2) surface unit cell wassampled with 16 special k-points, corresponding to 64 k-points in the Brillouin zone of the (1 × 1) cell. Absolutesurface energies of the (111) reconstructions were deter-mined using the energy density formalism. The resultsare shown in Fig. 7. The Ga vacancy model is the most
favorable reconstruction for a large range of the chemi-cal potential from a Ga-rich to an As-rich environment.Only in very As-rich environments the As trimer modelhas a lower energy. The Ga vacancy model has a surfaceenergy of 54 meV/A2, whereas, the As trimer model hasa surface energy of 51 meV/A2 in As-rich environmentat µAs = µAs(bulk). The Ga vacancy reconstruction was
observed experimentally by Haberern and Pashley55 andTong et al.57 Thornton et al. additionally observed theAs trimer reconstruction.
Two other groups have performed similar ab initio cal-culations. Using their energy density formalism, Chettyand Martin18 derived a value of 131 meV/A2 for the sur-face energy of the ideal (111) surface in a Ga-rich en-vironment, which is much larger than our value of 93meV/A2. Secondly, we can compare our results to the rel-ative surface energies of Kaxiras et al.54,15 They arrivedat the same qualitative conclusions. However, quantita-tively their relative surface energies are not easily com-parable to ours because they used As4 gas to define theAs-rich environment. Therefore they obtained a largerinterval for the chemical potential. We derive for the sur-face energy difference of the As adatom and Ga vacancystructure a value of 13 meV/A2, whereas Kaxiras et al.calculate a much larger difference of 47 meV/A2. Usingtheir own result for the ideal surface, Chetty and Martintransformed the relative surface energies of Kaxiras et al.to absolute surface energies. In comparison to our results,all these surface energies contain the same shift towardshigher energy as the ideal surface mentioned above. Wewill discuss this difference below and explain, why webelieve our results to be accurate.
Tong et al.57 performed a LEED analysis for the ge-ometry of the Ga vacancy reconstruction. Their geom-etry data compare very well with the theoretical dataof Chadi58, Kaxiras et al.54 and ours. For the Ga va-cancy reconstruction we find an average bond angle ofthe sp2-bonded Ga surface atom of 119.8◦ in agreementwith Tong et al. The bond angles of the p3-bonded Asatom of 87.0◦ and 100.6◦ average to 91.5 ◦ which againcompare very well with the value of 92.9◦ by Tong etal. The bonds of the p3-bonded As atom are strained by-1.6% and 2.6% with respect to the GaAs bulk bonds.Tong et al. measured a value -1.3% and 1.9%, respec-tively.
Furthermore, for the As trimer reconstruction we com-pare our geometry data to theoretical data of Kaxiras etal.54 The threefold-coordinated As adatoms form bondangles to the neighboring As adatoms of 60◦ due to sym-metry reasons. The bond angle of the As adatom tothe next Ga atom is 106.2◦. Therefore we get an aver-age bond angle of 90.8◦ which is in good agreement withthe 91.7◦ of Kaxiras et al. The surface Ga-As bonds arestrained by 1.4 %, whereas Kaxiras et al. find the samebond length as in the bulk. The As-As bonds have a bondlength of 2.44 A, 2.4 % shorter than that in As bulk. TheGa surface atom which is not bond to an As adatom re-
8

laxes into the plane of the As atoms with a bond angleof 118.4◦ and a bond length which is 2.6 % shorter thanin GaAs bulk. These values are slightly larger than the114.7◦ and 1.0 % reported by Kaxiras et al.
D. (111) Surface
The polar GaAs (111) surface differs from the (111)surface, as the bulk-truncated (111) surface is terminatedby As atoms, while the (111) surface is Ga terminated.At first sight the (111) surfaces might seem to be stillanalogous to the (111) surfaces, only that the Ga and Asatoms have to be exchanged. However, this analogy isnot useful, because As and Ga have different electronicproperties, and therefore the (111) and (111) surfacesdo not exhibit equivalent reconstructions. Stoichiometric(111) surfaces are gained by adding a Ga atom per (2 ×2) surface unit cell to the bulk-truncated surface or byremoving an As surface atom.
Kaxiras et al.15 calculated the relative surface energyfor various (2 × 2) reconstructions. Biegelsen et al.16
studied the (111) surface both experimentally and theo-retically. Using STM they observed an As trimer (2× 2)
reconstruction for As-rich environments. A (√
19×√
19)reconstruction which is dominated by two-layer hexago-nal rings was identified for Ga-rich environments.
Due to the large unit cell the (√
19×√
19) reconstruc-tion is computationally quite expensive, and in this workwe thus only consider (2 × 2) reconstructions. First ofall, for comparison, we calculate the surface energy of theideal (i.e., relaxed bulk-truncated) surface shown in Fig.8(a). This surface is not stoichiometric (∆N = 1
4/(1×1)).The dangling-bond of each As surface atom is filled with5/4 of an electron. Therefore the surface is metallic.Secondly, the Ga adatom model shown in Fig. 8(b) wasconsidered. Through adding of an additional Ga surfaceatom the surface has become stoichiometric and semicon-ducting. The dangling-bond of the Ga adatom is com-pletely empty, whereas the dangling-bond of the As atomwhich is not bond to the Ga adatom is completely filled.Furthermore, we also consider an As trimer model (seeFig. 8(c)). In contrast to the (111) surface the As trimeris bond to As surface atoms. This reconstruction has astoichiometry of ∆N = 1 per (1 × 1) surface unit cell.Each As surface atom has a completely filled dangling-bond. Therefore, the surface is semiconducting. Further-more, we calculate the surface energy for the As vacancymodel which is shown in Fig. 8(d). The removal of theAs surface atom causes the surface to be stoichiometric.The three neighboring Ga atoms have completely emptydangling-bonds. The surface fulfills the electron countingcriterion and is semiconducting. Finally, we calculate theGa trimer model (see Fig. 8(e)) to compare with Kaxiraset al.15 and Northrup et al.16 This surface model has astoichiometry of ∆N = −1/2 per (1×1) surface unit celland also fulfills the electron counting criterion. However,
(112)- -
(110
)-
(111
)--
-
(a) ideal (b) Ga adatom
(c) As trimer (d) As vacancy
(e) Ga trimerFIG. 8. Atomic structures of the GaAs (111) reconstruc-
tions.
it is metallic for the same reason as the Ga terminated(110) surface.
The calculations for the (111) surface were carried outwith the same parameters and supercell as those for the(111) surface outlined in the previous section. The re-sults are shown in Fig. 9. For As-rich environments wefind that the As trimer model is the most favorable re-construction, as observed experimentally by STM andconfirmed by previous ab initio calculations.16 This re-construction has a very low surface energy of 43 meV/A2.In a Ga-rich environment the Ga adatom reconstruction
9

−0.6 −0.4 −0.2 0.0µAs−µAs(bulk) (eV)
40
50
60
70
80
90
100γ su
rfac
e (m
eV/Å
2 )
Ga adatom
As trimer
As vacancy
ideal
Ga trimer
FIG. 9. Surface energy of the different GaAs (111) recon-structions in meV/A2 plotted versus the difference of thechemical potential of As and As bulk.
has the lowest energy (69 meV/A2) among all the struc-
tures we calculated. The (√
19 ×√
19) reconstructionfound experimentally was not included in our approach.However, as suggested by Biegelsen et al. our presentdata can be used to restrict the range of possible valuesfor the surface energy of the (
√19×
√19) reconstruction
consistent with observation: It has to be smaller than thesurface-energy of the Ga adatom model on the one hand,and it has to be larger than the minimum energy of theAs-trimer surface (plus a small correction of −3 meV/A2
to account for the non-stoichiometry of the√
19×√
19 re-construction) on the other hand. Therefore, we conclude
that energy of the (√
19 ×√
19) reconstruction is in therange between 40 and 69 meV/A2. Considering also theenergetical competition with facets of other orientations,even a slightly more stringent condition can be deduced:For the (111) (
√19 ×
√19) surface in a Ga-rich environ-
ment to be stable against faceting into {110} surfaces, itssurface energy has to be less than 63 meV/A2.
In comparison to the relative surface energies cal-culated by Kaxiras et al.15 our energy difference be-tween the As vacancy and the Ga adatom structure of2 meV/A2 is only slightly smaller than their value of 6meV/A2. However, they state that for the Ga-rich en-vironment the Ga trimer structure is 24 meV/A2 morefavorable than the Ga adatom structure. In contrast, weagree with Northrup et al.16 that the Ga trimer is ener-getically quite unfavorable. It has a 29 meV/A2 highersurface energy than the Ga adatom. Also the other rela-tive surface energies compare quite well with the alreadymentioned calculations of Northrup et al.16 although theyderived a larger heat of formation (0.92 eV as opposed toour value of 0.64 eV). Relative to the Ga adatom our sur-face energies of the As trimer are about 10 meV/A2 largerthan theirs. Also, they find a slightly larger energetic sep-
aration between the As vacancy and Ga adatom struc-tures. Their value for this energy difference is 6 meV/A2,whereas our value is 2 meV/A2. However, these differ-ences are small and do not affect the physical conclusions.Chetty and Martin derived the absolute surface energiesusing their result for the ideal (111) surface and the rel-ative surface energies of Kaxiras et al. and Northrup etal. In contrast to the (111) their value of 69 meV/A2
for the ideal (111) surface in the Ga-rich environment ismuch smaller than ours of 97 meV/A2. Therefore, thistime in comparison to our data the results all contain thesame shift to lower surface energies as the ideal surface.However, the sum of the (111) and (111) surface ener-gies from Chetty and Martin is close to ours. Thereforeit is the splitting of the slab total energy into contribu-tions from the (111) and the (111) side that comes outdifferently. In our calculations both sides are energeti-cally similar which seems to be plausible in view of thefact that the flat (i.e., not faceted) surfaces have beenobserved experimentally.
With respect to the calculated geometry we find thatthe As-As bond length in the trimer is 2.46 A, 1.6 %shorter than in bulk As. The As trimer atoms each bindto an As atom 2.30 A beneath the As trimer plane inagreement with Northrup et al.16 The remaining As atomwhich is not bond to the trimer relaxes outwards and is1.74 A below the trimer plane. This compares reasonablywell with the slightly larger value of 1.89 A by Northrupet al. For the two Ga surface models the separation ofthe adatom or trimer plane and the closest As (rest atom)plane amounts to 0.98 A for the Ga adatom model, and1.98 A for the Ga trimer model. Northrup et al. derivedvalues of 0.98 A and 1.90 A.
E. Equilibrium Crystal Shape (ECS)
As opposed to liquids, crystals have non-trivial equi-librium shapes because the surface energy γ(m) dependson the orientation m of the surface relative to the crys-tallographic axes of the bulk. Once γ(m) is known, theECS is determined by the Wulff construction,59,60 whichis equivalent to solving
r(h) = minm
(
γ(m)
m · h
)
. (6)
Here r(h) denotes the radius of the crystal shape in the
direction h. When the surface energy γ(m) is drawn aspolar plot, the ECS is given by the interior envelope ofthe family of planes perpendicular to m passing throughthe ends of the vectors γ(m) m. Under the assumptionthat only the (110), (100), (111), and (111) facets exist,we construct the ECS from the calculated surface en-ergies of these facets. Thus there may exist additionalthermodynamically stable facets that are missing on ourECS. To be sure to construct the complete shape one
10

(100)
(001)(001)
(010)
(011)
(011)
(110) (111)
(101)(101)
FIG. 10. Three-dimensional representation of the ECS ofGaAs in an As-rich environment, constructed from the surfaceenergies of the (110), (100), (111), and (111) facets. The(100), (010), and (001) axes are drawn for convenience.
would have to calculate the surface energy for every ori-entation. However, from experiments it is known thatthe low Miller-indices surface orientations we considerare likely to be the energetically most favorable ones.
As the GaAs surface energies depend on the chemicalenvironment, the ECS becomes a function of the chemi-cal potential. In Fig. 10 the ECS is shown for an As-richenvironment and zero temperature. The different facetshave been marked in the Figure and the ECS reflectsthe symmetry of bulk GaAs. To investigate the depen-dence of the ECS on the chemical potential we will fo-cus on the cross-section of the ECS with a (110) planethrough the origin. This cross-section includes the com-plete information from all four calculated surfaces, be-cause they all possess surface normals within this plane.The ECS is shown for three different chemical environ-ments in Fig. 11. Note that in a Ga-rich environment the(111)(
√19 ×
√19) reconstruction would be energetically
more favorable than the (111)(2×2) Ga-adatom recon-struction used for the construction of the ECS at thischemical potential, i.e., the experimental (111) facet ap-pears somewhat closer to the origin. For an As-rich envi-ronment we find that all four considered surface orienta-tions exist in thermodynamic equilibrium. Furthermore,the (111) surface exists within the full range of accessi-ble chemical potentials. This is in contrast to the resultChetty and Martin18 derived from the work of Kaxiraset al.14: They stated that the (111) surface has a highenergy and thus it should not exist as a thermodynamicequilibrium facet. However, experimental work of Weisset al.1 using a cylindrical shaped sample indicates that
-80 -40 40 80
-40
40
(110)
(001)
(111)(111)
-80 -40 40 80
-40
40
-80 -40 40 80
-40
40
(a) µAs = µAs(bulk) - Hf
(b) µAs = µAs(bulk) - 0.3eV
(c) µAs = µAs(bulk)
(111)(111)
(110)
(001)
(110)
(001)
(111)(111)
(111)(111)
(110)(001)
(110)
(001)
(111)(111)
(111)(111)
(110)
(001)
FIG. 11. Cross section of the ECS of GaAs for three dif-ferent chemical potentials µAs. The dashed line denotes theequilibrium shape of an infinitely long cylindrical crystal, de-rived from a two-dimensional Wulff-construction. The (111)orientation is equivalent to the (111) and the (111) to the(111).
between the (110) and (111) orientation all surfaces facetinto (110) and (111) orientations. The (2 × 2) super-structure of the (111) surface has been observed on thesefaceted surfaces. If the (111) orientation of GaAs wereinstable, the appearance of facets other than (111) on the
11

cylindrical crystal were to be expected.In Fig. 11 one can see that the ECS becomes smaller
for As-rich environments. The As terminated reconstruc-tions have surface energies about 20 % smaller than thosefound in Ga-rich environments, which are mostly stoi-chiometric like the Ga vacancy. In contrast to the sur-face reconstructions found for As-rich environments nosimilar Ga terminated reconstructions are observed. An-other remarkable feature of the ECS is that the surfaceenergies do not vary very much with the orientation. ForGa-rich environments they vary by about ±10%, whereasfor As-rich environments they vary only by ±5%.
Our calculated ECS imposes restrictions on the sur-face energies of other surface orientations: When it hasbeen proven experimentally that a facet exists in ther-modynamic equilibrium, one can derive a lower and anupper limit for its surface energy. The limits are given bythe surface energy of the neighboring facets on our ECStogether with appropriate geometry factors. They followfrom the conditions that (a) the surface energy has tobe sufficiently small, so that the surface does not facetinto {110}, {100}, {111}, and {111} orientations, and (b)that the surface energy is not so small that neighboringfacets are cut off by this plane and thus vanish from theECS. In a similar way the Wulff construction yields alower limit for the surface energy of any facet that doesnot exist in thermodynamic equilibrium.
Recently the shape of large three-dimensional InAsislands (diameter ∼ 2000 A) grown by MOVPE on aGaAs(100) substrate has been observed by E. Steimetz etal.61 These islands are presumably relaxed, the misfit ofthe lattice constants being compensated by a dislocationnetwork at the InAs-GaAs interface. Thus the facets dis-played on these islands should be identical to the facetson the ECS of InAs. In fact, the observed shapes arecompatible with an ECS like that of GaAs shown in Fig.10, with {110}, {100}, {111}, and {111} facets beingclearly discernible. Due to the similarity between InAsand GaAs we take this as another confirmation of ourresults as opposed to those of Chetty and Martin.18
V. SUMMARY AND CONCLUSION
The GaAs surface energies of different orientationshave been calculated consistently with one and the sameparameters and pseudo-potentials. The surface energiesof the (110), (100), (111) and (111) surfaces are given independence of the chemical potentials.
For the (111) and (111) surfaces we find a large dif-ference to previous results of Chetty and Martin.18 Theyderived a difference of about 62 meV/A2 between thesurface energies of the ideal (111) and (111) surfaces,whereas we calculate a difference of about −4 meV/A2.Consequently the absolute surface energies calculatedby Chetty and Martin using data of Kaxiras et al.14,15
and Northrup et al.16 contain the above difference of 66
meV/A2. This is due to a different splitting of the slabenergy into contributions from the (111) and (111) sur-faces, as Chetty and Martin’s and our sum of the (111)and (111) surface energies are essentially equal. Obtain-ing high surface energies for the (111) surfaces Chettyand Martin have to conclude that the (111) facet shouldbe unfavorable and not exist in thermodynamic equilib-rium. In contrast our surface energies for the (111) sur-face are lower and therefore we conclude that it existsin thermodynamic equilibrium which appears to be inagreement with experimental observations.
As already stated by Chetty and Martin18 there aresignificant differences between the results of Kaxiras etal. and Northrup et al. for the (111) surface: Kaxiras et
al. find the Ga trimer structure to be energetically fa-vorable in Ga-rich environments, whereas we agree withNorthrup et al. and find it energetically unfavorable.This is also confirmed by experiment.
Having calculated the absolute surface energies for dif-ferent orientations we are in the position to construct theECS of GaAs. We have to keep in mind, however, thatit is implicitly assumed that only the (110), (100), (111)and (111) surfaces exist in equilibrium. For a more re-fined discussion of faceting further calculations also forhigher-index surfaces would have to be performed. Fromour ECS we conclude that in As-rich environment all fourorientations exist in thermodynamic equilibrium. For agiven chemical potential the variation of the surface en-ergy with orientation is small and less than ±10%. OurECS of GaAs gives indication for the ECS of InAs orother III-V semiconductors which show similar surfacereconstructions.
VI. ACKNOWLEDGMENTS
We thank E. Steimetz for helpful discussion and a copyof Ref. 61 prior to publication. This work was supportedin part by the Sfb 296 of the Deutsche Forschungsgemein-schaft.
∗ Present Address: Department of Physics, MassachusettsInstitute of Technology, Cambridge, Massachusetts 02139.Electronic Address: [email protected]
1 W. Weiss, W. Ranke, D. Schmeisser, and W. Gopel,Surf. Sci. 221, 91 (1989).
2 R. Notzel, L. Daweritz, and K. Ploog, Phys. Rev. B 46,4736 (1992).
3 D. Leonard, M. Krishnamurthy, C. M. Reaves, S. P. Den-baars, and P. M. Petroff, Appl. Phys. Lett. 63, 3203 (1993).
4 J. M. Moison, F. Houzay, F. Barthe, L. Leprince, E. An-dree, and . Vatel, Appl. Phys. Lett. 64, 196 (1994).
12
5 M. Grundmann, J. Christen, N. N. Ledentsov, J. Bohrer,D. Bimberg, S. S. Ruvimov, P. Werner, U. Richter, U.Gosele, J. Heydenreich, V. Ustinov, A. Egorov, A. Zhukov,P. Kop’ev, and Z. Alferov, Phys. Rev. Lett. 74, 4043(1995).
6 V. A. Shchukin, N. N. Ledentsov, P. S. Kop’ev, and D.Bimberg, Phys. Rev. Lett. 75, 2968 (1995).
7 C. Messmer and J. C. Bilello, J. Appl. Phys. 52, 4623(1981).
8 D. J. Eaglesham, A. E. White, L. C. Feldman, N. Moriya,and D. C. Jacobson, Phys. Rev. Lett. 70, 1643 (1993).
9 J. M. Bermond, J. J. Metois, X. Egea, and F. Floret, Surf.Sci. 330, 48 (1995).
10 G.-X. Qian, R. M. Martin, and D. J. Chadi, Phys. Rev. B37, 1303 (1988).
11 J. E. Northrup and S. Froyen, Phys. Rev. Lett. 71, 2276(1993).
12 G.-X. Qian, R. M. Martin, and D. J. Chadi, Phys. Rev. B38, 7649 (1988).
13 T. Ohno, Phys. Rev. Lett. 70, 631 (1993).14 E. Kaxiras, Y. Bar-Yam, J. D. Joannopoulos, and K. C.
Pandey, Phys. Rev. B 35, 9625 (1987).15 E. Kaxiras, Y. Bar-Yam, J. D. Joannopoulos, and K. C.
Pandey, Phys. Rev. B 35, 9636 (1987).16 D. K. Biegelsen, R. D. Bringans, J. E. Northrup, and L.-E.
Swartz, Phys. Rev. Lett. 65, 452 (1990).17 N. Chetty and R. M. Martin, Phys. Rev. B 45, 6074 (1992).18 N. Chetty and R. M. Martin, Phys. Rev. B 45, 6089 (1992).19 CRC Handbook of Chemistry and Physics, 67 ed., edited
by R. C. West (CRC, Boca Raton, FL, 1986).20 R. J. Needs, R. M. Martin, and O. H. Nielsen, Phys. Rev.
B 33, 3778 (1986).21 N. Chetty and R. M. Martin, Phys. Rev. B 44, 5568 (1991).22 W. A. Harrison, J. Vac. Sci. Technol. 16, 1492 (1979).23 M. D. Pashley, Phys. Rev. B 40, 10481 (1989).24 J. L. A. Alves, J. Hebenstreit, and M. Scheffler, Phys. Rev.
B 44, 6188 (1991).25 P. Hohenberg and W. Kohn, Phys. Rev. 136, B864 (1964).26 W. Kohn and L. J. Sham, Phys. Rev. 140, A 1133 (1965).27 J. P. Perdew and A. Zunger, Phys. Rev. B 23, 5048 (1981).28 D. M. Ceperley and B. J. Alder, Phys. Rev. Lett. 45, 566
(1980).29 R. Stumpf and M. Scheffler, Comput. Phys. Commun. 79,
447 (1994).30 D. R. Hamann, Phys. Rev. B 40, 2980 (1989).31 L. Kleinman and D. M. Bylander, Phys. Rev. Lett. 48,
1425 (1982).32 X. Gonze, R. Stumpf, and M. Scheffler, Phys. Rev. B 44,
8503 (1991).33 J. Ihm, A. Zunger, and M. L. Cohen, J. Phys. C 12, 4409
(1979).34 H. J. Monkhorst and J. D. Pack, Phys. Rev. B 13, 5188
(1976).35 K. Shiraishi, J. Phys. Soc. Jap. 59, 3455 (1990).36 Landolt-Bornstein, edited by K.-H. Hellwege (Springer-
Verlag, Berlin, 1982), Vol. III/17a.37 B. Kubler, W. Ranke, and K. Jacobi, Surf. Sci. 92, 519
(1980).38 J. E. Northrup, Phys. Rev. B 44, 1349 (1991).39 L. Daweritz and R. Hey, Surf. Sci. 236, 15 (1990).
40 D. K. Biegelsen, R. D. Bringans, J. E. Northrup, and L.-E.Schwartz, Phys. Rev. B 41, 5701 (1990).
41 D. J. Chadi, J. Vac. Sci. Technol. A 5, 834 (1987).42 J. E. Northrup and S. Froyen, Phys. Rev. B 50, 2015
(1994).43 T. Hashizume, Q. K. Xue, J. Zhou, A. Ichimiya, and T.
Sakurai, Phys. Rev. Lett. 73, 2208 (1994).44 Q. Xue, T. Hashizume, J. M. Zhou, T. Sakata, T. Ohno,
and T. Sakurai, Phys. Rev. Lett. 74, 3177 (1995).45 J. Cerda, F. J. Palomares, and F. Soria, Phys. Rev. Lett.
75, 655 (1995).46 M. Sauvage-Simkin, R. Pinchaux, J. Massies, P. Calverie,
N. Jedrecy, J. Bonnet, and I. K. Robinson, Phys. Rev. Lett.62, 563 (62).
47 P. K. Larsen, J. H. Neave, J. F. van der Veen, P. J. Dobson,and B. A. Joyce, Phys. Rev. B 27, 4966 (1983).
48 S. A. Chambers, Surf. Sci. 261, 48 (1992).49 H. Xu, T. Hashizume, and T. Sakurai, Jpn. J. Appl. Phys.
32, 1511 (1993).50 H. Li and S. Y. Tong, Surf. Sci. 282, 380 (1993).51 J. E. Northrup and S. Froyen, Mat. Sci. Eng. B 2, 81
(1995).52 C. Xu, J. S. Burnham, R. M. B. S. H. Gross, and N. Wino-
grad, Phys. Rev. B 52, 5172 (1995).53 E. Kaxiras, Y. Bar-Yam, J. D. Joannopoulos, and K. C.
Pandey, Phys. Rev. B 33, 4406 (1986).54 E. Kaxiras, K. C. Pandey, Y. Bar-Yam, and J. D.
Joannopoulos, Phys. Rev. Lett. 56, 2819 (1986).55 K. W. Haberern and M. D. Pashley, Phys. Rev. B 41, 3226
(1990).56 J. M. C. Thornton, P. Weightman, D. A. Woolf, and C.
Dunscombe, in Proceedings of the Twenty-Second Inter-
national Conference on the Physics of Semiconductors.,edited by D. J. Lockwood (World Scientific, Singapore,1995), p. 471.
57 S. Y. Tong, G. Xu, and W. N. Mei, Phys. Rev. Lett. 52,1693 (1984).
58 D. J. Chadi, Phys. Rev. Lett. 52, 1911 (1984).59 G. Wulff, Z. Kristallogr. 34, 449 (1901).60 M. Wortis, in Chemistry and Physics of Solid Surfaces VII,
edited by R. Vanselow and R. F. Howe (Springer-Verlag,Berlin, 1988).
61 E. Steimetz, F. Schienle, and W. Richter (unpublished).
13