Embed Size (px)
Citation preview
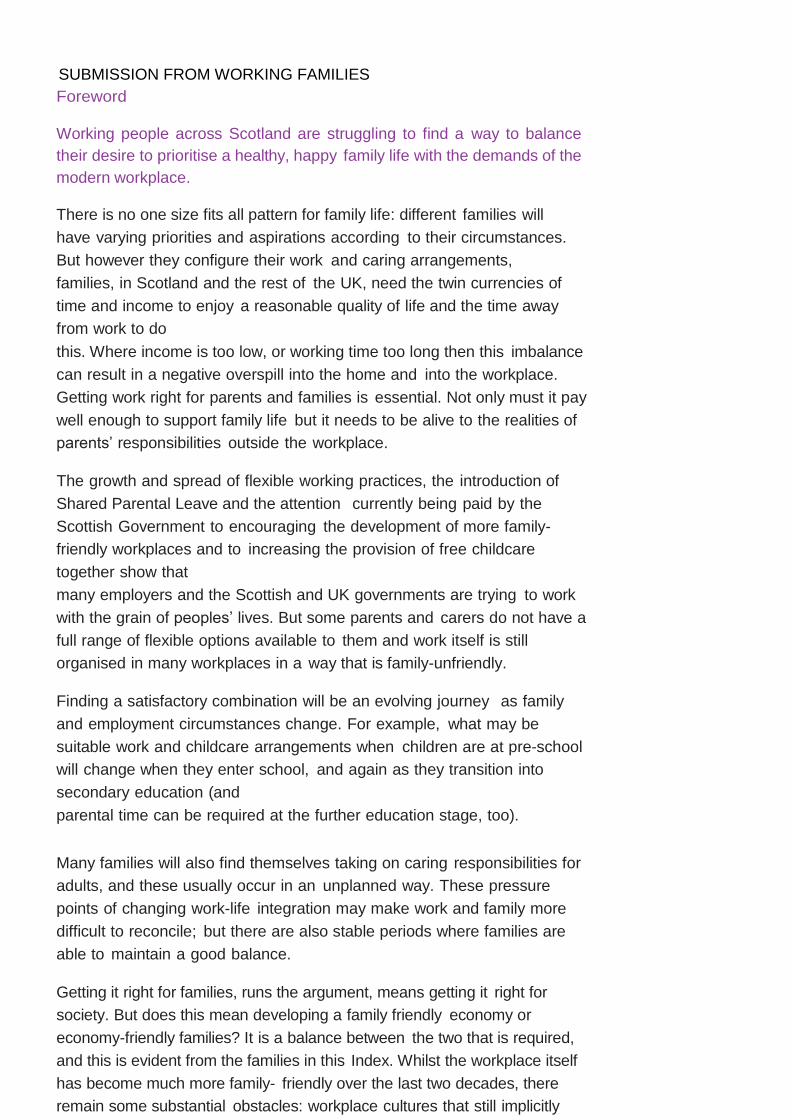
SUBMISSION FROM WORKING FAMILIES
Foreword
Working people across Scotland are struggling to find a way to balance
their desire to prioritise a healthy, happy family life with the demands of the
modern workplace.
There is no one size fits all pattern for family life: different families will
have varying priorities and aspirations according to their circumstances.
But however they configure their work and caring arrangements,
families, in Scotland and the rest of the UK, need the twin currencies of
time and income to enjoy a reasonable quality of life and the time away
from work to do
this. Where income is too low, or working time too long then this imbalance
can result in a negative overspill into the home and into the workplace.
Getting work right for parents and families is essential. Not only must it pay
well enough to support family life but it needs to be alive to the realities of
parents’ responsibilities outside the workplace.
The growth and spread of flexible working practices, the introduction of
Shared Parental Leave and the attention currently being paid by the
Scottish Government to encouraging the development of more family-
friendly workplaces and to increasing the provision of free childcare
together show that
many employers and the Scottish and UK governments are trying to work
with the grain of peoples’ lives. But some parents and carers do not have a
full range of flexible options available to them and work itself is still
organised in many workplaces in a way that is family-unfriendly.
Finding a satisfactory combination will be an evolving journey as family
and employment circumstances change. For example, what may be
suitable work and childcare arrangements when children are at pre-school
will change when they enter school, and again as they transition into
secondary education (and
parental time can be required at the further education stage, too).
Many families will also find themselves taking on caring responsibilities for
adults, and these usually occur in an unplanned way. These pressure
points of changing work-life integration may make work and family more
difficult to reconcile; but there are also stable periods where families are
able to maintain a good balance.
Getting it right for families, runs the argument, means getting it right for
society. But does this mean developing a family friendly economy or
economy-friendly families? It is a balance between the two that is required,
and this is evident from the families in this Index. Whilst the workplace itself
has become much more family- friendly over the last two decades, there
remain some substantial obstacles: workplace cultures that still implicitly
encourage longer hours; negative perceptions of flexible working and career
(and income) progression; and a lack of affordable, available and
appropriate childcare. The responsibility for a good work-life fit
for families is not only the concern of parents. It is a joint one, between
individuals, their employers and government too.
Modern Families Index Scotland shows that parents and other carers
find it extremely difficult to balance work and family life. And the so-
called sandwich generation, those shouldering responsibility for caring
both for children and ageing parents, is a growing feature in the
employment landscape. Scotland,
along with the rest of the UK, needs a productive, motivated and engaged
workforce to drive sustainable economic growth. We need a revolution in
workplace culture to help reach this goal.
Sarah Jackson OBE
Chief Executive, Working
Families
5
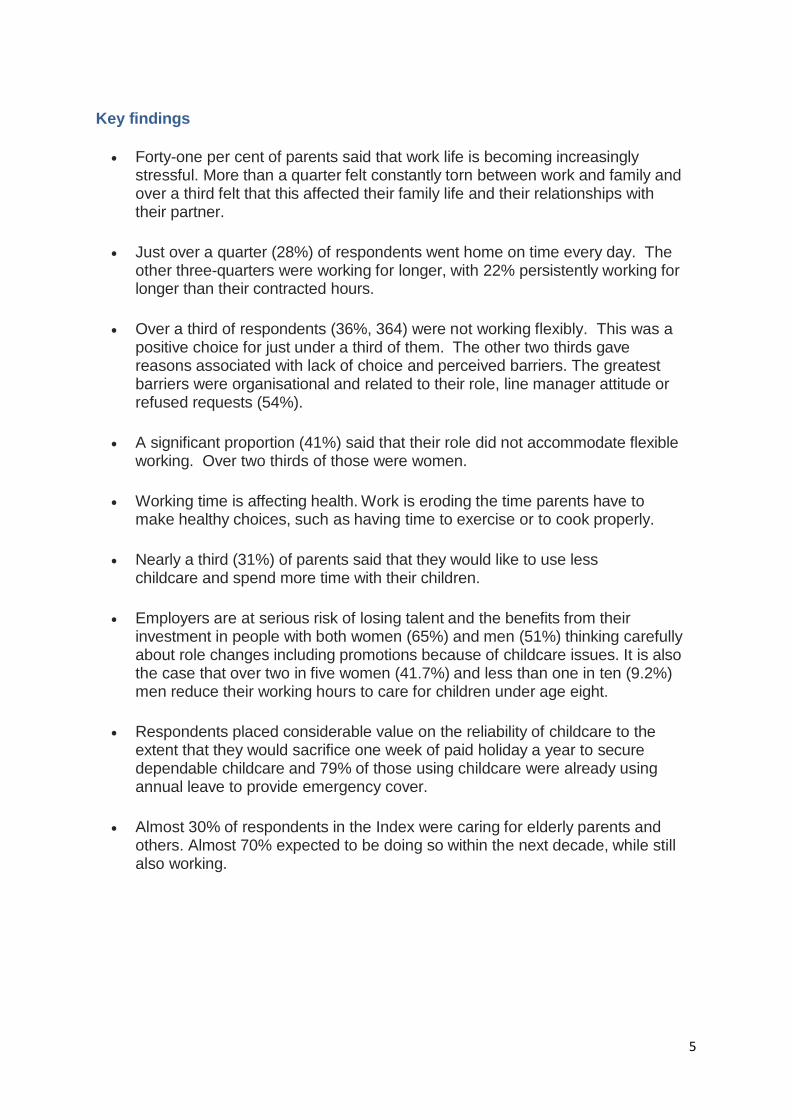
Key findings
Forty-one per cent of parents said that work life is becoming increasingly stressful. More than a quarter felt constantly torn between work and family and over a third felt that this affected their family life and their relationships with their partner.
Just over a quarter (28%) of respondents went home on time every day. The other three-quarters were working for longer, with 22% persistently working for longer than their contracted hours.
Over a third of respondents (36%, 364) were not working flexibly. This was a positive choice for just under a third of them. The other two thirds gave reasons associated with lack of choice and perceived barriers. The greatest barriers were organisational and related to their role, line manager attitude or refused requests (54%).
A significant proportion (41%) said that their role did not accommodate flexible working. Over two thirds of those were women.
Working time is affecting health. Work is eroding the time parents have to make healthy choices, such as having time to exercise or to cook properly.
Nearly a third (31%) of parents said that they would like to use less childcare and spend more time with their children.
Employers are at serious risk of losing talent and the benefits from their investment in people with both women (65%) and men (51%) thinking carefully about role changes including promotions because of childcare issues. It is also the case that over two in five women (41.7%) and less than one in ten (9.2%) men reduce their working hours to care for children under age eight.
Respondents placed considerable value on the reliability of childcare to the extent that they would sacrifice one week of paid holiday a year to secure dependable childcare and 79% of those using childcare were already using annual leave to provide emergency cover.
Almost 30% of respondents in the Index were caring for elderly parents and others. Almost 70% expected to be doing so within the next decade, while still also working.
6
Introduction
The Modern Families Index 2015: Scotland is a snapshot of how working families combine work and family life. It is based on the responses of 1,005 parents from across Scotland who are in paid employment and who have at least one dependent child living with them some of the time. The survey, therefore, is not representative of all families in Scotland. Nevertheless, it provides useful information about the fit and the conflict between family life, caring responsibilities and work life.
The survey ran in parallel with an annual UK-wide survey conducted by Working Families and Bright Horizons. The UK annual report, Modern Families Index, 2015 is at: www.workingfamilies.org.uk/wp-content/uploads/2015/01/Modern-Family- Index-full-report-FINAL.pdf
The survey ran online between 20 November and 10 December 2014. To participate, there had to be at least one working parent or carer in the household, with at least one resident dependant under 18 years old. Parents not in paid employment were ineligible. If the main respondent had a partner, they were asked to complete questions about their partner, and about their relationship. Partners did not participate directly. The survey used proportional quota sampling for age, gender and region.
The results for Scotland are published separately for the first time because, although many of the findings are similar across the UK, there are differences in Scotland which affect working parents, their families and their employers. This includes factors such as the elderly population increasing faster than the rest of the UK1; more rurally-dispersed population, proportionately more employment in the public sector2
and the distribution of people working in small, medium and large private sector businesses.3
Setting the context: families, work and policy in Scotland
This section places the survey findings in the context of current Scottish Government policy, the 2011 census, the Parenting across Scotland Evidence Response on family households and how they have changed over the past ten years4 and other relevant research.
Families There have been notable changes in families in the 21st century and these are both a cause and a consequence of social and economic policy. An Evidence Response
1 www.statisticsauthority.gov.uk 2 www.ons.gov.uk/ons/guide-method/compendiums/compendium-of-uk-statistics/economy/index.html 3 www.gov.scot/Resource/0043/00437279.pdf 4 Family households: how have family households in Scotland changed over 2001-2011? Evidence Request Bank Evidence Response 2014: www.parentingacrossscotland.org/media/424151/erb%20changing%20family%20households%202001- 2011%20april2014.pdf
7
commissioned by Parenting across Scotland and partners in 2014 from the Evidence Request Bank analysed how family households5 in Scotland have changed between the censuses of 2001 and 2011.6 The different experiences of women and men in the family and in the labour market are particularly relevant to this report.
For example, the Evidence Response highlighted significant differences in the type of economic activity engaged in by men and women; with women five times more likely than men to be working part-time. Lone parent women were far more likely to be working part-time than lone parent men: 64%:11% respectively. And the differentials across all these increased between 2001 and 2011. When women work part-time, whether through choice or circumstance, it may involve occupational downgrading, or underemployment, with women working well below their skill levels.7
This is significant because of the gender pay gap associated particularly between women in part-time employment and men in full-time employment. There is an 11.5% gap between men’s and women’s full-time hourly rates, and a 32.4% gap between women’s part-time hourly rates and men’s full-time hourly rates.8 This pay gap contributes to women’s poverty both in work and in retirement and it also affects their children. Levels of economic activity decreased for both men and women over the ten years to 2011. The reasons for this show marked gender differences with women six times more likely to be economically inactive than men because of looking after the home and family.9 Research shows that there is also a ‘penalty in pay’ associated with motherhood.10
Work What makes a workplace family-friendly is the extent to which employers make it possible for employees to fulfil both their family and work obligations in ways which maintain or increase individual and overall wellbeing. Government helps by making sure that laws, regulations, and social policies recognise the importance of families to society and act to meet, directly or indirectly, the needs of children, parents, disabled and elderly family members. Support for employers is also important because this work involves challenging traditional ways of working. Understanding the business benefits, designing and implementing effective policies, achieving cultural change and mitigating any negative impacts are not easy tasks.
5 Defined in the report as ‘a married, civil partnered or cohabiting couple (with or without children), or a lone parent with at least one child’ 6 Family households: how have family households in Scotland changed over 2001-2011? Evidence Request Bank Evidence Response 2014: www.parentingacrossscotland.org/media/424151/erb%20changing%20family%20households%202001- 2011%20april2014.pdf 7 See for example: www.fawcettsociety.org.uk/2014/08/new-research-low-paid-women-firmly-shut-recovery and www.shu.ac.uk/_assets/pdf/ceir-workingbelowpotential.pdf 8 See more on the gender pay gap at: www.closethegap.org.uk 9 Family households: how have family households in Scotland changed over 2001-2011? Evidence Request Bank Evidence Response 2014:

8
www.parentingacrossscotland.org/media/424151/erb%20changing%20family%20households%202001- 2011%20april2014.pdf 10 The family gap in pay in Europe http://wrap.warwick.ac.uk/6566/
9
Occupational segregation means that women tend to work in the ‘5 Cs’: catering, cleaning, caring, clerical and cashiering, with fewer women than men employed as
managers or in senior positions.11 By their nature, as well as low pay, these posts may offer less scope for ‘family-friendliness’ and less opportunity to influence employer policy.
Both men and women face challenges in the workplace although they may be different or experienced differently and can affect women and men disproportionately. The gendered nature of work and of parenting has a detrimental impact on both women and men and on society generally. Men may be expected and pressured to work long hours by workplace culture, workload and managerial expectations. They may not feel able or be enabled to take up part-time work, to take up paternity or shared parental leave for a number of reasons. These can include negative attitudes, fear of loss of future earnings and, because, as a result of the gender pay gap and other factors, men are still likely to be the main breadwinners. In a heterosexual couple forgoing all or part of the man’s salary might not be feasible.
Employers too need to be convinced of the benefits of working patterns which support the reality of the lives of the majority of the working population. These include better retention rates; reduced absenteeism and staff loyalty. These have a consequential effect both in economic terms and in providing services.
Family-friendly working needs to be economically viable for all parents; not just a choice for the better paid; or limited employment options (such as poorly-paid part- time/unreasonable shift/zero hours) masquerading as family-friendly approaches. A Scottish Government report found that employment is no guarantee against severe or extreme poverty. It found that 43% of working age adults in severe poverty and 44% of working age adults in extreme poverty lived in working households.12
11 www.closethegap.org.uk/content/gap 12 Scottish Government, Severe Poverty in Scotland, March 2015: www.gov.scot/Publications/2015/03/4673
10
Policy Taxation, in-work benefits, employment law, equalities law and legal powers relevant
to flexible working are reserved to the UK Government. The Scottish Government has devolved responsibility for education, including pre-school education and the
health and care of the young, disabled people and the elderly. The powers devolved
to the Scottish Parliament are currently under review and look set to be increased.
The Scottish Government’s ‘Programme for Government’ puts fairness and gender equality at the centre of its economic policy. It aims to increase childcare provision in order to bring more women into the workplace and thus encourage economic growth. Its Scottish Business Pledge13 is designed to encourage businesses to embrace the Scottish Government’s priorities including the Living Wage, youth employment, no zero-hours contracts, a commitment to innovate and export, support for youth skills, improved gender balance at the top and in pay structures, more workforce engagement and support for the local community. These are all important elements of a family-friendly approach.
There are several policy areas which affect the context of family-friendly working in Scotland. The Scottish Government’s National Parenting Strategy14, October 2012, aspires for Scotland to be the best place in the world for children to grow up. This aspiration is backed by a goal of making Scotland's workplaces more family-friendly. The Scottish Government increased early education and childcare entitlement15 in 2014 and plans to increase this further. It has enshrined the principles of child wellbeing and health and ‘getting it right for every child’ in statute under the Children and Young People (Scotland) Act 2014.
Households with dependent children
The 2011 census indicates that around one in four (26%, 616,000) households in Scotland contained one or more dependent children16, including 10% in which the youngest dependent child was under 5. Of those households, just over two in five (43%, 263,000) were lone parent households. Women headed 92% of lone parent households.
How families are changing The Evidence Response17 discusses how families have changed between 2001 and 2011. Its findings include:
13 www.gov.scot/About/Performance/programme-for-government/Programme-for-Government-2014- 15/Support-for-businesses 14 www.gov.scot/resource/0040/00403769.pdf 15 www.gov.scot/Topics/People/Young-People/early-years/parenting-early-learning/childcare 16 Dependent children are those living with their parent(s) and either (a) aged under 16, or (b) aged 16 to 18 in full-time education, excluding children aged 16 to 18 who have a spouse, partner or child living in the household 17 Family households: how have family households in Scotland changed over 2001-2011? Evidence Request Bank Evidence Response 2014:

11
www.parentingacrossscotland.org/media/424151/erb%20changing%20family%20households%202001- 2011%20april2014.pdf
10
Over the ten years to 2011, the number of couples getting married decreased and the number cohabiting increased. There was an associated decrease in the number of births registered to married parents. For the first time, in 2011, just over half of all births in Scotland were registered to unmarried parents
The number of adoptions increased
The number of children in formal kinship care increased
Working patterns
In 201118, there were one million parents aged 16 and over in Scotland with dependent children. Of these, 79% were in employment (including 27% in part-time
employment).19 Of the 111,000 lone parents in employment who had dependent children, 59% worked part-time.
The 2011 census shows significant differences between men and women in the hours they work, with five times more women than men working part-time; and men twice as likely as women to be self-employed. The Scottish Household Survey of 2011 indicates that 63% of women of working age with children were employed or self-employed compared to 61% of women without children. However, those with children were twice as likely as those without to be working part-time. Women without children were much more likely to be working full-time. 20
For lone parents, the 2011 census shows that 68% of male lone parents and 58% of female lone parents were in work. Female lone parents in employment were much more likely to be working part-time than male lone parents (64% compared to 18%).
The proportions are much higher than in 2001.21
Income According to a report from the Joseph Rowntree Foundation (JRF), the number of working households living at below the minimum income standard (MIS) has increased across the UK as a whole. This is associated with stagnant wages and cuts to in-work benefits rather than people having less work. For a couple with children where one partner works full-time and the other does not work, the risk of
18 Census 2011: Release 3N - Detailed characteristics on Scotland's population. January 2015 www.scotlandscensus.gov.uk/news/census-2011-release-3n-detailed-characteristics-scotlands-population [accessed 25 March 2015] 19 5% were unemployed; 10% were categorised as ‘economically inactive: looking after home or family’; and 7% were otherwise economically inactive (for example, long-term sick or disabled) 20 Source: Family households: how have family households in Scotland changed over 2001-2011? Evidence Request Bank Evidence Response 2014: www.parentingacrossscotland.org/media/424151/erb%20changing%20family%20households%202001- 2011%20april2014.pdf 21 Ibid
11
being below the MIS rose from 38% to 51%, and for a lone parent working full-time it rose from 26% to 33%.22
The 2010 MIS annual survey also considered rural areas. It was based on English data but it found that for couples with two children, the annual earnings requirement is much higher depending on whether one or both partners work and the remoteness of the community. People in remote areas need to spend 10 to 20% more on everyday requirements, including transport. It concluded that ‘people in rural areas need to work and earn well above the minimum wage to make ends meet. But since rural jobs are poorly paid, many people have substantially less than they need, even if they work’.23 This is particularly relevant for Scotland which has a significant rural population.
JRF has calculated that a working couple with two children needs to earn £19,400 each to achieve an acceptable living standard and a lone parent needs to earn
£25,600.24 There is increasing pressure on families trying to meet the rising costs of childcare, energy, food and housing. Its report concludes that families with children have particular difficulties. Earnings needed to make ends meet have risen by over 5%, at a time when average earnings have been flat.
Childcare
Parents need childcare in order to be able to work. It needs to be affordable, high- quality and available. These three conditions do not yet apply despite their importance to children’s outcomes, gender equality, a skilled workforce and economic stability – of individual families and Scotland generally. The Children in Scotland Childcare Commission is currently consulting on childcare and released its first report in March 2015.25 It is concerned only with paid-for and registered childcare. Within this limitation, it considers the need for childcare and education for children of all ages and how it might be paid for. It recommends how the whole approach could be improved for the benefit of children, parents and society.
Through the Children and Young People (Scotland) Act, the Scottish Government has recently expanded free childcare provision from 475 hours per year (equivalent to around 12.5 hours per week) to 600 hours per year (around 16 hours per week), for all three and four year olds. For the first time, provision has been extended to two year olds, with the aim of supporting those families who need routes out of poverty and in to employment, and those on lowest incomes. Provision will reach
22 Matt Padley et al. Households below a minimum income standard: 2008/09 to 2012/13, JRF, 2015 www.jrf.org.uk/publications/households-below-minimum-income-standard-2015 23 Donald Hirsch et al. A minimum income standard for rural households, JRF, 2010 www.jrf.org.uk/publications/minimum-income-rural-households 24 Donald Hirsh, A minimum income standard for the UK in 2013, JRF, 2013 www.jrf.org.uk/publications/MIS-2013

12
25 Interim report of the commission for childcare reform: an overview of our proposals for change and draft recommendations, March 2015 www.childreninscotland.org.uk/sites/default/files/Interim%20Statement_final_27March.pdf
13
15% of two year olds in this school year, increasing to 27% of all two year olds from this August.
The First Minister has committed to increasing provision to 30 hours per week for all three and four year olds and 27% of two year olds by the end of the next Parliamentary term, if re-elected. 30 hours is broadly the same level of provision as children in Scotland receive at primary school.
This new provision is welcome and it is too early to capture data to assess its impact. However, there is likely to still be significant unmet need outside the age groups targeted by these policies. According to the 2011 census, only 10% of those families in Scotland with dependent children have one or more children under the age of 5.
Over two in five women (41.7%) and less than one in ten (9.2%) men reduce their working hours to care for children under age eight. 26 Women’s employment patterns change as their children grow up. The most common arrangement (for around 40% of women) is not working while the child is under five and then working part-time once the child starts school but a sizeable minority work full-time.27 ‘Growing Up in Scotland’ research with parents of 10-month-old children who worked less than 20 hours per week found that a third agreed or strongly agreed with the statement: ‘If I could afford good quality childcare which was reliable and convenient, I would work more hours.’.28
The issues disproportionately affect women, who because of the gendered nature of parenting and their position in the workforce, are still the main carers of children, and still the majority of lone parents. There is an existing gender pay gap between women and men. Leaving work, under-employment, taking part-time, low status, low- paid work to fit around family are factors which have the potential to impact negatively in economic terms over the life course. Over the past decades, advances in gender equality mean that women are no longer seen as the dependents of men. Yet, the choices women make in combining motherhood and employment in their twenties and thirties can leave them in poverty in their seventies and eighties, particularly those who brought up children on their own, or who have gone through separation or divorce in their middle or later years. The consequences of these early choices are far-reaching.
Childcare costs are often a considerable outlay for working parents, in some instances making paid work unviable. Even part-time childcare can cost more than the average mortgage.29 Childcare costs are estimated at 27% of income, with
26 Source: derived from European Labour Force Survey, 2010 cited in Camilla Kidner et al. Early Learning and Childcare. SPICe Briefing, April 2014 www.scottish.parliament.uk/ResearchBriefingsAndFactsheets/S4/SB_14- 26.pdf 27 Source: Thompson, S and Ben-Galim, D. Childmind the Gap: Reforming childcare to support mothers into work. IPPR, 2014 Available at: www.ippr.org/images/media/files/publication/2014/02/childmind- thegap_Feb2014_11899.pdf cited in Camilla Kidner et al. Early Learning and Childcare. SPICe Briefing, April 2014 www.scottish.parliament.uk/ResearchBriefingsAndFactsheets/S4/SB_14-26.pdf 28 Bradshaw, P. et al Growing up in Scotland: Birth cohort 2. Results from the first

14
year. Edinburgh: Scottish Government, 2013 Available at: www.scotland.gov.uk/Publications/2013/02/3280/downloads 29 Jill Rutter and Katherine Stocker. The 2014 Scottish Childcare Report. Family and Childcare Trust www.familyandchildcaretrust.org/childcare-costs-surveys
15
parents across the UK as a whole paying more than in other European countries. Childcare is still very much seen as a private matter. Although the cost to parents is subsidised through free pre-school childcare and education provision, working tax credits and childcare vouchers, most subsidy is for younger children and much childcare does not reflect the expectations of employers; the hours which people work, including shift work and the realities of family life, including unexpected events or even routine health appointments and the cumulative effects of more than one child in the family.30
In its annual survey of childcare costs for 201531, the Family and Childcare Trust finds that childcare costs have risen at above the rate of inflation, a continuing trend. For Scotland, it finds that childcare for under-fives is most expensive in the Highlands and Islands and north east Scotland. It suggests that this is linked to providing childcare in sparsely populated rural areas but also highlights that such childcare is increasingly expensive in prosperous areas (the north east includes oil- rich Aberdeen) with private providers charging according to what they think people will pay.
Care of the elderly
The proportion of people in Scotland aged 65 and over is now greater than those under 16. Current projections suggest that the population will rise from around 5.33 million to 5.78 million by 2037, and that it will age significantly, with the number of people aged 65 and over increasing by 59% over that period.32 The number of people aged 85 and over is expected to increase significantly. Although people will live longer, they are not necessarily going to be living better, and we can expect more people to be affected by the illnesses and conditions of very old age.
Women are predominantly the carers of both dependent children and older people. Women having children later, together with the increased life expectancy of older people, means that working people, especially women, are increasingly caring for dependents at both ends of the age spectrum (coined as ‘the sandwich generation’). Working people are also working for longer, the age at which women receive state pension is now the same as men, and those entering the workforce now can expect to receive their state pension at 68. So, the need for family-friendly working is important for working people who are caring for elderly family members, including ageing and disabled partners.
The workplace
Private sector employment in Scotland accounts for 79% of total employment and public sector employment accounts for 21% (and has reduced over previous
30 Ibid 31 Jill Rutter, Childcare Costs Survey, Family and Childcare Trust, 2015
32 Scotland’s Population 2013: The Registrar General's Annual Review of Demographic Trends, August 2014 www.nrscotland.gov.uk/statistics-and-data/statistics/stats-at-a-glance/registrar-generals-annual-review/2013
16
years).33 2002 research by the Joseph Rowntree Foundation suggests that family- friendly or flexible working arrangements were more common in larger organisations and in the public sector.34 The 4th work-life balance survey35 shows that this is broadly similar in 2014, with larger organisations more likely to have written policies about flexible working, although a policy alone does not mean having practices that support their uptake.
As at March 2014, there were an estimated 335,015 private sector enterprises operating in Scotland. Almost all of these enterprises (98.2%) were small (0 to 49 employees); 3,780 (1.1%) were medium-sized (50 to 249 employees) and 2,295 (0.7%) were large (250 or more employees).
Small (0 to 49 employees) enterprises accounted for 42.3% and large (250+ employees) accounted for 45.3% of private sector employment. At March 2014, small- and medium-sized enterprises (SMEs) accounted for 80.5% of private sector employment in remote rural areas compared to 69.4% in accessible rural areas and 45.9% in the rest of Scotland.36
Many small or micro businesses are unregistered so they do not feature in these statistics. It is estimated that the number of unregistered businesses with no employees at March 2014 was around 168,490. This would include small sole traders/partnerships with no employees and an annual turnover of less than the VAT threshold. Although some may have been set up by individuals precisely in order to enable a balance between work and family those businesses that do grow to employ others are likely to find it difficult to develop the capacity needed to embrace a more family-friendly approach.
11.5% of employees in Scotland are self-employed, a rise of 0.9% since 2008 proportionate to other types of employment. Self-employed people do not have statutory rights to flexible working, paternity leave or other parental/carers leave.
Men are the majority of self-employed people but the number of women who are self-employed is increasing at a faster rate than men (associated with reduction in male-dominated skilled trades, for example in construction). The top three occupations for self-employed women are cleaners and domestics, childminders and related occupations, and hairdressers and barbers. The average income from self-
employment has fallen by over a fifth since 2008.37
Parenting and caring is still gendered. In society generally, what is seen as being a ‘good mother’ is significantly different from what is seen as a ‘good father’. There are strong expectations that women will take on the bulk of caring for children and others as well as the associated domestic activities, and that they will adapt their
33 Scottish Government, Public Sector Employment in Scotland, statistics for fourth quarter 2014, published March 2015 www.gov.scot/Publications/2015/03/2302 34 The nature and pattern of family-friendly employment policies in Britain www.jrf.org.uk/sites/files/jrf/5112.pdf 35
www.gov.uk/government/uploads/system/uploads/attachment_data/file/398557/
bis-14-1027-fourth-work-life-balance- employer-survey-2013.pdf

17
36 Businesses in Scotland. Scottish Government, 2014 www.gov.scot/Resource/0046/00462532.pdf 37 Self-employed workers in the UK. ONS, 2014 www.ons.gov.uk/ons/dcp171776_374941.pdf
18
working lives, income and expectations to suit. These expectations work against fathers who want a more active role in their families. They may be disinclined to use flexible policies in case they are seen as less committed or in case they experience the same career penalty as women. Given gender occupational segregation and the consequent pay differentials, in a couple household of a man, woman and children, it may simply not make sense for the higher earner (probably the man) to lose household income.
However, women in their 20s are now earning the same amount as their male counterparts, suggesting that for first-time parents, if both parents have previously been working full-time, decisions about income may not be so clear cut. Similarly, in low-income households, the pay gap is lower at 5.9% and income may therefore not be the compelling factor.38
Recent research39 with fathers of very young children indicates that fathers’ awareness of potential access to family-friendly arrangements and flexible working is limited. Their actual access is also limited if they are on a low income or work in an SME or are in a managerial role. However, those fathers who could take up flexible working said that they were more engaged employees. Tellingly, there is little available literature about employed men’s caring responsibilities for older children or elderly relatives.
The UK Modern Families Index 201540 comments on some deep-seated barriers to family-friendly working within workplaces. These include a culture of long hours (which in itself deters women and some men with families), people having to work long hours because their jobs are too big for the hours allocated and a ‘trust gap’ exhibited in, for example, the opinion that people who are working remotely are not as productive as those in the office.
Employers themselves may be concerned about how they will cover a service if staff are absent, especially if they are a very small business and may prefer informal and ad-hoc arrangements. A survey with employers indicated that while they thought that family-friendly working policies were morally right, it was not practical for their business.41
The following section sets out the main findings of the survey.
38 www.equalpayportal.co.uk/statistics
39 Fathers in the early years; how do they balance their work and family life? Family Friendly Working Scotland and Fathers Network Scotland, 2015 40 Modern Families Index (2015) Bright Horizons and Working Families 41 E Jordan et al. Employment Regulation Part B: Employer perceptions of maternity and paternity leave and flexible working arrangements, DBIS 2014 www.gov.uk/government/uploads/system/uploads/attachment_data/file/284559/BIS_employment_regulatio n_Part_B_V3.pdf
19
Survey findings
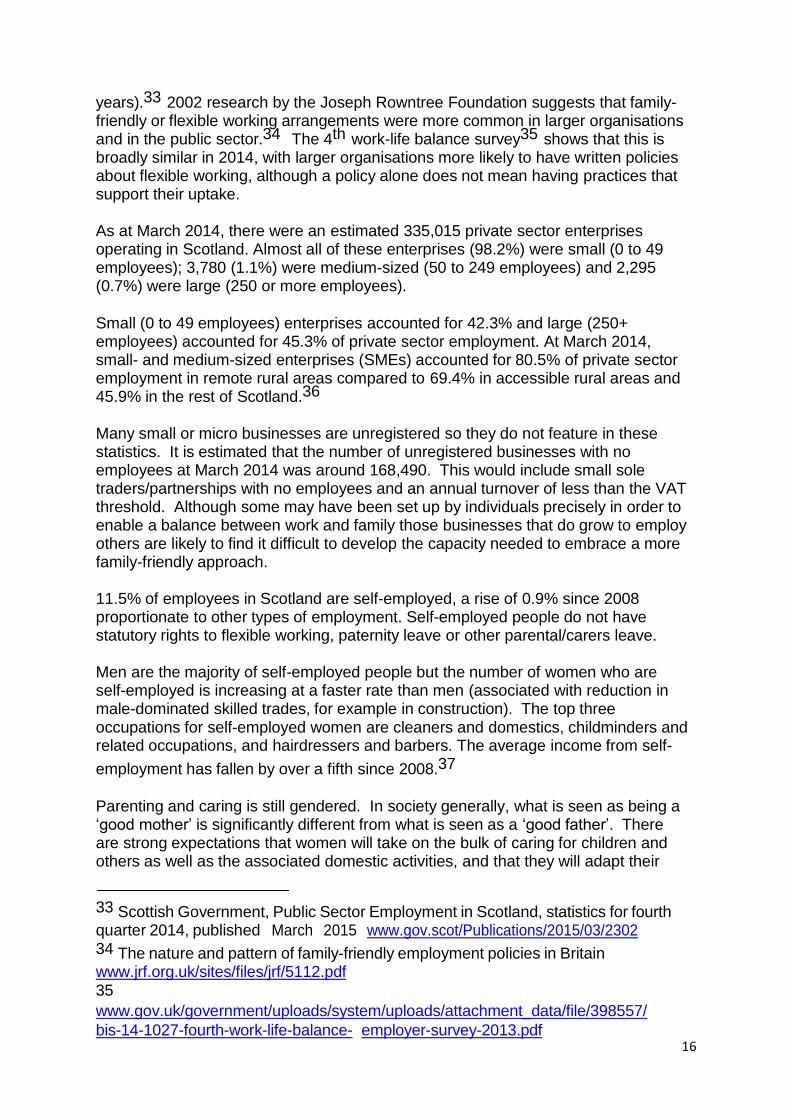
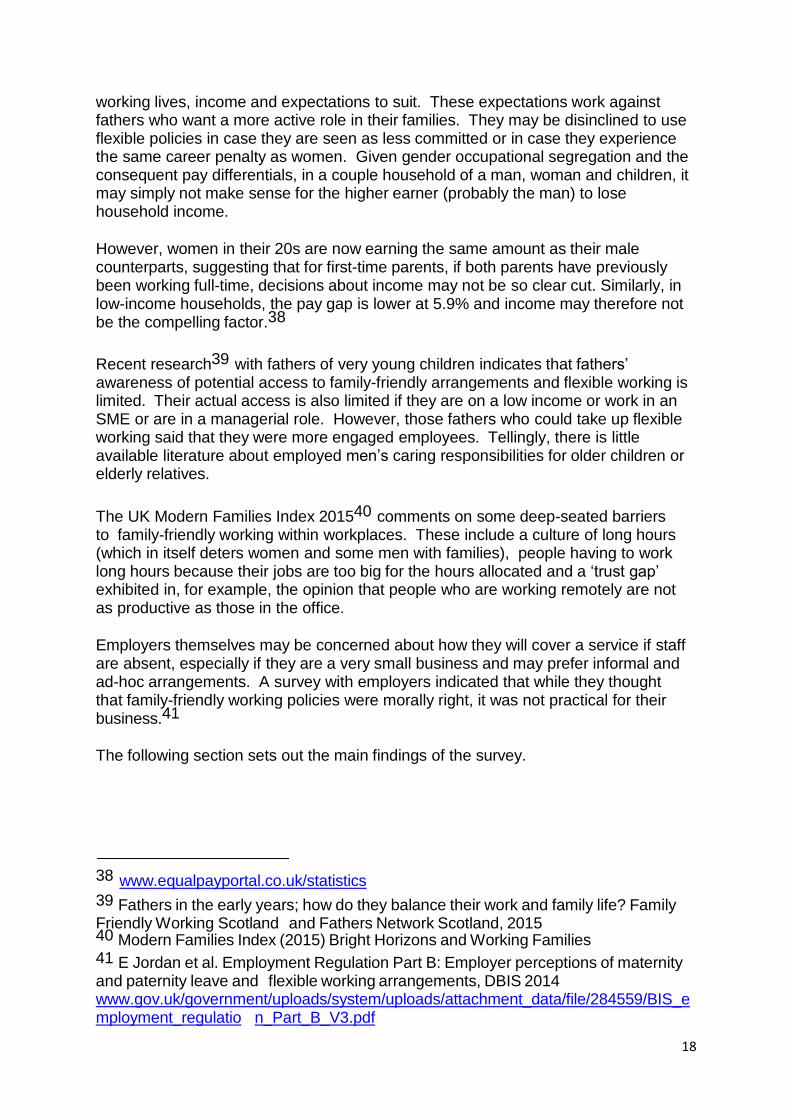
1. Profile of respondents 1,005 working parents with at least one dependent child resident some or all of the time took part in the survey. There was one respondent per household comprising 510 female respondents and 495 male respondents. The age and locations of the respondents can be seen in Fig 1 & Fig 2 below.
The 1,005 families in the survey had 1,633 dependent children.
Fig 1
Fig 2
Responses by region
4%
6% 6% 10%
8%
39% 13%
14%
Highlands & Islands
Lothians
West
North East
Central
South
Mid & Fife
Glasgow
n=1005
Age of respondents
4% 13%
21%
30%
32%
16 - 25 26 - 35 36 - 45 46 - 55 56+ n=1005
20
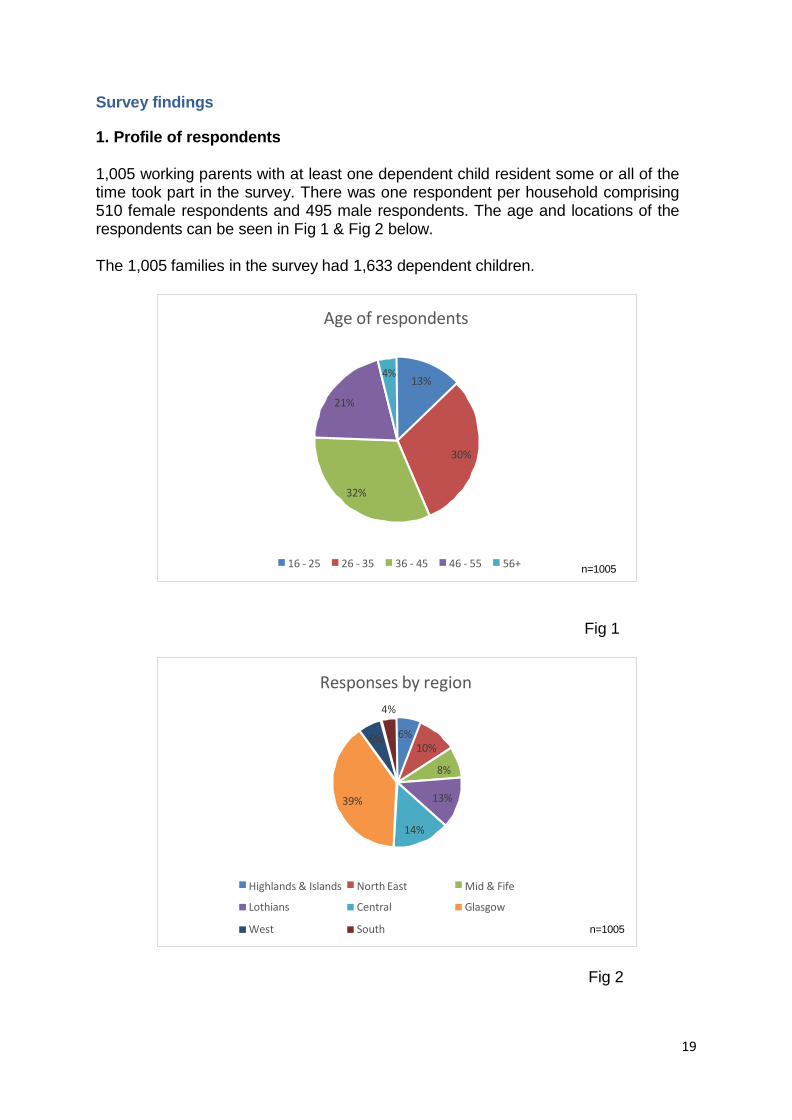
Relationship type Over three in five (62%) of respondents were married, in a civil partnership or cohabiting. 38% were lone parents (25% women and 13% men). It is not known how many cohabiting relationships involved same-sex partners. The survey was conducted before same-sex marriage was introduced in Scotland.
Relationship type 3%
1% 2%
15%
17%
52%
10%
Single In a relationship
Married/Civil Partnership
Widowed Divorced
Cohabi
ting
Separa
ted
n=1005
Fig 3
Number of children in household All the families surveyed had at least one dependent child (under 18) living with them. Over half (510) of families had two children and 13% (128) of families had three. The median ages of children were nine for one-child families, eight for two- child families and seven for three-child families. 15% of respondents said that they had a dependent with a disability significant enough to affect their own ability to work.
2. Income and work
53% of lone parent families and 18% of two parent families earned less than
the Joseph Rowntree Foundation’s Minimum Income Standard
86% of male and 60% of female respondents worked full-time. 33% of female and 7% of male respondents worked part-time.
Two in five women (41.7%) and less than one in ten (9.2%) men reduce their working hours to care for children under age eight.
21
Income of lone parents
120
100
80
60
40
20
0
n=379
Income by gender
Not working
More than £100,000
£75,000-£100,000
£50,000-£75,000
£41,000-£50,000
£31,000-£40,000
£21,000-£30,000
Less than £20,000
0% 20% 40% 60% 80% 100%
male female n=1005
28% of respondents went home on time every day. The other three-quarters were working for longer with 22% persistently working for longer than their contracted hours.
Over a third of respondents (36%, 364) were not working flexibly. This was a positive choice for just under a third of them. The other two thirds gave reasons associated with lack of choice and perceived barriers.
54% reported barriers to flexible working which were organisational and related to role, line manager attitude or refused requests.
41% said that their role did not accommodate flexible working. Over two thirds of these were women.
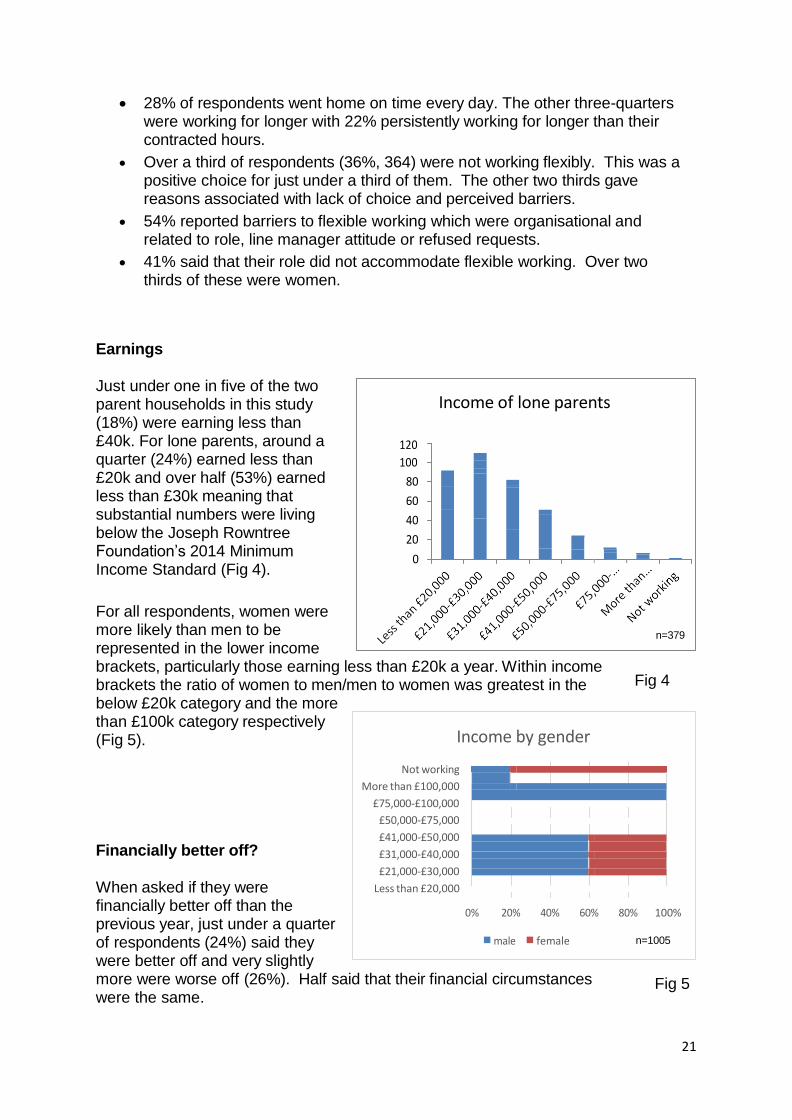
Earnings Just under one in five of the two parent households in this study (18%) were earning less than £40k. For lone parents, around a quarter (24%) earned less than £20k and over half (53%) earned less than £30k meaning that substantial numbers were living below the Joseph Rowntree Foundation’s 2014 Minimum Income Standard (Fig 4).
For all respondents, women were more likely than men to be represented in the lower income brackets, particularly those earning less than £20k a year. Within income brackets the ratio of women to men/men to women was greatest in the below £20k category and the more than £100k category respectively (Fig 5).
Financially better off?
When asked if they were financially better off than the previous year, just under a quarter of respondents (24%) said they were better off and very slightly more were worse off (26%). Half said that their financial circumstances were the same.
Fig 4
Fig 5
22
Employment patterns
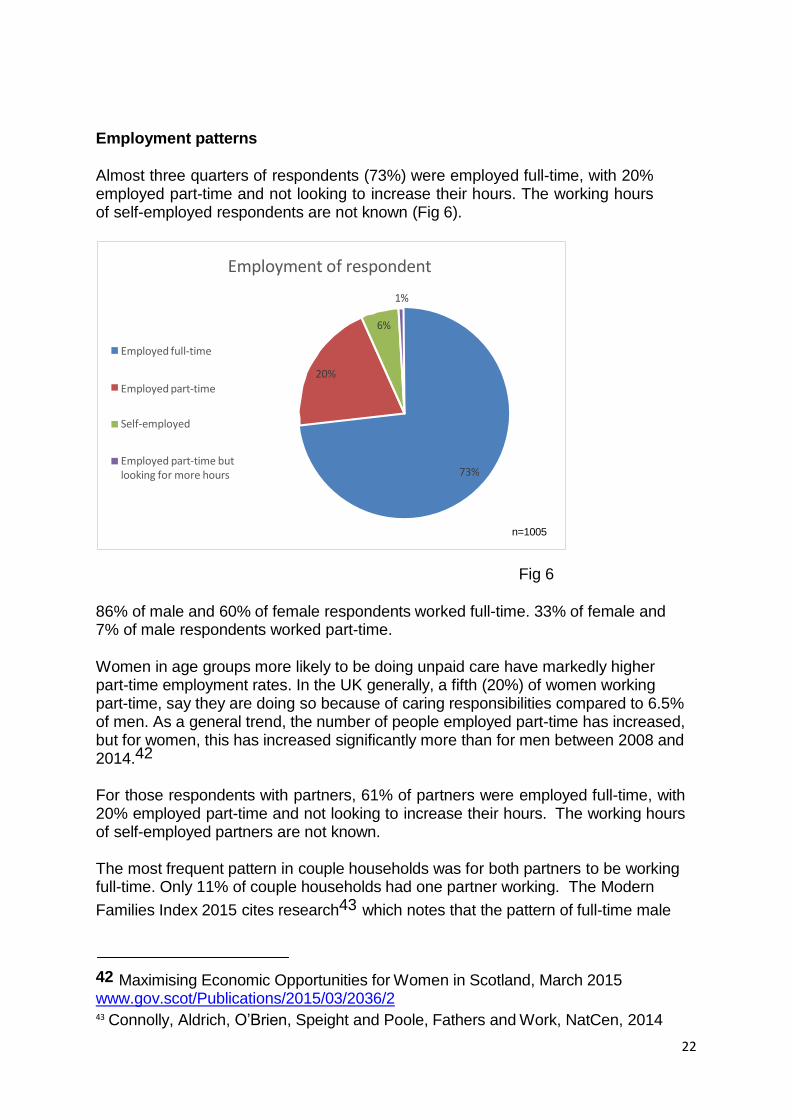
Almost three quarters of respondents (73%) were employed full-time, with 20% employed part-time and not looking to increase their hours. The working hours of self-employed respondents are not known (Fig 6).
Fig 6
86% of male and 60% of female respondents worked full-time. 33% of female and 7% of male respondents worked part-time.
Women in age groups more likely to be doing unpaid care have markedly higher part-time employment rates. In the UK generally, a fifth (20%) of women working part-time, say they are doing so because of caring responsibilities compared to 6.5% of men. As a general trend, the number of people employed part-time has increased, but for women, this has increased significantly more than for men between 2008 and 2014.42
For those respondents with partners, 61% of partners were employed full-time, with 20% employed part-time and not looking to increase their hours. The working hours of self-employed partners are not known.
The most frequent pattern in couple households was for both partners to be working full-time. Only 11% of couple households had one partner working. The Modern
Families Index 2015 cites research43 which notes that the pattern of full-time male
42 Maximising Economic Opportunities for Women in Scotland, March 2015 www.gov.scot/Publications/2015/03/2036/2 43 Connolly, Aldrich, O’Brien, Speight and Poole, Fathers and Work, NatCen, 2014
Employment of respondent
1%
6%
Employed full-time
20% Employed part-time
Self-employed
Employed part-time but looking for more hours 73%
n=1005
20
and part-time female may be in decline. However, the gender employment gap on a full-time equivalent (FTE) basis is increasing (currently 15.3% in Scotland).44
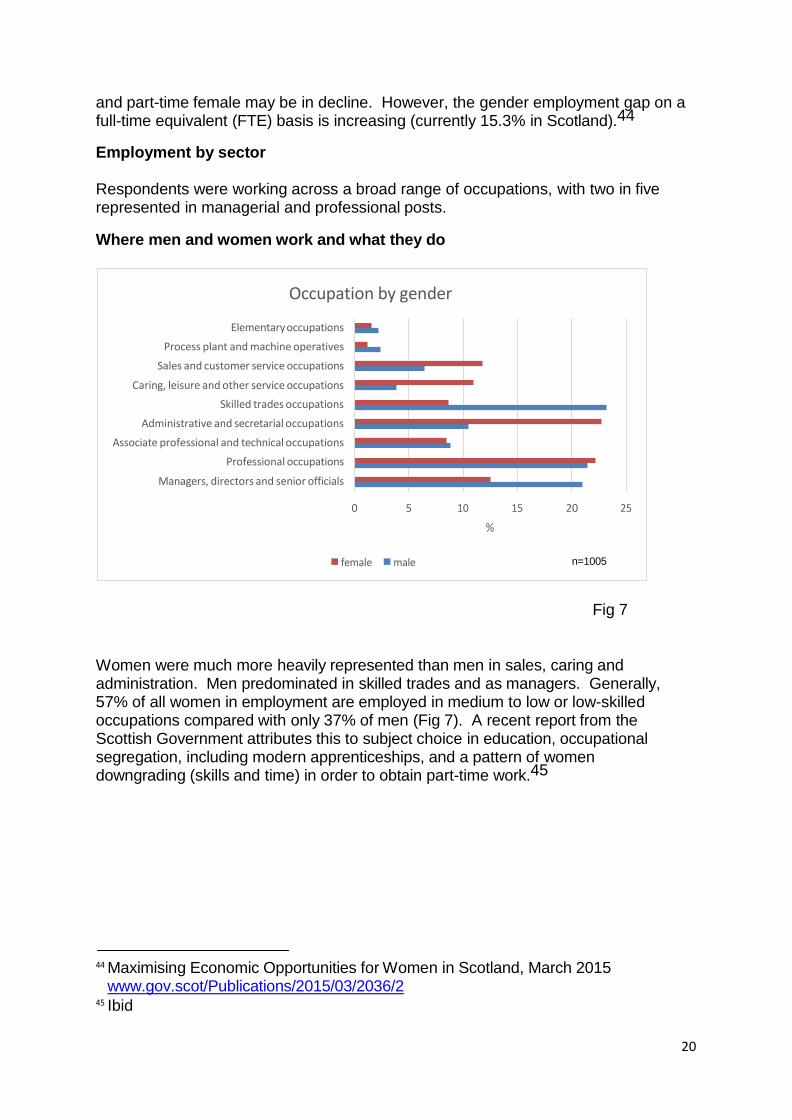
Employment by sector Respondents were working across a broad range of occupations, with two in five represented in managerial and professional posts.
Where men and women work and what they do
Fig 7
Women were much more heavily represented than men in sales, caring and administration. Men predominated in skilled trades and as managers. Generally, 57% of all women in employment are employed in medium to low or low-skilled occupations compared with only 37% of men (Fig 7). A recent report from the Scottish Government attributes this to subject choice in education, occupational segregation, including modern apprenticeships, and a pattern of women downgrading (skills and time) in order to obtain part-time work.45
44 Maximising Economic Opportunities for Women in Scotland, March 2015 www.gov.scot/Publications/2015/03/2036/2
45 Ibid
Occupation by gender
Elementary occupations
Process plant and machine operatives
Sales and customer service occupations
Caring, leisure and other service occupations
Skilled trades occupations
Administrative and secretarial occupations
Associate professional and technical occupations
Professional occupations
Managers, directors and senior officials
0 5 10 15 20 25
%
female male n=1005
21
Employment sector by gender
80
70
60
50
40
30
20
10
0
Private Public
male female
Fig 8
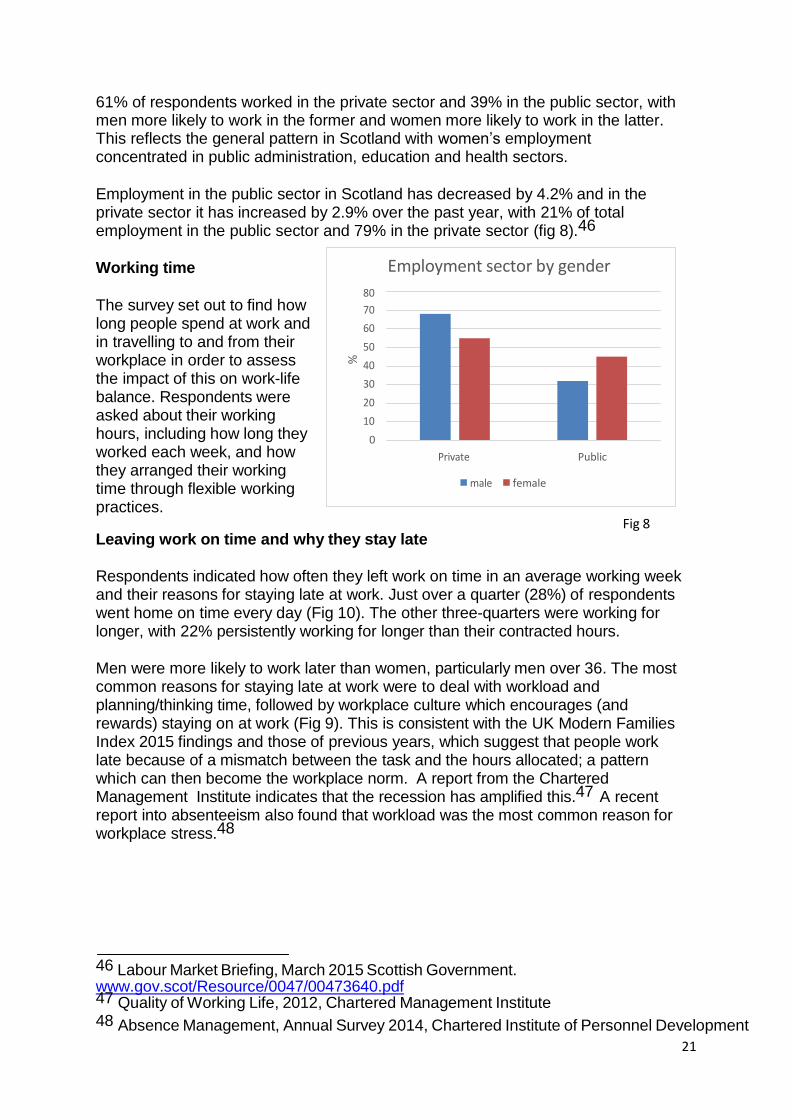
61% of respondents worked in the private sector and 39% in the public sector, with men more likely to work in the former and women more likely to work in the latter. This reflects the general pattern in Scotland with women’s employment concentrated in public administration, education and health sectors.
Employment in the public sector in Scotland has decreased by 4.2% and in the private sector it has increased by 2.9% over the past year, with 21% of total employment in the public sector and 79% in the private sector (fig 8).46
Working time
The survey set out to find how long people spend at work and in travelling to and from their workplace in order to assess the impact of this on work-life balance. Respondents were asked about their working hours, including how long they worked each week, and how they arranged their working time through flexible working practices.
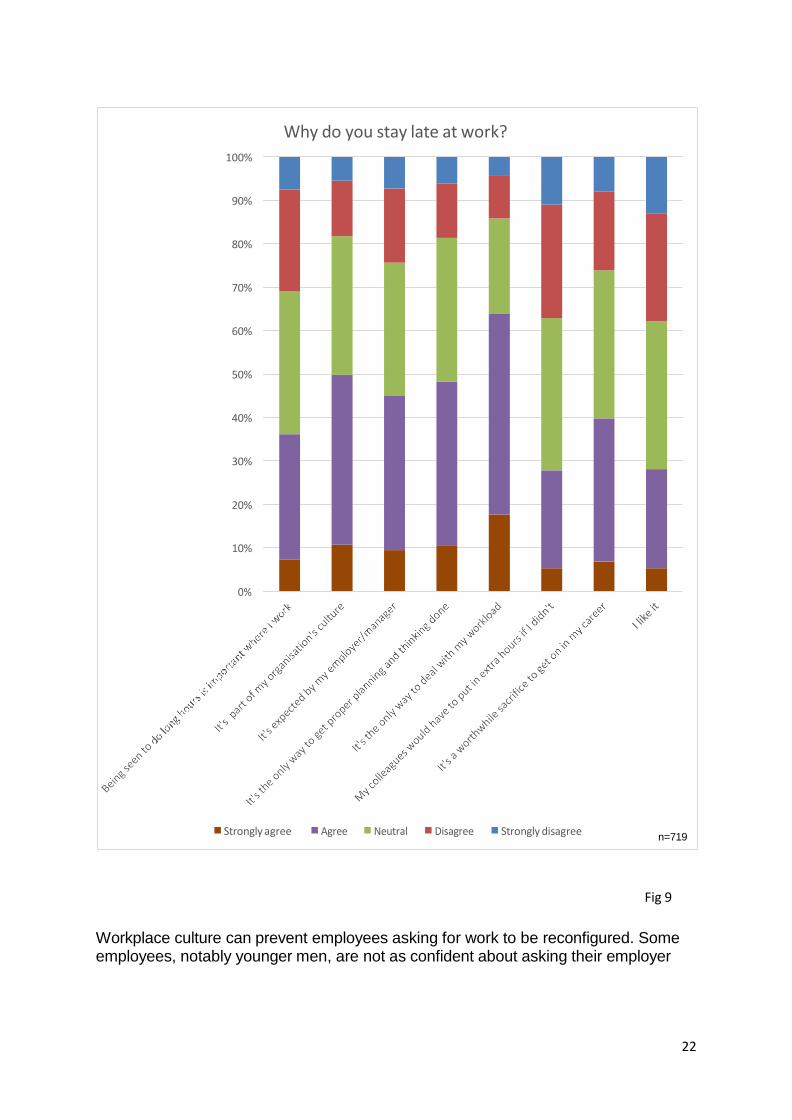
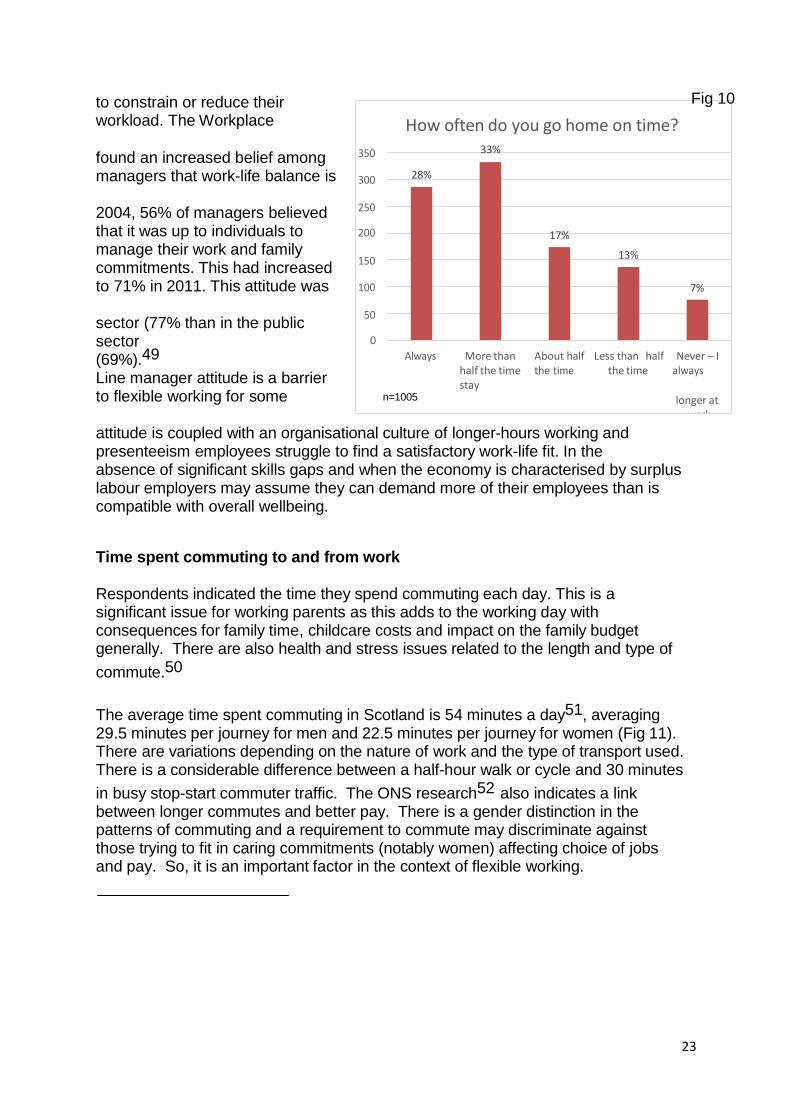
Leaving work on time and why they stay late Respondents indicated how often they left work on time in an average working week and their reasons for staying late at work. Just over a quarter (28%) of respondents went home on time every day (Fig 10). The other three-quarters were working for longer, with 22% persistently working for longer than their contracted hours.
Men were more likely to work later than women, particularly men over 36. The most common reasons for staying late at work were to deal with workload and planning/thinking time, followed by workplace culture which encourages (and rewards) staying on at work (Fig 9). This is consistent with the UK Modern Families Index 2015 findings and those of previous years, which suggest that people work late because of a mismatch between the task and the hours allocated; a pattern which can then become the workplace norm. A report from the Chartered Management Institute indicates that the recession has amplified this.47 A recent report into absenteeism also found that workload was the most common reason for workplace stress.48
46 Labour Market Briefing, March 2015 Scottish Government. www.gov.scot/Resource/0047/00473640.pdf 47 Quality of Working Life, 2012, Chartered Management Institute 48 Absence Management, Annual Survey 2014, Chartered Institute of Personnel Development
%
22
Workplace culture can prevent employees asking for work to be reconfigured. Some employees, notably younger men, are not as confident about asking their employer
Fig 9
Why do you stay late at work?
100%
90%
80%
70%
60%
50%
40%
30%
20%
10%
0%
Strongly agree Agree Neutral Disagree Strongly disagree n=719
23
Always More than About half Less than half Never – I half the time the time the time always stay
n=1005 longer at work
350
How often do you go home on time? 33%
300 28%
250
200 17%
150 13%
100 7%
50
0
to constrain or reduce their workload. The Workplace
found an increased belief among managers that work-life balance is
2004, 56% of managers believed that it was up to individuals to manage their work and family commitments. This had increased to 71% in 2011. This attitude was
sector (77% than in the public sector (69%).49 Line manager attitude is a barrier to flexible working for some
attitude is coupled with an organisational culture of longer-hours working and presenteeism employees struggle to find a satisfactory work-life fit. In the absence of significant skills gaps and when the economy is characterised by surplus labour employers may assume they can demand more of their employees than is compatible with overall wellbeing.
Time spent commuting to and from work Respondents indicated the time they spend commuting each day. This is a significant issue for working parents as this adds to the working day with consequences for family time, childcare costs and impact on the family budget generally. There are also health and stress issues related to the length and type of
commute.50
The average time spent commuting in Scotland is 54 minutes a day51, averaging 29.5 minutes per journey for men and 22.5 minutes per journey for women (Fig 11). There are variations depending on the nature of work and the type of transport used. There is a considerable difference between a half-hour walk or cycle and 30 minutes
in busy stop-start commuter traffic. The ONS research52 also indicates a link between longer commutes and better pay. There is a gender distinction in the patterns of commuting and a requirement to commute may discriminate against those trying to fit in caring commitments (notably women) affecting choice of jobs and pay. So, it is an important factor in the context of flexible working.
Fig 10
24
250
200
150
Flexible working by sector and gender
44%
34%
27% 23% 21% 22%
100 18%
10% 50
0
yes no yes no
Do you work flexibly?
private
Do you work flexibly?
public
male female n=1005
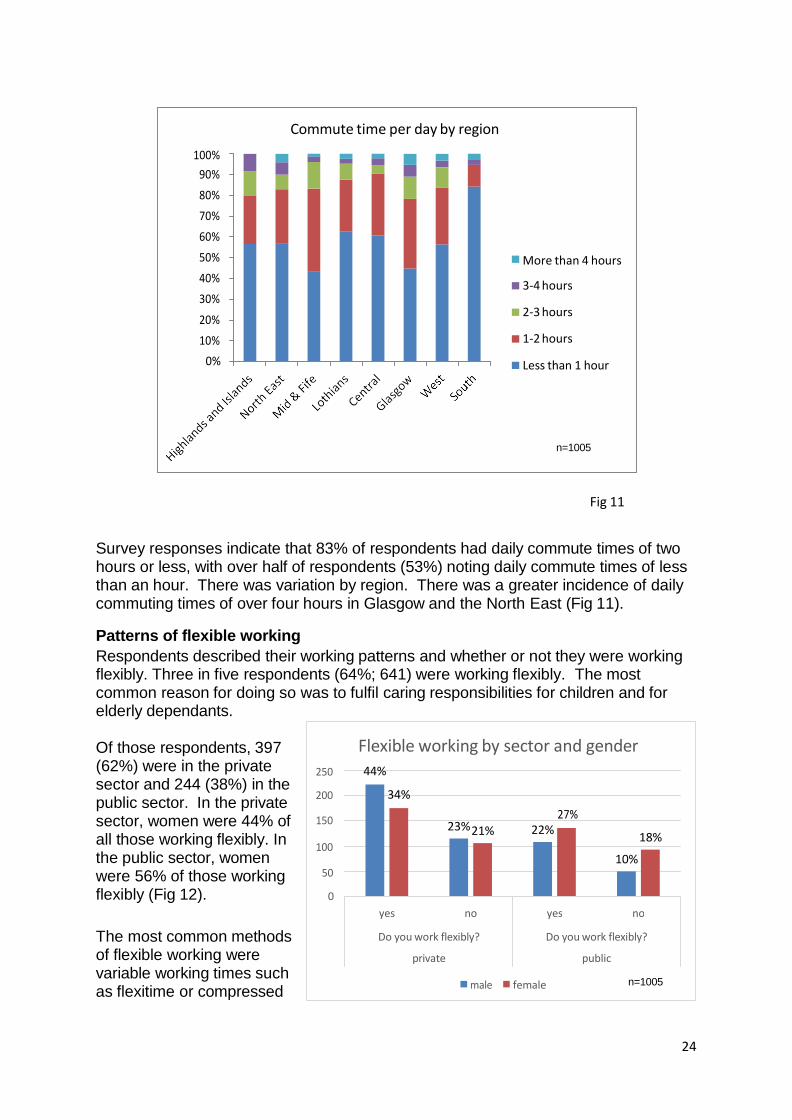
Survey responses indicate that 83% of respondents had daily commute times of two hours or less, with over half of respondents (53%) noting daily commute times of less than an hour. There was variation by region. There was a greater incidence of daily commuting times of over four hours in Glasgow and the North East (Fig 11).
Patterns of flexible working
Respondents described their working patterns and whether or not they were working flexibly. Three in five respondents (64%; 641) were working flexibly. The most common reason for doing so was to fulfil caring responsibilities for children and for elderly dependants.
Of those respondents, 397 (62%) were in the private sector and 244 (38%) in the public sector. In the private sector, women were 44% of all those working flexibly. In the public sector, women were 56% of those working flexibly (Fig 12).
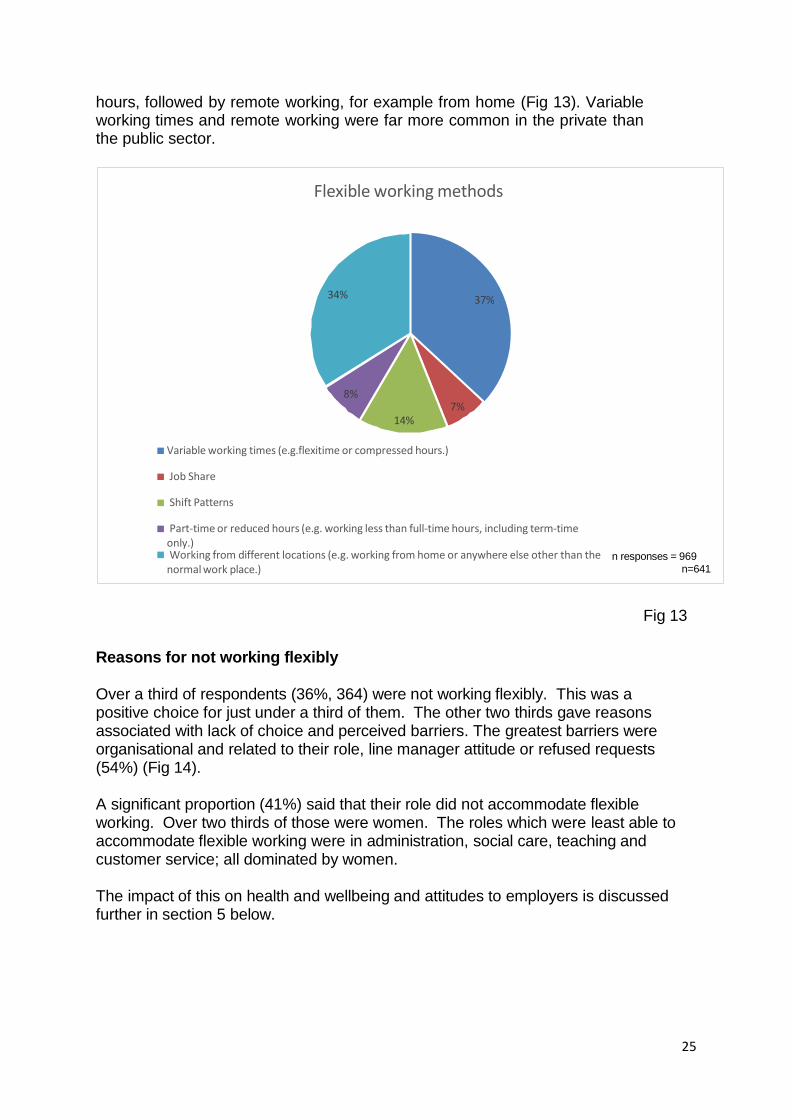
The most common methods of flexible working were variable working times such as flexitime or compressed
Fig 11
Commute time per day by region
100%
90%
80%
70%
60%
50%
40%
30%
20%
10%
0%
More than 4 hours
3-4 hours
2-3 hours
1-2 hours
Less than 1 hour
n=1005
25
hours, followed by remote working, for example from home (Fig 13). Variable working times and remote working were far more common in the private than the public sector.
Fig 13
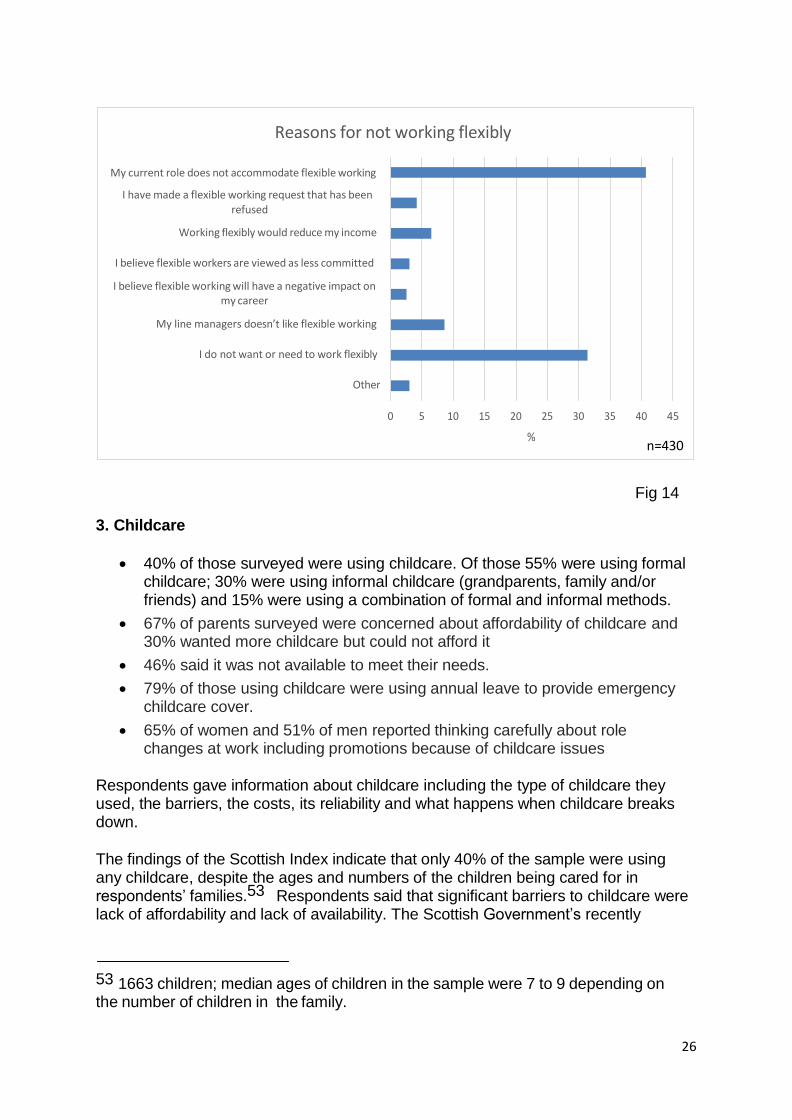
Reasons for not working flexibly Over a third of respondents (36%, 364) were not working flexibly. This was a positive choice for just under a third of them. The other two thirds gave reasons associated with lack of choice and perceived barriers. The greatest barriers were organisational and related to their role, line manager attitude or refused requests (54%) (Fig 14).
A significant proportion (41%) said that their role did not accommodate flexible working. Over two thirds of those were women. The roles which were least able to accommodate flexible working were in administration, social care, teaching and customer service; all dominated by women.
The impact of this on health and wellbeing and attitudes to employers is discussed further in section 5 below.
Flexible working methods
34% 37%
8% 7%
14%
Variable working times (e.g.flexitime or compressed hours.)
Job Share
Shift Patterns
Part-time or reduced hours (e.g. working less than full-time hours, including term-time only.) Working from different locations (e.g. working from home or anywhere else other than the n responses = 969
normal work place.) n=641
26
Fig 14
3. Childcare
40% of those surveyed were using childcare. Of those 55% were using formal childcare; 30% were using informal childcare (grandparents, family and/or friends) and 15% were using a combination of formal and informal methods.
67% of parents surveyed were concerned about affordability of childcare and 30% wanted more childcare but could not afford it
46% said it was not available to meet their needs.
79% of those using childcare were using annual leave to provide emergency childcare cover.
65% of women and 51% of men reported thinking carefully about role changes at work including promotions because of childcare issues
Respondents gave information about childcare including the type of childcare they used, the barriers, the costs, its reliability and what happens when childcare breaks down.
The findings of the Scottish Index indicate that only 40% of the sample were using any childcare, despite the ages and numbers of the children being cared for in respondents’ families.53 Respondents said that significant barriers to childcare were lack of affordability and lack of availability. The Scottish Government’s recently
53 1663 children; median ages of children in the sample were 7 to 9 depending on the number of children in the family.
Reasons for not working flexibly
My current role does not accommodate flexible working
I have made a flexible working request that has been refused
Working flexibly would reduce my income
I believe flexible workers are viewed as less committed
I believe flexible working will have a negative impact on my career
My line managers doesn’t like flexible working
I do not want or need to work flexibly
Other
0 5 10 15 20 25 30 35 40 45
% n=430
27
expanded free provision for pre-school age children should go some way to addressing this but childcare outside the age groups currently being targeted is likely to remain an issue for many families.
Working parents with dependent children use a wide variety of childcare in order to ensure that children are looked after before, during and at the end of the working day. This childcare is a mix of formal and informal, paid for and free. One or both parents may reduce or give up employment, they may use grandparents and informal methods, paid-for-care including registered childminders, pre-school nurseries, out- of-school care, depending on availability, cost, age and stage of children, proximity of family and so on (fig 15). Families in Scotland are more likely use grandparents than in other parts of the UK. A poll for Grandparents Plus and others shows, across the UK as a whole, increasing numbers of grandparents are stepping in to support families who are unable to meet the cost of childcare.54
The Scottish Index found that grandparents were an important provider of informal childcare and they also contributed to the costs of formal childcare.
Childcare is often assumed to be for under-fives but working parents need care for children of all ages and that can get even more problematic when children are young teenagers and during school holidays. There is a particular lack of provision for disabled children.55
The high costs and lack of availability mean that many families look for informal sources or juggle working hours to fit. Families who depend solely on formal, paid- for childcare are likely to have to pay a great deal for it.
The families in this survey were using, on average, less than 15 hours of formal childcare a week across all age groups of children (Fig 16.
Parents in the Scottish Index said that they were using shorter hours and flexible working in order to manage their caring responsibilities. There was also evidence to suggest that parents, particularly women, are limiting their career progression to ensure that they are able to meet these caring responsibilities.
Affordability was a major barrier to childcare for parents in survey. Of those who used formal childcare, some received assistance in the form of tax credits or childcare vouchers. Respondents were more likely to get help with costs from informal sources, such as grandparents, than from employers.
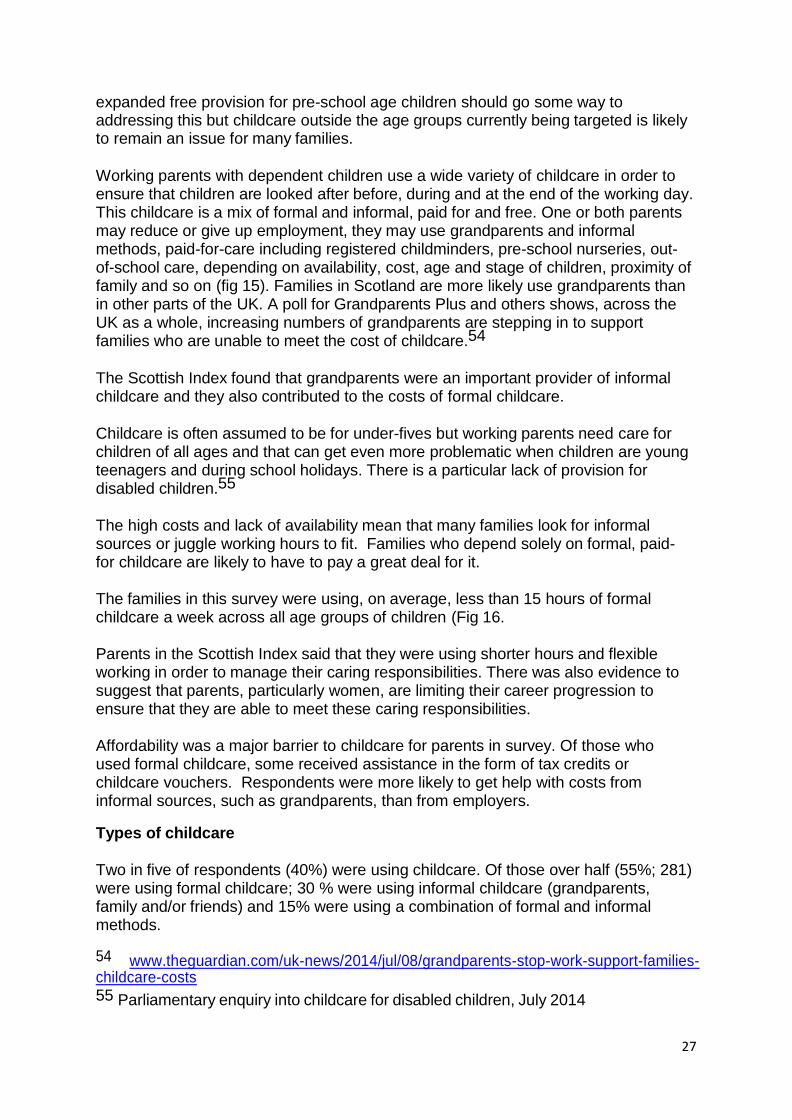
Types of childcare Two in five of respondents (40%) were using childcare. Of those over half (55%; 281) were using formal childcare; 30 % were using informal childcare (grandparents, family and/or friends) and 15% were using a combination of formal and informal methods.
54 www.theguardian.com/uk-news/2014/jul/08/grandparents-stop-work-support-families-childcare-costs 55 Parliamentary enquiry into childcare for disabled children, July 2014
28
15% of respondents were caring for a disabled child.
Fig 15
Respondents were using various types of childcare (both formal and informal) with childminders, grandparents, private nurseries and family/friends most common. The private sector (childminder, nanny and private nursery) accounted for 41% of responses. Informal methods (grandparents and family/friends) accounted for 31% (Fig 15).
67% of these respondents paid for childcare, with a further 15% using a mix of paid for and informal childcare.
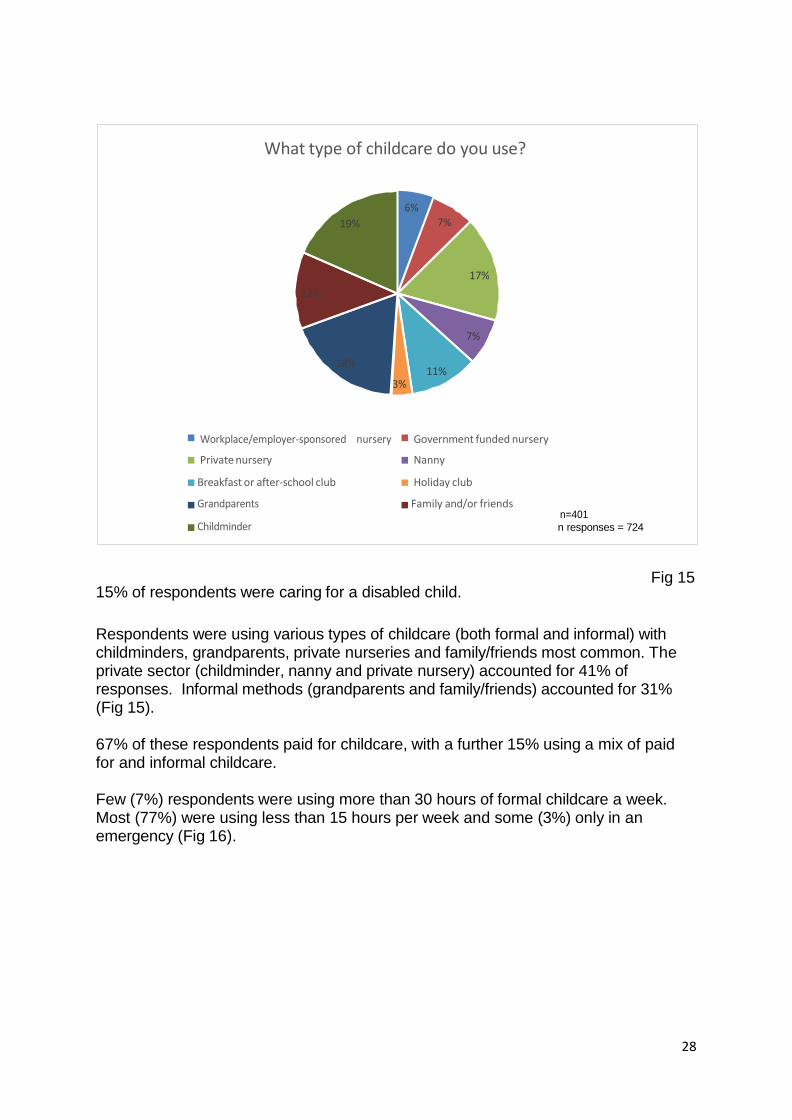
Few (7%) respondents were using more than 30 hours of formal childcare a week. Most (77%) were using less than 15 hours per week and some (3%) only in an emergency (Fig 16).
What type of childcare do you use?
6%
19% 7%
17%
12%
7%
18% 11%
3%
Workplace/employer-sponsored nursery Government funded nursery
Private nursery Nanny
Breakfast or after-school club Holiday club
Grandparents Family and/or friends n=401
Childminder n responses = 724
29
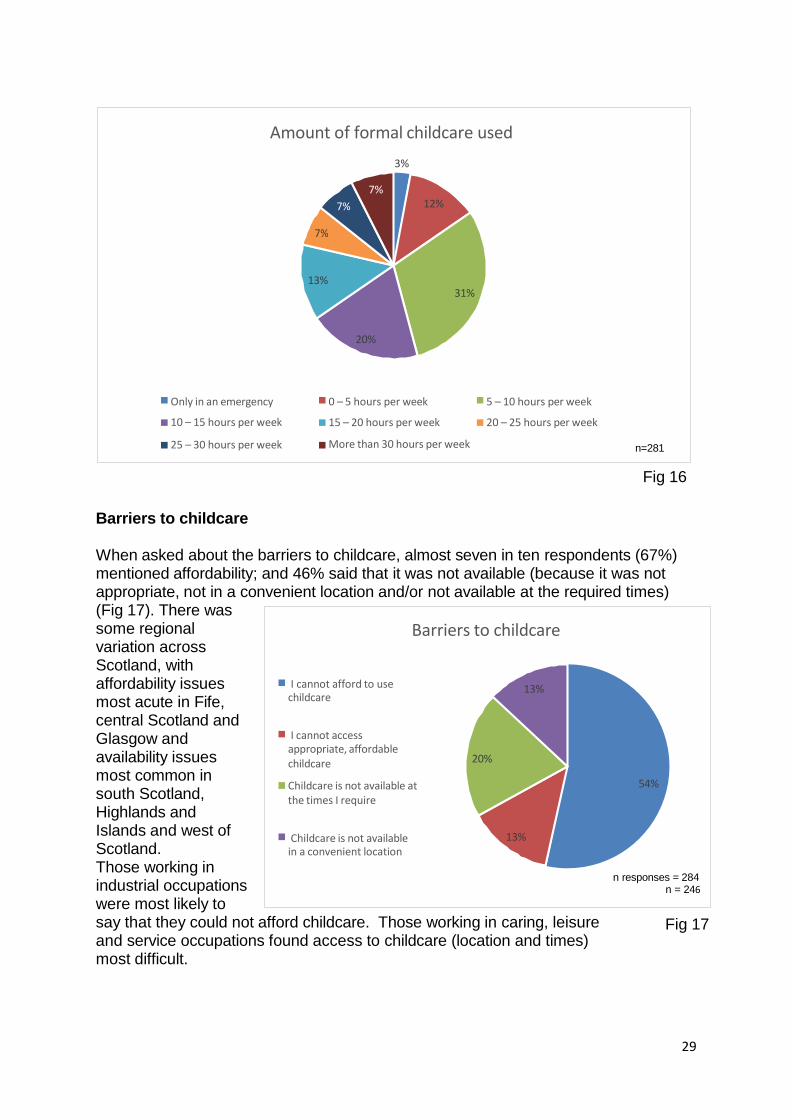
Barriers to childcare
I cannot afford to use childcare
13%
I cannot access appropriate, affordable childcare
Childcare is not available at the times I require
20%
54%
Childcare is not available in a convenient location
13%
n responses = 284 n = 246
Fig 16
Barriers to childcare When asked about the barriers to childcare, almost seven in ten respondents (67%) mentioned affordability; and 46% said that it was not available (because it was not appropriate, not in a convenient location and/or not available at the required times) (Fig 17). There was some regional variation across Scotland, with affordability issues most acute in Fife, central Scotland and Glasgow and availability issues most common in south Scotland, Highlands and Islands and west of Scotland. Those working in industrial occupations were most likely to say that they could not afford childcare. Those working in caring, leisure and service occupations found access to childcare (location and times) most difficult.
Fig 17
Amount of formal childcare used
3%
7%
7% 12%
7%
13% 31%
20%
Only in an emergency
10 – 15 hours per week
25 – 30 hours per week
0 – 5 hours per week 5 – 10 hours per week
15 – 20 hours per week 20 – 25 hours per week
More than 30 hours per week n=281
30
Do you have help with the costs of childcare?
Onsite Workplace Nursery Or Employer Prebooked Places At Offsite Nursery
Informal Source E.G. Grandparents Help With Costs
Childcare Element Of Working Tax Credits
Childcare Vouchers Via My Employer n=330 n responses = 561
0 20 40 60 80 100 120 140 160 180 200
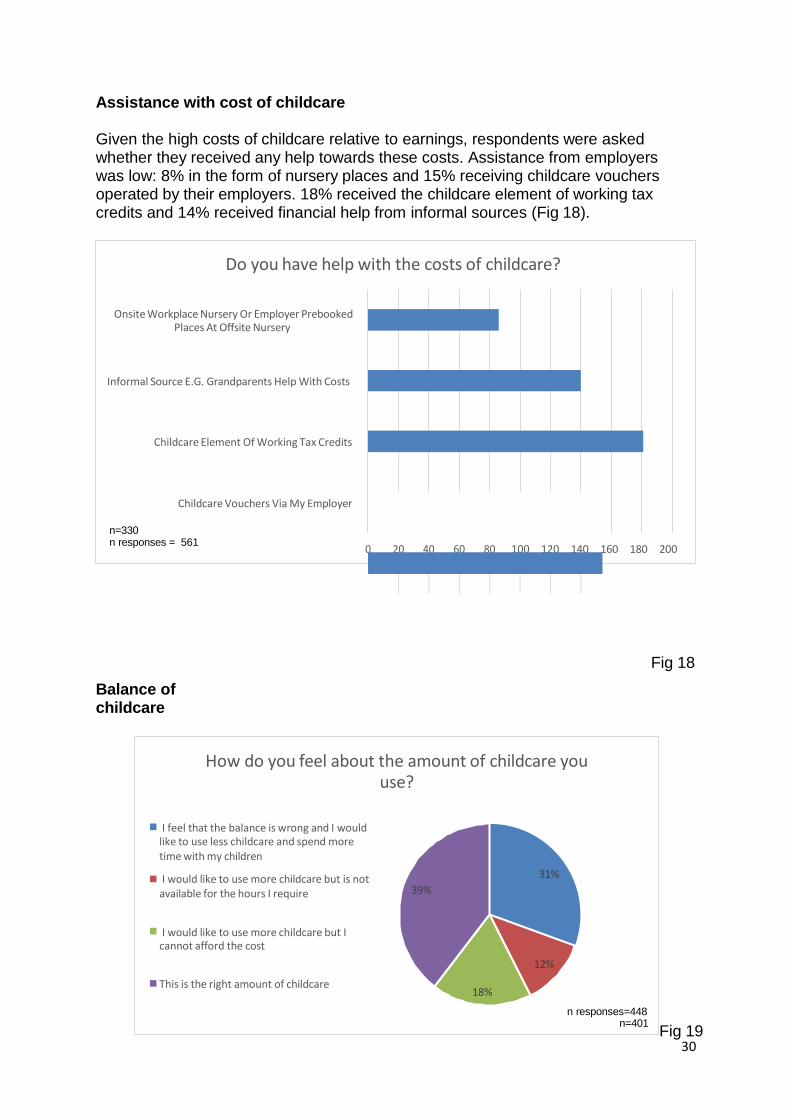
Assistance with cost of childcare Given the high costs of childcare relative to earnings, respondents were asked whether they received any help towards these costs. Assistance from employers was low: 8% in the form of nursery places and 15% receiving childcare vouchers operated by their employers. 18% received the childcare element of working tax credits and 14% received financial help from informal sources (Fig 18).
Balance of childcare
Fig 18
Fig 19
How do you feel about the amount of childcare you use?
I feel that the balance is wrong and I would like to use less childcare and spend more time with my children
I would like to use more childcare but is not available for the hours I require
31%
39%
I would like to use more childcare but I cannot afford the cost
12%
This is the right amount of childcare 18%
n responses=448 n=401
31
Causes of childcare breakdown
0% My formal care provider was
closed/unable to look after my child 11%
My child was ill and I was unable to take them to my usual childcare provider I had additional work responsibilities
on a day when I do not usually require childcare Other
33%
25%
31%
n=892
When asked about the amount of childcare they were using, around three in five respondents (61%) thought that the balance was wrong in some way. Almost a third (31%) would like to use less childcare and spend more time with their children; and 30% wanted more childcare but could not afford it, or it was not available at the times they required. 39% thought that the balance was right (Fig 19).
When childcare breaks down
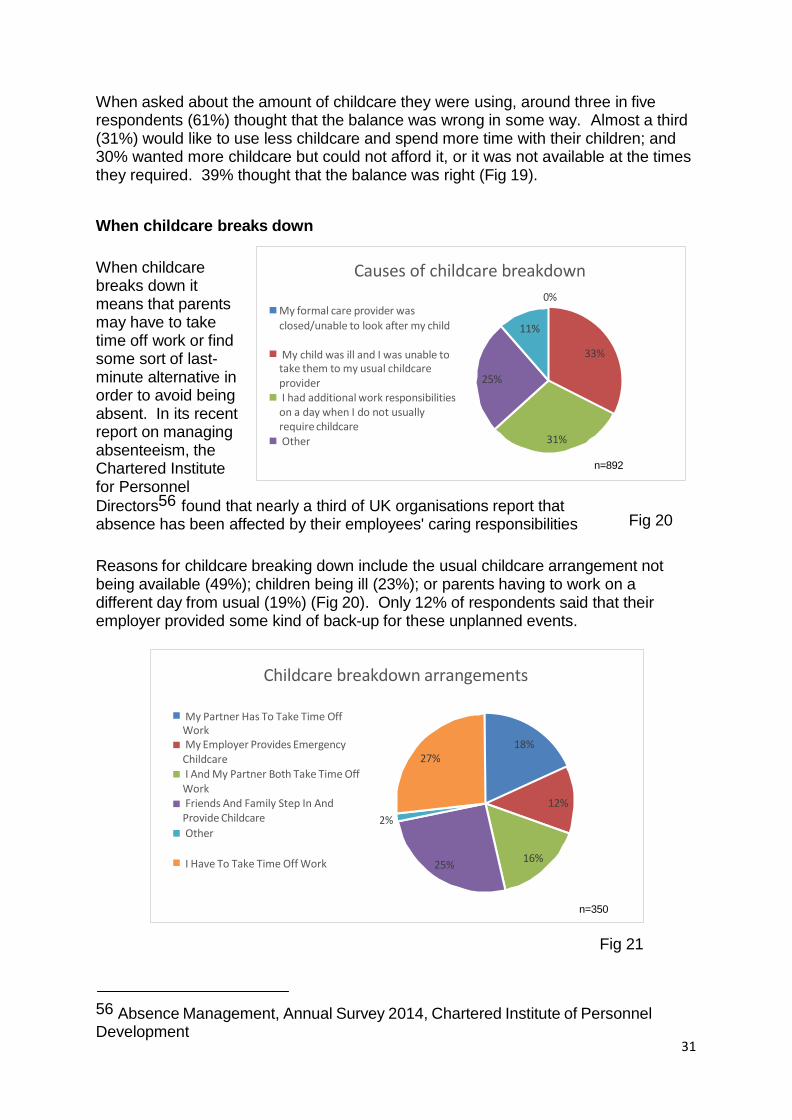
When childcare breaks down it means that parents may have to take time off work or find some sort of last- minute alternative in order to avoid being absent. In its recent report on managing absenteeism, the Chartered Institute for Personnel
Directors56 found that nearly a third of UK organisations report that absence has been affected by their employees' caring responsibilities
Fig 20
Reasons for childcare breaking down include the usual childcare arrangement not being available (49%); children being ill (23%); or parents having to work on a different day from usual (19%) (Fig 20). Only 12% of respondents said that their employer provided some kind of back-up for these unplanned events.
Fig 21
56 Absence Management, Annual Survey 2014, Chartered Institute of Personnel Development
Childcare breakdown arrangements
My Partner Has To Take Time Off Work My Employer Provides Emergency
Childcare I And My Partner Both Take Time Off
Work Friends And Family Step In And
Provide Childcare
Other
18% 27%
12%
2%
I Have To Take Time Off Work 25% 16%
n=350
32
Importance of childcare reliability
I would give up one week of paid holiday in a year for
dependable childcare.
I would value reliable childcare over additional employee
benefits (e.g. private health care, additional pension
contributions).
I would carefully consider my childcare options before
applying for a promotion or a new job
In response to this breakdown, respondents made various alternative arrangements. This generally meant that they, their partner or both of them had to take time off work with over three quarters of them (79%) having to take annual leave to cover emergency childcare. A quarter (25%) relied on friends and family Fig 21).
The findings suggest that the impact on the workplace is significant and that reliable childcare is an issue which should concern employers. Given that employers themselves were responsible for around a fifth of childcare breakdown in this sample, it suggests that more employers need to provide for back-up arrangements. Although some organisations do arrange for back-up childcare if a parent is called to work outwith their usual working hours, they are in the minority.57
Valuing reliability
Strongly agree Agree
Neither agree nor disagree
Disagree n=1005
Fig 22
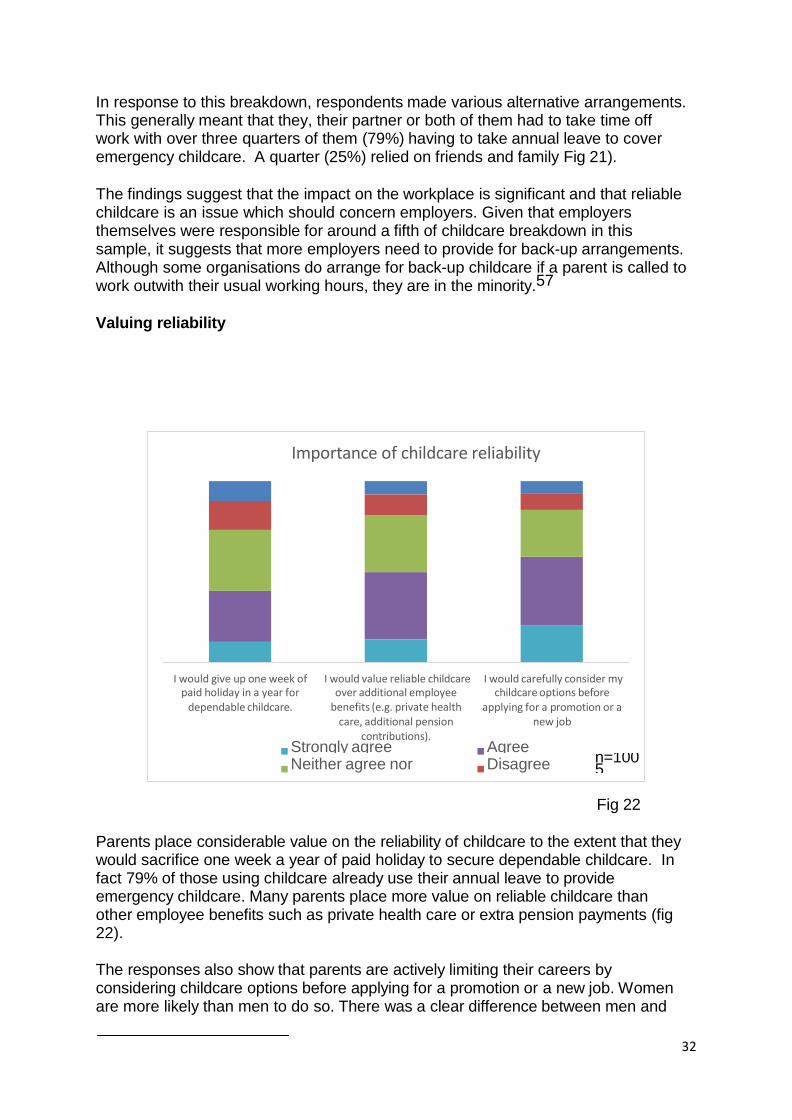
Parents place considerable value on the reliability of childcare to the extent that they would sacrifice one week a year of paid holiday to secure dependable childcare. In fact 79% of those using childcare already use their annual leave to provide emergency childcare. Many parents place more value on reliable childcare than other employee benefits such as private health care or extra pension payments (fig 22).
The responses also show that parents are actively limiting their careers by considering childcare options before applying for a promotion or a new job. Women are more likely than men to do so. There was a clear difference between men and

33
57 Scottish top employers for working families, Family Friendly Working Scotland, 2015 finalists
34
women, with 65% of women saying they would consider the childcare implications of a promotion, compared to 51% of men. This is also a limitation for employers.
Women still assume the main responsibility for childcare and in current conditions (i.e. reported lack of affordability, suitability of childcare) this is a barrier to encouraging more women into the workforce and to promotion into more senior roles. This is important both for gender equality but also workplace effectiveness.
4. Caring for elderly parents and others
Almost 30% of respondents were caring for elderly parents and others.
Almost 70% expected to be doing so within the next decade, while still also working.
More than two in five (44%) said that work affected their ability to care for elderly relatives and others often or all of the time
Respondents were asked about caring responsibilities for adults over 18.
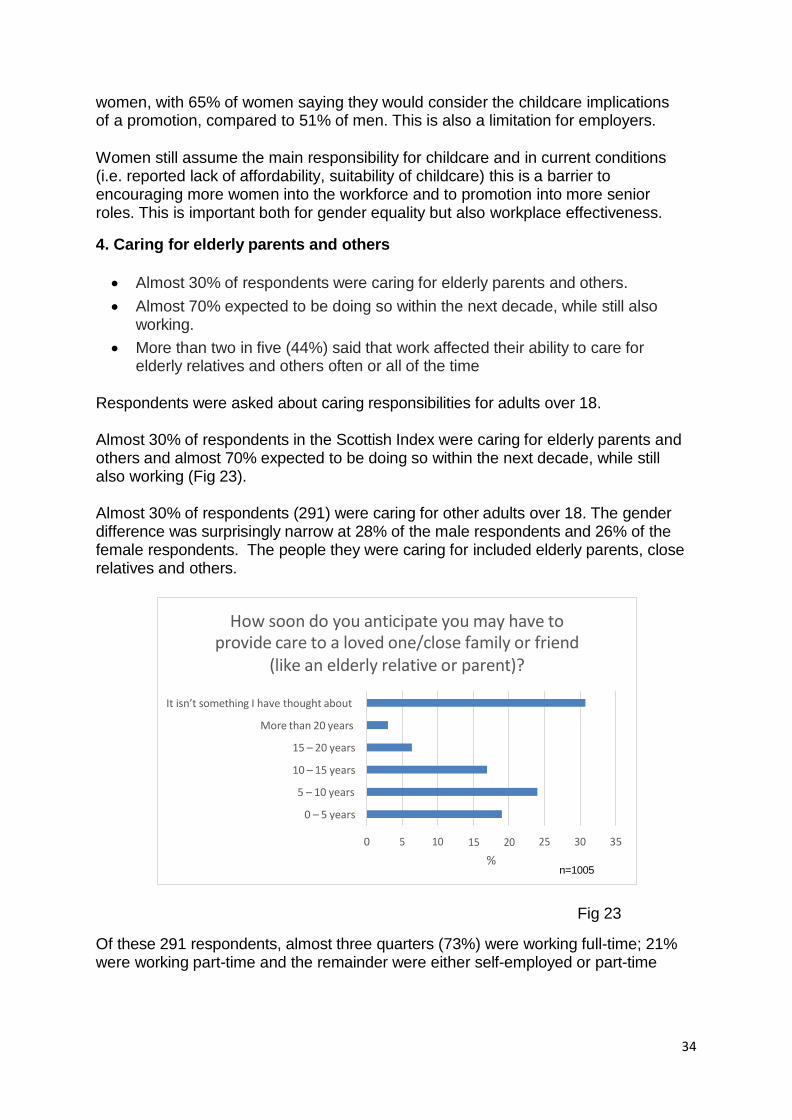
Almost 30% of respondents in the Scottish Index were caring for elderly parents and others and almost 70% expected to be doing so within the next decade, while still also working (Fig 23).
Almost 30% of respondents (291) were caring for other adults over 18. The gender difference was surprisingly narrow at 28% of the male respondents and 26% of the female respondents. The people they were caring for included elderly parents, close relatives and others.
Fig 23
Of these 291 respondents, almost three quarters (73%) were working full-time; 21% were working part-time and the remainder were either self-employed or part-time
How soon do you anticipate you may have to provide care to a loved one/close family or friend
(like an elderly relative or parent)? It isn’t something I have thought about
More than 20 years
15 – 20 years
10 – 15 years
5 – 10 years
0 – 5 years
0 5 10 15 20
%
25 30 35
n=1005
35
looking for more hours. It is not known whether the self-employed were full or part- time.
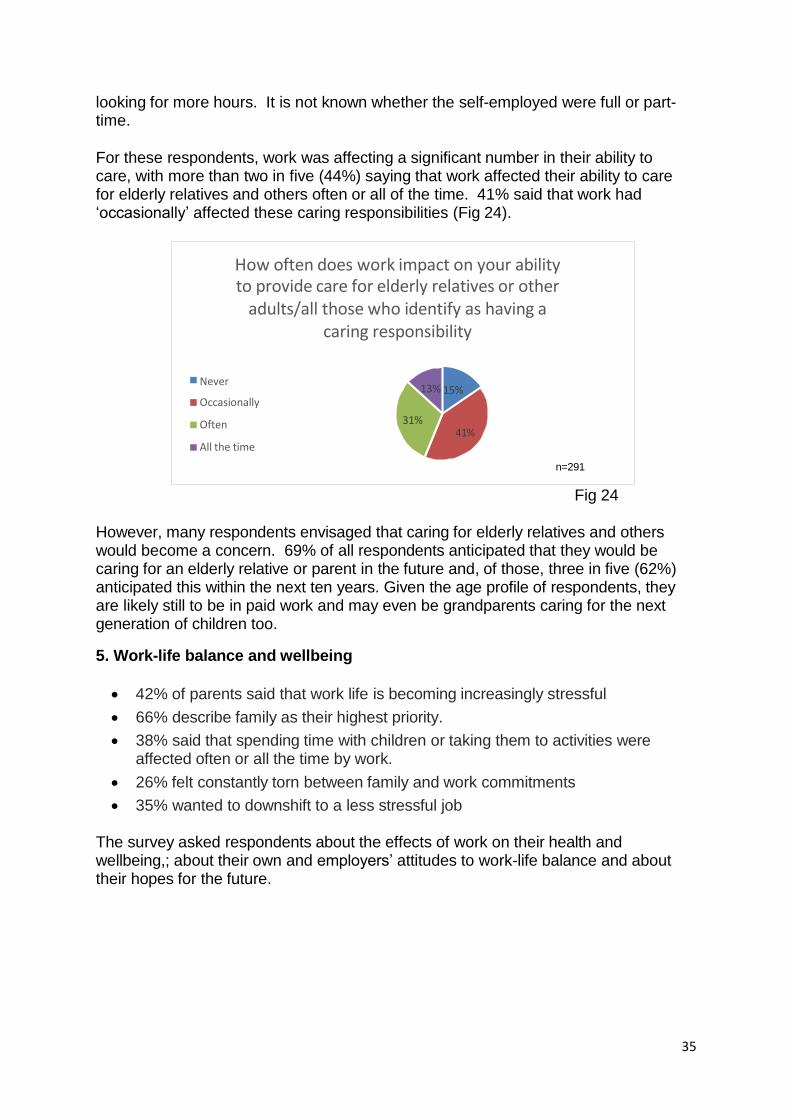
For these respondents, work was affecting a significant number in their ability to care, with more than two in five (44%) saying that work affected their ability to care for elderly relatives and others often or all of the time. 41% said that work had ‘occasionally’ affected these caring responsibilities (Fig 24).
Fig 24
However, many respondents envisaged that caring for elderly relatives and others would become a concern. 69% of all respondents anticipated that they would be caring for an elderly relative or parent in the future and, of those, three in five (62%) anticipated this within the next ten years. Given the age profile of respondents, they are likely still to be in paid work and may even be grandparents caring for the next generation of children too.
5. Work-life balance and wellbeing
42% of parents said that work life is becoming increasingly stressful
66% describe family as their highest priority.
38% said that spending time with children or taking them to activities were affected often or all the time by work.
26% felt constantly torn between family and work commitments
35% wanted to downshift to a less stressful job The survey asked respondents about the effects of work on their health and wellbeing,; about their own and employers’ attitudes to work-life balance and about their hopes for the future.
How often does work impact on your ability to provide care for elderly relatives or other
adults/all those who identify as having a caring responsibility
Never
Occasionally
Often
All the time
13% 15%
31% 41%
n=291
36
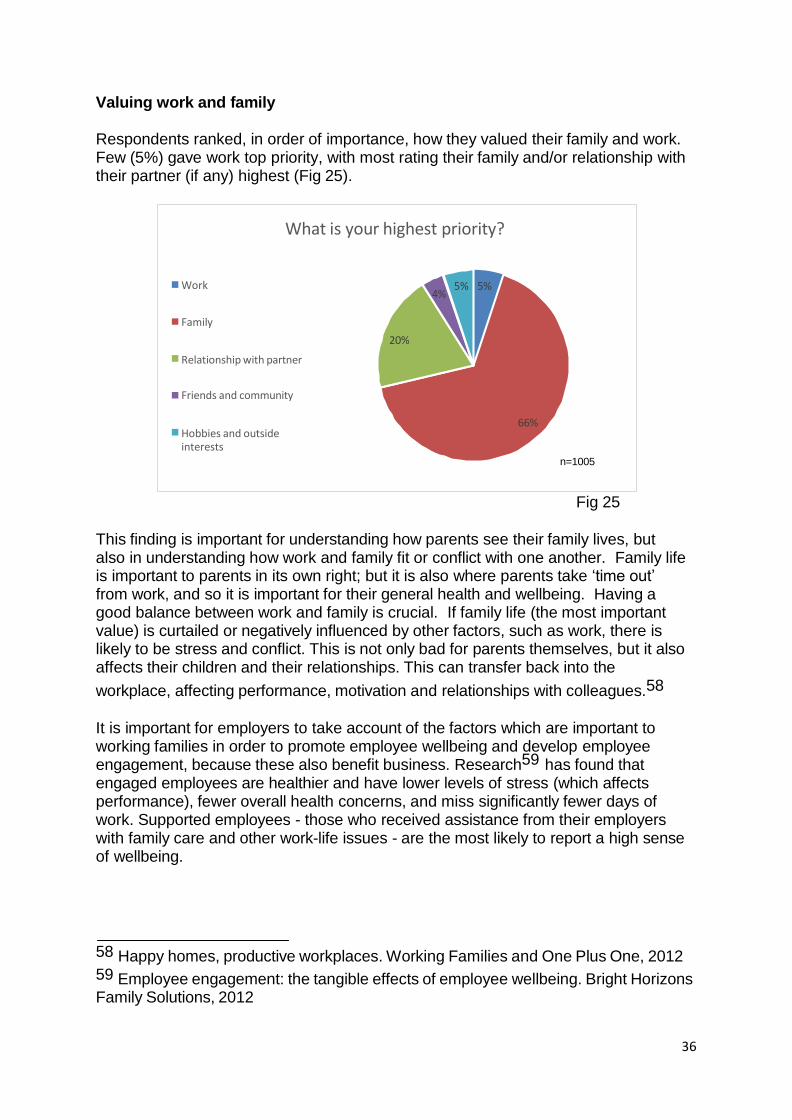
Valuing work and family Respondents ranked, in order of importance, how they valued their family and work. Few (5%) gave work top priority, with most rating their family and/or relationship with their partner (if any) highest (Fig 25).
Fig 25
This finding is important for understanding how parents see their family lives, but also in understanding how work and family fit or conflict with one another. Family life is important to parents in its own right; but it is also where parents take ‘time out’ from work, and so it is important for their general health and wellbeing. Having a good balance between work and family is crucial. If family life (the most important value) is curtailed or negatively influenced by other factors, such as work, there is likely to be stress and conflict. This is not only bad for parents themselves, but it also affects their children and their relationships. This can transfer back into the
workplace, affecting performance, motivation and relationships with colleagues.58
It is important for employers to take account of the factors which are important to working families in order to promote employee wellbeing and develop employee engagement, because these also benefit business. Research59 has found that engaged employees are healthier and have lower levels of stress (which affects performance), fewer overall health concerns, and miss significantly fewer days of work. Supported employees - those who received assistance from their employers with family care and other work-life issues - are the most likely to report a high sense of wellbeing.
58 Happy homes, productive workplaces. Working Families and One Plus One, 2012 59 Employee engagement: the tangible effects of employee wellbeing. Bright Horizons Family Solutions, 2012
What is your highest priority?
Work 4%
5% 5%
Family
20%
Relationship with partner
Friends and community
66% Hobbies and outside interests
n=1005
37
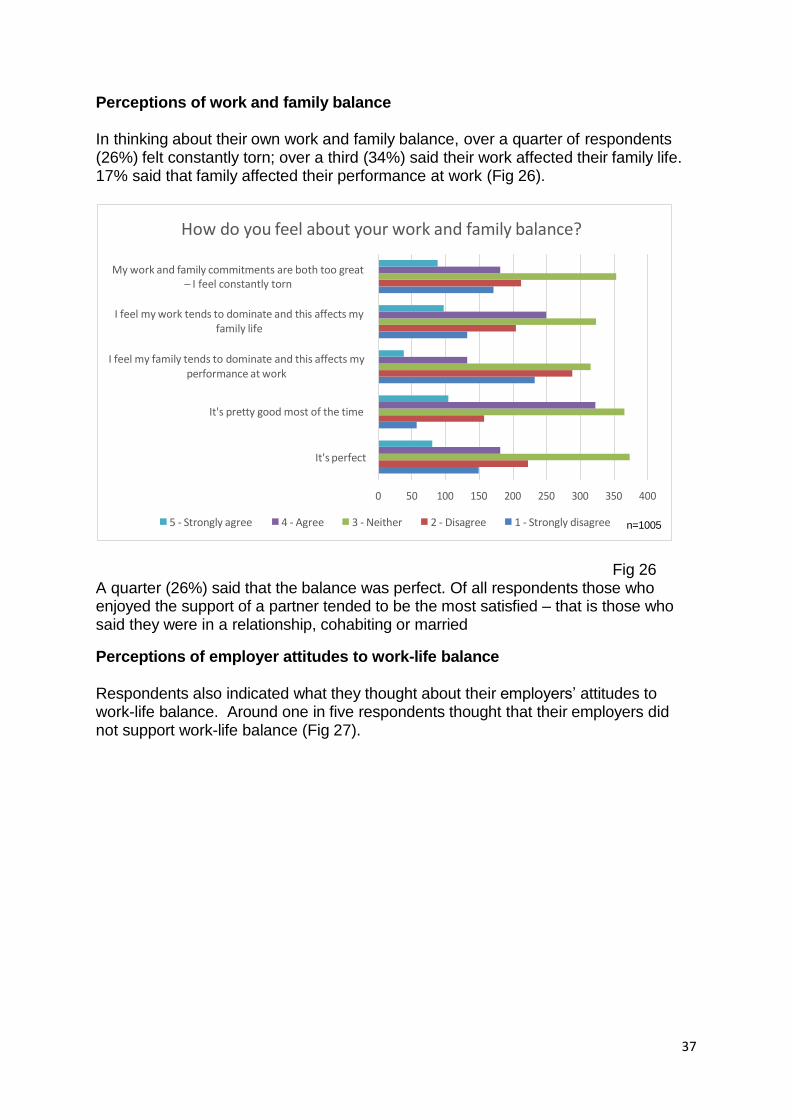
Perceptions of work and family balance In thinking about their own work and family balance, over a quarter of respondents (26%) felt constantly torn; over a third (34%) said their work affected their family life. 17% said that family affected their performance at work (Fig 26).
Fig 26 A quarter (26%) said that the balance was perfect. Of all respondents those who enjoyed the support of a partner tended to be the most satisfied – that is those who said they were in a relationship, cohabiting or married
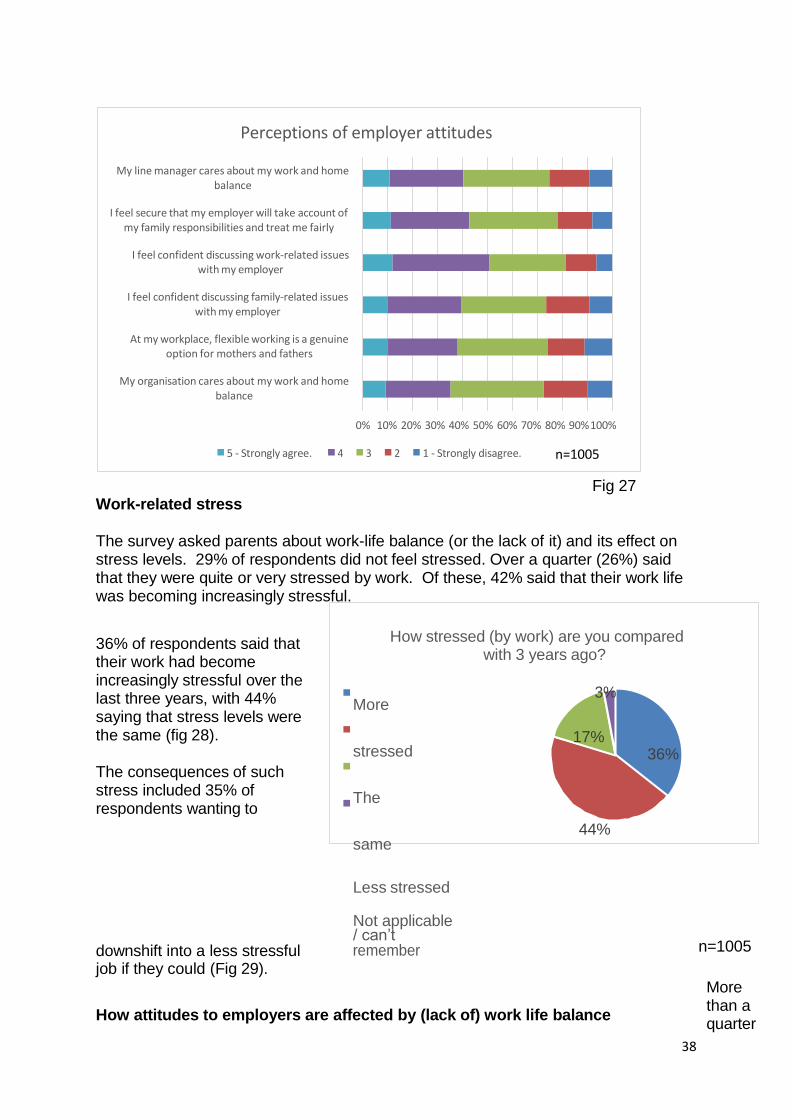
Perceptions of employer attitudes to work-life balance Respondents also indicated what they thought about their employers’ attitudes to work-life balance. Around one in five respondents thought that their employers did not support work-life balance (Fig 27).
How do you feel about your work and family balance? My work and family commitments are both too great
– I feel constantly torn
I feel my work tends to dominate and this affects my
family life
I feel my family tends to dominate and this affects my
performance at work
It's pretty good most of the time
It's perfect
0 50 100 150 200 250 300 350 400
5 - Strongly agree 4 - Agree 3 - Neither 2 - Disagree 1 - Strongly disagree n=1005
38
Fig 27
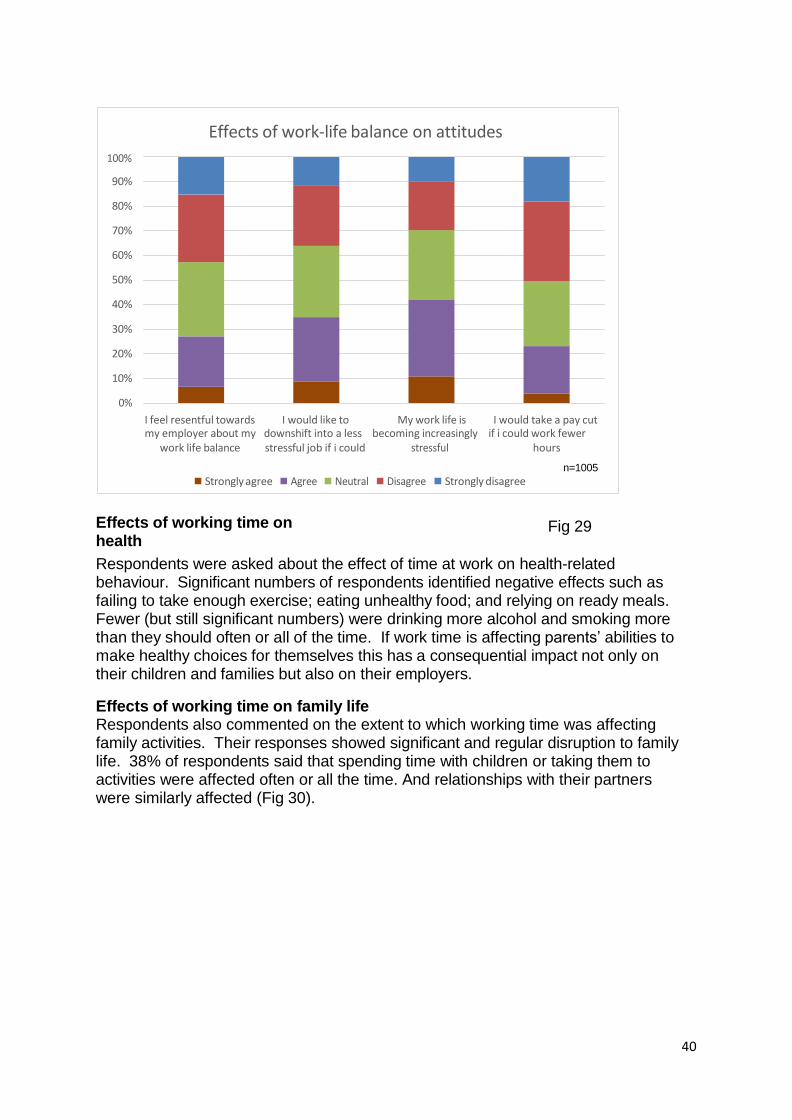
Work-related stress The survey asked parents about work-life balance (or the lack of it) and its effect on stress levels. 29% of respondents did not feel stressed. Over a quarter (26%) said that they were quite or very stressed by work. Of these, 42% said that their work life was becoming increasingly stressful.
36% of respondents said that their work had become increasingly stressful over the
How stressed (by work) are you compared with 3 years ago?
last three years, with 44% saying that stress levels were the same (fig 28).
The consequences of such stress included 35% of respondents wanting to
More
stressed
The
same
Less stressed Not applicable / can’t
3%
17%
44%
36%
downshift into a less stressful job if they could (Fig 29).
remember n=1005
How attitudes to employers are affected by (lack of) work life balance
More than a quarter
Perceptions of employer attitudes
My line manager cares about my work and home balance
I feel secure that my employer will take account of my family responsibilities and treat me fairly
I feel confident discussing work-related issues with my employer
I feel confident discussing family-related issues with my employer
At my workplace, flexible working is a genuine option for mothers and fathers
My organisation cares about my work and home balance
0% 10% 20% 30% 40% 50% 60% 70% 80% 90% 100%
5 - Strongly agree. 4 3 2 1 - Strongly disagree. n=1005

39
(27%) of respondents felt resentful towards their employer about their work and family balance (Fig 29).
Fig 28
40
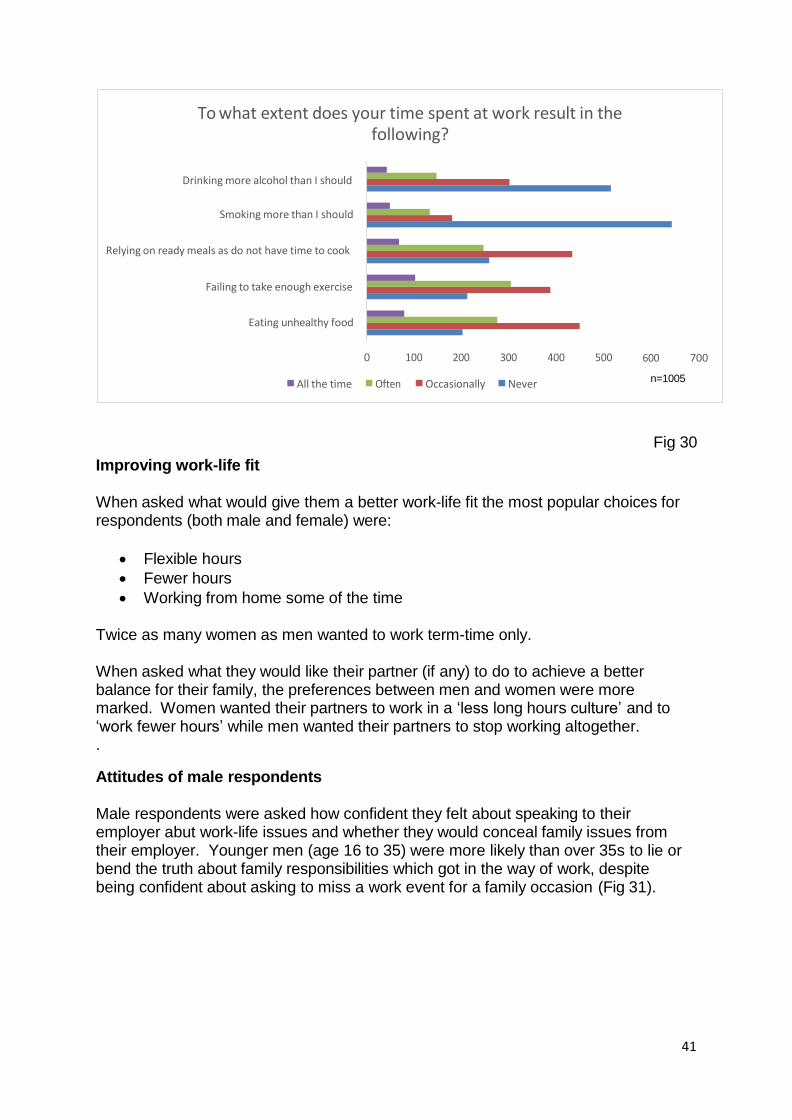
Effects of working time on health
Fig 29
Respondents were asked about the effect of time at work on health-related behaviour. Significant numbers of respondents identified negative effects such as failing to take enough exercise; eating unhealthy food; and relying on ready meals. Fewer (but still significant numbers) were drinking more alcohol and smoking more than they should often or all of the time. If work time is affecting parents’ abilities to make healthy choices for themselves this has a consequential impact not only on their children and families but also on their employers.
Effects of working time on family life Respondents also commented on the extent to which working time was affecting family activities. Their responses showed significant and regular disruption to family life. 38% of respondents said that spending time with children or taking them to activities were affected often or all the time. And relationships with their partners were similarly affected (Fig 30).
Effects of work-life balance on attitudes
100%
90%
80%
70%
60%
50%
40%
30%
20%
10%
0%
I feel resentful towards I would like to My work life is I would take a pay cut my employer about my downshift into a less becoming increasingly if i could work fewer
work life balance stressful job if i could stressful hours
n=1005
Strongly agree Agree Neutral Disagree Strongly disagree
41
Fig 30
Improving work-life fit When asked what would give them a better work-life fit the most popular choices for respondents (both male and female) were:
Flexible hours
Fewer hours
Working from home some of the time Twice as many women as men wanted to work term-time only.
When asked what they would like their partner (if any) to do to achieve a better balance for their family, the preferences between men and women were more marked. Women wanted their partners to work in a ‘less long hours culture’ and to ‘work fewer hours’ while men wanted their partners to stop working altogether. .
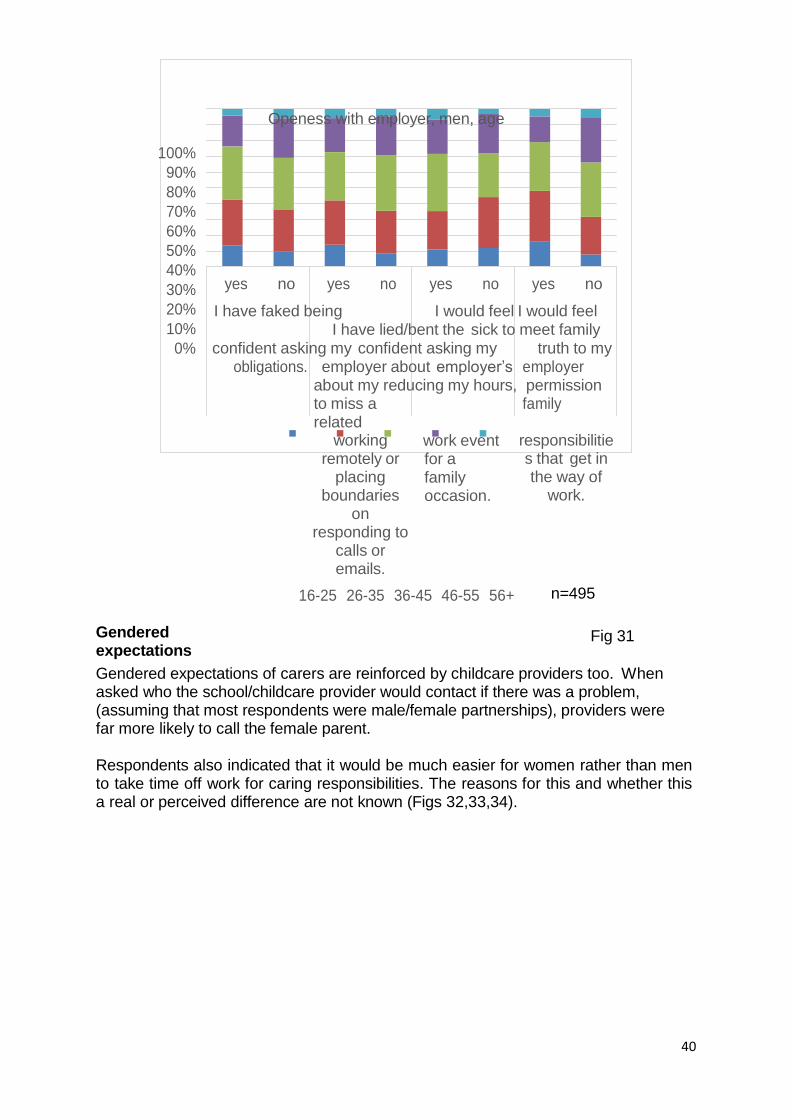
Attitudes of male respondents Male respondents were asked how confident they felt about speaking to their employer abut work-life issues and whether they would conceal family issues from their employer. Younger men (age 16 to 35) were more likely than over 35s to lie or bend the truth about family responsibilities which got in the way of work, despite being confident about asking to miss a work event for a family occasion (Fig 31).
To what extent does your time spent at work result in the following?
Drinking more alcohol than I should
Smoking more than I should
Relying on ready meals as do not have time to cook
Failing to take enough exercise
Eating unhealthy food
0 100 200 300 400 500
All the time Often Occasionally Never
600 700
n=1005
40
100%
90%
80%
70%
60%
50%
40%
30%
20%
10%
0%
Openess with employer, men, age
yes no yes no yes no yes no
I have faked being I would feel I would feel I have lied/bent the sick to meet family confident asking my confident asking my truth to my
obligations. employer about employer’s employer about my reducing my hours, permission to miss a family related
working remotely or
placing boundaries
on responding to
calls or emails.
work event for a family occasion.
responsibilities that get in the way of
work.
16-25 26-35 36-45 46-55 56+ n=495 Gendered expectations
Fig 31
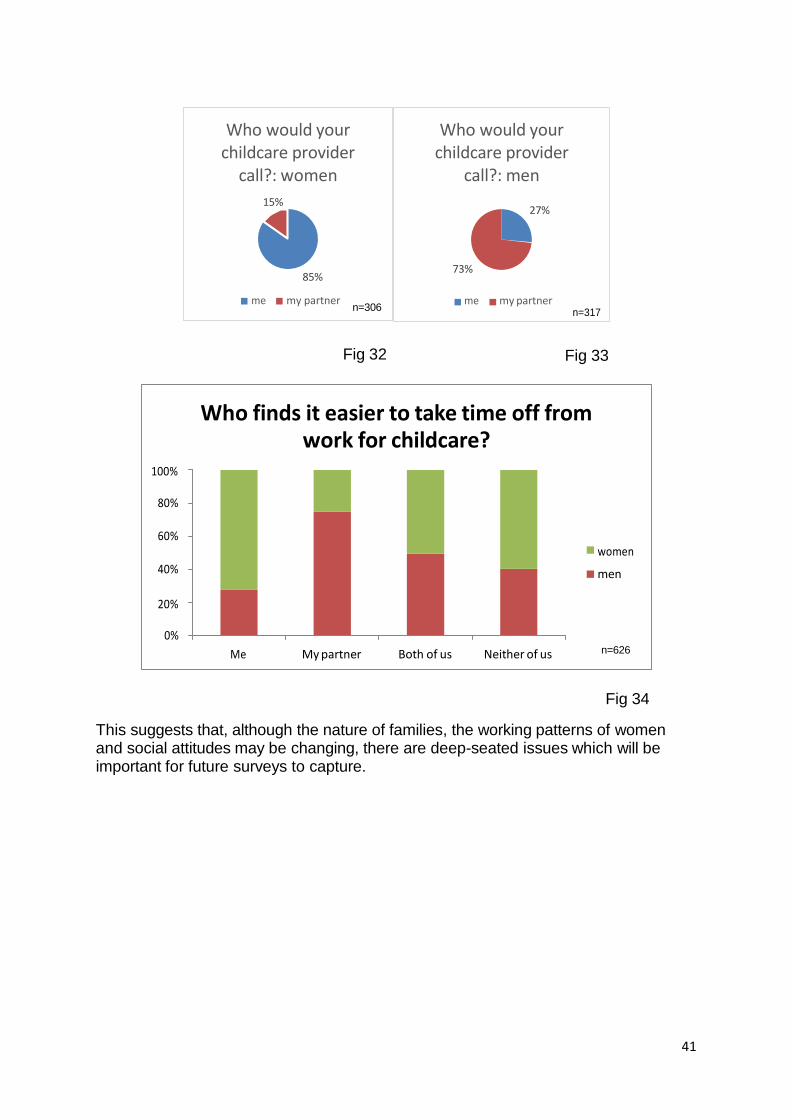
Gendered expectations of carers are reinforced by childcare providers too. When asked who the school/childcare provider would contact if there was a problem, (assuming that most respondents were male/female partnerships), providers were far more likely to call the female parent.
Respondents also indicated that it would be much easier for women rather than men to take time off work for caring responsibilities. The reasons for this and whether this a real or perceived difference are not known (Figs 32,33,34).
41
Fig 32 Fig 33
Fig 34
This suggests that, although the nature of families, the working patterns of women and social attitudes may be changing, there are deep-seated issues which will be important for future surveys to capture.
Who finds it easier to take time off from work for childcare?
100%
80%
60%
40%
women
men
20%
0%
Me My partner Both of us Neither of us n=626
Who would your childcare provider
call?: women
15%
85%
me my partner n=306
Who would your childcare provider
call?: men
27%
73%
me my partner
n=317
42
Conclusions
The survey highlights some of the typical challenges face by Scotland’s working parents as they try to balance work and family life and reveals the short and long- term effects of this on themselves, their families and their employers.
It highlights some areas of concern and also opportunities to build a more family- friendly workplace culture in Scotland. It describes some of the cross-over issues which affect individuals, business and the economy and society generally.
For example, although this survey took place before it was possible to assess the impact of the most recent measures taken by the Scottish Government to improve access to affordable childcare, it is clear that both the expense and the lack of sufficiently flexible, accessible childcare have serious implications for a government which is keen to boost the Scottish economy; reduce child and adult poverty; and increase gender equality. It has serious implications for employers too if parents, probably women, leave their jobs, or do not take up work, education or training in the first place because childcare is not available. Lack of suitable childcare results in a loss of tax revenue, skills losses and shortage, and increased welfare benefit payments. It also leads to poorer outcomes for children and wider social issues, including problems supporting an ageing population with its associated health and social care costs.
The survey results show clearly the sorts of choices and accommodation which parents make in order to fulfil both their work and family commitments. This includes putting careers on hold, limiting their life-time earnings, and looking to their own parents to provide childcare or help with childcare costs. The survey suggests that the focus still tends to be on what individuals themselves can do rather than how wider cultural and structural changes might support them better. And, of course, Scotland’s desire to increase its population to help fuel a thriving economy, underlines the point that not every family in Scotland will have effective personal and local networks of support.
The survey also shows just how important it is for employers to support families in their attempts to balance their different commitments, whether through job design, or workplace culture, or time spent at work. Over a third of respondents were not working flexibly and this was associated with having had a request turned down, or their role not accommodating or not being perceived to accommodate flexible working. The consequence of this included feelings of resentment towards their employers. Such resentment may stem from the lack of opportunities for flexible working; an employer culture which is not conducive to work-life balance; a line manager who is opposed to flexible working; a lack of control in managing their own workload; and a workload that is difficult to deal with because of its volume, its intensity, or both. Resentment towards an employer may diminish engagement and commitment; reduce productivity; and mean that employees withdraw discretionary effort. But it can also damage employees themselves, including their health and relationships, and this also affects performance at work.
Parents in this survey who were already working flexibly typically used variable working times such as flexitime or compressed hours, followed by remote working,
43
for example from home. Variable working times and remote working were far more common in the private than the public sector. Thinking about what they would like, parents wanted employers to provide flexible hours, fewer hours, working from home some of the time and (for women) term-time only working.
There were similarities but also important differences between the experiences of men and women. Respondents considered that it was more straightforward for women rather than men to take time off work for care purposes. Childcare providers would tend to contact mothers rather than fathers in an emergency. When asked what they would like their partner to do to achieve better work-life balance for their family, women wanted their male partners to work fewer hours and men wanted their women partners to stop working altogether.
The survey findings indicate that while it is acceptable for men to ask for time off for a one-off special occasion (such as a school play) it is not easy for them to ask for a different pattern of work or unscheduled leave (for example to look after a sick child). There is still a cultural pressure on men to achieve at work and to work longer hours, in order to be a good father. The opposite appears to apply to women.
There is still much work to be done on promoting the benefits of family-friendly working to parents, colleagues and employers. Support for employers, in terms of both knowledge and skills, so that they feel more able and confident to create the right conditions for more family friendly workplaces is clearly required
Economic and family wellbeing are two vital conditions for creating a flourishing Scotland. This survey shows that there is some way to go before the more progressive approach to balancing work and family life being advocated by the Scottish Government is valued and made possible by all the relevant stakeholders in Scotland.