Embed Size (px)
Citation preview
Submission by the
Council of Rural Research and Development Corporations
to the
Productivity Commission Inquiry into the
Australian Government
Research and Development Corporations Model
June 2010
CRRDC submission to the PC inquiry into the R&D corporations model, June 2010 Page 2
Attribution This submission was prepared by Garry Goucher & Associates in collaboration with the CRRDC.
Contributions from Adjunct Professor John Mullen (CSU, Orange) and Professor Julian Alston (UC, Davis) are greatly appreciated, as is the input from many others within the rural RD&E community.
CRRDC submission to the PC Inquiry into the R&D corporations model, June 2010 Page 3
CONTENTS
EXECUTIVE SUMMARY.................................................................................................. 4 1. INTRODUCTION ........................................................................................................ 8 2. HOW THE RDC MODEL OPERATES...................................................................... 12
2.1 International comparisons................................................................................ 15 3. RATIONALE FOR GOVERNMENT FUNDING SUPPORT...................................... 17
3.1 Opportunity to increase investment in rural RD&E.......................................... 17 3.2 Public goods, industry goods and spill-overs .................................................. 20 3.3 Inequalities in the distribution of costs and benefits ........................................ 21 3.4 Market failures.................................................................................................. 24 3.5 Responding to market failure ........................................................................... 28 3.6 Other rationales for government support......................................................... 30 3.7 Why are rural industries different?................................................................... 34 3.8 A comment on private rural R&D in Australia .................................................. 35
4. SOUNDNESS OF THE RDC MODEL....................................................................... 39 4.1 The RD&E framework ...................................................................................... 39 4.2 Effectiveness of the rural RD&E framework .................................................... 42 4.3 The role of the RDCs within the broader framework ....................................... 43 4.4 Strategic assessment....................................................................................... 45 4.5 Soundness of the RDC model ......................................................................... 46
5. FUNDING LEVEL ISSUES ....................................................................................... 48 5.1 The public/private funding balance .................................................................. 50 5.2 Matching funding to benefits ............................................................................ 50
6. IMPROVING THE RDC MODEL............................................................................... 52 6.1 Improving governance ..................................................................................... 52 6.2 Increasing administrative efficiency ................................................................. 54 6.3 Coordination and collaboration ........................................................................ 56 6.4 Evaluation ........................................................................................................ 61 6.5 Extension and adoption ................................................................................... 72
REFERENCES ............................................................................................................... 75 Appendix 1: Statutory Corporations and Industry-owned Company RDCs Appendix 2: Private investment survey (AFI) Appendix 3: CRRDC 2010 collaboration report — extract Appendix 4: CRRDC evaluation methodology Appendix 5: 2008 and 2009 evaluation reports Appendix 6: QualDATA survey Appendix 7: QualDATA preliminary findings
CRRDC submission to the PC Inquiry into the R&D corporations model, June 2010 Page 4
EXECUTIVE SUMMARY
The RDCs are a vital component of the rural RD&E system in Australia. With annual investments of about $500 million in RD&E, they are a key mode of collaboration between industry, government and science.
Importantly, the RD&E expenditure by RDCs extends far beyond improvement in farm productivity. The RDC’s research programs focus on the whole production and supply chain — from the environment in which production occurs, through transport, storage, processing and marketing of intermediate and consumer products.
The Australian RDC model is unique. No other nation has a model that combines such strong linkages — between science, producers in the supply chain, and government. Its synergies have made the model very highly regarded throughout the world. It is a strength of the Australian system that it has a network of stakeholders with legitimate and different perspectives. These stakeholders are encouraged to collaborate together to provide outcomes that serve multiple needs. In this system the RDCs provide a strategic and industry linked perspective.
The RDCs have a degree of independence, flexibility and involvement with the innovation process that is not found in other research organisations. RDCs are enabled to seek and contract for the skills and resources that offer the best prospects for results, wherever they may be available.
The core funding of RDCs is industry levies, matched dollar for dollar by the Australian Government. This matching funding encourages increased industry contributions to RD&E in the presence of market failures. Through the RDCs, governments also invest in RD&E that has wider environmental and social benefits for the Australian community.
Finding an appropriate balance between public and industry benefits from levy-funded RD&E is important in maintaining support for the RDC system. The levies themselves reflect the collaborative nature of the RDCs: although payment by levy payers is mandated by legislation, industry has the power to recommend rates be increased or decreased — potentially to zero. By this mechanism, industry has
a measure of control over its contribution to investment in RD&E.
Their strong links with Federal and state governments and industries allow the RDCs to look for the most pressing barriers to greater productivity and efficiency in producing and delivering products to consumers. RDCs are in a special position within the RD&E system, because unlike all other originators and providers, they are independent of research facilities and research scientists. This allows RDCs a far greater flexibility than other research originators, since they face no conflicts of interest in their choice of research provider. They find the most suitable facilities and researchers with the most relevant skills and experience.
A key attribute of RDC governance is the selection and appointment of directors with a broad range of skills and experience, ensuring that RD&E is focused on fields of greatest need and benefit, is of high quality, and is well administered. RDC investments are guided by consultation with industry and conform with the Government’s national rural research
CRRDC submission to the PC Inquiry into the R&D corporations model, June 2010 Page 5
and development priorities. RDC structures are open, transparent and accountable to their industry and Government stakeholders.
Almost all rural RD&E produces a mix of ‘public goods’ and ‘industry goods’ that are inseparable, and occur in proportions that are difficult to estimate. The existence of public goods in the outcomes of rural RD&E is one of the justifications for government investment in the research.
When RD&E leads to creation of public goods, market failure will generally exist, since there is no incentive for private individuals to invest in this research. Government must invest in these areas of research on behalf of the community to produce the desired public benefits. It is therefore common around the world for a high proportion of rural RD&E to be funded by government.
Investment in rural RD&E produces high rates of return. International studies have found rates of return of up to 80% per annum. Returns to public research in broadacre agriculture in Australia from 1953 to 2003 have been found to be in the range of 15% to 40% per annum. The broad conclusion from the substantial body of economic analysis of investment in publicly funded rural RD&E, both overseas and in Australia, confirms that returns are very high.
Since Australia’s level of investment is far below the point at which marginal returns equate with marginal costs, Australia would receive a very substantial pay-off from additional investment in rural RD&E.
The size of the demand elasticity for rural products and the characteristics of producer’s supply response to RD&E will result in disproportionate sharing of the costs and benefits of industry research, among producers, the supply chain and consumers. Lags of more than 35 years in realising the benefits of research will prevent producers currently paying levies from realising much of the benefit of the RD&E to which they contribute. These market failures discourage producers from making a socially optimal investment in rural RD&E. Matching funding by the Government is required to ensure there is optimal investment in industry RD&E.
Changes that might remove government investment and leave the RDCs more heavily dependent on levy funds would be particularly harmful; they would fragment research effort and increase pressure to limit RD&E to areas oriented directly toward on-farm productivity.
Expenditure on RD&E is a long-term investment and cannot be treated as a current cost of production for producers, nor viewed by governments through the narrow perspective of the near-term budget balance. Like any investment, rural RD&E involves forgoing current consumption in return for the expectation of greater benefits for the community as a whole in the future. The rate of investment in RD&E should be determined by consideration of the rural productivity, resource sustainability, and wider community benefits that Australia desires to receive in the future.
The rural sector has a strong culture of innovation and development. The sector is exposed to international markets and has a history of adapting quickly to market forces, adopting new technology, and altering product output, product type and production methods in response to shifting demand.
RD&E is a major driver of the sector’s innovation and capacity to respond to market forces. The technology employed in the rural sector is at the leading edge across a range of fields of science such as gene technology, spatial imaging and geo-positioning, remote sensing, microbiology and materials handling. RD&E has also been the major factor in maintaining
CRRDC submission to the PC Inquiry into the R&D corporations model, June 2010 Page 6
strong productivity growth over several decades, through which the sector has withstood the effects of constantly declining terms of trade, enabling it to maintain its international competitiveness and profitability, and to increase its contribution to the Australian economy.
Rural RD&E generates improvements in productivity and performance of businesses in the rural supply chain that handle, process and market rural products. The benefits of this research are distributed widely between consumers, the supply chain and producers, and to other sectors of the economy. Every Australian benefits every day from safer, higher quality, lower cost, and a wider choice of food and fibre products as a result of rural RD&E. The community also benefits from improved understanding of Australia’s unique environment and increasing sustainability in the production of food and fibre products as a result of rural RD&E. Rural R&D also contributes to advances in medical technology.
There are pressing, important strategic reasons why Australia should increase the rate of investment in rural RD&E. As a wealthy nation, Australia has a humanitarian responsibility to contribute to improving global food security, both through increasing its own rural productivity and contributing to the global knowledge stock that will assist other nations to increase their rural productivity. Australia should also be making prudent additional investments in adjusting to the potential for climate change, to make adjustments to demands for reduced greenhouse gas emissions and to rising energy prices before these pressures directly affect rural production.
A major contributor to declining productivity growth in the rural sector has been the long-term slow-down in investment in rural RD&E. Strong real growth in investment occurred from 1953 until the mid-1970s but since then, little real growth occurred in public rural RD&E expenditure. Given lags of more than 35 years in realising the benefits of research
expenditure, it is likely that this decline in investment is now affecting productivity growth and will continue to do so for decades to come.
Collaboration occurs at a number of levels across the RDC network, including between RDCs concerning rural RD&E priorities and strategies. Recent data shows that about 80% of the $458 million of RD&E investment by RDCs involves a financial or significant in-kind investment from other third parties. Up to $6.10 has been leveraged per dollar invested via collaboration with other organisations.
The CRRDC and RDCs have recently taken steps to harmonise administrative services and key operating processes and systems within the RDCs, including an independent review of potential harmonisation of management processes.
The CRRDC has led the collective measurement of the impact of rural RD&E conducted through RDCs to demonstrate the returns generated for levy payers and the Government. Evaluation will ensure that future prioritisation of investments by the RDCs is based on a sound, systematic knowledge of the impacts of past investments across the RDC portfolio. Results from the 2009 evaluation program show that for every dollar invested, there is a return of $10.51 over a 25 year timeframe. The evaluation also provided a comprehensive listing of the un-priced environmental and social benefits delivered by RDC projects.
The evaluation program is a further example of collaboration between RDCs to develop an effective framework for assessing the impact of RDC investments and their compliance with the Government’s priorities.
Extension and adoption is a fundamental component of investment in rural research and development, to ensure the translation of R&D to practical application along the whole
CRRDC submission to the PC Inquiry into the R&D corporations model, June 2010 Page 7
supply chain. The RDCs recognise that extension, adoption, training and education are key factors in capacity-building and that investment in this area must be allocated at the same time as the commitment to invest in the R&D. Collaborating to establish the status of extension, adoption, practice change and capacity-building across the RDCs is important to create a baseline understanding of the extent to which RD&E organisations are addressing this function as part of their funded programs.
CRRDC submission to the PC inquiry into the R&D corporations model, June 2010 Page 8
1. INTRODUCTION
The Council of Rural Research and Development Corporations (CRRDC) is an unincorporated body established by the six statutory corporations and nine industry-owned companies collectively known as the rural research and development corporations (RDCs) and listed at appendix 1. The CRRDC is the peak forum for the RDCs, facilitating coordination of research and strategic directions for evaluating the collective impact of the RDCs and for developing collaboration on major projects of national significance.
In response to the Productivity Commission’s (PC) Inquiry into the Australian Government Research and Development Corporations Model, the CRRDC makes this submission on behalf of these 15 RDCs. The RDCs themselves will also make specific submissions focused on their particular business environments.
The CRRDC welcomes the Productivity Commission Inquiry as an opportunity to demonstrate the strength of the RDC model, in which government and industry funds are co-invested, and to discuss the well-established link between investment in research, development and extension (RD&E) and growth in the productivity of primary industries.
This submission addresses the terms of reference and questions raised by the PC in its Issues Paper released in March 2010. The structure of this submission broadly follows the structure laid out in the Issues Paper.
Throughout this submission, unless otherwise indicated, the term “RDC” refers collectively to: • the six statutory research and development corporations established under the Primary
Industries and Energy Research and Development Act 1989 (PIERD Act), and
• the nine industry-owned companies (IOCs), incorporated under separate industry acts, which have responsibility for research and development for their respective industries.
This submission provides an overview of:
• the RDC model
• the role and function of the RDCs
• the soundness of the RDC role
• an evaluation of RDC research and collaboration.
The submission also discusses, from an economic perspective:
• the costs and benefits of rural R&D
• factors affecting the distribution of costs and benefits
• factors affecting funding by the public and private sectors.
Each RDC will also make a submission addressing the issues raised by the PC with specific reference to its industry.
CRRDC submission to the PC Inquiry into the R&D corporations model, June 2010 Page 9
“Rural RD&E”
In this submission the term “rural RD&E” is used to mean research, development and extension for the industries in Australia that encompass:
• agricultural, fishing and forestry production
• processing, marketing, safety and amenity of these products
• the environment and sustainability of the production resources associated with rural production.
This is the broad field of science for which the RDCs are responsible under the PIERD Act and related IOC Acts.
The term “R&D” has been used to refer specifically to research and development, and to theoretical discussion or international references where it is not clear that extension has been specifically included.
“Rural sector”
The term “rural sector” refers collectively to the industry groups engaged in the production, processing and marketing of the above products. This is a large and diverse field of industry, utilising a wide range of skills and spread over a wide geography, including the major cities.
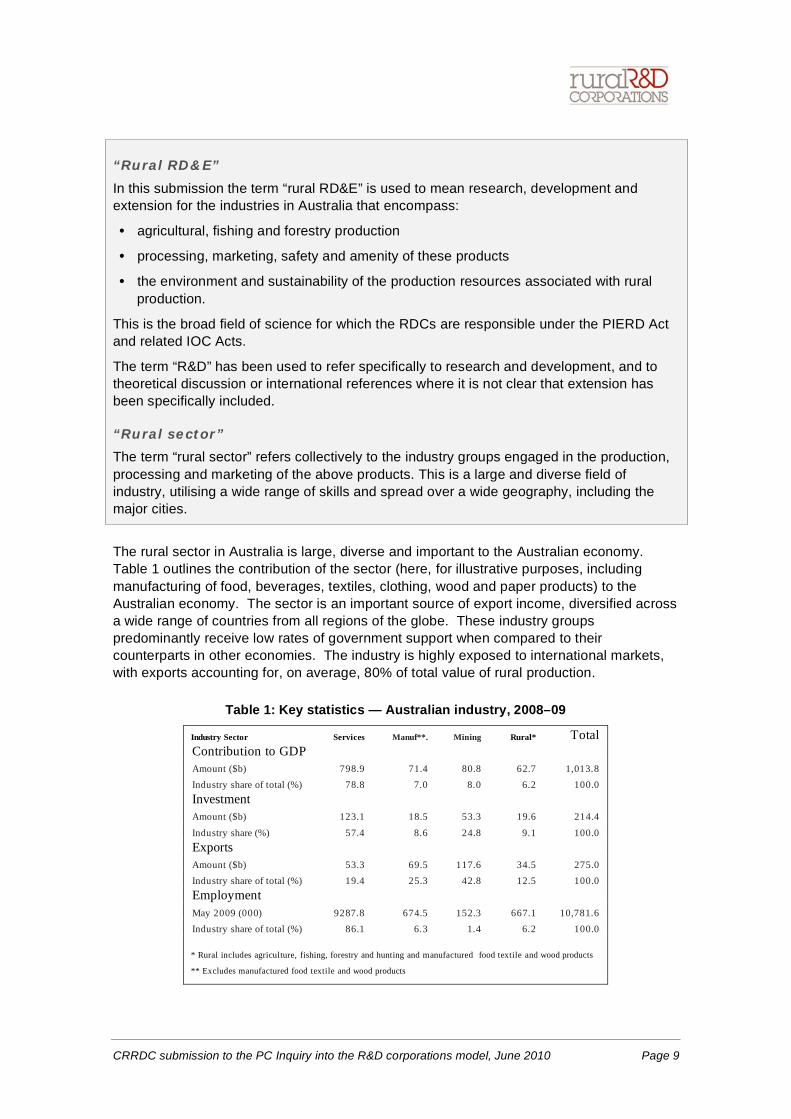
The rural sector in Australia is large, diverse and important to the Australian economy. Table 1 outlines the contribution of the sector (here, for illustrative purposes, including manufacturing of food, beverages, textiles, clothing, wood and paper products) to the Australian economy. The sector is an important source of export income, diversified across a wide range of countries from all regions of the globe. These industry groups predominantly receive low rates of government support when compared to their counterparts in other economies. The industry is highly exposed to international markets, with exports accounting for, on average, 80% of total value of rural production.
Table 1: Key statistics — Australian industry, 2008–09
Industry Sector Services Manuf**. Mining Rural* Total Contribution to GDP Amount ($b) 798.9 71.4 80.8 62.7 1,013.8 Industry share of total (%) 78.8 7.0 8.0 6.2 100.0 Investment Amount ($b) 123.1 18.5 53.3 19.6 214.4
Industry share (%) 57.4 8.6 24.8 9.1 100.0 Exports Amount ($b) 53.3 69.5 117.6 34.5 275.0 Industry share of total (%) 19.4 25.3 42.8 12.5 100.0 Employment May 2009 (000) 9287.8 674.5 152.3 667.1 10,781.6 Industry share of total (%) 86.1 6.3 1.4 6.2 100.0
* Rural includes agriculture, fishing, forestry and hunting and manufactured food textile and wood products
** Excludes manufactured food textile and wood products
CRRDC submission to the PC Inquiry into the R&D corporations model, June 2010 Page 10
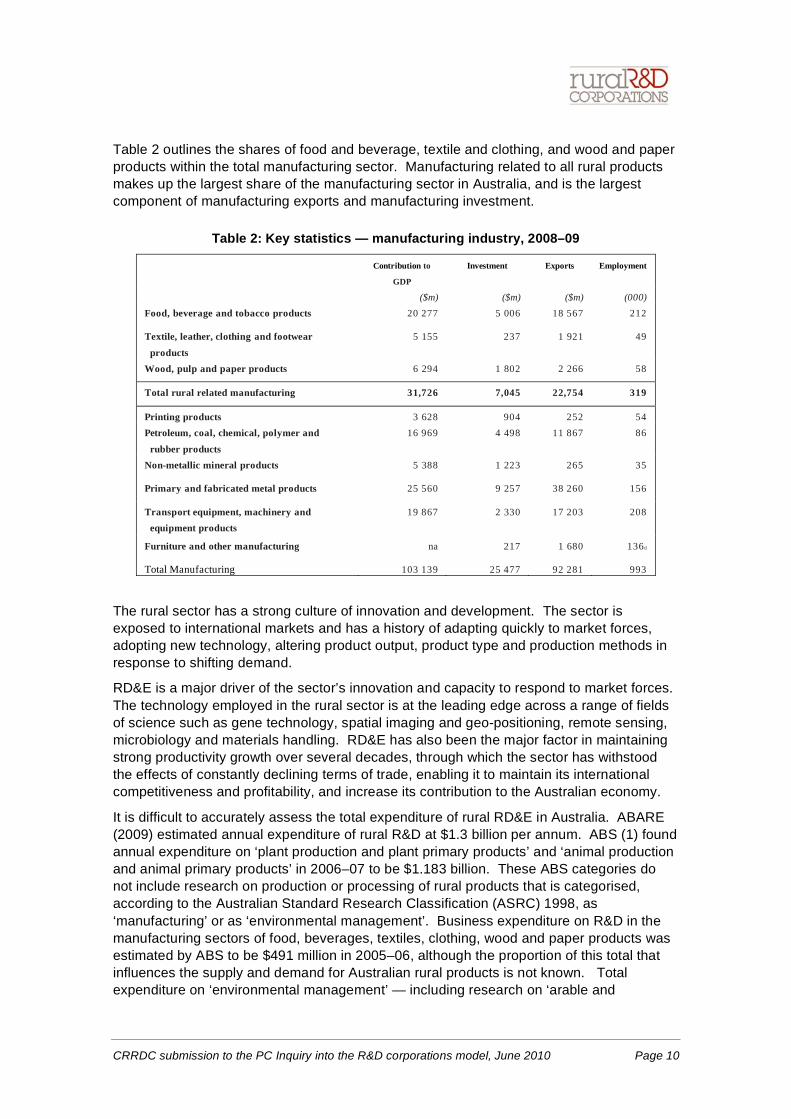
Table 2 outlines the shares of food and beverage, textile and clothing, and wood and paper products within the total manufacturing sector. Manufacturing related to all rural products makes up the largest share of the manufacturing sector in Australia, and is the largest component of manufacturing exports and manufacturing investment.
Table 2: Key statistics — manufacturing industry, 2008–09
Contribution to
GDP
Investment Exports Employment
($m) ($m) ($m) (000) Food, beverage and tobacco products 20 277 5 006 18 567 212
Textile, leather, clothing and footwear products
5 155 237 1 921 49
Wood, pulp and paper products 6 294 1 802 2 266 58
Total rural related manufacturing 31,726 7,045 22,754 319
Printing products 3 628 904 252 54 Petroleum, coal, chemical, polymer and
rubber products 16 969 4 498 11 867 86
Non-metallic mineral products 5 388 1 223 265 35
Primary and fabricated metal products 25 560 9 257 38 260 156
Transport equipment, machinery and equipment products
19 867 2 330 17 203 208
Furniture and other manufacturing na 217 1 680 136d
Total Manufacturing 103 139 25 477 92 281 993
The rural sector has a strong culture of innovation and development. The sector is exposed to international markets and has a history of adapting quickly to market forces, adopting new technology, altering product output, product type and production methods in response to shifting demand.
RD&E is a major driver of the sector’s innovation and capacity to respond to market forces. The technology employed in the rural sector is at the leading edge across a range of fields of science such as gene technology, spatial imaging and geo-positioning, remote sensing, microbiology and materials handling. RD&E has also been the major factor in maintaining strong productivity growth over several decades, through which the sector has withstood the effects of constantly declining terms of trade, enabling it to maintain its international competitiveness and profitability, and increase its contribution to the Australian economy.
It is difficult to accurately assess the total expenditure of rural RD&E in Australia. ABARE (2009) estimated annual expenditure of rural R&D at $1.3 billion per annum. ABS (1) found annual expenditure on ‘plant production and plant primary products’ and ‘animal production and animal primary products’ in 2006–07 to be $1.183 billion. These ABS categories do not include research on production or processing of rural products that is categorised, according to the Australian Standard Research Classification (ASRC) 1998, as ‘manufacturing’ or as ‘environmental management’. Business expenditure on R&D in the manufacturing sectors of food, beverages, textiles, clothing, wood and paper products was estimated by ABS to be $491 million in 2005–06, although the proportion of this total that influences the supply and demand for Australian rural products is not known. Total expenditure on ‘environmental management’ — including research on ‘arable and
CRRDC submission to the PC Inquiry into the R&D corporations model, June 2010 Page 11
permanent crop land’, ‘forest and wooded land’, ‘marine environment’, and ‘permanent grassland and arid land’ — was found by ABS to be $1 billion in 2006–07.
A careful disaggregation of ABS data is required to more accurately identify the total R&D expenditure that influences the supply and demand of Australian rural products. However, the total certainly exceeds $1.2 billion and is estimated by CRRDC to be approximately $1.5 billon per annum.
The benefits of rural RD&E are spread widely throughout the community. Every Australian benefits every day from their choice of low-cost, safe food and fibre products. Rural RD&E generates improvements in productivity and performance of businesses in the rural supply chain that handle, process and market rural products. Rural RD&E also contributes to higher quality, wider choice, lower cost, and more efficient production of rural commodities. The benefits of this research are distributed widely between consumers, the supply chain and producers, and to other sectors of the economy. As a result of rural RD&E the community also benefits from improved understanding of Australia’s unique environment and increasing sustainability in the production of food and fibre products.
The RDCs are a vital component of the rural RD&E system in Australia. With annual investments of about $500 million in RD&E, they are a key mode of collaboration between industry, government and science. Importantly, the RD&E expenditure by RDCs extends far beyond improvement in farm productivity. The RDC’s research programs focus on the whole production and supply chain — from the environment in which production occurs, through transport, storage, processing and marketing of intermediate and consumer products. RD&E touches a wide range of industries, businesses and workers, and the benefits are felt widely throughout the community.
The RDCs support RD&E from basic research to applied science and product development, and they fund — and are closely involved in — extension and adoption of R&D outcomes. The RDCs have independence, flexibility and involvement with the innovation process that is not found in other research organisations. They have close relationships with producers, processors, marketers, scientists and the wider community which start at board level in each organisation. Directors are chosen for their diverse range of backgrounds, regular contact with the science community at staff level, and consultative arrangements with industry create relationships that flow through each RDC within their governance system, which focus on meeting industry needs and the priorities of government. Each RDC forms a nexus of those broad interests and conveys those interests into formulating research strategies, plans and individual projects across the whole of the rural sector.
This submission from the CRRDC and the associated submissions from each RDC seek to inform the PC about the diversity of the role of the RDCs, the strengths of their structures and the importance of their role in supporting a high level of innovation and productivity growth across the rural sector for the benefit of the Australian community.
CRRDC submission to the PC Inquiry into the R&D corporations model, June 2010 Page 12
2. HOW THE RDC MODEL OPERATES
KEY FEATURES OF THE RURAL R&D CORPORATIONS
During the two decades since they were established, the RDCs have proved to be a successful model for advancing innovation in rural RD&E — especially in the presence of market failure. They have enabled productive partnerships for government and industry investment in science, producing significant benefits to RDC investors and other stakeholders.
Some important characteristics of the RDC model are as follows: • The RDC model is focused on influencing the full range of interactions along the
innovation chain, rather than focusing on generating new knowledge for its own sake. This results in applying significant resources to translating research outputs into practical outcomes and government policies.
• RDCs are not research grant agencies; rather they treat RD&E as an investment in economic, environmental and social benefits to their respective industries and to the people of Australia.
• RDCs are required to conduct their activities in accordance with strategic plans and annual operating plans that must be approved at ministerial level.
• RDCs ensure that a balance is achieved between the respective government and industry priorities.
• RDCs are fully accountable to their major stakeholders and to the wider community.
• In addition to their collaboration on specific RD&E matters, RDCs work closely together on policy issues to increase the effectiveness and efficiency of the national application of rural RD&E.
The RDCs have developed and evolved since their inception about two decades ago. Today, RDCs continue to share a number of common features, but variations and modifications have also been made to address the circumstances and needs of individual rural products. The RDCs range from single commodity corporations (e.g., Sugar RDC and Cotton RDC), to the Rural Industries RDC with responsibility for a range of industries, products and cross-sectoral issues, and corporations covering a diverse range of products (e.g., Grains RDC and Fisheries RDC). They also include industry-owned companies that have responsibility for RD&E and other functions such as promotion and marketing. Broadly, these variations have evolved to suit the needs of the products and the industries they serve, to strengthen the links between the supply chain and the RD&E functions, and to capture administrative efficiencies.
Funding arrangements also vary across the RDCs. The central theme of RDC funding is industry levies, complemented with matching funds from consolidated revenue. The industry levies are collected by the Australian Government, at a rate struck on the recommendation of industry, and with collection costs charged back to industry. Levies are for the most part raised on the production or sale of the raw, unprocessed rural commodity, either at a unit or an ad valorem rate. In addition to these central funding sources, voluntary levy arrangements in some sectors also provide additional RD&E funds, and
CRRDC submission to the PC Inquiry into the R&D corporations model, June 2010 Page 13
contributions from industry to specific projects or programs. A key feature of the RDC model is the involvement of industry directly in the process of determining whether, and at what rate, a levy should be raised. This industry responsibility draws with it an industry commitment to the RD&E process and to the utilisation of the funds.
Under the PIERD Act, the Australian Government matches levy funds expended on RD&E up to a maximum of 0.5% of the gross value of production (a more complex formula applies to the fishing and aquaculture industry). This commitment was made by the Australian Government for the purpose of encouraging increased industry contributions to RD&E, in the knowledge of market failures that prevent private investment in most rural RD&E, and that the PIERD Act required the RDCs to invest in RD&E that has wider environmental and social benefits for the Australian community. The limit on matching funds from consolidated revenue was not apparently based on any target rate of expenditure on rural RD&E, and appears only to have been for the purpose of limiting the Australian Government’s funding commitment under the Act.
A fundamental feature of the RDC model is its focus on individual industry supply chains. The industry focus of the RDCs has important consequences in terms of obtaining industry commitment to levies and research programs. It also makes the processes for distilling research priorities, defining the research tasks and promoting adoption more relevant and manageable for industry. Differences in the size and scope of each RDC principally reflect a judgement based on similarities in research between related products, structural aspects of the industries and relationships between products in a production situation.
RDCs do not concentrate narrowly on farm production. They look widely at the supply chains for their products and look for the most pressing barriers to greater productivity and efficiency in producing and delivering products to consumers. It is a basic economic reality that the benefits of productivity gains at any point in the supply chain are distributed widely to all participants, from producers to consumers; and the RDCs’ research effort acknowledges this reality. In addition, RDCs have responsibilities to conduct research that has environmental and social benefits for the wider community, that promote sustainable resource use, and that respond to research priorities advised to the RDCs by the Minister. The balance between these research areas and priorities is documented in the strategic plans and annual operating plans of each RDC, which are subject to Ministerial approval.
A key attribute of the RDCs is the selection and appointment of independent directors with a broad range of skills and experience. These skill areas include product processing, marketing, science, environmental management, resource management, RD&E administration, finance and rural production. The PIERD Act imposes this structure to ensure that the RDCs maintain a broad perspective over their research fields and to avoid conflicts of interests. The diverse range of skills at board level in each RDC continues to be a vital element in ensuring that RD&E is focused on areas of greatest need and benefit, is of high quality, and is well administered.
The skills of RDC directors are complemented by a range of consultative mechanisms with industry along the supply chain to ensure the RDCs are well informed about industry research needs and are responsive to their constituencies. Input from directors, stakeholders in the supply chain, science and government are compiled into strategic plans and annual operating plans that are open to review and challenge by industry. Few research organisations, in Australia or overseas, can offer such a concentration of expertise, close connection to science and industry, and an open strategic planning process, which at the same time enjoys strong industry commitment and support.
CRRDC submission to the PC Inquiry into the R&D corporations model, June 2010 Page 14
The RDCs are essentially collaborative organisations. They operate on behalf of government and industry supply chains, each representing constituencies that have convergent interests. Wherever possible within their research plans, RDCs utilise their funding to augment the research programs of existing research institutions to progress common priorities. Most RDC projects involve contributions in cash or in kind from other organisations with common interests in the project. Many projects involve more than one research institution, with the research task being coordinated to avoid duplication and to make most efficient use of the available skills and resources. Cooperation between RDCs and research institutions takes place over complementary research so that the benefits of RD&E can be shared in the interests of accelerating the acquisition of knowledge.
The level of collaboration and cooperation by RDCs with each other cannot be measured solely by the number of jointly funded projects. The level of consistency and complementarity between research plans in relation to common research objectives, the absence of overlap in research programs, and the willingness to pursue broader priorities in unison are measures of the degree of collaboration between RDCs, and may produce superior RD&E outcomes to those achieved by larger and more complex, jointly funded, projects. Broad research priorities — such as those relating to climate change, drought tolerance, water use efficiency or species diversity — each involve different research challenges, different production effects, and different modes of adoption in each industry sector. It is therefore frequently more efficient to pursue the common objective in a series of smaller, coordinated industry programs than to aggregate the tasks into a single program, when the ultimate adoption and implementation will have to occur on a product-by-product basis.
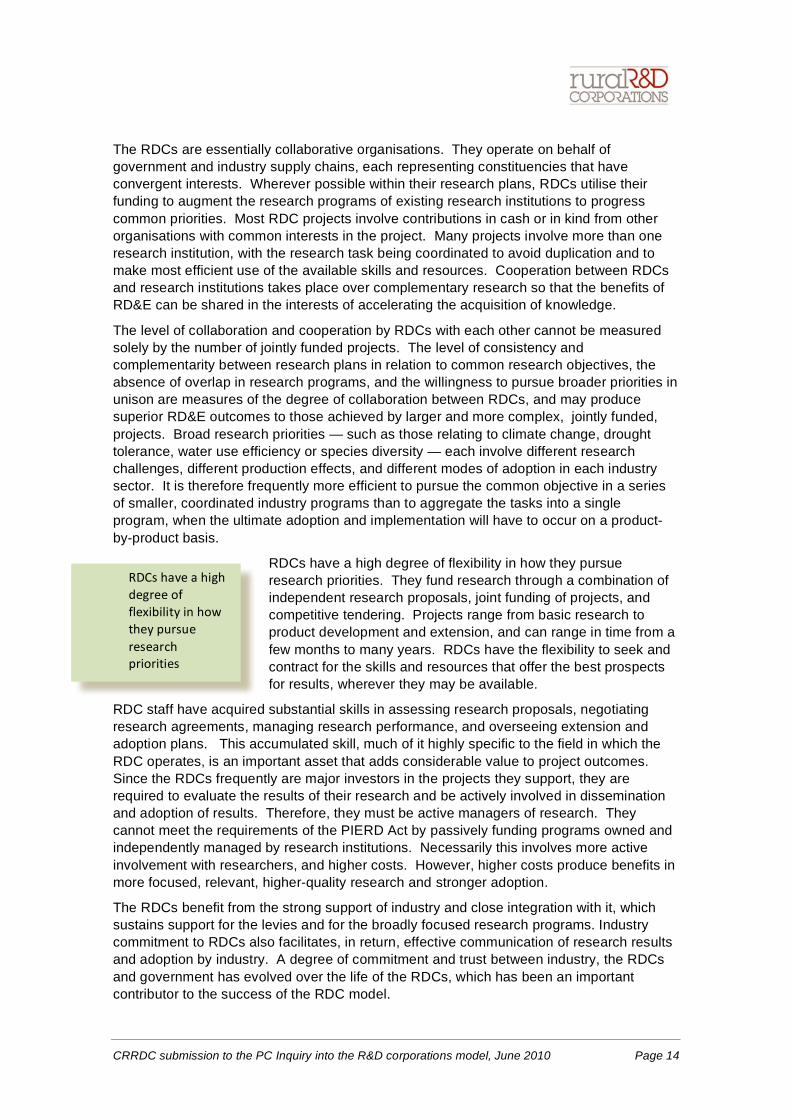
RDCs have a high degree of flexibility in how they pursue research priorities. They fund research through a combination of independent research proposals, joint funding of projects, and competitive tendering. Projects range from basic research to product development and extension, and can range in time from a few months to many years. RDCs have the flexibility to seek and contract for the skills and resources that offer the best prospects for results, wherever they may be available.
RDC staff have acquired substantial skills in assessing research proposals, negotiating research agreements, managing research performance, and overseeing extension and adoption plans. This accumulated skill, much of it highly specific to the field in which the RDC operates, is an important asset that adds considerable value to project outcomes. Since the RDCs frequently are major investors in the projects they support, they are required to evaluate the results of their research and be actively involved in dissemination and adoption of results. Therefore, they must be active managers of research. They cannot meet the requirements of the PIERD Act by passively funding programs owned and independently managed by research institutions. Necessarily this involves more active involvement with researchers, and higher costs. However, higher costs produce benefits in more focused, relevant, higher-quality research and stronger adoption.
The RDCs benefit from the strong support of industry and close integration with it, which sustains support for the levies and for the broadly focused research programs. Industry commitment to RDCs also facilitates, in return, effective communication of research results and adoption by industry. A degree of commitment and trust between industry, the RDCs and government has evolved over the life of the RDCs, which has been an important contributor to the success of the RDC model.
CRRDC submission to the PC Inquiry into the R&D corporations model, June 2010 Page 15
The PIERD Act is structured to improve a number of specific aspects in the administration of rural RD&E, especially to:
• attract increased contributions from industry to the RD&E effort
• focus broader, higher quality skills onto the task of defining research priorities and managing research
• broaden the focus of rural RD&E effort beyond the farm gate and to provide benefits to the wider community
• make rural RD&E more accountable to industry and the Government.
On all accounts, the RDC model, as it has evolved, has been successful in delivering these improvements. It is important that future evolution of the model does not diminish these achievements.
2.1 International comparisons
The RDC model is unique. No other country has a system that draws substantial contributions from rural producers to be channelled into structures that combine industry, the research community and government as partners in determining research plans and funding the execution of those plans.
Commonly, public and private R&D systems operate side by side, with limited formal integration of their activities. Benefits from publicly funded, basic and strategic R&D spill over into private R&D. In most countries there are consultative mechanisms to obtain input into the determination of research priorities for public R&D programs, but often with limited direct input by industry into the ultimate investment decisions. Private interests participate in and support public R&D projects where there is common interest and benefit to be realised from the outcomes.
In New Zealand, the majority of public R&D is conducted through eight Crown Research Institutes. These are Government-owned institutes operating on a mix of government funding and partnerships with commercial entities that contribute funds for research services, with shared rights to the outcomes. Partnerships are predominantly formed with large agribusiness companies. Funds from the Government are substantially provided under a system of contestable grants for identified projects. Performance is judged on a combination of quasi-commercial financial results and scientific performance indicators such as published papers, reports generated and technical presentations. Over all, about 34% of agricultural R&D in New Zealand is funded by the private sector.
Recent public commentary in New Zealand has raised deep concerns about the functioning of the Crown Research Institute model. With a high share of government funding (90%) delivered through contestable grants, it is claimed there is substantial wastage of skilled scientist’s time in preparing grant applications. Further, since grants have a defined life there is no incentive to terminate projects that are unlikely to produce results. The absence of significant core funding is considered to have destabilised careers, led to significant redundancies and discouraged young people from taking science careers.
In the United States, public R&D is funded by the Federal Government through the US Department of Agriculture and by State Governments. Funds are channelled into universities and colleges, federal government laboratories, and state agricultural experiment stations. The latter derive about 7.5% of their funding from industry grants and contracts, whereas federal laboratories are almost exclusively government-funded. Over all, the degree of private involvement in the public R&D system is small (about 5% of total
CRRDC submission to the PC Inquiry into the R&D corporations model, June 2010 Page 16
funds), although private research — separate from government — comprises about 49% of total agricultural R&D spending. Land grant colleges and universities, and state agricultural experiment stations have close consultative relationships with the farm sector, although they are not supported by industry funds.
In the UK, public agricultural R&D is conducted through the Department for Environment, Food and Rural Affairs, and the Biotechnology and Biological Sciences Research Council (BBSRC) — the principal funder of basic and strategic biological research for agricultural research. Together these entities spend about £138 million on R&D nominated as agricultural. The BBSRC expends funds in its own institutes (about 36%) and through universities (57%) and other institutes (7%). It has a council and research committees that determine research priorities; however, the membership of these bodies is overwhelmingly drawn from academic and research organisations. The Agriculture and Horticulture Development Board — with annual R&D expenditure of about £30 million (0.3% of GVP) —
administers grower levies collected by the Government on cereals and oilseeds, milk, pigs, beef and lambs, potatoes, and horticulture. Research priorities and funding decisions for each of the commodity groups are the responsibility of a council which almost exclusively comprises producers.
None of these models combines the joint linkages to science, producers, the supply chain and government that is present in the Australian RDC model.
CRRDC submission to the PC Inquiry into the R&D corporations model, June 2010 Page 17
3. RATIONALE FOR GOVERNMENT FUNDING SUPPORT Annual expenditure on rural RD&E in Australia is at least $1.2 billion per annum, of which about 80% is funded from Australian Government sources (ABS 1). It is common around the world for a high proportion of rural R&D to be funded by government, due substantially to the characteristics of the research. However, investment in rural R&D also produces high rates of return. This gives rise to policy questions concerning the role of government in relation to R&D and the appropriate rate of investment in rural R&D. This section addresses the economic analysis of returns to rural R&D, especially publicly funded R&D, and the role of government in facilitating national investment in rural R&D.
3.1 Opportunity to increase investment in rural RD&E
Extensive academic effort has been devoted during more than half a century to empirical measurement of the returns from public investment in rural R&D. These examinations have looked at specific projects and at aggregate national investment, have used a range of sources of data, have analysed investment periods up to a century, have looked at returns over periods of more than 50 years and have used a wide range of techniques and measures of the returns.
The most extensive review of the estimates of the return to rural RD&E was conducted by Alston and others for the International Food Policy Research Institute in 2000 (Alston et al., 2000). This paper reviewed 292 studies that made estimates of returns to rural RD&E written during a 44-year period from a range of countries from all regions of the globe, both for single industries and for entire national RD&E programs. These studies provided a total of 1,886 estimates of a rate of return to rural RD&E, with 97% of all studies measuring social returns rather than private returns.
The authors found the average of the estimates of the rate of return to research only (1,144) was 100% per annum. The average rate of return to research and extension (1,852 estimates) was 81.3% per annum. The range of the estimates of returns to research was spread widely, but fewer than 10 estimates (less than 1%) found a negative rate of return.
The estimates of the rates of return to RD&E are predominantly from research conducted by government or in other public sector institutions.
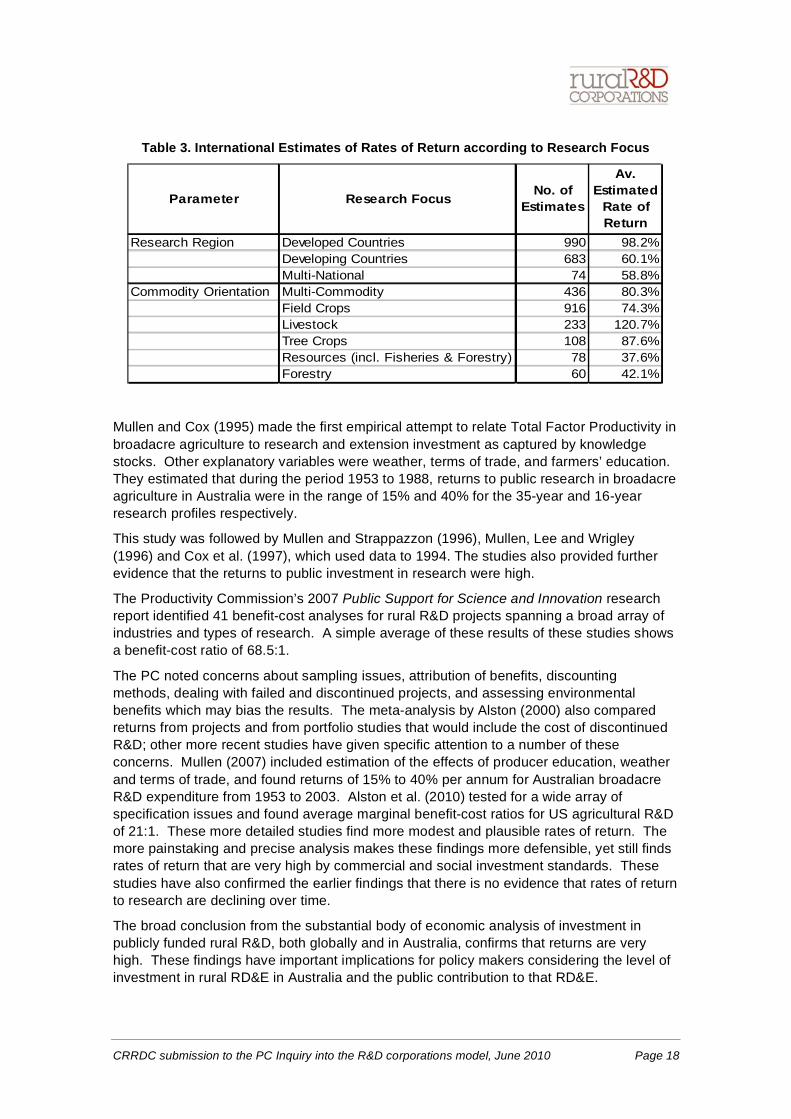
Table 3 provides a comparison, from Alston et al.(2000), of average estimated rates of return to RD&E in sub-groups of the total international data set, in which the RD&E related to a specific geographic region or specific commodities.
Of the studies in the analysis, 154 estimates related to rural RD&E in Australia and four estimates in New Zealand. They include estimates for pasture, sugarcane, trees, wheat, sorghum, rice, pulses, other crops, fruit and nuts, forestry, fisheries, beef, dairy, sheep, goats and all livestock and crops. The average estimated rate of return from all these studies of rural RD&E in Australia and New Zealand was 87% per annum.
The rates of return found in these studies are extremely high, and the authors noted the potential of a number of sources of error or bias in the findings including, project selection, lag lengths, discount rates and spillovers. In an effort to reduce the impact of extreme observations, a number of outliers were discarded from their original sample. However, this still left an average rate of return to research of 79% per annum — still a very high rate. It is useful to note that in this study, there was no evidence that rates of return to research have declined over time.
CRRDC submission to the PC Inquiry into the R&D corporations model, June 2010 Page 18
Table 3. International Estimates of Rates of Return according to Research Focus
Parameter Research Focus No. of Estimates
Av. Estimated
Rate of Return
Research Region Developed Countries 990 98.2%Developing Countries 683 60.1%Multi-National 74 58.8%
Commodity Orientation Multi-Commodity 436 80.3%Field Crops 916 74.3%Livestock 233 120.7%Tree Crops 108 87.6%Resources (incl. Fisheries & Forestry) 78 37.6%Forestry 60 42.1%
Mullen and Cox (1995) made the first empirical attempt to relate Total Factor Productivity in broadacre agriculture to research and extension investment as captured by knowledge stocks. Other explanatory variables were weather, terms of trade, and farmers’ education. They estimated that during the period 1953 to 1988, returns to public research in broadacre agriculture in Australia were in the range of 15% and 40% for the 35-year and 16-year research profiles respectively.
This study was followed by Mullen and Strappazzon (1996), Mullen, Lee and Wrigley (1996) and Cox et al. (1997), which used data to 1994. The studies also provided further evidence that the returns to public investment in research were high.
The Productivity Commission’s 2007 Public Support for Science and Innovation research report identified 41 benefit-cost analyses for rural R&D projects spanning a broad array of industries and types of research. A simple average of these results of these studies shows a benefit-cost ratio of 68.5:1.
The PC noted concerns about sampling issues, attribution of benefits, discounting methods, dealing with failed and discontinued projects, and assessing environmental benefits which may bias the results. The meta-analysis by Alston (2000) also compared returns from projects and from portfolio studies that would include the cost of discontinued R&D; other more recent studies have given specific attention to a number of these concerns. Mullen (2007) included estimation of the effects of producer education, weather and terms of trade, and found returns of 15% to 40% per annum for Australian broadacre R&D expenditure from 1953 to 2003. Alston et al. (2010) tested for a wide array of specification issues and found average marginal benefit-cost ratios for US agricultural R&D of 21:1. These more detailed studies find more modest and plausible rates of return. The more painstaking and precise analysis makes these findings more defensible, yet still finds rates of return that are very high by commercial and social investment standards. These studies have also confirmed the earlier findings that there is no evidence that rates of return to research are declining over time.
The broad conclusion from the substantial body of economic analysis of investment in publicly funded rural R&D, both globally and in Australia, confirms that returns are very high. These findings have important implications for policy makers considering the level of investment in rural RD&E in Australia and the public contribution to that RD&E.
CRRDC submission to the PC Inquiry into the R&D corporations model, June 2010 Page 19
3.1.1 Responses to high rates of return
Investment in rural RD&E can be expected to display diminishing returns: that is, as investment is increased, the marginal additional return from additional investment becomes progressively smaller. When there are diminishing returns, it is rational to continue to increase investment until the marginal return from the last dollar invested just equals the marginal opportunity cost of that dollar. When investment returns are high, it is an indicator that the rate of investment is far below the point at which marginal returns equal marginal cost and that additional investment will yield high rates of return.
The very high rates of returns to public rural RD&E investment observed above give a priori support to two very important conclusions. First, that there are very considerable barriers that either discourage private capital investing in the RD&E and/or prevent private investors from capturing the benefits of the RD&E that produce these high returns (or even a portion of the benefits sufficient to deliver a commercial return). Second, that Australia’s rate of investment is far below the point at which marginal returns equate with marginal costs.
Consequently, Australia would receive a very substantial pay-off from additional investment in rural RD&E.
The first of these conclusions will be discussed in the following section. On the second conclusion, given that private capital has not previously moved, nor is currently moving to invest to obtain these returns, there is a strong argument for the Government to use taxpayer funds to make additional investments in rural RD&E. With marginal returns estimated to be 15-40% per annum, excluding many un-measured or un-valued public benefits, the nation will receive a very substantial payoff from additional public investment. The distribution of these benefits merits consideration. However, an imbalance between public and private benefits on the one hand, and public and private costs on the other, is not sufficient grounds to forgo the returns entirely.
An assessment of the marginal cost of additional investment should consider the opportunity cost of the funds invested if they were put to other uses. When tax revenues are used to make investment in public RD&E, the cost to taxpayers is a loss of utility from giving up choice in how to use those funds. The marginal social opportunity cost of using taxpayer funds for public purposes has been estimated at 20% (Campbell and Bond 1997). This figure has been accepted as a benchmark for the deadweight losses associated with raising taxation revenue. All but the most conservative estimates of the returns to rural RD&E recoup this cost of public funds, suggesting that there is little prospect that additional public investment would fail to produce a positive return to the community.
An assessment of the opportunity cost of investment in additional RD&E might also consider other investment options. The PC (2007) examined the estimates of returns to public R&D in other sectors of the Australian economy. It noted econometric analyses of R&D expenditure in Australia that found rates of return of abut 50% per annum and higher, but also noted a high degree of uncertainty about the results. Of 13 cost–benefit analyses on non-rural R&D programs considered in that report, the simple average benefit-cost ratio was 13.3:1, compared to 68.5:1 for rural RD&E programs. This should not be taken as evidence that investment in rural RD&E will necessarily yield better returns than R&D in other sectors, but is consistent with other findings of the rates of return for public investment in rural RD&E, and supports continued strong investment in rural RD&E.
Australia would receive a very substantial pay-off from additional investment in rural RD&E
CRRDC submission to the PC Inquiry into the R&D corporations model, June 2010 Page 20
Public investment in RD&E (or any other area) gives rise to consideration of where the benefits from that investment will occur — what widely distributed public benefits will result and what private benefits will be created. All public expenditure results in a mix of public and private benefits that accrue more or less widely across the community. That some of the benefits will be private in nature is not sufficient cause to reject a decision to invest, especially if those private benefits are distributed widely in the community. A public investment decision will involve judgement about the extent of the total benefits to the community compared to the share of the benefits that would fall to a narrow group of private interests within the community.
With rates of return available to Australia from additional investment in rural RD&E estimated to be up to 15% - 40% per annum, or even higher for specific programs, it is in Australia’s long-term interests to ensure that those opportunities are captured. The universal consumption of rural products across the community will ensure that a significant share of the benefits is distributed widely within the community. Further, as significant private investment in rural RD&E would not occur autonomously, it is a valid use of taxpayer funds to capture these investment returns. The question of the distribution of those benefits between sectors within the community should be a secondary consideration to the decision to make additional investment in rural RD&E.
3.2 Public goods, industry goods and spill-overs
The outcomes of research are generally referred to in economic parlance as ‘public goods’ or ‘private goods’. Public goods have two key attributes: they are non-exhaustive in consumption and non-excludable. Non-exhaustive means that use of a service (such as information) by one person does not diminish its availability to others. Non-excludability means that it is not possible to exclude economic agents from using the benefits and ‘free riders’ from receiving benefits they do not pay for.
‘Private goods’ occur where research outcomes are rival and excludable, and can therefore be captured privately and funded privately.
When R&D results in the creation of public goods, market failure will generally exist, since there is no incentive for private individuals to invest in this research. Government must invest in these areas of research on behalf of the community in order to produce the desired public benefits.
Research outcomes that generate productivity gains specifically to producers and are non-exhaustive are sometimes referred to as ‘industry goods’. Industry goods arising from R&D are a quasi-private good, in that non-industry entities are unable to apply the R&D and are effectively excluded. However, in the absence of a means through which industry can meet the cost of the research, industry goods are in effect, public goods since individual producers cannot be excluded and do not have sufficient incentive to invest. In the context of Australian rural RD&E, the concept of ‘industry goods’ is highly relevant because of the creation of RD&E levies through which ‘industry’ is able to fund research.
Almost all rural RD&E produces a mix of ‘public goods’ and ‘industry goods’ that are inseparable and the proportions of which are difficult to estimate. The existence of these public goods in the outcomes of rural RD&E is one fundamental rationale for a Government contribution to funding of research. It justifies the sharing of RD&E funding between industry (through levies) and government.
However, the concept of ‘industry goods’ has limitations. If industry were perfectly homogeneous, market responses to the production of industry research benefits would
CRRDC submission to the PC Inquiry into the R&D corporations model, June 2010 Page 21
resemble responses to private research benefits. That is, just as consumers, processors and producers of rural products would share in the benefits from research, so would they also share in the incidence of levies to fund the RD&E, in equivalent proportions. In reality, rural industries are not homogeneous, and there are many inequalities in the manner in which the levy affects producers, in the availability of research benefits to producers and in the distribution of the levy costs and the research benefits among producers, processors and consumers along the supply chain. Wherever inequalities exist, benefits will spill over between producers or groups of producers, to others in the supply chain, and there will be disproportionate sharing of the costs and benefits of research.
These spill-overs are a further type of market failure. They will be discussed in more detail in a following section. However, they may be substantial, and may affect producers’ willingness to contribute levies to fund RD&E. The imperfect nature of industry goods produced by rural RD&E creates a significant incentive for producers to under-invest in levy-funded research to produce these ‘industry benefits’. Therefore, Government investment in rural RD&E must both address funding the production of public benefits discussed above and ensure that there is an optimal rate of investment in producing ‘industry benefits’.
3.3 Inequalities in the distribution of costs and benefits
In a policy context, it is important to consider how markets react to industry RD&E and to RD&E levies in order to understand the distribution of benefits of rural RD&E across the community. However, understanding market reactions to RD&E is no simple task. A variety of forces come into play in determining where benefits ultimately accrue. These forces can be individually complex and their effects difficult to predict when they interact. The economic investigation has been somewhat uneven in shedding light on these forces and their interactions, providing theoretical and analytical evidence on some, while others remain relatively less well understood.
The nature of supply shifts
In a conventional, competitive market model of the effects of research, the supply curve for a given commodity shifts to the right as a result of the adoption of the research results. The demand curve remains unchanged and the outcome is an increase in the quantity consumed and a fall in price paid by consumers. These effects are shown in the left hand graph in figure 1. Research induces the supply curve to shift from S0 to S1 with the result that price declines from P0 to P1 and the quantity consumed increases from Q0 to Q1. In this case, the consumer and producer shares of the gains from research are equivalent to, respectively, the blue and yellow shaded areas shown in the left-hand graph.
However, when the shift in the supply curve is pivotal as shown by S2 in the right-hand graph of figure 1 (page 23), there are distinct differences in the distribution of producer and consumer benefits. The size of the producer and consumer benefits of research from both types of supply shift is dependent on the elasticities of the supply and demand (i.e., the slope of the supply and demand curves), and also on the nature of the supply shift (i.e., whether the shift is parallel or pivotal).
CRRDC submission to the PC Inquiry into the R&D corporations model, June 2010 Page 22
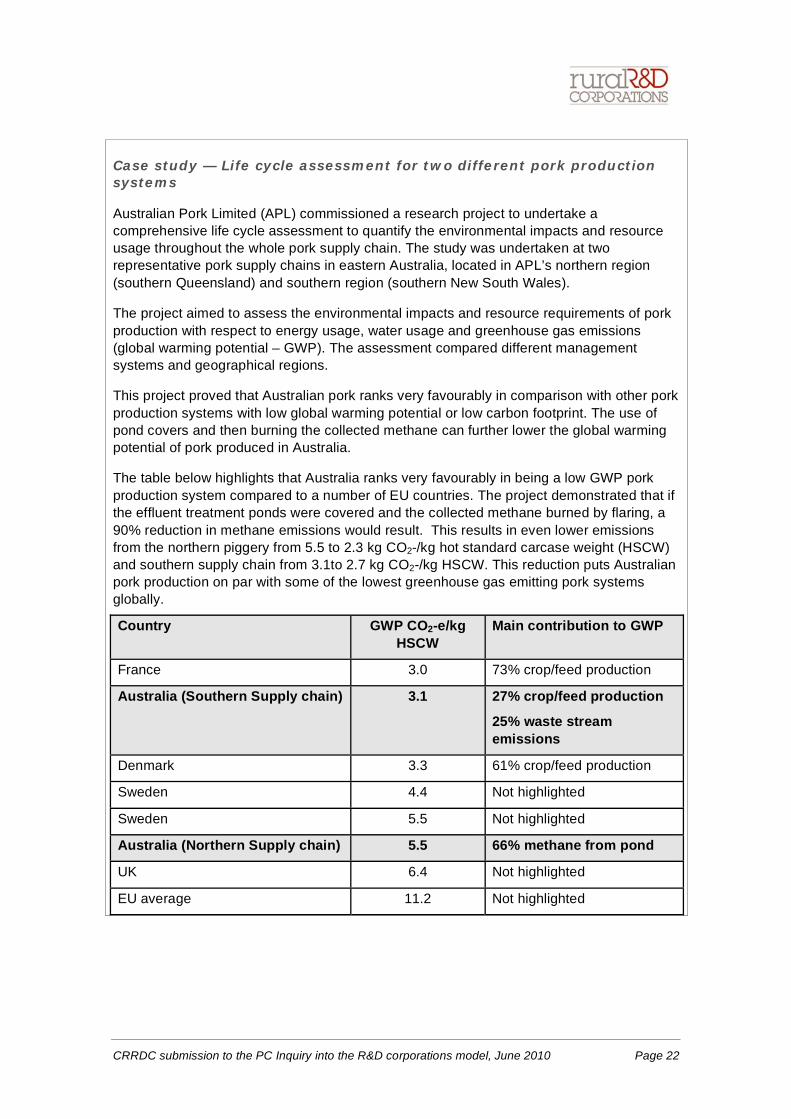
Case study — Life cycle assessment for two different pork production systems
Australian Pork Limited (APL) commissioned a research project to undertake a comprehensive life cycle assessment to quantify the environmental impacts and resource usage throughout the whole pork supply chain. The study was undertaken at two representative pork supply chains in eastern Australia, located in APL’s northern region (southern Queensland) and southern region (southern New South Wales).
The project aimed to assess the environmental impacts and resource requirements of pork production with respect to energy usage, water usage and greenhouse gas emissions (global warming potential – GWP). The assessment compared different management systems and geographical regions.
This project proved that Australian pork ranks very favourably in comparison with other pork production systems with low global warming potential or low carbon footprint. The use of pond covers and then burning the collected methane can further lower the global warming potential of pork produced in Australia.
The table below highlights that Australia ranks very favourably in being a low GWP pork production system compared to a number of EU countries. The project demonstrated that if the effluent treatment ponds were covered and the collected methane burned by flaring, a 90% reduction in methane emissions would result. This results in even lower emissions from the northern piggery from 5.5 to 2.3 kg CO2-/kg hot standard carcase weight (HSCW) and southern supply chain from 3.1to 2.7 kg CO2-/kg HSCW. This reduction puts Australian pork production on par with some of the lowest greenhouse gas emitting pork systems globally.
Country GWP CO2-e/kg HSCW
Main contribution to GWP
France 3.0 73% crop/feed production
Australia (Southern Supply chain) 3.1 27% crop/feed production
25% waste stream emissions
Denmark 3.3 61% crop/feed production
Sweden 4.4 Not highlighted
Sweden 5.5 Not highlighted
Australia (Northern Supply chain) 5.5 66% methane from pond
UK 6.4 Not highlighted
EU average 11.2 Not highlighted
CRRDC submission to the PC Inquiry into the R&D corporations model, June 2010 Page 23
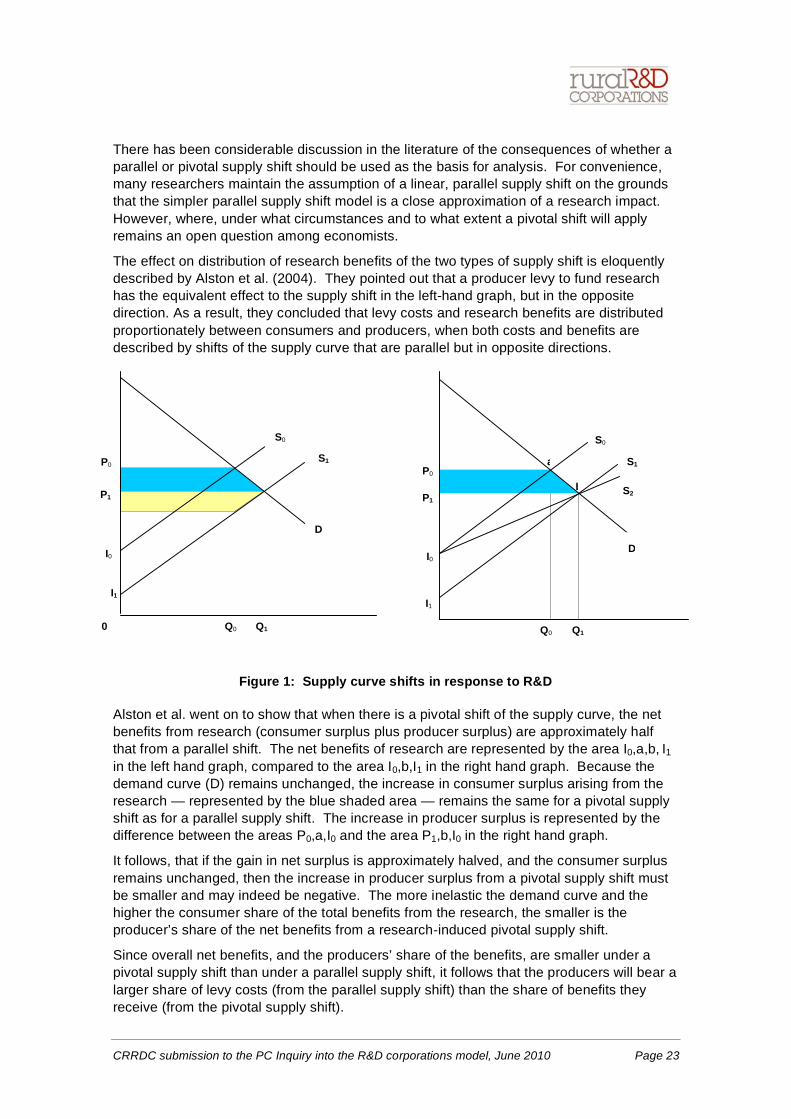
There has been considerable discussion in the literature of the consequences of whether a parallel or pivotal supply shift should be used as the basis for analysis. For convenience, many researchers maintain the assumption of a linear, parallel supply shift on the grounds that the simpler parallel supply shift model is a close approximation of a research impact. However, where, under what circumstances and to what extent a pivotal shift will apply remains an open question among economists.
The effect on distribution of research benefits of the two types of supply shift is eloquently described by Alston et al. (2004). They pointed out that a producer levy to fund research has the equivalent effect to the supply shift in the left-hand graph, but in the opposite direction. As a result, they concluded that levy costs and research benefits are distributed proportionately between consumers and producers, when both costs and benefits are described by shifts of the supply curve that are parallel but in opposite directions.
Figure 1: Supply curve shifts in response to R&D
Alston et al. went on to show that when there is a pivotal shift of the supply curve, the net benefits from research (consumer surplus plus producer surplus) are approximately half that from a parallel shift. The net benefits of research are represented by the area I0,a,b, I1 in the left hand graph, compared to the area I0,b,I1 in the right hand graph. Because the demand curve (D) remains unchanged, the increase in consumer surplus arising from the research — represented by the blue shaded area — remains the same for a pivotal supply shift as for a parallel supply shift. The increase in producer surplus is represented by the difference between the areas P0,a,I0 and the area P1,b,I0 in the right hand graph.
It follows, that if the gain in net surplus is approximately halved, and the consumer surplus remains unchanged, then the increase in producer surplus from a pivotal supply shift must be smaller and may indeed be negative. The more inelastic the demand curve and the higher the consumer share of the total benefits from the research, the smaller is the producer’s share of the net benefits from a research-induced pivotal supply shift.
Since overall net benefits, and the producers’ share of the benefits, are smaller under a pivotal supply shift than under a parallel supply shift, it follows that the producers will bear a larger share of levy costs (from the parallel supply shift) than the share of benefits they receive (from the pivotal supply shift).
I1
Q0 Q1
I0
0
P1
P0
D
S0
S1 S1
I0
P1 S2
Q0 Q1
P0
D
S0
I1
a
b

CRRDC submission to the PC Inquiry into the R&D corporations model, June 2010 Page 24
Other factors affecting market mechanisms
Much of the theoretical discussion and analysis of the supply response to research assumes linear supply and demand curves as shown above. This again is mostly for convenience and to simplify econometric analysis. In reality these functions are more likely to have a curved form, which may significantly alter the size of the producer and consumer surplus and the change in surpluses that result from a research induced supply shift. Estimating the change in surpluses when there are curved supply and demand functions is substantially more difficult than for the simplified linear forms.
Also, much of the theoretical discussion of the response to R&D is based on the assumption of perfectly competitive markets, where the forces of supply and demand interact to produce a market-clearing price. However, in most real-world situations, markets are not perfectly competitive and participants in the supply chain hold varying degrees of market power that enable them to influence the price or quantity consumed, or both. This capacity to influence the market responses to R&D further complicates the distribution of costs and benefits along the supply chain and exacerbates disproportionate allocation of costs and benefits. The inequalities are further compounded when research produces ’industry benefits’ that are unevenly distributed among producers.
When goods are exported, market dynamics are altered. It is usual to view the effects of export of goods as substantially increasing the elasticity of demand for the product. However, the elasticity of the export market varies, since differences in rural ‘commodities’ between countries and even between regions mean that supplies from different regions are not perfect substitutes and demand for particular classes of a commodity will accordingly be less elastic than if commodities were perfectly substitutable. With the existence of export markets, producers face some form of aggregate demand curve that incorporates domestic and export factors. This aggregate demand curve is more complex than a simple average of the two markets, and is not uniform for all producers, as some production is more suited to export markets than others because of type or location. Marketing structures and arrangements for storage, handling and transport also influence the way in which markets operate, and hence the shape of the demand curve to which producers respond.
The results of R&D are not uniformly applicable within an industry. Adoption will vary between producers, and the effects where adoption does occur, will differ according to a wide rage of production factors. As a result, the effects of R&D on the size, nature and shape of shift in the supply curve are difficult to determine — either in aggregate or for individual producers.
3.4 Market failures
The conventional rationale for public funding of rural RD&E is the existence of pervasive and substantial market failure. The pre-conditions for some of the forms of market failure have been discussed above. However, the market failures affecting the performance of rural RD&E take a number of forms. They are discussed in the following sections.
3.4.1 Non-excludability / non-exhaustion
Productivity gain from most rural RD&E is derived from techniques for managing production processes that are common to many producers of any given commodity. This knowledge is readily transferred between individuals and the value of the knowledge is not diminished by
CRRDC submission to the PC Inquiry into the R&D corporations model, June 2010 Page 25
any one individual’s use of the knowledge. This limits the capacity to restrict access to the benefits of the research and for investors to appropriate returns from the research. To the extent that industry is not homogeneous, that industry benefits are not uniformly available or applicable, and that there is inequality in the distribution of costs and benefits, there will be market failure and producers will have insufficient incentive to make an optimal investment in research.
3.4.2 Non-divisibility of research costs and ‘small firms’
Research projects require specialist skills and equipment, and are costly to undertake. Substantive rural RD&E programs typically require a budget of more than $11 million (CRRDC 2010). By their nature, research projects cannot be scaled down to suit the available resources of small rural businesses. Average net capital value of broadacre farms in Australia is about $3.3 million and average annual net cash income is about $70,000 per year (ABARE 2010).
Clearly, the size of the investment required to produce worthwhile results is beyond the financial capacity of virtually all farm businesses. Even groups of producers who might share a common interest because of regional factors or similarity in products will be likely to find it impossible make a cooperative investment of this order of magnitude. The high cost of research projects and the inability for projects to be scaled down to a size at which individuals can invest is a further source of market failure that, in the absence of Government intervention, would result in under-investment in rural RD&E.
Some authors have also suggested that there are significant economies of size, scale and perhaps scope in rural research (eg. Traxler and Byerlee, 2001). Such economies favour pursuing rural RD&E in larger more robust programs, rather than in smaller, regionally focussed structures. This further mitigates the benefits available from seeking to pursue research on a regionally co-operative basis and favours larger nationally based structures for rural RD&E. However, the larger the constituency for the research, the less homogeneous it will be and the greater will be the incentive for producers to under invest in RD&E.
3.4.3 Spill-over of benefits in multiple directions
Within and across regions, the non-excludable benefits of rural RD&E initiated by producers or others in rural supply chains, individually or collectively, cannot be confined to the contributors and can be readily taken up by non-contributors. Some of these spill-overs are confined to the product supply chain and are distributed to all participants by the market forces within the supply chain for the product. Other spill-overs are unrelated to the supply of the product or are specific to certain beneficiaries. All these types of spill-over benefits flow to a range of different groups in the community, including:
• intra-region, between producers
• inter-region, between producers
• between generations and/or growers entering or leaving the industry because of long adoption lags (up to 50 years)
• to other private interests up and down the supply chain
• to consumers.
CRRDC submission to the PC Inquiry into the R&D corporations model, June 2010 Page 26
Spill-overs among producers
Rural RD&E will have unequal impacts among a heterogeneous group of producers. Individual producers vary in size of operation, capacity to adopt various types of research, have subtly different production methods, different perceptions of risk and face different production conditions. As a result, individual needs and preferences for research benefits will vary even among geographically close production units. All other matters aside, these differences would lead producers to under-invest in RD&E, even through levy arrangements, since individuals would face uncertainty about the returns they would individually receive from a collective investment.
Across regions, the benefits of RD&E cannot be confined to producers within a region. Much research initially conducted in one region has been found to generate benefits to producers in other regions so that groups of individuals who might contribute to research in their region would be unable to prevent benefits flowing to producers in other regions. Alston et al. (2010) closely analysed regional spill-overs among US states. US states are smaller in size than in Australia, they may accord more with the general notion of regions in Australia. The findings (p. 460) were that on average, 57% of productivity gains in US agriculture were accounted for by own-state research and extension, with the remaining 43% accounted for by spill-ins from other states. Similar results could be expected in Australia at a regional level. Thus, if producers were able to undertake RD&E through cooperative or levy arrangements at a regional level, they face a leakage of benefits and uncertainty about the returns they would receive, which would lead them to under-invest in RD&E.
Recent studies of the benefits of rural RD&E have more accurately defined and estimated the lags involved in realising the benefits. Alston et al. (2010) reviewed the lag shapes and lengths used by a range of studies and tested alternative formulations on their data set for US agricultural research. Their results showed that models which allowed research to affect productivity for the following 50 years provided the closest explanation of the observed data, although most of the benefits were exhausted after 35 years (p. 459). With research lags (i.e., between investment and obtaining research results) of up to 10 years and development lags (i.e. to test the findings in field settings) of 3–5 years, before adoption commences, and then further lags before producers adopt a new research results, these findings are entirely plausible.
Mullen (2007) also addressed the length of research lags in the Australian context and found results indicating lags of at least 35 years in realising the benefits of Australian rural R&D.
It is to be expected that with such lags in realising the benefits of RD&E, producers will be unable to receive, within their working lifetime, all the benefits of an investment to which they contribute. Further, producers would face a rapidly increasing incentive to cease investment in RD&E as they aged. Indeed, a farmer of median age in Australia of 52 years (ABS 2008), acting to maximise his own welfare, would be unlikely to invest in RD&E since the results would not be available for adoption before he was ready to retire from the occupation. Even if smaller scale collective investment was to occur, a significant residual proportion of the benefits would be realised by future producers. Many of these unrealised benefits would be uncertain or invisible to a new producer on entering the industry and would accordingly not be capitalised into the value of land or other assets that were acquired on commencing production. For the new producer, these accumulated, unrealised research benefits to which they did not contribute would represent a windfall gain, while the departing producer would face an investment loss.
CRRDC submission to the PC Inquiry into the R&D corporations model, June 2010 Page 27
These various spill-overs of benefits between producers provide a powerful incentive for individual producers to forego investment in rural RD&E. Without intervention by the Government, Australia would see very low rates of rural RD&E with consequent dramatic effects on farm productivity and the wider benefits to the community.
Spill-overs to other private interests
Research outcomes, by their nature, are capricious and are liable to have effects outside their intended target. Research aimed at a productivity gain for producers may instead, or additionally, produce a productivity gain among non-farm users of the commodity. For example, research that leads to a higher-yielding wheat variety may also have improved flour yield, or improved dough properties for baking, which will improve productivity in milling and baking quite separate from the yield benefit to producers. Marketing systems are not always capable of reflecting these benefits in the price of individual transactions of goods that embody these benefits.
When the benefits of research cannot be contained, market forces will cause the benefits of productivity gains to be distributed along the supply chain to all participants. RD&E that creates productivity gains for producers also benefits processors, handlers and marketers of the product in greater volumes, lower prices or other product attributes. As discussed above, the distribution of these benefits is rarely proportional to the distribution of the levy costs, with the inequality often being substantial. There will be winners and losers.
Consumers Consumers may also receive unexpected benefits from RD&E aimed at improving rural productivity. For example, RD&E to improve animal nutrition may improve animal growth rates and meat yield, while at the same time improving eating quality for consumers and improving the welfare of the animals — quite separately from the effects on farm productivity.
3.4.5 Public benefits
Public benefits, as described at the beginning of this section, have two key attributes: they are non-exhaustive in consumption and non-excludable. When research produces public benefits, there is likely to be market failure since there is no incentive for individuals to invest in producing those benefits. Public benefits are usually not embodied in specific transactions for rural products. These benefits are additional to the share of economic benefits that accrue to consumers, and include a range of qualitative benefits and measurable but unpriced benefits that accrue widely across the community.
Why public benefits arise from rural RD&E: Because rural production stems from natural biological growth processes and is conducted within the natural environment, rural RD&E is focused on understanding, preserving and manipulating these processes and the environment in which they take place. It is inevitable that this work will have significant implications on the natural environment outside of rural production and on the community’s ability to manage and protect the natural environment.
CRRDC submission to the PC Inquiry into the R&D corporations model, June 2010 Page 28
The public benefits and the industry benefits from much rural RD&E are impossible to predict with precision and are impossible to separate. Thus, and with the added complication that RD&E is always subject to chance, it is impossible to separately fund RD&E for the public good and RD&E that delivers industry benefits.
Stable, high-quality food supply: A stable, high-quality food supply is a fundamental characteristic of modern, advanced society. Rural RD&E is continuously providing better protection
for rural products and the food supply against climatic, seasonal and disease factors that diminish quality and availability. This stability alleviates shortages and price fluctuations that consumers would otherwise face across most rural products. Improved production methods, better adapted plant and animal varieties and greater capacity to select varieties that embody consumer quality attributes result in constant improvement in consumer quality, longer shelf life and less wastage.
Food safety: Avoidance of food-borne illness and disease is taken for granted by most consumers, without realising that it is the result of a substantial, on-going research effort that feeds into production and food handling systems and often into food regulations. Improvements in food safety are the result of incremental movements in a mix of regulatory standards, supply–demand pressures and industry practice that are largely not visible to consumers. The market value of these benefits over time becomes impossible to separate from the fundamental effects of productivity improvement on supply and price.
Human medical science: Direct linkages between human medicine and rural science can be seen in relation to R&D that relates to protection from cross-species diseases such as influenza variants (e.g. avian and pig influenza pandemics) lyssavirus and Creutzfeldt–Jakob disease (CJD) variant (mad cow disease). Work on preventing, controlling and treating these diseases involves joint efforts between rural R&D and human medicine. In addition, many advances in human medicine have their origins in primary industry and veterinary science. For example, much of the technology involved in human fertility treatment was originally developed and used in agriculture. Gene technology developments, originally pioneered in agricultural science, have become part of the body of science that now underpins work in developing treatments for human genetic disorders.
Environmental and climate science: There are close links between many facets of rural R&D and environmental and climate sciences. It is from rural R&D targeted at understanding soil structures, soil fertility and hydrology, and from animal and plant sciences, that we have at our disposal a clear picture of the biosphere that operates on agricultural land. This knowledge base informs and drives environmental research and conservation activity across much of the Australian landscape.
These linkages are at times difficult to identify and the benefits difficult to quantify. Many of the public benefits arise from the R&D in direct association with the more obvious economic benefits as an integrated result, and in proportions that are often not apparent while research is in progress.
3.5 Responding to market failure From the foregoing discussion, it is clear that a range of public benefits derive from rural RD&E and significant spill-overs from industry benefits flow to a range of recipients. Both of these factors give rise to market failure in relation to the rate of investment that will occur in the absence of Government intervention and support for rural RD&E. In the absence of
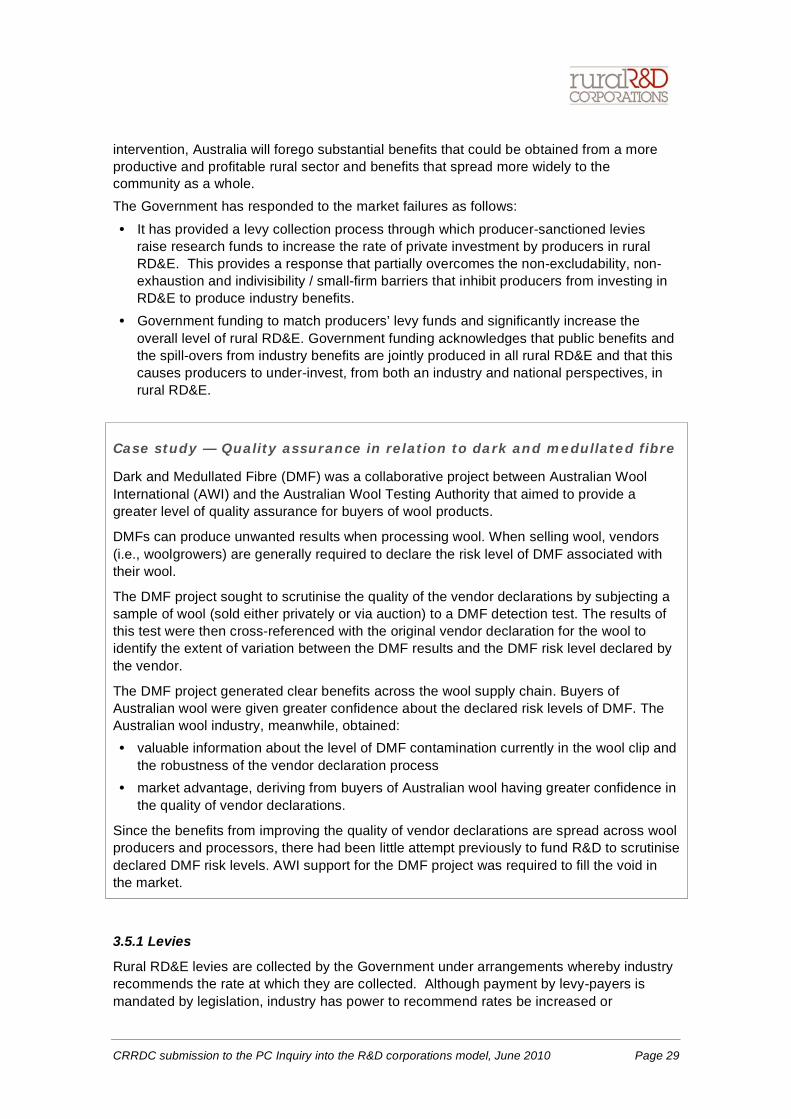
CRRDC submission to the PC Inquiry into the R&D corporations model, June 2010 Page 29
intervention, Australia will forego substantial benefits that could be obtained from a more productive and profitable rural sector and benefits that spread more widely to the community as a whole. The Government has responded to the market failures as follows:
• It has provided a levy collection process through which producer-sanctioned levies raise research funds to increase the rate of private investment by producers in rural RD&E. This provides a response that partially overcomes the non-excludability, non-exhaustion and indivisibility / small-firm barriers that inhibit producers from investing in RD&E to produce industry benefits.
• Government funding to match producers’ levy funds and significantly increase the overall level of rural RD&E. Government funding acknowledges that public benefits and the spill-overs from industry benefits are jointly produced in all rural RD&E and that this causes producers to under-invest, from both an industry and national perspectives, in rural RD&E.
Case study — Quality assurance in relation to dark and medullated fibre
Dark and Medullated Fibre (DMF) was a collaborative project between Australian Wool International (AWI) and the Australian Wool Testing Authority that aimed to provide a greater level of quality assurance for buyers of wool products.
DMFs can produce unwanted results when processing wool. When selling wool, vendors (i.e., woolgrowers) are generally required to declare the risk level of DMF associated with their wool.
The DMF project sought to scrutinise the quality of the vendor declarations by subjecting a sample of wool (sold either privately or via auction) to a DMF detection test. The results of this test were then cross-referenced with the original vendor declaration for the wool to identify the extent of variation between the DMF results and the DMF risk level declared by the vendor.
The DMF project generated clear benefits across the wool supply chain. Buyers of Australian wool were given greater confidence about the declared risk levels of DMF. The Australian wool industry, meanwhile, obtained: • valuable information about the level of DMF contamination currently in the wool clip and
the robustness of the vendor declaration process • market advantage, deriving from buyers of Australian wool having greater confidence in
the quality of vendor declarations.
Since the benefits from improving the quality of vendor declarations are spread across wool producers and processors, there had been little attempt previously to fund R&D to scrutinise declared DMF risk levels. AWI support for the DMF project was required to fill the void in the market.
3.5.1 Levies
Rural RD&E levies are collected by the Government under arrangements whereby industry recommends the rate at which they are collected. Although payment by levy-payers is mandated by legislation, industry has power to recommend rates be increased or
CRRDC submission to the PC Inquiry into the R&D corporations model, June 2010 Page 30
decreased — potentially to zero. By this mechanism, industry has a measure of control over its contribution to the level of investment in RD&E. Finding an appropriate balance between public and industry benefits from levy-funded RD&E is important in maintaining support for the RDC system.
Levies paid by producers to fund rural RD&E are not equivalent to private investment in RD&E. As discussed above, the distribution of benefits between levy payers will not be directly proportional to their contributions. Differences in the level of benefits received by individual levy payers, possibly of substantial magnitude, will occur within and between regions as a result of varying production conditions, differing limitations on productivity increase, and differing adoption preferences. The effects of differences in adoption will be magnified when effects on product prices are taken into account, since the levy payer who cannot (or chooses not to) adopt the RD&E will not benefit from the productivity increase and will suffer a price fall and income reduction.
Levies do not resolve the effects of the very long lags, of up to 50 years, in distribution of benefits from rural RD&E. Current levy payers will receive only a portion of the benefits from the RD&E that their levies fund, with the balance going to future producers.
In addition, any change in supply and demand conditions between when the levy is collected and the benefits received years later, will contribute to inequality between the shares of the costs and the benefits that producers bear. Earlier discussion addressed the complexities of the distribution of levy costs and research benefits along the supply chain. The temporal differences in the distribution of these costs and benefits are a further source of potential inequality that will contribute to under-investment by producers.
3.5.2 Government funding
Government funding of rural RD&E must respond to two classes of market failure: the production of public benefits and spill-over from industry benefits. There is no incentive for individuals to invest in research that produces public benefits; the presence of public benefits in the outcomes of rural RD&E diminishes the incentive for producers to invest.
The non-homogeneous nature of rural industries, and the inequalities in distribution of levy costs and benefits, will cause producers to under-invest in industry RD&E. To the extent that these problems are present in industry RD&E, the industry benefits that are produced take on characteristics of public benefits with attendant market failures. As a result, a Government contribution is required to obtain a socially optimal rate of investment in the industry benefits that rural RD&E generates.
3.6 Other rationales for government support Rural RD&E has a range of other policy objectives — not readily measured in monetary terms — that have strategic national importance, and that form a further, strong imperative for ensuring that Australia maintains a robust rural RD&E effort.
3.6.1 Recompense for rural RD&E spill-ins
Australia benefits greatly from rural RD&E conducted overseas, especially in areas such as biotechnology, pesticides and veterinary medicines, and plant germplasm. Mullen (2007) stated that these spill-ins could be responsible for as much as 40% of agricultural productivity gains in Australian broadacre agriculture. A purely economic assessment might suggest that Australia should treat this as a windfall gain, with no responsibility to provide any return or quid pro quo. However, in the context of Australia’s international policy relations and as a wealthy country, the nation has a responsibility to make a
CRRDC submission to the PC Inquiry into the R&D corporations model, June 2010 Page 31
contribution to the global accumulation of knowledge of agricultural sciences, and to make some recompense for the spill-in benefits it receives from foreign R&D.
It should also be noted in this context that Australia requires a viable domestic rural RD&E capability in order to benefit from these spill-ins. In many instances, adaptive research is required in order to apply foreign research to local conditions and facilitate adoption by local producers.
Case study — Linking the supply chain
Linking RD&E to the whole supply chain (forest growing, processing and market access) has always been a priority for Forest and Wood Products Australia (FWPA) and its predecessor, the Forest and Wood Products Research and Development Corporation.
Until recently, levies were only collected from processors and importers. However, RD&E activities were never restricted to these market segments as the organisation has always invested in projects in both plantations and native forests.
In 2007, the addition of a levy on forest growers has expanded the organisation’s ability invest in activities that affect the whole sector and its end-users. State government agencies, which are major forest growers, have entered into voluntary agreements with FWPA to provide funds at the same unit rate as the private sector growers.
FWPA is the only RDC that has a levy on imports — the third-largest source of its levy funds. More importantly, the import levy ensures that there are no free riders on the RD&E outcomes that result from investment in market access.
FWPA has four industry advisory groups to help ensure that its RD&E investments are addressing the needs of the whole supply chain. Advisory group members are drawn from FWPA members (government and private) and other organisations within the sector. The advisory groups have recently become more focused on promoting the uptake and adoption of research findings.
Some recent examples of this whole supply chain focus include: • a national life-cycle inventory database for timber building products and subsequent
pilot life-cycle assessment for alternative house designs in Melbourne, Sydney and Brisbane
• the Solid Wood Initiative, a trans-Tasman research consortium, which aims to develop technologies that maximise sawmill product value and volume recovery through utilisation of log measured input log properties to inform the selection of final processing options
• the Juvenile Wood Initiative, which has investigated the genetic control of wood formation and inter-relationships among wood traits and could lead to improvements for the plantation grower and solid wood processing sectors.
In addition, technology transfer and industry adoption of research outputs is also facilitated via the broad coverage of the FWPA levy base. All elements of the industry have equal access to the research findings and technology transfer events coordinated by FWPA and its research providers.
CRRDC submission to the PC Inquiry into the R&D corporations model, June 2010 Page 32
3.6.2 Global food security
Global population is currently estimated by the World Bank at 6.8 billion people and increasing at 1.8% (120 million people) per year. Many policy-makers and commentators have warned of increasing stress on available food supplies and the prospects of increasing food shortages and food security problems for many countries. All nations, rich and poor, will need to contribute to this challenge by contributing to the stock of knowledge of the environment and of food and fibre production, so as to increase rural productivity.
Developed nations possess about 26% of the world’s agricultural land and currently produce about one-third of agricultural products. They are net exporters of agricultural products to the rest of the world. Their role in the food security challenge is two-fold: to continue to increase their net exports of rural products, and to contribute to the accumulation of knowledge of rural production that will assist productivity growth in poorer countries.
The developed nations have the skills and financial resources to address these problems and have a humanitarian responsibility to contribute from these skills and resources to the global food security effort. To do so, they must sustain their domestic rural RD&E effort and human skills in rural sciences to build knowledge of rural production.
The global food security challenge has taken on an added dimension as understanding of the implications for rural production of greenhouse gas emissions and climate change becomes more apparent. Future gains in global food productivity will increasingly need to be made against a requirement to also reduce greenhouse gas emissions, reduce net energy consumption, and respond to changing climatic conditions.
The RD&E conducted by RDCs contributes to the stock of knowledge of food and rural production and the development of Australia’s skills base in this field. This knowledge, in turn, contributes to global efforts to improve food security through spill-overs from Australian research to research by other countries, and through Government aid programs and participation by scientists in foreign research and in non-government aid programs.
3.6.3 Research intensity and global share of agricultural land
International comparisons of Australia’s commitment to rural RD&E can be made with a range of measures. A measure cited in some literature is to compare countries based on R&D expenditure per dollar of agricultural output. On this measure, Australia spends about $3.30 on public R&D per $100 of agricultural production, similar to the UK ($3.18) and greater than the US and Canada ($2.24). The global average of public outlays on rural R&D is estimated at $1.38 per $100 of production.
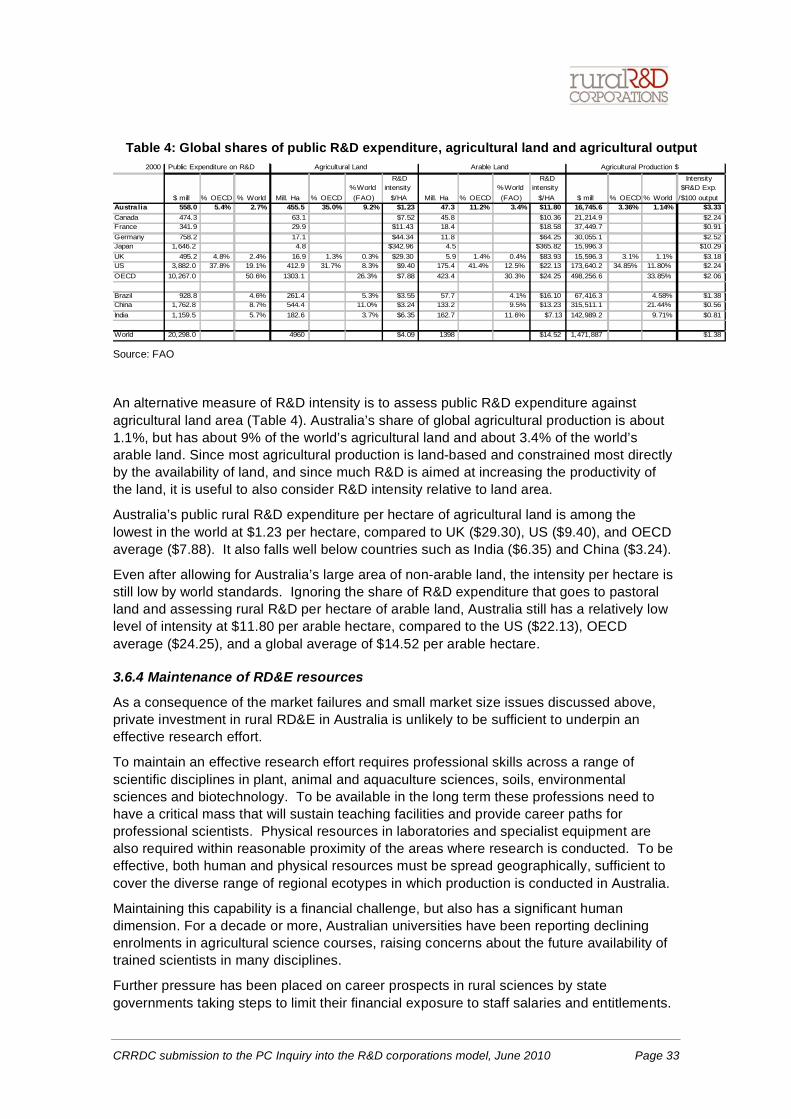
CRRDC submission to the PC Inquiry into the R&D corporations model, June 2010 Page 33
Table 4: Global shares of public R&D expenditure, agricultural land and agricultural output 2000
$ mill % OECD % World Mill. Ha % OECD%World (FAO)
R&D intensity
$/HA Mill. Ha % OECD%World (FAO)
R&D intensity
$/HA $ mill % OECD % World
Intensity $R&D Exp.
/$100 outputAustralia 558.0 5.4% 2.7% 455.5 35.0% 9.2% $1.23 47.3 11.2% 3.4% $11.80 16,745.6 3.36% 1.14% $3.33Canada 474.3 63.1 $7.52 45.8 $10.36 21,214.9 $2.24France 341.9 29.9 $11.43 18.4 $18.58 37,449.7 $0.91Germany 758.2 17.1 $44.34 11.8 $64.25 30,055.1 $2.52Japan 1,646.2 4.8 $342.96 4.5 $365.82 15,996.3 $10.29UK 495.2 4.8% 2.4% 16.9 1.3% 0.3% $29.30 5.9 1.4% 0.4% $83.93 15,596.3 3.1% 1.1% $3.18US 3,882.0 37.8% 19.1% 412.9 31.7% 8.3% $9.40 175.4 41.4% 12.5% $22.13 173,640.2 34.85% 11.80% $2.24OECD 10,267.0 50.6% 1303.1 26.3% $7.88 423.4 30.3% $24.25 498,256.6 33.85% $2.06
Brazil 928.8 4.6% 261.4 5.3% $3.55 57.7 4.1% $16.10 67,416.3 4.58% $1.38China 1,762.8 8.7% 544.4 11.0% $3.24 133.2 9.5% $13.23 315,511.1 21.44% $0.56India 1,159.5 5.7% 182.6 3.7% $6.35 162.7 11.6% $7.13 142,989.2 9.71% $0.81
World 20,298.0 4960 $4.09 1398 $14.52 1,471,887 $1.38
Agricultural Production $Public Expenditure on R&D Agricultural Land Arable Land
Source: FAO
An alternative measure of R&D intensity is to assess public R&D expenditure against agricultural land area (Table 4). Australia’s share of global agricultural production is about 1.1%, but has about 9% of the world’s agricultural land and about 3.4% of the world’s arable land. Since most agricultural production is land-based and constrained most directly by the availability of land, and since much R&D is aimed at increasing the productivity of the land, it is useful to also consider R&D intensity relative to land area.
Australia’s public rural R&D expenditure per hectare of agricultural land is among the lowest in the world at $1.23 per hectare, compared to UK ($29.30), US ($9.40), and OECD average ($7.88). It also falls well below countries such as India ($6.35) and China ($3.24).
Even after allowing for Australia’s large area of non-arable land, the intensity per hectare is still low by world standards. Ignoring the share of R&D expenditure that goes to pastoral land and assessing rural R&D per hectare of arable land, Australia still has a relatively low level of intensity at $11.80 per arable hectare, compared to the US ($22.13), OECD average ($24.25), and a global average of $14.52 per arable hectare.
3.6.4 Maintenance of RD&E resources
As a consequence of the market failures and small market size issues discussed above, private investment in rural RD&E in Australia is unlikely to be sufficient to underpin an effective research effort.
To maintain an effective research effort requires professional skills across a range of scientific disciplines in plant, animal and aquaculture sciences, soils, environmental sciences and biotechnology. To be available in the long term these professions need to have a critical mass that will sustain teaching facilities and provide career paths for professional scientists. Physical resources in laboratories and specialist equipment are also required within reasonable proximity of the areas where research is conducted. To be effective, both human and physical resources must be spread geographically, sufficient to cover the diverse range of regional ecotypes in which production is conducted in Australia.
Maintaining this capability is a financial challenge, but also has a significant human dimension. For a decade or more, Australian universities have been reporting declining enrolments in agricultural science courses, raising concerns about the future availability of trained scientists in many disciplines.
Further pressure has been placed on career prospects in rural sciences by state governments taking steps to limit their financial exposure to staff salaries and entitlements.
CRRDC submission to the PC Inquiry into the R&D corporations model, June 2010 Page 34
As dependence of state departments of primary industry on outside funding for many projects has increased, some departments have employed many professional staff on short-term contracts that mirror funding from outside sources. This has substantially diminished the job security offered to many professional scientists and significantly diminished the reputation and attractiveness of the professions.
To maintain an effective rural RD&E effort, the Government’s policy must have a clear long-term commitment to sustaining the human and physical resources required for this task. There are concerns that some scientific fields are reaching critically low numbers and facing significant difficulties in recruiting new entrants to the discipline, to extents that will affect capability in the medium term.
3.7 Why are rural industries different?
A number of characteristics of rural produce, producer firms, the production environment and rural production systems differentiate rural sector production from non-farm production, and cause of market failures in relation to rural RD&E as follows:
• Rural sector production relies essentially on harvesting the results of self-sustaining, biological, growth processes. RD&E is predominantly focused on the subtle modification of these processes. Research outputs typically take the form of information which is readily transferred between individuals and cannot be controlled by the owners of the research. By comparison, production of most non-farm goods involves synthetic, controlled processes that require specialised equipment, specific intellectual property and/or highly skilled operators to sustain output. The results of this RD&E can often be protected by intellectual property rights or are more difficult for non-contributors to apply.
• Rural production takes place in a continuously variable, seasonally bound, natural environment, compared to the stable, controlled, environment and short production cycle of most non-farm products. This limits the geographic scope of much rural RD&E to areas that share relatively homogeneous conditions. It also requires that rural R&D and evaluation of results be conducted over several seasonal production cycles to obtain reliable results. While there are exceptions (e.g., human therapeutic goods), this substantially increases the cost of rural R&D and lengthens the time to complete research, relative to much non-farm production research.
• Small or negative economies of scale in rural production limit the output of individual firms to a small share of total demand. Individual production must be combined with the output of other producers early in the supply chain to make up marketable parcels for processors or for international trade. As a result, producers generally lack economies of scale to pursue R&D that can be applied to a significant share of total production. Economies of scale in producing many non-farm goods often leads to a high degree of concentration, with individual firms capturing a larger share of production. This concentration makes it financially viable to undertake relevant R&D and facilitates restriction of others realising the benefits of the research.
• Rural products are frequently low-value (per unit), bulky commodities with unavoidable variability in attributes within and between seasons. This variability limits the potential for individual producers to differentiate their product in the market and capture value from differentiation. Potential rewards for individual R&D aimed at product differentiation and development are limited.
CRRDC submission to the PC Inquiry into the R&D corporations model, June 2010 Page 35
• The results of rural R&D frequently face non-excludability and non-exhaustion attributes that prevent the securing and protecting of intellectual property. By comparison, a large share of R&D for non-rural products is embedded in products or processes for which intellectual property rights can be secured permitting private investors in R&D to capture financial returns from the research. As expected, where these conditions do not apply, the public sector is also found to play a major role in funding non-rural R&D.
• The food and fibre products derived from rural industry are essential for life — they are consumed every day by all members of the community. In turn, the benefits of rural RD&E are also consumed daily and distributed across the community through the community’s daily consumption patterns. Few non-rural goods have such pervasive consumption patterns and naturally wide distribution of benefits.
• Since rural production is environmentally dependent and rural RD&E is focused on understanding and managing the environment, there are substantial spill-over benefits for understanding and managing the total environment, other than for production purposes. Few non-rural products are so integrally related to the environment that R&D produces these spill-over benefits for the community.
The foregoing attributes create a disincentive to invest in a wide range of RD&E related to production systems, product development, environmental management and commodity handling, transport, storage and marketing. Those attributes are common to most rural production, and collectively have a substantial effect on the potential for operators to profitably undertake RD&E individually or collectively. Non-farm industries may experience one or perhaps a few of these attributes, but do not face the same co-incidence of factors as to substantially diminish the incentive for individual firms to invest in R&D.
The factors that differentiate rural production and rural RD&E from the circumstances of other industry sectors apply universally. They substantially explain the observation that in most countries — whether developed, first-world economies or developing economies — rural RD&E is substantially funded by government.
3.8 A comment on private rural R&D in Australia
Nationally, Australia forms a relatively small proportion of world production for most rural commodities. This has implications for certain fields of rural R&D typically undertaken by the private sector, such as development of new pesticides, herbicides and veterinary medicines, for which the costs of developing and registering uses for a new active ingredient are of the order of $100–200 million each. Much of this research has application globally or across many countries and can avail itself of well-developed intellectual property systems. This research is generally conducted by large multi-national companies with research centres based in North America or Europe. These regions, because of their larger volume of agricultural production, represent major potential markets for the products. The concentration of these rural R&D segments in North America and Europe significantly boosts the level of private R&D observed in those regions, and influences the balance of public and private rural R&D shown in statistical comparisons between countries.
These concentrated global R&D programs give rise to follow-on R&D in Australia that is predominantly privately funded and performed. This is principally adaptive research to, for example, establish efficacy under local conditions.
Other fields of R&D that have global application include, for example, tractor and machinery development, identification and isolation of plant genetic traits; and to a lesser extent, some early-stage plant breeding.
CRRDC submission to the PC Inquiry into the R&D corporations model, June 2010 Page 36
Australia has opportunities to participate in some elements of this research, but participation is dependent on the receptiveness of the domestic commercial and regulatory environment. The domestic regulatory environment, for example, has harmed Australia’s capacity to participate in plant breeding using modern gene technology. The conflict between science-based, Federal regulation of genetically manipulated plants administered by the Office of the Gene Technology Regulator, and state government bans on growing such products, has made Australia an unattractive location for the major multi-national gene science companies to conduct research. Introduction of proprietary gene science products into Australia also requires commercial relationships in the form of technology licensing, joint ventures, or partnerships with local businesses that provide additional research and development of local products. To participate in these relationships, businesses need to have access to adequate capital, facilities and skills and an appetite for the risks associated with the research and the products produced.
Case study — tea tree oil Tea tree oil is a separate program in RIRDC’s New Rural Industries portfolio. Tea tree is native to northern coastal New South Wales and is also grown commercially in the Atherton Tablelands region of Queensland. Many coastal regions of northern Australia have the potential to grow this tree. Australia is the dominant producer of tea tree oil in the world, although production in China and Zimbabwe is increasing (Foster and Bird 2009).
The gross value of production of tea tree oil in Australia increased from $5m in 2002–03 to $12.6 million in 2006–07 (Foster 2009); RIRDC currently estimates it to be about $18 million. This represents an annual average growth rate of about 24 per cent. The oil is currently used predominantly in cosmetics, pharmaceuticals, toiletries, household products and industrial products (solvents and disinfectants). The oil has significant potential use in the health sector and this is the focus of much of the research on tea tree oil.
Recent research funded by RIRDC has highlighted the role tea tree oil may play in treating people with skin cancer. The research showed that a tea tree oil formulation significantly inhibited the growth of cancerous tumours in mice. The next step is to research how tea tree oil could be used to treat cancers in humans.
Other RIRDC research has indicated that tea tree oil is effective at treating conditions including cold sores, skin inflammation from irritant histamines, radiation skin reactions and fungal infections. Cold sores affect 20-40 per cent of the population but there is no cure for the condition. The anti-viral activity of tea tree oil is effective against the herpes simplex virus that causes cold sores (RIRDC and ATTIA 2007). Tea tree oil has also been found to provide relief from radiation skin reactions in cancer patients. These reactions occur in 95 per cent of patients undergoing radiation treatment for cancer. The treatment with tea tree oil gave better results than pawpaw ointment, a common treatment for radiation related skin irritations (RIRDC and ATTIA 2007). Tea tree oil can also be effective in eradicating golden staph in hospitals, as a treatment for acne, and as a hand wash (RIRDC and ATTIA 2007).
RIRDC’s current research plan aims to enhance production systems; address barriers to the use of tea tree oil, including safety standards; demonstrate new applications for the oil, especially in the health sector; and communicate the advantages of using tea tree oil. The results of previous research have been positive: for example, the breeding program led to a 90 per cent yield improvement, contributed considerably to reducing the cost of production, and enabled the industry to compete with overseas low-cost, low-quality competition (RIRDC 2006).
CRRDC submission to the PC Inquiry into the R&D corporations model, June 2010 Page 37
3.8.1 Private investment in rural R&D in Australia
With support of the CRRDC, the Australian Farm Institute is undertaking a project to examine levels of private sector investment in rural R&D in Australia, and the factors that private sector investors consider significant in making investment decisions. A particular focus will be on the interaction between the public and the private sectors. The project aims to provide both qualitative and quantitative information on private sector investment, and to consider the potential impacts of changes in the rate of investment in public sector rural R&D.
The objective of the project is to develop a robust understanding of the level and nature of private sector investment in rural research and development in Australia, and to identify important factors that may result in changes in private sector investment rates.
The final report will not be publicly available until August 2010; therefore, only preliminary findings have been included in this submission.
Project background It is claimed that there has been a significant increase in private sector investment in rural R&D in some nations — most notably in the USA — over recent decades. The argument is that net total rural R&D investment has not been reduced, but has simply transferred from public investment to private investment, and that this is evidence that continued high levels of public R&D investment may in fact crowd out private investment.
An alternative view is that private sector investment feeds off, and is very much complementary to, public sector investment, and that it is very narrowly focused and therefore does not drive sector productivity growth.
Discussion of this issue as it relates to Australia is constrained by limited publicly available data on current private investment in rural R&D, on trends in private rural R&D investment over recent years, and on factors contributing to decisions about private sector rural R&D investment. Also unclear is the extent to which the scale of Australia’s rural sector and Australia’s somewhat unique production systems and international market exposure modify the propensity of private sector interests to invest in rural R&D.
Of particular importance is whether the volume and nature of public-benefit spill-overs arising from these investments is different from those arising from public-sector rural RD&E investment, and the implications for the broader economy of a greater reliance on private sector investment. This project provides an important opportunity to gain more information about the interrelationship between public and private sector investment in rural R&D.
Project outline The project involves the collation of available data and information about private sector rural R&D investment, a national survey of private sector organisations potentially involved in rural R&D, analysis and reporting of the information arising from that survey, and some analysis of the future implications of changes in the level of public and private sector investment rates.
The survey population includes all private sector organisations investing in rural R&D in Australia, including Australian-based and international companies with a presence in Australia, and international companies that contract research in Australia but do not have a presence here.
A copy of the survey outline and the survey questionnaire are at appendix 2.
CRRDC submission to the PC Inquiry into the R&D corporations model, June 2010 Page 38
Preliminary findings
Survey responses indicated that due to the export dependence of most Australian rural commodity sub-sectors, Australia cannot be considered as a market for new technologies or chemicals in its own right. For example, one company estimated that the cost to register a new chemical in the major global market is between $US100 million and $US150 million. This means that private sector R&D investors in Australia are very unlikely to attempt to research a new chemical and this is more likely to be done by major companies at an international level. Investments of this scale require the capital resources of a large corporation and ability to enter and sell into all international markets. The role of an Australian subsidiary or partner in this instance is to undertake the compliance and development testing required here, and to market the product. Their role is to develop a market for new products rather than to develop new products.
Other than the leading farm commodities — wheat, barley, beef sheep and sugar, small market size is a significant constraint on private-sector investment in R&D. Without RDC support, even the costs of registering chemicals for continued use can be too high for product owners to consider.
The survey results did not identify any organisations that see the RDCs as competitors. Most appear to see RDCs as providers of useful research outcomes.
The results also indicate that the private businesses that undertake R&D have no interest in most broad research areas. If the research results cannot be protected as intellectual property, then the research is of little to no interest to them.
Over all, it would seem that private investment in rural R&D is patchy, even within sub-sectors, where it might be thought that broadly similar approaches might apply. There does, however, appear to be much interaction between the private and the public sectors, with an exception applying in relation to marketers of generic chemical products.
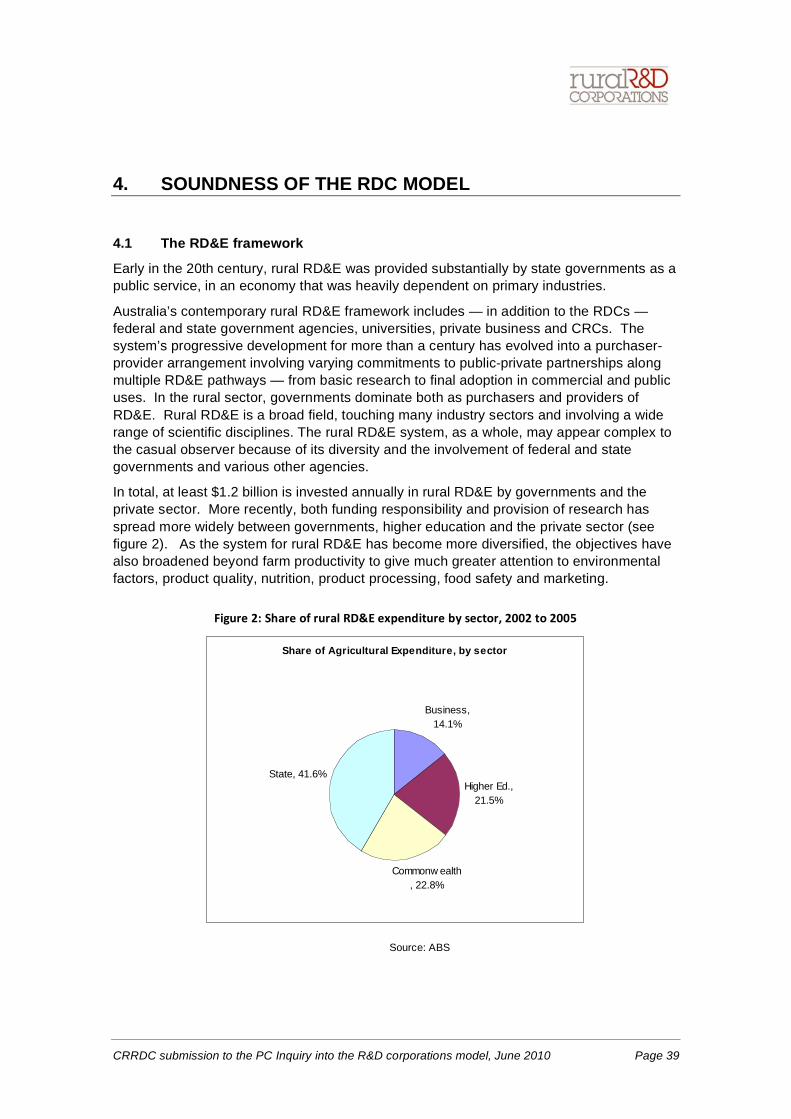
CRRDC submission to the PC Inquiry into the R&D corporations model, June 2010 Page 39
4. SOUNDNESS OF THE RDC MODEL
4.1 The RD&E framework
Early in the 20th century, rural RD&E was provided substantially by state governments as a public service, in an economy that was heavily dependent on primary industries.
Australia’s contemporary rural RD&E framework includes — in addition to the RDCs — federal and state government agencies, universities, private business and CRCs. The system’s progressive development for more than a century has evolved into a purchaser-provider arrangement involving varying commitments to public-private partnerships along multiple RD&E pathways — from basic research to final adoption in commercial and public uses. In the rural sector, governments dominate both as purchasers and providers of RD&E. Rural RD&E is a broad field, touching many industry sectors and involving a wide range of scientific disciplines. The rural RD&E system, as a whole, may appear complex to the casual observer because of its diversity and the involvement of federal and state governments and various other agencies.
In total, at least $1.2 billion is invested annually in rural RD&E by governments and the private sector. More recently, both funding responsibility and provision of research has spread more widely between governments, higher education and the private sector (see figure 2). As the system for rural RD&E has become more diversified, the objectives have also broadened beyond farm productivity to give much greater attention to environmental factors, product quality, nutrition, product processing, food safety and marketing.
Share of Agricultural Expenditure, by sector
Business, 14.1%
Higher Ed., 21.5%
Commonw ealth, 22.8%
State, 41.6%
Source: ABS
CRRDC submission to the PC Inquiry into the R&D corporations model, June 2010 Page 40
From a policy perspective, it is useful to consider participants in the system as providers and originators:
• research providers — who own facilities and employ people and undertake research (including Departments of Primary Industries (DPIs), universities, CSIRO, private companies)
• originators / funders — who commission research and financially support research projects.
Within the rural RD&E system, governments are the dominant purchasers and providers of RD&E, predominantly in response to the multiple sources of market failure discussed in the previous section. Almost all providers also originate research within their own facilities; in general, internally originated research is the largest component by value of the research undertaken.
Research tasks fall across a continuum from basic to applied in type. Universities and CSIRO generally have a stronger orientation toward more basic research; some state DPIs have, more recently, shifted their focus to include a greater involvement in higher-level strategic research.
Research outcomes can be considered in terms of regional, commodity, and resource security impacts. Research benefits from individual projects typically spread across all of these dimensions to a greater or lesser degree, in proportions that are difficult to foresee, manipulate or measure.
Research provider’s capabilities and their research programs are dispersed across a landscape of scientific disciplines, research types and outcomes. Each has a range of scientific specialities and varying involvement in basic or applied research, with varying focus on regional, commodity and resource security outcomes that depends on their individual objectives, funding sources and skills of staff.
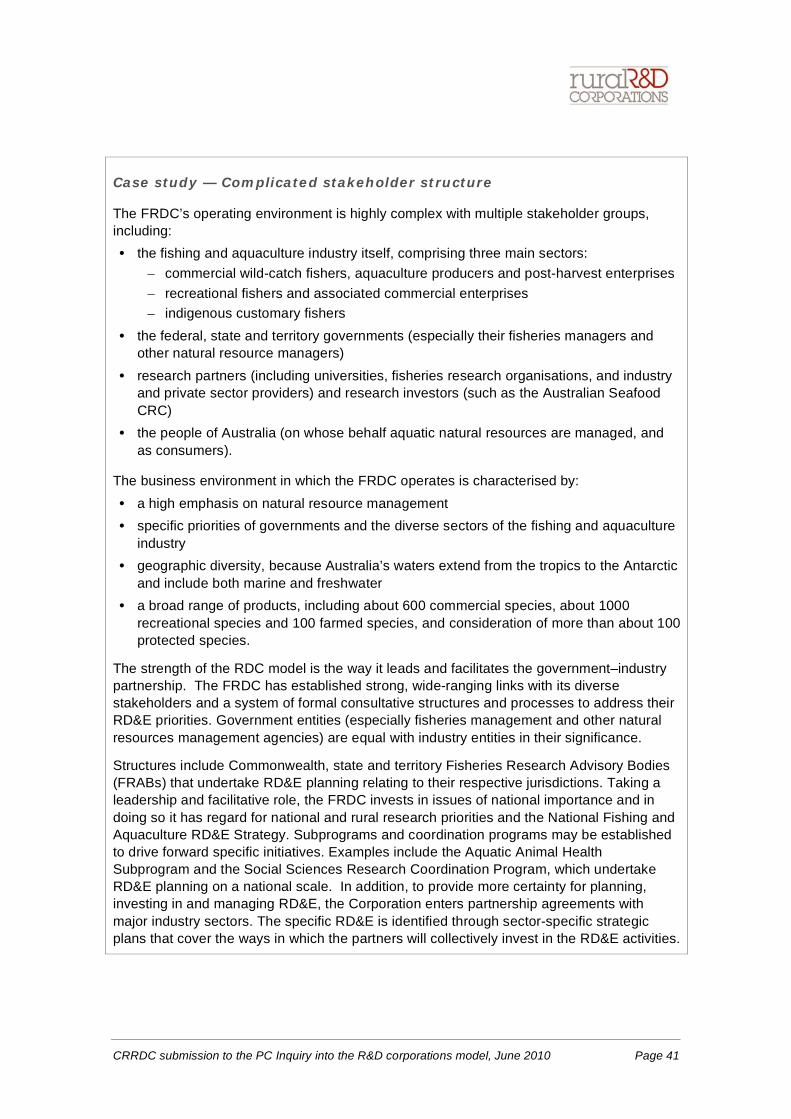
CRRDC submission to the PC Inquiry into the R&D corporations model, June 2010 Page 41
Case study — Complicated stakeholder structure
The FRDC’s operating environment is highly complex with multiple stakeholder groups, including: • the fishing and aquaculture industry itself, comprising three main sectors:
– commercial wild-catch fishers, aquaculture producers and post-harvest enterprises – recreational fishers and associated commercial enterprises – indigenous customary fishers
• the federal, state and territory governments (especially their fisheries managers and other natural resource managers)
• research partners (including universities, fisheries research organisations, and industry and private sector providers) and research investors (such as the Australian Seafood CRC)
• the people of Australia (on whose behalf aquatic natural resources are managed, and as consumers).
The business environment in which the FRDC operates is characterised by: • a high emphasis on natural resource management • specific priorities of governments and the diverse sectors of the fishing and aquaculture
industry • geographic diversity, because Australia’s waters extend from the tropics to the Antarctic
and include both marine and freshwater • a broad range of products, including about 600 commercial species, about 1000
recreational species and 100 farmed species, and consideration of more than about 100 protected species.
The strength of the RDC model is the way it leads and facilitates the government–industry partnership. The FRDC has established strong, wide-ranging links with its diverse stakeholders and a system of formal consultative structures and processes to address their RD&E priorities. Government entities (especially fisheries management and other natural resources management agencies) are equal with industry entities in their significance.
Structures include Commonwealth, state and territory Fisheries Research Advisory Bodies (FRABs) that undertake RD&E planning relating to their respective jurisdictions. Taking a leadership and facilitative role, the FRDC invests in issues of national importance and in doing so it has regard for national and rural research priorities and the National Fishing and Aquaculture RD&E Strategy. Subprograms and coordination programs may be established to drive forward specific initiatives. Examples include the Aquatic Animal Health Subprogram and the Social Sciences Research Coordination Program, which undertake RD&E planning on a national scale. In addition, to provide more certainty for planning, investing in and managing RD&E, the Corporation enters partnership agreements with major industry sectors. The specific RD&E is identified through sector-specific strategic plans that cover the ways in which the partners will collectively invest in the RD&E activities.
CRRDC submission to the PC Inquiry into the R&D corporations model, June 2010 Page 42
4.2 Effectiveness of the rural RD&E framework
It is difficult to assess the overall effectiveness of the rural RD&E system without first establishing clearly understood and accepted criteria by which to judge ‘effectiveness’. In part, because of the widely shared responsibility for rural RD&E, there have been no clear national, objective measures of the effectiveness of the RD&E effort. Productivity improvement is an obvious and integral part of the objective. Resource sustainability is a closely related objective and, increasingly, other environmental and consumer issues are being included.
The PIERD Act which established the RDCs includes the following objects:
(a) increasing the economic, environmental and social benefits to members of primary industries and to the community in general by improving the production, processing, storage, transport or marketing of the products of primary industries;
(b) achieving the sustainable use and sustainable management of natural resources; and
(c) making more effective use of the resources and skills of the community in general and the scientific community …
CSIRO lists the objective for its farming and food research program as:
… improving Australia’s food production and farming systems to ensure food and fibre are delivered to Australians on a sustainable basis.
Assessing performance against these divergent objectives is complicated by definitional and measurement problems. Even assessing performance against the primary objective of improving productivity is not straightforward. Intuitively, international comparisons of returns to rural RD&E might seem an attractive means of gauging the effectiveness of the RD&E framework. But the difficulties in obtaining comparable data between countries and differences in methodology mean that published estimates of returns by different authors, from different countries, are at best a general guide rather than a definitive measure.
It is apparent that for most of the last 3–4 decades, productivity growth in Australian primary industries has been quite high, but is also highly variable and sensitive to seasonal conditions. ABARE (2010) reported in March 2010 that its measure of total factor productivity grew at 2% a year between 1977–08 and 2000–01, but since 2000–01 growth has averaged minus 1% a year. Detailed econometric analysis by Sheng, Mullen and Zhao (2010) has found that the slow-down in productivity growth probably commenced much earlier than this — about 1994 — but has been accentuated by adverse weather in the last decade.
The long-term slow-down in funding for rural RD&E is the other major contributor to declining productivity growth in the rural sector. Mullen (2007) analysed the available data on rural RD&E expenditures, converting past expenditure to 2004 values. These results showed that strong real growth had occurred from 1953 until the mid-1970s. Since then, there had been little real growth in public rural RD&E expenditure. Given the lags of more than 35 years in realising the benefits of research expenditure, it is likely that this slow-down in spending is now affecting productivity growth and will continue to do so for decades to come.
Measurement of the quality and effectiveness of the rural RD&E system in delivering other objectives such as sustainable resource use and making more effective use of community skills is even more complex.
CRRDC submission to the PC Inquiry into the R&D corporations model, June 2010 Page 43
Although the structure of the rural RD&E system will undoubtedly influence effectiveness in delivering returns for the community as a whole, it is clear that funding is the overwhelming determinant of the benefits received. A substantial increase in the benefits from rural RD&E will only be achieved through real increases in investment.
4.3 The role of the RDCs within the broader framework
The RDCs are a central component of the rural RD&E system. With annual research expenditure of about $500 million per annum of the total investment in rural RD&E of at least $1.2 billion, the RDCs have substantial influence on the direction of the research effort.
The single most important attribute that differentiates the RDCs from other rural RD&E originators is their close links to industry and the science community. The mix of
experience from producers, scientists, processors and marketers and the wider community give the boards of the RDCs a wider perspective on the development needs for their commodity supply chains than can be seen in other RD&E organisations. The various consultative processes between producers, processors and the RDCs ensure that there is continuous input into research planning and priority setting for the industries. The linkages generate a level of trust and participation that produces benefits that flow in both directions — they are crucial in maintaining the relevance and immediacy of the research priorities and are integral in generating interest in, and rapid adoption of, the research outputs. None of the
other originators or providers working within the rural RD&E system has such deep connections to rural industry and the supply chains they service.
RDCs are in a special position within the RD&E system, because unlike all other originators and providers they are independent of research facilities and research scientists. This allows RDCs a far greater flexibility than other originators, since they do not face conflicts of interest in their choice of research provider. The originators who are also providers constantly face pressure to pursue research suited to the facilities they control and the skills and preferences of their staff. RDCs, however, have the freedom to find the most suitable facilities and researchers with the most relevant skills and experience. This is a crucial flexibility that the RDCs share with some key research bodies in Australia such as the Australian Research Council (ARC) and National Health and Medical Research Council (NHMRC).
The structure of the RDCs also makes them much more of an integral stakeholder in the RD&E process than many other RD&E organisations. Their responsibility for investment of industry funds, their links to industry and their responsibility for adoption of research outcomes leads the RDCs to be more closely involved in management of RD&E and its outcomes than other research providers, such as ARC, NHMRC or CSIRO.
The independence of the RDCs also equips them to be an important contributor to change. Their understanding of the research needs of their industry and close association with the research community gives them a unique strategic perspective from which to drive change in research directions and organisation. The RDCs are well placed to coordinate research in many aspects of their portfolios, to minimise overlap and to avoid gaps in the overall effort. This capacity to drive change also arises from their freedom to engage
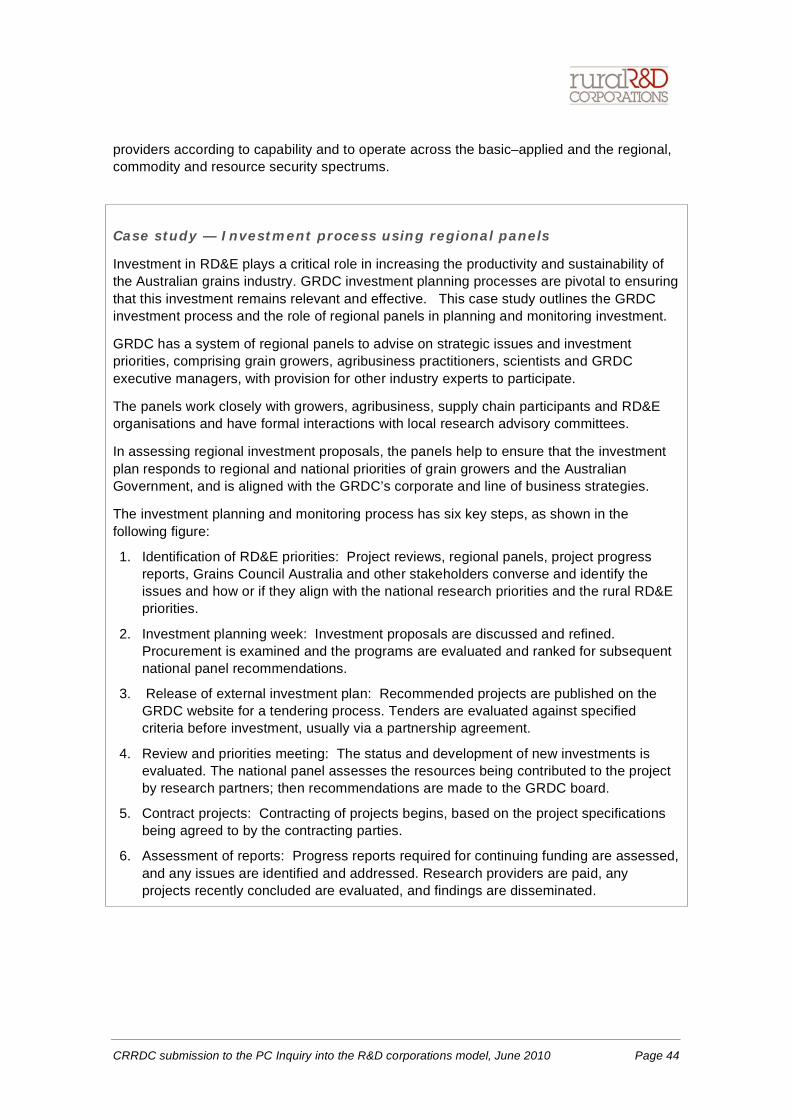
CRRDC submission to the PC Inquiry into the R&D corporations model, June 2010 Page 44
providers according to capability and to operate across the basic–applied and the regional, commodity and resource security spectrums.
Case study — Investment process using regional panels
Investment in RD&E plays a critical role in increasing the productivity and sustainability of the Australian grains industry. GRDC investment planning processes are pivotal to ensuring that this investment remains relevant and effective. This case study outlines the GRDC investment process and the role of regional panels in planning and monitoring investment.
GRDC has a system of regional panels to advise on strategic issues and investment priorities, comprising grain growers, agribusiness practitioners, scientists and GRDC executive managers, with provision for other industry experts to participate.
The panels work closely with growers, agribusiness, supply chain participants and RD&E organisations and have formal interactions with local research advisory committees.
In assessing regional investment proposals, the panels help to ensure that the investment plan responds to regional and national priorities of grain growers and the Australian Government, and is aligned with the GRDC’s corporate and line of business strategies.
The investment planning and monitoring process has six key steps, as shown in the following figure:
1. Identification of RD&E priorities: Project reviews, regional panels, project progress reports, Grains Council Australia and other stakeholders converse and identify the issues and how or if they align with the national research priorities and the rural RD&E priorities.
2. Investment planning week: Investment proposals are discussed and refined. Procurement is examined and the programs are evaluated and ranked for subsequent national panel recommendations.
3. Release of external investment plan: Recommended projects are published on the GRDC website for a tendering process. Tenders are evaluated against specified criteria before investment, usually via a partnership agreement.
4. Review and priorities meeting: The status and development of new investments is evaluated. The national panel assesses the resources being contributed to the project by research partners; then recommendations are made to the GRDC board.
5. Contract projects: Contracting of projects begins, based on the project specifications being agreed to by the contracting parties.
6. Assessment of reports: Progress reports required for continuing funding are assessed, and any issues are identified and addressed. Research providers are paid, any projects recently concluded are evaluated, and findings are disseminated.
CRRDC submission to the PC Inquiry into the R&D corporations model, June 2010 Page 45
4.4 Strategic assessment
The rural RD&E system is spread across federal and state governments and, within governments, across a number of departments and agencies. As a result, strategic assessment is a shared responsibility. Governments, as the major contributors to the cost of rural RD&E and as representatives of the community’s interests, have the primary responsibility for strategic assessment of RD&E effort across all agencies and fields. Governments also have the necessary powers to make this assessment and to implement change in the community’s interests. It is the Government’s responsibility to articulate a clear vision of the policy framework within which rural industries operate and rural RD&E is a key component of that framework.
Strategic assessment of rural RD&E is currently being driven through a number of related initiatives. The Primary Industries Ministerial Council and the Primary Industries Standing Committee (PISC) R&D Subcommittee have developed a National Primary Industries RD&E Framework that aims to increase coordination among the different stakeholders to better harmonise their roles in RD&E related to primary industries. Consequently, the extent to which it will shape the strategic environment for rural RD&E is yet to be established.
CRRDC submission to the PC Inquiry into the R&D corporations model, June 2010 Page 46
The Rural Research and Development Council, the advisory body to the Minister on rural RD&E, is in the process of developing a national strategic rural RD&E investment plan based on an agreed list of national priorities for profitable, globally competitive, sustainable, innovative and adaptable primary industries. Since this plan is also in the development phase, its contribution to the strategic assessment of rural RD&E is not yet clear.
The Minister for Agriculture, Fisheries and Forestry has also promulgated Rural Research and Development Priorities for rural R&D. The RDCs report not only against these priorities, but also against the National Research Priorities and the priorities of industry and state governments as they arise. A clear articulation of expectations and measurable returns would be an important step in identifying the outcomes the Australian Government is seeking from its investment in rural RD&E.
In relation to the RDCs, the Government has substantial means to control the strategic direction of rural RD&E. Ministerial approval is required for the RDC’s five-year strategic plans and annual operating plans. The Government also holds power over research performance through funding agreements with each IOC.
The CRRDC is taking a leadership role in the strategic assessment of collaborative opportunities and plays an active part in stimulating the sharing of information.
The RDCs collectively and through the CRRDC, are progressing opportunities to engage across government and with other key stakeholders, to be involved in the strategic assessment and development of the broader RD&E system. These initiatives and actions by RDCs and by the CRRDC are being pursued in response to the RDC’s needs and a common desire to improve the efficiency of their businesses.
4.5 Soundness of the RDC model
Based on its core attributes, the RDC model is considered to be sound and effective in directing RD&E to deliver productivity gains in the rural sector, especially because:
• it has stronger links to producers and processors than other participants in the National Primary Industries RD&E Framework, and it involves the science community in assessment and determination of research priorities
• it is supported by a larger share of industry funds than other originators of research
• it has more flexibility to source appropriate skills and resources
• it can both respond to research initiatives from the science community, and commission research on its own initiative.
The RDCs have a clear but broadly defined objective to improve the production, processing, storage, transport or marketing of the products of rural industries, improve sustainability of the sector’s natural resources and to make more effective use of the community’s scientific skills. The RDCs have demonstrably responded directly to these objectives and to emerging community needs that cut across these objectives. The RDCs have made effective use of scientific skills and resources, and have maintained a high standard of accountability for their use of public and private funds.
The RDCs have adapted well to changing RD&E needs and the requirements of governments. It has been noted that the RDCs face increasing demands to address environmental, climate change and human nutrition issues that have a lesser direct impact on farm productivity. These issues are closely associated with rural production and RDCs are well equipped to address the resulting contemporary research needs. However, to the
CRRDC submission to the PC Inquiry into the R&D corporations model, June 2010 Page 47
extent that this implies a reduced emphasis in productivity-oriented research, the community will face the costs of slowing productivity in the rural sector if funding increases do not mirror the wider field of objectives that the RDCs are expected to address.
A growing threat to the ability of RDCs to continue to deliver high productivity gains and sustainable resource use in the rural sector is the availability of skilled, specialised science staff. A lack of available skills impinges on research functions in some fields. This is not a concern that rural RD&E faces alone — many commentators have pointed to the declining numbers of graduates across almost all science disciplines. While community perceptions of science and scientific development play a role in this situation, so too must issues such as salary expectations, job security and career paths of people
in science occupations. The RDCs are at the forefront of promoting the technical advancement of rural industries and opportunities for scientists to work at the forefront of technology, but are less well placed than research providers, and ultimately governments, to influence employment conditions and career prospects for scientists. The RDCs have responded directly to many skill gaps that affect their research programs by, for example, funding postgraduate work to develop specific skills, and funding study leave, conference attendance and other skill development programs.
CRRDC submission to the PC Inquiry into the R&D corporations model, June 2010 Page 48
5. FUNDING LEVEL ISSUES
In economic terms, the optimum rate of investment in RD&E will be at the point at which marginal net returns from additional investment are zero. The high cost–benefit returns from rural RD&E are a clear indicator that there is substantial under-investment and that rural RD&E investment in Australia should be significantly increased.
When capital resources, whether public or private, are scarce, determining the optimum level of investment in rural RD&E becomes a strategic consideration with long-term national implications. Expenditure on RD&E is a long-term investment and cannot be treated as a current cost of production for producers, nor viewed by governments through the narrow perspective of the near-term budget balance. Like any investment, rural RD&E involves forgoing current consumption in return for the expectation of greater benefits for the community as a whole in the future. The rate of investment in RD&E should be determined by consideration of the rural productivity, resource sustainability, and wider community benefits that Australia desires to receive in the future. In this context, a determination of the optimum rate of investment cannot be derived solely by arithmetic analysis aimed at a narrow interpretation of inter-sectoral equity or from comparison with decisions on rural RD&E by other nations.
There are pressing, important strategic reasons why Australia should increase the rate of investment in rural RD&E.
Globally, population is increasing at about 2.3 million people per week, with potential to double by 2050. This implies a need to at least double the world’s food output in that time, in addition to addressing the needs of nearly 700 million people estimated to be currently suffering hunger and malnutrition. Rich nations, and those with substantial endowments of land, have a humanitarian responsibility to contribute to the challenge of feeding and clothing this rising population by contributing to the stock of knowledge about improving rural productivity and by maximising their contribution to global production and international trade in food products. Australia, with about 9% of the world’s agricultural land, has a significant role and responsibility in supplying the world’s future food production
requirements.
In addition to its large endowment of agricultural land, Australia has a policy environment that facilitates adjustment and growth, and a skilled and innovative production management culture. Together, these qualities give the nation a comparative advantage in rural production and trade in rural products. In addition, proximity to Asia — which has 50% of the world’s population and rapidly rising GDP per capita — offers substantial opportunities for the next 3-4 decades for increased exports of food and rural products. Australia has a reputation for delivering high-quality, clean rural commodities to its global customers and the sector continues to be a major export earner. For a country with persistent balance-of-payments and balance-of-trade problems, there is a strong strategic imperative to continue to invest in the comparative advantage of its rural sector to maximise its production potential and export income.
Australia is a highly urbanised country. Its major cities are already experiencing problems in providing infrastructure to absorb growing populations. By comparison rural regions are
CRRDC submission to the PC Inquiry into the R&D corporations model, June 2010 Page 49
experiencing population decline. Econtech (2005) found that the economies of rural regions are highly oriented toward the farm sector and related farm input and output dependent industries. These industries comprise, on average, 17% of regional economies and 24.2% of regional employment. Failure to maintain growth in rural industry productivity will lead to falling rural incomes and worsen the decline in regional economies, with a consequent acceleration of loss of population to the capital cities. An accelerated flow of population from rural regions to capital cities will contribute to urban crowding and associated infrastructure pressures and costs.
At a national level, the Econtech analysis found that in 1998–99 the farm-dependent economy, including both input and output related sectors, comprised 12.1% of GDP and 17.2% of national employment. Of this total, 8% of GDP and 12.1% of employment was in output related industries. The food manufacturing sector is the largest component of manufacturing, comprising about 25% of total manufacturing output. Failure to maintain an efficient raw material supply to these sectors will directly affect efficiency and productivity in food and fibre processing industries. Over all, a decline in productivity growth and profitability in the rural sector would have profound effects on the sectors that rely on its demand, or on processing and trading its products, and create significant adjustments pressures and costs.
Australia, with the rest of the world, is facing a set of challenges that may require a paradigm shift in the approach to producing food and fibre products. Rural output could be curtailed and production systems could require large-scale revision as a result of climate change, declining availability and rising prices for petroleum products, demands for greenhouse-gas abatement and rising fertiliser prices. With the possibility of such dramatic impacts on production, it would be prudent to consider the challenges in advance of their actual impact and to investigate options for responding to their likely effects. These challenges have community-wide impacts and warrant a broadly based contribution to the research effort through RDCs and other research organisations, to develop community-wide preparedness. Addressing these new challenges as a defensive strategy requires specific additional funding support from Government. This research should not be pursued by diverting funds from the on-going research programs of the RDCs to improve productivity gains and sustainable resource use in the rural sector.
ABARE, Mullen and others have reported a slowing in productivity growth in the rural sector in recent years. Although this trend is partly driven by historically low rainfalls across many rural areas, the recent findings of Sheng et al (2010) indicate that, in addition to the rainfall effect, underlying productivity growth has substantially slowed due to stalling real investment in rural RD&E. In part, the rural sector has been shielded from the effects of this fall in productivity growth by an easing in the long-term decline in terms of trade.
Terms of trade for primary industries have declined on average by 1.6% per year during the past four decades, although during the past two decades the rate of decline has stabilised, or has been well below 1% per annum, due to substantially higher world commodity prices. However, with rising global energy and fertiliser prices, rising currency value and softer domestic commodity prices, there may well be a return to more challenging terms of trade conditions for rural industries in coming decades.
There is every indication that the rural sector needs to lift productivity growth to get back to its long-term trend rate of improvement. More than this: to meet the challenges of climate change, reduced water
CRRDC submission to the PC Inquiry into the R&D corporations model, June 2010 Page 50
availability and declining terms of trade, productivity growth in excess of the long-term trend will be required if a fall in competitiveness and profitability is to be avoided. A step-up in future productivity growth can only be achieved through a substantial investment in rural RD&E.
5.1 The public/private funding balance
Rural industries are each a closely integrated system spanning land, water, environment, commodity production and the supply chain through which the products pass. Change and development in any one aspect of the system cannot be made in isolation from the other elements of the system. Rural RD&E programs mirror this integration, addressing the supply chain and the production environment as a single, functional system, committing research funds and resources where they will result in the greatest industry benefits. The benefits that flow from the research to non-producers and the wider public are inseparable from the producer benefits. Conversely, it is impossible to design and direct research that produces benefits to only one or another of these beneficiaries.
Changes in rural production methods that may affect biodiversity and the surrounding environment, also influence product quality and processing attributes. Conversely, changes to manufacturing methods or consumer preferences are transmitted back through the supply chain to alter production methods. In a closely integrated supply chain, the RD&E effort must similarly be closely integrated.
Changes that lead to a fragmentation of the research effort would adversely affect the efficiency of the research and the quality of the results. The broad focus of the RDCs on a whole-of-chain, ‘paddock to plate’ responsibility is a crucial factor in their success in focusing research on the factors most limiting productivity and improvement in resource use. By design, RDCs are ideally suited to addressing these productivity constraints, whether they are inside the farm gate and directly related to production; environment related; or related to consumer preferences. This whole-of-chain responsibility is a fundamental design feature of the RDC system and a key reason for government providing matching funding for the producer levies.
The matching funds provide the RDCs with the flexibility to pursue research at all points in the supply chain. Changes that might remove government funds and leave the RDCs more heavily dependent on levy funds would lead to a fragmentation of the research effort and increased pressure to limit RD&E to areas that appeared to be overly oriented toward on-farm productivity.
Just as the public and private benefits cannot be delivered separately by the research, so the funding for delivering public and private benefits along a supply chain should also not be separated.
5.2 Matching funding to benefits
In analysing the funding mix for rural RD&E, the notion of matching the balance between public and private funding of rural RD&E with the balance of public and private benefits is a less than helpful practical objective. Research is by nature speculative and the mix of public and private benefits can only be estimated imperfectly when research is being designed — and even after the research has been completed. The impacts of adoption by industry are complex and with development and adoption lags of between 35 and 50 years
CRRDC submission to the PC Inquiry into the R&D corporations model, June 2010 Page 51
associated with rural RD&E outcomes, accounting for the distribution of benefits is further complicated. The timing and impacts of spill-over effects in other sectors are also by their nature unknown, unpredictable and difficult to value.
Furthermore, many environmental, biodiversity, food safety and food security benefits cannot be measured quantitatively, or if quantifiable cannot be readily valued in economic terms.
As a result, the task of finding equity between the share of costs and the share of benefits degenerates into a multiplicity of imprecise and uncertain estimation techniques for a mix of qualitative and quantitative benefits against which to attempt to apportion costs. If assessed in terms of real improvements in the efficient allocation of resources, an imprecise and poorly founded estimate could not be relied on to deliver a more reliable result than the current equal sharing of costs.
Rebalancing the government’s investment across the RDCs would also not produce a more equitable outcome or improve the incentives that drive RDC’s allocation of funds. As production systems are developed around each commodity, producers will most readily take up RD&E that is focused on the commodity production systems. It is preferable for levies to be raised from commodities and for RD&E to be pursued along commodity lines.
Dissociating the rate of spending from the scale of production of each commodity is unlikely to lead to greater productivity from the research, either in terms of productivity returns for producers, or social gains for the rest of the community.
CRRDC submission to the PC Inquiry into the R&D corporations model, June 2010 Page 52
6. IMPROVING THE RDC MODEL This section addresses issues of governance, operating efficiency, collaboration, evaluation and RD&E adoption across the RDC network. Comments are made principally on the role of the CRRDC in coordination of these issues for the RDCs.
The CRRDC is seeking opportunities to develop further collaborative initiatives across the RDCs, recognising that collaboration in itself does not always bring net benefits. The RDCs will focus on collaborative initiatives that have a sound business case and will provide efficient and effective outcomes for industry and government.
The CRRDC has established a dedicated, full-time Secretariat and appointed an independent Chair to focus on the strategic direction for the RDCs. The CRRDC has also established a charter setting out the principles that govern management of its affairs and discharge its responsibilities. Under the charter, the role of the CRRDC is to advance rural RD&E, principally through the RDCs. It does this by providing strategic leadership for collaborative, effective and efficient investment in rural RD&E and provision of a national, coordinated voice on matters affecting the RDCs.
The CRRDC charter includes the following principles in executing its strategic direction and operations: • lead with vision and commitment to achieve its strategic objectives • seek to identify emerging issues and changes in the operating environment • ensure its processes are open and accountable to its members • act collegiately in responding to stakeholders • foster collaboration amongst members • be professional in all its activities to ensure the credibility of its outputs • be responsive and operate in an efficient manner.
6.1 Improving governance Each RDC has a board responsible for internal governance. The industry-owned companies (IOCs) are also subject to the requirements of the Corporations Act. RDC boards have, as required, established internal structures and procedures to ensure that good standards of control and management are maintained.
RDCs are also subject to the requirements of the PIERD Act, under which strategic plans and annual operating plans are subject to ministerial approval. The Minister is also empowered to give directions to the RDCs on the performance of their functions and exercise of their responsibilities. The CRRDC understands that the Department of Agriculture, Fisheries and Forestry (DAFF) is also considering the use of Ministers’ directions under the Act, and possible amendments to the PIERD Act, with the objective of enhancing governance processes.
The IOCs are subject to governance processes and requirements similar to those of the statutory RDCs. An additional level of governance is exercised by the Government through the renegotiation of each IOC’s Statutory Funding Agreement (SFA). The SFAs are effectively the ‘contract’ between the RDCs and the Government that provide the funds to match industry levy contributions and set the terms and conditions with which the IOCs must comply in order to receive Government funds. DAFF is enhancing the governance of the IOCs through these SFAs as each enters its renegotiation process.
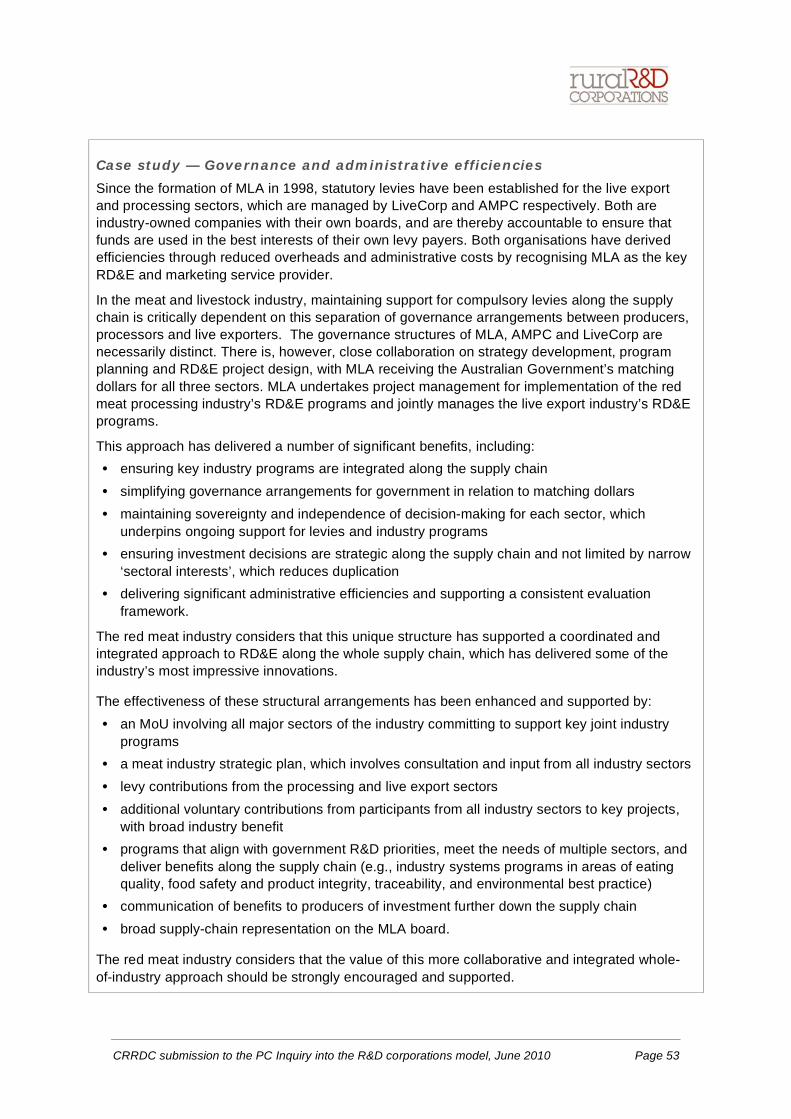
CRRDC submission to the PC Inquiry into the R&D corporations model, June 2010 Page 53
Case study — Governance and administrative efficiencies
Since the formation of MLA in 1998, statutory levies have been established for the live export and processing sectors, which are managed by LiveCorp and AMPC respectively. Both are industry-owned companies with their own boards, and are thereby accountable to ensure that funds are used in the best interests of their own levy payers. Both organisations have derived efficiencies through reduced overheads and administrative costs by recognising MLA as the key RD&E and marketing service provider.
In the meat and livestock industry, maintaining support for compulsory levies along the supply chain is critically dependent on this separation of governance arrangements between producers, processors and live exporters. The governance structures of MLA, AMPC and LiveCorp are necessarily distinct. There is, however, close collaboration on strategy development, program planning and RD&E project design, with MLA receiving the Australian Government’s matching dollars for all three sectors. MLA undertakes project management for implementation of the red meat processing industry’s RD&E programs and jointly manages the live export industry’s RD&E programs.
This approach has delivered a number of significant benefits, including: • ensuring key industry programs are integrated along the supply chain • simplifying governance arrangements for government in relation to matching dollars • maintaining sovereignty and independence of decision-making for each sector, which
underpins ongoing support for levies and industry programs • ensuring investment decisions are strategic along the supply chain and not limited by narrow
‘sectoral interests’, which reduces duplication • delivering significant administrative efficiencies and supporting a consistent evaluation
framework.
The red meat industry considers that this unique structure has supported a coordinated and integrated approach to RD&E along the whole supply chain, which has delivered some of the industry’s most impressive innovations.
The effectiveness of these structural arrangements has been enhanced and supported by: • an MoU involving all major sectors of the industry committing to support key joint industry
programs • a meat industry strategic plan, which involves consultation and input from all industry sectors • levy contributions from the processing and live export sectors • additional voluntary contributions from participants from all industry sectors to key projects,
with broad industry benefit • programs that align with government R&D priorities, meet the needs of multiple sectors, and
deliver benefits along the supply chain (e.g., industry systems programs in areas of eating quality, food safety and product integrity, traceability, and environmental best practice)
• communication of benefits to producers of investment further down the supply chain • broad supply-chain representation on the MLA board.
The red meat industry considers that the value of this more collaborative and integrated whole-of-industry approach should be strongly encouraged and supported.
CRRDC submission to the PC Inquiry into the R&D corporations model, June 2010 Page 54
6.2 Increasing administrative efficiency
The CRRDC and RDCs have taken a number of steps to increase administrative efficiency and harmonise administrative services. In mid-2009, the CRRDC commissioned Ernst Young to undertake a review of the potential for harmonisation of management processes across the RDCs. This review provided information on the potential to standardise some of the key operating processes and systems within the RDCs. Acting on this information, the RDCs based in Canberra have formed four working groups to realise synergies through collocation and through sharing of legal services, information and communication technology, and communications.
6.2.1 Contracts and agreements
The RDCs are examining the development of a standard research agreement to reduce transaction costs for RDCs and researchers and to facilitate collaboration between RDCs. For a standard agreement to be effective there must be enough commonality in how each RDC deals with contracting to avoid resorting to a high number of optional clauses. Legal advice has suggested sufficient common ground may exist and a draft standard research agreement is being prepared, to be circulated to all RDCs for internal legal advice and approval in July 2010.
Standardisation of contracts depends partly on development of a common approach to governing intellectual property management, commercialisation, risk management, reporting and payments. A common approach to intellectual property management and commercialisation is being progressed through the PISC R&D Subcommittee. The RDCs are actively participating in this working group and the results of this work will flow into RDC specific initiatives on these matters.
The PISC R&D Subcommittee is also examining opportunities for harmonisation across research organisations and in this context will review the progress made by the RDCs in this area.
6.2.2 Collocation
All RDCs have explored shared occupancy opportunities and where feasible, all RDCs make their offices available to other RDCs for meetings and short-term staff secondments.
Since 2007, SRDC has sub-let part of its tenancy to provide office space for Brisbane-based staff of HAL and APL and since early 2010, HAL has provide office space for three APL Sydney based staff. Negotiations are also currently underway with GWRDC to house an APL Adelaide based staff member.
Discussions between the RDCs based in Melbourne and Sydney found that the scale of operations and existing tenancy agreements currently preclude sharing premises in the two cities beyond existing arrangements. FWPA and DA will review joint accommodation opportunities in Melbourne when their current leases expire in 2013.
The Canberra-based RDCs (APL, GRDC, FRDC and RIRDC) commissioned Jones, Lang LaSalle in August 2009 to undertake an assessment of collocation. This work considered the current costs per square metre per employee and the potential savings and costs associated with collocation of all Canberra-based RDCs. The initial analysis identified a net cost of immediate collocation, largely due to the cost of early termination of existing leases.
Further work is now being undertaken to examine when a collocation could be effectively undertaken, taking into account existing lease terms. This work will also examine cost
CRRDC submission to the PC Inquiry into the R&D corporations model, June 2010 Page 55
savings from rationalisation of common area costs and common services, including cleaning, meeting rooms and reception.
6.2.3 Shared services
RDCs have examined a number of other opportunities to share services and reduce administrative costs.
The Canberra-based RDCs are benchmarking RDC information technology services to identify areas for cost savings through standardisation. APL and FRDC already share a common project management system that is hosted by FRDC. This system is also utilised by the Australian Fisheries Management Authority, the Seafood CRC and the Condamine NRM Group.
CRDC and RIRDC recently approached the market for joint hosting services for their project management system, Clarity. Both RDCs worked closely together on the procurement process and project management of the transition to the new provider. These RDCs share the hosting costs equally, thereby providing a financial benefit to both organisations.
A working group is also examining the potential savings from coordination of third-party suppliers of communications-related services, including printers and services such as public relations consultants. RDC Business Managers are reviewing the benefits of using a single supplier for purchasing stationery across all RDCs.
The opportunity for a broader shared services model is being explored by the CRRDC and will build on some of the more localised work currently being undertaken.
6.2.4 Information sharing
Forums and frameworks exist for RDCs to collaborate on strategic planning and operational harmonisation, in addition to the extensive informal collaboration currently occurring between RDCs. The CRRDC holds two major meetings a year, at which RDC chairs and CEOs consider opportunities for collaborative initiatives and establish the strategic directions of the CRRDC.
Under the aegis of the CRRDC, RDC Business Managers and Communications Managers meet at least twice yearly to identify opportunities for increased collaboration between RDCs, and to share knowledge and expertise. Policies and procedures for dealing with reserves, risk management and fraud control, and for formulating annual operational plans and annual reports, are some of the matters that have been addressed at this level. Coordination of reporting, legal services, expenditure and sharing experiences on the development of enterprise agreements has also been undertaken by Business Managers. Representatives from DAFF are invited to attend CRRDC meetings and Business Managers and Communications Managers meetings.
Establishment of a forum for RD&E program managers to provide for sharing of research techniques and project management is also being explored.
The CRRDC circulates a monthly Communiqué on the work of the CRRDC Secretariat and other activities, such as the work of the Primary Industries Ministerial Council and the Rural Research and Development Council.
CRRDC submission to the PC Inquiry into the R&D corporations model, June 2010 Page 56
6.2.5 Communications with the Australian Government
The CRRDC is exploring a number of areas through which communication with the Government and DAFF can be streamlined and strengthened. The CRRDC has also assisted with implementing recent changes to the RDCs’ annual operational plan process.
The CRRDC is working with the RDCs and DAFF to overcome difficulties in meeting overnment reporting requirements such as the portfolio budget submission process and annual reports. Since the requirements can be duplicative and conflicting, harmonisation of these processes and information requests from DAFF would reduce the administrative costs for both the RDCs and the Government.
The CRRDC is also investigating the extent to which the SFAs can be standardised. The Government currently negotiates these individually with each IOC in an often protracted
and costly process. The IOCs, with the CRRDC, are drafting a standard SFA as a starting point for future SFA negotiations.
More broadly, the CRRDC is building effective relationships with Government agencies outside the DAFF portfolio, including the Departments of the Prime Minister and Cabinet; Treasury; Finance and Deregulation; Innovation, Industry, Science and Research; Climate Change and Energy Efficiency; Environment, Water, Heritage and the Arts; Health and Ageing; and Education, Employment and Workplace Relations.
6.2.6 Data collection
The RDCs and the CRRDC are reviewing data and knowledge management systems, particularly as current processes for gathering data and information have been identified as an area for improvement. Numerous requests are made for data, on either a regular or ad hoc basis and this data is not always provided in a consistent form. For example, in preparing the 2010 Collaboration Report, not all RDCs were able to provide leverage figures for their RD&E investment.
The CRRDC also acknowledges that there are gaps in data collection and reporting across the RDCs. The CRRDC has an important role in coordinating the data and information-gathering on which decisions can be made.
The CRRDC is examining the extent to which collection and reporting of data can be streamlined to provide greater efficiencies and effectiveness. Consideration will also be given to the development of a database that can collate cross-RDC data. This would be a logical extension to the current collation of evaluation data across the RDCs. The CRRDC is keen to work with ABARE and DAFF on this project, since both these organisations are key collectors of data on the RDCs.
The CRRDC is also working with the RDCs to enable the widening of the ABARE survey program on productivity to include a broader range of industries and to increase the sample size to enable more accurate estimates to be made.
6.3 Coordination and collaboration
Effective coordination and collaboration of research between providers and between acquirers is acknowledged to have a range of advantages, including avoiding duplication of effort, maximising the synergies between related fields of inquiry, and allowing specialisation to occur.
CRRDC submission to the PC Inquiry into the R&D corporations model, June 2010 Page 57
RDCs are by their creation and nature, collaborative organisations. As previously discussed, they involve joint endeavour between industry, science, government and the community that utilises industry levy funds, private funds and taxpayer funds to invest in projects undertaken with state DPIs, universities, CSIRO, CRCs, private researchers and other RDCs. Their projects address shared objectives and understandings about the benefits of the research to industry and the community.
Collaboration occurs at a number of levels across the RDC network, including between RDCs on rural RD&E priorities and strategies. Following the CRRDC 2007 review of collaboration, RDC working groups were set up to facilitate collaboration across common research priorities. This role has now been absorbed into a formal PISC process for determining RD&E capacity, priorities and emerging needs across specific rural commodities and cross-sectoral issues.
Deeper collaborative relationships also exist in the form of longer-term agreements between RDCs, a number of state DPIs, universities and private industry to support research programs into the medium term. Other agreements between RDCs, local research providers and their counterparts overseas are sourcing the best industry RD&E and knowledge and applying it in Australia.
In relation to research outputs, the RDCs are knowledge providers to their industries. Collaboration with research providers and the private sector underpins their involvement in promoting adoption of research results.
The evaluation program is a further example of collaboration between RDCs to develop an effective framework for assessing the impact of RDC investments and their compliance with government priorities.
It is clear that collaboration occurs across the RDCs in many ways. The National Primary Industries Research, Development and Extension Framework currently being implemented through PISC will provide an integrated view of RD&E needs on both industry and cross-industry issues and will facilitate further strategic alignment and collaboration on a national basis.
The CRRDC is seeking opportunities to develop further collaborative initiatives across the RDCs, recognising that collaboration in itself does not always bring net benefits, since transaction costs and deadweight losses frequently accrue from combining tasks and resources that can result in lower returns to government and industry. The RDCs will focus on collaborative initiatives that have sound business cases and show promise to provide good outcomes for industry and government.
6.3.1 Collaborative investment
The CRRDC has updated the 2007 report: Increasing Effectiveness and Efficiency of RDC Investments Through Collaboration. An extract from the 2010 report is at appendix 3.
This report shows that the majority of RD&E investment is collaborative. Approximately 80 % of the $458 million of RD&E investment by RDCs involves a financial, or significant in-kind, investment from other third parties — including from other RDCs, state and Australian Government agencies, research institutes, companies and industry investment trusts.
Of the 80% of RDC investment that is collaborative, 71% ($318 million) is in collaboration with non-RDC parties to achieve industry-specific goals. 9% of investment involves two or more RDCs working together or with other non-RDC parties.
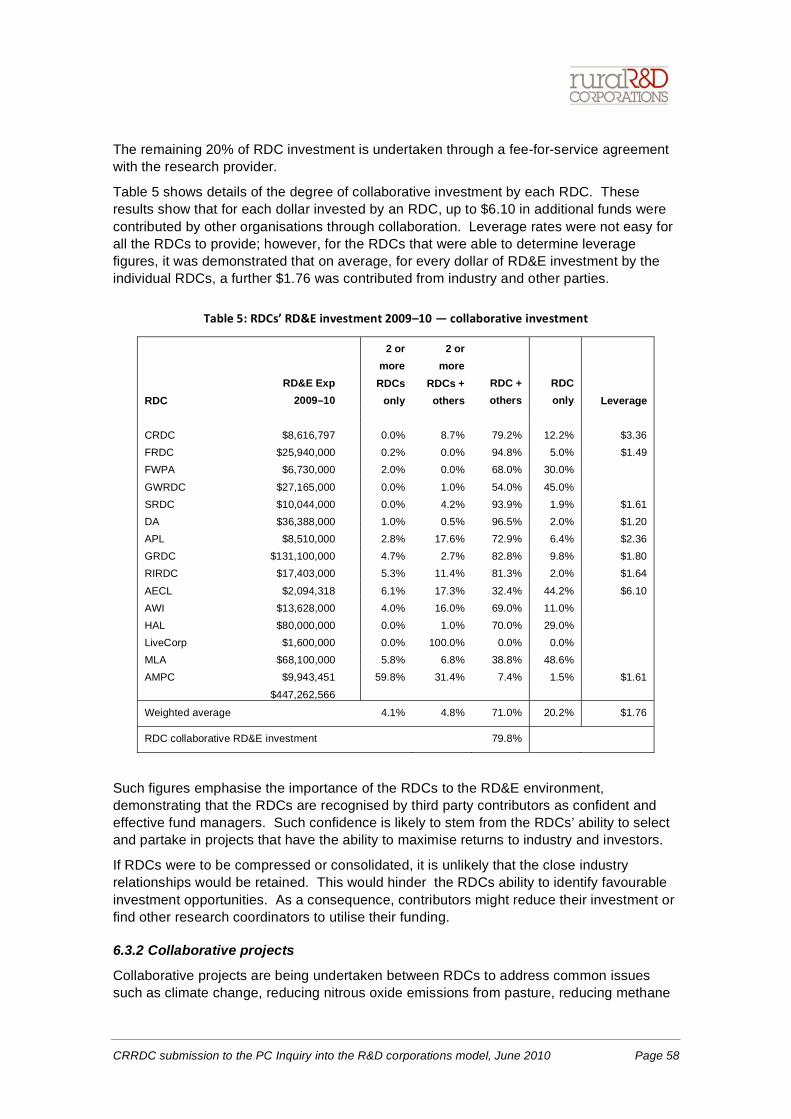
CRRDC submission to the PC Inquiry into the R&D corporations model, June 2010 Page 58
The remaining 20% of RDC investment is undertaken through a fee-for-service agreement with the research provider.
Table 5 shows details of the degree of collaborative investment by each RDC. These results show that for each dollar invested by an RDC, up to $6.10 in additional funds were contributed by other organisations through collaboration. Leverage rates were not easy for all the RDCs to provide; however, for the RDCs that were able to determine leverage figures, it was demonstrated that on average, for every dollar of RD&E investment by the individual RDCs, a further $1.76 was contributed from industry and other parties.
RDC RD&E Exp
2009–10
2 or more RDCs
only
2 or more
RDCs + others
RDC + others
RDC only Leverage
CRDC $8,616,797 0.0% 8.7% 79.2% 12.2% $3.36 FRDC $25,940,000 0.2% 0.0% 94.8% 5.0% $1.49 FWPA $6,730,000 2.0% 0.0% 68.0% 30.0%
GWRDC $27,165,000 0.0% 1.0% 54.0% 45.0% SRDC $10,044,000 0.0% 4.2% 93.9% 1.9% $1.61 DA $36,388,000 1.0% 0.5% 96.5% 2.0% $1.20 APL $8,510,000 2.8% 17.6% 72.9% 6.4% $2.36 GRDC $131,100,000 4.7% 2.7% 82.8% 9.8% $1.80 RIRDC $17,403,000 5.3% 11.4% 81.3% 2.0% $1.64
AECL $2,094,318 6.1% 17.3% 32.4% 44.2% $6.10 AWI $13,628,000 4.0% 16.0% 69.0% 11.0% HAL $80,000,000 0.0% 1.0% 70.0% 29.0% LiveCorp $1,600,000 0.0% 100.0% 0.0% 0.0% MLA $68,100,000 5.8% 6.8% 38.8% 48.6% AMPC $9,943,451 59.8% 31.4% 7.4% 1.5% $1.61
$447,262,566
Weighted average 4.1% 4.8% 71.0% 20.2% $1.76
RDC collaborative RD&E investment
79.8%
Such figures emphasise the importance of the RDCs to the RD&E environment, demonstrating that the RDCs are recognised by third party contributors as confident and effective fund managers. Such confidence is likely to stem from the RDCs’ ability to select and partake in projects that have the ability to maximise returns to industry and investors.
If RDCs were to be compressed or consolidated, it is unlikely that the close industry relationships would be retained. This would hinder the RDCs ability to identify favourable investment opportunities. As a consequence, contributors might reduce their investment or find other research coordinators to utilise their funding.
6.3.2 Collaborative projects
Collaborative projects are being undertaken between RDCs to address common issues such as climate change, reducing nitrous oxide emissions from pasture, reducing methane
CRRDC submission to the PC Inquiry into the R&D corporations model, June 2010 Page 59
emissions from ruminants, and animal welfare. However, joint funding is not always required, nor is it the only way to achieve effective cooperation and coordination of the RD&E effort. RDCs have a supply chain focus centred on their commodity segment and many research topics will have different research pathways, different adoption issues or different production management implications for different commodities. This can limit the effectiveness of trying to pursue research topics through larger, cooperatively funded joint projects.
RDC-to-RDC investment is focused around clusters of RD&E that are common to some but not all RDCs. Some of the key areas of RDC collaboration are: • animal, feed, grain and pasture productivity • soils, nutrients and fertiliser management • water consumption and irrigation • greenhouse gas reduction from ruminants and soils • farm and fishing health and safety
• vocational education and training and capacity-building.
The Climate Change Research Strategy for Primary Industries (CCRSPI) is a collaborative program established under a mandate from the Primary Industries Ministerial Council, PISC and the CRRDC to coordinate climate change research in rural industries within the National Primary Industries RD&E Framework.
The Premium Grains for Livestock Program is an example of highly effective collaboration at a project level. The project was hosted by GRDC and involved contributions from APL, MLA, Ridley Agriproducts, University of Sydney, South Australian Research and Development Institute, University of New England, CSIRO, Department of Natural Resources and Environment and NSW Department of Primary Industries. Running between 2000 and 2008, the program developed ways to increase the efficiency and effectiveness of livestock feeding programs.
The CRRDC is examining further collaborative opportunities for cross-sectoral investment. For example, in the area of natural resource management, the CRRDC is examining the extent to which the continuing unmet research needs in this area, previously managed by Land and Water Australia, can be addressed.
6.3.3 Strategic collaboration Various challenges confront all sectors of the Australian primary industries. The Government has emphasised the need for primary industries to respond to these challenges. Such responses must be investigated, tested and disseminated by RDCs. The CRRDC facilitates this industry wide effort by:
• providing leadership to RDCs to enable greater strategic collaboration when appropriate
• leading the establishment of common evaluation approaches to help compare investments and manage investment opportunities
• facilitating the implementation of shared services and common practices to foster greater cost efficiencies
• creating more formal and accessible communication channels between RDCs.
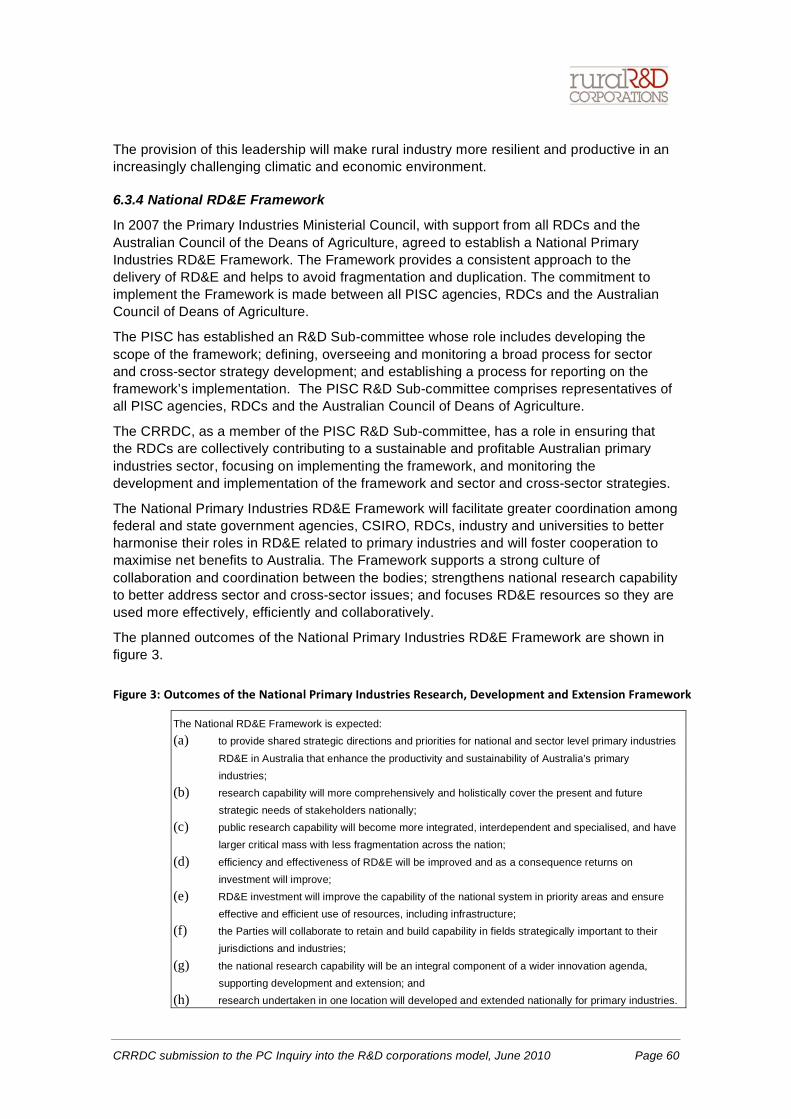
CRRDC submission to the PC Inquiry into the R&D corporations model, June 2010 Page 60
The provision of this leadership will make rural industry more resilient and productive in an increasingly challenging climatic and economic environment.
6.3.4 National RD&E Framework
In 2007 the Primary Industries Ministerial Council, with support from all RDCs and the Australian Council of the Deans of Agriculture, agreed to establish a National Primary Industries RD&E Framework. The Framework provides a consistent approach to the delivery of RD&E and helps to avoid fragmentation and duplication. The commitment to implement the Framework is made between all PISC agencies, RDCs and the Australian Council of Deans of Agriculture.
The PISC has established an R&D Sub-committee whose role includes developing the scope of the framework; defining, overseeing and monitoring a broad process for sector and cross-sector strategy development; and establishing a process for reporting on the framework’s implementation. The PISC R&D Sub-committee comprises representatives of all PISC agencies, RDCs and the Australian Council of Deans of Agriculture.
The CRRDC, as a member of the PISC R&D Sub-committee, has a role in ensuring that the RDCs are collectively contributing to a sustainable and profitable Australian primary industries sector, focusing on implementing the framework, and monitoring the development and implementation of the framework and sector and cross-sector strategies.
The National Primary Industries RD&E Framework will facilitate greater coordination among federal and state government agencies, CSIRO, RDCs, industry and universities to better harmonise their roles in RD&E related to primary industries and will foster cooperation to maximise net benefits to Australia. The Framework supports a strong culture of collaboration and coordination between the bodies; strengthens national research capability to better address sector and cross-sector issues; and focuses RD&E resources so they are used more effectively, efficiently and collaboratively.
The planned outcomes of the National Primary Industries RD&E Framework are shown in figure 3.
The National RD&E Framework is expected: (a) to provide shared strategic directions and priorities for national and sector level primary industries
RD&E in Australia that enhance the productivity and sustainability of Australia’s primary industries;
(b) research capability will more comprehensively and holistically cover the present and future strategic needs of stakeholders nationally;
(c) public research capability will become more integrated, interdependent and specialised, and have larger critical mass with less fragmentation across the nation;
(d) efficiency and effectiveness of RD&E will be improved and as a consequence returns on investment will improve;
(e) RD&E investment will improve the capability of the national system in priority areas and ensure effective and efficient use of resources, including infrastructure;
(f) the Parties will collaborate to retain and build capability in fields strategically important to their jurisdictions and industries;
(g) the national research capability will be an integral component of a wider innovation agenda, supporting development and extension; and
(h) research undertaken in one location will developed and extended nationally for primary industries.
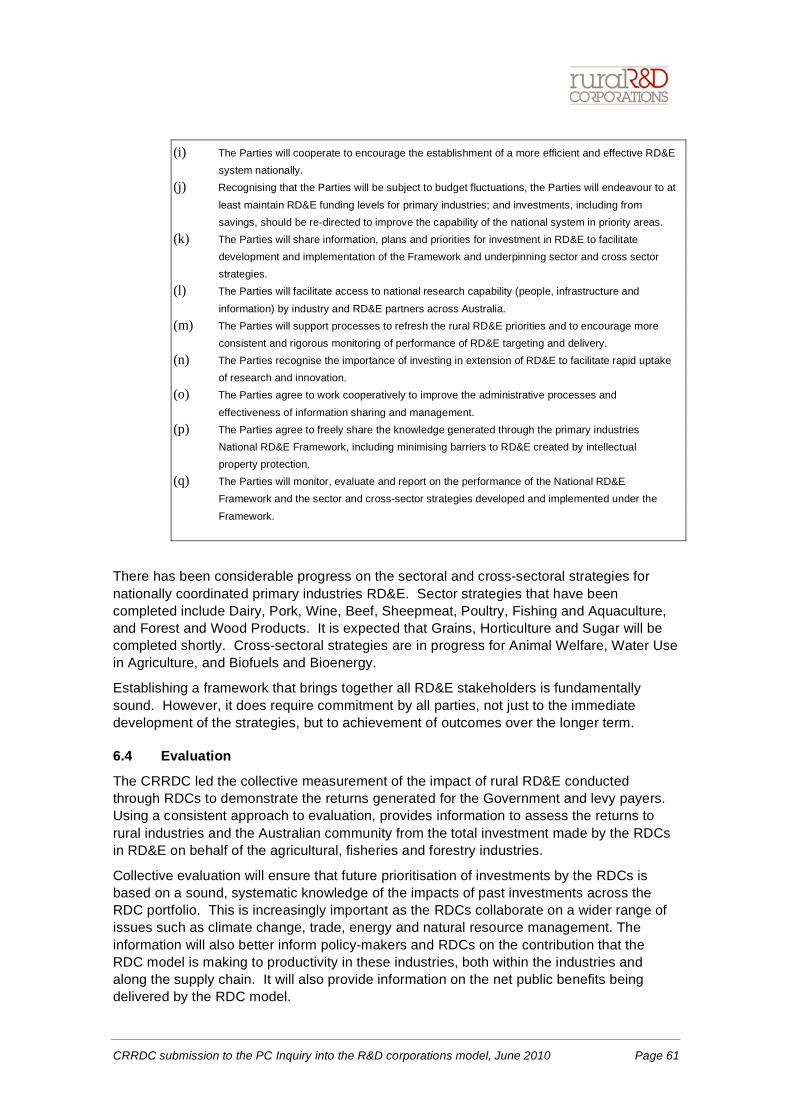
CRRDC submission to the PC Inquiry into the R&D corporations model, June 2010 Page 61
(i) The Parties will cooperate to encourage the establishment of a more efficient and effective RD&E system nationally.
(j) Recognising that the Parties will be subject to budget fluctuations, the Parties will endeavour to at
least maintain RD&E funding levels for primary industries; and investments, including from savings, should be re-directed to improve the capability of the national system in priority areas.
(k) The Parties will share information, plans and priorities for investment in RD&E to facilitate development and implementation of the Framework and underpinning sector and cross sector strategies.
(l) The Parties will facilitate access to national research capability (people, infrastructure and
information) by industry and RD&E partners across Australia. (m) The Parties will support processes to refresh the rural RD&E priorities and to encourage more
consistent and rigorous monitoring of performance of RD&E targeting and delivery. (n) The Parties recognise the importance of investing in extension of RD&E to facilitate rapid uptake
of research and innovation. (o) The Parties agree to work cooperatively to improve the administrative processes and
effectiveness of information sharing and management. (p) The Parties agree to freely share the knowledge generated through the primary industries
National RD&E Framework, including minimising barriers to RD&E created by intellectual property protection.
(q) The Parties will monitor, evaluate and report on the performance of the National RD&E Framework and the sector and cross-sector strategies developed and implemented under the
Framework.
There has been considerable progress on the sectoral and cross-sectoral strategies for nationally coordinated primary industries RD&E. Sector strategies that have been completed include Dairy, Pork, Wine, Beef, Sheepmeat, Poultry, Fishing and Aquaculture, and Forest and Wood Products. It is expected that Grains, Horticulture and Sugar will be completed shortly. Cross-sectoral strategies are in progress for Animal Welfare, Water Use in Agriculture, and Biofuels and Bioenergy.
Establishing a framework that brings together all RD&E stakeholders is fundamentally sound. However, it does require commitment by all parties, not just to the immediate development of the strategies, but to achievement of outcomes over the longer term.
6.4 Evaluation
The CRRDC led the collective measurement of the impact of rural RD&E conducted through RDCs to demonstrate the returns generated for the Government and levy payers. Using a consistent approach to evaluation, provides information to assess the returns to rural industries and the Australian community from the total investment made by the RDCs in RD&E on behalf of the agricultural, fisheries and forestry industries.
Collective evaluation will ensure that future prioritisation of investments by the RDCs is based on a sound, systematic knowledge of the impacts of past investments across the RDC portfolio. This is increasingly important as the RDCs collaborate on a wider range of issues such as climate change, trade, energy and natural resource management. The information will also better inform policy-makers and RDCs on the contribution that the RDC model is making to productivity in these industries, both within the industries and along the supply chain. It will also provide information on the net public benefits being delivered by the RDC model.
CRRDC submission to the PC Inquiry into the R&D corporations model, June 2010 Page 62
6.4.1 Evaluation framework
In 2007, in consultation with ACIL Tasman, the CRRDC developed an effective evaluation framework for assessing the impact of RDC investments and their compliance with Govern-ment priorities. The framework enables independent estimates of the net benefits of RDC investments, including achievements and industry benefits, relative to priorities.
There are three elements in the evaluation process:
1. Analysis of a sufficient number of significant, successful, large-scale projects or programs to demonstrate that the entire RDC portfolio is adding value to the Australian economy and producing positive industry and public benefits. These projects, undertaken in Year 1, will be included in the evaluation process in subsequent years, when particular aspects of the portfolio will be assessed. No such projects were included in the 2009 evaluation process.
2. Representative random sampling of project clusters from each RDC to build a pool of consistent cost–benefit analysis studies that can be used to provide an indication of the range and trends in returns from the total RDC investments over a three-year period. Randomly selected projects will be evaluated each year.
3. An analysis of early-stage collaborative RD&E projects, which are expected to have major areas of public interest in order to measure the value of work in progress and the private and public opportunities that early-stage research creates. A large cross-sectoral project on biosecurity was undertaken in the first year of evaluation and several more are planned for 2011.
6.4.2 Evaluation methodology The RDCs have agreed on an endorsed methodology to be followed by all RDCs. The methodology was reviewed by Treasury, Department of Finance and Deregulation, Department of Agriculture, Fisheries and Forestry, the Productivity Commission and the Australian Bureau of Agricultural and Resource Economics. The methodology will be
reviewed in the second half of 2010 to ensure that it continues to meet current and future priorities and is sufficiently flexible to account for individual needs of the RDCs.
The guidelines state that the program can have a supply or demand focus. In the development phase of the evaluation methodology, the RDCs specified that both their RD&E and marketing investments be included: it was considered that separating them would be difficult and would lead to a distorted picture of the portfolio.
The RDCs’ overhead costs are not included as there is no agreed methodology to allocate fixed costs. The significant projects included in Year 1 compared returns to total expenditure of the RDC. The random sample is not reported as total returns, but returns generated by each cluster reduced by direct costs. Inclusion of fixed costs would slightly reduce the return but would be unlikely to significantly affect the distribution, which is the key outcome of the random sample. As an example, most RDCs claim fixed costs to be between 8 and 10 percent of total costs, although this is yet to be tested. As part of the review process, the inclusion of fixed costs will be considered.
The CRRDC maintains a spreadsheet of all of the results, which will enable them to be aggregated and continually reported. A complete list of the projects used for the random assessments is included in each public report.
A comprehensive description of the methodology can be found in appendix 4.
CRRDC submission to the PC Inquiry into the R&D corporations model, June 2010 Page 63
6.4.3 RDC commitment to the evaluation process
The evaluation process was instigated by the RDCs through the CRRDC as a means to demonstrate the return on investment to stakeholders, including Government. Although there is no specific direction in either the PIERD Act or the individual SFAs, the RDCs considered evaluation to be a fundamental part of the investment process and part of their role as accountable fund managers. The CRRDC understands that as individual SFAs are being re-negotiated, DAFF is seeking to include reference to the evaluation process in those agreements.
Despite the CRRDC having no authority to compel any RDC to participate in the evaluation process, all RDCs have participated in either the full evaluation process or ‘hero’ projects in Year 1. In Year 2, the majority of RDCs participated. The main reason that not all RDCs were able to participate in Year 2 is that the timing of the evaluation process did not align with existing performance evaluation processes. All RDCs are participating in Year 3 and are fully
committed to the process.
Within each RDC a nominated person is responsible for the evaluation process: either the Business Manager or a dedicated evaluation staff member. The CRRDC has established an evaluation working group, responsible for the initial preparation and drafting of each evaluation report.
6.4.4 Improving the evaluation process
Development of the evaluation methodology is continuing, with the RDCs, through the CRRDC, examining the extent to which indicators and metrics can be developed to quantify the social and environmental impacts of RD&E. Consistent measurement of environmental and social benefits is a key goal that the RDCs are actively pursuing. Progress in this area is outlined below.
As part of a process of ensuring that all RDCs can participate in the evaluation process, the CRRDC is examining mechanisms by which costs can be shared. Currently, RDCs are able to utilise the expertise of a small group of consultants who have experience in this area. However, additional cost savings may be available from a greater sharing of these skills without compromising the independent nature of the analysis.
The CRRDC recently convened an evaluation forum to investigate the opportunity to establish a best-practice evaluation framework across government and government-related organisations. Participants included the RDCs; CRCs; CSIRO; Department of Innovation, Industry, Science and Research; state government departments; and academic institutions. There was broad agreement to establish consistent data collection and reporting mechanisms and evaluation of social and environmental impacts.
Following this forum, the Coordination Committee on Innovation agreed to take on the role of leading the strategic approach to best practice in evaluation. The CRRDC will participate in a working group to develop this approach, drawing on the earlier work of the Coordination Committee on Science and Technology.
At the most recent meeting of the PISC R&D Subcommittee in June 2010, the CRRDC led a workshop on harmonisation, especially with a view to harmonise evaluation processes across all PISC agencies. The Subcommittee agreed to progress the development of common definitions, design tools, assessment and reporting tools and continual improvement tools as part of this process. Standards for evaluation and a common
CRRDC submission to the PC Inquiry into the R&D corporations model, June 2010 Page 64
reporting framework will be included to enable comparisons to be made across agencies. A strategy for harmonisation of evaluation processes is expected to be presented to PISC in September 2010, followed by an implementation plan to be agreed in March 2011 with commencement in mid-2011.
A related area of RDC impact assessment is the expected contribution of RDC investments to total factor productivity growth, which two RDCs are investigating. GRDC and ABARE are jointly undertaking a series of projects analysing productivity and RD&E in the grains industry. RIRDC also has commissioned several projects assessing on-farm practice change and innovations that drive productivity growth.
6.4.5 Evaluation results
In 2008, the first CRRDC evaluation derived a benefit-cost ratio for 36 highly successful projects to show the high rate of returns achievable from rural RD&E, and 32 randomly selected projects to provide an estimate of the overall benefits derived from RDCs.
The evaluation showed that the 36 highly successful projects will generate $10.5 billion of benefits over a 10-year period from an investment of $265 million. The 32 randomly selected projects were estimated to deliver a benefit-cost ratio of 11:1 after 25 years. The estimate did not include non-measured benefits, including labour savings, increased investment, capital savings and market development. The quantitative benefit-cost estimate also did not include a range of environmental and social benefits.
The second CRRDC evaluation assessed 59 randomly selected projects, using the agreed methodology. Benefit-cost ratios derived from this evaluation were 2.36:1 after 5 years, 5.56:1 after 10 years and 10.51:1 after 25 years. The evaluation also provided a comprehensive listing of the un-priced environmental and social benefits delivered by the projects.
The 2008 and 2009 evaluation reports are at appendix 5.
These evaluation results are consistent with other findings on the returns to rural RD&E, including those identified by the PC (2007).
Mullen (2007) found benefit–cost ratios for RD&E investment in Australia that ranged from 9.7 to 20.5, depending on whether or not private research expenditure is included, the extent to which productivity gains are attributed to RD&E, and using a 4% per annum discount rate.
Alston et al. (2010) found benefit-cost ratios for public investment in RD&E in US agriculture of between 10.5 (discount rate of 5%) and 30.4 (discount rate of 3%), depending on assumptions about the extent to which productivity gains are attributed to publicly funded RD&E.
By comparison, the CRRDC evaluation process was of a similar order of magnitude, but used a discount rate of 5% per annum, thereby lowering the benefit-cost ratio. These comparisons confirm that the CRRDC findings are consistent with other estimates of benefit-cost ratios for rural RD&E, although differences between the studies do not permit more detailed conclusions to be drawn. The CRRDC work addresses specific project costs and benefits, whereas the other estimates are made at a national level and involve assumptions about attribution of benefits, lags and various measurement issues.
The RDCs, Cooperative Research Centres (CRCs) and Australian Centre for International Agricultural Research ( ACIAR) undertake extensive evaluation of their research projects. CSIRO currently does not undertake routine cost–benefit analysis of their projects, but it is
CRRDC submission to the PC Inquiry into the R&D corporations model, June 2010 Page 65
understood to be examining the establishment of an evaluation process for its lapsing programs.
The benefit-cost ratios from the first two years of evaluation (11:1 and 10.5:1) are highly consistent with the results of ACIAR, which show a benefit-cost ratio of 10:1.
6.4.6 Selection of projects
The RDCs are responsible for establishing their own populations for sampling and use a sampling method for the evaluation process. For the purpose of random sampling, the RDCs assemble their portfolios into clusters of projects aimed at a particular aspect of research. In many cases the RDCs use existing sub-programs as the basis for their clusters.
Developing a statistically robust sample of projects is very costly and a balance needs to be achieved between providing appropriate accountability and the cost of gathering, analysing and reporting the data that underpins this accountability. Therefore, the portfolio management is largely based on managing the clusters or sub-programs. In most cases the RDCs develop a list of about 40 clusters each.
Several RDCs have evaluated all of their recently completed projects. Others are putting in place internal processes that will support the evaluation program. As part of the review of the evaluation process, it is desirable to put in place best practices while recognising that each RDC is at a different point in introducing evaluation as part of “business as usual”.
The selection criteria are based on clusters having reached a milestone two to five years before the year of sampling. No stratification has yet been employed; however, once the full three-year results have been aggregated, the issue of bias can be considered.
6.4.7 Independent review
The RDCs assemble their entire investment portfolio into a series of sub-programs or clusters of projects. Projects are randomly selected and the RDCs then commission independent consultants to undertake the cost–benefit and other analysis specified in the methodology.
Once the cost–benefit analyses have been completed, the CRRDC coordinates the collation and verification of the data. The collated data is then independently reviewed and the results are included in an annual report. The 2010 report will include both the results for the prior year and the aggregated results for the three-year period.
A peer review process has not yet been established. In establishing the evaluation program, it was agreed that by publishing all aspects of the evaluation process, including the names of the consultants who undertook the analysis, this transparent process would be sufficient in the short term. However, the CRRDC will, in its review of the evaluation methodology, consider whether peer review or independent audit, needs to be instigated as part of the evaluation.
6.4.8 Social and environmental impacts
A limitation to the systematic evaluation of RD&E investment through the RDC structure is the difficulty in evaluating public benefit outcomes. Contributions to better environmental management, biosecurity, improved animal welfare, increased biodiversity, improved food safety and benefits to rural communities are difficult to measure and value. Simple listing of impacts clearly fails to give due credit to gains made as a result of the research. With an
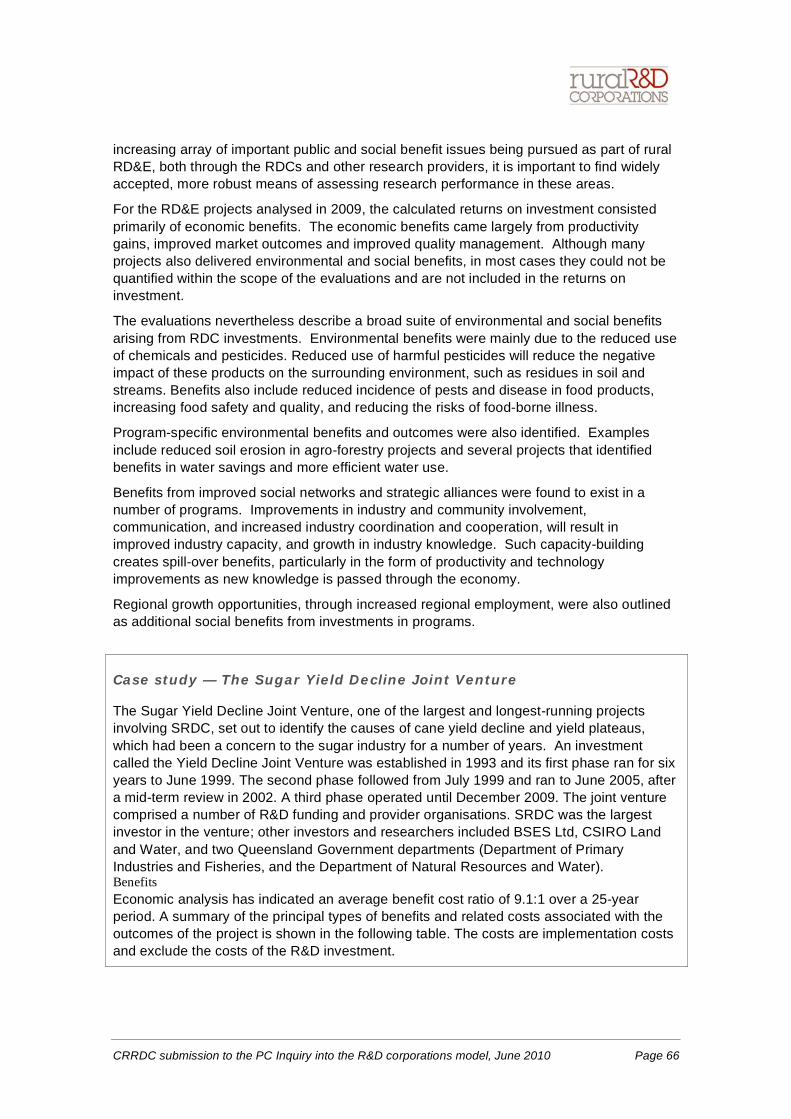
CRRDC submission to the PC Inquiry into the R&D corporations model, June 2010 Page 66
increasing array of important public and social benefit issues being pursued as part of rural RD&E, both through the RDCs and other research providers, it is important to find widely accepted, more robust means of assessing research performance in these areas.
For the RD&E projects analysed in 2009, the calculated returns on investment consisted primarily of economic benefits. The economic benefits came largely from productivity gains, improved market outcomes and improved quality management. Although many projects also delivered environmental and social benefits, in most cases they could not be quantified within the scope of the evaluations and are not included in the returns on investment.
The evaluations nevertheless describe a broad suite of environmental and social benefits arising from RDC investments. Environmental benefits were mainly due to the reduced use of chemicals and pesticides. Reduced use of harmful pesticides will reduce the negative impact of these products on the surrounding environment, such as residues in soil and streams. Benefits also include reduced incidence of pests and disease in food products, increasing food safety and quality, and reducing the risks of food-borne illness.
Program-specific environmental benefits and outcomes were also identified. Examples include reduced soil erosion in agro-forestry projects and several projects that identified benefits in water savings and more efficient water use.
Benefits from improved social networks and strategic alliances were found to exist in a number of programs. Improvements in industry and community involvement, communication, and increased industry coordination and cooperation, will result in improved industry capacity, and growth in industry knowledge. Such capacity-building creates spill-over benefits, particularly in the form of productivity and technology improvements as new knowledge is passed through the economy.
Regional growth opportunities, through increased regional employment, were also outlined as additional social benefits from investments in programs.
Case study — The Sugar Yield Decline Joint Venture
The Sugar Yield Decline Joint Venture, one of the largest and longest-running projects involving SRDC, set out to identify the causes of cane yield decline and yield plateaus, which had been a concern to the sugar industry for a number of years. An investment called the Yield Decline Joint Venture was established in 1993 and its first phase ran for six years to June 1999. The second phase followed from July 1999 and ran to June 2005, after a mid-term review in 2002. A third phase operated until December 2009. The joint venture comprised a number of R&D funding and provider organisations. SRDC was the largest investor in the venture; other investors and researchers included BSES Ltd, CSIRO Land and Water, and two Queensland Government departments (Department of Primary Industries and Fisheries, and the Department of Natural Resources and Water). Benefits Economic analysis has indicated an average benefit cost ratio of 9.1:1 over a 25-year period. A summary of the principal types of benefits and related costs associated with the outcomes of the project is shown in the following table. The costs are implementation costs and exclude the costs of the R&D investment.
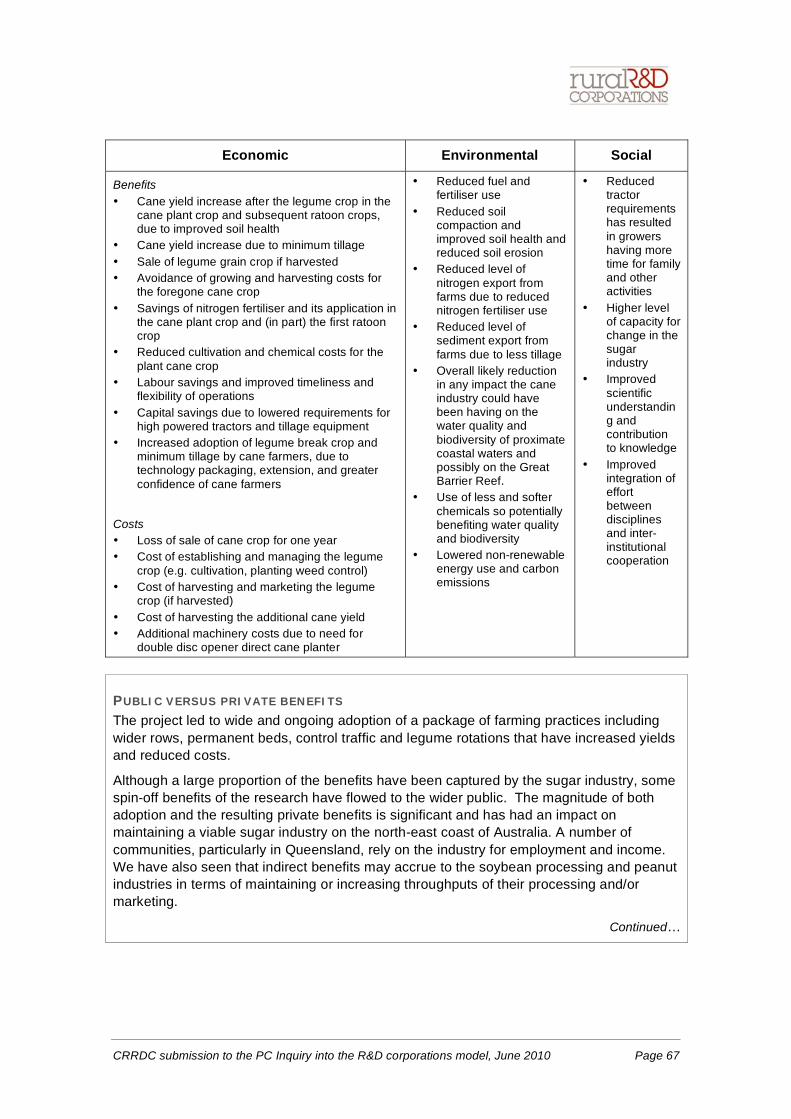
CRRDC submission to the PC Inquiry into the R&D corporations model, June 2010 Page 67
Economic Environmental Social
Benefits • Cane yield increase after the legume crop in the
cane plant crop and subsequent ratoon crops, due to improved soil health
• Cane yield increase due to minimum tillage • Sale of legume grain crop if harvested • Avoidance of growing and harvesting costs for
the foregone cane crop • Savings of nitrogen fertiliser and its application in
the cane plant crop and (in part) the first ratoon crop
• Reduced cultivation and chemical costs for the plant cane crop
• Labour savings and improved timeliness and flexibility of operations
• Capital savings due to lowered requirements for high powered tractors and tillage equipment
• Increased adoption of legume break crop and minimum tillage by cane farmers, due to technology packaging, extension, and greater confidence of cane farmers
Costs • Loss of sale of cane crop for one year • Cost of establishing and managing the legume
crop (e.g. cultivation, planting weed control) • Cost of harvesting and marketing the legume
crop (if harvested) • Cost of harvesting the additional cane yield • Additional machinery costs due to need for
double disc opener direct cane planter
• Reduced fuel and fertiliser use
• Reduced soil compaction and improved soil health and reduced soil erosion
• Reduced level of nitrogen export from farms due to reduced nitrogen fertiliser use
• Reduced level of sediment export from farms due to less tillage
• Overall likely reduction in any impact the cane industry could have been having on the water quality and biodiversity of proximate coastal waters and possibly on the Great Barrier Reef.
• Use of less and softer chemicals so potentially benefiting water quality and biodiversity
• Lowered non-renewable energy use and carbon emissions
• Reduced tractor requirements has resulted in growers having more time for family and other activities
• Higher level of capacity for change in the sugar industry
• Improved scientific understanding and contribution to knowledge
• Improved integration of effort between disciplines and inter-institutional cooperation
PUBLIC VERSUS PRIVATE BENEFITS
The project led to wide and ongoing adoption of a package of farming practices including wider rows, permanent beds, control traffic and legume rotations that have increased yields and reduced costs.
Although a large proportion of the benefits have been captured by the sugar industry, some spin-off benefits of the research have flowed to the wider public. The magnitude of both adoption and the resulting private benefits is significant and has had an impact on maintaining a viable sugar industry on the north-east coast of Australia. A number of communities, particularly in Queensland, rely on the industry for employment and income. We have also seen that indirect benefits may accrue to the soybean processing and peanut industries in terms of maintaining or increasing throughputs of their processing and/or marketing.
Continued…
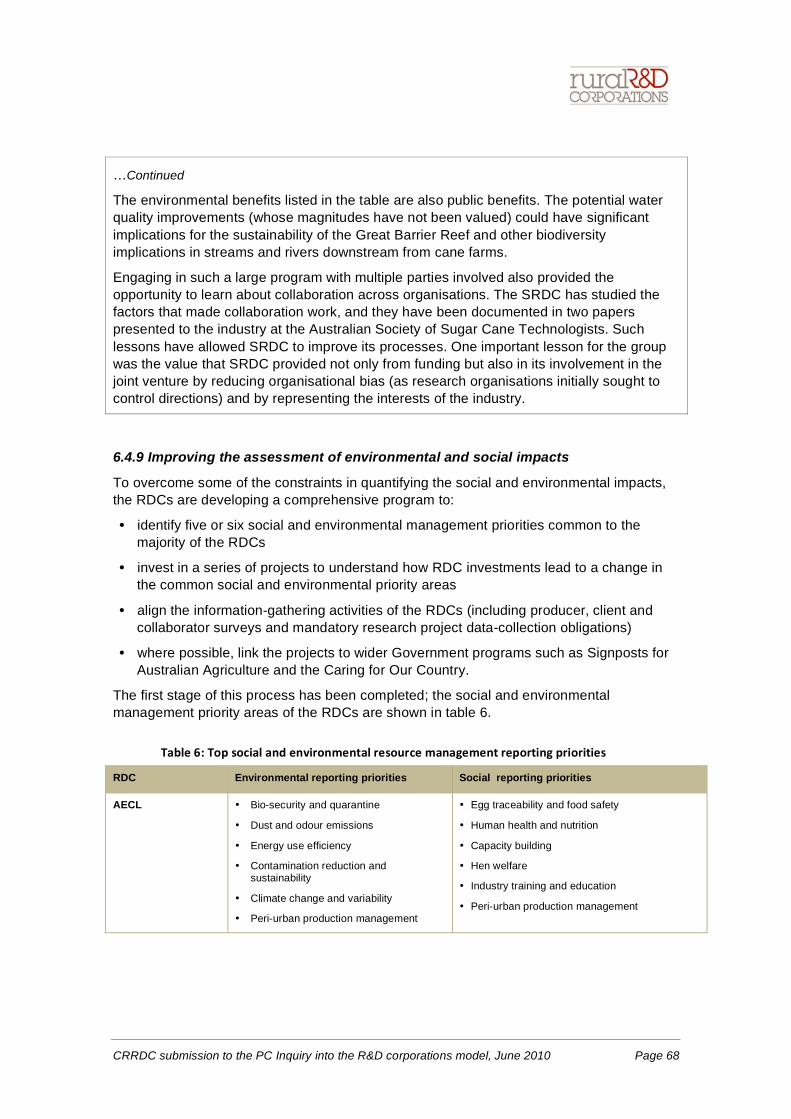
CRRDC submission to the PC Inquiry into the R&D corporations model, June 2010 Page 68
…Continued
The environmental benefits listed in the table are also public benefits. The potential water quality improvements (whose magnitudes have not been valued) could have significant implications for the sustainability of the Great Barrier Reef and other biodiversity implications in streams and rivers downstream from cane farms.
Engaging in such a large program with multiple parties involved also provided the opportunity to learn about collaboration across organisations. The SRDC has studied the factors that made collaboration work, and they have been documented in two papers presented to the industry at the Australian Society of Sugar Cane Technologists. Such lessons have allowed SRDC to improve its processes. One important lesson for the group was the value that SRDC provided not only from funding but also in its involvement in the joint venture by reducing organisational bias (as research organisations initially sought to control directions) and by representing the interests of the industry.
6.4.9 Improving the assessment of environmental and social impacts
To overcome some of the constraints in quantifying the social and environmental impacts, the RDCs are developing a comprehensive program to:
• identify five or six social and environmental management priorities common to the majority of the RDCs
• invest in a series of projects to understand how RDC investments lead to a change in the common social and environmental priority areas
• align the information-gathering activities of the RDCs (including producer, client and collaborator surveys and mandatory research project data-collection obligations)
• where possible, link the projects to wider Government programs such as Signposts for Australian Agriculture and the Caring for Our Country.
The first stage of this process has been completed; the social and environmental management priority areas of the RDCs are shown in table 6.
RDC Environmental reporting priorities Social reporting priorities
AECL • Bio-security and quarantine
• Dust and odour emissions
• Energy use efficiency
• Contamination reduction and sustainability
• Climate change and variability
• Peri-urban production management
• Egg traceability and food safety
• Human health and nutrition
• Capacity building
• Hen welfare
• Industry training and education
• Peri-urban production management

CRRDC submission to the PC Inquiry into the R&D corporations model, June 2010 Page 69
RDC Environmental reporting priorities Social reporting priorities
APL • Environmental best management practice
• Climate change adaptability through greenhouse gas management and mitigation
• Waste nutrient management
• Food safety
• Food traceability and issue response
• Industry capability
AWI • Optimal land resource management
• Adaptability to climate change
• Provenance, verification and promotion of wool’s eco-credentials
• Health and environmental attributes of wool fibre and products
• Building industry capacity through education, extension and leadership
• Building research capacity
CRDC • Soil structure and nutrient management
• Water-use efficiency
• N2O emissions
• Energy- efficiency
• Bio-security
• Building industry capacity
• Building cotton community capacity
DA • Whole of farm nutrient management and water quality
• Water use efficiency
• Green house gas management
• Human health and nutrition
• Satisfaction with farming
• Farm and post-farm skills and education
• OHS
• Dairy industry leadership in regional communities
FRDC • Bio-security
• Aquatic animal health
• By-catch management
• Climate change
• Threatened, endangered and protected species management
• Reducing fishing environmental impact
• Land use impacts
• Fish stock management
• Oceanographic and biophysical processes in aquatic systems
• Communicating responsible fishing practices
• Managing fisheries and aquacultures contribution to meeting customary, consumer, lifestyle and community needs
• Community resilience and development
• People development
FWPA • Water-use efficiency
• Increase GHG sequestration potential of forestry
• Improve forest biodiversity
• Human capacity-building
GRDC • Climate variability and climate change
• Greenhouse gas management
• Water-use efficiency
• Soil health and biology
• Bio-security
• Capacity-building
• Improving social welfare in regional communities
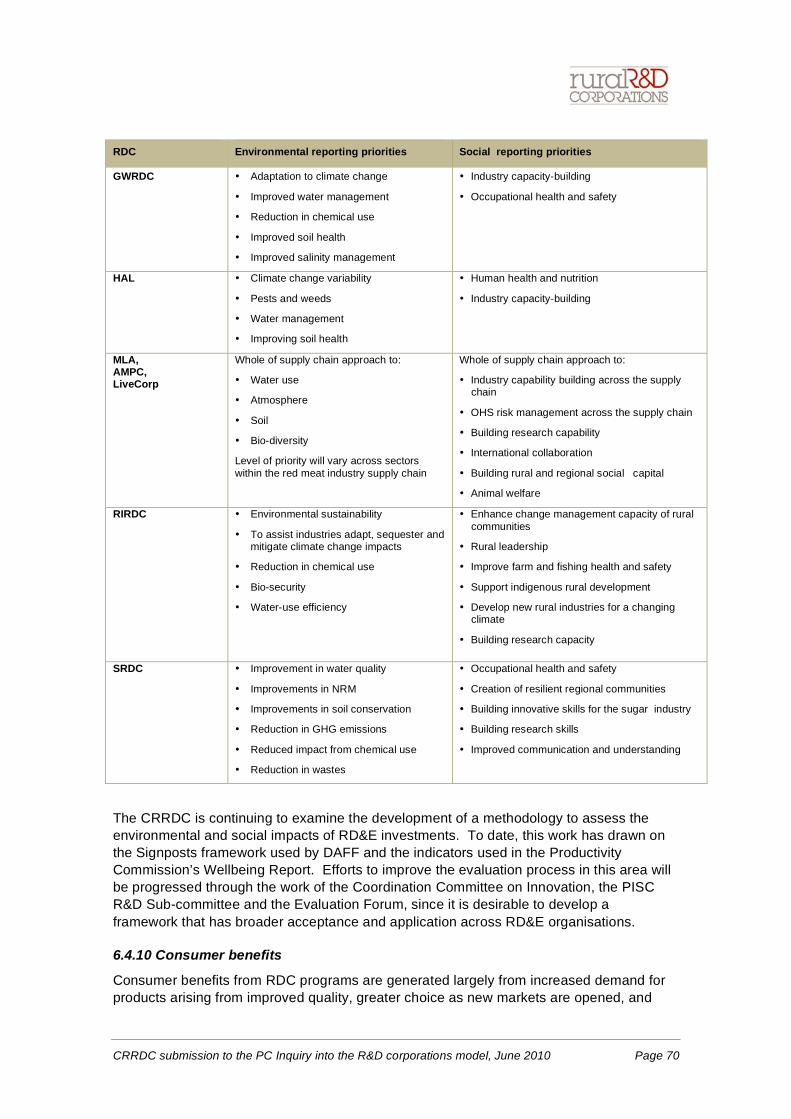
CRRDC submission to the PC Inquiry into the R&D corporations model, June 2010 Page 70
RDC Environmental reporting priorities Social reporting priorities
GWRDC • Adaptation to climate change
• Improved water management
• Reduction in chemical use
• Improved soil health
• Improved salinity management
• Industry capacity-building
• Occupational health and safety
HAL • Climate change variability
• Pests and weeds
• Water management
• Improving soil health
• Human health and nutrition
• Industry capacity-building
MLA, AMPC, LiveCorp
Whole of supply chain approach to:
• Water use
• Atmosphere
• Soil
• Bio-diversity
Level of priority will vary across sectors within the red meat industry supply chain
Whole of supply chain approach to:
• Industry capability building across the supply chain
• OHS risk management across the supply chain
• Building research capability
• International collaboration
• Building rural and regional social capital
• Animal welfare
RIRDC • Environmental sustainability
• To assist industries adapt, sequester and mitigate climate change impacts
• Reduction in chemical use
• Bio-security
• Water-use efficiency
• Enhance change management capacity of rural communities
• Rural leadership
• Improve farm and fishing health and safety
• Support indigenous rural development
• Develop new rural industries for a changing climate
• Building research capacity
SRDC • Improvement in water quality
• Improvements in NRM
• Improvements in soil conservation
• Reduction in GHG emissions
• Reduced impact from chemical use
• Reduction in wastes
• Occupational health and safety
• Creation of resilient regional communities
• Building innovative skills for the sugar industry
• Building research skills
• Improved communication and understanding
The CRRDC is continuing to examine the development of a methodology to assess the environmental and social impacts of RD&E investments. To date, this work has drawn on the Signposts framework used by DAFF and the indicators used in the Productivity Commission’s Wellbeing Report. Efforts to improve the evaluation process in this area will be progressed through the work of the Coordination Committee on Innovation, the PISC R&D Sub-committee and the Evaluation Forum, since it is desirable to develop a framework that has broader acceptance and application across RD&E organisations.
6.4.10 Consumer benefits
Consumer benefits from RDC programs are generated largely from increased demand for products arising from improved quality, greater choice as new markets are opened, and
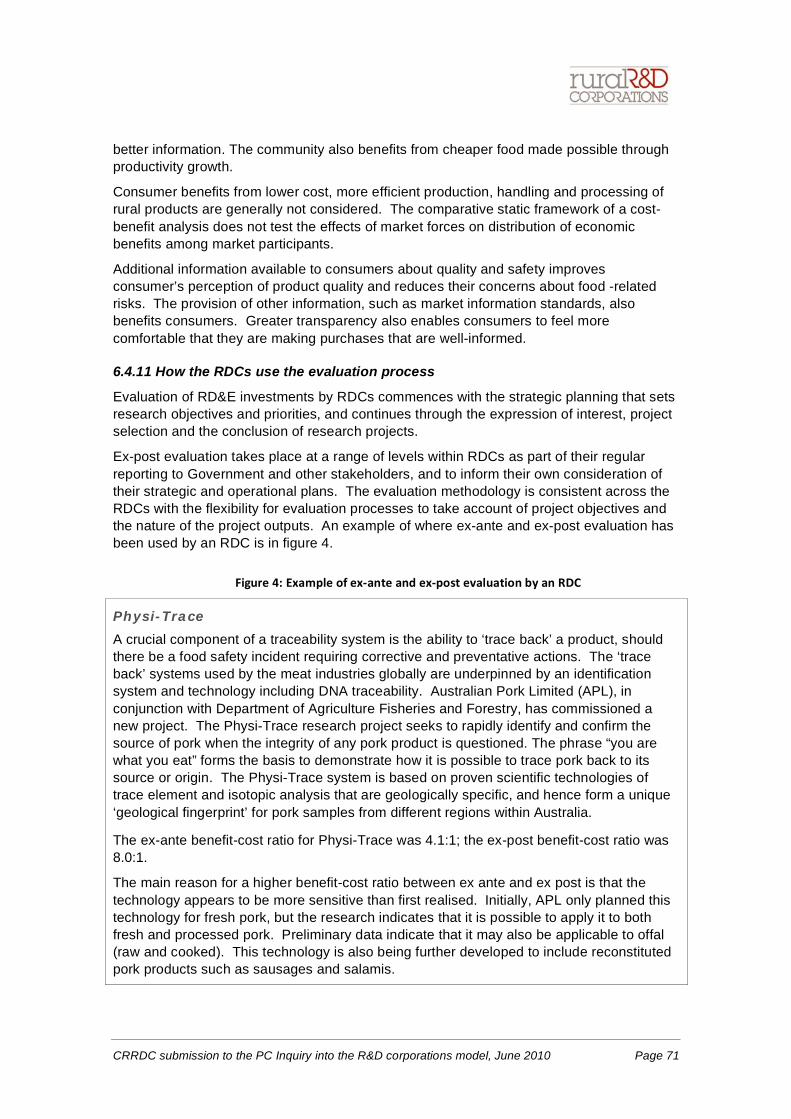
CRRDC submission to the PC Inquiry into the R&D corporations model, June 2010 Page 71
better information. The community also benefits from cheaper food made possible through productivity growth.
Consumer benefits from lower cost, more efficient production, handling and processing of rural products are generally not considered. The comparative static framework of a cost-benefit analysis does not test the effects of market forces on distribution of economic benefits among market participants.
Additional information available to consumers about quality and safety improves consumer’s perception of product quality and reduces their concerns about food -related risks. The provision of other information, such as market information standards, also benefits consumers. Greater transparency also enables consumers to feel more comfortable that they are making purchases that are well-informed.
6.4.11 How the RDCs use the evaluation process
Evaluation of RD&E investments by RDCs commences with the strategic planning that sets research objectives and priorities, and continues through the expression of interest, project selection and the conclusion of research projects.
Ex-post evaluation takes place at a range of levels within RDCs as part of their regular reporting to Government and other stakeholders, and to inform their own consideration of their strategic and operational plans. The evaluation methodology is consistent across the RDCs with the flexibility for evaluation processes to take account of project objectives and the nature of the project outputs. An example of where ex-ante and ex-post evaluation has been used by an RDC is in figure 4.
Physi-Trace
A crucial component of a traceability system is the ability to ‘trace back’ a product, should there be a food safety incident requiring corrective and preventative actions. The ‘trace back’ systems used by the meat industries globally are underpinned by an identification system and technology including DNA traceability. Australian Pork Limited (APL), in conjunction with Department of Agriculture Fisheries and Forestry, has commissioned a new project. The Physi-Trace research project seeks to rapidly identify and confirm the source of pork when the integrity of any pork product is questioned. The phrase “you are what you eat” forms the basis to demonstrate how it is possible to trace pork back to its source or origin. The Physi-Trace system is based on proven scientific technologies of trace element and isotopic analysis that are geologically specific, and hence form a unique ‘geological fingerprint’ for pork samples from different regions within Australia.
The ex-ante benefit-cost ratio for Physi-Trace was 4.1:1; the ex-post benefit-cost ratio was 8.0:1.
The main reason for a higher benefit-cost ratio between ex ante and ex post is that the technology appears to be more sensitive than first realised. Initially, APL only planned this technology for fresh pork, but the research indicates that it is possible to apply it to both fresh and processed pork. Preliminary data indicate that it may also be applicable to offal (raw and cooked). This technology is also being further developed to include reconstituted pork products such as sausages and salamis.
CRRDC submission to the PC Inquiry into the R&D corporations model, June 2010 Page 72
The cost–benefit analyses provide a consistently assembled source of data on a range of factors such as gross benefits, benefit lags, costs and contributions, counter-factual arguments, and other data linking environmental and social benefits with program investments.
The evaluation process provides information that allows the RDCs to address the following areas:
• the extent of the spill-overs between the RDCs and their levy payers that results in benefits accruing beyond the specific industries associated with each RDC
• the incidence of benefits along the supply chain and their impact on industry competitiveness
• the extent of public benefits and their relationship to government-formulated rural research priorities
• the attribution of benefits from collaboration among RDCs in carrying out their RD&E
• the attribution of benefits from collaboration between RDCs and other investors in research and development, including the CRCs, CSIRO, state governments and universities.
Significant differences exist between the RDCs and the industries in which they are operating, implying that comparing results of individual RDC’s evaluation with the aggregated or average return should be treated with caution. Questions of assessing the lessons from any negative returns cannot be adequately addressed from the aggregated figures. This is a matter for each RDC to address within its own portfolio.
In addition, RDC involvement often brings benefits to research projects that are supported through clarifying objectives and project design, and improving coordination with other research. RDC involvement may also permit the scope of a project to be widened and made more comprehensive, and give greater attention to the industry adoption process.
6.5 Extension and adoption
Extension and adoption is a fundamental component of investment in rural research and development to ensure the translation of R&D to practical application along the supply
chain. It is a process by which rural industries to access, adopt and adapt new ideas, science and technologies to boost their productivity, sustainability and competitiveness.
Extension and adoption focuses on achieving changed practices by end-users (rural industry enterprises, local government and landholders) from the adoption of new technologies. It recognises that other users of R&D, including consultants and advisers from public, private and community organisations, extension officers and
natural resources management organisations, all potentially have a role in the translation of R&D outputs so that they can be used effectively by end-users.
The National Primary Industries RD&E Framework, recognising this importance, includes extension as a core element in the overall Framework. The PISC R&D Sub-committee has established a working group on extension and is considering the role the Sub-committee can play in providing national leadership on enhancing extension. This will flow on to the development of both industry and cross-sectoral strategies under the framework.
CRRDC submission to the PC Inquiry into the R&D corporations model, June 2010 Page 73
The RDCs also recognise that extension, adoption, training and education are key factors in capacity-building and that investment in these areas must be allocated at the same time that investment is being considered for R&D. The RDCs already play a strong role in the area of extension and adoption, but there are opportunities for them to play a greater role, particularly as the capacity of state government extension services declines.
The CRRDC has identified that investment in extension and adoption may not have been pursued to its full extent across the RDCs and there is potential for more focused investment in this area. Gaining a picture of the capacity-building environment is helping to identify opportunities for both collaborative and individual initiatives to build skills and capacity in the areas of science, research and innovation.
6.5.1 National RD&E survey
The CRRDC is working with QualDATA to establish the status of the functions of extension, adoption, practice change and capacity-building across the RDCs through a national RD&E survey. The CRC Association has also agreed to support the project through their primary industries, natural resources management and environment-focused CRCs to provide stronger data for informing outcomes. This work aims to create a baseline understanding of the extent to which RD&E organisations are addressing this function as part of their funded programs. QualDATA has proposed that this survey becomes an annual project to establish and assess change over time. It is expected that the benchmarking process will foster change in RD&E activities.
The process is expected to:
• map RDC actions in the areas of extensions and adoption, to provide information on status and progress, assess actual and potential duplication, and define gaps
• establish the potential for further initiatives to better foster extension, adoption, practice change and capacity-building
• establish and review extension and adoption plans for the future, both specific and general
• consider the implications of these findings for corrective action.
6.5.2 Survey methodology
The survey has been developed by QualDATA and circulated to RDCs and relevant CRCs in April 2010. The survey aims to identify:
• how the RDCs link with extension providers, including government, community, business and agribusiness
• how RD&E organisations ensure RD&E is adopted and how they measure practice change and other adoption
• how the RDCs deliver information to end-users
• what initiatives are being undertaken to build human capacity, particularly in relation to PhD students, community skills, formal secondary and tertiary education programs and up-skilling of primary industry workers
• communication, extension and adoption processes related to key target audiences.
A copy of the project outline and survey is at appendix 6.
CRRDC submission to the PC Inquiry into the R&D corporations model, June 2010 Page 74
6.5.3 Survey results
The survey responses included a vast amount of data and resulted in the overall findings being richer than initially expected. A summary of the key findings and overview implications is at appendix 7. A copy of the final report will be available in July 2010.
It is apparent that the role of government agencies as partners is of great concern to the RD&E sector at large, with significant inconsistencies across state agencies. Clearly there are varied levels of focus, interest and ability in the extension, adoption and capacity-building fields. Some issues are clearly sector-dependent; much of it concerns entire national RD&E segments.
The findings also show that while there is considerable commonality amongst the respondents, there are strongly held views on key terms and key concepts. The understanding of adoption and extension terms, their meaning and application (in managing programs and projects and ensuring adoption and practice change) guides strategic and operational thinking at the researcher, research administration/manager, end user and adviser levels across the public and private sectors.
The current variance in perception of these adoption and extension terms and their importance means that it is pertinent to consider whether a common understanding of definitions and their application would prove valuable.
The findings also underline that within the national RD&E sector, responsibility for undertaking R&D is commonly accepted, whereas not all participants accept that they have a role or responsibility to ensure or facilitate the uptake or adoption of R&D outputs to achieve outcomes.
It is clear that programs are essential to build human capacity for individual industries. These programs can come in the form of conferences, symposia, workshops and field days. However there appears to be limited engagement in overarching strategic programs.
There is varied evaluation of the effectiveness of extension and training programs and potentially an underinvestment in social elements of the triple bottom line. Based on this finding, greater collaboration in capacity building could assist cross-fertilisation of ideas, potential roll-out of successful programs across other sectors, and greater strategic investment in rural industry wide programs. This argument is most pronounced in relation to longer term programs which have the potential to create a supply of younger talent.
Clear opportunities have been identified for more collaborative ventures to address duplication and differing levels of skills. The overall capacity-building ‘space’, particularly the supply chain of young people, warrants attention as it is a serious long-term structural issue.
A factor that has been identified as needing significant attention is the need for stronger delivery mechanisms, reduction of duplication, and a focus on intermediary users, including a role for the agribusiness sector as a conduit for delivery to end-users. Rigour in the monitoring, evaluation and reporting discipline appears to be generally lacking and more support is need for researchers and other workers in communicating their R&D outputs.
CRRDC submission to the PC Inquiry into the R&D corporations model, June 2010 Page 75
REFERENCES
ABARE 2010 (Australian Bureau of Agricultural and Resource Economics) Australian Farm Survey Results, 2007–08 to 2009–10, ABARE, Canberra
ABS (1) (Australian Bureau of Statistics) 8112.0, 2004-5, Research and Experimental Development, Australia, All Sector Summary, Oct 2006; and 8104.0, 2005-6, Research and Experimental Development, Business, Australia, Aug 2007.
ABS (2) (Australian Bureau of Statistics) 2008, 7104.0.55.001 - Agriculture in Focus: Farming Families, Australia, 2006, AGPS, Canberra
Alston, J., Andersen, M., James, J. and Pardey, P. 2010, Persistence Pays: US Agricultural Productivity Growth and the Benefits from Public R&D Spending, Springer, New York.
Alston, J.M., Chan-Kang, C., Marra, M.C., Pardey, P.G. and Wyatt, T.J. 2000, ‘A meta-analysis of rates of return to agricultural R&D: ex pede herculem?’, Research Report no. 113, International Food Policy Research Institute, Washington DC.
Alston, J.M., Freebairn, J.W., James, J.S., 2004, ‘Levy Funded Research Choices by Producers and Society. Australian Journal of Agricultural and Resource Economics, vol. 48, no. 1, pp. 33-64.
Alston, J.M., Sexton, R.J. and Zhang, M. 1997, The effects of imperfect competition on the size and distribution of research benefits. American Journal of Agricultural Economics 79 (4): 1252–1265.
Campbell, H. and Bond, K. 1997, ‘The cost of public funds in Australia’, Economic Record, vol. 73, pp. 22–34.
Cox, T., Mullen, J.D., Hu, W.S. 1997, ‘Nonparametric measures of the impact of public research expenditures on Australian broadacre agriculture. Australian Journal of Agricultural and Resource Economics, vol. 41, pp. 333-360.
CRRDC (Council of Rural Research and Development Corporations) 2010, Impact of Investment in Research and Development by the Rural Research and Development Corporations: Year 2 Results, Canberra.
Econtech 2005, Australia’s Farm-Dependent Economy: Analysis of the Role of Agriculture in the Australian Economy, Australian Farm Institute, Surry Hills, Australia.
Mullen, J. 2007, ‘Productivity growth and the returns from public investment in RD&E in Australian broadacre agriculture’, Australian Journal of Agricultural and Resource Economics, vol. 51, no. 4, pp. 359 84.
Mullen, J.D. and Cox, T.L. 1995, ‘The returns from research in Australian broadacre agriculture’. Australian Journal of Agricultural Economics, 39, 105-128.
Mullen, J.D., Lee, K. and Wrigley, S. 1996, ‘Agricultural production research expenditure in Australia: 1953-1994’, NSW Agriculture, Agricultural Economics Bulletin 14, Orange.
Mullen, J.D., and Strappazzon, L., (1996). The relationship between research investment and productivity growth: Australian broadacre agriculture 1953-94, Selected paper at Global Agricultural Science Policy for the 21st Century, 26 August 1996, Melbourne Australia.
CRRDC submission to the PC Inquiry into the R&D corporations model, June 2010 Page 76
Productivity Commission 2007, Public Support for Science and Innovation, Research Report, Canberra.
Sheng, Y., Mullen, J. & Zhao, S. 2010, ‘Has growth in productivity in Australian broadacre agriculture slowed?’, Paper presented to the Australian Agricultural and Resource Economics Society Conference, Adelaide, February 2010.
Traxler G, Byerlee D. 2001, ‘Linking technical change to research effort: an examination of aggregation and spillovers effects’, Agric. Econ. 24:235–46.
Appendix 1:
Statutory Corporations and Industry-owned Company RDCs
CRRDC submission to the PC inquiry into the R&D corporations model, June 2010
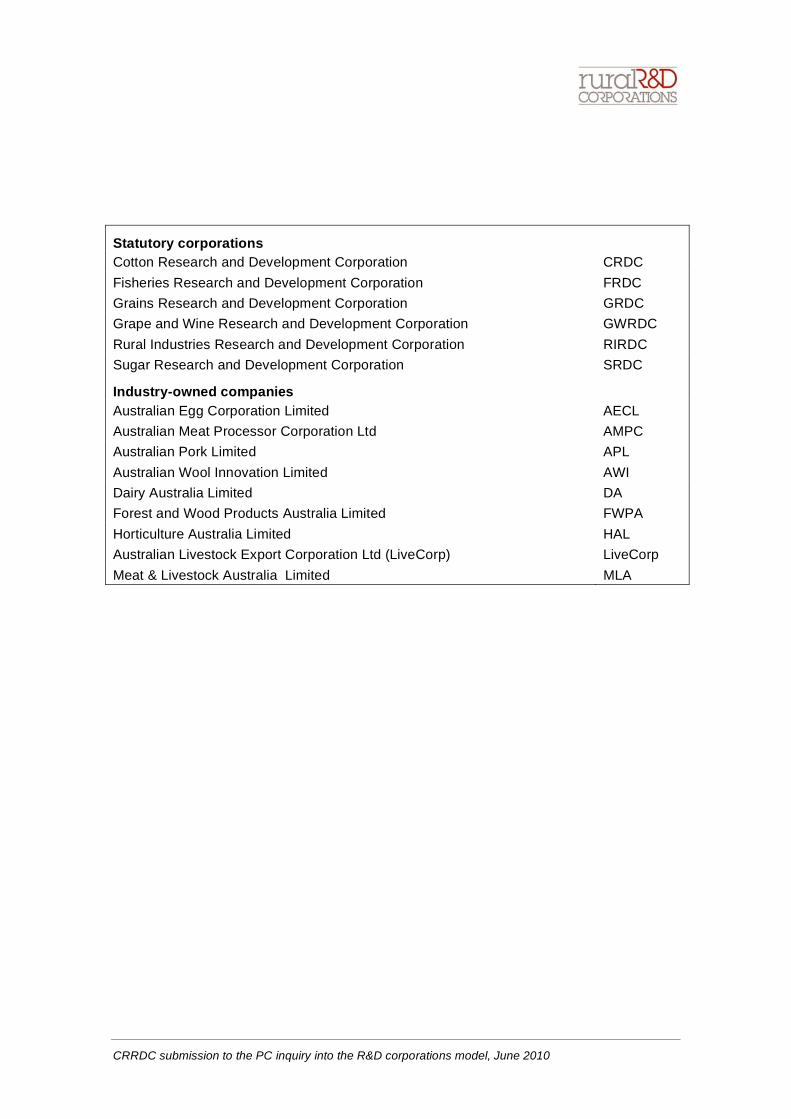
CRRDC submission to the PC inquiry into the R&D corporations model, June 2010
Statutory corporations Cotton Research and Development Corporation CRDC Fisheries Research and Development Corporation FRDC Grains Research and Development Corporation GRDC Grape and Wine Research and Development Corporation GWRDC Rural Industries Research and Development Corporation RIRDC Sugar Research and Development Corporation SRDC
Industry-owned companies Australian Egg Corporation Limited AECL Australian Meat Processor Corporation Ltd AMPC Australian Pork Limited APL Australian Wool Innovation Limited AWI Dairy Australia Limited DA Forest and Wood Products Australia Limited FWPA Horticulture Australia Limited HAL Australian Livestock Export Corporation Ltd (LiveCorp) LiveCorp Meat & Livestock Australia Limited MLA

Appendix 2:
Private investment survey (AFI)
CRRDC submission to the PC inquiry into the R&D corporations model, June 2010
1
A SURVEY OF PRIVATE SECTOR INVESTMENT IN
PRIMARY INDUSTRIES RESEARCH &
DEVELOPMENT (R&D) IN AUSTRALIA
An Australian Farm Institute project, supported by the Council of Chairs of Rural Research and Development Corporations.
March–June 2010
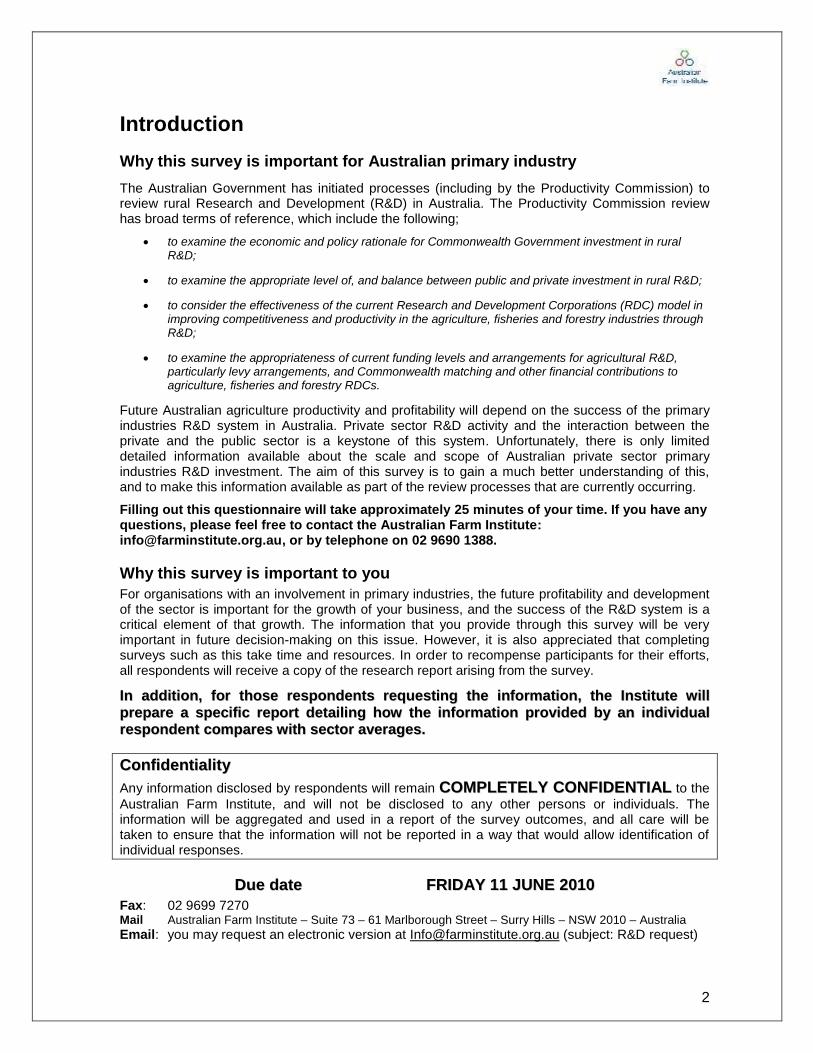
2
Introduction
Why this survey is important for Australian primary industry
The Australian Government has initiated processes (including by the Productivity Commission) to review rural Research and Development (R&D) in Australia. The Productivity Commission review has broad terms of reference, which include the following;
to examine the economic and policy rationale for Commonwealth Government investment in rural R&D;
to examine the appropriate level of, and balance between public and private investment in rural R&D;
to consider the effectiveness of the current Research and Development Corporations (RDC) model in improving competitiveness and productivity in the agriculture, fisheries and forestry industries through R&D;
to examine the appropriateness of current funding levels and arrangements for agricultural R&D, particularly levy arrangements, and Commonwealth matching and other financial contributions to agriculture, fisheries and forestry RDCs.
Future Australian agriculture productivity and profitability will depend on the success of the primary industries R&D system in Australia. Private sector R&D activity and the interaction between the private and the public sector is a keystone of this system. Unfortunately, there is only limited detailed information available about the scale and scope of Australian private sector primary industries R&D investment. The aim of this survey is to gain a much better understanding of this, and to make this information available as part of the review processes that are currently occurring.
Filling out this questionnaire will take approximately 25 minutes of your time. If you have any questions, please feel free to contact the Australian Farm Institute: [email protected], or by telephone on 02 9690 1388.
Why this survey is important to you
For organisations with an involvement in primary industries, the future profitability and development of the sector is important for the growth of your business, and the success of the R&D system is a critical element of that growth. The information that you provide through this survey will be very important in future decision-making on this issue. However, it is also appreciated that completing surveys such as this take time and resources. In order to recompense participants for their efforts, all respondents will receive a copy of the research report arising from the survey.
IInn aaddddiittiioonn,, ffoorr tthhoossee rreessppoonnddeennttss rreeqquueessttiinngg tthhee iinnffoorrmmaattiioonn,, tthhee IInnssttiittuuttee wwiillll
pprreeppaarree aa ssppeecciiffiicc rreeppoorrtt ddeettaaiilliinngg hhooww tthhee iinnffoorrmmaattiioonn pprroovviiddeedd bbyy aann iinnddiivviidduuaall
rreessppoonnddeenntt ccoommppaarreess wwiitthh sseeccttoorr aavveerraaggeess..
CCoonnffiiddeennttiiaalliittyy
Any information disclosed by respondents will remain CCOOMMPPLLEETTEELLYY CCOONNFFIIDDEENNTTIIAALL to the
Australian Farm Institute, and will not be disclosed to any other persons or individuals. The information will be aggregated and used in a report of the survey outcomes, and all care will be taken to ensure that the information will not be reported in a way that would allow identification of individual responses.
DDuuee ddaattee FFRRIIDDAAYY 1111 JJUUNNEE 22001100
Fax: 02 9699 7270 Mail Australian Farm Institute – Suite 73 – 61 Marlborough Street – Surry Hills – NSW 2010 – Australia
Email: you may request an electronic version at [email protected] (subject: R&D request)
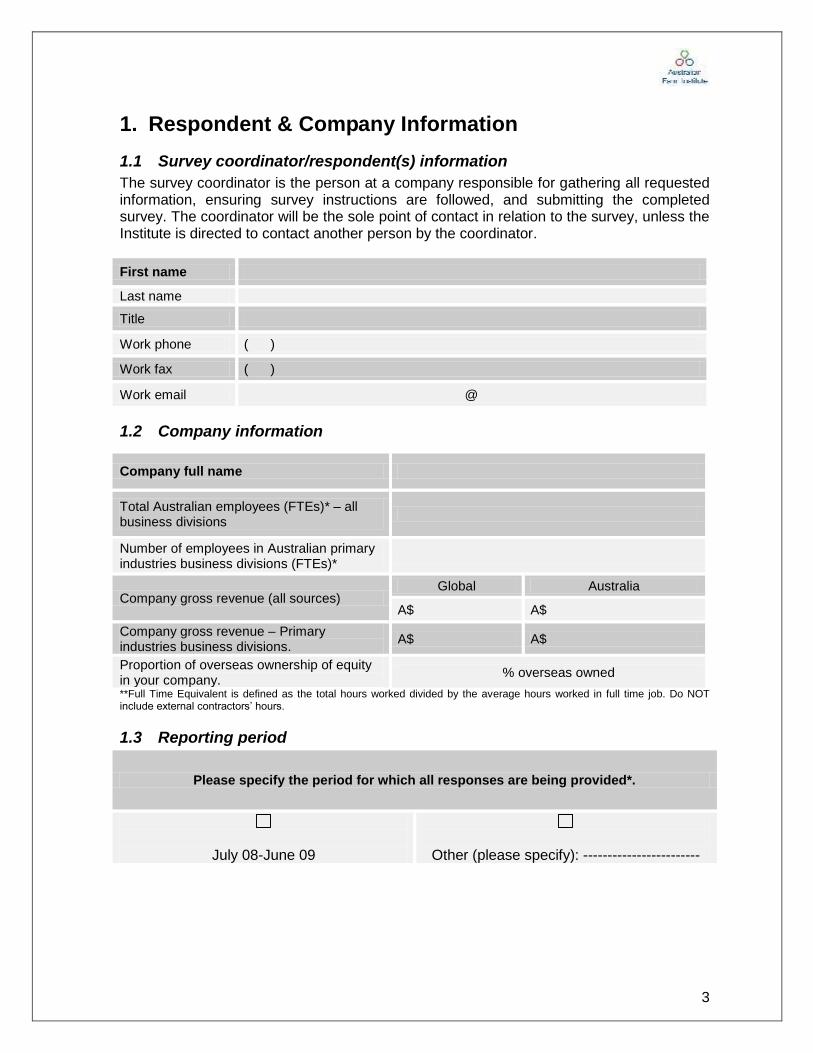
3
1. Respondent & Company Information
1.1 Survey coordinator/respondent(s) information
The survey coordinator is the person at a company responsible for gathering all requested information, ensuring survey instructions are followed, and submitting the completed survey. The coordinator will be the sole point of contact in relation to the survey, unless the Institute is directed to contact another person by the coordinator.
First name
Last name
Title
Work phone ( )
Work fax ( )
Work email @
1.2 Company information
Company full name
Total Australian employees (FTEs)* – all business divisions
Number of employees in Australian primary industries business divisions (FTEs)*
Company gross revenue (all sources) Global Australia
A$ A$
Company gross revenue – Primary industries business divisions.
A$ A$
Proportion of overseas ownership of equity in your company.
% overseas owned
**Full Time Equivalent is defined as the total hours worked divided by the average hours worked in full time job. Do NOT include external contractors’ hours.
1.3 Reporting period
Please specify the period for which all responses are being provided*.
July 08-June 09
Other (please specify): ------------------------
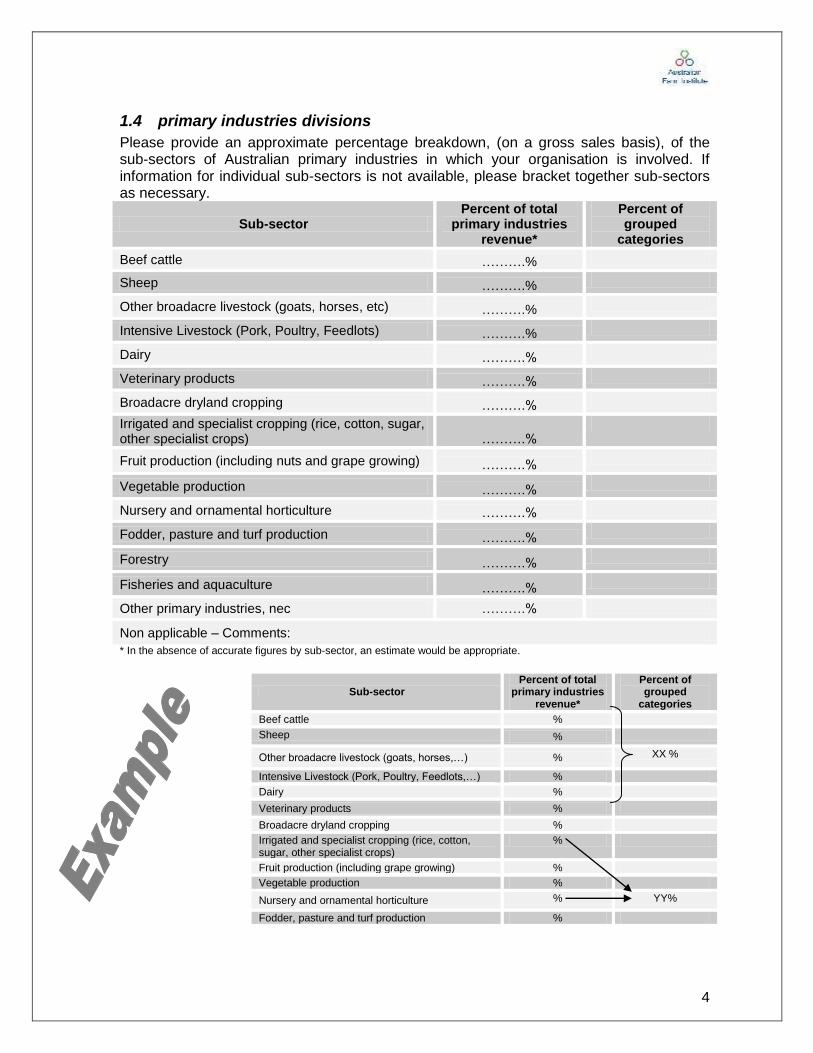
4
1.4 primary industries divisions
Please provide an approximate percentage breakdown, (on a gross sales basis), of the sub-sectors of Australian primary industries in which your organisation is involved. If information for individual sub-sectors is not available, please bracket together sub-sectors as necessary.
Sub-sector Percent of total
primary industries revenue*
Percent of grouped
categories
Beef cattle ……….%
Sheep ……….%
Other broadacre livestock (goats, horses, etc) ……….%
Intensive Livestock (Pork, Poultry, Feedlots) ……….%
Dairy ……….%
Veterinary products ……….%
Broadacre dryland cropping ……….%
Irrigated and specialist cropping (rice, cotton, sugar, other specialist crops) ……….%
Fruit production (including nuts and grape growing) ……….%
Vegetable production ……….%
Nursery and ornamental horticulture ……….%
Fodder, pasture and turf production ……….%
Forestry ……….%
Fisheries and aquaculture ……….%
Other primary industries, nec ……….%
Non applicable – Comments:
* In the absence of accurate figures by sub-sector, an estimate would be appropriate.
Sub-sector Percent of total
primary industries revenue*
Percent of grouped
categories
Beef cattle %
Sheep %
Other broadacre livestock (goats, horses,…) % XX %
Intensive Livestock (Pork, Poultry, Feedlots,…) %
Dairy %
Veterinary products %
Broadacre dryland cropping %
Irrigated and specialist cropping (rice, cotton, sugar, other specialist crops)
%
Fruit production (including grape growing) %
Vegetable production %
Nursery and ornamental horticulture % YY%
Fodder, pasture and turf production %
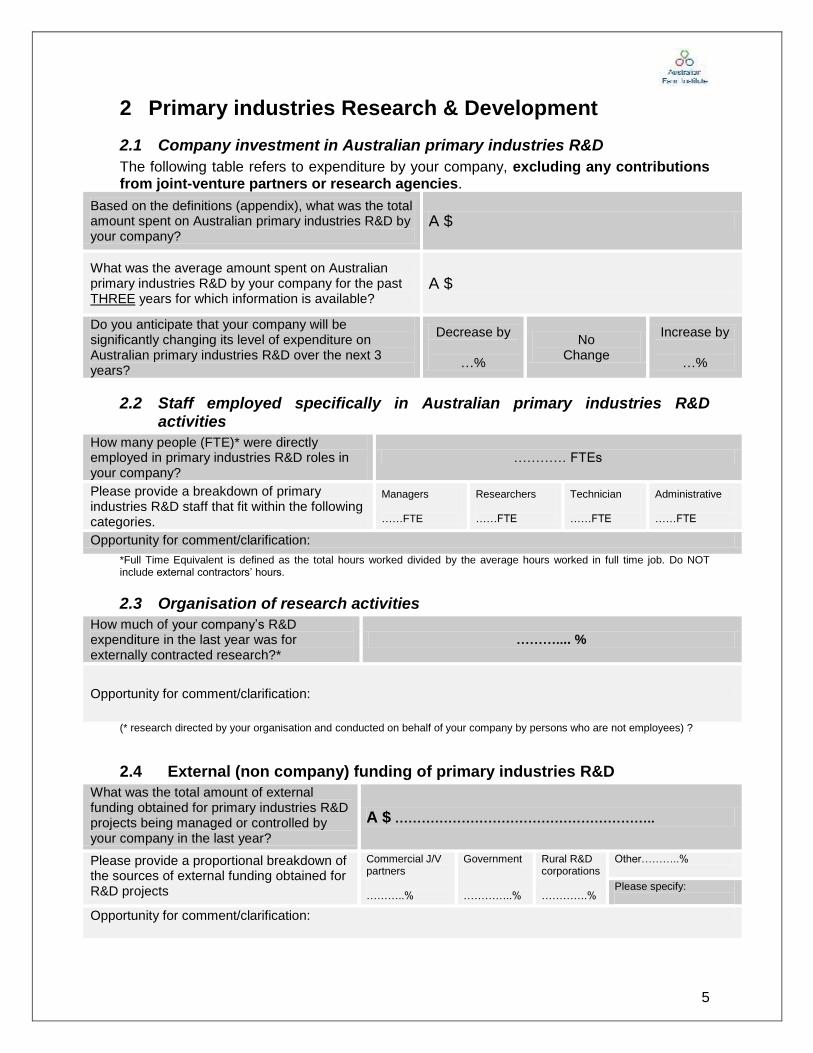
5
2 Primary industries Research & Development
2.1 Company investment in Australian primary industries R&D
The following table refers to expenditure by your company, excluding any contributions from joint-venture partners or research agencies.
Based on the definitions (appendix), what was the total amount spent on Australian primary industries R&D by your company?
A $
What was the average amount spent on Australian primary industries R&D by your company for the past THREE years for which information is available?
A $
Do you anticipate that your company will be significantly changing its level of expenditure on Australian primary industries R&D over the next 3 years?
Decrease by
…%
No Change
Increase by
…%
2.2 Staff employed specifically in Australian primary industries R&D activities
How many people (FTE)* were directly employed in primary industries R&D roles in your company?
………… FTEs
Please provide a breakdown of primary industries R&D staff that fit within the following categories.
Managers ……FTE
Researchers ……FTE
Technician ……FTE
Administrative ……FTE
Opportunity for comment/clarification:
*Full Time Equivalent is defined as the total hours worked divided by the average hours worked in full time job. Do NOT include external contractors’ hours.
2.3 Organisation of research activities
How much of your company’s R&D expenditure in the last year was for externally contracted research?*
……….... %
Opportunity for comment/clarification:
(* research directed by your organisation and conducted on behalf of your company by persons who are not employees) ?
2.4 External (non company) funding of primary industries R&D
What was the total amount of external funding obtained for primary industries R&D projects being managed or controlled by your company in the last year?
A $ …………………………………………………..
Please provide a proportional breakdown of the sources of external funding obtained for R&D projects
Commercial J/V partners ………..%
Government …………..%
Rural R&D corporations ………….%
Other………..%
Please specify:
Opportunity for comment/clarification:
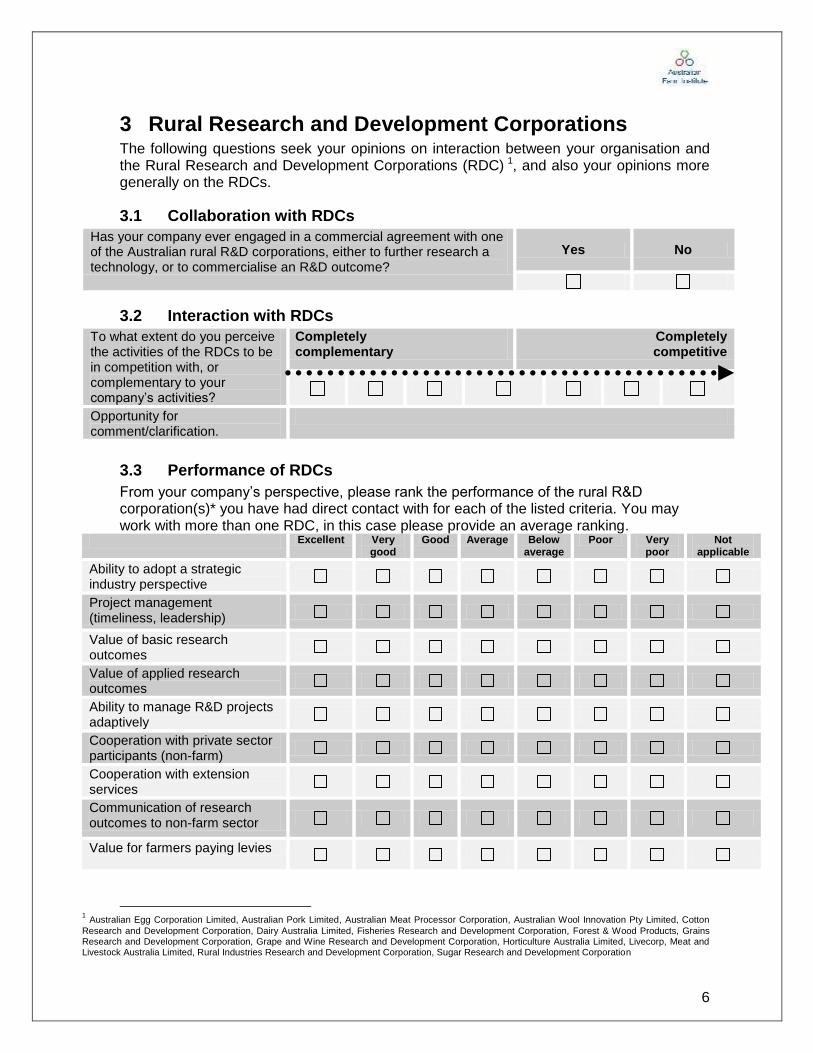
6
3 Rural Research and Development Corporations The following questions seek your opinions on interaction between your organisation and the Rural Research and Development Corporations (RDC) 1, and also your opinions more generally on the RDCs.
3.1 Collaboration with RDCs
Has your company ever engaged in a commercial agreement with one of the Australian rural R&D corporations, either to further research a technology, or to commercialise an R&D outcome?
Yes No
3.2 Interaction with RDCs
To what extent do you perceive the activities of the RDCs to be in competition with, or complementary to your company’s activities?
Completely complementary
Completely competitive
Opportunity for comment/clarification.
3.3 Performance of RDCs
From your company’s perspective, please rank the performance of the rural R&D corporation(s)* you have had direct contact with for each of the listed criteria. You may work with more than one RDC, in this case please provide an average ranking.
Excellent Very good
Good Average Below average
Poor Very poor
Not applicable
Ability to adopt a strategic industry perspective
Project management (timeliness, leadership)
Value of basic research outcomes
Value of applied research outcomes
Ability to manage R&D projects adaptively
Cooperation with private sector participants (non-farm)
Cooperation with extension services
Communication of research outcomes to non-farm sector
Value for farmers paying levies
1 Australian Egg Corporation Limited, Australian Pork Limited, Australian Meat Processor Corporation, Australian Wool Innovation Pty Limited, Cotton
Research and Development Corporation, Dairy Australia Limited, Fisheries Research and Development Corporation, Forest & Wood Products, Grains Research and Development Corporation, Grape and Wine Research and Development Corporation, Horticulture Australia Limited, Livecorp, Meat and Livestock Australia Limited, Rural Industries Research and Development Corporation, Sugar Research and Development Corporation
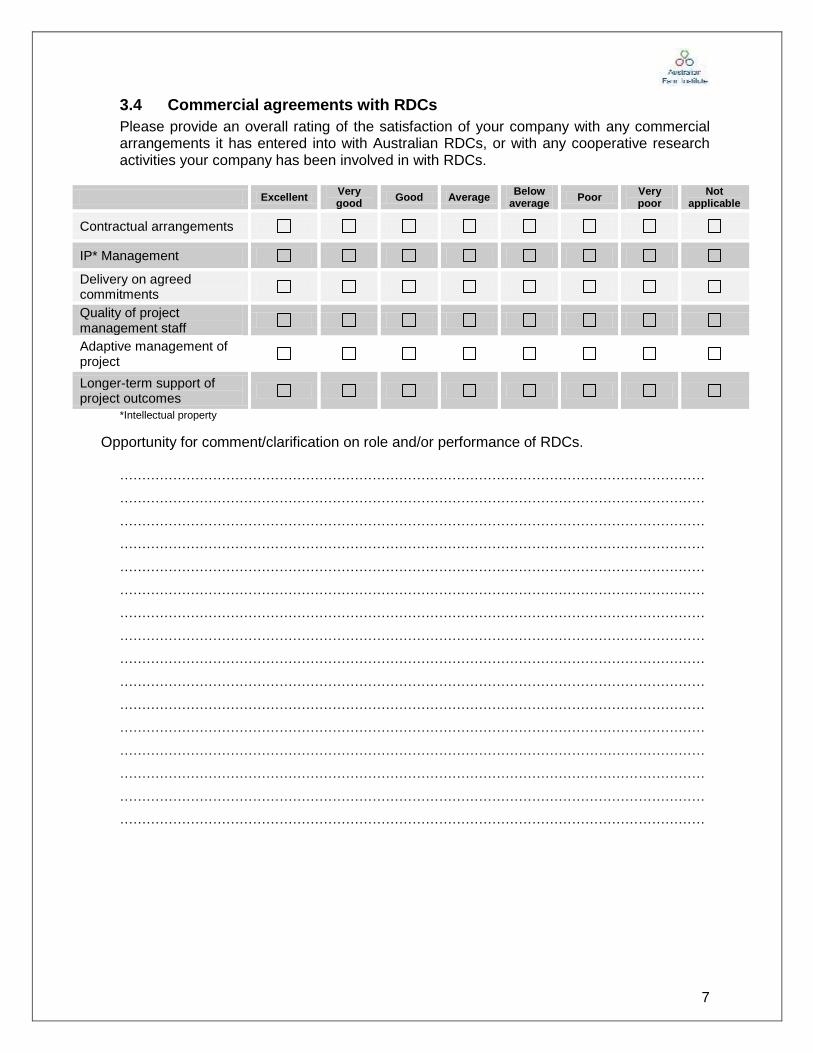
7
3.4 Commercial agreements with RDCs
Please provide an overall rating of the satisfaction of your company with any commercial arrangements it has entered into with Australian RDCs, or with any cooperative research activities your company has been involved in with RDCs.
Excellent Very good
Good Average Below
average Poor
Very poor
Not applicable
Contractual arrangements
IP* Management
Delivery on agreed commitments
Quality of project management staff
Adaptive management of project
Longer-term support of project outcomes
*Intellectual property
Opportunity for comment/clarification on role and/or performance of RDCs. ……………………………………………………………………………………………………………………
……………………………………………………………………………………………………………………
……………………………………………………………………………………………………………………
……………………………………………………………………………………………………………………
……………………………………………………………………………………………………………………
……………………………………………………………………………………………………………………
……………………………………………………………………………………………………………………
……………………………………………………………………………………………………………………
……………………………………………………………………………………………………………………
……………………………………………………………………………………………………………………
……………………………………………………………………………………………………………………
……………………………………………………………………………………………………………………
……………………………………………………………………………………………………………………
……………………………………………………………………………………………………………………
……………………………………………………………………………………………………………………
……………………………………………………………………………………………………………………
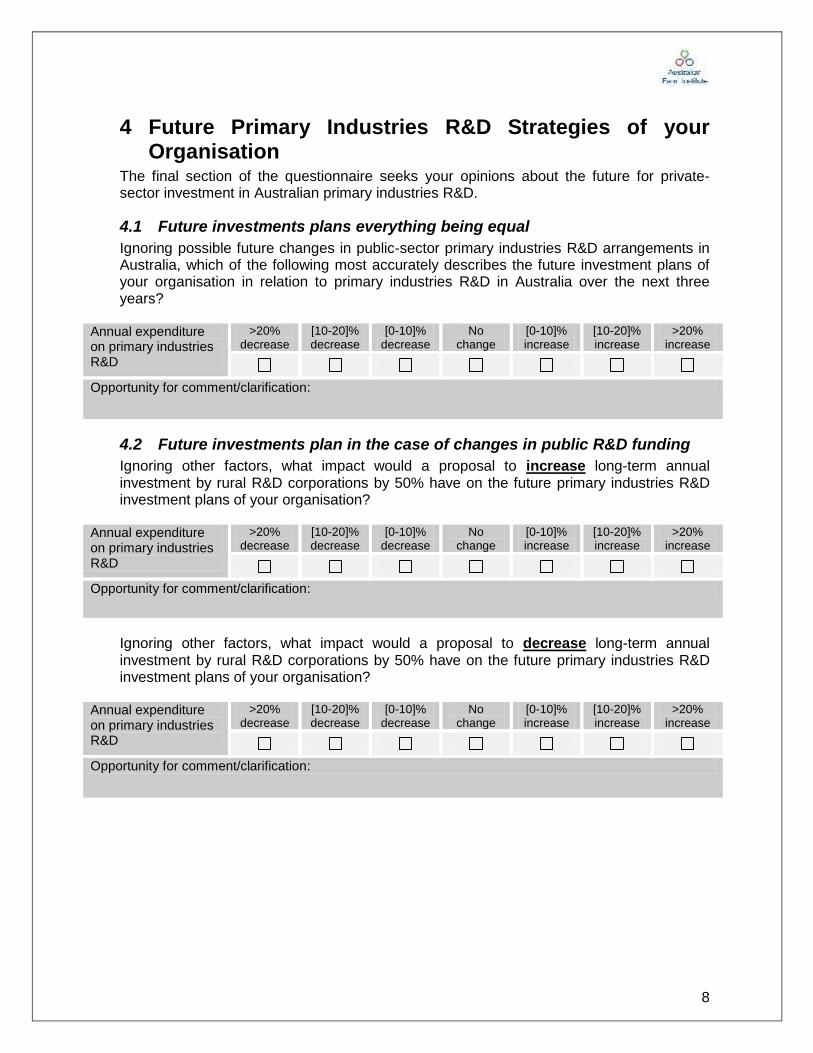
8
4 Future Primary Industries R&D Strategies of your Organisation
The final section of the questionnaire seeks your opinions about the future for private-sector investment in Australian primary industries R&D.
4.1 Future investments plans everything being equal
Ignoring possible future changes in public-sector primary industries R&D arrangements in Australia, which of the following most accurately describes the future investment plans of your organisation in relation to primary industries R&D in Australia over the next three years?
Annual expenditure on primary industries R&D
>20% decrease
[10-20]% decrease
[0-10]% decrease
No change
[0-10]% increase
[10-20]% increase
>20% increase
Opportunity for comment/clarification:
4.2 Future investments plan in the case of changes in public R&D funding
Ignoring other factors, what impact would a proposal to increase long-term annual investment by rural R&D corporations by 50% have on the future primary industries R&D investment plans of your organisation?
Annual expenditure on primary industries R&D
>20% decrease
[10-20]% decrease
[0-10]% decrease
No change
[0-10]% increase
[10-20]% increase
>20% increase
Opportunity for comment/clarification:
Ignoring other factors, what impact would a proposal to decrease long-term annual investment by rural R&D corporations by 50% have on the future primary industries R&D investment plans of your organisation?
Annual expenditure on primary industries R&D
>20% decrease
[10-20]% decrease
[0-10]% decrease
No change
[0-10]% increase
[10-20]% increase
>20% increase
Opportunity for comment/clarification:
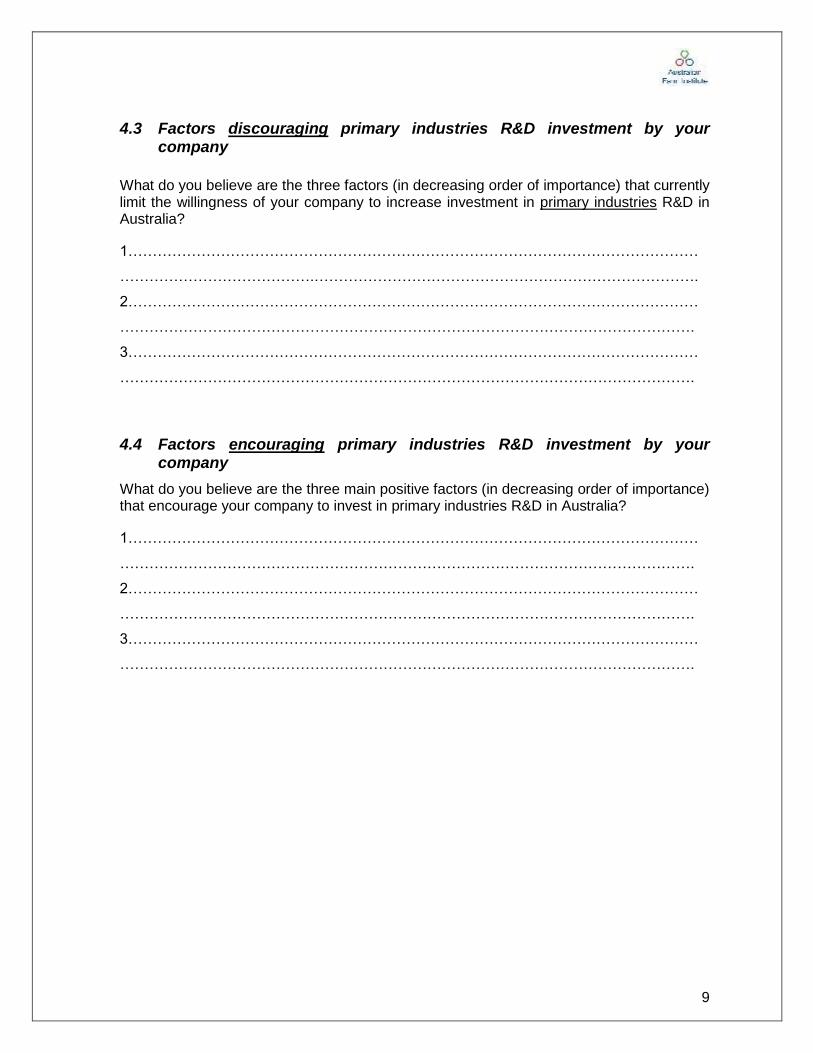
9
4.3 Factors discouraging primary industries R&D investment by your company
What do you believe are the three factors (in decreasing order of importance) that currently limit the willingness of your company to increase investment in primary industries R&D in Australia?
1………………………………………………………………………………………………………
………………………………….…………………………………………………………………….
2………………………………………………………………………………………………………
……………………………………………………………………………………………………….
3………………………………………………………………………………………………………
……………………………………………………………………………………………………….
4.4 Factors encouraging primary industries R&D investment by your company
What do you believe are the three main positive factors (in decreasing order of importance) that encourage your company to invest in primary industries R&D in Australia?
1………………………………………………………………………………………………………
……………………………………………………………………………………………………….
2………………………………………………………………………………………………………
……………………………………………………………………………………………………….
3………………………………………………………………………………………………………
……………………………………………………………………………………………………….
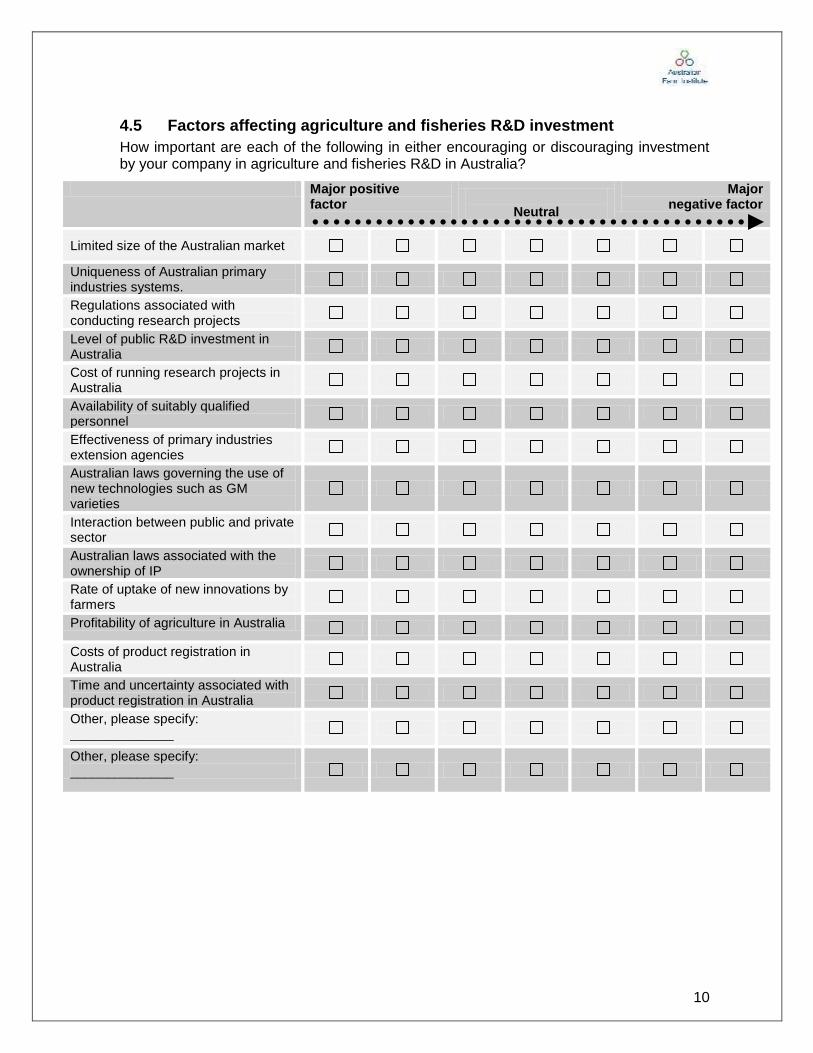
10
4.5 Factors affecting agriculture and fisheries R&D investment
How important are each of the following in either encouraging or discouraging investment by your company in agriculture and fisheries R&D in Australia?
Major positive factor
Neutral
Major negative factor
Limited size of the Australian market
Uniqueness of Australian primary industries systems.
Regulations associated with conducting research projects
Level of public R&D investment in Australia
Cost of running research projects in Australia
Availability of suitably qualified personnel
Effectiveness of primary industries extension agencies
Australian laws governing the use of new technologies such as GM varieties
Interaction between public and private sector
Australian laws associated with the ownership of IP
Rate of uptake of new innovations by farmers
Profitability of agriculture in Australia
Costs of product registration in Australia
Time and uncertainty associated with product registration in Australia
Other, please specify: ______________
Other, please specify: ______________
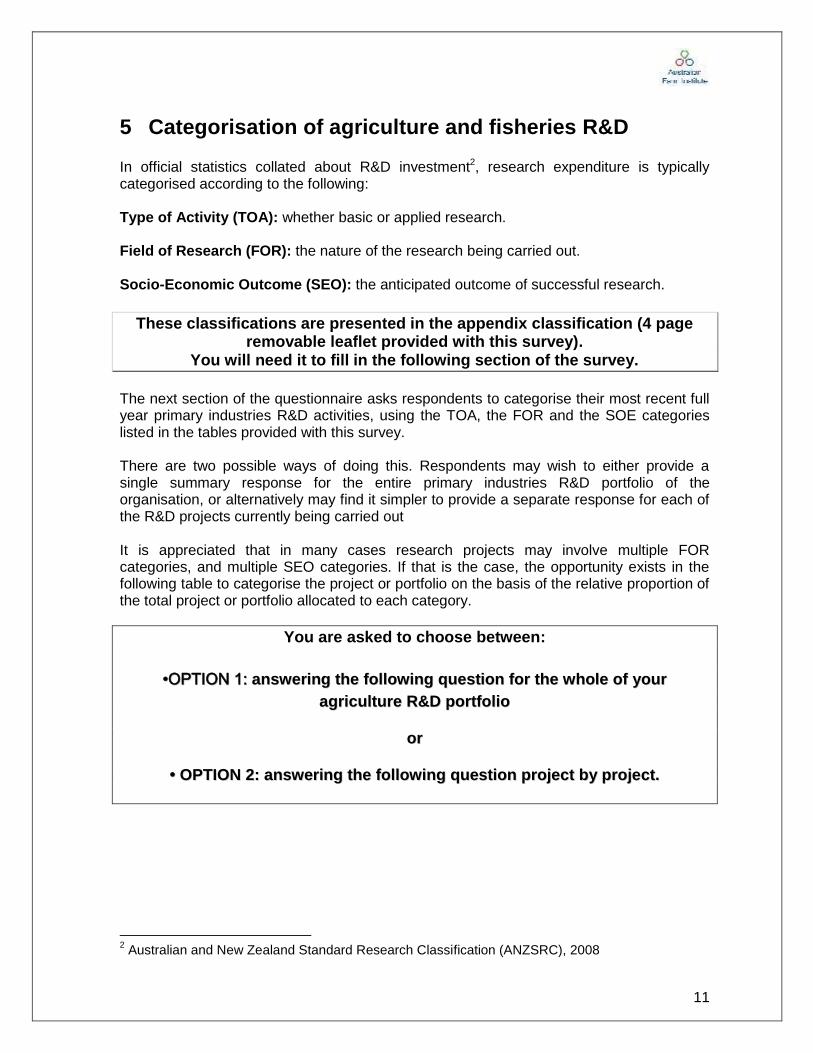
11
5 Categorisation of agriculture and fisheries R&D
In official statistics collated about R&D investment2, research expenditure is typically categorised according to the following: Type of Activity (TOA): whether basic or applied research. Field of Research (FOR): the nature of the research being carried out. Socio-Economic Outcome (SEO): the anticipated outcome of successful research.
These classifications are presented in the appendix classification (4 page removable leaflet provided with this survey).
You will need it to fill in the following section of the survey.
The next section of the questionnaire asks respondents to categorise their most recent full year primary industries R&D activities, using the TOA, the FOR and the SOE categories listed in the tables provided with this survey. There are two possible ways of doing this. Respondents may wish to either provide a single summary response for the entire primary industries R&D portfolio of the organisation, or alternatively may find it simpler to provide a separate response for each of the R&D projects currently being carried out It is appreciated that in many cases research projects may involve multiple FOR categories, and multiple SEO categories. If that is the case, the opportunity exists in the following table to categorise the project or portfolio on the basis of the relative proportion of the total project or portfolio allocated to each category.
You are asked to choose between:
••OOPPTTIIOONN 11:: aannsswweerriinngg tthhee ffoolllloowwiinngg qquueessttiioonn ffoorr tthhee wwhhoollee ooff yyoouurr
aaggrriiccuullttuurree RR&&DD ppoorrttffoolliioo
oorr
•• OOPPTTIIOONN 22:: aannsswweerriinngg tthhee ffoolllloowwiinngg qquueessttiioonn pprroojjeecctt bbyy pprroojjeecctt..
2 Australian and New Zealand Standard Research Classification (ANZSRC), 2008
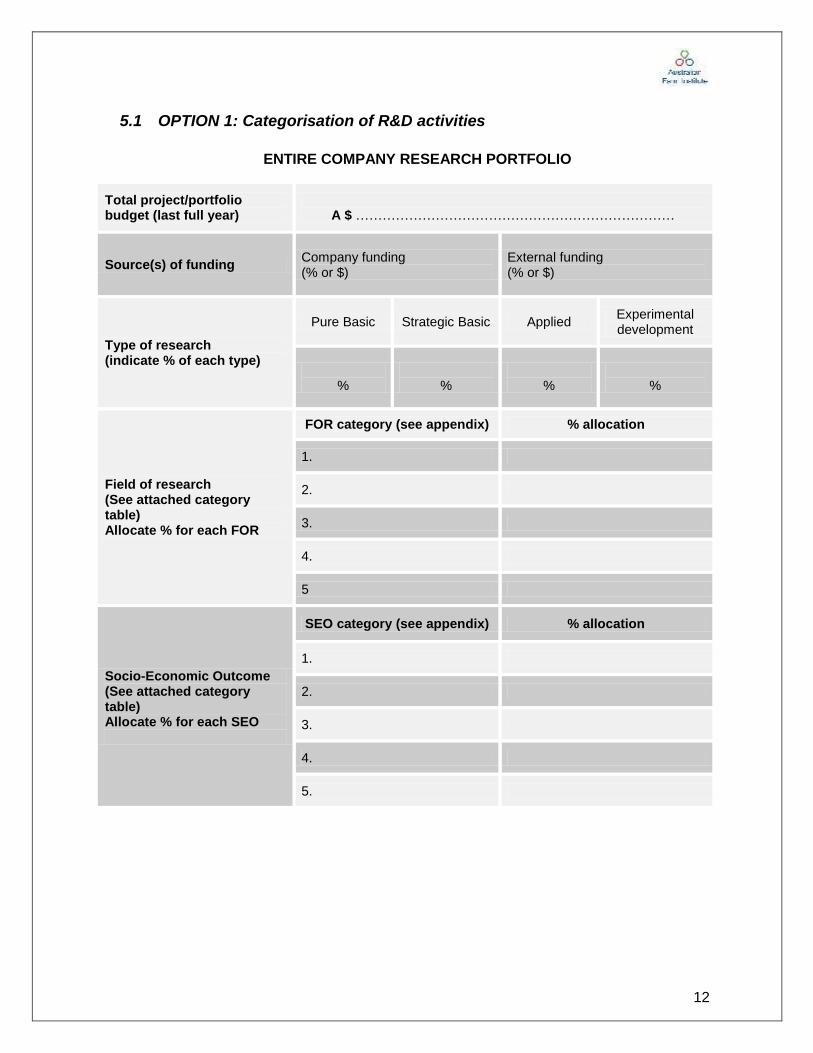
12
5.1 OPTION 1: Categorisation of R&D activities
ENTIRE COMPANY RESEARCH PORTFOLIO
Total project/portfolio budget (last full year)
A $ ………………………………………………………………
Source(s) of funding Company funding (% or $)
External funding (% or $)
Type of research (indicate % of each type)
Pure Basic Strategic Basic Applied Experimental development
%
%
%
%
Field of research (See attached category table) Allocate % for each FOR
FOR category (see appendix) % allocation
1.
2.
3.
4.
5
Socio-Economic Outcome (See attached category table) Allocate % for each SEO
SEO category (see appendix) % allocation
1.
2.
3.
4.
5.
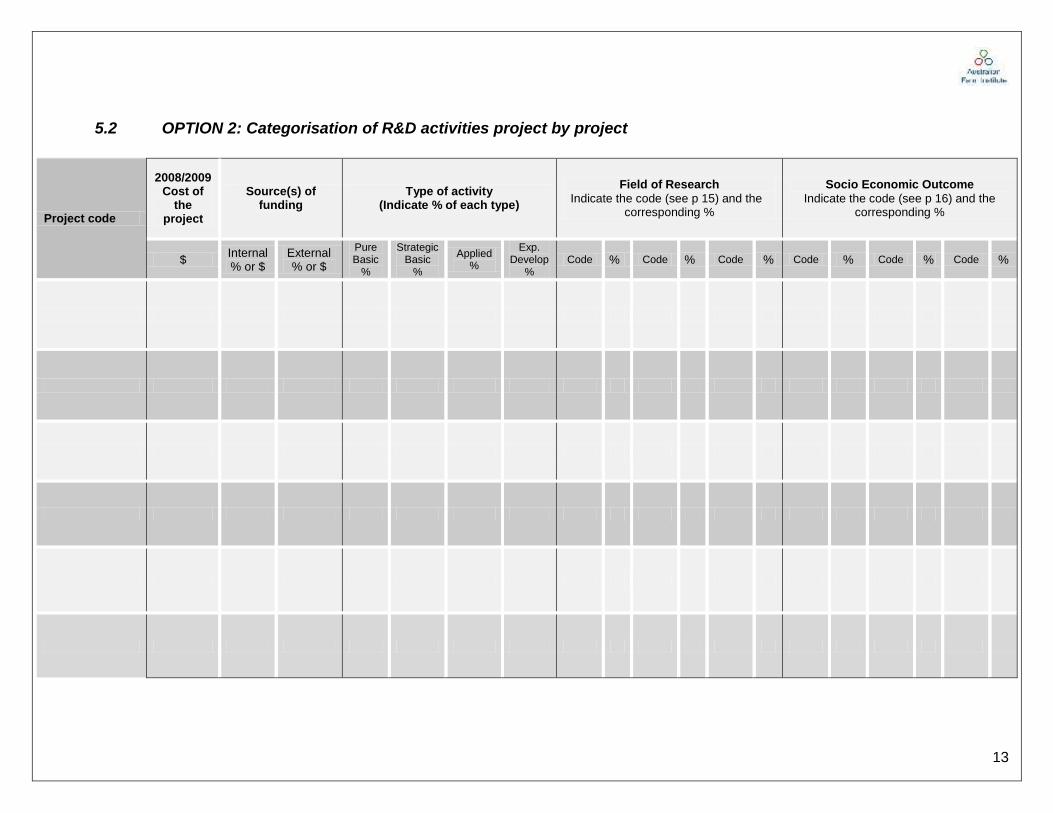
13
5.2 OPTION 2: Categorisation of R&D activities project by project
Project code
2008/2009 Cost of
the project
Source(s) of funding
Type of activity (Indicate % of each type)
Field of Research
Indicate the code (see p 15) and the corresponding %
Socio Economic Outcome
Indicate the code (see p 16) and the corresponding %
$ Internal % or $
External % or $
Pure Basic
%
Strategic Basic
%
Applied %
Exp. Develop
% Code % Code % Code % Code % Code % Code %

14
6 Conclusions and Comments Please provide any relevant comments you would like to make about the issues raised above that you feel are not adequately addressed in the questionnaire or that you feel need further explanation. ……………………………………………………………………………………………………….
……………………………………………………………………………………………………….
……………………………………………………………………………………………………….
……………………………………………………………………………………………………….
……………………………………………………………………………………………………….
……………………………………………………………………………………………………….
……………………………………………………………………………………………………….
……………………………………………………………………………………………………….
……………………………………………………………………………………………………….
……………………………………………………………………………………………………….
……………………………………………………………………………………………………….
……………………………………………………………………………………………………….
……………………………………………………………………………………………………….
……………………………………………………………………………………………………….
……………………………………………………………………………………………………….
……………………………………………………………………………………………………….
……………………………………………………………………………………………………….
……………………………………………………………………………………………………….
……………………………………………………………………………………………………….
……………………………………………………………………………………………………….
……………………………………………………………………………………………………….
……………………………………………………………………………………………………….
……………………………………………………………………………………………………….
……………………………………………………………………………………………………….
……………………………………………………………………………………………………….
……………………………………………………………………………………………………….
Appendix 3:
CRRDC 2010 collaboration report — extract
CRRDC submission to the PC inquiry into the R&D corporations model, June 2010
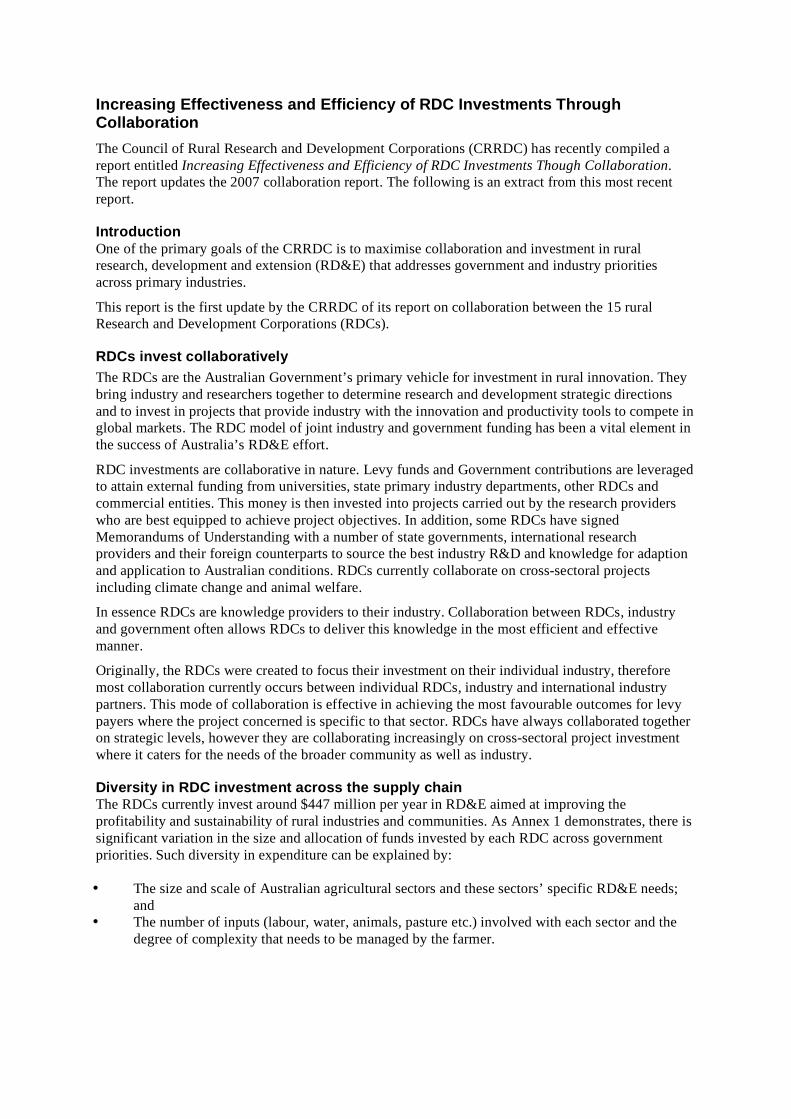
Increasing Effectiveness and Efficiency of RDC Investments Through Collaboration The Council of Rural Research and Development Corporations (CRRDC) has recently compiled a report entitled Increasing Effectiveness and Efficiency of RDC Investments Though Collaboration. The report updates the 2007 collaboration report. The following is an extract from this most recent report.
Introduction One of the primary goals of the CRRDC is to maximise collaboration and investment in rural research, development and extension (RD&E) that addresses government and industry priorities across primary industries.
This report is the first update by the CRRDC of its report on collaboration between the 15 rural Research and Development Corporations (RDCs).
RDCs invest collaboratively The RDCs are the Australian Government’s primary vehicle for investment in rural innovation. They bring industry and researchers together to determine research and development strategic directions and to invest in projects that provide industry with the innovation and productivity tools to compete in global markets. The RDC model of joint industry and government funding has been a vital element in the success of Australia’s RD&E effort.
RDC investments are collaborative in nature. Levy funds and Government contributions are leveraged to attain external funding from universities, state primary industry departments, other RDCs and commercial entities. This money is then invested into projects carried out by the research providers who are best equipped to achieve project objectives. In addition, some RDCs have signed Memorandums of Understanding with a number of state governments, international research providers and their foreign counterparts to source the best industry R&D and knowledge for adaption and application to Australian conditions. RDCs currently collaborate on cross-sectoral projects including climate change and animal welfare.
In essence RDCs are knowledge providers to their industry. Collaboration between RDCs, industry and government often allows RDCs to deliver this knowledge in the most efficient and effective manner.
Originally, the RDCs were created to focus their investment on their individual industry, therefore most collaboration currently occurs between individual RDCs, industry and international industry partners. This mode of collaboration is effective in achieving the most favourable outcomes for levy payers where the project concerned is specific to that sector. RDCs have always collaborated together on strategic levels, however they are collaborating increasingly on cross-sectoral project investment where it caters for the needs of the broader community as well as industry.
Diversity in RDC investment across the supply chain The RDCs currently invest around $447 million per year in RD&E aimed at improving the profitability and sustainability of rural industries and communities. As Annex 1 demonstrates, there is significant variation in the size and allocation of funds invested by each RDC across government priorities. Such diversity in expenditure can be explained by: • The size and scale of Australian agricultural sectors and these sectors’ specific RD&E needs;
and • The number of inputs (labour, water, animals, pasture etc.) involved with each sector and the
degree of complexity that needs to be managed by the farmer.
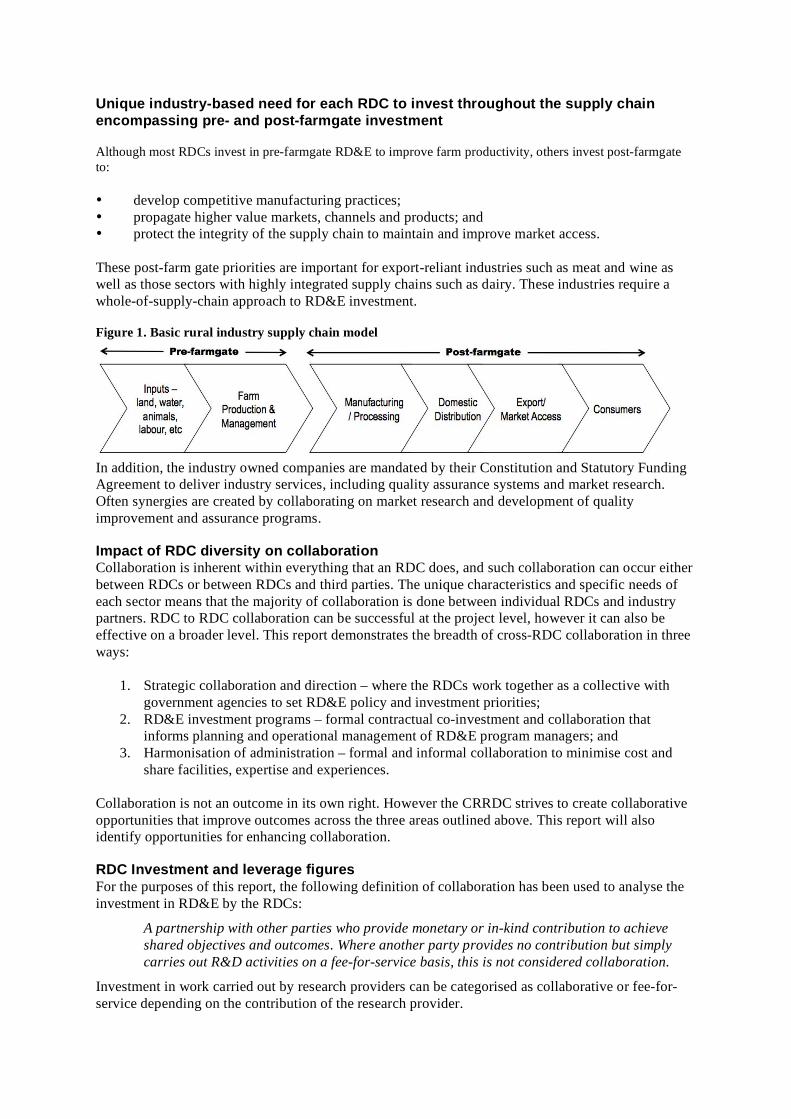
Unique industry-based need for each RDC to invest throughout the supply chain encompassing pre- and post-farmgate investment Although most RDCs invest in pre-farmgate RD&E to improve farm productivity, others invest post-farmgate to: • develop competitive manufacturing practices; • propagate higher value markets, channels and products; and • protect the integrity of the supply chain to maintain and improve market access. These post-farm gate priorities are important for export-reliant industries such as meat and wine as well as those sectors with highly integrated supply chains such as dairy. These industries require a whole-of-supply-chain approach to RD&E investment. Figure 1. Basic rural industry supply chain model
In addition, the industry owned companies are mandated by their Constitution and Statutory Funding Agreement to deliver industry services, including quality assurance systems and market research. Often synergies are created by collaborating on market research and development of quality improvement and assurance programs.
Impact of RDC diversity on collaboration Collaboration is inherent within everything that an RDC does, and such collaboration can occur either between RDCs or between RDCs and third parties. The unique characteristics and specific needs of each sector means that the majority of collaboration is done between individual RDCs and industry partners. RDC to RDC collaboration can be successful at the project level, however it can also be effective on a broader level. This report demonstrates the breadth of cross-RDC collaboration in three ways:
1. Strategic collaboration and direction – where the RDCs work together as a collective with government agencies to set RD&E policy and investment priorities;
2. RD&E investment programs – formal contractual co-investment and collaboration that informs planning and operational management of RD&E program managers; and
3. Harmonisation of administration – formal and informal collaboration to minimise cost and share facilities, expertise and experiences.
Collaboration is not an outcome in its own right. However the CRRDC strives to create collaborative opportunities that improve outcomes across the three areas outlined above. This report will also identify opportunities for enhancing collaboration.
RDC Investment and leverage figures For the purposes of this report, the following definition of collaboration has been used to analyse the investment in RD&E by the RDCs:
A partnership with other parties who provide monetary or in-kind contribution to achieve shared objectives and outcomes. Where another party provides no contribution but simply carries out R&D activities on a fee-for-service basis, this is not considered collaboration.
Investment in work carried out by research providers can be categorised as collaborative or fee-for-service depending on the contribution of the research provider.
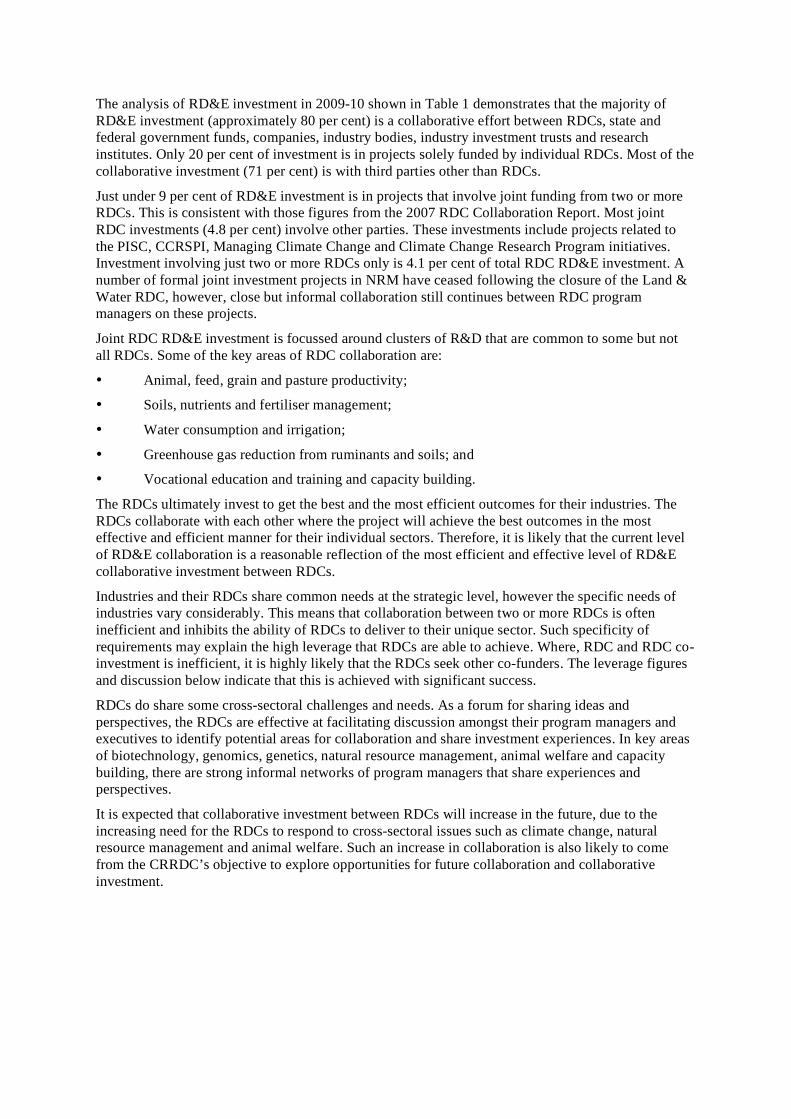
The analysis of RD&E investment in 2009-10 shown in Table 1 demonstrates that the majority of RD&E investment (approximately 80 per cent) is a collaborative effort between RDCs, state and federal government funds, companies, industry bodies, industry investment trusts and research institutes. Only 20 per cent of investment is in projects solely funded by individual RDCs. Most of the collaborative investment (71 per cent) is with third parties other than RDCs.
Just under 9 per cent of RD&E investment is in projects that involve joint funding from two or more RDCs. This is consistent with those figures from the 2007 RDC Collaboration Report. Most joint RDC investments (4.8 per cent) involve other parties. These investments include projects related to the PISC, CCRSPI, Managing Climate Change and Climate Change Research Program initiatives. Investment involving just two or more RDCs only is 4.1 per cent of total RDC RD&E investment. A number of formal joint investment projects in NRM have ceased following the closure of the Land & Water RDC, however, close but informal collaboration still continues between RDC program managers on these projects.
Joint RDC RD&E investment is focussed around clusters of R&D that are common to some but not all RDCs. Some of the key areas of RDC collaboration are:
• Animal, feed, grain and pasture productivity;
• Soils, nutrients and fertiliser management;
• Water consumption and irrigation;
• Greenhouse gas reduction from ruminants and soils; and
• Vocational education and training and capacity building.
The RDCs ultimately invest to get the best and the most efficient outcomes for their industries. The RDCs collaborate with each other where the project will achieve the best outcomes in the most effective and efficient manner for their individual sectors. Therefore, it is likely that the current level of RD&E collaboration is a reasonable reflection of the most efficient and effective level of RD&E collaborative investment between RDCs.
Industries and their RDCs share common needs at the strategic level, however the specific needs of industries vary considerably. This means that collaboration between two or more RDCs is often inefficient and inhibits the ability of RDCs to deliver to their unique sector. Such specificity of requirements may explain the high leverage that RDCs are able to achieve. Where, RDC and RDC co-investment is inefficient, it is highly likely that the RDCs seek other co-funders. The leverage figures and discussion below indicate that this is achieved with significant success.
RDCs do share some cross-sectoral challenges and needs. As a forum for sharing ideas and perspectives, the RDCs are effective at facilitating discussion amongst their program managers and executives to identify potential areas for collaboration and share investment experiences. In key areas of biotechnology, genomics, genetics, natural resource management, animal welfare and capacity building, there are strong informal networks of program managers that share experiences and perspectives.
It is expected that collaborative investment between RDCs will increase in the future, due to the increasing need for the RDCs to respond to cross-sectoral issues such as climate change, natural resource management and animal welfare. Such an increase in collaboration is also likely to come from the CRRDC’s objective to explore opportunities for future collaboration and collaborative investment.
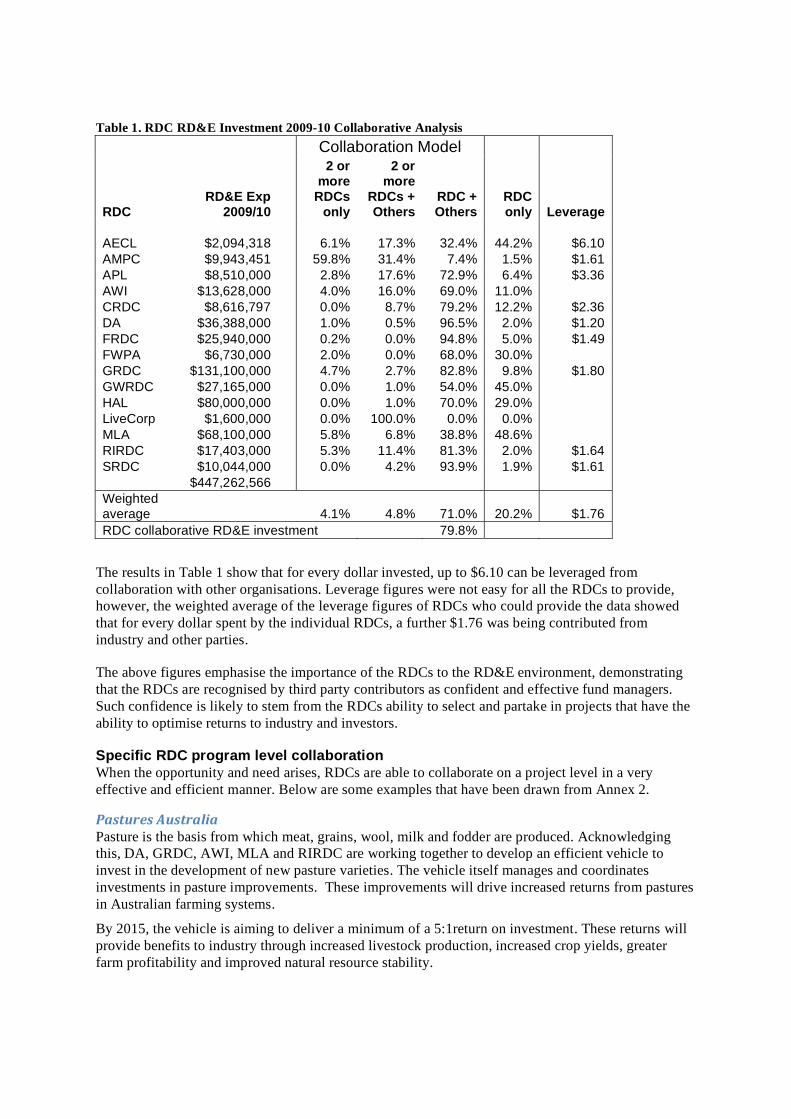
Table 1. RDC RD&E Investment 2009-10 Collaborative Analysis Collaboration Model
RDC RD&E Exp
2009/10
2 or more
RDCs only
2 or more
RDCs + Others
RDC + Others
RDC only Leverage
AECL $2,094,318 6.1% 17.3% 32.4% 44.2% $6.10 AMPC $9,943,451 59.8% 31.4% 7.4% 1.5% $1.61 APL $8,510,000 2.8% 17.6% 72.9% 6.4% $3.36 AWI $13,628,000 4.0% 16.0% 69.0% 11.0% CRDC $8,616,797 0.0% 8.7% 79.2% 12.2% $2.36 DA $36,388,000 1.0% 0.5% 96.5% 2.0% $1.20 FRDC $25,940,000 0.2% 0.0% 94.8% 5.0% $1.49 FWPA $6,730,000 2.0% 0.0% 68.0% 30.0% GRDC $131,100,000 4.7% 2.7% 82.8% 9.8% $1.80 GWRDC $27,165,000 0.0% 1.0% 54.0% 45.0% HAL $80,000,000 0.0% 1.0% 70.0% 29.0% LiveCorp $1,600,000 0.0% 100.0% 0.0% 0.0% MLA $68,100,000 5.8% 6.8% 38.8% 48.6% RIRDC $17,403,000 5.3% 11.4% 81.3% 2.0% $1.64 SRDC $10,044,000 0.0% 4.2% 93.9% 1.9% $1.61 $447,262,566 Weighted average 4.1% 4.8% 71.0% 20.2% $1.76 RDC collaborative RD&E investment 79.8%
The results in Table 1 show that for every dollar invested, up to $6.10 can be leveraged from collaboration with other organisations. Leverage figures were not easy for all the RDCs to provide, however, the weighted average of the leverage figures of RDCs who could provide the data showed that for every dollar spent by the individual RDCs, a further $1.76 was being contributed from industry and other parties.
The above figures emphasise the importance of the RDCs to the RD&E environment, demonstrating that the RDCs are recognised by third party contributors as confident and effective fund managers. Such confidence is likely to stem from the RDCs ability to select and partake in projects that have the ability to optimise returns to industry and investors.
Specific RDC program level collaboration When the opportunity and need arises, RDCs are able to collaborate on a project level in a very effective and efficient manner. Below are some examples that have been drawn from Annex 2.
Pasture is the basis from which meat, grains, wool, milk and fodder are produced. Acknowledging this, DA, GRDC, AWI, MLA and RIRDC are working together to develop an efficient vehicle to invest in the development of new pasture varieties. The vehicle itself manages and coordinates investments in pasture improvements. These improvements will drive increased returns from pastures in Australian farming systems.
By 2015, the vehicle is aiming to deliver a minimum of a 5:1return on investment. These returns will provide benefits to industry through increased livestock production, increased crop yields, greater farm profitability and improved natural resource stability.

As Australia is the most arid continent on earth, it is vital for the water consumed by Australia and its industries to be used in the most efficient and effective manner. GWRDC, SRDC, GRDC, MLA, RIRDC and HAL recognise this by investing in a program which facilitates collaboration among irrigation research providers and investors across Australia. The core function of the program is to define, commission and manage research projects that provide benefits to a broad range of stakeholders.
The program has been undertaken to invest in research, development and adoption of more sustainable and efficient irrigation systems throughout the country. The management function of the program ensures that minimal duplication occurs in the area of irrigation research.
This project was established to bring together the organisations who have an interest in the feedgrain industry; in doing this the project encompasses the whole supply chain (DA, APL, GRDC, MLA, AECL and other non-RDC organisations). It strives to provide security and availability of feed grain at internationally competitive prices by creating a whole of supply chain R&D strategy based on industry guidance and the resources of RD&E agencies.
Specifically, the program is currently investigating and improving the digestibility of sorghum. When achieved, this is likely to increase feed efficiencies in the livestock industries and have positive effects on the price of sorghum as demand may increase. The program is also seeking to address the need for more reliable data about the supply and stores of feedgrain in Australia, this will allow feedgrain consumers to change their feed rations earlier and allow feedgrain producers to make more educated crop rotation decisions. Finally, the project is working towards assembling a database of R&D feedgrain related R&D, this will ensure that research duplication does not occur in the future.
There are numerous outcomes that will arise from such a project. Firstly, the project will increase the utility of feed grains to end users. Secondly, the program will act as a focal point for organised industry consultation and R&D related issues. Finally, it will foster alliance building and open communication channels across and throughout the feedgrain sector.
Working with other RDCs under DAFF’s umbrella There are a number of areas where the RDCs work with the Department of Agriculture, Fisheries and Forestry as outlined below.
This industry-wide program funds projects and on-farm demonstrations intended to prepare Australia’s primary industries for climate change and build the resilience of the agricultural sector. Research focuses on reducing greenhouse pollution, better soil management and increased adaption in preparation for climate change. The projects provide practical management solutions to farmers and industries.
This $26 million methane project funded through the Australia Government’s Farming Future program is a joint initiative managed by DA and MLA. The project aims to identify technologies that will allow producers to breed and manage ruminants in ways which reduce their methane emissions whilst maintaining current animal productivity.
This $6 million initiative run by DA, MLA and AWI aims to identify technologies that will allow producers to reduce nitrous oxide emissions incurred during pasture production. Whilst the project is providing benefits to the whole industry, the reduction methods disseminated by the project are pasture and location specific, designed to best suit individual farming systems. This is a good example of how a project benefiting the whole industry or various sectors can be adapted to provide favourable outcomes to specific regions and production models.
Climate is something that affects all farmers, thus managing climate variability is essential for the business and environmental sustainability of agriculture. Numerous RDCs (DA, GRDC, GWRDC, MLA, RIRDC, and SRDC) have come together under the DAFF umbrella to form the Managing Climate Variability Program that runs until 2014.
Due to the seasonal nature and high input costs intrinsically connected to agriculture, it is important for farmers to be able to understand future weather patterns. The Managing Climate Variability Program invests in projects that seek to increase forecasting accuracy, build predictive capability and develop decision support tools for farmers when looking at weather outlooks.
These research initiatives are presenting significant gains for Australian farmers. For example grape growers are able to time their spraying and picking in a more profitable and certain manner. The program is also creating greater longer-term predictive capabilities. In Western Australia, grain growers utilising the tools provided by the program are able to decide fertiliser applications before the crop is even sown, this has the potential to reap an extra $50/ha p.a. profit. This is because they are able to look at the long-term climate outlook for that specific season. If the outlook is favourable they are able to increase their inputs to improve profitability. Conversely, in dry years they are able to reduce inputs to minimise losses.
Food Chain Assurance Advisory Group (FCAAG) Australia’s food safety and security systems and food regulatory arrangements are world class. However, the global security environment has changed and the potential for acts of deliberate and malicious intervention or contamination in the food supply has been recognised and raised by the World Health Organisation.
The recognition that the food supply chain is a critical component of our national infrastructure lead to the establishment of the Food Chain Assurance Advisory Group (FCAAG) in 2003. The Group is part of the Trusted Information Sharing Network for the protection of critical infrastructure, which is a partnership between industry and government. All RDCs are participants in FCAAG.
The FCAAG has undertaken a strategic assessment of food safety and security arrangements. This has been done to identify potential gaps and vulnerabilities in the event of acts of deliberate and malicious intervention or contamination. As a result of this assessment, the Group developed the National Food Chain Safety and Security Strategy to address the key gaps and vulnerabilities identified.
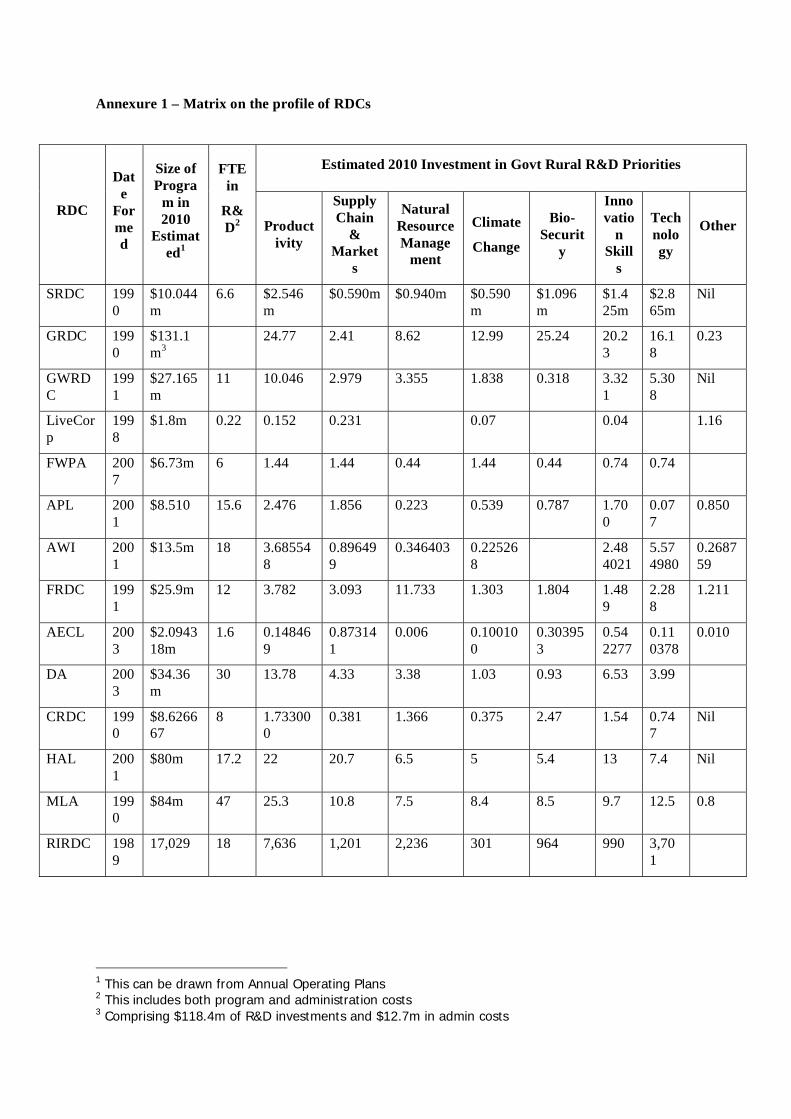
Annexure 1 – Matrix on the profile of RDCs
Estimated 2010 Investment in Govt Rural R&D Priorities
RDC
Date
Formed
Size of Progra
m in 2010
Estimated1
FTE in
R&D2
Productivity
Supply Chain
& Market
s
Natural Resource Manage
ment
Climate
Change
Bio-Securit
y
Innovatio
n Skill
s
Technology
Other
SRDC 1990
$10.044m
6.6 $2.546m
$0.590m $0.940m $0.590m
$1.096m
$1.425m
$2.865m
Nil
GRDC 1990
$131.1m3
24.77 2.41 8.62 12.99 25.24 20.23
16.18
0.23
GWRDC
1991
$27.165m
11 10.046 2.979 3.355 1.838 0.318 3.321
5.308
Nil
LiveCorp
1998
$1.8m 0.22 0.152 0.231 0.07 0.04 1.16
FWPA 2007
$6.73m 6 1.44 1.44 0.44 1.44 0.44 0.74 0.74
APL 2001
$8.510 15.6 2.476 1.856 0.223 0.539 0.787 1.700
0.077
0.850
AWI 2001
$13.5m 18 3.685548
0.896499
0.346403 0.225268
2.484021
5.574980
0.268759
FRDC 1991
$25.9m 12 3.782 3.093 11.733 1.303 1.804 1.489
2.288
1.211
AECL 2003
$2.094318m
1.6 0.148469
0.873141
0.006 0.100100
0.303953
0.542277
0.110378
0.010
DA 2003
$34.36m
30 13.78 4.33 3.38 1.03 0.93 6.53 3.99
CRDC 1990
$8.626667
8 1.733000
0.381 1.366 0.375 2.47 1.54 0.747
Nil
HAL 2001
$80m 17.2 22 20.7 6.5 5 5.4 13 7.4 Nil
MLA 1990
$84m 47 25.3 10.8 7.5 8.4 8.5 9.7 12.5 0.8
RIRDC 1989
17,029 18 7,636 1,201 2,236 301 964 990 3,701
1 This can be drawn from Annual Operating Plans 2 This includes both program and administration costs 3 Comprising $118.4m of R&D investments and $12.7m in admin costs
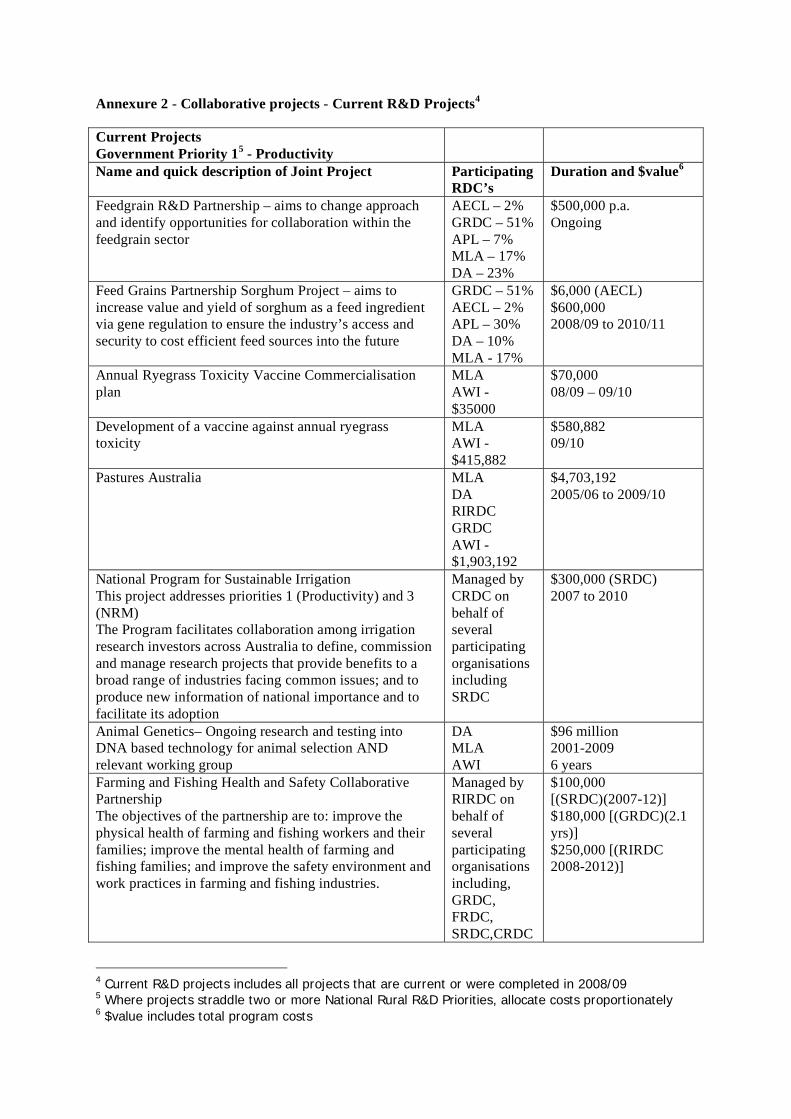
Annexure 2 - Collaborative projects - Current R&D Projects4
Current Projects Government Priority 15 - Productivity
Name and quick description of Joint Project Participating RDC’s
Duration and $value6
Feedgrain R&D Partnership – aims to change approach and identify opportunities for collaboration within the feedgrain sector
AECL – 2% GRDC – 51% APL – 7% MLA – 17% DA – 23%
$500,000 p.a. Ongoing
Feed Grains Partnership Sorghum Project – aims to increase value and yield of sorghum as a feed ingredient via gene regulation to ensure the industry’s access and security to cost efficient feed sources into the future
GRDC – 51% AECL – 2% APL – 30% DA – 10% MLA - 17%
$6,000 (AECL) $600,000 2008/09 to 2010/11
Annual Ryegrass Toxicity Vaccine Commercialisation plan
MLA AWI - $35000
$70,000 08/09 – 09/10
Development of a vaccine against annual ryegrass toxicity
MLA AWI - $415,882
$580,882 09/10
Pastures Australia MLA DA RIRDC GRDC AWI - $1,903,192
$4,703,192 2005/06 to 2009/10
National Program for Sustainable Irrigation This project addresses priorities 1 (Productivity) and 3 (NRM) The Program facilitates collaboration among irrigation research investors across Australia to define, commission and manage research projects that provide benefits to a broad range of industries facing common issues; and to produce new information of national importance and to facilitate its adoption
Managed by CRDC on behalf of several participating organisations including SRDC
$300,000 (SRDC) 2007 to 2010
Animal Genetics– Ongoing research and testing into DNA based technology for animal selection AND relevant working group
DA MLA AWI
$96 million 2001-2009 6 years
Farming and Fishing Health and Safety Collaborative Partnership The objectives of the partnership are to: improve the physical health of farming and fishing workers and their families; improve the mental health of farming and fishing families; and improve the safety environment and work practices in farming and fishing industries.
Managed by RIRDC on behalf of several participating organisations including, GRDC, FRDC, SRDC,CRDC
$100,000 [(SRDC)(2007-12)] $180,000 [(GRDC)(2.1 yrs)] $250,000 [(RIRDC 2008-2012)]
4 Current R&D projects includes all projects that are current or were completed in 2008/09 5 Where projects straddle two or more National Rural R&D Priorities, allocate costs proportionately 6 $value includes total program costs
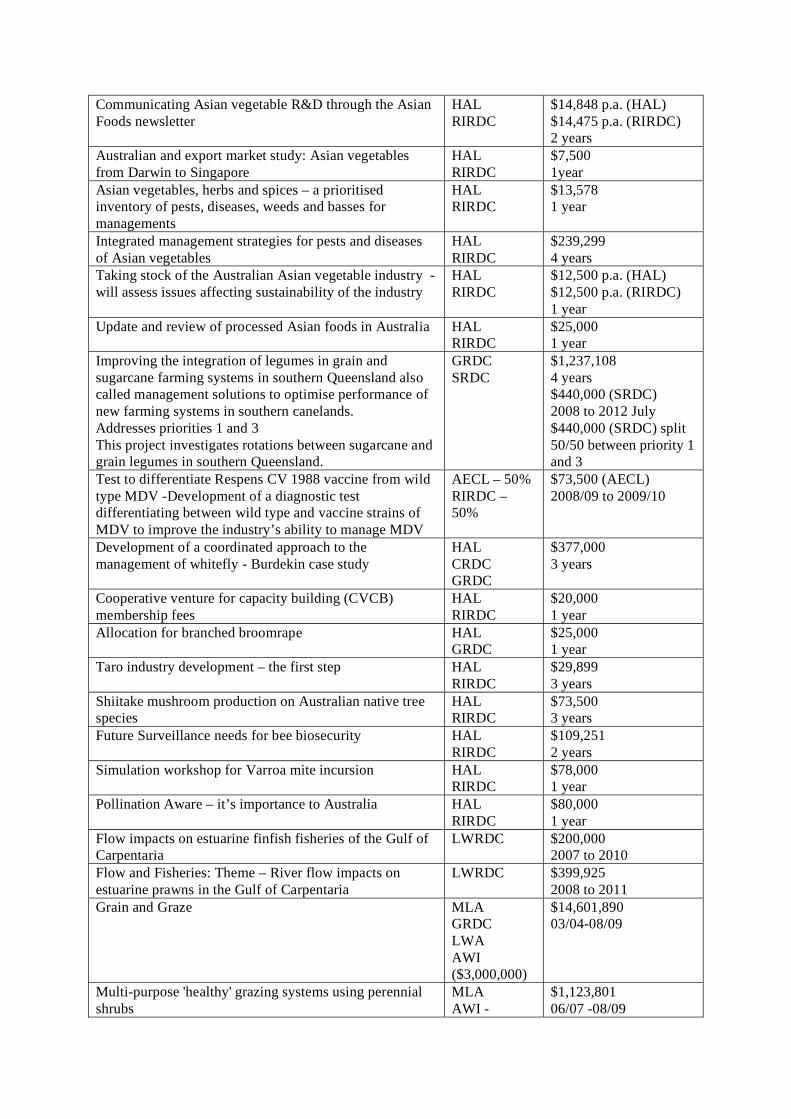
Communicating Asian vegetable R&D through the Asian Foods newsletter
HAL RIRDC
$14,848 p.a. (HAL) $14,475 p.a. (RIRDC) 2 years
Australian and export market study: Asian vegetables from Darwin to Singapore
HAL RIRDC
$7,500 1year
Asian vegetables, herbs and spices – a prioritised inventory of pests, diseases, weeds and basses for managements
HAL RIRDC
$13,578 1 year
Integrated management strategies for pests and diseases of Asian vegetables
HAL RIRDC
$239,299 4 years
Taking stock of the Australian Asian vegetable industry - will assess issues affecting sustainability of the industry
HAL RIRDC
$12,500 p.a. (HAL) $12,500 p.a. (RIRDC) 1 year
Update and review of processed Asian foods in Australia HAL RIRDC
$25,000 1 year
Improving the integration of legumes in grain and sugarcane farming systems in southern Queensland also called management solutions to optimise performance of new farming systems in southern canelands. Addresses priorities 1 and 3 This project investigates rotations between sugarcane and grain legumes in southern Queensland.
GRDC SRDC
$1,237,108 4 years $440,000 (SRDC) 2008 to 2012 July $440,000 (SRDC) split 50/50 between priority 1 and 3
Test to differentiate Respens CV 1988 vaccine from wild type MDV -Development of a diagnostic test differentiating between wild type and vaccine strains of MDV to improve the industry’s ability to manage MDV
AECL – 50% RIRDC – 50%
$73,500 (AECL) 2008/09 to 2009/10
Development of a coordinated approach to the management of whitefly - Burdekin case study
HAL CRDC GRDC
$377,000 3 years
Cooperative venture for capacity building (CVCB) membership fees
HAL RIRDC
$20,000 1 year
Allocation for branched broomrape HAL GRDC
$25,000 1 year
Taro industry development – the first step HAL RIRDC
$29,899 3 years
Shiitake mushroom production on Australian native tree species
HAL RIRDC
$73,500 3 years
Future Surveillance needs for bee biosecurity HAL RIRDC
$109,251 2 years
Simulation workshop for Varroa mite incursion HAL RIRDC
$78,000 1 year
Pollination Aware – it’s importance to Australia HAL RIRDC
$80,000 1 year
Flow impacts on estuarine finfish fisheries of the Gulf of Carpentaria
LWRDC $200,000 2007 to 2010
Flow and Fisheries: Theme – River flow impacts on estuarine prawns in the Gulf of Carpentaria
LWRDC $399,925 2008 to 2011
Grain and Graze
MLA GRDC LWA AWI ($3,000,000)
$14,601,890 03/04-08/09
Multi-purpose 'healthy' grazing systems using perennial shrubs
MLA AWI -
$1,123,801 06/07 -08/09
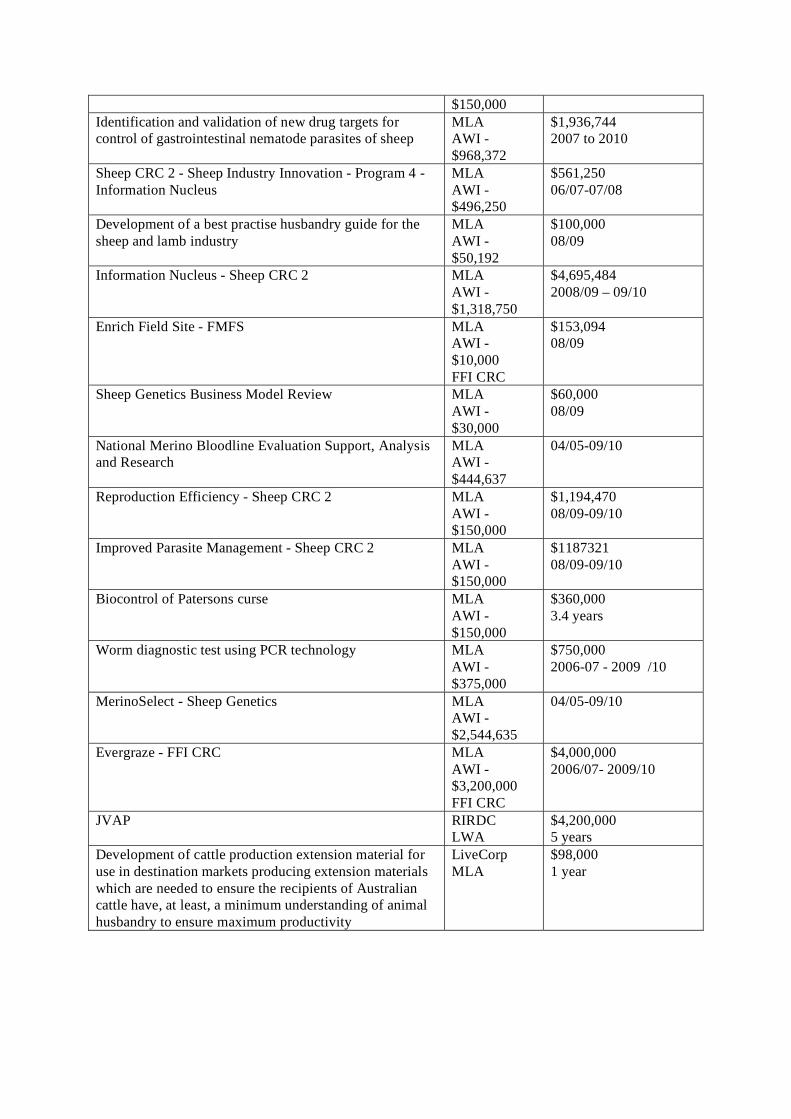
$150,000 Identification and validation of new drug targets for control of gastrointestinal nematode parasites of sheep
MLA AWI - $968,372
$1,936,744 2007 to 2010
Sheep CRC 2 - Sheep Industry Innovation - Program 4 - Information Nucleus
MLA AWI - $496,250
$561,250 06/07-07/08
Development of a best practise husbandry guide for the sheep and lamb industry
MLA AWI - $50,192
$100,000 08/09
Information Nucleus - Sheep CRC 2 MLA AWI - $1,318,750
$4,695,484 2008/09 – 09/10
Enrich Field Site - FMFS MLA AWI - $10,000 FFI CRC
$153,094 08/09
Sheep Genetics Business Model Review MLA AWI - $30,000
$60,000 08/09
National Merino Bloodline Evaluation Support, Analysis and Research
MLA AWI - $444,637
04/05-09/10
Reproduction Efficiency - Sheep CRC 2 MLA AWI - $150,000
$1,194,470 08/09-09/10
Improved Parasite Management - Sheep CRC 2 MLA AWI - $150,000
$1187321 08/09-09/10
Biocontrol of Patersons curse MLA AWI - $150,000
$360,000 3.4 years
Worm diagnostic test using PCR technology MLA AWI - $375,000
$750,000 2006-07 - 2009 /10
MerinoSelect - Sheep Genetics MLA AWI - $2,544,635
04/05-09/10
Evergraze - FFI CRC MLA AWI - $3,200,000 FFI CRC
$4,000,000 2006/07- 2009/10
JVAP RIRDC LWA
$4,200,000 5 years
Development of cattle production extension material for use in destination markets producing extension materials which are needed to ensure the recipients of Australian cattle have, at least, a minimum understanding of animal husbandry to ensure maximum productivity
LiveCorp MLA
$98,000 1 year
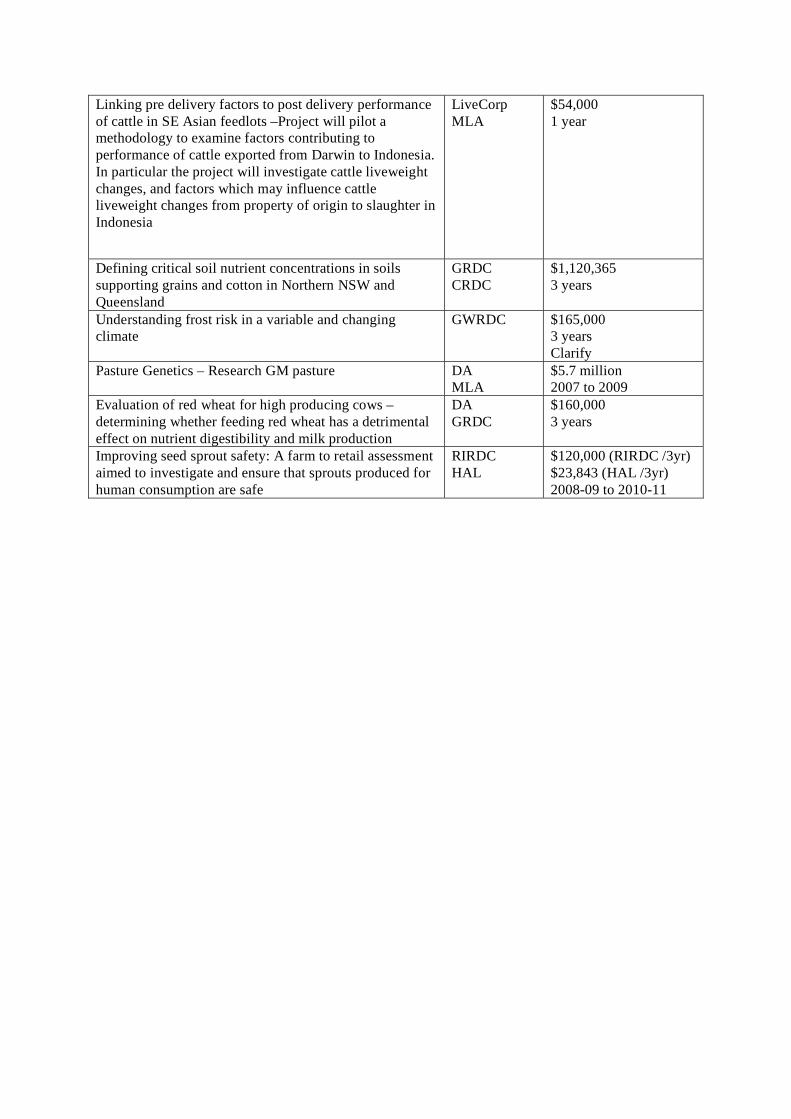
Linking pre delivery factors to post delivery performance of cattle in SE Asian feedlots –Project will pilot a methodology to examine factors contributing to performance of cattle exported from Darwin to Indonesia. In particular the project will investigate cattle liveweight changes, and factors which may influence cattle liveweight changes from property of origin to slaughter in Indonesia
LiveCorp MLA
$54,000 1 year
Defining critical soil nutrient concentrations in soils supporting grains and cotton in Northern NSW and Queensland
GRDC CRDC
$1,120,365 3 years
Understanding frost risk in a variable and changing climate
GWRDC $165,000 3 years Clarify
Pasture Genetics – Research GM pasture DA MLA
$5.7 million 2007 to 2009
Evaluation of red wheat for high producing cows – determining whether feeding red wheat has a detrimental effect on nutrient digestibility and milk production
DA GRDC
$160,000 3 years
Improving seed sprout safety: A farm to retail assessment aimed to investigate and ensure that sprouts produced for human consumption are safe
RIRDC HAL
$120,000 (RIRDC /3yr) $23,843 (HAL /3yr) 2008-09 to 2010-11
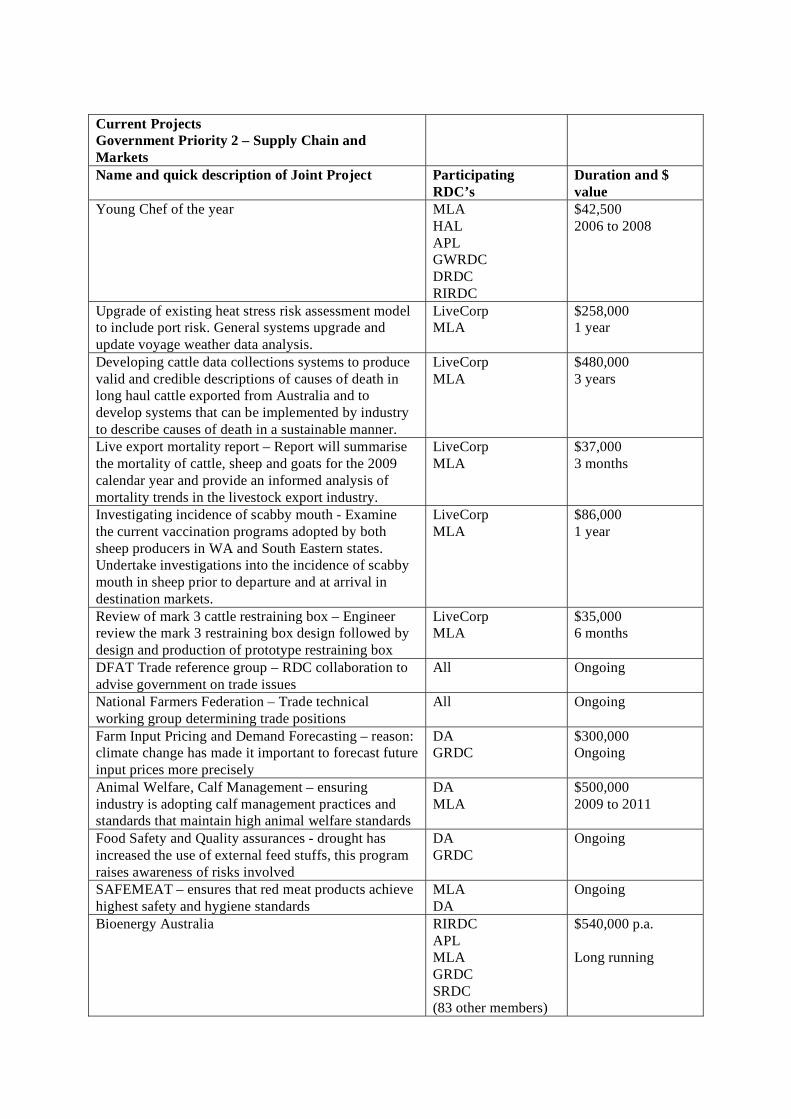
Current Projects Government Priority 2 – Supply Chain and Markets
Name and quick description of Joint Project Participating RDC’s
Duration and $ value
Young Chef of the year MLA HAL APL GWRDC DRDC RIRDC
$42,500 2006 to 2008
Upgrade of existing heat stress risk assessment model to include port risk. General systems upgrade and update voyage weather data analysis.
LiveCorp MLA
$258,000 1 year
Developing cattle data collections systems to produce valid and credible descriptions of causes of death in long haul cattle exported from Australia and to develop systems that can be implemented by industry to describe causes of death in a sustainable manner.
LiveCorp MLA
$480,000 3 years
Live export mortality report – Report will summarise the mortality of cattle, sheep and goats for the 2009 calendar year and provide an informed analysis of mortality trends in the livestock export industry.
LiveCorp MLA
$37,000 3 months
Investigating incidence of scabby mouth - Examine the current vaccination programs adopted by both sheep producers in WA and South Eastern states. Undertake investigations into the incidence of scabby mouth in sheep prior to departure and at arrival in destination markets.
LiveCorp MLA
$86,000 1 year
Review of mark 3 cattle restraining box – Engineer review the mark 3 restraining box design followed by design and production of prototype restraining box
LiveCorp MLA
$35,000 6 months
DFAT Trade reference group – RDC collaboration to advise government on trade issues
All Ongoing
National Farmers Federation – Trade technical working group determining trade positions
All Ongoing
Farm Input Pricing and Demand Forecasting – reason: climate change has made it important to forecast future input prices more precisely
DA GRDC
$300,000 Ongoing
Animal Welfare, Calf Management – ensuring industry is adopting calf management practices and standards that maintain high animal welfare standards
DA MLA
$500,000 2009 to 2011
Food Safety and Quality assurances - drought has increased the use of external feed stuffs, this program raises awareness of risks involved
DA GRDC
Ongoing
SAFEMEAT – ensures that red meat products achieve highest safety and hygiene standards
MLA DA
Ongoing
Bioenergy Australia RIRDC APL MLA GRDC SRDC (83 other members)
$540,000 p.a. Long running
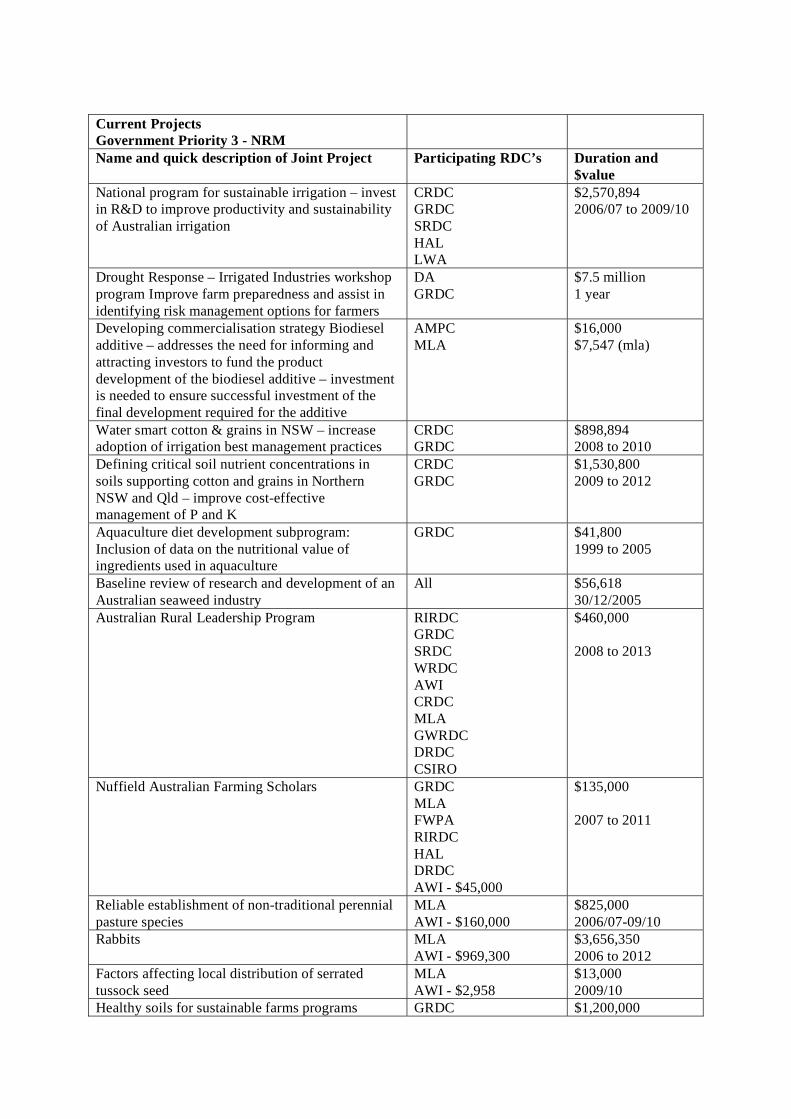
Current Projects Government Priority 3 - NRM
Name and quick description of Joint Project Participating RDC’s Duration and $value
National program for sustainable irrigation – invest in R&D to improve productivity and sustainability of Australian irrigation
CRDC GRDC SRDC HAL LWA
$2,570,894 2006/07 to 2009/10
Drought Response – Irrigated Industries workshop program Improve farm preparedness and assist in identifying risk management options for farmers
DA GRDC
$7.5 million 1 year
Developing commercialisation strategy Biodiesel additive – addresses the need for informing and attracting investors to fund the product development of the biodiesel additive – investment is needed to ensure successful investment of the final development required for the additive
AMPC MLA
$16,000 $7,547 (mla)
Water smart cotton & grains in NSW – increase adoption of irrigation best management practices
CRDC GRDC
$898,894 2008 to 2010
Defining critical soil nutrient concentrations in soils supporting cotton and grains in Northern NSW and Qld – improve cost-effective management of P and K
CRDC GRDC
$1,530,800 2009 to 2012
Aquaculture diet development subprogram: Inclusion of data on the nutritional value of ingredients used in aquaculture
GRDC $41,800 1999 to 2005
Baseline review of research and development of an Australian seaweed industry
All $56,618 30/12/2005
Australian Rural Leadership Program RIRDC GRDC SRDC WRDC AWI CRDC MLA GWRDC DRDC CSIRO
$460,000 2008 to 2013
Nuffield Australian Farming Scholars GRDC MLA FWPA RIRDC HAL DRDC AWI - $45,000
$135,000 2007 to 2011
Reliable establishment of non-traditional perennial pasture species
MLA AWI - $160,000
$825,000 2006/07-09/10
Rabbits MLA AWI - $969,300
$3,656,350 2006 to 2012
Factors affecting local distribution of serrated tussock seed
MLA AWI - $2,958
$13,000 2009/10
Healthy soils for sustainable farms programs GRDC $1,200,000
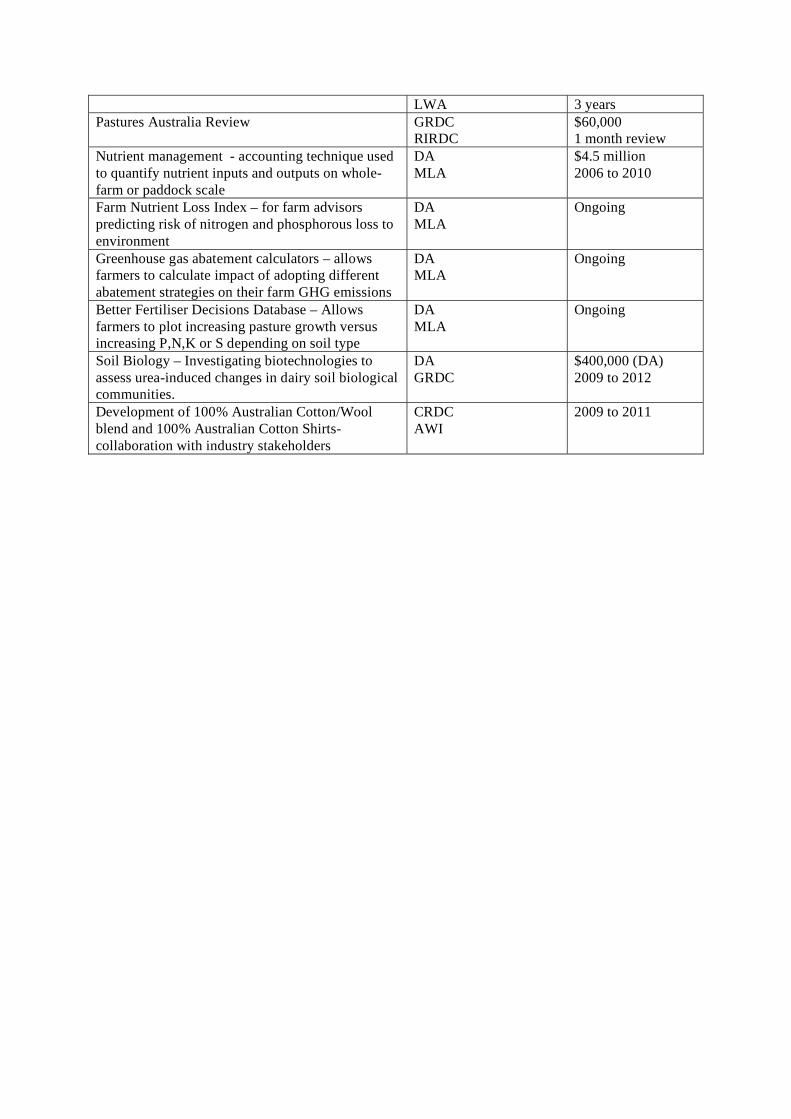
LWA 3 years Pastures Australia Review GRDC
RIRDC $60,000 1 month review
Nutrient management - accounting technique used to quantify nutrient inputs and outputs on whole-farm or paddock scale
DA MLA
$4.5 million 2006 to 2010
Farm Nutrient Loss Index – for farm advisors predicting risk of nitrogen and phosphorous loss to environment
DA MLA
Ongoing
Greenhouse gas abatement calculators – allows farmers to calculate impact of adopting different abatement strategies on their farm GHG emissions
DA MLA
Ongoing
Better Fertiliser Decisions Database – Allows farmers to plot increasing pasture growth versus increasing P,N,K or S depending on soil type
DA MLA
Ongoing
Soil Biology – Investigating biotechnologies to assess urea-induced changes in dairy soil biological communities.
DA GRDC
$400,000 (DA) 2009 to 2012
Development of 100% Australian Cotton/Wool blend and 100% Australian Cotton Shirts- collaboration with industry stakeholders
CRDC AWI
2009 to 2011
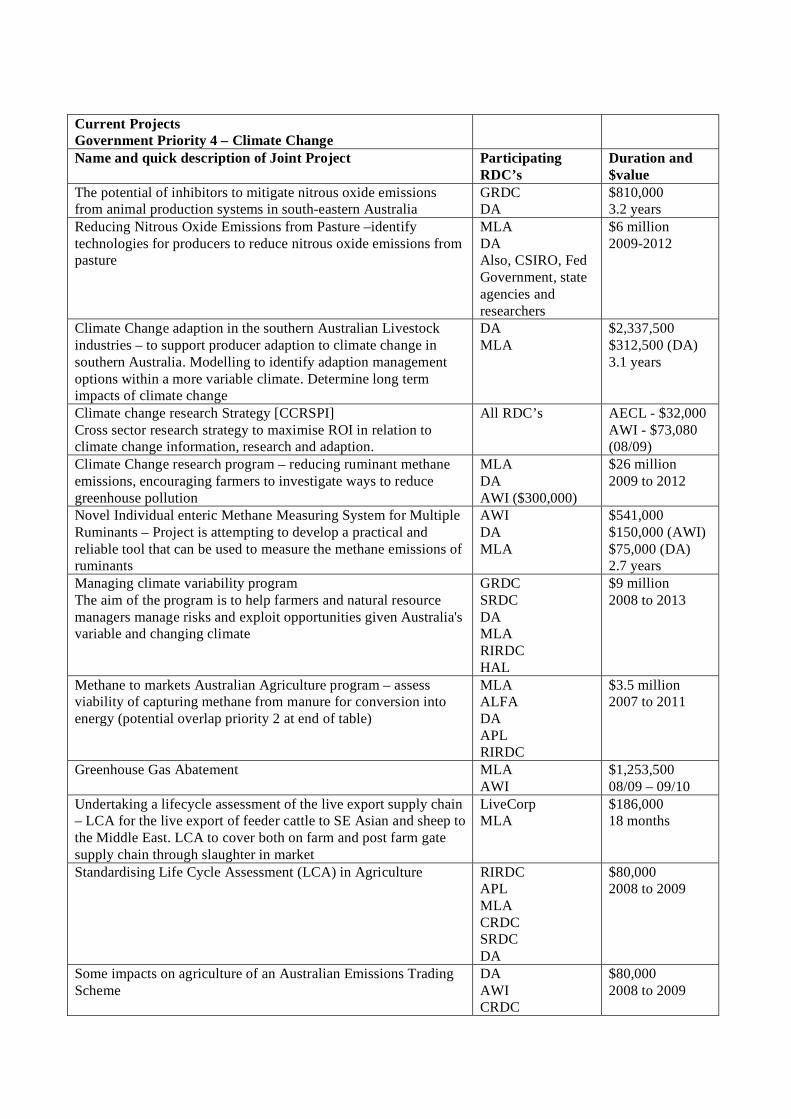
Current Projects Government Priority 4 – Climate Change
Name and quick description of Joint Project Participating RDC’s
Duration and $value
The potential of inhibitors to mitigate nitrous oxide emissions from animal production systems in south-eastern Australia
GRDC DA
$810,000 3.2 years
Reducing Nitrous Oxide Emissions from Pasture –identify technologies for producers to reduce nitrous oxide emissions from pasture
MLA DA Also, CSIRO, Fed Government, state agencies and researchers
$6 million 2009-2012
Climate Change adaption in the southern Australian Livestock industries – to support producer adaption to climate change in southern Australia. Modelling to identify adaption management options within a more variable climate. Determine long term impacts of climate change
DA MLA
$2,337,500 $312,500 (DA) 3.1 years
Climate change research Strategy [CCRSPI] Cross sector research strategy to maximise ROI in relation to climate change information, research and adaption.
All RDC’s AECL - $32,000 AWI - $73,080 (08/09)
Climate Change research program – reducing ruminant methane emissions, encouraging farmers to investigate ways to reduce greenhouse pollution
MLA DA AWI ($300,000)
$26 million 2009 to 2012
Novel Individual enteric Methane Measuring System for Multiple Ruminants – Project is attempting to develop a practical and reliable tool that can be used to measure the methane emissions of ruminants
AWI DA MLA
$541,000 $150,000 (AWI) $75,000 (DA) 2.7 years
Managing climate variability program The aim of the program is to help farmers and natural resource managers manage risks and exploit opportunities given Australia's variable and changing climate
GRDC SRDC DA MLA RIRDC HAL
$9 million 2008 to 2013
Methane to markets Australian Agriculture program – assess viability of capturing methane from manure for conversion into energy (potential overlap priority 2 at end of table)
MLA ALFA DA APL RIRDC
$3.5 million 2007 to 2011
Greenhouse Gas Abatement MLA AWI
$1,253,500 08/09 – 09/10
Undertaking a lifecycle assessment of the live export supply chain – LCA for the live export of feeder cattle to SE Asian and sheep to the Middle East. LCA to cover both on farm and post farm gate supply chain through slaughter in market
LiveCorp MLA
$186,000 18 months
Standardising Life Cycle Assessment (LCA) in Agriculture RIRDC APL MLA CRDC SRDC DA
$80,000 2008 to 2009
Some impacts on agriculture of an Australian Emissions Trading Scheme
DA AWI CRDC
$80,000 2008 to 2009
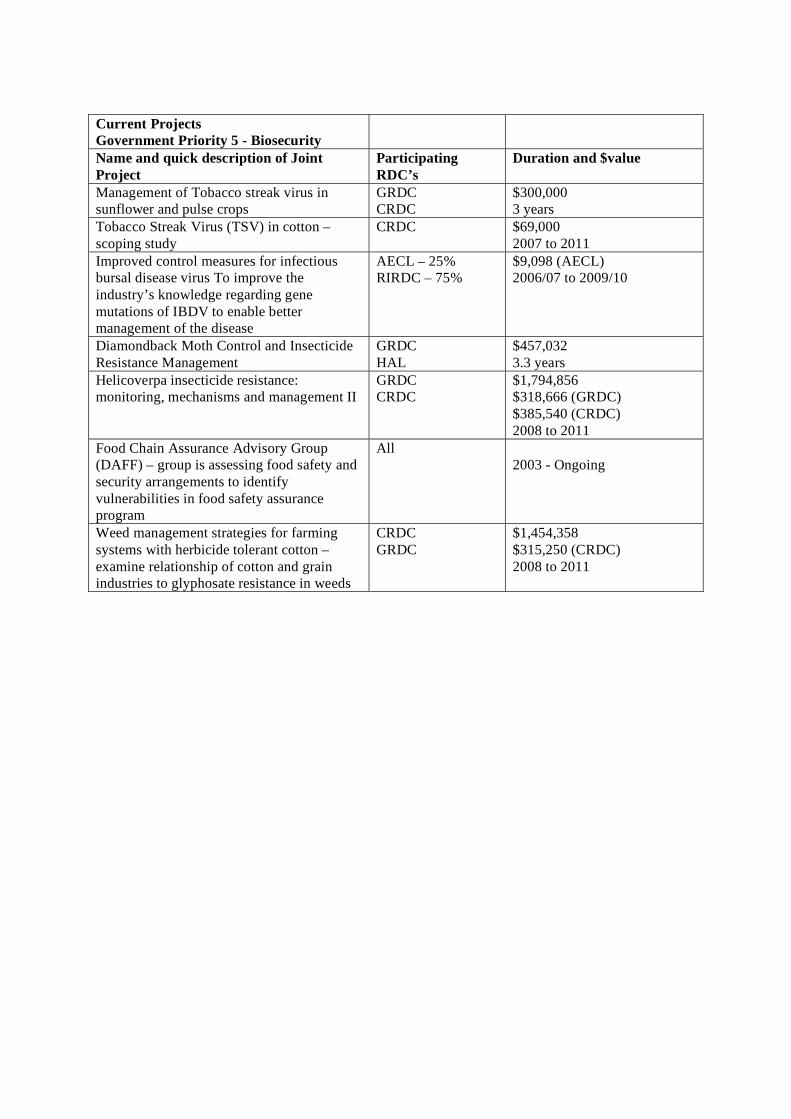
Current Projects Government Priority 5 - Biosecurity
Name and quick description of Joint Project
Participating RDC’s
Duration and $value
Management of Tobacco streak virus in sunflower and pulse crops
GRDC CRDC
$300,000 3 years
Tobacco Streak Virus (TSV) in cotton – scoping study
CRDC $69,000 2007 to 2011
Improved control measures for infectious bursal disease virus To improve the industry’s knowledge regarding gene mutations of IBDV to enable better management of the disease
AECL – 25% RIRDC – 75%
$9,098 (AECL) 2006/07 to 2009/10
Diamondback Moth Control and Insecticide Resistance Management
GRDC HAL
$457,032 3.3 years
Helicoverpa insecticide resistance: monitoring, mechanisms and management II
GRDC CRDC
$1,794,856 $318,666 (GRDC) $385,540 (CRDC) 2008 to 2011
Food Chain Assurance Advisory Group (DAFF) – group is assessing food safety and security arrangements to identify vulnerabilities in food safety assurance program
All 2003 - Ongoing
Weed management strategies for farming systems with herbicide tolerant cotton – examine relationship of cotton and grain industries to glyphosate resistance in weeds
CRDC GRDC
$1,454,358 $315,250 (CRDC) 2008 to 2011
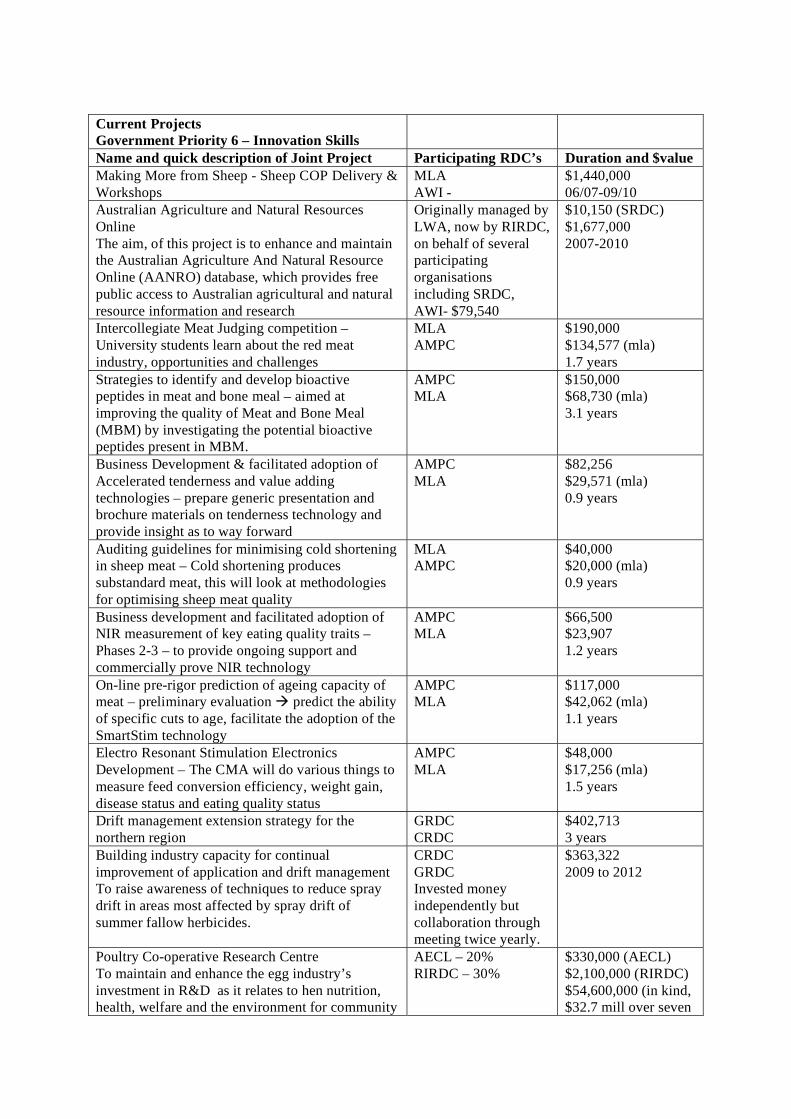
Current Projects Government Priority 6 – Innovation Skills
Name and quick description of Joint Project Participating RDC’s Duration and $value Making More from Sheep - Sheep COP Delivery & Workshops
MLA AWI -
$1,440,000 06/07-09/10
Australian Agriculture and Natural Resources Online The aim, of this project is to enhance and maintain the Australian Agriculture And Natural Resource Online (AANRO) database, which provides free public access to Australian agricultural and natural resource information and research
Originally managed by LWA, now by RIRDC, on behalf of several participating organisations including SRDC, AWI- $79,540
$10,150 (SRDC) $1,677,000 2007-2010
Intercollegiate Meat Judging competition – University students learn about the red meat industry, opportunities and challenges
MLA AMPC
$190,000 $134,577 (mla) 1.7 years
Strategies to identify and develop bioactive peptides in meat and bone meal – aimed at improving the quality of Meat and Bone Meal (MBM) by investigating the potential bioactive peptides present in MBM.
AMPC MLA
$150,000 $68,730 (mla) 3.1 years
Business Development & facilitated adoption of Accelerated tenderness and value adding technologies – prepare generic presentation and brochure materials on tenderness technology and provide insight as to way forward
AMPC MLA
$82,256 $29,571 (mla) 0.9 years
Auditing guidelines for minimising cold shortening in sheep meat – Cold shortening produces substandard meat, this will look at methodologies for optimising sheep meat quality
MLA AMPC
$40,000 $20,000 (mla) 0.9 years
Business development and facilitated adoption of NIR measurement of key eating quality traits – Phases 2-3 – to provide ongoing support and commercially prove NIR technology
AMPC MLA
$66,500 $23,907 1.2 years
On-line pre-rigor prediction of ageing capacity of meat – preliminary evaluation predict the ability of specific cuts to age, facilitate the adoption of the SmartStim technology
AMPC MLA
$117,000 $42,062 (mla) 1.1 years
Electro Resonant Stimulation Electronics Development – The CMA will do various things to measure feed conversion efficiency, weight gain, disease status and eating quality status
AMPC MLA
$48,000 $17,256 (mla) 1.5 years
Drift management extension strategy for the northern region
GRDC CRDC
$402,713 3 years
Building industry capacity for continual improvement of application and drift management To raise awareness of techniques to reduce spray drift in areas most affected by spray drift of summer fallow herbicides.
CRDC GRDC Invested money independently but collaboration through meeting twice yearly.
$363,322 2009 to 2012
Poultry Co-operative Research Centre To maintain and enhance the egg industry’s investment in R&D as it relates to hen nutrition, health, welfare and the environment for community
AECL – 20% RIRDC – 30%
$330,000 (AECL) $2,100,000 (RIRDC) $54,600,000 (in kind, $32.7 mill over seven
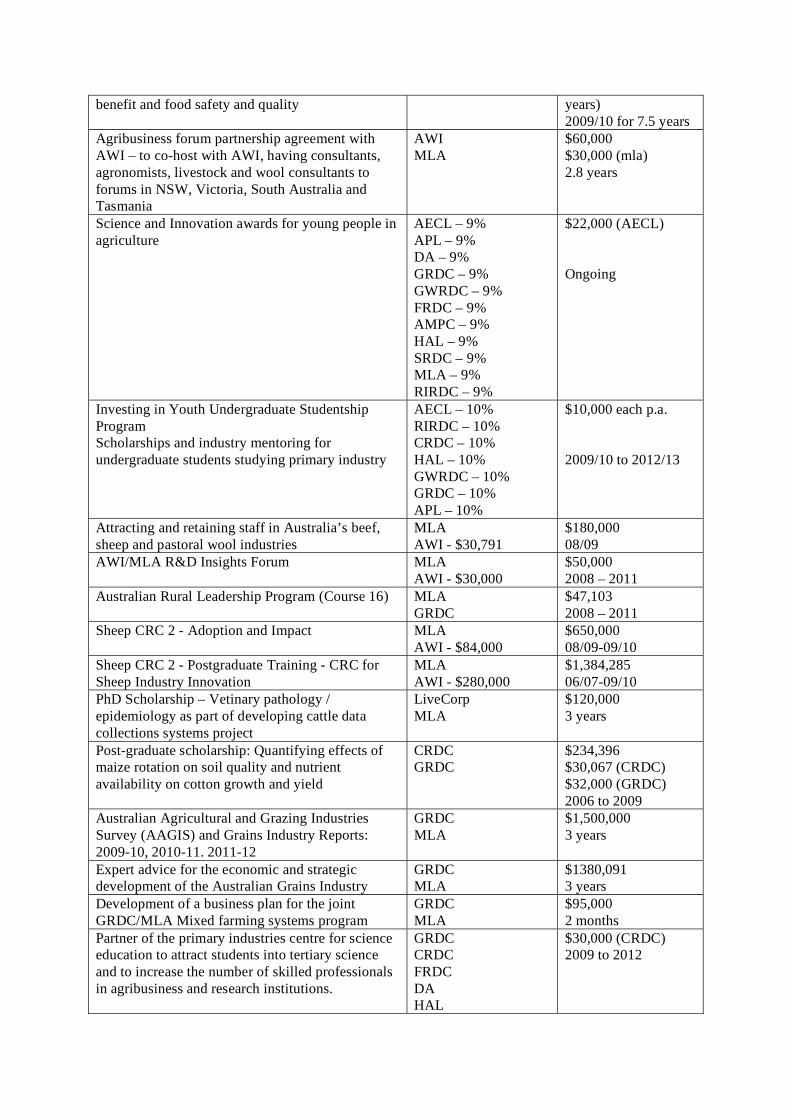
benefit and food safety and quality years) 2009/10 for 7.5 years
Agribusiness forum partnership agreement with AWI – to co-host with AWI, having consultants, agronomists, livestock and wool consultants to forums in NSW, Victoria, South Australia and Tasmania
AWI MLA
$60,000 $30,000 (mla) 2.8 years
Science and Innovation awards for young people in agriculture
AECL – 9% APL – 9% DA – 9% GRDC – 9% GWRDC – 9% FRDC – 9% AMPC – 9% HAL – 9% SRDC – 9% MLA – 9% RIRDC – 9%
$22,000 (AECL) Ongoing
Investing in Youth Undergraduate Studentship Program Scholarships and industry mentoring for undergraduate students studying primary industry
AECL – 10% RIRDC – 10% CRDC – 10% HAL – 10% GWRDC – 10% GRDC – 10% APL – 10%
$10,000 each p.a. 2009/10 to 2012/13
Attracting and retaining staff in Australia’s beef, sheep and pastoral wool industries
MLA AWI - $30,791
$180,000 08/09
AWI/MLA R&D Insights Forum MLA AWI - $30,000
$50,000 2008 – 2011
Australian Rural Leadership Program (Course 16) MLA GRDC
$47,103 2008 – 2011
Sheep CRC 2 - Adoption and Impact MLA AWI - $84,000
$650,000 08/09-09/10
Sheep CRC 2 - Postgraduate Training - CRC for Sheep Industry Innovation
MLA AWI - $280,000
$1,384,285 06/07-09/10
PhD Scholarship – Vetinary pathology / epidemiology as part of developing cattle data collections systems project
LiveCorp MLA
$120,000 3 years
Post-graduate scholarship: Quantifying effects of maize rotation on soil quality and nutrient availability on cotton growth and yield
CRDC GRDC
$234,396 $30,067 (CRDC) $32,000 (GRDC) 2006 to 2009
Australian Agricultural and Grazing Industries Survey (AAGIS) and Grains Industry Reports: 2009-10, 2010-11. 2011-12
GRDC MLA
$1,500,000 3 years
Expert advice for the economic and strategic development of the Australian Grains Industry
GRDC MLA
$1380,091 3 years
Development of a business plan for the joint GRDC/MLA Mixed farming systems program
GRDC MLA
$95,000 2 months
Partner of the primary industries centre for science education to attract students into tertiary science and to increase the number of skilled professionals in agribusiness and research institutions.
GRDC CRDC FRDC DA HAL
$30,000 (CRDC) 2009 to 2012
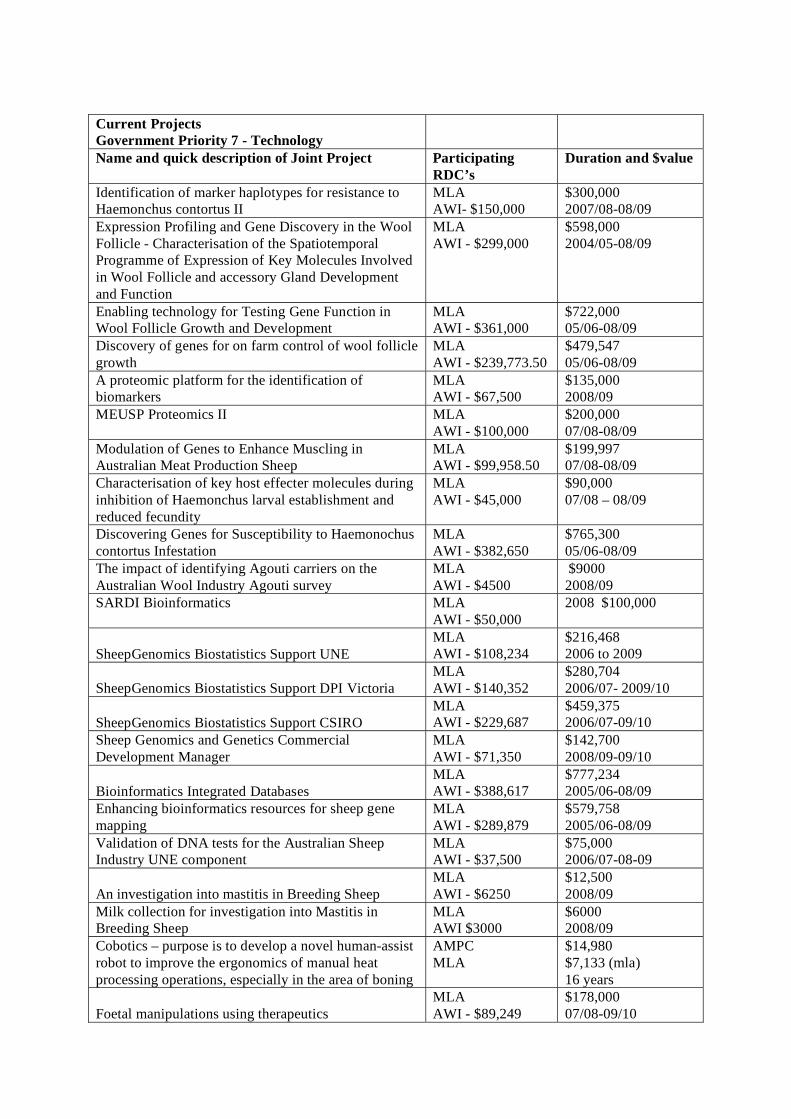
Current Projects Government Priority 7 - Technology
Name and quick description of Joint Project Participating RDC’s
Duration and $value
Identification of marker haplotypes for resistance to Haemonchus contortus II
MLA AWI- $150,000
$300,000 2007/08-08/09
Expression Profiling and Gene Discovery in the Wool Follicle - Characterisation of the Spatiotemporal Programme of Expression of Key Molecules Involved in Wool Follicle and accessory Gland Development and Function
MLA AWI - $299,000
$598,000 2004/05-08/09
Enabling technology for Testing Gene Function in Wool Follicle Growth and Development
MLA AWI - $361,000
$722,000 05/06-08/09
Discovery of genes for on farm control of wool follicle growth
MLA AWI - $239,773.50
$479,547 05/06-08/09
A proteomic platform for the identification of biomarkers
MLA AWI - $67,500
$135,000 2008/09
MEUSP Proteomics II MLA AWI - $100,000
$200,000 07/08-08/09
Modulation of Genes to Enhance Muscling in Australian Meat Production Sheep
MLA AWI - $99,958.50
$199,997 07/08-08/09
Characterisation of key host effecter molecules during inhibition of Haemonchus larval establishment and reduced fecundity
MLA AWI - $45,000
$90,000 07/08 – 08/09
Discovering Genes for Susceptibility to Haemonochus contortus Infestation
MLA AWI - $382,650
$765,300 05/06-08/09
The impact of identifying Agouti carriers on the Australian Wool Industry Agouti survey
MLA AWI - $4500
$9000 2008/09
SARDI Bioinformatics MLA AWI - $50,000
2008 $100,000
SheepGenomics Biostatistics Support UNE MLA AWI - $108,234
$216,468 2006 to 2009
SheepGenomics Biostatistics Support DPI Victoria MLA AWI - $140,352
$280,704 2006/07- 2009/10
SheepGenomics Biostatistics Support CSIRO MLA AWI - $229,687
$459,375 2006/07-09/10
Sheep Genomics and Genetics Commercial Development Manager
MLA AWI - $71,350
$142,700 2008/09-09/10
Bioinformatics Integrated Databases MLA AWI - $388,617
$777,234 2005/06-08/09
Enhancing bioinformatics resources for sheep gene mapping
MLA AWI - $289,879
$579,758 2005/06-08/09
Validation of DNA tests for the Australian Sheep Industry UNE component
MLA AWI - $37,500
$75,000 2006/07-08-09
An investigation into mastitis in Breeding Sheep MLA AWI - $6250
$12,500 2008/09
Milk collection for investigation into Mastitis in Breeding Sheep
MLA AWI $3000
$6000 2008/09
Cobotics – purpose is to develop a novel human-assist robot to improve the ergonomics of manual heat processing operations, especially in the area of boning
AMPC MLA
$14,980 $7,133 (mla) 16 years
Foetal manipulations using therapeutics MLA AWI - $89,249
$178,000 07/08-09/10
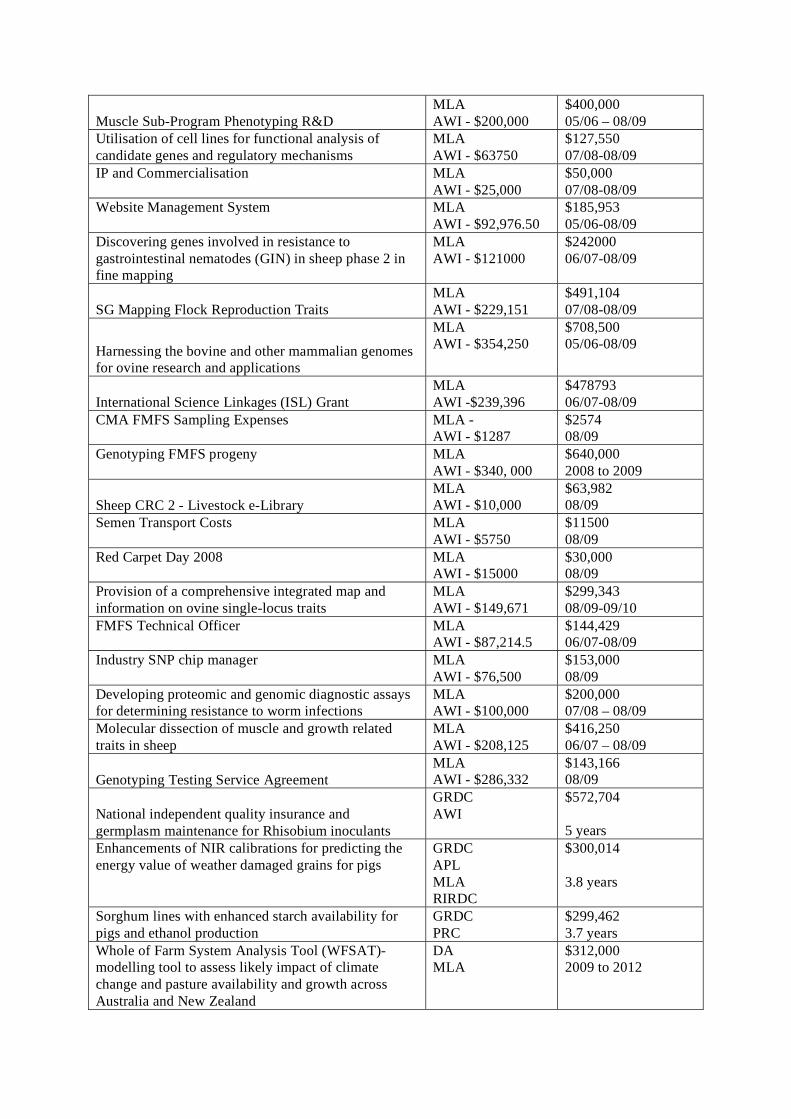
Muscle Sub-Program Phenotyping R&D MLA AWI - $200,000
$400,000 05/06 – 08/09
Utilisation of cell lines for functional analysis of candidate genes and regulatory mechanisms
MLA AWI - $63750
$127,550 07/08-08/09
IP and Commercialisation MLA AWI - $25,000
$50,000 07/08-08/09
Website Management System MLA AWI - $92,976.50
$185,953 05/06-08/09
Discovering genes involved in resistance to gastrointestinal nematodes (GIN) in sheep phase 2 in fine mapping
MLA AWI - $121000
$242000 06/07-08/09
SG Mapping Flock Reproduction Traits MLA AWI - $229,151
$491,104 07/08-08/09
Harnessing the bovine and other mammalian genomes for ovine research and applications
MLA AWI - $354,250
$708,500 05/06-08/09
International Science Linkages (ISL) Grant MLA AWI -$239,396
$478793 06/07-08/09
CMA FMFS Sampling Expenses MLA - AWI - $1287
$2574 08/09
Genotyping FMFS progeny MLA AWI - $340, 000
$640,000 2008 to 2009
Sheep CRC 2 - Livestock e-Library MLA AWI - $10,000
$63,982 08/09
Semen Transport Costs MLA AWI - $5750
$11500 08/09
Red Carpet Day 2008 MLA AWI - $15000
$30,000 08/09
Provision of a comprehensive integrated map and information on ovine single-locus traits
MLA AWI - $149,671
$299,343 08/09-09/10
FMFS Technical Officer MLA AWI - $87,214.5
$144,429 06/07-08/09
Industry SNP chip manager MLA AWI - $76,500
$153,000 08/09
Developing proteomic and genomic diagnostic assays for determining resistance to worm infections
MLA AWI - $100,000
$200,000 07/08 – 08/09
Molecular dissection of muscle and growth related traits in sheep
MLA AWI - $208,125
$416,250 06/07 – 08/09
Genotyping Testing Service Agreement MLA AWI - $286,332
$143,166 08/09
National independent quality insurance and germplasm maintenance for Rhisobium inoculants
GRDC AWI
$572,704 5 years
Enhancements of NIR calibrations for predicting the energy value of weather damaged grains for pigs
GRDC APL MLA RIRDC
$300,014 3.8 years
Sorghum lines with enhanced starch availability for pigs and ethanol production
GRDC PRC
$299,462 3.7 years
Whole of Farm System Analysis Tool (WFSAT)- modelling tool to assess likely impact of climate change and pasture availability and growth across Australia and New Zealand
DA MLA
$312,000 2009 to 2012
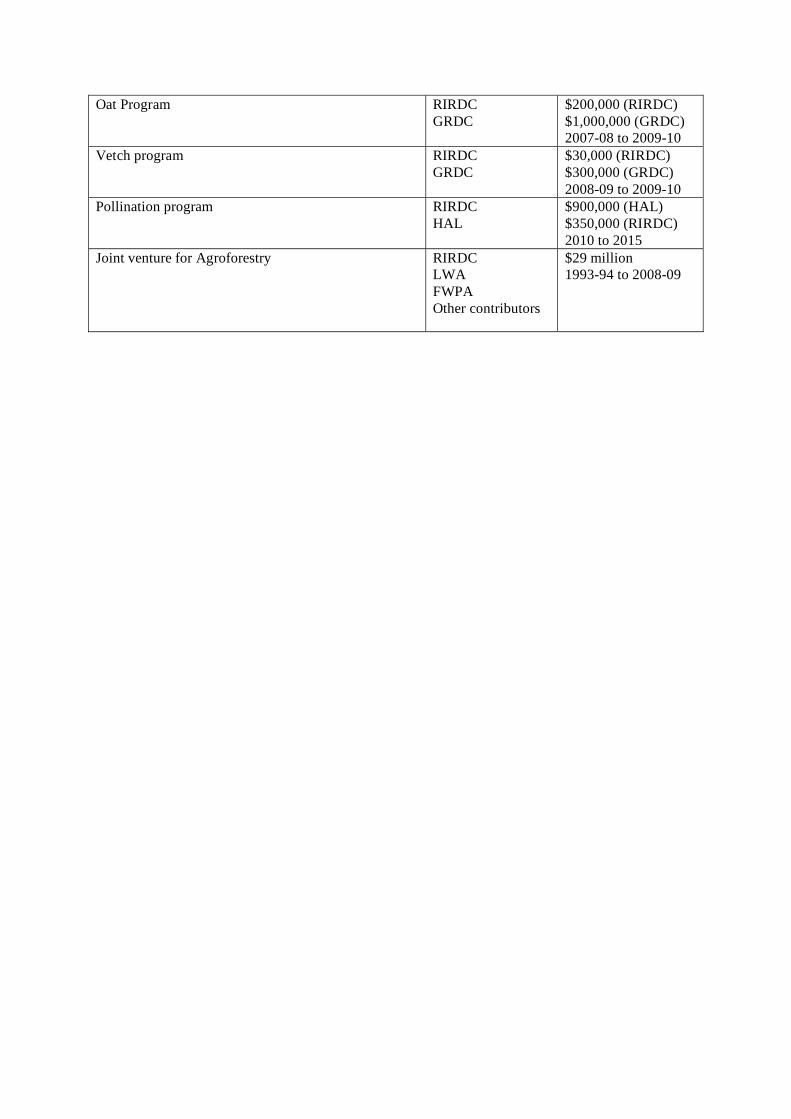
Oat Program RIRDC GRDC
$200,000 (RIRDC) $1,000,000 (GRDC) 2007-08 to 2009-10
Vetch program RIRDC GRDC
$30,000 (RIRDC) $300,000 (GRDC) 2008-09 to 2009-10
Pollination program RIRDC HAL
$900,000 (HAL) $350,000 (RIRDC) 2010 to 2015
Joint venture for Agroforestry RIRDC LWA FWPA Other contributors
$29 million 1993-94 to 2008-09
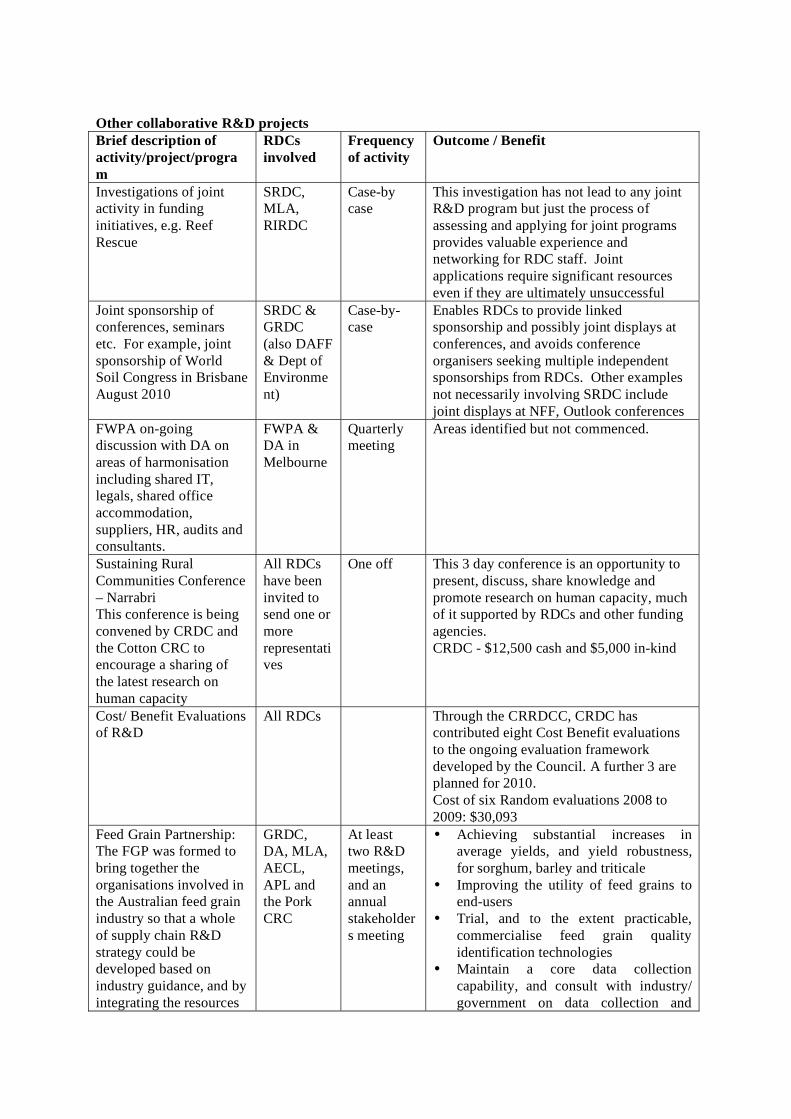
Other collaborative R&D projects Brief description of activity/project/program
RDCs involved
Frequency of activity
Outcome / Benefit
Investigations of joint activity in funding initiatives, e.g. Reef Rescue
SRDC, MLA, RIRDC
Case-by case
This investigation has not lead to any joint R&D program but just the process of assessing and applying for joint programs provides valuable experience and networking for RDC staff. Joint applications require significant resources even if they are ultimately unsuccessful
Joint sponsorship of conferences, seminars etc. For example, joint sponsorship of World Soil Congress in Brisbane August 2010
SRDC & GRDC (also DAFF & Dept of Environment)
Case-by-case
Enables RDCs to provide linked sponsorship and possibly joint displays at conferences, and avoids conference organisers seeking multiple independent sponsorships from RDCs. Other examples not necessarily involving SRDC include joint displays at NFF, Outlook conferences
FWPA on-going discussion with DA on areas of harmonisation including shared IT, legals, shared office accommodation, suppliers, HR, audits and consultants.
FWPA & DA in Melbourne
Quarterly meeting
Areas identified but not commenced.
Sustaining Rural Communities Conference – Narrabri This conference is being convened by CRDC and the Cotton CRC to encourage a sharing of the latest research on human capacity
All RDCs have been invited to send one or more representatives
One off This 3 day conference is an opportunity to present, discuss, share knowledge and promote research on human capacity, much of it supported by RDCs and other funding agencies. CRDC - $12,500 cash and $5,000 in-kind
Cost/ Benefit Evaluations of R&D
All RDCs Through the CRRDCC, CRDC has contributed eight Cost Benefit evaluations to the ongoing evaluation framework developed by the Council. A further 3 are planned for 2010. Cost of six Random evaluations 2008 to 2009: $30,093
Feed Grain Partnership: The FGP was formed to bring together the organisations involved in the Australian feed grain industry so that a whole of supply chain R&D strategy could be developed based on industry guidance, and by integrating the resources
GRDC, DA, MLA, AECL, APL and the Pork CRC
At least two R&D meetings, and an annual stakeholders meeting
• Achieving substantial increases in average yields, and yield robustness, for sorghum, barley and triticale
• Improving the utility of feed grains to end-users
• Trial, and to the extent practicable, commercialise feed grain quality identification technologies
• Maintain a core data collection capability, and consult with industry/ government on data collection and
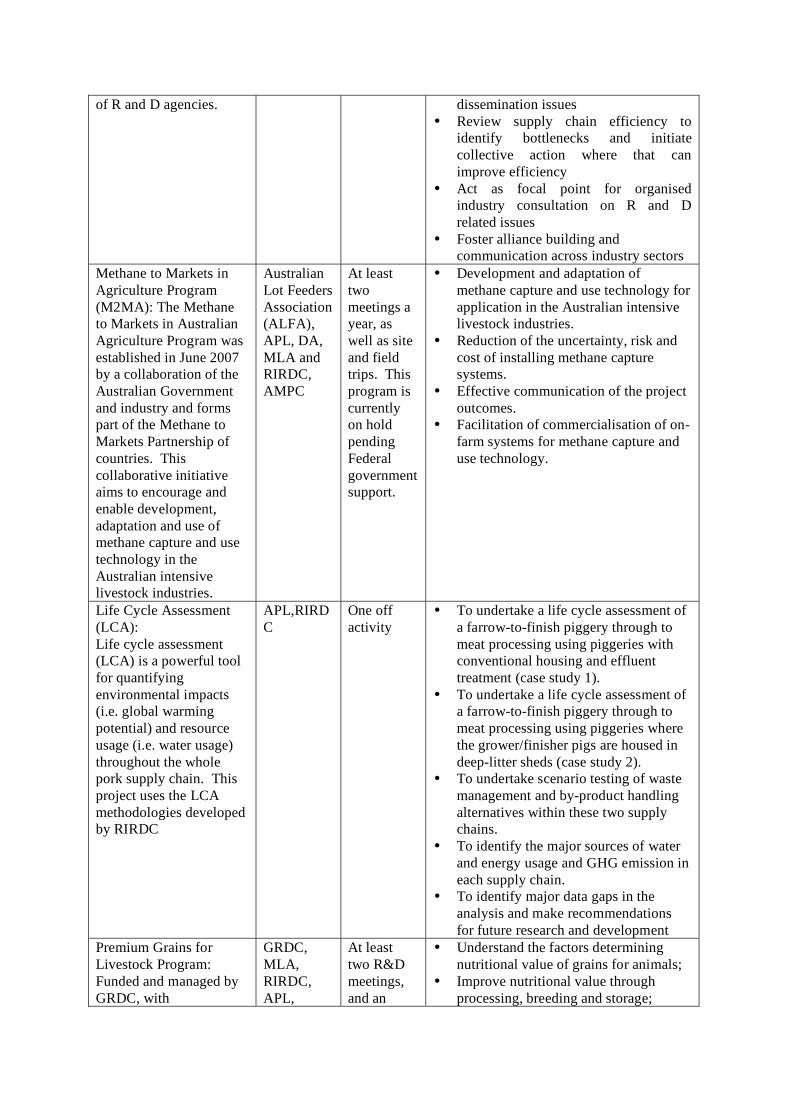
of R and D agencies. dissemination issues • Review supply chain efficiency to
identify bottlenecks and initiate collective action where that can improve efficiency
• Act as focal point for organised industry consultation on R and D related issues
• Foster alliance building and communication across industry sectors
Methane to Markets in Agriculture Program (M2MA): The Methane to Markets in Australian Agriculture Program was established in June 2007 by a collaboration of the Australian Government and industry and forms part of the Methane to Markets Partnership of countries. This collaborative initiative aims to encourage and enable development, adaptation and use of methane capture and use technology in the Australian intensive livestock industries.
Australian Lot Feeders Association (ALFA), APL, DA, MLA and RIRDC, AMPC
At least two meetings a year, as well as site and field trips. This program is currently on hold pending Federal government support.
• Development and adaptation of methane capture and use technology for application in the Australian intensive livestock industries.
• Reduction of the uncertainty, risk and cost of installing methane capture systems.
• Effective communication of the project outcomes.
• Facilitation of commercialisation of on-farm systems for methane capture and use technology.
Life Cycle Assessment (LCA): Life cycle assessment (LCA) is a powerful tool for quantifying environmental impacts (i.e. global warming potential) and resource usage (i.e. water usage) throughout the whole pork supply chain. This project uses the LCA methodologies developed by RIRDC
APL,RIRDC
One off activity
• To undertake a life cycle assessment of a farrow-to-finish piggery through to meat processing using piggeries with conventional housing and effluent treatment (case study 1).
• To undertake a life cycle assessment of a farrow-to-finish piggery through to meat processing using piggeries where the grower/finisher pigs are housed in deep-litter sheds (case study 2).
• To undertake scenario testing of waste management and by-product handling alternatives within these two supply chains.
• To identify the major sources of water and energy usage and GHG emission in each supply chain.
• To identify major data gaps in the analysis and make recommendations for future research and development
Premium Grains for Livestock Program: Funded and managed by GRDC, with
GRDC, MLA, RIRDC, APL,
At least two R&D meetings, and an
• Understand the factors determining nutritional value of grains for animals;
• Improve nutritional value through processing, breeding and storage;
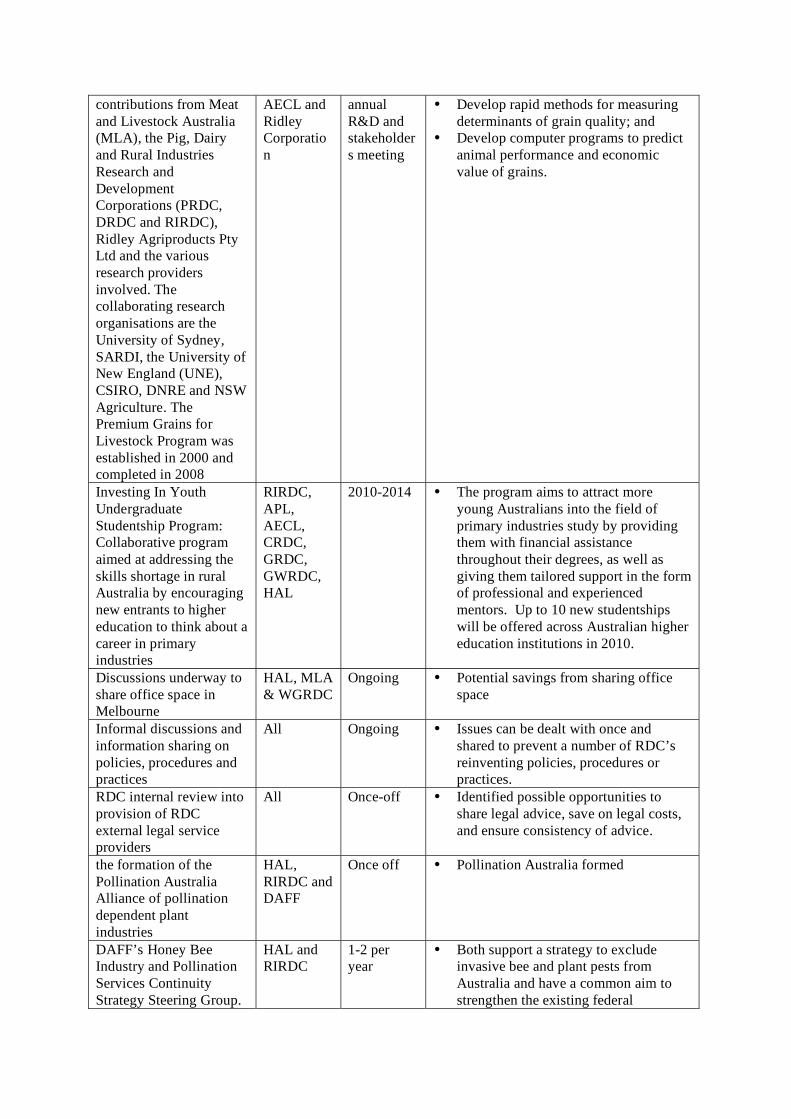
contributions from Meat and Livestock Australia (MLA), the Pig, Dairy and Rural Industries Research and Development Corporations (PRDC, DRDC and RIRDC), Ridley Agriproducts Pty Ltd and the various research providers involved. The collaborating research organisations are the University of Sydney, SARDI, the University of New England (UNE), CSIRO, DNRE and NSW Agriculture. The Premium Grains for Livestock Program was established in 2000 and completed in 2008
AECL and Ridley Corporation
annual R&D and stakeholders meeting
• Develop rapid methods for measuring determinants of grain quality; and
• Develop computer programs to predict animal performance and economic value of grains.
Investing In Youth Undergraduate Studentship Program: Collaborative program aimed at addressing the skills shortage in rural Australia by encouraging new entrants to higher education to think about a career in primary industries
RIRDC, APL, AECL, CRDC, GRDC, GWRDC, HAL
2010-2014 • The program aims to attract more young Australians into the field of primary industries study by providing them with financial assistance throughout their degrees, as well as giving them tailored support in the form of professional and experienced mentors. Up to 10 new studentships will be offered across Australian higher education institutions in 2010.
Discussions underway to share office space in Melbourne
HAL, MLA & WGRDC
Ongoing • Potential savings from sharing office space
Informal discussions and information sharing on policies, procedures and practices
All Ongoing • Issues can be dealt with once and shared to prevent a number of RDC’s reinventing policies, procedures or practices.
RDC internal review into provision of RDC external legal service providers
All Once-off • Identified possible opportunities to share legal advice, save on legal costs, and ensure consistency of advice.
the formation of the Pollination Australia Alliance of pollination dependent plant industries
HAL, RIRDC and DAFF
Once off • Pollination Australia formed
DAFF’s Honey Bee Industry and Pollination Services Continuity Strategy Steering Group.
HAL and RIRDC
1-2 per year
• Both support a strategy to exclude invasive bee and plant pests from Australia and have a common aim to strengthen the existing federal
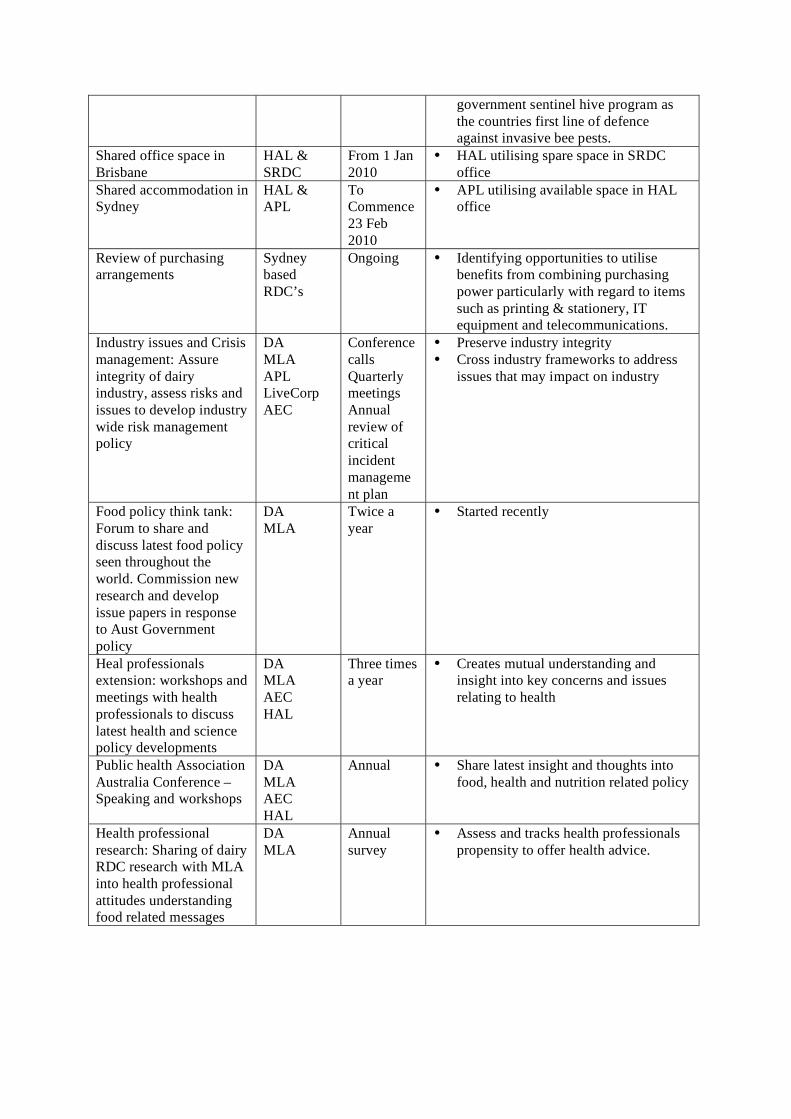
government sentinel hive program as the countries first line of defence against invasive bee pests.
Shared office space in Brisbane
HAL & SRDC
From 1 Jan 2010
• HAL utilising spare space in SRDC office
Shared accommodation in Sydney
HAL & APL
To Commence 23 Feb 2010
• APL utilising available space in HAL office
Review of purchasing arrangements
Sydney based RDC’s
Ongoing • Identifying opportunities to utilise benefits from combining purchasing power particularly with regard to items such as printing & stationery, IT equipment and telecommunications.
Industry issues and Crisis management: Assure integrity of dairy industry, assess risks and issues to develop industry wide risk management policy
DA MLA APL LiveCorp AEC
Conference calls Quarterly meetings Annual review of critical incident management plan
• Preserve industry integrity • Cross industry frameworks to address
issues that may impact on industry
Food policy think tank: Forum to share and discuss latest food policy seen throughout the world. Commission new research and develop issue papers in response to Aust Government policy
DA MLA
Twice a year
• Started recently
Heal professionals extension: workshops and meetings with health professionals to discuss latest health and science policy developments
DA MLA AEC HAL
Three times a year
• Creates mutual understanding and insight into key concerns and issues relating to health
Public health Association Australia Conference – Speaking and workshops
DA MLA AEC HAL
Annual • Share latest insight and thoughts into food, health and nutrition related policy
Health professional research: Sharing of dairy RDC research with MLA into health professional attitudes understanding food related messages
DA MLA
Annual survey
• Assess and tracks health professionals propensity to offer health advice.
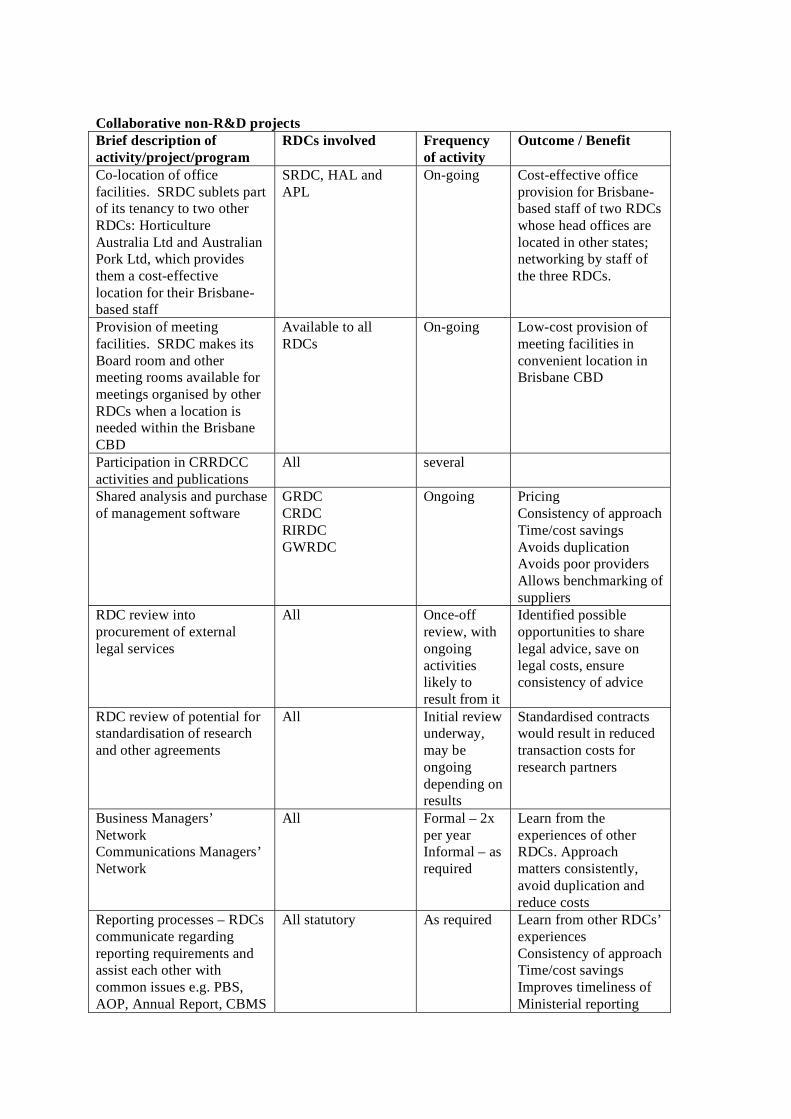
Collaborative non-R&D projects Brief description of activity/project/program
RDCs involved Frequency of activity
Outcome / Benefit
Co-location of office facilities. SRDC sublets part of its tenancy to two other RDCs: Horticulture Australia Ltd and Australian Pork Ltd, which provides them a cost-effective location for their Brisbane-based staff
SRDC, HAL and APL
On-going Cost-effective office provision for Brisbane-based staff of two RDCs whose head offices are located in other states; networking by staff of the three RDCs.
Provision of meeting facilities. SRDC makes its Board room and other meeting rooms available for meetings organised by other RDCs when a location is needed within the Brisbane CBD
Available to all RDCs
On-going Low-cost provision of meeting facilities in convenient location in Brisbane CBD
Participation in CRRDCC activities and publications
All several
Shared analysis and purchase of management software
GRDC CRDC RIRDC GWRDC
Ongoing Pricing Consistency of approach Time/cost savings Avoids duplication Avoids poor providers Allows benchmarking of suppliers
RDC review into procurement of external legal services
All Once-off review, with ongoing activities likely to result from it
Identified possible opportunities to share legal advice, save on legal costs, ensure consistency of advice
RDC review of potential for standardisation of research and other agreements
All Initial review underway, may be ongoing depending on results
Standardised contracts would result in reduced transaction costs for research partners
Business Managers’ Network Communications Managers’ Network
All Formal – 2x per year Informal – as required
Learn from the experiences of other RDCs. Approach matters consistently, avoid duplication and reduce costs
Reporting processes – RDCs communicate regarding reporting requirements and assist each other with common issues e.g. PBS, AOP, Annual Report, CBMS
All statutory As required Learn from other RDCs’ experiences Consistency of approach Time/cost savings Improves timeliness of Ministerial reporting
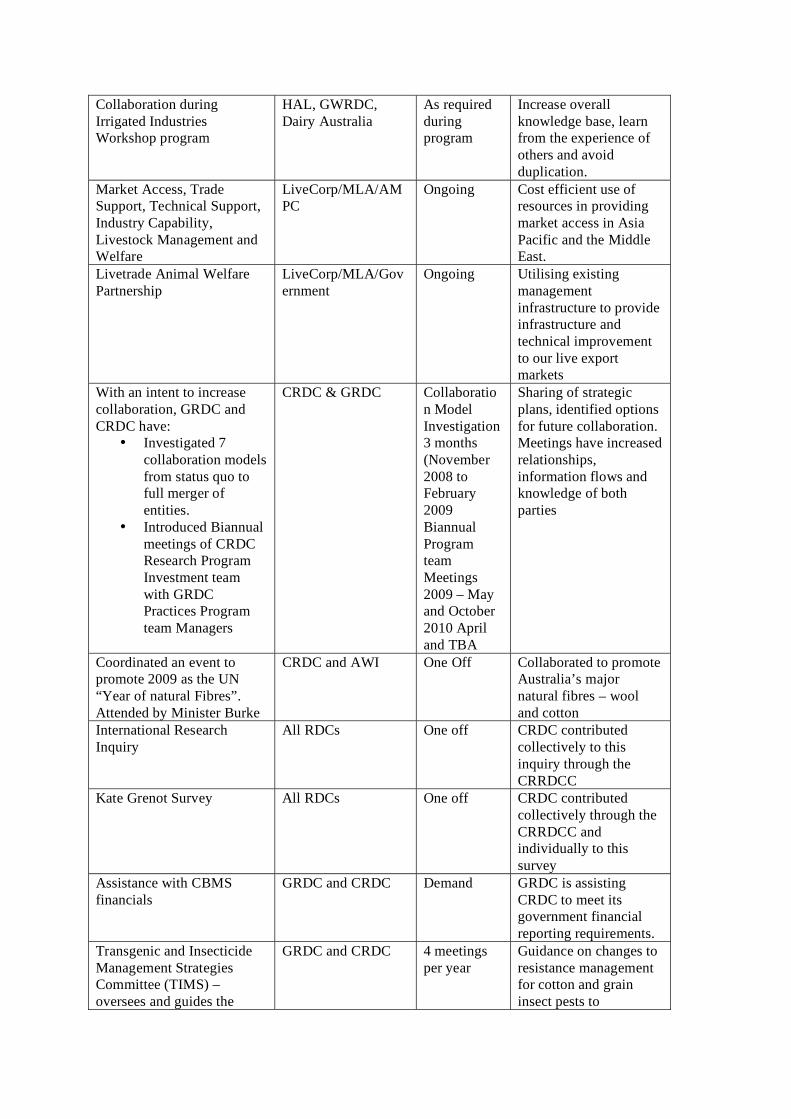
Collaboration during Irrigated Industries Workshop program
HAL, GWRDC, Dairy Australia
As required during program
Increase overall knowledge base, learn from the experience of others and avoid duplication.
Market Access, Trade Support, Technical Support, Industry Capability, Livestock Management and Welfare
LiveCorp/MLA/AMPC
Ongoing Cost efficient use of resources in providing market access in Asia Pacific and the Middle East.
Livetrade Animal Welfare Partnership
LiveCorp/MLA/Government
Ongoing Utilising existing management infrastructure to provide infrastructure and technical improvement to our live export markets
With an intent to increase collaboration, GRDC and CRDC have:
• Investigated 7 collaboration models from status quo to full merger of entities.
• Introduced Biannual meetings of CRDC Research Program Investment team with GRDC Practices Program team Managers
CRDC & GRDC Collaboration Model Investigation 3 months (November 2008 to February 2009 Biannual Program team Meetings 2009 – May and October 2010 April and TBA
Sharing of strategic plans, identified options for future collaboration. Meetings have increased relationships, information flows and knowledge of both parties
Coordinated an event to promote 2009 as the UN “Year of natural Fibres”. Attended by Minister Burke
CRDC and AWI One Off Collaborated to promote Australia’s major natural fibres – wool and cotton
International Research Inquiry
All RDCs One off CRDC contributed collectively to this inquiry through the CRRDCC
Kate Grenot Survey All RDCs One off CRDC contributed collectively through the CRRDCC and individually to this survey
Assistance with CBMS financials
GRDC and CRDC Demand GRDC is assisting CRDC to meet its government financial reporting requirements.
Transgenic and Insecticide Management Strategies Committee (TIMS) – oversees and guides the
GRDC and CRDC 4 meetings per year
Guidance on changes to resistance management for cotton and grain insect pests to
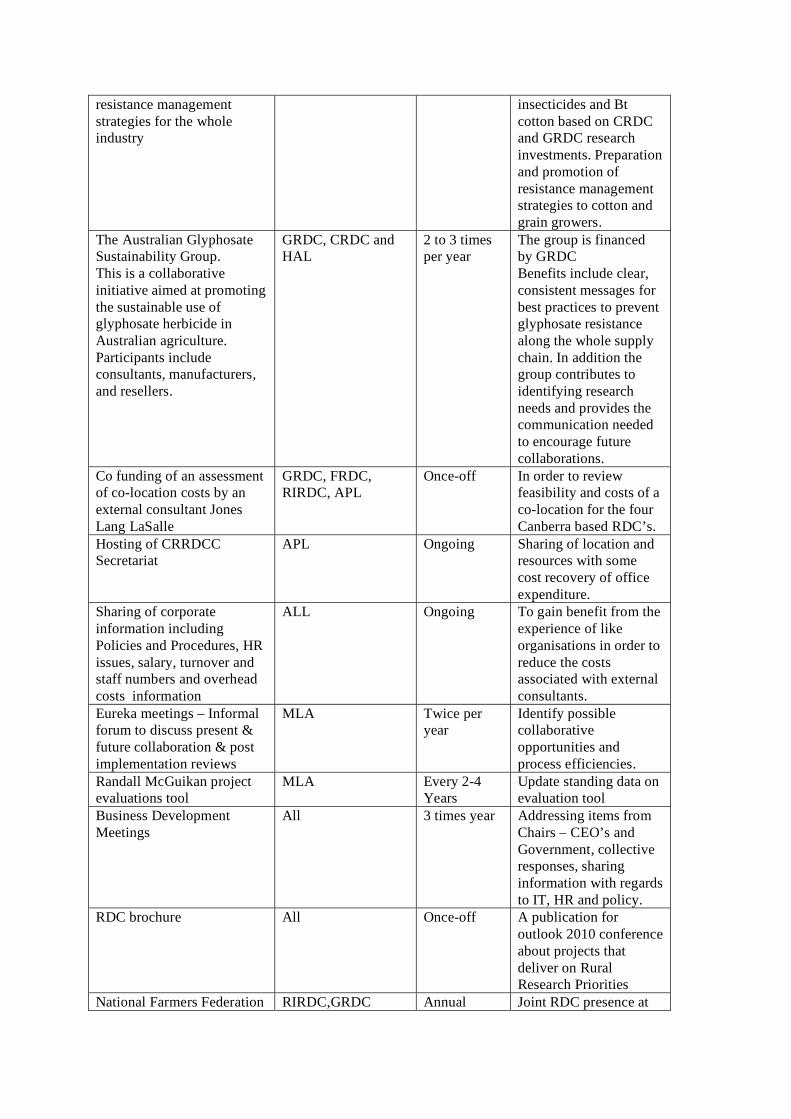
resistance management strategies for the whole industry
insecticides and Bt cotton based on CRDC and GRDC research investments. Preparation and promotion of resistance management strategies to cotton and grain growers.
The Australian Glyphosate Sustainability Group. This is a collaborative initiative aimed at promoting the sustainable use of glyphosate herbicide in Australian agriculture. Participants include consultants, manufacturers, and resellers.
GRDC, CRDC and HAL
2 to 3 times per year
The group is financed by GRDC Benefits include clear, consistent messages for best practices to prevent glyphosate resistance along the whole supply chain. In addition the group contributes to identifying research needs and provides the communication needed to encourage future collaborations.
Co funding of an assessment of co-location costs by an external consultant Jones Lang LaSalle
GRDC, FRDC, RIRDC, APL
Once-off In order to review feasibility and costs of a co-location for the four Canberra based RDC’s.
Hosting of CRRDCC Secretariat
APL Ongoing Sharing of location and resources with some cost recovery of office expenditure.
Sharing of corporate information including Policies and Procedures, HR issues, salary, turnover and staff numbers and overhead costs information
ALL Ongoing To gain benefit from the experience of like organisations in order to reduce the costs associated with external consultants.
Eureka meetings – Informal forum to discuss present & future collaboration & post implementation reviews
MLA Twice per year
Identify possible collaborative opportunities and process efficiencies.
Randall McGuikan project evaluations tool
MLA Every 2-4 Years
Update standing data on evaluation tool
Business Development Meetings
All 3 times year Addressing items from Chairs – CEO’s and Government, collective responses, sharing information with regards to IT, HR and policy.
RDC brochure All Once-off A publication for outlook 2010 conference about projects that deliver on Rural Research Priorities
National Farmers Federation RIRDC,GRDC Annual Joint RDC presence at
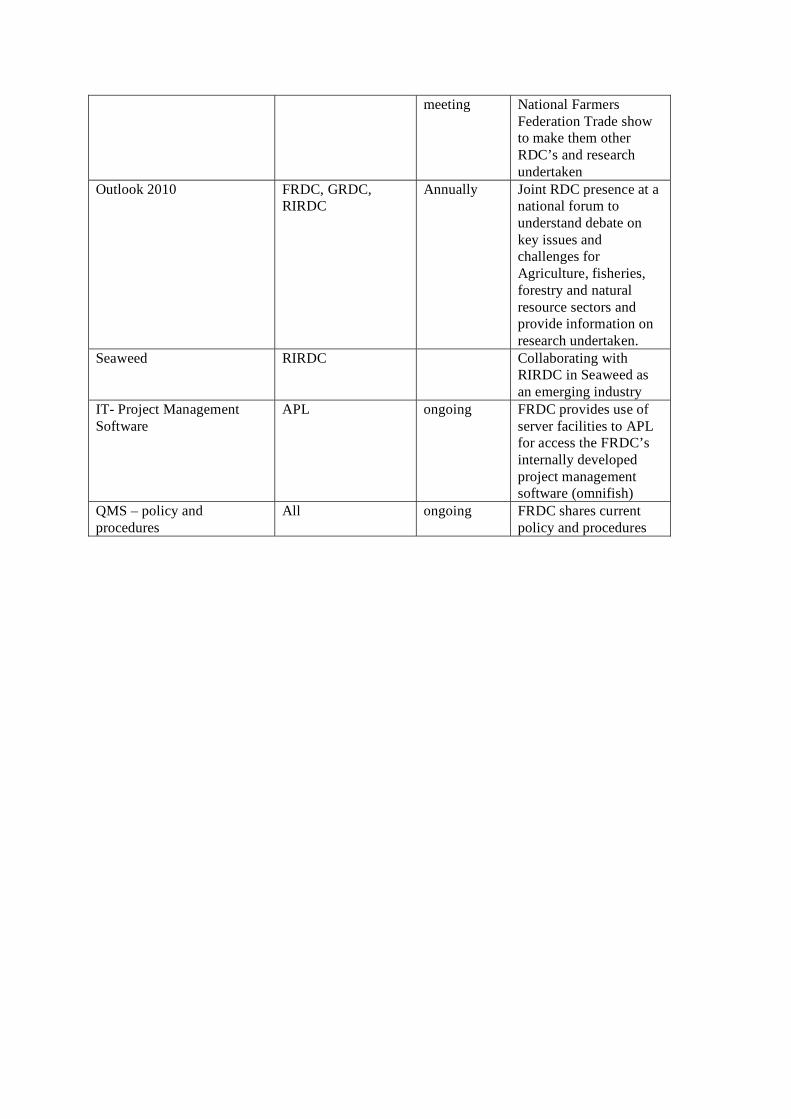
meeting National Farmers Federation Trade show to make them other RDC’s and research undertaken
Outlook 2010 FRDC, GRDC, RIRDC
Annually Joint RDC presence at a national forum to understand debate on key issues and challenges for Agriculture, fisheries, forestry and natural resource sectors and provide information on research undertaken.
Seaweed RIRDC Collaborating with RIRDC in Seaweed as an emerging industry
IT- Project Management Software
APL ongoing FRDC provides use of server facilities to APL for access the FRDC’s internally developed project management software (omnifish)
QMS – policy and procedures
All ongoing FRDC shares current policy and procedures
Appendix 4:
CRRDC evaluation methodology
CRRDC submission to the PC inquiry into the R&D corporations model, June 2010
i
Council of Rural Research and Development Corporation Chairs
Guidelines for Evaluation
Updated April 2009
ii
Contents 1 Purpose 1
2 Structure and process 2
3 Outputs 3
4 Governance 4 4.1 Independent review requirements 4 4.2 Transparency 5
5 Administration 5
6 Selection of projects for review 6 6.1 Sampled projects 6 6.2 The number of CBAs required 6 6.3 Major projects 7 6.4 Collaborative projects 7
7 Cost benefit methodology 8 7.1 General 8 7.2 Benefits 9
7.2.1 General 9 7.2.2 Industry benefits 9 7.2.3 Environmental benefits 10 7.2.4 Social benefits 11
7.3 Costs 11 7.4 The counterfactual 12 7.5 Treatment of uncertainty 13 7.6 Attribution of benefits 13
Attachment A: Real options 7.6.1 Strengths 7.6.2 Weaknesses
1
1 Background to this revision The first round of the evaluation process has been completed and the results published by the
CRRDCC. Overall the results were very well received by the Government and other interested parties. DAFF provided some specific comments on the first round that provide some guidance
for subsequent rounds. The main DAFF comments of relevance for the CBA analysis can be summarised as:
• Emphasis should be given in the CBAs to people development as well as empirical evidence of the value of R&D
• Better substantiation of the public benefits (more quantification where possible and commensurate with the benefits derived from evaluation of public benefits)
• It would be worthwhile to continue to test the counter factual
These comments provide a useful guide to the where additional emphasis should be placed on the CBA analysis conducted in this round of the evaluation process.
From an administrative perspective some standardization of the report would also assist in a more efficient aggregation and analysis of the results. The secretariat recognizes that the analysis
is conducted by a number of consultants under whose names the reports are published. This means that each consultancy has a style and format that they have developed to differentiate their
services which they would not want to diminish in this process. However, while we recognize these proprietary concerns we would encourage each consultant to consider where they could
accommodate a format similar to that of the FRDC, SRDC, and GRDC hero projects which can be found at http://www.ruralrdc.com.au/Page/Evaluation+/Highly+successful+projects.aspx
In addition to the a continuation of the CBA studies, the secretariat and the evaluation working group is investigating the development of a common set of environmental and social resource management issues that the RDC can report against. This will be the subject if investigation in
2009 for inclusion in the 2010 round of the evaluation process. For this year the CBAs are to look at environmental and social impacts on an ad hoc (specific to each project) basis.
2 Purpose This document sets out the guidelines for evaluation of the impact of the Research and
Development (R&D) programs funded by the RDCs.
The evaluation process has been established by the Council of Rural Research and Development Chairs (CRRDCC) to report on the:
• Overall returns from the RDCs collectively to industry.
• Public and spillover returns from the collective program.
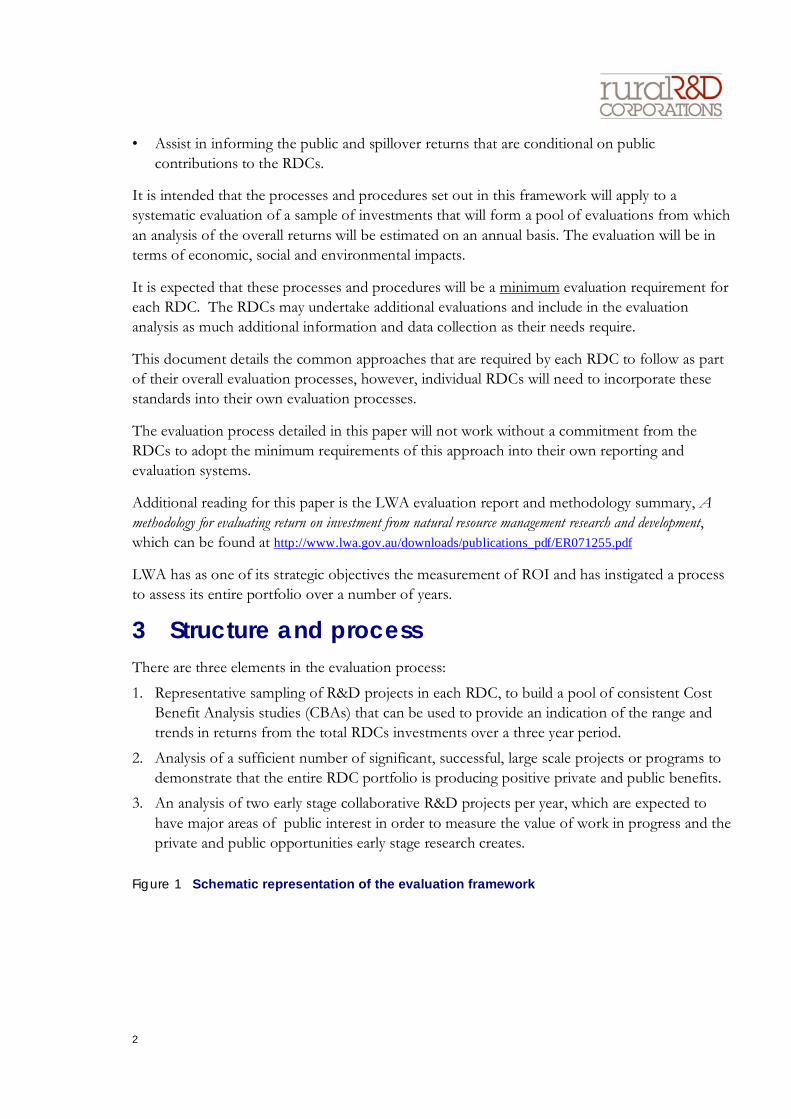
2
• Assist in informing the public and spillover returns that are conditional on public contributions to the RDCs.
It is intended that the processes and procedures set out in this framework will apply to a systematic evaluation of a sample of investments that will form a pool of evaluations from which
an analysis of the overall returns will be estimated on an annual basis. The evaluation will be in terms of economic, social and environmental impacts.
It is expected that these processes and procedures will be a minimum evaluation requirement for each RDC. The RDCs may undertake additional evaluations and include in the evaluation analysis as much additional information and data collection as their needs require.
This document details the common approaches that are required by each RDC to follow as part of their overall evaluation processes, however, individual RDCs will need to incorporate these standards into their own evaluation processes.
The evaluation process detailed in this paper will not work without a commitment from the RDCs to adopt the minimum requirements of this approach into their own reporting and evaluation systems.
Additional reading for this paper is the LWA evaluation report and methodology summary, A methodology for evaluating return on investment from natural resource management research and development, which can be found at http://www.lwa.gov.au/downloads/publications_pdf/ER071255.pdf
LWA has as one of its strategic objectives the measurement of ROI and has instigated a process to assess its entire portfolio over a number of years.
3 Structure and process There are three elements in the evaluation process:
1. Representative sampling of R&D projects in each RDC, to build a pool of consistent Cost Benefit Analysis studies (CBAs) that can be used to provide an indication of the range and trends in returns from the total RDCs investments over a three year period.
2. Analysis of a sufficient number of significant, successful, large scale projects or programs to demonstrate that the entire RDC portfolio is producing positive private and public benefits.
3. An analysis of two early stage collaborative R&D projects per year, which are expected to
have major areas of public interest in order to measure the value of work in progress and the private and public opportunities early stage research creates.
Figure 1 Schematic representation of the evaluation framework
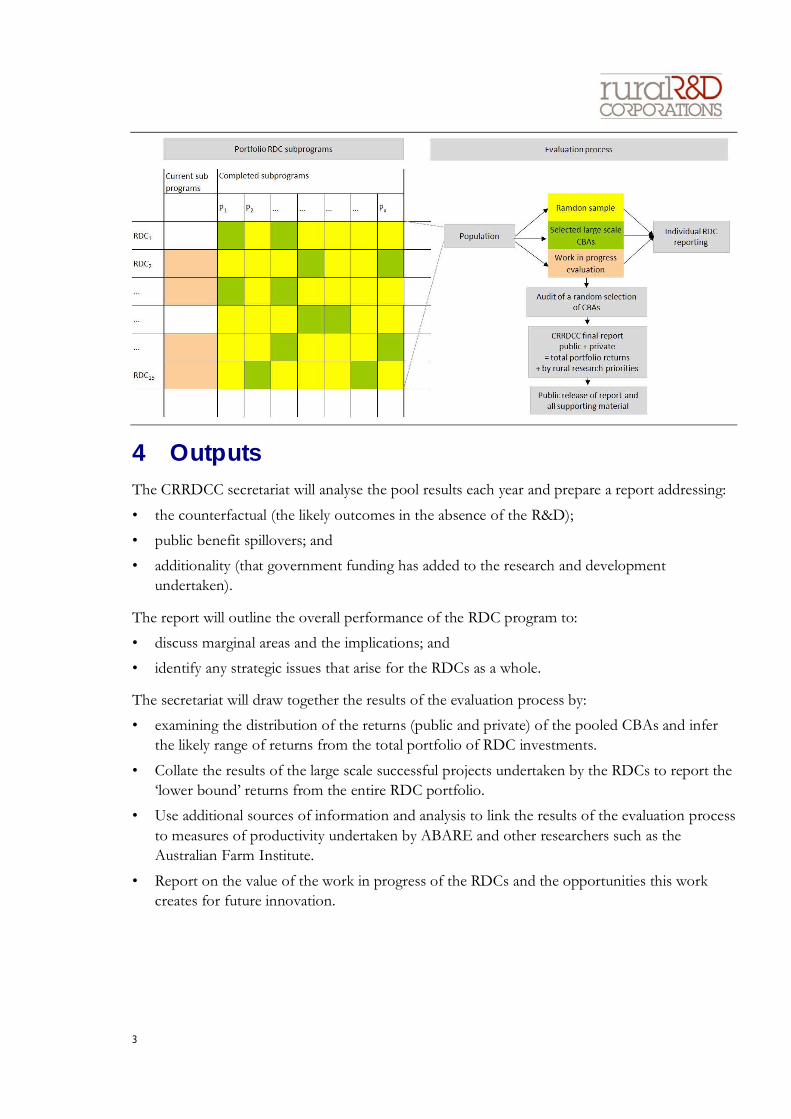
3
4 Outputs The CRRDCC secretariat will analyse the pool results each year and prepare a report addressing:
• the counterfactual (the likely outcomes in the absence of the R&D);
• public benefit spillovers; and
• additionality (that government funding has added to the research and development undertaken).
The report will outline the overall performance of the RDC program to:
• discuss marginal areas and the implications; and
• identify any strategic issues that arise for the RDCs as a whole.
The secretariat will draw together the results of the evaluation process by:
• examining the distribution of the returns (public and private) of the pooled CBAs and infer the likely range of returns from the total portfolio of RDC investments.
• Collate the results of the large scale successful projects undertaken by the RDCs to report the ‘lower bound’ returns from the entire RDC portfolio.
• Use additional sources of information and analysis to link the results of the evaluation process
to measures of productivity undertaken by ABARE and other researchers such as the Australian Farm Institute.
• Report on the value of the work in progress of the RDCs and the opportunities this work creates for future innovation.
4
5 Governance It is important that in implementing this framework outcomes are achieved that ensure that the
results of the evaluations are verifiable and based on a consistent approach across the RDCs. The governance framework proposed is based on consistency in the application of the methodology
and transparency of the analysis.
Consistency will be confirmed by an internal audit of the outcomes by ACIL Tasman supported by peer review across the RDCs.
Transparency will be achieved by ensuring that:
• the methodology proposed is publicly available;
• all of the results of the ACIL Tasman audit, peer review are publicly available on the CRRDCC website; and
• all of the CBAs and any other evaluation material are publicly available.
All of the CBAs must report on the key variables of the claimed benefits and how sensitive the results are to identified variables.
5.1 Independent review requirements It is likely that an independent review of the results be conducted at the end of the first three
years of the evaluation process. This would allow the evaluation process to undergo several iterations and a larger pool of randomly selected projects accumulated. The structure of the
independent review would be decided at the time but would likely follow the a set of guidelines such as:
• evaluate and make comments on the methodology;
• review any analysis conducted by the secretariat including the two large scale work in progress studies;
• review the final report prepared by the secretariat to ensure that the conclusion drawn are consistent with the data collected; and
• take account of the audit results.
Independent auditing would be conducted by an organisation at arms length from the Secretariat. The auditing body would also need the detailed knowledge of relevant agriculture sectors to enable it to examine the details of the CBAs it is auditing.
The audit process could:
• review the assumptions and quality of analysis of a random sample of the pooled CBAs; and
• review the assumptions and quality of the analysis of the entire large scale successful project CBAs.
Resolution of this matter is not a prerequisite to implementing the framework and would depend on the expressed needs of Government.

5
5.2 Transparency
The second theme of the governance of the evaluation process will be to ensure that all stages of the process are transparent. This will require that:
• the methodology proposed is publicly available;
• all of the results of the peer review, auditing and reference group reports are publicly available on the CRRDCC website; and
• all of the CBAs and any other evaluation material be publicly available.
All of the CBAs must report on the key variables of the claimed benefits and how sensitive the results are to each variable.
6 Administration The evaluation process will be administered by the CRRDCC through its Secretariat and the
results will be reported at the September CRRDCC meeting each year.
Cost benefit analyses are to be undertaken and funded by each of the RDCs. RDCs may use common consulting services when appropriate to reduce costs. The RDCs should consider
conducting the CBAs analysis through an open tender system.
The two large scale collaborative project evaluations per year will be undertaken by the secretariat under the secretariat contracts with the CRRDCC.
There are opportunities for the RDCs to collaborate strongly in this process in the following ways:
• sharing costs of developing research on adoption, and common assumptions such as currency projections and input costs;
• development of common project database software;
• some of the smaller RDCs may consider jointly employing evaluation project officers or
similar;
• meeting regularly to share information on the implementation and development of the process; and
• peer reviewing data collection, internal evaluation processes and evaluation results.
A sub-group of the RDC business managers has been formed to coordinate the evaluation process and provide a forum for RDC collaboration on this topic. Each RDC will have to make a
decision on how much it pools its resources with other RDCs or other research organizations undertaking R&D evaluation.
6
7 Selection of projects for review
7.1 Sampled projects
The aim of the first element of the evaluation framework is to collect over time a pool of CBAs which will provide an estimate of the distribution of returns for the collective program. In order
to keep the costs appropriate to the size and complexity of the program it will be necessary to create a representative sample of independent investments in R&D (i.e., projects that are not
substantively reliant on the results of others in the pool).
The population of sub-programs from which the random sample would be drawn will be based on a population that conforms to the following characteristics:
• A series of ‘clusters’ of projects commissioned to contribute to a particular defined area of investigation that was established to produce a particular product, service or other outcome. These may be subprograms or simply related projects leading to a specific outcome.
• The sampling process should be random, that is all defined sub programs or their equivalent should be put into the population from which the pooled samples will be drawn from.
• The ‘sub-program’ or cluster of projects must have reached (but not necessarily achieved) a
significant milestone within the last 2-5 years.
• The time frame for the population from which the sample will be drawn should be long enough for some confidence in the technology to be built (usually indicated by early adoption
rates) and for sufficient data to be available (such as ABS or ABARE survey reports).
• The pool of CBAs proposed will be based on a three year cycle. This means that the pool of sampled projects will initially be built up over three years once the process has been
implemented. Once the pool has been established, each subsequent year will be added and a year dropped off. This will provide a three year moving average with results published each
year.
• The program can be of either an off farm or on farm orientation (supply or demand focus).
The population from which the pooled CBAs will be drawn must include as close as practically possible the entire external delivery program investments of the RDC divided into sub programs or their equivalent.
7.2 The number of CBAs required The number of sub programs or their equivalent that will need to be the subject of the CBAs is
dependant on two things:
• the cost of preparing the CBAs; and
• the level of confidence that is sufficient to ensure the sample is adequate to provide a reliable indication of the returns from the total program.
It is important to ensure that cost of the evaluation process is commensurate with the benefits of
conducting it for each of the RDCs. As a general rule, the RDCs that are investing in evaluation
7
processes have been allocating around 0.5 per cent of their annual budgets for this purpose. This
provides a useful benchmark for this exercise.
To balance the budgetary concerns of the RDCs with the need to have a statistically robust sample, the sample mean will need to be within a maximum of 0.35 standard deviations of the
population mean and have a 90 per cent degree of confidence. As a general rule the smaller the population the greater the proportion of the population that needs to be sampled.
For an RDC with 40 sub programs or the equivalent; where the sample mean needs to be within 0.35 standard deviations of the population mean; and where 90 per cent confidence is required, a sample size of 14 sub programs (built up over three years) will be required.
As the sample is built up some bias may emerge such as large projects or specific areas of investigation may be producing higher returns. If bias does eventuate it may be necessary to introduce some stratification into the sample. However, this will only become apparent once a
sufficient number of pooled CBA results are collected. Stratification can be done at the population level or at the aggregation stage. Possible areas of stratification may include large and
small programs by value, or programs initiated to produce public, private or a combination of both types of benefits.
The secretariat will work with each of the RDCs to develop their sampling methodology to ensure consistency.
The RDCs should investigate ways to share costs as much as possible by:
• jointly tendering programs evaluations that are likely to share common data requirements;
• jointly tender for two or more CBAs to increase buying power; and
• share information and data sets between RDCs as much as practical.
7.3 Major projects The CRRDCC has decided that the major or ‘hero’ projects role in the evaluation methodology should be conducted on an as needed basis to demonstrate a particular aspect of the RDC
portfolio.
It is anticipated that each year the CRRDCC Executive Committee will decide:
• If a set of hero projects is warranted
• If hero projects are warranted what particular aspects of the RDCs they should report on.
Once it is recommended that a set of hero projects are desirable the RDCs can either work together on several large scale hero project evaluations or submit individual reports.
This ad hoc approach to the hero projects allows the CRRDCC to use the hero projects tactically as the need arises.
7.4 Collaborative projects The questions being asked in this phase of the evaluation process are quite different from the
ex-post CBA evaluations. The principle questions being answered with this analysis are:
8
• what is value of a sample of the RDC work in progress;
• what are the future private and public opportunities this work is creating;
• in some instances what the insurance value of R&D is, such as the value of contingency plans for the management of exotic pests and diseases, drought management tactics and projects
aimed at climate change mitigation; and
• are large scale collaborative projects increasing RDC R&D efficiency?
In most instances the results of this material are not likely to be directly additive to the results of
the ex-post CBAs but they will add an important dimension to the evaluation of the portfolio of investments of the RDCs.
Two large collaborative project or program evaluations of work in progress with significant public interest will be analysed by the secretariat each year. The projects will be selected by the secretariat based on advice from the collaboration working groups currently working on
increasing RDC collaboration. The secretariat will use an options framework, where necessary, to incorporate the potential for adaptive management of the programs under examination. This has
been outlined in an earlier report see attachment A.
8 Cost benefit methodology
8.1 General
The following are general guidelines for the conduct of the CBAs:
• CBAs should be on clusters of investments where outcomes can be reasonably estimated taking into account the likelihood of adoption or implementation.
• All projections and calculations should be in real terms (without escalating benefits and costs for inflation)
• All CBAs should report present values (NPVs) of net benefits (benefits minus costs); internal rates of return (IRRs)1; and benefit-to-cost ratios (BCRs) calculated using the present value of
benefits and costs. The Commonwealth Guidelines for benefit cost analysis should be followed in calculation of the net benefits (Handbook of Cost-Benefit Analysis 2006 found at
http://www.finance.gov.au/FinFramework/fc_2006_01.html)
• Adoption rates should be estimated conservatively and be tested for their sensitivity:
… the RDCs should keep a database of adoption rates used in past CBAs, and over time use these to cross-check and revise adoption rates.
1 Because the IRR calculation can have an inconsistency where a high IRR is calculated, a modified MIRR may also be used which
incorporates more conservative reinvestment rates. The Excel IRR and MIRR calculations should not be used. A template will be
developed with the appropriate calculations included and circulated by the Secretariat.
9
• CBAs should include sensitivity analysis on key variables or parameters once a benefit stream and costs have been calculated (e.g., if a project involves overseas markets, sensitivity analysis around exchange rate assumptions).
• A common discount rate of 5 per cent will be adopted for all CBAs:
• Common project horizons will be adopted:
… current year, 5, 10 and 20 year horizons (these are the minimum horizons and more can be added if required). It is noted that some R&D particularly natural resource
management is often considered to have much larger time frames for the benefits to be generated and the appropriate time horizons should be included in the evaluation
process
• Actual and anticipated benefit streams should also be included in the CBAs including the
reference points listed in the previous dot point. The benefit streams should be charted out so that a clear picture of when they expected to increase, peak and decline is described.
8.2 Benefits
8.2.1 General
It is important from an analytical point of view that the costs and benefits be fully identified – although not necessarily all of them need to be quantified. Each project should in its approval documentation include key success factors in terms of the output of the research and the
expected rate of adoption if successful. It is anticipated that occasionally a large unanticipated benefit will be identified and where this is the case an attempt should be made to measure and
quantify this.
All of the benefits should be allocated where possible to the Rural Research Priorities current at the time of completion of the project.
Also, all of the benefits will need to be clearly separated into those that are private and those that are public.
8.2.2 Industry benefits
These benefits are those that are captured by the industry sector that is contributing the levy funds (often referred to as internalised benefits).
A list of industry benefits is likely to include at least some of list below:
• to the levy payers and other industries in the supply chain in Australia:
… the value of improvements in productivity;
… the value of improvements in market share or market returns;
… the insurance value of preventative measures;
… the value of improving market access;
… the value in reducing risk or improving the sustainability of the business;
10
… the value of improved industry awareness;
• to research capability
… attracting and retaining researchers; and
… building technological capability relevant to Australia.
Where possible, industry benefits should be partitioned between those captured by levy payers and those that spillover into other industries in the supply chain. Consideration should also be
given in the report to the circumstances which effect how the benefits are shared between levy payers and others.
8.2.3 Environmental benefits
Environmental benefits generally will represent public good or spillover benefits although some may accrue to levy payers in terms of water, salinity and air quality and sustainable natural
resource management generally. These benefits are likely to include:
• improvements in water quality, environmental flows and salinity in both surface and groundwater;
• improvements natural resource management including wetlands, nature reserves and cultural values;
• improvement in the sustainability of areas of conservation value;
• improvements in air quality;
• improvements in soil conservation and management;
• preservation of endangered species;
• sustainable management of biologic resources;
• reduction in emissions of greenhouse gases;
• reduction in toxic waste; and
• safer use of agricultural and veterinary chemicals.
There is a wide range of credible methods for estimating environmental values including:
• benefits transfer;
• substitute cost method;
• hedonic pricing method;
• contingent valuation;
• choice modelling;
• travel cost method; and
• productivity method.
Most economic consulting firms would be aware of the strengths and weaknesses of each approach. In addition some governments provide data for calculation of environmental benefits. The NSW Government’s Envalue data base is one example of a data base of benefit assessments
11
of environmental values2. The Secretariat will provide guidance on each method should RDCs
require assistance.
8.2.4 Social benefits
Social benefits may be national or regional and could include:
• occupational health and safety;
• public health and mental health;
• creation of resilient regional communities;
• building innovation skills for industry;
• building research skills;
• animal welfare; and
• biosecurity.
The assessment of the impact on society will need to take into account the following issues:
• Does the project directly or indirectly impact on the wider public in Australia? If the answer is
Yes some analysis of the specific benefits should be undertaken. Examples of social benefits include:
… Has the technology reduced the burden of disease for all or some citizens or for workers in specific industries?
… Has the project results improved human capabilities that might be useful to other industries or communities
… Have there been improvements to animal welfare that are valued by, for example, non-farming members of the community?
• Document quantitatively and qualitatively any other social changes which have arisen as a result of the project, such as:
… Health-related spillovers, for example while vaccinations against infectious disease protect those who are vaccinated the same vaccination may also reduce the likelihood
of infection of unvaccinated people or animals, or improved diagnostic techniques may reduce contagion risks.
… Changes to community expectations, for example, changes in expectation about the extent and type of treatment that should be expected for animals with particular
conditions.
… Changes to skill sets required to work in the industry.
8.3 Costs
As the pooled CBAs are being collected to answer questions about marginal returns and investment decisions the RDCs costs allocated to the R&D program being analysed should be on
2 www.environment.nsw.gov.au/envalue/StudyCnt.asp
12
the same basis. That is the RDC costs that vary directly with the size of the project should be
included. For most RDCs this will be the direct project cost without any allocation of overheard, general administration or board costs.
All costs should be identified, for example, in addition to the direct costs of the research additional costs such as those below will need to be included:
– Costs involved in extension needs to be subtracted from the benefit stream, because
adoption cannot occur without these expenditures, and it is essential that they be clearly identified and reported in addition to the direct R&D.
– If the program is aimed at increasing demand for a product then any additional marketing expenses will also need to be deducted from the benefit stream also.
– All contributions from all contributors to the project will need to be included and clearly identified.
– Any industry costs of adoption such as changes to machinery, training increased input costs will also need to be subtracted from the benefit stream.
8.4 The counterfactual
There are two critical – and often interrelated – questions that a good cost-benefit analysis must
attempt to answer:
• what is likely to happen with the project, or what happened with the project? and
• what is likely to happen without the project or, what would have happened in the absence of the project (this is also known as the ‘counterfactual’ or ‘baseline scenario’)?
Many, if not most, CBAs focus exclusively on the first question, as this is what researchers who carry out the projects will primarily be focussed on and driven by. Individual researchers cannot
be expected to have an overall RDC portfolio perspective, nor do they specialise in analysing industry developments. However, at a higher strategic level RDC Business Managers should, and
should be able to, turn serious attention to the second question, because:
Benefits of a project = Benefits with the project minus benefits without the project
To better understand and to reflect in CBAs what might happen (or have happened) in the absence of a project, the case for market failure needs to be closely examined. Only if there is
demonstrated market failure, and if there are no other R&D institutions working on the same (or similar) problems either here or abroad, can one legitimately assume that ‘nothing’ will happen
(or would have happened) in the absence of the project. Key questions to ask are:
• would the R&D have been undertaken and/or would the benefits have been gained in the absence of the RDC involvement; and
• has the RDC brought forward a benefit?
The most obvious and commonly overlooked factor here relates to the well-known ‘productivity treadmill’ that is at work in agriculture. If it is known that in the past yields have, for example,
typically increased at 1.5 per cent per annum, then this should be recognised in the CBA. It
13
means that a project can rarely ‘claim’ the full yield increase that may have been observed
following the adoption of the technology.
Studying government’s and industry’s existing strategies or solutions, as well as activity known to be undertaken by other R&D providers, will result in a much better understanding of the
situation without a project. Use of the Internet can greatly facilitate this stage of analysis.
8.5 Treatment of uncertainty
Risk and uncertainty are likely to be identified in several ways:
• obsolescence of the technology caused by another invention or the nature of the industry changing;
• the risk that the technology will not perform as expected or the costs of implementing the technology are much higher than first thought; and/or
• adoption will not be as high as forecast.
The risk of obsolescence will be largely dealt with the inclusion of the 5, 10 and 15 years benefit reference points. Similarly adoption will be a significant variable and will need to be included in a
sensitivity analysis.
The risk of the technology not performing to expectations will need to be considered at some point during the evaluation process. As all of the CBAs will be conducted on an ex-post basis,
the level of risk of technology failure is likely to be small. The standard approach of this methodology is to assume a likely success rate that can be used to adjust the net benefits. For
instance the net benefit described can be multiplied by an estimated success factor established on a case by case basis.
As part of the governance of this process all CBAs should have a detailed analysis of the key variables of the expected benefits and how sensitive the analysis is to changes of them. In most instances that is likely to three to four key variables that have the most impact. This has been
covered in previous sections of this paper particularly in the CBA methodology and the governance section.
8.6 Attribution of benefits
Once the benefits have been described and quantified, and the counterfactual considered, the resulting total program benefits identified will have to be apportioned the organisations that
funded the project. In many instances it will be simply a matter of apportioning the benefits on the same basis as the funds were contributed. That is if the RDC contributed 50 per cent of a
program’s funding then 50 per cent of the benefits can be claimed.
However, this may not always be the case. In some instances the weighting may be different to the contributions due to factors that may include:
• valuable intellectual property that may not be available without the involvement of the party that owns it;

14
• the project may be contingent on imported technology; and
• the level and importance of in kind support for the project from other organisations.
In future attribution of the anticipated benefits should be agreed to at the commencement of the program by all parties involved, and a mechanism by which unanticipated benefits be attributed also be agreed to.
Appendix 5:
2008 and 2009 evaluation reports
CRRDC submission to the PC inquiry into the R&D corporations model, June 2010
.
Measuring economic,environmental andsocial returns from
Rural Researchand Development
Corporations’investment
December 2008
Page2
Acknowledgement
The Council of Rural Research and Development Corporations’ Chairswould like to acknowledge the 15 Rural Research and DevelopmentCorporations for their involvement in this project and the seveneconomic consultancies whose work was fundamental to thepreparation of this report.
Disclaimer
While every care has been taken to ensure accuracy, the Councilaccepts no responsibility for any action undertaken as result of relianceon this report.
Page3
ContentsSummary………………………………………………………………………………….. 5
Main report………………………………………………………………………………... 10
About the RDCs………………………………………………………………………... 10
Background……………………………………………………………………………... 10
Purpose of evaluation………………………………………….………………………. 11
Public benefits………………………………………………………………………….. 12
Methodology…………………………………………………………………………….. 12
The counterfactual……………………………………………………………………… 13
Results…………………………………………………………………………………... 13
Highly successful projects……………………………………………...……………... 14
Randomly selected projects…………………………………………............……………17
Value of RDC R&D collaboration as demonstrated by biosecurity and foodsafety... ………………………………………………………………...... ……………. 19
Collaboration………………………………………………………………………….… 20
National Rural Research Priorities………………………………………………........ 21
Public benefits………………………………………………………………………….. 23
Valuing public benefits…………………………………………………………………. 25
Consumer and industry benefits of the selected successful projects…….………. 26
Lessons from year one of the evaluation program…………………..……………... 26
Assessment of work in progress……………………………………….……………... 26
Responding to changing priorities……………………………………………………. 27
Path forward…………………………………………………………......……………... 27
Appendix 1 – Glossary of terms……………………………………….……………… 28
Appendix 2 – Methodology……………………………………………..……………… 30
Methodology……………………………………………………………..……………… 30
Project selection………………………………………………………………………... 30
Project outputs…………………………………………………………..……………… 30
Appendix 3 – Tables……………………………………………………..……………… 31
Pag
e4
List of acronyms and abbreviationsAAHL Australian Animal Health Laboratory
AARES Australian Agricultural and Resource Economic Society
ACRCP Australian Cereal Rust Control Program
AECL Australian Egg Corporation Limited
APL Australian Pork Limited
AWI Australian Wool Innovation
CIMMYT International Maize and Wheat Improvement Center
CRC Cooperative Research Centre
CRDC Cotton Research and Development Corporation
CRRDCC Council of Rural Research and Development Corporations’ Chairs
CSIRO Commonwealth Scientific and Industrial Research Organisation
DA Dairy Australia
FRDC Fisheries Research and Development Corporation
FWPA Forests and Wood Products Australia
GM genetically modified
GRDC Grains Research and Development Corporation
GWRDC Grape and Wine Research and Development Corporation
HAL Horticulture Australia Limited
LWA Land and Water Australia
MLA Meat and Livestock Australia
MPA Marine Protected Area
OH&S occupational health and safety
OJD Ovine Johnes disease
PV present values
R&D research and development
RDC Research and Development Corporation
RIRDC Rural Industries Research and Development Corporation
RRP Rural Research Priorities
SARDI South Australian Research and Development Institute
SRDC Sugar Research and Development Corporation
TBL triple bottom line
TVC total viable count
Note: All dollar amounts in this report relate to 2007 values.
Page5
SummaryIntroduction
Australia’s productivity growth, which is driven by innovation from investment in research, development andextension, puts the nation in a pre-eminent position to meet the growing global demand for primary industryproducts.
In part, this growth is generated by the rural Research and Development Corporations (RDCs). There are 15RDCs,
1 which form a partnership between industry and government. Their role is to prioritise, coordinate and
integrate the demands of industry and government with the capabilities of research providers.
The RDCs currently invest around $540 million per year in R&D (including marketing) to improve theprofitability and sustainability of rural industries and communities.
For every $1.00 contributed by the Australian Government, industry levies and contributions add a further$1.50, on average. This serves to leverage the total investment and create far greater benefits for Australiathan would otherwise be the case.
The structure of the RDCs and the extensive collaboration between the organisations involved promoteseffective research, development, innovation and extension of research findings in priority areas such asclimate change and natural resource management. The ability to tackle projects
2 jointly increases efficiency
and can result in more effective communication and uptake of the outcomes of R&D. This contributes directlyto the growth in productivity in Australian agriculture.
The RDCs embrace the Australian Government’s National Research Priorities and Rural Research andDevelopment Priorities in their investment, evaluation and reporting frameworks. Alignment with thesepriorities is a key consideration when setting strategic directions and making key investment decisions.
This report provides the results of the first year of an ongoing collective evaluation of the impact,effectiveness and return on investment from the RDCs. Further work by the RDCs over the next twoyears will build on these results. The evaluation was undertaken to provide robust and objective informationon the overall economic, social and environmental returns produced by the RDC portfolio. This is the largestevaluation of rural R&D undertaken so far in Australia.
Context and purpose
Individually, RDCs use a range of evaluation approaches to report value to stakeholders and to providerecommendations and guidelines for ongoing and future investment. In 2007 the RDCs agreed to worktogether to measure and report on the overall return on R&D investment. The methodology and approachdeveloped by the RDCs in this process will be of use to a wide range of R&D investors. This is particularlyimportant in the areas of social and environmental benefits where common tools and frameworks are stillevolving.
The projects assessed for this report include projects in the priority areas of improving productivity,developing supply chains and markets, and natural resource management. Climate change also featured ina number of projects. The evaluations were completed prior to the recent National Climate Change Research
Strategy for Primary Industries which is one of the RDCs’ major emerging areas of collaboration.
It is anticipated that this study will make an important contribution to the Government’s contemplation of theNational Innovation System Review.
1 There are 15 members of the Council of Rural Research and Development Corporations’ Chairs.
2 ‘Projects’ mean a group of investments made to produce a particular R&D outcome. This can apply to anindividual project or a group of projects with clearly defined innovation outcomes.
Page6
Evaluation framework
This evaluation focused on a sample of projects managed by the RDCs. It included projects that achievedsignificant milestones or had been completed between two and five years prior to 2006–07. This first stageevaluation report has three key components:
1. Examine the returns from 36 highly successful projects selected by the RDCs to demonstratepositive returns.
2. Examine the returns from 32 randomly selected projects (from a pool of over 600 projects relevantto the sampling period). The 32 projects, while not statistically representative of the pool, providegeneral insights into the performance of the RDC portfolio. This randomly selected group will beincreased in number in subsequent evaluations to allow statistically significant conclusions to bemade.
3. Examine and evaluate a sample of current RDC programs that involve collaboration and have ahigh level of national importance. The area of biosecurity and food safety R&D was the first to beselected for review and several different biosecurity projects were evaluated.
The Council of Rural Research and Development Corporations’ Chairs (CRRDCC) prepared the commonevaluation guidelines for this work. These guidelines were reviewed by key economic agencies of theAustralian Government including the:
• Treasury
• Department of Finance and Deregulation
• Department of Agriculture, Fisheries and Forestry
• Productivity Commission
• Australian Bureau of Agricultural and Resource Economics.
RDCs engaged economic consultants to undertake the evaluations. In total, a pool of seven consultanciesprepared the cost-benefit studies used as the basis of this evaluation report.
Results
The results from the first year of analysis show significant benefits from the investment by the RDCs:
• A sample of 36 highly successful projects will return $10.5 billion in quantified benefits.
• Of the $10.5 billion in quantified benefits, $5.5 billion will be private benefits (that is, benefitsaccruing to rural industries). The remaining $5.0 billion will be benefits captured by consumers, otherparticipants in the supply chain and the wider public.
• A sample of 32 randomly selected projects from the RDC portfolio will deliver an average return of$11 for each dollar invested (in 2007 dollars).
• A range of significant social and environmental benefits were identified which are distributed broadlyto the Australian community.
Page7
Background to results
The 36 highly successful projects will generate the $10.5 billion return from a $265 million investment bythe RDCs and a $200 million contribution from other funding partners. RDCs initiated and managed all 36projects.
The returns attributable to the RDCs’ $265 million investment – $5.9 billion – will more than pay for the entire$4.5 billion invested by RDCs across 600 projects over the past 10 years.
The purpose of examining the cost-benefit analyses from 36 highly successful projects was to establishthat RDC investment was delivering positive returns.
While choosing highly successful projects proved the capacity of RDC investments to generate compellingreturns, analysis of the 32 randomly selected projects from a pool of 600 relevant to the sampling periodgives a clearer indication of average returns across the portfolio.
While the focus of the current study was to evaluate the return on RDC investments, the evaluation also:
• demonstrates the strong collaboration between RDCs, rural industry, government and researchpartners
• shows that significant benefits are generated in areas targeted by the National Research Prioritiesand Rural Research and Development Priorities
• provides a sound basis for further combined evaluation work to:
– measure the value of RDC investments
– provide insights to individual RDCs about managing investments
– provide leadership in approaches to evaluation of innovation in Australia.
Public benefits
This evaluation process has identified many public benefits and quantified them where possible. Where ithas not been possible to quantify the benefits, the evaluation process uses a robust ‘weight of evidence’case – involving the accumulation of prima facie evidence of improvements in environmental and socialvalues for Australian society stemming from the RDC investments.
Taking both the highly successful and the randomly selected project groups into account, examples ofpublic benefits include:
• improved biodiversity and increased carbon sequestration
• reduced soil erosion and improved water quality
• a reduction in food-borne infectious diseases
• increased efficiency in water use, together with improved water quality for many rural industries
• improved biosecurity
• more sustainable use of natural resources
• increased adaptability of rural industries to climate change.
Many of these benefits have been achieved through the RDC’s coordination of projects that specificallyaddress both industry and government Rural Research Priorities.
Page8
A small sample of the public benefits that could be quantified includes:
• $503 million in social and related industry benefits in food safety from a Meat and Livestock Australia(MLA) investment of $2 million in food safety research
• $10 million that did not have to be spent on social adjustment for fishing industry-dependentcommunities had the proposed Marine Protected Areas (MPAs) been implemented in the proposedareas, rather than being relocated.
• $48 million of total quantifiable environmental benefits as a result of investment by Australian WoolInnovation (AWI), with contributions from Land and Water Australia (LWA) and MLA in the Land,Water and Wool project.
• $162 million in public benefits from improved water-use efficiency in rice production resulting fromexpenditure of $2 million.
The CRRDCC will invest in improving the methodology to quantify the assessment of social andenvironmental benefits for future evaluations.
While most of the evaluation process has focused on RDC impacts, there is also considerable value inmaintaining R&D capacity so that RDCs can absorb international innovations and respond to particularemergency needs as they arise. The maintenance of the RDC investment capacity gives Australianagriculture, fisheries and forestry a ‘seat at the international’ rural R&D table. Prominent examples of this are:
• the transfer of genetically modified cotton technology through the Cotton Research and DevelopmentCorporation (CRDC)
• Australia’s participation in international cereal breeding programs through Grains Research andDevelopment Corporation (GRDC) investments in the International Maize and Wheat ImprovementCenter (CIMMYT).
The evaluation of the RDCs has included an analysis of the insurance value of RDC biosecurity investments.
The RDCs have directly invested around $35 million per year on biosecurity projects in collaboration with anumber of organisations including the CRCs for Australian Biosecurity and National Plant Biosecurity,CSIRO, the Australian Animal Health Laboratory, Animal Health Australia and Plant Health Australia. Anassessment of three biosecurity projects indicated returns of $135.15 million over 10 years’ direct investmentof $1 million from several RDCs. The bulk of these benefits arose from reduced costs arising out of earlierdiagnosis of horse flu from technology developed originally to detect avian influenza.
Collaboration
Analysis shows 32 of the 36 highly successful projects (89 per cent) and 22 of the 32 randomly selectedprojects (69 per cent) involved collaborative funding.
RDCs have a unique perspective that is provided by their close engagement with industry and their intimateknowledge of market conditions that is not easily and regularly assessable either by government or theresearch community.
Additionally many of the RDCs have ensured collaboration by involving industry (from all parts of the valuechain) in boards, panels, reference groups, and specialised regional development groups. This hasenhanced capability, engagement and diffusion of knowledge.
Page9
Conclusions
It is clear from the results that the RDCs generate significant economic, social and environmental benefits forAustralia in key areas that have been determined as priorities by rural industries and the AustralianGovernment. Returns from a small number of highly successful projects are greater than the cost of thetotal investment in R&D. Further, a randomly selected set of projects shows a strong average return oninvestment across the portfolio.
Lessons have been learned from this initial year of evaluation that will be used to strengthen the ongoingevaluation. Social and environmental outcomes are difficult to quantify, leading to a likely understatement oftheir value. Improved tools and techniques are needed in these areas to be able to capture and value socialand environmental outcomes. This is particularly important in areas of priority to government policy makers.
Evaluation methodologies must be developed in conjunction with other non-RDC parties, to ensure that themeasures deliver maximum utility to key stakeholders. Ultimately, the results and methods will have valuewell beyond the RDCs themselves.
Page10
Main reportAbout the RDCs
There are 15 rural research and development corporations. Seven of the RDCs are statutory bodies and areadministered according to the Primary Industries and Energy Research and Development Act (1989) andeight are industry-owned companies (see Table 1 below). The industry-owned companies enter into acontract with the Australian Government enabling them to receive levies collected and matching funding.
The CRRDCC undertook this evaluation as part of their leadership role to ensure returns from industry andgovernment investment are maximised.
Table 1 Statutory and industry-owned RDCs
Statutory bodies
Cotton Research and Development Corporation CRDC
Fisheries Research and Development Corporation FRDC
Grains Research and Development Corporation GRDC
Grape and Wine Research and Development Corporation GWRDC
Land & Water Australia LWA
Rural Industries Research and Development Corporation RIRDC
Sugar Research and Development Corporation SRDC
Industry-owned companies
Australian Egg Corporation Limited AECL
Australian Pork Limited APL
Australian Wool Innovation AWI
Dairy Australia DA
Forests and Wood Products Australia FWPA
Horticulture Australia Limited HAL
LiveCorp LiveCorp
Meat and Livestock Australia MLA
Background
Agriculture feeds the world. The secure supply of food and natural fibre in the face of climate change andincreasing global population is one of the major challenges facing agriculture globally. The issues ofagricultural and food security and climate change mitigation and adaptation have been identified as keypriorities for government in the Review of the National Innovation System.
Page11
Australia is in a pre-eminent position to meet this growing demand for agricultural products throughproductivity growth, which is driven by innovation from investment in research, development and extension ofresearch findings.
In part, this growth is generated by the rural RDCs, which currently invest about $540 million per year(including marketing). RDC contributions comprise $325 million of industry levies
3 and $216 million of
Australian Government funds per year. Over the past 17 years, for every $1.00 that the AustralianGovernment has contributed, industry has contributed $1.50 on average. This substantial investmentaccounts for around 50 per cent of the R&D in the agricultural, fisheries and forestry industries undertaken inAustralia.
The structure of the RDCs and the extensive collaboration between the organisations involved promoteseffective research, development, innovation and extension of research findings in priority areas such asclimate change and natural resource management. The ability to tackle projects jointly increases efficiencyand can result in more effective communication and uptake of the outcomes of R&D.
Collaboration is critical to the success of the RDCs. Their role is to prioritise, coordinate, and integrate thedemands of industry and government with the capabilities of research providers.
Part of the Government’s rationale for the RDC model at the time it was set up (Hansard: 4/10/1989) was toprovide the Australian Government’s matching of up to 0.5 per cent of gross value of produce (GVP) asincentive or ‘seed money’ to encourage industries to invest more in R&D. The RDC model, based onindustry and government collaboration, is an effective working alliance between government, industry andresearch partners. It is a unique example of government–industry partnership benefitting both the industryand the wider community. The Australian RDC model is envied by our competitors in North America. Giventhe enormous and multidimensional current and future challenges in rural industries, this model forms animportant part of the innovation process in Australian agriculture, fisheries and forestry industries.
Purpose of evaluation
The RDCs communicate the value and returns of this investment to their industry and governmentstakeholders both individually and as a group through the CRRDCC.
In 2007 the CRRDCC initiated an ongoing aggregate evaluation reporting program to determine the impactand effectiveness of this major investment in innovation by the RDCs. The purpose of this aggregatereporting is to provide the government and industry with a robust demonstration of the value that the RDCsdeliver to their industries and to the broader community through the investment of industry and public funds.This is the largest evaluation of rural R&D undertaken so far in Australia.
Well-established methods exist for measuring economic benefits, and more recently evaluation hasexpanded to include social and environmental benefits through the use of ‘triple bottom line’ (TBL) reporting.Triple bottom line reporting captures a range of social and environmental impacts that include significantpublic good components whose benefits accrue to the wider community.
4
The TBL approach brings challenges to measuring broader public benefits. In most cases social andenvironmental goods are unpriced – that is, they have no monetary equivalent – and it is difficult to assign avalue to them. Methods for measuring environmental and social impacts are not yet established, yet theseindicators are of increasing importance for government policy.
The CRRDCC will take the outputs from this inaugural stage of the evaluation process to continue to build aframework for evaluation and reporting that is at the forefront of this field in Australia.
3 Most of these levies are compulsory, although some are voluntary. The majority of these contributions arebased on the value of production.4 For a definition of ‘public good’ and ‘public benefit’ see Appendix 1.
Page12
This will be the largest and most comprehensive evaluation program undertaken in Australian rural R&D. Itwill provide the member corporations and government with robust and objective information on the overalleconomic, social and environmental returns produced by the RDC portfolio. The lessons learned, particularlyin the areas of public benefit measurement and reporting across economic, environmental and socialbenefits, also have implications and uses beyond the RDC arena as many industries seek better ways toreport holistically on investment value.
This current report captures the results of the first year of the ongoing evaluation program. It demonstrates ahigh return on investment to the agriculture sector and to the wider community. The report is mindful of thecurrent interest in public support of rural R&D. Future decision making regarding the funding of rural R&D willrely on an understanding of the full range of benefits delivered through rural R&D. The outcomes of this firstcomprehensive review of RDCs investment will be an important step in helping to inform such deliberations.
Public benefits
Of the wide range of environmental and social benefits identified in the evaluation process, many accrue tothe wider public, and in the absence of the RDCs investments would not be produced. ‘Public benefits’ arethose benefits that accrue to a wide cross section of the community, and that many members of thecommunity would value highly and wish to ensure that they continued to be produced.
This evaluation process has identified many of these public benefits and quantified them where possible.Where it has not been possible to quantify the benefits, the evaluation process uses a robust ‘weight ofevidence’ case – involving the accumulation of prima facie evidence of improvements in environmental andsocial values for Australian society stemming from the RDC investments.
Methodology
The evaluation process included three elements.
1. Examination of the return of 36 specifically-selected highly successful projects. These highlysuccessful projects can be defined as having reached a stage where significant evidence ofdelivery was available.
2. Examination of the returns of 32 randomly selected projects from a pool of 600. These projectswere chosen at random from the entire range of projects in order to provide an indication of theaverage return to Australia from the RDC investment. Note that at this stage the results areconsidered indicative only, as it will take several years of such sampling to reach a level that wouldbe considered statistically significant.
3. Examination and evaluation of a sample of current RDC programs that involve collaboration andhave a high level of public interest. Biosecurity was the first area to be selected for review andseveral biosecurity projects were evaluated.
Project evaluations were undertaken by seven independent economic consultants commissioned byindividual RDCs. This has ensured that the evaluations are robust and independent. The process wascoordinated and the results have been compiled by the CRRDCC.
The consultants engaged to undertake the evaluations were required to use cost-benefit analysis methods toderive estimates of the value of investments made by RDCs in specific projects.
Evaluation guidelines were prepared by the CRRDCC. These guidelines were reviewed by the economicagencies of the Australian Government including the:
• Treasury
• Department of Finance and Deregulation
• Department of Agriculture Fisheries and Forestry
Page13
• Productivity Commission
• Australian Bureau of Agricultural and Resource Economics.
All of these agencies have supported the approach and methodology used, and have provided comments. Asummary of the terminology and methodology is presented in Appendices 1 and 2. The full methodology canbe found at www.ruralrdc.com.au.
The counterfactual
A component of the evaluation was the derivation of the counterfactual – that is, what would have otherwisehappened in the absence of funding support by the RDC for a specific investment.
By considering what might otherwise have eventuated, the estimated returns provide an indication of theincremental value to Australia of the RDC investment. However, in addition to the counterfactual forindividual projects, the RDCs are also investigating the counterfactual of the RDC model as a whole – that is,the amount of net benefits that would have been produced had the RDC model not been established.
The proposition is that a reduction in the pool of knowledge available to farmers – of which the RDC portfoliois a major component – reduces the rate of agricultural productivity growth over time. This proposition, to befurther tested by the RDCs as part of this evaluation process, is supported by the research findings of JohnMullen,
5 president of the Australian Agricultural and Resource Economic Society (AARES).
For each evaluation, consultants considered all benefits to Australia, in terms of economic, environmentaland social impacts. Where possible such impacts were quantified. Impacts that could not be quantified wereidentified and evaluated from a qualitative perspective. In future evaluations, consideration will be given todeveloping methods to either quantify such impacts in monetary terms or to use other metrics to expresstheir significance.
This report does not provide details of each evaluation undertaken. Individual evaluations can be found atwww.ruralrdc.com.au.
The purpose here is to provide a summary of evaluation results and to discuss the range of public benefitsand triple bottom line (TBL) impacts that can be generated from investments made by Australian RDCs.
Results
This section contains the results of the three evaluation approaches:
1. Highly successful projects – which showcase a selection of successful RDC projects anddemonstrate a positive return on RDC investment
2. Randomly selected sample projects – which give an indication of the average return on RDCinvestment
3. The value of RDC R&D collaboration in addressing key government priorities, specificallybiosecurity.
The results demonstrate the important and significant economic, social and environmental benefits deliveredby the RDCs. The quantified benefits alone show a return well in excess of the total level of investment bythe RDCs.
5 Mullen, J, (2007) Productivity growth and the returns from public investment in R&D in Australianagriculture. Presidential address to the 51st Annual Conference of AARES, 13–16 February 2007, Queenstown,New Zealand.
Page14
Significant non-quantified benefits have been reported, particularly in the social and environmental impactareas that address the Australian government’s rural research and development priorities. Understandingthese impacts is of increasing importance to government and RDC levy payers.
6
Highly successful projects
The 36 highly successful projects will generate the $10.5 billion return from a $265 million investment bythe RDCs and a $200 million contribution from other funding partners. RDCs initiated and managed all 36projects.
The returns attributable to the RDCs’ $265 million investment – $5.9 billion – will more than pay for the entire$4.5 billion invested by RDCs across 600 projects over the past 10 years.
Of the $10.5 billion in quantified benefits, $5.5 billion will be private benefits (that is, benefits accruing to ruralindustries). The remaining $5.0 billion will be benefits captured by consumers, other participants in thesupply chain and the wider public.
The purpose of examining the cost-benefit analyses from 36 highly successful projects was to establishthat RDC investment was delivering positive returns.
In several cases environmental benefits have been captured and quantified as economic benefits becausethey have identifiable market values. Water and waste management, for example, represent input costs foragricultural producers.
Further, the environmental and social impacts are underestimated because there are significant challengesin quantifying the environmental and social benefits and outcomes of the R&D driven by the RDCs. Thesechallenges include that:
• the tools, frameworks and standards are not fully developed – there need to be accepted standardsfor quantifying and reporting
• in some cases the market values available from robust analysis are clearly lower than the commonlyheld societal value.
The RDCs are leading the way on this front and will work together with government and research partners toaddress these challenges as part of this ongoing evaluation program.
The following sections provide a discussion of the economic, environmental and social benefits identified(see Table A3:3 and Table A3:4 in Appendix 3).
Economic benefits
Economic benefits accrue to agricultural and other enterprises in Australia. These benefits include:
• reduced production costs
• improved supply chain and markets
• increased royalties
• increased demand for primary products
• increased yield
• improved efficiency
• increased industry value add.
6 RDC levy payers are producers from whom a compulsory levy is collected to fund the activities of the RDC.For most RDCs, the amount of the compulsory levy is voted on regularly by the growers.
Page15
Non-measured economic benefits include:
• labour savings
• increased investment
• capital savings
• market development.
Analysis of the results reveals a wide range of economic benefits. Around $946 million were attributable toreducing costs from 10 projects and $189 million from increasing yield from two projects. In general termsthree projects delivered in total $285 million from increasing prices for primary products and two projectsdelivered $1.5 billion in total from increasing value add to primary commodities.
Specific examples of the types of economic benefits resulting from RDC investments are:
• The Australian Cereal Rust Control Program (ACRCP), which aimed to reduce the frequency andseverity of cereal rust outbreaks in grains, delivered benefits of $2144 million in total, while theGRDC component of the benefits was estimated to be $632 million.
• The Eating Quality for Beef and Sheep Meat program, which is aimed at improving the eating qualityof red-meat, will deliver substantial economic benefits, including:
– $1.1 billion in additional industry value
– $3.5 billion in additional consumer welfare.7
• The MLA Market Access Program was targeted at reducing and eliminating trade barriers and hasimproved access to markets that will deliver $415 million in additional industry value.
• Dairy Australia's Countdown Down Under program has delivered a significant reduction in theincidence of mastitis across the dairy herd. The total productivity gains and control cost savings fromthis program were evaluated at $225 million.
The projects also identified a range of non-quantified economic benefits including reduced costs, laboursavings, capital savings, improved markets and market development, increased yields and improvedproductivity.
Environmental benefits
Not all highly successful projects had quantified environmental benefits. Those which could be quantifieddemonstrated substantial returns. Three of the 36 projects produced $179 million in quantified benefits towater quality and biodiversity. The areas where benefits were identified include:
• increased water use efficiency – 16 per cent of projects
• improved water quality and biodiversity outcomes – 16 per cent of projects
• reduced chemical usage – 6 per cent of projects
• reduced waste – 3 per cent of projects
• reduced emissions of greenhouse gases or carbon sequestration – 5.5 per cent of projects
• improved land use and soils management – 16 per cent of projects
• reduced salinity – 6 per cent of projects.
7 These benefits are not included in the $10.5b of total benefits.
Page16
Social benefits
Social benefits that were quantified in 23 projects included:
• improved food safety and security – 8 per cent of projects
• increased profits for suppliers – 28 per cent of projects
• increased consumer welfare – 25 per cent of projects
• strengthening rural communities – 6 per cent of projects
• improved human health – 3 per cent of projects.
Additional social benefits that were not quantified included:
• improved human health – 14 per cent of projects
• improved occupational health and safety – 14 per cent of projects
• enhanced R&D research capability – 8 per cent of projects
• increased consumer welfare – 3 per cent of projects
• improved training – 8 per cent of projects
• animal welfare – 3 per cent of projects.
Examples of the types of social benefits resulting from RDC investments follow.
• ACRCP has enhanced food security through its involvement in an international collaboration for thescreening of varieties for the UG99 wheat stem rust strain. This fungal disease of wheat has beenidentified as a potentially significant threat to food supplies.
• The MLA Food Safety: Predictive Microbiology Project. MLA, in collaboration with regulatoryauthorities at both federal and state levels, has achieved the inclusion of R&D outcomes into newregulations which will yield additional social benefits, including reduced illness and death resultingfrom listeriosis plus spillover benefit to the pork industry. This benefit to society and related industrytotals $503 million, including an estimate of consumer welfare benefit.
• Dairy Australia's Dairy Food of Life program has led to an increase in the consumption of dairyproducts in Australia, delivering improved health outcomes as well as quantified consumer welfarebenefits of $209 million.
Time profile for delivering benefits
The time profile of delivery of the estimated private and public benefits from the successful projects isshown in Figure 1. Note that the present value of benefits accruing in each year increases to a maximumover the period up to 2010. After this the value of benefits are relatively level until around 2015 when theydecline slowly. This suggests that the significant component of the present value of benefits is realised in thefirst 15 years following the last year of funding of the project.
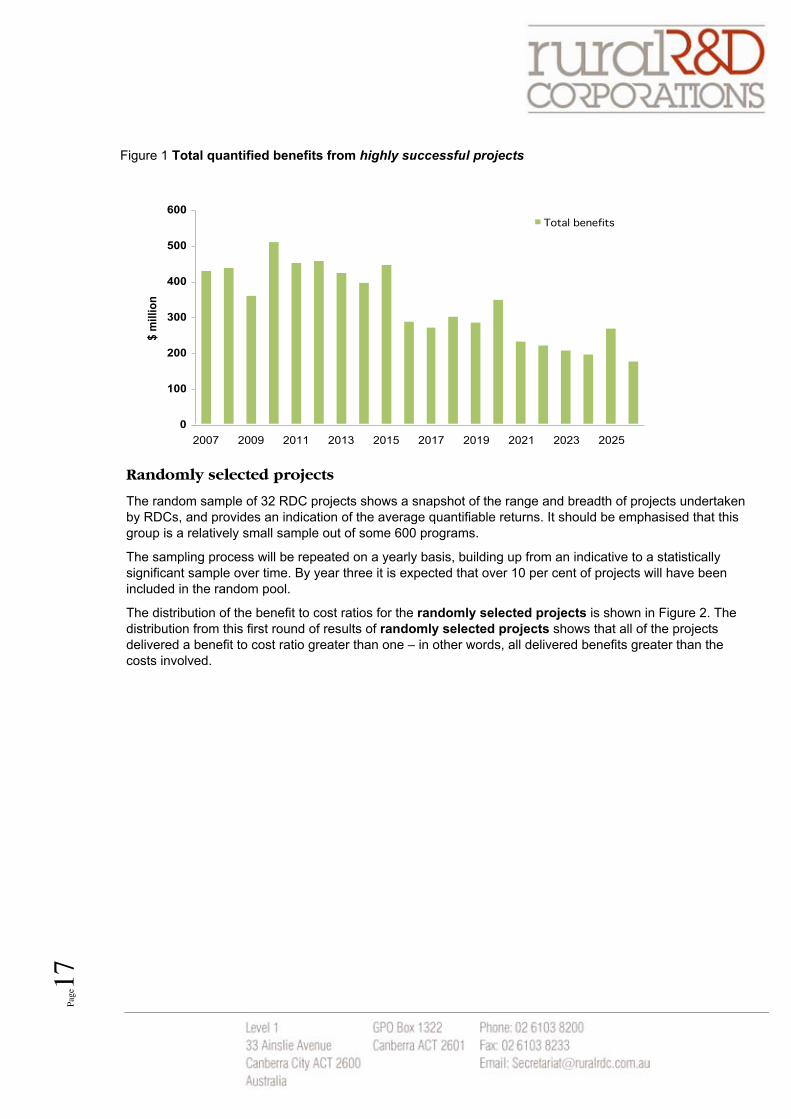
Page17
Figure 1 Total quantified benefits from highly successful projects
0
100
200
300
400
500
600
2007 2009 2011 2013 2015 2017 2019 2021 2023 2025
$ m
illio
n
Total benefits
Randomly selected projects
The random sample of 32 RDC projects shows a snapshot of the range and breadth of projects undertakenby RDCs, and provides an indication of the average quantifiable returns. It should be emphasised that thisgroup is a relatively small sample out of some 600 programs.
The sampling process will be repeated on a yearly basis, building up from an indicative to a statisticallysignificant sample over time. By year three it is expected that over 10 per cent of projects will have beenincluded in the random pool.
The distribution of the benefit to cost ratios for the randomly selected projects is shown in Figure 2. Thedistribution from this first round of results of randomly selected projects shows that all of the projectsdelivered a benefit to cost ratio greater than one – in other words, all delivered benefits greater than thecosts involved.
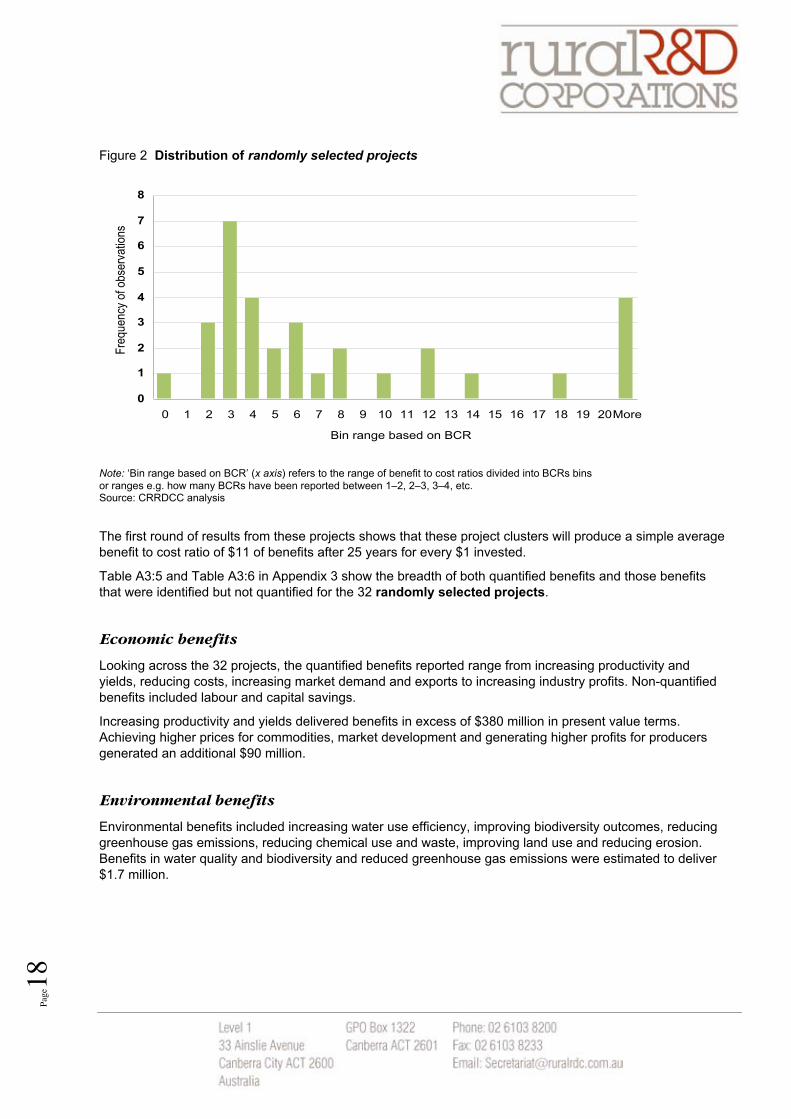
Page18
Figure 2 Distribution of randomly selected projects
0
1
2
3
4
5
6
7
8
0 1 2 3 4 5 6 7 8 9 10 11 12 13 14 15 16 17 18 19 20More
Bin range based on BCR
Fre
quency
of obse
rvatio
ns
Note: ‘Bin range based on BCR’ (x axis) refers to the range of benefit to cost ratios divided into BCRs binsor ranges e.g. how many BCRs have been reported between 1–2, 2–3, 3–4, etc.Source: CRRDCC analysis
The first round of results from these projects shows that these project clusters will produce a simple averagebenefit to cost ratio of $11 of benefits after 25 years for every $1 invested.
Table A3:5 and Table A3:6 in Appendix 3 show the breadth of both quantified benefits and those benefitsthat were identified but not quantified for the 32 randomly selected projects.
Economic benefits
Looking across the 32 projects, the quantified benefits reported range from increasing productivity andyields, reducing costs, increasing market demand and exports to increasing industry profits. Non-quantifiedbenefits included labour and capital savings.
Increasing productivity and yields delivered benefits in excess of $380 million in present value terms.Achieving higher prices for commodities, market development and generating higher profits for producersgenerated an additional $90 million.
Environmental benefits
Environmental benefits included increasing water use efficiency, improving biodiversity outcomes, reducinggreenhouse gas emissions, reducing chemical use and waste, improving land use and reducing erosion.Benefits in water quality and biodiversity and reduced greenhouse gas emissions were estimated to deliver$1.7 million.
Page19
Social benefits
Social benefits included improving human health, increasing consumer welfare, improving animal health,improving occupational health and safety for employees, increasing building research and developmentcapacity, strengthening rural communities and education, and training.
Quantified improvements in human health, and increases in consumer welfare and animal health werevalued at around $14 million. In addition, increased profits for related and supporting industries wereestimated at $29 million. Projects enhancing consumer ‘happiness’ produced benefits of $115 million.
Value of RDC R&D collaboration as demonstrated by biosecurity and food safety
An important area of investment by the RDCs has been in improving the prevention, preparedness andresponses to biosecurity and food safety threats in Australia. The RDCs have directly invested around $35million per year on biosecurity projects in collaboration with a number of organisations including the CRCs forAustralian Biosecurity and National Plant Biosecurity, CSIRO, the Australian Animal Health Laboratory,Animal Health Australia and Plant Health Australia. This current report has evaluated a series of investmentsby the RDCs in biosecurity research. These investments are in:
• tests for detection of poultry disease and the transfer of avian influenza tests to laboratories inAustralia
• the development of predictive microbiology in red meat
• research on procedures for Ovine Johnes disease (OJD), which is a wasting disease of sheep.
The returns attributable to the RDC investment and the nature of the benefits are summarised in Table 2.This table shows total returns in excess of $135.15 million against expenditure of about $1 million by theRDCs. The bulk of these benefits arise from the impacts of the reduced cost (due to earlier diagnosis of thedisease) of responding to avian influenza and horse flu virus. The equine influenza project illustrates theoptions value in research and development where research carried out to develop better tests for avianinfluenza was found to also benefit the management of horse flu. The RDCs contributed to the transfer of thetesting methods to other laboratories, which has led to the extension of the testing to areas outside theimmediate concern of avian influenza testing.
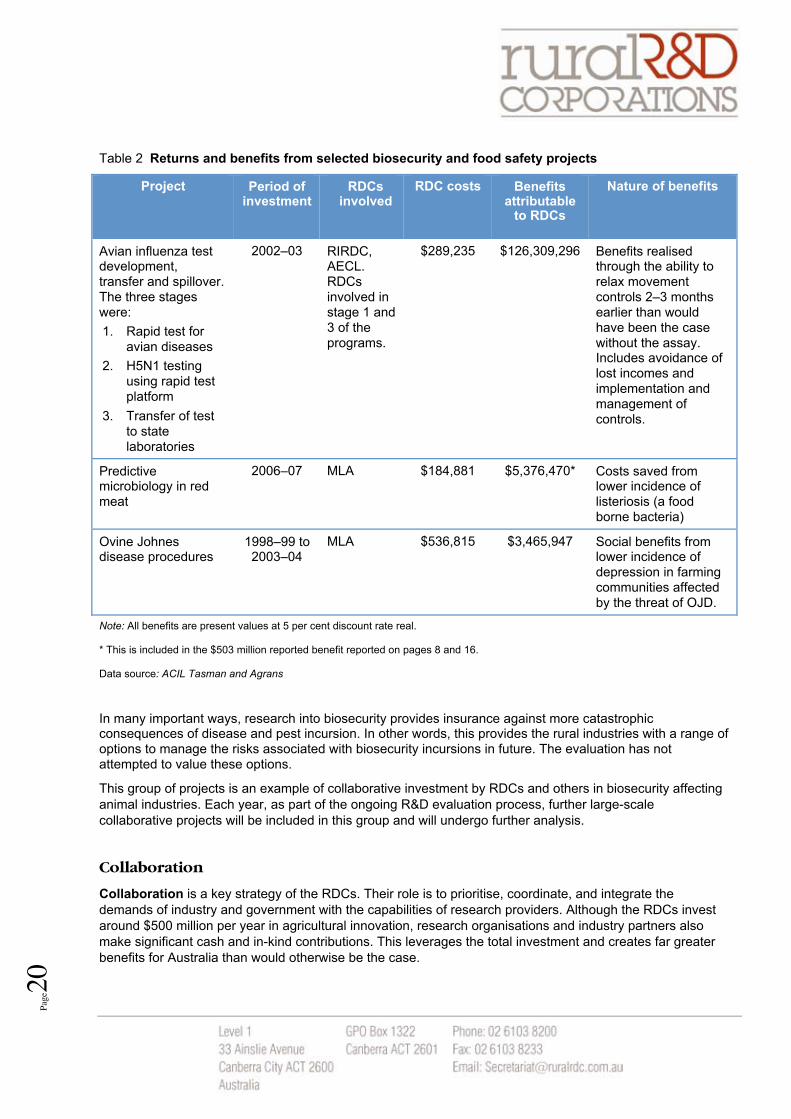
Page20
Table 2 Returns and benefits from selected biosecurity and food safety projects
Project Period ofinvestment
RDCsinvolved
RDC costs Benefitsattributable
to RDCs
Nature of benefits
Avian influenza testdevelopment,transfer and spillover.The three stageswere:
1. Rapid test foravian diseases
2. H5N1 testingusing rapid testplatform
3. Transfer of testto statelaboratories
2002–03 RIRDC,AECL.RDCsinvolved instage 1 and3 of theprograms.
$289,235 $126,309,296 Benefits realisedthrough the ability torelax movementcontrols 2–3 monthsearlier than wouldhave been the casewithout the assay.Includes avoidance oflost incomes andimplementation andmanagement ofcontrols.
Predictivemicrobiology in redmeat
2006–07 MLA $184,881 $5,376,470* Costs saved fromlower incidence oflisteriosis (a foodborne bacteria)
Ovine Johnesdisease procedures
1998–99 to2003–04
MLA $536,815 $3,465,947 Social benefits fromlower incidence ofdepression in farmingcommunities affectedby the threat of OJD.
Note: All benefits are present values at 5 per cent discount rate real.
* This is included in the $503 million reported benefit reported on pages 8 and 16.
Data source: ACIL Tasman and Agrans
In many important ways, research into biosecurity provides insurance against more catastrophicconsequences of disease and pest incursion. In other words, this provides the rural industries with a range ofoptions to manage the risks associated with biosecurity incursions in future. The evaluation has notattempted to value these options.
This group of projects is an example of collaborative investment by RDCs and others in biosecurity affectinganimal industries. Each year, as part of the ongoing R&D evaluation process, further large-scalecollaborative projects will be included in this group and will undergo further analysis.
Collaboration
Collaboration is a key strategy of the RDCs. Their role is to prioritise, coordinate, and integrate thedemands of industry and government with the capabilities of research providers. Although the RDCs investaround $500 million per year in agricultural innovation, research organisations and industry partners alsomake significant cash and in-kind contributions. This leverages the total investment and creates far greaterbenefits for Australia than would otherwise be the case.
Page21
Co-investment provides one example of how RDCs join with industry and other partners in R&D projects.This involves jointly funding a program or project, with the outcomes being shared between the participatingstakeholders.
Many of the projects included in the selection of random and successful projects have been collaborativeventures. The RDCs have collaborated financially with a wide variety of industry, research, university andgovernment stakeholders to conduct research. Table A3:1 in Appendix 3 shows funding partners for the 36highly successful projects and Table A3:2 shows funding partners for the 32 randomly selectedprojects. The tables indicate that 32 of the sample of 36 highly successful projects (89 per cent) and 22 ofthe 32 randomly selected projects (69 per cent) involved collaborative funding respectively.
Collaboration is not only financial. Projects included in the highly successful and randomly selectedprojects identified other partners, including research partners and organisations, as providing in-kindsupport.
RDCs have a unique perspective that is provided by their close engagement with industry and their intimateknowledge of market conditions that is not easily and regularly assessable either by government or theresearch community.
Additionally many of the RDCs have ensured collaboration by involving industry (from all parts of the valuechain) in boards, panels, reference groups, and specialised regional development groups. This hasenhanced capability, engagement and diffusion of knowledge.
The measure of success in collaboration is not through the value or number of collaborative investmentsconducted, but rather whether increasing the level of collaboration increases the R&D investment’s efficiencyand effectiveness. While determining the extent to which co-investment increases the investment’s efficiencyand effectiveness was not included in this evaluation phase, it would be reasonable to assume that if the co-investment had not taken place, the effectiveness of the R&D would be lower due to reduced resources.
National Rural Research Priorities
The Australian Government’s National Rural Research Priorities (RRP) provides one of the frameworks thatcontribute to the R&D strategies of the RDCs.
Figure 3 suggests that the majority of the successful projects focused on RRP 1 — Productivity andadding value. RRP 3 — Natural resource management and RRP 2 — Supply chain and markets wereequally cited.
It is not surprising that productivity increments have been the focus of the majority of these projects as thiswas the primary aim in most cases. Indeed, the majority of results indicate that the projects served toincrease productivity by showing producers how to use the resources available to them more efficiently.
Natural resource management has also been identified as a key research priority addressed by the RDCs.This is important in light of growing awareness by the wider Australian community of environmentalsustainability in recent years.
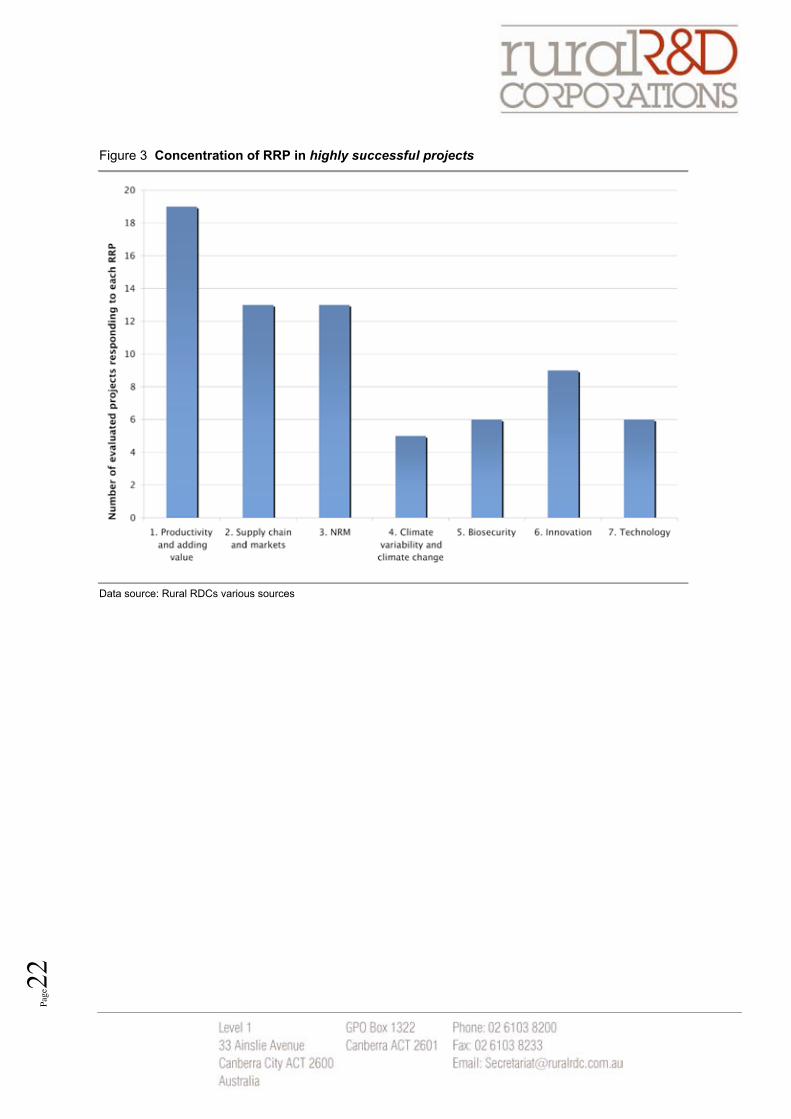
Page22
Figure 3 Concentration of RRP in highly successful projects
Data source: Rural RDCs various sources
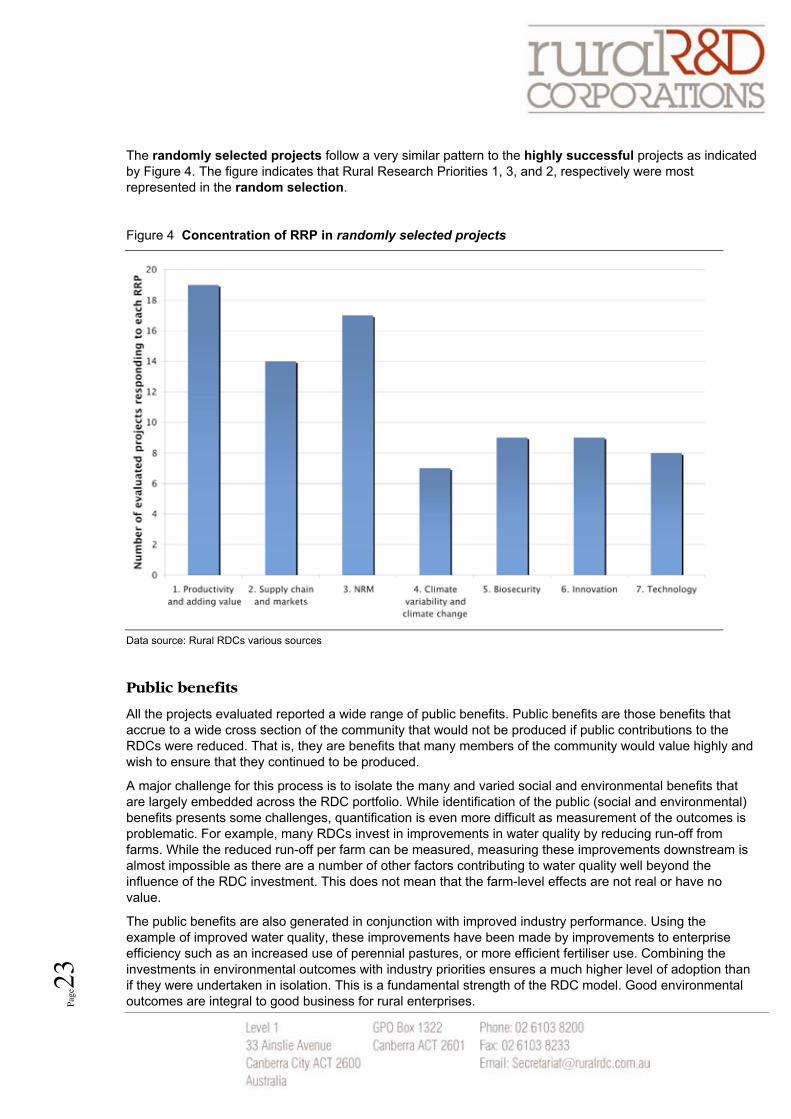
Page23
The randomly selected projects follow a very similar pattern to the highly successful projects as indicatedby Figure 4. The figure indicates that Rural Research Priorities 1, 3, and 2, respectively were mostrepresented in the random selection.
Figure 4 Concentration of RRP in randomly selected projects
Data source: Rural RDCs various sources
Public benefits
All the projects evaluated reported a wide range of public benefits. Public benefits are those benefits thataccrue to a wide cross section of the community that would not be produced if public contributions to theRDCs were reduced. That is, they are benefits that many members of the community would value highly andwish to ensure that they continued to be produced.
A major challenge for this process is to isolate the many and varied social and environmental benefits thatare largely embedded across the RDC portfolio. While identification of the public (social and environmental)benefits presents some challenges, quantification is even more difficult as measurement of the outcomes isproblematic. For example, many RDCs invest in improvements in water quality by reducing run-off fromfarms. While the reduced run-off per farm can be measured, measuring these improvements downstream isalmost impossible as there are a number of other factors contributing to water quality well beyond theinfluence of the RDC investment. This does not mean that the farm-level effects are not real or have novalue.
The public benefits are also generated in conjunction with improved industry performance. Using theexample of improved water quality, these improvements have been made by improvements to enterpriseefficiency such as an increased use of perennial pastures, or more efficient fertiliser use. Combining theinvestments in environmental outcomes with industry priorities ensures a much higher level of adoption thanif they were undertaken in isolation. This is a fundamental strength of the RDC model. Good environmentaloutcomes are integral to good business for rural enterprises.
Page24
More specifically the most common environmental impacts were:
• reduced chemical usage and impact on the environment. The Timerite project submitted by AWIresulted in more effective control of the pasture and crop pest the red legged earth mite using lesschemicals, and the adoption of GM cotton dramatically reducing pesticide use in cotton crops.
• reduced water and nutrient run-off and improvements in water quality. Many of the RDC projectssubmitted in this process – Land, Water and Wool (AWI), Rivers and Water Quality (LWA), and ecoefficiency in milk production (DA ) – developed ways to increase water-use efficiency such asthrough the increased use of perennial pastures.
• improved biodiversity. The benefits of improved biodiversity are included in many projects submittedfor this process. Almost every RDC has invested with LWA on projects to manage the ecology offarms while maintaining or improving productivity.
A small sample of some of the projects that have identified public benefits are summarised below. They havebeen chosen as representing a particular aspect of the public benefits produced by the RDC portfolio on anongoing basis.
FRDC Marine Protected Areas research
In 2006, a series of Marine Protected Areas (MPAs) were being considered by the Australian Governmentthat would have excluded fishing from a number of ecologically important areas of the Southern Ocean. TheFRDC, in collaboration with representatives from the fishing industry and management agencies from threestates, commissioned a report on the impacts of the MPAs on the fishing industry and the communitiesdependent on them. The costs to the fishing industry and dependent regional communities was going to besubstantial had they been implemented as the Government proposed.
This report led to a relocation of the MPAs resulting in a 30 per cent increase in the area and conservationvalues of the MPA and a significant reduction in impacts on fisheries in the proposed areas. The net socialbenefits are valued at $10 million, based on avoided social-adjustment costs that the Government wouldhave provided the fishing industry-dependent communities had the proposed MPAs been implemented.
Food safety: predictive microbiology
This MLA-funded research into predictive microbiology provides a scientific basis for assessing pathogengrowth at each point in the processing chain and has been adopted by every sector of the meat-processingindustry. On the whole, the report suggests that as a result of this practice the quality of red meat hasimproved four-fold since 1993.
The spill-over effect of this is related to increased health benefits for consumers. It is estimated that the foodsafety program is expected to generate $503 million in social and related industry benefits over the next 30years by reducing food-borne infectious diseases, such as listeriosis.
Moreover, the program has lead to significant reductions in total viable count (TVC) and E. coli. TVC gives aquantitative idea about the presence of microorganisms in a sample. Estimates provided indicate that bothTVC and E. coli in beef, for example, decreased by 35 per cent. The study also found a 50 per cent reductionin TVC and a 75 per cent reduction in E.coli for boneless beef and sheep meat from 1994–2004.
Page25
AWI Land, Water and Wool Project
Land, Water and Wool was a national research and development program providing woolgrowers withpractical tools to help manage natural resources sustainably and profitably.
The $40 million five-year program, a partnership between Australian Wool Innovation, Land & WaterAustralia and Meat and Livestock Australia, researched major issues facing the wool industry.
Land, Water and Wool conducted a best practice survey and found that Australian woolgrowers had adopteda range of natural resource practices including planting salt tolerant species on salt affected lands, replantingor retaining vegetation along waterways and limiting stock access, fencing of native bush and native grassesand adjusting farming practices to seasonal forecasts. Environmental service benefits included improvedwater quality in creeks and rivers, biodiversity conservation and reduced erosion.
A case study of a 2630 ha mixed enterprise property in Western Australia valued the public benefits of nativevegetation planting and riparian zone protection at $4.9 million.
The total benefits of the Land, Water and Wool program were estimated at $120 million. Approximately $48million of these benefits are environmental and attributable to AWI’s investment. These includedrehabilitation of degraded land, water quality improvements, biodiversity enhancement, and increasedgreenhouse gas sequestration.
Valuing public benefits
This evaluation methodology has sought to quantify the public benefits identified in the evaluation to theextent that is practical and commensurate with the value of doing so.
The CRRDCC recognises that there are considerable constraints on the measurements, empirical valuationand attribution of the public benefits produced by the RDC investments. To this end the CRRDCC evaluationmethodology instructs those conducting the evaluations to quantify public benefits where a robust andcredible case can be established. Where this was not possible, reasons were provided together with adescription of the benefits.
The results of the first year of evaluation have identified a broad range of both quantified and unquantifiedsocial and environmental benefits that fall more broadly into the category of ‘public benefits spillover’ to thecommunity. This establishes a robust ‘weight of evidence’ case – involving the accumulation of prima facie
evidence of improvements in environmental and social values for Australian society stemming from the RDCinvestments.
Care is needed to ensure that this limited tangibility does not become a reason to ignore these potentiallyhigh-value outcomes from RDC investments. To do so is likely to undervalue the work of the RDCs and torisk moving forward with an incomplete picture of where the public value lies – and this would risk biasingsubsequent activities in favour of the tangible outcomes. This would be at the expense of potentially highvalue if less-tangible outcomes.
If public contributions were solely based on the quantified public benefits, the RDCs would be subject to aperverse incentive to invest only in those areas where public benefits could be reasonably quantified, thusdiverting resources from the projects that have a wide range of social and environmental values.
It is also important to be realistic about the level of precision and comprehensiveness, at reasonable cost,that can and should be achieved in relation to some of these less tangible impacts. Quantification can onlybe undertaken to the point that it remains cost-effective to push this work – before information limitations andthe effects of legitimate variation in the way that different stakeholders would value different outcomesprevent useful further progress.
Information limitations, such as measuring biodiversity, water quality and reduced salinity, have beenidentified as a major constraint on the valuation of public benefits. In response to this the RDCs are investingin developing robust metrics for presenting significant social and environmental outcomes.
Page26
Consumer and industry (non-producer) benefits of the selected highly successfulprojects
Consumer benefits are generally measured in terms of positive changes in consumer surplus. Consumersurplus is the difference between the price consumers are willing to pay (or reservation price) and the actualprice. If someone is willing to pay more than the actual price, their benefit in a transaction is how much theysaved.
Where quantified changes in consumer surplus can be proved, these can be considered as part of thebenefits delivered. Changes in consumer surplus can be difficult to measure. In the case where a change insupply does not lead to a change in price (as is the case of many exported agricultural products) there is nochange in consumer surplus. Factoring in changes in consumer surplus therefore needs to be treated withcare in a benefit to cost analysis.
Changes in consumer surplus that were identified are wide and could include any innovation produced bythe RDCs that resulted in an improvement in quality in the final product such: as meat-eating quality (MLA);lighter weight, easier-care wool garments (AWI); and awareness of the range and versatility of dairy products(DA). All of the efficiency gains derived from the innovations produced by the RDCs are passed on toAustralian consumers in the form of either lower prices and/or higher-value products.
Lessons from year one of the evaluation program
This report describes the initial outcomes of the first round of the combined RDC evaluation program. This isan ongoing program that will evolve over time, providing continually higher quality information and insightsboth for the RDCs and other parties taking similar routes.
The major lesson learned is that there are significant environmental and social benefits that are undervaluedbecause of challenges faced in their measurement and monetisation. These are especially relevant whenestimating the benefits associated with the delivery of public goods arising from the investment.
There may ultimately be a role for government in assisting this shortcoming through developing credible andagreed values. This can be achieved either through creating markets, ascribing values (carbon being anotable example) or other mechanisms.
The ability to quantify a number of areas of benefits, especially in social and environmentalcategories, is limited by the lack of a market where the benefits can be valued. Such benefits aretherefore potentially undervalued in the quantification.
In many areas of benefits, the tools and frameworks are not available to enable consistent and crediblerepresentation of value in a quantified sense. For example, MLA and DA had projects delivering significanthealth benefits to the wider community, including reduced hypertension and obesity. However, a dollar valueof ‘no value’ was ascribed to these benefits. This is an area that will need to be addressed in future work –but in many cases will require a sustained program of research in its own right to develop standards andcredible endorsement.
Assessment of work in progress
This current evaluation was based on projects that had been completed or had reached a major milestone.This ex poste approach ignores the substantial value in research and development projects that are underway but have not reached a major milestone. The examination of the biosecurity projects demonstrated thatconsiderable value is embedded in ‘work-in-progress’. Future evaluation may explore this further.
Page27
Responding to changing priorities
The Rural Research Priorities provide the RDCs with a strategic framework to address issues of priority togovernments. However, the rapid changes in global markets, the need for continued productivityimprovement in the agriculture, fisheries and forestry industries and the challenges of climate change andthe management of water mean relative priorities are changing rapidly.
Maintenance of research capacity and the ability of the research community and industry to absorb andadopt innovation will also be critical issues in the future.
The RDCs in collaboration with the Primary Industries Standing Committee have taken a leadership role indeveloping national Research and Development Strategic Plans. These are to be considered at the meetingof the Primary Industries Ministerial Council in November 2008.
These new initiatives were not in place when the first round of evaluations was started. Future evaluation willneed to consider the impact of these strategies and their subsequent investments in terms of theeffectiveness of meeting these national priorities.
Path forward
This report describes the results of the first round of what will be an ongoing annual program of evaluation.Representatives of the RDCs will meet in February 2009 to further review the results and decide the nextsteps.
Furthermore, the RDCs are looking to develop frameworks for measuring social and environmental benefits.This work will focus on areas where the current gaps in ability to measure results and ideally quantify indollar terms are most significant.
Page28
Appendix 1 – Glossary of termsBenefit to cost ratio (BCR) – the ratio of the quantified benefits to the cost of investing in the R&D project.
Collaboration – where two or more RDCs (or external agencies) agree to work together through enhancedcommunication, coordination or coinvestment to leverage their respective investments.
Counterfactual – what would have otherwise happened in the absence of funding support by the RDC for aspecific investment; the baseline scenario.
Discount rate – a discount rate serves the purpose of discounting from the original investment the benefitsotherwise obtained if the investment had been placed in the financial system at a market interest rate (5 percent was used in this report). It can also be interpreted as a foregone income for having undertaken theinvestment in the RDC project. The discount rate, jointly with inflation rate, is used to determine the realvalue of investment (cost/benefits) at some point in time, usually present terms.
Economic (or industry) benefits – benefits such as improved productivity, market share or market access.
Environmental benefits – benefits which directly affect the environment, such as water or air quality,salinity, endangered species and biodiversity. These benefits generally represent a ‘public good’ or ‘spillover’benefit, although some benefits are accrued to levy payers.
Ex-ante – evaluation carried out before an investment has been made.
Ex-post – evaluation occurring after the R&D has been completed.
Highly successful project – a project selected because it demonstrates a positive return to the RDC.
GVP – gross value of produce. This is the farmgate value of commodities produced.
Internal rate of return (IRR) – the discount rate that makes the net present value equal zero. Can also bethe rate of growth the project is expected to generate.
National Research Priorities (NRPs) – an Australian Government initiative to help focus R&D efforts onissues of national importance. Rural Research Priorities are aligned with National Research Priorities.
Net present value (NPV) – after the stream of nominal benefits of an investment project has beendetermined, for instance $100 per year for the next five years, the NPV comprises in one single value,usually the current year, such stream of future benefits. Its calculation implies the use of inflation rate and adiscount rate in order to account for the loss of value from future inflation and the opportunity cost of analternative investment, respectively.
Non-quantified benefits – benefits stemming from an R&D project that cannot be valued in dollar terms.
Primary Industries and Energy Research and Development Act (1989) – enabling legislation for thestatutory RDCs.
Public benefit – benefits stemming from the investment that are enjoyed by society as a whole.
Public good – a good that is ‘non-rivalrous’ (that is, where consumption by one party does not preventanother party from also consuming that good) and ‘non-excludable’ (that is, where, once a good is produced,one party cannot stop another from enjoying its benefits).
Quantified benefits – benefits stemming from an R&D project that can be valued in dollar terms.
Randomly selected project – a project selected from a defined set of projects that will contribute to a poolto demonstrate the distribution of returns to the total RDC investment portfolio.
Page29
Rural Research and Development Corporations (RDCs) – a unique co-funding partnership between theAustralian Government and the agriculture, forestry and fisheries industries which commission and managetargeted research and foster uptake and adoption based on the identified needs and priorities of bothindustry and the Australian Government.
Rural Research Priorities (RRPs) – an Australian Government initiative to balance new and ongoing R&Dinvestment needs for the primary industries sector, and to ensure that the R&D objectives of the AustralianGovernment are met. RDCs align their R&D investments with the RRPs: productivity and value adding;supply chain markets: natural resource management, climate variability and climate change; biosecurity; andsupporting priorities.
Social benefits – benefits stemming from a project that directly affects the wider Australian public, such aspublic health, occupational health and safety, resilient regional communities and animal welfare.
Spillovers – costs and benefits borne by those not party to the transaction are called ‘spillovers’ or‘externalities’, as they are external to the activity.
Total viable count (TVC) – TVC gives a quantitative idea about the presence of microorganisms in asample.
Triple bottom line (TBL) – a measurement of the economic, environmental and social performance of aproject.
Page30
Appendix 2 – Methodology
Methodology
An evaluation framework was prepared to help develop the cost-benefit analyses (CBAs). The framework’skey points are outlined below.
Project selection
The methodology required evaluation of 36 highly successful projects and 32 randomly selectedprojects. An analysis of the highly successful projects would provide at least a minimum positive returnon investment on the total portfolio of projects. An analysis of a collection of random projects (to beundertaken over time) would be used to calculate an average return and establish a distribution of returns tothe total portfolio.
Project outputs
The CBA must report on the net present values (NPV), the internal rate of return (IRR) of the investment, thebenefit to cost ratios (BCRs) of the investment. The values were reported in real terms (2006–07 dollars) toensure consistency.
Values were determined based on a 5 per cent real discount rate. This rate was selected as it is a fairlyneutral opportunity cost of the funds. To overcome likely changes in this discount rate, CBAs were invited toundertake a sensitivity analysis of this and other key variables and parameters.
The NPVs, IRR and BCRs were to be reported along a project horizon of 0, 5, 10 and 20 years in the firstinstance, with additional time points added as necessary. It was decided to incorporate a series of timehorizons as part of the generally conservative nature of the evaluation process. It also needed to berecognised that while benefits from research grow over time, they also diminish further into the time horizon.Possible obsolescence of technology is one example of why a range of time horizons was incorporated intothe framework. However, it was also recognised that for some fields of research, in particular naturalresource management and forestry, it may take considerably longer for the benefits to be generated.Consequently, a longer time horizon may be necessary.
CBAs had to report benefits accruing to industry (that is, the industry sector contributing the levy funds), theenvironment and society.
CBAs were required to report outputs against the RDC investment and the total investment (that is, includingthe contribution of other funding partners). This would allow the benefits directly attributed to the RDCinvestment to be drawn out from the benefits accruing to the total investment.
Examination of the counterfactual scenario was used to consider the situation with and without the project.Benefits to the project could therefore be the net of the benefits with and without the project.
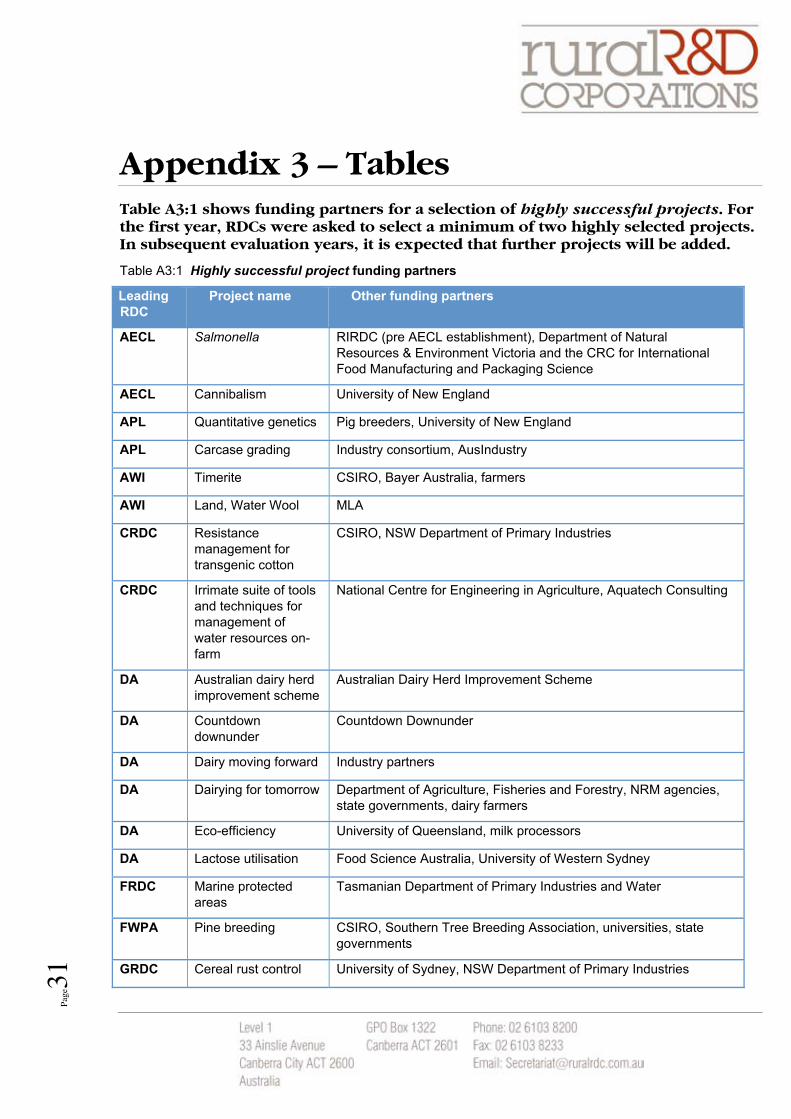
Page31
Appendix 3 – TablesTable A3:1 shows funding partners for a selection of highly successful projects. Forthe first year, RDCs were asked to select a minimum of two highly selected projects.In subsequent evaluation years, it is expected that further projects will be added.
Table A3:1 Highly successful project funding partners
LeadingRDC
Project name Other funding partners
AECL Salmonella RIRDC (pre AECL establishment), Department of NaturalResources & Environment Victoria and the CRC for InternationalFood Manufacturing and Packaging Science
AECL Cannibalism University of New England
APL Quantitative genetics Pig breeders, University of New England
APL Carcase grading Industry consortium, AusIndustry
AWI Timerite CSIRO, Bayer Australia, farmers
AWI Land, Water Wool MLA
CRDC Resistancemanagement fortransgenic cotton
CSIRO, NSW Department of Primary Industries
CRDC Irrimate suite of toolsand techniques formanagement ofwater resources on-farm
National Centre for Engineering in Agriculture, Aquatech Consulting
DA Australian dairy herdimprovement scheme
Australian Dairy Herd Improvement Scheme
DA Countdowndownunder
Countdown Downunder
DA Dairy moving forward Industry partners
DA Dairying for tomorrow Department of Agriculture, Fisheries and Forestry, NRM agencies,state governments, dairy farmers
DA Eco-efficiency University of Queensland, milk processors
DA Lactose utilisation Food Science Australia, University of Western Sydney
FRDC Marine protectedareas
Tasmanian Department of Primary Industries and Water
FWPA Pine breeding CSIRO, Southern Tree Breeding Association, universities, stategovernments
GRDC Cereal rust control University of Sydney, NSW Department of Primary Industries
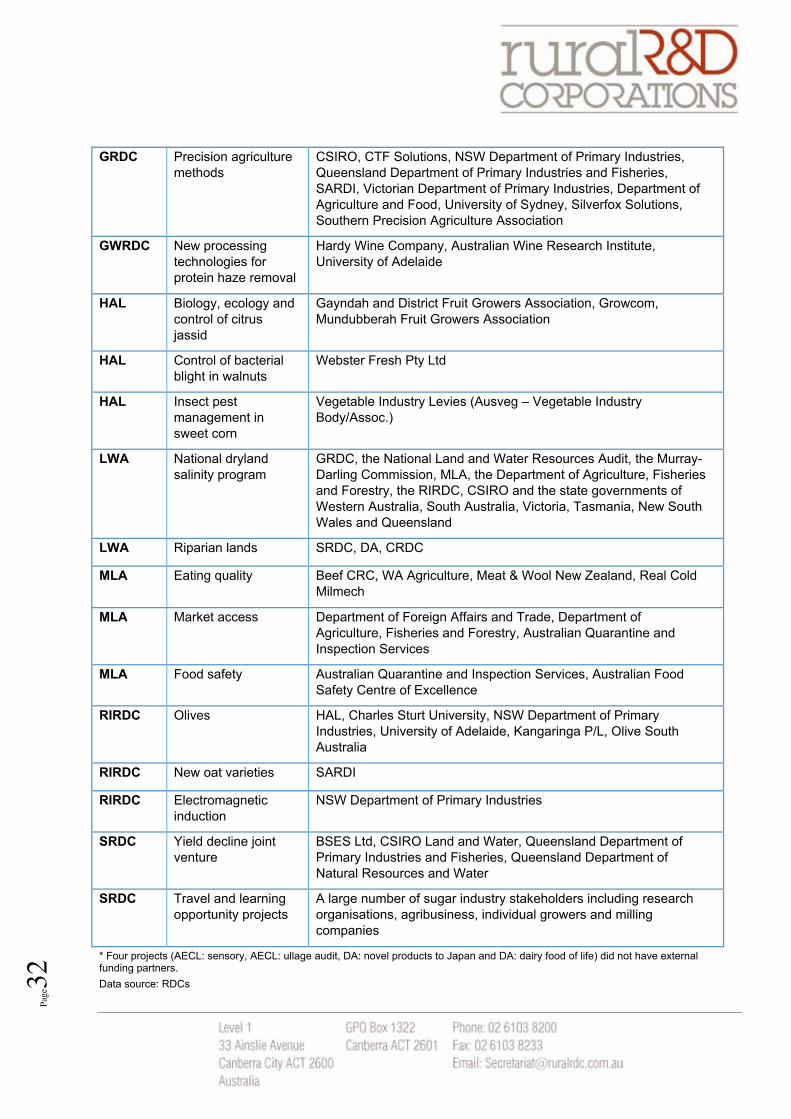
Page32
GRDC Precision agriculturemethods
CSIRO, CTF Solutions, NSW Department of Primary Industries,Queensland Department of Primary Industries and Fisheries,SARDI, Victorian Department of Primary Industries, Department ofAgriculture and Food, University of Sydney, Silverfox Solutions,Southern Precision Agriculture Association
GWRDC New processingtechnologies forprotein haze removal
Hardy Wine Company, Australian Wine Research Institute,University of Adelaide
HAL Biology, ecology andcontrol of citrusjassid
Gayndah and District Fruit Growers Association, Growcom,Mundubberah Fruit Growers Association
HAL Control of bacterialblight in walnuts
Webster Fresh Pty Ltd
HAL Insect pestmanagement insweet corn
Vegetable Industry Levies (Ausveg – Vegetable IndustryBody/Assoc.)
LWA National drylandsalinity program
GRDC, the National Land and Water Resources Audit, the Murray-Darling Commission, MLA, the Department of Agriculture, Fisheriesand Forestry, the RIRDC, CSIRO and the state governments ofWestern Australia, South Australia, Victoria, Tasmania, New SouthWales and Queensland
LWA Riparian lands SRDC, DA, CRDC
MLA Eating quality Beef CRC, WA Agriculture, Meat & Wool New Zealand, Real ColdMilmech
MLA Market access Department of Foreign Affairs and Trade, Department ofAgriculture, Fisheries and Forestry, Australian Quarantine andInspection Services
MLA Food safety Australian Quarantine and Inspection Services, Australian FoodSafety Centre of Excellence
RIRDC Olives HAL, Charles Sturt University, NSW Department of PrimaryIndustries, University of Adelaide, Kangaringa P/L, Olive SouthAustralia
RIRDC New oat varieties SARDI
RIRDC Electromagneticinduction
NSW Department of Primary Industries
SRDC Yield decline jointventure
BSES Ltd, CSIRO Land and Water, Queensland Department ofPrimary Industries and Fisheries, Queensland Department ofNatural Resources and Water
SRDC Travel and learningopportunity projects
A large number of sugar industry stakeholders including researchorganisations, agribusiness, individual growers and millingcompanies
* Four projects (AECL: sensory, AECL: ullage audit, DA: novel products to Japan and DA: dairy food of life) did not have externalfunding partners.
Data source: RDCs
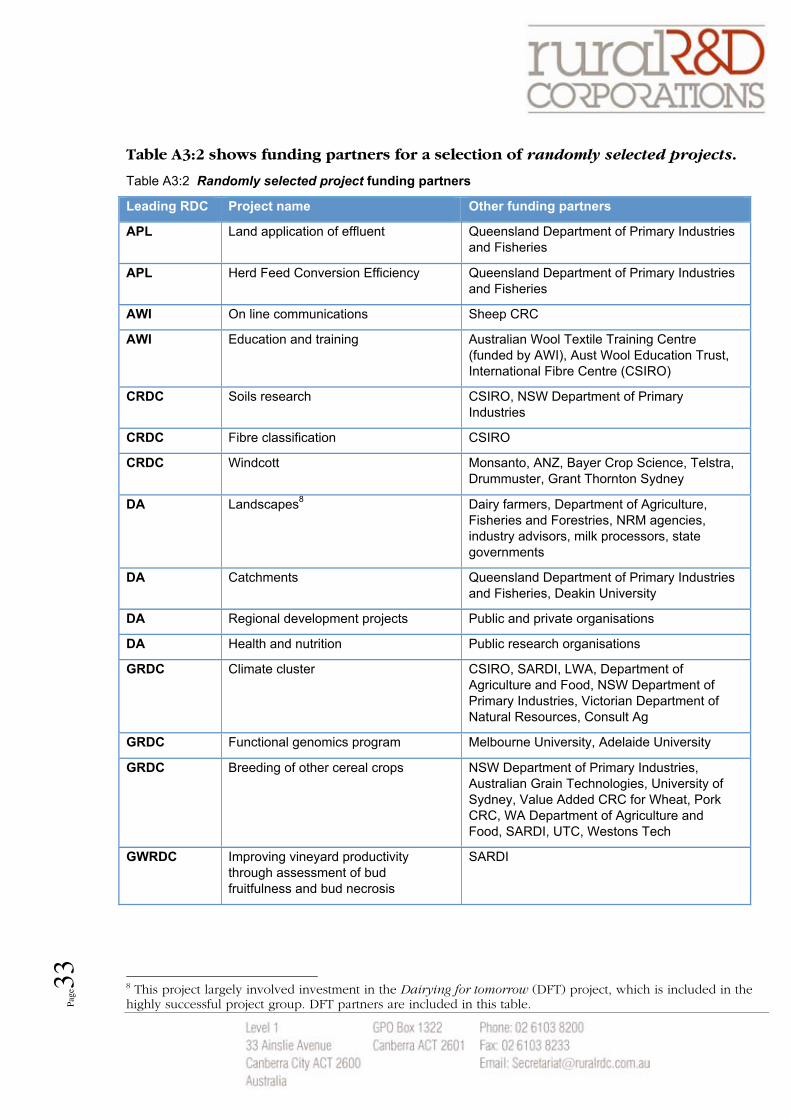
Page33
Table A3:2 shows funding partners for a selection of randomly selected projects.
Table A3:2 Randomly selected project funding partners
Leading RDC Project name Other funding partners
APL Land application of effluent Queensland Department of Primary Industriesand Fisheries
APL Herd Feed Conversion Efficiency Queensland Department of Primary Industriesand Fisheries
AWI On line communications Sheep CRC
AWI Education and training Australian Wool Textile Training Centre(funded by AWI), Aust Wool Education Trust,International Fibre Centre (CSIRO)
CRDC Soils research CSIRO, NSW Department of PrimaryIndustries
CRDC Fibre classification CSIRO
CRDC Windcott Monsanto, ANZ, Bayer Crop Science, Telstra,Drummuster, Grant Thornton Sydney
DA Landscapes8
Dairy farmers, Department of Agriculture,Fisheries and Forestries, NRM agencies,industry advisors, milk processors, stategovernments
DA Catchments Queensland Department of Primary Industriesand Fisheries, Deakin University
DA Regional development projects Public and private organisations
DA Health and nutrition Public research organisations
GRDC Climate cluster CSIRO, SARDI, LWA, Department ofAgriculture and Food, NSW Department ofPrimary Industries, Victorian Department ofNatural Resources, Consult Ag
GRDC Functional genomics program Melbourne University, Adelaide University
GRDC Breeding of other cereal crops NSW Department of Primary Industries,Australian Grain Technologies, University ofSydney, Value Added CRC for Wheat, PorkCRC, WA Department of Agriculture andFood, SARDI, UTC, Westons Tech
GWRDC Improving vineyard productivitythrough assessment of budfruitfulness and bud necrosis
SARDI
8 This project largely involved investment in the Dairying for tomorrow (DFT) project, which is included in thehighly successful project group. DFT partners are included in this table.
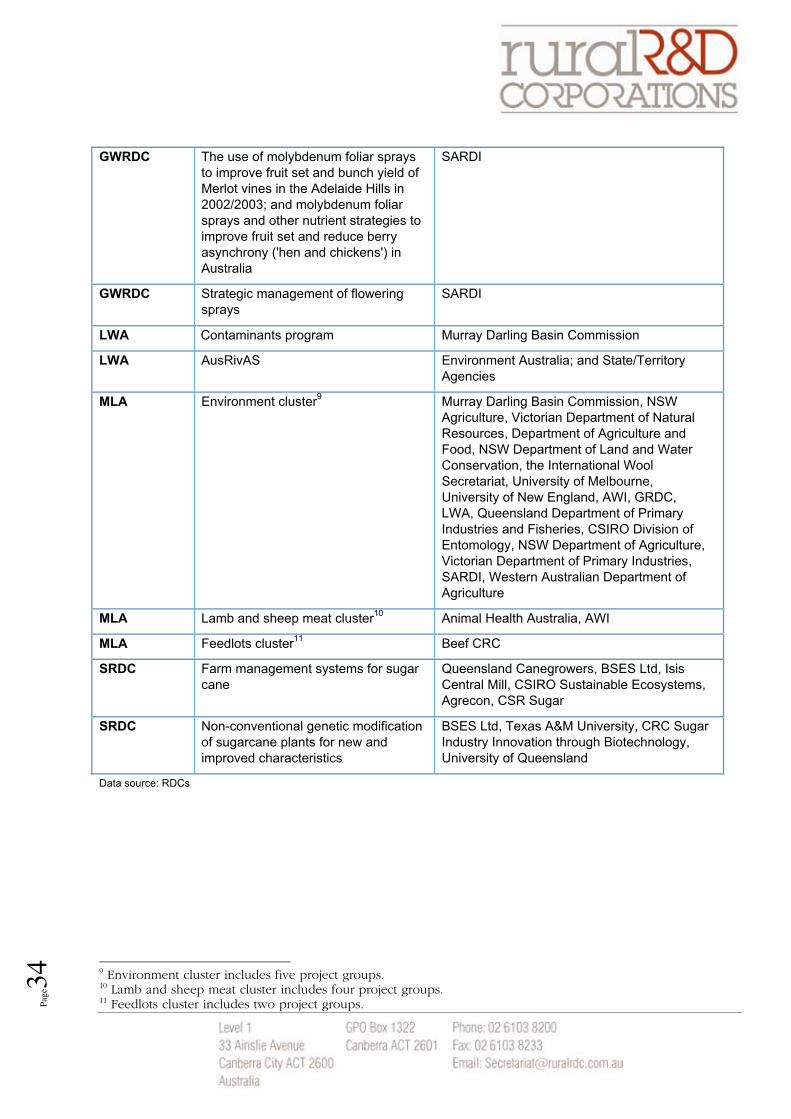
Page34
GWRDC The use of molybdenum foliar spraysto improve fruit set and bunch yield ofMerlot vines in the Adelaide Hills in2002/2003; and molybdenum foliarsprays and other nutrient strategies toimprove fruit set and reduce berryasynchrony ('hen and chickens') inAustralia
SARDI
GWRDC Strategic management of floweringsprays
SARDI
LWA Contaminants program Murray Darling Basin Commission
LWA AusRivAS Environment Australia; and State/TerritoryAgencies
MLA Environment cluster9
Murray Darling Basin Commission, NSWAgriculture, Victorian Department of NaturalResources, Department of Agriculture andFood, NSW Department of Land and WaterConservation, the International WoolSecretariat, University of Melbourne,University of New England, AWI, GRDC,LWA, Queensland Department of PrimaryIndustries and Fisheries, CSIRO Division ofEntomology, NSW Department of Agriculture,Victorian Department of Primary Industries,SARDI, Western Australian Department ofAgriculture
MLA Lamb and sheep meat cluster10
Animal Health Australia, AWI
MLA Feedlots cluster11
Beef CRC
SRDC Farm management systems for sugarcane
Queensland Canegrowers, BSES Ltd, IsisCentral Mill, CSIRO Sustainable Ecosystems,Agrecon, CSR Sugar
SRDC Non-conventional genetic modificationof sugarcane plants for new andimproved characteristics
BSES Ltd, Texas A&M University, CRC SugarIndustry Innovation through Biotechnology,University of Queensland
Data source: RDCs
9 Environment cluster includes five project groups.10 Lamb and sheep meat cluster includes four project groups.11 Feedlots cluster includes two project groups.
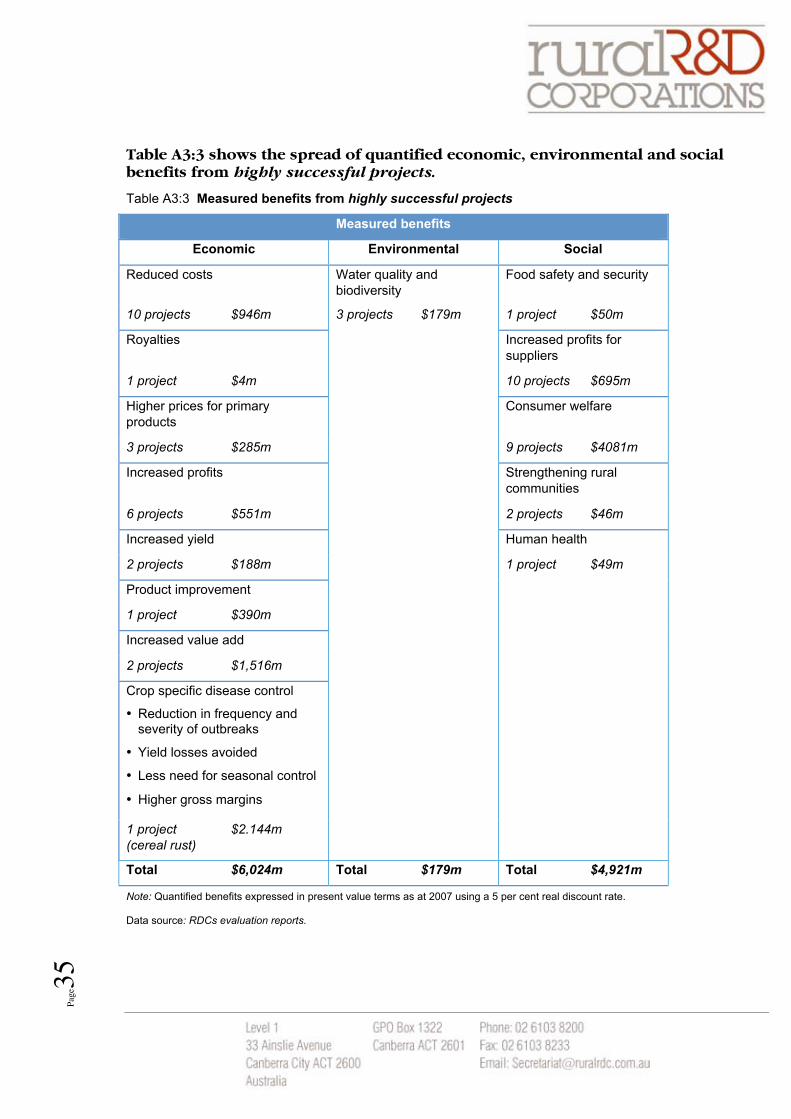
Page35
Table A3:3 shows the spread of quantified economic, environmental and socialbenefits from highly successful projects.
Table A3:3 Measured benefits from highly successful projects
Measured benefits
Economic Environmental Social
Reduced costs Water quality andbiodiversity
Food safety and security
10 projects $946m 3 projects $179m 1 project $50m
Royalties Increased profits forsuppliers
1 project $4m 10 projects $695m
Higher prices for primaryproducts
Consumer welfare
3 projects $285m 9 projects $4081m
Increased profits Strengthening ruralcommunities
6 projects $551m 2 projects $46m
Increased yield Human health
2 projects $188m 1 project $49m
Product improvement
1 project $390m
Increased value add
2 projects $1,516m
Crop specific disease control
• Reduction in frequency andseverity of outbreaks
• Yield losses avoided
• Less need for seasonal control
• Higher gross margins
1 project
(cereal rust)
$2.144m
Total $6,024m Total $179m Total $4,921m
Note: Quantified benefits expressed in present value terms as at 2007 using a 5 per cent real discount rate.
Data source: RDCs evaluation reports.
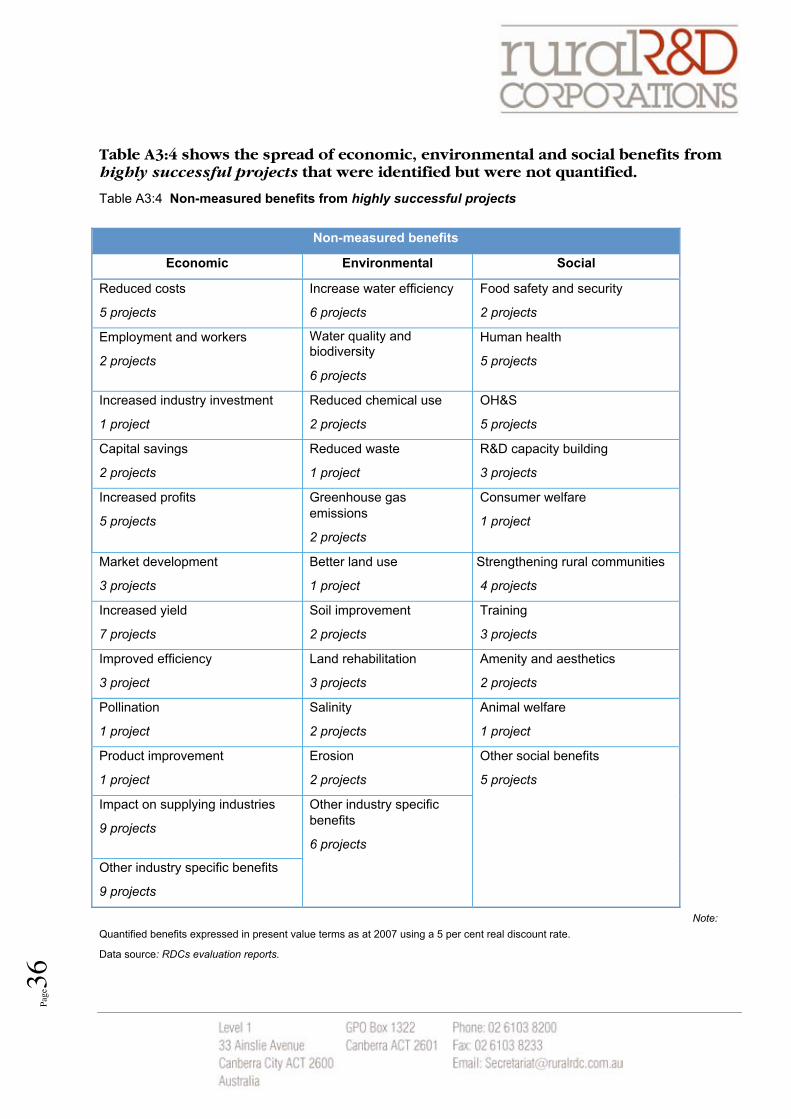
Page36
Table A3:4 shows the spread of economic, environmental and social benefits fromhighly successful projects that were identified but were not quantified.
Table A3:4 Non-measured benefits from highly successful projects
Note:
Quantified benefits expressed in present value terms as at 2007 using a 5 per cent real discount rate.
Data source: RDCs evaluation reports.
Non-measured benefits
Economic Environmental Social
Reduced costs
5 projects
Increase water efficiency
6 projects
Food safety and security
2 projects
Employment and workers
2 projects
Water quality andbiodiversity
6 projects
Human health
5 projects
Increased industry investment
1 project
Reduced chemical use
2 projects
OH&S
5 projects
Capital savings
2 projects
Reduced waste
1 project
R&D capacity building
3 projects
Increased profits
5 projects
Greenhouse gasemissions
2 projects
Consumer welfare
1 project
Market development
3 projects
Better land use
1 project
Strengthening rural communities
4 projects
Increased yield
7 projects
Soil improvement
2 projects
Training
3 projects
Improved efficiency
3 project
Land rehabilitation
3 projects
Amenity and aesthetics
2 projects
Pollination
1 project
Salinity
2 projects
Animal welfare
1 project
Product improvement
1 project
Erosion
2 projects
Impact on supplying industries
9 projects
Other industry specific benefits
9 projects
Other industry specificbenefits
6 projects
Other social benefits
5 projects
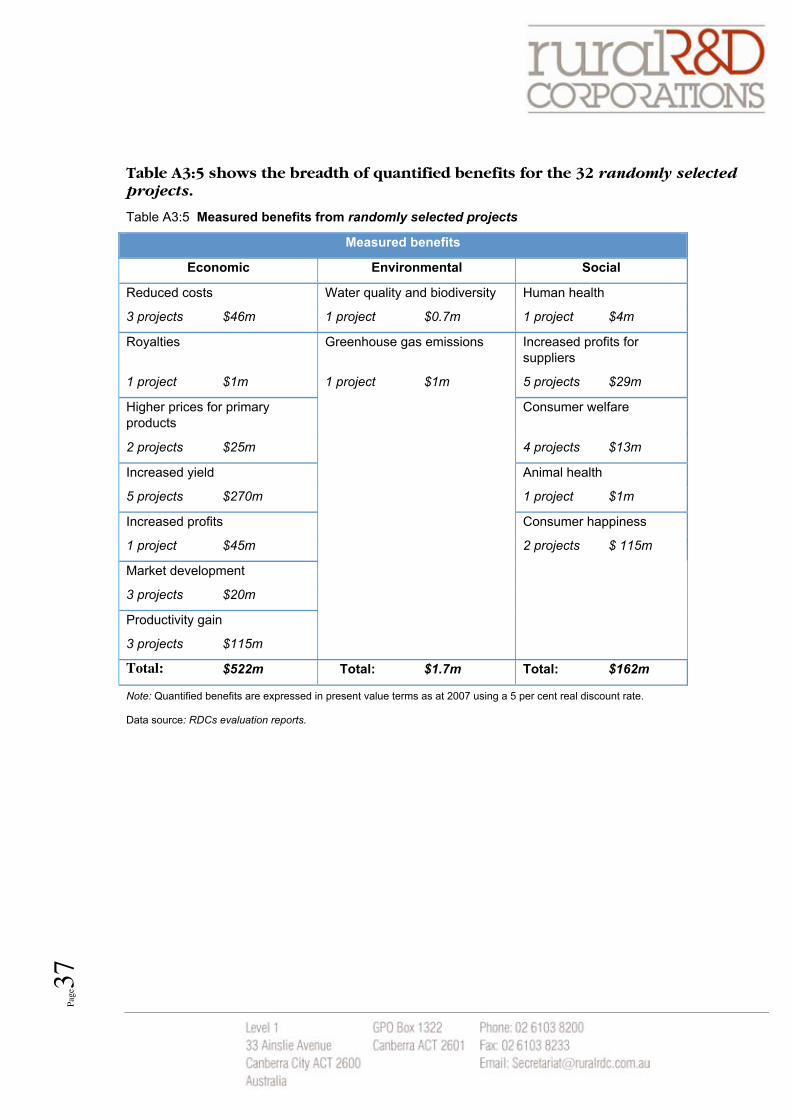
Page37
Table A3:5 shows the breadth of quantified benefits for the 32 randomly selectedprojects.
Table A3:5 Measured benefits from randomly selected projects
Measured benefits
Economic Environmental Social
Reduced costs Water quality and biodiversity Human health
3 projects $46m 1 project $0.7m 1 project $4m
Royalties Greenhouse gas emissions Increased profits forsuppliers
1 project $1m 1 project $1m 5 projects $29m
Higher prices for primaryproducts
Consumer welfare
2 projects $25m 4 projects $13m
Increased yield Animal health
5 projects $270m 1 project $1m
Increased profits Consumer happiness
1 project $45m 2 projects $ 115m
Market development
3 projects $20m
Productivity gain
3 projects $115m
Total: $522m Total: $1.7m Total: $162m
Note: Quantified benefits are expressed in present value terms as at 2007 using a 5 per cent real discount rate.
Data source: RDCs evaluation reports.
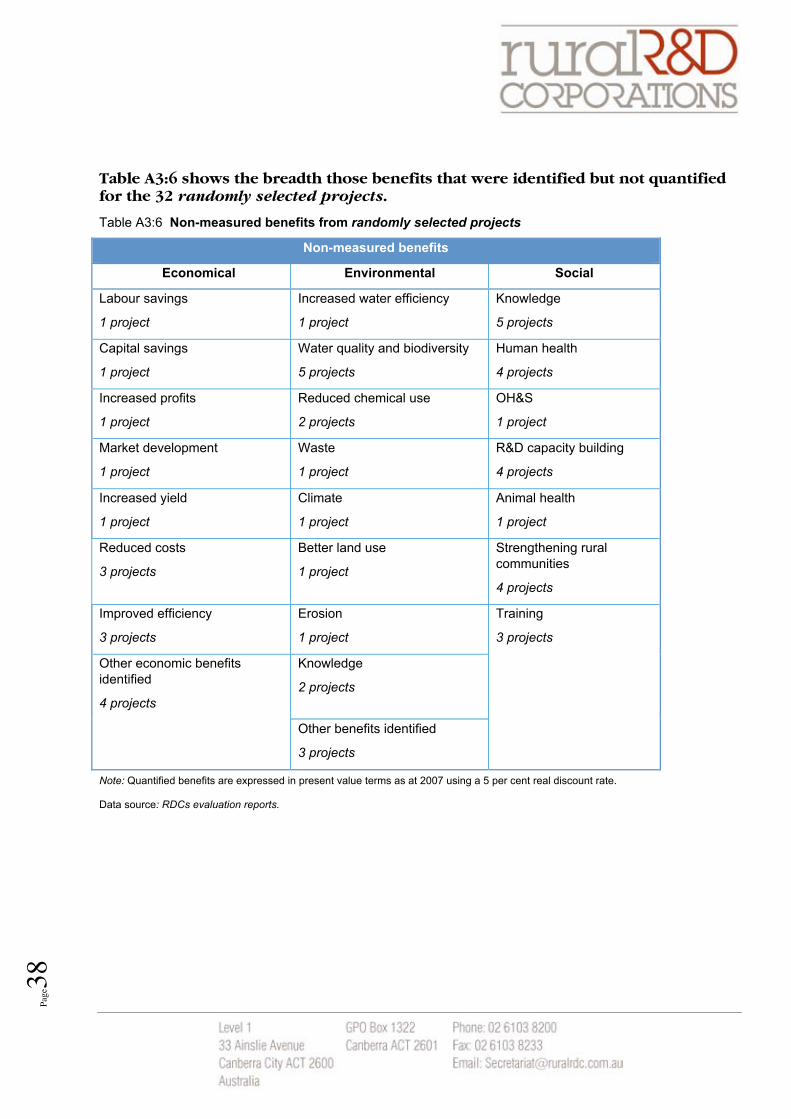
Page38
Table A3:6 shows the breadth those benefits that were identified but not quantifiedfor the 32 randomly selected projects.
Table A3:6 Non-measured benefits from randomly selected projects
Non-measured benefits
Economical Environmental Social
Labour savings
1 project
Increased water efficiency
1 project
Knowledge
5 projects
Capital savings
1 project
Water quality and biodiversity
5 projects
Human health
4 projects
Increased profits
1 project
Reduced chemical use
2 projects
OH&S
1 project
Market development
1 project
Waste
1 project
R&D capacity building
4 projects
Increased yield
1 project
Climate
1 project
Animal health
1 project
Reduced costs
3 projects
Better land use
1 project
Strengthening ruralcommunities
4 projects
Improved efficiency
3 projects
Erosion
1 project
Training
3 projects
Other economic benefitsidentified
4 projects
Knowledge
2 projects
Other benefits identified
3 projects
Note: Quantified benefits are expressed in present value terms as at 2007 using a 5 per cent real discount rate.
Data source: RDCs evaluation reports.
IMPACT OF INVESTMENT IN RESEARCH AND DEVELOPMENT BY THE RURAL RESEARCH AND DEVELOPMENT CORPORATIONS
Year 2 results
Council of Rural Research and Development Corporations Chairs January 2010
ii
Contents Executive Summary iii1 Introduction 12 Methodology 23 Projects 34 Benefits of the RDC investments 3
4.1 Economic benefits 3
4.2 Environmental and social benefits 6
4.3 Consumer benefits 9
4.4 The 2009 results 10
4.5 Distribution of the results 12
5 Ongoing work on the evaluation process 146 Conclusion 17A. Statutory and industry owned RDCs 18B. List of projects evaluated in 2009 19C. Glossary of terms 21
Box 1 HAL Investment in Avocado Projects – Plant Protection 4
Box 2 RIRDC Investment in the Fodder Crops R&D Program 5
Box 3 Consumer benefits case study– Dairy Australia 10
Chart 1 Accumulation indexes for a range of asset classes 12
Table 1 Aggregate cumulative results of the CBA randomly selected in 2009 ($million) 11
Table 2 Aggregate results of the CBA randomly selected in 2009 (simple average $million) 11
Table 3 Aggregate results of the CBA randomly selected in 2009 (weighted average by program cost) 11
Executive Summary iii
Executive Summary
Australian agriculture is innovative and consistently out-performs most other sectors of the Australian economy in total factor productivity growth, with domestic rural R&D a major driver of this
performance.
This investment in rural research and development is driven by the unique model of co-investment between government and industry through the Rural Research and Development Corporations (RDCs). The RDC model, based on industry and government collaboration, is an effective working alliance between government, industry and research partners. It is a unique example of government–industry
partnership benefiting both the industry and the wider community.
The RDCs are major funders of R&D in Australian agriculture, investing $4411 million in R&D in 2008-09, which covered a range of priority areas including productivity, climate change and natural resource management. This amount includes $244 million of industry investment and $207 million in Government matching contributions.
Averaged over the past 20 years, for every $1.00 that the Australian Government has contributed, industry has contributed $1.50. This serves to leverage the total investment and provides greater benefits for Australia than from either party investing alone, creating ownership by industry and a partnership between industry and government. This substantial investment accounts for around 302 per cent of the R&D expenditure in the agricultural, fisheries and forestry industries undertaken in Australia, with the strategic activities of the RDCs influencing a large proportion of other research and development.
The structure of the RDC model and the extensive collaboration between the organisations involved, promotes effective research, development, innovation and extension of research findings in areas that are priorities for both industry and government, such as productivity growth, climate change and natural resource management. The ability to tackle projects jointly increases efficiency and can result in more effective communication and uptake of the outcomes of R&D. This contributes directly to the growth in productivity in Australian agriculture.
This report provides the results of the second year of an ongoing evaluation of the impacts, effectiveness and returns on investment by Australian rural research and development corporations. It builds on the 2008 report, showing once again, a high return on investment from the random sample of programs assessed across the RDCs.
The evaluation program undertaken by the RDCs is the largest and broadest of this type of analysis of rural R&D in Australia. The program will continue to be refined as standards and tools are developed to assist the RDCs. This evaluation program is likely to be useful for other forms of investment in
1 Expenditure varies from year to year and total R&D expenditure does not necessarily equal the totals of industry and
Government contributions due to carry forward balances of industry funds.
2 Core, P. (2010) A retrospective on rural R&D in Australia. Department of Agriculture Fisheries and Forestry, Canberra, January 2010, page v.
The RDC model is an effective working alliance between government, industry and research partners
Executive Summary iv
research and development both in Australia and overseas, where assessment of innovation programs and projects is desirable.
Context and purpose
The Council of Rural Research and Development Corporations Chairs (CRRDCC) is a non incorporated body comprising the Chairs of 163 RDCs and provides the peak forum for evaluation of the collective impact of the RDCs and for collaboration on major projects of national significance. The 16 RDCs are listed at Appendix A.
This evaluation process demonstrates the strong collaboration between RDCs, rural industry, government and research partners and shows significant benefits are generated in areas targeted by the National Research and Rural Research and Development Priorities.
In December 2008, the CRRDCC released the first year of results of this ongoing evaluation of the investment return. The 2008 report showed that over a 25 year timeframe, for every $1 invested there was an average return of $11, in 2007 dollars.
This is the second report to be delivered by the RDCs and shows results consistent with that of the first year, underlining the high value investment in rural research and development provides to Australian businesses and the community.
This report will:
• assist in communicating the range and value of activities undertaken by the RDCs to their
stakeholders in a credible and verifiable basis within a consistent framework; • assist in developing common standards and tools for use across the RDCs and, more broadly,
in other areas of research and development and innovation; and • assist the RDCs in strategic and resource allocation decisions.
Results
The results from this second random sample of programs again show significant and consistent benefits from investment by the RDCs across a range of activities they participate in.
There were 59 individual programs evaluated in 2009, representing $837 million in RDC investments. These programs covered a range of investments from forestry, meat, fodder crops and soil biology to education in dairy and fisheries resource management. These programs cover applied research, extension, capacity building, and information management. The programs were independently evaluated using a standardised cost benefit analysis methodology that was applied consistently across
the RDCs.
The results show a strong return on investment, with a benefit cost ratio of 2.36 after five years and 5.56 after 10 years. The return rises to 10.51 after 25 years. That is, for every $1 invested, $10.51 is returned
3 Following the closure of Land and Water Australia in December 2009, 15 RDCs now comprise the CRRDCC
For every $1 invested, $10.51 is returned after 25 years.
Executive Summary v
after 25 years, largely consistent with the results from 2008, which showed that for every $1 invested, $11 was returned.
Importantly, these results show that pay back on the investment dollar is quick, with 60 per cent of projects showing a positive net present value by year five and 77 per cent positive by year 10. This means that there is a low risk of the innovation becoming obsolete, or industry circumstances changing, before the costs of the project can be recouped. Obsolescence in this context means the risk of adoption falling short of expectations as producers switch to newer innovations.
The results also show that there are no negative results in the 10 year and 25 year timeframes, with the
high and consistent rates of return at the program level suggesting that there may be under investment in rural R&D, an issue that will be investigated further in the 2010 evaluation report.
Benefits
Not all results are amenable to economic evaluation with current technologies, particularly those in the environmental and social areas. For the R&D projects analysed this year, the calculated returns on investment consisted primarily of economic benefits. The economic benefits came largely from productivity gains, improved market outcomes and improved quality management. While many projects also delivered environmental and social benefits, in most cases they could not be quantified within the scope of the evaluations conducted, and are not included in the returns on investment contained in this report.
Nevertheless, the evaluations describe a broad suite of environmental and social benefits arising from RDC investments. The majority of the reported social and environmental benefits included environmental and health benefits through the reduced use of chemicals, and improvements in food safety. Environmental benefits also included reduced soil erosion, reduction of chemical residues and more efficient water use.
Human resource capacity building, a critical contributor to regional development is also a major social impact of the RDC investments.
As noted above, the majority of the evaluations conducted by the RDCs were not able to quantify the
environmental and social benefits in economic terms, therefore the calculated returns on investment understate the full suite of benefits delivered by RDC investments. Consistent measurement of
environmental and social benefits is a key goal that the RDCs are actively pursuing. It is intended that a separate report will be published, outlining the results of this work.
Introduction 1
1 Introduction The Council of Rural Research and Development Corporations Chairs (CRRDCC) led the collective
measurement of the impact of Rural R&D to demonstrate the returns generated by the RDC model for levy payers and government. The purpose of the collective evaluation is to ensure that future
prioritisation of investments by the RDCs is based on a sound, systematic knowledge of the impacts of past investments across the RDC portfolio. This is increasingly important as the RDCs collaborate on a
wider range of issues such as climate change, trade, energy and natural resource management.
A consistent approach to evaluation provides information to assess the returns to rural industries and the broader society from the total investment made by the RDCs in research and development on
behalf of Australia’s agricultural, fisheries and forestry industries. The information will better inform policy makers and RDCs on the contribution that the RDC model is making to productivity in these
industries, both within the industries and along the supply chain. This is critical to maintaining the international competitiveness of Australia’s rural industries. It will also provide information on the net
public benefits being delivered by the RDC model.
The cost benefit analyses (CBA) provide a consistently assembled source of data on a range of factors such as gross benefits, benefit lags, costs and contributions, counterfactual arguments and other data
linking environmental and social benefits with program investments.
The evaluation process provides information that allows the RDCs to address the following areas:
• the extent of the spillovers between the RDCs and their levy payers that results in benefits accruing
beyond the specific industries associated with each RDC;
• the incidence of benefits along the supply chain and their impact on industry competitiveness;
• the extent of public benefits and their relationship to government formulated rural research priorities;
• the attribution of benefits from collaboration amongst RDCs in carrying out their RD&E; and
• the attribution of benefits from collaboration between RDCs and other investors in research and development including the CRCs, CSIRO, state governments and universities.
It should be noted that there are significant differences between the RDCs and the industries in which they are operating. This means that comparing results of individual RDC’s evaluation with the aggregated or average return should be treated with caution. Questions of assessing the lessons from
any negative returns cannot be adequately addressed from the aggregated figures. This is a matter for each RDC to address within their own portfolio.
The innovation cycle is complex and prone to produce large irregular returns from some projects or periods of smaller incremental gains across the entire portfolio. Further, extension of the results of RDC investments is likely to vary considerably between RDCs and is driven by such factors as scope of
levy mandate, industry prospects, capacity to finance new innovation by individuals and producers, climate variability and trade circumstances.
Methodology 2
This report summarises the results of the second year of the CRRDCC evaluation process. The evaluation process is ongoing and aimed at
producing a major report every three years. The results of the 2009 evaluation will be aggregated with the 2008 and 2010 results to be
reported on in late 2010.
The 2008 report provided the results of an independent evaluation of 36 highly successful projects and 32 randomly selected projects, to give an indication of average returns across the portfolio. The results
showed that over a 25 year timeframe, for every $1.00 invested there was an average return of $11, in 2007 dollars.
The results of the first year of the evaluations can be found at www.ruralrdc.com.au
2 Methodology In 2007, the CRRDCC developed an effective evaluation framework, in consultation with ACIL
Tasman, for assessing the impact of RDC investments and their compliance with government priorities. The resulting methodology was reviewed by The Treasury, Department of Finance and
Deregulation, the Department of Agriculture, Fisheries and Forestry, the Productivity Commission and the Australian Bureau of Agriculture and Resource Economics. The framework enables independent
estimates to be provided of the net benefits of RDC investments, including achievements and industry benefits, relative to priorities.
There are three elements in the evaluation process:
1. Analysis of a sufficient number of significant, successful, large scale projects or programs to demonstrate that the entire RDC portfolio is adding value to the Australian economy and
producing positive private and public benefits. These projects were undertaken in year one and will be included in the evaluation process in subsequent years, when particular aspects of the portfolio
are selected for assessment. No such projects were included in the 2009 evaluation process.
2. Representative random sampling of project clusters from each RDC to build a pool of consistent cost benefit analysis studies (CBAs) that can be used to provide an indication of the range and
trends in returns from the total RDCs investments over a three year period. Randomly selected projects will be evaluated each year.
3. An analysis of early stage collaborative R&D projects, which are expected to have major areas of public interest in order to measure the value of work in progress and the private and public opportunities early stage research creates. A large cross sector project on biosecurity was
undertaken in the first year of evaluation and several more are planned for next year.
A comprehensive description of the methodology can be found at www.ruralrdc.com.au.
The evaluation process is ongoing...
Projects 3
3 Projects RDCs assembled their entire investment portfolio into a series of sub programs or clusters of projects. Projects were randomly selected and RDCs then commissioned independent consultants to undertake
the analysis.
There were 59 project clusters (programs) evaluated in 2009. The programs covered a broad range of RDC investments ranging across forestry, meat, fodder crops, dairy systems, soil biology and fisheries
resource management. As well as covering a range of industry related topics, the programs also reflect the various stages across a wide spectrum of the innovation cycle within which the RDCs operate.
These programs cover applied research, extension, capacity building, and information management. While many of these elements are often contained within each program, for example most programs have an extension component, the majority of the 2009 programs focused more on one element than
another. For example, the Edgenetwork® offers a range of practical workshops, designed to help producers gain knowledge and skills to improve livestock operations. This education program supports
producers forming ‘peer review boards’ to discuss and analyse management practices used on their farms.
Another example of the emphasis in some of these programs on various stages of the innovation cycle is the GRDC soil biology programs, which, in collaboration with industry partners, developed new biological seed inoculants to improve plant performance. This program focused on the development
and commercialisation of new inoculants by applying basic research on soil biology and inoculants already in wide spread use for legumes.
A full list of all of the programs selected for the 2009 evaluation report can be found at Appendix B.
4 Benefits of the RDC investments
4.1 Economic benefits
The total net present value (NPV) of all programs evaluated in 2009 was estimated at $1.9 billion over a 25 year period. Economic benefits included productivity gains, improved market outcomes, and
improved quality systems.
4.1.1 Productivity gains
A large proportion of programs identified reduced costs to industry, including lower operating and capital costs, as a significant benefit from RDC investment in projects. Other improvements to industry
profits were identified as coming from increased sale volumes (as consumer demand and consumption increases in response to improved quality) and improved efficiency resulting in lower costs proportional
to output.
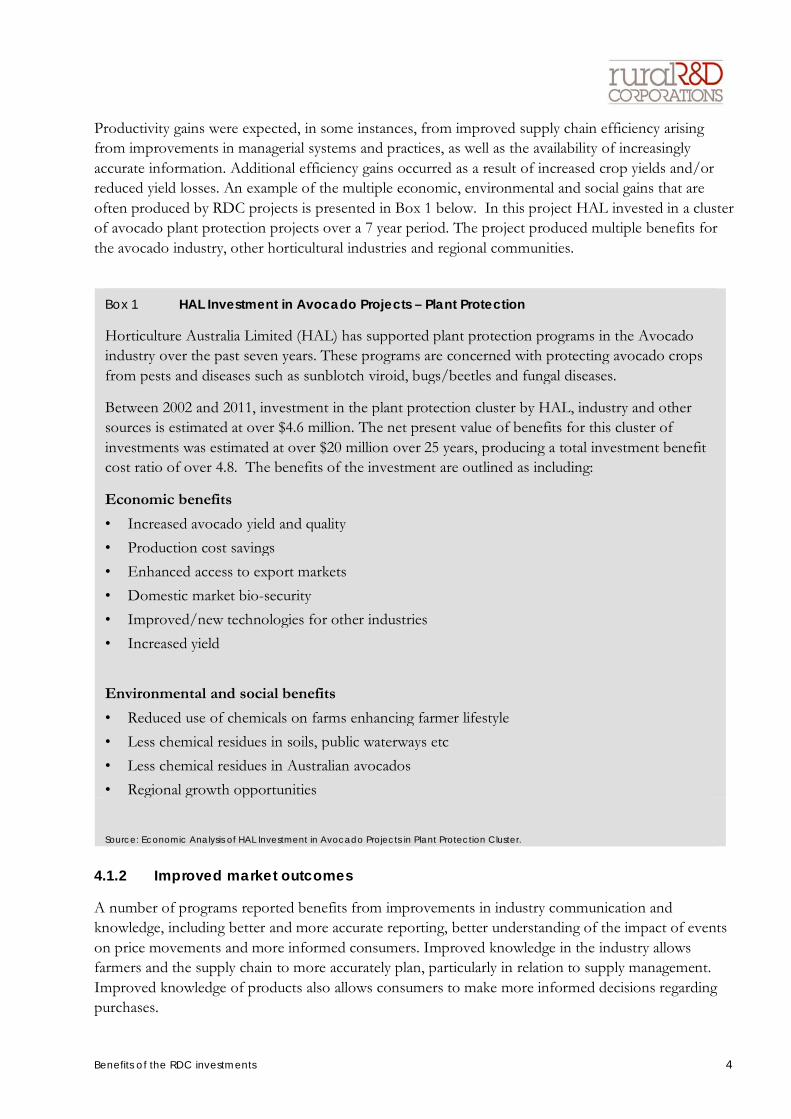
Benefits of the RDC investments 4
Productivity gains were expected, in some instances, from improved supply chain efficiency arising from improvements in managerial systems and practices, as well as the availability of increasingly
accurate information. Additional efficiency gains occurred as a result of increased crop yields and/or reduced yield losses. An example of the multiple economic, environmental and social gains that are
often produced by RDC projects is presented in Box 1 below. In this project HAL invested in a cluster of avocado plant protection projects over a 7 year period. The project produced multiple benefits for
the avocado industry, other horticultural industries and regional communities.
Box 1 HAL Investment in Avocado Projects – Plant Protection
Horticulture Australia Limited (HAL) has supported plant protection programs in the Avocado industry over the past seven years. These programs are concerned with protecting avocado crops
from pests and diseases such as sunblotch viroid, bugs/beetles and fungal diseases.
Between 2002 and 2011, investment in the plant protection cluster by HAL, industry and other sources is estimated at over $4.6 million. The net present value of benefits for this cluster of
investments was estimated at over $20 million over 25 years, producing a total investment benefit cost ratio of over 4.8. The benefits of the investment are outlined as including:
Economic benefits
• Increased avocado yield and quality
• Production cost savings
• Enhanced access to export markets
• Domestic market bio-security
• Improved/new technologies for other industries
• Increased yield
Environmental and social benefits
• Reduced use of chemicals on farms enhancing farmer lifestyle
• Less chemical residues in soils, public waterways etc
• Less chemical residues in Australian avocados
• Regional growth opportunities
Source: Economic Analysis of HAL Investment in Avocado Projects in Plant Protection Cluster.
4.1.2 Improved market outcomes
A number of programs reported benefits from improvements in industry communication and knowledge, including better and more accurate reporting, better understanding of the impact of events
on price movements and more informed consumers. Improved knowledge in the industry allows farmers and the supply chain to more accurately plan, particularly in relation to supply management.
Improved knowledge of products also allows consumers to make more informed decisions regarding purchases.
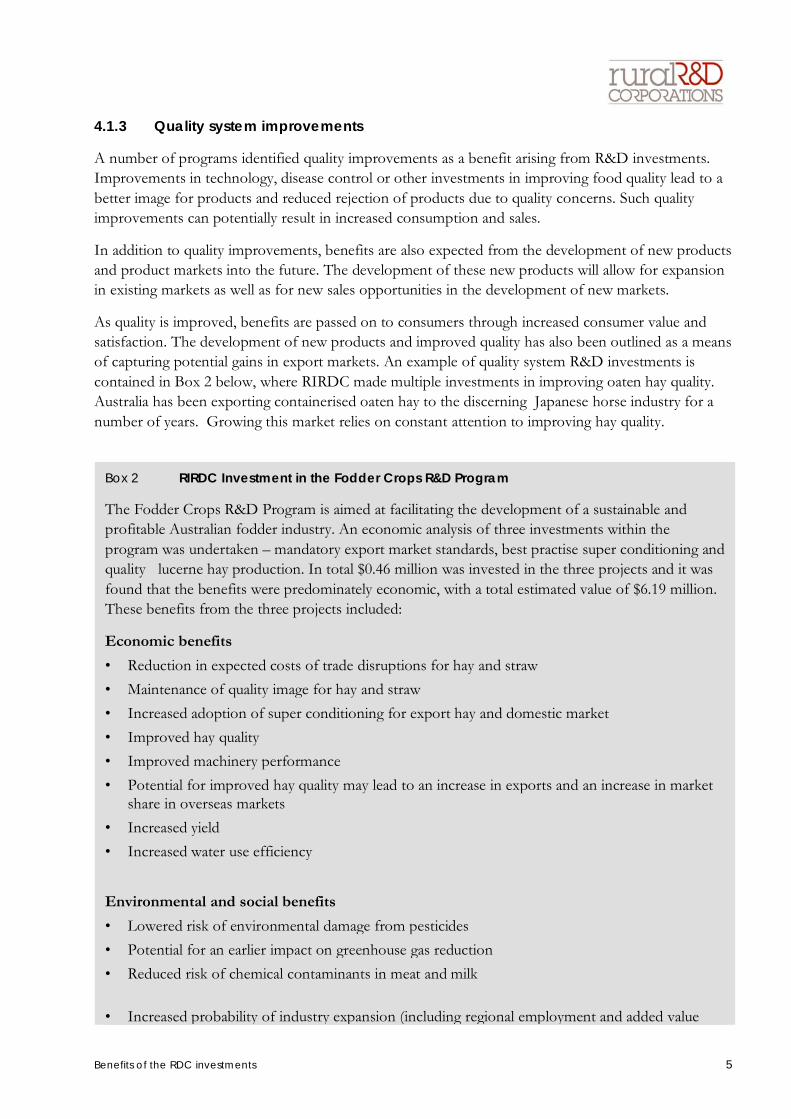
Benefits of the RDC investments 5
4.1.3 Quality system improvements
A number of programs identified quality improvements as a benefit arising from R&D investments. Improvements in technology, disease control or other investments in improving food quality lead to a
better image for products and reduced rejection of products due to quality concerns. Such quality improvements can potentially result in increased consumption and sales.
In addition to quality improvements, benefits are also expected from the development of new products and product markets into the future. The development of these new products will allow for expansion in existing markets as well as for new sales opportunities in the development of new markets.
As quality is improved, benefits are passed on to consumers through increased consumer value and satisfaction. The development of new products and improved quality has also been outlined as a means of capturing potential gains in export markets. An example of quality system R&D investments is
contained in Box 2 below, where RIRDC made multiple investments in improving oaten hay quality. Australia has been exporting containerised oaten hay to the discerning Japanese horse industry for a
number of years. Growing this market relies on constant attention to improving hay quality.
Box 2 RIRDC Investment in the Fodder Crops R&D Program
The Fodder Crops R&D Program is aimed at facilitating the development of a sustainable and profitable Australian fodder industry. An economic analysis of three investments within the
program was undertaken – mandatory export market standards, best practise super conditioning and quality lucerne hay production. In total $0.46 million was invested in the three projects and it was
found that the benefits were predominately economic, with a total estimated value of $6.19 million. These benefits from the three projects included:
Economic benefits
• Reduction in expected costs of trade disruptions for hay and straw
• Maintenance of quality image for hay and straw
• Increased adoption of super conditioning for export hay and domestic market
• Improved hay quality
• Improved machinery performance
• Potential for improved hay quality may lead to an increase in exports and an increase in market share in overseas markets
• Increased yield
• Increased water use efficiency
Environmental and social benefits
• Lowered risk of environmental damage from pesticides
• Potential for an earlier impact on greenhouse gas reduction
• Reduced risk of chemical contaminants in meat and milk
• Increased probability of industry expansion (including regional employment and added value
Benefits of the RDC investments 6
impacts)
• More efficient water use
• Reduced drainage water, recharge to water-tables, and nutrient exports off-farm.
• Reduced workload and improved lifestyles for irrigators
Source: RIRDC (2009), Economic Evaluation of Investment in the Fodder Crops R&D program.
4.2 Environmental and social benefits
The environmental and social benefits arising from RDC investments in programs were less frequently
quantified than the economic benefits. Most commonly, these benefits included health benefits through the reduced use of chemicals and improvements in food safety as well as benefits from improved
coordination and cooperation within industries.
Environmental benefits were mainly due to the reduced use of chemicals and pesticides. Lessened use of harmful pesticides will reduce the negative impact of these products on the surrounding
environment, for example, as chemical residues are reduced in soil and streams. The reduction of harmful chemicals is linked to health improvements through less harmful residues in food and reduced
exposure to such chemicals by employees and local residents. In addition to reduced chemical residue, the reduction of pests and disease and quality improvements will result in increased food safety,
improved food security and a reduction in food borne illness.
Program specific environmental benefits and outcomes were also identified. Examples include reduced soil erosion in agro-forestry projects, improved animal welfare from the humane destruction of chicken
carcasses, as well as several projects which identified the benefits of water savings and more efficient water use.
Social benefits from improved social networks and strategic alliances were found to exist in a number of programs. Improvements in industry and community involvement and communication, as well as increased industry coordination and cooperation will result in improved industry capacity and growth in
industry knowledge. Such capacity building creates spillover benefits, particularly in the form of productivity and technology improvements, as new knowledge is passed through the economy.
Regional growth opportunities, through improved business and increased regional employment were also outlined as additional social benefits from investments in programs.
Further work is being undertaken on the social and environmental impacts arising from RDC investments and will be included in a separate report.
Benefits of the RDC investments 7
4.2.1 Summary of environmental benefits
Below is a summary of the environmental benefits identified in the programs evaluated in 2009:
• DA • Reduced nutrient runoff and reduced water use from systems style approaches to managing
farms.
• CRDC • The water use efficiency on farms project identified savings of 1ML per Ha, subsequently it
identified a probable reduction in herbicide use and greenhouse gas emissions.
• FRDC • Reductions in water contamination and chemicals for disease management.
• GRDC • Increased adoption of sustainable agricultural practices and subsequent reductions in the use
of fungicide. • More sustainable agriculture from reduced reliance on manufactured and mined fertilisers. • Reduced risk of toxic contamination from chemicals in the farm environment. • Reduced use of protectant chemicals in grain storage environments. • Increased plant resistance can lead to less chemical/fertiliser usage on oilseed/other farms
and potentially lead to reduced export of chemicals and nutrients to public waterways.
• GWRDC • Reduced water use through improvements in the management of vine physiology.
• HAL (Potato and Nursery programs) • Accelerated phase out of chemicals, increasing yields and reducing water consumption.
• RIRDC (Agroforestry, Chicken Meat and Fodder Crop programs) • Benefits achieved from these clusters include greater soil conservation, reduction of
chemical residues and greater water efficiencies.
• SRDC • Significant reductions in erosion risk which will lead to a reduction in nutrient and sediment
runoff into sensitive water ways and marine ecosystems. • Reduced GHG emissions, chemical use and wastes.
Benefits of the RDC investments 8
4.2.2 Summary of social benefits
Below is a summary of the social benefits identified in the programs evaluated in 2009:
• DA • Increased education and career development on and post-farm, through the National
Centre for Dairy Education - Australia program, which directly links industry and education providers together in partnership.
• HAL (Potato and Nursery programs) • Research indicates greater health benefits for the Australian public associated with increased
consumption of avocados. Such research also gives consumers greater confidence that chemicals used on avocados are safe. The programs have also lead to greater industry networks and linkages, leading to a more cohesive industry.
• FRDC • The research has lead to the maintenance, development and attainment of a profitable and
sustainable salmon farming industry in Tasmania. This leads to a more viable industry.
• GRDC • Increased industry research capacity resulting from expanding soil biology research. • Enhanced skills and capacity in entomology and taxonomy. • Reduced potential adverse health impacts to grain fumigators and limited further use of
chemical grain protectants. • Potential health benefits from high oleic canola oils.
• RIRDC • Reduced risk of health impacts from pathogens in chicken meat litter (noting that existing
risk was already low), with potential contribution to reduced dust and odour emissions in the future. Data and information to alleviate community concerns regarding the risks of pathogen emissions from meat chicken sheds.
• SRDC • The creation of resilient regional communities has been strengthened by investing in the
capacity of people in the sugar industry to extend their knowledge of innovative research skills. Gains have also been made to overall public health benefits with extensive farm safety and OHS programs implemented.
Benefits of the RDC investments 9
4.3 Consumer benefits
Consumer benefits from RDC programs are generated largely from increased demand for products
arising from improved quality, greater choice as new markets are opened, and better information.
Several programs, such as the potato and avocado programs have identified improved quality as a significant benefit of RDC investments. As quality, or even perception of product quality improves, a
perception of increased value in the product increases consumer benefit.
Additional information to consumers regarding quality or safety can also improve the perception of products by customers. Programs have identified improved knowledge and confidence of consumers as
facilitating increased consumption, for example in the chicken meat R&D program.
The provision of other information, such as market information standards, can also benefit consumers. In the case of the MLA’s market information, better information leads to reduced costs in the red meat
chain from efficient price discovery, more confident decision-making and improved capacity to meet market needs, which results in better prices for consumers. Greater transparency can also lead to more
sales as consumers may feel more comfortable making informed purchases.
Several programs have also found increased demand for products and services as a result of project investments. For example, HAL nursery and garden industry projects have found benefits to the
industry from increased consumer demand from the business improvement program and industry development programs, to be valued at $2.44m and $2.87m respectively. While not measuring
consumer benefits directly, an increased demand implies considerable increases in consumer benefits. The avocado programs – market and consumer research; post harvest and fruit quality; and supply
chain – also experienced increased consumption, valued between $1,800/t and $2,700/t for each project.
An example of a program delivering consumer benefits is the APL Project Muscle Profiling, that analysed new ways of cutting pork carcases. The program focused on producing a consumer-driven product range of fresh pork cuts (incorporating new carcass cutting lines) to meet the evolving
requirements of consumers and to drive maximum incremental profit at all levels of the supply chain. A key focus was to improve the value return from pork shoulders, as retailers had identified this
product category as offering lower dollar returns but also potential for higher returns. The benefits of this program are forecast to increase consumer demand for pork, as pork products are presented in
new and innovative servings and cuts. There are also considerable supply chain savings that are likely to be generated.
Higher levels of industry productivity may also generate consumer benefits as decreasing operating costs and new technologies resulting in larger yields, allow businesses to be more competitive, and reduce prices for consumers. An example of an RDC investment where benefits to consumers were as
a result of increased industry profitability is the Dairy Australia System Management project contained in Box 3.
Benefits of the RDC investments 10
Box 3 Consumer benefits case study– Dairy Australia
Dairy Australia’s System Management project was established with the aim to equip the dairy industry with resources and tools to increase farm profitability through a more efficient and
productive workforce and for dairy farmers to embrace innovative technologies to improve farm productivity over time.
In addition to economic benefits such as increased farm profits, value of information, reduced staff turnover etc, benefits to Australian consumers of dairy products were also incorporated into project cost benefit analysis. Gains from the project to consumers come as a result of increased
industry profitability, and as a result lower dairy prices.
Consumer benefits were estimated at approximately $5 million between 2009 and 2020. These consumer benefits were estimated on the basis that 10% of farm level benefits are captured by
Australian dairy consumers through lower prices.
Source: Cost benefit analysis of randomly selected Dairy Australia investments.
4.4 The 2009 results
There were 594 projects and project clusters randomly selected this year. These were conducted from
2001 to 2009 (some are ongoing but all had reached a significant milestone by 2007-08) and cover a wide range of topics, as would be expected from RDCs covering industries as diverse as grains, wine,
red meat and cotton production.
The total expenditure on these projects was $837 million of which one, Northern Beef Research (a MLA co-investment with the Queensland Department of Employment, Economic Development and
Innovation), was $345 million or approximately 40 per cent. Of the total cost of the projects, the RDCs contributed $175 million. This demonstrates that the RDCs
collaboratively manage co-investment in R&D that is well in excess of their own direct contributions, underpinning the RDCs pivotal
role in coordinating and leading a majority of the rural research expenditure in Australia. Each program analysis was asked to report
NPV, BCR and IRRs at 0, 5, 10, and 25 years following the last year of investment in the program. The results are summarised in the tables below.
4 58 of the 59 projects provided quantified results.
The simple average results clearly show a strong positive return
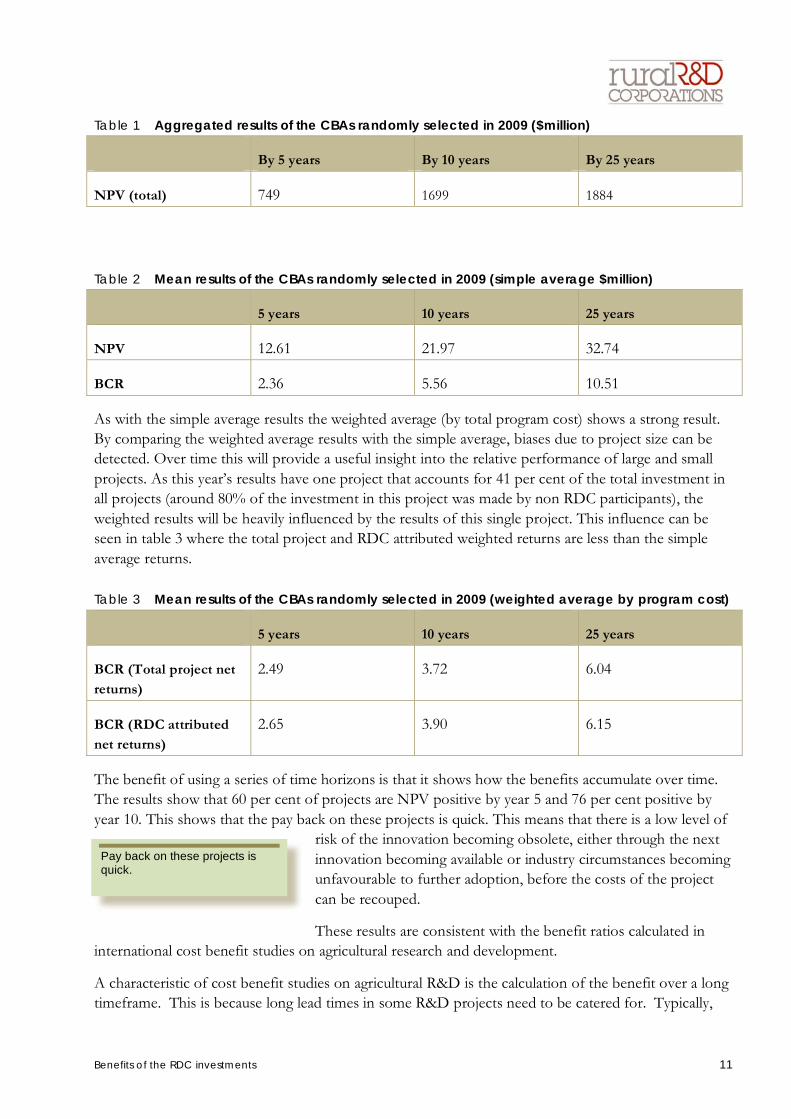
Benefits of the RDC investments 11
Table 1 Aggregated results of the CBAs randomly selected in 2009 ($million)
By 5 years By 10 years By 25 years
NPV (total) 749 1699 1884
Table 2 Mean results of the CBAs randomly selected in 2009 (simple average $million)
5 years 10 years 25 years
NPV 12.61 21.97 32.74
BCR 2.36 5.56 10.51
As with the simple average results the weighted average (by total program cost) shows a strong result. By comparing the weighted average results with the simple average, biases due to project size can be detected. Over time this will provide a useful insight into the relative performance of large and small
projects. As this year’s results have one project that accounts for 41 per cent of the total investment in all projects (around 80% of the investment in this project was made by non RDC participants), the
weighted results will be heavily influenced by the results of this single project. This influence can be seen in table 3 where the total project and RDC attributed weighted returns are less than the simple
average returns.
Table 3 Mean results of the CBAs randomly selected in 2009 (weighted average by program cost)
5 years 10 years 25 years
BCR (Total project net
returns) 2.49 3.72 6.04
BCR (RDC attributed
net returns) 2.65 3.90 6.15
The benefit of using a series of time horizons is that it shows how the benefits accumulate over time. The results show that 60 per cent of projects are NPV positive by year 5 and 76 per cent positive by
year 10. This shows that the pay back on these projects is quick. This means that there is a low level of risk of the innovation becoming obsolete, either through the next
innovation becoming available or industry circumstances becoming unfavourable to further adoption, before the costs of the project
can be recouped.
These results are consistent with the benefit ratios calculated in international cost benefit studies on agricultural research and development.
A characteristic of cost benefit studies on agricultural R&D is the calculation of the benefit over a long timeframe. This is because long lead times in some R&D projects need to be catered for. Typically,
Pay back on these projects is quick.
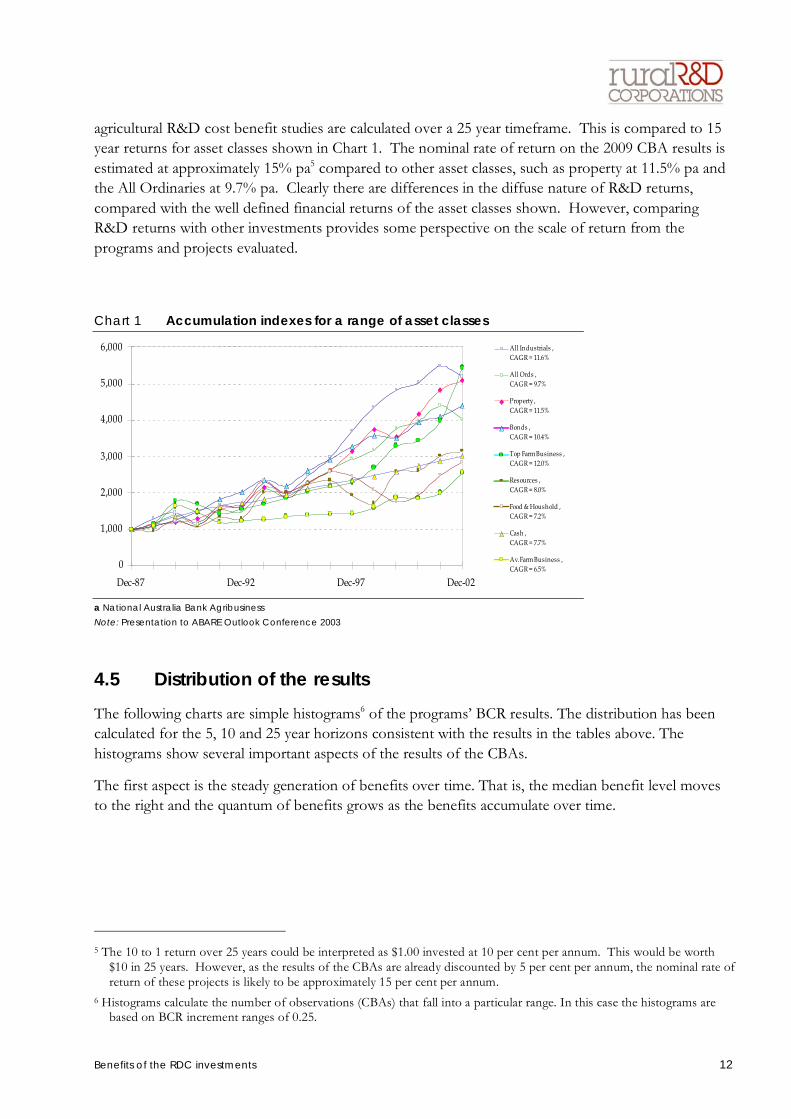
Benefits of the RDC investments 12
agricultural R&D cost benefit studies are calculated over a 25 year timeframe. This is compared to 15 year returns for asset classes shown in Chart 1. The nominal rate of return on the 2009 CBA results is
estimated at approximately 15% pa5 compared to other asset classes, such as property at 11.5% pa and the All Ordinaries at 9.7% pa. Clearly there are differences in the diffuse nature of R&D returns,
compared with the well defined financial returns of the asset classes shown. However, comparing R&D returns with other investments provides some perspective on the scale of return from the
programs and projects evaluated.
Chart 1 Accumulation indexes for a range of asset classes
0
1,000
2,000
3,000
4,000
5,000
6,000
Dec-87 Dec-92 Dec-97 Dec-02
All Industrials , CAGR = 11.6%
All Ords , CAGR = 9.7%
Property , CAGR = 11.5%
Bonds , CAGR = 10.4%
Top Farm Business , CAGR = 12.0%
Resources , CAGR = 8.0%
Food & Houshold , CAGR = 7.2%
Cash , CAGR = 7.7%
Av. Farm Business , CAGR = 6.5%
a National Australia Bank Agribusiness
Note: Presentation to ABARE Outlook Conference 2003
4.5 Distribution of the results
The following charts are simple histograms6 of the programs’ BCR results. The distribution has been calculated for the 5, 10 and 25 year horizons consistent with the results in the tables above. The
histograms show several important aspects of the results of the CBAs.
The first aspect is the steady generation of benefits over time. That is, the median benefit level moves to the right and the quantum of benefits grows as the benefits accumulate over time.
5 The 10 to 1 return over 25 years could be interpreted as $1.00 invested at 10 per cent per annum. This would be worth
$10 in 25 years. However, as the results of the CBAs are already discounted by 5 per cent per annum, the nominal rate of return of these projects is likely to be approximately 15 per cent per annum.
6 Histograms calculate the number of observations (CBAs) that fall into a particular range. In this case the histograms are based on BCR increment ranges of 0.25.
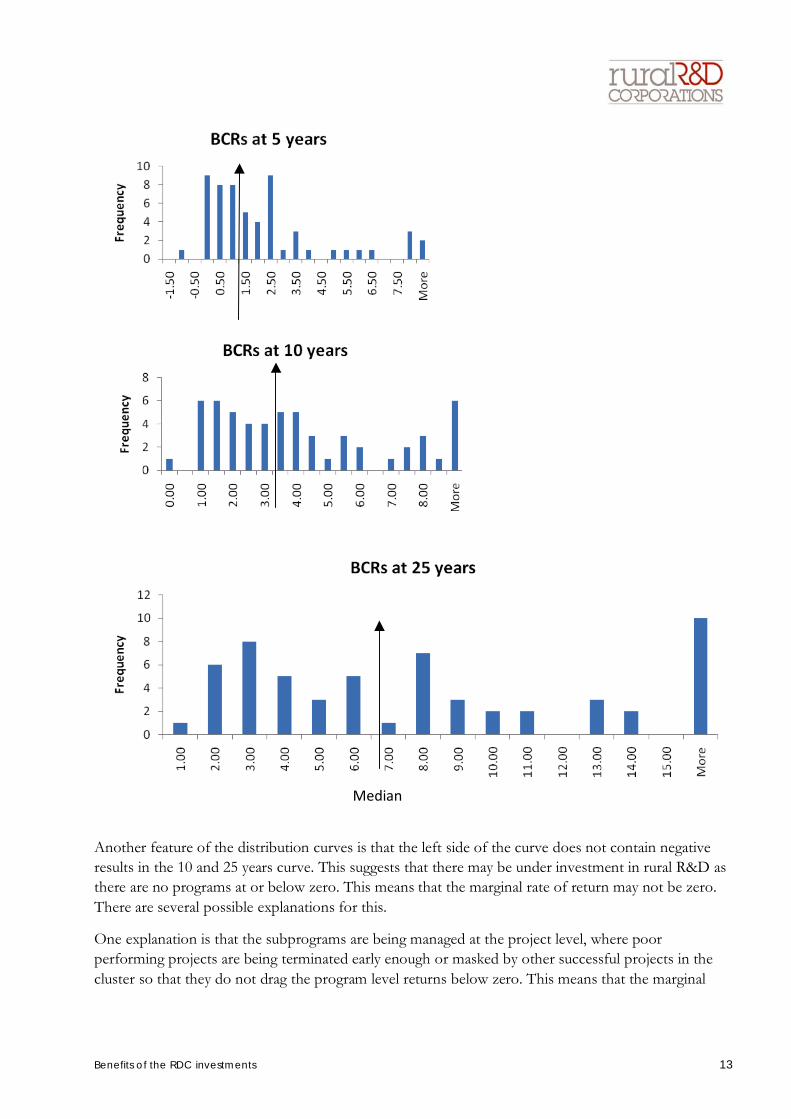
Benefits of the RDC investments 13
Another feature of the distribution curves is that the left side of the curve does not contain negative results in the 10 and 25 years curve. This suggests that there may be under investment in rural R&D as there are no programs at or below zero. This means that the marginal rate of return may not be zero.
There are several possible explanations for this.
One explanation is that the subprograms are being managed at the project level, where poor performing projects are being terminated early enough or masked by other successful projects in the
cluster so that they do not drag the program level returns below zero. This means that the marginal
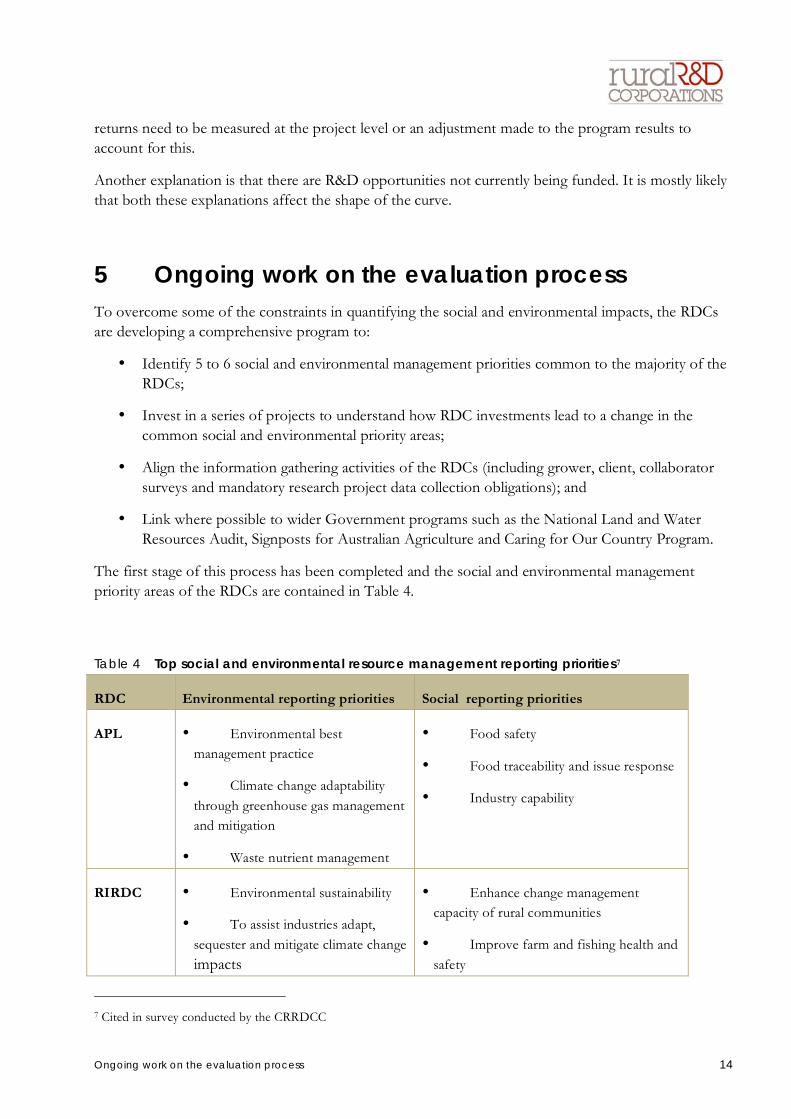
Ongoing work on the evaluation process 14
returns need to be measured at the project level or an adjustment made to the program results to account for this.
Another explanation is that there are R&D opportunities not currently being funded. It is mostly likely that both these explanations affect the shape of the curve.
5 Ongoing work on the evaluation process To overcome some of the constraints in quantifying the social and environmental impacts, the RDCs are developing a comprehensive program to:
• Identify 5 to 6 social and environmental management priorities common to the majority of the RDCs;
• Invest in a series of projects to understand how RDC investments lead to a change in the common social and environmental priority areas;
• Align the information gathering activities of the RDCs (including grower, client, collaborator surveys and mandatory research project data collection obligations); and
• Link where possible to wider Government programs such as the National Land and Water Resources Audit, Signposts for Australian Agriculture and Caring for Our Country Program.
The first stage of this process has been completed and the social and environmental management priority areas of the RDCs are contained in Table 4.
Table 4 Top social and environmental resource management reporting priorities7
RDC Environmental reporting priorities Social reporting priorities
APL • Environmental best
management practice
• Climate change adaptability
through greenhouse gas management
and mitigation
• Waste nutrient management
• Food safety
• Food traceability and issue response
• Industry capability
RIRDC • Environmental sustainability
• To assist industries adapt,
sequester and mitigate climate change
impacts
• Enhance change management
capacity of rural communities
• Improve farm and fishing health and
safety
7 Cited in survey conducted by the CRRDCC
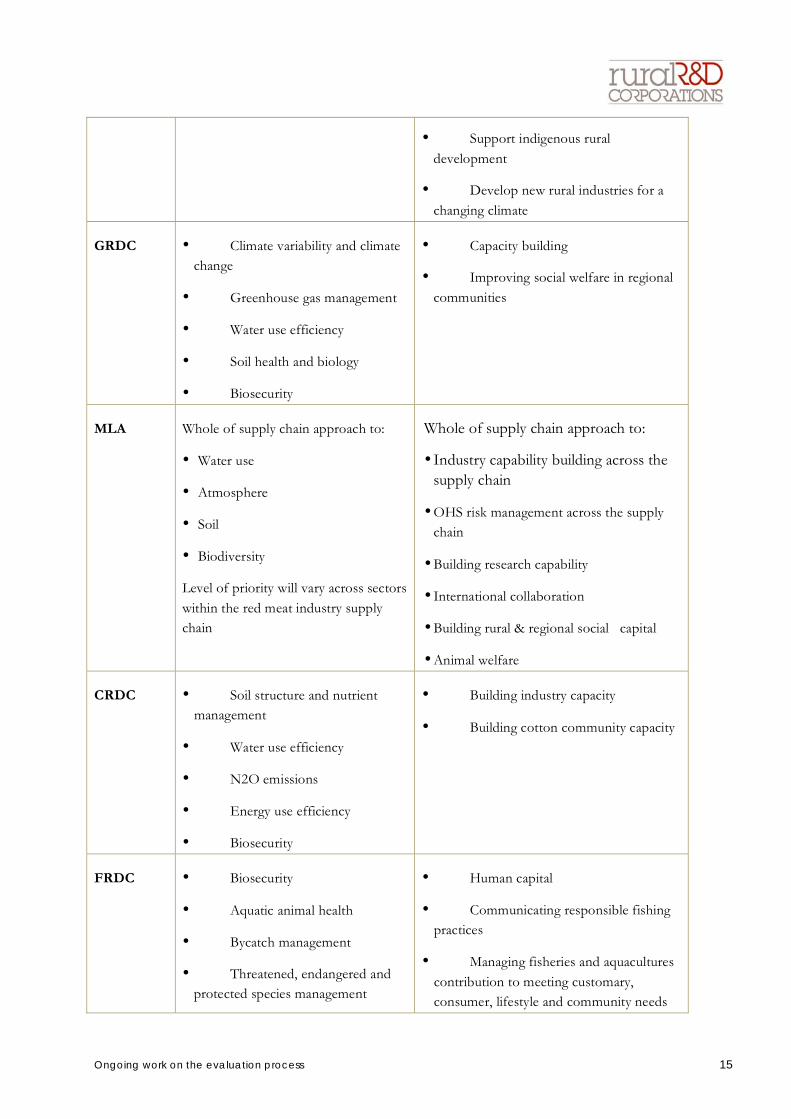
Ongoing work on the evaluation process 15
• Support indigenous rural
development
• Develop new rural industries for a
changing climate
GRDC • Climate variability and climate
change
• Greenhouse gas management
• Water use efficiency
• Soil health and biology
• Biosecurity
• Capacity building
• Improving social welfare in regional
communities
MLA Whole of supply chain approach to:
• Water use
• Atmosphere
• Soil
• Biodiversity
Level of priority will vary across sectors
within the red meat industry supply
chain
Whole of supply chain approach to:
• Industry capability building across the
supply chain
• OHS risk management across the supply
chain
• Building research capability
• International collaboration
• Building rural & regional social capital
• Animal welfare
CRDC • Soil structure and nutrient
management
• Water use efficiency
• N2O emissions
• Energy use efficiency
• Biosecurity
• Building industry capacity
• Building cotton community capacity
FRDC • Biosecurity
• Aquatic animal health
• Bycatch management
• Threatened, endangered and
protected species management
• Human capital
• Communicating responsible fishing
practices
• Managing fisheries and aquacultures
contribution to meeting customary,
consumer, lifestyle and community needs
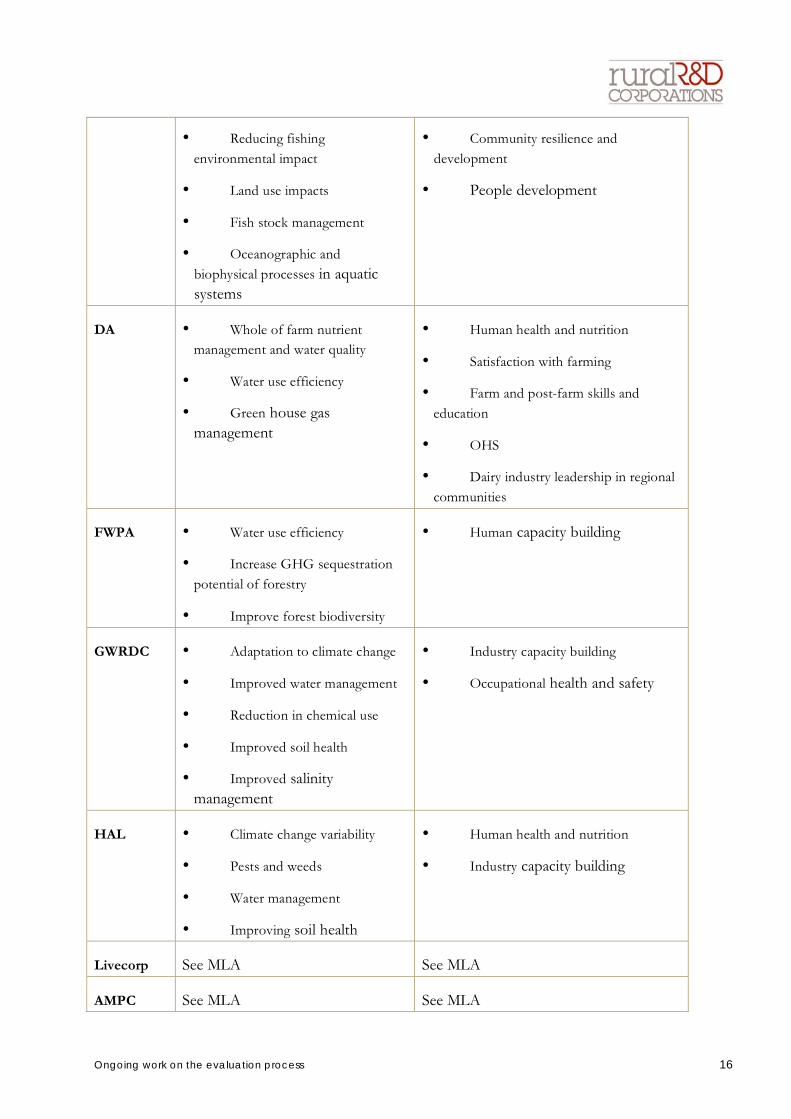
Ongoing work on the evaluation process 16
• Reducing fishing environmental impact
• Land use impacts
• Fish stock management
• Oceanographic and biophysical processes in aquatic systems
• Community resilience and development
• People development
DA • Whole of farm nutrient management and water quality
• Water use efficiency
• Green house gas management
• Human health and nutrition
• Satisfaction with farming
• Farm and post-farm skills and education
• OHS
• Dairy industry leadership in regional communities
FWPA • Water use efficiency
• Increase GHG sequestration potential of forestry
• Improve forest biodiversity
• Human capacity building
GWRDC • Adaptation to climate change
• Improved water management
• Reduction in chemical use
• Improved soil health
• Improved salinity management
• Industry capacity building
• Occupational health and safety
HAL • Climate change variability
• Pests and weeds
• Water management
• Improving soil health
• Human health and nutrition
• Industry capacity building
Livecorp See MLA See MLA
AMPC See MLA See MLA
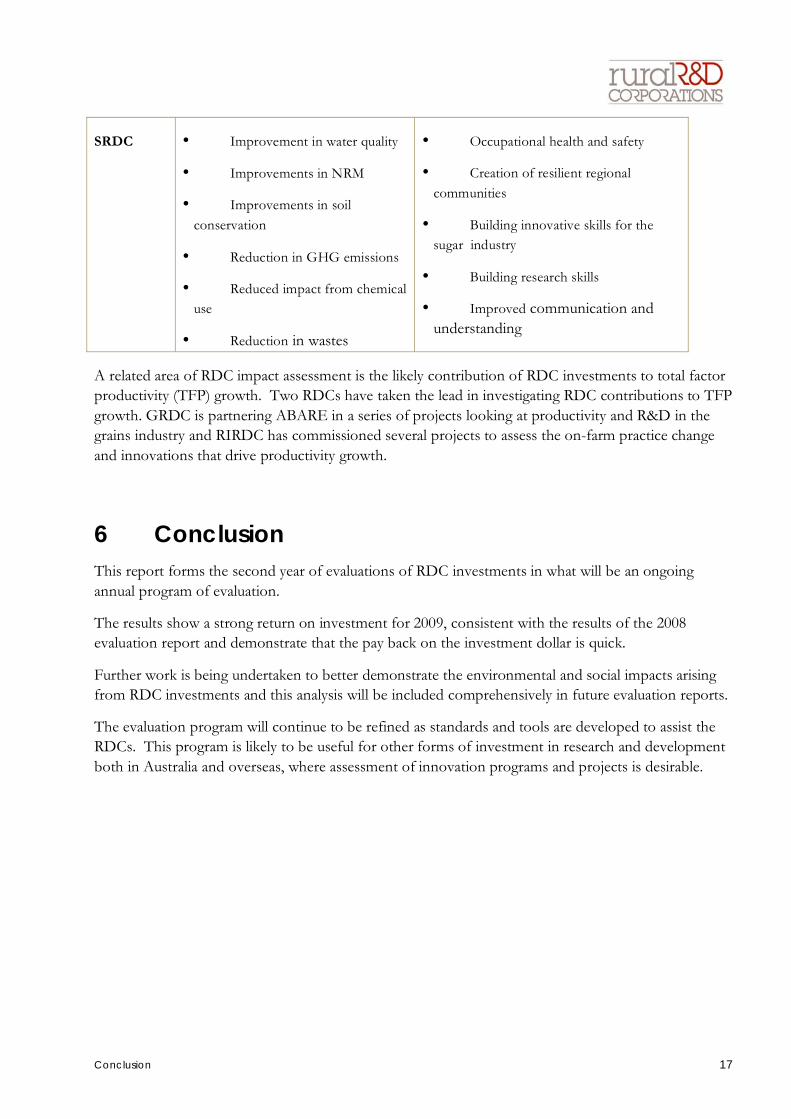
Conclusion 17
SRDC • Improvement in water quality
• Improvements in NRM
• Improvements in soil
conservation
• Reduction in GHG emissions
• Reduced impact from chemical
use
• Reduction in wastes
• Occupational health and safety
• Creation of resilient regional
communities
• Building innovative skills for the
sugar industry
• Building research skills
• Improved communication and
understanding
A related area of RDC impact assessment is the likely contribution of RDC investments to total factor productivity (TFP) growth. Two RDCs have taken the lead in investigating RDC contributions to TFP
growth. GRDC is partnering ABARE in a series of projects looking at productivity and R&D in the grains industry and RIRDC has commissioned several projects to assess the on-farm practice change
and innovations that drive productivity growth.
6 Conclusion This report forms the second year of evaluations of RDC investments in what will be an ongoing
annual program of evaluation.
The results show a strong return on investment for 2009, consistent with the results of the 2008 evaluation report and demonstrate that the pay back on the investment dollar is quick.
Further work is being undertaken to better demonstrate the environmental and social impacts arising from RDC investments and this analysis will be included comprehensively in future evaluation reports.
The evaluation program will continue to be refined as standards and tools are developed to assist the RDCs. This program is likely to be useful for other forms of investment in research and development
both in Australia and overseas, where assessment of innovation programs and projects is desirable.
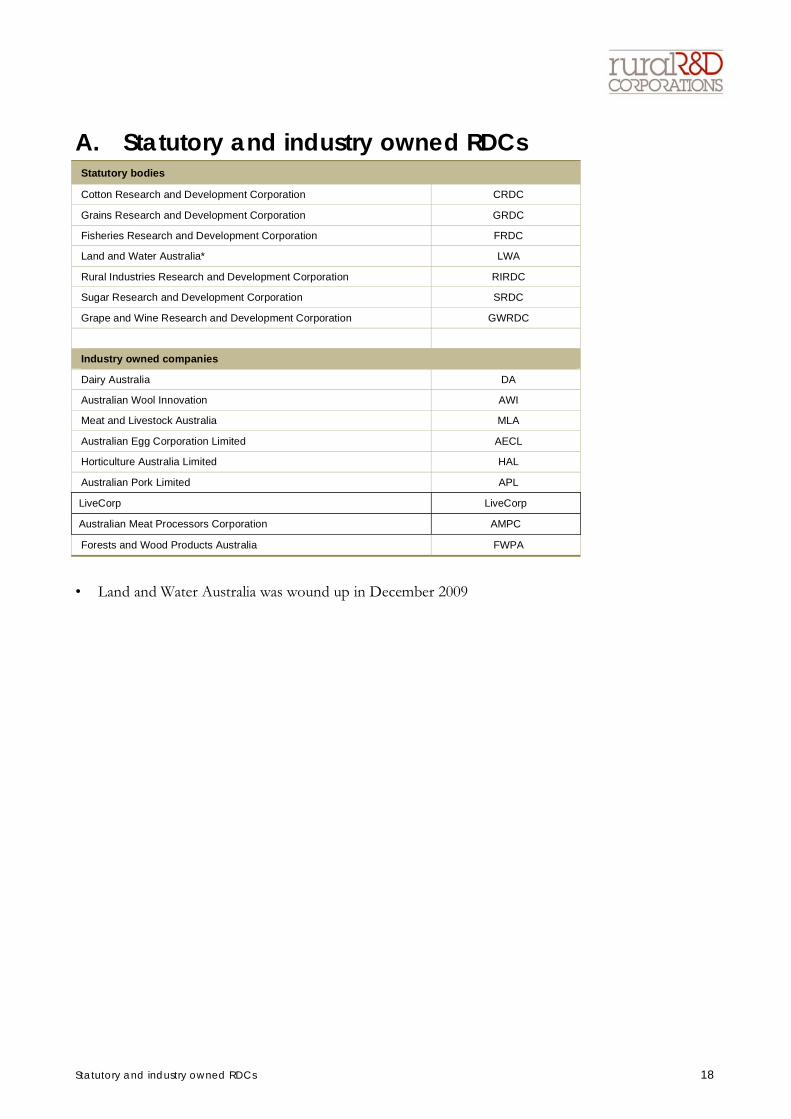
Statutory and industry owned RDCs 18
A. Statutory and industry owned RDCs Statutory bodies
Cotton Research and Development Corporation CRDC
Grains Research and Development Corporation GRDC
Fisheries Research and Development Corporation FRDC
Land and Water Australia* LWA
Rural Industries Research and Development Corporation RIRDC
Sugar Research and Development Corporation SRDC
Grape and Wine Research and Development Corporation GWRDC
Industry owned companies
Dairy Australia DA
Australian Wool Innovation AWI
Meat and Livestock Australia MLA
Australian Egg Corporation Limited AECL
Horticulture Australia Limited HAL
Australian Pork Limited APL
LiveCorp LiveCorp
Australian Meat Processors Corporation AMPC
Forests and Wood Products Australia FWPA
• Land and Water Australia was wound up in December 2009
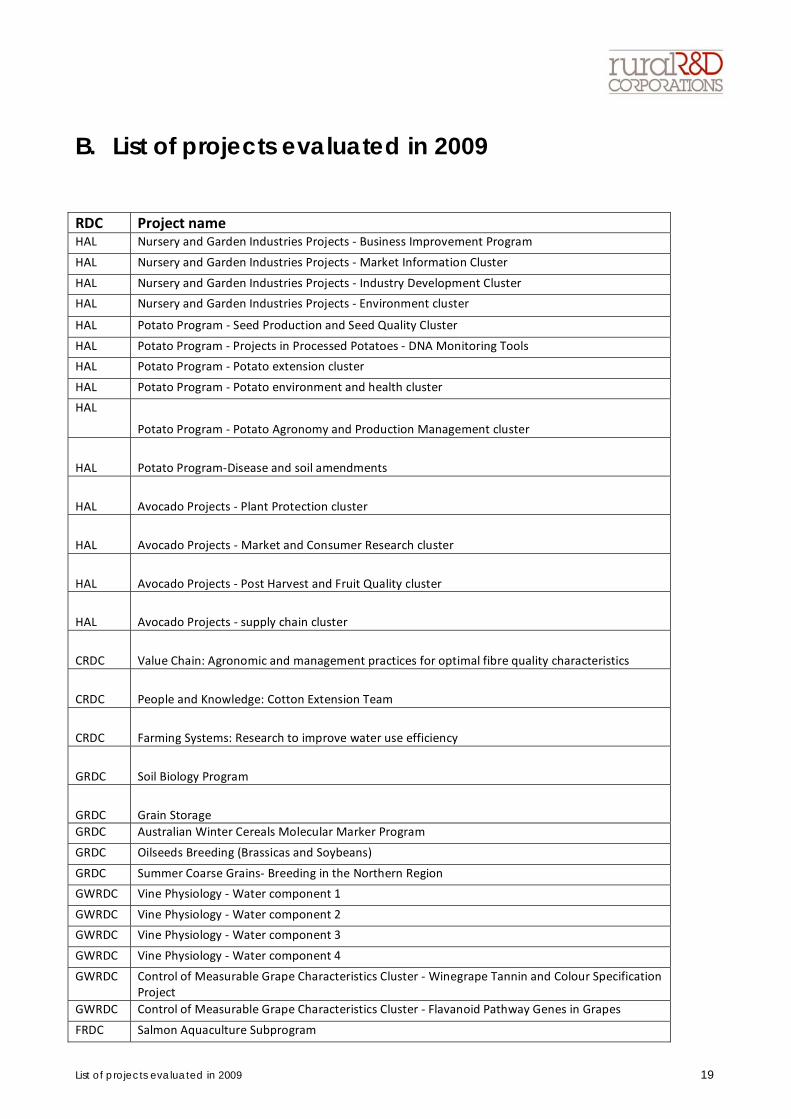
List of projects evaluated in 2009 19
B. List of projects evaluated in 2009
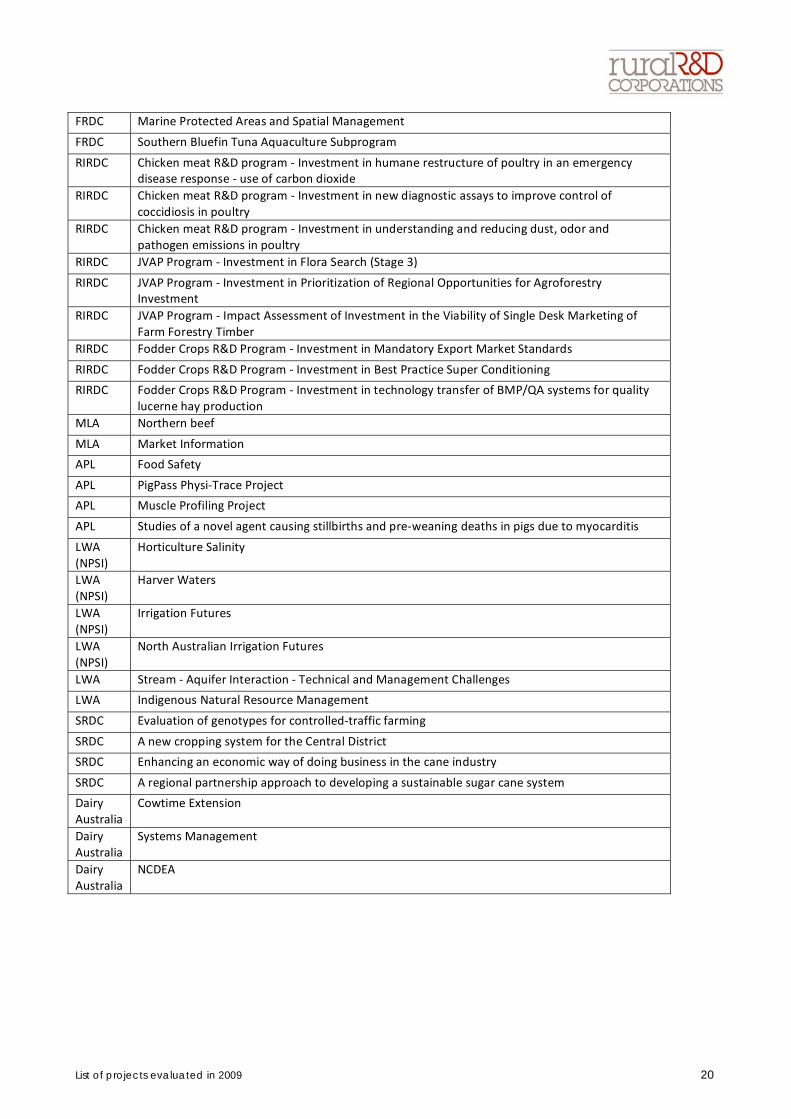
List of projects evaluated in 2009 20
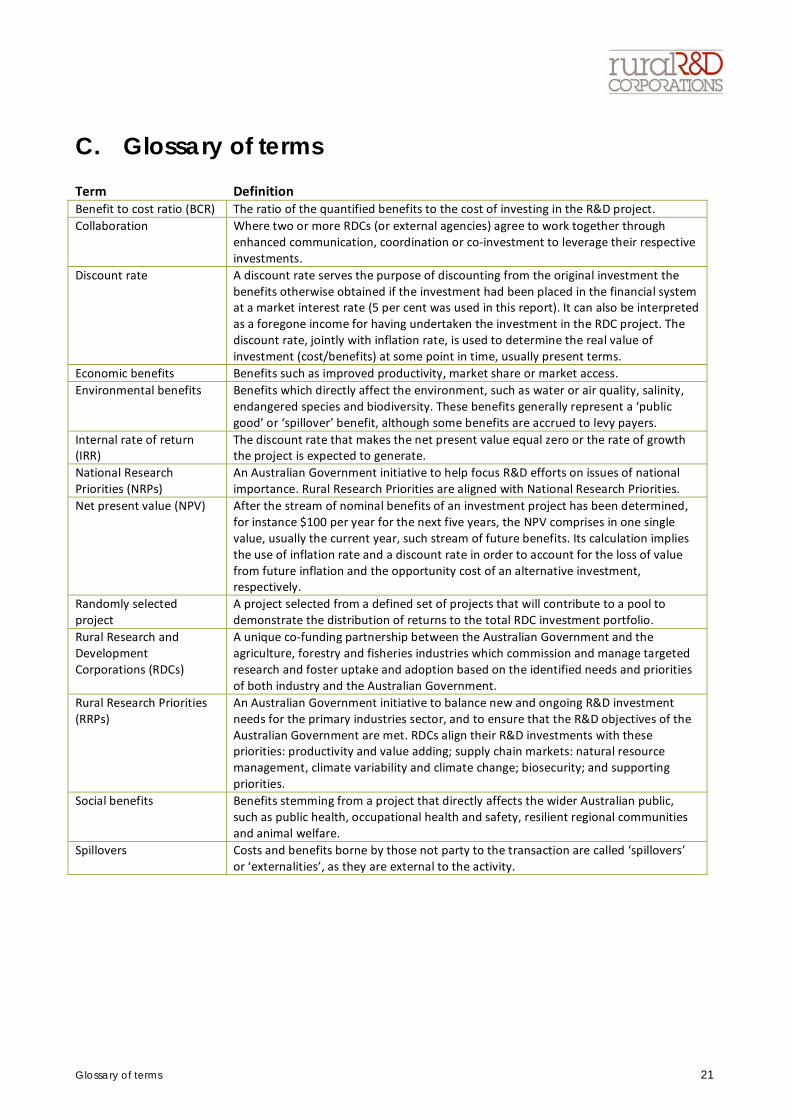
Glossary of terms 21
C. Glossary of terms
Appendix 6:
QualDATA survey
CRRDC submission to the PC inquiry into the R&D corporations model, June 2010

Page | 1
Extension, Adoption, Practice Change and Education Survey of RDCs and Agricultural Industry based CRCs
The purpose of this survey is to undertake the collection of data to support submissions to the Productivity Commission Inquiry into the Rural Research and Development Corporations and is being undertaken by QualDATA/Rural Survey Specialists in conjunction with the Council of Rural Research and Development Corporations (CRRDC) and the CRC Association (CRCA). The focus is on the extension, adoption, practice change, education and capacity building components of the organisations – directed towards next users (eg: consultants, extension officers, NRM organisation staff etc) and end users (eg: landholders, farming enterprises, local government). Background details
1. Name of organisation
2. Contact Person providing information
3. Position of respondent
CEO or equivalent
Executive Manager or equivalent
Program Manager or equivalent
Other
4. Type of organisation
CRC
RDC
Other Definitions There are a range of terms used in the extension/adoption arena. Below are terms relevant to this survey with some very brief working definitions. Please use these definitions in relation to the later questions – although there is also a space for you to propose an alternative definition that you are more comfortable with for future communication. Please feel free to propose alternative names / terms for these functions too and if required additional names and definitions. a.Marketing – encouraging sales of industry products
b.Promotion – promoting the organisation or industry and its benefits
c.Public Relations – maintaining a positive media presence
d.Communication – keeping stakeholders up to date with policies, activities, outputs, information and opportunities (without expecting feedback)
e.Engagement – providing opportunity for input into policy, strategies and activities
f.Extension – using a range of informal education approaches to encourage adoption and change
g. Advisory – one-on-one technical or business support usually provided by private consultants and/or agribusiness; or NRM group personnel sometimes with support of state agencies
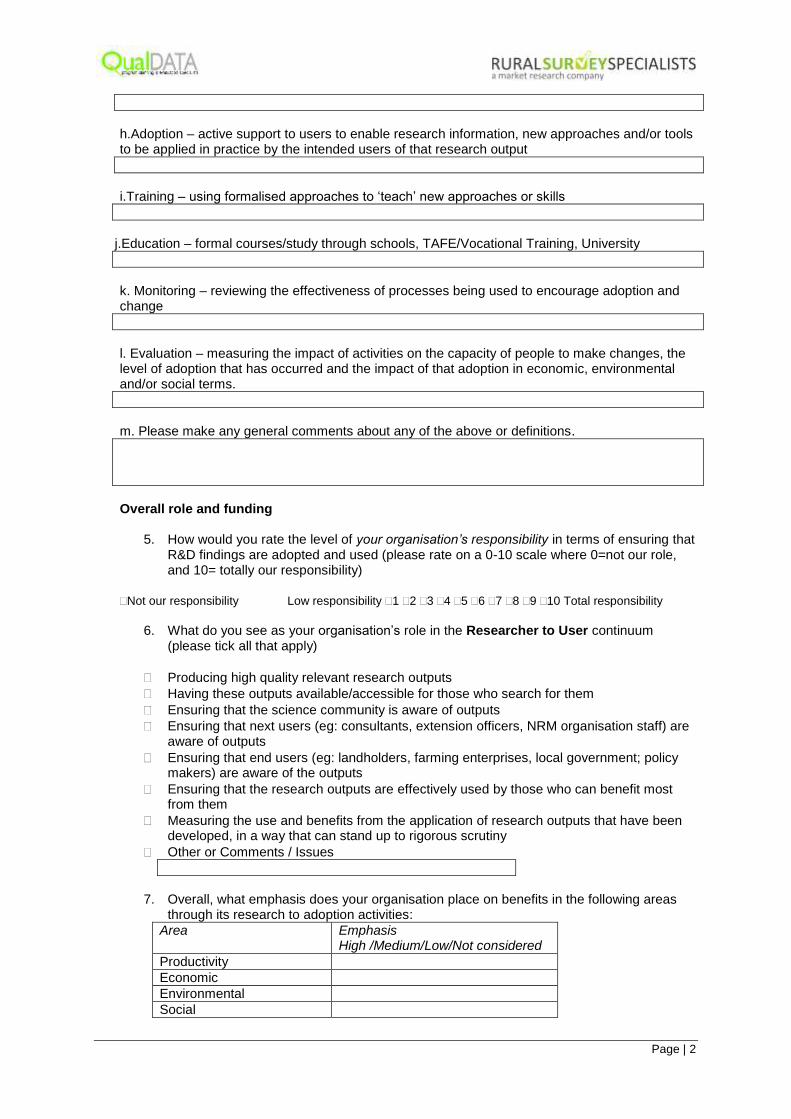
Page | 2
h.Adoption – active support to users to enable research information, new approaches and/or tools to be applied in practice by the intended users of that research output
i.Training – using formalised approaches to ‘teach’ new approaches or skills
j.Education – formal courses/study through schools, TAFE/Vocational Training, University
k. Monitoring – reviewing the effectiveness of processes being used to encourage adoption and change
l. Evaluation – measuring the impact of activities on the capacity of people to make changes, the level of adoption that has occurred and the impact of that adoption in economic, environmental and/or social terms.
m. Please make any general comments about any of the above or definitions.
Overall role and funding
5. How would you rate the level of your organisation’s responsibility in terms of ensuring that R&D findings are adopted and used (please rate on a 0-10 scale where 0=not our role, and 10= totally our responsibility)
Not our responsibility Low responsibility 1 2 3 4 5 6 7 8 9 10 Total responsibility
6. What do you see as your organisation’s role in the Researcher to User continuum
(please tick all that apply)
Producing high quality relevant research outputs
Having these outputs available/accessible for those who search for them
Ensuring that the science community is aware of outputs
Ensuring that next users (eg: consultants, extension officers, NRM organisation staff) are aware of outputs
Ensuring that end users (eg: landholders, farming enterprises, local government; policy makers) are aware of the outputs
Ensuring that the research outputs are effectively used by those who can benefit most from them
Measuring the use and benefits from the application of research outputs that have been developed, in a way that can stand up to rigorous scrutiny
Other or Comments / Issues
7. Overall, what emphasis does your organisation place on benefits in the following areas
through its research to adoption activities:
Area Emphasis High /Medium/Low/Not considered
Productivity
Economic
Environmental
Social

Page | 3
8. How strongly – and in what ways – does your organisation currently link to the following (other) providers in the extension/advisory/training/adoption process?
8.a Government extension agencies
No link Weak link 1 2 3 4 5 6 7 8 9 10 Strong link
Details
8.b NRM Bodies (CMOs, CMAs, Landcare)
No link Weak link 1 2 3 4 5 6 7 8 9 10 Strong link
Details
8.c Agribusiness – including Consultants/Product resellers/Product suppliers
No link Weak link 1 2 3 4 5 6 7 8 9 10 Strong link
Details
8.d Comments on this issue
9. What specific activities (program / project name and/or specific description) are you
taking/sponsoring in building human capacity?
Type of activity Details of activities including expected outcomes
Fostering Post-graduate research/studies
Schools based activities – Yrs 8-12
Schools based activities – under Yr 8
University focussed activities
Vocational Education Training activities
Informal skilling
‘In the industry’ on the job work / experience
Supporting local community/industry groups
Other / overall comments
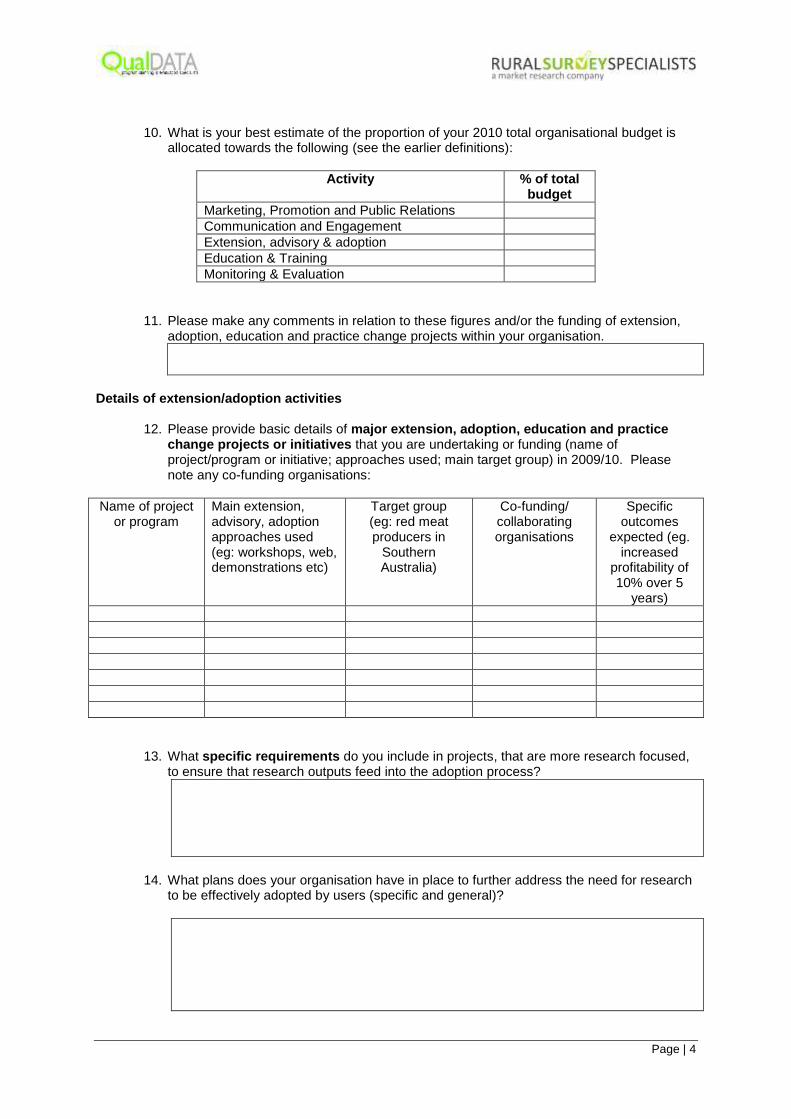
Page | 4
10. What is your best estimate of the proportion of your 2010 total organisational budget is allocated towards the following (see the earlier definitions):
Activity % of total budget
Marketing, Promotion and Public Relations
Communication and Engagement
Extension, advisory & adoption
Education & Training
Monitoring & Evaluation
11. Please make any comments in relation to these figures and/or the funding of extension, adoption, education and practice change projects within your organisation.
Details of extension/adoption activities
12. Please provide basic details of major extension, adoption, education and practice change projects or initiatives that you are undertaking or funding (name of project/program or initiative; approaches used; main target group) in 2009/10. Please note any co-funding organisations:
Name of project or program
Main extension, advisory, adoption approaches used (eg: workshops, web, demonstrations etc)
Target group (eg: red meat producers in
Southern Australia)
Co-funding/ collaborating organisations
Specific outcomes
expected (eg. increased
profitability of 10% over 5
years)
13. What specific requirements do you include in projects, that are more research focused, to ensure that research outputs feed into the adoption process?
14. What plans does your organisation have in place to further address the need for research
to be effectively adopted by users (specific and general)?
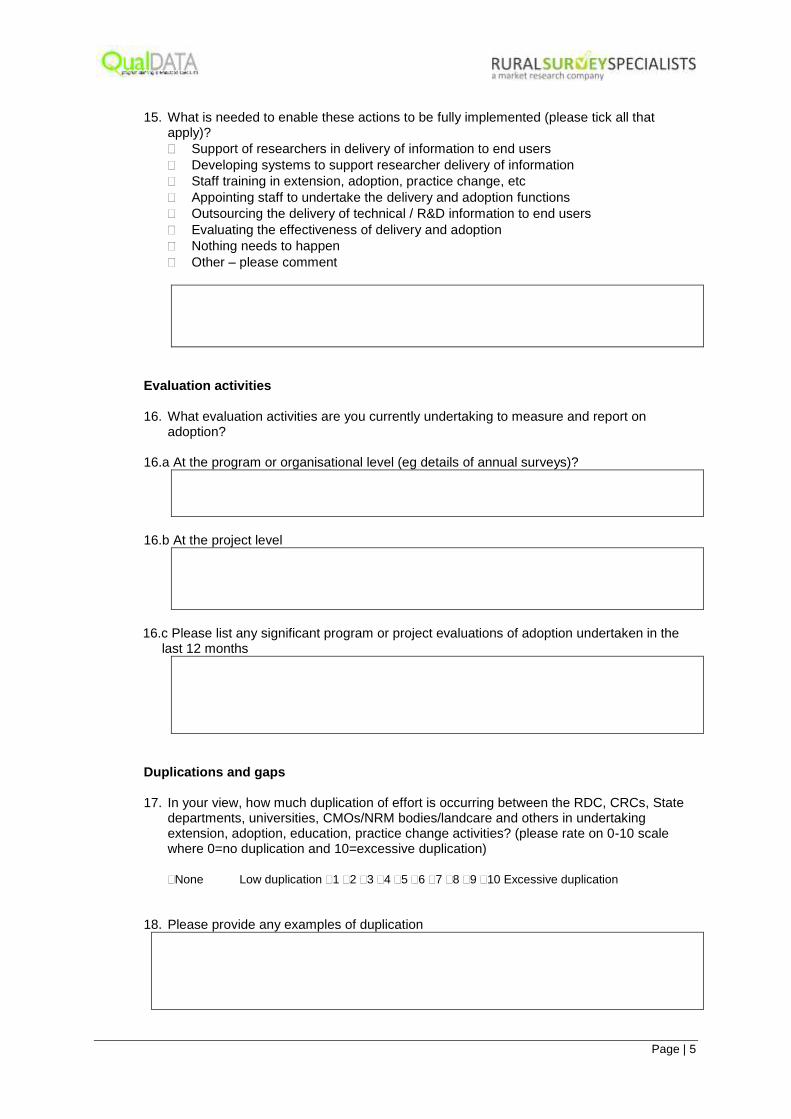
Page | 5
15. What is needed to enable these actions to be fully implemented (please tick all that
apply)?
Support of researchers in delivery of information to end users
Developing systems to support researcher delivery of information
Staff training in extension, adoption, practice change, etc
Appointing staff to undertake the delivery and adoption functions
Outsourcing the delivery of technical / R&D information to end users
Evaluating the effectiveness of delivery and adoption
Nothing needs to happen
Other – please comment
Evaluation activities
16. What evaluation activities are you currently undertaking to measure and report on adoption?
16.a At the program or organisational level (eg details of annual surveys)?
16.b At the project level
16.c Please list any significant program or project evaluations of adoption undertaken in the
last 12 months
Duplications and gaps
17. In your view, how much duplication of effort is occurring between the RDC, CRCs, State
departments, universities, CMOs/NRM bodies/landcare and others in undertaking extension, adoption, education, practice change activities? (please rate on 0-10 scale where 0=no duplication and 10=excessive duplication)
None Low duplication 1 2 3 4 5 6 7 8 9 10 Excessive duplication
18. Please provide any examples of duplication
Page | 6
19. What do you have in place to maximise collaboration and minimise duplication of these
activities?
20. Please make any suggestions as to what more needs to be in place to assist rural RDE organisations and programs to work more collaboratively/minimise duplication with respect to extension, adoption, education, practice change activities.
Final comments
21. Please make any other comment on how the extension, adoption, education, practice change activities could be improved into the future for the RDC/CRC community to benefit end users?
Thanks
Appendix 7:
QualDATA preliminary findings
CRRDC submission to the PC inquiry into the R&D corporations model, June 2010
QualDATA Pty Ltd National RD&E Survey The CRRDC is working with the national market research and monitoring and evaluation company QualDATA Pty Ltd to establish the status of the extension, adoption, practice change and capacity building functions across the RDCs through a national RD&E survey. The CRC Association has also agreed to support the project through their primary industries, NRM and environment focussed CRCs in order to provide stronger data that can inform the outcomes. This work will seek to create a baseline understanding of the extent to which national RD&E organisations are addressing this function as part of their funded programs. It is proposed that this survey will become an annual project to establish and assess change over time. It is anticipated that this benchmarking process will lead to an opportunity to foster change in the activities of RD&E organisations in recognition of the data that is emerging. The following outcomes will be achieved through this process:
• Map the current approach of RDCs towards extension and adoption to find gaps and duplications in the current process:
• Establish the potential for further initiatives to better foster extension, adoption, practice change and capacity building;
• Establish and review extension and adoption plans for the future, both specific and general; and
• Consider the implications of these findings in a strategic manner so that they can be addressed and issues resolved.
Methodology A survey was developed by QualDATA to collect data on the extension, adoption, practice change, education and capacity building components of the RDCs and CRCs. This survey was circulated to RDCs and relevant CRCs in mid-April 2010 and aimed to identify the following:
• How the RDCs link with extension providers, including government, community, business and agribusiness;
• How RD&E organisations ensure R&D is adopted and how they measure practice change/adoption;
• How the RDCs deliver information to end users;
• What initiatives are being undertaken to build human capacity, particularly in relation to PhD students, community skills, formal programs in schools/university and to upskill farm and industry workers; and
• Define communication, extension and adoption processes related to key target audiences.
Results The comprehensive provision of data meant that valuable findings could be drawn from the survey responses. A summary of these is outlined below. Common understanding of processes across the sector
The survey sought to gain an understanding of whether these agencies had a common understanding of the information and R&D outcome delivery process, uptake strategies, technology/innovation adoption and practice change continuum. It recognised that marketing, promotion, public relations, communication, engagement, extension, advice/advisory, adoption, training, education, monitoring, and evaluation are all terms used in the sector – and that there are other terms used in particular sectors. It is apparent that while there is considerable commonality amongst the respondents, there are strongly held views on key terms and key concepts. Some views are at variance with others – some are inclusive of a range of these terms and concepts while others are explicit and exclusive. The understanding of adoption and extension terms, their meaning and application (in managing programs and projects and ensuring adoption and practice change) guides strategic and operational thinking at the researcher, research administration/manager, end user and adviser levels across the public and private sectors. The current variance in perception of these adoption and extension terms and their importance means that it is pertinent to consider whether a common understanding of definitions and their application would prove highly valuable by removing diversity and confusion in relation to these principles. Organisation’s role and responsibility in the Researcher to User continuum There was considerable variation in the RDCs and CRCs view of what their role was in relation to end users. The main views are outlined below in order of decreasing commonality:
• to produce quality research outputs which are accessible to those users who search for the output
• to ensure effective use by beneficiaries and measure the use and benefits of the
application of the outputs.
• To ensure the science community is aware of the research outputs. It is apparent that some see their primary role to influence the science community and assist the career aspirations of the research community while others see their role to meet the needs of end users.
In summary, there were varied interpretations as to the priorities of RDCs and CRCs. These differences should be evaluated in light of the environment that the particular research provider serves. These findings also underline that the national RD&E sector accepts responsibility for undertaking R&D, whereas not all in the sector accept that they have a role or responsibility to ensure or facilitate the uptake or adoption of those R&D outcomes. These findings could conceivably lead to the question – ‘why undertake R&D if it is unclear who accepts the responsibility for their uptake or adoption?’ At the very least the question could be – ‘why undertake R&D if you there is insufficient data to assess to what extent the adoption process occurs?’ Triple Bottom Line The respondents placed varying degrees of significance on the following triple bottom line indicators:
• Productivity – the majority had a high focus on this area
• Economic – a similar majority had a high focus on this area
• Environmental – slightly more than half had a high to medium focus in this area and slightly less than half had a lower focus
• Social – there was a lower focus on social issues than environmental. It is unsurprising that productivity and economic benefits are a major focus of R&D for each of the industry sectors. Linkages to other providers The survey sought to understand the strength and methods of the linkages with a range of other providers in the extension/advisory/training/adoption process as outlined below:
• Government extension agencies – of the 21 respondents 5 noted a decline in their engagement with government extension agencies whilst others reported strong collaboration.
• NRM Bodies (CMOs, CMAs, Landcare) – varied links are apparent with this sector depending on the particular rural needs and nature of the industry
• Agribusiness, including Consultants/Product resellers/Product suppliers – some RDCs particularly in the more intensive industries report strong engagement with this sector, whereas others have relatively little to do with this sector but understand the need to improve.
Some respondents such as pork have had high success rates when dealing directly with the growers. Others have had immense difficulty and are having to become better at collaborating and dealing with next users such as consultants. This is driven by the reduction in the governments extension capability. Building human capacity Details were sought on the outcomes of programs and projects being undertaken in terms of building human capacity in key areas of:
• Fostering Post-graduate and undergraduate research/studies – a range of programs are undertaken including post-graduate awards, PhD programs, internships, undergraduate training/research awards to foster personnel for their industries.
• Schools based activities at Yrs 8-12 – activities including preparation of general and specific sector based materials, eg Pig in Secondary School and Cows Create Careers; collaborative programs like the Get into Genes program; the multi-RDC and CRC Primary Industries Centre For Science Education (PICSE) program; the Primary Industries Education Foundation (PIEF); the Investing in Youth Program Undergraduate Studentships and ‘minor activities like work experience for individual students or hosting groups of students to visit research sites’.
• Schools based activities in the under Yr 8 school settings – some of the above activities are undertaken in this age group
• University focussed activities – include university scholarships, vacation scholarships and placements and professional development
• Vocational Education Training activities – Some offer certificate programs whereas others invest in specific structured professional development programs
• Informal skilling and ‘in the industry’– this learning process involves an array of approaches including workshops, conferences, travel bursaries, field days, demonstrations, discussion groups, internships and school projects..
• Supporting local community/industry groups – many RDCs and CRCs support State farming organisations, industry conferences and specific industry development programs in defined areas/industries. This is done as a method of engaging with the end users of the original research
• Other / overall comments – some RDCs have dedicated People Development Programs that create strategic industry settings and a number fund varied leadership development projects including the Rural Leadership Program.
It is clear that programs are essential to build human capacity for individual industries. These programs can come in the form of conferences, symposia, workshops, field days, etc. However there appears to be limited engagement in overarching strategic programs such as the National Conference on Sustaining Rural Communities; engagement with state farming organisations, the PICSE and PIEF programs (which some see as duplication whereas others see as complementary); the Rural Leadership Program and linkages with Agrifood Skills Council, universities and VET programs. Recognising that a number of respondents noted that their capacity building programs are ‘under review’ or ‘being developed/redeveloped’ it would seem that the cooperative venture for capacity building should perhaps be revisited as it provided for all RDCs and built human capacity considerably Previously it has been reported that there is varied evaluation of the effectiveness of programs and potentially an underinvestment in social elements of the triple bottom line. Based on this, greater collaboration in capacity building could assist cross-fertilisation of ideas; potential roll-out of successful programs across other sectors and greater strategic investment in rural industry wide programs. This argument is most pronounced in relation to longer term programs which have the potential to create a supply of younger talent. Best estimates of the proportion of 2010 total organisational budgets allocated towards the key elements of the informing, extending, advising, education and evaluation functions were:
• Marketing, Promotion and Public Relations – the majority of respondents noted their investments was less than 5% with 3 from 10-20% and one at over 50%
• Communication and Engagement – the majority of respondents noted their investment was less than 10% with only 2 over 10%
• Extension, advisory and adoption – varied from the majority investing less than 10%, 4 between 10-20% and 2 over 30%
• Education and Training – varied from the majority investing less than 10%, 2 between 10-20% and 2 between 20-30%
• Monitoring and Evaluation – the majority of respondents noted their investment was less than 5% with 4 from 5-10% and one over 10%.
In terms of comments about these investments, it was noted that in some cases accurate figures are bundled into wider program and project costings. This issue will be considered in more detail in the full report. Details of extension/adoption activities A range of specific major extension, adoption, education and practice change projects or initiatives that are being undertaken or funded were reported by respondents. The key elements of these included the approaches used, target audiences, the co-funding or collaborative mechanisms used and the specific outcomes expected.
These projects provide specific insights as case studies when considering the merits of greater collaboration plus facilitating greater learning from the experiences of other RDCs and CRCs. The projects provide real examples to allow the recognition / consideration / understanding of the potential value of effective capacity building processes. Respondents also reported on the extent to which they seek support systems for researchers in delivery of information to users; staff training in extension, adoption, practice change; appointing dedicated delivery or adoption focussed personnel including the ability to outsource the delivery processes and in evaluating the effectiveness of the delivery and adoption processes. It is apparent that all these are needed to some extent. The results will also be considered in the full report. Evaluation activities Similarly details of program and project level evaluation activities, regarding adoption of R&D outcomes, were reported by respondents. Findings included:
• Stakeholder surveys are undertaken at varied frequencies and at varied levels of detail across the national R&D sector – from nil, to occasional (every 5-yrears) to annual
• Varied Benefit:Cost and Impact Evaluation processes and frequencies are used – at organisational, industry, program and project levels
• In a small number of cases respondents reported exit surveys completed from each field base extension, adoption, communication, etc activity
• A number reported engagement with the CRRDC reporting processes. These results demonstrate a patchy approach to monitoring, evaluation and reporting with little consistency across the sector. Duplication and gaps Respondents were asked to consider duplication of effort between the RDCs, CRCs, State departments, universities, CMOs/NRM bodies/landcare and others in undertaking extension, adoption, education, practice change activities and gaps in those activities. Out of the respondents, 10 reported low duplication and 5 reported medium duplication. Some of the issues considered were – overlap of publications and workshops/seminars, etc directed to the same groups of end users and next users; too many surveys seeking similar data from the same groups for varied purposes; poor communication amongst and between industries – much of this resulting in information overload/reinforcement of perceptions that national RD&E agencies are silos. A number of processes for minimising duplication were reported. There would be value in these being shared amongst the national RD&E community. Other issues Respondents were given an opportunity to canvass remaining key issues of importance. A number reported the need to canvass strong across RDC and CRC collaborative mechanisms. While several focussed simply on capacity building others saw a wider perspective suggesting collaborative Centres of Excellence to deal with bigger picture issues of which extension, adoption, etc was a key theme. It is therefore apparent that a number of respondents see collaborative programs, processes and decision making as being important – both from a management perspective as well as to ensure that next users and end users are able to source information and obtain the greatest benefit from their use and application of R&D outcomes.
Summary It is apparent that the role of the government agencies as partners is clearly of great concern to the sector at large with significant inconsistencies across state agencies. It is clear that there are varied levels of focus, interest and ability in the extension, adoption and capacity building discipline. Some issues are clearly sector dependent while much of it is of whole of national R&D sector concern. An area that has been identified as needing significant attention relates to the need for stronger delivery mechanisms, reduction of duplication, and a focus on next users including a role for the agribusiness sector as a conduit for delivery to end users. Rigour in the monitoring, evaluation and reporting discipline appears generally lacking. It appears apparent that more support of researchers and other workers in communicating their R&D outcomes is needed. While it is apparent that there is no ‘one size fits all’ approach , there are lessons that can be learned from all entities in the national RD&E sector that can be applied by counterparts. There appear to be commonalities in the intensive industries and in the extensive industries. There are clear opportunities identified for more collaborative ventures to address duplication and different levels of skills. The overall capacity building ‘space’ especially the supply chain of young people warrants attention as it is such as long term structural issue. 4. Next Steps Once the final results of the survey are available a review process will be undertaken including:
• A review of the report by the CRRDC and CRC Association
• A one-day workshop