Embed Size (px)
Citation preview

Sublingual Nitroglycerin Delivery for Treatment and
Prevention of Angina Pectoris
BEE 4530: Computer-Aided Engineering: Applications to Biomedical Processes
Allison Jagoe
Eric Jurgens
Marissa Kewley
Daniel Younger

1
Table of Contents
1. Executive Summary ...................................................................................................................................................... 3 2. Introduction ..................................................................................................................................................................... 4
2.1 Background .................................................................................................................................................................... 4
2.2 Research Review .......................................................................................................................................................... 4
3. Design Objectives ........................................................................................................................................................... 6
4. Schematic .......................................................................................................................................................................... 6
4.1 Original Schematic ...................................................................................................................................................... 6
4.2 Simplified Schematic .................................................................................................................................................. 7
5. Methods ............................................................................................................................................................................. 8
6. Mesh convergence and final mesh ........................................................................................................................ 11
7. Results .............................................................................................................................................................................. 13
8. Validation/Accuracy Check ..................................................................................................................................... 16
9. Sensitivity Analysis ..................................................................................................................................................... 17
9.1 Diffusivity of Nitroglycerin into the Sublingual Mucosa ........................................................................... 18
9.2 Diffusivity of Nitroglycerin into the Saliva ...................................................................................................... 18
9.3 Magnitude of salivary flow velocity ................................................................................................................... 19
9.4 Frequency of salivary flow directional change ............................................................................................. 19
9.5 Summary ....................................................................................................................................................................... 20
10. Design Modification – Nitroglycerin Strip Model ........................................................................................... 21
10.1 Model Schematic ..................................................................................................................................................... 21
10.2 Methods ...................................................................................................................................................................... 21
10.3 Boundary Conditions and Numerical Inputs ............................................................................................... 21
10.4 Results ......................................................................................................................................................................... 22
11. Conclusions..................................................................................................................................................................... 26
11.1 Manufacturability and Economic Constraint .............................................................................................. 27
11.2 Health Safety Constraint ...................................................................................................................................... 27
Appendix A: Mathematical statement of the problem ........................................................................................... 28
Governing Equations ....................................................................................................................................................... 28

2
Boundary Conditions and Initial Values .................................................................................................................. 28
Input Parameters .............................................................................................................................................................. 29
Appendix B: Solution strategy .......................................................................................................................................... 29
Mesh ....................................................................................................................................................................................... 29
Appendix C: Additional visuals ........................................................................................................................................ 31
Average Flux into Bloodstream vs. Time Graphs – Sensitivity Analysis .................................................... 31
References ................................................................................................................................................................................ 35

3
1. Executive Summary
This project is the first-ever attempt at modeling sublingual drug absorption. COMSOL
Multiphysics was used as a software platform for creating a computer model of a nitroglycerin
tablet placed beneath the tongue. The goal was to realistically simulate the transfer of
nitroglycerin from a sublingual tablet to the bloodstream over time. Data reported in scientific
literature was used as the quantitative basis for modeling nitroglycerin diffusion into the saliva
and sublingual mucosa. The model includes passive diffusion into the tongue and bottom of the
mouth, salivary flow created by sublingual salivary glands, and gradual shrinking of the tablet
due to breakdown in saliva. This model was used to evaluate whether or not a sublingual
nitroglycerin strip would be a more efficient vehicle of drug delivery.
COMSOL was used to create a model of nitroglycerin drug delivery via a sublingual
tablet. Concentration profiles were then produced for various time points and the flux of drug
entering the bloodstream over time was determined. These profiles were used to calculate the
concentration of nitroglycerin in the blood at any given time. In the literature, the values of
nitroglycerin diffusivity in the saliva and oral tissues were given as ranges of values. To ensure
that the model was representative of the entire range of diffusivity values, a sensitivity analysis
was performed. Flow rates for saliva were also altered using sensitivity analysis to account for
variation between individuals. Upon completion of the nitroglycerin tablet model, COMSOL was
used to alter the tablet’s geometry into that of a sublingual strip, thereby creating a different
nitroglycerin delivery model. The concentration profiles and quantitative values generated using
each model were compared to evaluate the theoretical relative efficacy of each vehicle of
nitroglycerin delivery.
A calculated blood concentration of 79.94 pg/mL at two minutes helped validate the
accuracy of the tablet model by proving the computed concentration falls within a range of
literature values at that given time. The tablet is shown to dissolve completely in 28.5 seconds
which also corresponds with the literature value. As part of a sensitivity analysis, the diffusivity
of nitroglycerin into the sublingual mucosa was altered by an order of magnitude. The results
showed that plasma concentration was greater for a higher diffusivity when compared to a lower
one. Changing the diffusivity of saliva as well as varying the saliva flow all increased the overall
blood concentration after one minute of administering the tablet. The end results were
significantly influenced by parameter fluctuation suggesting the importance of using accurate
values. The strip model gave a plasma concentration five orders of magnitude greater than the
tablet after two minutes. A significant improvement in efficiency is seen the strip model.
These COMSOL models serve as a proof-of-concept design study demonstrating that
nitroglycerin delivery via a thin sublingual strip with the same amount of nitroglycerin as the
tablet is more efficient than the tablet. A higher concentration of nitroglycerin diffused into the
blood plasma in one minute with the strip model compared to the tablet model. These findings
are a valuable first step in discovering a new method of sublingual nitroglycerin delivery to treat
and prevent angina pectoris.

4
2. Introduction
2.1 Background
Over seven million people in the United States suffer from a condition known as angina
pectoris (Lab Test Online 2012). Angina is chest pain or discomfort that is caused by temporary
insufficient blood flow to the heart (Graboys and Lown 2003). It is often described as a
“constricting” or “suffocating” feeling that lasts anywhere between one and fifteen minutes
(What is Angina? 2011). Pain can also be felt in the left shoulder, arm, neck, jaw, or back
(Graboys and Lown 2003). Although angina does not indicate a heart attack, it is generally a
symptom of coronary heart disease (CAD), the most common heart disease in American adults
(What is Angina? 2011). A patient with CAD suffers from atherosclerosis, a narrowing of blood
vessels, which prevents sufficient oxygen rich blood from reaching the heart (Lab Test Online
2012). Angina pectoris is triggered by varying stimuli from person to person and can change
over time as the condition worsens. Some examples include, but are not limited to, physical or
emotional stress, extreme temperatures, or exercise (Lab Test Online 2012). Treatments for
angina vary, but commonly involve the use of nitroglycerin (What is Angina? 2011).
Nitroglycerin is a vasodialator that causes blood vessels to widen thereby allowing adequate
amounts of oxygen to reach the heart (Graboys and Lown 2003). Commonly, nitroglycerin is
administered in the form of a tablet to be taken orally. This allows the drug to take affect quicker
than it would if in the form of a patch, cream, or even an injection.
2.2 Research Review
Nitroglycerin has been used to treat angina pectoris since 1879. It was approved by the
FDA in 1938. However, it was not until recently that its mechanism as a vasodialator was
understood (Ogbru 2009). Nitroglycerin, a member of the group of drugs called nitrates, is
known to widen arteries and veins thereby decreasing the preload on the heart muscle. When
nitroglycerin is used the heart is required to do less work by since oxygenated blood can reach
the heart more easily, and thus angina chest pain is lessened (Ogbru 2009). Nitroglycerin’s
vasodialative properties were demonstrated in a study by Brown et. al who showed that the cross
sectional area of various sized vessels increased an average of 18% when patients were treated
with sublingual nitroglycerin (Brown, et al. 1981). It was thought in the late 1970s that this was
due to the generation of nitric oxide in smooth muscle (Ignarro 2002). Later studies further
revealed that nitroglycerin causes a chemical reaction to occur between the nitro compound and a
thiol, a sulfhydryl containing compound, to generate an intermediate known as S-nitrosothiol
(Ignarro 2002). This intermediate decomposes and releases nitric oxide (NO), a free radical that
acts as a signaling molecule and a powerful vasodilator. (Ignarro 2002)
Currently, the oral route is the favored method for drug delivery, as it is inexpensive,
convenient, and adaptable. In addition, it possesses some significant advantages over other
methods of drug delivery such as transdermal drug diffusion or injection. In oral drug delivery,
transport of drug begins with diffusion of drug through the oral mucosa. Drugs are rapidly
absorbed into the reticulated vein and are transported through the facial veins, the internal
jugular vein, and then the brachiocephalic vein, and are finally drained into the general
circulation. (Li and Robinson 2005) Drugs entering the vascular system through the jugular vein
bypass hepatic first-pass metabolism (enzyme-mediated degradation) allowing less of the drug to

5
be administered. This rapid systemic delivery improves bioavailability of the drug, and decreases
immunogenic responses. (Li et al) The noninvasive nature of oral administration is preferred by
patients. Higher permeability of the buccal mucosa compared to other transepithelial routes
makes this a quicker route of delivery. (Jasti, Venugopal and Xiaoling 2005) Onset of action of
sublingual tablets occurs within 1-3 minutes; while ingestible gel filled tablets require over 10
minutes to take effect. (Bauer and Seifert 2005)
More specifically, sublingual drug delivery is the preferred route of oral delivery for
drugs that benefit from a quick onset of pharmacological relief. Narang et al. 2010 reported that
sublingual drug absorption is three to ten times greater than oral drug absorption. The superior
absorption capabilities of the sublingual route can be attributed to a number of specific qualities
of the sublingual epithelium. The sublingual mucosa is considerably more permeable than any of
the other three oral mucosas (buccal, gingival, and palatal) (Goswami, Jasti and Li 2008) since it
is stratified non-keratinized squamous epithelium. While much of this greater permeability can
be explained by the non-keratinization of the sublingual epithelium, another main feature which
contributes to rapid sublingual absorption is the thickness of the sublingual mucosa.
While the buccal, gingival and palatal mucosas have thicknesses of 200, 250, and 500-
600 µm, respectively, the sublingual mucosa is only about 100-200 µm thick (Narang and Jyoti
2011). The sublingual epithelium is reported to be 8-12 cell layers thick (Goswami, Jasti and Li
2008) whereas the epithelium of the buccal mucosa allegedly consists of 40-50 cell layers
(Shojaei 1998). The relative thinness of the sublingual mucosa and epithelium further justifies
the higher rate of drug absorption via the sublingual route.
In addition to higher permeability and smaller dimensions, the sublingual method of drug
delivery is favorable because of the high vascularization of this area (Narang and Jyoti 2011). De
Boer et al. 1984 maintains that the rich blood and lymphatic vessels are very important to the
drug absorption propensity of the sublingual region. Sublingually, the drug is able to pass
directly into the systemic circulation. Furthermore, no additional water or chewing is necessary
to dissolve or process drugs administered sublingually. Salivary glands are located underneath
the tongue which produce mucin and help promote the production of saliva according to Narang
et al. 2010. The sublingual area is constantly washed by significant amounts of saliva which
quickly dissolves drug tablets that are placed underneath the tongue.
Sublingual drug absorption can be affected by three different factors according to Narang
et al. First, since drug absorption through the sublingual mucosa is primarily through passive
permeation, the drug must be slightly more lipophilic than would be required by gastrointestinal
absorption. Second, the drug must be soluble in saliva and at the pH of saliva. Third, the drug
must not exhibit a tendency to bind to oral mucosa and must have an oil-water partition
coefficient in the range of 40-2000. Finally, as long as the drug is created with optimization of
these parameters in mind, the sublingual delivery route can be extremely convenient, accessible
and effective.
Since sublingual drug delivery seems to be a commonly preferred method of delivery, the
question of using the sublingual route of administration to deliver nitroglycerin is certainly
merited. In fact, Riseman et al. (Riseman, Altman and Koretsky 1958) published a study, which

6
specifically compared the efficacy of nitroglycerin administered sublingually, subcutaneously,
and orally. The frequency of response, as defined by the number of patients whose exercise
tolerance was increased before angina was induced, was one hundred percent. The superiority of
sublingual delivery of nitroglycerin is unmistakable.
While sublingual nitroglycerin tablets are used by numerous angina victims worldwide, the
convection and diffusion of the tablet underneath the tongue is poorly understood. COMSOL is
therefore useful in modeling this drug transfer process in order to better comprehend
nitroglycerin sublingual delivery and how it varies from person to person in accordance with
individual salivary flow rates and oral diffusivities. COMSOL was also used to model
nitroglycerin delivery via a sublingual strip and to conclude that this method of delivery might
prove superior to tablet delivery in the future.
3. Design Objectives
The five main objectives of this modeling project are as follows:
1. Create realistic and accurate models of sublingual nitroglycerin delivery via tablet and
strip
2. Determine the flux of nitroglycerin into the bloodstream over time
3. Determine the nitroglycerin plasma concentration over time
4. Perform sensitivity analysis to evaluate how saliva and mucosa diffusivities and saliva
flow affect sublingual nitroglycerin delivery
5. Compare drug absorption via sublingual tablet and strip and assess relative efficiency of
each vehicle
4. Schematic
4.1 Original Schematic
Figure 1 below is an image that conveys what is actually happening during sublingual
nitroglycerin delivery via a tablet. The patient places the nitroglycerin tablet underneath the
tongue and then gently lowers their tongue and keeps it in place allowing saliva to cover and
flow over the tablet. The tablet then breaks down in the saliva releasing the drug which
eventually makes its way into the sublingual mucosa on the bottom of the tongue and the bottom
of the mouth and into the bloodstream.

7
Figure 1: Sublingual Nitroglycerin Tablets. Image of drug tablet being placed underneath the
tongue to enable sublingual nitroglycerin delivery. (Nandini 2011)
4.2 Simplified Schematic
For the purpose of computer modeling, the system depicted in Figure 1 above needed to
be simplified before constructing the model in COMSOL. The tablet was modeled as a very thin
cylindrical pill with a diameter of 4 mm and a height of 2 mm. The tablet is surrounded by
saliva. At the top is the bottom of the tongue and at the bottom is the bottom of the mouth; both
contain blood vessels located at a depth of 200µm. Since the boundary conditions change after
the tablet has dissolved, there are two schematics provided in the Figure 2 below.
200 μm
200 μm
tongue
bottom of mouth
tablet
saliva
Y
X
4 mm
12 mm
2 mm
Uinit
=.0133
v D
c
xc*
c=0
c=0 c=5.259e-8 mol/mm3
a)

8
Figure 2: Simplified sublingual tablet schematic. Schematic with dimensions that were input
into COMSOL in order to model sublingual nitroglycerin delivery via tablet. a) Schematic with
boundary conditions for t=0 to t=28.6 seconds (dissolve time). b) Schematic with boundary
conditions for t=28.6 to t=500 seconds.
The two schematics, Figure 2a and 2b, must be run as separate models in COMSOL. The
schematic in Figure 2a is run until the tablet is dissolved, then the boundary conditions are
altered and the model corresponding to Figure 2b is run until completion. The initial conditions
for part b of the model are inputted as the end results from part a.
5. Methods
Sublingual nitroglycerin delivery in COMSOL was modeled as a two dimensional mass
transfer process. Although the drug is realistically transferred out of the tablet in all three
dimensions, the model is simplified as two dimensions since the drug concentration gradient in
the ‘z’ direction is constant and thus does not need to be considered with regard to this model.
Below is the governing equation for 2D transient mass transfer with drug diffusion in both
the x and y dimension and convection due to saliva flow in the x direction. The equation is:
(
)
where ca is the concentration of the drug, ux is the convective velocity in the x direction, and Da
is the diffusivity of nitroglycerin through saliva or the sublingual mucosa.
200 μm
200 μm
tongue
bottom of mouth
dissolved tablet
saliva
Y
X
12 mm
Uinit
=.013
3
c=0
c=0
flux=0
b)

9
In order to determine the exact velocity of the saliva flow at each point along the x
dimension, the Navier-Stokes equation for fluid flow was implemented. It is necessary to use the
Navier Stokes equation to ensure that the velocity of the saliva is calculated at each individual
position in the sublingual cavity and that the velocity is not assumed to be constant. This
governing equation for fluid flow is shown below:
(
) (
)
where ρ is the density of saliva, ux is the velocity of the saliva, g is the force of gravity, µ is the
viscosity of saliva, and
is the change in pressure in the x direction.
This equation is only applicable to the middle region which contains saliva. This is
specified in COMSOL by setting the initial and inlet velocity in both the tongue and the bottom
of the mouth as equal to zero. In the saliva region, however, while the initial velocity is set to
zero, the inlet velocity was set to 0.0133 mm/sec, which is the flow rate of saliva underneath the
tongue due to the sublingual salivary glands as reported in the literature (Dawes 1993). At the
saliva/bottom of the tongue boundary, saliva/tablet boundary and saliva/bottom of the mouth
boundary, a “no slip” condition was specified so that the velocity of saliva flow at each of these
interfaces is set to zero.
Next, in order to account for the fact that the tablet gradually dissolves with time when
placed beneath the tongue, a “moving mesh (ALE)” was added to the model. It was assumed that
the tablet only shrinks in the y direction and that it shrinks by dissolving from the surface inward
while the concentration at the outermost surface of the tablet remains constant. The velocity with
which the top and bottom boundaries of the tablet are moving/shrinking is defined as follows:
where v is the shrinking velocity,where
is the flux of the drug at the tablet/saliva interface,
and c* is the concentration of nitroglycerin at the tablet surface.
Thus, the velocity at which the tablet shrinks is proportional to the surface flux of mass
lost from the tablet. The top and bottom of the tablet move with a velocity of equal magnitude
but opposite sign so that the boundaries eventually meet. To determine the average surface flux,
the model was solved and a plot of total flux at the top boundary of the tablet (coordinates: (4-8,
2.45) was generated. This plot is shown in Figure 3.

10
Figure 3: Total mass flux from top boundary of tablet over time. Graph of total flux (mol/m2/s)
out of the top boundary of the tablet; each curve represents a different time point. The top most
blue line represents t=0 seconds.
This plot shows that the total flux out of the top boundary of the tablet varied from about
0.1 x 10⁻⁹ to 0.83 x 10⁻⁹ mol/mm2sec over the time that the model ran. Therefore, the value 0.5 x
10-9 mol/mm2sec was selected as the approximate flux out of tablet to be used to determine
shrinking velocity. The velocity of the top and bottom surfaces of the tablet were thus defined as
follows:
[
]
[
]
The top boundary moves in the –y direction and is therefore defined as negative while the bottom
boundary moves in the +y direction and so it defined as positive.
This provided a starting point for determining the shrinking velocity. However, to make
the model more accurate, the flux over the top tablet boundary as a function of time needed to be
determined. To do this, the previously described model was solved. Then, the average total flux
over the top tablet boundary was calculated every thirty seconds. These values were entered as a
function of time called “tabflux” and the intermediate times were interpolated. As a result, the
velocities of the top and bottom surfaces were defined as the following equations.
[
]

11
[
]
When the boundaries meet, the tablet is considered to be entirely dissolved and so the
tablet boundaries stop moving and the flux along the boundaries is set to zero. These new
boundary settings are implemented into a second COMSOL model and the final conditions of the
previous model are set as the new initial conditions.
A final addition to the model was the concept of “saliva sloshing.” In reality, saliva does not
flow in one direction in the sublingual cavity. In order to simulate the more random flow of
saliva underneath the tongue, the velocity was modeled as a time-dependent oscillating function.
At the first time point saliva is set to flow from left to right with an inlet velocity equal 0.0133
mm/sec as stated above. At the next time point, the velocity switches directions and flows from
right to left and follows this cyclical pattern for the entirety of the model. The leftmost saliva
boundary was set as an inlet with a velocity pattern that followed the cyclic pattern described
above. This was implemented in COMSOL by referencing a .txt file with the inlet velocity
values at each time point. Each alternating second inversed the velocity magnitude to model the
sloshing motion and times in between were interpolated.
6. Mesh convergence and final mesh
A mesh convergence analysis was performed to determine what size mesh was necessary.
The parameter tracked was the total concentration of drug in the tongue at 105 seconds (the
approximate time that the tablet has completely dissolved). This was calculated for each different
mesh by integrating the concentration gradient in subdomain 3 (the tongue). Once a certain
number of mesh elements is reached, this value should no longer change, regardless of the
number of additional mesh elements. The solution should not be dependent on the mesh chosen.
The plot in Figure 4 was used to identify a sufficient mesh.

12
Figure 4: Mesh Convergence Analysis (at 105 seconds). The total concentration of nitroglycerin
in the tongue at a given time plotted versus various numbers of mesh elements. The value
converges at about 15,000 elements as marked by the red circle. After that point, the solution is
no longer dependent on the mesh size used.
The plot begins to stabilize once the mesh reached about 10,000 mesh elements. It seems
that at all meshes finer than this value the total concentration of drug in the tongue is about
2.493e-07 mol/mm2 at 105 seconds. Since the mesh does not affect the solution above 15,000
mesh elements, it was decided that the mesh circled in red with 15,624 mesh elements (that is, a
mesh with 0.1 as the maximum element size in the domains and 0.04 as the maximum element
size in at the boundaries) would be used for all future calculations, to save computing time.
The final mesh chosen is a free parameter mesh with the maximum element size equal to
0.1 and a maximum element size at the boundaries of 0.04. The boundaries that have a finer
mesh are the boundary from saliva to tongue, the boundary from saliva to the bottom of the
mouth, and all four tablet boundaries. Since there is a higher drug concentration gradient at the
tablet boundaries, these regions should have a finer mesh to reduce the error. Similarly, the
boundaries between saliva and sublingual mucosa (the tongue and bottom of the mouth) were
meshed to have a smaller element size. This was done because the profile changes as the drug
diffuses from the saliva into tissue with a different diffusivity value and a more detailed profile
could be beneficial in those regions. For these reasons, the six boundaries listed above have a
maximum element size of .04. The final mesh is shown below in Figure 5.
2.490
2.495
2.500
2.505
2.510
2.515
2.520
2.525
2.530
2.535
0 10000 20000 30000 40000 50000
To
tal
con
cen
tra
tio
n o
f d
rug
in
th
e t
on
gu
e
(*1
0^
-7 m
ol/
mm
2)
Number of Mesh Elements

13
Figure 5: Final Mesh. Max element size in all three subregions is equal to 0.1. Max element size
on boundaries is equal to 0.04.
It should be noted in Figure 5 that elements around the boundaries with the greatest
concentration gradient are much smaller than the elements far from these boundaries in order to
reduce error.
7. Results
After running the model, an animation was generated to give a visual display of the drug
delivery process over a five minute time period. The surface plots in Figure 6 below show
snapshots at different time points throughout the process of drug delivery from the tablet. Drug is
shown diffusing from the tablet into the saliva and subsequently into the tongue and the bottom
of the mouth, and then into the bloodstream.
Figure 6: Surface plots of sublingual nitroglycerin tablet. The nitroglycerin concentration
gradients at various time points are displayed in units of mol/mm2. Clockwise from the top left:
Times displayed are at 5 seconds, 28 seconds, 35 seconds, and 180 seconds.
The tablet dissolves for the first 28.5 seconds. The time point just before the tablet is
completely dissolved can be seen in the top right image in Figure 6 above. In this image the
highest concentration of nitroglycerin is at the very center where the last sliver of the tablet
remains and the concentration of drug gradually decreases further away from the center. After
Min: 0 Max: 5.259E-8

14
the tablet is completely dissolved, at 28.5 seconds, the flux of drug at the tablet boundaries is set
to zero so no additional drug is released into the saliva. Once the tablet has disappeared,
nitroglycerin in the saliva continues to diffuse towards the tongue and bottom of the mouth
through the sublingual mucosa and into the blood stream, as shown in the bottom left image in
Figure 6. At 180 seconds, the concentration of nitroglycerin in the entire visible system is
significantly lower since most of the drug has entered into the bloodstream.
Next, a graph of the average flux of nitroglycerin entering into the bloodstream as a
function of time was created. COMSOL was used to generate total flux values at 1000 different
location points on the tongue/bloodstream boundary and the bottom of the mouth/bloodstream
boundary at various time points. At each time point the total flux values were averaged to
determine the average flux into the bloodstream at that time point. A graph of average flux of
nitroglycerin into the bloodstream versus time is show in Figure 7 below.
Figure 7: Average flux of nitroglycerin into the bloodstream over time.
Figure 7 above can be used to visualize the trend of nitroglycerin flux into the
bloodstream during the total duration that the model was run (300 seconds). The flux increases as
the drug diffuses through the saliva, mucosal membrane, and into the blood. A dip in the graph
can be seen between about 45 and 65 seconds, which is most likely due to the increased distance
the drug must diffuse as the tablet shrinks. Since the tablet is shrinking faster than the drug is
diffusing, the boundaries that the drug must cross to enter into the sublingual mucosa and finally
reach the blood stream are becoming increasingly far away. Once the tablet is completely
dissolved, the flux again increases. Figure 7 shows that at five minutes, the flux has begun to
level out, and will presumably decrease to zero as all the nitroglycerin has diffused into the blood
or out of the saliva.
In order to determine the nitroglycerin blood plasma concentration (BPC) at any given
time point, the graph of average flux into the bloodstream as a function of time (Figure 7 above)
was integrated using the Reimann sums estimation technique. At each ten second interval the
0
1E-13
2E-13
3E-13
4E-13
5E-13
6E-13
0 50 100 150 200 250 300
Flu
x (
mo
l/m
m^
2/s
)
Time (s)

15
average flux over the very top boundary (into the bloodstream) was used to determine the total
amount of drug that had entered into the bloodstream by that time point in the following way:
(
) (
) (
) (
)
(8)
The total area through which the drug is entering the bloodstream has been estimated as
two surfaces, the bottom of the tongue and the bottom of the mouth, each which has dimensions
of 12 x 4 mm (total area = 48 mm2). The values necessary to implement the above equation can
be found in Table 1 below.
Table 1: Values used to calculate total blood plasma concentration
Property Value
Total area through which drug is entering the bloodstream 96 mm2
Molar mass of nitroglycerin 227 g/mol (Wikipedia 2012)
Blood plasma volume 5000 mL (Taggart, Starr and Starr
1989)
Like any drug, nitroglycerin is gradually degraded in the bloodstream. The half-life of
nitroglycerin in the bloodstream is reported in the literature to be about 3 minutes (180 seconds)
(RxMed n.d.).The decaying rate constant of nitroglycerin in the bloodstream was found as
follows:
(
)
The following equations were then used to determine how much of the drug was lost due
to degradation in the bloodstream, at each ten second time point.
where
is equal to the flux of drug into the bloodstream, A is the area over which the drug
diffuses, V is the volume of the blood plasma, λ is the decaying rate constant and c is the
concentration of drug the bloodstream.
The calculated value of
was subtracted from the blood plasma concentration at each
time point to calculate the blood plasma nitroglycerin concentration which incorporates
degradation of the drug in the bloodstream. Figure 8 shows the blood plasma concentration as a
function of time with and without degradation of nitroglycerin according to the nitroglycerin
tablet model generated in COMSOL.

16
Figure 8: Concentration of Nitroglycerin in blood plasma as a function of time. Graph shows
blood plasma concentration both with and without drug degradation in the bloodstream.
Figure 8 shows that the blood plasma nitroglycerin concentration increases steadily over time
from 0 to 300 seconds. The blood plasma concentration is in the effective range of 20-400 pg/mL
(Bauer and Seifert 2005) for angina treatment between about 70 and 300 seconds, which is
consistent with what has been reported in the literature (Bauer and Seifert 2005).
8. Validation/Accuracy Check
In order to validate the model, the total concentration in the blood stream at a given time was
compared to values found in the literature. The required blood plasma concentration for
nitroglycerin to take effect, as a treatment for angina, is between 20 pg/ml and 400 pg/ml. The
literature review revealed that this would occur on average between two and three minutes,
although this time varies from patient to patient. The total blood plasma concentration at the two
minute time point was therefore analyzed. To do this, the total flux over the very top boundary of
the model was computed, which represents the total flux into the bloodstream. Since COMSOL
only gives the total flux at each position at a certain time point, the flux over the entire boundary
was determined as the sum of the total flux at each location on the boundary at a certain time
point. A graph of total flux into the bloodstream was plotted as a function of time. This graph
was then integrated using the Riemann sums technique to calculate the total flux of nitroglycerin
into the bloodstream at 120 seconds (2 minutes). The area under the flux curve was calculated to
With Drug
Degradation
Without Drug
Degradation
0
50
100
150
200
250
300
350
400
450
500
0 50 100 150 200 250 300
To
tal
Co
nce
ntr
ati
on
(p
g/m
L)
Time (s)

17
be 2.0984E-11
. This value was then multiplied by the area by which the drug is passing
over. The area is 12 mm long by 4 mm in the z direction. (Note that here it was assumed that
there is no change in flux in the z direction.) This number was multiplied by two because equal
amounts of drug are assumed to enter into the bloodstream via the bottom of the tongue and the
bottom of the mouth. The total amount of drug then needs to be converted into grams by
multiplying by the molar mass. Assuming an average of 5L of blood in every patient, the
concentration in grams per mL can be computed. Finally, the degradation of the nitroglycerin in
the blood was taken into account by using the method described in the Results section above. A
decay constant of 0.0385 sec-1
was used to calculate the actual effective concentration at each
time point. The validation calculation is seen explicitly below.
(
)
According to the nitroglycerin sublingual tablet model, the blood plasma concentration does
reach an effective concentration within the value reported in the literature, 1-3 minutes (Bauer et
al). The minimum effective concentration of nitroglycerin, 20 pg/mL, is reached in less than
forty seconds.
Literature values for in vitro oral tablet dissolving time are cited to be between 5 and 30
seconds (Klancke 2003). The dissolving time for the tablet in the model above is 28.5 seconds,
which is in agreement with the literature values. Based on these two points of validation, it can
be concluded that nitroglycerin drug delivery via a sublingual tablet has been accurately
modeled.
9. Sensitivity Analysis
There are four main parameters that were altered for sensitivity analysis:
1. Diffusivity of nitroglycerin in saliva: Since currently this value is approximated as the
diffusivity of nitroglycerin in water, the value was altered by 10% to account for the
minimal difference in the properties of water and saliva are as reported in literature.
2. Diffusivity of nitroglycerin in sublingual mucosa: This value has been approximated as
the diffusivity of the drug in buccal (cheek) mucosa which was estimated from literature
values of nitroglycerin in the skin. It is documented in the literature how much more
diffusive the buccal mucosa is as compared to the skin. This parameter was varied by an
order of magnitude since a great deal of approximation was used.
3. Magnitude of salivary flow: Since salivary flow rates vary from person to person, a range
of magnitudes were used to ensure that the model is applicable to the majority of
individuals.

18
4. Frequency of salivary flow directional change: A range of salivary flow frequencies was
tested to account for difference between salivary flow in individuals.
The concentration in the bloodstream at 60 seconds, taking into account drug degradation in
the blood, was compared for the sensitivity analysis. One minute was chosen as the time to
compare the concentration values since it is longer than the maximum dissolving time, and
allows some time for additional diffusion. For each case of the sensitivity analysis, the
concentration was computed as described in the validation section.
9.1 Diffusivity of Nitroglycerin into the Sublingual Mucosa
In the nitroglycerin tablet model, 1.76E-04 mm2/sec was used as the value of
nitroglycerin diffusivity both in the bottom side of the tongue and on the very bottom of the
mouth. This sublingual mucosa diffusivity value was approximated as the diffusivity of the
buccal mucosa. Since the buccal mucosa is reportedly 4 to 4000 times more diffusive than the
skin (Shojaei 1998), the diffusivity of nitroglycerin in the buccal mucosa was approximated by
increasing the diffusivity of nitroglycerin in the skin by a factor of 400. In order to analyze how
this estimation may have affected the results of the model, a sensitivity analysis was performed
on this parameter. The sublingual mucosa diffusivity value was both decreased and increased by
an order of magnitude resulting in a low diffusivity value of 1.76E-05 mm2/sec and a high
diffusivity value of 1.76E-03 mm2/sec. The corresponding flux vs. time graphs can be seen in
Appendix C, Figures C1 and C2. It makes sense that the flux of nitroglycerin into the blood is
much greater for the high diffusivity of the mucosal region. The low diffusivity graph shows flux
values that are an order of magnitude less than the values corresponding to high diffusivity.
Figure 9 shows that changes in the sublingual mucosa diffusivity value are proportional
to changes in the nitroglycerin plasma concentration at one minute. Decreasing the sublingual
mucosa diffusivity by an order of magnitude decreases the concentration reached after one
minute. With a lower sublingual mucosa diffusivity value, it takes much longer for the drug to
move through the bottom of the tongue and the bottom of the mouth to reach the blood vessels.
The opposite is true for increasing the sublingual mucosa diffusivity value. Since changing the
diffusivity value of the sublingual mucosa affects the concentration in the bloodstream
drastically, the plasma concentration is quite dependent on sublingual mucosa diffusivity.
9.2 Diffusivity of Nitroglycerin into the Saliva
Since the diffusivity of nitroglycerin into saliva is not well reported in the literature, the
diffusivity of nitroglycerin in saliva was approximated as the diffusivity of nitroglycerin in
water. Saliva is composed of 98% water, and thus this is a reasonable assumption to make.
Therefore, this diffusivity value is only varied by +/- 10% instead of an order of magnitude. The
flux vs. time graphs for both cases can be seen in Appendix C, Figures C3 and C4. The flux into
the bloodstream for both cases are on the same order of magnitude, however the flux reaches a
greater value in the high saliva diffusivity. This corresponds to what was predicted; since the
nitroglycerin can diffuse into the surrounding fluid more easily, there will ultimately be a greater
flux into the bloodstream.
Altering the diffusivity of the saliva had interesting effects. Both decreasing and
increasing it by 10% caused a significant increase in concentration at one minute. Lower saliva

19
diffusivity means that nitroglycerin enters the saliva at a lower rate and diffuses through the
saliva more slowly. Since the drug cannot diffuse in the x direction, through the saliva, as easily,
the time that it requires for the drug to reach the sublingual mucosa is less than the time required
for the drug to reach the far left and far right boundaries. Accordingly, less drug is lost out the
sides of the model and more drug reaches the bloodstream. This results in a higher plasma
concentration at one minute. When the diffusivity is increased by 10%, the drug can diffuse
through the saliva more quickly. Thus, more drug reaches the sublingual mucosa and the
bloodstream and so a higher plasma concentration at one minute is attained.
9.3 Magnitude of salivary flow velocity
To analyze the effect of salivary flow on the nitroglycerin tablet model, the model was
run with flow values 50% greater and less than the utilized value. The normal model used a
salivary flow rate of 0.01333 mm/sec while the 50% greater and less model used flow rates of
0.006667 mm/sec and 0.01999 mm/sec, respectively. The resulting total flux graphs are shown in
Figures C5 and C6 in Appendix C. When comparing the two flux graphs, it is clear that the flux
into the blood stream is much greater for the high magnitude case by about two orders of
magnitude. This makes sense because the faster the saliva is moving, the faster the drug can
dissolve and diffuse away into the blood.
The results from the sensitivity analysis were interesting since deviations from the
original value resulted in an increased plasma concentration after one minute. For higher saliva
flow rates, the flux of the drug across the surface of the tablet is greater, resulting in more surface
convection and thus, a higher plasma concentration after one minute. For lower salivary flow
magnitudes, less drug is being convectively forced far away from the center and lost into the
peripheral saliva. Thus, more drug is able to diffuse directly into the sublingual mucosa and the
plasma concentration at one minute is greater.
9.4 Frequency of salivary flow directional change
In an attempt to include the effects of convection due to salivary flow beneath the tongue,
a piecewise function was created to specify the magnitude and direction of salivary flow velocity
at each time point. Since salivary flow beneath the tongue is not uni-directional, the model
instead models salivary flow as alternating between directions in the x dimension more akin to a
“sloshing” motion. In the original model, the salivary flow switches directions every second.
Since this is not documented in the literature, a sensitivity analysis was performed to see how
switching the salivary flow direction every 0.5 seconds and every 2 seconds, affects the blood
concentration at one minute. The flux vs. time results for each case may be seen in Figures C7
and C8 in Appendix C. The flux into the bloodstream for both sloshing cases is similar. Both are
on the same order of magnitude, however, the faster sloshing results in a slightly greater flux.
The purpose of performing a sensitivity analysis on this parameter was to address both
the estimations that were made to simulate saliva “sloshing” and the presumable variation
between individuals. It is interesting to note that when the time between salivary flow directional
changes was both decreased and increased, the plasma concentration at one minute was increased
from the original value.

20
When the direction of fluid flow changes every 0.5 seconds, there is more surface
convection over the tablet and so the flux of drug out of the tablet is greater. Subsequently, more
drug will enter the tongue and bloodstream resulting in a higher plasma concentration after 60
seconds. Interestingly, when fluid flow changes direction every 2 seconds, the concentration of
nitroglycerin after 60 seconds is greater than when fluid changes direction after 1 second. This
defied the expectation that the concentration would be lower since there would be less total flux
across the surface of the tablets. The expected decrease in flux may be counteracted by a larger
distribution of drug in the mouth due to the increased fluid flow time. Given that saliva flows
over the tablet for twice as long, the drug is being distributed over a wider area underneath the
tongue. This would increase the area over which drug diffuses into the tongue thus increasing the
total flux into the tongue and into the bloodstream and increasing the plasma concentration at
one minute.. This effect may be enough to balance the decrease in convective flux for a 2 second
fluid change but not for a 1 second fluid change.
9.5 Summary
A graphical summary of the sensitivity analysis results can be found in Figure 9 below.
This graph shows how altering each of the four parameters (diffusivity in saliva, diffusivity in
the sublingual mucosa, magnitude of salivary flow velocity and frequency of salivary flow
directional change) changes the concentration of nitroglycerin in the blood plasma after one
minute. Using the normal model parameters, at one minute the plasma has reached a
nitroglycerin concentration of 20.13 pg/mL.
Figure 9: Sensitivity Analysis of Sublingual Nitroglycerin Tablet Model. Graphical display of
how variation in four different parameters affects the blood concentration at one minute
463.91
20.13 13.24
48.37
20.13
55.86 65.06
20.13
3901.64
51.94
20.13
48.83
1
10
100
1000
10000
Pla
sma
Co
nce
ntr
ati
on
at
60
se
con
ds
(pg
/m
L)
Varied Parameter
Drug diffusivity in saliva
(mm^2/sec)
Magnitude of saliva flow velocity
(mm/s)
Frequency of saliva flow directional
change
Drug diffusivity in mucosa (mm^2/sec)

21
Figure 9 shows that when the diffusivity in sublingual mucosa is varied in both directions,
the concentration of drug in the blood at one minute changes respectively. Therefore a more
exact value for nitroglycerin into the sublingual mucosa would be beneficial in producing the
most physiologically accurate results in this model. Altering all of the other factors described
results in an increase in blood plasma concentration. It became evident in this model that there
will be large variation between individuals since each person will have various saliva properties.
In all cases except for the low mucosa diffusivity case, the minimum effective concentration is
reached in one minute.
10. Design Modification – Nitroglycerin Strip Model
10.1 Model Schematic
After analyzing the model for nitroglycerin delivery in tablet form, a thin strip was
analyzed for comparative efficacy. Since strips require very little moisture to dissolve, drug is
able to diffuse directly into the tongue. Thus in this model, the saliva layer with salivary flow
was excluded and the strip was modeled as a thin layer between the bottom of the tongue and
floor of the mouth. The strip schematic is presented in Figure 10 below.
Figure 10: Schematic of the nitroglycerin thin strip model. The strip is modeled with a thickness
of 12 µm, a width of 20mm, and a length of 20mm. Since saliva is not necessary for strip
dissolution, the salivary layer is excluded and the strip is modeled as being between the tongue
and bottom of the mouth which can be modeled as one region due to physical similarity.
Since the strip was 20mm wide while the tablet was only 4mm, the cross section of the
tongue modeled must also be expanded. Therefore, in the case of the strip, 40mm of the tongue
must be modeled as seen in Figure 10 above.
10.2 Methods
Similar to the previous model, this process was modeled in COMSOL as 2D diffusion
governed by the 2D transient mass transfer equation:
(
)
where ca is the concentration of the drug and Da is the diffusivity of nitroglycerin through the
sublingual mucosa. Note that in this equation, unlike the equation for the tablet, the convective
term is excluded since salivary flow is not present in this model.
10.3 Boundary Conditions and Numerical Inputs
A. The concentration in the strip is constant throughout the strip and throughout the duration
of drug delivery:

22
30625.0
)2020012.0(
3.0
mm
mg
mmmmmm
mgc
A mass of 0.3mg of nitroglycerin is used to remain consistent with the amount in the
tablet. Since the molar mass of nitroglycerin is 227 x 103 mg/mol the surface drug
concentration can also be written as,
3
710753.2mm
molc
However, after a period of 10 seconds, which is within the range of thin strip dissolution
time, the strip takes on a zero flux/insulation boundary condition since it has dissolved.
B. At the top boundary of the model and at the bottom of the model, the top of tongue and
bottom of the mouth respectively, are the locations of blood vessels. At these locations,
the drug enters the bloodstream so quickly that the drug concentration is essentially
always equal to zero:
c = 0mg
mm3
C. The material properties that must be input into COMSOL before solving the model are
the same as those shown in Appendix A, Table A1 except that this model was only run
until a final time of 180 seconds.
10.4 Results
The results of the dissolution of the strip were generated in a manner identical to that of
the tablet. One exception is that the area over which the nitroglycerin passes is 40mm wide by
20mm deep in the strip model, compared to the 12mm by 4mm in the tablet. The efficacy of the
strip was assessed through comparison of the total flux into tongue over time and the plasma
concentration of the drug over time as determined by both the strip model and the tablet model.
The total flux of the drug into the tongue demonstrates behavior similar to what was seen with
the tablet model. There is an increase in flux followed by a slight drop in the flux at the time the
drug has been depleted. This decrease is then followed by an increase in flux as the remaining
drug begins to diffuse into the bloodstream. Drug flux then slowly decreases since the drug has
been totally removed from the oral cavity as seen in Figure 11 below.

23
Figure 11: Total flux of nitroglycerin into the tongue for the thin strip model
When comparing Figure 11 to Figure 7 for the strip and tablet flux respectively, it is clear
that the flux into the bloodstream for the strip is much greater. The maximum flux reached is
more than two orders of magnitude greater than that for the strip. It is obvious from this that the
strip is much more efficient.
The concentration of drug in the plasma versus time when the strip model is used also
demonstrates the same behavior as the tablet model. Plasma concentration for the strip steadily
increases throughout the three minute span as shown in Figure 12.
0
5E-12
1E-11
1.5E-11
2E-11
2.5E-11
3E-11
3.5E-11
4E-11
4.5E-11
5E-11
0 50 100 150 200
Flu
x (
mo
l/(m
m^
2 s
))
Time (s)

24
Figure 12: Concentration of nitroglycerin in the blood plasma versus time when using the strip
model.
Figure 12 shows that a concentration of just under 20000 pg/mL is reached after three
minutes of administering the strip, a concentration much greater than achieved by the tablet.
A comparison of the two models based on flux as well as plasma concentration clearly
shows that the strip is a significantly more effective vehicle of drug delivery. Both the total flux
and plasma concentration are two orders of magnitude greater with the strip. Thus, a greater
quantity of drug enters the bloodstream when the strip is used. Below in Figures 13 and 14, the
total flux vs. time and plasma nitroglycerin concentration vs. time are plotted for both models on
a logarithmic scale.
0
5000
10000
15000
20000
25000
0 20 40 60 80 100 120 140 160 180
Co
nce
ntr
ati
on
(p
g/
ml)
Time (s)

25
Figure 13: Total flux of drug into the bloodstream for both models on a logarithmic scale
Figure 14: Concentration of nitroglycerin in the blood plasma for both models plotted on a
logarithmic scale
1E-15
1E-14
1E-13
1E-12
1E-11
1E-10
0 50 100 150
Flu
x (
mol/
(mm
^2)s
)
Time (s)
Strip
Tablet
0.01
0.1
1
10
100
1000
10000
100000
1000000
0 50 100 150
Con
cen
trati
on
(p
g/m
l)
Time (s)
Strip
Tablet

26
Figure 13 shows that the flux of nitroglycerin into the bloodstream is, on average, two
orders of magnitude greater for the strip in comparison to the tablet. As a result of this, the
plasma concentration is greater at all times for the strip model, as shown in Figure 14. Given a
total of 0.3mg of nitroglycerin in both the tablet and the strip, the maximum blood plasma
concentration that could be achieved is 600,000 pg/mL (0.3mg/5000mL). This is assuming that
all of the nitroglycerin enters the bloodstream and no degradation occurs, which is not physically
possible. In the case of the strip, the plasma concentration at three minutes is approximately
326,600 pg/mL. The efficiency improvement achieved by the strip model is obvious.
11. Conclusions
Before this study, the exact method of sublingual nitroglycerin delivery had never been fully
modeled nor understood. The COMSOL model created in this study accurately simulates the
path of nitroglycerin from the tablet into the bloodstream taking into account saliva flow and a
flux dependent drug dissolution rate. In this way, the first design objective was accomplished.
The model enabled a better understanding of the sublingual drug delivery process for both tablet
and strip nitroglycerin delivery vehicles.
The flux of nitroglycerin into the bloodstream as well as the plasma concentration were also
calculated and plotted as a function of time; two variables that were not well understood
previously, according to the literature. The time until full dissolution and time until the
nitroglycerin takes effect were compared to literature values to validate the model. Sensitivity
analysis showed that diffusivity of the tongue has a large effect on drug plasma concentration at
a given time, as expected. In other cases, such as more frequent sloshing or faster saliva velocity,
more nitroglycerin reached the blood within one minute of administering the tablet.
When comparing the sublingual tablet to the strip model, it was clear that a strip with the
same initial amount of nitroglycerin as the tablet was much more effective. The greater surface
area and faster dissolution time allows a much higher concentration of drug to reach the blood
after one minute. Angina patients often take nitroglycerin medication prior to the onset of a heart
attack when time is vital. Therefore a fast-acting and effective drug delivery vehicle is a top
priority. For this reason, a nitroglycerin strip for angina treatment could be an important
discovery from the perspective of pharmaceutical companies.
This concentration of nitroglycerin is attainable in a strip, with regards to manufacturing,
according to Dixit et al., and so the potential of a nitroglycerin strip as an alternative angina
treatment is undeniable. The research and development of a nitroglycerin strip for the treatment
of angina pectoris could perform well in the current tablet-dominated market. The computer
model designed in this study was beneficial because it served as a proof-of-concept study of the

27
nitroglycerin strip design. Computer modeling, in this instance, was able to replace costly
preliminary experimentation and support the value of future research.
11.1 Manufacturability and Economic Constraint
While there are several theoretical benefits of the sublingual strip method, adopting this
design does not come without economic and manufacturing constraints. While the design is
supported by COMSOL modeling as demonstrated above, plenty of time is still needed for
product development, preclinical and clinical trials, and FDA approval (Malke, et al. 2010). This
entire process could take upwards of seven years. These stages of development require a great
deal of time and money, while virtually no income being generated (Malke, et al. 2010). This,
therefore, presents a time and financial constraint on the company. It is clear that not all
pharmaceutical companies have the financial backing and time to convert to oral strip
nitroglycerin delivery. Additionally, switching all the manufacturing devices would require
significant effort, time, and money on the company’s behalf. Luckily, similar devices have been
previously invented so minimal engineering would be needed (Malke, et al. 2010). Regardless, a
company may not have the available facilities or financial capability to undertake such a large
endeavor. In these ways, replacing nitroglycerin tablets with nitroglycerin strips is severely
restricted by manufacturability and economic constraints.
11.2 Health Safety Constraint
While it may seem clear that effectiveness of angina treatment can be increased by
increasing the amount of nitroglycerin delivered to a patient, there are some health and safety
limitations to this proposition. Too high a dose of nitroglycerin can cause shortness of breath,
blurred or double vision, heart palpitations and rapid heartbeat, convulsions, fainting, and even
comas (National Institute of Health 2011). This safety concern therefore places a constraint on
the maximum drug concentration that can be included in the strip or tablet model. This restricts
the design somewhat since there is a certain limit on the maximum drug allowed. However, the
model shows such high plasma concentrations with the strip that it even seems viable to decrease
the overall nitroglycerin concentration in the stip. This would help reduce expenses as well as
side effects. Further testing would need to be conducted to determine the optimal amount of
nitroglycerin.

28
Appendix A: Mathematical statement of the problem
Governing Equations
In the mucosal regions
Diffusion modeled by: )(2
2
2
2
y
c
x
cD
t
c aaa
a
In the saliva region (for tablet model only)
Convection and diffusion modeled by:
¶ca¶t
+ ux¶ca¶x
= Da (¶2ca
¶x2+
¶2ca
¶y2)
Navier Stokes modeled by:
(u
t ux
u
x) g (
2u
x2)
P
x
Boundary Conditions and Initial Values
A. From the initial time until the time at which the tablet completely dissolves, the surface of
the tablet, that is all four boundaries, is assumed to always be at a constant concentration:
33011937.0
8
3.0
mm
mg
mm
mgc
Since the molar mass of nitroglycerin is 227 x 103 mg/mol the surface drug concentration
can also be written as,
c 5.259108 mol
mm 3
Once the tablet is completely dissolved this boundary condition changes and all four
boundaries that once represented the tablet are set to be insulation boundary conditions so
that the flux of drug at these boundaries is equal to zero.
B. At the very top boundary of the tablet model, 200µm into the tongue from the saliva, and
at the very bottom of the model, 200µm deep into the bottom of the mouth, are the
locations of the blood vessels. At this location, the drug enters the bloodstream so quickly
that the drug concentration is essentially always equal to zero:
c = 0mg
mm3

29
Input Parameters
The material properties that must be input into COMSOL before solving the model are shown in
Table A1 below.
Table A1. Material properties for nitroglycerin sublingual tablet model. Table of values
necessary to use COMSOL model of nitroglycerin sublingual tablet delivery.
Appendix B: Solution strategy
The COMSOL linear systems solver direct (UMFPACK) was used to find the complete
solution of this model. The problem was a transient model solved from 0 to 300 seconds with an
initial time step of 0.005 and maximum time step of 0.1 manually entered in COMSOL. For the
calculations, the default values for relative and absolute tolerance, 0.01 and 0.001 respectively,
were used.
Mesh
The model was implemented into COMSOL as a 2-D rectangular model with several
different layers. In the complete solution, a maximum element size of 0.1 was used throughout
the subdomains with a maximum size of 0.04 along the boundaries of the tablet and
saliva/mucosa interface where a greater gradient was expected. The mesh consists of triangular
elements, each with three nodes.
A mesh convergence analysis was performed to assure the resulting drug concentration
was not dependent on the mesh size used. The data from this analysis is presented below in Table
B1.
Property Value Unit Reference
Diffusivity of nitroglycerin in saliva 7.339e-4 mm2/sec (GSI Enviornmental
2010)
Diffusivity of nitroglycerin in tongue/bottom of
the mouth
1.76e-4 mm2/sec (Shojaei 1998)
(Nakamura, et al. 2001)
Flow rate of saliva at left most inlet boundary 0.0133 mm/sec (Dawes 1993)
Concentration of drug at tablet surface 5.259e-8 mol/mm3 (Bauer and Seifert 2005)
Initial drug concentrations in
saliva/tongue/bottom of mouth
0 mol/mm3
Dynamic viscosity of saliva (in subdomain 2) 0.0016e-3 kg/mm2sec (Kusy and Schafer 1995)
Density of saliva 1e-6 kg/ mm3 (Bijella, et al. 2005)
Results saved every 0.1 sec
Final time 300 sec
30
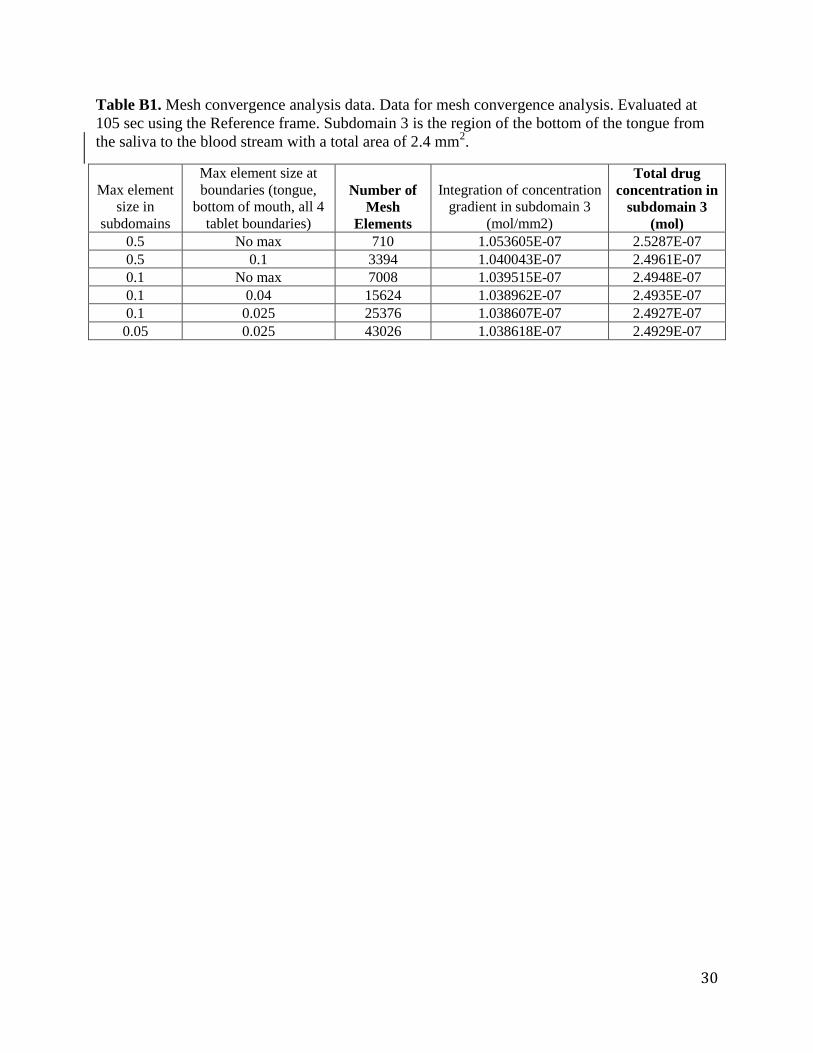
Table B1. Mesh convergence analysis data. Data for mesh convergence analysis. Evaluated at
105 sec using the Reference frame. Subdomain 3 is the region of the bottom of the tongue from
the saliva to the blood stream with a total area of 2.4 mm2.
Max element
size in
subdomains
Max element size at
boundaries (tongue,
bottom of mouth, all 4
tablet boundaries)
Number of
Mesh
Elements
Integration of concentration
gradient in subdomain 3
(mol/mm2)
Total drug
concentration in
subdomain 3
(mol)
0.5 No max 710 1.053605E-07 2.5287E-07
0.5 0.1 3394 1.040043E-07 2.4961E-07
0.1 No max 7008 1.039515E-07 2.4948E-07
0.1 0.04 15624 1.038962E-07 2.4935E-07
0.1 0.025 25376 1.038607E-07 2.4927E-07
0.05 0.025 43026 1.038618E-07 2.4929E-07

31
Appendix C: Additional visuals
Average Flux into Bloodstream vs. Time Graphs – Sensitivity Analysis
Below are graphs of the average flux into the blood stream versus time for each
sensitivity analysis case.
Figure C1. Flux vs. time graph for low sublingual mucosa diffusivity case (D=1.76e-5 mm
2/s)
Figure C2. Flux vs. time graph for high sublingual mucosa diffusivity case (D=1.76e-3 mm
2/s)
0
2E-14
4E-14
6E-14
8E-14
1E-13
1.2E-13
1.4E-13
0 50 100 150
Flu
x (
mo
l/m
m^
2/s
)
Time (s)
0
1E-13
2E-13
3E-13
4E-13
5E-13
6E-13
0 50 100 150
Flu
x (
mo
l/m
m^
2/s
)
Time (s)

32
Figure C3. Flux vs. time graph for low saliva diffusivity case (D=6.605e-4mm
2/s)
Figure C4. Flux vs. time graph for high saliva diffusivity case (D=8.073e-4 mm
2/s)
0
1E-13
2E-13
3E-13
4E-13
5E-13
6E-13
0 50 100 150
Flu
x (
mo
l/m
m^
2/s
)
Time (s)
0
1E-13
2E-13
3E-13
4E-13
5E-13
6E-13
0 50 100 150
Flu
x (
mo
l/m
m^
2/s
)
Time (s)

33
Figure C5. Flux vs. time graph for low saliva velocity magnitude (u=0.00667 mm/s)
Figure C6. Flux vs. time graph for high saliva velocity magnitude (u=0.1999 mm/s)
0
1E-13
2E-13
3E-13
4E-13
5E-13
6E-13
7E-13
0 50 100 150
Flu
x (
mo
l/m
m^
2/s
)
Time (s)
0
5E-12
1E-11
1.5E-11
2E-11
2.5E-11
3E-11
3.5E-11
4E-11
0 50 100 150
Flu
x (
mo
l/m
m^
2/s
)
Time (s)

34
Figure C7. Flux vs. time graph saliva sloshing frequency every 0.5 seconds
Figure C8. Flux vs. time graph saliva sloshing frequency every 2 seconds
0
1E-13
2E-13
3E-13
4E-13
5E-13
6E-13
0 50 100 150
Flu
x (
mo
l/m
m^
2/s
)
Time (s)
0
5E-14
1E-13
1.5E-13
2E-13
2.5E-13
3E-13
3.5E-13
4E-13
4.5E-13
5E-13
0 50 100 150
Flu
x (
mo
l/m
m^
2/s
)
Time (s)

35
References
Bauer, John Anthony, and Jennifer Seifert. "Sublingual Transmucosal Delivery of Organic Nitrates: Treatment of Angina Pectoris." In Drug Delivery to the Oral Cavity Molecules to Market, by Tapash K Gosh and William Pfister. London: Taylor & Francis Group, 2005.
Bijella, Maria Francisca Thereza, Fernanda Laurencao Brighenti, Maria Fernanda Borro Bijella, and Marilia Afonso Rabelo Buzalaf. "Fluoride kinetics in saliva after the use of a fluoride-containing." Pediatric 19, no. 4 (2005): 256-260.
Brown, B G, E Bolson, R B Peterson, C D Pierce, and H T Dodge. "The Mechanism of Nitroglycerin Action: Stenosis Vasodialation as a Major Component of the Drug Response." Circulation, 1981: 1089-1097.
Dawes, C. "The Ebb and Flow of the Salivary Tide." In Cariology for the Nineties, by William H Bowen and Lawrence A Tabak, 133-141. Rochester: University of Rochester Press, 1993.
Dixit, R P, and S P Puthli. "Oral strip technology: Overview and future potential." Journal of Controlled Release 139, no. 2 (October 2009): 94-107.
Goswami, Tarun, Bhaskara Jasti, and Xiaoling Li. "Sublingual Drug Delivery." Critical Reviews in Therapeutic Drug Carrier Systems 25, no. 5 (2008): 449-484.
Graboys, T B, and R Lown. "Nitroglycerin: The “Mini” Wonder Drug." Circulation Journal of the American Heart Association, 2003: 78-79.
GSI Enviornmental. Nitroglycerin. 2010. http://www.gsi-net.com/en/publications/gsi-chemical-database/single/396.html (accessed April 29, 2012).
Ignarro, L J. "After 130 years, the molecular mechanism of action of nitroglycerin is revealed." PNAS 99, no. 12 (2002): 7816-7817.
Jasti, Bhaskara, Marasanapalle Venugopal, and Li Xiaoling. "Modulation of Oral Transmucosal Permeability: Permeation Enhancers." In Drug Delivery to the Oral Cavity: Molecules to Market, by Tapash K Ghosh and William Pfister. London: Taylor & Francis Group, 2005.
Klancke, James. "Dissolution Testing of Orally Disintegrating Tablets." Dissolution Technologies, 2003: 6-8.
Kusy, R P, and D L Schafer. "Rheology of stimulated whole saliva in a typical pre-orthodontic sample population." Journal of Materials Science: Materials in Medicine 6, no. 1 (1995): 385-389.
Lab Test Online. Angina. April 13, 2012. http://labtestsonline.org/understanding/conditions/angina/ (accessed April 25, 2012).
Li, Bing, and Joseph Robinson. "Preclinical Assessment of Oral Mucosal Drug Delivery." In Drug Delivery to the Oral Cavity: Molecules to Market, by Tapash K Ghosh and William Pfister. London: Taylor & Francis Group, 2005.
Malke, S, S Shidhaye, J Desai, and V Kadam. "Oral Films - Patient Compliant Dosage Form For Pediatrics." The internet Journal of Pediatrics and Neonatology 11, no. 2 (2010). http://www.ispub.com/journal/the-internet-journal-of-pediatrics-and-neonatology/volume-11-number-2/oral-films-patient-compliant-dosage-form-for-pediatrics.html

36
Nandini. An Introduction to Tablets. May 16, 2011. http://www.pharmainfo.net/nandini/blog/introduction-tablets (accessed April 29, 2012).
Narang, Neha, and Sharma Jyoti. "SublingualL Mucosa as a Route for Systemic Drug Delivery." International Journal of Pharmacy and Pharmaceutical Sciences 3, no. 2 (2011): 18-22.
National Institute of Health. December 15, 2011. http://www.nlm.nih.gov/medlineplus/ency/article/002587.htm (accessed April 29, 2012).
Ogbru, Omudhome. nitroglycerin, Nitro-Bid, Nitro-Dur, Nitrostat, Transderm-Nitro, Minitran, Deponit, Nitrol. March 26, 2009. (accessed April 26, 2012).
Riseman, Joseph, George Altman, and Sidney Koretsky. "Nitroglycerin and Other Nitrites in the Treatment of Angina Pectoris:Comparison of Six Preparations and Four Routes of Administration." Circulation 17, no. 17 (1958): 22-39.
Shojaei, Amir. "Systemic Drug Delivery via the Buccal Mucosal Route." Journal of Pharmacy & Pharmaceutical Sciences 1, no. 1 (1998): 15-30.
Taggart, Starr, and Cecie Starr. "The Unity and Diversity of Life." Biology, 1989: 398. What is Angina? June 1, 2011. http://www.nhlbi.nih.gov/health/health-
topics/topics/angina/ (accessed April 26, 2012). Wikipedia. Nitroglycerin. April 6, 2012. http://en.wikipedia.org/wiki/Nitroglycerin
(accessed April 29, 2012).