Embed Size (px)
Citation preview
Subjective welfare and (in)formal sector in a transition country
Ada Ferrer-i-Carbonell
ICREA researcher at Institut d'Anàlisi Econòmica (IAE-CSIC), Spain
and
Klarita Gërxhani
Faculty of Social and Behavioural Sciences,
Amsterdam Institute for Advanced Labour Studies, Faculty of Economics and Business, and
Tinbergen Institute
University of Amsterdam, The Netherlands
5 October 2007
Acknowledgments: We would like to thank Bruno Frey, Erik Plug, Arthur Schram, Jeroen van den Bergh, and Bernard van Praag for useful comments and support.
2
Subjective welfare and (in)formal sector in a transition country
Abstract
This paper examines the relationship between working in the formal or informal sector
and subjective welfare in a country in transition. It does so by allowing for individual
heterogeneity in attitudes towards taxes. The results indicate that, for most individuals,
working in the informal sector has negative effects on their subjective welfare. For some
individuals, however, this effect is positive. The differentiating characteristic of the latter
group is their low private tax morale, i.e, they disagree that not paying taxes today has
personal financial repercussions in the future.
Keywords: financial satisfaction; informal sector; tax morale; transition.
JEL-Classification: J0; I3; O5; H26; O17.
3
1. Introduction An important episode in the previous century was the rise and fall of communist
economies in Central and Eastern Europe and the Baltic states. The end of these
economies led to the emergence of so-called transition countries, which are characterized
by rapid economic and institutional change. This transformation has been accompanied by
the appearance of an informal sector of substantial size. From an economic perspective,
the informal sector is important in terms of both the re-allocation of resources it causes
and its impact on individuals’ welfare. This paper focuses on the latter.
Early contributions to the literature argue that average individual earnings in the
informal sector are lower than in the formal sector (Merrick, 1976; Kugler et al., 1979;
Bourguignon, 1979; Banerjee, 1982; Heckman and Hotz, 1986; Pradhan and van Soest,
1995; and Pisani and Pagán, 2003). Thomas (1990) presents evidence that this mainly
holds for less developed countries. Moreover, working in the informal sector has other
disadvantages: workers often experience worse working conditions, face higher job
insecurity, have no labor contract and, as a consequence are excluded from various social
benefits. Despite these disadvantages, working in the informal sector is often preferred to
being unemployed (De Grazia, 1982; Kesner-Skreb, 1997; Gërxhani, 2004b) and
sometimes even considered to be a better option than working in the formal sector. Aside
from the financial advantage of not paying taxes (e.g., Hansson, 1982), the informal sector
sometimes provides more flexibility and opportunities for individual initiative and
creativity than the formal sector (De Grazia, 1982; Renooy, 1990; Marcouiller et al.,
1997).
Various studies have suggested that the earnings distributions in the formal and
informal sectors have substantial overlap (Fields, 1990), so that the differences may be
smaller than is commonly thought (Charmes, 1990). These findings are based on
distinguishing between two sub-sectors within the informal sector. One is called the
‘upper-tier informal sector’. It is characterized by limited-entry and high wages, and is
preferred by workers to formal sector employment. The other is called the ‘easy-entry
informal sector’, which consists of employment that is characterized by free-entry and low
wages. Workers consider the latter to be undesirable relative to formal sector employment.
Based on this distinction, Fields (1990) reports that individuals working in the upper-tier
informal sector have voluntarily moved there from the formal sector and are happy about
their choice. In other words, for these individuals, the disadvantages of working in the
4
informal sector are outweighed by the advantages. Individuals who participate in the easy-
entry informal sector are unsatisfied with working in the informal sector and are typically
looking for jobs in the formal sector.
Despite these attempts to characterize the pros and cons of working in the informal
sector, the existing literature remains unclear about the consequences for individual
welfare. Although income is often used to compare individuals across sectors, there is
more to welfare than just income, e.g., (un)certainty about the future and (lack of) social
security. In this paper, a broader concept of economic welfare, i.e., subjective welfare is
used. This is captured by individuals' own evaluation of their financial situation.
From this overview, we conclude that though the existing literature touches upon
welfare differences between the two sectors, a systematic analysis of individuals’
subjective welfare attributed to working in the (in)formal sector and its causes is still
missing. This paper recognizes this gap and offers a first (econometric) analysis of the
effect of working in the (in)formal sector on individual self-reported financial situation.
The empirical analysis uses a dataset for Albania, a country in transition. After the
collapse of communism, a combination of economic, social and institutional factors
created suitable conditions for the informal sector to be prevalent in Albania (Gërxhani
and Schram, 2006).1 Moreover, the individual involvement in the informal sector in this
country is not voluntary. This is due to a limited number of jobs available in the formal
sector combined with trivial and short-termed financial support by the Albanian welfare
system. As shown by Gërxhani (2004b), this lack of choice is a fundamental difference
between the informal sector in developed countries and that in transition countries, which
has not been taken into account in previous studies. In transition countries, ‘survival’ plays
an important role in the decision to participate in the informal sector.2 In a recent study on
dichotomous sectoral composition of labor in Nicaragua, Pisani and Pagán (2003: 574)
argue that “unlike developed countries which have a functional social safety net for
unemployed people to ‘wait’ or queue for formal sector employment, Nicaragua has
virtually no social safety net; this compels potential formal sector job seekers to work in
the informal sector (which acts as the de facto social safety net) while awaiting formal
sector employment.”
1 The average size of the shadow economy in Albania was estimated to be 33.4% in 1999/2000 (Schneider, 2005). 2 The fact that formal and informal sectors are often found to be complementary in transition countries is another indication of the survival aspect of the informal sector in these countries. A broader discussion can be found in Schneider and Enste (2000).
5
Finally, this paper takes the analysis one step further by recognizing that individuals
are not homogenous economic agents with identical perceptions of their own welfare. In
the empirical application, it identifies two groups of individuals, distinguished by the
extent of their ‘tax morale’. This refers to individual attitudes towards taxes. An important
distinction between working in the formal and informal sector is whether or not
individuals pay taxes. Individuals may, however, differ on how they perceive the financial
consequences of (not) paying taxes. By allowing for this difference, the analysis provides
a more accurate explanation for heterogeneity in subjective welfare.
The remainder of this paper is structured as follows. Section 2 introduces the
empirical approach. This involves a description of the question used to capture subjective
welfare, an explanation of the econometric model, and a characterization of the data.
Section 3 presents and discusses the results. Section 4 concludes.
2. The empirical approach 2.1. Subjective measures
Psychologists have measured individual well-being by means of subjective questions since
the late 1960s, starting with Cantril (1965), Wilson (1967) and Bradburn (1969). An
overview of this literature is presented in Kahneman et al. (1999). More recently, many
economists have made use of subjective questions on, among others, welfare (financial
satisfaction), well-being, and health satisfaction, to address a wide range of scientifically
and politically relevant questions.3 Subjective questions ask individuals about their life
satisfaction in general or with respect to various domains of life in particular, such as
housing, health, or financial situation. The most relevant characteristic of the subjective
measures is their focus on individual perceptions.
The focal point of this paper is the financial consequences of working in the formal
or informal sector, hence the following question is used:
“How satisfied are you with the financial situation of your household?”.
Individuals are asked to evaluate their satisfaction on a 0 to 10 scale, where 0 stands for
totally dissatisfied and 10 for totally satisfied. From now on, this information will be
3 Studies include Clark and Oswald (1994); Kapteyn (1994); Ng (1997); Oswald (1997); van Praag and Frijters (1999); Pradhan and Ravallion (2000); DiTella et al. (2001); Easterlin (2001); Ferrer-i-Carbonell and van Praag (2002); Frey and Stutzer (2002); Ravallion and Lokshin (2002); Torgler (2003); van Praag et al. (2003); Ferrer-i-Carbonell and Frijters (2004); Frijters et al. (2004); Ferrer-i-Carbonell (2005); and Torgler and Schneider (2005).
6
referred to as individual financial satisfaction (FS). FS reflects individuals’ perceptions of
their economic situation. This means that two individuals who have the same income can
experience different financial satisfaction levels. The analysis presented here sheds light
on which circumstances, other than income, determine FS. Special attention is given to the
importance of the sector one works in. The financial satisfaction question is thus used here
as a measure of subjective welfare. This means that the lower the respondents are in the
scale, the lower their subjective economic well-being is. Van Praag and Ferrer-i-Carbonell
(2004) make use of the same question when studying the extent of poverty in Russia.4
The econometric analysis of financial satisfaction (FS) −and of any subjective
measure− requires two main assumptions. First, individuals are able and willing to
evaluate their own financial satisfaction in a questionnaire. Second, the answers to the
financial satisfaction question are interpersonally comparable. In other words, it is
assumed that different individuals understand and respond to the financial question in
similar ways. It is beyond the scope of this paper to discuss these two assumptions. A
detailed discussion is provided in Ferrer-i-Carbonell and Frijters (2004) and Senik (2004).
2.2. The model
The discussion about what is the best econometric technique to estimate the answers to
satisfaction questions has not yet been resolved (Ferrer-i-Carbonell and Frijters, 2004; van
Praag and Ferrer-i-Carbonell, 2004, Chp. 2). Here, an Ordered Probit is chosen. This
choice is based on two assumptions we impose on the variable FS. First, it is not possible
to observe the exact level of financial satisfaction (FS*), but only the range in which it lies
(FS). Second, the variable gives an ordinal ranking, not a cardinal one. For example, an
individual answering ‘8’ is more satisfied than one answering ‘4’, but not necessarily
twice as much.
The individual financial satisfaction is here described by the following empirical
model:
k k+1
* ( )FS= k FS*FS Ln y I Xα β γ δ ε
µ µ= + + + +⇔ ≤ <
(1)
4 Ravallion and Lokshin (2002) use another subjective welfare question, called the Economic Welfare Question, to explain the large differences between objective and subjective poverty in Russia. Other subjective measures of poverty are based on the Income Evaluation Question, the Minimum Income Question, and the Minimum Spending Question (see, e.g., van Praag, 1971, Kapteyn et al., 1988; van Praag et al., 1997; Garner and Short, 2003; and Gustafsson et al., 2004).
7
where FS* is the underlying non-observed variable, FS is the observed variable, k is one
of the 11 categories (0 to 10), and µ are the estimated intercept terms. Equation (1) shows
that the financial satisfaction is explained by whether an individual works in the informal
sector (I), by the household (monthly) net income (y), and by a set of socio-economic and
demographic variables (X). I is a dummy variable that takes a value 1 if the individual
works in the informal sector, and 0 if (s)he works in the formal sector. The household
income is taken in logarithmic form. This specification is chosen to reflect a diminishing
marginal utility of income. The error term ε, which represents the part of FS* that cannot
be explained, is normally distributed with mean 0 and variance 1, as usual in Ordered
Probit. For details, see Maddala (1983).
2.3. Introducing tax morale
The early economic approaches to tax compliance are mainly based on the economics of
crime and punishment arguments (see Allingham and Sandmo, 1972; Yitzhaki, 1974; and
Cowell, 1990). Later research has shown that non-economic analyses of compliance seem
to substantially contribute to the further understanding of individual tax compliance
decision.5 This paper fits into the later research by focusing on tax morale as one of the
most important factors within the non-economic analyses of compliance (see Alm and
Torgler, 2005; 2006; Alm et al, 2006; Feld and Torgler, 2006; Torgler and Schneider,
2006). Tax morale can be defined as “individuals’ willingness to pay taxes or, in other
words, the moral obligation to pay taxes or the belief in contributing to the society by
paying taxes” (Cummings et al., 2004: 5). Several studies argue that tax morale, as a
particular kind of individual intrinsic motivations, does not only depend on one’s
upbringing but also on the specific institutional context. This includes experience with tax
authorities, interaction with other taxpayers, the constitutional environment, and insecurity
of property rights (Frey, 1989; Alm et. al., 1992; Feld and Frey, 2002; Schneider and
Enste, 2003; Torgler, 2003).
Our data set captures two aspects of tax morale, a private and a public one. The
‘private’ tax morale reflects individual attitudes towards taxes that have direct personal
benefits. In the data set, this aspect is measured by the information on whether individuals
(dis)agree (on a 5-point scale) with the following statement: “Not paying social and health
insurance today would cause serious financial problems for me in the future (e.g., no
8
pension benefits)”.6 The underlying meaning behind this question is that individuals who
agree that not paying social and health insurance today has personal financial
repercussions in the future, demonstrate a high ‘private’ morale towards taxes. For these
individuals, working in the informal sector and thus not paying taxes may negatively
affect their current financial satisfaction.7
The public aspect of tax morale is reflected in the individual (un)willingness to
contribute to public goods. 8 This is captured by whether individuals (dis)agree (on a 5-
point scale) with: “People should pay taxes because if they do, they will benefit from them
(e.g., better roads, more parks, and more schools)”. Individuals who agree that people
should pay taxes because of the public benefits involved, reveal a high ‘public’ tax morale.
Contributing to public goods can positively affect individual financial satisfaction in three
ways: (1) individuals enjoy a larger provision of public goods, (2) altruistic individuals
who contribute to public goods will experience a utility gain due to contributing to the
welfare of others, and (3) the economic burden of having to pay taxes may be
compensated by the pleasure of contributing to the group’s welfare. The last is known as
the ‘warm-glow’ effect, described by Andreoni (1990: 473) as the utility gain “from the
act of giving”.
Obviously, there is a direct relationship between the sector one works in and the
(non)payment of taxes and social/health insurance. Therefore, the effect of working in the
(in)formal sector on an individual’s financial satisfaction may depend on the individual’s
tax morale. The empirical analysis distinguishes between various types of individuals
(defined by their private and public tax morale), for whom the impact of working in the
(in)formal sector on financial satisfaction may differ. This is operationalized using two
dummy variables indicating whether individuals have a high ‘private’ or ‘public’ tax
morale. They are called HPrTm and HPbTm, respectively. These dummy variables take
value 1 if an individual reveals a high tax morale and 0 otherwise.9 Financial satisfaction
5 For a detailed description of the economic and non-economic theories of tax compliance, see Alm et al (1995). 6 In Albania, our case study, payment of social and health insurance premiums is mandatory and is directly subtracted from income together with other taxes. In addition, an individual is entitled to benefits only if (s)he has contributed to the scheme (see Beqja, 2002). 7 This hypothesis is closely related to a research question put forward by Feige (1990). He questions whether the benefits of working in the informal sector (by avoiding institutional constraints) outweigh the costs of exclusion from economic benefits and legal rights. 8 Experimental evidence shows that one reason why people contribute to taxes is because they finance public goods (e.g., Alm et al., 1992 and Becker et al., 1987). 9 Individuals are classified as having a high tax morale if they choose 1 or 2 on the 5-point scale. This corresponds to the verbal categories ‘strongly agree’ and ‘mildly agree’. The respondents are classified as
9
is now regressed including two interaction terms between working in the informal sector
and the two dummy variables. Additionally, the two dummy variables are included
separately in the analysis so as to differentiate between the effect of tax morale through
working in the informal sector, and the direct effect of tax morale on financial satisfaction.
Financial satisfaction is now explained by:
( ) ( * ) ( * )FS Ln y I I HPrTm HPrTm I HPbTm HPbTm Xα β γ ϕ φ π κ δ ε= + + + + + + + + (2)
The effect that working in the informal sector has on the financial satisfaction is described
by γ; (γ +ϕ), or (γ +ϕ+π) depending on the individuals’ tax morale. If these three
coefficients are identical, all the groups are affected in the same way. For completeness,
the empirical analysis includes a third specification in which we exclude the interaction
term between tax morale and working in the informal sector from equation (2). This third
specification allows us to identify whether the differences (if any) in γ between equation
(1) and (2) are related to the tax morale variables or to the interaction term between these
variables and working in the informal sector.
2.4. The endogeneity of the sector choice
An empirical concern is that the sector choice may be endogenous. In other words,
individuals self-select themselves into one sector or another. Most of the recent research
until now models tax evasion and occupational decisions as an individual choice (see, for
example, Watson, 1985; Jung et al., 1994; and Schroyen, 1997). While this research refers
to developed countries, the literature about less developed countries argues that working in
the informal sector is not a matter of choice in a transition country like Albania (see
Section 1). In this paper we empirically test this hypothesis. If there were a free choice of
sector, individuals would choose the sector where they obtain a higher financial
satisfaction.10 In this case, one would expect individuals with a low private tax morale to
choose to work in the informal sector and those with a high private tax morale to work in
the formal sector. The former ones benefit financially from not paying taxes today and do
having a low tax morale if they answer ‘neither agree nor disagree’ (3), ‘mildly disagree’ (4), or ‘strongly disagree’ (5). The frequency distribution of private tax morale based on the original scale is: 82% strongly agree with the statement, 11% mildly agree, 4% are neutral, 1% mildly disagree, and 2% strongly disagree. For public tax morale, this distribution is 68%, 17%, 9%, 3% and 3%, respectively. 10 For a theoretical model in which occupational choice depends on risk attitudes, see Pestieau and Possen (1991).
10
not perceive any future consequences of it. For the latter, the opposite is true. We ran a
Probit regression to explain the individual probability of working in the informal sector by
individual private tax morale. The results show that the private tax morale has a very small
and insignificant effect on the probability of working in the informal sector. In other
words, whether an individual has a low or high tax morale does not have any influence on
her or his decision to work in the (in)formal sector. This indicates that individuals do not
self-select themselves into one of the two sectors.
In addition, one may argue that although individuals do not freely self-select into
one sector, their participation in the informal sector may depend on income-earnings’
options elsewhere. We have two variables to test for this in our data set, namely: the
number of household members who have a paid job (or a dummy variable indicating that
there is more than one household member working), and the number of family members
living abroad who financially support the individual. One would expect that individuals
without any alternative sources of income would have a higher probability to be in the
informal sector. A probit analysis of the probability of working in the informal sector
however shows that the effect of both variables is statistically insignificant even when
including private tax morale in the estimation.
A second source of sample selection bias may be driven by the demand side. For
example, when individuals with certain characteristics, such as low education and skills,
are chosen less often to work in the formal sector. Looking at our sample we cannot
exclude this option as people with higher education have a statistically significant lower
probability to be working in the informal sector. This may lead to an inconsistent estimate
of the effect of informal sector on financial satisfaction if education would co-determinate
both, working in the informal sector and the level of financial satisfaction. This would be
the case if lower educated individuals would not only have a higher probability to work in
the informal sector but would also have a set of unobservable characteristics (such as
reduced social network and capacity to deal with adversities) that correlate negatively with
financial satisfaction. One would correct for this possible source of endogeneity by using
instrument variables.11 Some studies use human capital characteristics to estimate both the
selection mechanism and the main equation. They do that by using different specifications
of the education variables, which may lead to bias results (Dustmann and van Soest,
1998). Moreover, it is difficult to believe that education does not affect financial
11 If we were to have panel data, we could alternatively apply a fixed effects model.
11
satisfaction in other ways than through the probability of working in the formal sector.
Thus, as Dustmann and van Soest (1998) conclude regarding selection between private
and public sector: “…correcting for nonrandom selection is important, but is only useful if
appropriate instrumental variables are available which play a role in the selection
mechanism, but can be excluded from the wage equation.” (p. 1419). Next to education,
other authors have instrumentalized the sector choice by, among others, the region of
origin, gender, age, number of children and other household structure variables (Gindling,
1991; Magnac, 1991). In our data set, many of these variables proved not to have any
effect on the sector selection. In addition, age, gender and being married suffer from the
same weaknesses as education. One could also exploit geographic variation (see Beuran
and Kalugina, 2006), time variation (de Holanda and Filho, 2005), or information on
parent’s occupation or education (e.g., Dustman and van Soest, 1998). Given the cross-
sectional nature of our data set and its restriction to individuals located in only one region,
we do not posses such instruments. Therefore, the best we can do is to look at the effect of
working in the informal sector on financial satisfaction while controlling for those
observable characteristics that differ between individuals in the formal and informal
sector. Next to having lower education, being a woman, older, and having emigrating to
Tirana from rural areas also increase the probability of being in the informal sector. These
variables will be included in the financial satisfaction equation.
2.5. The data
The analysis is based on data collected in a field survey conducted by one of the authors in
2000, in the urban area of Tirana, the capital of Albania. The method applied is the ‘self-
administered questionnaire’, which combines personal contacts with written
questionnaires. The survey sample consisted of 1,500 households living in Tirana, which
represented about 1.1% of Tirana households in 2000. The sampling was random and
based on a geographical framework, covering the five –more or less equally sized– regions
of urban Tirana. The main income earner of the household was asked to respond to all the
questions. The response rate of 89.3% gave 1,340 valid questionnaires returned.12
Gërxhani (2007) discusses the representativeness of the data collected by comparing its
results to the most recent survey with comparable data by the Albanian Institute of
Statistics (INSTAT). From the comparison, it appears that the average age of the
12 The complete questionnaire can be found in Gërxhani (2002; 2007) and can be provided upon request.
12
respondents, average size of the household, percentage of children in the household, and
gender division of adult members in the household are very similar in the two surveys.
Hence, it is concluded that the data collected in 2000 are to a large extent representative of
Tirana households. For a more detailed description of the data collection method, see
Gërxhani (2007).
The data contain information about individual self-reported financial satisfaction
on a 0 to 10 scale. The sample average equals 3.37, which is very low compared to the two
most well known data sets utilizing this question, that is, financial satisfaction scores in
the United Kingdom and Germany (see van Praag and Ferrer-i-Carbonell, 2004, chapter
3). However, the low score of Financial Satisfaction in Albania compares very well to the
level of subjective welfare reported in the Albanian LSMS data set of the World Bank
(2003).
Our data set also provides information on the sector in which individuals work. This
is used to distinguish between individuals working in the formal and informal sectors.
Respondents were asked to report their working sector from a list of seven categories (e.g.,
public sector, private sector (with and without labor contract), self-employment). This
information was combined with other available information on reported tax payments
(e.g., (non)payment of personal income tax or small business tax). In the sample, 24.6% of
the respondents work in the informal sector. 13 Individuals with more than one job (this is
13% of the sample) are classified as working in the formal sector if at least one of their
jobs is in this sector.14 In addition, the data contain information on individuals’ socio-
economic and demographic characteristics (e.g., age, gender, and education), household
monthly net income, taxes, and other information relevant for a transition country like
Albania (e.g., the number of family members living abroad who support the family
financially). Finally, the data provide information on individual attitudes to various
statements related to paying taxes. Two of these attitudinal questions are used to study the
importance of tax morale in explaining the relationship between working in the (in)formal
sector and subjective welfare (cf. section 2.3). In a study of tax evasion, Gërxhani (2004a)
13 Note that there are no other comparable data sources that measure the underground economy in Albania through informal employment. 14 This is because by having at least one job in the formal sector, they have the right to social benefits. The regression analysis (below) corrects, nevertheless, for having more than one job by including a dummy variable (“moonlighting”), which takes value 1 if an individual has more than one job and 0 otherwise. Note that classifying these individuals as being in the informal sector produces qualitatively very similar results to the ones presented here.
13
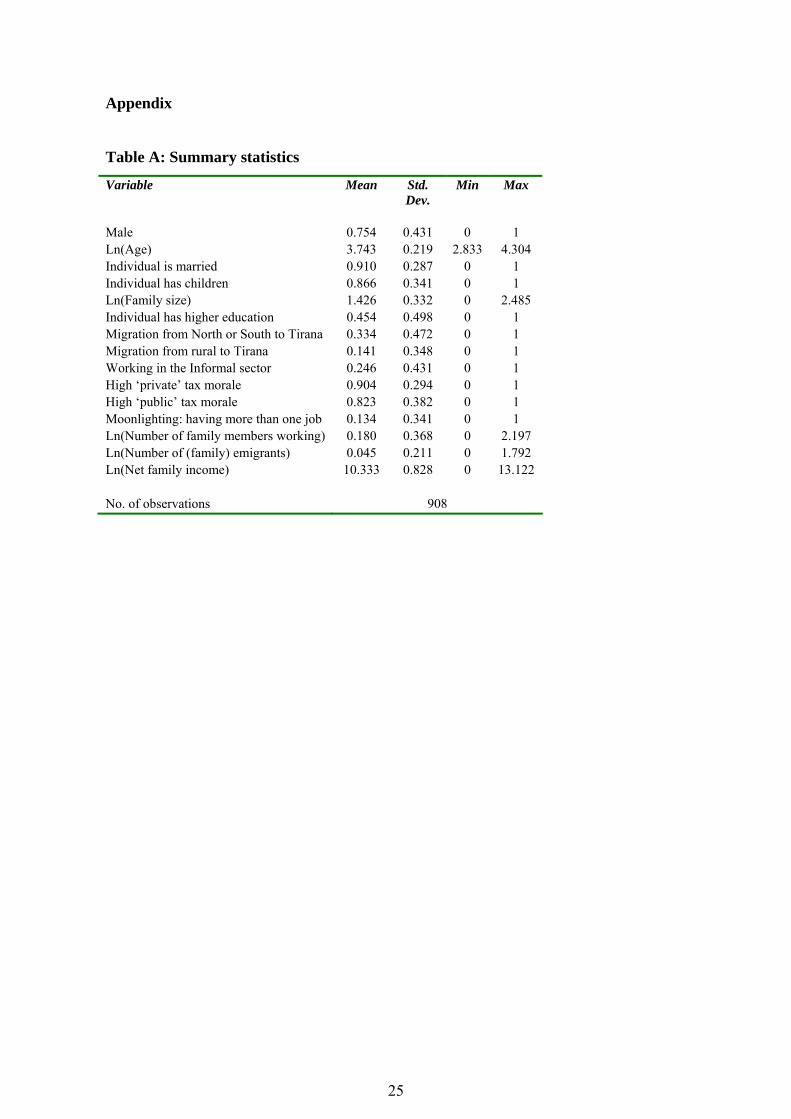
uses these and other questions as a measure of tax morale. For the descriptive statistics of
the variables used in the analysis, see table A in the Appendix.
3. Results The presentation of the results is split in three parts. First, financial satisfaction is
explained by whether or not an individual works in the informal sector, by the household
monthly net income, and by a large set of socio-economic and demographic variables (cf.
Equation (1)). Second, the analysis proceeds by distinguishing between various groups of
individuals based on their tax morale (cf. Equation (2)). Finally, the individual financial
satisfaction related to working in the informal sector is evaluated in terms of income.
3.1. Financial satisfaction and the (in)formal sector
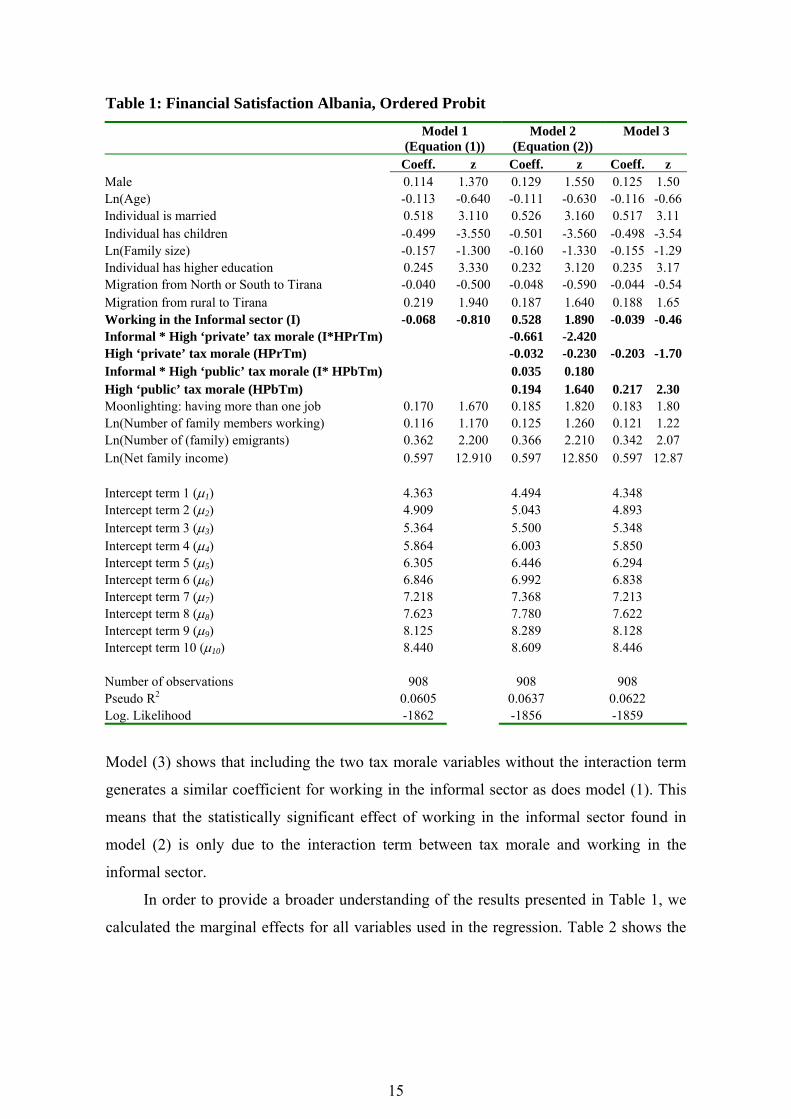
Table 1 presents the estimation results for equation (1) in columns 2 and 3. These are to a
large extent consistent with the existing literature on countries in transition (see Ravallion
and Lokshin, 2002; and van Praag and Ferrer-i-Carbonell, 2004). On the one hand, the
explanatory variables “male”, “married”, “higher education”, and “net family income”
have a positive coefficient, although “male” non-significantly so. On the other hand, the
coefficients for “having children” and “family size” show a negative sign, although the
last coefficient is non-significant.
Albania has its own particularities, however, which relate to its transitory phase of
development. They involve the following: having (and being financially supported by)
family members living abroad has a positive coefficient; having lived in a rural area before
transition also affects financial satisfaction positively (this may capture a comparison
effect with the past); and having more than one job also has a positive coefficient
(although only significant at 10%).
Finally, the empirical analysis shows that the coefficient for working in the informal
sector is negative but not statistically significant. Below we show that this non-significant
coefficient is a weighted average across two groups of individuals for whom working in
the informal sector has a different impact on their financial satisfaction. By correcting for
individuals’ tax morale, the effect of working in the informal sector on financial
satisfaction will become statistically strong.
14
3.2. Financial satisfaction and tax morale
The fourth and fifth columns of table 1 present the estimation results for equation (2).15
The analysis shows that for individuals with a high private tax morale, working in the
informal sector correlates negatively with financial satisfaction. The total coefficient for
these individuals is –0.132 (=0.528-0.661). These two coefficients are both statistically
significant at about 6% and 2%, respectively. For those individuals with a low private tax
morale, the coefficient between being in the informal sector and financial satisfaction is
positive (0.528). This group represents a minority (10% of the sample). The test of joint
significance of these coefficients (or any combination of them) gives a χ2 always larger
than 5, indicating statistical significance.
These results imply that Model 1 was unable to distinguish between two types of
individuals whose effect of working in the informal sector on their financial satisfaction is
very strong and distinct. In the regression analysis, individuals working in the formal
sector are the reference group. Thus, ceteris paribus, the financial satisfaction from
working in the formal sector is lower than that of working in the informal sector in case of
a low private tax morale. The effect of the dummy variable indicating a high private tax
morale is insignificant and very small. Also the interaction term between working in the
informal sector and a high public tax morale is not significant and very small. This means
that the effect of working in the informal sector on financial satisfaction does not seem to
depend on the individual public tax morale. The dummy variable reflecting individual
high public tax morale is positively correlated with financial satisfaction, although only
significant at the 10% level. These results imply that the effect of public tax morale on
financial satisfaction is positive for all individuals, regardless of whether they work in the
formal or informal sector. For individuals working in the formal sector, the economic
burden of paying taxes may (as argued above) be compensated by the ‘warm glow’ effect
of contributing to a public good. For individuals working in the informal sector, and thus
not paying taxes, the positive coefficient may result from a free riding effect.
15 The coefficients of all variables included in both models are almost identical.
15
Table 1: Financial Satisfaction Albania, Ordered Probit
Model 1
(Equation (1)) Model 2
(Equation (2)) Model 3
Coeff. z Coeff. z Coeff. z Male 0.114 1.370 0.129 1.550 0.125 1.50 Ln(Age) -0.113 -0.640 -0.111 -0.630 -0.116 -0.66Individual is married 0.518 3.110 0.526 3.160 0.517 3.11 Individual has children -0.499 -3.550 -0.501 -3.560 -0.498 -3.54Ln(Family size) -0.157 -1.300 -0.160 -1.330 -0.155 -1.29Individual has higher education 0.245 3.330 0.232 3.120 0.235 3.17 Migration from North or South to Tirana -0.040 -0.500 -0.048 -0.590 -0.044 -0.54Migration from rural to Tirana 0.219 1.940 0.187 1.640 0.188 1.65 Working in the Informal sector (I) -0.068 -0.810 0.528 1.890 -0.039 -0.46Informal * High ‘private’ tax morale (I*HPrTm) -0.661 -2.420 High ‘private’ tax morale (HPrTm) -0.032 -0.230 -0.203 -1.70Informal * High ‘public’ tax morale (I* HPbTm) 0.035 0.180 High ‘public’ tax morale (HPbTm) 0.194 1.640 0.217 2.30 Moonlighting: having more than one job 0.170 1.670 0.185 1.820 0.183 1.80 Ln(Number of family members working) 0.116 1.170 0.125 1.260 0.121 1.22 Ln(Number of (family) emigrants) 0.362 2.200 0.366 2.210 0.342 2.07 Ln(Net family income) 0.597 12.910 0.597 12.850 0.597 12.87 Intercept term 1 (µ1) 4.363 4.494 4.348 Intercept term 2 (µ2) 4.909 5.043 4.893 Intercept term 3 (µ3) 5.364 5.500 5.348 Intercept term 4 (µ4) 5.864 6.003 5.850 Intercept term 5 (µ5) 6.305 6.446 6.294 Intercept term 6 (µ6) 6.846 6.992 6.838 Intercept term 7 (µ7) 7.218 7.368 7.213 Intercept term 8 (µ8) 7.623 7.780 7.622 Intercept term 9 (µ9) 8.125 8.289 8.128 Intercept term 10 (µ10) 8.440 8.609 8.446 Number of observations 908 908 908 Pseudo R2 0.0605 0.0637 0.0622 Log. Likelihood -1862 -1856 -1859
Model (3) shows that including the two tax morale variables without the interaction term
generates a similar coefficient for working in the informal sector as does model (1). This
means that the statistically significant effect of working in the informal sector found in
model (2) is only due to the interaction term between tax morale and working in the
informal sector.
In order to provide a broader understanding of the results presented in Table 1, we
calculated the marginal effects for all variables used in the regression. Table 2 shows the
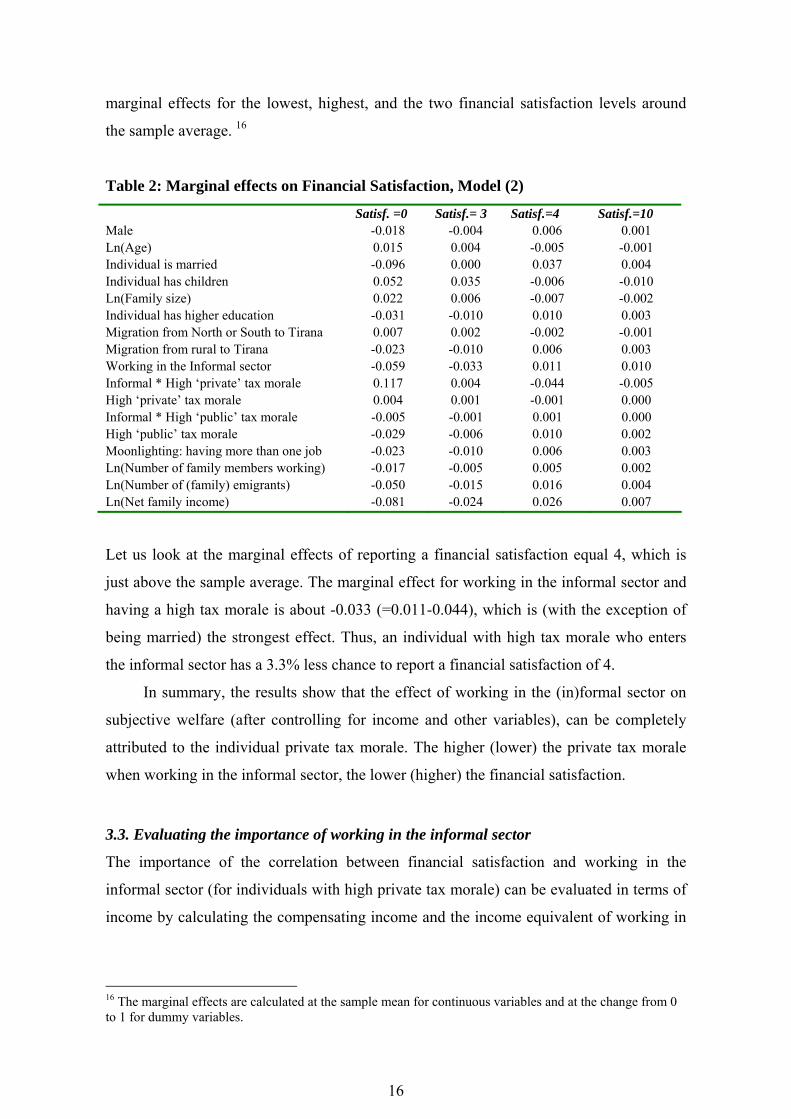
16
marginal effects for the lowest, highest, and the two financial satisfaction levels around
the sample average. 16
Table 2: Marginal effects on Financial Satisfaction, Model (2)
Satisf. =0 Satisf.= 3 Satisf.=4 Satisf.=10 Male -0.018 -0.004 0.006 0.001 Ln(Age) 0.015 0.004 -0.005 -0.001 Individual is married -0.096 0.000 0.037 0.004 Individual has children 0.052 0.035 -0.006 -0.010 Ln(Family size) 0.022 0.006 -0.007 -0.002 Individual has higher education -0.031 -0.010 0.010 0.003 Migration from North or South to Tirana 0.007 0.002 -0.002 -0.001 Migration from rural to Tirana -0.023 -0.010 0.006 0.003 Working in the Informal sector -0.059 -0.033 0.011 0.010 Informal * High ‘private’ tax morale 0.117 0.004 -0.044 -0.005 High ‘private’ tax morale 0.004 0.001 -0.001 0.000 Informal * High ‘public’ tax morale -0.005 -0.001 0.001 0.000 High ‘public’ tax morale -0.029 -0.006 0.010 0.002 Moonlighting: having more than one job -0.023 -0.010 0.006 0.003 Ln(Number of family members working) -0.017 -0.005 0.005 0.002 Ln(Number of (family) emigrants) -0.050 -0.015 0.016 0.004 Ln(Net family income) -0.081 -0.024 0.026 0.007
Let us look at the marginal effects of reporting a financial satisfaction equal 4, which is
just above the sample average. The marginal effect for working in the informal sector and
having a high tax morale is about -0.033 (=0.011-0.044), which is (with the exception of
being married) the strongest effect. Thus, an individual with high tax morale who enters
the informal sector has a 3.3% less chance to report a financial satisfaction of 4.
In summary, the results show that the effect of working in the (in)formal sector on
subjective welfare (after controlling for income and other variables), can be completely
attributed to the individual private tax morale. The higher (lower) the private tax morale
when working in the informal sector, the lower (higher) the financial satisfaction.
3.3. Evaluating the importance of working in the informal sector
The importance of the correlation between financial satisfaction and working in the
informal sector (for individuals with high private tax morale) can be evaluated in terms of
income by calculating the compensating income and the income equivalent of working in
16 The marginal effects are calculated at the sample mean for continuous variables and at the change from 0 to 1 for dummy variables.
17
the formal sector (for similar approaches see Blanchflower and Oswald, 2004; and Ferrer-
i-Carbonell and van Praag, 2002).
From equation (2) we can derive the income necessary to compensate an individual
with a high tax morale for the loss of satisfaction due to working in the informal sector:
ln 1 exp( ) 1y yγ ϕ γ ϕβ β+ +
∆ = − ⇒ ∆ = −
The income necessary to compensate an individual with a low tax morale for the loss of
satisfaction due to working in the informal sector equals:
ln 1 exp( ) 1y yγ γβ β
∆ = − ⇒ ∆ = −
The equivalent loss is the reciprocal of the compensating income.
Combining the estimated coefficients with these relationships indicates that an
individual with a high private tax morale moving from the formal to the informal sector
would experience a satisfaction loss equivalent to 16.1% of his or her income. The
(compensating) income necessary to bring this individual back to the initial level of
satisfaction is a 19.2% income increase. These results show the relevance for financial
satisfaction of moving from the formal to the informal sector.
4. Conclusions This paper studies the relationship between working in the formal or informal sector and
subjective welfare in a country in transition. Distinguishing between two types of
individuals based on their attitudes towards taxes, the results show that, for most
individuals, working in the informal sector has negative effects on their subjective welfare.
Remarkably, some individuals who work in the informal sector are financially even more
satisfied than their counterparts in the formal sector. The differentiating characteristic of
these individuals is that they demonstrate a low private tax morale, i.e, they disagree that
not paying taxes today has personal financial repercussions in the future.
Comparative studies of individuals working in the formal and informal sectors have
mainly focused on the income differential between the two sectors. Even when other
aspects like ease of entry and social exclusion are theoretically recognized, it has remained
an open question what the effect of working in the formal or informal sector is on an
18
individual's welfare. 17 This paper contributes to the literature by providing an empirical
answer to this question.
17 For example, in their study on Nicaragua, Pisani and Pagán (2003) presume that the willingness to queue for a formal sector job might be related to pecuniary and nonpecuniary benefits associated with the formal sector jobs that matter to informal sector workers.
19
References
Allingham, M.G., and Sandmo, A. (1972). Income Tax Evasion: A Theoretical Analysis.
Journal of Public Economics, 1: 323- 38.
Alm, J., McClelland, G.H., and Schulze, W.D., 1992. Why do people pay taxes? Journal
of Public Economics, 48: 21-38.
Alm, J. and B. Torgler, 2005. Estimating the Determinants of Tax Morale. National Tax
Association Papers and Proceedings (Minneapolis 2004): 269-274.
Alm, J. and B. Torgler, 2006. Culture Differences and Tax Morale in the United States and
Europe, Journal of Economic Psychology. 27: 224-246.
Alm, J., I. Sanchez, and A. de Juan, 1995. Economic and noneconomic factors in tax
compliance. Kyklos, 48: 3-18.
Alm, J., J. Martinez-Vazquez, and B. Torgler, 2006. Russian Attitudes Toward Paying
Taxes – Before, During, and After the Transition, International Journal of Social
Economics. 33: 832-857.
Andreoni, J., 1990. Impure altruism and donations to public goods: A theory of warm-
glow giving. The Economic Journal, 100 (401): 464-477.
Banerjee, N. (1982). Survival of the Poor. In Safa, H.I. (Ed.), Towards a Political
Economy of Urbanization in Third World Countries, 175-88. Delhi, Oxford University
Press, Bombay Calcutta Madras.
Becker, W., Büchner, H.-J., and Sleeking, S., 1987. The impact of public transfer
expenditures on tax evasion: An experimental approach, Journal of Public Economics,
34: 243-252.
Beqja, I., 2002. Restructuring of the pension system in South Eastern Europe. Working
paper. Ljubljana.
Beuran, M. and Kalugina, E., 2006. Social exclusion and the informal sector: the case of
Russia. Work in progress Centre d’Economie de la Sorbonne, Université de Paris 1.
Blanchflower, D. and Oswald, A.J., 2004. Well-Being Over Time in Britain and the USA.
Journal of Public Economics, 88: 1359-1386.
Bourguignon, F., 1979. Pobreza y Dualismo en el Sector Urbano de las Economias en
Desarrollo: El Caso de Colombia. Desarrollo y Sociedad, January.
Bradburn, N.M., 1969. The structure of psychological well-being. Aldine Publishing
Company, Chicago.
20
Cantril, H., 1965. The pattern of human concerns. Rutgers University Press, New
Brunswick.
Charmes, J., 1990. A critical review of concepts, definitions and studies in the informal
sector. In: Turnham, D., Salome, B., and Schwarz, S., (eds.). The informal sector
revisited. OECD, Paris, pp: 10-49
Clark, A. E. and Oswald, A. J., 1994. Unhappiness and unemployment. Economic Journal,
104: 648-659.
Cowell, F. (1990). Cheating the Government. Cambridge: MIT Press.
Cummings, R., Martinez-Vazquez, J., McKee, M. and Torgler, B., 2004. Effects of culture
on tax compliance: A cross check of Experimental and survey evidence. Paper
presented at the Meetings of the Public Choice Society, Baltimore, March 11-14, 2004.
De Grazia, R., 1982. Clandestine employment: A problem of our times. In: Tanzi, V. (ed.),
The Underground Economy in the United States and Abroad. Lexington D.C. Heath.
de Holanda, F. and Filho, B., 2005. Labor Legislation and the Size of Informal Sector in
Brazil. Working paper.
DiTella, R., R.J. MacCulloch and A.J. Oswald, 2001. Preferences over Inflation and
Unemployment: Evidence from Surveys of Subjective Well-being. American Economic
Review, 91: 335 -341.
Dustmann, C. and Van Soest, C., 1998. Public and private sector wages of male workers
in Germany. European Economic Review. 42: 1417-1441.
Easterlin, R.A., 2001. Income and happiness: Towards a unified theory. The Economic
Journal, 111: 465-484.
Feige, E.L., 1990. Defining and estimating underground and informal economies: The new
institutional economics approach. World Development 18 (7): 989-1002
Feld, L.P. and Frey, B.S., 2002. Trust breeds trust: How taxpayers are treated. Economics
of Governance, 3: 87-99.
Feld, L. and B. Torgler, 2006. Tax Morale in Germany in the 90s, National Tax
Association Papers and Proceedings,.
Ferrer-i-Carbonell, A. and B.M.S. van Praag, 2002. The subjective costs of health losses
due to chronic diseases. An alternative model for monetary appraisal. Health
Economics, 11: 709-722.
Ferrer-i-Carbonell, A. and P. Frijters, 2004. How important is methodology for the
estimates of the determinants of happiness? The Economic Journal, 114: 641-659
21
Ferrer-i-Carbonell, A., 2005. Income and Well-Being: An Empirical Analysis of the
Comparison Income Effect. Journal of Public Economics, 89: 997-1019.
Fields, G.S., 1990. Labor market modeling and the urban informal sector: Theory and
evidence. In: Turnham, D., Salome, B., and Schwarz, S., (eds.). The informal sector
revisited. OECD, Paris, pp: 49-69.
Frey, B. and A. Stutzer; 2002. What Can Economists Learn from Happiness Research?
Journal of Economic Literature 40: 402-435.
Frey, B.S., 1989. How Large (or Small) should the Underground Economy be? In: Feige
(eds.). The Underground Economy: Tax Evasion and Information Distortion.
Cambridge University Press, pp. 111-29.
Frijters, P., J.P. Haisken-DeNew, and M. A. Shields. 2004. Money Does matter! Evidence
from increasing real incomes and life satisfaction in East Germany following
reunification. American Economic Review, 94(3), pp. 730-741.
Garner, T.I. and K.S. Short, 2003. Personal Assessments of Minimum Income and
Expenses: What Do They Tell Us about 'Minimum Living' Thresholds and Equivalence
Scales? In: Y. Amiel and J.S. Bishop (eds.), Inequality, welfare and Povery: Theory
and measurement, vol. 9. Elsevier Science: The Netherlands.
Gërxhani, K. and A. Schram, 2006. Tax evasion and income source: A comparative
experimental study. Journal of Economic Psychology, 27(3): 402-422.
Gërxhani, K., 2002. The informal sector in transition: Tax evasion in an institutional
vacuum, Ph.D. thesis, University of Amsterdam, Tinbergen Institute Research Series,
no. 265, University of Amsterdam, Amsterdam.
Gërxhani, K., 2004a. Tax evasion in transition: Outcome of an institutional clash? Testing
Feige’s conjecture in Albania. European Economic Review, 48: 729-745.
Gërxhani, K., 2004b. The informal sector in developed and less developed countries: A
literature survey. Public Choice, 120 (3-4): 267-300.
Gërxhani, K., 2007. “Did you pay your taxes?” How (not) to conduct tax evasion surveys
in transition countries. Social Indicators Research, 80: 555-581.
Gindling, T.H., 1991. Labor Market Segmentation and the Determination of Wages in the
Public, Private-Formal, and Informal Sectors in San Jose, Costa Rica, Economic
Development and Cultural Change, 39: 585-606.
Gustafsson, B., L. Shi, and H. Sato, 2004. Can a subjective poverty line be applied to
china? Assessing poverty among urban residents in 1999. Journal of International
Development: 16: 1089-1107.
22
Hansson, I., 1982. The Underground economy in a high tax country: The case of Sweden.
In: Tanzi, V. (ed.). The Underground Economy in the United States and Abroad.
Lexington D.C. Heath.
Heckman, J.J., and V. J. Hotz. 1986. An Investigation of the Labor Market Earnings of
Panamanian Males: Evaluating the Sources of Inequality. Journal of Human Resources
21:507-542
Jung, Y.H., Snow, A., and Trandel, G.A., 1994. Tax evasion and the size of the
underground economy, Journal of Public Economics, 54: 391-402.
Kahneman, D., E. Diener, and N. Schwarz (eds.), 1999. Foundations of Hedonic
Psychology: Scientific Perspectives on Enjoyment and Suffering. Russell Sage
Foundation, New York.
Kapteyn, A., 1994. The Measurement of Household Cost Functions: Revealed Preference
versus Subjective Measures. Journal of Population Economics, 7: 333-350.
Kapteyn, A., P.Kooreman and R.J. Willemse, 1988. Some methodological issues in the
implementation of subjective poverty definitions, Journal of Human Resources, 23:
222-242.
Kesner-Skreb, M., 1997. The unofficial economy and development”, paper presented in
the international workshop ‘The importance of unofficial economy in economic
transition’, 16-17 May 1997, Zagreb, Croatia.
Kugler, B., Reyes, A. and de Gomez, M.I., 1979. Educacion y Mercado de Trabajo
Urbano en Colombia. Bogota, Corporacion Centro regional de Poblacion.Maddala,
G.S., 1983. Limited-dependent and qualitative variables in econometrics. Cambridge
University Press, Cambridge: UK.
Maddala, G. (1983). Limited-Dependent and Qualitative Variables in Econometrics,
Cambridge University Press, Cambridge.
Magnac. T., 1991. Segmented or Competitive Labor Markets, Econometrica, 59:165-187.
Marcouiller, D., de Castilla, VR, and Woodruff, C., 1997. Formal measures of the
informal-sector wage gap in Mexico, El Salvador, and Peru. Economic Development
and Cultural Change, 45: 367
Merrick, T.W., 1976. Employment and Earnings in the Informal Sector in Brazil: The
Case of Belo Horizonte. Journal of Developing Areas, April.
Ng, Y-K., 1997. A Case for Happiness, cardinalism, and interpersonal comparability. The
Economic Journal, 107: 1848-1858.
23
Oswald, A.J., 1997. Happiness and economic performance. The Economic Journal, 107:
1815-1831.
Pestieau, P, and Possen, U.M., 1991. Tax evasion and occupational choice, Journal of
Public Economics, 45: 107-125.
Pisani, M.J. and J.A. Pagán, 2003. Sectoral Queuing in a Transitional Economy: The Case
of Nicaragua in the 1990s. Labour, 17: 571-597.
Praag, van B.M.S. and A. Ferrer-i-Carbonell, 2004. Happiness Quantified: A Satisfaction
Calculus approach. Oxford University Press, Oxford: UK.
Praag, van B.M.S. and P. Frijters, 1999. The measurement of welfare and well-being; the
Leyden approach. In: D. Kahneman, E. Diener and N. Schwarz (eds.). Foundations of
hedonic psychology: scientific perspectives on enjoyment and suffering. Russel Sage
Foundation, New York. Chapter 21.
Praag, van B.M.S., 1971. The welfare function of income in Belgium: an empirical
investigation. European Economic Review, 2: 337-369.
Praag, van B.M.S., Flik, R.J., and Stam, P.J.A.,1997. Poverty lines and equivalence scales:
a theoretical and empirical evaluation. In: Keilman, N., Lyngstad, H.B., and Thomsen,
I. (Eds.), Poverty and Economic Inequality in Industrialized Western Societies.
Scandinavian UP, Oslo.
Praag, van BMS, P. Frijters and A. Ferrer-i-Carbonell, 2003. The anatomy of well-being.
Journal of Economic Behavior and Organization, 51: 29-49.
Pradhan, M and M. Ravallion, 2000. Measuring poverty using qualitative perceptions of
consumption adequacy. Review of Economics and Statistics, 82: 462-471.
Pradhan, M. and A. van Soest, 1995. Formal and informal sector employment in urban
areas. of Bolivia, Labour Economics, 2: 275-297.
Ravallion, M. and M. Lokshin, 2002. Self-rated economic welfare in russia, European
Economic Review, 46: 1453-1473.
Renooy, P.H., 1990. The informal economy: Meaning, measurement and social
significance. Netherlands Geographical Studies. Amsterdam.
Schneider, F. (2005). Shadow economies around the world. What do we really know?,
European Journal of Political Economy, 21: 598-642.
Schneider, F. and Enste, D.H., 2000. Shadow Economies: Size, Causes and Consequences.
Journal of Economic Literature 38(1): 77-114.
Schneider, F. and Enste, D.H., 2003. The Shadow Economy: An International Survey.
Cambridge: Cambridge University Press.
24
Schroyen F., 1997. Pareto efficient income taxation under costly monitoring, Journal of
Public Economics, 65: 343-366
Senik, C. 2004. What Can we Learn from Subjective Data? The Case of Income and Well-
Being, Forthcoming in Journal of Economic Surveys.
Thomas, J.J, 1990. Synthesis of Comments and Discussion: Methodology and Theory. In:
Turnham, D., Salome, B., and Schwarz, S., (eds.). The informal sector revisited.
OECD, Paris
Torgler, B. and F. Schneider, 2005. What shapes the attitudes towards paying taxes?
Evidence from Switzerland, Belgium and Spain. CREMA Working Paper 2005-06,
Basel, Switzerland.
Torgler, B., 2003. Tax morale in transition countries. Post-communist Economies, 15:
357- 381.
Torgler, B. and F. Schneider, 2006. Shadow Economy, Institutions and Tax Morale,
National Tax Association Papers and Proceedings.
Watson, H.S., 1985, Tax Evasion and Labor Markets. Journal of Public Economics, 27:
231–246
Wilson, W., 1967. Correlates of avowed happiness. Psychological Bulletin, 67: 294-306.
World Bank, 2003. Albania: Poverty assessment. Report no. 26213-AL, The World Bank.
Yitzhaki, S. (1974). Income Tax Evasion: a Theoretical Analysis. Journal of Public Economics 3: 201-2.
25
Appendix
Table A: Summary statistics
Variable Mean Std. Dev.
Min Max
Male 0.754 0.431 0 1 Ln(Age) 3.743 0.219 2.833 4.304 Individual is married 0.910 0.287 0 1 Individual has children 0.866 0.341 0 1 Ln(Family size) 1.426 0.332 0 2.485 Individual has higher education 0.454 0.498 0 1 Migration from North or South to Tirana 0.334 0.472 0 1 Migration from rural to Tirana 0.141 0.348 0 1 Working in the Informal sector 0.246 0.431 0 1 High ‘private’ tax morale 0.904 0.294 0 1 High ‘public’ tax morale 0.823 0.382 0 1 Moonlighting: having more than one job 0.134 0.341 0 1 Ln(Number of family members working) 0.180 0.368 0 2.197 Ln(Number of (family) emigrants) 0.045 0.211 0 1.792 Ln(Net family income) 10.333 0.828 0 13.122 No. of observations 908