Embed Size (px)
Citation preview
* Fabio Blanco-Mesa
Extended author information available on the last page of the article
Subjective stakeholder dynamics relationships treatment: a methodological approach using fuzzy decision-making
Fabio Blanco-Mesa1 · Anna María Gil-Lafuente2 · José M. Merigó3
Abstract
Since the stakeholder theory was proposed to explain the interaction among its
agents, extensive approaches have been developed. However, the literature contin-
ues to suggest the development of new methodologies that allow an analysis of the dynamics and uncertainty of the relationships between each agent. In this sense, this
research proposes a novel methodology for the treatment of subjective stakeholder dynamics using fuzzy decision-making. The study proposes a mathematical meth-
odological perspective for the treatment of subjective relationships among stake-
holders, which allows a predictive simulation tool to be developed for attitude and
personal preferences to analyze the links among all stakeholders. A mathematical
application is developed to help the decision-making process in uncertainty concern-
ing the ordering-according-to-their-importance and linking-of-relation algorithms,
which are based on notions of relation, gathering and ordering. A numerical exam-
ple is proposed to understand the method’s usefulness and feasibility. The results
approximate how stakeholder ambiguity and fuzziness can be managed considering
the decision-maker’s preference subjectivity. In addition, these results highlight the
different relationships among each stakeholder, their intensity levels, the incidence
linkage loops and the incidence relative on stakeholder behaviors. The main impli-
cation of this proposition is to deal with the subjective preferences provide by deci-
sion-maker to better interpret environmental and subjective factors. Furthermore, this
study contributes to the strategic planning and decision-making processes for
operative units within uncertain environment in the short term.
Keywords Fuzzy theory · Decision-making · Stakeholder dynamics · Subjectivity
and incidences
F. Blanco-Mesa et al.
1 Introduction
Stakeholder theory has been proposed to explain and identify relationships
among stakeholders (Wagner et al. 2011). Based on this theory, several analyti-
cal tools have been developed to explain stakeholder interactions. Tools for ana-
lyzing stakeholders have been focused on developing matrices, lists of criteria
and attributes to understand complexity and change (Ramirez 1999). Therefore,
several approaches are highlighted, such as, Instrumental (Freeman 1984, 2004,
2011; Donaldson and Preston 1995), strategy Mitchell et al. (1997), network
Rowley (1997), mental models Hjortsø et al. (2005) and so on. However, they
have problems defining boundaries and identifying relevant stakeholders (Ram-
irez 1999). Thus, these tools have been used to explain stakeholder relation-
ships through visual schemes and to comprehend, simplify and aggregate com-
plex information (Fassin 2007). Nevertheless, some of these models show only
a static representation and do not consider change over time, heterogeneity, or
static characteristics that have been criticized (Friedman and Miles 2002; Fassin
2009). In fact, stakeholders are structured by internal and external relationships,
which are always in a dynamic situation with important changes affecting organi-
zational results (Windsor 2011). Relationships between the interest groups differ,
since interactions differ depending on the power and the sensitivity of their influ-
ence, and not all have the same weight and participation (Fassin 2007). In these
sense, relationship structure are conformed by persons, where occur dynamic
situations that affects organizational results. These dynamics involve human rea-
soning; attitudes, perceptions, personal appraisals, notions, value judgments and
opinions have a high subjectivity and high degree of incidence on final decision-
making, i.e. the imperfections, heterogeneous and dynamic of relationships are
conditioned by human behavior. The relationships have a dynamic and uncertain
process; where the dynamic process implies a change in the relationship’s inter-
action among actors that participate in the firm’s environment and uncertainty
implies unexpected environmental facts, fuzzy boundaries and unclear levels of
organization. Hence, stakeholder relationships and their behavior are in complex,
uncertain and dynamic situation in which human reasoning is the key factor in the
imperfection and heterogeneity of them. Thus, it is suitable to use new perspec-
tives that taking into account dynamic and uncertain of the relationships based on
human rationality.
Under this perspective, in the fields of mathematics and information systems,
multiple methodologies have been proposed and developed that allow the treatment
of uncertainty and dynamic processes. One of these fields is fuzzy decision-making.
Studies on fuzzy decision-making stemmed from studies on the concepts of fuzzy
sets (Zadeh 1965), fuzzy environments (Bellman and Zadeh 1970), approximate
reasoning (Zadeh 1975a, b, c) and applications of fuzzy sets in decision systems
(Zimmermann 1986). These studies have provided several approaches that allow a
numerical process treatment of the decision-maker’s subjectivity and opinion.
Based on the above, this paper proposes a novel methodology for treating stake-
holder dynamics through a causal relationship. The methodology is developed
Subjective stakeholder dynamics relationships treatment:…
using two algorithms—an ordering-according-to-importance algorithm and a
linking-of-relations algorithm—both of which are based on notions of relation,
gathering and ordering (Gil-Aluja 1999). This mathematical tool allows the study
of intense and linked relationships1 (Gil-Aluja 1999) of all a stakeholders in an
organization. A numerical example is proposed to demonstrate the method’s use-
fulness and feasibility. In this case, the numerical example is focused on a math-
ematical assumption regarding the treatment of stakeholder relationships. The
numerical example’s results allow us to obtain the fuzzy subjective preference
and the relative intensity between each stakeholder. These results are depicted to
show the intensity of stakeholder importance and each stakeholder’s relational
ties in a firm’s entire structure. However, the model has some limitations because
it is a theoretical proposal; the data come from a mathematical assumption of
subjective preference and specific information, which are only valid in the short
term. This proposition’s main implication is to address the decision-maker’s sub-
jectivity to allow for a more accurate interpretation of environmental and subjec-
tive factors. Furthermore, this methodology allows for a holistic assessment of
the immediate firm’s environment.
This paper is structured as follows. First, the theoretical framework is composed
of dynamic relationships among stakeholders, which is the study’s main contribution
to fuzzy decision-making. Second, the methodology is defined using a mathematical
model, which refers to the comparison notion and the causality and incidence of the
relation concepts. Third, a mathematical application is proposed. Fourth, an illustra-
tive example, a mathematical application model, the main results and implication
and limitations are explained. Finally, the conclusions are presented.
2 Theoretical framework
2.1 Dynamic relationship of the stakeholders
Stakeholder theory has helped researchers understand the environments and rela-
tions of firms. This theory has sought to explain and predict how organizations
act by considering stakeholder influences (Wagner et al. 2011). Furthermore, it
has provided an account of how stakeholders act and seek to influence a firm’s
decision-making and behavior (Frooman 1999). In fact, stakeholder theory has
1 Intense and linked relations are defined as characteristics and properties of each relationship type.
Intensity considers that a connector agent is in the relationship, which allows an analysis of the con-
vergence of the limit, periodicity and non-standardized situations that are reflected in aspects such as
time, space and possible connections. Thus, relationships’ behavior can be observed as time passes or
a sequence happens, which can strengthen or weaken existing relationships or create new relationships.
Linked considers the graphical representations of the relationships in which the direct or indirect con-
nections are shown, i.e., the linked relationships among the different objects belonging to the graph are
established. Thus, variations can be analyzed in the relations’ intensities, levels or strengths to observe
the behavior and the links’ strengthening or degradation establishing the relationships in a period of time
or in a sequence of stages.
F. Blanco-Mesa et al.
been used to develop several analytical tools as part of the strategic management
approach to evaluate the environment and identify the relations among groups
that constitute stakeholders (Wagner et al. 2011). According to Ramirez (1999),
these tools have focused on developing matrices or lists of criteria or attributes
to understand stakeholders’ complex and ever-changing natures; however, these
tools have difficulty defining boundaries and identifying relevant stakeholders. In
this sense, from Freeman (1984), numerous stakeholder analysis approaches have
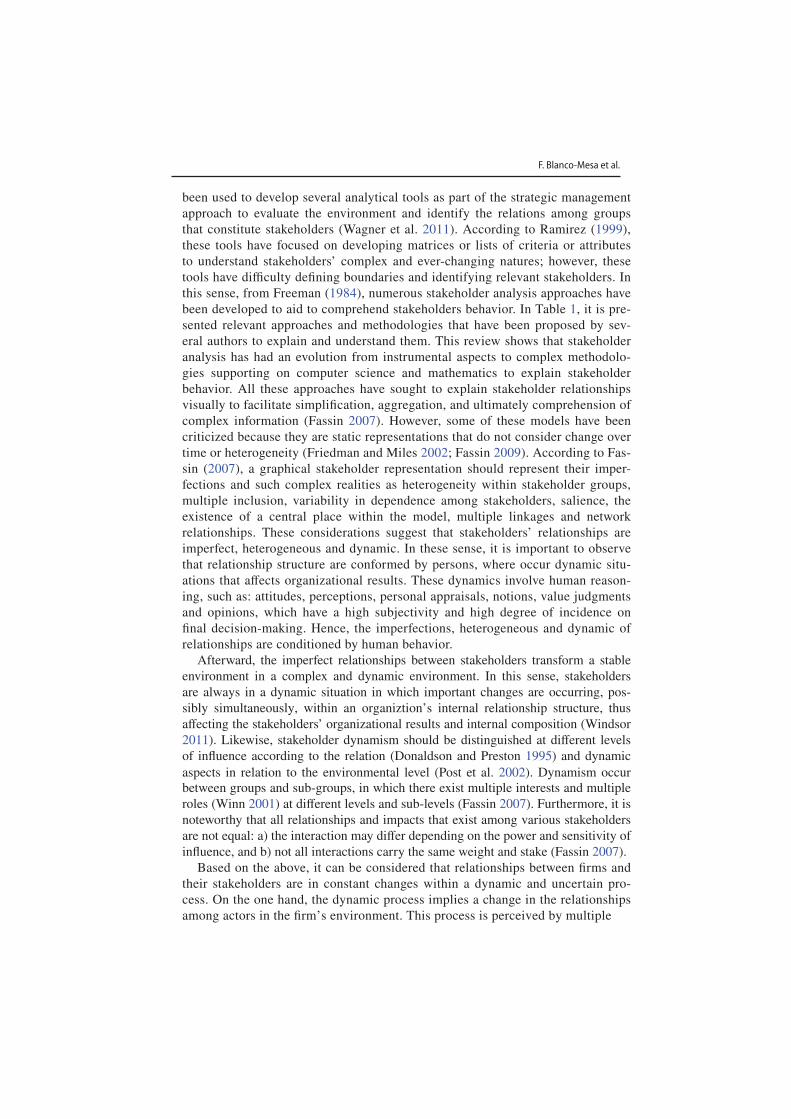
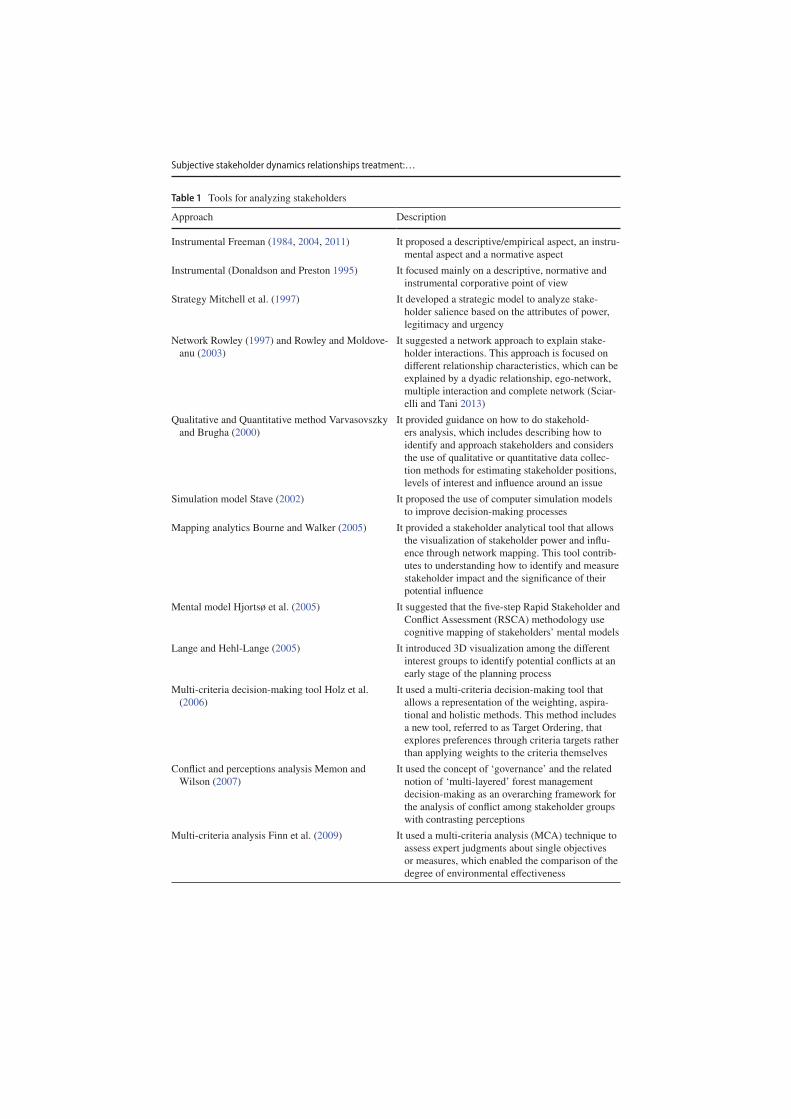
been developed to aid to comprehend stakeholders behavior. In Table 1, it is pre-
sented relevant approaches and methodologies that have been proposed by sev-
eral authors to explain and understand them. This review shows that stakeholder
analysis has had an evolution from instrumental aspects to complex methodolo-
gies supporting on computer science and mathematics to explain stakeholder
behavior. All these approaches have sought to explain stakeholder relationships
visually to facilitate simplification, aggregation, and ultimately comprehension of
complex information (Fassin 2007). However, some of these models have been
criticized because they are static representations that do not consider change over
time or heterogeneity (Friedman and Miles 2002; Fassin 2009). According to Fas-
sin (2007), a graphical stakeholder representation should represent their imper-
fections and such complex realities as heterogeneity within stakeholder groups,
multiple inclusion, variability in dependence among stakeholders, salience, the
existence of a central place within the model, multiple linkages and network
relationships. These considerations suggest that stakeholders’ relationships are
imperfect, heterogeneous and dynamic. In these sense, it is important to observe
that relationship structure are conformed by persons, where occur dynamic situ-
ations that affects organizational results. These dynamics involve human reason-
ing, such as: attitudes, perceptions, personal appraisals, notions, value judgments
and opinions, which have a high subjectivity and high degree of incidence on
final decision-making. Hence, the imperfections, heterogeneous and dynamic of
relationships are conditioned by human behavior.
Afterward, the imperfect relationships between stakeholders transform a stable
environment in a complex and dynamic environment. In this sense, stakeholders
are always in a dynamic situation in which important changes are occurring, pos-
sibly simultaneously, within an organiztion’s internal relationship structure, thus
affecting the stakeholders’ organizational results and internal composition (Windsor
2011). Likewise, stakeholder dynamism should be distinguished at different levels
of influence according to the relation (Donaldson and Preston 1995) and dynamic
aspects in relation to the environmental level (Post et al. 2002). Dynamism occur
between groups and sub-groups, in which there exist multiple interests and multiple
roles (Winn 2001) at different levels and sub-levels (Fassin 2007). Furthermore, it is
noteworthy that all relationships and impacts that exist among various stakeholders
are not equal: a) the interaction may differ depending on the power and sensitivity of
influence, and b) not all interactions carry the same weight and stake (Fassin 2007).
Based on the above, it can be considered that relationships between firms and
their stakeholders are in constant changes within a dynamic and uncertain pro-
cess. On the one hand, the dynamic process implies a change in the relationships
among actors in the firm’s environment. This process is perceived by multiple
Subjective stakeholder dynamics relationships treatment:…
Table 1 Tools for analyzing stakeholders
Approach Description
Instrumental Freeman (1984, 2004, 2011) It proposed a descriptive/empirical aspect, an instru-
mental aspect and a normative aspect
Instrumental (Donaldson and Preston 1995) It focused mainly on a descriptive, normative and
instrumental corporative point of view
Strategy Mitchell et al. (1997) It developed a strategic model to analyze stake-
holder salience based on the attributes of power,
legitimacy and urgency
Network Rowley (1997) and Rowley and Moldove-
anu (2003)
It suggested a network approach to explain stake-
holder interactions. This approach is focused on
different relationship characteristics, which can be
explained by a dyadic relationship, ego-network,
multiple interaction and complete network (Sciar-
elli and Tani 2013)
Qualitative and Quantitative method Varvasovszky
and Brugha (2000)
It provided guidance on how to do stakehold-
ers analysis, which includes describing how to
identify and approach stakeholders and considers
the use of qualitative or quantitative data collec-
tion methods for estimating stakeholder positions,
levels of interest and influence around an issue
Simulation model Stave (2002) It proposed the use of computer simulation models
to improve decision-making processes
Mapping analytics Bourne and Walker (2005) It provided a stakeholder analytical tool that allows
the visualization of stakeholder power and influ-
ence through network mapping. This tool contrib-
utes to understanding how to identify and measure
stakeholder impact and the significance of their
potential influence
Mental model Hjortsø et al. (2005) It suggested that the five-step Rapid Stakeholder and
Conflict Assessment (RSCA) methodology use
cognitive mapping of stakeholders’ mental models
Lange and Hehl-Lange (2005) It introduced 3D visualization among the different
interest groups to identify potential conflicts at an
early stage of the planning process
Multi-criteria decision-making tool Holz et al.
(2006)
It used a multi-criteria decision-making tool that
allows a representation of the weighting, aspira-
tional and holistic methods. This method includes
a new tool, referred to as Target Ordering, that
explores preferences through criteria targets rather
than applying weights to the criteria themselves
Conflict and perceptions analysis Memon and
Wilson (2007)
It used the concept of ‘governance’ and the related
notion of ‘multi-layered’ forest management
decision-making as an overarching framework for
the analysis of conflict among stakeholder groups
with contrasting perceptions
Multi-criteria analysis Finn et al. (2009) It used a multi-criteria analysis (MCA) technique to
assess expert judgments about single objectives
or measures, which enabled the comparison of the
degree of environmental effectiveness
F. Blanco-Mesa et al.
Table 1 (continued)
Approach Description
Q methodology Wolsink and Breukers (2010) It used Q methodology, which allows comparing
patterns in stakeholder views on institutional
conditions and changes in the domains of energy
policy, spatial planning and environmental policy
Influence perspective Fassin (2009, 2010) It developed a dynamic perspective of stakeholder
management in seeking to explain the influence
of social movements from the three stakeholder
categories of real stakeholders, stakewatchers and
stakekeepers to explain boundaries between firms
and the environmental influence
Interdependence analysis Windsor (2011) It studied multiple relations with greater degrees of
variation and the intensity of influence and power,
which are characterized by interaction and their
resulting mutual influence and interdependence,
interconnectedness, and interrelatedness
Complex environment Elias (2012) It developed a systemic dynamic methodology for
stakeholder analysis, which seeks to capture the
dynamic and complex nature of environmental
conflicts
Source own elaboration
relations that vary greatly and differ in intensities of influence and power (Post
et al. 2002; Fassin 2010; Windsor 2011).
Relationships are characterized by interaction and the resulting mutual influ-
ence and interdependence, interconnectedness, and interrelatedness (Waddock
2011; Windsor 2011). In turn, mutual influence is exerted by this interactivity, i.e.,
interactors have some ability to affect a factor that is core to their own or other
stakeholders’ status or change other factors (Waddock 2011). Hence, the nature of
their interdependence will help address the influence of environmental uncertainty
and determine the firm’s priorities [Harrison and St. John, 1996, see in (Fassin
2009)]. In contrast, uncertainty implies unexpected environmental fea-tures, fuzzy
boundaries and unclear levels of organization. First, relationships are affected by
environmental features (Windsor 2011), such as the local community and media,
among others (Wagner et al. 2011), which have a growing influence on firms’
decisions and actions. In fact, global events and social environments have ever-
greater power and influence, with managerial implications that affect stakeholder
relationships (Friedman and Miles 2002; Holzer 2007). Second, the boundaries
and level of firms’ environments within this dynamic are not clearly defined
because pressure groups and regulators occupy an ambiguous position.
Furthermore, organizational boundaries are becoming fuzzy through new forms of
cooperation (Fassin 2009). According to Fassin (2009, 2010), boundaries between
firms and their stakeholders and the environmental influence are difficult to
identify and define. Additionally, idiosyncratic factors exist particular to the
context that hinder such boundaries’ management and analysis (Fassin 2009).
Subjective stakeholder dynamics relationships treatment:…
Hence, it is shown that stakeholder relationships and their behavior are complex,
uncertain and in a dynamic situation in which human rationality plays a key role,
however, methodologies proposed can not be able to show the imperfection and het-
erogeneity of them. Thus, it is suitable to use a dynamic and uncertain perspective
of the relations to propose a novel methodology using fuzzy decision-making tech-
niques in uncertainty.
2.2 Fuzzy decision-making
Fuzzy decision-making has become an important field of research, with a large
number of studies developing tools and methods for its treatment (Blanco-Mesa
et al. 2017). The studies on fuzzy decision-making stemmed from studies of the con-
cepts of fuzzy sets (Zadeh 1965), fuzzy environments (Bellman and Zadeh 1970),
approximate reasoning (Zadeh 1975a, b, c) and applications of fuzzy sets in decision
systems (Zimmermann 1986). Research on decision-making is focused on dealing
with problems of multiple criteria decision-making (MCDM). Thus, fuzzy theory is
incorporated into MCDM for the treatment of problems in situations with subjective
uncertainty because the objectives and constraints can involve linguistic and fuzzy
variables (Tzeng and Huang 2011). Hwang and Yoon (1981) suggest that the prob-
lems of multiple criteria decision-making can be classified into multiple attribute
decision making (MADM) and multiple objective decision-making (MODM), and
Xu (2015) has proposed uncertain multiple attribute decision-making (UMADM) to
rank and prioritize information based on weight. The decision maker’s main interest
is to design the “most” feasible alternative in relation to limited resources (Chen and
Hwang 1992). According to Carlsson and Fullér (1996), these methods are devel-
oped paths to find a ranking, methods that assess the relative importance of multiple
attributes and fuzzy mathematical programming. Thus, several proposals have been
developed, among which we can identify intuitionistic fuzzy sets (Atanassov 1986);
decision-making in a fuzzy environment (Bellman and Zadeh 1970); multiple attrib-
ute decision-making (Hwang and Yoon 1981); ordered weighted averaging aggrega-
tion operators in multi-criteria decision-making (Yager 1988); families of ordered
weighted aggregation (OWA) operators (Yager 1993; Merigó and Gil-Lafuente
2009; He et al. 2017); fuzzy sets (Zadeh 1965); linguistic variables and their appli-
cation to approximate reasoning-I-II-III (Zadeh 1975a, b, c); fuzzy sets as a basis
for a theory of possibility (Zadeh 1999); results of empirical studies in fuzzy set
theory (Zimmermann 1978); fuzzy sets and decision analysis (Zimmermann et al.
1984); fuzzy sets, decision-making and expert systems (Zimmermann 1986); fuzzy
preference orderings in group decision-making (Tanino 1984); group decision-mak-
ing with a fuzzy linguistic majority (Kacprzyk 1986); the analytic hierarchy pro-
cess (Saaty 1980, 1987, 1990) and theory of decision in uncertainty (Kaufmann and
Gil-Aluja 1991, 1992, 1993, 1995; Kaufmann et al. 1994; Gil-Aluja 1996, 2000).
These methods are then applied to current business issues, such as supply-chain
management, investment decision-making, personnel appraisal, product redesign
and service maintenance. Currently, the research field of fuzzy decision-making has
branched into new areas such as computer science, engineering, science operations
F. Blanco-Mesa et al.
management, mathematics, economic affairs and automatic control systems (Merigó
et al. 2015). Likewise, Kochenderfer (2015) highlighted statistical tools for treating
decision-making under uncertainty, such as Bayesian networks as a graphical model
that capture probabilistic relationships among variables, utility theory as a frame-
work for understanding optimal decision-making under uncertainty, Markov deci-
sion processes as a method for modeling sequential problems, model uncertainty,
state uncertainty, and cooperative decision-making involving multiple interacting
agents.
Of the above methodologies, we highlight that developed by Gil-Aluja (1999),
which broadly explores the notion of relation. This concept studies the linking of
relation and the relation of causality based on the incidence concept (Kaufmann
and Gil-Aluja 1988), which can be strengthened or weakened by the variation of the
intensity of relations (Blanco-Mesa 2015). The intensity is expressed by member-
ship function, and the variation is explained by the composition max-min (Gil-Aluja
1999). These concepts allow an analytical process of subjective attributes, taking
into account the decision-maker’s appraisal maker according to some notable char-
acteristics, i.e. this attributes or appraisals or opinions of decision makers are con-
sidered as subjective preferences within the process. Then, in this process, subjective
preferences are more significant than in other methodologies. Likewise, the subjec-
tive preferences are composed by decision-makers estimations, which are based on
the quality or quantity of data received. Thus, several authors have made some appli-
cations of this methodology within business and economic fields, such as marketing
(Gil-Lafuente 1997; Nicolás and Gil-Lafuente 2012), customer management rela-
tionship (CMR) (Gil-Lafuente and Luis Bassa 2011), finance (Salazar-Garza 2012;
Laengle et al. 2017), strategy (Gil-Lafuente and Barcellos de Paula 2010; Martorell-
Cunill et al. 2013), stakeholders (Gil-Lafuente and Barcellos de Paula 2013), cor-
porate social responsibility (CSR) (Vizuete Luciano et al. 2013), the economy (Gil-
Lafuente et al. 2012a, b; Blanco-Mesa and Gil-Lafuente 2014; Blanco-Mesa and
Gil-Lafuente 2017; León-Castro et al. 2018), entrepreneurship (Maqueda Lafuente
et al. 2013; Blanco-Mesa et al. 2015, 2018) and sport business (Gil-Lafuente 2002;
Gil-Lafuente 2008; Gil-Lafuente et al. 2012a, b; Blanco-Mesa 2015), which have
been shown to be useful in decision-making in uncertainty. These applications have
the advantage that the decision-maker’s preferences can be assessed showing several
alternatives, intensities and importance of relations. Hence, this methodology allows
reflecting the decision-maker’s attitudinal character maker, focusing on problems in
business and economics decision-making.
3 Methodology
In this section, we briefly review some basic concepts about comparison notion and
fuzzy relation composed by the ordering-according-to-the-importance-of-character-
istics algorithm and fuzzy composition representations in a square fuzzy matrix.
The square fuzzy and comparison index
In decision-making in uncertainty, this index is used to link relations and estab-
lish the relation of incidence or causality through the nuances of their relation levels.
Subjective stakeholder dynamics relationships treatment:…
The vectors are given by subjective preferences that are in turn parameterized by the
ordering-according-to-importance-of-characteristics algorithm. Therefore, a square
fuzzy matrix can represent the results obtained by the comparison index.
3.1 Ordering according to the importance of characteristics algorithm
Identifying the characteristics’ importance (Gil-Aluja 1999) is a useful technique for
establishing relative importance in a causality relation between two objects consid-
ering their characteristics. The characteristics’ importance is composed of the domi-
nant eigenvalue and the dominant eigenvector.
Definition 1 Matrix reciprocal [R̃] collects all characteristics compared by the time
it has been preferred. For each characteristic Cj a two-by-two comparison is carried
out, Ci, C
k; i, k = 1, 2,… , n using a quotient, which determines the time that it is pre-
ferred to the other one, such as:
where Ci represents the times is preferred to C
k.
Note that the matrix is built by collecting all 𝜇ik
, and it is reciprocal and coher-
ent/consistent. It is reciprocal because it complies with 𝜇ii= 1 ; 𝜇
ik= 1∕𝜇
ki , where
𝜇ik∈ R
+
o, i, k = 1, 2,… , n . It is coherent/consistent because it complies with
∀i, k, l ∈ {1, 2,… , n} ; fi∕f
k∗ f
k∕f
l= f
i∕f
l , i.e., 𝜇
ik∗ 𝜇
kl= 𝜇
il.
Therefore, the matrix must comply with the transpose property, which is given
by:
and the proportionality property, which is given by:
also:
Therefore:
(1)𝜇ik=
fi
fk
, i, k = 1, 2,… , n,
(2)∑n
k=1𝜇
ik∗ f
k=
∑n
k=1
fi
fk
∗ fk= n ∗ f
i,
(3)𝜇
ik
𝜇lk
=
fi∕f
k
fl∕f
k
=
fi
fl
,
(4)𝜇
ik′
𝜇lk′
=
fi∕f
k′
fl∕f
k′
=
fi
fl
,
(5)𝜇
ik
𝜇lk
=
𝜇ik′
𝜇lk′
.
F. Blanco-Mesa et al.
Definition 2 A Dominant Eigenvalue Eva
of dimension n, is a mapping
Eva∶ [0, 1]nx[0, 1]n → [0, 1] that has an associated limit weighting vector 𝜆
(c)
1 , with
wj∈ [0, 1] and
n∑
j=1
wj≥ 1 , such as:
where xi and y
k represents the jth largest of sets X and Y.
Therefore:
Definition 3 A Dominant Eigenvector V (c) has an associated weighting vector 𝜆(c)
1 ,
with wj∈ [0, 1] and
n∑
j=1
wj≤ 1 , such as:
and normalizing:
Therefore, Relative Importance is shown within a representative of the impor-
tance matrix [R̃] by each characteristic. This matrix is given by:
R
R̃
where ̃
[ ] is the ith arguments of the set X.
Hence, following the process above, a resulting matrix [ ]
∗
is obtained, whichrepresents a square fuzzy matrix.
3.2 The square fuzzy matrix
The square fuzzy matrix (Gil-Aluja 1999) is useful for representing direct and
indirect relationships between physical and mental objects. In decision-making in
uncertainty, it is used to link relations and to establish the relation of incidence
(6)Eva
(⟨x
i, y
k⟩,… , ⟨x
n, y
m⟩)=
n∑
k=1
maxwj(𝜇
ik∗ y
k),
(7)𝜆(c)
1= E
vamax.
(8)Vc(x
i, y
k,… , x
n, y
m
)=
n∑
k=1
(𝜇ik∗ y
k)
max(𝜇ik∗ y
k)
,
(9)N(c)
=V(c)
∑V (c)
.
(10)[R̃]∗
= N(c)
∗
[R̃],
Subjective stakeholder dynamics relationships treatment:…
or causality through the nuances of their relational levels. Therefore, the distance
relatives can be represented on a square fuzzy matrix:
where [R̃]∗
represents the ith arguments of the sets X and Y.
Note that this matrix can comply with the reflexive, transitive, symmetry
and fuzzy anti-symmetry properties. It is reflexive because the relation of ele-
ments of the set x ∈ E with itself that is with x ∈ E is total, and the main
diagonal is full of 1. Therefore, it must be accomplished with ∀ai∈ E where
i = 1, 2,… , n ∶ 𝜇ij= 1, i = j and 𝜇
ij∈ [0, 1], i ≠ j where a
i are the ith arguments
of the set E. It is transitive because the indirect relation among the three elements
of the referential E ( ai,a
j , a
k ) can be considered in the same manner, i.e., that the
indirect relation between ai and a
k cannot be greater than the direct relation a
j and
ak . Therefore, it must be accomplished with ∀a
i,aj, a
k∈ E : 𝜇
aiik≥ ∨(𝜇
aiaj∧ 𝜇
ajak) .
It is in symmetry because the intensity of the relation from ai to a
j is considered
the same as aj to a
i . Therefore, it must be accomplished with ∀a
i, a
j∈ E, a
i≠ a
j
and 𝜇ai= 𝜇
aj where a
i and a
j are the ith arguments of the set E. It is fuzzy anti-
symmetry because the intensity of the relation from ai to a
j is not considered the
same as aj to a
i . Therefore, it must be accomplished with ∀a
i, a
j∈ E, a
i≠ a
j and
𝜇ij≠ 𝜇
jior 𝜇
ij= 𝜇
ji= 0 where a
i and a
j are the ith arguments of the set E.
3.3 Fuzzy composition
Fuzzy composition or convolution max-min (Gil-Aluja 1999) is a useful tech-
nique for associating between physical and mental objects. In decision-making
on uncertainty, it is used to represent the degree of belonging or the lack of asso-
ciation and interaction or interconnection of fuzzy relation between elements of
its own set or two or more fuzzy sets. For elements of its own set or two or more
fuzzy sets, the convolution max-min can be defined as follows:
Definition 4 A fuzzy composition R◦S is defined as a fuzzy relation UxW and it is
associated with their characteristic functions 𝜇R(x, y) and 𝜇
S(y, z) , which is given by
composition max-min, such as:
where (x, z) ∈ (U, W).
(11)
a a ↱ a1 a2 ⋯ ai
a a a1 (x1, y1) (x1, y2) ⋯ (x1, yi)[
R̃]∗
= a2 (x2, y1) (x2, y2) ⋯ (x2, yi)
a a ⋮ ⋮ ⋮ ⋯ ⋮
a a ai(x
i, y1) (x1, y2) ⋯ (x
i, y
i)
,
(12)𝜇R◦S
(x, z) = ∨y∈V
(𝜇R(x, y) ∧ 𝜇
s(y, z)),
F. Blanco-Mesa et al.
Therefore, the relative intensity is established by the convolution of the fuzzy
matrix [R̃] with itself. The behavior of relation can be observed through evolution
over time or at no temporal stage.
Definition 5 The max-min composition of matrix [R̃] is given by:
Therefore:
when [R̃]n = [R̃]n+1 the process is stopped.
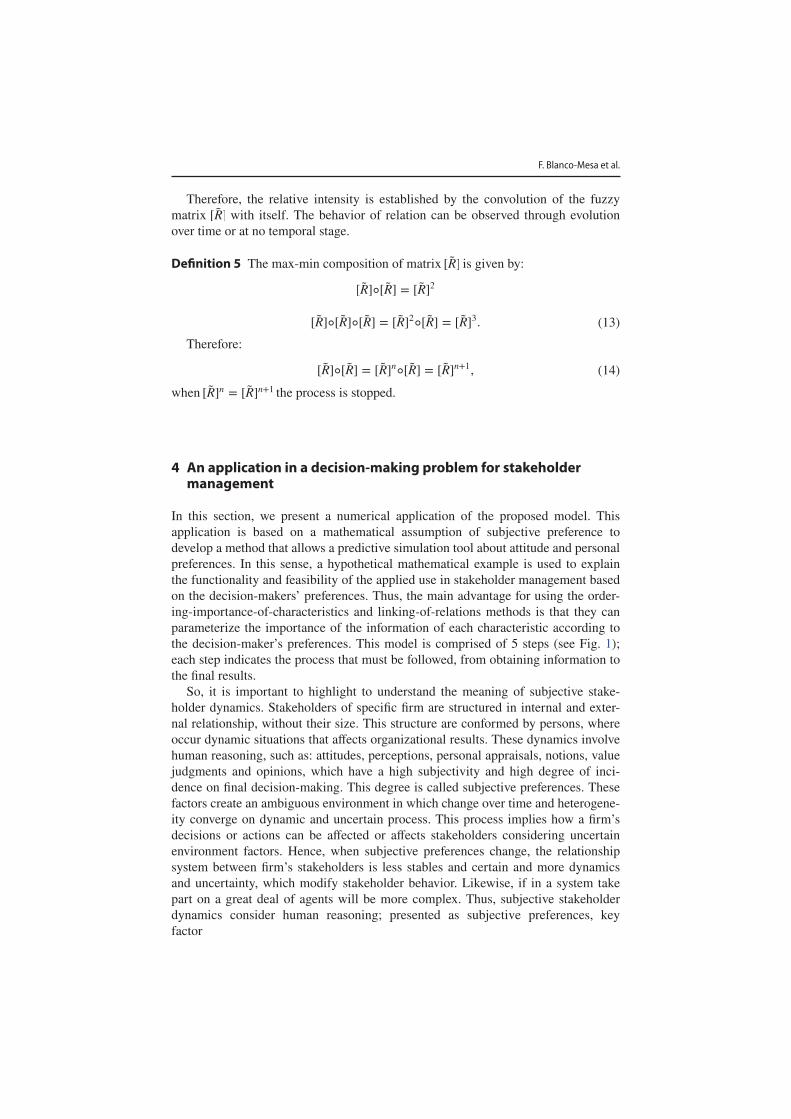
4 An application in a decision-making problem for stakeholder management
In this section, we present a numerical application of the proposed model. This
application is based on a mathematical assumption of subjective preference to
develop a method that allows a predictive simulation tool about attitude and personal
preferences. In this sense, a hypothetical mathematical example is used to explain
the functionality and feasibility of the applied use in stakeholder management based
on the decision-makers’ preferences. Thus, the main advantage for using the order-
ing-importance-of-characteristics and linking-of-relations methods is that they can
parameterize the importance of the information of each characteristic according to
the decision-maker’s preferences. This model is comprised of 5 steps (see Fig. 1);
each step indicates the process that must be followed, from obtaining information to
the final results.
So, it is important to highlight to understand the meaning of subjective stake-
holder dynamics. Stakeholders of specific firm are structured in internal and exter-
nal relationship, without their size. This structure are conformed by persons, where
occur dynamic situations that affects organizational results. These dynamics involve
human reasoning, such as: attitudes, perceptions, personal appraisals, notions, value
judgments and opinions, which have a high subjectivity and high degree of inci-
dence on final decision-making. This degree is called subjective preferences. These
factors create an ambiguous environment in which change over time and heterogene-
ity converge on dynamic and uncertain process. This process implies how a firm’s
decisions or actions can be affected or affects stakeholders considering uncertain
environment factors. Hence, when subjective preferences change, the relationship
system between firm’s stakeholders is less stables and certain and more dynamics
and uncertainty, which modify stakeholder behavior. Likewise, if in a system take
part on a great deal of agents will be more complex. Thus, subjective stakeholder
dynamics consider human reasoning; presented as subjective preferences, key
factor
[R̃]◦[R̃] = [R̃]2
(13)[R̃]◦[R̃]◦[R̃] = [R̃]2◦[R̃] = [R̃]
3.
(14)[R̃]◦[R̃] = [R̃]n◦[R̃] = [R̃]
n+1,
Subjective stakeholder dynamics relationships treatment:…
to modify stakeholder behavior in a dynamic and uncertain process, where a firm’s
decisions can be affected or affects stakeholders.
The following is a case in which a group of experts should consider the possible
relationships between each interest group if a new strategic diversification plan is
implemented. The main idea is to anticipate or predict stakeholder behavior when
deciding to implement this new strategic plan. Thus, it supposes that a sports firm
consults a group of experts to improve the decision-making process in strategic
planning. Expert estimations are used to analyze how strategic planning for a new
leisure program can influence the firm’s relationship with each stakeholder it con-
siders strategic. The method allows describing the linking and ordering among all
characteristics. The five-step model proposed in Fig. 1 is followed:
Step 1: This step presumes that experts have defined the stakeholders of the
immediate firm environment. Experts should have defined stakeholders, the kind
of relationships and agents. First, this information is used to identify each stake-
holder and the category to which each stakeholder belongs. Second, it allows the
possible relationship to be established that can exist, which helps to define the
Ste
p 1
Ste
p 2
Ste
p 3
Ste
p 4
Ste
p 5
S.1.1. Define the Immediate firm environment
S.1.2. Define Characteristics and Categories of
each stakeholder
S.2.1. Define the Subjective preference matrix
between characteristics
S.2.2. Define the Subjective preference matrix
for power, responsibility and salience relation
S.3.1. Define the Level of importance for each
stakeholder and characteristic
S.4.1. Define the Level of environmental
importance
S.5.1. Obtain 1) the Relative level of
importance for each stakeholder and characteristic, 2) the Dominant Eigenvalue and
the Dominant Eigenvector, 3) the Fuzzy
relative matrix for power, responsibility and salience relation and 4) the Relative intensity
matrix for power, responsibility and salience
The Immediate environment is composed of a determined number of
stakeholders, who belong to a classification with a kind of relationship.Characteristics and Categories of each stakeholder is composed of
three elements, categories that define the environment, stakeholder
group that defines a set of specific stakeholders and are grouped within each category, and the characteristics of defined legitimacy (L),
power/influence (P) and responsibility (R) to each specific stakeholder.
The Subjective preference matrix between characteristics is a matrix
composed of L, P and R. Experts or decision-makers, who have to
follow the conditions defined in equations 1 to 5, to fix the level of preference for each of the characteristics.
Subjective preference matrix for power, responsibility and salience
relation are matrices that represent each characteristic (L, P and R) and are composed of a set of specific stakeholders. The fixation of the level
of preference for experts or decision-makers, who have to follow the
conditions, define each specific stakeholder in equations 1 to 5. Values are fixed environments using their experience, knowledge and
information available.
The level of importance for each stakeholder and characteristic are
obtained from the average and normalization of subjective preference
exposed in Step 2. Thus, the different levels of importance are obtained for each characteristic associated with a stakeholder. These values are
identified as LISP
, LISR
, LISL
and CA.
Level of environmental importance is the consideration value that
experts or decision-makers have about the environment using their
experience, knowledge and information available.
Final results are obtained results to build graphical representations of
relative impact and the incidence linkage loops.
Fig. 1 Subjective stakeholder model
F. Blanco-Mesa et al.
Tab
le 2
Im
med
iate
firm
envir
onm
ent
IDS
takeh
old
ers
Kin
d o
f re
lati
onsh
ipA
gen
ts
aF
irm
Gro
wth
busi
nes
sA
dm
inis
trat
ion b
ody
bE
mplo
yee
sL
abour
law
sE
mplo
yee
s
cB
usi
nes
sC
ontr
acts
and a
gre
emen
tsS
uppli
ers,
cre
dit
ors
, par
tner
s
dC
ust
om
ers
Cust
om
ers
Work
ers
and fi
rms
affili
ated
eU
nio
ns
and a
ssoci
atio
nU
nio
ns
and s
afet
y g
roups
Unio
ns
fC
om
pet
itors
Mar
ked
, co
mpet
itors
FC
F’s
com
pet
itors
gIn
stit
uti
ons
and a
udit
ors
Publi
c in
tere
st g
roup
Contr
oll
ing b
ody
hL
oca
l org
aniz
atio
n a
nd G
over
nm
ent
Leg
al a
ctiv
itie
s co
ntr
ol
Loca
l, r
egio
nal
and n
atio
nal
gover
nm
ent
iM
edia
and o
ther
sD
iffuse
r an
d o
bse
rver
Med
ia a
nd c
om
munic
atio
n
jC
ivil
soci
ety
Civ
il, en
vir
onm
enta
l an
d h
um
an r
ights
Com
munit
y
Subjective stakeholder dynamics relationships treatment:…
type of characteristic. Third, each agent is defined that belongs to each stake-
holder. Thus, in this assumption, experts have defined ten stakeholders that are
confirmed by sixteen agents and identified with ID from a to j (see Table 2). The
immediate firm environment is defined using Fassin stakeholder approximation
(Fassin 2009, 2010). Experts continue to have the autonomy to define and select
the number of stakeholders according to the firm’s need.
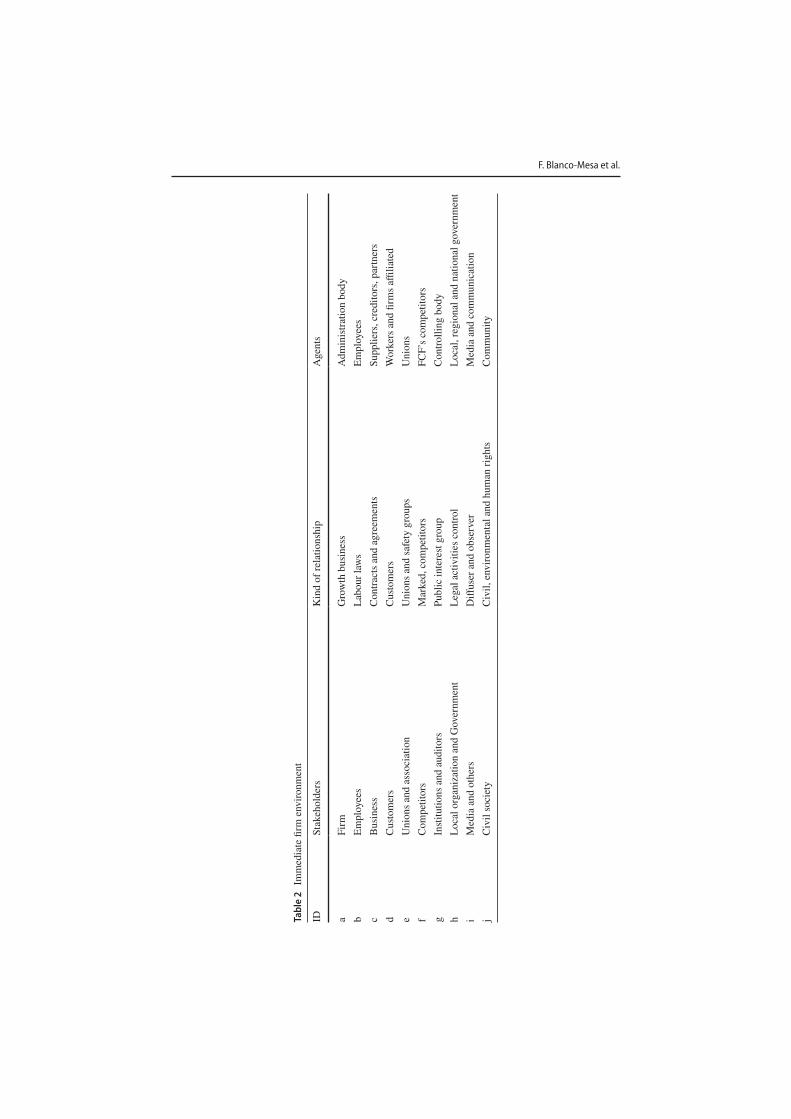
After that, considering the information established in Table 1, experts built
categories and characteristics matrices for each stakeholder group (see Table 3).
Based on stakeholders, the different categories were defined, which respond to
stakeholder boundaries, i.e., environmental stakeholders (Fassin 2009, 2010).
These were called real stakeholders (Rs), stakewatchers (Sw) and stakekeep-
ers (Sk), and gathered stakeholders within a group, e.g., stakeholders e, f and g
belonged to Sw. With categories and stakeholder groups defined, each of their
characteristics were established according to the legitimacy of their claims (L),
power/influence dominances (P) and responsibilities (R). These attributes con-
formed to stakeholder salience (Mitchell et al. 1997), which allowed a definition
of the kind of relationships in three possibilities (L or P or R) to be analyzed as a
unit ( Salience = L ∩ P ∩ R ). These attributes allow analyzing the dynamic nature
of stakeholder-manage relationships (Mitchell et al. 1997). In this sense, experts
defined whether a stakeholder had all, some or no attributes. In this assumption
some stakeholders had all attributes others had some or none. Finally, each of the
stakeholder characteristics was considered a property. This first step allowed us to
Table 3 Characteristics and
categories of each stakeholderCategory Stakeholder group Character-
istics
Real stakeholders
RS
a Firm L P R
b Employees L P –
c Business L P –
d Customers L P R
Stakewatchers
SW
e Unions and association – P –
f Competitors – P –
g Institutions and auditors – P –
Stakekeepers
SK
h Local organization and
Government State
L P R
i Media and others – P –
j Civil Society – P –
Table 4 Subjective preference
matrix between characteristicsPower Legitimacy Responsibility
Power 1 1 2/7 1 1/2
Legitimacy 7/9 1 1 1/6
Responsibility 2/3 6/7 1
AQ3
F. Blanco-Mesa et al.
Table 5 Subjective preference
matrix of power relationP a b c d e f g h i j
a 1 1.40 1.00 1.17 1.40 1.17 1.17 1.00 1.00 1.40
b 0.71 1 0.71 0.83 1.00 0.83 0.83 0.71 0.71 1.00
c 1.00 1.40 1 1.17 1.40 1.17 1.17 1.00 1.00 1.40
d 0.86 1.20 0.86 1 1.20 1.00 1.00 0.86 0.86 1.20
e 0.71 1.00 0.71 0.83 1 0.83 0.83 0.71 0.71 1.00
f 0.86 1.20 0.86 1.00 1.20 1 1.00 0.86 0.86 1.20
g 0.86 1.20 0.86 1.00 1.20 1.00 1 0.86 0.86 1.20
h 1.00 1.40 1.00 1.17 1.40 1.17 1.17 1 1.00 1.40
i 1.00 1.40 1.00 1.17 1.40 1.17 1.17 1.00 1 1.40
j 0.71 1.00 0.71 0.83 1.00 0.83 0.83 0.71 0.71 1
Table 6 Subjective preference
matrix of responsibility relationR a b c d e f g h i j
a 1 1.17 1.40 0.70 1.17 1.40 1.00 0.70 1.00 1.00
b 0.86 1 1.00 0.50 0.83 1.00 0.71 0.50 0.71 0.71
c 0.71 1.00 1 0.70 1.17 1.40 1.00 0.70 1.00 1.00
d 1.43 2,00 1.43 1 1.00 1.20 0.86 0.60 0.86 0.86
e 0.86 1.20 0.86 1.00 1 1.00 0.71 0.50 0.71 0.71
f 0.71 1.00 0.71 0.83 1.00 1 0.86 0.60 0.86 0.86
g 1.00 1.40 1.00 1.17 1.40 1.17 1 0.60 0.86 0.86
h 1.43 2,00 1.43 1.67 2,00 1.67 1.67 1 1.00 1.00
i 1.00 1.40 1.00 1.17 1.40 1.17 1.17 1.00 1 1.00
j 1.00 1.40 1.00 1.17 1.40 1.17 1.17 1.00 1.00 1
Table 7 Subjective preference
matrix of salienceT a b c d e f g h i j
a 1 1.28 1.20 0.93 1.28 1.28 1.08 0.85 1.00 1.20
b 0.79 1 0.86 0.67 0.92 0.92 0.77 0.61 0.71 0.86
c 0.86 1.20 1 0.93 1.28 1.28 1.08 0.85 1.00 1.20
d 1.14 1.60 1.14 1 1.10 1.10 0.93 0.73 0.86 1.03
e 0.79 1.10 0.79 0.92 1 0.92 0.77 0.61 0.71 0.86
f 0.79 1.10 0.79 0.92 1.10 1 0.93 0.73 0.86 1.03
g 0.93 1.30 0.93 1.08 1.30 1.08 1 0.73 0.86 1.03
h 1.21 1.70 1.21 1.42 1.70 1.42 1.42 1 1.00 1.20
i 1.00 1.40 1.00 1.17 1.40 1.17 1.17 1.00 1 1.20
j 0.86 1.20 0.86 1.00 1.20 1.00 1.00 0.86 0.86 1
Subjective stakeholder dynamics relationships treatment:…
make a holistic assessment of the immediate firm environment because it consid-
ered each category and sub-set.
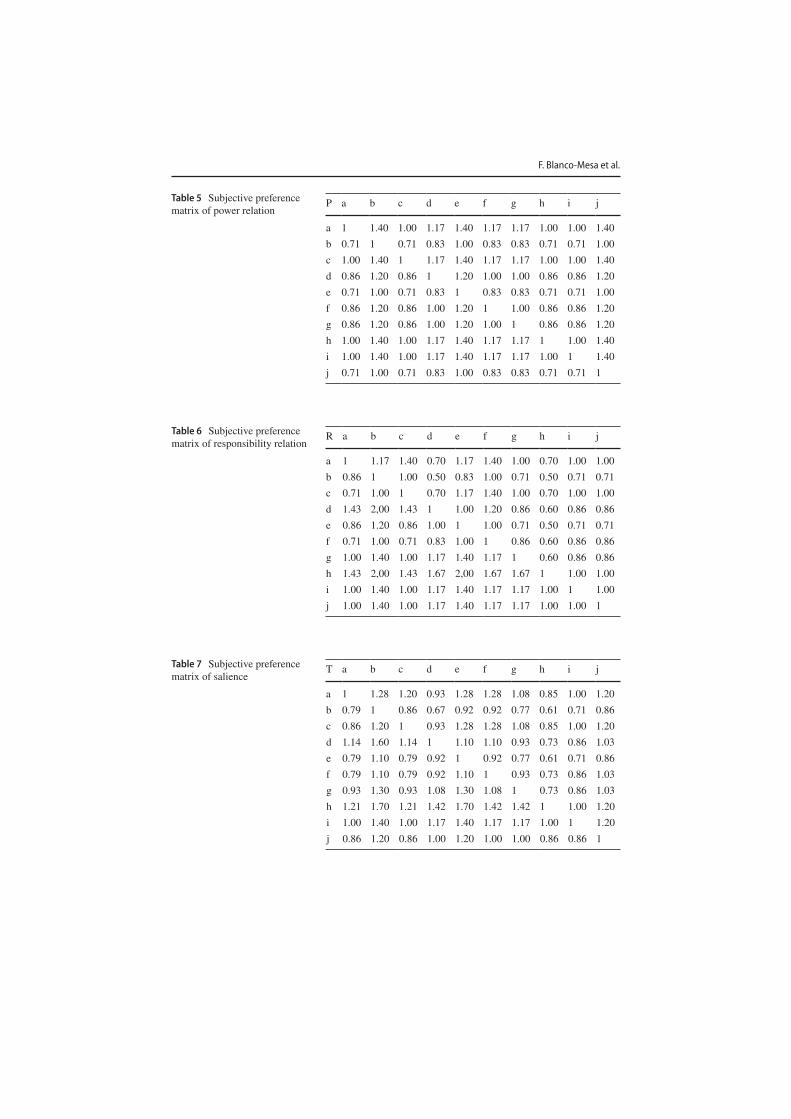
Step 2: Now experts have fixed each characteristic’s preference level to form
a subjective preference matrix. Initially, they should suggest subjective prefer-
ence among power, legitimacy and responsibility (Table 4). These preferences are
characterized by inverse multiplicative, i.e., if we have a number x∕y , its inverse
multiplicative is y∕x , or if we have x , its inverse is 1∕x . This characteristic rep-
resents the opposite level of subjective preference for each variable, e.g., if the
subjective preference between power and legitimacy is 2, the inverse preference
between legitimacy and power is 1/2. Thus, following the same procedure, sub-
jective preference matrices of power, responsibility and salience are built for each
stakeholder set (Tables 5, 6 and 7). The salience matrix considers all characteris-
tics to establish subjective preference. Here, each of the estimates could be com-
posed of the quality or quantity of the data received—e.g., statistics, reports, and
survey information—which are used as guidance by experts.
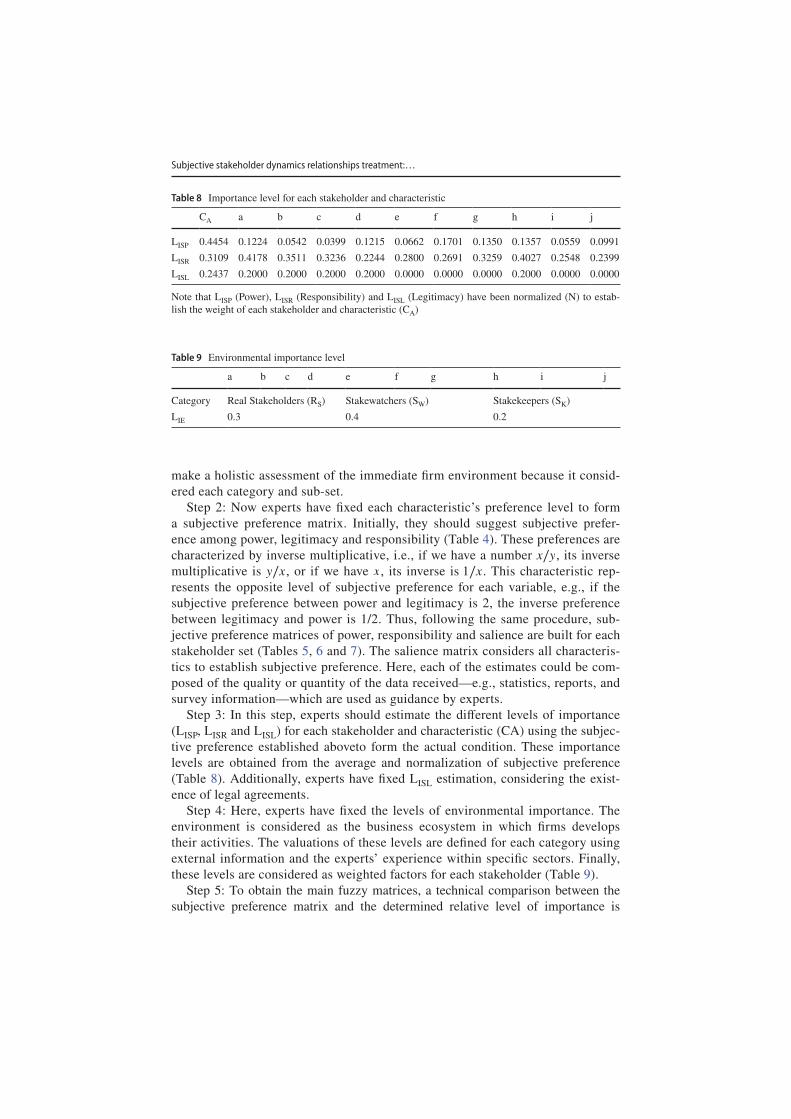
Step 3: In this step, experts should estimate the different levels of importance
(LISP, LISR and LISL) for each stakeholder and characteristic (CA) using the subjec-
tive preference established aboveto form the actual condition. These importance
levels are obtained from the average and normalization of subjective preference
(Table 8). Additionally, experts have fixed LISL estimation, considering the exist-
ence of legal agreements.
Step 4: Here, experts have fixed the levels of environmental importance. The
environment is considered as the business ecosystem in which firms develops
their activities. The valuations of these levels are defined for each category using
external information and the experts’ experience within specific sectors. Finally,
these levels are considered as weighted factors for each stakeholder (Table 9).
Step 5: To obtain the main fuzzy matrices, a technical comparison between the
subjective preference matrix and the determined relative level of importance is
Table 8 Importance level for each stakeholder and characteristic
Note that LISP (Power), LISR (Responsibility) and LISL (Legitimacy) have been normalized (N) to estab-
lish the weight of each stakeholder and characteristic (CA)
CA a b c d e f g h i j
LISP 0.4454 0.1224 0.0542 0.0399 0.1215 0.0662 0.1701 0.1350 0.1357 0.0559 0.0991
LISR 0.3109 0.4178 0.3511 0.3236 0.2244 0.2800 0.2691 0.3259 0.4027 0.2548 0.2399
LISL 0.2437 0.2000 0.2000 0.2000 0.2000 0.0000 0.0000 0.0000 0.2000 0.0000 0.0000
Table 9 Environmental importance level
a b c d e f g h i j
Category Real Stakeholders (RS) Stakewatchers (SW) Stakekeepers (SK)
LIE 0.3 0.4 0.2
F. Blanco-Mesa et al.
considered as the starting point. In this application, each result obtained is consid-
ered a vector of importance forming a fuzzy matrix, and the multiplication of LISP,
LISL and LISR with LIE is considered the relative importance level for each stake-
holder and characteristic (RLI’s).
4.1 Results
The following section presents the application’s main results. The RLI, dominant
eigenvalue (Eva), dominant eigenvector (V(c)) and fuzzy matrices are obtained, which allows the establishment of the relative intensity among stakeholders. Thus,
these algorithms are shown to be adjustable in making assumptions about the deci-
sion-maker’s preference. Based on these results, the possible relationships among
all stakeholders are depicted, linked and grouped. We propose a numerical example
to demonstrate the proposed method’s usefulness and feasibility. This methodology
allows aggregating subjective information to obtain representative results. Subjec-
tive information is provided by opinions, suggestions and recommendations from
experts who possess knowledge but do not know the effect of their decisions. In
this case, the numerical example is focused on the mathematical assumption for the
treatment of stakeholder relationships, which considers P, L, and R characteristics
and Rs, Sw and Sk categories for an uncertain environment.
Initially, in this process, the relative level of importance is obtained for each
stakeholder and characteristic (RLI’s) (Table 10), which is the result of LISP, LISL
and LISR and LIE multiplied.
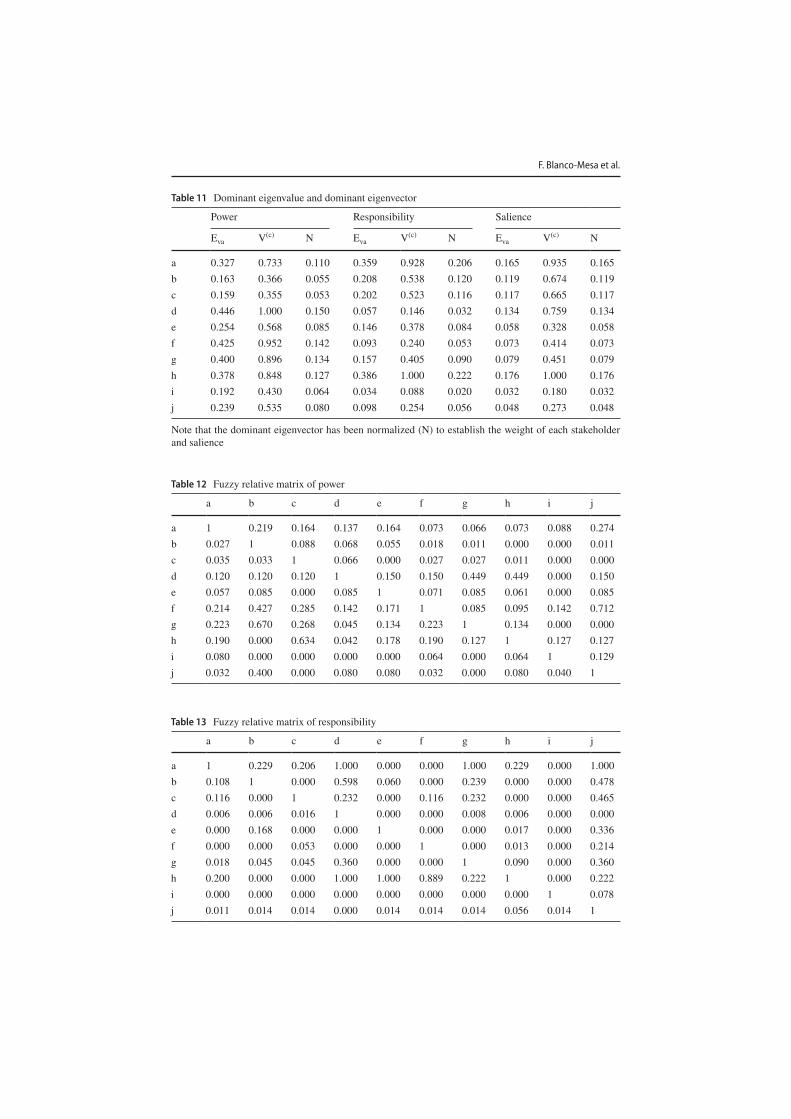
After that, (Eva) and (V(c)) values are obtained using different RLIs value (see Table 11). This table shows the values (Eva) and (V(c)) for power, responsibility and salience. Eva and V(c) values are fundamental to find fuzzy relative matrices (FRM) and intensity relative matrices (IRM).
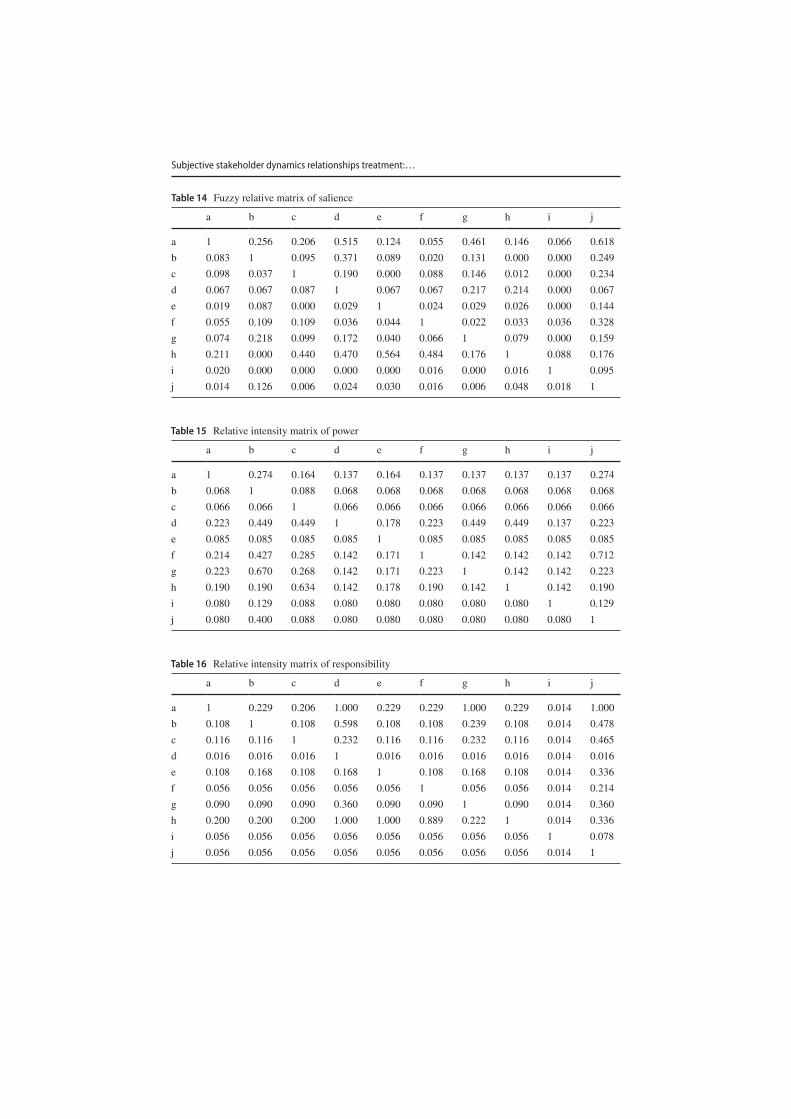
Finally, fuzzy relative matrices (FRM) and intensity relative matrices (IRM) are
defined. Initially, fuzzy relative matrices (FRM) are obtained for each subjective
preference matrix (see Tables 12, 13, 14). To determine these matrices, each sub-
jective preference matrix is multiplied with V(c) normalized. These matrices allow
the ambiguity and fuzziness of the stakeholders and decision-maker subjectivity to
be addressed. In each matrix, number 1 defines the relationship of each stakeholder
with itself in total and the decimal zero—0.000—defines the weakest incidence rela-
tion of appr oximately < 10−3.
Next, to obtain the intensity relative matrices (IRM), we processed each FRM
using max-min composition (Tables 15, 16, 17). Max-min composition allows the
simulation of relationship evolution in a short time. The results obtained for each
matrix have different degrees of intensity according to the incidence levels. These
different levels are considered weighted vectors. Also, in the FRM, apparently no
relationships occur among some stakeholders, but in this process, these relationships
have been discovered, which means that interactive relationships among stakehold-
ers within a changing environment can be analyzed in a short time by a dynamic
process. In addition, the intensity is associated with incidence and influence.

Subjective stakeholder dynamics relationships treatment:…
Tab
le 1
0
Rel
ativ
e le
vel
of
import
ance
CA
ab
cd
ef
gh
ij
RL
ISP
0.1
336
45yil
ñ 0
.0367
0.0
163
0.0
120
0.0
364
0.0
265
0.0
681
0.0
540
0.0
271
0.0
112
0.0
198
RL
ISR
0.0
731
0.0
627
0.0
426
0.0
344
0.0
046
0.0
284
0.0
241
0.0
234
0.0
388
0.0
092
0.0
062
RL
ISL
0.0
933
0.2
000
0.2
000
0.2
000
0.2
000
0.0
000
0.0
000
0.0
000
0.2
000
0.0
000
0.0
000
F. Blanco-Mesa et al.
Table 11 Dominant eigenvalue and dominant eigenvector
Note that the dominant eigenvector has been normalized (N) to establish the weight of each stakeholder
and salience
Power Responsibility Salience
Eva V(c) N Eva V(c) N Eva V(c) N
a 0.327 0.733 0.110 0.359 0.928 0.206 0.165 0.935 0.165
b 0.163 0.366 0.055 0.208 0.538 0.120 0.119 0.674 0.119
c 0.159 0.355 0.053 0.202 0.523 0.116 0.117 0.665 0.117
d 0.446 1.000 0.150 0.057 0.146 0.032 0.134 0.759 0.134
e 0.254 0.568 0.085 0.146 0.378 0.084 0.058 0.328 0.058
f 0.425 0.952 0.142 0.093 0.240 0.053 0.073 0.414 0.073
g 0.400 0.896 0.134 0.157 0.405 0.090 0.079 0.451 0.079
h 0.378 0.848 0.127 0.386 1.000 0.222 0.176 1.000 0.176
i 0.192 0.430 0.064 0.034 0.088 0.020 0.032 0.180 0.032
j 0.239 0.535 0.080 0.098 0.254 0.056 0.048 0.273 0.048
Table 12 Fuzzy relative matrix of power
a b c d e f g h i j
a 1 0.219 0.164 0.137 0.164 0.073 0.066 0.073 0.088 0.274
b 0.027 1 0.088 0.068 0.055 0.018 0.011 0.000 0.000 0.011
c 0.035 0.033 1 0.066 0.000 0.027 0.027 0.011 0.000 0.000
d 0.120 0.120 0.120 1 0.150 0.150 0.449 0.449 0.000 0.150
e 0.057 0.085 0.000 0.085 1 0.071 0.085 0.061 0.000 0.085
f 0.214 0.427 0.285 0.142 0.171 1 0.085 0.095 0.142 0.712
g 0.223 0.670 0.268 0.045 0.134 0.223 1 0.134 0.000 0.000
h 0.190 0.000 0.634 0.042 0.178 0.190 0.127 1 0.127 0.127
i 0.080 0.000 0.000 0.000 0.000 0.064 0.000 0.064 1 0.129
j 0.032 0.400 0.000 0.080 0.080 0.032 0.000 0.080 0.040 1
Table 13 Fuzzy relative matrix of responsibility
a b c d e f g h i j
a 1 0.229 0.206 1.000 0.000 0.000 1.000 0.229 0.000 1.000
b 0.108 1 0.000 0.598 0.060 0.000 0.239 0.000 0.000 0.478
c 0.116 0.000 1 0.232 0.000 0.116 0.232 0.000 0.000 0.465
d 0.006 0.006 0.016 1 0.000 0.000 0.008 0.006 0.000 0.000
e 0.000 0.168 0.000 0.000 1 0.000 0.000 0.017 0.000 0.336
f 0.000 0.000 0.053 0.000 0.000 1 0.000 0.013 0.000 0.214
g 0.018 0.045 0.045 0.360 0.000 0.000 1 0.090 0.000 0.360
h 0.200 0.000 0.000 1.000 1.000 0.889 0.222 1 0.000 0.222
i 0.000 0.000 0.000 0.000 0.000 0.000 0.000 0.000 1 0.078
j 0.011 0.014 0.014 0.000 0.014 0.014 0.014 0.056 0.014 1
Subjective stakeholder dynamics relationships treatment:…
Table 14 Fuzzy relative matrix of salience
a b c d e f g h i j
a 1 0.256 0.206 0.515 0.124 0.055 0.461 0.146 0.066 0.618
b 0.083 1 0.095 0.371 0.089 0.020 0.131 0.000 0.000 0.249
c 0.098 0.037 1 0.190 0.000 0.088 0.146 0.012 0.000 0.234
d 0.067 0.067 0.087 1 0.067 0.067 0.217 0.214 0.000 0.067
e 0.019 0.087 0.000 0.029 1 0.024 0.029 0.026 0.000 0.144
f 0.055 0.109 0.109 0.036 0.044 1 0.022 0.033 0.036 0.328
g 0.074 0.218 0.099 0.172 0.040 0.066 1 0.079 0.000 0.159
h 0.211 0.000 0.440 0.470 0.564 0.484 0.176 1 0.088 0.176
i 0.020 0.000 0.000 0.000 0.000 0.016 0.000 0.016 1 0.095
j 0.014 0.126 0.006 0.024 0.030 0.016 0.006 0.048 0.018 1
Table 15 Relative intensity matrix of power
a b c d e f g h i j
a 1 0.274 0.164 0.137 0.164 0.137 0.137 0.137 0.137 0.274
b 0.068 1 0.088 0.068 0.068 0.068 0.068 0.068 0.068 0.068
c 0.066 0.066 1 0.066 0.066 0.066 0.066 0.066 0.066 0.066
d 0.223 0.449 0.449 1 0.178 0.223 0.449 0.449 0.137 0.223
e 0.085 0.085 0.085 0.085 1 0.085 0.085 0.085 0.085 0.085
f 0.214 0.427 0.285 0.142 0.171 1 0.142 0.142 0.142 0.712
g 0.223 0.670 0.268 0.142 0.171 0.223 1 0.142 0.142 0.223
h 0.190 0.190 0.634 0.142 0.178 0.190 0.142 1 0.142 0.190
i 0.080 0.129 0.088 0.080 0.080 0.080 0.080 0.080 1 0.129
j 0.080 0.400 0.088 0.080 0.080 0.080 0.080 0.080 0.080 1
Table 16 Relative intensity matrix of responsibility
a b c d e f g h i j
a 1 0.229 0.206 1.000 0.229 0.229 1.000 0.229 0.014 1.000
b 0.108 1 0.108 0.598 0.108 0.108 0.239 0.108 0.014 0.478
c 0.116 0.116 1 0.232 0.116 0.116 0.232 0.116 0.014 0.465
d 0.016 0.016 0.016 1 0.016 0.016 0.016 0.016 0.014 0.016
e 0.108 0.168 0.108 0.168 1 0.108 0.168 0.108 0.014 0.336
f 0.056 0.056 0.056 0.056 0.056 1 0.056 0.056 0.014 0.214
g 0.090 0.090 0.090 0.360 0.090 0.090 1 0.090 0.014 0.360
h 0.200 0.200 0.200 1.000 1.000 0.889 0.222 1 0.014 0.336
i 0.056 0.056 0.056 0.056 0.056 0.056 0.056 0.056 1 0.078
j 0.056 0.056 0.056 0.056 0.056 0.056 0.056 0.056 0.014 1
F. Blanco-Mesa et al.
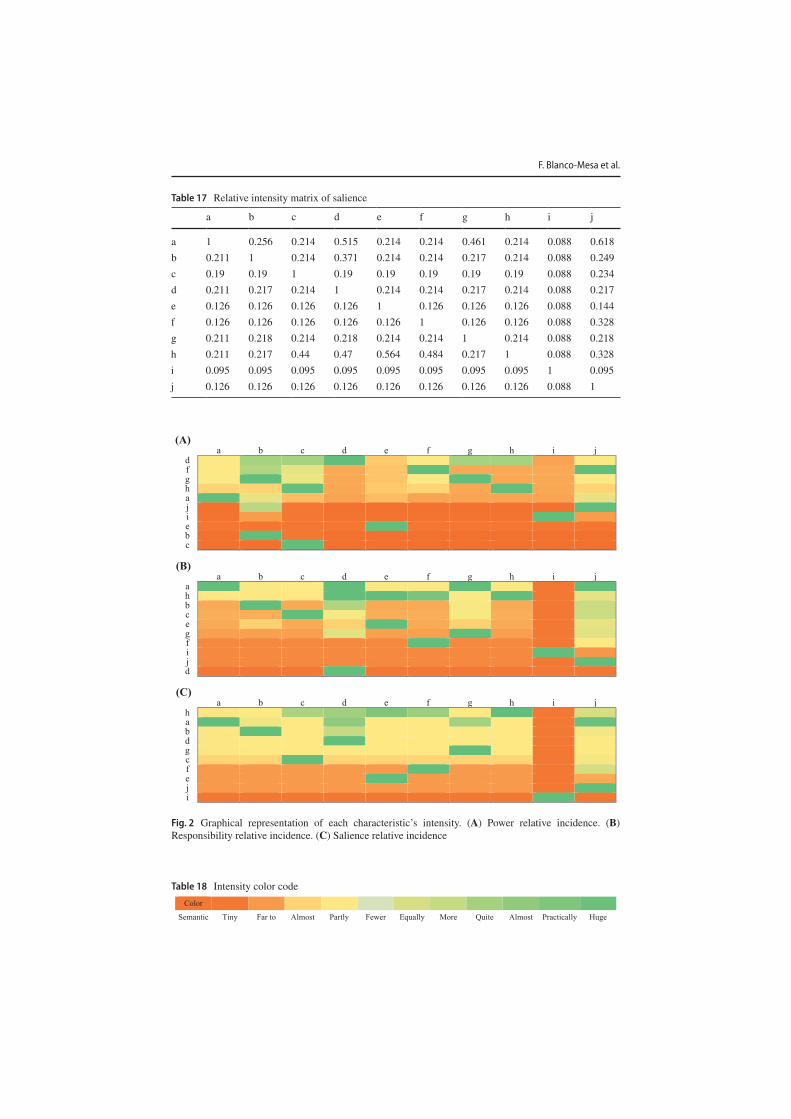
Table 17 Relative intensity matrix of salience
a b c d e f g h i j
a 1 0.256 0.214 0.515 0.214 0.214 0.461 0.214 0.088 0.618
b 0.211 1 0.214 0.371 0.214 0.214 0.217 0.214 0.088 0.249
c 0.19 0.19 1 0.19 0.19 0.19 0.19 0.19 0.088 0.234
d 0.211 0.217 0.214 1 0.214 0.214 0.217 0.214 0.088 0.217
e 0.126 0.126 0.126 0.126 1 0.126 0.126 0.126 0.088 0.144
f 0.126 0.126 0.126 0.126 0.126 1 0.126 0.126 0.088 0.328
g 0.211 0.218 0.214 0.218 0.214 0.214 1 0.214 0.088 0.218
h 0.211 0.217 0.44 0.47 0.564 0.484 0.217 1 0.088 0.328
i 0.095 0.095 0.095 0.095 0.095 0.095 0.095 0.095 1 0.095
j 0.126 0.126 0.126 0.126 0.126 0.126 0.126 0.126 0.088 1
(A)
a b c d e f g h i jdfghajiebc
(B)
a b c d e f g h i jahbcegfijd
(C)
a b c d e f g h i jhabdgcfeji
Fig. 2 Graphical representation of each characteristic’s intensity. (A) Power relative incidence. (B)
Responsibility relative incidence. (C) Salience relative incidence
Table 18 Intensity color code
Color
Semantic Tiny Far to Almost Partly Fewer Equally More Quite Almost Practically Huge
Subjective stakeholder dynamics relationships treatment:…
Nevertheless, the results presented in the matrices hinder the practical under-
standing of the intensity and incidence of the linked relationships among all the
stakeholders for each characteristic. Thus, two visual schemes are proposed to
portray the dynamics of stakeholder relationships. Figure 2 includes a color rep-
resentation for each characteristic, showing the intensity of the importance of
one stakeholder over another. Here, intensity represents the possible incidence
impact that each stakeholder’s behavior can have in its relationships on the entire
structure and firm. These intensities are determined using minimum, average and
maximum limits to configure each matrix of relative intensity. So, in Table 18 is
presented the intensity color code to understand intensity
The intensity analysis shows the relative incidence on stakeholder behavior
according to its characteristic, where orange color indicates the lowest incidence
(LIN), yellow/green color indicates a medium incidence (MIN), and green color indi-
cates the highest incidence (HIN). These incidences denote how some relationships
are strengthened and others are degraded as they pass through the sequential stages.
Thus, the incidences of HIN are more intense than those of MIN and LIN, and the
incidence of MIN are more intense than those of LIN (HIN > MIN > LIN). For exam-
ple, in a power-relative incidence, d has an HIM, a has an MIM and c has an LIM. In
a responsibility-relative incidence, a has an HIM, e has an MIM and d has an LIM. In
a salience-relative incidence, h has an HIM, g has an MIM and i has an LIM. These
results can be interpreted as showing the responsiveness of a specific stakeholder
to environmental pressure. Hence, if the incidence level is high, then the pressure
exerted is higher and the pressure received is lower. If the incidence level is low,
then the pressure exerted is lower and the pressure received is greater.
(A) Power relative incidence
(B) Responsibility relative incidence
(C) Salience relative incidence
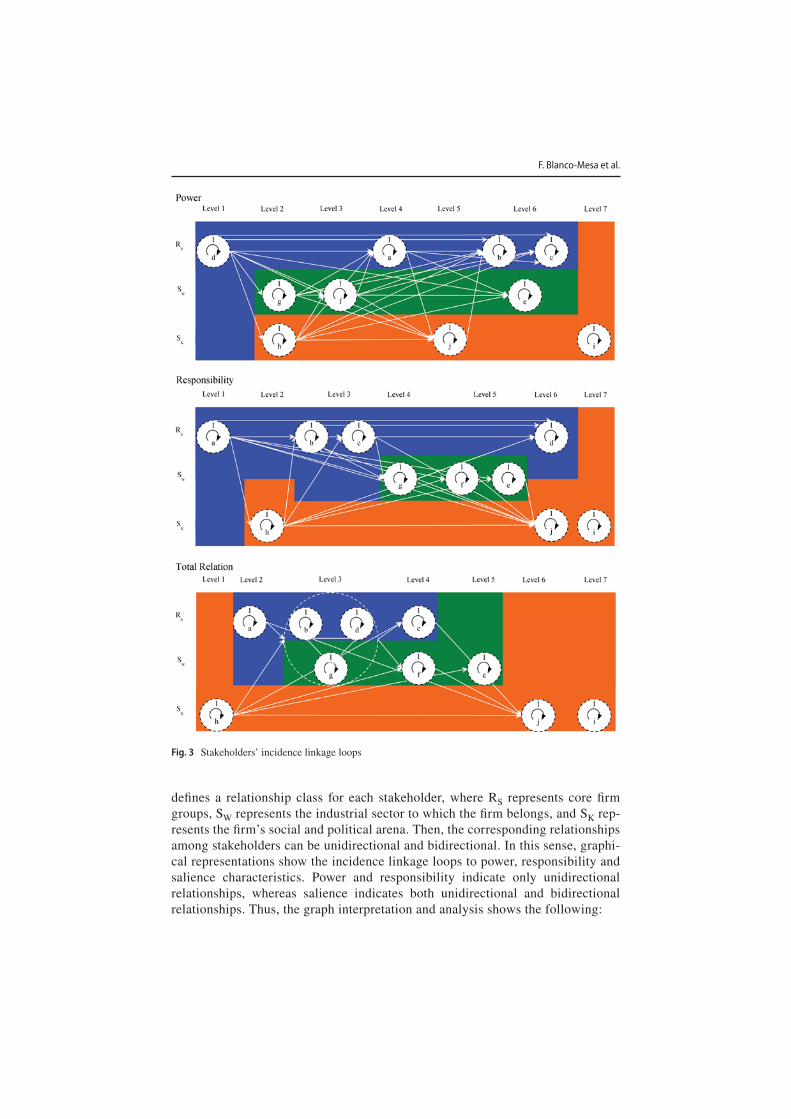
In Fig. 3, each category is represented graphically in which the possible influ-
ence between each stakeholder and the firm as unit are denoted in incidence
linkage loops (ILL). ILL establishes a relationship order structure using group-
ing concepts (Gil-Aluja 1999). These concepts allow the determination of linked
relationships and equivalent classes through lineal, total order and loop order of
indifferent objects. Thus, this structure allows relationship incidences to be indi-
cated at several levels and categories. These graphical representations show loops
(circles) and ties (lines); a loop denotes the total relationship of a stakeholder
with itself and a tie denotes links that shows the order of each stakeholder at
different incidence levels. This analysis is called the linked relationships analy-
sis and differs from that of the intensity of relation because it shows the relative
order of stakeholders within different levels and categories.
Here, each level indicates incidence relationships between each stakeholder,
where level 1 notes the greatest incidence and level 7 notes the lowest. In fact,
incidence levels might weaken or strengthen over a period of time, i.e., they can
be significant or non-significant but do not disappear. Likewise, each category
F. Blanco-Mesa et al.
Fig. 3 Stakeholders’ incidence linkage loops
defines a relationship class for each stakeholder, where RS represents core firm
groups, SW represents the industrial sector to which the firm belongs, and SK rep-
resents the firm’s social and political arena. Then, the corresponding relationships
among stakeholders can be unidirectional and bidirectional. In this sense, graphi-
cal representations show the incidence linkage loops to power, responsibility and
salience characteristics. Power and responsibility indicate only unidirectional
relationships, whereas salience indicates both unidirectional and bidirectional
relationships. Thus, the graph interpretation and analysis shows the following:
Subjective stakeholder dynamics relationships treatment:…
First, the graph of power incidences is of great usefulness when decision-makers
want to see how much power and influence an agent has over others. Thus, for our
hypothetical case’s core groups of a firm, d has the greatest power and influence
on the other agents belonging to the categories RS, SW and SK, whereas a exercises
power over b, c, e and j and f, g and h exercise power over a. Likewise, i does not
have any power incidence, which indicates that it is independent and its behavior
is not influenced nor does it exert any influence on the other agents. Hence, d has a
great degree of influence and power in the implementation of a new strategic diver-
sification plan. Second, the graph of responsibility incidences is greatly useful when
decision-makers want to know the level of incidence on responsibility an agent has
over the others. Thus, a has the highest level of responsibility on the whole struc-
ture, followed by h, whereas the responsibilities of d and j are limited, and b, c, e, f
and g have responsibility for specific stakeholders. Hence, a has the highest degree
of responsibility in the implementation of a new strategic diversification plan.
Third, the graph of salience incidences is greatly useful when decision-makers want
to observe in an integral way the incidence between each agent that comprises the
stakeholder set. Thus, h has the highest influence on the other agents belonging to
the categories RS, SW and SK, followed by a, whereas c, d, f and j have the lowest
influence. Furthermore, b, e and g have formed a strongly connected relation-loop,
highlighting their importance within the relational order. Hence, h has the highest
degree of influence on the other agents in the implementation of a new strategic
diversification plan
4.2 Implications and limitations
This research proposes a mathematical approximation providing a methodological
approach to analyzing subjective stakeholder dynamics in decision-making pro-
cesses. This proposition combines several algorithms belonging to the decision-
making theory in uncertainty, which allows the valuation and analysis of a decision-
maker’s subjective preferences when establishing the relationships with different
degrees of incidence. In this sense, it contributes in the generation of new methods
that allow the establishment of possible incidences that have the agents belonging to
the stakeholder set, from the treatment of the perceptions that have the people that
comprise them. This method is greatly useful, since the decisions made in stake-
holder management are taken by people, which are given by its particular inter-
ests when taking advantage of the position of existing power, the responsibilities
acquired and the relevance they give to some relationships over others. Within the
literature are a wide number of methodologies that allow the stakeholder relation-
ships to be examined. For example, we have shown in the literature review several
methods that aid in an understanding of dynamic stakeholder relationships, where
the works of Bourne and Walker (2005), Rowley (1997), Rowley and Moldoveanu
(2003), Varvasovszky and Brugha (2000), Hjortsø et al. (2005), Lange and Hehl-
Lange (2005), Holz et al. (2006), Memon and Wilson (2007), Finn et al. (2009),
Wolsink and Breukers (2010), Fassin (2009; 2010), Windsor (2011) and Elias
(2012) are highlighted. However, these tools have boundaries that are difficult to
F. Blanco-Mesa et al.
define and relevant stakeholders that are hard to identify (Ramirez 1999). In contrast
with these proposals, we have proposed a novel method for the treatment of the sub-
jective stakeholder dynamics, in which is considered human reasoning; presented as
subjective preferences, as key factor to modify stakeholder behavior in a dynamic
and uncertain process, where a firm’s decisions can be affected or affects stake-
holders. Thus, when subjective preferences change, relationship system between
firm’s stakeholders is more dynamics and uncertainty losing stability and certainty.
Likewise, if in a system take part on a great deal of agents will be more complex.
Hence, with this method, the identification of boundaries between each stakeholder
is not static and their linked and intensity relationships are relative and dynamic,
since they can move among several levels and categories, i.e. position and intensity
change by human rationality.
Correspondingly, this work presents several implications that will be useful in
future applications for real cases to analyze stakeholders’ behavior. Within the phe-
nomena of human nature is the development of mental constructs that relate, assign,
group and order information in anticipation of a decision’s possible consequences.
This process occurs so quickly that the human mind only manages to focus its atten-
tion on those elements that are considered important and are expressed in their
intentions, preferences and attitudes. Thus, in the decision-making process, this lack
of attention is a bias that leads to a great loss of information. Based on this premise,
a mathematical tool is developed that allows collecting these subjective assessments
to be processed without forgetting information that may be relevant. In this sense,
this tool is presented in an example to predict possible behaviors and the intensity of
the relations among stakeholders, focusing on the company.
First, a mathematical method is presented that allows a predictive simulation tool
to be made about attitude and personal preferences based on a mathematical assump-
tion for subjective preference. This methodology can aggregate subjective informa-
tion to determine the incidence, edges and behavior of relationships among stake-
holders according to each characteristic’s intensity. Intensity is established using
algorithms belonging to fuzzy systems, which are able to process agents’ personal
interests that comprise stakeholders through the valuations that capture their opin-
ions, perceptions and attitudes. Second, as a result of information processing, the
main outputs are obtained that are the matrices of relative intensity that allow us to
build the groupings and relationships between each stakeholder. These products are
of great importance because they offer theoretically sustainable results on the treat-
ment of subjectivity using non-parametric techniques, an aspect that is difficult to
predict using parametric techniques. Third, on the mathematical assumption of the
methodological application, the multiple relationships network can be weakened or
strengthened according to power/influence, responsibility, legality and salience posi-
tions. On the one hand, multiple relationships are characterized by their high degree
of variation in the relationship intensity, which explains its heterogeneity. On the
other hand, a position refers to groups or individuals who can affect or be affected
by the organization according to the relationship’s pragmatic aspects between the
stakeholders and the firm, i.e., a relationship determined by the market (Fassin 2009;
Freeman 2011). Hence, analyzing stakeholder dynamics in the decision-making pro-
cess implies how a firm’s decisions or actions can be affected or affect stakeholders
Subjective stakeholder dynamics relationships treatment:…
considering uncertain environmental factors like policies, economics, social, envi-
ronment and technological changes globally. In this sense, these dynamics can pro-
mote or restrict trust and cooperation affecting competitiveness, productivity, trans-
fer of knowledge, the conformation of strategic alliances and so on.
On the other hand, it is important to mention that in the literature there are similar
methods to allow comparing information. One of this is Analytical Hierarchy Pro-
cess (AHP), which allow comparison taking into account measurements or scales to
reflects the relative strength of preferences and feelings the analytic hierarchy pro-
cess (Saaty 1987). In AHP is presented an eigenvector solution for weights, where
weighted vectors normalization help to get priority vector. In the proposition pre-
sented, algorithms stated in Definitions 1, 2 and 3 are used to obtain eigenvalue and
eigenvector to build fuzzy relative matrices (FRM) and intensity relative matrices
(IRM). Hence, in this paper is used to get final results definitive results and not as
a previous step or creation of the priority vector. Likewise, (Yager 1988, 1993) has
proposed new methods to get weighted vectors through entropy of dispersion, Bal-
ance operator, divergence of W and degree of orness, which can be used to obtain
subjective preferences for futures researches.
However, this research has limitations due to this study’s nature. A prominent
limitation is the empirical validation of the research itself, since a mathemati-
cal method is proposed whose application is a supposition to prove its theoretical
operation. Similarly, as a mathematical proposition, methodological limitations exist
because it is presented as a hypothetical example to illustrate the operation of algo-
rithms to show how the assumption subjective preference is parameterized. Hence,
these methodological limitations are evident, as they are used as important elements
in the stakeholder theory to elaborate the hypothetical examples to study the stake-
holder’s relationships and their implications when making a decision.
5 Conclusions
We study stakeholder theory and briefly review developed stakeholder analysis tools
to evaluate the environment and identify the relations among groups that constitute
stakeholders. Likewise, we highlight the changing relationships among stakeholders
in a dynamic and uncertain process. We also briefly review fuzzy decision-making
and its application in business studies. We highlight the methodology developed by
Gil-Aluja (1999), which explores the broad notion of relation using the importance-
of-characteristics-ordering and linking-of-relations methods. We propose a novel
method that makes a predictive simulation tool about attitude and personal pref-
erences based on a mathematical assumption subjective preference. We present a
numerical example to demonstrate the proposed method’s usefulness and feasibility.
The numerical example is focused on a mathematical assumption for the treatment
of stakeholder relationships, which considers the P, L, and R characteristics and the
Rs, Sw and Sk categories for an environment of uncertainty. The main advantage of
using this method is that it can parameterize the importance of information about
each characteristic according to the decision-maker’s preferences Additionally,
F. Blanco-Mesa et al.
subjective information is provided by experts who possess knowledge but do not
know the effect of their decisions.
Results of the numerical mathematical assumption subjective preference example
allow the fuzzy subjective preference and relative intensity to be obtained between
each stakeholder. These results are depicted to show the intensity of the stakehold-
ers’ importance and their incidence linkage loops. Likewise, the graphical represen-
tation allows an interpretation to be obtained of the responsiveness and significant
level of a specific stakeholder’s incidence. The mathematical tool application is
developed that allows these collected subjective assessments to be processed with-
out forgetting information that may be relevant. First, the method allows a predictive
simulation tool to be made about attitude and personal preferences. Furthermore, it
offers theoretically sustainable results on the treatment of subjectivity using non-
parametric techniques, an aspect that is difficult to predict using parametric tech-
niques. Hence, analyzing subjective stakeholder dynamics in the decision-making
process implies how a firm’s decisions or actions can be affected or affects stake-
holders considering uncertain environment factors.
However, this research has limitations due to the study’s nature as empirical and
methodological validation, since a hypothetical example was used based on impor-
tant elements in stakeholder theory. Likewise, the model continues to be fully valid,
and specific results will evolve in the medium and long term according to the func-
tional trend that the dynamic process itself will provide. In future studies, this novel
methodology can be applied in stakeholder case studies to understand its applicabil-
ity and scope.
Acknowledgements We would like to thank the anonymous reviewers for valuable comments that have
improved the paper’s quality.
References
Atanassov KT (1986) Intuitionistic fuzzy sets. Fuzzy Sets Syst 20:87–96
Bellman RE, Zadeh LA (1970) Decision-making in a fuzzy environment. Manag Sci 17:B-141–B-164
Blanco-Mesa F (2015) Técnicas para la toma de decisiones en contextos inciertos: identificación de opor-
tunidades socio- económicas en el ámbito deportivo. Universitat de Barcelona, Barcelona
Blanco-Mesa F, Gil-Lafuente AM (2014) Characterization and grouping of the Colombia regions for
development of clusters: An application of the Pichat algorithm. J Comput Optim Econ Financ
5:187–196
Blanco-Mesa F, Gil-Lafuente AM (2017) Towards a competitiveness in the economic activity in Colom-
bia: using Moore’s families and Galois latticies in clustering. Econ Comput Econ Cybern Stud Res
51:231–250
Blanco-Mesa F, Gil-Lafuente AM, Merigó JM (2015) New aggregation methods for decision-making in
the selection of business opportunities. In: Gil-Aluja J, Terceño-Gomez A, Ferrer-Comalat JC et al
(eds) Scientific methods for the treatment of uncertainty in social science. Springer International
Publishing, Girona, pp 3–18Blanco-Mesa F, Merigó JM, Gil-Lafuente AM (2017) Fuzzy decision making: a bibliometric-based
review. J Intell Fuzzy Syst 32:2033–2050
Blanco-Mesa F, Gil-Lafuente AM, Merigó JM (2018) New aggregation operators for decision-making
under uncertainty: an applications in selection of entrepreneurial opportunities. Technol Econ Dev
Econ 24:335–357
Bourne L, Walker DHT (2005) Visualising and mapping stakeholder influence. Manag Decis 43:649–660

Subjective stakeholder dynamics relationships treatment:…
Carlsson C, Fullér R (1996) Fuzzy multiple criteria decision making: recent developments. Fuzzy Sets
Syst 78:139–153
Chen SJ, Hwang CL (1992) Fuzzy multiple attribute decision making: methods and applications.
Springer, Berlin
Donaldson T, Preston LE (1995) The stakeholder theory of the corporation: concepts, evidence and
implications. Acad Manag Rev 20:65–91
Elias AA (2012) A system dynamics model for stakeholder analysis in environmental conflicts. J Environ
Plan Manag 55:387–406
Fassin Y (2007) Imperfections and shortcomings of the stakeholder model’s graphical representation. J
Bus Ethics 80:879–888
Fassin Y (2009) The stakeholder model refined. J Bus Ethics 84:113–135. https ://doi.org/10.1007/s1055
1-008-9677-4
Fassin Y (2010) A dynamic perspective in Freeman’s stakeholder model. J Bus Ethics 96:39–49
Finn JA, Bartolini F, Bourke D et al (2009) Ex post environmental evaluation of agri-environment
schemes using experts’ judgements and multicriteria analysis. J Environ Plan Manag 52:717–737
Freeman RE (1984) Strategic management: a stakeholder approach. Pitman, Boston
Freeman RE (2004) The stakeholder approach revisited. Zeitschrift für Wirtschafts und Unternehmen-
sethik 5:228–241
Freeman RE (2011) Managing for stakeholders: trade-offs or value creation. J Bus Ethics 96:7–9
Friedman AL, Miles S (2002) Developing stakeholder theory. J Manag Stud 39:1–21
Frooman J (1999) Stakeholder influence strategies. Acad Manag Rev 24:191–205
Gil-Aluja J (1996) Towards a new paradigm of investment selection in uncertainty. Fuzzy Sets Syst
84:187–197
Gil-Aluja J (1999) Elements for a theory of decision in uncertainty. Kluwer Academic Publishers,
Dordrecht
Gil-Aluja J (2000) Lances y desventuras del nuevo paradigma de la teoría de la decisión. Proceedings del
III Congreso SIGEF. SIGEF, Buenos Aires, pp 11–37
Gil-Lafuente J (1997) Marketing para el nuevo milenio: Nuevas técnicas para la gestión comercial en la
incertidumbre. Ediciones Pirámide, Barcelona
Gil-Lafuente J (2001) Algoritmos para la excelencia: Claves para el éxito en la gestión deportiva. Barce-
lona Editions, Barcelona, F.C
Gil-Lafuente J (2002) Keys for success in sport management. Ed. Malladoiro, Vigo
Gil-Lafuente J (2008) Automatismos y racionalidad en la toma de decisiones para sustituir a un deportista
en momentos decisivos. Cuad gestión 8:39–57
Gil-Lafuente AM, Barcellos de Paula L (2010) Una aplicación de la metodología de los efectos olvida-
dos: Los factores que contribuyen al crecimiento sostenible de la empresa. Cuad del CIMBAGE
12:23–34
Gil-Lafuente AM, Barcellos de Paula L (2013) Algorithm applied in the identification of stakeholders.
Kybernetes 42:674–685
Gil-Lafuente AM, Luis Bassa C (2011) The forgotten effects model in a CRM strategy. Fuzzy Econ Rev
16:3–19
Gil-Lafuente AM, Klimova A, Imanov K (2012a) Forgotten effects in the comparative economic analysis
for Spain and Russia in conditions of globalization. In 2012 IV international conference “problems
of cybernetics and informatics” (PCI). IEEE, Baku, pp 1–4
Gil-Lafuente AM, Blanco-Mesa F, Castillo C (2012b) The forgotten effects of sport. In: Gil-Lafuente
AM, Gil-Lafuente J, Merigó-Lindahl JM (eds) Soft computing in management and business eco-
nomics. Springer, Berlin Heidelberg, Berlin, Heidelberg, pp 375–391
He X, Wu Y, Yu D, Merigó JM (2017) Exploring the ordered weighted averaging operator knowledge
domain: a bibliometric analysis. Int J Intell Syst 32:1151–1166
Hjortsø CN, Christensen SM, Tarp P (2005) Rapid stakeholder and conflict assessment for natural
resource management using cognitive mapping: the case of Damdoi Forest Enterprise, Vietnam.
Agric Human Values 22:149–167
Holz L, Kuczera G, Kalma J (2006) Multiple criteria decision making: facilitating a learning environ-
ment. J Environ Plan Manag 49:455–470
Holzer B (2007) Turning stakeseekers into stakeholders: a political coalition perspective on the politics of
stakeholder influence. Bus Soc 47:50–67
Hwang C-L, Yoon K (1981) Multiple attribute decision making. Springer, Berlin Heidelberg
Kacprzyk J (1986) Group decision making with a fuzzy linguistic majority. Fuzzy Sets Syst 18:105–118
F. Blanco-Mesa et al.
Kaufmann A, Gil-Aluja J (1988) Modelos para la investigación de los efectos olvidados. Milladoiro, Vigo
Kaufmann A, Gil-Aluja J (1991) Nuevas técnicas para la dirección estratégica. Publicacions Universitat de
Barcelona, Barcelona
Kaufmann A, Gil-Aluja J (1992) Técnicas de gestión de empresa: previsiones, decisiones y estrategias. Edi-
ciones Pirámide
Kaufmann A, Gil-Aluja J (1993) Técnicas especiales para la gestión de expertos. Villadoiro, Vigo
Kaufmann A, Gil-Aluja J (1995) Grafos Neuronales para la Economía y la Gestión de Empresas. Ediciones
Pirámide, Madrid
Kaufmann A, Gil-Aluja J, Gil-Lafuente AM (1994) La creatividad en la gestión de las empresas. Ediciones
Pirámide, Madrid
Kochenderfer MJ (2015) Decision making under uncertainty: theory and application. MIT Lincoln Labora-
tory Series, Cambrige
Laengle S, Loyola G, Merigo JM (2017) Mean-variance portfolio selection with the ordered weighted aver-
age. IEEE Trans Fuzzy Syst 25:350–362
Lange E, Hehl-Lange S (2005) Combining a participatory planning approach with a virtual landscape model
for the siting of wind turbines. J Environ Plan Manag 48:833–852
León-Castro E, Avilés-Ochoa E, Merigó JM, Gil-Lafuente AM (2018) Heavy moving averages and their
application in econometric forecasting. Cybern Syst 49:26–43
Maqueda Lafuente JF, Gil-Lafuente AM, Guzman-Parra VF, Gil-Lafuente J (2013) Key factors for entrepre-
neurial success. Manag Decis 51:1932–1944
Martorell-Cunill O, Gil-Lafuente AM, Socias Salvà A, Mulet Forteza C (2013) The growth strategies in
the hospitality industry from the perspective of the forgotten effects. Comput Math Organ Theory
20:195–210
Memon PA, Wilson GA (2007) Contesting governance of indigenous forests in New Zealand: the case of the
West Coast Forest Accord. J Environ Plan Manag 50:745–764
Merigó JM, Gil-Lafuente AM (2009) The induced generalized OWA operator. Inf Sci (Ny) 179:729–741
Merigó JM, Gil-Lafuente AM, Yager RR (2015) An overview of fuzzy research with bibliometric indicators.
Appl Soft Comput 27:420–433
Mitchell RK, Agle BR, Wood DJ (1997) Toward a theory of stakeholders identification and salience: defining
the principle of who and what really. Acad Manag Rev 22:853–886
Nicolás C, Gil-Lafuente J (2012) Customer experience assessment: forgotten effects. J Comput Optim Econ
Financ 4:77–88
Post JE, Preston LE, Sachs S (2002) Managing the extended enterprise: the new stakeholder view. Calif Man-
age Rev 45:6–28
Ramirez R (1999) Stakeholder analysis and conflict management. In: Buckles D (ed) Cultivating peace: con-
flict and collaboration in. World Bank Institute, Whasintong, pp 101–126
Rowley TJ (1997) Moving beyond dyadic ties: a network theory of stakeholder influences. Acad Manag Rev
22:887–910
Rowley TI, Moldoveanu M (2003) When will stakeholder groups act? An interest and identity: based model
of stakeholder group mobilization. Acad Manag Rev 28:204–219
Saaty TL (1980) Analytical hierarchy process. McGraw-Hill, New York
Saaty RW (1987) The analytic hierarchy process: what it is and how it is used. Math Model 9:161–176
Saaty TL (1990) How to make a decision: the analytic hierarchy process. Eur J Oper Res 48:9–26
Salazar-Garza R (2012) The mexican peso: exchange risk coverage management through the forgotten effects
theory. J Econ Financ Adm Sci 17:53–73
Sciarelli M, Tani M (2013) Network approach and stakeholder management. Bus Syst Rev 2:175–190
Stave KA (2002) Using system dynamics to improve public participation in environmental decisions. Syst
Dyn Rev 18:139–167
Tanino T (1984) Fuzzy preference orderings in group decision making. Fuzzy Sets Syst 12:117–131
Tzeng GH, Huang JJ (2011) Multiple attribute decision making: methods and applications. Chapman and
Hall/CRC, Boca Raton
Varvasovszky Z, Brugha R (2000) A stakeholder analysis. Health Policy Plan 15:338–345
Vizuete Luciano E, Gil-Lafuente AM, García González A, Boria-Reverte S (2013) Forgotten effects of cor-
porate social and environmental responsibility. Kybernetes 42:736–753
Waddock S (2011) We are all stakeholders of Gaia: a normative perspective on stakeholder thinking. Organ
Environ 24:192–212
Wagner E, Alves H, Raposo M (2011) Stakeholder theory: issues to resolve. Manag Decis 49:226–252
Windsor D (2011) The role of dynamics in stakeholder thinking. J Bus Ethics 96:79–87
Subjective stakeholder dynamics relationships treatment:…
Winn MI (2001) Building stakeholder theory with a decision modeling methodology. Bus Soc 40:133–166
Wolsink M, Breukers S (2010) Contrasting the core beliefs regarding the effective implementation of wind
power. an international study of stakeholder perspectives. J Environ Plan Manag 53:535–558
Xu Z (2015) Uncertain multi-attribute decision making: Methods and applications. Springer, Berlin
Yager RR (1988) On ordered weighted averaging aggregation operators in multicriteria decision-making.
IEEE Trans Syst Man Cybern 18:183–190
Yager RR (1993) Families of OWA operators. Fuzzy Sets Syst 59:125–148
Zadeh LA (1965) Fuzzy sets. Inf Control 8:338–353
Zadeh LA (1975a) The concept of a linguistic variable and its application to approximate reasoning I. Inf Sci
(Ny) 8:199–249
Zadeh LA (1975b) The concept of a linguistic variable and its application to approximate reasoning II. Inf
Sci (Ny) 8:301–357
Zadeh LA (1975c) The concept of a linguistic variable and its application to approximate reasoning III. Inf
Sci (Ny) 9:43–80
Zadeh LA (1999) Fuzzy sets as a basis for a theory of possibility. Fuzzy Sets Syst 100:9–34
Zimmermann HJ (1978) Results of empirical studies in fuzzy set theory. Plenum Press, New York
Zimmermann HJ (1986) Fuzzy sets, decision making and expert systems. Kluwer Academic Publishers,
Netherlands
Zimmermann HJ, Zadeh L, Gaines B (1984) Fuzzy sets and decision analysis. North-Holland, Amsterdam
Fabio Blanco-Mesa is a PhD student at the Department of Business Administration at the University of
Barcelona, Spain. He also holds a Bachelor from the District University Francisco Jose of Caldas and an
MSc in Business Research from the University of Barcelona. He has published several papers in interna-
tional journals, books and conference proceedings including International Journal of Intelligent Systems,
Knowledge-Based Systems, Kybernetes, Applied Soft Computing and Technological and Economic
Development of Economy. He also serves as a reviewer for several international journals. He is currently
interested in Decision Making, Entrepreneurship, Competitiveness, Fuzzy Systems, Aggregation Opera-
tors, Strategy, Stakeholders, Sport Management and Uncertainty.
Anna María Gil-Lafuente is a Professor in the Department of Business Administration at the University
of Barcelona (Spain). She has an MSc and a PhD Degree in Business Administration from the University
of Barcelona. She has published more than 450 papers in journals, books and conference proceedings
including journals such as Information Sciences, International Journal of Intelligent Systems, Applied
Soft Computing, International Journal of Uncertainty, Fuzziness and Knowledge-Based Systems and
Expert Systems with Applications. She has published more than 20 books including 10 with Springer and
2 with World Scientific. She is editor-in-chief of Nova Sciences Collection Computational Intelligence in
Engineering, Economics, and Management and co-editor-in-chief of 8 journals published by the Associa-
tion for Modeling and Simulation in Enterprises (AMSE). She is on the editorial board of several journals
and scientific committees. She has also served as a reviewer for many journals. She is currently interested
in Decision Making, Aggregation operators, Fuzzy Systems, Uncertainty and Finance.
José M. Merigó is a Professor at the Department of Management Control and Information Systems at the
University of Chile. Previously, he was a Senior Research Fellow at the Manchester Business School,
University of Manchester (UK) and an Assistant Professor in the Department of Business Administration
at the University of Barcelona (Spain). He has a MSc and a PhD degree in Business Administration from
University of Barcelona, Spain. He also holds a Bachelor Degree in Economics and a Master Degree in
European Business Administration and Business Law from Lund University, Sweden. He has published
more than 300 papers in journals, books and conference proceedings including journals such as Informa-
tion Sciences, European Journal of Operational Research, Technological and Economic Development of
Economy, Expert Systems with Applications, International Journal of Intelligent Systems and Computers
& Industrial Engineering. He has published 10 books including four with Springer and two with World
Scientific. He is on the editorial board of several journals including the Journal of Business Research,
Technological and Economic Development of Economy, Journal of Intelligent & Fuzzy Systems and
Economic Computation and Economic Cybernetics Studies and Research. He has participated in several
scientific committees and serves as a reviewer in a wide range of journals. He is currently interested in
Aggregation Operators, Decision Making, Uncertainty and Bibliometrics.
F. Blanco-Mesa et al.
Affiliations
Fabio Blanco-Mesa1 · Anna María Gil-Lafuente2 · José M. Merigó3
Anna María Gil-Lafuente
José M. Merigó
1 Universidad Pedagógica y Tecnológica de Colombia, Av. Central del Norte 39-115,
Tunja 150001, Boyacá, Colombia
2 University of Barcelona, Av. Diagonal, 690, 08034 Barcelona, Spain
3 Department of Management Control and Information Systems, School of Economics
and Business, University of Chile, Av. Diagonal Paraguay 257, 8330015 Santiago, Chile