Embed Size (px)
Citation preview
© 2014 S. Karger AG, Basel1664–5464/14/0043–0419$39.50/0
Original Research Article
Dement Geriatr Cogn Disord Extra 2014;4:419–430
Subjective Cognitive Impairment Subjects in Our Clinical Practice Sara Garcia-Ptacek a, b, i, j Lena Cavallin c, f Ingemar Kåreholt e, g Milica Gregoric Kramberger d, h Bengt Winblad h Vesna Jelic a, b Maria Eriksdotter a, b
a Division of Clinical Geriatrics, Department of Neurobiology, Care Sciences and Society, b Department of Geriatric Medicine, Karolinska University Hospital, c Department of Clinical Science, Intervention and Technology, and d Karolinska Institutet Alzheimer Disease Research Center, Department of Neurobiology, Care Sciences and Society, Karolinska Institutet, e Aging Research Center, Karolinska Institutet and Stockholm University, and f Department of Radiology, Karolinska University Hospital, Stockholm , and g Institute for Gerontology, School of Health Sciences, Jönköping University, Jönköping , Sweden; h Department of Neurology, University Medical Centre, Ljubljana , Slovenia; i Department of Neurology, Hospital Clínico San Carlos, and j Department of Medicine, Universidad Complutense de Madrid, Madrid , Spain
Key Words Alzheimer’s disease · Dementia · Mild cognitive impairment
Abstract Background: The clinical challenge in subjective cognitive impairment (SCI) is to identify which individuals will present cognitive decline. We created a statistical model to determine which variables contribute to SCI and mild cognitive impairment (MCI) versus Alzheimer’s dis-ease (AD) diagnoses. Methods: A total of 993 subjects diagnosed at a memory clinic (2007–2009) were included retrospectively: 433 with SCI, 373 with MCI and 187 with AD. Descriptive statistics were provided. A logistic regression model analyzed the likelihood of SCI and MCI patients being diagnosed with AD, using age, gender, Mini-Mental State Examination score, the ratio of β-amyloid 42 divided by total tau, and phosphorylated tau as independent vari-ables. Results: The SCI subjects were younger (57.8 ± 8 years) than the MCI (64.2 ± 10.6 years) and AD subjects (70.1 ± 9.7 years). They were more educated, had less medial temporal lobe atrophy (MTA) and frequently normal cerebrospinal fluid biomarkers. Apolipoprotein E4/E4 homozygotes and apolipoprotein E3/E4 heterozygotes were significantly less frequent in the SCI group (6 and 36%) than in the AD group (28 and 51%). Within the regression model, car-diovascular risk factors, confluent white matter lesions, MTA and central atrophy increased
Published online: November 11, 2014
E X T R A
Sara Garcia-Ptacek Division of Clinical Geriatrics, Department of Neurobiology, Care Sciences and Society, Karolinska Institutet, Section for Clinical Geriatrics Novum plan 5, SE–141 86 Stockholm (Sweden) E-Mail sara.garcia-ptacek @ ki.se
www.karger.com/dee
DOI: 10.1159/000366270
This is an Open Access article licensed under the terms of the Creative Commons Attribution-NonCommercial 3.0 Unported license (CC BY-NC) (www.karger.com/OA-license), applicable to the online version of the article only. Distribution permitted for non-commercial purposes only.
420Dement Geriatr Cogn Disord Extra 2014;4:419–430
DOI: 10.1159/000366270
E X T R A
Garcia-Ptacek et al.: Subjective Cognitive Impairment Subjects in Our Clinical Practice
www.karger.com/dee© 2014 S. Karger AG, Basel
the AD likelihood for SCI subjects. Conclusions: SCI patients form a distinct group. In our model, factors suggesting cardiovascular risk, MTA and central atrophy increased the AD like-lihood for SCI subjects. © 2014 S. Karger AG, Basel
Introduction
Subjective cognitive impairment (SCI) can be defined as the presence of cognitive complaints in the absence of pathological neuropsychological testing [1] . SCI patients represent a significant sample of the population attended to memory clinics worldwide [2] . The question remains whether the difficulties noticed in SCI represent an early stage in the dementia process which escapes formal neuropsychological testing [an SCI-mild cognitive impairment (MCI)-Alzheimer’s disease (AD) continuum] or whether they are the result of other coexisting condi-tions, such as mood disorders [3–9] . In some studies, the SCI group differs from the general aging population in parameters such as behavioral and psychological symptoms [10] , cerebro-spinal fluid (CSF) biomarkers [11, 12] , hippocampal and cortical volumes [13–15] , functional neuroimaging [12, 16, 17] and AD pathology [18, 19] . Other studies contradict these findings [7, 20] , and the significance and prognosis of an SCI diagnosis remain unclear.
In the first part of this paper, we aim to describe the characteristics of the patients who are referred for cognitive assessment and receive an SCI diagnosis in a specialist memory clinic setting. In the second part, we enter clinical and paraclinical variables into a statistical model that accurately distinguishes between diagnoses. In this way, we evaluate which factors correlate with AD likelihood within the model.
Methods
Patient Characteristics The Karolinska Memory Clinic is based at the Department of Geriatric Medicine at the
Karolinska University Hospital, Huddinge, Sweden, and receives approximately 450 new patients each year. The clinic provides treatment for dementia disorders of the geriatric popu-lation of the adjacent hospital area as well as memory problems of the inhabitants of the greater Stockholm area aged <65 years. The patient groups are therefore highly heterogeneous.
A total of 1,154 patients were referred to the Karolinska Memory Clinic from 2007 through 2009. Patient interviews and clinical assessments were accompanied by physical examinations and cognitive screening, which dictated further testing [21] . The investigations chosen were based on the patients’ clinical presentation, symptoms and clinical examination. Diagnoses were made by a senior consultant in consensus with a team of geriatricians, neurol-ogists, neuropsychologists, nurses, occupational therapists, psychiatrists and speech thera-pists [2] involved in each case. For the diagnosis of SCI, the ICD-10 classification was employed, i.e., ‘Z03.3 = observation for suspected nervous system disorder’, when the patient had subjective memory problems that could not be confirmed objectively [22] . MCI was diag-nosed applying the consensus criteria for MCI [23] ; the ICD-10/DSM-IV criteria were used for dementia [22, 24] and the NINCDS-ADRDA criteria for AD [21, 25] . Patients were excluded if they were not diagnosed with AD, MCI or SCI or if they had coexisting conditions that might put the diagnosis in doubt, such as congenital cerebral abnormalities, aggressive neoplasm or concurrent epilepsy. Patients with common psychiatric comorbidities, such as depression, or chronic somatic diseases, such as heart conditions, were not excluded. This resulted in a total of 993 included patients.
421Dement Geriatr Cogn Disord Extra 2014;4:419–430
DOI: 10.1159/000366270
E X T R A
Garcia-Ptacek et al.: Subjective Cognitive Impairment Subjects in Our Clinical Practice
www.karger.com/dee© 2014 S. Karger AG, Basel
Our sample was retrospectively drawn from routine clinical records, thus representing a naturalistic sample where the patients’ clinical picture dictated diagnostic plans.
Assessment Neuroimaging All patients underwent neuroimaging (24.8% CT, 75.2% MRI), which was performed at
different radiology departments in Stockholm and neighboring counties, with different machines and protocols.
Of the 993 included patients, 560 underwent blinded medial temporal lobe atrophy (MTA) rating. MTA was assessed visually using the Scheltens scale [26] on a coronal T1-weighted sequence in MRI or on a CT scan with coronal reconstruction. Since previous studies have demonstrated good agreement between multidetector row CT and 1.5-tesla MRI [27] , all pa-tients with an MRI or CT scan were included in the study. The coronal series were angulated perpendicular to a line between the anterior and posterior commissures (AC-PC) or perpen-dicular to the long axis of the brainstem [28] . Scores ranged from 0 (no atrophy) to 4 (severe atrophy), where grades 3 and 4 are referred to as clearly pathological. The left and right MTA were rated separately. The assessment was done by one rater (L.C.) who was blinded to the clinical data.
White matter lesions (WML) were assessed in 943 of the included patients on axial FLAIR MRI and axial CT scans with a grading system based on the revised Fazekas scale [29] : no WML, few WML and confluent WML. Because of the possible lack of comparability between WML evaluated by CT and those evaluated by MRI, the results are presented for both neuro-imaging methods together and separately.
Central atrophy, defined as loss in central gray matter and widening ventricles compared to a standard 25-year-old individual, was assessed in 980 patients on an axial FLAIR sequence or axial CT scan and rated dichotomously as presence or absence of atrophy. Cortical atrophy was rated dichotomously in 980 patients, and evaluated as widening sulci and atrophy of gyri in different cortical regions.
Due to differences in protocol and neuroimaging techniques, not all neuroradiological variables could be evaluated for all patients; in this case, only the variables included on the imaging slides were considered.
CSF Analyses CSF was obtained by standard lumbar puncture. CSF data were available for 744 patients.
All samples were stored at –80 ° C until analysis. CSF total tau (t-tau), phosphorylated tau (p-tau) and 42-residue amyloid-β (Aβ 42 ) were determined using a commercially available sandwich ELISA (Innogenetics, Ghent, Belgium) [30] . The cutoff points employed for the diag-nosis were ≥ 400 ng/l for t-tau, ≥ 80 ng/l for p-tau and ≤ 450 ng/l for Aβ 42 . These cutoffs were defined by the Department of Clinical Chemistry at the Karolinska University Hospital and are those employed in clinical practice.
Apolipoprotein E Genotyping Patient DNA samples for apolipoprotein E (ApoE) genotype analyses were extracted
from peripheral white blood cells using standard methods [31] , and ApoE genotypes were determined by a microsequencing method on microtiter plates (AffiGene ApoE, Sangtec Medical, Bromma, Sweden). ApoE data on 325 of the included patients were available.
Neuropsychological Testing and Clinical Evaluation Neuropsychological testing included the Mini-Mental State Examination (MMSE) [32] and
a combination of the following: information and similarities, logical memory, block design and
422Dement Geriatr Cogn Disord Extra 2014;4:419–430
DOI: 10.1159/000366270
E X T R A
Garcia-Ptacek et al.: Subjective Cognitive Impairment Subjects in Our Clinical Practice
www.karger.com/dee© 2014 S. Karger AG, Basel
digit symbol [Wechsler Adult Intelligence Scale, Revised (WAIS-R)] [33] ; Wechsler Memory Scale, Revised [34] ; figure classification [subtest of the Synonyms Reasoning Block Test (SRB2)] [35] ; Rey Auditory Verbal Learning Test (RAVLT) [36] ; copying and memory (subtest of the Rey-Osterrieth Complex Figure Test) [37] ; Trail Making Test parts A and B [34] , and/or Verbal Fluency Test (FAS) [38] . The clinical evaluation included the assessment of behavioral and psychological symptoms associated with dementia (BPSD), which were evaluated by interview and registered as the presence or absence of positive or negative BPSD. Depression was deter-mined both with a clinical interview and with the Cornell Scale for Depression in Dementia (CSDD) [39] , where a score >8 indicates depression. Patients were considered to have a positive family history of dementia when there was at least 1 affected first-degree relative.
Statistical Evaluation Descriptive Statistics Group differences for discrete variables were calculated with χ 2 tests. Some of the vari-
ables where group differences were presented as means were non-normal. Therefore, p values were obtained from binary logistic regression, since this corresponds with nonpara-metric log-linear tests of the means. For each variable, the MCI and AD group means were compared with the SCI group mean.
Statistical Model A statistical model was created to analyze the likelihood of being diagnosed with AD
among the patients in our database. This required three steps. First, a statistical logistic regression model was established that accurately classified patients as AD/not AD, as defined by their clinical diagnoses. A number of models were tested, and the model containing age, gender, MMSE score, Aβ 42 /t-tau ratio and p-tau as independent variables was the most accurate one, classifying 94.9% of the patients correctly. Second, the model was applied to every patient in the SCI, AD and MCI groups, and to each subject, the probability of being diag-nosed with AD was assigned by the model (ranging from 0.0 to 99.2%). These probabilities were stored as a variable (henceforth referred to as AD likelihood). Finally, they were used as the outcome in separate models for the MCI and SCI groups. All clinical variables were introduced one at a time in an effort to identify the ones which were associated with an increased probability of being diagnosed with AD.
These variables included clinical data (years of education, cardiovascular risk factors, positive BPSD, negative BPSD, presence of allergies, alcohol abuse, stroke or transient ischemic attack, parkinsonism, rheumatoid arthritis and chronic inflammatory disease), current treatments (acetylsalicylic acid, nonsteroidal anti-inflammatory drugs, steroids, anti-hypertensive therapy and neuroleptics) and neuroimaging data (frontal, temporal and parietal atrophy, generalized atrophy, central atrophy, WML, mean MTA, MTA on the left side, MTA on the right side and the highest MTA score for each patient). Dichotomous variables were derived from MTA, such as MTA ≥ 2 and ≥ 3 for the left and right sides, as a mean value, and as a maximum value on either side. Also entered were neuropsychological tests, the CSDD score and other paraclinical data (ApoE phenotype, background electroencephalogram rhythm, elevated thyroid-stimulating hormone and elevated homocysteine).
Results
Descriptive Statistics In the analyses, 433 patients with SCI, 373 with MCI and 187 with AD were included.
Descriptive statistics are given in tables 1–4 . The SCI patients were significantly younger
423Dement Geriatr Cogn Disord Extra 2014;4:419–430
DOI: 10.1159/000366270
E X T R A
Garcia-Ptacek et al.: Subjective Cognitive Impairment Subjects in Our Clinical Practice
www.karger.com/dee© 2014 S. Karger AG, Basel
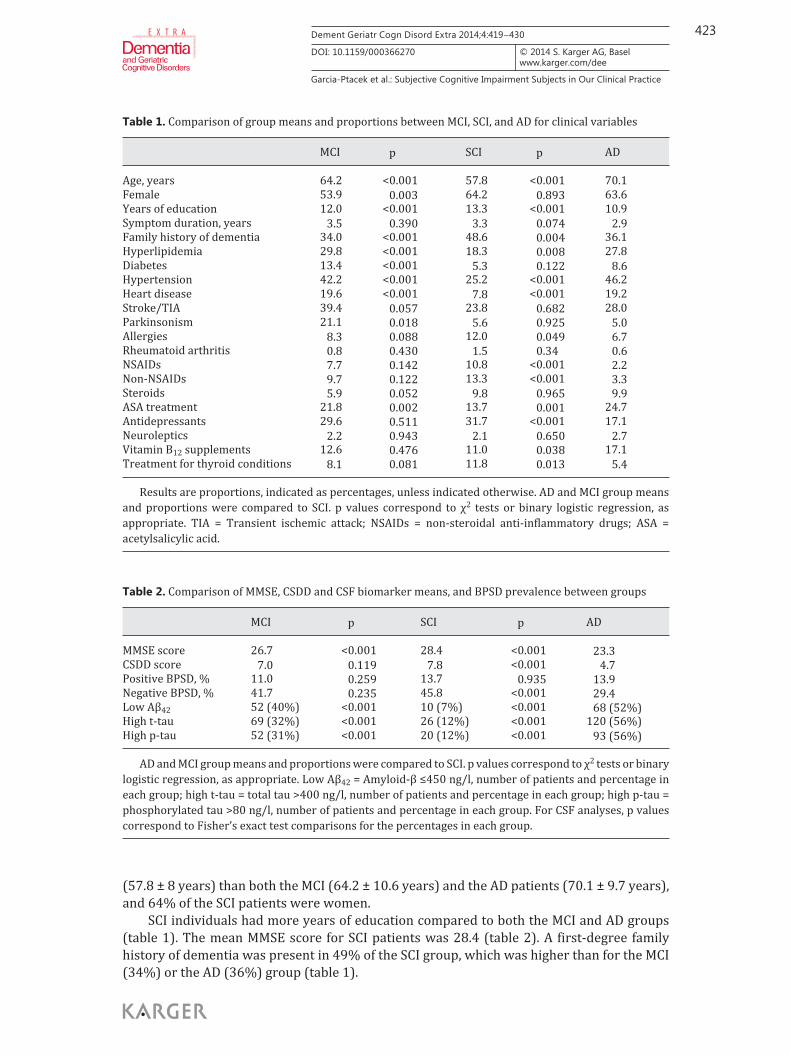
(57.8 ± 8 years) than both the MCI (64.2 ± 10.6 years) and the AD patients (70.1 ± 9.7 years), and 64% of the SCI patients were women.
SCI individuals had more years of education compared to both the MCI and AD groups ( table 1 ). The mean MMSE score for SCI patients was 28.4 ( table 2 ). A first-degree family history of dementia was present in 49% of the SCI group, which was higher than for the MCI (34%) or the AD (36%) group ( table 1 ).
Table 1. Comparison of group means and proportions between MCI, SCI, and AD for clinical variables
MCI p SCI p AD
Age, years 64.2 <0.001 57.8 <0.001 70.1Female 53.9 0.003 64.2 0.893 63.6Years of education 12.0 <0.001 13.3 <0.001 10.9Symptom duration, years 3.5 0.390 3.3 0.074 2.9Family history of dementia 34.0 <0.001 48.6 0.004 36.1Hyperlipidemia 29.8 <0.001 18.3 0.008 27.8Diabetes 13.4 <0.001 5.3 0.122 8.6Hypertension 42.2 <0.001 25.2 <0.001 46.2Heart disease 19.6 <0.001 7.8 <0.001 19.2Stroke/TIA 39.4 0.057 23.8 0.682 28.0Parkinsonism 21.1 0.018 5.6 0.925 5.0Allergies 8.3 0.088 12.0 0.049 6.7Rheumatoid arthritis 0.8 0.430 1.5 0.34 0.6NSAIDs 7.7 0.142 10.8 <0.001 2.2Non-NSAIDs 9.7 0.122 13.3 <0.001 3.3Steroids 5.9 0.052 9.8 0.965 9.9ASA treatment 21.8 0.002 13.7 0.001 24.7Antidepressants 29.6 0.511 31.7 <0.001 17.1Neuroleptics 2.2 0.943 2.1 0.650 2.7Vitamin B12 supplements 12.6 0.476 11.0 0.038 17.1Treatment for thyroid conditions 8.1 0.081 11.8 0.013 5.4
Results are proportions, indicated as percentages, unless indicated otherwise. AD and MCI group means and proportions were compared to SCI. p values correspond to χ2 tests or binary logistic regression, as appropriate. TIA = Transient ischemic attack; NSAIDs = non-steroidal anti-inflammatory drugs; ASA = acetylsalicylic acid.
Table 2. Comparison of MMSE, CSDD and CSF biomarker means, and BPSD prevalence between groups
MCI p SCI p AD
MMSE score 26.7 <0.001 28.4 <0.001 23.3CSDD score 7.0 0.119 7.8 <0.001 4.7Positive BPSD, % 11.0 0.259 13.7 0.935 13.9Negative BPSD, % 41.7 0.235 45.8 <0.001 29.4Low Aβ42 52 (40%) <0.001 10 (7%) <0.001 68 (52%)High t-tau 69 (32%) <0.001 26 (12%) <0.001 120 (56%)High p-tau 52 (31%) <0.001 20 (12%) <0.001 93 (56%)
AD and MCI group means and proportions were compared to SCI. p values correspond to χ2 tests or binary logistic regression, as appropriate. Low Aβ42 = Amyloid-β ≤450 ng/l, number of patients and percentage in each group; high t-tau = total tau >400 ng/l, number of patients and percentage in each group; high p-tau = phosphorylated tau >80 ng/l, number of patients and percentage in each group. For CSF analyses, p values correspond to Fisher’s exact test comparisons for the percentages in each group.
424Dement Geriatr Cogn Disord Extra 2014;4:419–430
DOI: 10.1159/000366270
E X T R A
Garcia-Ptacek et al.: Subjective Cognitive Impairment Subjects in Our Clinical Practice
www.karger.com/dee© 2014 S. Karger AG, Basel
Cardiovascular risk factors were prevalent in our sample. All cardiovascular risk factors were higher in the MCI group, and hyperlipidemia and arterial hypertension were signifi-cantly higher in the AD group compared to the SCI group ( table 1 ).
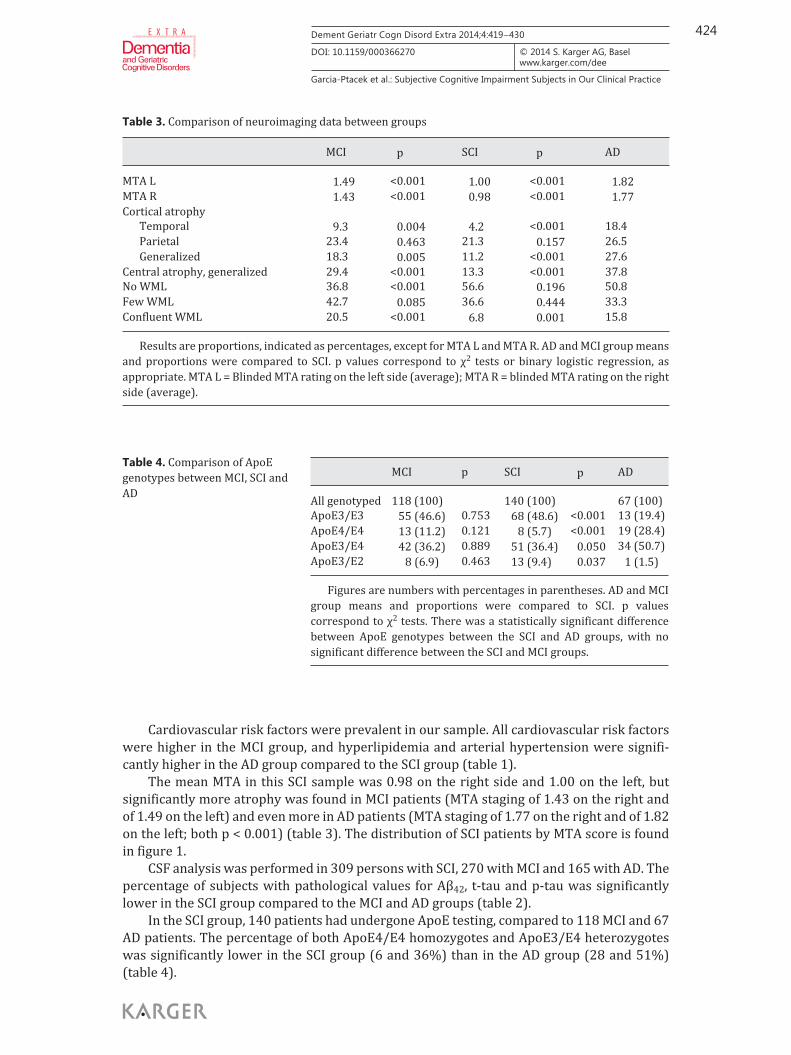
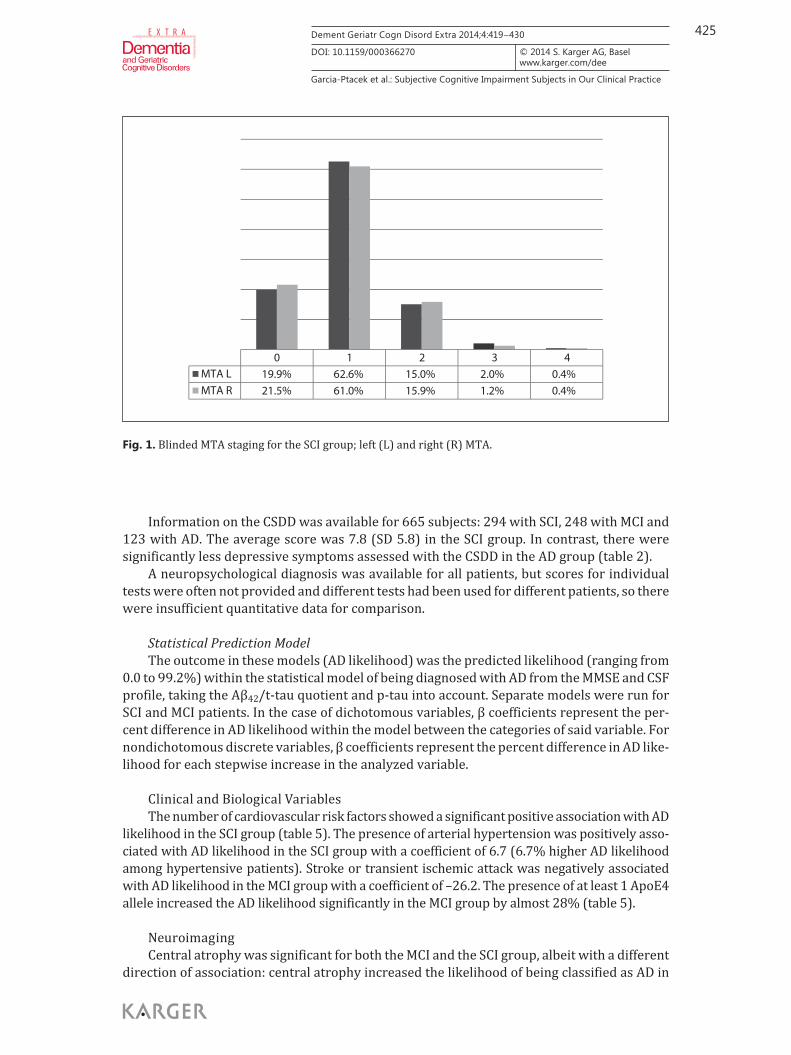
The mean MTA in this SCI sample was 0.98 on the right side and 1.00 on the left, but significantly more atrophy was found in MCI patients (MTA staging of 1.43 on the right and of 1.49 on the left) and even more in AD patients (MTA staging of 1.77 on the right and of 1.82 on the left; both p < 0.001) ( table 3 ). The distribution of SCI patients by MTA score is found in figure 1 .
CSF analysis was performed in 309 persons with SCI, 270 with MCI and 165 with AD. The percentage of subjects with pathological values for Aβ 42 , t-tau and p-tau was significantly lower in the SCI group compared to the MCI and AD groups ( table 2 ).
In the SCI group, 140 patients had undergone ApoE testing, compared to 118 MCI and 67 AD patients. The percentage of both ApoE4/E4 homozygotes and ApoE3/E4 heterozygotes was significantly lower in the SCI group (6 and 36%) than in the AD group (28 and 51%) ( table 4 ).
Table 3. Comparison of neuroimaging data between groups
MCI p SCI p AD
MTA L 1.49 <0.001 1.00 <0.001 1.82MTA R 1.43 <0.001 0.98 <0.001 1.77Cortical atrophy
Temporal 9.3 0.004 4.2 <0.001 18.4Parietal 23.4 0.463 21.3 0.157 26.5Generalized 18.3 0.005 11.2 <0.001 27.6
Central atrophy, generalized 29.4 <0.001 13.3 <0.001 37.8No WML 36.8 <0.001 56.6 0.196 50.8Few WML 42.7 0.085 36.6 0.444 33.3Confluent WML 20.5 <0.001 6.8 0.001 15.8
Results are proportions, indicated as percentages, except for MTA L and MTA R. AD and MCI group means and proportions were compared to SCI. p values correspond to χ2 tests or binary logistic regression, as appropriate. MTA L = Blinded MTA rating on the left side (average); MTA R = blinded MTA rating on the right side (average).
MCI p SCI p AD
All genotyped 118 (100) 140 (100) 67 (100)ApoE3/E3 55 (46.6) 0.753 68 (48.6) <0.001 13 (19.4)ApoE4/E4 13 (11.2) 0.121 8 (5.7) <0.001 19 (28.4)ApoE3/E4 42 (36.2) 0.889 51 (36.4) 0.050 34 (50.7)ApoE3/E2 8 (6.9) 0.463 13 (9.4) 0.037 1 (1.5)
Figures are numbers with percentages in parentheses. AD and MCI group means and proportions were compared to SCI. p values correspond to χ2 tests. There was a statistically significant difference between ApoE genotypes between the SCI and AD groups, with no significant difference between the SCI and MCI groups.
Table 4. Comparison of ApoE genotypes between MCI, SCI and AD
425Dement Geriatr Cogn Disord Extra 2014;4:419–430
DOI: 10.1159/000366270
E X T R A
Garcia-Ptacek et al.: Subjective Cognitive Impairment Subjects in Our Clinical Practice
www.karger.com/dee© 2014 S. Karger AG, Basel
Information on the CSDD was available for 665 subjects: 294 with SCI, 248 with MCI and 123 with AD. The average score was 7.8 (SD 5.8) in the SCI group. In contrast, there were significantly less depressive symptoms assessed with the CSDD in the AD group ( table 2 ).
A neuropsychological diagnosis was available for all patients, but scores for individual tests were often not provided and different tests had been used for different patients, so there were insufficient quantitative data for comparison.
Statistical Prediction Model The outcome in these models (AD likelihood) was the predicted likelihood (ranging from
0.0 to 99.2%) within the statistical model of being diagnosed with AD from the MMSE and CSF profile, taking the Aβ 42 /t-tau quotient and p-tau into account. Separate models were run for SCI and MCI patients. In the case of dichotomous variables, β coefficients represent the per-cent difference in AD likelihood within the model between the categories of said variable. For nondichotomous discrete variables, β coefficients represent the percent difference in AD like-lihood for each stepwise increase in the analyzed variable.
Clinical and Biological Variables The number of cardiovascular risk factors showed a significant positive association with AD
likelihood in the SCI group ( table 5 ). The presence of arterial hypertension was positively asso-ciated with AD likelihood in the SCI group with a coefficient of 6.7 (6.7% higher AD likelihood among hypertensive patients). Stroke or transient ischemic attack was negatively associated with AD likelihood in the MCI group with a coefficient of –26.2. The presence of at least 1 ApoE4 allele increased the AD likelihood significantly in the MCI group by almost 28% ( table 5 ).
Neuroimaging Central atrophy was significant for both the MCI and the SCI group, albeit with a different
direction of association: central atrophy increased the likelihood of being classified as AD in
0 1 2 3 4MTA L 19.9% 62.6% 15.0% 2.0% 0.4%MTA R 21.5% 61.0% 15.9% 1.2% 0.4%
Fig. 1. Blinded MTA staging for the SCI group; left (L) and right (R) MTA.
426Dement Geriatr Cogn Disord Extra 2014;4:419–430
DOI: 10.1159/000366270
E X T R A
Garcia-Ptacek et al.: Subjective Cognitive Impairment Subjects in Our Clinical Practice
www.karger.com/dee© 2014 S. Karger AG, Basel
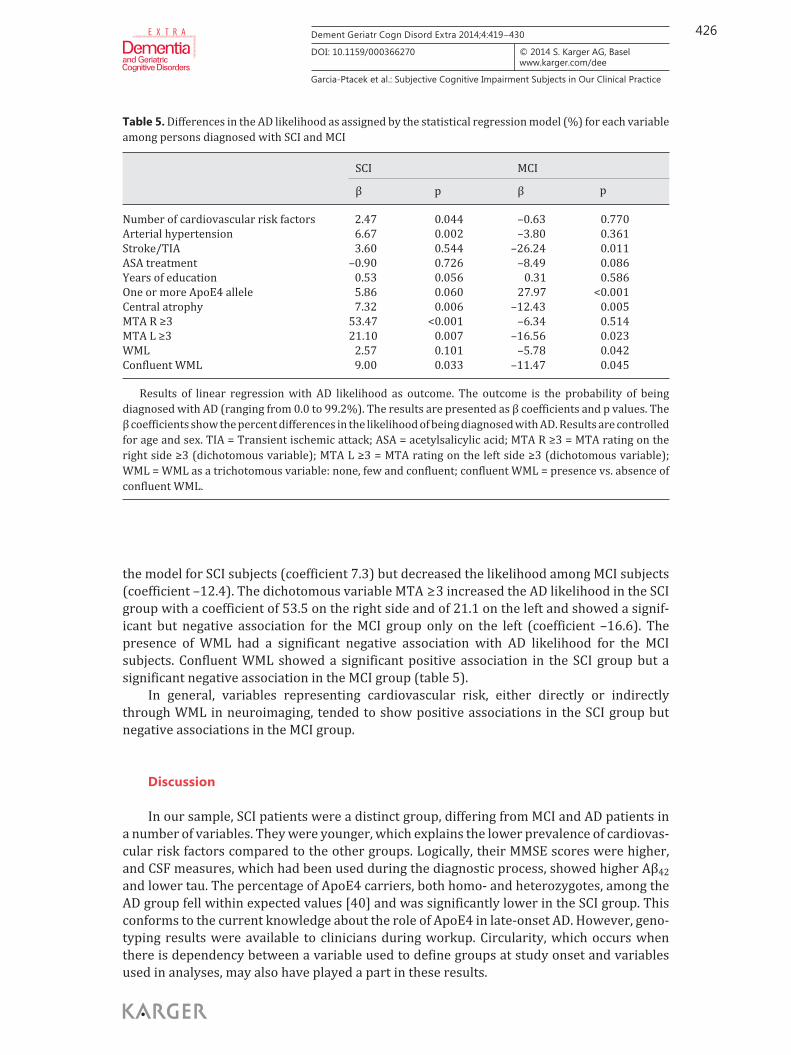
the model for SCI subjects (coefficient 7.3) but decreased the likelihood among MCI subjects (coefficient –12.4). The dichotomous variable MTA ≥ 3 increased the AD likelihood in the SCI group with a coefficient of 53.5 on the right side and of 21.1 on the left and showed a signif-icant but negative association for the MCI group only on the left (coefficient –16.6). The presence of WML had a significant negative association with AD likelihood for the MCI subjects. Confluent WML showed a significant positive association in the SCI group but a significant negative association in the MCI group ( table 5 ).
In general, variables representing cardiovascular risk, either directly or indirectly through WML in neuroimaging, tended to show positive associations in the SCI group but negative associations in the MCI group.
Discussion
In our sample, SCI patients were a distinct group, differing from MCI and AD patients in a number of variables. They were younger, which explains the lower prevalence of cardiovas-cular risk factors compared to the other groups. Logically, their MMSE scores were higher, and CSF measures, which had been used during the diagnostic process, showed higher Aβ 42 and lower tau. The percentage of ApoE4 carriers, both homo- and heterozygotes, among the AD group fell within expected values [40] and was significantly lower in the SCI group. This conforms to the current knowledge about the role of ApoE4 in late-onset AD. However, geno-typing results were available to clinicians during workup. Circularity, which occurs when there is dependency between a variable used to define groups at study onset and variables used in analyses, may also have played a part in these results.
Table 5. Differences in the AD likelihood as assigned by the statistical regression model (%) for each variable among persons diagnosed with SCI and MCI
SCI MCI
β p β p
Number of cardiovascular risk factors 2.47 0.044 –0.63 0.770Arterial hypertension 6.67 0.002 –3.80 0.361Stroke/TIA 3.60 0.544 –26.24 0.011ASA treatment –0.90 0.726 –8.49 0.086Years of education 0.53 0.056 0.31 0.586One or more ApoE4 allele 5.86 0.060 27.97 <0.001Central atrophy 7.32 0.006 –12.43 0.005MTA R ≥3 53.47 <0.001 –6.34 0.514MTA L ≥3 21.10 0.007 –16.56 0.023WML 2.57 0.101 –5.78 0.042Confluent WML 9.00 0.033 –11.47 0.045
Results of linear regression with AD likelihood as outcome. The outcome is the probability of being diagnosed with AD (ranging from 0.0 to 99.2%). The results are presented as β coefficients and p values. The β coefficients show the percent differences in the likelihood of being diagnosed with AD. Results are controlled for age and sex. TIA = Transient ischemic attack; ASA = acetylsalicylic acid; MTA R ≥3 = MTA rating on the right side ≥3 (dichotomous variable); MTA L ≥3 = MTA rating on the left side ≥3 (dichotomous variable); WML = WML as a trichotomous variable: none, few and confluent; confluent WML = presence vs. absence of confluent WML.
427Dement Geriatr Cogn Disord Extra 2014;4:419–430
DOI: 10.1159/000366270
E X T R A
Garcia-Ptacek et al.: Subjective Cognitive Impairment Subjects in Our Clinical Practice
www.karger.com/dee© 2014 S. Karger AG, Basel
It has been proposed that at least some cognitive complaints stem from depressive or anxious symptoms rather than from cognitive decline. Our finding of a more prevalent family history of dementia and a higher CSDD score in the SCI group might support this hypothesis. However, SCI subjects differed in depressive symptoms only from the AD group and not from the MCI group, suggesting that depression might be reactive to cognitive difficulties and require insight that is lost in dementia, or that mood disorders are harder to diagnose in dementia. It has been shown that depression causes attention deficits, which might lead to subjective cognitive complaints [41] . The relationship between depression and AD is, however, unclear. A previous study did not find a positive association between depressive symptoms and AD pathology as measured by CSF biomarkers, but instead found a negative association between depressive symptoms and tau [30] .
Blinded MTA rating revealed interesting data, with few SCI patients presenting patho-logical scores, as seen in figure 1 . Higher scores increased the AD likelihood in the SCI group but decreased the probability or showed negative trends in the MCI group. Circularity may explain these results, since clinicians had access to neuroimaging even though they did not have access to the formal MTA rating. Hence, MCI patients with more temporal lobe atrophy probably displayed non-AD clinical characteristics – otherwise they would have been diag-nosed with AD, not with MCI. Other authors have found hippocampal atrophy in SCI subjects [14, 15] , but their studies evaluated the whole hippocampal volume, whereas our MTA assessment was done on a single coronal image at the mid part of the hippocampal head. Our study lacked normal controls for comparison. A longitudinal follow-up would be needed to investigate if the atrophy progresses.
Central atrophy and confluent WML showed a positive association with AD likelihood in the SCI group and a negative association in the MCI group. Individual cardiovascular risk factors were often not significant in one or either group, but variables representing cardio-vascular risk tended towards a positive association in the SCI and a negative association in the MCI group. This could reflect epidemiological differences between groups and a difference in the prevalence of cardiovascular risk factors ( table 1 ). It might also show fundamental differences in the differential diagnosis that is posed in each group: among SCI subjects, the differential diagnosis might lie between prediagnosable AD and nonorganic pathology. Cere-brovascular risk factors, particularly hypertension, smoking, obesity and diabetes, are asso-ciated with AD [42] and might increase the AD likelihood in this group. By contrast, the MCI group might comprise subjects with predementia AD and cognitive deficits due to other causes, among them cerebrovascular pathology, as evidenced by the high stroke prevalence (39%). Since cardiovascular risk factors have a stronger link to vascular cognitive impairment than they have to AD, in this group, cardiovascular markers might push the diagnosis towards vascular cognitive impairment and away from AD.
A weakness of our study is its cross-sectional design. A longitudinal follow-up would be needed to investigate if the atrophy progresses or if the neuropsychological profile of SCI patients deteriorates. The focus of this paper was to characterize SCI subjects and compare them to AD patients. SCI patients were selected because they were referred to the memory clinic for cognitive complaints, irrespective of their origin. As such, the underlying causes of complaints in this group are varied and represent the heterogeneity found in clinical practice. Our study is naturalistic in its design, and the diagnosis of SCI followed the routine clinical practice at our memory clinic and was not determined by a research protocol. Thus, not all tests were available for all patients as they would have been in a research cohort; in a clinical setting, some patients may not need, or refuse to complete, certain procedures. Other centers and settings may have different procedures. The advantage of clinic-based studies is a more representative and less selected study population. However, the absence of standardized criteria for SCI makes it difficult to compare studies on the subject [8, 43] , and others may
428Dement Geriatr Cogn Disord Extra 2014;4:419–430
DOI: 10.1159/000366270
E X T R A
Garcia-Ptacek et al.: Subjective Cognitive Impairment Subjects in Our Clinical Practice
www.karger.com/dee© 2014 S. Karger AG, Basel
References
1 Reisberg B, Prichep L, Mosconi L, John ER, Glodzik-Sobanska L, Boksay I, Monteiro I, Torossian C, Vedvyas A, Ashraf N, Jamil IA, de Leon MJ: The pre-mild cognitive impairment, subjective cognitive impairment stage of Alzheimer’s disease. Alzheimers Dement 2008; 4:S98–S108.
2 Wahlund LO, Pihlstrand E, Jonhagen ME: Mild cognitive impairment. Experience from a memory clinic. Acta Neurol Scand Suppl 2003; 179: 21–24.
3 Reisberg B, Gauthier S: Current evidence for subjective cognitive impairment (SCI) as the pre-mild cognitive impairment (MCI) stage of subsequently manifest Alzheimer’s disease. Int Psychogeriatr 2008; 20: 1–16.
4 Geerlings MI, Jonker C, Bouter LM, Ader HJ, Schmand B: Association between memory complaints and incident Alzheimer’s disease in elderly people with normal baseline cognition. Am J Psychiatry 1999; 156: 531–537.
have employed different criteria. Likewise, we only excluded patients with atypical comor-bidities, such as intracranial neoplasms, that questioned the diagnosis. The high percentage of parkinsonism among the MCI patients is a consequence of this, and might reflect a hetero-geneous patient group. Comorbid AD and Parkinson’s disease, cognitive decline due to Parkin-son’s disease and subcortical vascular pathology may explain the high prevalence of parkin-sonim in this group.
The model for evaluating AD likelihood was based on the MMSE and CSF profile (Aβ 42 /t-tau quotient and p-tau). There are several possible ways to construct such a model, and models based on other factors may also be important to explore.
A number of studies suggest that SCI subjects may not all be healthy individuals [4, 6, 11, 13–15, 19] , and several authors have proposed that some SCIs might be the earliest detectable stage of AD [3, 12, 44] . The challenge is to distinguish between cognitive complaints due to factors such as anxiety or depression and those stemming from a neurodegenerative process. It has been suggested that cognitive complaints with normal testing would be more specific in highly educated individuals in whom the ceiling effect of neuropsychological testing becomes a factor [5] . In our sample, SCI subjects tended to be highly educated, but this may be because they belong to a younger generation and because of the sociocultural environment of urban Sweden. It is important to keep in mind that many SCI subjects will never develop a neurodegenerative disease.
Follow-up is necessary to determine the long-term cognitive outcome of each group of patients. Only a few such studies have been performed. A normal episodic memory test in patients at a memory clinic has been shown to predict normal cognition 3 years later [45] , but the contribution of factors other than cognition must also be explored in the long term. Our study should be placed in context with the Dubois criteria [46] and the NIA diagnostic guide-lines [47] in seeking to identify individuals in predementia stages of AD. SCI subjects, espe-cially if properly selected, might be a valuable intervention group for AD prevention or early treatment strategies.
Acknowledgements
This study was supported by grants from the regional agreement on medical training and clinical research (ALF) between the Stockholm County Council and Karolinska Institutet, Gustaf V and Queen Victoria’s Freemason Foundation and the Swedish Brain Power Consortium.
Disclosure Statement
The authors have no conflicts of interest to disclose.
429Dement Geriatr Cogn Disord Extra 2014;4:419–430
DOI: 10.1159/000366270
E X T R A
Garcia-Ptacek et al.: Subjective Cognitive Impairment Subjects in Our Clinical Practice
www.karger.com/dee© 2014 S. Karger AG, Basel
5 van Oijen M, de Jong FJ, Hofman A, Koudstaal PJ, Breteler MM: Subjective memory complaints, education, and risk of Alzheimer’s disease. Alzheimers Dement 2007; 3: 92–97.
6 Jorm AF, Christensen H, Korten AE, Jacomb PA, Henderson AS: Memory complaints as a precursor of memory impairment in older people: a longitudinal analysis over 7–8 years. Psychol Med 2001; 31: 441–449.
7 Wang PN, Wang SJ, Fuh JL, Teng EL, Liu CY, Lin CH, Shyu HY, Lu SR, Chen CC, Liu HC: Subjective memory complaint in relation to cognitive performance and depression: a longitudinal study of a rural Chinese popu-lation. J Am Geriatr Soc 2000; 48: 295–299.
8 Abdulrab K, Heun R: Subjective memory impairment. A review of its definitions indicates the need for a comprehensive set of standardised and validated criteria. Eur Psychiatry 2008; 23: 321–330.
9 Jonker C, Geerlings MI, Schmand B: Are memory complaints predictive for dementia? A review of clinical and population-based studies. Int J Geriatr Psychiatry 2000; 15: 983–991.
10 van der Linde R, Stephan BC, Matthews FE, Brayne C, Savva GM: Behavioural and psychological symptoms in the older population without dementia – relationship with socio-demographics, health and cognition. BMC Geriatr 2010; 10: 87.
11 Rami L, Fortea J, Bosch B, Sole-Padulles C, Llado A, Iranzo A, Sanchez-Valle R, Molinuevo JL: Cerebrospinal fluid biomarkers and memory present distinct associations along the continuum from healthy subjects to AD patients. J Alzheimers Dis 2011; 23: 319–326.
12 Mistur R, Mosconi L, Santi SD, Guzman M, Li Y, Tsui W, de Leon MJ: Current challenges for the early detection of Alzheimer’s disease: brain imaging and CSF studies. J Clin Neurol 2009; 5: 153–166.
13 Saykin AJ, Wishart HA, Rabin LA, Santulli RB, Flashman LA, West JD, McHugh TL, Mamourian AC: Older adults with cognitive complaints show brain atrophy similar to that of amnestic MCI. Neurology 2006; 67: 834–842.
14 van der Flier WM, van Buchem MA, Weverling-Rijnsburger AW, Mutsaers ER, Bollen EL, Admiraal-Behloul F, Westendorp RG, Middelkoop HA: Memory complaints in patients with normal cognition are associated with smaller hippocampal volumes. J Neurol 2004; 251: 671–675.
15 Fortea J, Sala-Llonch R, Bartres-Faz D, Llado A, Sole-Padulles C, Bosch B, Antonell A, Olives J, Sanchez-Valle R, Molinuevo JL, Rami L: Cognitively preserved subjects with transitional cerebrospinal fluid β-amyloid 1–42 values have thicker cortex in Alzheimer’s disease vulnerable areas. Biol Psychiatry 2011; 70: 183–190.
16 Rodda JE, Dannhauser TM, Cutinha DJ, Shergill SS, Walker Z: Subjective cognitive impairment: increased prefrontal cortex activation compared to controls during an encoding task. Int J Geriatr Psychiatry 2009; 24: 865–874.
17 Rodda J, Dannhauser T, Cutinha DJ, Shergill SS, Walker Z: Subjective cognitive impairment: functional MRI during a divided attention task. Eur Psychiatry 2011; 26: 457–462.
18 Jorm AF, Masaki KH, Davis DG, Hardman J, Nelson J, Markesbery WR, Petrovitch H, Ross GW, White LR: Memory complaints in nondemented men predict future pathologic diagnosis of Alzheimer disease. Neurology 2004; 63: 1960–1961.
19 Barnes LL, Schneider JA, Boyle PA, Bienias JL, Bennett DA: Memory complaints are related to Alzheimer disease pathology in older persons. Neurology 2006; 67: 1581–1585.
20 Nobili F, Frisoni GB, Portet F, Verhey F, Rodriguez G, Caroli A, Touchon J, Calvini P, Morbelli S, De Carli F, Guerra UP, Van de Pol LA, Visser PJ: Brain SPECT in subtypes of mild cognitive impairment. Findings from the DESCRIPA multicenter study. J Neurol 2008; 255: 1344–1353.
21 Oksengard AR, Cavallin L, Axelsson R, Andersson C, Nagga K, Winblad B, Eriksdotter-Jonhagen M, Wahlund LO: Lack of accuracy for the proposed ‘Dubois criteria’ in Alzheimer’s disease: a validation study from the Swedish brain power initiative. Dement Geriatr Cogn Disord 2010; 30: 374–380.
22 World Health Organization: The ICD-10 Classification of Mental and Behavioural Disorders: Clinical Descrip-tions and Diagnostic Guidelines. Geneva, World Health Organization, 1992.
23 Winblad B, Palmer K, Kivipelto M, Jelic V, Fratiglioni L, Wahlund LO, Nordberg A, Backman L, Albert M, Almkvist O, Arai H, Basun H, Blennow K, de Leon M, DeCarli C, Erkinjuntti T, Giacobini E, Graff C, Hardy J, Jack C, Jorm A, Ritchie K, van Duijn C, Visser P, Petersen RC: Mild cognitive impairment – beyond controversies, towards a consensus: report of the International Working Group on Mild Cognitive Impairment. J Intern Med 2004; 256: 240–246.
24 American Psychiatric Association: Diagnostic and Statistical Manual of Mental Disorders, ed 4. Washington, American Psychiatric Association, 1994.
25 McKhann G, Drachman D, Folstein M, Katzman R, Price D, Stadlan EM: Clinical diagnosis of Alzheimer’s disease: report of the NINCDS-ADRDA Work Group under the auspices of Department of Health and Human Services Task Force on Alzheimer’s Disease. Neurology 1984; 34: 939–944.
26 Scheltens P, Leys D, Barkhof F, Huglo D, Weinstein HC, Vermersch P, Kuiper M, Steinling M, Wolters EC, Valk J: Atrophy of medial temporal lobes on MRI in ‘probable’ Alzheimer’s disease and normal ageing: diagnostic value and neuropsychological correlates. J Neurol Neurosurg Psychiatry 1992; 55: 967–972.
27 Wattjes MP, Henneman WJ, van der Flier WM, de Vries O, Traber F, Geurts JJ, Scheltens P, Vrenken H, Barkhof F: Diagnostic imaging of patients in a memory clinic: comparison of MR imaging and 64-detector row CT. Radi-ology 2009; 253: 174–183.
28 Cavallin L, Bronge L, Zhang Y, Oksengard AR, Wahlund LO, Fratiglioni L, Axelsson R: Comparison between visual assessment of MTA and hippocampal volumes in an elderly, non-demented population. Acta Radiol 2012; 53: 573–579.
430Dement Geriatr Cogn Disord Extra 2014;4:419–430
DOI: 10.1159/000366270
E X T R A
Garcia-Ptacek et al.: Subjective Cognitive Impairment Subjects in Our Clinical Practice
www.karger.com/dee© 2014 S. Karger AG, Basel
29 Inzitari D, Pracucci G, Poggesi A, Carlucci G, Barkhof F, Chabriat H, Erkinjuntti T, Fazekas F, Ferro JM, Hennerici M, Langhorne P, O’Brien J, Scheltens P, Visser MC, Wahlund LO, Waldemar G, Wallin A, Pantoni L: Changes in white matter as determinant of global functional decline in older independent outpatients: three year follow-up of LADIS (leukoaraiosis and disability) study cohort. BMJ 2009; 339:b2477.
30 Kramberger MG, Jelic V, Kareholt I, Enache D, Eriksdotter Jonhagen M, Winblad B, Aarsland D: Cerebrospinal fluid Alzheimer markers in depressed elderly subjects with and without Alzheimer’s disease. Dement Geriatr Cogn Dis Extra 2012; 2: 48–56.
31 Hixson JE, Vernier DT: Restriction isotyping of human apolipoprotein E by gene amplification and cleavage with Hha I. J Lipid Res 1990; 31: 545–548.
32 Folstein MF, Folstein SE, McHugh PR: ‘Mini-mental state’. A practical method for grading the cognitive state of patients for the clinician. J Psychiatr Res 1975; 12: 189–198.
33 Bartfai A, Nyman H, Stegman B: Wechsler Adult Intelligence Scale Revised. WAIS-R Manual. Stockholm, Psykologiförlaget, 1994.
34 Reitan R, Wolfson D: The Halstead-Reitan Neuropsychological Test Battery: Theory and Clinical Interpre-tation. Tucson, Neuropsychology Press, 1993.
35 Andersson E, Berg S, Lawenius M, Svanborg A: Intellectual functioning in a 70-year-old urban population. Acta Psychiatr Scand 1978; 57: 59–66.
36 Schmidt M: Rey Auditory Verbal Learning Test – A Handbook. Los Angeles, Western Psychological Services, 1996.
37 Lezak M: Neuropsychological Assessment, ed 3. New York, Oxford University Press, 1995. 38 Fernaeus SE, Almkvist O: Word production: dissociation of two retrieval modes of semantic memory across
time. J Clin Exp Neuropsychol 1998; 20: 137–143. 39 Alexopoulos GS, Abrams RC, Young RC, Shamoian CA: Cornell scale for depression in dementia. Biol Psychiatry
1988; 23: 271–284. 40 Ward A, Crean S, Mercaldi CJ, Collins JM, Boyd D, Cook MN, Arrighi HM: Prevalence of apolipoprotein E4
genotype and homozygotes (APOE e4/4) among patients diagnosed with Alzheimer’s disease: a systematic review and meta-analysis. Neuroepidemiology 2012; 38: 1–17.
41 Weisenbach SL, Boore LA, Kales HC: Depression and cognitive impairment in older adults. Curr Psychiatry Rep 2012; 14: 280–288.
42 Barnes DE, Yaffe K: The projected effect of risk factor reduction on Alzheimer’s disease prevalence. Lancet Neurol 2011; 10: 819–828.
43 Garcia-Ptacek S, Eriksdotter M, Jelic V, Porta-Etessam J, Kareholt I, Manzano Palomo S: Subjective cognitive impairment: towards early identification of Alzheimer disease. Neurologia 2013, Epub ahead of print.
44 Getsios D, Blume S, Ishak KJ, Maclaine G, Hernandez L: An economic evaluation of early assessment for Alzheimer’s disease in the United Kingdom. Alzheimers Dement 2012; 8: 22–30.
45 Andersson C, Lindau M, Almkvist O, Engfeldt P, Johansson SE, Eriksdotter Jonhagen M: Identifying patients at high and low risk of cognitive decline using Rey Auditory Verbal Learning Test among middle-aged memory clinic outpatients. Dement Geriatr Cogn Disord 2006; 21: 251–259.
46 Dubois B, Feldman HH, Jacova C, Dekosky ST, Barberger-Gateau P, Cummings J, Delacourte A, Galasko D, Gauthier S, Jicha G, Meguro K, O’Brien J, Pasquier F, Robert P, Rossor M, Salloway S, Stern Y, Visser PJ, Scheltens P: Research criteria for the diagnosis of Alzheimer’s disease: revising the NINCDS-ADRDA criteria. Lancet Neurol 2007; 6: 734–746.
47 Sperling RA, Aisen PS, Beckett LA, Bennett DA, Craft S, Fagan AM, Iwatsubo T, Jack CR Jr, Kaye J, Montine TJ, Park DC, Reiman EM, Rowe CC, Siemers E, Stern Y, Yaffe K, Carrillo MC, Thies B, Morrison-Bogorad M, Wagster MV, Phelps CH: Toward defining the preclinical stages of Alzheimer’s disease: recommendations from the National Institute on Aging-Alzheimer’s Association workgroups on diagnostic guidelines for Alzheimer’s disease. Alzheimers Dement 2011; 7: 280–292.


![Title: Effects of cognitive training on gray matter volumes in … · 2017-12-07 · 3 Introduction Subjective memory impairment (SMI) is common in the elderly [1]. In the memory](https://img.pdfslide.us/doc/110x75/5f7fed037a2517735b0cd799/title-effects-of-cognitive-training-on-gray-matter-volumes-in-2017-12-07-3-introduction.jpg)


![Subjective Cognitive Impairment Cohort (SCIENCe): study ......Test (RAVLT)—direct recall (five trials summed) and de-layed recall and cued recall (both >20 min) [28]. We used Trail](https://img.pdfslide.us/doc/110x75/60cd1c073e64aa265f494f37/subjective-cognitive-impairment-cohort-science-study-test-ravltadirect.jpg)