Embed Size (px)
DESCRIPTION
Do Auralex Mopads make a difference in the sound quality of your monitoring system?
Citation preview
Subjective Assessment of Monitor Loudspeaker Isolators
C. Fenton 1
Subjective Assessment of Monitor Loudspeaker Isolators
by
Constantin Fenton
A report submitted in fulfillment of the requirements for
43-3326-01 Acoustical Testing II
Department of Audio Arts and Acoustics
Dominique Chéenne and Douglas Jones
Columbia College Chicago
May 12th 2011
Subjective Assessment of Monitor Loudspeaker Isolators
C. Fenton 2
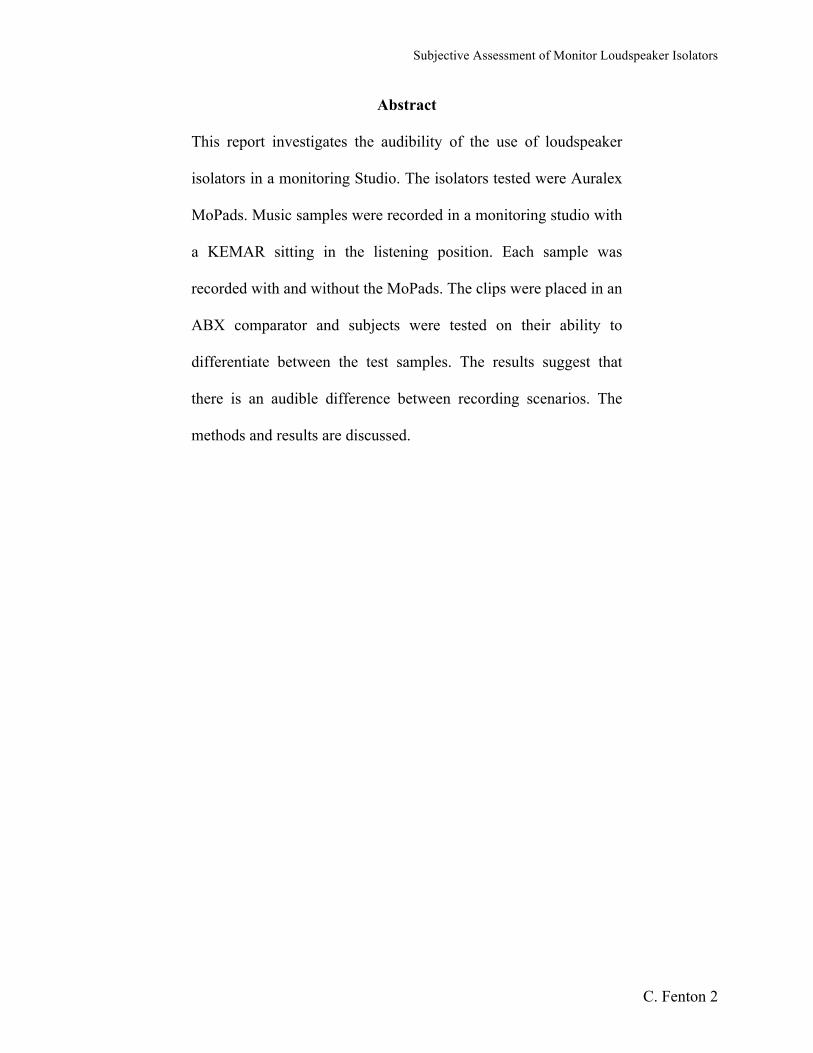
Abstract
This report investigates the audibility of the use of loudspeaker
isolators in a monitoring Studio. The isolators tested were Auralex
MoPads. Music samples were recorded in a monitoring studio with
a KEMAR sitting in the listening position. Each sample was
recorded with and without the MoPads. The clips were placed in an
ABX comparator and subjects were tested on their ability to
differentiate between the test samples. The results suggest that
there is an audible difference between recording scenarios. The
methods and results are discussed.
Subjective Assessment of Monitor Loudspeaker Isolators
C. Fenton 3
TABLE OF CONTENTS
Abstract -------------------------------------------------------------------- p. 2
1. Introduction ------------------------------------------------------------- p. 4-5
2. Experimentation Procedure ------------------------------------------ p. 6-16
2.1 Summary ---------------------------------------------------- p. 6-7
2.2 Acquisition of Test Samples and Discussion ----------- p. 7-11
2.3 Subject Testing --------------------------------------------- p. 12-16
3. Results ------------------------------------------------------------------ p. 17-24
3.1 Statistical Basis---------------------------------------------- p. 17-20
3.2 Test Results ------------------------------------------------- p. 20-21
3.3 Data Analysis ----------------------------------------------- p. 21-24
4. Conclusion ------------------------------------------------------------- p. 24-25
Acknowledgements ------------------------------------------------------ p. 26
References ----------------------------------------------------------------- p. 27
Subjective Assessment of Monitor Loudspeaker Isolators
C. Fenton 4
1. Introduction
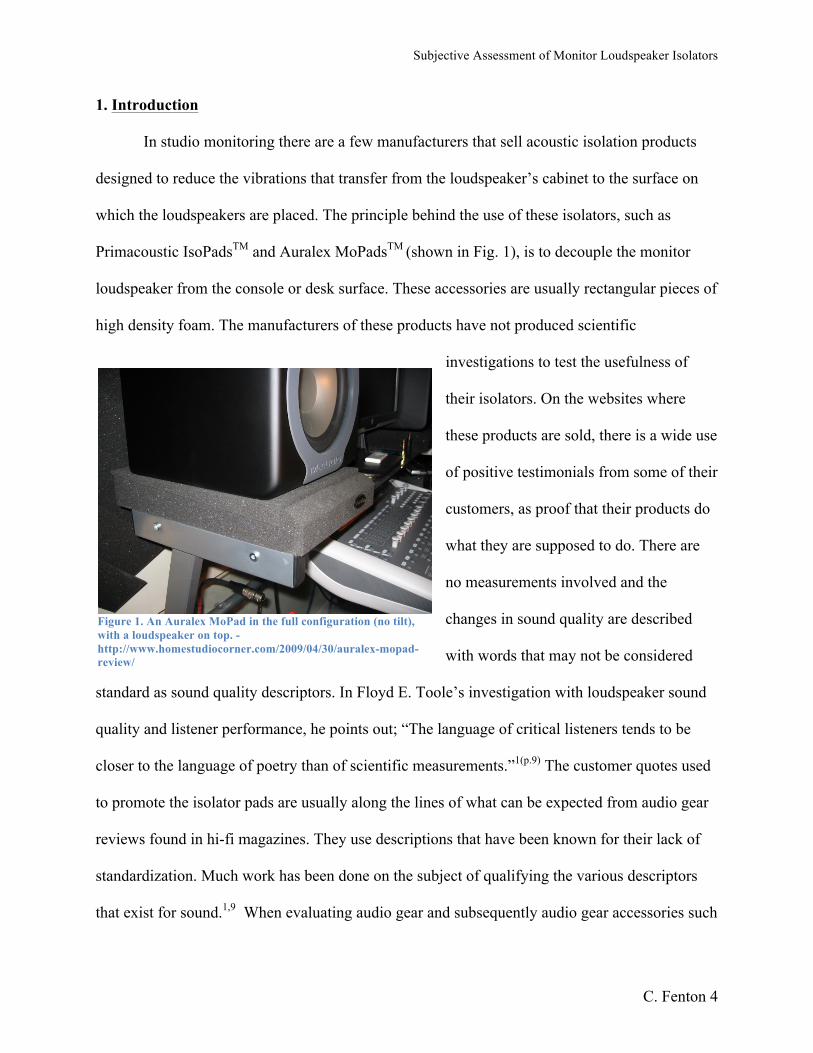
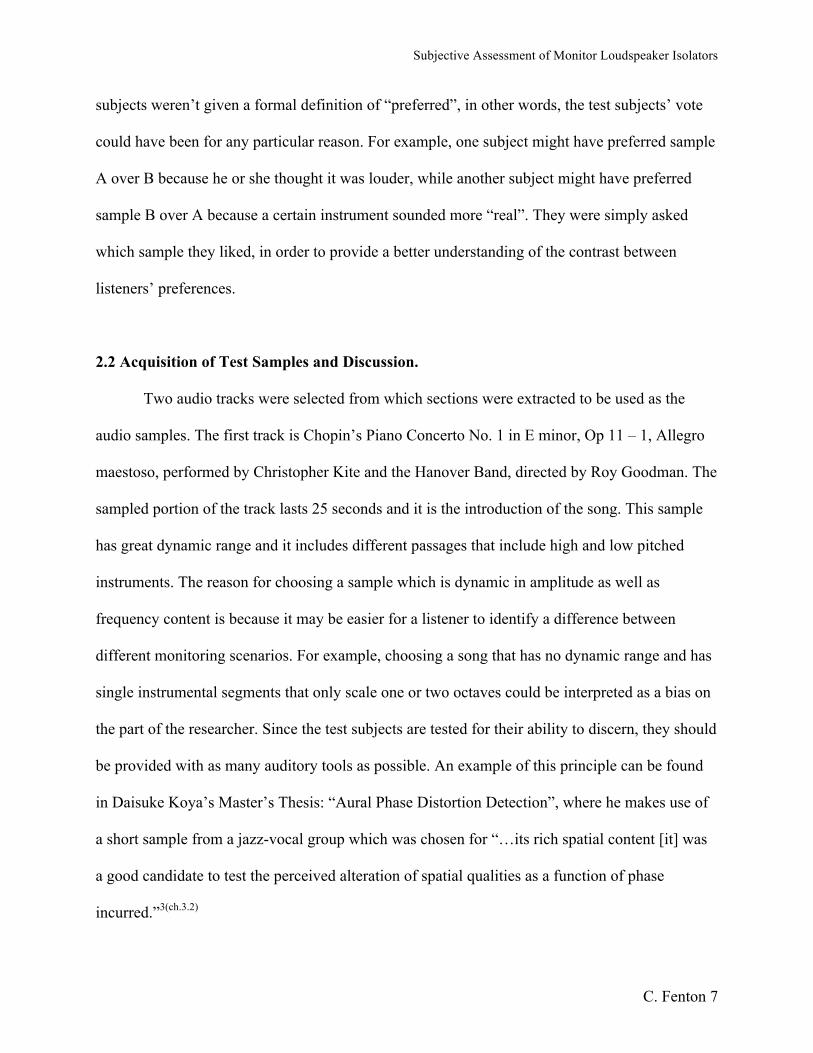
In studio monitoring there are a few manufacturers that sell acoustic isolation products
designed to reduce the vibrations that transfer from the loudspeaker’s cabinet to the surface on
which the loudspeakers are placed. The principle behind the use of these isolators, such as
Primacoustic IsoPadsTM and Auralex MoPadsTM (shown in Fig. 1), is to decouple the monitor
loudspeaker from the console or desk surface. These accessories are usually rectangular pieces of
high density foam. The manufacturers of these products have not produced scientific
investigations to test the usefulness of
their isolators. On the websites where
these products are sold, there is a wide use
of positive testimonials from some of their
customers, as proof that their products do
what they are supposed to do. There are
no measurements involved and the
changes in sound quality are described
with words that may not be considered
standard as sound quality descriptors. In Floyd E. Toole’s investigation with loudspeaker sound
quality and listener performance, he points out; “The language of critical listeners tends to be
closer to the language of poetry than of scientific measurements.”1(p.9) The customer quotes used
to promote the isolator pads are usually along the lines of what can be expected from audio gear
reviews found in hi-fi magazines. They use descriptions that have been known for their lack of
standardization. Much work has been done on the subject of qualifying the various descriptors
that exist for sound.1,9 When evaluating audio gear and subsequently audio gear accessories such
Figure 1. An Auralex MoPad in the full configuration (no tilt), with a loudspeaker on top. -http://www.homestudiocorner.com/2009/04/30/auralex-mopad-review/
Subjective Assessment of Monitor Loudspeaker Isolators
C. Fenton 5
as the MoPads, the manufacturers may provide information that may or may not be benefitial
from a scientific standpoint. Much of the vocabulary used by manufacturers to describe their
products may not be subject to scientific scrutiny.
Auralex’s short description simply states that the MoPads “provide sonic isolation
between your monitors and whatever your monitors are resting on, INSTANTLY improving the
accuracy of your entire monitoring system.”2 The quote taken from the manufacturer’s website
can be considered to be partially misleading. Firstly, the phrase “provide sonic isolation” can be
interpreted many ways and will be disregarded. Secondly, the second half of the manufacturer’s
claim, “…INSTANTLY improving the accuracy of your entire monitoring system”, holds
validity only if the end-user agrees with the claim after the user has evaluated the isolators. As
far as the use of the word “accuracy” goes, it can be inferred that the manufacturer is referring to
improving the fidelity of the monitoring system. Auralex’s description of the MoPads, along
with reviews written by satisfied customers describes how the MoPads change the quality of the
sound. The customer reviews provided by various websites that sell the MoPads are obviously
for the benefit of the website’s sales and cannot be taken as impartial reviews.
Since the use of such isolators as the MoPads may or may not change the quality of the
sound in a given studio, a study has been provided in which a number of participants were tested
to determine if they could hear a difference in sound quality between a monitoring system that
makes use of the MoPads, and the same system without the MoPads. The focus of the study is to
statistically determine if the use of Auralex MoPads is audible or not, and to provide a method to
test the audibility of loudspeaker isolators.
Subjective Assessment of Monitor Loudspeaker Isolators
C. Fenton 6
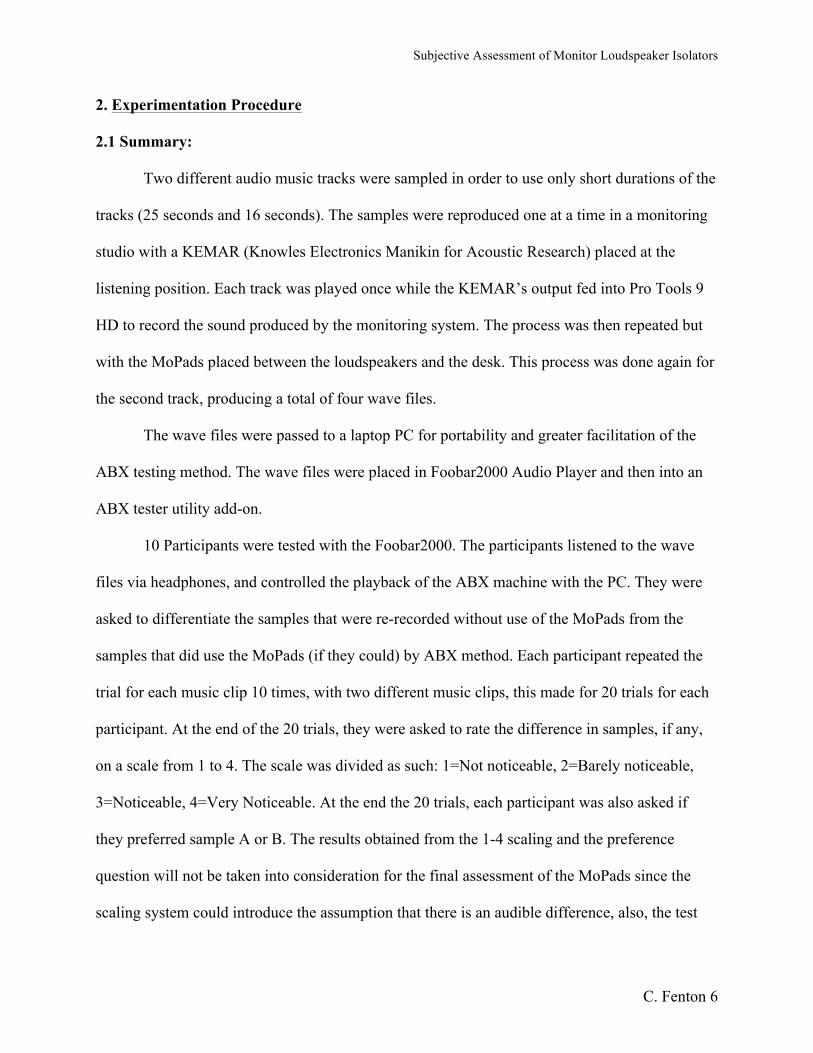
2. Experimentation Procedure
2.1 Summary:
Two different audio music tracks were sampled in order to use only short durations of the
tracks (25 seconds and 16 seconds). The samples were reproduced one at a time in a monitoring
studio with a KEMAR (Knowles Electronics Manikin for Acoustic Research) placed at the
listening position. Each track was played once while the KEMAR’s output fed into Pro Tools 9
HD to record the sound produced by the monitoring system. The process was then repeated but
with the MoPads placed between the loudspeakers and the desk. This process was done again for
the second track, producing a total of four wave files.
The wave files were passed to a laptop PC for portability and greater facilitation of the
ABX testing method. The wave files were placed in Foobar2000 Audio Player and then into an
ABX tester utility add-on.
10 Participants were tested with the Foobar2000. The participants listened to the wave
files via headphones, and controlled the playback of the ABX machine with the PC. They were
asked to differentiate the samples that were re-recorded without use of the MoPads from the
samples that did use the MoPads (if they could) by ABX method. Each participant repeated the
trial for each music clip 10 times, with two different music clips, this made for 20 trials for each
participant. At the end of the 20 trials, they were asked to rate the difference in samples, if any,
on a scale from 1 to 4. The scale was divided as such: 1=Not noticeable, 2=Barely noticeable,
3=Noticeable, 4=Very Noticeable. At the end the 20 trials, each participant was also asked if
they preferred sample A or B. The results obtained from the 1-4 scaling and the preference
question will not be taken into consideration for the final assessment of the MoPads since the
scaling system could introduce the assumption that there is an audible difference, also, the test
Subjective Assessment of Monitor Loudspeaker Isolators
C. Fenton 7
subjects weren’t given a formal definition of “preferred”, in other words, the test subjects’ vote
could have been for any particular reason. For example, one subject might have preferred sample
A over B because he or she thought it was louder, while another subject might have preferred
sample B over A because a certain instrument sounded more “real”. They were simply asked
which sample they liked, in order to provide a better understanding of the contrast between
listeners’ preferences.
2.2 Acquisition of Test Samples and Discussion.
Two audio tracks were selected from which sections were extracted to be used as the
audio samples. The first track is Chopin’s Piano Concerto No. 1 in E minor, Op 11 – 1, Allegro
maestoso, performed by Christopher Kite and the Hanover Band, directed by Roy Goodman. The
sampled portion of the track lasts 25 seconds and it is the introduction of the song. This sample
has great dynamic range and it includes different passages that include high and low pitched
instruments. The reason for choosing a sample which is dynamic in amplitude as well as
frequency content is because it may be easier for a listener to identify a difference between
different monitoring scenarios. For example, choosing a song that has no dynamic range and has
single instrumental segments that only scale one or two octaves could be interpreted as a bias on
the part of the researcher. Since the test subjects are tested for their ability to discern, they should
be provided with as many auditory tools as possible. An example of this principle can be found
in Daisuke Koya’s Master’s Thesis: “Aural Phase Distortion Detection”, where he makes use of
a short sample from a jazz-vocal group which was chosen for “…its rich spatial content [it] was
a good candidate to test the perceived alteration of spatial qualities as a function of phase
incurred.”3(ch.3.2)
Subjective Assessment of Monitor Loudspeaker Isolators
C. Fenton 8
The second song from which a sample was extracted is “Name Dropping” by Steve
Morse Band. The sampled clip is a slow passage taken from the second half of the track. This
clip was selected because it presented the alternative to classical music with rock. Having a clip
of rock music may allow the subjects to differentiate test samples A and B with greater ease
since the subjects might have more familiarity with modern music. The rock track sample also
has good dynamic range and the instrumentals cover a wide range of frequencies.
The two different music tracks were taken from an iTunes collection in which their
formats were MP3 (both stereo) with a sample rate of 44,100 kHz. The classical music track by
Chopin had a bit rate of 229 kbps and the rock track by Steve Morse Band had a bit rate of 320
kbps. Some may argue that the difference in bit rates between the two tracks may place an unfair
advantage for easier differentiation within a 20-trial ABX test, but the two tracks are already
very different so a hypothetical “advantage” would be irrelevant.
The tracks were sampled using mp3DirectCut v2.07 which left the bit rates and sample
rates intact. The clips were then taken to a monitoring studio (Mini-Suite 3) in the Audio Arts
and Acoustics Department of Columbia College Chicago (The room measures L 14 ft. 4 in. (4.37
m) x W 8ft. 6 in. (2.6 m) x H 8ft. (2.44 m). The room has light acoustic padding on the side walls,
heavy padding on the front wall and a diffuser on the rear wall – next to the door. The corners
are treated with bass traps. The ceiling has acoustical tile and the floor is carpeted.). Here, the
clips were converted to wave files and imported into Pro Tools 9 HD. Pro Tools was the same
software used to record the output from the loudspeakers.
The music clips were binaurally recorded using the KEMAR (G.R.A.S. Head and Torso
Type 45BA – Serial No. 78858) to simulate HRTFs and the aural properties of the eardrum, ear
canal, and pinna, in order to capture the sound that an average human being would hear.4 The
Subjective Assessment of Monitor Loudspeaker Isolators
C. Fenton 9
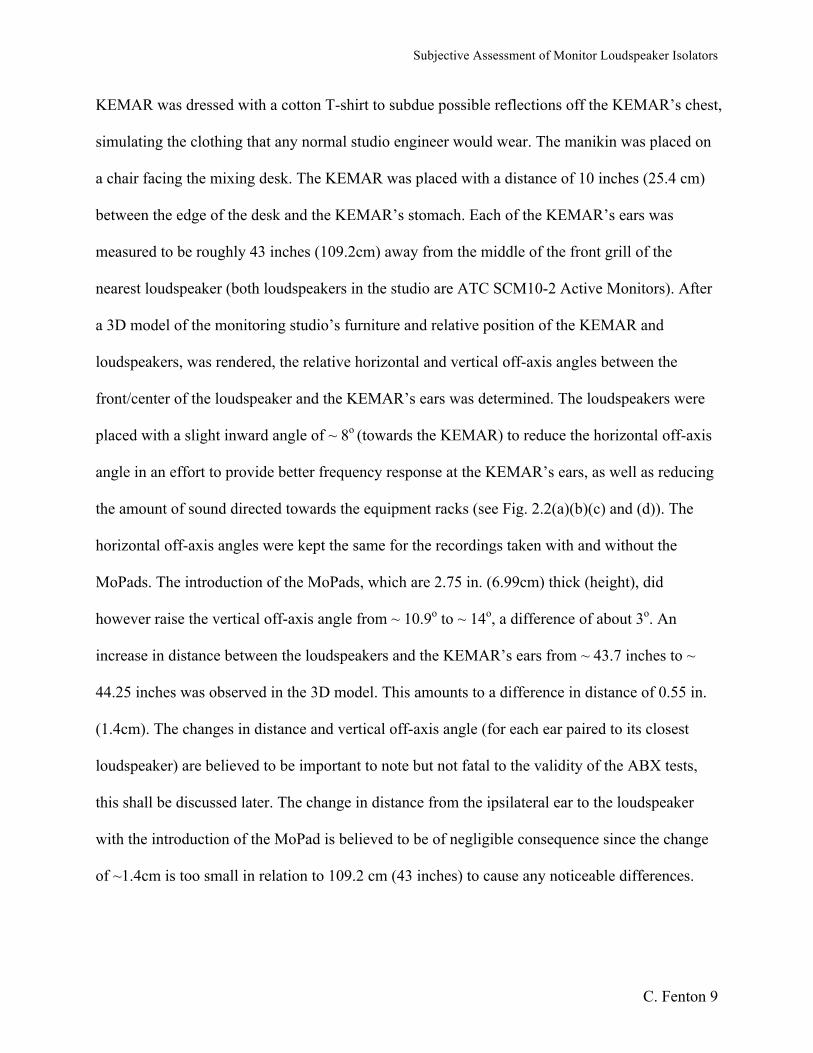
KEMAR was dressed with a cotton T-shirt to subdue possible reflections off the KEMAR’s chest,
simulating the clothing that any normal studio engineer would wear. The manikin was placed on
a chair facing the mixing desk. The KEMAR was placed with a distance of 10 inches (25.4 cm)
between the edge of the desk and the KEMAR’s stomach. Each of the KEMAR’s ears was
measured to be roughly 43 inches (109.2cm) away from the middle of the front grill of the
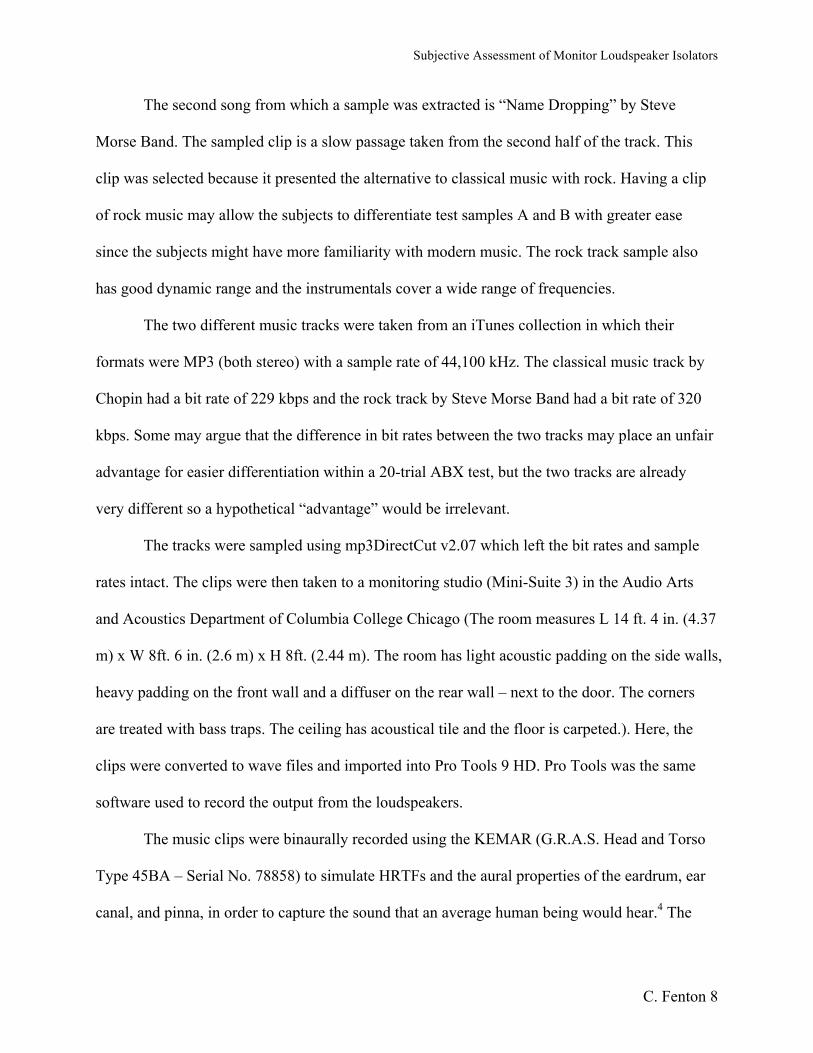
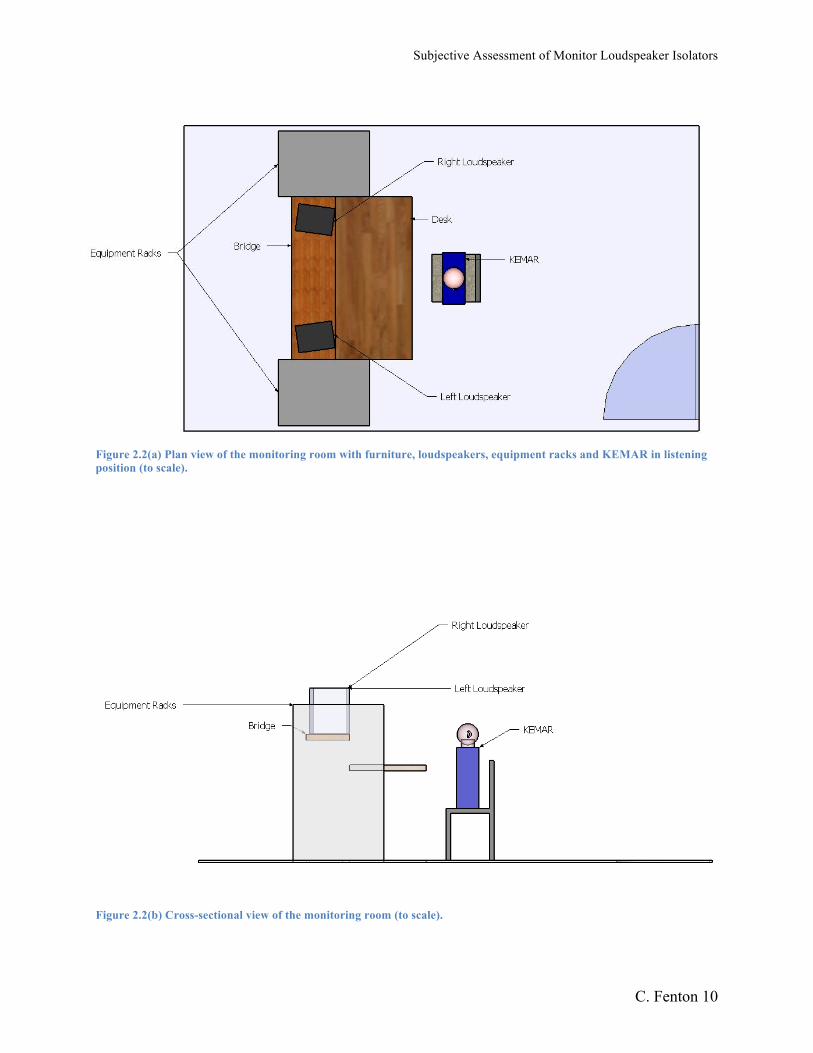
nearest loudspeaker (both loudspeakers in the studio are ATC SCM10-2 Active Monitors). After
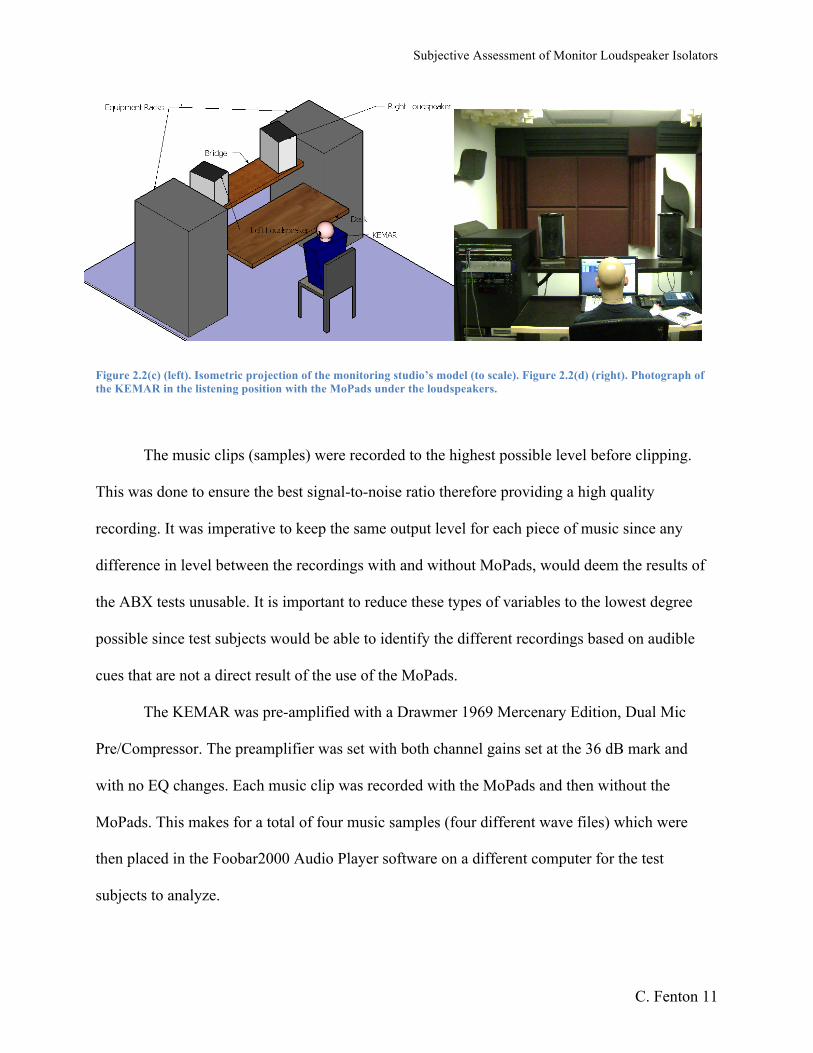
a 3D model of the monitoring studio’s furniture and relative position of the KEMAR and
loudspeakers, was rendered, the relative horizontal and vertical off-axis angles between the
front/center of the loudspeaker and the KEMAR’s ears was determined. The loudspeakers were
placed with a slight inward angle of ~ 8o (towards the KEMAR) to reduce the horizontal off-axis
angle in an effort to provide better frequency response at the KEMAR’s ears, as well as reducing
the amount of sound directed towards the equipment racks (see Fig. 2.2(a)(b)(c) and (d)). The
horizontal off-axis angles were kept the same for the recordings taken with and without the
MoPads. The introduction of the MoPads, which are 2.75 in. (6.99cm) thick (height), did
however raise the vertical off-axis angle from ~ 10.9o to ~ 14o, a difference of about 3o. An
increase in distance between the loudspeakers and the KEMAR’s ears from ~ 43.7 inches to ~
44.25 inches was observed in the 3D model. This amounts to a difference in distance of 0.55 in.
(1.4cm). The changes in distance and vertical off-axis angle (for each ear paired to its closest
loudspeaker) are believed to be important to note but not fatal to the validity of the ABX tests,
this shall be discussed later. The change in distance from the ipsilateral ear to the loudspeaker
with the introduction of the MoPad is believed to be of negligible consequence since the change
of ~1.4cm is too small in relation to 109.2 cm (43 inches) to cause any noticeable differences.
Subjective Assessment of Monitor Loudspeaker Isolators
C. Fenton 10
Figure 2.2(a) Plan view of the monitoring room with furniture, loudspeakers, equipment racks and KEMAR in listening position (to scale).
Figure 2.2(b) Cross-sectional view of the monitoring room (to scale).
Subjective Assessment of Monitor Loudspeaker Isolators
C. Fenton 11
Figure 2.2(c) (left). Isometric projection of the monitoring studio’s model (to scale). Figure 2.2(d) (right). Photograph of the KEMAR in the listening position with the MoPads under the loudspeakers.
The music clips (samples) were recorded to the highest possible level before clipping.
This was done to ensure the best signal-to-noise ratio therefore providing a high quality
recording. It was imperative to keep the same output level for each piece of music since any
difference in level between the recordings with and without MoPads, would deem the results of
the ABX tests unusable. It is important to reduce these types of variables to the lowest degree
possible since test subjects would be able to identify the different recordings based on audible
cues that are not a direct result of the use of the MoPads.
The KEMAR was pre-amplified with a Drawmer 1969 Mercenary Edition, Dual Mic
Pre/Compressor. The preamplifier was set with both channel gains set at the 36 dB mark and
with no EQ changes. Each music clip was recorded with the MoPads and then without the
MoPads. This makes for a total of four music samples (four different wave files) which were
then placed in the Foobar2000 Audio Player software on a different computer for the test
subjects to analyze.
Subjective Assessment of Monitor Loudspeaker Isolators
C. Fenton 12
2.3 Subject Testing
10 Subjects were selected for testing the possible audible difference between a sample
monitoring session, recorded with and without the MoPads. Each subject performed a separate
trial for each piece of music 10 times. Two distinct pieces of music made for a total of 20 ABX
trials for each subject. Since the ABX tests were performed in Harbin, China, the subjects
selected were those who could speak English well enough to follow detailed instructions. None
of the subjects were tested for hearing but they were all believed to have adequate hearing. The
subjects were students in Harbin Engineering University’s International Department. Each
participant was tested individually and all the tests took place in the same room at different times.
Six out of the ten participants are amateur musicians and are believed to be critical listeners.
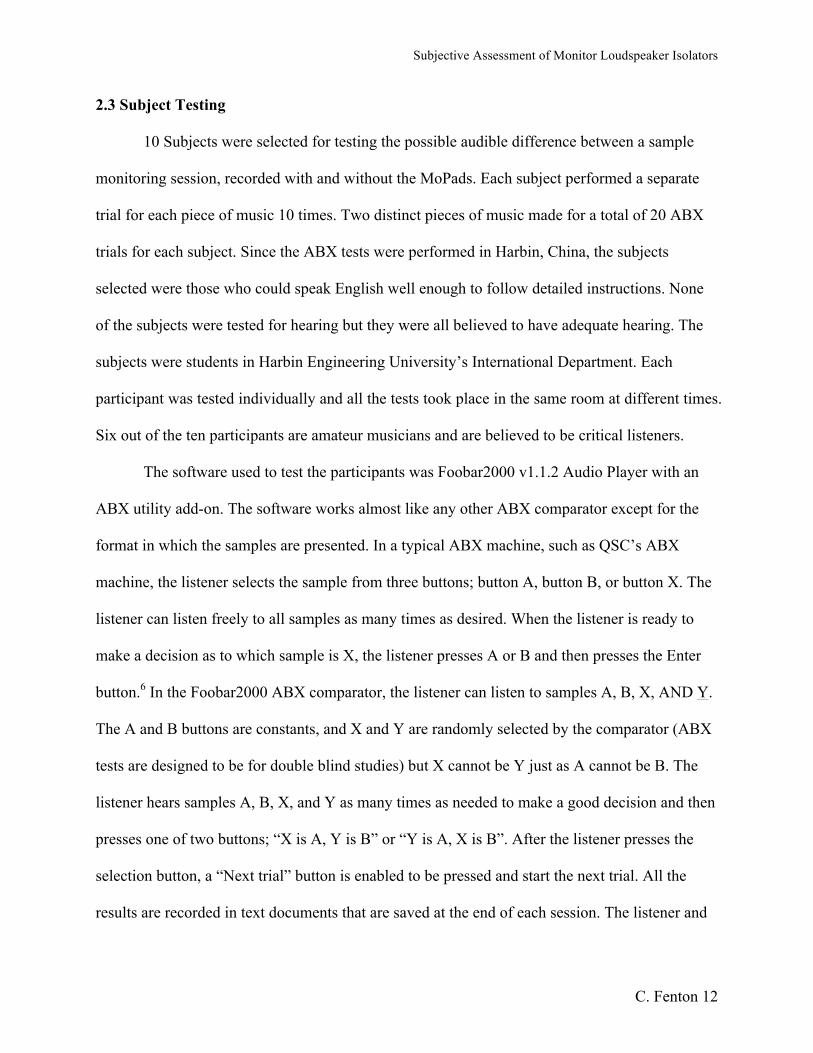
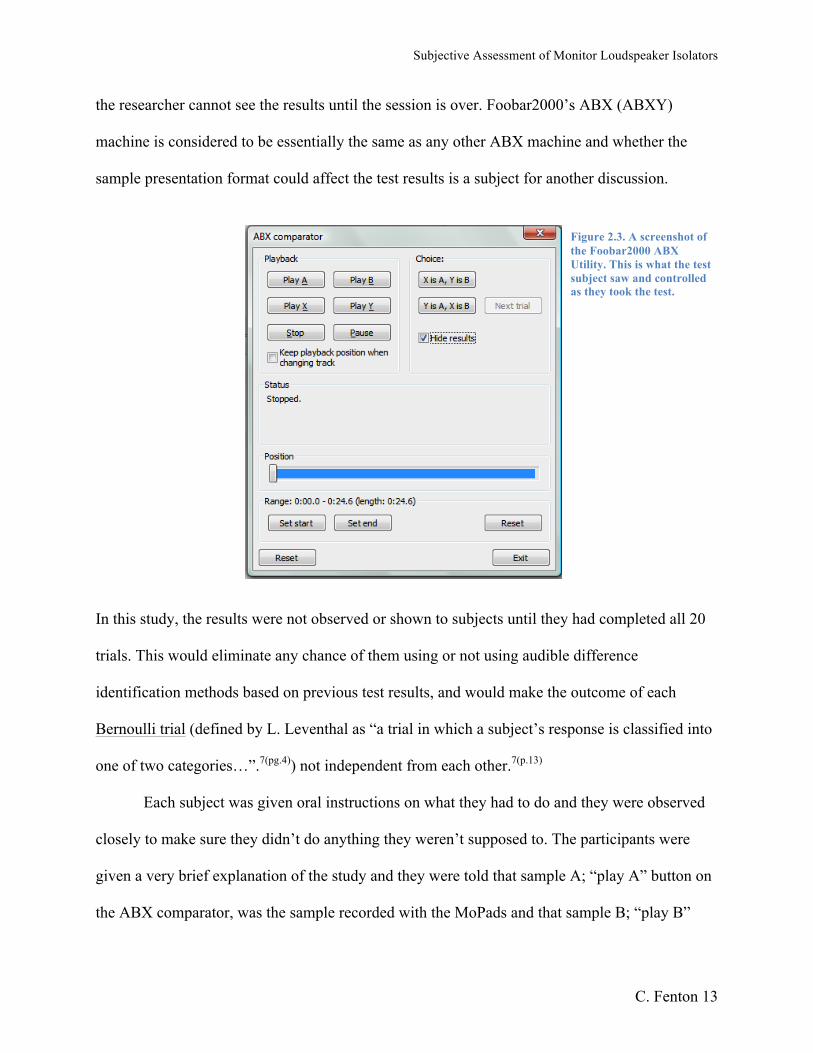
The software used to test the participants was Foobar2000 v1.1.2 Audio Player with an
ABX utility add-on. The software works almost like any other ABX comparator except for the
format in which the samples are presented. In a typical ABX machine, such as QSC’s ABX
machine, the listener selects the sample from three buttons; button A, button B, or button X. The
listener can listen freely to all samples as many times as desired. When the listener is ready to
make a decision as to which sample is X, the listener presses A or B and then presses the Enter
button.6 In the Foobar2000 ABX comparator, the listener can listen to samples A, B, X, AND Y.
The A and B buttons are constants, and X and Y are randomly selected by the comparator (ABX
tests are designed to be for double blind studies) but X cannot be Y just as A cannot be B. The
listener hears samples A, B, X, and Y as many times as needed to make a good decision and then
presses one of two buttons; “X is A, Y is B” or “Y is A, X is B”. After the listener presses the
selection button, a “Next trial” button is enabled to be pressed and start the next trial. All the
results are recorded in text documents that are saved at the end of each session. The listener and
Subjective Assessment of Monitor Loudspeaker Isolators
C. Fenton 13
the researcher cannot see the results until the session is over. Foobar2000’s ABX (ABXY)
machine is considered to be essentially the same as any other ABX machine and whether the
sample presentation format could affect the test results is a subject for another discussion.
In this study, the results were not observed or shown to subjects until they had completed all 20
trials. This would eliminate any chance of them using or not using audible difference
identification methods based on previous test results, and would make the outcome of each
Bernoulli trial (defined by L. Leventhal as “a trial in which a subject’s response is classified into
one of two categories…”.7(pg.4)) not independent from each other.7(p.13)
Each subject was given oral instructions on what they had to do and they were observed
closely to make sure they didn’t do anything they weren’t supposed to. The participants were
given a very brief explanation of the study and they were told that sample A; “play A” button on
the ABX comparator, was the sample recorded with the MoPads and that sample B; “play B”
Figure 2.3. A screenshot of the Foobar2000 ABX Utility. This is what the test subject saw and controlled as they took the test.
Subjective Assessment of Monitor Loudspeaker Isolators
C. Fenton 14
button, was the sample recorded without the MoPads. They were told that their task was to
identify the difference between sample A and sample B, IF THERE WAS ONE, which would be
done through the ABX method. The subjects unfamiliar with ABX testing (all 10 of them in this
study) were briefly explained the basics of the testing method. Each participant was given one
practice trial for which the results weren’t recorded. This was done to familiarize the subjects
with the musical piece and the testing method. The subjects were instructed to not remove the
headphones once a 10 trial session began. After each 10 trial test, the subjects were asked to rate
the difference in sound (if any) on a scale from 1-4: 1 Being: “Not noticeable” 2: “Barely
noticeable”, 3: “Noticeable”, and 4: “Very noticeable”. The subjects were then asked which
sample they preferred. The responses to the two questions following each 10 trail test were not
used to definitively asses the MoPads. The responses were only used in an attempt to get a better
understanding of the ABX results. The subjects weren’t asked to give comments but the
comments some participants did make were also recorded. Each subject was asked to do 10 trials
for each piece of music. Each subject was given a 10 minute break between each 10 trial session
to avoid boredom and fatigue.
The tests were administered with a pair of Technics RP-DH 1200 stereo headphones. The
headphones are of high quality, with a frequency response from 5 Hz to 30 kHz (manufacturer
specification) and have a closed-ear design that reduces the amount of background noise heard
by the listener. The output level setting of the PC was kept the same for every trial. Even though
listening tests in the past have been performed where the listener controls the output level,3(ch.4.3)
and 5(pg.12) this was done to eliminate output level variables between subjects and between trials.
Choosing an appropriate level is important because it is desirable that the listener’s ears are as
responsive on the first trial, as they are on the last trial. More importantly though, is protecting
Subjective Assessment of Monitor Loudspeaker Isolators
C. Fenton 15
the subject from any harm that might be a result of the music being played too loud. The output
of the right headphone was measured with a RadioShack digital sound level meter that has an
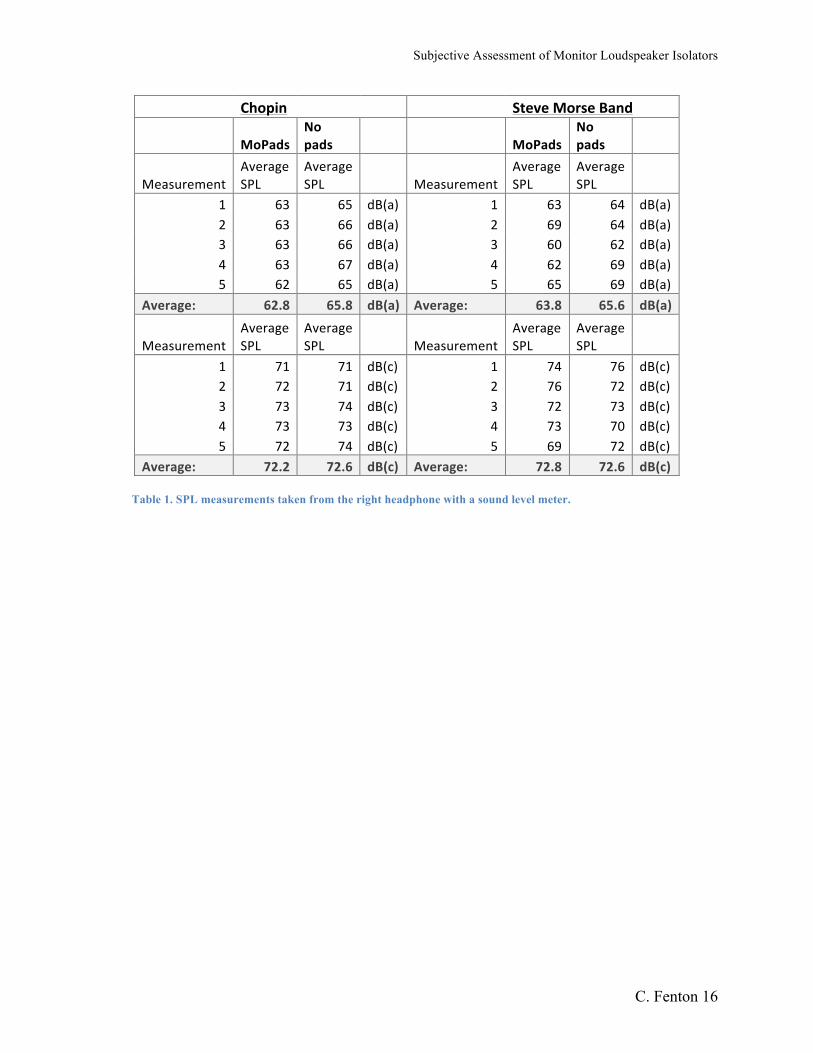
accuracy of + 2 dB at 114 dB SPL. Table 1. below, displays a series of measurements for
average SPLs for all four samples measured in dB(a) and dB(c) weightings with a fast response.
From the table below, it can be observed the level differences between the dB(a) measurements
within the same piece of music are greater than the level differences in dB(c). It can be assumed
that a listener will perceive a louder level from the recordings taken without the MoPads but it is
difficult to prove that a decrease in level is solely a function of the MoPads. Table 1 is provided
to illustrate the levels at which the samples were played through the headphones. At the levels
shown below, it is safe to say that none of the listeners would find the levels too loud or intrusive.
Perhaps the levels are too low for monitoring room standards but these levels can be set as
standard without the need to turn the level down within a trial session.
Another way to avoid having excessive levels within an experiment is to limit the
maximum output level the listener selects, either by way of a limiter circuit or a software limiter
in the PC. The output level was obtained with the right headphone lightly pressed against a
square piece of sturdy packaging foam with a hole in the middle. The hole was large enough to
fit the microphone end of the Radio Shack digital sound level meter.
Subjective Assessment of Monitor Loudspeaker Isolators
C. Fenton 16
Chopin Steve Morse Band
MoPads No pads
MoPads
No pads
Measurement Average SPL
Average SPL Measurement
Average SPL
Average SPL
1 63 65 dB(a) 1 63 64 dB(a) 2 63 66 dB(a) 2 69 64 dB(a) 3 63 66 dB(a) 3 60 62 dB(a) 4 63 67 dB(a) 4 62 69 dB(a) 5 62 65 dB(a) 5 65 69 dB(a)
Average: 62.8 65.8 dB(a) Average: 63.8 65.6 dB(a)
Measurement Average SPL
Average SPL Measurement
Average SPL
Average SPL
1 71 71 dB(c) 1 74 76 dB(c) 2 72 71 dB(c) 2 76 72 dB(c) 3 73 74 dB(c) 3 72 73 dB(c) 4 73 73 dB(c) 4 73 70 dB(c) 5 72 74 dB(c) 5 69 72 dB(c)
Average: 72.2 72.6 dB(c) Average: 72.8 72.6 dB(c)
Table 1. SPL measurements taken from the right headphone with a sound level meter.
Subjective Assessment of Monitor Loudspeaker Isolators
C. Fenton 17
3. Results
3.1 Statistical Basis
For this study, there were 10 binomial experiments (one for each subject) in which each
had a sample number of 20 (1 subject x 20 Trials: N = 20). Each binomial experiment consisted
of 10 trials for each piece of music which made a total of 20 trials (2 different music clips).
There were 10 subjects tested and each subject repeated a trial 10 times for each piece of music.
A multiple subject/multiple trial combination was employed, in which the outcome of each trial
was believed to be independent because the subjects were tested individually and they did not
view their results until after all 20 trials had ended.7 To assess the statistical significance of the
results obtained during this study, the Type 1 and Type 2 errors have been calculated for the
minimum required number of correct responses needed to reject the Null Hypothesis, as well as a
third indicative introduced by Leventhal; the Fairness Coefficient.
To calculate Type 1 error (α) (risk of concluding that differences are audible when they are
inaudible) and Type 2 error (β) (risk of concluding that differences are inaudible when they are
audible), one must choose the minimum number of correct responses ( r ) in an ABX test (with
N number of trials) that are needed to determine if there is an audible difference between
whatever is being tested.7(pg.12) For a 95% confidence level, or 0.05 significance level (nominal
α), QSC has provided Table 2. that shows their criterion for “confidently estimating” that there is
an audible difference between components under test.6(p.10)
Subjective Assessment of Monitor Loudspeaker Isolators
C. Fenton 18
Table 2. QSC’s minimum N to r table for 0.05 significance level.6(pg.10)
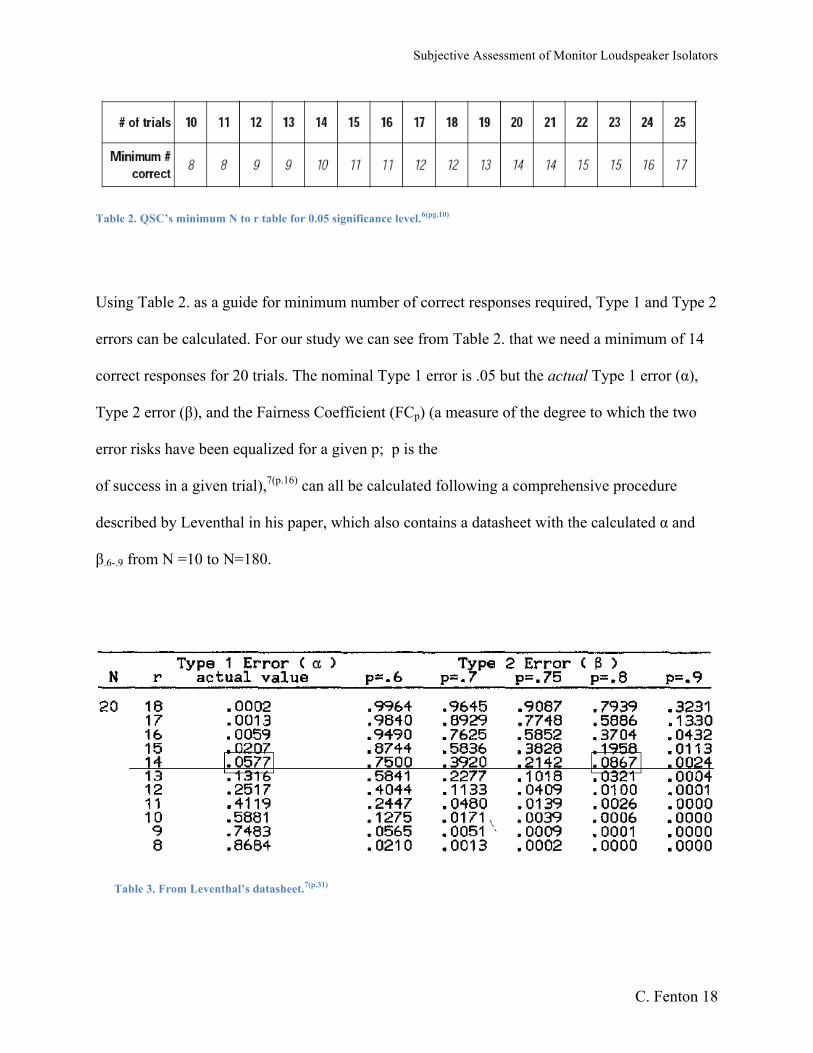
Using Table 2. as a guide for minimum number of correct responses required, Type 1 and Type 2
errors can be calculated. For our study we can see from Table 2. that we need a minimum of 14
correct responses for 20 trials. The nominal Type 1 error is .05 but the actual Type 1 error (α),
Type 2 error (β), and the Fairness Coefficient (FCp) (a measure of the degree to which the two
error risks have been equalized for a given p; p is the
of success in a given trial),7(p.16) can all be calculated following a comprehensive procedure
described by Leventhal in his paper, which also contains a datasheet with the calculated α and
β.6-.9 from N =10 to N=180.
Table 3. From Leventhal’s datasheet.7(p.31)
Subjective Assessment of Monitor Loudspeaker Isolators
C. Fenton 19
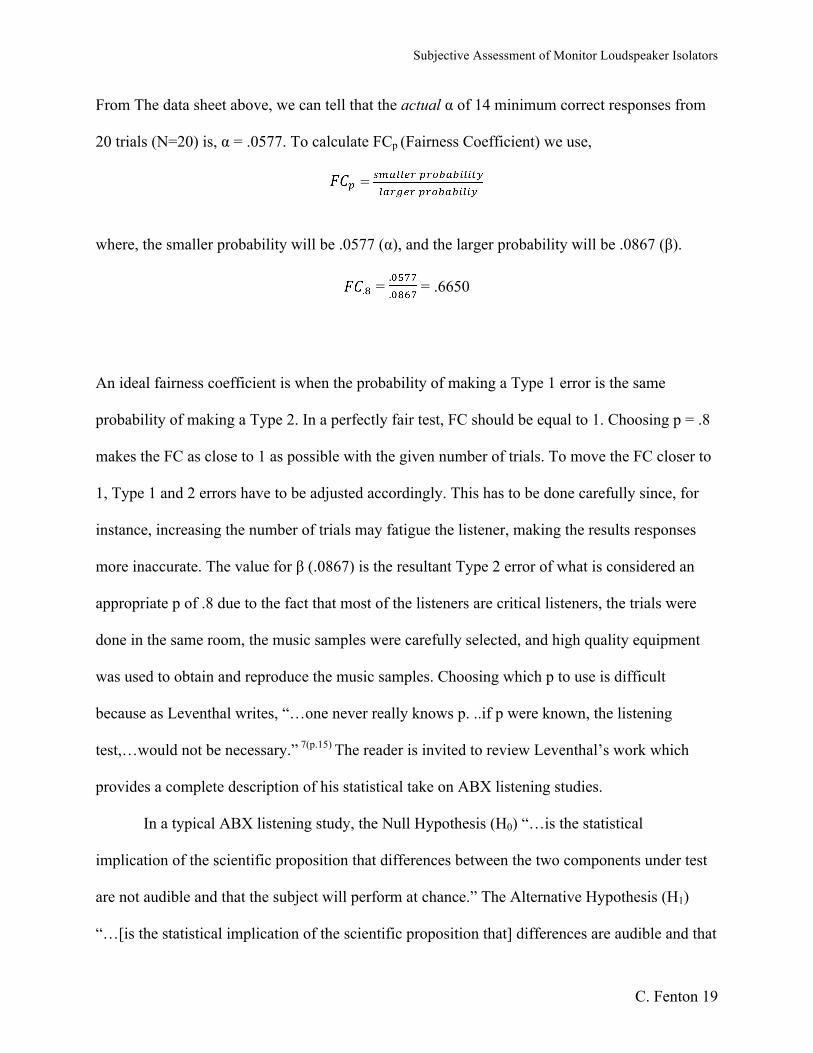
From The data sheet above, we can tell that the actual α of 14 minimum correct responses from
20 trials (N=20) is, α = .0577. To calculate FCp (Fairness Coefficient) we use,
=
where, the smaller probability will be .0577 (α), and the larger probability will be .0867 (β).
= = .6650
An ideal fairness coefficient is when the probability of making a Type 1 error is the same
probability of making a Type 2. In a perfectly fair test, FC should be equal to 1. Choosing p = .8
makes the FC as close to 1 as possible with the given number of trials. To move the FC closer to
1, Type 1 and 2 errors have to be adjusted accordingly. This has to be done carefully since, for
instance, increasing the number of trials may fatigue the listener, making the results responses
more inaccurate. The value for β (.0867) is the resultant Type 2 error of what is considered an
appropriate p of .8 due to the fact that most of the listeners are critical listeners, the trials were
done in the same room, the music samples were carefully selected, and high quality equipment
was used to obtain and reproduce the music samples. Choosing which p to use is difficult
because as Leventhal writes, “…one never really knows p. ..if p were known, the listening
test,…would not be necessary.” 7(p.15) The reader is invited to review Leventhal’s work which
provides a complete description of his statistical take on ABX listening studies.
In a typical ABX listening study, the Null Hypothesis (H0) “…is the statistical
implication of the scientific proposition that differences between the two components under test
are not audible and that the subject will perform at chance.” The Alternative Hypothesis (H1)
“…[is the statistical implication of the scientific proposition that] differences are audible and that
Subjective Assessment of Monitor Loudspeaker Isolators
C. Fenton 20
the subject will perform above chance.”7(p.5) For this study, the test is between two scenarios; use
of MoPads and no use of MoPads, as opposed to “two components” as Leventhal writes.
3.2 Test Results
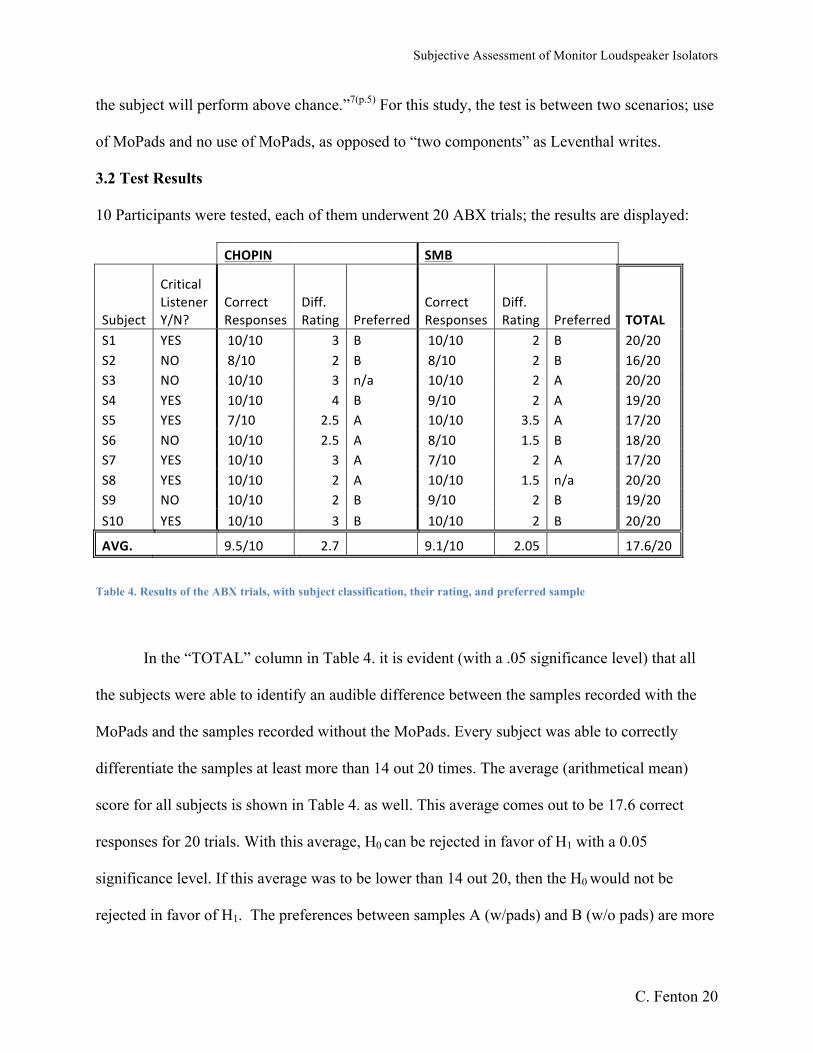
10 Participants were tested, each of them underwent 20 ABX trials; the results are displayed:
CHOPIN SMB
Subject
Critical Listener Y/N?
Correct Responses
Diff. Rating Preferred
Correct Responses
Diff. Rating Preferred TOTAL
S1 YES 10/10 3 B 10/10 2 B 20/20 S2 NO 8/10 2 B 8/10 2 B 16/20 S3 NO 10/10 3 n/a 10/10 2 A 20/20 S4 YES 10/10 4 B 9/10 2 A 19/20 S5 YES 7/10 2.5 A 10/10 3.5 A 17/20 S6 NO 10/10 2.5 A 8/10 1.5 B 18/20 S7 YES 10/10 3 A 7/10 2 A 17/20 S8 YES 10/10 2 A 10/10 1.5 n/a 20/20 S9 NO 10/10 2 B 9/10 2 B 19/20 S10 YES 10/10 3 B 10/10 2 B 20/20
AVG. 9.5/10 2.7 9.1/10 2.05 17.6/20
Table 4. Results of the ABX trials, with subject classification, their rating, and preferred sample
In the “TOTAL” column in Table 4. it is evident (with a .05 significance level) that all
the subjects were able to identify an audible difference between the samples recorded with the
MoPads and the samples recorded without the MoPads. Every subject was able to correctly
differentiate the samples at least more than 14 out 20 times. The average (arithmetical mean)
score for all subjects is shown in Table 4. as well. This average comes out to be 17.6 correct
responses for 20 trials. With this average, H0 can be rejected in favor of H1 with a 0.05
significance level. If this average was to be lower than 14 out 20, then the H0 would not be
rejected in favor of H1. The preferences between samples A (w/pads) and B (w/o pads) are more
Subjective Assessment of Monitor Loudspeaker Isolators
C. Fenton 21
or less balanced, and the averages for the 1-4 difference ratings for both music samples are
between “barely noticeable” and “noticeable”.
3.3 Data Analysis
As mentioned in section 2.2 – Acquisition of Test Samples and Discussion, the results of
the ABX trials may have been influenced by the alteration of the sound field created by the
increased height of the loudspeakers when they were resting on the MoPads.
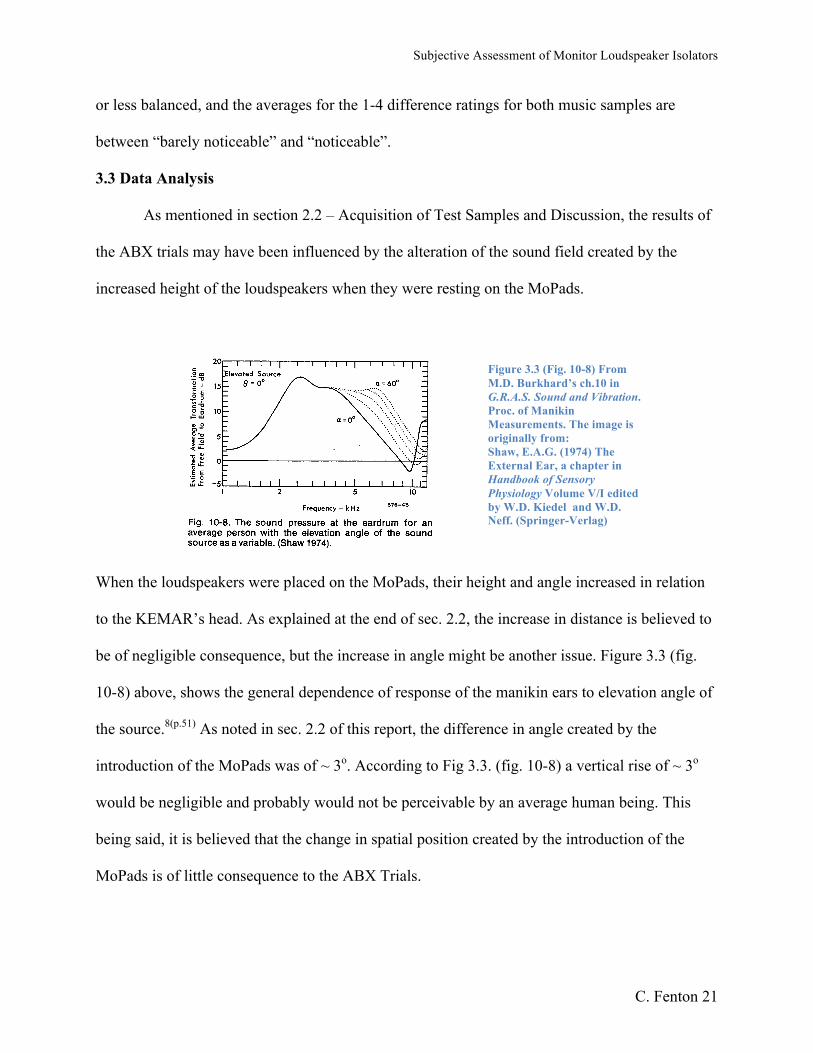
When the loudspeakers were placed on the MoPads, their height and angle increased in relation
to the KEMAR’s head. As explained at the end of sec. 2.2, the increase in distance is believed to
be of negligible consequence, but the increase in angle might be another issue. Figure 3.3 (fig.
10-8) above, shows the general dependence of response of the manikin ears to elevation angle of
the source.8(p.51) As noted in sec. 2.2 of this report, the difference in angle created by the
introduction of the MoPads was of ~ 3o. According to Fig 3.3. (fig. 10-8) a vertical rise of ~ 3o
would be negligible and probably would not be perceivable by an average human being. This
being said, it is believed that the change in spatial position created by the introduction of the
MoPads is of little consequence to the ABX Trials.
Figure 3.3 (Fig. 10-8) From M.D. Burkhard’s ch.10 in G.R.A.S. Sound and Vibration. Proc. of Manikin Measurements. The image is originally from: Shaw, E.A.G. (1974) The External Ear, a chapter in Handbook of Sensory Physiology Volume V/I edited by W.D. Kiedel and W.D. Neff. (Springer-Verlag)
Subjective Assessment of Monitor Loudspeaker Isolators
C. Fenton 22
Another issue that might have increased the subjects’ ability to distinguish between
samples could be that the when the KEMAR was used to record the music clips without the
MoPads, the ipsilateral ears were ~ 10.9o off-axis from the center of the loudspeakers. When the
MoPads were introduced, as mentioned previously, this angle was increased to ~ 14. The
manufacturer of the loudspeakers specifies that the vertical coverage area in which the signal is
phase coherent is + 10o. Placing the KEMAR’s ears so close to the edge of the “coherent area”
might have given rise to aural effects that might have diminished as the ipsilateral ears were
placed farther and farther away from the “coherent area”. This is considered to be of little
consequence as well since the recordings were made in the presence of two loudspeakers with
stereo recordings. The phase distortions at both angles of 10.9o and 14o are believed to be
random due to the phase differences created by the stereo recordings and the acoustics of the
room. It is believed that the subjects weren’t able to differentiate the samples based on phase
incoherence because of these reasons and because according to D. Koya’s double blind
investigations, human beings can’t recognize phase incoherence in music.3 Due to the design of
the monitoring studio’s desk in which the music samples were re-recorded, the KEMAR’s head
was out of the Loudspeakers’ “sweet spot”, this is a disadvantage to the strength of the
experiment. For any possible evaluations in the future that employ a similar method, it would be
imperative to keep the KEMAR’s ears directly on the loudspeaker’s horizontal and vertical axes.
The samples should be recorded at the highest possible quality to facilitate the test subjects’ task.
Placement of the KEMAR should be given much attention to ensure a high level of quality and
accuracy for the re-recordings.
The results of the ABX trials also might have been hindered by the quality of the original
files that were used to record the music samples. It is the belief of this author that if the files used
Subjective Assessment of Monitor Loudspeaker Isolators
C. Fenton 23
to record the music clips were of higher quality, any noticeable difference that a subject could
hear would only be accentuated; furthermore, the use of higher quality files may have given rise
to audible cues that could have been used to differentiate the samples. It is considered that the
use of higher quality files would have been likely to provide the subjects with a better - “fairer”
test.
Since the basis of this study is to assess if the MoPads affect the sound in a monitoring
room, where only critical listeners practice their trade, ideally, all of the test subjects that
participated should be considered critical listeners. This was not the case, but taking a look at the
results in Table 4., it can be observed that there were instances were “critical listeners” obtained
a less than perfect score (see S4, S5, and S7) and it can also be seen that one of the subjects that
wasn’t considered a critical listener obtained a perfect score (see S3). An ideal study for the
MoPads should only use professional and amateur audio engineers as test subjects since they are
the intended end-users of such a product. It can be assumed that repeating this ABX study
employing only audio engineers as test subjects would yield higher differentiation rates. It is also
important to mention that all the subjects tested were under the age of 30. It is recommended that
any similar studies include more subjects and of various ages to make for stronger assertions and
to take into consideration the degradation of hearing in humans as they age. It is quite possible
that a study with older individuals could yield lower differentiation rates (decreased number of
correct responses).
Perhaps the biggest issue plaguing the results of this study is the presence of the
equipment racks next to the loudspeakers. Taking a look at Figures 2.2(a), (b), (c), and (d), on
pages 10 and 11, it can be assumed that the equipment racks provided some sound reflection that
was picked up by the KEMAR’s ears. A problem arises when the loudspeakers are raised with
Subjective Assessment of Monitor Loudspeaker Isolators
C. Fenton 24
the use of the MoPads; at certain frequencies, less energy is being reflected by the equipment
racks. The amount of energy reflected off the racks quite possibly introduced a certain type of
sound coloration to what the KEMAR was receiving. If this coloration was reduced then
theoretically, the subjects under test would not only be hearing the differences created by the
decoupling of the loudspeakers from the mixing desk, they would also be hearing a reduced
sound coloration. This fault in test sample acquisition could easily lead to higher differentiation
rates between samples. It is difficult to determine the amount of energy that was reflected off of
the equipment racks but it is improbable that the subjects were able to differentiate samples
based solely on the different amounts of energy that were reflected off the equipment racks. To
improve any future studies using the methods described, the loudspeakers should be far enough
from any objects that might change the sound quality as a result of loudspeaker height increase.
The test results obtained during this study are believed to be satisfactory to a certain
degree. Much care should be taken to reduce the amount of variables when acquiring samples to
be used in ABX tests.
4. Conclusion
The possible difference in sound quality created by the use of loudspeaker isolators –
Auralex MoPads, in a sound monitoring room was assessed by performing a double blind study.
Music clips were re-recorded in a monitoring studio, playing back the music through the monitor
loudspeakers and recording the output with a KEMAR. Each music sample was recorded twice,
once without the MoPads and the second time without. The re-recorded wave files were placed
in an ABX testing computer program. 10 Test subjects performed 20 ABX trials each, to see if
Subjective Assessment of Monitor Loudspeaker Isolators
C. Fenton 25
they could differentiate the two recording scenarios and their responses were assessed
statistically. With the results obtained in this study, it is believed that the effect of Auralex
MoPads in a particular monitoring studio, are audible. The 0.05 significance level used to
statistically assess the data obtained through the study suggests that the use of MoPads is aurally
distinguishable. The method for this study is not without faults but some of the possible issues
have been addressed in the previous section. It is recommended that any attempt of reproducing
this study with alternative audio components or accessories, be made with a monitoring studio
that is optimal and presents as few variables as possible.
The variations on which this study could be improved include, among many, testing the
audibility of multiple isolation pads, perhaps by different manufacturers and of different designs,
to see which isolators are the most distinguishable. Another advantageous variation on this study,
in addition to an ABX test, would be to provide the subjects with questionnaires and record their
detailed assessments on the quality of the sound, as has been done in the works by F. E. Toole1,
and B. Bank and H.M. Lehtonen9. Since the function of loudspeaker isolators is based on
reducing the vibrations that pass from the loudspeaker’s enclosure to the mixing console, board,
desk, etc., an interesting variation on this study would be to use multiple loudspeakers of varying
weight and rigidity to see what type of loudspeakers would be most beneficiated from the use of
isolators. These are just a few variations that could be made to enhance such a study. Since the
method of this study might be labeled as unique or even unorthodox, the variations and possible
improvements are virtually endless. To mention a few, improvements can be made in the types
of files used to record the music, music selection, KEMAR positioning scrutiny, test subject
selection, test subject opinion gathering, and more demanding statistical evaluations.
Subjective Assessment of Monitor Loudspeaker Isolators
C. Fenton 26
Acknowledgements:
A special debt of gratitude is owed to Dominique Chéenne for his valuable comments,
suggestions, and instruction. To Douglas Jones for his valuable comments, instruction, and
suggestion on using the KEMAR to evaluate the isolators. To Pantelis Vassilakis for his valuable
emails. To Xinya “Peter” Zhang for his suggestion on how to measure the output of the
headphones. To David Randin for his comments. To Joshua Rivkin for his valuable assistance
with Pro Tools. To Brett Johnson, Ben Bridgewater, Ray Morales, and Robert Zilligen for their
suggestions and assistance with the use of the KEMAR. To Tony Miccolis and Sonija Dewberry
for the facilitation of the monitoring studio. And finally, to the subjects of the study who took the
time and effort to participate in this investigation.
Subjective Assessment of Monitor Loudspeaker Isolators
C. Fenton 27
References :
1 F. E. Toole, “Subjective Measurements of Loudspeaker Sound Quality and Listener
Performance,” J.AudioEng.Soc.,Vol.33, No.1/2 (1985).
2 Auralex Acoustics Inc. MoPad Monitor Isolators. Auralex Acoustics, copyright 1991-
2010. Web. <http://www.auralex.com/sound_isolation_mopad/sound_isolation_mopad.asp>.
3 D. Koya, "Aural Phase Distortion Detection." Thesis. University of Miami (2000).
Music.miami.edu. University of Miami. Web. 14 Apr. 2011.
<http://www.music.miami.edu/programs/mue/Research/dkoya/title_page.htm>.
4 M. D. Burkhard and R.M. Sachs. Anthropometric Manikin for Acoustic Research (Ch.
2). In M.D. Burkhard (comp.) G.R.A.S. Sound and Vibration. Proc. of Manikin Measurements,
Elk Grove Village, Illinois USA. G.R.A.S. Web. <http://www.gras.dk/00012/00330/>.
5 L. Archibald, J. G. Holt, and C. J. Huss. "The Highs & Lows of Double-Blind
Testing." The Highs & Lows of Double-Blind Testing. Stereophile Magazine. Web.
<http://www.stereophile.com/features/141/index.html>.
6 "QSC Audio, ABX Comparator User Manual." Ackthud.net. Web.
<http://www.ackthud.net/shawnfogg/pics/temp/ABX_manual.pdf>.
7 L. Leventhal, “How Conventional Statistical Analyses Can Prevent Finding Audible
Differences in Listening Tests,” presented at the AES Convention 79, paper number 2275 (1985).
8 M. D. Burkhard. Measurement Procedures (Ch. 10). In M.D. Burkhard (comp.) G.R.A.S.
Sound and Vibration. Proc. of Manikin Measurements, Elk Grove Village, Illinois USA.
G.R.A.S. Web. <http://www.gras.dk/00012/00330/>.
9 B. Bank and H.M. Lehtonen, “Perception of longitudinal components in piano string
vibrations,” J. Acoust. Soc. Am. Vol. 128 (3) (2010)