Embed Size (px)
Citation preview

Subject to Completion. Dated June 2, 2014.
Goldman Sachs Bank USA $
GS Momentum Builder® Multi-Asset 5 ER Index-Linked Certificates of Deposit due 2021
The CDs will not bear interest. The amount that you will be paid on your CDs on the stated maturity date (expected to be March 30, 2021) is based on the performance of the GS Momentum Builder® Multi-Asset 5 ER Index as measured from the trade date (expected to be June 25, 2014) to and including the determination date (expected to be March 25, 2021). The index measures the extent to which the performance of the selected underlying assets (up to 14 exchange traded funds and a money market position, which provide exposure to equities, fixed income, emerging markets, alternatives, commodities, inflation, and cash equivalent asset classes) outperform the sum of 3-month USD LIBOR plus a daily index fee of 0.50% per annum. The money market position reflects the returns accruing at a rate equal to the federal funds effective rate on a hypothetical investment in a notional overnight money account denominated in U.S. dollars. The return on your CDs will be positive if the index level on the determination date is greater than the initial level of the index (set on the trade date). If the final index level is less than the initial index level, you will receive the face amount of your CDs. Because the index measures the performance of the selected underlying assets less the sum of 3-mo-LIBOR plus the fee of 0.50% per annum, the selected underlying assets must outperform 3-mo-LIBOR plus the fee of 0.50% per annum for the index level to increase. The index rebalances monthly (and sometimes daily) from among the 15 underlying assets. Each month the index is rebalanced by calculating the combination of underlying assets with the highest return during the prior six months, subject to a (a) limit of 5% on portfolio realized volatility over look-back periods of six months, three months and one month, and (b) maximum weight for each underlying asset and each asset class. Realized volatility is the degree of variation in the daily closing prices or levels of the aggregate of the underlying assets over the applicable look-back period. This results in a portfolio for each of the three look-back periods. The weight of each underlying asset for each monthly rebalancing will equal the average of the weight, if any, of such underlying asset in the three portfolios. During the term of your CDs, as a result of monthly rebalancing, the index may include as few as four underlying assets (as few as three ETFs) and may never include some of the underlying assets or asset classes. On each index business day the realized volatility of the index for the prior month is calculated and, if it exceeds 6%, the index will be rebalanced for that day (but not for any subsequent index business day) by ratably reallocating a portion of the exposure to the ETFs in the index to the money market position sufficient to reduce the prior month realized volatility to 6%. As a result of a daily rebalancing, the index may not include any ETFs and may allocate its entire exposure to the money market position, the return on which might not exceed 3-mo-LIBOR. Historically, a significant portion of the index exposure has been to the money market position, the return on which has been below 3-mo-LIBOR. To determine your payment of the supplemental amount at maturity, we will calculate the index return, which is the percentage increase or decrease in the final index level from the initial index level. For each $1,000 face amount of your CDs you will receive an amount in cash equal to $1,000 plus the supplemental amount, if any. The supplemental amount will equal:
● if the index return is positive (the final index level is greater than the initial index level), the product of (a) $1,000 times (b) 2.0 times (c) the index return; or
● if the index return is zero or negative (the final index level is equal to or less than the initial index level), $0. Your investment in the CDs involves certain risks, including, among other things, our credit risk. See page S-19. You should read the additional disclosure herein so that you may better understand the terms and risks of your investment.
The estimated value of your CDs at the time the terms of your CDs are set on the trade date (as determined by reference to pricing models used by Goldman, Sachs & Co. (GS&Co.) and taking into account our credit spreads) is expected to be between $910 and $960 per $1,000 face amount, which will be less than the original issue price. The value of your CDs at any time will reflect many factors and cannot be predicted; however, the price (not including GS&Co.’s customary bid and ask spreads) at which GS&Co. would initially buy or sell CDs (if it makes a market, which it is not obligated to do) and the value that GS&Co. will initially use for account statements and otherwise will equal approximately $ per $1,000 face amount, which will exceed the estimated value of your CDs as determined by reference to these models. The amount of the excess will decline on a straight line basis over the period from the trade date through . You must hold the CDs to maturity to receive the stated payout from Goldman Sachs Bank USA. Original issue date: expected to be June 30, 2014 Original issue price: 100.00% of the face amount* Placement fee: % of the face amount Net proceeds to the issuer: % of the face amount * The original issue price will vary between % and 100% for certain investors; see “Supplemental Plan of Distribution” on page S-158. The CDs evidence deposit liabilities of Goldman Sachs Bank USA and are not obligations of or guaranteed by The Goldman Sachs Group, Inc. or any other entity. The CDs are covered, with respect to the face amount only, by federal deposit insurance, up to a maximum limit of $250,000 per depositor or $250,000 per participant in the case of certain retirement accounts. These maximum limits are the total federal deposit insurance protection available for your CDs, together with any other deposit accounts you may hold at Goldman Sachs Bank USA in the same right and capacity. In addition, the FDIC has taken the position that the supplemental amount is not insured by the FDIC until it has been finally determined and accrued on the determination date. FDIC insurance is subject to further important limitations set forth on the next page.
Disclosure Statement Supplement No. dated , 2014.
The
info
rmat
ion
in th
is p
relim
inar
y di
sclo
sure
stat
emen
t sup
plem
ent i
s not
com
plet
e an
d m
ay b
e ch
ange
d. T
his p
relim
inar
y di
sclo
sure
stat
emen
t sup
plem
ent i
s not
an
offe
r to
sell
nor d
oes i
t see
k an
offe
r to
buy
thes
e CD
s in
any
juris
dict
ion
whe
re th
e of
fer o
r sal
e is
not
per
mitt
ed.

Goldman Sachs Bank USA may use this disclosure statement supplement in the initial sale of the CDs. In addition, Goldman, Sachs & Co. or any other affiliate of Goldman Sachs Bank USA may use this disclosure statement supplement in a market-making transaction in a CD after its initial sale. If the CDs are purchased from Goldman, Sachs & Co. or any other affiliate of Goldman Sachs Bank USA, this disclosure statement supplement is being used in a market-making transaction, unless the purchaser is informed otherwise in the confirmation of sale. We may decide to sell additional CDs after the date of this disclosure statement supplement, at issue prices and with placement fees and net proceeds that differ from the amounts set forth above. By your purchase of a CD, you are deemed to represent to us and any dealer through which you purchase the CD that your deposits with Goldman Sachs Bank USA, including the CDs, when aggregated in accordance with Federal Deposit Insurance Corporation regulations, are within the $250,000 FDIC insurance limit for each insurable capacity. For purposes of early withdrawal upon your death or adjudication of incompetence, we will limit the combined aggregate principal amount of (i) these CDs and (ii) any other CDs of Goldman Sachs Bank USA subject to this withdrawal limit to the FDIC insurance coverage amount applicable to each insurable capacity in which such CDs are held. Please contact us or the applicable dealer if you have any questions concerning the application of the limit on early withdrawal to your CDs. FDIC insurance may not cover the CDs if a regulatory or statutory change renders the CDs ineligible for FDIC insurance coverage. Further, if Goldman Sachs Bank USA’s status as an insured depository institution is terminated or suspended by the FDIC (including as a result of our actions) or is terminated by us, during the period of temporary insurance following the termination or suspension the FDIC insurance may not cover any amounts in excess of the face amount of the CDs. Also, FDIC insurance does not cover any losses attributable to the sale of your CDs prior to maturity and any secondary market premium paid by you above the face amount of the CDs is not insured by the FDIC. Thus, the amount of any CD that will be insured by the FDIC may be less than the full amount that would otherwise be payable on the CD at maturity. For more information about some of the limits of FDIC insurance that apply to the CDs and the ranking of the CDs relative to other obligations of Goldman Sachs Bank USA, see “Status of Certificates of Deposit” on page 5 of the accompanying disclosure statement and “Additional Risk Factors Specific to Your Certificates of Deposit” on page S-19 of this disclosure statement supplement. Any amount owed on the CDs in excess of, or not otherwise eligible for, FDIC insurance will be subject to the creditworthiness of Goldman Sachs Bank USA. The CDs have not been nor will they be registered under the Securities Act of 1933. Neither the Securities and Exchange Commission nor any other regulatory body has approved or disapproved of the CDs or passed upon the accuracy or adequacy of this disclosure statement supplement or the accompanying disclosure statement, which have not been filed with the SEC. Any representation to the contrary is a criminal offense. The following is a list of the eligible underlying assets for the index, including the related asset classes, asset class maximum weights and underlying asset maximum weights. The index is more fully described beginning on page S-51 herein.
ASSET CLASS
ASSET CLASS
MINIMUM WEIGHT
ASSET CLASS
MAXIMUM WEIGHT
ELIGIBLE UNDERLYING
ASSET TICKER
UNDERLYING ASSET
MINIMUM WEIGHT
UNDERLYING ASSET
MAXIMUM WEIGHT
Equities 0% 50% SPDR® S&P 500® ETF Trust SPY 0% 20% iShares® MSCI EAFE ETF EFA 0% 20% iShares® MSCI Japan ETF EWJ 0% 10%
Fixed Income 0% 50%
iShares® 20+ Year Treasury Bond ETF TLT 0% 20% iShares® iBoxx $ Investment Grade Corporate Bond ETF LQD 0% 20%
iShares® iBoxx $ High Yield Corporate Bond ETF HYG 0% 20%
Emerging Markets 0% 25%
iShares® MSCI Emerging Markets ETF EEM 0% 20% iShares® J.P. Morgan USD Emerging Markets Bond ETF EMB 0% 20%
Alternatives 0% 25% iShares® U.S. Real Estate ETF IYR 0% 20% Alerian MLP ETF AMLP 0% 10% PowerShares® Senior Loan Portfolio BKLN 0% 10%
Commodities 0% 25% PowerShares® DB Commodity Index Tracking Fund DBC 0% 20%
SPDR® Gold Trust GLD 0% 20% Inflation 0% 25% iShares® TIPS Bond ETF TIP 0% 25%
Cash Equivalent 0% 50%* Money Market Position N/A 0% 50%*
* With respect to the money market position, the related asset class maximum weight and underlying asset maximum weight limitations do not apply to daily rebalancing and, therefore, as a result of daily rebalancing, the index may allocate its entire exposure to the money market position.

About Your CDs This disclosure statement supplement constitutes a supplement to the document listed below and should be read in conjunction with such document:
Disclosure statement dated December 19, 2011(available at http://www2.goldmansachs.com/disclaimer/gsbankusa/gs-bank-usa-disclosure-statement-december-19-2011.pdf) The information in this disclosure statement supplement supersedes any conflicting information in the document listed above. In addition, some of the terms or features described in the listed document may not apply to your CDs.

S-4
SUMMARY INFORMATION
We refer to the certificates of deposit we are offering by this disclosure statement supplement as the “offered CDs” or the “CDs”. Each of the offered CDs, including your CDs, has the terms described below. Please note that in this disclosure statement supplement, references to “Goldman Sachs Bank USA”, “we”, “our” and “us” refer only to Goldman Sachs Bank USA.
You should read this disclosure statement supplement together with the disclosure statement dated December 19, 2011, of Goldman Sachs Bank USA, which we refer to herein as the “accompanying disclosure statement”. The accompanying disclosure statement is available at http://www2.goldmansachs.com/disclaimer/gsbankusa/gs-bank-usa-disclosure-statement-december-19-2011.pdf or may be obtained from us or your broker.
Key Terms Issuer: Goldman Sachs Bank USA Index: GS Momentum Builder® Multi-Asset 5 ER Index (Bloomberg symbol, “GSMBMA5 Index”), as published by the index sponsor (including any index calculation agent acting on the index sponsor’s behalf); see “The Index” on page S-51. Additional information about the index is available at the following website: http://www.solactive.com/indexing-en/indices/complex/. We are not incorporating by reference the website or any material it includes in this disclosure statement supplement Index calculation agent: Solactive AG Index sponsor: Goldman, Sachs & Co. Face amount: $ in the aggregate for all the offered CDs, issued in minimum denominations of $1,000 and integral multiples of $1,000 in excess thereof Payment amount: on the stated maturity date, we will pay you for each $1,000 face amount of your CDs, an amount in cash equal to the sum of $1,000 plus the supplemental amount Supplemental amount: for each $1,000 face amount of the CDs:
• if the index return is positive (the final index level is greater than the initial index level), the product of (i) $1,000 times (ii) the upside participation rate times (iii) the index return; or
• if the index return is zero or negative (the final index level is equal to or less than the initial index level), $0 Initial index level (to be set on the trade date): Closing level of the index: as described under “Specific Terms of Your Certificates of Deposit — Special Calculation Provisions — Closing Level of the Index” on page S-44 Level of the index: as described under “Specific Terms of Your Certificates of Deposit — Special Calculation Provisions — Level of the Index” on page S-44
Final index level: the closing level of the index on the determination date, except in the limited circumstances described under “Specific Terms of Your Certificates of Deposit — Consequences of a Non-Trading Day” on page S-42 and subject to adjustment as provided under “Specific Terms of Your Certificates of Deposit — Discontinuance or Modification of the Index” on page S-42 Index return: the quotient of (i) the final index level minus the initial index level divided by (ii) the initial index level, expressed as a positive or negative percentage Upside participation rate: 200.00% Supplemental discussion of U.S. federal income tax consequences: The CDs will be treated as debt instruments subject to the special rules governing contingent payment debt instruments for U.S. federal income tax purposes. Under this treatment, it is the opinion of Sidley Austin LLP that if you are a U.S. individual or taxable entity, you generally should be required to pay taxes on ordinary income from the CDs over their term based on the comparable yield for the CDs. In addition, any gain you may recognize on the sale, exchange or maturity of the CDs will be taxed as ordinary interest income. Trade date: expected to be June 25, 2014 Original issue date (settlement date) (to be set on the trade date): expected to be June 30, 2014

S-5
Stated maturity date (to be set on the trade date): expected to be March 30, 2021 subject to adjustment as described under “Specific Terms of Your Certificates of Deposit — Payment on Stated Maturity Date — Stated Maturity Date” on page S-42 Determination date (to be set on the trade date): expected to be March 25, 2021 subject to adjustment as described under “Specific Terms of Your Certificates of Deposit — Payment on Stated Maturity Date — Determination Date” on page S-42 Mandatory redemption: if our status as an insured depository institution is terminated by the FDIC or us or as a result of our actions, or if a regulatory or statutory change renders the CDs ineligible for FDIC insurance coverage, to the extent permitted by law and regulation, we will redeem your CDs then outstanding on the applicable mandatory redemption date, unless they mature prior to such date, as described under “Specific Terms of Your Certificates of Deposit — Mandatory Redemption” on page S-42; your CDs are not otherwise subject to redemption at our option
Mandatory redemption date: as described under “Specific Terms of Your Certificates of Deposit — Mandatory Redemption” on page S-43
Mandatory redemption amount: as described under “Specific Terms of Your Certificates of Deposit — Special Calculation Provisions — Mandatory Redemption Amount” on page S-44
Optional redemption in the event of death or adjudication of incompetence: as described under “Specific Terms of Your Certificates of Deposit — Optional Redemption in the Event of Death or Adjudication of Incompetence” on page S-43 (such description includes important limitations, described on pages S-16 and S-43 hereof, that are not described in the accompanying disclosure statement). Your CDs are not otherwise subject to repayment at your option. If you sell your CDs in a secondary market transaction prior to maturity, you may receive significantly less than the face amount, as described under “Q&A — What Will I Receive If I Sell the CDs Prior to the Stated Maturity Date?” below
Redemption date: means the date on which CDs are redeemed following a mandatory redemption or an optional redemption in the event of death or adjudication of incompetence, as applicable
No interest: the CDs will not bear interest No listing: the CDs will not be listed on any securities exchange or interdealer market quotation system CD calculation agent: Goldman, Sachs & Co. Business day: as described under “Specific Terms of Your Certificates of Deposit — Special Calculation Provisions — Business Day” on page S-44 Trading day: as described under “Specific Terms of Your Certificates of Deposit S pe cia l Ca lcula tion Provisions Tra ding Da y” on pa ge S-44 CUSIP no.: 38147JF49 ISIN no.: US38147JF492 Legal ownership and payment: the CDs will be issued in master certificate form and payment will be made in accordance with the applicable procedures of the depositary, as discussed under “Legal Ownership and Payment” on page 38 of the accompanying disclosure statement
ERISA: as described under “Employee Retirement Income Security Act” on page 55 of the accompanying disclosure statement
Original issue price: 100% of the face amount or between % and 100% of the face amount for CDs purchased by certain advisory accounts where investors are charged investment advisory or other fees in connection with such accounts. An investor who purchases CDs at an original issue price below 100% of the face amount will still be credited with the full face amount of the CD but will purchase at a more favorable price to the extent of the difference between the price such investor pays for the CD and 100% of the face amount of the CD.
Purchase Limitation
By your purchase of a CD, you are deemed to represent to us and any dealer through which you purchase the CD that your deposits with Goldman Sachs Bank USA, including the CDs, when aggregated in accordance with Federal Deposit Insurance Corporation regulations, are within the $250,000 FDIC insurance limit for each insurable capacity.

S-6
Transaction Summary GS Momentum Builder® Multi-Asset 5 ER Index-Linked Certificates of Deposit due 2021
The below is only a brief summary of the terms of your CDs. You should read the detailed description thereof in “Summary Information” on page S-4 and in “Specific Terms of Your Certificates of Deposit” on page S-41 as well as the accompanying disclosure statement.
INVESTMENT THESIS For investors who:
• seek the opportunity to achieve a return based on the performance of an index that attempts to track the positive price momentum in certain eligible underlying assets by varying exposure to those eligible underlying assets, subject to limitations on volatility and a maximum weight for each underlying asset and each asset class. Amounts payable on the CDs are FDIC insured in the amounts described on page S-13, up to the applicable FDIC insurance limits, and thereafter exposed to the credit risk of the issuer.
• understand that the eligible underlying assets provide exposure to equities, fixed income, emerging markets, alternatives, commodities, inflation, and cash equivalent asset classes.
• seek to have their principal returned after a period of 81 months. • believe the index will increase during the period from the trade date to the determination date. • are willing to receive only their principal back at maturity if the index return is less than or equal to zero.
The index may include as few as four underlying assets (as few as three ETFs) and may not include some of the underlying assets or assets classes during the entire term of your CDs. Historically, a significant portion of the index exposure has been to the money market position, the return of which has been below 3-month USD LIBOR.
PAYOUT DESCRIPTION On the stated maturity date we will pay you, for each $1,000 face amount of your CDs, an amount in cash equal to the sum of $1,000 plus:
• if the index return is positive (the final index level is greater than the initial index level), the product of (i) $1,000 times (ii) 2.0 times (iii) the index return; or
• if the index return is zero or negative (the final index level is equal to or less than the initial index level), $0.

S-7
Transaction Summary GS Momentum Builder® Multi-Asset 5 ER Index-Linked Certificates of Deposit due 2021
THE INDEX The GS Momentum Builder® Multi-Asset 5 ER Index (the index) measures the extent to which the performance of the exchange traded
funds and money market position included in the index outperform the notional interest rate, which is a rate equal to 3-month USD LIBOR, plus a daily index maintenance fee of 0.50% per annum. The money market position reflects the returns accruing to a hypothetical investor from an investment in a notional overnight money account denominated in U.S. dollars that accrues interest at a rate equal to the federal funds effective rate. The index rebalances monthly (and sometimes daily) from among 15 underlying assets that provide exposure to assets that have been categorized in the following asset classes: equities; fixed income; emerging markets; alternatives; commodities; inflation; and cash equivalent. The index attempts to track the positive price momentum in the underlying assets, subject to limitations on volatility and a maximum weight for each underlying asset and each asset class, each as described below.
Features of the index include: • monthly rebalancing based on the combination of underlying assets that would have provided the highest historical return during a
return look-back period comprised of the prior six months, subject to: o a limit of 5% on the degree of variation in the daily closing prices or closing level, as applicable, of the aggregate of such
underlying assets over three different realized volatility look-back periods (the prior six months, three months and one month); and o a maximum weight for each underlying asset and each asset class; and
• the potential for daily rebalancing into the money market position, based on whether the realized volatility of the underlying assets comprising the index exceeds the volatility cap of 6% for the applicable volatility cap period (the prior one month).
Analyzing realized volatility over three look-back periods results in a portfolio for each look-back period and the weight of each underlying asset for each monthly rebalancing will equal the average of the weights of such underlying asset in the three portfolios. Monthly rebalancing will be implemented over a base index rebalancing period comprised of five base index rebalancing days, which are the first five index business days of each calendar month beginning on, and including, the base index observation day (the first calendar day of each month), subject to adjustment.
The value of the index is calculated on each index business day by reference to the performance of the total return index value net of the sum of the return on the notional interest rate in effect at that time plus the daily index maintenance fee of 0.50% per annum. Any cash dividend paid on an index ETF is deemed to be reinvested in such index ETF and subject to subsequent changes in the value of the index ETF. In addition, any interest accrued on the money market position is similarly deemed to be reinvested on a daily basis in such money market position and subject to subsequent changes in the federal funds effective rate. The total return index value on each index business day is calculated by reference to the weighted performance of:
• the base index, which is the weighted combination of underlying assets that comprise the index at the applicable time as a result of the most recent monthly base index rebalancing (whether partially or fully implemented); and
• any additional exposure to the money market position resulting from any daily total return index rebalancing that day. The underlying assets that comprise the base index as the result of the most recent monthly base index rebalancing may include a
combination of ETFs and the money market position, or solely ETFs. A daily total return index rebalancing will occur on a daily total return index rebalancing day, which is any index business day, if the realized volatility of the base index exceeds the volatility cap of 6% for the volatility cap period applicable to such daily total return index rebalancing day. As a result of a daily total return index rebalancing, the index will have exposure to the money market position even if the base index has no such exposure resulting from its most recent monthly base index rebalancing.
For the purpose of this disclosure statement supplement: • an “eligible underlying asset” is one of the ETFs or the money market position that is eligible for inclusion in the index on a monthly
base index observation day; • an “eligible ETF” is one of the ETFs that is eligible for inclusion in the index on a monthly base index observation day (when we refer to
an “ETF” we mean an exchange traded fund, which for purposes of this disclosure statement supplement includes the following exchange traded products: SPDR® S&P 500® ETF Trust, PowerShares® DB Commodity Index Tracking Fund and SPDR® Gold Trust);
• an “index underlying asset” is an eligible underlying asset with a non-zero weighting on any index business day; • an “index ETF” is an ETF that is an eligible ETF with a non-zero weighting on any index business day; and • an “index business day” is a day on which both (i) commercial banks and currency exchange markets settle payments and are open for
general business in New York and (ii) the New York Stock Exchange is open for its regular trading session on such day. TERMS Issuer Goldman Sachs Bank USA Index GS Momentum Builder® Multi-Asset 5 ER Index Trade Date Expected to be June 25, 2014 Settlement Date (to be set on the trade date) Expected to be June 30, 2014 Determination Date (to be set on the trade date) Expected to be March 25, 2021 Stated Maturity Date (to be set on the trade date) Expected to be March 30, 2021 Initial Index Level To be determined on the trade date Final Index Level The closing level of the index on the determination date Upside Participation Rate 200.00% Index Return The quotient of (i) the final index level minus the initial index level divided by (ii) the initial
index level, expressed as a percentage Payment Amount On the stated maturity date we will pay you, for each $1,000 face amount of your CDs, an
amount in cash equal to the sum of $1,000 plus the supplemental amount Supplemental Amount For each $1,000 face amount of the CDs:
• if the index return is positive (the final index level is greater than the initial index level), the product of (i) $1,000 times (ii) the upside participation rate times (iii) the index return; or
• if the index return is zero or negative (the final index level is equal to or less than the initial index level), $0
CUSIP 38147JF49

S-8
Transaction Summary GS Momentum Builder® Multi-Asset 5 ER Index-Linked Certificates of Deposit due 2021
HYPOTHETICAL EXAMPLES
The following table is provided for purposes of illustration only. It should not be taken as an indication or prediction of future investment results and is intended merely to illustrate the impact that various hypothetical closing levels of the index on the determination date could have on the payment at maturity assuming an upside participation rate of 200.00% and assuming all other variables remain constant. The actual performance of the index over the life of your CDs, particularly on the determination date, as well as the amount payable on the stated maturity date, may bear little relation to the hypothetical examples shown below or on page S-47 or to the historical levels of the index shown elsewhere in this disclosure statement supplement. You should also refer to the historical index performance information and hypothetical performance data beginning on page S-61 of this disclosure statement supplement.
Hypothetical Final Index Level (as a Percentage of
the Initial Index Level)
Hypothetical Payment Amount (as a Percentage of
Face Amount) 175.00% 250.00% 150.00% 200.00% 125.00% 150.00% 110.00% 120.00% 100.00% 100.00% 90.00% 100.00% 75.00% 100.00% 50.00% 100.00% 25.00% 100.00% 0.00% 100.00%

S-9
Transaction Summary GS Momentum Builder® Multi-Asset 5 ER Index-Linked Certificates of Deposit due 2021
REBALANCING
Monthly Base Index Rebalancing
Calculate the 6-month historical returns for each
underlying asset combination
Daily Total Return Index Rebalancing
Calculate the realized volatility of the index underlying assets for the applicable 1-month
volatility cap period
The weightings of the index underlying assets
will be rebalanced in order to reduce the
realized volatility for the applicable 1-month
volatility cap period by ratably reallocating a
portion of the exposure to the ETFs comprising the index to the money market position. The
money market position reflects the notional returns accruing to a hypothetical investor
from an investment in a notional overnight money account denominated in U.S. dollars that accrues interest at the overnight interest rate, which is a rate equal to the federal
funds effective rate
Yes No
Determine three potential portfolios (one for each realized volatility look-back period) by selecting
underlying asset weights that both (i) would have provided the highest
6-month historical return and (ii) are within the underlying asset
maximum weight, the asset class maximum weight and the
applicable realized volatility constraint
Run the daily rebalancing test to determine if any further changes from
this position are required
Calculate the 6-month, 3-month and 1-month
realized volatility for each underlying asset
combination (each a potential portfolio)
Has the realized volatility for the applicable 1-month volatility cap period exceeded the volatility cap?
The index will not be rebalanced on such index business day
Determine the weighting of each index underlying asset by averaging the weights of each underlying asset
in the three potential portfolios identified above

S-10
Transaction Summary GS Momentum Builder® Multi-Asset 5 ER Index-Linked Certificates of Deposit due 2021
Historical Information and Hypothetical Data The following chart and table provide a comparison between the index (using historical information and hypothetical data, as explained below) and certain asset classes (in each case, represented by a benchmark ETF or a benchmark index) from December 3, 2007 to May 27, 2014. Benchmark ETF data and benchmark index data is based on the historical levels of the benchmark ETFs and benchmark indices, respectively. The historical index information from December 17, 2013 (the index launch date) to May 27, 2014 reflects the actual performance of the index. (In the chart, this historical index information can be found to the right of the vertical solid line marker.) The hypothetical index data from March 3, 2011 to December 16, 2013 is based on the historical levels of the eligible underlying assets using the same methodology that is used to calculate the index. Hypothetical index data for the period from December 3, 2007 through March 2, 2011 was calculated using the same methodology that is used to calculate the index, provided that a proxy was used for the following eligible ETFs, in each case for the period of time that such eligible ETF was not in existence: iShares® J.P. Morgan USD Emerging Markets Bond ETF (not in existence prior to December 19, 2007), Alerian MLP ETF (not in existence prior to August 25, 2010) and PowerShares® Senior Loan Portfolio (not in existence prior to March 3, 2011). As a result, due to the varying weights of the eligible ETFs and proxies, at any time during this period as much as 100% of the hypothetical index performance data was derived from proxy data. Please note that the benchmark ETFs and benchmark indices that are used to represent asset classes for purposes of the following table and chart may not be eligible underlying assets for purposes of the index and in some cases differ from the eligible underlying assets that are used to represent asset classes with the same or similar titles for purposes of the index. You should not take the historical index information, hypothetical index data or historical benchmark ETF and benchmark index data as an indication of the future performance of the index.
Performance Since December 2007
As of 5/27/2014
GS Momentum Builder® Multi Asset 5 ER
Index (GSMBMA5)
US Bonds (AGG)
Global Equities (MSCI ACWI
Excess Return Index)
Commodities (S&P GSCI
Excess Return Index)
US Real Estate (IYR)
Effective Performance (1 Month) 1.93% 1.06% 2.02% -0.26% 3.03% Effective Performance (6 Month) 4.97% 2.88% 5.59% 6.42% 15.68% Annualized* Performance (since December 2007) 6.32% 4.04% 2.29% -5.52% 4.53% Annualized* Realized Volatility (since December 2007)** 5.14% 5.97% 19.92% 25.16% 39.70%
Return over Risk (since December 2007)*** 1.23 0.68 0.12 -0.22 0.11 Maximum Peak-to-Trough Drawdown**** -11.04% -13.19% -58.27% -71.59% -68.32%
* Calculated on a per annum percentage basis. ** Calculated on the same basis as realized volatility used in calculating the index. *** Calculated by dividing the annualized performance by the annualized realized volatility since December 3, 2007. **** The largest percentage decline experienced in the relevant measure from a previously occurring maximum level.
0
20
40
60
80
100
120
140
160
GS Momentum Builder® Multi Asset 5 ER Index (GSMBMA5) US Bonds (AGG)
Global Equities (MSCI ACWI Excess Return Index) Commodities (S&P GSCI Excess Return Index)
US Real Estate (IYR)

S-11
Transaction Summary
GS Momentum Builder® Multi-Asset 5 ER Index-Linked Certificates of Deposit due 2021
The following chart, which is based on historical information and hypothetical data, sets forth the monthly allocation on each base index observation day between each asset class from December 3, 2007 to May 1, 2014, with each bar representing a month. The historical index information from December 17, 2013 (the index launch date) to May 1, 2014 reflects the actual performance of the index. (In the chart, this historical information can be found to the right of the vertical solid line marker.) The hypothetical index data from March 3, 2011 to December 16, 2013 is based on the historical levels of the eligible underlying assets using the same methodology that is used to calculate the index. Hypothetical index data for the period from December 3, 2007 through March 2, 2011 was calculated using the same methodology that is used to calculate the index, provided that a proxy was used for the following eligible ETFs, in each case for the period of time that such eligible underlying asset was not in existence: iShares® J.P. Morgan USD Emerging Markets Bond ETF (not in existence prior to December 19, 2007), Alerian MLP ETF (not in existence prior to August 25, 2010) and PowerShares® Senior Loan Portfolio (not in existence prior to March 3, 2011). As a result, due to the varying weights of the eligible underlying assets and proxies, at any time during this period as much as 100% of the hypothetical index performance data was derived from proxy data. You should not take the historical index information or hypothetical index data as an indication of the future performance of the index.
RISKS
Please read the section entitled “Additional Risk Factors Specific to Your Certificates of Deposit” beginning on page S-19 of this disclosure statement supplement as well as the risks described under “Risk Factors” in the accompanying disclosure statement dated December 19, 2011.
0.00%
10.00%
20.00%
30.00%
40.00%
50.00%
60.00%
70.00%
80.00%
90.00%
100.00%
Dec-07 Jun-08 Dec-08 Jun-09 Dec-09 Jun-10 Dec-10 Jun-11 Dec-11 Jun-12 Dec-12 Jun-13 Dec-13
Cash Equivalent
Inflation
Commodities
Alternatives
Emerging Markets
Fixed Income
Equities

S-12
Q&A
How do the CDs Work?
On the stated maturity date, we will pay you for each $1,000 face amount of your CDs, an amount in cash equal to the sum of $1,000 plus the supplemental amount. The supplemental amount at maturity will be based on the performance of the GS Momentum Builder® Multi-Asset 5 ER Index, as measured from the trade date to and including the determination date (to be set on the trade date, and is expected to be March 25, 2021, subject to adjustment).
To determine your payment at maturity, we will first calculate the percentage increase or decrease in the final index level (which will be the closing level of the index on the determination date) from the initial index level (set on the trade date), which we refer to as the index return. The index return may reflect a positive return (based on any increase in the index level over the life of the CDs) or a negative return (based on any decrease in the index level over the life of the CDs). The supplemental amount will equal:
• if the index return is positive (the final index level is greater than the initial index level), the product of (i) $1,000 times (ii) the upside participation rate of 200.00% times (iii) the index return; or
• if the index return is zero or negative (the final index level is equal to or less than the initial index level), $0.
As noted above, the supplemental amount will be calculated only on the determination date. Unlike conventional CDs, which may compound interest when they bear a simple interest rate, there is no compounding of any kind during the term of the CDs.
What Does the Index Measure and Who Publishes It?
The GS Momentum Builder® Multi-Asset 5 ER Index (the index) measures the extent to which the performance of the exchange-traded funds and a money market position (together with the ETFs, the underlying assets) included in the index outperform the sum of the notional interest rate, which is a rate equal to 3-month USD LIBOR, plus the daily index maintenance fee of 0.50% per annum. The money market position reflects the notional returns accruing to a hypothetical investor from an investment in a notional overnight money account denominated in U.S. dollars that accrues interest at the overnight interest rate, which is a rate equal to the federal funds effective rate. The index rebalances monthly (and sometimes daily) from among 15 underlying assets that have been categorized in the following asset classes: equities; fixed income; emerging markets; alternatives; commodities; inflation; and cash equivalent. The index attempts to track the positive price momentum in the underlying assets, subject to limitations on volatility and a maximum weight for each underlying asset and each asset class, each as described below.
Each month the index is rebalanced by first calculating the portfolio of underlying assets that would have provided the highest historical return during a return look-back period comprised of the prior six months, subject to a limit of 5% on the degree of variation in the daily closing prices or closing level, as applicable, of the aggregate of such underlying assets (a measure known as “realized volatility”) over three different realized volatility look-back periods (the prior six months, three months and one month) and subject to a maximum weight for each underlying asset and each asset class. This results in three potential portfolios of underlying assets (one for each realized volatility look-back period). The weight of each underlying asset for a monthly base index rebalancing will equal the average of the weights of such underlying asset in these three potential portfolios. While the weight of each underlying asset for each monthly base index rebalancing will be determined on a single day (the base index observation day), the monthly rebalancing based on such revised weights will be implemented over a base index rebalancing period comprised of five base index rebalancing days, which are the first five index business days of each calendar month beginning on, and including, the base index observation day, subject to adjustment. As a result of monthly rebalancing, the index may include as few as four eligible underlying assets (as few as three eligible ETFs) and may not include some of the underlying assets or asset classes during the entire term of the CDs.
In addition, if on any daily total return index rebalancing day, which is any index business day, the realized volatility of the index underlying assets exceeds the volatility cap of 6% for the applicable volatility cap period (the prior one month), the index will be rebalanced in order to reduce such realized volatility by ratably reallocating a portion of the exposure to the index ETFs to the money market position. Historically, a significant portion of the index exposure has been to the money market position, the return of which has been below 3-month USD LIBOR.
The index reflects the return of the index underlying assets less the sum of the notional interest rate plus the daily index maintenance fee. Any cash dividend paid on an index ETF is deemed to be reinvested in such index ETF and subject to subsequent changes in the value of the index ETF. In addition, any interest accrued on the money market position is similarly deemed to be reinvested on a daily basis in such money market position and subject to subsequent changes in the federal funds effective rate. For further information regarding how the index value is calculated see “The Index — How is the index value calculated on any day?” below.

S-13
An index committee (as defined in “The Index – Who calculates and oversees the index?” below) is responsible for overseeing the index and its methodology, while the index calculation agent calculates the value of the index and implements the methodology determined by the index committee. The index committee may exercise discretion in the case of any changes to the eligible ETFs, delayed rebalancing and index market disruption event or any potential adjustment event that occurs in relation to one or more eligible ETFs (as defined in “The Index – Could index market disruption events or corporate events impact the calculation of the index or the implementation of monthly base index rebalancing or a daily total return index rebalancing by the index calculation agent?” below) that occurs in relation to one or more eligible ETFs.
The index is determined, comprised and calculated by the index calculation agent without regard to the offered CDs. For further information, please see “The Index” on page S-51.
For the purpose of this disclosure statement supplement:
• an “eligible underlying asset” is one of the ETFs or the money market position that is eligible for inclusion in the index on a base index observation day;
• an “eligible ETF” is one of the ETFs that is eligible for inclusion in the index on a base index observation day (when we refer to an “ETF” we mean an exchange traded fund, which for purposes of this disclosure statement supplement includes the following exchange traded products: SPDR® S&P 500® ETF Trust, PowerShares® DB Commodity Index Tracking Fund and SPDR® Gold Trust);
• an “index underlying asset” is an eligible underlying asset with a non-zero weighting on any index business day;
• an “index ETF” is an ETF that is an eligible ETF with a non-zero weighting on any index business day; and
• an “index business day” is a day on which both (i) commercial banks and currency exchange markets settle payments and are open for general business in New York and (ii) the New York Stock Exchange is open for its regular trading session on such day.
Are the CDs Insured by the Federal Deposit Insurance Corporation (“FDIC”) and How Will the CDs Rank Against Other Obligations of Goldman Sachs Bank USA?
The CDs evidence deposit liabilities of Goldman Sachs Bank USA, which are covered by FDIC insurance, up to the maximum limits set by the Federal Deposit Insurance Act and the corresponding regulations and interpretations of the FDIC. In general, deposits are subject to a maximum FDIC insurance limit of $250,000 per depositor, or $250,000 per participant in the case of certain retirement accounts. These maximum limits are the total federal deposit insurance protection available for funds in your CDs, together with any other deposit accounts you may hold at Goldman Sachs Bank USA in the same right and capacity. In addition, the availability of FDIC insurance to an owner of a beneficial interest in a CD represented by a master certificate may be dependent upon, among other things, whether such interest and any intermediary interests are accurately and adequately disclosed on the records of the depositary, participants of the depositary and persons that hold interests through participants. The records of Goldman Sachs Bank USA will reflect that certain intermediaries hold the CDs. These intermediaries may hold the CDs for the benefit of their customers or for other intermediaries who in turn hold those interests for the benefit of others. Each intermediary in the chain of ownership must properly reflect the capacity in which funds are held and the identity of its customers in order for the FDIC to determine that federal deposit insurance is available to the ultimate depositor on a pass-through basis. In addition, the FDIC has taken the position that the supplemental amount is not insured by the FDIC until it is finally determined and accrued on the determination date. Also, FDIC insurance may not cover the CDs if a regulatory or statutory change renders the CDs ineligible for FDIC insurance coverage. Further, if Goldman Sachs Bank USA’s status as an insured depository institution is terminated or suspended by the FDIC (including as a result of our actions) or is terminated by us, during the period of temporary insurance following the termination or suspension the FDIC insurance may not cover any amounts in excess of the face amount of the CDs. In addition, the FDIC has taken the position that any secondary market premium paid by you above the face amount of the CDs is not insured by the FDIC. In the event of a liquidation or other resolution of Goldman Sachs Bank USA, the claims of holders of the CDs, although subordinated in rights to the claims of a receiver of Goldman Sachs Bank USA for administrative expenses, are entitled to priority over the claims of general unsecured non-depositor creditors of Goldman Sachs Bank USA. In addition, the CDs will rank pari passu with all other deposit liabilities of Goldman Sachs Bank USA, except deposits which are required by law to be secured and subject to any statutory preference. Any amounts owed on the CDs in excess of, or not otherwise eligible for, FDIC insurance will be subject to the creditworthiness of Goldman Sachs Bank USA.
However, the ultimate determination of the insurability and priority of the CDs would be made by the FDIC in response to claims of depositors. For more information, see “Status of Certificates of Deposit” on page 5 of the accompanying disclosure statement and “Additional Risk Factors Specific to Your Certificates of Deposit” on page S-19.

S-14
Which Key Terms Have Not Yet Been Set?
We have not yet set some key terms, and we will not set those terms until the trade date. These include:
• the initial index level;
• the settlement date;
• the determination date; and
• the stated maturity date.
Each of these terms could significantly affect the amount you will receive on the stated maturity date.
Who Should or Should Not Consider an Investment in the CDs?
The CDs are intended for investors who seek exposure to the potential increases in the GS Momentum Builder® Multi-Asset 5 ER Index. In order to evaluate whether to invest in the CDs, you should carefully consider and understand the features of the CDs and how they would perform in various situations. The CDs have a different payout structure from, and do not compound interest as is common in more traditional certificates of deposit. At maturity investors will receive a supplemental amount, which will be based on the index return, which is the percentage increase or decrease in the final index level (which will be the closing level of the index on the determination date) from the initial index level (set on the trade date). If the index return is zero or negative, the supplemental amount will equal $0 for each $1,000 face amount of your CDs.
The overall return on your investment in the CDs may be less than you would have earned by investing in a non-indexed bank deposit or debt security that bears interest at a prevailing market rate. Therefore, the CDs may not be a suitable investment for you if you prefer the lower risk of fixed income investments with comparable maturities issued by financial institutions with comparable credit that pay interest payments at prevailing market rates.
In addition, the CDs are designed for investors who are willing to hold them to maturity and should not be purchased if you plan to sell them in the secondary market.
By your purchase of a CD, you are deemed to represent to us and any dealer through which you purchase the CD that your deposits with Goldman Sachs Bank USA, including the CDs, when aggregated in accordance with Federal Deposit Insurance Corporation regulations, are within the $250,000 FDIC insurance limit for each insurable capacity.
What Will I Receive If I Sell the CDs Prior to the Stated Maturity Date?
If you sell your CDs prior to the stated maturity date, you will receive the market price for your CDs. The market price for your CDs may be influenced by many factors, such as the level of the index, the volatility of the index, the time remaining until maturity and dealer discount. For more information on the estimated value of your CDs, see “Additional Risk Factors Specific to Your Certificates of Deposit — The Estimated Value of Your CDs At the Time the Terms of Your CDs Are Set On the Trade Date (as Determined By Reference to Pricing Models Used By Goldman, Sachs & Co.) Will Be Less Than the Original Issue Price Of Your CDs” on page S-19 of this disclosure statement supplement. You may also be charged a commission in connection with a secondary market transaction. Depending on the impact of these factors, you may receive significantly less than the face amount of your CDs in any sale of your CDs before the stated maturity date. As a result, you should not purchase the CDs unless you plan to hold them to maturity.
What About Taxes?
Some of the U.S. federal income tax consequences of an investment in your CDs are summarized below, but we urge you to read the more detailed discussion in “Supplemental Discussion of United States Federal Income Tax Consequences” on page S-155. The CDs will be treated as debt instruments subject to special rules governing contingent payment debt instruments for U.S. federal income tax purposes. If you are a U.S. individual or a taxable entity, you generally will be required to pay taxes on ordinary income from the CDs over their term based on the comparable yield for the CDs, even though you will not receive any payments from us until maturity. This comparable yield is determined solely to calculate the amount on which you will be taxed prior to maturity and is neither a prediction nor a guarantee of what the actual yield will be. In addition, any gain you may recognize on the sale, exchange or maturity of the CDs will be taxed as ordinary interest income. If you are a secondary purchaser of the CDs, the tax consequences to you may be different.
Please see “Supplemental Discussion of United States Federal Income Tax Consequences” below for a more detailed discussion. Please also consult your own tax advisor concerning the U.S. federal income tax and any other applicable tax consequences to you of owning your CDs in your particular circumstances.

S-15
Ratings
On June 21, 2012, Moody’s Investors Service downgraded Goldman Sachs Bank USA’s long-term deposit rating two notches from Aa3 to A2; outlook stable. Goldman Sachs Bank USA’s short-term bank deposit rating of P-1 was affirmed.

S-16
TRUTH IN SAVINGS DISCLOSURES
For the Initial Issuance and Sale of the Certificates of Deposit
Minimum Balance to Acquire a CD
Each CD is issued in a minimum denomination of $1,000 and integral multiples of $1,000 in excess thereof. If you acquire the CDs as part of the initial offering of CDs or directly from Goldman Sachs Bank USA, you will be required to pay 100% of the face amount of such CDs. If you acquire the CDs on the secondary market through a third party (including without limitation through Goldman, Sachs & Co.), you may be required to pay a secondary market premium in addition to 100% of the face amount of the CDs, plus any applicable service charges imposed by the third party.
Maturity Date
The CDs are scheduled to mature on March 30, 2021 (the “stated maturity date”), subject to adjustment if such day is not a business day or the determination date is postponed, as described under “Specific Terms of Your Certificates of Deposit — Payment on Stated Maturity Date — Stated Maturity Date” and “— Determination Date” on page S-42 and “Specific Terms of Your Certificates of Deposit — Special Calculation Provisions — Business Day” on page S-44.
No Renewal and No Interest
The CDs will not renew on the stated maturity date. No interest will be paid on the CDs, whether before or after the stated maturity date. Unless we redeem your CDs as described under “— Mandatory Redemption” or under “— Optional Redemption in the Event of Death or Adjudication of Incompetence” below, the amount we will pay on the stated maturity date for your CDs is an amount in cash equal to the face amount of the CDs plus the applicable supplemental amount, as described in more detail in this disclosure statement supplement. Payment will be made to the holders of the CDs in accordance with the applicable procedures of the depositary. See also “Legal Ownership and Payment” on page 38 of the accompanying disclosure statement.
Supplemental Amount
You will be entitled to receive a supplemental amount in addition to the face amount of your CDs on the stated maturity date, as described in this disclosure statement supplement.
Please see “Summary Information — Key Terms” on page S-4 for important information about how the supplemental amount payable on the stated maturity date (in addition to the face amount of the CDs) will be determined, including information about the initial index level, the upside participation rate and the determination date. Please also see “Specific Terms of Your Certificates of Deposit — Payment on Stated Maturity Date — Supplemental Amount” and “— Determination Date” on page S-42 for more information regarding the supplemental amount and the determination date.
No supplemental amount will be paid if there is a mandatory redemption or any early redemption due to death or adjudication of incompetence. See “— Mandatory Redemption” and “— Optional Redemption in the Event of Death or Adjudication of Incompetence” below.
Mandatory Redemption
If our status as an insured depository institution is terminated by the FDIC or us or as a result of our actions or if regulatory or statutory changes in the future render the CDs ineligible for FDIC insurance, to the extent permitted by applicable law and regulation, we will redeem your CDs then outstanding on the applicable mandatory redemption date as described under “Specific Terms of Your Certificates of Deposit — Mandatory Redemption” on page S-43. This commitment to redeem your CDs may not be enforceable under certain circumstances, such as if the FDIC has been appointed our receiver or conservator. The mandatory redemption amount for your CDs then outstanding on the applicable mandatory redemption date will not be less than the face amount of your CDs then outstanding. However, there will be no mandatory redemption if the mandatory redemption date occurs on or after the stated maturity date. The mandatory redemption amount for your CDs then outstanding on the applicable mandatory redemption date will be determined as described under “Specific Terms of Your Certificates of Deposit — Special Calculation Provisions— Mandatory Redemption Amount” on page S-44, but in any event will not be less than the face amount of your CDs then outstanding. In the event that regulatory or statutory changes render the CDs ineligible for FDIC insurance, the amount payable upon such mandatory redemption will be subject to the creditworthiness of Goldman Sachs Bank USA.
Optional Redemption in the Event of Death or Adjudication of Incompetence
In the event of your death or adjudication of incompetence, your authorized representative will have the option to request a redemption of your CDs before (not on or after) the stated maturity date as described under “Description of Certificates of Deposit We May Offer — Redemption — Redemption Upon Death or Adjudication of Incompetence” in the accompanying disclosure statement, which we refer to as the “estate feature”. However, the estate feature for the CDs

S-17
offered by this disclosure statement supplement is subject to important limitations that are not described in the accompanying disclosure statement.
By your purchase of a CD, you are deemed to represent to us and any dealer through which you purchase the CD that your deposits with Goldman Sachs Bank USA, including the CDs, when aggregated in accordance with Federal Deposit Insurance Corporation regulations, are within the $250,000 FDIC insurance limit for each insurable capacity. For purposes of early withdrawal pursuant to the estate feature, we will limit the combined aggregate principal amount of (i) these CDs and (ii) any other CDs of Goldman Sachs Bank USA subject to this withdrawal limit to the FDIC insurance coverage amount applicable to each insurable capacity in which such CDs are held.
A joint owner of a joint account with a beneficial owner who has died or been adjudicated incompetent will be entitled to redeem a CD only if such joint owner was a member of the same household with the deceased or incompetent beneficial owner at the time of such beneficial owner’s death or declaration of legal incompetency, or if such joint owner is related to the deceased or incompetent beneficial owner, including by blood, marriage or adoption. Any other joint accountholder shall have no right to the estate feature. A joint owner so entitled to redeem a CD shall hold all of the rights to take actions with respect to such CD that are granted to an authorized representative under the Disclosure Statement with respect to the estate feature.
In addition, as discussed in the accompanying disclosure statement, written verification acceptable to us will be required to permit early withdrawal pursuant to the estate feature and all questions regarding the eligibility or validity of any exercise of the estate feature will be determined by us in our sole discretion, which determination will be final and binding on all parties. Furthermore, we may waive any applicable limitations with respect to a deceased or incompetent beneficial owner but not make the same or similar waivers with respect to other deceased or incompetent beneficial owners.
Subject to all of the foregoing, if your authorized representative chooses to redeem your CDs, on the redemption date, your authorized representative will receive only the face amount of your CDs. No supplemental amount will be paid in connection with any such early redemption.
Depending on market conditions, the value of the CDs in the secondary market may be greater than the amount your authorized representative would receive on the date of such early redemption. Accordingly, your authorized representative should contact your broker to determine the secondary market price of the CDs, and the amount of fees or commissions that would be payable in a secondary market transaction, and should carefully consider whether to sell the CDs to your broker or another market participant rather than redeem the CDs pursuant to a request for redemption.
Transaction Limitations
You cannot change (increase or decrease) the face amount of a CD. If you want to increase the total amount of CDs you own, you must acquire new CDs. There is no assurance that we will sell any additional CDs subsequent to the date of this disclosure statement supplement.
You may not withdraw or redeem any portion of the face amount of your CDs before the stated maturity date. Unless the CDs are mandatorily redeemed by us as described under “— Mandatory Redemption” above or the CDs are redeemed by your authorized representative in the event of your death or adjudication of incompetence as described under “— Optional Redemption in the Event of Death or Adjudication of Incompetence” above, Goldman Sachs Bank USA is not required (and does not intend) to make any payment on the CDs before the stated maturity date. Except as specifically described in the preceding sentence, the CDs will not be subject to redemption at our option or repayment at your option before the stated maturity date.
Selling the CDs Before the Stated Maturity Date
If you want to receive funds before the stated maturity date for CDs that you have acquired, you may be required to sell the CDs in the secondary market, if any exists. Goldman Sachs Bank USA is not required (and does not intend) to repurchase any CD before the stated maturity date, and is not required to assist you in finding a third party willing to purchase the CDs from you before the stated maturity date. If you are able to sell your CDs before the stated maturity date, you will receive the market price at that time for the CDs. The market price for your CDs could be significantly less than the face amount of the CDs, and could be significantly less than what you paid to acquire your CDs. Furthermore, if you sell your CDs, you will likely be charged a commission for secondary market transactions, or the price will likely reflect a dealer discount.

S-18
Additional Information
Please see the other sections of this disclosure statement supplement and the accompanying disclosure statement for important additional information about the CDs.
For more information relating to these truth in savings disclosures, please contact Goldman Sachs Bank USA at 1̵800-323-5678.

S-19
ADDITIONAL RISK FACTORS SPECIFIC TO YOUR CERTIFICATES OF DEPOSIT
An investment in your CDs is subject to the risks described below, as well as the risks described under “Risk Factors” in the accompanying disclosure statement dated December 19, 2011. Your CDs are a riskier investment than many other bank deposit obligations. Also, your CDs are not equivalent to investing directly in any eligible underlying asset or the assets held by any eligible ETF or in CDs that bear interest at the notional interest rate or the federal funds effective rate. You should carefully consider whether the offered CDs are suited to your particular circumstances.
Although we have classified the risks described below into three categories (general risks, risks related to the index and risks related to the eligible underlying assets), the order in which these categories are presented is not intended to signify any decreasing (or increasing) significance of these risks. You should read all of the risks described below and in the accompanying disclosure statement.
General Risks The Estimated Value of Your CDs At the Time the Terms of Your CDs Are Set On the Trade Date (as Determined By Reference to Pricing Models Used By Goldman, Sachs & Co.) Will Be Less Than the Original Issue Price Of
Your CDs
The original issue price for your CDs will exceed the estimated value of your CDs as of the time the terms of your CDs are set on the trade date, as determined by reference to Goldman, Sachs & Co.’s pricing models and taking into account our credit spreads. Such expected estimated value on the trade date is set forth on the cover of this disclosure statement supplement; after the trade date, the estimated value as determined by reference to these models will be affected by changes in market conditions, our creditworthiness and other relevant factors. The price at which Goldman, Sachs & Co. would initially buy or sell your CDs (if Goldman, Sachs & Co. makes a market, which it is not obligated to do), and the value that Goldman, Sachs & Co. will initially use for account statements and otherwise, will also exceed the estimated value of your CDs as determined by reference to these models. As agreed with the distribution participants, the amount of the excess will decline on a straight line basis over the period from the date hereof through the applicable date set forth on the cover. Thereafter, if Goldman, Sachs & Co. buys or sells your CDs it will do so at prices that reflect the estimated value determined by reference to such pricing models at that time. The price at which Goldman, Sachs & Co. will buy or sell your CDs at any time also will reflect its then current bid and ask spread for similar sized trades of structured CDs.
In estimating the value of your CDs as of the time the terms of your CDs are set on the trade date, as disclosed on the front cover of this disclosure statement supplement, Goldman, Sachs & Co.’s pricing models consider certain variables, including principally our credit spreads, interest rates (forecasted, current and historical rates), volatility, price-sensitivity analysis and the time to maturity of the CDs. These pricing models are proprietary and rely in part on certain assumptions about future events, which may prove to be incorrect. As a result, the actual value you would receive if you sold your CDs in the secondary market, if any, to others may differ, perhaps materially, from the estimated value of your CDs determined by reference to our models due to, among other things, any differences in pricing models or assumptions used by others. See “— The Market Value of Your CDs May Be Influenced by Many Unpredictable Factors” below.
The difference between the estimated value of your CDs as of the time the terms of your CDs are set on the trade date and the original issue price is a result of certain factors, including principally the placement fee and commissions, the expenses incurred in creating, documenting and marketing the CDs, and an estimate of the difference between the amounts we pay to Goldman, Sachs & Co. and the amounts Goldman, Sachs & Co. pays to us in connection with your CDs. We pay to Goldman, Sachs & Co. amounts based on what we would pay to holders of a non-structured CD with a similar maturity. In return for such payment, Goldman, Sachs & Co. pays to us the amounts we owe under your CDs.
In addition to the factors discussed above, the value and quoted price of your CDs at any time will reflect many factors and cannot be predicted. If Goldman, Sachs & Co. makes a market in the CDs, the price quoted by Goldman, Sachs & Co. would reflect any changes in market conditions and other relevant factors, including any deterioration in our creditworthiness or perceived creditworthiness. These changes may adversely affect the value of your CDs, including the price you may receive for your CDs in any market making transaction. To the extent that Goldman, Sachs & Co. makes a market in the CDs, the quoted price will reflect the estimated value determined by reference to Goldman, Sachs & Co.’s pricing models at that time, plus or minus its then current bid and ask spread for similar sized trades of structured CDs (and subject to the declining excess amount described above).
Furthermore, if you are able to sell your CDs, you will likely be charged a commission for secondary market transactions, or the price will likely reflect a dealer discount. This commission or discount will further reduce the proceeds you would receive for your CDs in a secondary market sale. You must hold the CDs to maturity to receive the stated payout from Goldman Sachs Bank USA and sales in the secondary market, if any, may result in substantial losses.
S-20
In addition, in the event that Goldman, Sachs & Co. or any other affiliate of ours purchases your CDs in the secondary market within six days after the date of initial issuance of those CDs, downward adjustments will be made to the purchase price to be paid to you to account for early withdrawal penalties we are required to impose pursuant to Regulation D of the Federal Reserve Board. Thus, if you sell your CDs to Goldman, Sachs & Co. or any of our affiliates within six days after you purchase and pay for them, you are likely to receive a reduced price for your CDs.
There is no assurance that Goldman, Sachs & Co. or any other party will be willing to purchase your CDs at any price and, in this regard, Goldman, Sachs & Co. is not obligated to make a market in the CDs. See “— Your CDs May Not Have an Active Trading Market” below.
The CDs Differ from Conventional Bank Deposits
The CDs combine features of equity and debt. The terms of the CDs differ from those of conventional CDs and other bank deposits in that the supplemental payment is based on the performance of the index. Therefore, the return on your investment in the CDs may be less than the amount that would be paid on a conventional CD or other bank deposit. The return at maturity of only $1,000 and the supplemental amount for each $1,000 face amount of your CDs may not compensate you for any loss in value due to inflation and other factors relating to the value of money over time. In addition, the supplemental amount will be calculated only on the determination date. Unlike conventional CDs, which may compound interest when they bear a simple interest rate, there is no effect on the principal amount of the CDs, nor is there any compounding of any kind, during the term of the CDs. Thus, you should not expect any positive index performance during the term of the CDs to have an effect on the principal amount of your CDs.
You May Receive Only the Face Amount of Your CDs at Maturity If the index return is zero or negative on the determination date, no supplemental amount will be paid on your CDs on
the stated maturity date. In such case, the return on your CDs will be limited to the face amount. Even if the amount paid on your CDs exceeds the face amount of your CDs, the overall return you earn on your CDs
may be less than you would have earned by investing in a CD that bears interest at the prevailing market rate. The Amount Payable on Your CDs Is Not Linked to the Level of the Index at Any Time Other than the
Determination Date
The determination date will be set on the trade date, and the amount payable at maturity will be based solely on the closing level of the index on the determination date (subject to adjustment as described elsewhere in this disclosure statement supplement). Therefore, if the closing level of the index dropped precipitously on the determination date, the payment amount for your CDs may be significantly less than it would have been had the payment amount been linked to the closing level of the index prior to such drop in the level of the index. Although the actual level of the index on the stated maturity date or at other times during the life of your CDs may be higher than the final index level, you will not benefit from the closing level of the index at any time other than on the determination date.
Your CDs Will Not Bear Interest You will not receive any interest payments on your CDs. As a result, even if the amount payable for each of your CDs
on the stated maturity date exceeds the face amount of your CDs, the overall return you earn on your CDs may be less than you would have earned by investing in a non-indexed debt security of comparable maturity that bears interest at a prevailing market rate.
If You Sell Your CDs in a Secondary Market Transaction, You May Experience a Loss If you sell your CDs prior to the stated maturity date, you will receive the market price for your CDs. The market price
for your CDs may be influenced by many factors, such as the volatility and general performance of the index, the time remaining until maturity, dealer discount and other factors described below. You may also be charged a commission in connection with a secondary market transaction. Depending on the impact of these factors, you may receive significantly less than the face amount of your CDs in any sale of your CDs before the stated maturity date.
The Market Value of Your CDs May Be Influenced by Many Unpredictable Factors The following factors, among others, many of which are beyond our control, may influence the market value of your
CDs:
• the level of the index, including the initial index level;
• the volatility — i.e., the frequency and magnitude of changes — in the level of the index (even though the index attempts to limit volatility with monthly and potentially daily rebalancing), the eligible underlying assets and the assets that comprise the eligible ETFs;
• the market prices of the eligible ETFs;

S-21
• 3-month USD LIBOR;
• the federal funds effective rate;
• economic, financial, legislative, regulatory and political, military or other events that affect markets generally and the assets held by the eligible ETFs, and which may affect the closing levels of the index;
• other interest rates and yield rates in the market;
• the time remaining until your CDs mature; and
• our creditworthiness, whether actual or perceived, and including actual or anticipated upgrades or downgrades in our credit ratings or changes in other credit measures.
These factors may influence the market value of your CDs if you sell your CDs before maturity, including the price you may receive for your CDs in any market making transaction. If you sell your CDs prior to maturity, you may receive less than the face amount of your CDs.
You cannot predict the future performance of the index based on its historical performance or on any hypothetical performance data. The actual performance of the index over the life of the CDs, as well as the amount payable on the stated maturity date, may bear little or no relation to the historical index performance information, hypothetical performance data or hypothetical return examples shown elsewhere in this disclosure statement supplement.
Other Investors in the CDs May Not Have the Same Interests as You
Other investors in the CDs are not required to take into account the interests of any other investor in exercising remedies or other rights in their capacity as holders or in making requests or recommendations to Goldman Sachs as to the establishment of other transaction terms. The interests of other investors may, in some circumstances, be adverse to your interests. For example, certain investors may take short positions (directly or indirectly through derivative transactions) on assets that are the same or similar to your CDs, index, the eligible underlying assets or other similar securities, which may adversely impact the market for or value of your CDs.
You Have No Shareholder Rights or Rights to Receive Any Shares or Units of Any Eligible ETF, or Any Assets Held by Any Eligible ETF or the Money Market Position
Investing in the CDs will not make you a holder of any shares or units of any eligible ETF or any asset held by any eligible ETF or the money market position. Investing in the CDs will not cause you to have any voting rights, any rights to receive dividends or other distributions or any other rights with respect to any eligible ETF, the assets held by any eligible ETF or the money market position. Your CDs will be paid in cash, and you will have no rights to receive delivery of any shares or units of any eligible ETF or the assets held by any eligible ETF.
The CD Calculation Agent Will Have the Authority to Make Determinations That Could Affect the Market Value of Your CDs, When Your CDs Mature and the Amount You Receive at Maturity
As of the date of this disclosure statement supplement, we have appointed Goldman, Sachs & Co. as the CD calculation agent. As CD calculation agent, Goldman, Sachs & Co. will make all determinations regarding the initial index level; the final index level on the determination date, which will be used to determine the amount we must pay on the stated maturity date; successor indices; the determination date; the stated maturity date; the mandatory redemption date, if applicable; business days and trading days; the mandatory redemption amount, if applicable; the supplemental amount and the amount payable on your CDs; and any other determination as applicable or specified herein. See “Specific Terms of Your Certificates of Deposit” below. The CD calculation agent also has discretion in making certain adjustments relating to a discontinuation or modification of the index. See “Specific Terms of Your Certificates of Deposit — Discontinuance or Modification of the Index” below. The exercise of this discretion by Goldman, Sachs & Co. could adversely affect the value of your CDs. We may change the CD calculation agent at any time without notice and Goldman, Sachs & Co. may resign as CD calculation agent at any time upon 60 days’ written notice to Goldman Sachs Bank USA.
Your CDs May Not Have an Active Trading Market Your CDs will not be listed or displayed on any securities exchange or included in any interdealer market quotation
system, and there may be little or no secondary market for your CDs. Even if a secondary market for your CDs develops, it may not provide significant liquidity and we expect that transaction costs in any secondary market would be high. As a result, the difference between bid and asked prices for your CDs in any secondary market could be substantial. You should not purchase our CDs unless you plan to hold them to maturity.

S-22
The CD Calculation Agent Can Postpone the Determination Date if a Non-Trading Day Occurs If the CD calculation agent determines that, on a day that would otherwise be the determination date, such date is not
a trading day for the index, the applicable determination date will be postponed until the first following trading day, subject to limitation on postponement described under “Specific Terms of Your Certificates of Deposit — Payment on Stated Maturity Date — Determination Date” on page S-42. If the determination date is postponed to the last possible day and such day is not a trading day, such day will nevertheless be the determination date.
If the determination date is postponed as a result of any of the foregoing, the stated maturity date for your CDs will also be postponed, as described under “Specific Terms of Your Certificates of Deposit — Payment on Stated Maturity Date — Stated Maturity Date” on page S-42. In such a case, you may not receive the cash payment that we are obligated to deliver on the stated maturity date until several days after the originally scheduled stated maturity date. If the closing level of the index is not available on the determination date because of a non-trading day or for any other reason (except as described under “Specific Terms of Your Certificates of Deposit — Discontinuance or Modification of the Index” on page S-42), in certain circumstances the CD calculation agent will determine the closing level of the index, based on its assessment, made in its sole discretion, of the level of the index on such day, as described under “Specific Terms of Your Certificates of Deposit — Consequences of a Non-Trading Day” on page S-42.
The Full Face Amount of Your CDs and the Supplemental Amount May Not Be Protected by FDIC Insurance
The CDs evidence deposit liabilities of Goldman Sachs Bank USA, which are covered by FDIC insurance. In general, the FDIC insures all deposits maintained by a depositor in the same ownership capacity at the same depository institution, and per participant for certain retirement accounts, up to a maximum limit of $250,000. These maximum limits are the total protection available for your CDs, together with any other deposit accounts you may hold at Goldman Sachs Bank USA in the same right and capacity. As a result, the full face amount of your CDs and any return thereon and any accrued and finally determined supplemental amount, may not be protected by FDIC insurance.
FDIC insurance coverage includes the face amount of your CDs and finally determined return on your CDs to the date of default of Goldman Sachs Bank USA. Accordingly, if the FDIC was appointed conservator or receiver of Goldman Sachs Bank USA prior to the determination date of the CDs, the FDIC has taken the position that any supplemental amount between the date of deposit and the date the FDIC was appointed receiver or conservator is not insured because such supplemental amount is not accrued and finally determined until the determination date and would not be reflected on the books of Goldman Sachs Bank USA at the time of such appointment. Thus, the amount insured by the FDIC with respect to the CDs may be substantially less than the amount that would otherwise be payable on the CDs at maturity (and could be less than the applicable FDIC insurance limits). In addition, the FDIC takes the position that any secondary market premium paid by you above the face amount of the CDs is not insured by the FDIC. Also, FDIC insurance may not cover the CDs if a regulatory or statutory change renders the CDs ineligible for FDIC insurance coverage. Further, if Goldman Sachs Bank USA’s status as an insured depository institution is terminated or suspended by the FDIC (including as a result of our actions) or is terminated by us, during the period of temporary insurance following the termination the FDIC insurance may not cover any amounts in excess of the face amount of the CDs or any accrued and finally determined return thereon. If you sell your CDs prior to maturity, FDIC insurance will not cover any resulting losses.
The FDIC may temporarily suspend the deposit insurance on deposits received by us if it has initiated involuntary FDIC insurance termination proceedings against us and certain other circumstances apply. If our FDIC insurance status were suspended, FDIC deposit insurance would continue to apply to deposits existing at the time of such suspension, but only for the benefit of the owners of deposits at the time of such suspension. Accordingly, any purchaser of a CD following such suspension would not have the benefit of FDIC deposit insurance, which would negatively affect the secondary market, if any, for the CDs.
To the Extent Payments Under the CDs Are Not Insured by the FDIC, You Can Depend Only on Our Creditworthiness for Payment on the CDs
The CDs will be our obligations only. Except to the extent FDIC insurance is available from the FDIC, no entity other than Goldman Sachs Bank USA (or its receiver or conservator, if applicable, to the extent of any available remaining assets of Goldman Sachs Bank USA) will have any obligation, contingent or otherwise, to make any payments in respect of the CDs. Accordingly, we will be dependent on our assets and earnings to generate the funds necessary to meet our obligations with respect to the CDs. If our assets and earnings are not adequate, we may be unable to make payments in respect of the CDs and you could lose that part of your deposit, if any, that is not covered by FDIC insurance.

S-23
In the event of a liquidation or other resolution of Goldman Sachs Bank USA and the FDIC makes payment on the CDs under FDIC insurance, the FDIC will be subrogated to all rights of holders of the CDs against Goldman Sachs Bank USA, to the extent of such payment.
The CDs are obligations solely of Goldman Sachs Bank USA, and are not obligations of The Goldman Sachs Group, Inc. or any other affiliate of Goldman Sachs Bank USA. In addition, the CDs are not guaranteed by The Goldman Sachs Group, Inc. or any other affiliate of Goldman Sachs Bank USA.
Status as Uninsured Deposits Could Reduce Your Recovery of Principal Deposited and/or Adversely Affect Your Return
If the FDIC were appointed as conservator or receiver of Goldman Sachs Bank USA, the amount actually paid by the FDIC in this capacity on the claims of holders of the CDs in excess of the amount insured by the FDIC and paid under FDIC insurance would depend upon, among other factors, the amount of conservatorship or receivership assets available for the payment of claims of deposit liabilities.
If appointed as conservator or receiver of Goldman Sachs Bank USA, the FDIC also would be authorized to disaffirm or repudiate any contract to which Goldman Sachs Bank USA is a party, the performance of which was determined to be burdensome, and the disaffirmance or repudiation of which was determined to promote the orderly administration of Goldman Sachs Bank USA’s affairs. It is likely that for this purpose deposit obligations, such as the CDs, would be considered “contracts” within the meaning of the foregoing and that the CDs could be repudiated by the FDIC as conservator or receiver of Goldman Sachs Bank USA. Such repudiation should result in a claim by a depositor against the conservator or receiver for the face amount of the CDs. No claim would be available, however, for any secondary market premium paid by a depositor above the face amount of a CD and no claims would likely be available for any supplemental amount that has not yet been finally determined and accrued.
The FDIC as conservator or receiver may also transfer to another insured depository institution any of the insolvent institution’s assets and liabilities, including deposit liabilities such as the CDs (or only the insured portion thereof), without the approval or consent of the beneficial owners of the CDs. The transferee depository institution would be permitted to offer beneficial owners of the CDs (or the insured portion thereof so transferred) the choice of (i) repayment of the principal amount so transferred or (ii) substitute terms which may be less favorable. If a CD is paid off prior to its stated maturity date, either by a transferee depository institution or the FDIC, its beneficial owner may not be able to reinvest the funds at the same rate of return as the rate on the original CD.
As with all deposits, if it becomes necessary for FDIC insurance payments to be made on the CDs, there is no specific time period during which the FDIC must make insurance payments available. Accordingly, in such an event, you should be prepared for the possibility of an indeterminate delay in obtaining insurance payments.
Except to the extent insured by the FDIC as described in this disclosure statement supplement and the accompanying disclosure statement, the CDs are not otherwise insured by any governmental agency or instrumentality or any other person.
You Will Not Have the Right to Withdraw the Face Amount of Your CDs Prior to the Stated Maturity Date
When you purchase the CDs, you agree with Goldman Sachs Bank USA to keep your funds on deposit for the term of the CDs. You will not have the right to withdraw any portion of the face amount of your CDs prior to the stated maturity date. Therefore, you should not rely on the possibility of early withdrawal for gaining access to your funds prior to the stated maturity date.
Your CDs Are Subject to Mandatory Redemption
In the event our status as an insured depository institution is terminated by the FDIC or us or as a result of our actions or if regulatory or statutory changes in the future render the CDs ineligible for FDIC insurance coverage, to the extent permitted by applicable law and regulation we will redeem your CDs in full, unless they mature prior to the redemption date, as described under “Specific Terms of Your Certificates of Deposit — Mandatory Redemption” on page S-43. The payment amount you receive upon such redemption due to the termination of FDIC insurance may be less than the amount you would have otherwise received on your CDs, but will not be less than the face amount. This commitment to redeem your CDs may not be enforceable under certain circumstances, such as if the FDIC has been appointed receiver or conservator of the bank.

S-24
If Your CDs Are Mandatorily Redeemed You May Not Receive the Mandatory Redemption Amount for up to Almost Two Years. In Addition, the Full Mandatory Redemption Amount May Not Be Protected by FDIC Insurance
In the event our status as an insured depository institution is terminated by the FDIC or us or as a result of our actions, or if a regulatory or statutory change renders the CDs ineligible for FDIC insurance coverage, to the extent permitted by applicable law and regulation, we will redeem your CDs in full, unless they mature prior to the redemption date, as described under “Specific Terms of Your Certificates of Deposit — Mandatory Redemption” on page S-43. As described therein, in the event our status as an insured depository institution is terminated by the FDIC or us or as a result of our actions, the mandatory redemption amount will be determined by the tenth business day after our status as an insured depository institution is terminated by the FDIC, but the mandatory redemption amount will not be paid until the last business day on which any of our outstanding deposit obligations would be insured by the FDIC, which may not occur for a period of six months to up to almost two years after the mandatory redemption amount is determined (depending on the period of temporary deposit insurance provided by the FDIC following the termination of our status as an insured depository institution). During this time period, the mandatory redemption amount will not bear interest and the CDs will not otherwise be exposed to market movements. Thus, the overall return you earn on your CDs in the event of a mandatory redemption may be less than you would have earned if our status as an insured depository institution had not been terminated.
In addition, the temporary deposit insurance that would be provided by the FDIC following termination of our status as an insured depository institution will cover only those amounts accrued with respect to your CDs on the date of such termination. As a result, the mandatory redemption amount, to the extent it exceeds the face amount, may not be covered by FDIC insurance. Therefore, you may be fully exposed to our credit risk to the extent the mandatory redemption amount exceeds the face amount of your CDs.
If Regulatory Changes Render the CDs Ineligible for FDIC Insurance Coverage, Your CDs May Not Be Covered by FDIC Insurance and Will Be Subject to Mandatory Redemption
If the FDIC or another regulatory body determines that the CDs are not eligible for FDIC insurance coverage, to the extent permitted by law, we will redeem your CDs in full, unless they mature prior to the redemption date, as described, and subject to the limits set forth, under “Specific Terms of Your Certificates of Deposit — Mandatory Redemption” on page S-43. Until the date of such redemption, which will occur ten business days after the effective date of any such regulation, ruling or interpretation that renders the CDs ineligible for FDIC insurance, you will be fully exposed to our credit risk and you would not be entitled to FDIC insurance if Goldman Sachs Bank USA becomes insolvent and the FDIC is appointed its conservator or receiver.
Certain Considerations for Insurance Companies and Employee Benefit Plans
Any insurance company or fiduciary of a pension plan or other employee benefit plan that is subject to the prohibited transaction rules of the Employee Retirement Income Security Act of 1974, as amended, which we call “ERISA”, or the Internal Revenue Code of 1986, as amended, including an IRA or a Keogh plan (or a governmental plan to which similar prohibitions apply), and that is considering purchasing the CDs with the assets of the insurance company or the assets of such a plan, should consult with its counsel regarding whether the purchase or holding of the CDs could become a “prohibited transaction” under ERISA, the Internal Revenue Code or any substantially similar prohibition in light of the representations a purchaser or holder in any of the above categories is deemed to make by purchasing and holding the CDs. This is discussed in more detail under “Employee Retirement Income Security Act” on page 55 of the accompanying disclosure statement.
Your CDs Will Be Treated as Debt Instruments Subject to Special Rules Governing Contingent Payment Debt Instruments for U.S. Federal Income Tax Purposes
Your CDs will be treated as debt instruments subject to special rules governing contingent payment debt instruments for U.S. federal income tax purposes. If you are a U.S. individual or taxable entity, you generally will be required to pay taxes on ordinary income from the CDs over their term based on the comparable yield for the CDs, even though you will not receive any payments from us until maturity. In addition, any gain you may recognize on the sale, exchange or maturity of the CDs will be taxed as ordinary interest income. If you are a secondary purchaser of the CDs, the tax consequences to you may be different. Please see “Supplemental Discussion of United States Federal Income Tax Consequences” below for a more detailed discussion. Please also consult your own tax advisor concerning the U.S. federal income tax and any other applicable tax consequences to you of owning your CDs in your particular circumstances.

S-25
Risks Related to the Index The Index Measures the Performance of the Index Underlying Assets Less the Sum of the Notional Interest Rate
Plus the Daily Index Maintenance Fee Your CDs are linked to the index which measures the performance of the underlying assets included in the index plus,
with respect to ETFs included in the index, dividends paid on such ETFs, less the sum of the notional interest rate plus the daily index maintenance fee. Increases in the level of the notional interest rate may offset in whole or in part increases in the levels of the index underlying assets. As a result, any return on the index — and thus on your CDs — may be reduced or eliminated, which will have the effect of reducing the amount payable in respect of your CDs. The index underlying assets must produce positive returns at least as great as the sum of the notional interest rate plus the daily index maintenance fee before the index will have a positive return. Historically, a significant portion of the index exposure has been to the money market position, the return of which has been below the notional interest rate.
Your Investment in the CDs May Be Subject to Concentration Risks The assets underlying an eligible underlying asset may represent a particular market or commodity sector, a particular
geographic region or some other sector or asset class. As a result, your investment in the CDs may be concentrated in a single sector or asset class even though there are maximum weights for each underlying asset and each asset class. This concentration could occur because of concentration in the investment goals of one or more eligible ETFs. Other than in connection with a monthly base index rebalancing, the exposure of the index at any time could be limited to the money market position. In connection with a monthly base index rebalancing, the index may include exposure to as few as three eligible ETFs. Although your investment in the CDs will not result in the ownership or other direct interest in the assets held by the eligible ETFs, the return on your investment in the CDs will be subject to certain risks similar to those associated with direct investments in the market or commodity sector, geographic region, other sector or class represented by the relevant assets.
In addition, in connection with a monthly base index rebalancing, the index may rebalance to include only index underlying assets that represent a limited number of markets or commodity sectors, geographic regions, other sectors or asset classes. If this were to occur, you will be subject to risks similar to those associated with direct investments in these markets or commodity sectors, geographic regions, other sectors or asset classes. These markets, geographic regions, sectors or asset classes may not be diversified.
You May Not Have Exposure to One or More of the Eligible Underlying Assets during the Term of the CDs In any given month, the index is expected to have exposure to only a limited subset of the 15 eligible underlying
assets (which, including the money market position, initially could be as few as four eligible underlying assets (i.e., as few as three eligible ETFs)) and you may not have any exposure to some of the 15 eligible underlying assets or asset classes during the entire term of the CDs. As a result, you should not expect the index to provide a balanced exposure to all of the eligible underlying assets. Further, if, on any index business day, the realized volatility of the index underlying assets exceeds the volatility cap of 6% for the applicable volatility cap period, the index will ratably rebalance a portion of the exposure to the index ETFs into the money market position to reduce such realized volatility level. This may limit your exposure to the index ETFs during the term of the CDs. While the Weight of Each Index Underlying Asset for Each Monthly Rebalancing Will Be Determined on a Single Day (the Index Observation Day), the Rebalancing Based on Such Revised Weights Will Be Implemented Over a
Base Index Rebalancing Period For purposes of each monthly base index rebalancing, the weight of each index underlying asset will be determined
on a related base index observation day. While the weight of each index underlying asset for each monthly base index rebalancing will be determined on a single day (i.e., such base index observation day), the rebalancing based on such revised weights will be implemented over a base index rebalancing period comprised of five base index rebalancing days, which are the first five index business days of each calendar month beginning on, and including, the base index observation day, subject to adjustment. As a result, for the first four days of the base index rebalancing period, the composition of the index will contain a mix of underlying assets that is different than the portfolio of underlying assets selected on the related base index observation day. Therefore, the levels of the index on such days may be lower than such levels would have been if the monthly base index rebalancing had been implemented in full in one day, which could have an adverse impact on any payments on, and the value of, your CDs and the trading market for your CDs. For a discussion of how the index is rebalanced, see “The Index — How frequently is the index rebalanced?”.

S-26
The Weight of Each Index Underlying Asset Reflects the Average of the Weights of Such Index Underlying Asset Over Three Realized Volatility Look-Back Periods
To calculate the weight of each index underlying asset in a monthly base index rebalancing, three potential portfolios are first generated on the base index observation day. Each portfolio is calculated to reflect the highest historical return during a return look-back period comprised of the prior six months subject to a limitation on realized volatility over three different realized volatility look-back periods (the prior six months, three months and one month) and subject to a maximum weight for each underlying asset and each asset class. Theoretically, all three potential portfolios could be the same, although this is unlikely. The weight of each index underlying asset for each monthly base index rebalancing is the average of the weights of such underlying asset in these three potential portfolios. As a result, the weight of each index underlying asset will be different than it would have been had the index underlying assets been determined based on a single realized volatility look-back period. Further, because the weight of each index underlying asset is the average of the weights of such underlying asset across three realized volatility look-back period, the impact of a low realized volatility for an index underlying asset for one realized volatility look-back period may be lessened by a higher realized volatility for that index underlying asset for one or both of the other realized volatility look-back periods. For a discussion of how the look-back periods are determined, see “The Index — What is realized volatility and how are the weights of the underlying assets influenced by it?”.
The Index May Not Successfully Capture Price Momentum and May Not Achieve its Target Volatility The index attempts to track the positive price momentum in the eligible underlying assets. As such, each month the
index is rebalanced by calculating the portfolio of underlying assets that would have provided the highest historical return during a return look-back period comprised of the prior six months subject to the limitations on volatility and the maximum weights for each underlying asset and each asset class. However, there is no guarantee that trends existing in the preceding six months or during the realized volatility look-back periods over which volatility is evaluated will continue in the future. The trend of an eligible underlying asset may change at the end of any measurement period and such change may not be reflected in the return of the eligible underlying asset calculated over the return look-back period.
In addition, the volatility controls and maximum weightings may limit the index’s ability to track price momentum. The index is different from an investment that seeks long-term exposure to a constant set of underlying assets. The index may fail to realize gains that could occur as a result of holding assets that have experienced price declines, but after which experience a sudden price spike. As a result, if market conditions do not represent a continuation of prior observed trends, the level of the index, which is rebalanced based on prior trends, may decline. No assurance can be given that the investment methodology used to construct the index will outperform any alternative index that might be constructed from the eligible underlying assets.
No assurance can be given that the investment methodology on which the index is based will be successful or that the index will outperform any alternative methodology that might be employed in respect of the eligible underlying assets. Furthermore, no assurance can be given that the index will achieve its target volatility of 5%. The actual realized volatility of the index may be greater or less than 5%. Asset Class Maximum Weights Will in Many Cases Prevent All of the Eligible Underlying Assets in an Asset Class
From Being Included in the Index at Their Underlying Asset Maximum Weights and May Also Prevent the Index From Having Exposure to Certain Types of Assets At Any Given Time
The asset class maximum weights will in many cases prevent all of the eligible underlying assets in an asset class
from being included in the index at their underlying asset maximum weights. This is due to the fact that, in many cases, the asset class maximum weight is less than the sum of the underlying asset maximum weights in that asset class.
In addition, the three underlying assets that are categorized in the alternatives asset class are not expected to be highly correlated. One underlying asset of that asset class seeks investment results that correspond generally to an index that tracks certain energy infrastructure master limited partnerships, another underlying asset seeks investment results that correspond generally to an index that tracks the real estate sector of the U.S. equity market and the other underlying asset seeks investment results that correspond generally to an index that tracks large institutional leveraged loans. However, each of these three underlying assets is subject to the same asset class maximum weight, which is less than the sum of the three underlying asset maximum weights that relate to these three underlying assets. Therefore, it is possible that the asset class maximum weight restriction for the alternatives asset class alone (as opposed to the other restrictions applicable to the index) will prevent all of these eligible ETFs from being index ETFs simultaneously, which would mean that the index might not have exposure to certain energy infrastructure master limited partnerships, the real estate sector of the U.S. equity market and large institutional leveraged loans at the same time.

S-27
Each Index Underlying Asset’s Weight Is Limited by Its Underlying Asset Maximum Weight, Its Asset Class Maximum Weight and the Monthly Volatility Constraint
Each month, the index sets the weights for the eligible underlying assets to those weights that would have provided the highest historical return during a return look-back period comprised of the prior six months, subject to investment constraints on the maximum weights of each eligible underlying asset and each asset class, and the monthly volatility constraint of 5%. These constraints could lower your return versus an investment that was not limited as to the maximum weighting allotted to any one index underlying asset or asset class or was not subject to the monthly volatility target (or the daily volatility cap of 6%).
The index’s monthly volatility target may result in a significant portion of the index’s exposure being allocated to the money market position. The volatility target represents an intended trade-off, in which some potential upside is given up in exchange for attempting to limit downside exposure in volatile markets. However, because the CDs provide for the repayment of principal at maturity, the incremental benefit to holders of the CDs from the index’s volatility target may be limited. In other words, the CDs themselves limit exposure to decreases in the level of the index by providing for payment amount that will be no less than the face amount of the CDs. Due to this feature of the CDs, the index’s volatility target, which attempts to reduce downside exposure to the eligible ETFs, may not be as beneficial as it otherwise may be (including, for example, when used with CDs that provide for a payment amount that could be less than the face amount) and the cost of the index’s volatility target, which is reflected in part in the above referenced trade-off, may not be desirable to you.
If the Level of the Index Changes, the Market Value of Your CDs May Not Change in the Same Manner Your CDs may trade quite differently from the performance of the index. Changes in the level of the index may not
result in a comparable change in the market value of your CDs. Even if the level of the index increases above the initial index level during the life of the CDs, the market value of your CDs may not increase by the same amount. We discuss some of the reasons for this disparity under “— The Market Value of Your CDs May Be Influenced by Many Unpredictable Factors” above.
Past Index Performance is No Guide to Future Performance The actual performance of the index over the life of the CDs, as well as the amount payable at maturity, may bear little
relation to the historical index performance information, hypothetical performance data or hypothetical return examples set forth elsewhere in this disclosure statement supplement. We cannot predict the future performance of the index.
The Lower Performance of One Index Underlying Asset May Offset an Increase in the Other Index Underlying Assets
Your CDs are linked to the index which rebalances monthly among 15 eligible underlying assets. Declines in the level of one index underlying asset may offset increases in the levels of the other index underlying assets. As a result, any return on the index— and thus on your CDs — may be reduced or eliminated, which will have the effect of reducing the amount payable in respect of your CDs at maturity.
Because Historical Returns and Realized Volatility Are Measured on an Aggregate Basis, Index Underlying Assets Could Include Eligible Underlying Assets With a High Realized Volatility and Could Exclude Eligible
Underlying Assets With a High Historical Return Because historical return and realized volatility are measured on an aggregate basis within each potential portfolio,
index underlying assets could include eligible underlying assets with a high realized volatility and could exclude eligible underlying assets with a high historical return. An eligible underlying asset with a relatively high realized volatility may be included as an index underlying asset because its realized volatility is offset by another eligible underlying asset that is also included as an index underlying asset.
In addition, highly correlated eligible underlying assets may be excluded from a potential portfolio, in whole or in part, on a base index observation day, even if, on an independent basis, such eligible underlying assets have a relatively high six-month historical return or relatively low realized volatility for the applicable look-back period.
Correlation of Performances Among the Index Underlying Assets May Reduce the Performance of the Index Performances of the index underlying assets may become highly correlated from time to time during the term of the
CDs, including, but not limited to, periods in which there is a substantial decline in a particular sector or asset type containing such correlated index underlying assets. High correlation among index underlying assets representing any one sector or asset type which has a substantial percentage weighting in the index during periods of negative returns could have an adverse effect on the level of the index.

S-28
The Policies of the Index Sponsor and Index Calculation Agent, and Changes That Affect the Index or the Eligible ETFs, Could Affect the Amount Payable on Your CDs and Their Market Value
The policies of the index sponsor concerning the calculation of the level of the index, additions, deletions or substitutions of eligible underlying assets and the manner in which changes affecting the eligible underlying assets or, where applicable, their sponsors, such as stock dividends, reorganizations or mergers, are reflected in the level of the index could affect the level of the index and, therefore, the payment amount on your CDs at maturity and the market value of your CDs prior to maturity.
As further described under “The Index” in this disclosure statement supplement, a comparable ETF may be selected by the index committee, if available, to replace an index ETF and/or eligible ETF. The replacement of any index ETF may have an adverse impact on the value of the index. The amount payable on your CDs and their market value could also be affected if the index sponsor or index calculation agent changes these policies, for example, by changing the manner in which it calculates the level of the index or if the index sponsor discontinues or suspends calculation or publication of the level of the index, in which case it may become difficult to determine the market value of your CDs.
If events such as these occur on the determination date, the CD calculation agent — which initially will be Goldman, Sachs & Co., our affiliate — may determine the closing level of the index on the determination date — and thus the amount payable on the stated maturity date — in a manner it considers appropriate, in its sole discretion. We describe the discretion that the CD calculation agent will have in determining the closing level of the index on the determination date and the amount payable on your CDs more fully under “Specific Terms of Your Certificates of Deposit — Discontinuance or Modification of the Index” and “Specific Terms of Your Certificates of Deposit— Role of CD calculation agent” below.
As Index Sponsor, Goldman Sachs & Co. Can Replace the Index Calculation Agent at Any Time The index sponsor has retained Solactive AG to serve as index calculation agent. The index calculation agent
calculates the value of the index and implements the methodology determined by the index committee. The index sponsor can replace the index calculation agent at any time. In the event the index sponsor appoints a replacement index calculation agent, a public announcement will be made via press release. Any replacement of the index calculation agent may result in reporting delays and other disruptions.
The Index Calculation Agent Can Resign Upon Notification to the Index Sponsor As index calculation agent, Solactive AG can resign upon 60 days’ written notice to the index sponsor. In the event
the index sponsor appoints a replacement index calculation agent, a public announcement will be made via press release. Any resignation by the index calculation agent may result in reporting delays and other disruptions. The Index Weightings May Be Ratably Rebalanced into the Money Market Position on Any or All Days During the
Term of the CDs The index has a daily volatility control feature which can result in a rebalancing between the index ETFs and the
money market position. This has the effect of reducing the exposure of the index to the performance of the index ETFs by rebalancing a portion of the exposure into the money market position if the historical realized volatility of the index underlying assets for the applicable one-month volatility cap period (observed and calculated by the index calculation agent on each daily total return index rebalancing day) would otherwise exceed the volatility cap of 6%.
During a monthly base index rebalancing, there is no guarantee that the index will not be rebalanced so that the money market position represents 50% of the index (i.e., the maximum weight for both the cash equivalent asset class and the money market position). Further, there is no guarantee that on any daily total return index rebalancing day (each index business day) the index will not be rebalanced so that the money market position represents 100% of the index due to the daily volatility control feature. This is because the maximum weight for the cash equivalent asset class and the money market position do not apply to daily rebalancing. Any rebalancing into the money market position will limit your return on the CDs.
In addition, there is no guarantee that the volatility cap will successfully reduce the volatility of the index or avoid any volatile movements of any index underlying asset. If there is a rapid and severe decline in the market price of the index underlying assets, the index may not rebalance into the money market position until the index has declined by a substantial amount.
The Index May Perform Poorly during Periods Characterized by Increased Short-Term Volatility The index’s methodology is based on momentum investing. Momentum investing strategies are effective at identifying
the current market direction in trending markets. However, in non-trending markets, momentum investment strategies are subject to “whipsaws.” A whipsaw occurs when the market reverses and does the opposite of what is indicated by the trend indicator, resulting in a trading loss during the particular period. Consequently, the index may perform poorly in non-trending, “choppy” markets characterized by increased short-term volatility.

S-29
Index Market Disruption Events Could Affect the Level of the Index on Any Date and/or Delay a Monthly Base Index Rebalancing Day or Daily Total Return Index Rebalancing Day
If a monthly base index rebalancing day or a daily total return index rebalancing day must be effected on an index business day on which an index market disruption event occurs or is continuing, the index committee, in its sole discretion, will postpone such monthly base index rebalancing day or such daily total return index rebalancing day, as applicable, to the next index business day on which no index market disruption event occurs or is continuing. The term “index market disruption event” is defined in, and the resulting postponements are described in, “The Index — Could index market disruption events or corporate events impact the calculation of the index or the implementation of a monthly base index rebalancing or a daily total return index rebalancing by the index calculation agent?” herein. Any delay in rebalancing may have an adverse impact on the level of the index.
The Index Has a Limited Operating History The CDs are linked to the performance of the index, which was launched on December 17, 2013. Because the index
has no index level history prior to that date, limited historical index level information will be available for you to consider in making an independent investigation of the index performance, which may make it difficult for you to make an informed decision with respect to the CDs.
The hypothetical performance data prior to the launch of the index on December 17, 2013 refers to simulated performance data created by applying the index's calculation methodology to historical prices or rates of the underlying assets that comprise the index (including proxies when applicable). Such simulated hypothetical performance data has been produced by the retroactive application of a back-tested methodology. No future performance of the index can be predicted based on the simulated hypothetical performance data or the historical index performance information described herein.
Increased Regulatory Oversight and Changes in the Method Pursuant to Which the LIBOR Rates Are Determined May Adversely Affect the Value of Your CDs
Beginning in 2008, concerns were raised that some of the member banks surveyed by the British Bankers’ Association (BBA) in connection with the calculation of LIBOR across a range of maturities and currencies may have been under-reporting or otherwise manipulating the inter-bank lending rate applicable to them. A number of BBA member banks have entered into settlements with their regulators and law enforcement agencies with respect to alleged manipulation of LIBOR, and investigations were instigated by regulators and governmental authorities in various jurisdictions (including in the United States, United Kingdom, European Union, Japan and Canada). If manipulation of LIBOR or another inter-bank lending rate occurred, it may have resulted in that rate being artificially lower (or higher) than it otherwise would have been.
In September 2012, the U.K. government published the results of its review of LIBOR (commonly referred to as the “Wheatley Review”). The Wheatley Review made a number of recommendations for changes with respect to LIBOR including the introduction of statutory regulation of LIBOR, the transfer of responsibility for LIBOR from the BBA to an independent administrator, changes to the method of compilation of lending rates and new regulatory oversight and enforcement mechanisms for rate-setting. Based on the Wheatley Review, final rules for the regulation and supervision of LIBOR by the Financial Conduct Authority (FCA) were published and came into effect on April 2, 2013 (the “FCA Rules”). In particular, the FCA Rules include requirements that (1) an independent LIBOR administrator monitor and survey LIBOR submissions to identify breaches of practice standards and/or potentially manipulative behavior, and (2) firms submitting data to LIBOR establish and maintain a clear conflicts of interest policy and appropriate systems and controls. In addition, in response to the Wheatley Review recommendations, ICE Benchmark Administration Limited (ICE Administration) has been appointed as the independent LIBOR administrator, effective February 1, 2014.
It is not possible to predict the effect of the FCA Rules, any changes in the methods pursuant to which the LIBOR rates are determined and any other reforms to LIBOR that will be enacted in the U.K. and elsewhere, which may adversely affect the trading market for LIBOR-based securities. In addition, any changes announced by the FCA, the ICE Administration or any other successor governance or oversight body, or future changes adopted by such body, in the method pursuant to which the LIBOR rates are determined may result in a sudden or prolonged increase or decrease in the reported LIBOR rates. If that were to occur and to the extent that the value of your securities is affected by reported LIBOR rates, the level of interest payments and the value of the securities may be affected. Further, uncertainty as to the extent and manner in which the Wheatley Review recommendations will continue to be adopted and the timing of such changes may adversely affect the current trading market for LIBOR-based securities and the value of your CDs.
The Historical Levels of the Notional Interest Rate Are Not an Indication of the Future Levels of the Notional Interest Rate
In the past, the level of the notional interest rate (3-month USD LIBOR) has experienced significant fluctuations. You should note that historical levels, fluctuations and trends of the notional interest rate are not necessarily indicative of future

S-30
levels. Any historical upward or downward trend in the notional interest rate is not an indication that the notional interest rate is more or less likely to increase or decrease at any time, and you should not take the historical levels of the notional interest rate as an indication of its future performance. Risks Related to the Eligible ETFs
General risks related to the eligible ETFs
The Eligible ETFs Are Passively Managed To Track an Index and May Not Perform as Well as an Actively Managed Fund or Another Investment
The eligible ETFs are not actively managed and may be affected by a general decline in the assets tracked by their underlying indices. Each passively managed eligible ETF invests in assets included in, or representative of, the underlying index. These eligible ETFs’ investment advisors do not attempt to take defensive positions under any market conditions, including during declining markets. This means, among other things, that the investment advisor typically will not sell a particular holding just because it is performing poorly. Instead, the ETF seeks to track the index regardless of whether the index level is increasing or decreasing. As a result, shares of the passively managed eligible ETFs may not perform as well as an investment in actively managed ETFs or a basket comprised solely of actively managed ETFs or some other investment that seeks to outperform a benchmark or market.
Except to the Extent That The Goldman Sachs Group, Inc. is the Issuer of Equity or Debt Securities in an Underlying Index, There is No Affiliation Between Us and Any Issuer of Assets Held by Any Eligible ETF or Any Sponsor of Any Eligible ETF, and We Are Not Responsible for Any Disclosure by Any Issuer of Assets Held by
Any Eligible ETF or Any Eligible ETF Sponsor or Investment Advisor
The common stock of The Goldman Sachs Group, Inc., our affiliate, is one of the 500 underlier stocks comprising the S&P 500® Index and our debt securities are part of the Markit iBoxx USD Liquid Investment Grade Index. Goldman, Sachs & Co. and one or more of our other affiliates may act, from time to time, as authorized participants in the distribution of shares of eligible ETFs, and, at any time, may hold shares of eligible ETFs. We are not otherwise affiliated with the issuers of the assets held by the eligible ETFs, the underlying index sponsors or the eligible ETF sponsors or investment advisors. However, we or our affiliates may currently or from time to time in the future own securities of, or engage in business with, the eligible ETFs, their sponsors, their investment advisors, the sponsors of the underlying indexes or the issuers of assets held by the eligible ETFs. Nevertheless, neither we nor any of our affiliates has verified the accuracy or the completeness of any information about the eligible ETFs, the investment advisors or the issuers of assets held by the eligible ETFs, and we have consulted only publicly available sources of information about them. You, as an investor in the CDs, should make your own investigation into the eligible ETFs, the investment advisors and the issuers of the assets held by the eligible ETFs. See “The Eligible Underlying Assets” below for additional information about the eligible ETFs.
None of the eligible ETF sponsors, the sponsors of the underlying indexes, the eligible ETFs’ investment advisors and the issuers of assets held by the eligible ETFs are involved in the offering of your CDs in any way and none of them have any obligation of any sort with respect to your CDs. Thus, none of the eligible ETF sponsors, the sponsors of the underlying indexes, the eligible ETFs’ investment advisors and the issuers of assets held by the eligible ETFs have any obligation to take your interests into consideration for any reason, including in taking any corporate actions that might adversely affect the level of an index or making any investment decision for the eligible ETFs.
The Policies of the Eligible ETF Sponsors and/or Investment Advisor, and the Policies of Any Sponsor of an Underlying Index Tracked by an Eligible ETF, Could Affect the Level of the Index
Any eligible ETF sponsor or investment advisor may from time to time be called upon to make certain decisions or judgments with respect to the implementation of the strategy of the eligible ETF’s investment advisor concerning additions, deletions or substitutions of securities or assets held by the eligible ETF, the manner in which changes affecting the underlying index, if any, are reflected in the eligible ETF, the means of executing trading on behalf of an eligible ETF, and the best means of tracking an underlying index, if any. The eligible ETF sponsor’s or investment advisor’s decisions or judgments could affect the market price of the shares of the eligible ETF and may adversely affect the level of the index.
In addition, the sponsor of an underlying index tracked by an eligible ETF is responsible for the design and maintenance of such underlying index. The policies of the sponsor of such underlying index concerning the calculation of the underlying index, including decisions regarding the addition, deletion or substitution of the assets included in the underlying index, could affect the level of the underlying index and, consequently, could affect the market price of shares

S-31
of the eligible ETF and could adversely affect the level of the index, the amount payable on your CDs and the market value of your CDs.
There Are Risks Associated with the Eligible ETFs
Although all of the shares of the eligible ETFs are listed for trading on NYSE Arca, Inc. (NYSE Arca) and a number of similar products have been traded on the NYSE Arca or other securities exchanges for varying periods of time, there is no assurance that an active trading market will continue for the eligible ETFs or that there will be liquidity in any such trading market.
Further, each eligible ETF is subject to custody risk, which refers to the risks in the process of clearing and settling trades and the holding of securities by local banks, agents and depositories. Low trading volumes and volatile prices in less developed markets make trades harder to complete and settle, and governments or trade groups may compel local agents to hold securities in designated depositories that are not subject to independent evaluation. The less developed a country’s securities market is, the greater the likelihood of custody problems.
The Eligible ETFs May Be Subject to Pricing Dislocations and Other Market Forces, Which May Adversely Affect the Level of the Index
Even if the net asset value of an eligible ETF’s assets is increasing, the market price of its shares may not. Shares of an eligible ETF may trade in the secondary market at times when the eligible ETF does not accept orders to purchase or redeem shares. At such times, shares may trade in the secondary market with more significant premiums or discounts than might be experienced at times when the eligible ETF accepts purchase and redemption orders. In addition, shares of each eligible ETF trade at prices at, above or below the most recent net asset value of the ETF’s assets. The trading prices of an eligible ETF’s shares fluctuate continuously throughout trading hours based on market supply and demand rather than the net asset value. The trading prices of the eligible ETF’s shares may deviate significantly from the ETF’s net asset value during periods of market volatility, and disruptions due to creations and redemptions of the eligible ETF’s shares by authorized participants or the existence of extreme market volatility may result in trading prices for shares of the eligible ETF that differ significantly from its net asset value. If any of these dislocations were to occur, the level of the index, the amount payable on your CDs and the market value of your CDs may be adversely affected.
The Values of the Eligible ETFs May Not Completely Track the Level of the Indices Underlying Such Eligible ETFs
Although the trading characteristics and valuations of the shares of an eligible ETF will usually mirror to some extent the characteristics and valuations of the underlying index, the value of the shares of an eligible ETF may not completely track the level of the underlying index. One of the common reasons this occurs is that an index is a theoretical financial calculation of the performance of certain assets, but an eligible ETF holds an actual investment portfolio. The value of a share of the eligible ETF may reflect transaction costs and fees incurred or imposed by the investment advisor of the eligible ETF as well as the costs to the ETF to buy and sell its assets. These costs and fees are not included in the calculation of the underlying index. Additionally, because an eligible ETF may not actually hold all of the assets that comprise the underlying index, and may invest in securities that are not part of the underlying index, the eligible ETF may not closely track the performance of the underlying index. Some additional reasons for these tracking differences are described under “The Eligible Underlying Assets” below. As a result of these tracking differences, the index may not perform as well as an investment linked directly to the underlying indices of the eligible ETFs.
In addition, although the PowerShares® Senior Loan Portfolio tracks an index, it may invest up to 20% of its assets in other securities not included in that index. See “— Risks related to the PowerShares® Senior Loan Portfolio” below.
The Eligible ETFs May Be Subject to Global or Regional Financial Risks, Which May Adversely Affect the Level of the Index
Many of the eligible ETFs invest wholly or substantially in regionally-focused debt or equity securities. If a financial crisis occurs in a region, or if there is another global financial crisis such as the one experienced beginning in 2008, any number (if not all) of the eligible ETFs may be severely affected, which may adversely affect the level of the index.
S-32
Risks related to eligible ETFs holding foreign assets (including the iShares® MSCI EAFE ETF, the iShares® MSCI Japan ETF, the iShares® iBoxx $ High Yield Corporate Bond
ETF, the iShares® iBoxx $ Investment Grade Corporate Bond ETF, the iShares® Emerging Markets ETF, the iShares® J.P.Morgan USD Emerging Markets Bond ETF and the PowerShares® Senior Loan Portfolio)
Your CDs Will Be Subject to Foreign Currency Exchange Rate Risk
Certain eligible ETFs hold assets that are denominated or trade in non-U.S. dollar currencies. The value of the assets held by such eligible ETFs that are denominated in non-U.S. dollar currencies may be adjusted to reflect their U.S. dollar value by converting the price of such assets from the non-U.S. dollar currency to U.S. dollars. Consequently, if the value of the U.S. dollar strengthens against the non-U.S. dollar currency in which an asset is denominated or trades, the market price of the eligible ETF’s shares may not increase even if the non-dollar value of the asset held by the eligible ETF increases. This also may occur because the income received by the eligible ETF on its assets is adversely affected, in dollar terms, by the exchange rate.
Foreign currency exchange rates vary over time, and may vary considerably during the term of your CDs. Changes in a particular exchange rate result from the interaction of many factors directly or indirectly affecting economic and political conditions. Of particular importance are:
• existing and expected rates of inflation;
• existing and expected interest rate levels;
• the balance of payments among countries;
• the extent of government surpluses or deficits in the relevant foreign country and the United States; and
• other financial, economic, military and political factors.
All of these factors are, in turn, sensitive to the monetary, fiscal and trade policies pursued by the governments of the relevant foreign countries and the United States and other countries important to international trade and finance.
The market price of the CDs and level of the index could also be adversely affected by delays in, or refusals to grant, any required governmental approval for conversions of a local currency and remittances abroad or other de facto restrictions on the repatriation of U.S. dollars.
It has been reported that the U.K. Financial Conduct Authority and regulators from other countries, including the United States, are in the process of investigating the potential manipulation of published currency exchange rates. If such manipulation has occurred or is continuing, certain published exchange rates may have been, or may be in the future, artificially lower (or higher) than they would otherwise have been. Any such manipulation could have an adverse impact on any payments on, and the value of, your CDs and the trading market for your CDs. In addition, we cannot predict whether any changes or reforms affecting the determination or publication of exchange rates or the supervision of currency trading will be implemented in connection with these investigations. Any such changes or reforms could also adversely impact your CDs.
Even Though Currencies Trade Around-The-Clock, Your CDs Will Not
Certain eligible ETFs hold assets that are denominated or trade in non-U.S. dollar currencies and that are adjusted to reflect their U.S. dollar value. The interbank market in foreign currencies is a global, around-the-clock market. Therefore, the hours of trading for your CDs, if any trading market develops, will not conform to the hours during which the currencies trade. Significant price and rate movements may take place in the underlying foreign currency exchange markets that will not be reflected immediately in the price of your CDs. The possibility of these movements should be taken into account. There is no systematic reporting of last-sale information for foreign currencies. Reasonably current bid and offer information is available in certain brokers’ offices, in bank foreign currency trading offices and to others who wish to subscribe for this information, but this information will not necessarily be reflected in the level of the index. There is no regulatory requirement that those quotations be firm or revised on a timely basis. The absence of last-sale information and the limited availability of quotations to individual investors may make it difficult for many investors to obtain timely, accurate data about the state of the underlying foreign currency exchange markets.

S-33
Intervention in the Foreign Currency Exchange Markets by the Countries Issuing Any Currency In Which an Asset Held by an Eligible ETF Trades or Is Denominated Could Adversely Affect the Level of the Index
Foreign currency exchange rates can be volatile and are affected by numerous factors specific to each foreign country. Foreign currency exchange rates can be fixed by the sovereign government, allowed to float within a range of exchange rates set by the government, or left to float freely. Governments, including those issuing the currencies in which the underlying assets held by the eligible ETFs trade or are denominated, use a variety of techniques, such as intervention by their central bank or imposition of regulatory controls or taxes, to affect the exchange rates of their respective currencies. Currency developments may occur in any of the countries issuing the currencies in which the underlying assets held by the eligible ETFs trade or are denominated. Often, these currency developments impact foreign currency exchange rates in ways that cannot be predicted.
Governments may also issue a new currency to replace an existing currency, fix the exchange rate or alter the exchange rate or relative exchange characteristics by devaluation or revaluation of a currency. Thus, a special risk in purchasing the CDs is that the market price of certain of the eligible ETFs’ shares and the income it receives from its assets, and therefore the index, could be affected by the actions of sovereign governments that could change or interfere with previously freely determined currency valuations, fluctuations in response to other market forces and the movement of currencies across borders.
The CD calculation agent is not obligated to make any offsetting adjustment or change in the event of any devaluation or revaluation or imposition of exchange or other regulatory controls or taxes or in the event of other developments affecting any eligible ETF or any asset held by an eligible ETF during the life of your CDs.
Because certain eligible ETFs may convert the prices of underlying assets that trade in foreign currencies to their U.S. dollar equivalents or hold assets denominated in foreign currencies, a weakening in the exchange rate of any such foreign currency relative to the U.S. dollar may have an adverse effect on the level of the index.
Suspensions or Disruptions of Market Trading in One or More Foreign Currencies May Adversely Affect the Value of Your CDs
The foreign currency exchange markets are subject to temporary distortions or other disruptions due to various factors, including government regulation and intervention, the lack of liquidity in the markets and the participation of speculators. Because the eligible ETFs convert the prices of underlying assets that trade in foreign currencies to their U.S. dollar equivalents, circumstances could adversely affect the relevant foreign currency exchange rates and, therefore, the share price of certain of the eligible ETFs and the level of the index.
Your Investment in the CDs Will Be Subject to Risks Associated with Foreign Securities Markets
Certain eligible ETFs hold assets issued by foreign companies or entities. You should be aware that investments in foreign securities markets involve particular risks. The foreign securities markets, and in particular emerging markets, in which assets held by the eligible ETFs trade may have less liquidity and may be more volatile than U.S. or other securities markets and market developments may affect foreign markets differently from U.S. or other securities markets. Direct or indirect government intervention to stabilize these foreign securities markets, as well as cross-shareholdings in foreign companies, may affect trading prices and volumes in these markets. Also, there is generally less publicly available information about foreign companies than about those U.S. companies that are subject to the reporting requirements of the U.S. Securities and Exchange Commission (SEC), and foreign companies are subject to accounting, auditing and financial reporting standards and requirements that differ from those applicable to U.S. reporting companies.
Securities prices in foreign countries are subject to political, economic, financial and social factors that apply in those geographical regions. These factors, which could negatively affect those securities markets, include the possibility of recent or future changes in a foreign government’s economic and fiscal policies, the possible imposition of, or changes in, currency exchange laws or other laws or restrictions applicable to foreign companies or investments in foreign equity securities and the possibility of fluctuations in the rate of exchange between currencies, the possibility of outbreaks of hostility and political instability and the possibility of natural disaster or adverse public health development in the region. Moreover, foreign economies may differ favorably or unfavorably from the U.S. economy in important respects such as growth of gross national product, rate of inflation, capital reinvestment, resources and self-sufficiency.
The eligible ETFs may hold assets that trade in countries considered to be emerging markets. Countries with emerging markets may have relatively less stable governments, may present the risks of nationalization of businesses, restrictions on foreign ownership and prohibitions on the repatriation of assets, and may have less protection of property rights than more developed countries. The economies of countries with emerging markets may be based on only a few

S-34
industries, may be highly vulnerable to changes in local or global trade conditions, and may suffer from extreme and volatile debt burdens or inflation rates. Local securities markets may trade a small number of securities and may be unable to respond effectively to increases in trading volume, potentially making prompt liquidation of holdings difficult or impossible at times. It will also likely be more costly and difficult for an eligible ETF sponsor to enforce the laws or regulations of a foreign country or trading facility, and it is possible that the foreign country or trading facility may not have laws or regulations which adequately protect the rights and interests of investors in the assets included in such eligible ETFs. In particular, the iShares® J.P. Morgan USD Emerging Markets Bond ETF invests in debt instruments issued by sovereign and quasi-sovereign entities in emerging market countries. In addition, the iShares® MSCI Emerging Markets ETF invests in equity securities issued by foreign companies in countries that are considered emerging markets and the iShares® MSCI EAFE ETF and the iShares® MSCI Japan ETF invests in equity securities issued by foreign companies, many of which trade on foreign securities markets. The iShares® iBoxx $ High Yield Corporate Bond ETF, the iShares® iBoxx $ Investment Grade Corporate Bond ETF and the PowerShares® Senior Loan Portfolio also may invest in foreign company debt securities so long as they are U.S.-dollar denominated.
In addition, because foreign exchanges may be open on days when the eligible ETFs are not traded, the value of the assets underlying such eligible ETFs may change on days when the exchanges on which the eligible ETFs are listed are closed.
Risks related to eligible ETFs holding U.S. government debt securities
Your Investment is Subject to Concentration Risks
Certain of the eligible ETFs invest in U.S. Treasury bonds that are all obligations of the United States, including the iShares® 20+ Year Treasury Bond ETF and the iShares® TIPS Bond ETF. In addition, the iShares® 20+ Year Treasury Bond ETF invests in securities with a similar remaining time to maturity. As a result, these eligible ETFs are concentrated in the performance of bonds issued by a single issuer and having the same general tenor and terms. Although your investment in the CDs will not result in the ownership or other direct interest in the U.S. Treasury bonds held by any eligible ETF, the return on your investment in the CDs will be subject to certain risks similar to those associated with direct investment in a U.S. Treasury bonds. This increases the risk that any downgrade of the credit ratings of the U.S. government from its current ratings, any increase in risk that the U.S. Treasury may default on its obligations by the market (whether for credit or legislative process reasons) or any other market events that create a decrease in demand for U.S. Treasury bonds would significantly adversely affect such eligible ETFs and may adversely affect the level of the index. In addition, to the extent that any such decrease in demand is more concentrated in particular U.S. Treasury bond maturities, the eligible ETFs that are concentrated in those maturities could be severely affected, which may adversely affect the level of the index.
ETFs Holding U.S. Government Bonds May Change in Unexpected Ways
The indexes to which ETFs holding U.S. Treasury bonds tend to be linked tend to have very limited public disclosure about the underlying indexes. The index sponsors of these indexes retain discretion to make changes to the indexes at any time. The lack of detailed information about the indexes and how their constituents may change in the future creates the risk that the indexes could change in the future to perform much differently from the way they would perform if such changes were not made. If the indexes are changed in unexpected ways, the ETFs holding such bonds would similarly change to better reflect the indexes. The performance of the ETFs holding such bonds could be adversely affected in that case, which could adversely affect your investment in the CDs.
Risks related to eligible ETFs holding debt securities
Your Investment is Subject to Income Risk and Interest Rate Risk
The income of eligible ETFs that invest in debt securities, or “bonds,” may decline when interest rates fall. This decline can occur because the eligible ETF must invest in lower-yielding bonds as bonds in its portfolio fall outside the time to maturity limits required by the eligible ETF’s investment objective, bonds in the underlying index are substituted or the eligible ETF otherwise needs to purchase additional bonds. In the case of the iShares® J.P. Morgan USD Emerging Markets Bond ETF and the PowerShares® Senior Loan Portfolio, the decline also can occur because they can invest in floating rate bonds, the interest income of which will decrease as interest rates decrease. In addition, as interest rates rise, the value of the fixed rate bonds held by an eligible ETF is likely to decrease. Securities with longer durations tend to be more sensitive to interest rate changes, usually making them more volatile than securities with shorter durations. If any of these events occur, the shares of the eligible ETFs invested in bonds and the level of the index could be adversely affected.

S-35
Your Investment is Subject to Investment-Grade Credit Risk
Generally, the prices of debt securities are influenced by the creditworthiness of the issuers of those debt securities. The credit ratings of investment grade debt securities in particular may be downgraded to non-investment grade levels, which could lead to a significant decrease in the value of those debt securities and a lack of liquidity in the trading markets for those debt securities. If that occurs, the share price of the eligible ETFs holding the formerly investment-grade debt and level of the index may be adversely affected. The iShares® iBoxx $ Investment Grade Corporate Bond ETF holds mostly, if not solely, investment grade securities.
Risks related to the PowerShares® Senior Loan Portfolio
The PowerShares® Senior Loan Portfolio invests in senior loans. Investments in senior loans typically are below investment grade and are considered speculative because of the credit risk of their issuers. Such companies are more likely to default on their payments of interest and principal owed, and such defaults could reduce the PowerShares® Senior Loan Portfolio’s value and income distributions. An economic downturn generally leads to a higher non-payment rate, and a senior loan may lose significant value before a default occurs. If there is a default, the PowerShares® Senior Loan Portfolio may have to reinvest the unanticipated proceeds at lower interest rates, resulting in a decline in the PowerShares® Senior Loan Portfolio’s income. The risks associated with senior loans are similar to the risks of junk bonds, although senior loans typically are senior and secured, whereas junk bonds often are subordinated and unsecured. See “— Risks related to the iShares® iBoxx $ High Yield Corporate Bond ETF” below. Although the loans in which the PowerShares® Senior Loan Portfolio invests generally will be secured by specific collateral, there can be no assurance that such collateral would satisfy the borrower’s obligation in the event of non-payment of scheduled interest or principal or that such collateral could be readily liquidated. In the event of the bankruptcy of a borrower, the PowerShares® Senior Loan Portfolio’s access to the collateral may be limited by bankruptcy or other insolvency loans and, therefore, the PowerShares® Senior Loan Portfolio could experience delays or limitations with respect to its ability to realize the benefits of the collateral securing a loan.
In addition, the PowerShares® Senior Loan Portfolio faces significant liquidity and other risks as a result of its senior loan investments. There is no organized exchange on which loans are traded and reliable market quotations may not be readily available. Therefore, elements of judgment may play a greater role in valuation of loans than for securities with a more developed secondary market and the PowerShares® Senior Loan Portfolio may not realize full value in the event of the need to sell a loan. To the extent that a secondary market does exist for certain loans, the market may be subject to volatility, irregular trading activity, wide bid/ask spreads, decreased liquidity and extended trade settlement periods and may decline precipitously if there are credit concerns about a borrower. Some loans are subject to the risk that a court, pursuant to fraudulent conveyance or other similar laws, could subordinate the loans to presently existing or future indebtedness of the borrower or take other action detrimental to lenders, including the PowerShares® Senior Loan Portfolio, such as invalidation of loans or causing interest previously paid to be refunded to the borrower. Many loans are not registered with the SEC or any state securities commission and often are not rated by any nationally recognized rating service. Generally, there is less readily available, reliable information about most loans than is the case for many other types of securities. In addition, although a loan may be senior to equity and other debt securities in a borrower’s capital structure, such obligations may be structurally subordinated to obligations of the borrower’s subsidiaries.
Finally, although the PowerShares® Senior Loan Portfolio tracks the S&P/LSTA U.S. Leveraged Loan 100 Index, it may invest up to 20% of its assets in other securities not included in the S&P/LSTA U.S. Leveraged Loan 100 Index, in money market instruments, including repurchase agreements or other funds that invest exclusively in money market instruments (subject to applicable limitations under the Investment Company Act of 1940, as amended, or exemptions therefrom), convertible securities, structured CDs (CDs on which the amount of principal repayment and interest payments is based on the movement of one or more specified factors, such as the movement of a particular security or securities index) and in closed-end funds that invest all or a portion of their assets in senior loans and other liquid instruments such as high-yield securities (commonly referred to as “junk bonds”). The PowerShares® Senior Loan Portfolio has been in existence for less than two years. It is impossible to predict how closely over time any ETF will track its underlying index. Given the difficulties in trading loans noted above as well as the PowerShares® Senior Loan Portfolio’s ability to hold a significant portion of its assets in other securities, there is a risk that the PowerShares® Senior Loan Portfolio will not track the S&P/LSTA U.S. Leveraged Loan 100 Index as closely as other fixed income ETFs track their underlying indexes. As of March 31, 2014, Invesco PowerShares® reported that, over a one-year period, the index had increased by 3.87% while the market price of a share of the ETF had increased 3.07%.
S-36
Risks related to the iShares® TIPS Bond ETF
The iShares® TIPS Bond ETF includes inflation-protected bonds, which typically have lower yields than conventional fixed rate bonds because of their inflation adjustment feature. If inflation is low, the benefit received from the inflation-protected feature of the underlying bonds may not sufficiently compensate for this reduced yield. The performance of the iShares® TIPS Bond ETF is also affected by the Consumer Price Index (CPI). The Bureau of Labor Statistics (BLS) revises the calculation of CPI whenever there are significant changes in consumer buying habits or shifts in population distribution or demographics. The BLS monitors changing buying habits on an annual basis, and the census conducted every 10 years by the Census Bureau provides information that enables the BLS to reselect a new geographic sample that accurately reflects the current population distribution and other demographic factors. In addition, as a matter of policy, BLS continually researches improved statistical methods. Thus, even between major revisions, changes to the calculation of the CPI are made. Any of these changes may affect the performance of treasury inflation protected securities held by the iShares® TIPS Bond ETF, and therefore may adversely affect the index.
Risks related to the iShares® iBoxx $ High Yield Corporate Bond ETF
The iShares® iBoxx $ High Yield Corporate Bond ETF holds generally U.S. dollar-denominated liquid high yield corporate bonds, sometimes referred to as “junk” bonds. High yield bonds (rated below investment grade, which means a rating of BB+ or lower by S&P or Fitch and Ba1 or lower by Moody’s), compared to higher-rated securities of similar maturities, tend to have more volatile prices and increased price sensitivity to changing interest rates and to adverse economic and business developments, greater risk of loss due to default or declining credit quality, greater likelihood that adverse economic or company specific events will make the issuer of such bonds unable to make interest and/or principal payments, and greater susceptibility to negative market sentiments leading to depressed prices and decrease in liquidity. The companies that issue high yield bonds are often highly leveraged, and their ability to service their debt obligations during an economic downturn or periods of rising interest rates may be impaired. In addition, these companies may not have access to more traditional methods of financing and may be unable to repay debt at maturity by refinancing. The risk of loss due to default in payment of interest or principal by these issuers is significantly greater than with higher quality securities because medium and lower quality securities generally are unsecured and subordinated to senior debt. Default, or the market’s perception that a high yield issuer is likely to default, could reduce the value and liquidity of the issuer’s securities.
Risks related to the iShares® U.S. Real Estate ETF
The iShares® U.S. Real Estate ETF invests in shares of companies that directly or indirectly invest in real estate. The performance of the real estate industry is affected by multiple factors, including general economic and political conditions, the availability of financing for real estate, governmental actions that affect real estate, liquidity in the real estate market and interest rates. The value of shares of companies that invest in real estate and the performance of the iShares® U.S. Real Estate ETF will be negatively affected by a downturn in the real estate industry and may remain flat or decrease in periods of low growth. In addition, real estate markets tend to be local or regional, and an increase in one area may not offset a downturn in another area. Further, the iShares® U.S. Real Estate ETF invests in real estate investment trusts, the performance of which is subject to concentration and management risks similar to those to which the eligible ETFs are subject.
Risks related to eligible ETFs holding commodities or commodity futures (“commodity eligible ETFs”)
Termination or Liquidation of a Commodity Eligible ETF Could Adversely Affect the Value of the Index
The commodity eligible ETFs are Delaware statutory trusts. The trusts may be required to terminate and liquidate at a time that is disadvantageous to you. If the trusts are required to terminate and liquidate, such termination and liquidation could occur at a time when the prices of commodities contracts included (directly or indirectly) in such eligible ETFs are lower than the prices of those commodities contracts at the time when you purchased your CDs, which could have an adverse impact on the level of the index.
Your Investment is Subject to Concentration Risks
The commodity contracts for each commodity held by the commodity eligible ETFs are each concentrated in a single commodities contract. As a result, the performance of such commodity eligible ETFs will be concentrated in the performance of those specific contracts. Although your investment in the CDs will not result in the ownership or other direct interest in the commodities contracts held (directly or indirectly) by any of the eligible ETFs, the return on your investment in the CDs will be subject to certain risks similar to those associated with direct investment in those contracts.

S-37
This increases the risk that any market events that create a decrease in demand for or the trading price of the commodities contracts would significantly adversely affect the commodity eligible ETFs and could have an adverse impact on the level of the index.
Fees and Expenses Payable by the Commodity Eligible ETFs Are Charged Regardless of Profitability and May Result in a Depletion of Their Assets
The commodity eligible ETFs are subject to fees and expenses, which are payable irrespective of profitability. Interest earned on the assets posted as collateral is paid to the commodity eligible ETF and is used to pay fees and expenses. A prolonged decline in interest rates could materially affect the amount of interest paid to a commodity eligible ETF. In the case of either an extraordinary expense and/or insufficient interest income to cover ordinary expenses, a commodity eligible ETF could be forced to liquidate its positions in commodities contracts to pay such expenses.
Legal and Regulatory Changes Could Adversely Affect the Level of the Index
The Dodd-Frank Wall Street Reform and Consumer Protection Act (Dodd-Frank), which effected substantial changes to the regulation of the futures and over-the-counter (OTC) derivative markets, was enacted in July 2010. Dodd-Frank requires regulators, including the Commodity Futures Trading Commission (CFTC), to adopt regulations to implement many of the requirements of the legislation. While the CFTC has adopted many of the required regulations, a number of them have only recently become effective, and certain requirements remain to be finalized. The ultimate impact of the regulatory scheme, therefore, cannot yet be fully determined. Under Dodd-Frank, the CFTC approved a final rule to impose limits on the size of positions that can be held by market participants in futures and OTC derivatives on physical commodities. Those rules were challenged in federal court by industry groups and were vacated by a decision of the court in September 2012. While the CFTC subsequently proposed the new rule on position limits, its ultimate scope and impact, as well as the content, scope or impact of other CFTC rules, cannot be conclusively determined at present, and these limits could restrict the ability of certain market participants to participate in the commodity, future and swap markets and markets for other OTC derivatives on physical commodities to the extent and at the levels that they have in the past. These factors may also have the effect of reducing liquidity and increasing costs in these markets as well as affecting the structure of the markets in other ways. In addition, these legislative and regulatory changes have increased, and will continue to increase, the level of regulation of markets and market participants, and therefore the costs of participating in the commodities, futures and OTC derivative markets. Without limitation, these changes require many OTC derivative transactions to be executed on regulated exchanges or trading platforms and cleared through regulated clearing houses. Swap dealers (as defined by the CFTC) are also required to be registered and are or will be subject to various regulatory requirements, including, but not limited to, proposed capital and margin requirements, record keeping and reporting requirements and various business conduct requirements. These legislative and regulatory changes, and the resulting increased costs and regulatory oversight requirements, could result in market participants being required to, or deciding to, limit their trading activities, which could cause reductions in market liquidity and increases in market volatility. In addition, transaction costs incurred by market participants are likely to be higher than in the past, reflecting the costs of compliance with the new regulations. These consequences could adversely affect the level of the index, which could in turn adversely affect the return on and value of your CDs .
In addition, other regulatory bodies have proposed or may propose in the future legislation similar to that proposed by Dodd-Frank or other legislation containing other restrictions that could adversely impact the liquidity of and increase costs of participating in the commodities markets. For example, in October 2011 the European Commission published a proposal to replace the Markets in Financial Instruments Directive (2004/39/EC) with a new Markets in Financial Instruments Regulation and an amended Markets in Financial Instruments Directive (together, MiFID II). MiFID II is now being negotiated by the European Parliament and the Council of the European Union, but current drafts of MiFID II provide for the establishment of national position limits on the size of positions in commodity derivatives which a person may hold over a specified period of time. Given that the MiFID II proposals have not yet been finalized, and given that both Level 2 and national implementing measures will potentially be required for position limits to become effective, the scope of the final rules remains unclear. By way of further example, the European Market Infrastructure Regulation (Regulation (EU) No 648/2012) (“EMIR”) will require mandatory clearing of certain OTC derivative contracts, reporting of derivatives and risk mitigation techniques (including margin requirements) for uncleared OTC derivative contracts. EMIR will likely impact a number of market participants and is expected to increase the cost of transacting derivatives.
Risks related to PowerShares® DB Commodity Index Tracking Fund
The Value of the Shares of PowerShares® DB Commodity Index Tracking Fund Relates Directly to the Value of the Commodity Futures Contracts and Other Assets Held by PowerShares® DB Commodity Index Tracking Fund and

S-38
Fluctuations in the Price of These Assets Could Materially Adversely Affect an Investment in PowerShares® DB Commodity Index Tracking Fund’s Shares
PowerShares® DB Commodity Index Tracking Fund attempts to mirror, as closely as possible, before fees and expenses, the changes (positive or negative) in the level of DBIQ Optimum Yield Diversified Commodity Index Excess Return™, which is an index consisting of exchange-traded futures contracts on 14 specific commodities. The value of the shares of PowerShares® DB Commodity Index Tracking Fund relates directly to the value of PowerShares® DB Commodity Index Tracking Fund’s portfolio of futures contracts, less the liabilities (including estimated accrued but unpaid expenses) of PowerShares® DB Commodity Index Tracking Fund. The price of the commodities underlying the futures contracts may fluctuate widely.
Several factors may affect the prices of the commodities and the futures contracts, including, but not limited to:
• global supply and demand of each commodity, which may be influenced by such factors as forward selling by the various commodities producers, purchases made by the commodities producers to unwind their hedge positions and production and cost levels in the major markets for each of the 14 commodities;
• domestic and foreign interest rates and investors’ expectations concerning interest rates;
• domestic and foreign inflation rates and investors’ expectations concerning inflation rates;
• investment and trading activities of mutual funds, hedge funds and commodity funds; and
• global or regional political, economic or financial events and situations.
Fewer Representative Commodities May Result In Greater Volatility, Which Could Adversely Affect the Index
The futures contracts in DBIQ Optimum Yield Diversified Commodity Index Excess Return™ (and therefore held by PowerShares® DB Commodity Index Tracking Fund) are contracts on 14 commodities: Light Sweet Crude Oil (WTI), Heating Oil, RBOB Gasoline, Natural Gas, Brent Crude, Gold, Silver, Aluminum, Zinc, Copper Grade A, Corn, Wheat, Soybeans, and Sugar. Accordingly, the DBIQ Optimum Yield Diversified Commodity Index Excess Return™ (and therefore PowerShares® DB Commodity Index Tracking Fund) is concentrated in terms of the number of commodities represented. You should be aware that other commodities indexes are more diversified in terms of both the number and variety of commodities included. In addition, DBIQ Optimum Yield Diversified Commodity Index Excess Return™ (and therefore PowerShares® DB Commodity Index Tracking Fund) is not production weighted on a current basis, and may therefore underrepresent the current global commodities market. Concentration in fewer commodities may result in a greater degree of volatility in shares of PowerShares® DB Commodity Index Tracking Fund under specific market conditions and over time. In addition, futures contracts have a high degree of price variability and are subject to occasional rapid and substantial changes. If some or all of the futures contracts held by PowerShares® DB Commodity Index Tracking Fund experience such volatility, the value of the shares of PowerShares® DB Commodity Index Tracking Fund and therefore the index could be adversely affected.
Futures Contracts Are Not Assets with Intrinsic Value
Trading in futures transfers the risk of future price movements from one market participant to another. This means that for every gain, there is an equal and offsetting loss. Futures contracts themselves are not assets with intrinsic value, and simply reflect, in the case of cash-settled contracts, certain rights to payment or obligations to make payments to the other party to the contract, and in the case of physically-settled contracts, such as the futures contracts underlying DBIQ Optimum Yield Diversified Commodity Index Excess Return™, an agreement to make or take delivery of a particular asset at a specified price. Accordingly, market participants taking the opposite side of the relevant futures contract trades may believe that the price of the underlying commodities will move against the interests of DBIQ Optimum Yield Diversified Commodity Index Excess Return™ (and therefore PowerShares® DB Commodity Index Tracking Fund).
Trading on Commodity Exchanges Outside the United States is Not Subject to U.S. Regulation
Some of PowerShares® DB Commodity Index Tracking Fund’s trading is expected to be conducted on commodity exchanges outside the United States. Trading on such exchanges is not regulated by any United States governmental agency and may involve certain risks not applicable to trading on United States exchanges, including different or diminished investor protections. In trading contracts denominated in currencies other than U.S. dollars, shares are subject to the risk of adverse exchange-rate movements between the dollar and the functional currencies of such contracts. The shares could incur substantial losses from trading on foreign exchanges to which they would not have otherwise been

S-39
subject had PowerShares® DB Commodity Index Tracking Fund’s trading been limited to U.S. markets. Aluminum, Zinc, Copper Grade A and Brent Crude are the current commodity contracts that are traded on foreign exchanges.
“Backwardation” or “Contango” in the Market Prices of the Commodities Contracts Will Affect the Value of the PowerShares® DB Commodity Index Tracking Fund’s Shares
As the futures contracts that underlie the underlying index near expiration, they are replaced by contracts that have a later expiration. Thus, for example, a contract purchased and held in August 2014 may specify an October 2014 expiration. As that contract nears expiration, it may be replaced by selling the October 2014 contract and purchasing the contract expiring in December 2014. This process is referred to as “rolling.” Historically, the prices of Light Sweet Crude Oil and Heating Oil have frequently been higher for contracts with shorter-term expirations than for contracts with longer-term expirations, which is referred to as “backwardation.” In these circumstances, absent other factors, the sale of the October 2014 contract would take place at a price that is higher than the price at which the December 2014 contract is purchased, thereby creating a gain in connection with rolling. While Light Sweet Crude Oil and Heating Oil have historically exhibited consistent periods of backwardation, backwardation will likely not exist in these markets at all times. The absence of backwardation in Light Sweet Crude Oil and Heating Oil will adversely affect the value of the underlying index and, accordingly, decrease the value of PowerShares® DB Commodity Index Tracking Fund’s shares.
Conversely, certain of the commodities contracts underlying the underlying index historically exhibit “contango” markets rather than backwardation. Contango markets are those in which the prices of contracts are higher in the distant delivery months than in the nearer delivery months due to the costs of long-term storage of a physical commodity prior to delivery or other factors. Although certain of the commodities may have historically exhibited consistent periods of contango, contango will likely not exist in these markets at all times. Contango in certain of the commodities will adversely affect the value of the underlying index and, accordingly, decrease the value of PowerShares® DB Commodity Index Tracking Fund’s shares.
Risks related to SPDR® Gold Trust
Potential Discrepancies in the Calculation of the London PM Fix Could Have an Adverse Effect on the Value of the SPDR® Gold Trust Shares
The “London Gold Fix” is determined twice each business day (10:30 a.m. and 3:00 p.m. London time) by the member banks of The London Gold Market Fixing Ltd. using a bidding process that sets or “fixes” the price of gold by matching buy and sell orders submitted to the member banks for the applicable fixing time. The net asset value of the SPDR® Gold Trust is determined each day the trust’s principal market, the NYSE Arca, is open for regular trading, using the 3:00 p.m. London Gold Fix, which is commonly referred to as the “London PM Fix”.
Recently, increased attention has been directed to the use of various financial benchmarks and indices as price setting mechanisms for market transactions, including the London Gold Fix. For example, the press has reported that regulators in both Germany and the United Kingdom are currently reviewing the London Gold Fix as part of a wider review of how global benchmark rates are set. Separately, several lawsuits have been filed against the member banks which establish the London Gold Fix for alleged manipulative conduct in connection with their role in determining the London Gold Fix. Concerns about the integrity or reliability of the London PM Fix, even if eventually shown to be without merit, could adversely affect investor interest in gold and therefore adversely affect the price of gold and the value of an investment in the shares of the SPDR® Gold Trust. In addition, because the net asset value of the SPDR® Gold Trust is determined using the London PM Fix, discrepancies in the calculation of the London PM Fix could have an adverse impact on the value of an investment in the shares. Furthermore, any concern about the reliability of the pricing mechanism could disrupt trading in gold and products using the London PM Fix, such as the shares. Each of these factors could lead to less liquidity or greater price volatility or otherwise could have an adverse impact on the trading price of the shares and therefore the index and your CDs.
The Value of the Shares of SPDR® Gold Trust Relates Directly to the Value of the Gold Held by SPDR® Gold Trust and Fluctuations in the Price of Gold Could Materially Adversely Affect an Investment in SPDR® Gold Trust’s
Shares
The shares are designed to mirror as closely as possible the performance of the price of gold, and the value of the shares relates directly to the value of the gold held by SPDR® Gold Trust, less the trust’s liabilities (including estimated accrued expenses). The price of gold has fluctuated widely over the past several years. Several factors may affect the price of gold, including, but not limited to:

S-40
• global supply and demand of gold, which may be influenced by such factors as forward selling by gold producers, purchases made by gold producers to unwind their hedge positions, central bank purchases and sales, and production and cost levels in the major gold-producing countries such as South Africa, the United States and Australia;
• interest rates;
• investors’ expectations concerning inflation rates;
• currency exchange rates;
• investment and trading activities of hedge funds and commodity funds; and
• global or regional political, economic or financial events and situations.
If gold markets continue to be subject to sharp fluctuations, this may result in potential losses if the index allocates away from shares at a time when the price of gold is lower. In addition, gold markets have historically experienced extended periods of flat or declining prices, in addition to sharp fluctuations.
The Amount of Gold Represented by the Shares of SPDR® Gold Trust Will Continue to Be Reduced During the Life of SPDR® Gold Trust Due to SPDR® Gold Trust’s Expenses
Each outstanding share represents a fractional, undivided interest in the gold held by SPDR® Gold Trust. The SPDR® Gold Trust does not generate any income and regularly sells gold to pay for its ongoing expenses. Therefore, the amount of gold represented by each share has gradually declined over time. This is also true with respect to shares that are issued in exchange for additional deposits of gold into the SPDR® Gold Trust, as the amount of gold required to create shares proportionately reflects the amount of gold represented by the shares outstanding at the time of creation. Assuming a constant gold price, the trading price of the shares is expected to gradually decline relative to the price of gold as the amount of gold represented by the shares gradually declines.

S-41
SPECIFIC TERMS OF YOUR CERTIFICATES OF DEPOSIT
Please note that in this section entitled “Specific Terms of Your Certificates of Deposit”, references to “holders” mean those who own CDs registered in their own names, on the books that we or the paying agent may maintain for this purpose, and not those who own beneficial interests in a master certificate registered in street name through The Depository Trust Company. Please review the special considerations that apply to owners of beneficial interests in the accompanying disclosure statement, under “Legal Ownership and Payment”.
This disclosure statement supplement summarizes specific financial and other terms that apply to the offered CDs, including your CDs; terms that apply generally to all CDs are described in “Description of Certificates of Deposit We May Offer” in the accompanying disclosure statement. The terms described here supplement those described in the accompanying disclosure statement and, if the terms described here are inconsistent with those described there, the terms described here are controlling. The offered CDs are “indexed CDs” as described in the accompanying disclosure statement.
Please note that the information about the settlement date or trade date, issue price, placement fee and net proceeds to Goldman Sachs Bank USA on the front cover page or elsewhere in this disclosure statement supplement relates only to the initial issuance and sale of the CDs. If you have purchased your CDs in a market-making transaction after the initial issuance and sale of the CDs, any such relevant information about the sale to you will be provided in a separate confirmation of sale.
By your purchase of a CD, you are deemed to represent to us and any dealer through which you purchase the CD that your deposits with Goldman Sachs Bank USA, including the CDs, when aggregated in accordance with Federal Deposit Insurance Corporation regulations, are within the $250,000 FDIC insurance limit for each insurable capacity.
In addition to those terms described on the cover page and under “Summary Information” of this disclosure statement supplement, the following terms will apply to your CDs:
Denominations
Each CD registered in the name of a holder must have a face amount of $1,000 and integral multiples of $1,000 in excess thereof.
Index and Index Sponsor
In this disclosure statement supplement, when we refer to the index, we mean the index specified on the front cover page, or any successor index as it may be modified, replaced or adjusted from time to time as described under “— Discontinuance or Modification of the Index” below. When we refer to the index sponsor as of any time, we mean the entity, including any successor sponsor, that determines and publishes the index as then in effect.
Payment on Stated Maturity Date
Unless we redeem your CDs as described under “— Mandatory Redemption” or “—Optional Redemption in the Event of Death or Adjudication of Incompetence” below, on the stated maturity date we will pay you for each $1,000 face amount of your CDs an amount in cash equal to the sum of $1,000 plus the supplemental amount.
Supplemental Amount
For each $1,000 face amount of your CDs, the supplemental amount will equal:
• if the index return is positive (the final index level is greater than the initial index level), the product of (i) $1,000 times (ii) the upside participation rate times (iii) the index return; or
• if the index return is zero or negative (the final index level is equal to or less than the initial index level), $0.

S-42
The initial index level will be set on the trade date and is expected to be the closing level of the index on the trade date. The CD calculation agent will determine the final index level, which will be the closing level of the index on the determination date as calculated and published by the index sponsor (including any index calculation agent acting on the index sponsor’s behalf), subject to adjustment in certain circumstances described under “— Consequences of a Non-Trading Day” and “— Discontinuance or Modification of the Index” below.
The closing level of the index on any trading day is the official closing level of the index or any successor index published by the index sponsor (including any index calculation agent acting on the index sponsor’s behalf).
The index return is calculated by subtracting the initial index level from the final index level and dividing the result by the initial index level, with the quotient expressed as a percentage.
The upside participation rate is 200.00%.
The amount payable on your CDs on the stated maturity date will be based on the final index level. If the final index level is greater than the initial index level, i.e., the index return is positive due to an increase in the level of the index, you will receive a 2.00% increase in the supplemental amount for each 1.00% increase in the index level due to the upside participation rate. If the final index level is less than the initial index level, i.e., the index return is negative due to a decrease in the level of the index, you will receive 100% of the face amount of your CDs. As a result, if the final index level is less than the initial index level on the determination date, the payment you would receive at maturity for each of your CDs would be equal to 100% of each $1,000 face amount of a CD (or $1,000).
Stated Maturity Date
The stated maturity date is expected to be March 30, 2021, unless that day is not a business day, in which case the stated maturity date will be the next following business day. If the determination date is postponed as described under “— Determination Date” below, the stated maturity date will be postponed by the same number of business day(s) from but excluding the originally scheduled date for such determination date to and including the actual postponed determination date.
Determination Date
The determination date is expected to be March 25, 2021 unless the CD calculation agent determines that such day is not a trading day. In that event, the determination date will be the first following trading day. In no event, however, will the determination date be postponed to a date later than the originally scheduled stated maturity date or, if the originally scheduled stated maturity date is not a business day, later than the first business day after the originally scheduled stated maturity date. If the determination date is postponed to the last possible day, but such day is not a trading day, that day will nevertheless be the determination date.
Consequences of a Non-Trading Day If a day that would otherwise be the determination date is not a trading day, then the determination date will be
postponed as described under “— Determination Date” above.
If the CD calculation agent determines that the final index level is not available on the last possible determination date because of a non-trading day or for any other reason (other than as described under “— Discontinuance or Modification of the Index” below), then the CD calculation agent will nevertheless determine the level of the index based on its assessment, made in its sole discretion, of the level of the index at the applicable time on that day.
Discontinuance or Modification of the Index
If the index sponsor discontinues publication of the index and the index sponsor or anyone else publishes a substitute index that the CD calculation agent determines is comparable to the index, or if the CD calculation agent designates a substitute index, then the CD calculation agent will determine the amount payable on the stated maturity date by reference to the substitute index. We refer to any substitute index approved by the CD calculation agent as a successor index.
If the CD calculation agent determines on the determination date that the publication of the index is discontinued and there is no successor index, the CD calculation agent will determine the amount payable on the stated maturity date by a computation methodology that the CD calculation agent determines will as closely as reasonably possible replicate the index.
If the CD calculation agent determines that the index or the method of calculating the index is changed at any time in any respect — including any split or reverse split and any addition, deletion or substitution and any reweighting or rebalancing of the index or of the index ETFs and whether the change is made by the index sponsor under its existing policies or following a modification of those policies, is due to the publication of a successor index, is due to events

S-43
affecting one or more of the index ETFs or its sponsor or is due to any other reason — and is not otherwise reflected in the level of the index by the index sponsor pursuant to the index methodology described under “The Index” below, then the CD calculation agent will be permitted (but not required) to make such adjustments in the index or the method of its calculation as it believes are appropriate to ensure that the level of the index used to determine the amount payable on the stated maturity date is equitable.
All determinations and adjustments to be made by the CD calculation agent with respect to the index may be made by the CD calculation agent in its sole discretion. The CD calculation agent is not obligated to make any such adjustments.
Mandatory Redemption
If our status as an insured depository institution is terminated by the FDIC or us or as a result of our actions, or if a regulatory or statutory change renders the CDs ineligible for FDIC insurance coverage, to the extent permitted by law and regulation, we will redeem your CDs then outstanding on the applicable mandatory redemption date in full at a price equal to the mandatory redemption amount, which is described under “—Special Calculation Provisions—Mandatory Redemption Amount” below. This commitment to redeem your CDs may not be enforceable under certain circumstances, such as if the FDIC has been appointed receiver or conservator of the bank. No supplemental amount will be paid following the effective date of such regulatory or statutory change or such termination of our status as an insured depository institution if such termination were to occur. The mandatory redemption date following any such termination, however, will be the last business day on which any of our outstanding deposit obligations would be insured by the FDIC pursuant to temporary deposit insurance provided by the FDIC. Such date may not occur for a period of six months to up to almost two years after the mandatory redemption amount is determined (depending on the period of temporary deposit insurance provided by the FDIC following the termination of our status as an insured depository institution). If regulatory or statutory changes render the CDs ineligible for FDIC insurance, the mandatory redemption date following such change will be the tenth business day after the effective date of any such regulation, ruling or interpretation which renders the CDs ineligible for FDIC insurance coverage. The mandatory redemption amount will not bear interest. We describe the mandatory redemption amount under “— Special Calculation Provisions” below. You may not receive the mandatory redemption amount for up to almost two years and the full mandatory redemption amount may not be covered by FDIC insurance. In addition, if the mandatory redemption results from regulatory or statutory changes in the future that render the CDs ineligible for FDIC insurance, the mandatory redemption amount in such scenario will not be covered by FDIC insurance and will be subject to the credit risk of Goldman Sachs Bank USA until the date of such redemption, which will occur ten business days after the effective date of any such regulatory or statutory change. See "Additional Risk Factors Specific to Your Certificates of Deposit — If Your CDs Are Mandatorily Redeemed You May Not Receive the Mandatory Redemption Amount for Up to Almost Two Years. In Addition, the Full Mandatory Redemption Amount May Not Be Protected by FDIC Insurance" and " — If Regulatory Changes Render the CDs Ineligible for FDIC Insurance Coverage, Your CDs May Not Be Covered by FDIC Insurance and Will Be Subject to Mandatory Redemption."
Notwithstanding the foregoing, in the event the mandatory redemption date occurs on or after the stated maturity date, you will receive the amount described under “— Payment on Stated Maturity Date” above.
Optional Redemption in the Event of Death or Adjudication of Incompetence
The authorized representative of a deceased or adjudicated incompetent beneficial owner of a CD will have the option to request a redemption of the CDs before (not on or after) the stated maturity date as described under “Description of the Certificates of Deposit We May Offer — Redemption — Redemption Upon Death or Adjudication of Incompetence” on page 34 of the accompanying disclosure statement and “Truth in Savings Disclosure — Optional Redemption in the Event of Death or Adjudication of Incompetence” herein, which we refer to as the “estate feature.” However, the estate feature for the CDs offered by this disclosure statement supplement is subject to important limitations that are not described in the accompanying disclosure statement.
By your purchase of a CD, you are deemed to represent to us and any dealer through which you purchase the CD that your deposits with Goldman Sachs Bank USA, including the CDs, when aggregated in accordance with Federal Deposit Insurance Corporation regulations, are within the $250,000 FDIC insurance limit for each insurable capacity. For purposes of early withdrawal pursuant to the estate feature, we will limit the combined aggregate principal amount of (i) these CDs and (ii) any other CDs of Goldman Sachs Bank USA subject to this withdrawal limit to the FDIC insurance coverage amount applicable to each insurable capacity in which such CDs are held.
A joint owner of a joint account with a beneficial owner who has died or been adjudicated incompetent will be entitled to redeem a CD only if such joint owner was a member of the same household with the deceased or incompetent beneficial owner at the time of such beneficial owner’s death or declaration of legal incompetency, or if such joint owner is related to the deceased or incompetent beneficial owner, including by blood, marriage or adoption. Any other joint accountholder shall have no right to the estate feature. A joint owner so entitled to redeem a CD shall hold all of the rights

S-44
to take actions with respect to such CD that are granted to an authorized representative under the Disclosure Statement with respect to the estate feature.
In addition, as discussed in the accompanying disclosure statement, written verification acceptable to us will be required to permit early withdrawal pursuant to the estate feature and all questions regarding the eligibility or validity of any exercise of the estate feature will be determined by us in our sole discretion, which determination will be final and binding on all parties. Furthermore, we may waive any applicable limitations with respect to a deceased or incompetent beneficial owner but not make the same or similar waivers with respect to other deceased or incompetent beneficial owners.
The value of the CDs may be greater than their face amount on the date of such early redemption. Accordingly, the authorized representative should contact your broker to determine the market price of the CDs and should otherwise carefully consider whether to sell the CDs to your broker or another market participant rather than redeeming the CDs at the face amount pursuant to a request for redemption.
Manner of Payment
We will make any payments in accordance with the applicable procedures of the depositary.
Role of CD Calculation Agent
The CD calculation agent will make all determinations regarding the index; successor indices; the stated maturity date; the determination date; the mandatory redemption date, if applicable; business days; trading days; the index return; the final index level; the mandatory redemption amount, if applicable; the supplemental amount and the amount payable on your CDs at maturity; and any other determination as applicable or specified herein. Absent manifest error, all determinations of the CD calculation agent will be final and binding on you and us, without any liability on the part of the CD calculation agent.
Please note that Goldman, Sachs & Co., our affiliate, is currently serving as the CD calculation agent as of the original issue date of your CDs. We may change the CD calculation agent at any time after the original issue date without notice and Goldman, Sachs & Co. may resign as CD calculation agent at any time upon 60 days’ written notice to us.
Special Calculation Provisions
Business Day
When we refer to a business day with respect to your CDs, we mean each Monday, Tuesday, Wednesday, Thursday and Friday that is not a day on which banking institutions in New York City are authorized or obligated by law, regulation or executive order to close.
Trading Day
When we refer to a trading day with respect to your CDs, we mean a day on which the index is calculated and published by the index sponsor (including any index calculation agent acting on the index sponsor’s behalf).
Closing Level of the Index
When we refer to the closing level of the index on any trading day, we mean the official closing level of the index or any successor index published by the index sponsor (including any index calculation agent acting on the index sponsor’s behalf) on such trading day.
Level of the Index
When we refer to the level of the index at any time on any trading day, we mean the official level of the index or any successor index published by the index sponsor (including any index calculation agent acting on the index sponsor’s behalf) at such time on such trading day.
Mandatory Redemption Amount
The mandatory redemption amount for your CDs on any day will be an amount equal to the greater of:
• the face amount of your CDs, and
• the cost of having a qualified financial institution, of the kind and selected as described below, expressly assume all of our payment and other obligations with respect to your CDs as of that day and as if our insured status had not been terminated or the CDs had not been rendered ineligible for FDIC insurance coverage, or

S-45
to undertake other obligations providing substantially equivalent economic value to you with respect to your CDs.
That cost will equal:
• the lowest amount that a qualified financial institution would charge to effect this assumption or undertaking, plus
• the reasonable expenses, including reasonable attorneys’ fees, incurred by the holder of the CDs in preparing any documentation necessary for this assumption or undertaking.
In no event, however, will the mandatory redemption amount for your CDs be less than the face amount of your CDs.
During the mandatory redemption quotation period for your CDs, which we describe below, the holder and/or we may request a qualified financial institution to provide a quotation of the amount it would charge to effect this assumption or undertaking. If either party obtains a quotation, it must notify the other party in writing of the quotation. The amount referred to in the first bullet point above will equal the lowest — or, if there is only one, the only — quotation obtained, and as to which notice is so given, during the mandatory redemption quotation period. With respect to any quotation, however, the party not obtaining the quotation may object, on reasonable and significant grounds, to the assumption or undertaking by the qualified financial institution providing the quotation and notify the other party in writing of those grounds within two business days after the last day of the mandatory redemption quotation period, in which case that quotation will be disregarded in determining the mandatory redemption amount.
Mandatory Redemption Quotation Period
The mandatory redemption quotation period is the period beginning, as applicable, on: (i) the day on which our status as an insured depository institution is terminated by the FDIC, or (ii) the effective date of any regulation, ruling or interpretation that renders the CDs ineligible for FDIC insurance, in each case ending on the third business day after that day, unless:
• no quotation of the kind referred to above is obtained,
• every quotation of that kind obtained is objected to within five business days after the day on which our status as an insured depository institution is terminated or the effective date of any regulation, ruling or interpretation that renders the CDs ineligible for FDIC insurance, as applicable, or
• the mandatory redemption amount based on the quotation of that kind obtained and not objected to would be less than the face amount of your CDs.
If any of these three events occurs, the mandatory redemption quotation period will continue until the third business day after the first business day on which prompt notice of a quotation is given as described above, if that quotation is objected to as described above within five business days after that first business day or if the mandatory redemption amount based on that quotation would be less than the face amount of your CDs, however, the mandatory redemption quotation period will continue as described in the prior sentence and this sentence.
In any event, in the case of a regulatory or statutory change-related mandatory redemption, if the mandatory redemption quotation period and the subsequent two business day objection period have not ended before the business day preceding the mandatory redemption date, or in the case of an insurance status-related mandatory redemption, if the mandatory redemption quotation period and subsequent two business day objection period have not ended before the tenth business day after the start of the mandatory redemption quotation period, then the mandatory redemption amount will equal the face amount of your CDs.
Because the mandatory redemption date with respect to a termination of our status as an insured depository institution will occur only at the end of the applicable grace period during which our deposits remain insured pursuant to temporary insurance after our status as an insured depository institution has been terminated by the FDIC, you may not receive the mandatory redemption amount for a period of up to almost two years after the end of the mandatory redemption quotation period and you will not earn interest on that amount or on the face amount of the CDs during that period.
Qualified Financial Institutions
For the purpose of determining the mandatory redemption amount at any time, a qualified financial institution must be a financial institution organized under the laws of any jurisdiction in the United States of America, which at that time has outstanding debt obligations with a stated maturity of one year or less from the date of issue and that is rated either:

S-46
• A-1 or higher by Standard & Poor’s Ratings Services or any successor, or any other comparable rating then used by that rating agency, or
• P-1 or higher by Moody’s Investors Service, Inc. or any successor, or any other comparable rating then used by that rating agency.

S-47
HYPOTHETICAL EXAMPLES The following table and chart are provided for purposes of illustration only. They should not be taken as an indication
or prediction of future investment results and are intended merely to illustrate the impact that the various hypothetical index levels on the determination date could have on the payment amount at maturity assuming all other variables remain constant.
The examples below are based on a range of final index levels that are entirely hypothetical; no one can predict what the level of index will be on any day throughout the life of your CDs, and no one can predict what the final index level will be on the determination date. The index has been highly volatile in the past — meaning that the level of the index has changed considerably in relatively short periods — and its performance cannot be predicted for any future period.
The information in the following examples reflects hypothetical rates of return on the offered CDs assuming that they are purchased on the original issue date at the face amount and held to the stated maturity date. If you are able to sell your CDs in a secondary market prior to the stated maturity date, your return will depend upon the market value of your CDs at the time of sale, which may be affected by a number of factors that are not reflected in the table below such as the volatility of the index and our creditworthiness. In addition, the estimated value of your CDs at the time the terms of your CDs are set on the trade date (as determined by reference to pricing models used by Goldman, Sachs & Co.) will be less than the original issue price of your CDs. For more information on the estimated value of your CDs, see “Additional Risk Factors Specific to Your Certificates of Deposit — The Estimated Value of Your CDs At the Time the Terms of Your CDs Are Set On the Trade Date (as Determined By Reference to Pricing Models Used By Goldman, Sachs & Co.) Will Be Less Than the Original Issue Price Of Your CDs” on page S-19 of this disclosure statement supplement and the cover of this disclosure statement supplement. The information in the table also reflects the key terms and assumptions in the box below.
Moreover, we have not yet set the initial index level that will serve as the baseline for determining the index return and the amount we will pay on your CDs at maturity. We will not do so until the trade date. As a result, the initial index level may differ substantially from the index level prior to the trade date and may be higher or lower than the actual closing level of the index on the trade date. For these reasons, the actual performance of the index over the life of your CDs, particularly on the determination date, as well as the amount payable at maturity may bear little relation to the hypothetical examples shown below or to the historical index performance information or hypothetical performance data shown elsewhere in this disclosure statement supplement. For information about the historical index performance levels and hypothetical performance data of the index during recent periods, see “The Index —Daily Closing Levels of the Index” on page S-62.
Key Terms and Assumptions
Face amount ................................................................................................................................................... $1,000
Upside participation rate ................................................................................................................................. 200.00%
No non-trading day occurs on the originally scheduled determination date
No change in or affecting any of the eligible underlying assets or the method by which the index sponsor calculates the index
CDs purchased on original issue date and held to the stated maturity date
Before investing in the offered CDs, you should consult publicly available information to determine the level of the index between the date of this disclosure statement supplement and the date of your purchase of the offered CDs.
Any rate of return you may earn on an investment in the CDs may be lower than that which you could earn on a comparable investment in the index underlying assets.
Also, the hypothetical examples shown below do not take into account the effects of applicable taxes. Because of the U.S. tax treatment applicable to your CDs, tax liabilities could affect the after-tax rate of return on your CDs to a comparatively greater extent than the after-tax return on the index ETFs.
The table below shows the hypothetical payment amounts that we would deliver on the stated maturity date in exchange for each $1,000 face amount of the CDs if the final index level (expressed as a percentage of the initial index level) were any of the hypothetical levels shown in the left column.
The levels in the left column of the table below represent hypothetical final index levels and are expressed as percentages of the initial index level. The amounts in the right column represent the hypothetical payment amounts, based

S-48
on the corresponding hypothetical final index level (expressed as a percentage of the initial index level), and are expressed as percentages of the face amount of a CD (rounded to the nearest one-hundredth of a percent). Thus, a hypothetical payment amount of 100.00% means that the value of the cash payment that we would deliver for each $1,000 of the outstanding face amount of the CDs on the stated maturity date would equal 100.00% of the face amount of a CD, based on the corresponding hypothetical final index level (expressed as a percentage of the initial index level) and the assumptions noted above.
Hypothetical Final Index Level (as Percentage of Initial Index Level)
Hypothetical Payment Amount (as Percentage of Face Amount)
175.00% 250.00% 150.00% 200.00% 125.00% 150.00% 110.00% 120.00% 100.00% 100.00% 90.00% 100.00% 75.00% 100.00% 50.00% 100.00% 25.00% 100.00% 0.00% 100.00%
If, for example, the final index level were determined to be 25.00% of the initial index level, the payment amount that
we would deliver on your CDs at maturity would be 100.00% of the face amount of your CDs, as shown in the table above. As a result, if you purchased your CDs on the original issue date and held them to the stated maturity date, you would receive no return on your investment.
The following chart also shows a graphical illustration of the hypothetical payment amounts (expressed as a percentage of the face amount of your CDs) that we would pay on your CDs on the stated maturity date, if the final index level (expressed as a percentage of the initial index level) were any of the hypothetical levels shown on the horizontal axis. The chart shows that any hypothetical final index level (expressed as a percentage of the initial index level) of less than 100.00% (the section left of the 100.00% marker on the horizontal axis) would result in a hypothetical payment amount of 100.00% of the face amount of your CDs.
0%
50%
100%
150%
0% 50% 100% 150%
Hypo
thet
ical P
aym
ent A
mou
nt as
% o
f Fac
e Am
ount
Hypothetical Final Index Level as % of Initial Index Level
Index Performance
CD Performance
S-49
The payment amounts and supplemental amounts shown above are entirely hypothetical; they are based on closing levels of the index that may not be achieved on the determination date and on assumptions that may prove to be erroneous. The actual market value of your CDs on the stated maturity date or at any other time, including any time you may wish to sell your CDs, may bear little relation to the hypothetical payment amounts shown above, and these amounts should not be viewed as an indication of the financial return on an investment in the offered CDs. Please read “Additional Risk Factors Specific to Your Certificates of Deposit — The Market Value of Your CDs May Be Influenced by Many Unpredictable Factors” on page S-20.
Payments on the CDs are economically equivalent to the amounts that would be paid on a combination of other instruments. For example, payments on the CDs are economically equivalent to a combination of an interest-bearing bond bought by the holder and one or more options entered into between the holder and us (with one or more implicit option premiums paid over time). The discussion in this paragraph does not modify or affect the terms of the CDs or the U.S. federal income tax treatment of the CDs, as described elsewhere in this disclosure statement supplement.
We cannot predict the actual final index level or the market value of your CDs, nor can we predict the relationship between the level of the index and the market value of your CDs at any time prior to the stated maturity date. The actual amount that a holder of the CDs will receive at maturity and the rate of return on the offered CDs will depend on the actual initial index level, which we will set on the trade date, and the actual closing level of the index on the determination date, as determined by the CD calculation agent as described above. Moreover, the assumptions on which the hypothetical returns are based may turn out to be inaccurate. Consequently, the amount of cash to be paid in respect of your CDs on the stated maturity date may be very different from the information reflected in the table, chart and examples above.

S-50
USE OF PROCEEDS We expect to use the net proceeds we receive from the sale of the offered CDs for the purposes we describe in the
accompanying disclosure statement under “Use of Proceeds”. We or our affiliates may also use those proceeds in transactions intended to hedge our obligations under the offered CDs as described below.
HEDGING In anticipation of the sale of the CDs, we and/or our affiliates expect to enter into cash-settled hedging transactions
involving purchases of listed or over-the-counter options, futures and/or other instruments linked to the index on or before the trade date. In addition, from time to time after we issue the CDs, we and/or our affiliates expect to enter into additional hedging transactions and to unwind those we have entered into, in connection with the CDs and perhaps in connection with other index-linked CDs we issue, some of which may have returns linked to the index, the eligible underlying assets or 3-month USD LIBOR. Consequently, with regard to your CDs, from time to time, we and/or our affiliates:
• expect to acquire, or dispose of, cash-settled positions in listed or over-the-counter options, futures or other instruments linked to the index or some or all of the eligible underlying assets or 3-month USD LIBOR,
• may take or dispose of positions in the assets held by the eligible ETFs,
• may take or dispose of positions in listed or over-the-counter options or other instruments based on indices designed to track the performance of the New York Stock Exchange or other components of the U.S. equity market,
• may take short positions in the eligible underlying assets or other securities of the kind described above — i.e., we and/or our affiliates may sell securities of the kind that we do not own or that we borrow for delivery to purchaser, and/or
• may take or dispose of positions in interest rate swaps, options swaps and treasury bonds. We and/or our affiliates may acquire a long or short position in securities similar to the offered CDs from time to time
and may, in our or their sole discretion, hold or resell those securities. In the future, we and/or our affiliates expect to close out hedge positions relating to the CDs and perhaps relating to
other CDs with returns linked to the index, the eligible underlying assets, 3-month USD LIBOR or assets held by the eligible ETFs. We expect our affiliates’ steps to involve sales of instruments linked to the index, the eligible underlying assets, 3-month USD LIBOR or assets held by the eligible ETFs on or shortly before the determination date. Our affiliates’ steps also may involve sales and/or purchases of some or all of the listed or over-the-counter options, futures or other instruments linked to the index.
The hedging activity discussed above may adversely affect the market value of your CDs from time to time and the value of the consideration that we will deliver on your CDs at maturity. See “Risk Factors — Our Affiliate’s Anticipated Hedging Activities May Negatively Impact Investors in the CDs and Cause our Interests and Those of Our Clients and Counterparties to be Contrary to Those of Investors in the CDs” and “Risk Factors — Trading and Investment Activities for its Own Account or for its Clients, Could Negatively Impact Investors in the CDs” in the accompanying disclosure statement for a discussion of these adverse effects.

S-51
THE INDEX
General Overview The GS Momentum Builder® Multi-Asset 5 ER Index (the index) measures the extent to which the performance of the
exchange-traded funds and a money market position (together with the ETFs, the underlying assets) included in the index outperform the sum of the notional interest rate, which is a rate equal to 3-month USD LIBOR, plus the daily index maintenance fee of 0.50% per annum. The money market position reflects the notional returns accruing to a hypothetical investor from an investment in a notional overnight money account denominated in U.S. dollars that accrues interest at the overnight interest rate, which is a rate equal to the federal funds effective rate. The index rebalances monthly (and sometimes daily) from among 15 underlying assets that have been categorized in the following asset classes: equities; fixed income; emerging markets; alternatives; commodities; inflation; and cash equivalent. The index attempts to track the positive price momentum in the underlying assets, subject to limitations on volatility and a maximum weight for each underlying asset and each asset class, each as described below.
Each month the index is rebalanced by first calculating the portfolio of underlying assets that would have provided the highest historical return during a return look-back period comprised of the prior six months, subject to a limit of 5% on the degree of variation in the daily closing prices or closing level, as applicable, of the aggregate of such underlying assets (a measure known as “realized volatility”) over three different realized volatility look-back periods (the prior six months, three months and one month) and subject to a maximum weight for each underlying asset and each asset class. This results in three potential portfolios of underlying assets (one for each realized volatility look-back period). The weight of each underlying asset for a monthly base index rebalancing will equal the average of the weights of such underlying asset in these three potential portfolios. While the weight of each underlying asset for each monthly base index rebalancing will be determined on a single day (the base index observation day), the monthly rebalancing based on such revised weights will be implemented over a base index rebalancing period comprised of five base index rebalancing days, which are the first five index business days of each calendar month beginning on, and including, the base index observation day, subject to adjustment. As a result of monthly rebalancing, the index may include as few as four eligible underlying assets (as few as three eligible ETFs) and may not include some of the underlying assets or asset classes during the entire term of the CDs.
In addition, if on any daily total return index rebalancing day, which is any index business day, the realized volatility of the index underlying assets exceeds the volatility cap of 6% for the applicable volatility cap period (the prior one month), the index will be rebalanced in order to reduce such realized volatility by ratably reallocating a portion of the exposure to the index ETFs to the money market position. Historically, a significant portion of the index exposure has been to the money market position, the return of which has been below 3-month USD LIBOR.
The index reflects the return of the index underlying assets less the sum of the notional interest rate plus the daily index maintenance fee. Any cash dividend paid on an index ETF is deemed to be reinvested in such index ETF and subject to subsequent changes in the value of the index ETF. In addition, any interest accrued on the money market position is similarly deemed to be reinvested on a daily basis in such money market position and subject to subsequent changes in the federal funds effective rate. For further information regarding how the index value is calculated see “— How is the index value calculated on any day?” below.
The notional interest rate is a rate equal to 3-month USD LIBOR, which generally will be the offered rate for 3-month deposits in U.S. dollars, as that rate appears on the Reuters screen 3750 page as of 11:00 a.m., London time, as observed two London business days prior to the relevant notional interest rate reset date. A notional interest rate reset date will occur quarterly on January 2, April 2, July 2 and October 2, or, if one of those dates is not an index business day, on the index business day immediately following such day on which the notional interest rate is reset. A London business day is a day on which commercial banks and foreign currency markets settle payments and are open for general business in London.
With respect to the money market position, the overnight interest rate is a rate equal to the federal funds effective rate. The federal funds effective rate for any day generally will be the rate for U.S. dollar federal funds on or with respect to such day, as set forth in USD-FEDERAL-FUNDS-H15, as provided by Reuters on RSF.REC.USONFFE=.NaE, or as provided by another recognized sourced used for the purpose of displaying such rate for that day. For any given calendar day on which an overnight interest rate is not available, the index calculation agent will use for such day the latest available level of the overnight interest rate.
The value of the index is calculated in U.S. dollars on each index business day by reference to the performance of the total return index value net of the sum of the return on the notional interest rate in effect at that time plus the daily index

S-52
maintenance fee of 0.50% per annum. The total return index value on each index business day is calculated by reference to the weighted performance of:
• the base index, which is the weighted combination of underlying assets that comprise the index at the applicable time as a result of the most recent monthly base index rebalancing (whether partially or fully implemented); and
• any additional exposure to the money market position resulting from any daily total return index rebalancing that day.
The underlying assets that comprise the base index as the result of the most recent monthly base index rebalancing may include a combination of ETFs and the money market position, or solely ETFs. A daily total return index rebalancing will occur on any daily total return index rebalancing day if the realized volatility of the base index exceeds the volatility cap of 6% for the volatility cap period applicable to such index business day. As a result of a daily total return index rebalancing, the index will have exposure to the money market position even if the base index has no such exposure resulting from its most recent monthly base index rebalancing.
For the purpose of this disclosure statement supplement:
• an “eligible underlying asset” is one of the ETFs or the money market position that is eligible for inclusion in the index on a base index observation day;
• an “eligible ETF” is one of the ETFs that is eligible for inclusion in the index on a base index observation day (when we refer to an “ETF” we mean an exchange traded fund, which for purposes of this disclosure statement supplement includes the following exchange traded products: SPDR® S&P 500® ETF Trust, PowerShares® DB Commodity Index Tracking Fund and SPDR® Gold Trust);
• an “index underlying asset” is an eligible underlying asset with a non-zero weighting on any index business day; • an “index ETF” is an ETF that is an eligible ETF with a non-zero weighting on any index business day; and • an “index business day” is a day on which both (i) commercial banks and currency exchange markets settle
payments and are open for general business in New York and (ii) the New York Stock Exchange is open for its regular trading session on such day.
How frequently is the index rebalanced? Each month the index rebalances from among the 15 eligible underlying assets by calculating the portfolio of
underlying assets that would have provided the highest historical return during a return look-back period comprised of the prior six months, subject to a limit of 5% on the degree of variation in the daily closing prices or closing level, as applicable, of the aggregate of such underlying assets (a measure known as “realized volatility”) over three different realized volatility look-back periods (the prior six months, three months and one month) and subject to a maximum weight for each underlying asset and each asset class. This results in three potential portfolios of underlying assets (one for each realized volatility look-back period). The weight of each underlying asset for a monthly rebalancing will equal the average of the weights of such underlying asset in these three potential portfolios. This monthly rebalancing is referred to as the base index rebalancing and the resulting portfolio of index underlying assets comprise the base index for the month. While the weight of each underlying asset for each monthly base index rebalancing will be determined on the base index observation day, the monthly base index rebalancing will be implemented over a base index rebalancing period comprised of five base index rebalancing days, which are the first five index business days of each calendar month beginning on, and including, the base index observation day, subject to adjustment. A “base index observation day” is the first index business day of each calendar month, subject to adjustment. Certain aspects of base index observation day and base index rebalancing day adjustments are described under “— Could index market disruption events or corporate events impact the calculation of the index or the implementation of a monthly base index rebalancing or a daily total return index rebalancing by the index calculation agent?” below.
Additionally, the index may be rebalanced on any daily total return index rebalancing day (including during a base index rebalancing period) as a result of a daily volatility control feature if, on such daily total return index rebalancing day, the realized volatility of the base index exceeds the volatility cap of 6% for the applicable volatility cap period, which is the prior one month. This type of rebalancing has the effect of reducing the exposure of the index to the performance of the eligible ETFs by rebalancing a portion of the exposure into the money market position. This daily rebalancing is referred to as the daily total return index rebalancing.

S-53
For a discussion of how the look-back periods for monthly and daily rebalancing are determined, see “— What is realized volatility and how are the weights of the underlying assets influenced by it?” and “— How do the weights of the index underlying assets change as a result of a daily total return index rebalancing?”, respectively, below. How is the index value calculated on any day?
The value of the index was set to 100 on the inception date of the index, January 2, 2013. On each index business day, the value of the index changes by reference to the performance of the total return index value net of the sum of the return on the notional interest rate in effect at that time plus the daily index maintenance fee of 0.50% per annum. The total return index value on each index business day is calculated by reference to the weighted performance of:
• the base index, which is the weighted combination of underlying assets that comprise the index at the applicable time as a result of the most recent monthly base index rebalancing (whether partially or fully implemented); and
• any exposure to the money market position resulting from any daily total return index rebalancing that day.
The underlying assets that comprise the base index as the result of the most recent monthly base index rebalancing may include a combination of ETFs and the money market position, or solely ETFs. A daily total return index rebalancing will occur on any daily total return index rebalancing day if the realized volatility of the base index exceeds the volatility cap of 6% for the volatility cap period applicable to such daily total return index rebalancing day. As a result of a daily total return index rebalancing, the index will have exposure to the money market position even if the base index has no such exposure resulting from its most recent monthly base index rebalancing.
On any index business day, the index value will equal (a) the index value on the immediately preceding notional interest rate reset day multiplied by (b) the return on the total return index on such index business day reduced by the sum of (i) the prorated notional interest rate and (ii) the prorated daily index maintenance fee. The return on the total return index for any such index business day will equal the quotient of the total return index value as of such index business day divided by the total return index value as of the immediately preceding notional interest rate reset day. The prorated notional interest rate and prorated daily index maintenance fee are each calculated on an actual/360 day count basis from but excluding the immediately preceding notional interest rate reset date. The notional interest rate is reset on quarterly notional interest rate reset dates which are each January 2, April 2, July 2 and October 2, or, if such date is not an index business day, on the index business day immediately following such date. Regardless of whether the index underlying assets include the money market position on a monthly base index observation day, if the index has ratably rebalanced into the money market position as a result of the daily volatility control feature, then the index also will include the value of the money market position.
The value of any index ETF is equal to the result of multiplying the weight applicable to such index ETF and the adjusted level of such index ETF. The adjusted level of such index ETF reflects any price change in such index ETF as well as any cash dividend paid on such index ETF. Any cash dividend paid on an index ETF is deemed to be reinvested in such index ETF and subject to subsequent changes in the value of the index ETF.
The value of the money market position reflects, on any day, the amount of interest accrued at the overnight interest rate on an investment in a notional U.S. dollar denominated overnight money account. The money market position will have a positive notional return if the overnight interest rate is positive. Any interest accrued on the money market position is deemed to be reinvested on a daily basis in such money market position and subject to subsequent changes in the federal funds effective rate.
The contribution of any index underlying asset to the performance of the index will depend on its weight and performance. The effects of potential adjustment events are described under “— Could index market disruption events or corporate events impact the calculation of the index or the implementation of a monthly base index rebalancing or a daily total return index rebalancing by the index calculation agent?” below. How are the index underlying assets weights determined during the base index rebalancing period?
While the weight of each underlying asset for each monthly rebalancing will be determined on the applicable base index observation day, the monthly rebalancing based on such revised weights will be implemented over the base index rebalancing period. The base index rebalancing period is comprised of five index rebalancing days, which are the first five index business days of each calendar month beginning on, and including, the base index observation day, subject to adjustment as described below under “— Could market disruptions or corporate events impact the calculation of the index or the implementation of a monthly base index rebalancing or a daily total return index rebalancing by the index calculation agent?”. Following each base index observation day, any change in the weight of an index underlying asset in

S-54
the base index from the prior base index observation day will be implemented incrementally by one fifth each day. For example, if the weight of an index underlying asset in the base index is to be increased from the prior base index observation day, such weight will be increased by one fifth of such increase on each day in the base index rebalancing period until the weight reflects the weight selected on the related base index observation day. How does the index attempt to provide exposure to price momentum?
The index uses the historical return performance of the eligible underlying assets to determine the composition of the index on a base index observation day. The six-month historical returns are used as an indication of price momentum. Although the index methodology seeks to select index underlying assets with the highest six-month historical return reflecting price momentum, the underlying asset maximum weights, asset class maximum weights, monthly volatility target, averaging of eligible underlying asset weights in the realized volatility look-back periods and daily volatility control, as well as how the eligible underlying assets correlate, may limit the exposure to those underlying assets with the highest six-month historical returns.
The six-month historical return for an eligible underlying asset is calculated to include, with respect to the ETFs, price changes and any cash dividends paid during the relevant six-month period being evaluated. Who calculates and oversees the index?
The index is calculated using a methodology developed by Goldman, Sachs & Co., the index sponsor. The complete index methodology is available at http://www.solactive.com/indexing-en/indices/complex/. We are not incorporating by reference this website or any material it includes into this disclosure statement supplement.
An index committee is responsible for overseeing the index and its methodology. The index committee may exercise discretion in the case of any changes to the eligible underlying assets, delayed rebalancing and index market disruption events or any potential adjustment event that occurs in relation to one or more eligible underlying assets. The index committee will initially be comprised of three full-time employees of The Goldman Sachs Group, Inc. or one or more of its affiliates.
Changes to the index methodology made by the index committee will be publicly announced on the index calculation agent’s website at least 60 index business days prior to their effective date. Adjustments made by the index calculation agent in response to index market disruption events and potential adjustment events will be publicly announced as promptly as is reasonably practicable on the index calculation agent’s website.
The index committee may exercise limited discretion with respect to the index, including in the situations described below under “— Can the Eligible Underlying Assets Change?”. Any such changes or actions are publicly announced as promptly as is reasonably practicable and normally at least five index business days prior to their effective date.
The index sponsor has retained Solactive AG to serve as index calculation agent. The index calculation agent calculates the value of the index and implements the methodology determined by the index committee. The index sponsor can replace the index calculation agent at any time, or the index calculation agent can resign on 60 days notice to the index sponsor. In the event the index sponsor appoints a replacement index calculation agent, a public announcement will be made via press release.
The index calculation agent is responsible for the day to day implementation of the methodology of the index and for its calculation. The index calculation agent calculates and publishes the value of the index every 15 seconds on each index business day and publishes it on the Bloomberg page GSMBMA5 Index and Reuters page .GSMBMA5. The index calculation agent may from time to time consult the index committee on matters of interpretation with respect to the methodology. What underlying assets are included in the universe of potential index underlying assets?
As of the date of this document, there are 14 eligible ETFs included in the 15 eligible underlying assets. These eligible underlying assets track assets that have been categorized in the following asset classes: equities; fixed income; emerging markets; alternatives; commodities; inflation; and cash equivalent. The 14 ETFs are as follows:
• SPDR® S&P 500® ETF Trust (SPY) — SPY seeks investment results that correspond generally to the price and yield performance, before fees and expenses, of publicly traded securities in leading industries of the U.S. economy, as measured by the S&P 500® Index. SPY has been categorized in the equities asset class.
• iShares® MSCI EAFE ETF (EFA) — EFA seeks investment results that correspond generally to the price and yield performance, before fees and expenses, of publicly traded securities in the European, Australasian and Far Eastern markets, as measured by the MSCI EAFE® Index. EFA has been categorized in the equities asset class.
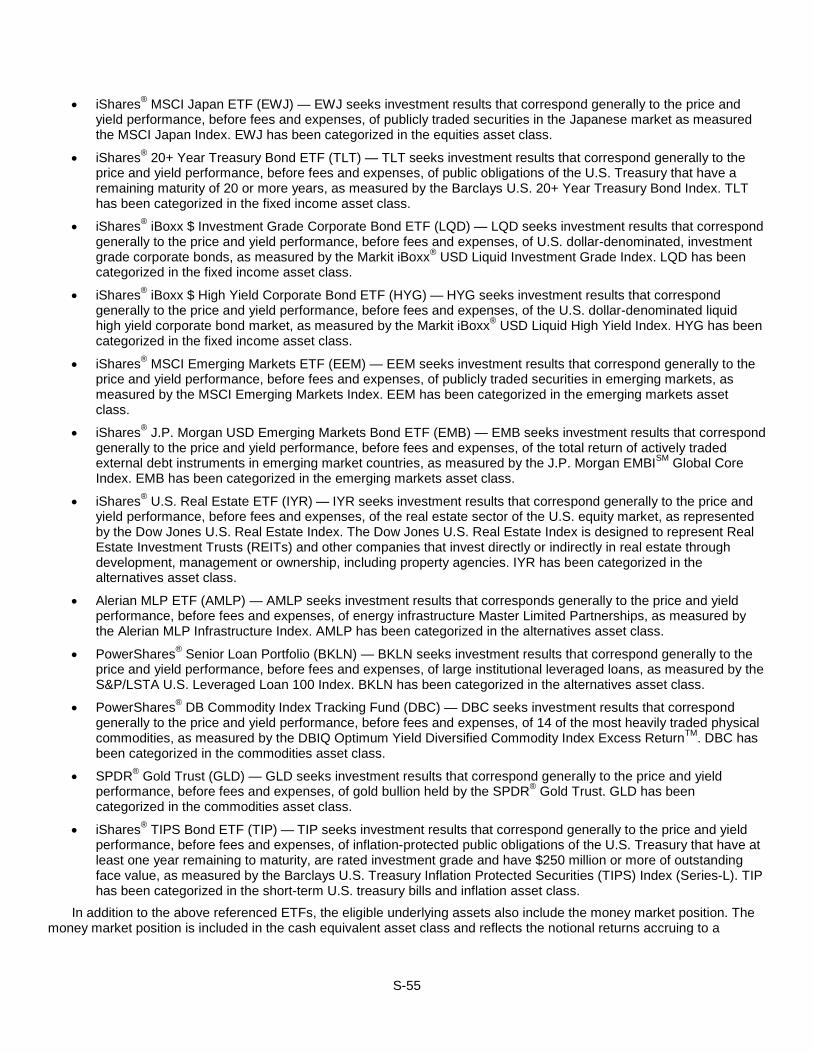
S-55
• iShares® MSCI Japan ETF (EWJ) — EWJ seeks investment results that correspond generally to the price and yield performance, before fees and expenses, of publicly traded securities in the Japanese market as measured the MSCI Japan Index. EWJ has been categorized in the equities asset class.
• iShares® 20+ Year Treasury Bond ETF (TLT) — TLT seeks investment results that correspond generally to the price and yield performance, before fees and expenses, of public obligations of the U.S. Treasury that have a remaining maturity of 20 or more years, as measured by the Barclays U.S. 20+ Year Treasury Bond Index. TLT has been categorized in the fixed income asset class.
• iShares® iBoxx $ Investment Grade Corporate Bond ETF (LQD) — LQD seeks investment results that correspond generally to the price and yield performance, before fees and expenses, of U.S. dollar-denominated, investment grade corporate bonds, as measured by the Markit iBoxx® USD Liquid Investment Grade Index. LQD has been categorized in the fixed income asset class.
• iShares® iBoxx $ High Yield Corporate Bond ETF (HYG) — HYG seeks investment results that correspond generally to the price and yield performance, before fees and expenses, of the U.S. dollar-denominated liquid high yield corporate bond market, as measured by the Markit iBoxx® USD Liquid High Yield Index. HYG has been categorized in the fixed income asset class.
• iShares® MSCI Emerging Markets ETF (EEM) — EEM seeks investment results that correspond generally to the price and yield performance, before fees and expenses, of publicly traded securities in emerging markets, as measured by the MSCI Emerging Markets Index. EEM has been categorized in the emerging markets asset class.
• iShares® J.P. Morgan USD Emerging Markets Bond ETF (EMB) — EMB seeks investment results that correspond generally to the price and yield performance, before fees and expenses, of the total return of actively traded external debt instruments in emerging market countries, as measured by the J.P. Morgan EMBISM Global Core Index. EMB has been categorized in the emerging markets asset class.
• iShares® U.S. Real Estate ETF (IYR) — IYR seeks investment results that correspond generally to the price and yield performance, before fees and expenses, of the real estate sector of the U.S. equity market, as represented by the Dow Jones U.S. Real Estate Index. The Dow Jones U.S. Real Estate Index is designed to represent Real Estate Investment Trusts (REITs) and other companies that invest directly or indirectly in real estate through development, management or ownership, including property agencies. IYR has been categorized in the alternatives asset class.
• Alerian MLP ETF (AMLP) — AMLP seeks investment results that corresponds generally to the price and yield performance, before fees and expenses, of energy infrastructure Master Limited Partnerships, as measured by the Alerian MLP Infrastructure Index. AMLP has been categorized in the alternatives asset class.
• PowerShares® Senior Loan Portfolio (BKLN) — BKLN seeks investment results that correspond generally to the price and yield performance, before fees and expenses, of large institutional leveraged loans, as measured by the S&P/LSTA U.S. Leveraged Loan 100 Index. BKLN has been categorized in the alternatives asset class.
• PowerShares® DB Commodity Index Tracking Fund (DBC) — DBC seeks investment results that correspond generally to the price and yield performance, before fees and expenses, of 14 of the most heavily traded physical commodities, as measured by the DBIQ Optimum Yield Diversified Commodity Index Excess ReturnTM. DBC has been categorized in the commodities asset class.
• SPDR® Gold Trust (GLD) — GLD seeks investment results that correspond generally to the price and yield performance, before fees and expenses, of gold bullion held by the SPDR® Gold Trust. GLD has been categorized in the commodities asset class.
• iShares® TIPS Bond ETF (TIP) — TIP seeks investment results that correspond generally to the price and yield performance, before fees and expenses, of inflation-protected public obligations of the U.S. Treasury that have at least one year remaining to maturity, are rated investment grade and have $250 million or more of outstanding face value, as measured by the Barclays U.S. Treasury Inflation Protected Securities (TIPS) Index (Series-L). TIP has been categorized in the short-term U.S. treasury bills and inflation asset class.
In addition to the above referenced ETFs, the eligible underlying assets also include the money market position. The money market position is included in the cash equivalent asset class and reflects the notional returns accruing to a
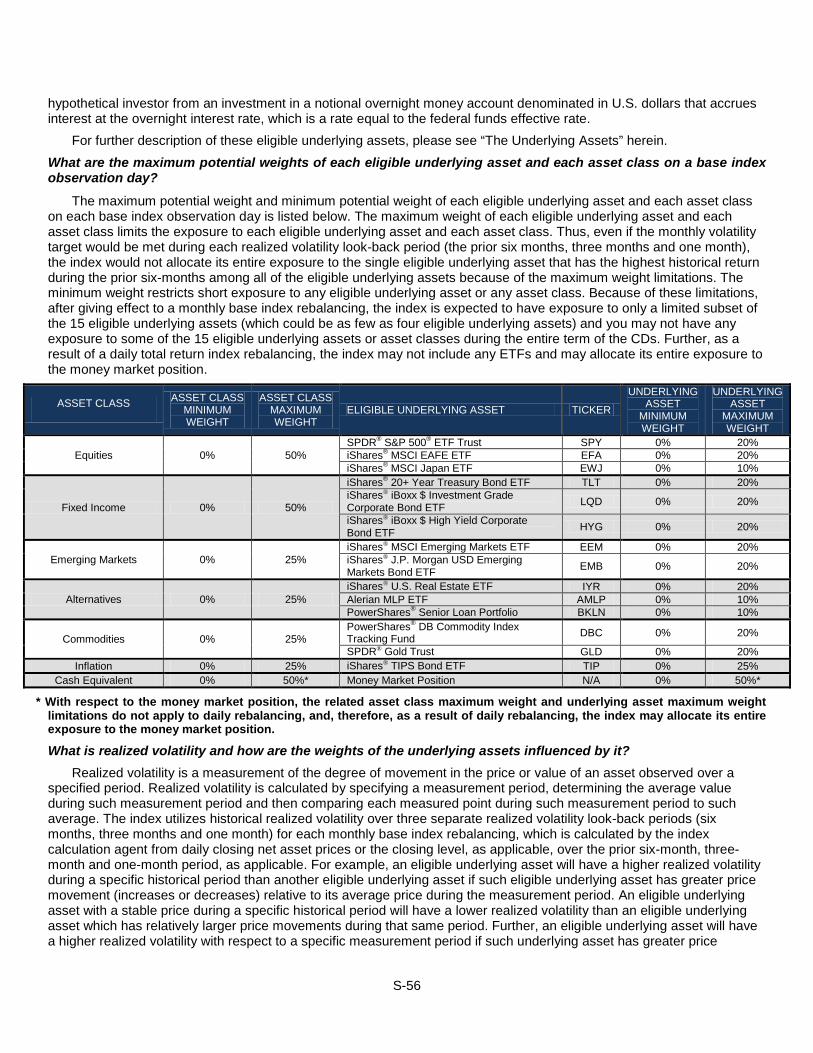
S-56
hypothetical investor from an investment in a notional overnight money account denominated in U.S. dollars that accrues interest at the overnight interest rate, which is a rate equal to the federal funds effective rate.
For further description of these eligible underlying assets, please see “The Underlying Assets” herein. What are the maximum potential weights of each eligible underlying asset and each asset class on a base index observation day?
The maximum potential weight and minimum potential weight of each eligible underlying asset and each asset class on each base index observation day is listed below. The maximum weight of each eligible underlying asset and each asset class limits the exposure to each eligible underlying asset and each asset class. Thus, even if the monthly volatility target would be met during each realized volatility look-back period (the prior six months, three months and one month), the index would not allocate its entire exposure to the single eligible underlying asset that has the highest historical return during the prior six-months among all of the eligible underlying assets because of the maximum weight limitations. The minimum weight restricts short exposure to any eligible underlying asset or any asset class. Because of these limitations, after giving effect to a monthly base index rebalancing, the index is expected to have exposure to only a limited subset of the 15 eligible underlying assets (which could be as few as four eligible underlying assets) and you may not have any exposure to some of the 15 eligible underlying assets or asset classes during the entire term of the CDs. Further, as a result of a daily total return index rebalancing, the index may not include any ETFs and may allocate its entire exposure to the money market position.
ASSET CLASS ASSET CLASS MINIMUM WEIGHT
ASSET CLASS MAXIMUM WEIGHT
ELIGIBLE UNDERLYING ASSET TICKER
UNDERLYING ASSET
MINIMUM WEIGHT
UNDERLYING ASSET
MAXIMUM WEIGHT
Equities 0% 50% SPDR® S&P 500® ETF Trust SPY 0% 20% iShares® MSCI EAFE ETF EFA 0% 20% iShares® MSCI Japan ETF EWJ 0% 10%
Fixed Income 0% 50%
iShares® 20+ Year Treasury Bond ETF TLT 0% 20% iShares® iBoxx $ Investment Grade Corporate Bond ETF LQD 0% 20%
iShares® iBoxx $ High Yield Corporate Bond ETF HYG 0% 20%
Emerging Markets 0% 25% iShares® MSCI Emerging Markets ETF EEM 0% 20% iShares® J.P. Morgan USD Emerging Markets Bond ETF EMB 0% 20%
Alternatives 0% 25% iShares® U.S. Real Estate ETF IYR 0% 20% Alerian MLP ETF AMLP 0% 10% PowerShares® Senior Loan Portfolio BKLN 0% 10%
Commodities 0% 25% PowerShares® DB Commodity Index Tracking Fund DBC 0% 20%
SPDR® Gold Trust GLD 0% 20% Inflation 0% 25% iShares® TIPS Bond ETF TIP 0% 25%
Cash Equivalent 0% 50%* Money Market Position N/A 0% 50%*
* With respect to the money market position, the related asset class maximum weight and underlying asset maximum weight limitations do not apply to daily rebalancing, and, therefore, as a result of daily rebalancing, the index may allocate its entire exposure to the money market position.
What is realized volatility and how are the weights of the underlying assets influenced by it? Realized volatility is a measurement of the degree of movement in the price or value of an asset observed over a
specified period. Realized volatility is calculated by specifying a measurement period, determining the average value during such measurement period and then comparing each measured point during such measurement period to such average. The index utilizes historical realized volatility over three separate realized volatility look-back periods (six months, three months and one month) for each monthly base index rebalancing, which is calculated by the index calculation agent from daily closing net asset prices or the closing level, as applicable, over the prior six-month, three-month and one-month period, as applicable. For example, an eligible underlying asset will have a higher realized volatility during a specific historical period than another eligible underlying asset if such eligible underlying asset has greater price movement (increases or decreases) relative to its average price during the measurement period. An eligible underlying asset with a stable price during a specific historical period will have a lower realized volatility than an eligible underlying asset which has relatively larger price movements during that same period. Further, an eligible underlying asset will have a higher realized volatility with respect to a specific measurement period if such underlying asset has greater price

S-57
movements (increases and decreases) in such measurement period as compared to the price movements of the same underlying asset in a different measurement period.
In choosing the weights for the index underlying assets for any month, the monthly volatility target limits the overall level of realized volatility that may be reflected by the index underlying assets. Since the monthly volatility target limits the base index as a whole, when creating the three potential portfolios the realized volatility of each eligible underlying asset for the applicable look-back period needs to be compared relative to the realized volatilities of the remaining eligible underlying assets for the same look-back period. An eligible underlying asset may have a relatively high six-month historical return relative to other eligible underlying assets, but may be excluded from inclusion as an index underlying asset for a given month (or may be assigned a weight below its maximum weight) because that eligible underlying asset has a high realized volatility in a particular look-back period relative to other eligible underlying assets. However, because the weight of each underlying asset for each monthly rebalancing will equal the average of the weights of such underlying asset across three potential portfolios (one for each realized volatility look-back period), the impact of a low realized volatility for one look-back period may be lessened by a higher realized volatility for a different look-back period. In addition, an eligible underlying asset with a relatively high realized volatility may be included as an index underlying asset because its realized volatility is offset by another eligible underlying asset that is also included as an index underlying asset. Because the historical returns and realized volatility are measured on an aggregate basis within each potential portfolio, highly correlated eligible underlying assets may be excluded from a potential portfolio, in whole or in part, on a base index observation day. Such highly correlated eligible underlying assets may be excluded even if, on an independent basis, such eligible underlying assets have a relatively high six-month historical return or relatively low realized volatility for the applicable look-back period. Since realized volatility is based on historical data, there is no assurance that the historical level of volatility of an index underlying asset included in the index in a monthly rebalancing will continue during such month.
The look-back period relevant for calculating the six-month historical return and six-, three- or one-month historical realized volatility of each combination of eligible underlying assets is the period beginning on (and including) the day that is six, three or one calendar months (or, if any such day is not an index business day, the preceding index business day), as applicable, before the second index business day immediately preceding such base index observation day to (and including) the third index business day prior to the given index business day.
With respect to each potential portfolio, if at a base index observation day no combination of eligible underlying assets complies with the monthly volatility target, asset class maximum weights and underlying asset maximum weights, then such portfolio will select, from all combinations of eligible underlying assets that comply with the asset class maximum weights and the underlying asset maximum weights, the combination with the lowest historical realized volatility for the realized volatility look-back period applicable to such potential portfolio, regardless of that combination’s six-month performance. The particular combination so selected will exceed the monthly volatility target. How do the weights of the index underlying assets change as a result of a daily total return index rebalancing?
The index calculation agent calculates the historical realized volatility of the base index for the applicable volatility cap period, which is the prior one month as determined below. As long as, on any given daily total return index rebalancing day, the calculated one-month realized volatility of the base index for the applicable volatility cap period is equal to or less than the volatility cap, no change to the then-current weights of the index underlying assets is made on that daily total return index rebalancing day. However, if on any given daily total return index rebalancing day the calculated volatility of the base index for the volatility cap period exceeds the volatility cap of 6%, the exposure of the index is partially rebalanced into the money market position to reduce the historical realized volatility for such volatility cap period. This is achieved by partially rebalancing, to the money market position, the exposure of the total return index to the base index through a reduction of the base index weight to the percentage that is equal to the volatility cap divided by such calculated volatility. As a result of a daily total return index rebalancing, the index may not include any ETFs (e.g., if the base index weight is reduced to zero) and may allocate its entire exposure to the money market position.
With respect to any given daily total return index rebalancing day, the volatility cap period is the period beginning on (and including) the day which is one calendar month (or, if any such date is not an index business day, the preceding index business day) before the second index business day prior to the given daily total return index rebalancing day to (and including) the third index business day prior to the given daily total return index rebalancing day. The volatility cap period with respect to any given total return index rebalancing day will not be affected by any postponement of such total return index rebalancing day by the index calculation agent, and the exposure to the base index will be calculated on the postponed total return index rebalancing day as though such total return index rebalancing day had not been postponed.

S-58
Examples of hypothetical daily total return index rebalancing
The following table displays hypothetical one-month realized volatility for the base index and the percent weighting of the base index for purposes of calculating the total return index value as a result of hypothetical daily rebalancing in different situations. You should note that the base index itself may contain exposure to the money market position which would be in addition to any exposure to the money market position that the index reflects as a result of a daily rebalancing. For purposes of highlighting the effect of a daily rebalancing, the table assumes that the base index itself did not contain exposure to the money market position as a result of a monthly base index rebalancing. This information is intended to illustrate the operation of the index on each daily total return index rebalancing day and is not indicative of how the index may perform in the future.
Day 1 2 3 4 5 6 7 8 9 10
Historical One-Month Realized Volatility of the Base Index
3.0 4.9 6.1 5.3 6.2 5.6 8.5 6.0 7.4 3.9
Weight of Base Index For Purposes of Calculating the Total Return Index Value
100.00% 100.00% 98.36% 100.00% 96.77% 100.00% 70.59% 100.00% 81.08% 100.00%
Weight of Money Market Position
0.00% 0.00% 1.64% 0.00% 3.23% 0.00% 29.41% 0.00% 18.92% 0.00%
On days 1, 2, 4, 6, 8 and 10 the historical realized volatility of the base index for the applicable volatility cap period is equal to or less than the volatility cap, so the index did not ratably rebalance into the money market position on such daily total return index rebalancing day.
On days 3, 5, 7 and 9, because the historical realized volatility of the base index for the applicable volatility cap period is greater than the volatility cap, then the weight allocated to the base index for such daily total return index rebalancing day is ratably rebalanced into the money market position. Please see “Underlying Asset Weightings” below for data regarding the frequency of daily rebalancing. What is the money market position?
The money market position is a hypothetical investment intended to express the notional returns accruing to a hypothetical investor from an investment in a notional overnight money account denominated in U.S. dollars that accrues interest at the overnight interest rate, which is a rate equal to the federal funds effective rate. Allocation of the index to the money market position is intended to reduce the volatility of the index.
The index will provide exposure to the money market position (1) if on a monthly base index observation day the money market position has a relatively high performance compared to the other eligible underlying assets in a potential portfolio and/or, with respect to a realized volatility look-back period, such index underlying asset has a comparatively low realized volatility compared to the other eligible index underlying assets and is used to reduce the realized volatility of the index underlying assets in a potential portfolio on an aggregate basis and/or (2) on any index business day, if the realized

S-59
volatility of the index underlying assets for the applicable volatility cap period is higher than the volatility cap, resulting in a daily total return index rebalancing. Can the eligible underlying assets change?
The eligible underlying assets are not expected to change. However, the index committee may eliminate an eligible ETF and/or designate a successor eligible ETF if for any reason any of the following events occur with respect to such ETF:
• the ETF ceases to exist, is delisted, terminated, wound up, liquidated or files for bankruptcy, is combined with another ETF that has a different investment objective, or changes its currency of denomination;
• the ETF suspends creations or redemptions for five consecutive index business days or announces a suspension of unlimited duration for such creations or redemptions;
• the net asset value of the ETF is not calculated or is not announced by either the ETF or its sponsor for five consecutive index business days, or an index market disruption event occurs and is continuing for five consecutive index business days;
• the average daily trading volume in the preceding three calendar months of the ETF is less than $1 million (where average daily trading volume is measured by summing the value of all reported transactions in such ETF for each trading day during the preceding three full calendar months, and dividing this sum by the total number of such trading days) or the net asset value of such ETF is below $250 million (where net asset value is measured as the value of an entity’s assets less the value of its liabilities as publicly disclosed by this ETF or its sponsor);
• the sponsor or investment adviser of the ETF files for bankruptcy and there is no solvent immediate successor;
• limitations on ownership are imposed on the ETF due to a change in law or regulation, loss of regulatory exemptive relief or otherwise, and the index committee, in its sole discretion, determines that such limitations materially adversely affect the ability of holders of such ETF to hold, acquire or dispose of shares of such ETF;
• the tax treatment of the ETF changes in a way that would have an adverse effect on holders of shares of such ETF;
• the index committee, in its sole discretion, determines that the ETF has changed the index underlying or otherwise referenced by such ETF to an index that is materially different, or the methodology for the index is materially modified (other than a modification in the ordinary course of administration of the index underlying or otherwise referenced by such ETF);
• the index underlying or otherwise referenced by the ETF is no longer compiled, or the closing level of such index is not calculated or published for five consecutive index business days; or
• the index sponsor determines in its sole discretion that it is not practicable for the ETF to continue to be included in the index for any reason, including due to: a) a dispute as to whether a license is required to use the ETF or the related index, or b) to the extent there is an agreement in place governing such use, changes in the terms upon which the
ETF or related index is made available to the index sponsor for inclusion in the index that the index sponsor, in its sole discretion, determines to be materially adverse to it.
Any successor eligible underlying asset shall be the underlying asset, in the determination of the index committee, that most closely replicates the affected eligible underlying asset without triggering any of the events listed above. Such deletions and additions may be undertaken during a base index rebalancing period or in between base index rebalancing periods. Could index market disruption events or corporate events impact the calculation of the index or the implementation of a monthly base index rebalancing or a daily total return index rebalancing by the index calculation agent?
If a monthly base index rebalancing day or a daily total return index rebalancing day must be effected on an index business day on which an index market disruption event (as defined below) occurs or is continuing with respect to any index underlying asset, the index calculation agent will postpone such monthly base index rebalancing day or total return index rebalancing day until the next index business day on which no index market disruption event occurs or is continuing with respect to any index underlying asset. The index calculation agent shall then rebalance the index as if (i) for each

S-60
index underlying asset that had not been affected by an index market disruption event as if the monthly base index rebalancing day (if applicable) or the daily total return index rebalancing day, respectively, occurred on the first day on which such index market disruption event occurred and (ii) for each index underlying asset that had been affected by such index market disruption event as if such monthly base index rebalancing day (if applicable) or such daily total return index rebalancing day, respectively, occurred on the first day on which there was no index market disruption event occurring or continuing. Consequently, if, for example, an index market disruption event were to occur on a base index rebalancing day with respect to only one of the index underlying assets and on the following index business day such index market disruption event was no longer continuing and no new index market disruption event were to occur, then on the base index rebalancing day on which the index market disruption event occurred the weight of all index underlying assets not affected by the index market disruption event would be determined and on such following index business day the weight of the affected index underlying asset would be determined. As a result, the weight of an index underlying asset affected by an index market disruption event could be temporarily underrepresented or overrepresented in the base index.
On the sixth index business day following the occurrence of an index market disruption event with respect to any index underlying asset, if such index market disruption event is continuing, the index committee may instruct the index calculation agent to rebalance the index using a specified price. In the event the index committee determines on such sixth index business day, in its sole discretion, that no such instructions should be given to the index calculation agent, the index committee may revisit such determination on any index business day thereafter on which the index market disruption event is continuing. Notwithstanding the foregoing, in the event of a force majeure event (as defined below) in which all of the index underlying assets are affected, the calculation and publication of the index shall be postponed until, in the determination of the index calculation agent, such force majeure event has been resolved.
An “index market disruption event” with respect to an eligible ETF will have occurred in any of the following situations: (i) upon the occurrence or existence of a trading disruption (as defined below) or an exchange disruption (as defined below), in either case for more than two hours of trading or at any time during the one-hour period that ends at the scheduled closing time of the exchange (as defined below), and which the index calculation agent determines is material, (ii) upon the occurrence or existence of an early closure (as defined below), (iii) the net asset value per share of such ETF is not calculated or is not announced by the eligible ETF or the sponsor of such ETF, (iv) the eligible ETF or the relevant sponsor of any eligible ETF suspends creations or redemptions of shares of such ETF, (v) upon the occurrence or existence of an index dislocation or (vi) upon the occurrence or existence of a force majeure event.
A “trading disruption” means any suspension of or limitation imposed on trading by the exchange or related exchange (as defined below), and whether by reason of movements in price exceeding limits permitted by the exchange or otherwise, relating to the eligible ETF shares, related index or futures or options on the eligible ETF shares or underlying index.
An “exchange disruption” means any event that disrupts or impairs (as determined by the index calculation agent in its sole discretion) the ability of market participants in general to effect transactions in, or obtain market values for, the shares of the ETF on the exchange or futures or options on the ETF shares or underlying index, in each case on the relevant related exchange.
An “early closure” means the closure of the exchange or relevant related exchange on any business day of that exchange prior to its scheduled closing time unless such earlier closing time is announced by such exchange prior to the close of trading on the first index business day immediately preceding such date.
An “exchange” means the primary exchange on which shares of an eligible ETF are listed. A “related exchange” means, in respect of an eligible ETF or underlying index, as the case may be, the primary
exchange (or exchanges) or quotation system (or quotation systems) on which futures or options contracts relating to such eligible ETF or underlying index, as the case may be, are traded, if any.
An “index dislocation” means the index calculation agent determines that a market participant, as a result of a market-wide condition relating to the index or any eligible ETF, would (i) be unable, after using commercially reasonable efforts, to acquire, establish, re-establish, substitute, maintain, unwind, or dispose of all or a material portion of any hedge position relating to the index or an eligible ETF or (ii) incur a materially increased cost in doing so, including due to any capital requirements or other law or regulation.
A “force majeure event” will have occurred if the index calculation agent determines that there has been the occurrence of a systems failure, natural or man-made disaster, act of God, armed conflict, act of terrorism, riot or labor disruption or any similar intervening circumstance that is beyond the reasonable control of the index sponsor, index

S-61
calculation agent or any of their respective affiliates that the index calculation agent determines is likely to have a material effect on an eligible ETF, or on its ability to perform its role in respect of the index.
In the event that an index ETF is affected by a potential adjustment event, the index committee may make adjustments to the level of such index ETF and/or the weighting of the index underlying assets. Any of the following will be a potential adjustment event with respect to an index ETF:
Potential Adjustment Event Adjustment Adjustment Description
Cash Dividends Yes The dividend is reinvested in that index ETF.
Special / Extraordinary Dividends Yes The dividend is reinvested in that index ETF.
Return of Capital Yes The capital is reinvested in that index ETF.
Stock Dividend Yes Where shareholders receive “B” new shares for every “A” share held, the number of shares is adjusted by multiplying the original number of shares by the quotient of (a) the sum of A and B divided by (b) A.
Stock Split Yes Where shareholders receive “B” new shares for every “A” share held, the number of shares is adjusted by multiplying the original number of shares by the quotient of B divided by A.
Potential adjustment events also include any other event that could have a diluting or concentrative effect on the theoretical value of the index ETF shares and would not otherwise be accounted for in the index. The index calculation agent may make adjustments in such cases.
If the index calculation agent determines that the price made available for an index ETF by the exchange reflects a manifest error, the calculation of the index where the index ETF has a non-zero weighting shall be delayed until such time as a corrected price is made available. In the event a corrected price is not made available on a timely basis, the index calculation agent may determine an appropriate price and disclose on its website its determination and the basis therefor. In the event an exchange corrects prices previously provided, the index calculation agent shall recalculate index levels using the corrected information and disclose on its website that it has substituted updated versions of index levels as a result. This convention, however, will not change the starting index value for the CDs. However, the CD calculation agent may adjust the method of calculation of the level of the index to ensure that the level of the index used to determine the amount payable on the stated maturity date is equitable. See “Specific Terms of Your Certificates of Deposit—Discontinuance or Modification of the Index” above. What is the historical performance of the index?
The closing level of the index has fluctuated in the past and may, in the future, experience significant fluctuations. Any upward or downward trend in the historical or hypothetical closing level of the index during any period shown below is not an indication that the index is more or less likely to increase or decrease at any time during the life of your CDs.
You should not take the historical index performance information or hypothetical performance data of the index as an indication of the future performance of the index. We cannot give you any assurance that the future performance of the index, the index underlying assets, the notional interest rate or the overnight interest rate will result in receiving an amount greater than the outstanding face amount of your CDs on the stated maturity date. In light of the increased volatility currently being experienced by U.S. and global securities markets and recent market declines, the trend reflected in the historical index performance information and hypothetical performance data may be less likely to be

S-62
indicative of the performance of the index during the period from the trade date to the determination date than would otherwise have been the case.
Neither we nor any of our affiliates make any representation to you as to the performance of the index. Before investing in the offered CDs, you should consult publicly available information to determine the relevant index levels between the date of this disclosure statement supplement and the date of your purchase of the offered CDs. The actual performance of the index over the life of the offered CDs, as well as the payment amount at maturity, may bear little relation to the historical index performance information or hypothetical performance data shown below.
Daily Closing Levels of the Index
The following graph shows the daily closing levels of the index from December 3, 2007 to May 30, 2014. Since the index was launched on December 17, 2013 and has a limited operating history, the graph includes hypothetical performance data for the index prior to its launch on December 17, 2013.
The historical closing levels from December 17, 2013 (the index launch date) to May 30, 2014 were obtained from Bloomberg Financial Services and Solactive AG, without independent verification. (In the graph, historical closing levels can be found to the right of the vertical solid line marker.) You should not take the historical index performance information as an indication of the future performance of the index.
The hypothetical performance data from March 3, 2011 to December 16, 2013 is based on the historical levels of the eligible underlying assets using the same methodology that is used to calculate the index. The hypothetical performance data for the period from December 3, 2007 through March 2, 2011 was calculated using the same methodology that is used to calculate the index, provided that a proxy was used for the following eligible ETFs, in each case for the period of time such eligible ETF was not in existence: iShares® J.P. Morgan USD Emerging Markets Bond ETF (not in existence prior to December 19, 2007), Alerian MLP ETF (not in existence prior to August 25, 2010) and PowerShares® Senior Loan Portfolio (not in existence prior to March 3, 2011). As a result, due to the varying weights of the eligible ETFs and proxies, at any time during this period as much as 100% of the hypothetical index performance data was derived from proxy data. Information regarding such proxies is available upon request. Each proxy had at least an 80% correlation to the related eligible ETF during the period beginning after the eligible ETF became available, after deducting from the proxy’s performance a fee equal to the management fee charged by the applicable eligible ETF or the difference between the management fee charged by such proxy and the management fee charged by the applicable eligible ETF, as applicable. Therefore, the use of proxies for eligible ETFs that were not in existence during some or all of the period from December 3, 2007 through March 2, 2011 may have resulted in hypothetical performance data that overstates or understates how the index would have performed, and the extent to which the daily volatility control would or would not have been triggered, had no proxy information been required.
The hypothetical performance data prior to the launch of the index on December 17, 2013 refers to simulated performance data created by applying the index's calculation methodology to historical prices of the underlying assets that comprise the index (including proxies when applicable). Such simulated performance data has been produced by the retroactive application of a back-tested methodology, and may reflect a bias towards underlying assets or related indices that have performed well in the past. No future performance of the index can be predicted based on the simulated performance described herein. You should not take the hypothetical performance data as an indication of the future performance of the index.

S-63
Underlying Asset Weightings
As of the latest base index observation day on May 1, 2014, the following chart sets forth the target weighting of each eligible underlying asset and the hypothetical and historical average percentage weightings of the eligible underlying assets, the highest percentage weightings of the eligible underlying assets and the percentage of base index observation days with positive weightings for the eligible underlying assets from December 3, 2007 to May 1, 2014 (the period for which eligible underlying assets or proxy information is available). This data reflects the same historical information and hypothetical data and use of proxies as in the previous tables. You should not take the historical information or hypothetical data as an indication of the future performance of the index.
Eligible Underlying Asset Target
Weighting (as of May 1,
2014)*
Average Weighting
Highest Weighting
Percentage of Index
Observation Days When Underlying
Asset is Included as
an Index Underlying
Asset SPDR® S&P 500® ETF Trust 20.00% 6.77% 20.10% 53.85%
iShares® MSCI Japan ETF 0.00% 1.14% 10.10% 24.36%
iShares® MSCI EAFE ETF 4.20% 2.84% 20.10% 26.92%
iShares® 20+ Year Treasury Bond ETF 20.00% 8.80% 20.10% 62.82%
iShares® iBoxx $ Investment Grade Corporate Bond ETF
20.00% 9.68% 20.00% 70.51%
iShares® iBoxx $ High Yield Corporate Bond ETF
10.00% 7.98% 20.00% 67.95%
iShares® MSCI Emerging Markets ETF
0.00% 0.80% 8.50% 25.64%
iShares® J.P. Morgan USD Emerging Markets Bond ETF
0.80% 9.92% 20.00% 74.36%
iShares® U.S. Real Estate ETF 6.70% 4.20% 10.00% 58.97%
Alerian MLP ETF 18.30% 4.94% 20.10% 65.38% PowerShares® Senior Loan Portfolio 0.00% 5.43% 10.00% 74.36%
PowerShares® DB Commodity Index Tracking Fund
0.00% 2.72% 19.20% 33.33%
SPDR® Gold Trust 0.00% 4.36% 20.00% 60.26% iShares® TIPS Bond ETF 0.00% 11.38% 25.00% 83.33%
Money Market Position 0.00% 19.03% 59.30% 65.38%
*Current weighting information is updated from time to time by Solactive AG, the index calculation agent, at http://www.solactive.com/indexing-en/indices/complex/. We are not incorporating by reference the website or any material it includes in this disclosure statement supplement.
The following chart and table provide a comparison between the index (using historical information and hypothetical data, as explained below) and certain classes of assets (in each case, represented by a benchmark ETF or a benchmark index, which are distinct from the asset classes in which the 15 underlying assets have been categorized for purposes of this index) from December 3, 2007 to May 27, 2014. Benchmark ETF data and benchmark index data is based on the historical levels of the benchmark ETFs and benchmark indices, respectively. The historical index information from

S-64
December 17, 2013 (the index launch date) to May 27, 2014 reflects the actual performance of the index. (In the chart, this historical index information can be found to the right of the vertical solid line marker.) The hypothetical index data from March 3, 2011 to December 16, 2013 is based on the historical levels of the eligible underlying assets, using the same methodology that is used to calculate the index. Hypothetical index data for the period from December 3, 2007 through March 2, 2011 was calculated using the same methodology that is used to calculate the index, provided that a proxy was used for the following eligible ETFs, in each case for the period of time that such eligible ETF was not in existence: iShares® J.P. Morgan USD Emerging Markets Bond ETF (not in existence prior to December 19, 2007), Alerian MLP ETF (not in existence prior to August 25, 2010) and PowerShares® Senior Loan Portfolio (not in existence prior to March 3, 2011). As a result, due to the varying weights of the eligible ETFs and proxies, at any time during this period as much as 100% of the hypothetical index performance data was derived from proxy data. Please note that the benchmark ETFs and benchmark indices that are used to represent asset classes for purposes of the following table and chart may not be eligible underlying assets for purposes of the index and in some cases differ from the eligible underlying assets that are used to represent classes of assets with the same or similar titles for purposes of the index. You should not take the historical index information, hypothetical index data or historical benchmark ETF and benchmark index data as an indication of the future performance of the index.
Performance Since December 2007
As of 5/27/2014
GS Momentum
Builder® Multi Asset 5 ER
Index (GSMBMA5)
US Bonds (AGG)
Global Equities (MSCI ACWI
Excess Return Index)
Commodities (S&P GSCI
Excess Return Index)
US Real Estate (IYR)
Effective Performance (1 Month) 1.93% 1.06% 2.02% -0.26% 3.03% Effective Performance (6 Month) 4.97% 2.88% 5.59% 6.42% 15.68% Annualized* Performance (since December 2007) 6.32% 4.04% 2.29% -5.52% 4.53% Annualized* Realized Volatility (since December 2007)** 5.14% 5.97% 19.92% 25.16% 39.70%
Return over Risk (since December 2007)*** 1.23 0.68 0.12 -0.22 0.11 Maximum Peak-to-Trough Drawdown**** -11.04% -13.19% -58.27% -71.59% -68.32%
* Calculated on a per annum percentage basis. ** Calculated on the same basis as realized volatility used in calculating the index. *** Calculated by dividing the annualized performance by the annualized realized volatility since December 3, 2007. **** The largest percentage decline experienced in the relevant measure from a previously occurring maximum level.
The following chart sets forth the monthly allocation on each base index observation day between each asset class
from December 3, 2007 to May 1, 2014, with each bar representing a month, using the historical index information and hypothetical index data previously supplied above. (In the chart, this historical information can be found to the right of the
0
20
40
60
80
100
120
140
160
GS Momentum Builder® Multi Asset 5 ER Index (GSMBMA5) US Bonds (AGG)
Global Equities (MSCI ACWI Excess Return Index) Commodities (S&P GSCI Excess Return Index)
US Real Estate (IYR)

S-65
vertical solid line marker.) You should not take the historical information or hypothetical data as an indication of the future performance of the index.
The following chart sets forth the number of index underlying assets included in the index on each monthly base index
observation day during the period from December 3, 2007 to May 1, 2014 based on the historical index information and hypothetical index data previously supplied above. You should not take the historical information or hypothetical data as an indication of the future performance of the index.
Number of Index Underlying
Assets Number of
Months
Percent of Months Included
(Out of 77 Months)
0 0 0.00% 1 0 0.00% 2 0 0.00% 3 0 0.00% 4 1 1.28% 5 2 2.56% 6 6 7.69% 7 16 20.51% 8 12 15.38% 9 24 30.77% 10 6 7.69% 11 or more 11 14.10%
The following chart sets forth the percentage of monthly base index observation days during the period from December 3, 2007 to May 1, 2014 on which the asset class maximum weight restrictions reduced the weighting of one or more index underlying assets or prevented one or more eligible underlying assets from becoming an index underlying asset. These percentages are based on the historical index information and hypothetical index data previously supplied above. You should not take the historical information or hypothetical data as an indication of the future performance of the index.
0.00%
10.00%
20.00%
30.00%
40.00%
50.00%
60.00%
70.00%
80.00%
90.00%
100.00%
Dec-07 Jun-08 Dec-08 Jun-09 Dec-09 Jun-10 Dec-10 Jun-11 Dec-11 Jun-12 Dec-12 Jun-13 Dec-13
Cash Equivalent
Inflation
Commodities
Alternatives
Emerging Markets
Fixed Income
Equities
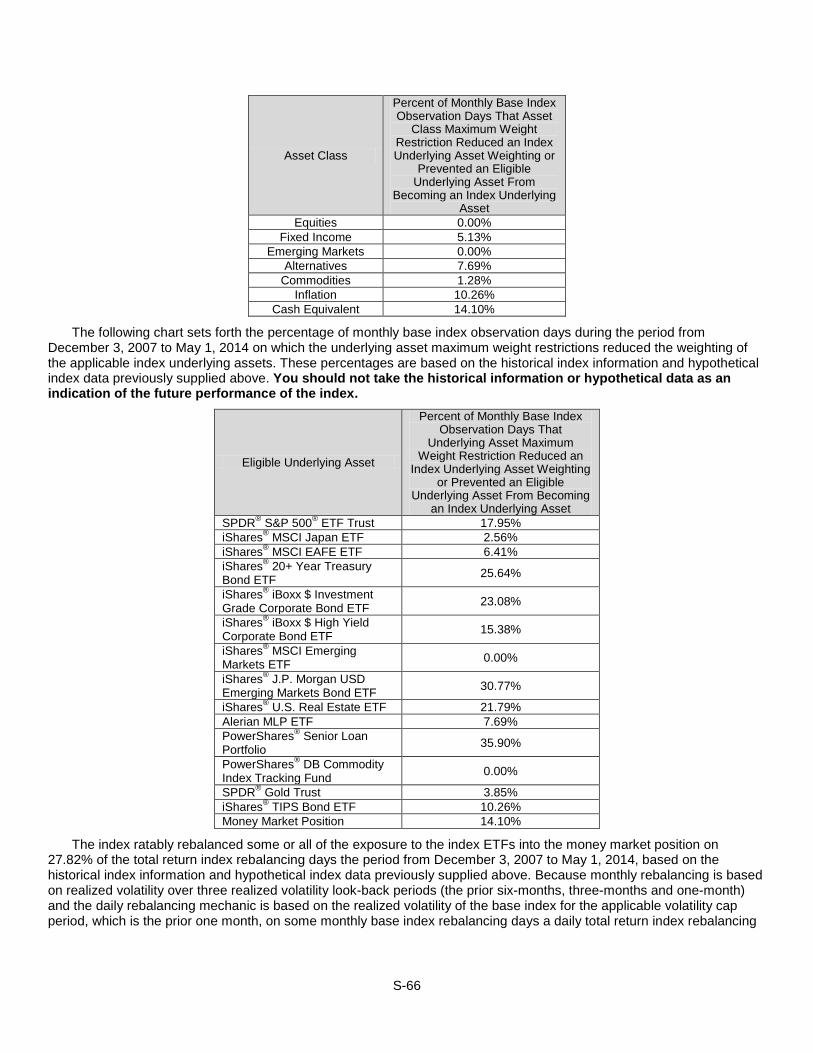
S-66
Asset Class
Percent of Monthly Base Index Observation Days That Asset
Class Maximum Weight Restriction Reduced an Index Underlying Asset Weighting or
Prevented an Eligible Underlying Asset From
Becoming an Index Underlying Asset
Equities 0.00% Fixed Income 5.13%
Emerging Markets 0.00% Alternatives 7.69%
Commodities 1.28% Inflation 10.26%
Cash Equivalent 14.10%
The following chart sets forth the percentage of monthly base index observation days during the period from December 3, 2007 to May 1, 2014 on which the underlying asset maximum weight restrictions reduced the weighting of the applicable index underlying assets. These percentages are based on the historical index information and hypothetical index data previously supplied above. You should not take the historical information or hypothetical data as an indication of the future performance of the index.
Eligible Underlying Asset
Percent of Monthly Base Index Observation Days That
Underlying Asset Maximum Weight Restriction Reduced an
Index Underlying Asset Weighting or Prevented an Eligible
Underlying Asset From Becoming an Index Underlying Asset
SPDR® S&P 500® ETF Trust 17.95% iShares® MSCI Japan ETF 2.56% iShares® MSCI EAFE ETF 6.41% iShares® 20+ Year Treasury Bond ETF 25.64%
iShares® iBoxx $ Investment Grade Corporate Bond ETF 23.08%
iShares® iBoxx $ High Yield Corporate Bond ETF 15.38%
iShares® MSCI Emerging Markets ETF 0.00%
iShares® J.P. Morgan USD Emerging Markets Bond ETF 30.77%
iShares® U.S. Real Estate ETF 21.79% Alerian MLP ETF 7.69% PowerShares® Senior Loan Portfolio 35.90%
PowerShares® DB Commodity Index Tracking Fund 0.00%
SPDR® Gold Trust 3.85% iShares® TIPS Bond ETF 10.26% Money Market Position 14.10%
The index ratably rebalanced some or all of the exposure to the index ETFs into the money market position on 27.82% of the total return index rebalancing days the period from December 3, 2007 to May 1, 2014, based on the historical index information and hypothetical index data previously supplied above. Because monthly rebalancing is based on realized volatility over three realized volatility look-back periods (the prior six-months, three-months and one-month) and the daily rebalancing mechanic is based on the realized volatility of the base index for the applicable volatility cap period, which is the prior one month, on some monthly base index rebalancing days a daily total return index rebalancing

S-67
also occurred. You should not take the historical information or hypothetical data as an indication of the future performance of the index.
The following chart displays the percentage of index exposure to the index underlying assets during the period from December 3, 2007 to May 1, 2014 based on the historical index information and hypothetical index data previously supplied above. (In the chart, this historical information can be found to the right of the vertical solid line marker.) A percentage less than 100% means that a daily rebalancing has occurred, reducing exposure in the existing ETFs and increasing exposure to the money market position. You should not take the historical information or hypothetical data as an indication of the future performance of the index.
Rebalancing and Performance Illustration In order to illustrate how the monthly rebalancing operates, we have provided below a table that shows data related to
the base index observation days that occurred in April 2011 and November 2012. This data reflects the same historical information and hypothetical data and use of proxies as in the previous tables. The table includes the 6-month historical returns and the 6-month realized volatility, the 3-month realized volatility and the one-month realized volatility for each eligible underlying asset and the weights that they were assigned on the base index observation day occurring in April 2011 and November 2012 based on the average of the weight of each underlying asset in each of the three potential portfolios of ETFs (one for each realized volatility look-back period). We have also provided the monthly returns for each eligible ETF for the April 2011 and November 2012 periods. You should not take the historical information or hypothetical data as an indication of the future performance of the index.
0.00%
10.00%
20.00%
30.00%
40.00%
50.00%
60.00%
70.00%
80.00%
90.00%
100.00%
Dec-07 Jun-08 Dec-08 Jun-09 Dec-09 Jun-10 Dec-10 Jun-11 Dec-11 Jun-12 Dec-12 Jun-13 Dec-13
% Invested in Underlying Assets Selected on Previous Monthly Rebalancing

S-68
April 2011 Rebalancing
Eligible Underlying Assets 6-Month Historical
Return
6-Month Realized Volatility
3-Month Realized Volatility
1-Month Realized Volatility
Weighting at Rebalancing
Monthly Return for Period after Rebalancing
SPDR® S&P 500® ETF Trust 16.15% 12.22% 12.76% 15.92% 14.50% 1.92% iShares® MSCI Japan ETF 5.16% 21.50% 25.22% 36.39% 0.00% 2.43% iShares® MSCI EAFE ETF 9.14% 18.67% 18.80% 23.81% 0.00% 4.45% iShares® 20+ Year Treasury Bond ETF -10.83% 15.67% 13.43% 12.76% 0.00% 2.58%
iShares® iBoxx $ Investment Grade Corporate Bond ETF -1.63% 6.42% 5.29% 5.25% 0.00% 2.21%
iShares® iBoxx $ High Yield Corporate Bond ETF 6.41% 6.28% 5.15% 5.97% 17.90% 1.69%
iShares® MSCI Emerging Markets ETF 6.63% 20.07% 19.73% 20.60% 0.00% -1.15%
iShares® J.P. Morgan USD Emerging Markets Bond ETF -1.93% 6.31% 5.17% 3.70% 0.00% 1.67%
iShares® U.S. Real Estate ETF 8.90% 6.74% 7.41% 9.37% 4.30% -0.18% Alerian MLP ETF 11.87% 15.36% 14.35% 17.92% 3.60% 3.75% PowerShares® Senior Loan Portfolio 5.83% 2.86% 3.73% 5.53% 6.70% 0.97% PowerShares® DB Commodity Index Tracking Fund 25.76% 19.08% 17.41% 20.10% 13.40% 1.79%
SPDR® Gold Trust 8.87% 15.91% 13.68% 12.39% 0.30% 7.67% iShares® TIPS Bond ETF 1.05% 6.71% 5.82% 5.23% 19.30% 2.45% Money Market Position 0.09% 0.01% 0.01% 0.01% 20.00% 0.01%
November 2012 Rebalancing
Eligible Underlying Assets 6-Month Historical
Return
6-Month Realized Volatility
3-Month Realized Volatility
1-Month Realized Volatility
Weighting at Rebalancing
Monthly Return for Period after Rebalancing
SPDR® S&P 500® ETF Trust 2.20% 13.85% 10.65% 11.22% 0.00% -1.01% iShares® MSCI Japan ETF -5.46% 15.97% 14.39% 16.68% 0.00% 1.53% iShares® MSCI EAFE ETF 2.06% 18.98% 15.59% 16.52% 0.00% 1.72% iShares® 20+ Year Treasury Bond ETF 5.90% 14.41% 14.29% 14.22% 10.00% 2.09%
iShares® iBoxx $ Investment Grade Corporate Bond ETF 7.37% 4.43% 4.40% 3.59% 20.00% -0.17%
iShares® iBoxx $ High Yield Corporate Bond ETF 4.89% 7.14% 5.40% 4.84% 20.00% 1.06%
iShares® MSCI Emerging Markets ETF -1.10% 21.10% 16.31% 15.00% 0.00% -0.19%
iShares® J.P. Morgan USD Emerging Markets Bond ETF 9.10% 5.59% 3.52% 3.88% 20.00% 1.21%
iShares® U.S. Real Estate ETF 1.83% 8.90% 5.70% 6.46% 0.00% -1.06% Alerian MLP ETF 0.71% 13.47% 8.86% 9.71% 0.00% -0.41% PowerShares® Senior Loan Portfolio 3.54% 4.06% 1.70% 1.29% 10.00% 0.05% PowerShares® DB Commodity Index Tracking Fund -2.92% 16.86% 13.71% 14.34% 0.00% 2.03%
SPDR® Gold Trust 2.51% 14.41% 11.65% 9.14% 20.00% 0.03% iShares® TIPS Bond ETF 3.36% 4.28% 4.74% 3.84% 0.00% 0.97% Money Market Position 0.08% 0.01% 0.01% 0.01% 0.00% 0.01%
In reviewing the table provided above, you should consider the following:
• In any given month, we expect that the index will have exposure to only a limited subset of the 15 underlying assets. For example, for the April 2011 rebalancing, 9 eligible underlying assets (8 of which were ETFs) were selected as index underlying assets for the upcoming month from the 15 eligible underlying assets. Thus, the index did not target any exposure during the April 2011 period to 6 of the eligible underlying assets. Also, for example, for the November 2012 rebalancing, 6 eligible underlying assets (all of which were ETFs) were selected for the upcoming month from the 15 eligible underlying assets. Thus, the index did not target any exposure during the November 2012 period to 9 of the eligible underlying assets.
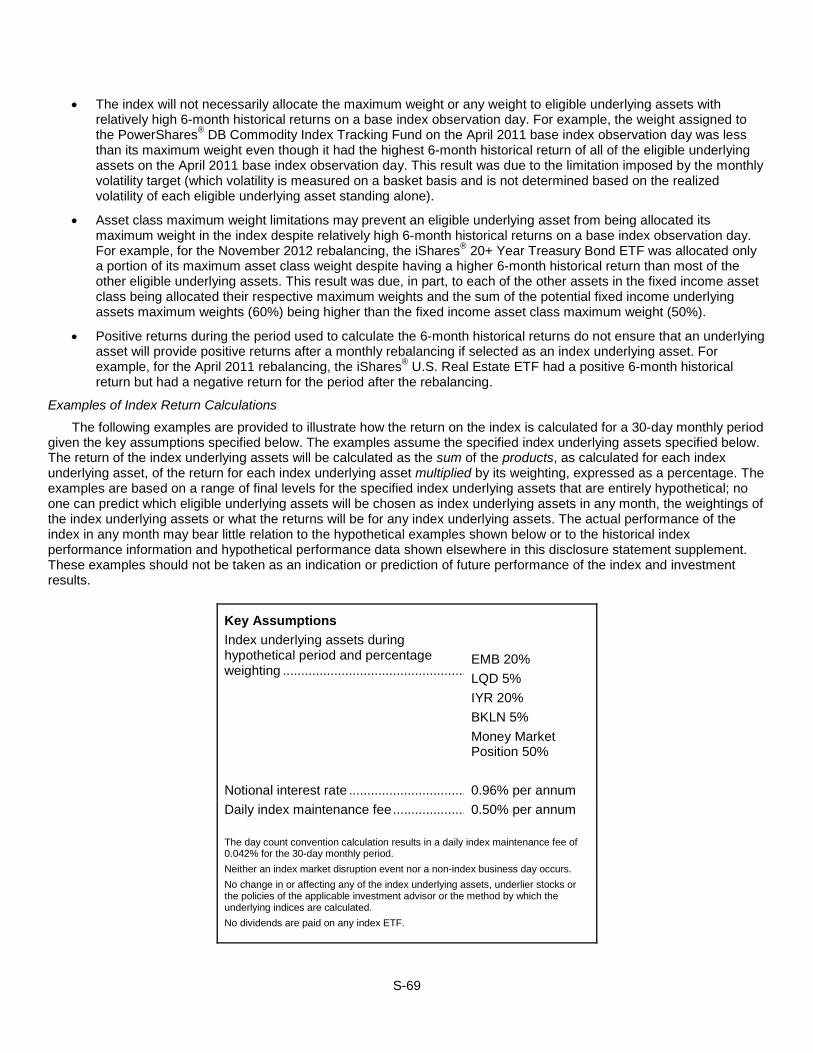
S-69
• The index will not necessarily allocate the maximum weight or any weight to eligible underlying assets with relatively high 6-month historical returns on a base index observation day. For example, the weight assigned to the PowerShares® DB Commodity Index Tracking Fund on the April 2011 base index observation day was less than its maximum weight even though it had the highest 6-month historical return of all of the eligible underlying assets on the April 2011 base index observation day. This result was due to the limitation imposed by the monthly volatility target (which volatility is measured on a basket basis and is not determined based on the realized volatility of each eligible underlying asset standing alone).
• Asset class maximum weight limitations may prevent an eligible underlying asset from being allocated its maximum weight in the index despite relatively high 6-month historical returns on a base index observation day. For example, for the November 2012 rebalancing, the iShares® 20+ Year Treasury Bond ETF was allocated only a portion of its maximum asset class weight despite having a higher 6-month historical return than most of the other eligible underlying assets. This result was due, in part, to each of the other assets in the fixed income asset class being allocated their respective maximum weights and the sum of the potential fixed income underlying assets maximum weights (60%) being higher than the fixed income asset class maximum weight (50%).
• Positive returns during the period used to calculate the 6-month historical returns do not ensure that an underlying asset will provide positive returns after a monthly rebalancing if selected as an index underlying asset. For example, for the April 2011 rebalancing, the iShares® U.S. Real Estate ETF had a positive 6-month historical return but had a negative return for the period after the rebalancing.
Examples of Index Return Calculations
The following examples are provided to illustrate how the return on the index is calculated for a 30-day monthly period given the key assumptions specified below. The examples assume the specified index underlying assets specified below. The return of the index underlying assets will be calculated as the sum of the products, as calculated for each index underlying asset, of the return for each index underlying asset multiplied by its weighting, expressed as a percentage. The examples are based on a range of final levels for the specified index underlying assets that are entirely hypothetical; no one can predict which eligible underlying assets will be chosen as index underlying assets in any month, the weightings of the index underlying assets or what the returns will be for any index underlying assets. The actual performance of the index in any month may bear little relation to the hypothetical examples shown below or to the historical index performance information and hypothetical performance data shown elsewhere in this disclosure statement supplement. These examples should not be taken as an indication or prediction of future performance of the index and investment results.
Key Assumptions Index underlying assets during hypothetical period and percentage weighting ..................................................
EMB 20% LQD 5% IYR 20% BKLN 5% Money Market Position 50%
Notional interest rate ................................ 0.96% per annum Daily index maintenance fee .................... 0.50% per annum The day count convention calculation results in a daily index maintenance fee of 0.042% for the 30-day monthly period. Neither an index market disruption event nor a non-index business day occurs. No change in or affecting any of the index underlying assets, underlier stocks or the policies of the applicable investment advisor or the method by which the underlying indices are calculated. No dividends are paid on any index ETF.

S-70
Example 1: Each index underlying asset appreciates. The sum of the weighted returns of each index underlying asset is greater than the sum of the notional interest rate plus the daily index maintenance fee. The volatility cap is never breached.
Column A Column B Column C Column D Column E
Index Underlying Asset
(Ticker) Hypothetical Initial Level
Hypothetical Final Level
Column B / Column A Weighting
Column C x Column D
EMB 100.00 101.00 1.00% 20.00% 0.200% LQD 100.00 102.00 2.00% 5.00% 0.100% IYR 100.00 103.00 3.00% 20.00% 0.600% BKLN 100.00 104.00 4.00% 5.00% 0.200% Money Market Position 100.00 100.70 0.07% 50.00% .035% Return of Index
Underlying Assets: 1.135%
Return of Notional Cash Investment in the Notional Interest Rate:
0.080% Total Daily Index
Maintenance Fee:
0.042% Index Return: 1.013%
In this example, the index underlying assets all had positive returns. The return of the index underlying assets prior to adjustment for the notional interest rate and the daily index maintenance fee equals 1.135% for the month and, once the notional interest rate for the month and the daily index maintenance fee are subtracted, the return of the index for the month equals 1.013%. Example 2: Each index underlying asset appreciates. The sum of the weighted returns of each index underlying asset is less than the sum of the notional interest rate plus the daily index maintenance fee. The volatility cap is never breached.
Column A Column B Column C Column D Column E
Index Underlying Asset
(Ticker) Hypothetical Initial Level
Hypothetical Final Level
Column B / Column A Weighting
Column C x Column D
EMB 100.00 100.06 0.06% 20.00% 0.012% LQD 100.00 100.03 0.03% 5.00% 0.002% IYR 100.00 100.04 0.04% 20.00% 0.008% BKLN 100.00 100.07 0.07% 5.00% 0.004% Money Market Position 100.00 100.05 0.05% 50.00% 0.025% Return of Index
Underlying Assets: 0.050%
Return of Notional Cash Investment in the Notional Interest Rate:
0.080% Total Daily Index
Maintenance Fee:
0.042% Index Return: -0.072%
In this example, the index underlying assets all had positive returns. The return of the index underlying assets prior to adjustment for the notional interest rate equals 0.050% for the month and, since the sum of the notional interest rate plus

S-71
the daily index maintenance fee is greater than such return, once the notional interest rate for the month and the daily index maintenance fee are subtracted, the return of the index for the month is negative and equals -0.072%.
Example 3: Each index underlying asset depreciates. The volatility cap is never breached.
Column A Column B Column C Column D Column E
Index Underlying Asset
(Ticker) Hypothetical Initial Level
Hypothetical Final Level
Column B / Column A Weighting
Column C x Column D
EMB 100.00 99.70 -0.30% 20.00% -0.06% LQD 100.00 98.00 -2.00% 5.00% -0.10% IYR 100.00 99.80 -0.20% 20.00% -0.04% BKLN 100.00 97.00 -3.00% 5.00% -0.15% Money Market Position 100.00 95.00 -5.00% 50.00% -2.50% Return of Index
Underlying Assets: -2.850%
Return of Notional Cash Investment in the Notional Interest Rate:
0.080% Total Daily Index
Maintenance Fee:
0.042% Index Return: -2.972%
In this example, the index underlying assets all had negative returns. The return of the index underlying assets prior to adjustment for the notional interest rate and the daily index maintenance fee equals -2.850% for the month and once the notional interest rate for the month and the daily index maintenance fee are subtracted the return of the index for the month is further reduced and equals -2.972%. Example 4: The index underlying assets have mixed returns. The volatility cap is never breached.
Column A Column B Column C Column D Column E
Index Underlying Asset
(Ticker) Hypothetical Initial Level
Hypothetical Final Level
Column B / Column A Weighting
Column C x Column D
EMB 100.00 102.00 2.00% 20.00% 0.400% LQD 100.00 98.00 -2.00% 5.00% -0.100% IYR 100.00 100.10 0.10% 20.00% 0.020% BKLN 100.00 99.20 -0.80% 5.00% -0.040% Money Market Position 100.00 99.04 -0.96% 50.00% -0.480% Return of Index
Underlying Assets: -0.200%
Return of Notional Cash Investment in the Notional Interest Rate:
0.080% Total Daily Index
Maintenance Fee:
0.042% Index Return: -0.322%
In this example, three of the index underlying assets had a negative return and two had positive returns. The return of the index underlying assets prior to adjustment for the notional interest rate and the daily index maintenance fee equals

S-72
-0.200% for the month and, once the notional interest rate for the month and the daily index maintenance fee are subtracted, the return of the index for the month is further reduced and equals -0.322%.
Example 5: The index ratably rebalances into the money market position during the month. Column A Column B Column C Column D Column E Index
Underlying Asset
(Ticker) Hypothetical Initial Level
Hypothetical Final Level
Column B/ Column A Weighting
Column C x
Column D With Initial Exposure to the Money Market Position (one week of the month)
EMB 100.00 102.00 2.00% 20.00% 0.40% LQD 100.00 103.00 3.00% 5.00% 0.15% IYR 100.00 104.00 4.00% 20.00% 0.80%
BKLN 100.00 105.00 5.00% 5.00% 0.25% Money
Market Position 100.00 101.00 1.00% 50.00% 0.50%
Return of Index
Underlying Assets: Return of Notional Cash Investment in the Notional Interest Rate: Total Daily Index Maintenance Fee: Index Return:
2.100%
0.080%
0.042% 1.978%
Column A Column B Column C Column D Column E
Index
Underlying Asset
(Ticker) Hypothetical Initial Level
Hypothetical Final Level
Column B/ Column A Weighting
Column C x
Column D With Additional Exposure to the Money Market Position (remaining three weeks of the month)
EMB 100.00 102.00 2.00% 16.00% 0.32% LQD 100.00 103.00 3.00% 4.00% 0.12% IYR 100.00 104.00 4.00% 16.00% 0.64% BKLN 100.00 105.00 5.00% 4.00% 0.20% Money Market Position 100.00 101.00 1.00% 60.00% 0.60%
Return of Index Underlying Assets: Return of Notional Cash Investment in the Notional Interest Rate: Total Daily Index Maintenance Fee: Index Return:
1.880%
0.080%
0.042% 1.758%

S-73
In this example, the index underlying assets all had positive returns for the month. In order to highlight the effect of rebalancing into the money market position, we have assumed that such a rebalancing occurs one week into the month and that on each subsequent index business day the realized volatility for the applicable cap period exceeds the volatility cap by 7.5%, thereby reducing the exposure to the base index (and, consequently, each index underlying asset) by 20%. For the first week of the month (a quarter of the month in this example), the underlying assets and their weights were as indicated above. For each portion of the month indicated above, before and after the rebalancing, we have shown what the index underlying assets’ returns would have been for the month as a whole and, consequently, what the return of the index underlying assets would have been for the month as a whole. The return of the index underlying assets for the month prior to adjustment for the notional interest rate and the daily index maintenance fee equals 1.935% (i.e., the result of a quarter of the month at the returns prior to the additional allocation to the money market position as a result of the volatility control feature plus three quarters of the month at the returns after such allocation) and, once the notional interest rate and the daily index maintenance fee for the month are subtracted, the return of the index for the month equals 1.813% (i.e., 1.935% minus 0.122% (the sum of the notional interest rate plus the daily index maintenance fee). Since the returns on EMB, LQD, IYR and BKLN were higher than the money market position, the increased weighting to the money market position for a portion of the month reduced the return of the index relative to the return associated with the index using the money market position.
We cannot predict which eligible underlying assets will be chosen as index underlying assets in any month, the weights of the index underlying assets or what the final levels will be for any index underlying assets or the overnight interest rate. The actual amount that you will receive maturity and the rate of return on the offered CDs will depend on the performance of the index which will be determined by the index underlying assets chosen and their weightings.
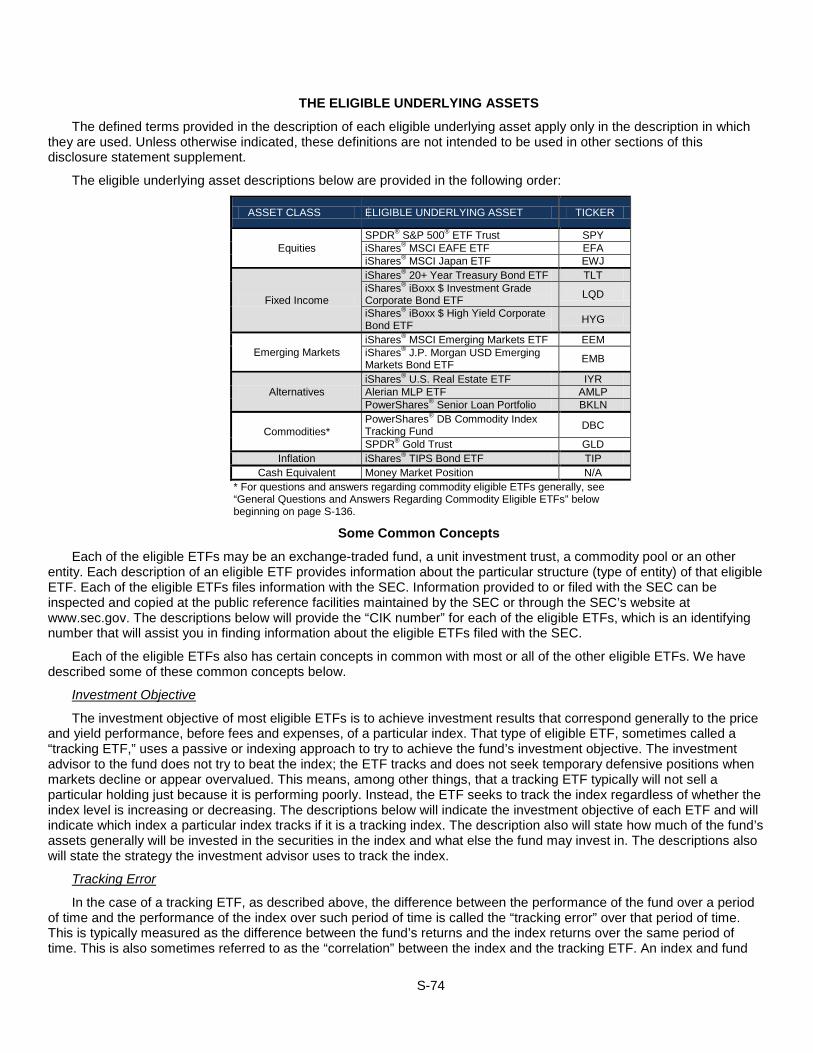
S-74
THE ELIGIBLE UNDERLYING ASSETS
The defined terms provided in the description of each eligible underlying asset apply only in the description in which they are used. Unless otherwise indicated, these definitions are not intended to be used in other sections of this disclosure statement supplement.
The eligible underlying asset descriptions below are provided in the following order:
ASSET CLASS ELIGIBLE UNDERLYING ASSET TICKER
Equities SPDR® S&P 500® ETF Trust SPY iShares® MSCI EAFE ETF EFA iShares® MSCI Japan ETF EWJ
Fixed Income
iShares® 20+ Year Treasury Bond ETF TLT iShares® iBoxx $ Investment Grade Corporate Bond ETF LQD
iShares® iBoxx $ High Yield Corporate Bond ETF HYG
Emerging Markets iShares® MSCI Emerging Markets ETF EEM iShares® J.P. Morgan USD Emerging Markets Bond ETF EMB
Alternatives iShares® U.S. Real Estate ETF IYR Alerian MLP ETF AMLP PowerShares® Senior Loan Portfolio BKLN
Commodities* PowerShares® DB Commodity Index Tracking Fund DBC
SPDR® Gold Trust GLD Inflation iShares® TIPS Bond ETF TIP
Cash Equivalent Money Market Position N/A * For questions and answers regarding commodity eligible ETFs generally, see “General Questions and Answers Regarding Commodity Eligible ETFs” below beginning on page S-136.
Some Common Concepts
Each of the eligible ETFs may be an exchange-traded fund, a unit investment trust, a commodity pool or an other entity. Each description of an eligible ETF provides information about the particular structure (type of entity) of that eligible ETF. Each of the eligible ETFs files information with the SEC. Information provided to or filed with the SEC can be inspected and copied at the public reference facilities maintained by the SEC or through the SEC’s website at www.sec.gov. The descriptions below will provide the “CIK number” for each of the eligible ETFs, which is an identifying number that will assist you in finding information about the eligible ETFs filed with the SEC.
Each of the eligible ETFs also has certain concepts in common with most or all of the other eligible ETFs. We have described some of these common concepts below.
Investment Objective
The investment objective of most eligible ETFs is to achieve investment results that correspond generally to the price and yield performance, before fees and expenses, of a particular index. That type of eligible ETF, sometimes called a “tracking ETF,” uses a passive or indexing approach to try to achieve the fund’s investment objective. The investment advisor to the fund does not try to beat the index; the ETF tracks and does not seek temporary defensive positions when markets decline or appear overvalued. This means, among other things, that a tracking ETF typically will not sell a particular holding just because it is performing poorly. Instead, the ETF seeks to track the index regardless of whether the index level is increasing or decreasing. The descriptions below will indicate the investment objective of each ETF and will indicate which index a particular index tracks if it is a tracking index. The description also will state how much of the fund’s assets generally will be invested in the securities in the index and what else the fund may invest in. The descriptions also will state the strategy the investment advisor uses to track the index.
Tracking Error
In the case of a tracking ETF, as described above, the difference between the performance of the fund over a period of time and the performance of the index over such period of time is called the “tracking error” over that period of time. This is typically measured as the difference between the fund’s returns and the index returns over the same period of time. This is also sometimes referred to as the “correlation” between the index and the tracking ETF. An index and fund
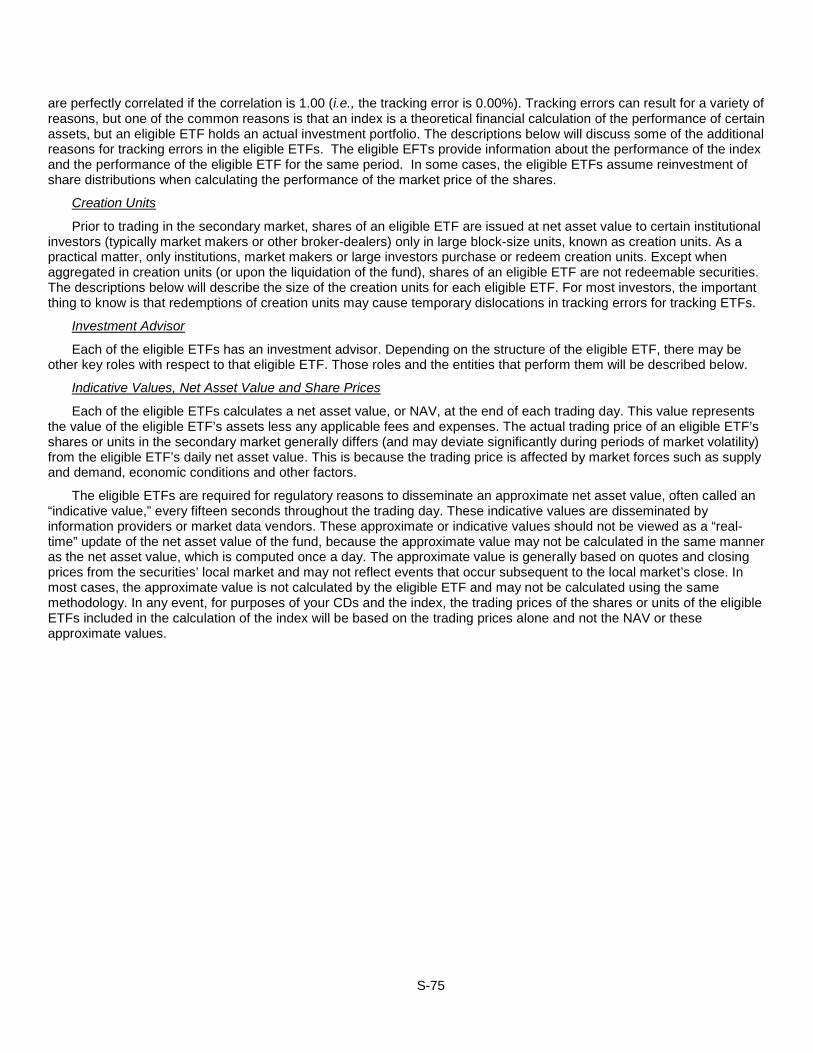
S-75
are perfectly correlated if the correlation is 1.00 (i.e., the tracking error is 0.00%). Tracking errors can result for a variety of reasons, but one of the common reasons is that an index is a theoretical financial calculation of the performance of certain assets, but an eligible ETF holds an actual investment portfolio. The descriptions below will discuss some of the additional reasons for tracking errors in the eligible ETFs. The eligible EFTs provide information about the performance of the index and the performance of the eligible ETF for the same period. In some cases, the eligible ETFs assume reinvestment of share distributions when calculating the performance of the market price of the shares.
Creation Units
Prior to trading in the secondary market, shares of an eligible ETF are issued at net asset value to certain institutional investors (typically market makers or other broker-dealers) only in large block-size units, known as creation units. As a practical matter, only institutions, market makers or large investors purchase or redeem creation units. Except when aggregated in creation units (or upon the liquidation of the fund), shares of an eligible ETF are not redeemable securities. The descriptions below will describe the size of the creation units for each eligible ETF. For most investors, the important thing to know is that redemptions of creation units may cause temporary dislocations in tracking errors for tracking ETFs.
Investment Advisor
Each of the eligible ETFs has an investment advisor. Depending on the structure of the eligible ETF, there may be other key roles with respect to that eligible ETF. Those roles and the entities that perform them will be described below.
Indicative Values, Net Asset Value and Share Prices
Each of the eligible ETFs calculates a net asset value, or NAV, at the end of each trading day. This value represents the value of the eligible ETF’s assets less any applicable fees and expenses. The actual trading price of an eligible ETF’s shares or units in the secondary market generally differs (and may deviate significantly during periods of market volatility) from the eligible ETF’s daily net asset value. This is because the trading price is affected by market forces such as supply and demand, economic conditions and other factors.
The eligible ETFs are required for regulatory reasons to disseminate an approximate net asset value, often called an “indicative value,” every fifteen seconds throughout the trading day. These indicative values are disseminated by information providers or market data vendors. These approximate or indicative values should not be viewed as a “real-time” update of the net asset value of the fund, because the approximate value may not be calculated in the same manner as the net asset value, which is computed once a day. The approximate value is generally based on quotes and closing prices from the securities’ local market and may not reflect events that occur subsequent to the local market’s close. In most cases, the approximate value is not calculated by the eligible ETF and may not be calculated using the same methodology. In any event, for purposes of your CDs and the index, the trading prices of the shares or units of the eligible ETFs included in the calculation of the index will be based on the trading prices alone and not the NAV or these approximate values.
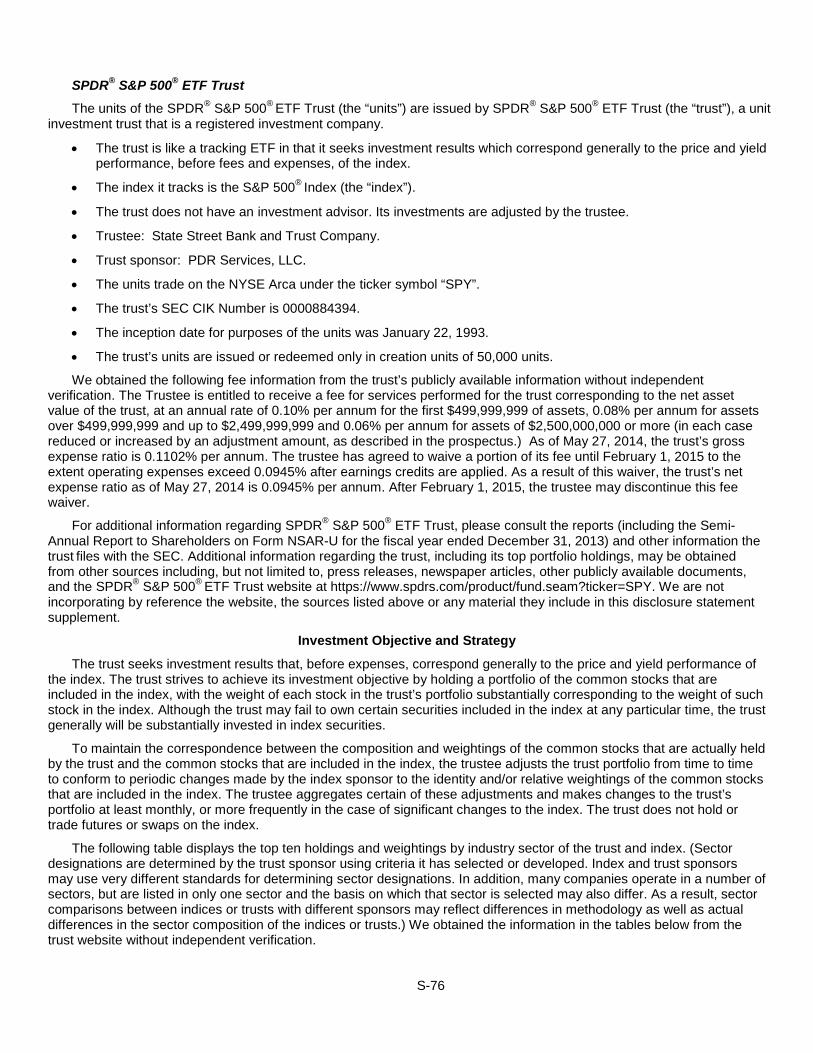
S-76
SPDR® S&P 500® ETF Trust The units of the SPDR® S&P 500® ETF Trust (the “units”) are issued by SPDR® S&P 500® ETF Trust (the “trust”), a unit
investment trust that is a registered investment company.
• The trust is like a tracking ETF in that it seeks investment results which correspond generally to the price and yield performance, before fees and expenses, of the index.
• The index it tracks is the S&P 500® Index (the “index”).
• The trust does not have an investment advisor. Its investments are adjusted by the trustee.
• Trustee: State Street Bank and Trust Company.
• Trust sponsor: PDR Services, LLC.
• The units trade on the NYSE Arca under the ticker symbol “SPY”.
• The trust’s SEC CIK Number is 0000884394.
• The inception date for purposes of the units was January 22, 1993.
• The trust’s units are issued or redeemed only in creation units of 50,000 units.
We obtained the following fee information from the trust’s publicly available information without independent verification. The Trustee is entitled to receive a fee for services performed for the trust corresponding to the net asset value of the trust, at an annual rate of 0.10% per annum for the first $499,999,999 of assets, 0.08% per annum for assets over $499,999,999 and up to $2,499,999,999 and 0.06% per annum for assets of $2,500,000,000 or more (in each case reduced or increased by an adjustment amount, as described in the prospectus.) As of May 27, 2014, the trust’s gross expense ratio is 0.1102% per annum. The trustee has agreed to waive a portion of its fee until February 1, 2015 to the extent operating expenses exceed 0.0945% after earnings credits are applied. As a result of this waiver, the trust’s net expense ratio as of May 27, 2014 is 0.0945% per annum. After February 1, 2015, the trustee may discontinue this fee waiver.
For additional information regarding SPDR® S&P 500® ETF Trust, please consult the reports (including the Semi-Annual Report to Shareholders on Form NSAR-U for the fiscal year ended December 31, 2013) and other information the trust files with the SEC. Additional information regarding the trust, including its top portfolio holdings, may be obtained from other sources including, but not limited to, press releases, newspaper articles, other publicly available documents, and the SPDR® S&P 500® ETF Trust website at https://www.spdrs.com/product/fund.seam?ticker=SPY. We are not incorporating by reference the website, the sources listed above or any material they include in this disclosure statement supplement.
Investment Objective and Strategy
The trust seeks investment results that, before expenses, correspond generally to the price and yield performance of the index. The trust strives to achieve its investment objective by holding a portfolio of the common stocks that are included in the index, with the weight of each stock in the trust’s portfolio substantially corresponding to the weight of such stock in the index. Although the trust may fail to own certain securities included in the index at any particular time, the trust generally will be substantially invested in index securities.
To maintain the correspondence between the composition and weightings of the common stocks that are actually held by the trust and the common stocks that are included in the index, the trustee adjusts the trust portfolio from time to time to conform to periodic changes made by the index sponsor to the identity and/or relative weightings of the common stocks that are included in the index. The trustee aggregates certain of these adjustments and makes changes to the trust’s portfolio at least monthly, or more frequently in the case of significant changes to the index. The trust does not hold or trade futures or swaps on the index.
The following table displays the top ten holdings and weightings by industry sector of the trust and index. (Sector designations are determined by the trust sponsor using criteria it has selected or developed. Index and trust sponsors may use very different standards for determining sector designations. In addition, many companies operate in a number of sectors, but are listed in only one sector and the basis on which that sector is selected may also differ. As a result, sector comparisons between indices or trusts with different sponsors may reflect differences in methodology as well as actual differences in the sector composition of the indices or trusts.) We obtained the information in the tables below from the trust website without independent verification.

S-77
Top Ten Holdings of Trust and Index as of May 27, 2014
Issuer Percentage of Trust (%)
Percentage of Index (%)
APPLE INC 3.27% 3.23%
EXXON MOBIL CORP 2.57% 2.58%
MICROSOFT CORP 1.78% 1.79%
JOHNSON & JOHNSON 1.67% 1.68%
GENERAL ELECTRIC CO 1.56% 1.57%
WELLS FARGO & CO 1.42% 1.42%
CHEVRON CORP 1.37% 1.39%
BERKSHIRE HATHAWAY INC-Class B 1.35% 1.35%
PROCTER & GAMBLE CO 1.27% 1.29%
JPMORGAN CHASE & CO. 1.22% 1.22%
Weighting by Sector of Trust and Index as of May 27, 2014*
Sector Percentage of Trust (%)
Percentage of Index (%)
Information Technology 18.85% 18.81%
Financials 16.02% 15.97%
Health Care 13.25% 13.25%
Consumer Discretionary 11.95% 11.97%
Industrials 10.71% 10.73%
Energy 10.47% 10.51%
Consumer Staples 9.66% 9.69%
Materials 3.51% 3.54%
Utilities 3.03% 3.03%
Telecommunications Services 2.47% 2.49%
* Percentages may not sum to 100% due to rounding
Correlation
Although the trust intends to track the performance of the index as closely as possible, the trust’s return may not match or achieve a high degree of correlation with the return of the index due to expenses and transaction costs incurred in adjusting the portfolio. In addition, it is possible that the trust may not always fully replicate the performance of the index due to unavailability of certain index securities in the secondary market or due to other extraordinary circumstances (e.g., if trading in a security has been halted).
For the period ended April 30, 2014, the SPDR® website gave the following performance figures for market price of a unit and the index: unit—1 year on an annualized basis, 20.29%; 3 years on an annualized basis, 13.64%, 5 years on an annualized basis, 18.95%, 10 years on an annualized basis, 7.57%, since inception on an annualized basis, 9.11%; index—1 year on an annualized basis, 20.44%; 3 years on an annualized basis, 13.83%, 5 years on an annualized basis, 19.14%, 10 years on an annualized basis, 7.67%, since inception on an annualized basis, 9.26%.
Unit Dividends
Holders of units receive dividends on the last business day of each April, July, October and January in an amount corresponding to the amount of any cash dividends declared on the common stocks held by the trust, net of the fees and expenses associated with the operation of the trust, and taxes, if applicable. Because of the fees and expenses, the

S-78
dividend yield for units is ordinarily less than the hypothetical dividend yield of the index. The unit dividends will be reflected in the calculation of the index as described under “—Calculation of the Total Return of the Index” on page S-78 below.
The S&P 500® Index
The index includes a representative sample of 500 companies in leading industries of the U.S. economy. The 500 companies are not the 500 largest companies listed on the NYSE and not all 500 companies are listed on the NYSE. S&P chooses companies for inclusion in the index with an aim of achieving a distribution by broad industry groupings that approximates the distribution of these groupings in the common stock population of the U.S. equity market. The index is calculated, maintained and published by Standard & Poor’s (S&P) and is part of the S&P Dow Jones Indices family of indices. Additional information is available. In addition, information may be obtained from other sources including, but not limited to, press releases, newspaper articles, other publicly available documents, and on the following website: http:// www.spdji.com. We are not incorporating by reference the website, the sources listed above or any material they include in this disclosure statement supplement.
S&P intends for the index to provide a performance benchmark for the U.S. equity markets. Constituent changes are made on an as-needed basis and there is no schedule for constituent reviews. Constituent changes are generally announced one to five business days prior to the change. Relevant criteria for additions to the index that are employed by S&P include: the company proposed for addition should have an unadjusted market capitalization of $4.6 billion or more; the ratio of annual dollar value traded in the proposed constituent to float adjusted market capitalization of that company should be 1.00 or greater; the company should trade a minimum of 250,000 shares in each of the six months leading up to the evaluation date; the company must be a U.S. company (characterized as a Form 10-K filer, a company whose U.S. portion of fixed assets and revenues constitutes a plurality of the total, a company with a primary listing of the common stock on the NYSE (including NYSE Arca and NYSE MKT), the NASDAQ Global Select Market, the NASDAQ Select Market or the NASDAQ Capital Market and a corporate governance structure consistent with U.S. practice); the proposed constituent has a public float of 50% or more of its stock; the inclusion of the company will contribute to sector balance in the index relative to sector balance in the market as a whole; financial viability (usually measured as four consecutive quarters of positive as-reported earnings and operationally justifiable leverage for the proposed constituent’s industry and business model); and, for IPOs, a seasoning period of six to twelve months. Certain types of securities are always excluded, including limited partnerships, master limited partnerships, OTC bulletin board issues, closed-end funds, ETFs, ETNs, royalty trusts, tracking stocks, preferred shares, unit trusts, equity warrants, convertible bonds, investment trusts, ADRs, ADSs and master limited partnership investment trust units. Stocks are deleted from the index when they are involved in mergers, acquisitions or significant restructurings such that they no longer meet the inclusion criteria, and when they substantially violate one or more of the addition criteria. Companies that experience a trading halt may be retained or deleted in S&P’s discretion. S&P evaluates additions and deletions with a view to maintaining index continuity.
S&P divides the 500 companies included in the index into nine Global Industry Classification Sectors: Consumer Discretionary, Consumer Staples, Energy, Financials, Health Care, Industrials, Materials, Technology (combination of Information Technology sector and Telecommunication Services sector) and Utilities.
The trust tracks the performance of the total version of the index. A total return index represents the total return earned in a portfolio that tracks the price index and reinvests dividend income in the overall index, not in the specific stock paying the dividend. The difference between the price return calculation and the total return calculation is that, with respect to the price return calculation, changes in the index level reflect changes in stock prices, whereas with respect to the total return calculation of the index, changes in the index level reflect both movements in stock prices and the reinvestment of dividend income.
Calculation of the Total Return of the Index
The index is calculated using a base-weighted aggregate (or market capitalization weighted) methodology. The total return calculation begins with the price return of the index. The value of the price return index on any day for which an index value is published is determined by a fraction, the numerator of which is the aggregate of the market price of each stock in the index times the number of shares of such stock included in the index, and the denominator of which is the divisor, which is described more fully below. The “market value” of any underlier stock is the product of the market price per share of that stock times the number of the then-outstanding shares of such underlier stock that are then included in the index.
The index is also sometimes called a “base-weighted index” because of its use of a divisor. The “divisor” is a value calculated by S&P that is intended to maintain conformity in index values over time and is adjusted for all changes in the underlier stocks’ share capital after the “base date” as described below. The level of the index reflects the total market

S-79
value of all underlier stocks relative to the index’s base date of 1941-43. S&P set the base value of the index on the base date at 10.
In addition, the index is float-adjusted, meaning that the share counts used in calculating the index reflect only those shares available to investors rather than all of a company’s outstanding shares. S&P seeks to exclude shares held by certain shareholders concerned with the control of a company, a group that generally includes the following: officers and directors, private equity, venture capital, special equity firms, publicly traded companies that hold shares in another company, strategic partners, holders of restricted shares, employee stock ownership plans, employee and family trusts, foundations associated with the company, holders of unlisted share classes of stock, government entities at all levels (except government retirement or pension funds) and any individual person who controls a 5% or greater stake in a company as reported in regulatory filings (collectively, “control holders”). To this end, S&P excludes all share-holdings (other than mutual funds, exchange-traded fund providers, asset managers, pension plans and other institutional investors) with a position greater than 5% of the outstanding shares of a company from the float-adjusted share count to be used in index calculations. Although global consistency is preferred wherever possible, in jurisdictions where companies report holdings of higher than 5% and no holdings data at the 5% threshold is available, the float calculation will be based on the reporting level required in the non-U.S. jurisdiction.
The exclusion is accomplished by calculating an Investable Weight Factor (IWF) for each stock that is part of the numerator of the float-adjusted index fraction described above:
IWF = (available float shares)/(total shares outstanding)
where available float shares is defined as total shares outstanding less shares held by control holders. In most cases, an IWF is reported to the nearest one percentage point.
Once the price return index has been calculated, the total return index is calculated. First, the total daily dividend for each stock in the index is calculated by multiplying the per share dividend by the number of shares included in the index. Then the index dividend is calculated by aggregating the total daily dividends for each of the index stocks (which may be zero for some stocks) and dividing by the divisor for that day. Next the daily total return of the index is calculated as a fraction minus 1, the numerator of which is the sum of the index level plus the index dividend and the denominator of which is the index level on the previous day. Finally, the total return index for that day is calculated as the product of the value of the total return index on the previous day times the sum of 1 plus the index daily total return for that day.
Maintenance of the Index
In order to keep the index comparable over time S&P engages in an index maintenance process. The maintenance process involves changing the constituents as discussed above, and also involves adjusting the number of shares used to calculate the index, monitoring and completing the adjustments for company additions and deletions, adjusting for stock splits and stock dividends and adjusting for other corporate actions.
The two types of adjustments primarily used by S&P are divisor adjustments and adjustments to the number of shares (including float adjustments) used to calculate the index. Set forth below under “Adjustments for Corporate Actions” is a table of certain corporate events and their resulting effect on the divisor and the share count. If a corporate event requires an adjustment to the divisor, that event has the effect of altering the market value of the affected underlier stock and consequently of altering the aggregate market value of the underlier stocks following the event. In order that the level of the index not be affected by the altered market value (which could be an increase or decrease) of the affected underlier stock, S&P derives a new divisor by dividing the post-event market value of the underlier stocks by the pre-event index value, which has the effect of reducing the index’s post-event value to the pre-event level.
The index maintenance process also involves tracking the changes in the number of shares included for each of the index companies. The timing of adjustments to the number of shares depends on the type of event causing the change, public availability of data, local market practice, and whether the change represents more than 5% of the float-adjusted share count. Changes as a result of mergers or acquisitions are implemented when the transaction occurs, regardless of the size of the change to the number of shares. At S&P’s discretion, however, de minimis merger and acquisition changes may be accumulated and implemented with the updates made at the quarterly share updates as described below. Changes in a constituent’s float-adjusted shares of 5% or more due to public offerings, tender offers, Dutch auctions or exchange offers are implemented as soon as reasonably possible. Other changes of 5% or more are made weekly and are announced after the market close on Fridays for implementation after the close of trading on the following Friday. For smaller changes, on the third Friday of the last month in each calendar quarter, S&P updates the share totals of companies in the index as required by any changes in the float-adjusted number of shares outstanding. S&P implements a share freeze the week leading to the effective date of the quarterly share count updates. During this frozen period,

S-80
shares are not changed except for certain corporate action events (merger activity, stock splits, rights offerings and certain share dividend payable events). After the float-adjusted share count totals are updated, the divisor is adjusted to compensate for the net change in the total market value of the index. In addition, any changes over 5% in the current common shares outstanding for the index companies are carefully reviewed by S&P on a weekly basis, and when appropriate, an immediate adjustment is made to the divisor.
Adjustments for Corporate Actions
There is a large range of corporate actions that may affect companies included in the index. Certain corporate actions require S&P to recalculate the share count or the float adjustment or to make an adjustment to the divisor to prevent the value of the index from changing as a result of the corporate action. This helps ensure that the movement of the index does not reflect the corporate actions of individual companies in the index. Several types of corporate actions, and their related adjustments, are listed in the table below.
Corporate Action Share Count Revision
Required? Divisor Adjustment Required?
Stock split
Yes — share count is revised to reflect new
count.
No — share count and price changes are off-setting
Change in shares outstanding (secondary issuance, share
repurchase and/or share buy-back)
Yes — share count is revised to reflect new
count.
Yes — divisor adjustment reflects change in market capitalization
Spin-off if spun-off company is not being added to the S&P 500® Index
No
Yes — divisor adjustment reflects decline in index market value (i.e. value of the
spun-off unit) Spin-off if spun-off company is
being added to the S&P 500® Index and no company is being removed
No
No
Spin-off if spun-off company is being added to the S&P 500® Index
and another company is being removed
No
Yes — divisor adjustment reflects deletion
Special dividends
No
Yes — calculation assumes that share price drops by the amount of the dividend; divisor adjustment reflects this change in
index market value Change in IWF
No
Yes — divisor change reflects the change in market value caused by the change to
an IWF Company added to or deleted from
the S&P 500® Index No
Yes — divisor is adjusted by the net
change in market value Rights Offering
No
Yes — divisor adjustment reflects increase
in market capitalization
(calculation assumes that offering is fully
subscribed at the set price)
Calculations and Disruptions Due to Exchange Closure
Real time calculations of the index use prices from each stock’s primary listing exchange (NYSE or NASDAQ). If there is a failure or interruption on either exchange, real time calculations switch to the Composite Tape and an announcement is published on S&P’s website. If the interruption does not end before the market close and the exchange(s) in question publishes a list of closing prices, those prices are used. If no list is published, the last trade as of

S-81
4 p.m. on the Composite Tape is used. A notice is published on S&P’s web site indicating which prices are used for the closing values. In extreme circumstances, S&P may decide to delay index adjustments or not publish the index.
Historical Closing Prices of the Units
The closing price of the units has fluctuated in the past and may, in the future, experience significant fluctuations. Any historical upward or downward trend in the closing price of the shares during the period shown below is not an indication that the units are more or less likely to increase or decrease at any time during the life of your CDs. The period shown below will be approximately ten years, but may be shorter if Bloomberg Financial Services does not provide historical closing prices for the entirety of such period (whether due to the applicable inception date occurring less than ten years from the date hereof or otherwise).
You should not take the historical closing prices of the units as an indication of the future performance of the units. We cannot give you any assurance that the future performance of the units will result in your receiving an amount greater than the outstanding face amount of your CDs on the stated maturity date. Neither we nor any of our affiliates make any representation to you as to the performance of the units. Before investing in the offered CDs, you should consult publicly available information to determine the relevant units closing prices between the date of this disclosure statement supplement and the date of your purchase of the offered CDs. The actual performance of the units over the life of the offered CDs, as well as the payment amount at maturity may bear little relation to the historical prices shown below.
The graph below shows the daily historical prices of the units from May 30, 2004 through May 30, 2014. We obtained the closing prices shown in the graph below from Bloomberg Financial Services without independent verification.
“SPDR®” is a registered trademark of Standard & Poor's Financial Services LLC (S&P) and Dow Jones is a registered trademark of Dow Jones Trademark Holdings LLC (Dow Jones) and have been licensed for use by S&P Dow Jones Indices LLC. The index is not sponsored, endorsed, sold or promoted by S&P Dow Jones Indices LLC, Dow Jones, S&P or their respective affiliates, and neither S&P Dow Jones Indices LLC, Dow Jones, S&P or their respective affiliates make any representation regarding the advisability of investing in the index.
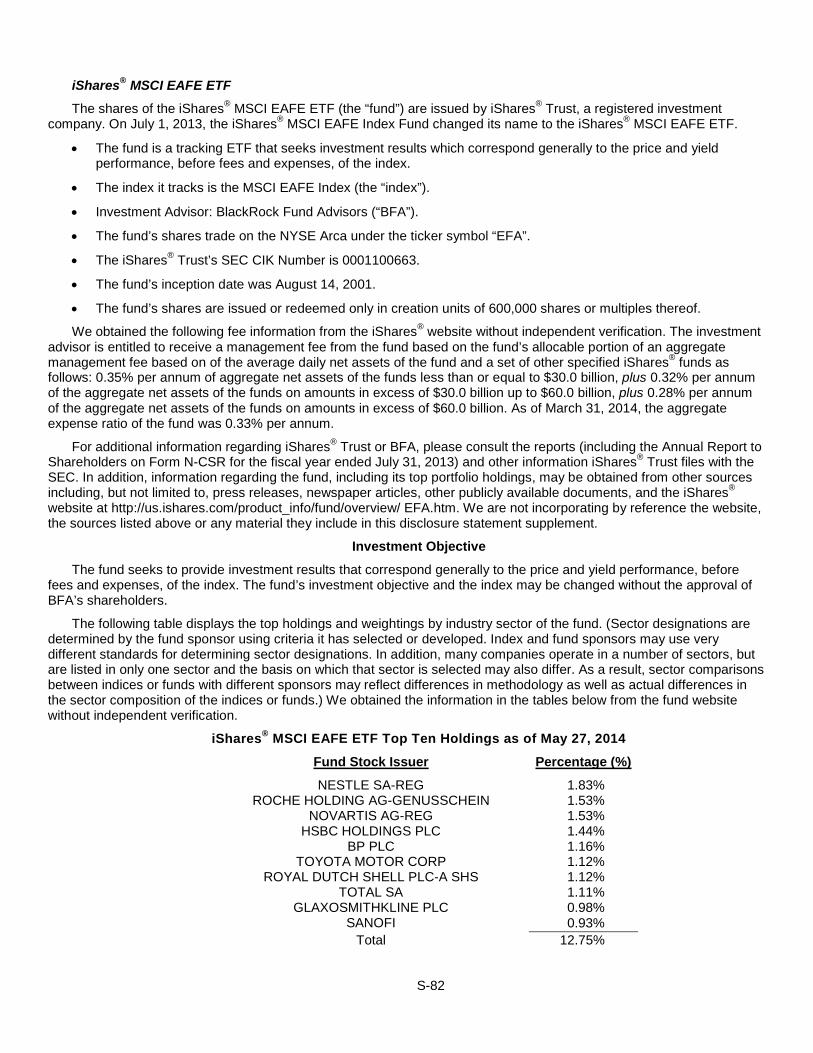
S-82
iShares® MSCI EAFE ETF
The shares of the iShares® MSCI EAFE ETF (the “fund”) are issued by iShares® Trust, a registered investment company. On July 1, 2013, the iShares® MSCI EAFE Index Fund changed its name to the iShares® MSCI EAFE ETF.
• The fund is a tracking ETF that seeks investment results which correspond generally to the price and yield performance, before fees and expenses, of the index.
• The index it tracks is the MSCI EAFE Index (the “index”).
• Investment Advisor: BlackRock Fund Advisors (“BFA”).
• The fund’s shares trade on the NYSE Arca under the ticker symbol “EFA”.
• The iShares® Trust’s SEC CIK Number is 0001100663.
• The fund’s inception date was August 14, 2001.
• The fund’s shares are issued or redeemed only in creation units of 600,000 shares or multiples thereof.
We obtained the following fee information from the iShares® website without independent verification. The investment advisor is entitled to receive a management fee from the fund based on the fund’s allocable portion of an aggregate management fee based on of the average daily net assets of the fund and a set of other specified iShares® funds as follows: 0.35% per annum of aggregate net assets of the funds less than or equal to $30.0 billion, plus 0.32% per annum of the aggregate net assets of the funds on amounts in excess of $30.0 billion up to $60.0 billion, plus 0.28% per annum of the aggregate net assets of the funds on amounts in excess of $60.0 billion. As of March 31, 2014, the aggregate expense ratio of the fund was 0.33% per annum.
For additional information regarding iShares® Trust or BFA, please consult the reports (including the Annual Report to Shareholders on Form N-CSR for the fiscal year ended July 31, 2013) and other information iShares® Trust files with the SEC. In addition, information regarding the fund, including its top portfolio holdings, may be obtained from other sources including, but not limited to, press releases, newspaper articles, other publicly available documents, and the iShares® website at http://us.ishares.com/product_info/fund/overview/ EFA.htm. We are not incorporating by reference the website, the sources listed above or any material they include in this disclosure statement supplement.
Investment Objective
The fund seeks to provide investment results that correspond generally to the price and yield performance, before fees and expenses, of the index. The fund’s investment objective and the index may be changed without the approval of BFA’s shareholders.
The following table displays the top holdings and weightings by industry sector of the fund. (Sector designations are determined by the fund sponsor using criteria it has selected or developed. Index and fund sponsors may use very different standards for determining sector designations. In addition, many companies operate in a number of sectors, but are listed in only one sector and the basis on which that sector is selected may also differ. As a result, sector comparisons between indices or funds with different sponsors may reflect differences in methodology as well as actual differences in the sector composition of the indices or funds.) We obtained the information in the tables below from the fund website without independent verification.
iShares® MSCI EAFE ETF Top Ten Holdings as of May 27, 2014
Fund Stock Issuer Percentage (%)
NESTLE SA-REG 1.83% ROCHE HOLDING AG-GENUSSCHEIN 1.53%
NOVARTIS AG-REG 1.53% HSBC HOLDINGS PLC 1.44%
BP PLC 1.16% TOYOTA MOTOR CORP 1.12%
ROYAL DUTCH SHELL PLC-A SHS 1.12% TOTAL SA 1.11%
GLAXOSMITHKLINE PLC 0.98% SANOFI 0.93%
Total 12.75%

S-83
iShares® MSCI EAFE ETF Weighting by Sector as of May 27, 2014
Sector Percentage (%)
Financials 25.18% Industrials 12.45%
Consumer Discretionary 11.42% Consumer Staples 9.98%
Health Care 9.05% Materials 8.07% Energy 6.97%
Other/Undefined 4.62% Telecommunication Services 4.33%
Information Technology 4.26% Utilities 3.67% Total 100.00%
* Percentages may not sum to 100% due to rounding.
iShares® MSCI EAFE ETF Weighting by Country as of May 27, 2014
Country Percentage (%)
Japan 19.22% United Kingdom 17.99%
France 10.08% Switzerland 9.62% Germany 9.16% Australia 8.26%
Netherlands 4.70% Spain 3.54%
Sweden 3.08% Hong Kong 2.54%
Italy 2.36% Singapore 1.37% Denmark 1.30% Belgium 1.22%
Other 4.31% Total 98.75%
* Percentages may not sum to 100% due to rounding.
Representative Sampling
BFA uses a representative sampling strategy to attempt to track the performance of the index. For the fund, this strategy involves investing in a representative sample of securities that collectively have an investment profile similar to that of the index. The securities selected are expected to have aggregate investment characteristics (based on factors such as market capitalization and industry weightings), fundamental characteristics (such as return variability, earnings valuation and yield) and liquidity measures similar to those of the index.
The fund generally invests at least 90% of its assets in the securities of the index and in depositary receipts representing securities of the index. The fund may invest the remainder of its assets in securities not included in the index, but which BFA believes will help the fund track the index. The fund may also invest its other assets in futures contracts, options and swaps, as well as cash and cash equivalents, including shares of money market funds affiliated with BFA. Also, the fund may lend securities representing up to one-third of the value of the fund's total assets (including the value of the collateral received).
Tracking Error
The performance of the fund and the index may vary due to a variety of factors, including differences between the fund’s assets and the index, pricing differences, transaction costs, the fund’s holding of cash, differences in timing of the accrual of dividends and differences between the fund’s portfolio and the index resulting from new or existing legal

S-84
restrictions that apply to the fund but not to the index or to investors using a representative sampling strategy in general. BFA expects that, over time, the fund’s tracking error will not exceed 5%. The fund’s use of a representative sampling strategy can be expected to produce a greater tracking error over a period of time than would result if the fund used an indexing strategy in which a fund invests in substantially all of the securities in its index in approximately the same proportions as in the index.
As of April 30, 2014, iShares reported the following average annual returns on the market price of the fund’s shares and the index. The market price of the fund’s shares takes into account distributions on the shares and the returns shown account for changes in the mid-point of the bid and ask prices at 4:00 p.m., Eastern time on the relevant date. Fund shares: 1 year, 13.47; 3 years, 5.51; 5 years, 13.68; 10 years, 6.87; since inception, 6.23; index: 1 year, 13.35; 3 years, 5.66; 5 years, 13.58; 10 years, 6.93%; since fund inception, 6.26.
Industry Concentration Policy
The fund will concentrate its investments (i.e., hold 25% or more of its total assets) in a particular industry or group of industries to approximately the same extent that the index is concentrated in that industry or group of industries.
The MSCI® EAFE Index
The MSCI EAFE Index (the “index”) is a stock index calculated, published and disseminated daily by MSCI Inc. (“MSCI”) through numerous data vendors, on the MSCI website and in real time on Bloomberg Financial Markets and Reuters Limited.
The index is a free float-adjusted market capitalization index and is one of the MSCI Global Investable Market Indices (the “MSCI Indices”), the methodology of which is described below. The index is considered a “standard” index, which means it consists of all eligible large capitalization and mid-capitalization stocks, as determined by MSCI, in the relevant market. Additional information about the MSCI Indices is available on the following website: http://www.msci.com/products/indices/country_and_regional/em/ methodology.html. Daily closing price information for the index is available on the following website: http://www.mscibarra.com/products/indices/international_equity_indices/performance.html. We are not incorporating by reference the website, the sources listed above or any material they include in this disclosure statement supplement.
The index is intended to provide performance benchmarks for the developed equity markets in Australia and New Zealand and in Europe and Asia, which are, as of the date of this disclosure statement supplement, Austria, Australia, Belgium, Denmark, Finland, France, Germany, Hong Kong, Ireland, Israel, Italy, Japan, the Netherlands, New Zealand, Norway, Portugal, Singapore, Spain, Sweden, Switzerland and the United Kingdom. The constituent stocks of the index are derived from the constituent stocks in the 21 MSCI standard single country indices for the developed market countries listed above. The index is calculated in U.S. dollars on a total return net basis.The index was launched on December 31, 1969 at an initial value of 100.
MSCI divides the companies included in the index into ten Global Industry Classification Sectors: Consumer Discretionary, Consumer Staples, Energy, Financials, Health Care, Industrials, Information Technology, Materials, Telecommunication Services and Utilities.
Construction of the MSCI Indices
MSCI undertakes an index construction process, which involves: (i) defining the equity universe; (ii) determining the market investable equity universe for each market; (iii) determining market capitalization size segments for each market; (iv) applying index continuity rules for the standard index; (v) creating style segments within each size segment within each market; and (vi) classifying securities under the Global Industry Classification Standard. The index construction methodology differs in some cases depending on whether the relevant market is considered a developed market or an emerging market. All of the MSCI Indices are standard indices, meaning that only securities that would qualify for inclusion in a large cap index or a mid cap index will be included as described below.
Defining the Equity Universe
Identifying Eligible Equity Securities: The equity universe initially looks at securities listed in any of the countries in the MSCI Global Index series, which will be classified as either “developed markets” or “emerging markets”. All listed equity securities, including real estate investment trusts and certain income trusts in Canada are eligible for inclusion in the equity universe. Conversely, mutual funds (other than business development companies in the U.S.), exchange-traded funds, equity derivatives, limited partnerships and most investment trusts are not eligible for inclusion in the equity universe.

S-85
Country Classification of Eligible Securities: Each company and its securities (i.e., share classes) are classified in one and only one country, which allows for a distinctive sorting of each company by its respective country.
Determining the Market Investable Equity Universes
A market investable equity universe for a market is derived by applying investability screens to individual companies and securities in the equity universe that are classified in that market. A market is generally equivalent to a single country. The global investable equity universe is the aggregation of all market investable equity universes. The investability screens used to determine the investable equity universe in each market are:
Equity Universe Minimum Size Requirement: This investability screen is applied at the company level. In order to be included in a market investable equity universe, a company must have the required minimum market capitalization. The equity universe minimum size requirement applies to companies in all markets and is derived as follows:
• First, the companies in the developed market equity universe are sorted in descending order of full market capitalization and the cumulative coverage of the free float-adjusted market capitalization of the developed market equity universe is calculated for each company. Each company’s free float-adjusted market capitalization is represented by the aggregation of the free float-adjusted market capitalization of the securities of that company in the equity universe.
• Second, when the cumulative free float-adjusted market capitalization coverage of 99% of the sorted equity universe is achieved, by adding each company’s free float-adjusted market capitalization in descending order, full market capitalization of the company that reaches the 99% threshold defines the equity universe minimum size requirement.
• The rank of this company by descending order of full market capitalization within the developed market equity universe is noted, and will be used in determining the equity universe minimum size requirement at the next rebalance.
As of November 2013, the equity universe minimum size requirement was set at U.S. $162 million. Companies with a full market capitalization below this level are not included in any market investable equity universe. The equity universe minimum size requirement is reviewed and, if necessary, revised at each semi-annual index review, as described below.
Equity Universe Minimum Free Float-Adjusted Market Capitalization Requirement: This investability screen is applied at the individual security level. To be eligible for inclusion in a market investable equity universe, a security must have a free float-adjusted market capitalization equal to or higher than 50% of the equity universe minimum size requirement.
Minimum Liquidity Requirement: This investability screen is applied at the individual security level. To be eligible for inclusion in a market investable equity universe, a security must have adequate liquidity as measured by its 12-month and 3-month annualized traded value ratio. This measure attempts to screen out extreme daily trading volumes and takes into account the free float-adjusted market capitalization size of securities. In the calculation of a security’s annualized traded value ratio, the trading volumes in depository receipts associated with that security, such as ADRs or GDRs, are also considered. A minimum liquidity level of 20% of the 3-month annualized traded value ratio and 90% of 3-month frequency of trading over the last four consecutive quarters, as well as 20% of the 12-month annualized traded value ratio, are required for inclusion of a security in a market investable equity universe of a developed market. A minimum liquidity level of 15% of the 3-month annualized traded value ratio and 80% of 3-month frequency of trading over the last four consecutive quarters, as well as 15% of the 12-month annualized traded value ratio, are required for inclusion of a security in a market investable equity universe of an emerging market.
Due to liquidity concerns relating to securities trading at very high stock prices, a security that is currently not a constituent of a MSCI Global Investable Markets Index that is trading at a stock price above U.S. $10,000 will fail the liquidity screening and will not be included in any market investable equity universe.
Global Minimum Foreign Inclusion Factor Requirement: This investability screen is applied at the individual security level. To determine the free float of a security, MSCI considers the proportion of shares of such security available for purchase in the public equity markets by international investors. In practice, limitations on the investment opportunities for international investors include: strategic stakes in a company held by private or public shareholders whose investment objective indicates that the shares held are not likely to be available in the market; limits on the proportion of a security’s share capital authorized for purchase by non-domestic investors; or other foreign investment restrictions which materially limit the ability of foreign investors to freely invest in a particular equity market, sector or security.
MSCI will then derive a “foreign inclusion factor” for the company that reflects the proportion of shares outstanding that is available for purchase in the public equity markets by international investors. MSCI will then “float-adjust” the

S-86
weight of each constituent company in an index by the company’s foreign inclusion factor. Typically, securities with a free float adjustment ratio of less than 0.15 will not be eligible for inclusion in MSCI’s indices.
Once the free float factor has been determined for a security, the security’s total market capitalization is then adjusted by such free float factor, resulting in the free float-adjusted market capitalization figure for the security.
Minimum Length of Trading Requirement: This investability screen is applied at the individual security level. For an initial public offering to be eligible for inclusion in a market investable equity universe, the new issue must have started trading at least four months before the implementation of the initial construction of the index or at least three months before the implementation of a semi-annual index review. This requirement is applicable to small new issues in all markets. Large initial public offerings are not subject to the minimum length of trading requirement and may be included in a market investable equity universe and a standard index, such as the MSCI Indices, outside of a quarterly or semi-annual index review.
Minimum Foreign Room Requirement: This investability screen is applied at the individual security level. For a security that is subject to a foreign ownership limit to be eligible for inclusion in a market investable equity universe, the proportion of shares still available to foreign investors relative to the maximum allowed (referred to as “foreign room”) must be at least 15%.
Defining Market Capitalization Size Segments for Each Market
Once a market investable equity universe is defined, it is segmented into the following size-based indices:
• Investable Market Index (Large Cap + Mid Cap + Small Cap)
• Standard Index (Large Cap + Mid Cap)
• Large Cap Index
• Mid Cap Index
• Small Cap Index
Creating the size segment indices in each market involves the following steps: (i) defining the market coverage target range for each size segment; (ii) determining the global minimum size range for each size segment; (iii) determining the market size−segment cutoffs and associated segment number of companies; (iv) assigning companies to the size segments; and (v) applying final size-segment investability requirements. For developed market indices and emerging market indices, the market coverage for a standard index is 85% and 42.5% respectively. As of November 2013, the global minimum size range for a developed market standard index is a full market capitalization of USD 2.41 billion to USD 5.54 billion, and the global minimum size range for an emerging market standard index is a full market capitalization of USD 1.20 billion to USD 2.77 billion.
Index Continuity Rules for Standard Indices
In order to achieve index continuity, as well as provide some basic level of diversification within a market index, notwithstanding the effect of other index construction rules, a minimum number of five constituents will be maintained for a developed market standard index and a minimum number of three constituents will be maintained for an emerging market standard index, and involves the following steps:
• If after the application of the index construction methodology, a developed market standard index contains fewer than five securities or an emerging market standard index contains fewer than three securities, then the largest securities by free float-adjusted market capitalization are added to the index in order to reach the minimum number of required constituents.
• At subsequent index reviews, if the free float-adjusted market capitalization of a non-index constituent is at least 1.50 times the free float-adjusted market capitalization of the smallest existing constituent after rebalancing, the larger free float-adjusted market capitalization security replaces the smaller one.
Creating Style Indices within Each Size Segment
All securities in the investable equity universe are classified into value or growth segments. The classification of a security into the value or growth segment is used by MSCI to construct additional indices.

S-87
Classifying Securities under the Global Industry Classification Standard
All securities in the global investable equity universe are assigned to the industry that best describes their business activities. The GICS classification of each security is used by MSCI to construct additional indices.
Calculation Methodology for the MSCI Indices
The performance of each of the MSCI Indices is a free float weighted average of the U.S. dollar values of its component securities.
Prices used to calculate the component securities are the official exchange closing prices or prices accepted as such in the relevant market. In general, all prices are taken from the main stock exchange or exchanges in each market. In the event of a market disruption resulting in any component security price to be unavailable, MSCI will generally use the last reported price for such component security for the purpose of performance calculation. Closing prices are converted into U.S. dollars, as applicable, using the closing exchange rates calculated by WM/Reuters at 4:00 P.M. London Time.
Companies may be listed simultaneously on more than one stock exchange in Japan. A company may apply for delisting from one stock exchange while remaining listed on other stock exchanges. For such delisting, Japanese stock exchanges generally give notice one month prior to the expected last trading date of the security to be delisted. Should such delisting involve a change in the primary exchange and/or trigger a change in the price source, MSCI will obtain the price of the security from the new primary exchange two weeks after an announcement of delisting from the stock exchange.
Daily Total Return Methodology
The MSCI Indices are net daily total return indices. A daily total return index measures the market performance, including price performance and income from regular cash distributions, while a net daily total return index measures the price performance and income from dividends, net of certain withholding taxes. MSCI calculates withholding taxes using the highest applicable withholding tax rate applicable to institutional investors. The current withholding tax rate used by MSCI to calculate the MSCI Japan Index is 15.315%. This net income is reinvested in the index and thus makes up part of the total index performance. MSCI’s net daily total return methodology reinvests cash dividends in indices the day the security is quoted ex-dividend, or on the ex-date. In the case of the MSCI Japan Index, since many Japanese companies declare their dividends after the ex-date but make estimated dividends broadly available before the ex-date, an estimation of the dividend, or else the previous year dividend if no estimation is available, is reinvested on the ex-date. Certain dividends, including special/extra dividends and commemorative dividends, are reinvested in the indices if, a day prior to the ex-date, the dividend impact on price is less than 5%. If the impact is 5% or more, the dividend will be reflected in the indices through a price adjustment. A specific price adjustment is always applied for stock dividends that are issued at no cost to the shareholders, an extraordinary capital repayment or a dividend paid in the shares of another company. Cash payments related to corporate events, such as mergers and acquisitions, are considered on a case-by-case basis.
Maintenance of the MSCI Indices
In order to maintain the representativeness of the MSCI Indices, structural changes may be made by adding or deleting component securities. Currently, such changes in the MSCI Indices may generally only be made on four dates throughout the year: after the close of the last scheduled business day of each February, May, August and November.
Each country index is maintained with the objective of reflecting, on a timely basis, the evolution of the underlying equity markets. In maintaining each component country index, emphasis is also placed on its continuity, replicability and on minimizing turnover.
MSCI classifies index maintenance in three broad categories. The first consists of ongoing event related changes, such as mergers and acquisitions, which are generally implemented in the country indices in which they occur. The second category consists of quarterly index reviews, aimed at promptly reflecting other significant market events. The third category consists of semi-annual index reviews that systematically re-assess the various dimensions of the equity universe for all countries simultaneously and are conducted on a fixed semi-annual timetable.
Ongoing event-related changes to the MSCI Indices are the result of mergers, acquisitions, spin-offs, bankruptcies, reorganizations and other similar corporate events. They can also result from capital reorganizations in the form of rights issues, stock bonus issues, public placements and other similar corporate actions that take place on a continuing basis. MSCI will remove from the indices as soon as practicable securities of companies that file for bankruptcy or other protection from their creditors, that are suspended and for which a return to normal business activity and trading is unlikely in the near future; or that fail stock exchange listing requirements with a delisting announcement. Securities may also be considered for early deletion in other significant cases, such as decreases in free float and foreign ownership limits, or

S-88
when a constituent company acquires or merges with a non-constituent company or spins-off another company. In practice, when a constituent company is involved in a corporate event which decreases by more than 33% the company’s full market capitalization or decreases its foreign inclusion factor to below 0.15, the securities of the constituent company are considered for early deletion from the indices simultaneously with the event. Share conversions may also give rise to an early deletion. All changes resulting from corporate events are announced prior to their implementation in the indices, provided all necessary information on the event is available.
MSCI’s quarterly index review process is designed to ensure that the country indices continue to be an accurate reflection of evolving equity markets. This goal is achieved by timely reflecting significant market driven changes that were not captured in each index at the time of their actual occurrence and that should not wait until the semi-annual index review due to their importance. These quarterly index reviews may result in additions and deletions of component securities from a country index and changes in “foreign inclusion factors” and in number of shares. Additions and deletions to component securities may result from: the addition of large companies that did not meet the minimum size criterion for inclusion at the time of their initial public offering or secondary offering; the replacement of companies which are no longer suitable industry representatives; the deletion of securities whose overall free float has fallen to less than 15% and that do not meet specified criteria; the deletion of securities that have become very small or illiquid; and the addition or deletion of securities as a result of other market events. Significant changes in free float estimates and corresponding changes in the foreign inclusion factor for component securities may result from: large market transactions involving strategic shareholders that are publicly announced; secondary offerings that, given lack of sufficient notice or small size (less than 5% of the company’s outstanding shares) were not reflected immediately; increases in foreign ownership limits; decreases in foreign ownership limits which did not require foreign investors to immediately sell shares in the market; corrections resulting from the reclassification of shareholders from strategic to non-strategic, and vice versa, and/or updates to the number of shares outstanding; updates to foreign inclusion factors following the public disclosure of new shareholder structures for companies involved in mergers, acquisitions or spin-offs, where different from MSCI’s pro forma free float estimate at the time of the event; large conversions of exchangeable bonds and other similar securities into already existing shares; the end of lock-up periods or expiration of loyalty incentives for non-strategic shareholders; and changes in the foreign inclusion factor as a result of other events of similar nature. Small changes in the number of shares resulting from, for example, exercise of options or warrants, conversion of convertible bonds or other instruments or share buybacks, are generally updated at the quarterly index review rather than at the time of the change. The results of the quarterly index reviews are announced at least two weeks in advance of their effective implementation dates as of the close of the last business day of February and August. MSCI has noted that consistency is a factor in maintaining each component country index.
MSCI’s semi-annual index review is designed to systematically reassess the component securities of the index. During each semi-annual index review, the universe of component securities is updated and the global minimum size range for the index is recalculated, which is based on the full market capitalization and the cumulative free float-adjusted market capitalization coverage of each security that is eligible to be included in the index. The following index maintenance activities, among others, are undertaken during each semi-annual index review: the component securities are updated by identifying new equity securities that were not part of the index at the time of the previous quarterly index review; the minimum size requirement for the index is updated and new companies are evaluated relative to the new minimum size requirement; existing component securities that do not meet the minimum liquidity requirements of the index may be removed; and changes in “foreign inclusion factors” are implemented. During a semi-annual index review, component securities may be added or deleted from a country index for a range of reasons, including the reasons discussed with respect to component securities changes during quarterly index reviews as discussed above. The results of the semi-annual index reviews are announced at least two weeks in advance of their effective implementation date as of the close of the last business day of May and November.
Index maintenance also includes monitoring and completing adjustments for share changes, stock splits, stock dividends, and stock price adjustments due to company restructurings or spin-offs.
Daily closing price information for the MSCI Indices is available on the following website: http://www.msci.com. We are not incorporating by reference that website or any material it includes in this disclosure statement supplement.
Historical Closing Prices of the Fund’s Shares
The closing price of shares of the fund has fluctuated in the past and may, in the future, experience significant fluctuations. Any historical upward or downward trend in the closing price of the shares during the period shown below is not an indication that the shares are more or less likely to increase or decrease at any time during the life of your CDs. The period shown below will be approximately ten years, but may be shorter if Bloomberg Financial Services does not

S-89
provide historical closing prices for the entirety of such period (whether due to the applicable inception date occurring less than ten years from the date hereof or otherwise).
You should not take the historical closing prices of the shares as an indication of the future performance of the shares. We cannot give you any assurance that the future performance of the shares will result in your receiving an amount greater than the outstanding face amount of your CDs on the stated maturity date. Neither we nor any of our affiliates make any representation to you as to the performance of the shares. Before investing in the offered CDs, you should consult publicly available information to determine the relevant fund closing prices between the date of this disclosure statement supplement and the date of your purchase of the offered CDs. The actual performance of the fund over the life of the offered CDs, as well as the payment amount at maturity may bear little relation to the historical prices shown below.
The graph below shows the daily historical prices of the shares of the fund from May 30, 2004 through May 30, 2014. We obtained the closing prices shown in the graph below from Bloomberg Financial Services without independent verification.
“iShares®” is a registered trademark of BlackRock Institutional Trust Company, N.A. (BITC). The index is not sponsored, endorsed, sold, or promoted by BITC. BITC makes no representations or warranties to the owners of the index or any member of the public regarding the advisability of investing in the index. BITC has no obligation or liability in connection with the operation, marketing, trading or sale of the index.

S-90
iShares® MSCI Japan ETF The shares of the iShares® MSCI Japan ETF (the “fund”) are issued by iShares, Inc. (the “company”). The company
was organized as a Maryland corporation on September 1, 1994 and is authorized to have multiple series or portfolios, of which the fund is one. On July 1, 2013, the iShares® MSCI Japan Index Fund changed its name to the iShares® MSCI Japan ETF.
• The fund is a tracking ETF that seeks investment results which correspond generally to the price and yield performance, before fees and expenses, of the index.
• The index it tracks is the MSCI Japan Index (the “index”).
• Investment Advisor: BlackRock Fund Advisors (“BFA”).
• The fund’s shares trade on the NYSE Arca under the ticker symbol “EWJ”.
• The company’s SEC CIK Number is 0000930667.
• The fund’s inception date was March 12, 1996.
• The fund’s shares are issued or redeemed only in creation units of 600,000 shares or multiples thereof.
We obtained the following fee information from the iShares® website without independent verification. The investment advisor is entitled to receive a management fee from the fund based on the fund’s allocable portion of the aggregate of the average daily net assets of the fund and a set of other specified iShares® funds as follows: 0.59% per annum of the aggregate net assets of the funds less than or equal to $7.0 billion, plus 0.54% per annum of the aggregate net assets of the funds on amounts in excess of $7.0 billion up to $11.0 billion, plus 0.49% per annum of the aggregate net assets of the funds on amounts in excess of $11.0 billion up to $24.0 billion, plus 0.44% per annum of the aggregate net assets of the funds on amounts in excess of $24.0 billion up to $48.0 billion, plus 0.40% per annum of the aggregate net assets of the funds in excess of $48.0 billion. As of March 31, 2014, the aggregate expense ratio of the fund was 0.48% per annum.
For additional information regarding the company or BFA, please consult the reports (including the Annual Report to Shareholders on Form N-CSR for the fiscal year ended August 31, 2013) and other information the company files with the SEC. In addition, information regarding the fund, including its top portfolio holdings, may be obtained from other sources including, but not limited to, press releases, newspaper articles, other publicly available documents and the iShares® website at http://us.ishares.com/product_info/fund/overview/EWJ.htm. We are not incorporating by reference the website, the sources listed above or any material they include in this disclosure statement supplement.
Investment Objective
The fund seeks to provide investment results that correspond generally to the price and yield performance, before fees and expenses, of the index. The fund’s investment objective and the index may be changed without the approval of BFA’s shareholders.
The following table displays the top holdings and weightings by industry sector of the fund. (Sector designations are determined by the fund sponsor using criteria it has selected or developed. Index and fund sponsors may use very different standards for determining sector designations. In addition, many companies operate in a number of sectors, but are listed in only one sector and the basis on which that sector is selected may also differ. As a result, sector comparisons between indices or funds with different sponsors may reflect differences in methodology as well as actual differences in the sector composition of the indices or funds.) We obtained the information in the tables below from the fund website without independent verification.

S-91
iShares® MSCI Japan ETF Top Ten Holdings as of May 27, 2014
Fund Stock Issuer Percentage (%) TOYOTA MOTOR CORP 5.75%
MITSUBISHI UFJ FINANCIAL GRO 2.78% SOFTBANK CORP 2.52%
HONDA MOTOR CO LTD 2.19% SUMITOMO MITSUI FINANCIAL GR 1.89% MIZUHO FINANCIAL GROUP INC 1.68%
CANON INC 1.42% JAPAN TOBACCO INC 1.40%
TAKEDA PHARMACEUTICAL CO LTD 1.38% HITACHI LTD 1.28%
Total 22.29% iShares® MSCI Japan ETF Weighting by Sector as of May 27, 2014*
Sector Percentage (%) Consumer Discretionary 20.35%
Industrials 19.84% Financials 19.76%
Information Technology 10.65% Consumer Staples 6.86%
Health Care 6.39% Materials 5.76%
Telecommunication Services 5.49% Utilities 2.46% Energy 1.32%
Other/Undefined 1.12% Total 100.00%
* Percentages may not sum to 100% due to rounding.
Representative Sampling
BFA uses a representative sampling strategy to attempt to track the performance of the index. For the fund, this strategy involves investing in a representative sample of securities that collectively have an investment profile similar to that of the index. The securities selected are expected to have aggregate investment characteristics (based on factors such as market capitalization and industry weightings), fundamental characteristics (such as return variability, earnings valuation and yield) and liquidity measures similar to those of the index.
The fund generally invests at least 90% of its assets in the securities of the index and in depositary receipts representing securities of the index. The fund may invest the remainder of its assets in securities not included in the index, but which BFA believes will help the fund track the index. The fund may also invest its other assets in futures contracts, options and swaps, as well as cash and cash equivalents, including shares of money market funds affiliated with BFA. Also, the fund may lend securities representing up to one-third of the value of the fund's total assets (including the value of the collateral received).
Tracking Error
The performance of the fund and the index may vary due to a variety of factors, including differences between the fund’s assets and the index, pricing differences, transaction costs, the fund’s holding of cash, differences in timing of the accrual of dividends and differences between the fund’s portfolio and the index resulting from new or existing legal restrictions that apply to the fund but not to the index or to investors using a representative sampling strategy in general. BFA expects that, over time, the fund’s tracking error will not exceed 5%. The fund’s use of a representative sampling strategy can be expected to produce a greater tracking error over a period of time than would result if the fund used an indexing strategy in which a fund invests in substantially all of the securities in its index in approximately the same proportions as in the index.
As of April 30, 2014, iShares reported the following average annual returns on the market price of the fund’s shares and the index. The market price of the fund’s shares takes into account distributions on the shares and the returns shown account for changes in the mid-point of the bid and ask prices at 4:00 p.m., Eastern time on the relevant date. Fund

S-92
shares: 1 year, -4.28; 3 years, 3.50; 5 years, 7.09; 10 years, 2.09; since inception, -0.69; index: 1 year, -3.70; 3 years, 4.33; 5 years, 7.78; 10 years, 2.09%; since fund inception, -0.69.
Industry Concentration Policy
The fund will concentrate its investments (i.e., hold 25% or more of its total assets) in a particular industry or group of industries to approximately the same extent that the index is concentrated in that industry or group of industries.
The MSCI Japan Index
The index is a stock index calculated, published and disseminated daily by MSCI Inc. (“MSCI”) through numerous data vendors, on the MSCI website and in real time on Bloomberg Financial Markets and Reuters Limited.
The index is a free float-adjusted market capitalization index and is one of the MSCI Global Investable Market Indices (the “MSCI Indices”), the methodology of which is described below. The index is categorized by MSCI as a developed market index and is considered a “standard” index, which means it consists of all eligible large capitalization and mid-capitalization stocks, as determined by MSCI, in the relevant market. Additional information about the MSCI Indices is available on the following website: http://www.msci.com/products/indices/country_and_regional/em/ methodology.html. Daily closing price information for the index is available on the following website: http://www.mscibarra.com/products/indices/international_equity_indices/performance.html. We are not incorporating by reference the website, the sources listed above or any material they include in this disclosure statement supplement.
The index is designed to measure the performance of the large- and mid-capitalization segments of Japan’s equity market. The 320 constituent stocks of the index (as of December 31, 2013) are selected from an eligible universe of equity securities listed on national Japanese stock exchanges including the Tokyo Stock Exchange, Osaka Stock Exchange, JASDAQ and Nagoya Stock Exchange. The index is calculated in U.S. dollars on a total return net basis. The index was launched on December 31, 1969 at an initial value of 100.
MSCI divides the companies included in the index into ten Global Industry Classification Sectors: Financials, Consumer Discretionary, Industrials, Information Technology, Consumer Staples, Materials, Health Care, Telecommunication Services, Utilities and Energy.
For additional information about the construction, calculation methodology and maintenance of the index, please see “iShares® MSCI EAFE ETF — Construction of the MSCI Indices”, “iShares® MSCI EAFE ETF — Calculation Methodology for the MSCI Indices” and “iShares® MSCI EAFE ETF — Maintenance of the MSCI Indices”, respectively, on pages S-84, S-87 and S-87 of this disclosure statement supplement, respectively.
Historical Closing Prices of the Fund’s Shares
The closing price of shares of the fund has fluctuated in the past and may, in the future, experience significant fluctuations. Any historical upward or downward trend in the closing price of the shares during the period shown below is not an indication that the shares are more or less likely to increase or decrease at any time during the life of your CDs. The period shown below will be approximately ten years, but may be shorter if Bloomberg Financial Services does not provide historical closing prices for the entirety of such period (whether due to the applicable inception date occurring less than ten years from the date hereof or otherwise).
You should not take the historical closing prices of the shares as an indication of the future performance of the shares. We cannot give you any assurance that the future performance of the shares will result in your receiving an amount greater than the outstanding face amount of your CDs on the stated maturity date. Neither we nor any of our affiliates make any representation to you as to the performance of the shares. Before investing in the offered CDs, you should consult publicly available information to determine the relevant fund closing prices between the date of this disclosure statement supplement and the date of your purchase of the offered CDs. The actual performance of the fund over the life of the offered CDs, as well as the payment amount at maturity may bear little relation to the historical prices shown below.
The graph below shows the daily historical prices of the shares of the fund from May 30, 2004 through May 30, 2014. We obtained the closing prices shown in the graph below from Bloomberg Financial Services without independent verification.

S-93
“iShares®” is a registered trademark of BlackRock Institutional Trust Company, N.A. (BITC). The index is not
sponsored, endorsed, sold, or promoted by BITC. BITC makes no representations or warranties to the owners of the index or any member of the public regarding the advisability of investing in the index. BITC has no obligation or liability in connection with the operation, marketing, trading or sale of the index.

S-94
iShares® 20+ Year Treasury Bond ETF
The shares of the iShares® 20+ Year Treasury Bond ETF (the “fund”) are issued by iShares® Trust, a registered investment company. On July 1, 2013, the iShares® Barclays 20+ Year Treasury Bond Fund changed its name to iShares® 20+ Year Treasury Bond ETF.
• The fund is a tracking ETF that seeks investment results which correspond generally to the price and yield performance, before fees and expenses, of the index.
• The index it tracks is the Barclays U.S. 20+ Year Treasury Bond Index (the “index”).
• Investment Advisor: BlackRock Fund Advisors (“BFA”).
• The fund’s shares trade on the NYSE Arca under the ticker symbol “TLT”.
• The iShares® Trust’s SEC CIK Number is 0001100663.
• The fund’s inception date was July 22, 2002.
• The fund’s shares are issued or redeemed only in creation units of 100,000 shares or multiples thereof.
We obtained the following fee information from the iShares® website without independent verification. The investment advisor is entitled to receive a management fee from the fund based on a percentage of the fund’s average daily net assets, at an annual rate of 0.15%. BFA is responsible for substantially all expenses of the fund, except interest expenses, taxes, brokerage expenses, future distribution fees or expenses and extraordinary expenses. As of April 24, 2014, the expense ratio of the fund was 0.15% per annum.
For additional information regarding iShares® Trust or BFA, please consult the reports (including the Annual Report to Shareholders on Form N−CSR for the fiscal year ended February 28, 2014) and other information iShares® Trust files with the SEC. In addition, information regarding the fund, including its top portfolio holdings, may be obtained from other sources including, but not limited to, press releases, newspaper articles, other publicly available documents, and the iShares® website at http://us.ishares.com/product_info/fund/overview/TLT.htm. We are not incorporating by reference the website, the sources listed above or any material they include in this disclosure statement supplement.
Investment Objective and Strategy
The fund seeks to provide investment results that correspond generally to the price and yield performance, before fees and expenses, of the index. The fund’s investment objective and the index that the fund tracks may be changed without shareholder approval.
BFA uses a representative sampling strategy to attempt to track the performance of the index. For the fund, this strategy involves investing in a representative sample of securities that collectively have an investment profile similar to that of the index. The securities selected are expected to have aggregate investment characteristics (based on factors such as market capitalization and industry weightings), fundamental characteristics (such as return variability, duration, maturity or credit ratings and yield) and liquidity measures similar to those of the index. The fund may or may not hold all of the securities in the index.
The fund generally invests at least 90% of its assets in the bonds in the index and at least 95% of its assets in U.S. government bonds. The fund may invest up to 10% of its assets in U.S. government bonds not included in the index, but which BFA believes will help the fund track the index. For example, the fund may invest in bonds or other assets not included in the index in order to reflect changes in the index (such as reconstitutions, additions and deletions). The fund may also invest up to 5% of its assets in repurchase agreements collateralized by U.S. government obligations and in cash and cash equivalents, including shares of money market funds advised by BFA or its affiliates. The fund may lend securities representing up to one-third of the value of the fund’s total assets (including the value of the collateral received).
The Index
The index is sponsored by Barclays Capital Inc. (Barclays), which determines the composition and relative weightings of the securities in the index and publishes information regarding its market value. The index includes all publicly-issued U.S. Treasury securities that have a remaining maturity greater than or equal to 20 years, are rated investment grade (Baa3/BBB- or higher using the middle rating of Moody’s, S&P and Fitch) and have $250 million or more of outstanding face value. In addition, the securities must be denominated in U.S. dollars, bear a fixed rate of interest and not be convertible. The index does not include state and local government series bonds or coupon issues that have been

S-95
stripped from bonds. The index is market capitalization weighted and includes all of the securities that meet the index criteria. The securities in the index are updated on the last business day of each month. The index is calculated in U.S. dollars on a total return (gross) basis.
The Fund’s Holdings
The following table displays the top holdings of the fund. We obtained the information in the tables below from the iShares® website without independent verification.
iShares® 20+ Year Treasury Bond ETF Top Ten Holdings as of May 27, 2014
U.S. Treasury Bond Percentage (%)
3.13% due 2/15/2043 13.93% 3.63% due 8/15/2043 10.67% 4.25% due 11/15/2040 8.13% 3.75% due 8/15/2041 7.64% 2.75% due 8/15/2042 7.41% 4.38% due 5/15/2040 7.27% 4.63% due 2/15/2040 5.03% 3.13% due 11/15/2041 4.66% 3.75% due 11/15/2043 4.22% 2.75% due 11/15/2042 3.89%
Total 72.85% The following table displays additional information about the bonds held by the fund and the annualized performance
difference, in each case as of May 27, 2014. We obtained the information in the table below from the iShares® website without independent verification.
Weighted average maturity 26.91 years
Weighted average coupon 3.56%
Effective duration 16.71
Weighted average maturity is the mean of the remaining term to maturity of the bonds held by the fund. Weighted average coupon is the mean of the interest rates, or coupons, payable on the bonds. Effective duration is a measure of the responsiveness of a bond or portfolio price to interest rates, taking into account the impact on expected bond cash flows due to interest rate changes.
As of May 27, 2014, the fund had 24 holdings, 98.01% of which were U.S. Treasury bonds, and 1.99% of which were cash or short-term securities, 84.08% of the fund’s holdings were rated Aaa by Moody’s and 84.08% of the fund’s holdings were rated AA+ by S&P.
Tracking Error
The performance of the fund and the index may vary due to a variety of factors, including transaction costs, timing variances and differences between the fund’s portfolio and the index resulting from legal restrictions (such as diversification requirements) that apply to the fund but not to the index or to investors using a representative sampling strategy in general. BFA expects that, over time, the fund’s tracking error will not exceed 5%. The fund’s use of a representative sampling strategy can be expected to produce a greater tracking error over a period of time than would result if the fund used an indexing strategy in which a fund invests in substantially all of the securities in its index in approximately the same proportions as in the index.
As of April 30, 2014, iShares reported the following average annual returns on the market price of the fund’s shares and the index. The market price of the fund’s shares takes into account distributions on the shares and the returns shown account for changes in the mid-point of the bid and ask prices at 4:00 p.m., Eastern time on the relevant date. Fund shares: 1 year, -6.84; 3 years, 9.08; 5 years, 6.13; 10 years, 7.07; since inception, 6.85; index: 1 year, -6.55; 3 years, 9.33; 5 years, 6.31; 10 years, 7.17%; since fund inception, 6.96.

S-96
Historical Closing Prices of the Fund’s Shares
The closing price of shares of the fund has fluctuated in the past and may, in the future, experience significant fluctuations. Any historical upward or downward trend in the closing price of the shares during the period shown below is not an indication that the shares are more or less likely to increase or decrease at any time during the life of your CDs. The period shown below will be approximately ten years, but may be shorter if Bloomberg Financial Services does not provide historical closing prices for the entirety of such period (whether due to the applicable inception date occurring less than ten years from the date hereof or otherwise).
You should not take the historical closing prices of the shares as an indication of the future performance of the shares. We cannot give you any assurance that the future performance of the shares will result in your receiving an amount greater than the outstanding face amount of your CDs on the stated maturity date. Neither we nor any of our affiliates make any representation to you as to the performance of the shares. Before investing in the offered CDs, you should consult publicly available information to determine the relevant fund closing prices between the date of this disclosure statement supplement and the date of your purchase of the offered CDs. The actual performance of the fund over the life of the offered CDs, as well as the payment amount at maturity may bear little relation to the historical prices shown below.
The graph below shows the daily historical prices of the shares of the fund from May 30, 2004 through May 30, 2014. We obtained the closing prices shown in the graph below from Bloomberg Financial Services without independent verification.
“iShares®” is a registered trademark of BlackRock Institutional Trust Company, N.A. (BITC). The index is not sponsored, endorsed, sold, or promoted by BITC. BITC makes no representations or warranties to the owners of the index or any member of the public regarding the advisability of investing in the index. BITC has no obligation or liability in connection with the operation, marketing, trading or sale of the index.

S-97
iShares® iBoxx $ Investment Grade Corporate Bond ETF
The shares of the iShares® iBoxx $ Investment Grade Corporate Bond ETF (the “fund”) are issued by iShares® Trust, a registered investment company. On July 1, 2013, iShares® iBoxx $ Investment Grade Corporate Bond Fund changed its name to iShares® iBoxx $ Investment Grade Corporate Bond ETF.
• The fund is a tracking ETF that seeks investment results which correspond generally to the price and yield performance, before fees and expenses, of the index.
• The index it tracks is the Markit iBoxx® USD Liquid Investment Grade Index (the “index”).
• Investment Advisor: BlackRock Fund Advisors (“BFA”).
• The fund’s shares trade on the NYSE Arca under the ticker symbol “LQD”.
• The iShares® Trust’s SEC CIK Number is 0001100663.
• The fund’s inception date was July 22, 2002.
• The fund’s shares are issued or redeemed only in creation units of 100,000 shares or multiples thereof.
We obtained the following fee information from the iShares® website without independent verification. For its investment advisory services to the fund, BFA is entitled to receive a management fee from the fund corresponding to the fund’s allocable portion of an aggregate management fee based on the aggregate average daily net assets of the fund and a set of other specified iShares® funds (the “Combined Funds”), at an annual rate of 0.1500% for the first $121 billion of assets, 0.1425% for assets of over $121 billion and up to $211 billion, and 0.1354% for assets over $211 billion. As of March 31, 2014, the expense ratio of the fund was 0.15% per annum.
For additional information regarding iShares® Trust or BFA, please consult the reports (including the Semi-Annual Report to Shareholders on Form N−CSRS for the period ended August 31, 2013) and other information iShares® Trust files with the SEC. In addition, information regarding the fund, including its top portfolio holdings, may be obtained from other sources including, but not limited to, press releases, newspaper articles, other publicly available documents, and the iShares® website at http://us.ishares.com/product_info/fund/overview/LQD.htm. We are not incorporating by reference the website, the sources listed above or any material they include in this disclosure statement supplement.
Investment Objective and Strategy
The fund seeks to provide investment results that correspond generally to the price and yield performance, before fees and expenses, of the index. The fund’s investment objective and the index may be changed without the approval of BFA’s shareholders.
The following table displays the top holdings and weightings by industry sector of the fund. (Sector designations are determined by the fund sponsor using criteria it has selected or developed. Index and fund sponsors may use very different standards for determining sector designations. In addition, many companies operate in a number of sectors, but are listed in only one sector and the basis on which that sector is selected may also differ. As a result, sector comparisons between indices or funds with different sponsors may reflect differences in methodology as well as actual differences in the sector composition of the indices or funds.). We obtained the information in the tables below from the fund website without independent verification.

S-98
iShares® iBoxx $ Investment Grade Corporate Bond ETF Top Ten Holdings as of May 27, 2014
Corporate Bond Issuer Percentage (%) BLACKROCK FDS III 1.05%
VERIZON COMMUNICATIONS INC 0.75% VERIZON COMMUNICATIONS INC 0.40%
MERRILL LYNCH & CO INC 0.35% GOLDMAN SACHS GROUP INC 0.33%
GENERAL ELECTRIC CAPITAL CORP 0.32% GENERAL ELECTRIC CAPITAL CORP 0.31%
APPLE INC 0.30% WAL-MART STORES INC 0.30%
THE GOLDMAN SACHS GROUP INC 0.29%
Total 4.40% iShares® iBoxx $ Investment Grade Corporate Bond ETF Weighting by Sector
as of May 27, 2014*
Sector Percentage (%) Financials 33.11% Oil & Gas 12.34%
Consumer Services 10.92% Health Care 8.56%
Telecommunications 7.88% Consumer Goods 7.86%
Technology 6.08% Basic Materials 5.28%
Industrials 4.41% Other/Undefined 1.95%
Utilities 1.52% Financial Institutions 0.07%
Total 99.98% * Percentages may not sum to 100% due to rounding.
The following table displays additional information about the bonds held by the fund, in each case as of May 27, 2014. We obtained the information in the table below from the iShares® website without independent verification.
Weighted average maturity 11.71 years Weighted average coupon 4.56%
Effective duration 7.71 Weighted average maturity is the mean of the remaining term to maturity of the bonds held by the fund. Weighted
average coupon is the mean of the interest rates, or coupons, payable on the bonds. Effective duration is a measure of the responsiveness of a bond or portfolio price to interest rates, taking into account the impact on expected bond cash flows due to interest rate changes.
Representative Sampling
Although the fund seeks results that correspond generally to the performance of the index, the fund uses a representative sampling strategy to attempt to track the performance of the index. For the fund, this strategy involves investing in a representative sample of securities that collectively have an investment profile similar to that of the index, although the fund holdings do not identically correspond to the holdings and weightings of the index and may diverge significantly from the index. The securities selected are expected to have aggregate investment characteristics (based on

S-99
factors such as market capitalization and industry weightings), fundamental characteristics (such as return variability, duration, maturity or credit ratings and yield) and liquidity measures similar to those of the index. The fund generally invests at least 90% of its assets in the securities of the index and at least 95% of its assets in investment-grade corporate bonds. The fund may invest up to 5% of its assets in repurchase agreements collateralized by U.S. government obligations and in cash and cash equivalents, including shares of money market funds advised by BFA or its affiliates, as well as in bonds not included in the index, but which BFA believes will help the fund track the index. The fund may also lend securities representing up to one-third of the value of the fund’s total assets (including the value of the collateral received).
Tracking Error
The performance of the fund and of the index may vary due to a variety of factors, including transaction costs, asset valuations, corporate actions (such as mergers and spin-offs) and differences between the fund’s portfolio and the index resulting from legal restrictions (such as diversification requirements) that apply to the fund but not to the index or to investors using a representative sampling strategy in general.
Tracking error may occur because of differences between the securities held in the fund’s portfolio and those included in the index, pricing differences, the fund’s holding of cash, differences in timing of the accrual of distributions, changes to the index or the need to meet various new or existing regulatory requirements. Tracking error also may result because the fund incurs fees and expenses, while the index does not. BFA expects that, over time, the fund’s tracking error will not exceed 5%. The fund’s use of a representative sampling strategy can be expected to produce a greater tracking error over a period of time than would result if the fund used an indexing strategy in which a fund invests in substantially all of the securities in the index in approximately the same proportions as in the index.
As of April 30, 2014, iShares reported the following average annual returns on the market price of the fund’s shares and the index. The market price of the fund’s shares takes into account distributions on the shares and the returns shown account for changes in the mid-point of the bid and ask prices at 4:00 p.m., Eastern time on the relevant date. Fund shares: 1 year, 0.38; 3 years, 6.39; 5 years, 8.91; 10 years, 5.73; since inception, 6.11; index: 1 year, 0.42; 3 years, 6.62; 5 years, 9.59; 10 years, 6.03%; since fund inception, 6.37.
Industry Concentration Policy
The fund will concentrate its investments (i.e., hold 25% or more of its total assets) in a particular industry or group of industries to approximately the same extent that the index is concentrated in that industry or group of industries. For purposes of this limitation, securities of the U.S. government (including its agencies and instrumentalities), repurchase agreements collateralized by U.S. government securities, and securities of state or municipal governments and their political subdivisions are not considered to be issued by members of any industry.
The Index
The index is a bond index calculated, published and disseminated by the index sponsor, Markit Indices Limited (“Markit”). The index is designed to provide a balanced representation of the U.S. dollar denominated investment grade corporate debt. The index is market-value weighted, with an issuer weight cap of 3%, calculated as of the last business day of each month using the end-of-month closing prices for each bond. The index is calculated in U.S. dollars on a total return (gross) basis. The index is calculated as end-of-day and distributed once daily after 4 p.m. EST. The indices are calculated every day except on common U.S. bank holidays. In addition, the indices are calculated with the previous trading day’s close on the last calendar day of each month if that day is not a trading day.
As of December 31, 2013, the index included approximately 1,152 bonds chosen according to the index rules described below.
Selection Criteria of the Index
The bonds in the index must meet all the criteria described below as of the close of business four business days prior to the rebalancing date, except that rating agency downgrades may be accounted for three business days prior to the rebalancing date, and in each case provided that the relevant bond data can be verified, at Markit’s sole discretion, as of that cut-off date. The new index composition becomes effective on the first business day of the next month. Additionally, the index rules and their application will be governed by two committees:
• Technical Index Committee: consists of representatives form market makers/banks and meets on a monthly basis in order to arbitrate monthly rebalancing and to monitor any market developments.

S-100
• Oversight Committee: consists of representatives from mostly the buy side and meets in order to discuss the decisions of the technical index committee, the wider index rules and any market developments which may warrant rule changes.
Bond Classification: Bonds must be USD denominated corporate credit (i.e., debt instruments backed by corporate issuers that are not secured by specific assets). Debt issued by governments, sovereigns, quasi-sovereigns, and government-backed or guaranteed entities is excluded. As of August 2012, the issuer or, in the case of a finance subsidiary, the issuer’s guarantor, must be domiciled, incorporated and the country of risk must be in Andorra, Australia, Austria, Belgium, Bermuda, Canada, Cayman Islands, Cyprus, Denmark, Faeroe Islands, Finland, France, Germany, Gibraltar, Greece, Hong Kong, Iceland, Ireland, Italy, Japan, Jersey, Liechtenstein, Luxembourg, Malta, Monaco, Netherlands, New Zealand, Norway, Portugal, San Marino, Singapore, Spain, Sweden, Switzerland, United States or United Kingdom. A new country is added to the index if it is classified as a developed market on the “Markit Global Economic Development Classification.” A country is no longer eligible for the index if it is classified as an emerging market based on the “Markit Global Economic Development Classification”. The “Markit Global Economic Development Classification” is updated once per year. The results are published at the end of July. The inclusion/exclusion of a country becomes effective at the end of October. Each bond is assigned to one of the following six sectors: Consumer Goods, Consumer Services, Financials, Industrials & Materials, Telecommunication & Technology and Utilities & Energy.
All bonds are classified based on the principal activities of the issuer, the main sources of the cash flows used to pay coupons and redemptions, and a bond’s specific collateral type or legal provisions. Markit reviews bond classification regularly and makes necessary changes at the next rebalancing.
Bond Type: Only fixed rate bonds whose cash flow can be determined in advance are eligible, including fixed coupon bonds, step-up bonds with coupon schedules known at issuance (or as functions of the issuer’s rating), bonds with sinking funds, amortizing bonds, medium term notes, Rule 144A offerings with a registration right (only 144A bonds with a Regulation S version eligible for the Markit iBoxx® USD Benchmark Index), callable bonds and putable bonds. Preferred shares, convertible bonds, subordinated bank or insurance debt with mandatory contingent conversion features or with any conversion options before the first call date, bonds with other equity features attached (e.g. options or warrants), private placements, perpetual bonds, floating rate notes, pay-in kind bonds, zero coupon bonds, bonds with zero step-ups (GAINS), bonds with difference between accrual and coupon payment periods, and monthly-paying bonds are excluded. Any bond subject to a firm call or tender officer in the month immediately following the rebalancing date will be excluded, provided that Markit is aware of such tender offer or firm call.
Credit Rating: All bonds must have a Markit iBoxx rating of investment grade. Ratings from each of the following three agencies are considered for the calculation of the Markit iBoxx Rating: Fitch Ratings, Moody’s Investor Service and Standard & Poor’s Rating Services. If more than one agency rates a given bond, those ratings are averaged. Investment grade is defined as BBB- or above from Fitch or S&P and Baa3 or above from Moody’s. If a bond is rated by more than one of the above agencies, then the Markit iBoxx rating is the average of the provided ratings. In the case of an ID change or exchange of a Rule 144A/Regulation S offering into a registered bond, the ratings from the Rule 144A/Regulation S offering are also used for the registered bond.
Time to Maturity: At the rebalancing day, all bonds must have an expected remaining life of at least three years, and all newly included bonds must have an expected remaining life of at least three years and six months.
Amount Outstanding: The outstanding face value of a bond must be at least $750 million as of the bond selection cut-off date, after taking into account buybacks or increases. The outstanding face value of all bonds denominated in USD from the issuer must be at least $2 billion as of the bond selection cut-off date.
Minimum Run: Any bond that enters the index must remain in the index for a minimum of six months (provided that the bond is not upgraded to investment grade, defaulted or fully redeemed in that period).
Lockout Period: A bond that drops out of the index at re-balancing is excluded from re-entering the index for a three-month period.
Annual Index Review: The selection rules for the index are reviewed once per year during the annual index review process, the result of which will become effective at the end of October.
Calculation of the Index
Bond Prices: Index calculation is based on bid and ask quotes provided by the contributing banks. All iBoxx indices are multi-contributor priced. Prices for the bonds in the index are sourced from a number of leading market makers. The

S-101
received quotes are subject to a rigorous quality control process which excludes stale or off-market prices, and the remaining quotes that pass the quality control are consolidated to the index price.
Index Rebalancing: The index is rebalanced every month on the last business day of the month after the close of business. The rebalancing only takes into account changes to amounts outstanding publicly known four business days before the end of the month, changes in ratings publicly known three business days before the end of the month, and new bonds issued if publicly known to settle until the last calendar day of the month and if their rating has become known at least four business days before the end of the month.
Ten business days before the end of each month, a preliminary membership list is published. Four business days before the end of each month the constituents of the index are determined and an updated membership list is published. On the last business day of each month, Markit publishes the final membership with closing prices for the bonds, and various bonds analytics based on the index prices of the bonds.
Index Weights: The weight for each bond is determined on the last business day of each month using the end-of-month market values and applying an issuer cap of 3%.
Index Calculation: The components of the total return are price changes, accrued interest, coupon payments, and reinvestment income on cash flows received during the composition month. Calculations are performed daily, using consolidated bid prices at approximately 4 p.m. Eastern Time.
Treatment of Special Intra-Month Events
• Unscheduled Full Redemption: If a bond is fully redeemed intra-month, the redeemed bond is treated as cash based on the last consolidated price, the call price or repurchase price, as applicable. In addition, the clean price of the bond is set to the redemption price, and the interest accrued until the redemption date is treated as an irregular coupon payment.
• Bonds Trading Flat of Accrued: If a bond is identified as trading flat of accrued, the accrued interest of the bonds is set to 0 in the total return index calculation and the bond is excluded from the calculation of all bond and index analytical values.
• Multi-Coupon Bonds: For step-up bonds with a pre-defined coupon schedule, such schedule cannot change during the life of the bond and is used for all calculations. For event-driven bonds whose coupon may change upon occurrence (or non-occurrence) of pre-specified events, the coupon schedule as of the calculation date is used.
Additional information regarding the index may be obtained from other sources including, but not limited to, press releases, newspaper articles, other publicly available documents, the iBoxx $ Liquid Investment Grade Index factsheet at http://www.markit.com/assets/en/docs/fact-sheets/MKT_iBoxx_USD_Liquid_Investment_Grade_Index_factsheet.pdf and the Markit iBoxx USD Liquid Investment Grade Index Guide at https://products.markit.com/indices/download/products/guides/Markit_iBoxx_USD_Liquid_IG_Index.pdf. We are not incorporating by reference the website, the sources listed above or any material they include in this disclosure statement supplement.
Historical Closing Prices of the Fund’s Shares
The closing price of shares of the fund has fluctuated in the past and may, in the future, experience significant fluctuations. Any historical upward or downward trend in the closing price of the shares during the period shown below is not an indication that the shares are more or less likely to increase or decrease at any time during the life of your CDs. The period shown below will be approximately ten years, but may be shorter if Bloomberg Financial Services does not provide historical closing prices for the entirety of such period (whether due to the applicable inception date occurring less than ten years from the date hereof or otherwise).
You should not take the historical closing prices of the shares as an indication of the future performance of the shares. We cannot give you any assurance that the future performance of the shares will result in your receiving an amount greater than the outstanding face amount of your CDs on the stated maturity date. Neither we nor any of our affiliates make any representation to you as to the performance of the shares. Before investing in the offered CDs, you should consult publicly available information to determine the relevant fund closing prices between the date of this disclosure statement supplement and the date of your purchase of the offered CDs. The actual performance of the fund

S-102
over the life of the offered CDs, as well as the payment amount at maturity may bear little relation to the historical prices shown below.
The graph below shows the daily historical prices of the shares of the fund from May 30, 2004 through May 30, 2014. We obtained the closing prices shown in the graph below from Bloomberg Financial Services without independent verification.
“iShares®” is a registered trademark of BlackRock Institutional Trust Company, N.A. (BITC). The index is not sponsored, endorsed, sold, or promoted by BITC. BITC makes no representations or warranties to the owners of the index or any member of the public regarding the advisability of investing in the index. BITC has no obligation or liability in connection with the operation, marketing, trading or sale of the index.

S-103
iShares® iBoxx $ High Yield Corporate Bond ETF
The shares of the iShares® iBoxx $ High Yield Corporate Bond ETF (the “fund”) are issued by iShares® Trust, a registered investment company. On July 1, 2013, iShares® iBoxx $ High Yield Corporate Bond Fund changed its name to iShares® iBoxx $ High Yield Corporate Bond ETF.
• The fund is a tracking ETF that seeks investment results which correspond generally to the price and yield performance, before fees and expenses, of the index.
• The index it tracks is the Markit iBoxx® USD Liquid High Yield Index (the “index”).
• Investment Advisor: BlackRock Fund Advisors (“BFA”).
• The fund’s shares trade on the NYSE Arca under the ticker symbol “HYG”.
• The iShares® Trust’s SEC CIK Number is 0001100663.
• The fund’s inception date was April 4, 2007.
• The fund’s shares are issued or redeemed only in creation units of 100,000 shares or multiples thereof.
We obtained the following fee information from the iShares® website without independent verification. The investment advisor is entitled to receive a management fee from the fund based on the fund’s allocable portion of an aggregate management fee based on the aggregate average daily net assets of the fund and another specified iShares® funds as follows: 0.5000% per annum of the aggregate net assets of the funds less than or equal to $19.0 billion, plus 0.4750% per annum of the aggregate net assets of the funds on amounts greater than $19.0 billion up to $33.0 billion, plus 0.4513% per annum of the aggregate net assets of the funds on amounts greater than $33.0 billion up to $58.0 billion, plus 0.4287% on amounts in excess of $58.0 billion. As of March 31, 2014, the expense ratio of the fund was 0.50% per annum.
For additional information regarding iShares® Trust or BFA, please consult the reports (including the Semi-Annual Report to Shareholders on Form N−CSRS for the period ended August 31, 2013) and other information iShares® Trust files with the SEC. In addition, information regarding the fund, including its top portfolio holdings, may be obtained from other sources including, but not limited to, press releases, newspaper articles, other publicly available documents, and the iShares® website at http://us.ishares.com/product_info/fund/overview/HYG.htm. We are not incorporating by reference the website, the sources listed above or any material they include in this disclosure statement supplement.
Investment Objective
The fund seeks to provide investment results that correspond generally to the price and yield performance, before fees and expenses, of the index. The fund’s investment objective and the index may be changed without the approval of BFA’s shareholders. The following table displays the top holdings and weightings by industry sector of the fund. (Sector designations are determined by the fund sponsor using criteria it has selected or developed. Index and fund sponsors may use very different standards for determining sector designations. In addition, many companies operate in a number of sectors, but are listed in only one sector and the basis on which that sector is selected may also differ. As a result, sector comparisons between indices or funds with different sponsors may reflect differences in methodology as well as actual differences in the sector composition of the indices or funds.). We obtained the information in the tables below from the fund website without independent verification.

S-104
iShares® iBoxx $ High Yield Corporate Bond ETF Top Ten Holdings as of May 23, 2014
Corporate Bond Issuer Percentage (%) BLACKROCK FDS III 1.17%
SPRINT CORP 0.58% SPRINT NEXTEL CORPORATION 0.45%
HCA INC 0.45% FIRST DATA CORPORATION 0.43%
REYNOLDS GROUP ISSUER LLC 0.42% CHRYSLER GROUP LLC 0.41% CHRYSLER GROUP LLC 0.39%
TENET HEALTHCARE CORPORATION 0.37% HAWK ACQUISITION SUB INC 0.36%
Total 5.03% iShares® iBoxx $ High Yield Corporate Bond ETF Weighting by Sector
as of May 23, 2014
Sector Percentage (%) Consumer Services 15.31%
Oil & Gas 13.42% Financials 13.03%
Telecommunications 12.20% Industrials 11.34%
Health Care 8.96% Consumer Goods 6.72%
Technology 6.52% Basic Materials 6.21%
Utilities 3.93% Other/Undefined 2.37%
Total 100.01% * Percentages may not sum to 100% due to rounding.
The following table displays additional information the bonds held by the fund, in each case as of May 27, 2014. We obtained the information in the table below from the iShares® website without independent verification.
Weighted average maturity 4.22 years
Weighted average coupon 6.75%
Weighted average maturity is the mean of the remaining term to maturity of the bonds held by the fund. Weighted average coupon is the mean of the interest rates, or coupons, payable on the bonds.
Representative Sampling
Although the fund seeks results that correspond generally to the performance of the index, the fund uses a representative sampling strategy to attempt to track the performance of the index. For the fund, this strategy involves investing in a representative sample of securities that collectively have an investment profile similar to that of the index, although the fund holdings do not identically correspond to the holdings and weightings of the index and may diverge significantly from the index. The securities selected are expected to have aggregate investment characteristics (based on factors such as market capitalization and industry weightings), fundamental characteristics (such as return variability, duration, maturity or credit ratings and yield) and liquidity measures similar to those of the index.

S-105
The fund generally invests at least 90% of its assets in the securities of the index. However, the fund may invest up to 20% of its assets in certain futures, options and swaps contracts, cash and cash equivalents, including shares of money market funds affiliated with BFA, as well as in high yield corporate bonds not included in the index, but which BFA believes will help the fund track the index. For example, the fund may invest in high yield corporate bonds not included in the index in order to reflect prospective changes in the index. The fund may also lend securities representing up to one-third of the value of the fund’s total assets (including the value of the collateral received).
Tracking Error
The performance of the fund and of the index may vary due to a variety of factors, including transaction costs, asset valuations, corporate actions (such as mergers and spin-offs), timing variances and differences between the fund’s portfolio and the index resulting from legal restrictions (such as diversification requirements) that apply to the fund but not to the index or to investors using a representative sampling strategy in general.
Tracking error risk may be heightened during times of increased market volatility or other unusual market conditions. BFA expects that the fund may experience higher tracking error than is typical for similar exchange-traded funds. BFA expects that, over time, the fund’s tracking error will not exceed 5%.
As of April 30, 2014, iShares reported the following average annual returns on the market price of the fund’s shares and the index. The market price of the fund’s shares takes into account distributions on the shares and the returns shown account for changes in the mid-point of the bid and ask prices at 4:00 p.m., Eastern time on the relevant date. Fund shares: 1 year, 4.53; 3 years, 7.45; 5 years, 12.54; since inception, 6.75; index: 1 year, 4.97; 3 years, 7.82; 5 years, 13.97; since fund inception, 7.21.
Industry Concentration
The fund will concentrate its investments (i.e., hold 25% or more of its total assets) in a particular industry or group of industries to approximately the same extent that the index is concentrated in that industry or group of industries. For purposes of this limitation, securities of the U.S. government (including its agencies and instrumentalities), repurchase agreements collateralized by U.S. government securities, and securities of state or municipal governments and their political subdivisions are not considered to be issued by members of any industry.
The Index
The index is a bond index calculated, published and disseminated by the index sponsor, Markit Indices Limited (“Markit”). The index is designed to provide a balanced representation of the U.S. dollar (“USD”) denominated high yield corporate bond market through a broad coverage of the USD high yield liquid bond universe. The index is market-value weighted, with an issuer weight cap of 3%, calculated as of the last business day of each month using the end-of-month closing prices for each bond. The index is calculated in U.S. dollars on a total return (gross) basis. The index is calculated as end-of-day and distributed once daily after 4 p.m. EST. The indices are calculated every day except on common U.S. bank holidays. In addition, the indices are calculated with the previous trading day’s close on the last calendar day of each month if that day is not a trading day.
As of December 31, 2013, the index included tracked approximately 879 bonds chosen according to the index rules described below.
Selection Criteria
The bonds in the index must meet all the criteria described below as of the close of business three business days prior to the rebalancing date provided that the relevant bond data can be verified, at Markit’s sole discretion, as of that cut-off date. The new index composition becomes effective on the first business day of the next month. Additionally, the index rules and their application will be governed by two committees:
• Technical Index Committee: consists of representatives form market makers/banks and meets on a monthly basis in order to arbitrate monthly rebalancing and to monitor any market developments.
• Oversight Committee: consists of representatives from mostly the buy side and meets in order to discuss the decisions of the technical index committee, the wider index rules and any market developments which may warrant rule changes.
Bond Classification: Bonds must be USD denominated corporate credit (i.e., debt instruments backed by corporate issuers that are not secured by specific assets). Debt issued by governments, sovereigns, quasi-sovereigns, and

S-106
government-backed or guaranteed entities is excluded. As of August 2012, the issuer or, in the case of a finance subsidiary, the issuer’s guarantor, must be domiciled, incorporated and the country of risk must be in Andorra, Australia, Austria, Belgium, Bermuda, Canada, Cayman Islands, Cyprus, Denmark, Faeroe Islands, Finland, France, Germany, Gibraltar, Greece, Hong Kong, Iceland, Ireland, Italy, Japan, Jersey, Liechtenstein, Luxembourg, Malta, Monaco, Netherlands, New Zealand, Norway, Portugal, San Marino, Singapore, Spain, Sweden, Switzerland, United States or United Kingdom. A new country is added to the index if it is classified as a developed market according to Markit’s global economic development classification list. A country is no longer eligible for the index if it is classified as an emerging market based on the classified list. Market’s classification list is updated once per year. The results are published at the end of July. The inclusion/exclusion of a country becomes effective at the end of October. Each bond is assigned to one of the following six sectors: Consumer Goods, Consumer Services, Financials, Industrials & Materials, Telecommunication & Technology and Utilities & Energy.
All bonds are classified based on the principal activities of the issuer, the main sources of the cash flows used to pay coupons and redemptions, and a bond’s specific collateral type or legal provisions. Markit reviews bond classification regularly and makes necessary changes at the next rebalancing.
Bond Type: Only fixed rate bonds whose cash flow can be determined in advance are eligible, including fixed coupon bonds, step-up bonds with coupon schedules known at issuance (or as functions of the issuer’s rating), bonds with sinking funds, amortizing bonds, medium term notes, Rule 144A offerings, callable bonds and putable bonds. Preferred shares, convertible bonds, subordinated bank or insurance debt with mandatory contingent conversion features or with any conversion options before the first call date, bonds with other equity features attached (e.g. options or warrants), private placements, perpetual bonds, floating rate notes, pay-in kind bonds, zero coupon bonds, bonds with zero step-ups (GAINS), bonds with difference between accrual and coupon payment periods, monthly-paying bonds and Regulation S offerings are excluded. Any bond subject to a firm call or tender officer in the month immediately following the rebalancing date will be excluded, provided that Markit is aware of such tender offer or firm call.
Credit Rating: All bonds must have a rating of sub-investment grade. Ratings from each of the following three agencies are considered: Fitch Ratings, Moody’s Investor Service and Standard & Poor’s Rating Services. If more than one agency rates a given bond, those ratings are averaged. Sub-investment grade is defined as BB+ or lower from Fitch or S&P and Ba1 or lower from Moody’s, but not in default. Bonds rated D by Fitch or S&P, or that have been subject to a default press release by Moody’s are excluded. An included bond subsequently downgraded to D by Fitch or S&P or subject to a default press release by Moody’s (as of the bond selection cut-off date) will be excluded on the next rebalancing date. In case of an exchange of a 144A bond into a registered bond, the ratings from the 144A bond are also used for the registered bond. After a bond has migrated into high yield from investment grade status, it must retain that status for three months before it can be included in the index.
Time to Maturity: At issuance, all bonds must have an expected remaining life of 15 years or less. At the rebalancing day, all bonds must have an expected remaining life of at least one year and all newly included bonds must have an expected remaining life of at least one year and six months.
Amount Outstanding: The outstanding face value of a bond must be at least $400 million as of the bond selection cut-off date, after taking into account buybacks or increases. The outstanding face value of all bonds denominated in USD from the issuer must be at least $1 billion as of the bond selection cut-off date.
Minimum Run: Any bond that enters the index must remain in the index for a minimum of six months (provided that the bond is not upgraded to investment grade, defaulted or fully redeemed in that period).
Lockout Period: A bond that drops out of the index at re-balancing is excluded from re-entering the index for a three-month period.
Annual Index Review: The selection rules for the index are reviewed once per year during the annual index review process, the result of which will become effective at the end of October.
Calculation of the Index
Bond Prices: Index calculation is based on bid and ask quotes provided by the contributing banks. All iBoxx indices are multi-contributor priced. Prices for the bonds in the index are sourced from a number of leading market makers. The received quotes are subject to a rigorous quality control process which excludes stale or off-market prices, and the remaining quotes that pass the quality control are consolidated to the index price.

S-107
Index Rebalancing: The index is rebalanced every month on the last business day of the month after the close of business. The rebalancing only takes into account changes to amounts outstanding publicly known three business days before the end of the month, changes in ratings publicly known two business days before the end of the month, and new bonds issued if publicly known to settle until the last calendar day of the month and if their rating has become known at least three business days before the end of the month.
Ten business days before the end of each month, a preliminary membership list is published. Three business days before the end of each month the constituents of the index are determined and an updated membership list is published. On the last business day of each month, Markit publishes the final membership with closing prices for the bonds, and various bonds analytics based on the index prices of the bonds.
Index Weights: The weight for each bond is determined on the last business day of each month using the end-of-month market values and applying an issuer cap of 3%.
Index Calculation: The components of the total return are price changes, accrued interest, coupon payments, and reinvestment income on cash flows received during the composition month. Calculations are performed daily, using consolidated bid prices at approximately 4 p.m. Eastern Time.
Treatment of Special Intra-Month Events
• Unscheduled Full Redemption: If a bond is fully redeemed intra-month, the redeemed bond is treated as cash based on the last consolidated price, the call price or repurchase price, as applicable. In addition, the clean price of the bond is set to the redemption price, and the interest accrued until the redemption date is treated as an irregular coupon payment.
• Bonds Trading Flat of Accrued: If a bond is identified as trading flat of accrued, the accrued interest of the bonds is set to 0 in the total return index calculation and the bond is excluded from the calculation of all bond and index analytical values.
• Multi-Coupon Bonds: For step-up bonds with a pre-defined coupon schedule, such schedule cannot change during the life of the bond and is used for all calculations. For event-driven bonds whose coupon may change upon occurrence (or non-occurrence) of pre-specified events, the coupon schedule as of the calculation date is used.
Additional information regarding the index may be obtained from other sources including, but not limited to, press releases, newspaper articles, other publicly available documents, the Markit iBoxx $ Liquid High Yield Index factsheet at http://www.markit.com/assets/en/docs/fact-sheets/MKT_iBoxx_USD_Liquid_High_Yield_Index%20_factsheet.pdf and the Markit iBoxx USD Liquid HY Index Guide at http://www.markit.com/assets/en/docs/products/data/indices/bond-indices/Markit%20iBoxx%20USD%20Li quid%20HY%20Index_20120416.pdf. We are not incorporating by reference the website, the sources listed above or any material they include in this disclosure statement supplement.
Historical Closing Prices of the Fund’s Shares
The closing price of shares of the fund has fluctuated in the past and may, in the future, experience significant fluctuations. Any historical upward or downward trend in the closing price of the shares during the period shown below is not an indication that the shares are more or less likely to increase or decrease at any time during the life of your CDs. The period shown below will be approximately ten years, but may be shorter if Bloomberg Financial Services does not provide historical closing prices for the entirety of such period (whether due to the applicable inception date occurring less than ten years from the date hereof or otherwise).
You should not take the historical closing prices of the shares as an indication of the future performance of the shares. We cannot give you any assurance that the future performance of the shares will result in your receiving an amount greater than the outstanding face amount of your CDs on the stated maturity date. Neither we nor any of our affiliates make any representation to you as to the performance of the shares. Before investing in the offered CDs, you should consult publicly available information to determine the relevant fund closing prices between the date of this disclosure statement supplement and the date of your purchase of the offered CDs. The actual performance of the fund over the life of the offered CDs, as well as the payment amount at maturity may bear little relation to the historical prices shown below.

S-108
The graph below shows the daily historical prices of the shares of the fund from May 22, 2007 through May 30, 2014. We obtained the closing prices shown in the graph below from Bloomberg Financial Services without independent verification.
“iShares®” is a registered trademark of BlackRock Institutional Trust Company, N.A. (BITC). The index is not sponsored, endorsed, sold, or promoted by BITC. BITC makes no representations or warranties to the owners of the index or any member of the public regarding the advisability of investing in the index. BITC has no obligation or liability in connection with the operation, marketing, trading or sale of the index.

S-109
iShares® MSCI Emerging Markets ETF
The shares of the iShares® MSCI Emerging Markets ETF (the “fund”) are issued by iShares, Inc. (the “company”). The Company was organized as a Maryland corporation on September 1, 1994 and is authorized to have multiple series or portfolios, of which the fund is one. On July 1, 2013, the iShares® MSCI Emerging Markets Index Fund changed its name to the iShares® MSCI Emerging Markets ETF.
• The fund is a tracking ETF that seeks investment results which correspond generally to the price and yield performance, before fees and expenses, of the index.
• The index it tracks is the MSCI Emerging Markets Index (the “index”).
• Investment Advisor: BlackRock Fund Advisors (“BFA”).
• The fund’s shares trade on the NYSE Arca under the ticker symbol “EEM”.
• The company’s SEC CIK Number is 0000930667.
• The fund’s inception date was April 7, 2003.
• The fund’s shares are issued or redeemed only in creation units of 450,000 shares or multiples thereof.
The index was launched on December 31, 1987 with an initial level of 100.
We obtained the following fee information from the iShares® website without independent verification. The investment advisor is entitled to receive a management fee from the fund based on the fund’s allocable portion of an aggregate management fee based on the aggregate average daily net assets of the fund and a set of other specified iShares® funds as follows: 0.75% per annum of the aggregate net assets of the funds less than or equal to U.S. $14.0 billion, plus 0.68% per annum of the aggregate net assets of the funds on amounts in excess of U.S. $14.0 billion up to U.S. $28.0 billion, plus 0.61% per annum of the aggregate net assets of the funds on amounts in excess of U.S. $28.0 billion up to U.S. $42.0 billion, plus 0.56% per annum of the aggregate net assets of the funds on amounts in excess of U.S. $42.0 billion up to U.S. $56.0 billion, plus 0.50% per annum of the aggregate net assets of the funds on amounts in excess of U.S. $56.0 billion up to U.S. $70.0 billion, plus 0.45% per annum of the aggregate net assets of the funds on amounts in excess of U.S. $70.0 billion up to U.S. $84.0 billion, plus 0.40% per annum of the aggregate net assets of the funds in excess of U.S. $84.0 billion. As of March 31, 2014, the aggregate expense ratio of the fund was 0.67% per annum.
For additional information regarding the company or BFA, please consult the reports (including the Annual Report to Shareholders on Form N-CSR for the fiscal year ended August 31, 2013) and other information the company files with the SEC. In addition, information regarding the fund, including its top portfolio holdings, may be obtained from other sources including, but not limited to, press releases, newspaper articles, other publicly available documents and the iShares® website at http://us.ishares.com/product_info/fund/overview/ EEM.htm. We are not incorporating by reference the website, the sources listed above or any material they include in this disclosure statement supplement.
Investment Objective
The fund seeks to provide investment results that correspond generally to the price and yield performance, before fees and expenses, of the index. The fund’s investment objective and the index may be changed at any time, without the approval of BFA’s shareholders.
The following tables display the top holdings and weightings by industry sector of the fund. (Sector designations are determined by the fund sponsor using criteria it has selected or developed. Fund advisors and index sponsors may use very different standards for determining sector designations. In addition, many companies operate in a number of sectors, but are listed in only one sector and the basis on which that sector is selected may also differ. As a result, sector comparisons between funds or indices with different sponsors may reflect differences in methodology as well as actual differences in the sector composition of the indices or funds.) We obtained the information in the tables below from the fund website without independent verification.

S-110
iShares® MSCI Emerging Markets ETF Top Ten Holdings as of May 23, 2014
Fund Stock Issuer Percentage (%) SAMSUNG ELECTRONICS CO LTD 3.85%
TAIWAN SEMICONDUCTOR MANUFAC 2.50% TENCENT HOLDINGS LTD 1.84%
CHINA MOBILE LTD 1.51% CHINA CONSTRUCTION BANK-H 1.32%
GAZPROM OAO 1.26% IND & COMM BK OF CHINA-H 1.19%
NASPERS LTD-N SHS 1.17% ITAU UNIBANCO HOLDING SA PREF 1.02%
MTN GROUP LTD 0.93% Total 16.59%
iShares® MSCI Emerging Markets ETF Weighting by Sector as of May 23, 2014*
Sector Percentage (%) Financials 26.54%
Information Technology 16.85% Energy 10.76%
Consumer Discretionary 9.00% Materials 8.98%
Consumer Staples 8.38% Telecommunication Services 6.94%
Industrials 6.42% Utilities 3.55%
Health Care 1.67% Total 99.09%
* Percentages may not sum to 100% due to rounding.
iShares® MSCI Emerging Markets ETF Weighting by County as of May 23, 2014*
Country Percentage (%) China 17.35
Korea (South) 15.85 Taiwan 11.70 Brazil 10.92
South Africa 7.90 India 7.08
Russian Federation 5.36 Mexico 4.74
Malaysia 3.77 Indonesia 2.63 Thailand 2.06 Turkey 1.73 Poland 1.67 Chile 1.52
Colombia 1.07 Other 4.35
99.70% * Percentages may not sum to 100% due to rounding.

S-111
Representative Sampling
BFA uses a representative sampling strategy to attempt to track the performance of the index. For the fund, this strategy involves investing in a representative sample of securities that collectively have an investment profile similar to that of the index. The securities selected are expected to have aggregate investment characteristics (based on factors such as market capitalization and industry weightings), fundamental characteristics (such as return variability, earnings valuation and yield) and liquidity measures similar to those of the index.
The fund generally invests at least 90% of its assets in the securities of the index and in depositary receipts representing securities of the index. The fund may invest the remainder of its assets in securities not included in the index, but which BFA believes will help the fund track the index. The fund may also invest its other assets in futures contracts, options and swaps, as well as cash and cash equivalents, including shares of money market funds affiliated with BFA. Also, the fund may lend securities representing up to one-third of the value of the fund's total assets (including the value of the collateral received). The fund invests all of its assets that are invested in India in a wholly owned subsidiary located in the Republic of Mauritius. BFA also serves of the investment advisor of the subsidiary.
Tracking Error
The performance of the fund and the index may vary due to a variety of factors, including differences between the fund’s assets and the index, pricing differences, transaction costs, the fund’s holding of cash, differences in timing of the accrual of dividends and differences between the fund’s portfolio and the index resulting from new or existing legal restrictions that apply to the fund but not to the index or to investors using a representative sampling strategy in general. BFA expects that, over time, the fund’s tracking error will not exceed 5%. The fund’s use of a representative sampling strategy can be expected to produce a greater tracking error over a period of time than would result if the fund used an indexing strategy in which a fund invests in substantially all of the securities in its index in approximately the same proportions as in the index.
As of April 30, 2014, the fund’s annualized performance difference (as compared to the index returns), or the “tracking error”, was 0.51% over the last year, 0.62% over the last three years, 1.60% over the last five years, 0.52% over the last ten years, and 0.42% since the fund’s inception date.
Industry Concentration Policy
The fund will concentrate its investments (i.e., hold 25% or more of its total assets) in a particular industry or group of industries to approximately the same extent that the index is concentrated in that industry or group of industries.
The MSCI® Emerging Markets Index
The MSCI Emerging Markets Index, (the “index”) is a stock index calculated, published and disseminated daily by MSCI Inc. (“MSCI”) through numerous data vendors, on the MSCI website and in real time on Bloomberg Financial Markets and Reuters Limited.
The index is a free float-adjusted market capitalization index and is one of the MSCI Global Investable Market Indices (the “MSCI Indices”), the methodology of which is described below. The index is considered a “standard” index, which means it consists of all eligible large capitalization and mid-capitalization stocks, as determined by MSCI, in the relevant emerging markets. Additional information about the MSCI Indices is available on the following website: http://www.msci.com/products/indices/country_and_regional/em/ methodology.html. Daily closing price information for the index is available on the following website: http://www.mscibarra.com/products/indices/international_equity_indices/performance.html. We are not incorporating by reference the website, the sources listed above or any material they include in this disclosure statement supplement.
The index is intended to provide performance benchmarks for the emerging equity markets in the Americas, Europe, the Middle East, Africa and Asia, which are, as of the date of this disclosure statement supplement, Brazil, Chile, China, Colombia, Czech Republic, Egypt, Greece, Hungary, India, Indonesia, Malaysia, Mexico, Peru, Philippines, Poland, Russia, South Africa, South Korea, Taiwan, Thailand and Turkey. The constituent stocks of the MSCI Emerging Markets Index are derived from the constituent stocks in the 21 MSCI standard single country indices for the emerging market countries listed above. The index is calculated in U.S. dollars on a total return net basis.The index was launched on December 31, 1987 at an initial value of 100.

S-112
For additional information about the construction, calculation methodology and maintenance of the index, please see “iShares® MSCI EAFE ETF — Construction of the MSCI Indices”, “iShares® MSCI EAFE ETF — Calculation Methodology for the MSCI Indices” and “iShares® MSCI EAFE ETF — Maintenance of the MSCI Indices”, respectively, on pages S-84, S-87 and S-87 of this disclosure statement supplement, respectively.
Historical Closing Prices of the Fund’s Shares
The closing price of shares of the fund has fluctuated in the past and may, in the future, experience significant fluctuations. Any historical upward or downward trend in the closing price of the shares during the period shown below is not an indication that the shares are more or less likely to increase or decrease at any time during the life of your CDs. The period shown below will be approximately ten years, but may be shorter if Bloomberg Financial Services does not provide historical closing prices for the entirety of such period (whether due to the applicable inception date occurring less than ten years from the date hereof or otherwise).
You should not take the historical closing prices of the shares as an indication of the future performance of the shares. We cannot give you any assurance that the future performance of the shares will result in your receiving an amount greater than the outstanding face amount of your CDs on the stated maturity date. Neither we nor any of our affiliates make any representation to you as to the performance of the shares. Before investing in the offered CDs, you should consult publicly available information to determine the relevant fund closing prices between the date of this disclosure statement supplement and the date of your purchase of the offered CDs. The actual performance of the fund over the life of the offered CDs, as well as the payment amount at maturity may bear little relation to the historical prices shown below.
The graph below shows the daily historical prices of the shares of the fund from May 27, 2004 through May 30, 2014. We obtained the closing prices shown in the graph below from Bloomberg Financial Services without independent verification.
“iShares®” is a registered trademark of BlackRock Institutional Trust Company, N.A. (BITC). The index is not sponsored, endorsed, sold, or promoted by BITC. BITC makes no representations or warranties to the owners of the index or any member of the public regarding the advisability of investing in the index. BITC has no obligation or liability in connection with the operation, marketing, trading or sale of the index.

S-113
iShares® J.P. Morgan USD Emerging Markets Bond ETF
The shares of the iShares® J.P. Morgan USD Emerging Markets Bond ETF (the “fund”) are issued by iShares® Trust, a registered investment company. On July 1, 2013, iShares® JPMorgan USD Emerging Markets Bond Fund changed its name to iShares® J.P. Morgan USD Emerging Markets Bond ETF.
• The fund is a tracking ETF that seeks investment results which correspond generally to the price and yield performance, before fees and expenses, of the index.
• The index it tracks is the J.P. Morgan EMBISM Global Core Index (the “index”).
• Investment Advisor: BlackRock Fund Advisors (“BFA”).
• The fund’s shares trade on the NYSE Arca under the ticker symbol “EMB”.
• The iShares® Trust’s SEC CIK Number is 0001100663.
• The fund’s inception date was December 17, 2007.
• The fund’s shares are issued or redeemed only in creation units of 100,000 shares or multiples thereof.
We obtained the following fee information from the iShares® website without independent verification. The investment advisor is entitled to receive a management fee from the fund corresponding to the fund’s allocable portion of an aggregate management fee based on the aggregate average daily net assets of the fund and the iShares® iBoxx $ High Yield Corporate Bond ETF as follows: 0.6000% of the aggregate net assets of the funds less than or equal to $19 billion, plus 0.5700% of the aggregate net assets of the funds over $19 billion, up to and including $33 billion, plus 0.5415% of the aggregate net assets of the funds over $33 billion, up to and including $58 billion, plus 0.5145% of the aggregate net assets of the funds in excess of $58 billion. As of March 31, 2014, the expense ratio of the fund was 0.60% per annum.
For additional information regarding iShares® Trust or BFA, please consult the reports (including the Semi-Annual Report to Shareholders on Form N-CSRS for the period ended April 30, 2013) and other information iShares® Trust files with the SEC. In addition, information regarding the fund, including its top portfolio holdings, may be obtained from other sources including, but not limited to, press releases, newspaper articles, other publicly available documents, and the iShares® website at http://us.ishares.com/product_info/fund/overview/EMB.htm. We are not incorporating by reference the website, the sources listed above or any material they include in this disclosure statement supplement.
Investment Objective and Strategy
The fund seeks to provide investment results that correspond generally to the price and yield performance, before fees and expenses, of the index. The fund’s investment objective and the index may be changed at any time, without the approval of BFA’s shareholders.
The following tables display the top bond holdings, holdings and weightings by country, and maturity breakdown of the fund. We obtained the information in the tables below from the iShares® website without independent verification.

S-114
iShares® J.P. Morgan USD Emerging Markets Bond ETF Top Ten Holdings as of May 27, 2014
Bond Issuer Percentage (%) RUSSIAN (FEDERATION OF) 1.84%
POLAND (REPUBLIC OF) 1.25% PETRONAS CAPITAL LTD. 1.22%
PERU (REPUBLIC OF) 1.06% ARGENTINA (REPUBLIC OF) 0.92%
POLAND (REPUBLIC OF) 0.90% SINOPEC GROUP OVERSEAS DEVELOPMENT
CHINA 0.89%
PANAMA (REPUBLIC OF) 0.88% HUNGARY (REPUBLIC OF) 0.87% ROMANIA (REPUBLIC OF) 0.86%
Total 10.69%
iShares® J.P. Morgan USD Emerging Markets Bond ETF Top Ten Weightings by Country as of May 27, 2014
Country Percentage (%) Mexico 5.85% Brazil 5.83%
Turkey 5.81% Russian Federation 5.64%
Philippines 5.47% Indonesia 5.23% Colombia 4.59% Hungary 4.23%
Venezuela 4.05% Poland 3.80%
South Africa 3.77% Total 54.27%
iShares® J.P. Morgan USD Emerging Markets Bond ETF Maturity Breakdown as of May 27, 2014*
Maturity Percentage (%) 0-1 years 0.00% 1-5 years 14.82%
5-10 years 48.24% 10-15 years 8.66% 15-20 years 8.45% 20-25 years 7.69% 25+ years 10.40%
Total 98.26% * Percentages may not sum to 100% due to rounding.

S-115
The following table displays additional information about the bonds held by the fund as of May 27, 2014. We obtained the information in the table below from the iShares® website without independent verification.
Weighted average maturity 11.21 years
Weighted average coupon 6.13%
Effective duration 7.10
Weighted average maturity is the mean of the remaining term to maturity of the bonds held by the fund. Weighted average coupon is the mean of the interest rates, or coupons, payable on the bonds. Effective duration is a measure of the responsiveness of a bond or portfolio price to interest rates, taking into account the impact on expected bond cash flows due to interest rate changes.
Representative Sampling
The fund uses a representative sampling strategy to attempt to track the performance of the index. This strategy involves investing in a representative sample of securities that collectively have an investment profile similar to that of the index. The securities selected are expected to have, in the aggregate, investment characteristics (based on factors such as market capitalization and industry weightings), fundamental characteristics (such as return variability, duration, maturity or credit ratings and yield) and liquidity measures similar to those of the index. The fund generally invests at least 90% of its assets in the securities of index. The fund may at times invest up to 20% of its assets in certain futures, options and swap contracts, cash and cash equivalents, including money market funds advised by BFA or its affiliates, as well as in securities not included in the index, but which BFA believes will help the fund track the index. The fund may lend securities representing up to one-third of the value of the fund’s total assets (including the value of the collateral received).
Tracking Error
The performance of the fund and of the index may vary due to a variety of factors, including transaction costs, non-U.S. currency valuations, asset valuations, corporate actions (such as mergers and spin-offs), timing variances and differences between the fund’s portfolio and the index resulting from legal restrictions (such as diversification requirements) that apply to the fund but not to the index or to investors using a representative sampling strategy in general.
Tracking error also may occur because of pricing differences, transaction costs, the fund’s holding of cash, differences in timing of the accrual of distributions, changes to the index or the need to meet various new or existing regulatory requirements. Tracking error also may result because the fund incurs fees and expenses, while the index does not. BFA expects that, over time, the fund’s tracking error will not exceed 5%. The fund’s use of a representative sampling strategy can be expected to produce a greater tracking error over a period of time than would result if the fund used an indexing strategy in which a fund invests in substantially all of the securities in the index in approximately the same proportions as in the index.
As of April 30, 2014, the fund’s total return tracking error was 1.00% over the last year, 0.99% over the last three years, 0.98% over the last five years and 0.88% since the fund’s inception.
Industry Concentration Policy
The fund will concentrate its investments (i.e., hold 25% or more of its total assets) in a particular industry or group of industries to approximately the same extent that the index is concentrated in that industry or group of industries. For purposes of this limitation, securities of the U.S. government (including its agencies and instrumentalities), repurchase agreements collateralized by U.S. government securities, and securities of state or municipal governments and their political subdivisions are not considered to be issued by members of any industry.
The Index
The index is a broad, diverse, market capitalization weighted index designed to measure the performance of U.S. dollar-denominated Brady bonds, Eurobonds and traded loans issued by sovereign and quasi-sovereign entities of emerging market countries. The index is calculated in U.S. dollars on a total return (gross) basis.
Quasi-sovereign entities are entities whose securities are either 100% owned by their respective governments or subject to a 100% guarantee that does not rise to the level of constituting the full faith and credit by such governments. The methodology is designed to distribute the weight of each country within the index by limiting the weights of countries with higher debt outstanding and reallocating this excess to countries with lower debt outstanding.

S-116
Index Methodology
In order for a bond to be considered as eligible for inclusion in the index, the bond must be issued by a country that is considered an emerging market. A country is defined as an emerging market and, therefore, can be considered for inclusion in the index, to be considered an emerging market, a country’s gross net income (“GNI”) per capita must be below the index income ceiling (“IIC”) established by the index sponsor for three consecutive years to be eligible for inclusion. The IIC is defined as the GNI per capital level that is adjusted every year by the growth rate of the World GNI per capita (calculated using the World Bank’s “Atlas method” for converting other currencies into U.S. dollars and using the midyear population), which is published by the World Bank annually. The base IIC level was established in 1987 at US $6,000 GNI per capita. Second, regardless of their IIC, countries that either have restructured their external debt during the past ten years or currently have restructured external debt outstanding will also be considered for inclusion in the index. Once the universe of emerging markets countries has been defined, the eligible securities from these countries must be selected for inclusion in the index.
Component Selection Criteria
To be eligible for inclusion in the index, a security: (i) can be fixed or floating-rate; (ii) must be issued by sovereign and quasi-sovereign entities from index-eligible countries described above; (iii) must be denominated in U.S. dollars; (iv) must have a current face amount outstanding of $1 billion or more; (v) must have at least 2 years until maturity; (vi) must be able to settle internationally through Euroclear or another institution domiciled outside the issuing country; and (vii) must be a security whose bid and offer prices are available on a daily and timely basis — either from an inter-dealer broker or J.P. Morgan. Convertible bonds are excluded from the index.
Index Maintenance
The index is a broad, diverse market capitalization weighted index. The index is priced at 3:00 pm, Eastern Time every business day of the year as defined by the U.S. bond market calendar. Index securities are priced using bid pricing each day. For securities where there is not a valid price available at 3:00 pm, Eastern Time, the last available valid price is obtained from the market. As a last resort, if there are no valid market prices for an instrument, J.P. Morgan traders are asked to provide a market bid and ask. For those securities where pricing is not available on a regular basis, the composition methodology ensures that such securities will be excluded from the index.
The weight of each security in the index is determined by first starting with the face amount outstanding of all eligible securities and aggregating such securities by country. The highest weighted countries are then constrained by capping the total weight within those countries. The result establishes new country weights which are then used to calculate the new eligible face amounts per security within those countries. To calculate the final weights of each security in the index, the current day’s price is multiplied by each security’s adjusted face amount. The market capitalization for each security is then divided by the total market capitalization for all securities in the index. The result represents the weight of the security expressed as a percentage of the index.
The index is generally rebalanced on a monthly basis, on the last business day of the month. A new security that meets the index admission requirements is added to the index on the first month-end business date after its issuance, provided its issue date falls before the 15th of the month. A new security whose settlement date falls on or after the 15th of the month is added to the index on the last business day of the next month. There are two exceptions to this rule. The first exception applies to new securities that are released as part of a debt exchange program. For example, if a country exchanges a portion of its outstanding debt for a new issue after the 15th of the month, at the month-end rebalancing date immediately following this event the amount of debt retired in this exchange would be removed from the index. The new security would then be added to the index. The second exception concerns Regulation S securities. A security that is issued solely in reliance on Regulation S of the 1933 Act and not pursuant to Rule 144A will be ineligible for inclusion in the index until the expiration of the relevant Regulation S restricted period. The date at which the restriction is lifted will effectively be the new “issue” date, at which point the 15th of the month rule will apply. In extreme cases, an intra-month rebalancing can occur when: (i) more than $6 billion of the face amount of index eligible bonds are exchanged or (ii) more than 2/3 of the face amount of any one of the most liquid index bonds are exchanged. If an announcement is made for a bond to be called, it is removed from the index on the month-end prior to its call date on the basis of having less than 24 months remaining until maturity. However, if an announcement is not made in time for the bond to be removed from the index on the prior month-end, it will be removed the first month-end following the announcement, unless the amount to be called triggers an intra-month rebalancing.

S-117
Historical Closing Prices of the Fund’s Shares
The closing price of shares of the fund has fluctuated in the past and may, in the future, experience significant fluctuations. Any historical upward or downward trend in the closing price of the shares during the period shown below is not an indication that the shares are more or less likely to increase or decrease at any time during the life of your CDs. The period shown below will be approximately ten years, but may be shorter if Bloomberg Financial Services does not provide historical closing prices for the entirety of such period (whether due to the applicable inception date occurring less than ten years from the date hereof or otherwise).
You should not take the historical closing prices of the shares as an indication of the future performance of the shares. We cannot give you any assurance that the future performance of the shares will result in your receiving an amount greater than the outstanding face amount of your CDs on the stated maturity date. Neither we nor any of our affiliates make any representation to you as to the performance of the shares. Before investing in the offered CDs, you should consult publicly available information to determine the relevant fund closing prices between the date of this disclosure statement supplement and the date of your purchase of the offered CDs. The actual performance of the fund over the life of the offered CDs, as well as the payment amount at maturity may bear little relation to the historical prices shown below.
The graph below shows the daily historical prices of the shares of the fund from December 19, 2007 through May 30, 2014. We obtained the closing prices shown in the graph below from Bloomberg Financial Services without independent verification.
“iShares®” is a registered trademark of BlackRock Institutional Trust Company, N.A. (BITC). The index is not sponsored, endorsed, sold, or promoted by BITC. BITC makes no representations or warranties to the owners of the index or any member of the public regarding the advisability of investing in the index. BITC has no obligation or liability in connection with the operation, marketing, trading or sale of the index.

S-118
iShares® U.S. Real Estate ETF
The shares of the iShares® U.S. Real Estate ETF (the “fund”) are issued by iShares® Trust, a registered investment company. On July 1, 2013, the iShares® Dow Jones U.S. Real Estate IndexSM Fund changed its name to the iShares® U.S. Real Estate ETF.
• The fund is a tracking ETF that seeks investment results which correspond generally to the price and yield performance, before fees and expenses, of the index.
• The index it tracks is the Dow Jones U.S. Real Estate IndexSM (the “index”).
• Investment Advisor: BlackRock Fund Advisors (“BFA”).
• The fund’s shares trade on the NYSE Arca under the ticker symbol “IYR”.
• The fund’s SEC CIK Number is 0001100663.
• The fund’s inception date was June 12, 2000.
• The fund’s shares are issued or redeemed only in creation units of 50,000 shares or multiples thereof.
We obtained the following fee information from the iShares® website without independent verification. The investment advisor is entitled to receive a management fee from the fund based on the fund’s allocable portion of an aggregate management fee based on the aggregate average daily net assets of the fund and a set of other iShares® funds as follows: 0.48% per annum of the aggregate net assets of the funds less than or equal to $10.0 billion; plus 0.43% per annum of the aggregate net assets of the funds over $10.0 billion, up to and including $20.0 billion; plus 0.38% per annum of the aggregate net assets of the funds in excess of $20.0 billion. As of April 30, 2014, the expense ratio of the fund was 0.46%.
For additional information regarding iShares® Trust or BFA, please consult the reports (including the Semi-Annual Report to Shareholders on Form N-CSRS for the period ended October 31, 2013) and other information iShares® Trust files with the SEC. In addition, information regarding the fund, including its top portfolio holdings, may be obtained from other sources including, but not limited to, press releases, newspaper articles, other publicly available documents, and the iShares® website at http://us.ishares.com/product_info/fund/overview/IYR.htm?fundSearch=true&qt=IYR. We are not incorporating by reference the website, the sources listed above or any material they include in this disclosure statement supplement.
Investment Objective
The fund seeks to provide investment results that correspond generally to the price and yield performance, before fees and expenses, of the index. The fund’s investment objective and the index may be changed at any time, without the approval of BFA’s shareholders.
The following tables display the top holdings and weightings by industry sector of the fund. (Sector designations are determined by the fund sponsor using criteria it has selected or developed. Index and fund sponsors may use very different standards for determining sector designations. In addition, many companies operate in a number of sectors, but are listed in only one sector and the basis on which that sector is selected may also differ. As a result, sector comparisons between indices or funds with different sponsors may reflect differences in methodology as well as actual differences in the sector composition of the indices or funds.) We obtained the information in the tables below from the fund’s website without independent verification.

S-119
iShares® U.S. Real Estate ETF Top Ten Holdings as of May 27, 2014 Fund Stock Issuer Percentage (%)
SIMON PROPERTY GROUP INC 7.93% AMERICAN TOWER CORP 5.03%
CROWN CASTLE INTL CORP 3.65% PUBLIC STORAGE 3.57%
PROLOGIS INC 2.96% EQUITY RESIDENTIAL 2.95%
VENTAS INC 2.86% HCP INC 2.76%
HEALTH CARE REIT INC 2.67% VORNADO REALTY TRUST 2.66%
Total 36.99% iShares® U.S. Real Estate ETF by Sector as of May 27, 2014*
Sector Percentage (%) SPECIALTY REITS 30.75%
RETAIL REITS 20.06% INDUSTRIAL AND OFFICE REITS 18.10%
RESIDENTIAL REITS 12.42% MORTGAGE REITS 6.29%
HOTEL AND LODGING REITS 5.04% REAL ESTATE SERVICES 2.74%
REAL ESTATE HOLDING AND DEVELOPMENT 1.65% DIVERSIFIED REITS 1.52%
REAL ESTATE INVESTMENT TRUSTS 1.26% Total 99.83%
* Percentages may not sum to 100% due to rounding.
Representative Sampling
The fund uses a representative sampling strategy to attempt to track the performance of the index before fees and expenses. For the fund, this strategy involves investing in a representative sample of securities that collectively have an investment profile similar to that of the index. The securities selected are expected to have aggregate investment characteristics (based on factors such as market capitalization and industry weightings), fundamental characteristics (such as return variability and yield) and liquidity measures similar to those of the index. The fund may or may not hold all of the securities that are included in the index.
The fund generally invests at least 90% of its assets in the securities of the index and in depositary receipts representing securities thereof. The fund may invest the remainder of its assets in securities index not included in the index, but which BFA believes will help the fund track the index. The fund may also invest its other assets in certain futures, options and swaps contracts, as well as cash and cash equivalents, including shares of money market funds affiliated with BFA.
Tracking Error
The performance of the fund and of the index may vary due to a variety of factors, including transaction costs, valuations, asset valuations, market impact, corporate actions (such as mergers and spin-offs), timing variances and differences between the fund’s portfolio and the index resulting from legal restrictions (such as diversification requirements) that apply to the fund but not to the index or the use of a representative sampling strategy in general. BFA expects that, over time, the fund’s tracking error will not exceed 5%. The fund’s use of a representative sampling strategy can be expected to produce a greater tracking error over a period of time than would result if the fund used an indexing

S-120
strategy in which a fund invests in substantially all of the securities in its index in approximately the same proportions as in the index.
As of April 30, 2014, iShares reported the following average annual returns on the market price of the fund’s shares and the index. The market price of the fund’s shares takes into account distributions on the shares and the returns shown account for changes in the mid-point of the bid and ask prices at 4:00 p.m., Eastern time on the relevant date. Fund shares: 1 year, -1.29; 3 years, 7.98; 5 years, 20.79; 10 years, 8.72; since inception, 10.24; index: 1 year, -0.59; 3 years, 8.58; 5 years, 21.33; 10 years, 9.13%; since fund inception, 10.71.
Industry Concentration Policy
The fund will concentrate its investments (i.e., hold 25% or more of its total assets) in a particular industry or group of industries to approximately the same extent that the index is concentrated in that industry or group of industries.
The Index
The index is a float-adjusted market capitalization total return index that is calculated, published and disseminated by the index sponsor, S&P Dow Jones Indices (Dow Jones). It is a subset of the Dow Jones U.S. Index, and is designed to represent real estate investment trusts (REITs) and other companies that invest directly or indirectly in real estate through development, management or ownership, including property agencies. Stocks are selected for the index if they are contained in the index universe and if, based on their revenues, they have been classified into the Real Estate Supersector (8600) as defined by the proprietary classification system used by Dow Jones. Because the index is comprised primarily of REITs, the prices of the component stocks reflect changes in lease rates, vacancies, property development and transactions. The index is calculated in U.S. dollars on a total return (gross) basis.
Calculation and Dissemination
The closing values of the index are calculated on a 24-hour day that ends at 5:30 p.m. New York time and, following the determination of the previous day’s closing price, the index values for the current day are updated and disseminated on a real-time basis beginning at 5:30 p.m. whenever any of the exchanges represented in the index are open.
If trading in a stock is suspended while its market is open, the last traded price for that stock is used for all subsequent index computations until trading resumes. If trading is suspended before the opening, the stock’s adjusted closing price from the previous day is used to calculate the index. Until a particular stock opens, its adjusted closing price from the previous day is used in the index computation.
If a market is closed due to an exchange holiday, the previous adjusted closing price for each of its index underlying assets, coupled with the most-recent intraday currency bid price, is used to determine the index’s current U.S. dollar value.
To be included in the index, a stock must be part of the index universe, defined as all stocks traded on major U.S. stock exchanges minus any non-common issues and illiquid stocks. Index candidates must be common shares or other securities that have the characteristics of common equities. All classes of common shares, both fully and partially paid, are eligible. Fixed-dividend shares and securities such as convertible notes, warrants, rights, mutual funds, unit investment trusts, closed-end fund shares, shares in limited partnerships and shares in business development companies (BDCs) are not eligible. Temporary issues arising from corporate actions, such as “when-issued shares,” are considered on a case-by-case basis when necessary to maintain continuity in a company’s index membership. REITs, listed property trusts, and similar real-property-owning pass-through structures taxed as REITs by their domiciles also are eligible. Securities that have had more than ten non-trading days during the past quarter are excluded from the index universe.
After determination of the index universe, the index universe is then sorted by float-adjusted market capitalization and stocks in the top 95% of the index universe are categorized into 10 broad Industries, 19 Supersectors, 41 Sectors and 114 Subsectors as defined by a proprietary classification system used by Dow Jones. Segments are designed to capture the risk characteristics of a specific market by grouping together constituents that respond in similar ways to economic, political and environmental factors.
The index level is calculated using a fraction, the numerator of which is the price of each stock in the index multiplied by the number of shares used in the index calculation (total shares outstanding times the IWF), and summed across all the stocks in the index. The denominator is the index divisor.

S-121
The Index Divisor
To assure that the index’s value, or level, does not change when stocks are added or deleted, the divisor is adjusted to offset the change in market value of the index. Thus, the divisor plays a critical role in the index’s ability to provide a continuous measure of market valuation when faced with changes to the stocks included in the index. In a similar manner, some corporate actions that cause changes in the market value of the stocks in an index should not be reflected in the index level. Adjustments are made to the divisor to eliminate the impact of these corporate actions. Any change to the stocks in the index that alters the total market value of the index while holding stock prices constant will require a divisor adjustment.
Divisor adjustments are made “after the close” meaning that after the close of trading the closing prices are used to calculate the new divisor based on whatever changes are being made. It is, then, possible to provide two complete descriptions of the index – one as it existed at the close of trading and one as it will exist at the next opening of trading. If the same stock prices are used to calculate the index level for these two descriptions, the index levels are the same.
With prices constant, any change that changes the total market value included in the index will require a divisor change. For cataloging changes, it is useful to separate changes caused by the management of the index from those stemming from corporate actions of the constituent companies. Among those changes driven by index management are adding or deleting companies, adjusting share counts and changes to IWFs and other factors affecting share counts or stock prices.
When a company is added to or deleted from the index, the net change in the market value of the index is calculated and this is used to calculate the new divisor. The market values of stocks being added or deleted are based on the prices, shares outstanding, IWFs and any other share count adjustments.
There are a large range of different corporate actions ranging from routine share issuances or buy backs to unusual events like spin-offs or mergers. These are listed on the table below with a description of the adjustments, if any.
Corporate Action Effects Divisor Adjustments?
Company added/deleted Net change in market value determines the divisor adjustment.
Yes
Change in shares outstanding Any combination of secondary issuance, share repurchase or buy back – share counts revised to reflect change.
Yes
Stock split Share count revised to reflect new count. Divisor adjustment is not required since the share count and price changes are offsetting.
No
Spin-off If the spun-off company is not being added to the index, the divisor adjustment reflects the decline in index market value (i.e., the value of the spun-off unit).
Yes
Spin-off Spun-off company added to the index, no company removed from the index.
No
Spin-off Spun-off company added to the index, another company removed to keep number of names fixed. Divisor adjustment reflects deletion.
Yes
Change in IWF Increasing (decreasing) the IWF increases (decreases) the total market value of the index. The divisor change reflects the change
Yes

S-122
in market value caused by the change to an IWF.
Special Dividend When a company pays a special dividend the share price is assumed to drop by the amount of the dividend; the divisor adjustment reflects this drop in index market value.
Yes
Rights offering Each shareholder receives the right to buy a proportional number of additional shares at a set (often discounted) price. The calculation assumes that the offering is fully subscribed. Divisor adjustment reflects increase in market cap measured as the shares issued multiplied by the price paid.
Yes
Annual Reconstitution, Quarterly Reviews and Index Maintenance
The index is reconstituted annually in September. The process includes the review of all stocks in their respective markets to determine eligibility according to the existing criteria. In addition, the investable weight factor (“IWF”), for each stock is reviewed based on the most recently available data filed with various regulators and exchanges and updated as needed. Changes are implemented at the opening of trading on the Monday following the third Friday of September. Changes in IWFs resulting from corporate actions which exceed 5% are implemented as soon as possible; changes of less than 5% are implemented at the next annual review.
Generally, no companies are added to an index between annual reconstitutions except for initial public offerings and spinoffs. Any exceptions to this rule are announced with ample lead time.
Changes in shares outstanding of less than 5% are accumulated and made quarterly in March, June, September and December . These changes, as well as any weight adjustments, are implemented at the opening of trading on the Monday following the third Friday of the quarterly update month.
The indices are also reviewed on an ongoing basis to account for corporate actions such as mergers, acquisitions, takeovers, delistings or bankruptcies. Changes to index composition and related weight adjustments are made as soon as they are effective. Corporate actions (such as stock splits, stock dividends, spin-offs and rights offerings) are applied after the close of trading on the day prior to the ex-date. Share changes resulting from exchange offers are applied on the ex-date.
Initial public offerings and new listings on eligible exchanges are added to at the next quarterly update if the new listing occurs on or before the final trading day of February, May, August or November and meets all other eligibility requirements. Spinoffs of index constituents are added to the index at the time of the spinoff, providing they meet index eligibility requirements. Spinoffs are assigned the same size and style as the parent company at the time of the action. All spinoff sizes are evaluated at the next quarterly update.
Whenever possible, Dow Jones will announce changes in the index at least two business days prior to their implementation date.
If an index constituent is suspended by its primary market, it may be removed from the index at the discretion of the Index Committee. When this occurs, S&P Dow Jones Indices will use the best-available alternate pricing source to determine the value at which the company should be removed from the index.
Float Adjustment
A company’s outstanding shares are adjusted to exclude shares held by certain shareholders concerned with the control of a company, a group that generally includes the following: officers and directors, private equity, venture capital, special equity firms, publicly traded companies that hold shares in another company, strategic partners, holders of

S-123
restricted shares, employee stock ownership plans, employee and family trusts, foundations associated with the company, holders of unlisted share classes of stock, government entities at all levels (except government retirement or pension funds) and any individual person who controls a 5% or greater stake in a company as reported in regulatory filings. However, holdings by depositary banks, mutual funds, exchange-traded fund providers, asset managers, pension plans and other institutional investors, even if greater than 5% of the outstanding shares of a company, are generally included in the float-adjusted share count to be used in the index calculations, as they are deemed to be acting as investors and not involved with control of a company.
The index adjustment to reflect control holders is accomplished by calculating the IWF for each stock that is part of the numerator of the float-adjusted index fraction described above:
IWF = (available float shares)/(total shares outstanding)
where available float shares are defined as total shares outstanding less shares held by control holders. In most cases, IWFs are reported to the nearest one percentage point.
Historical Closing Prices of the Fund’s Shares
The closing price of shares of the fund has fluctuated in the past and may, in the future, experience significant fluctuations. Any historical upward or downward trend in the closing price of the shares during the period shown below is not an indication that the shares are more or less likely to increase or decrease at any time during the life of your CDs. The period shown below will be approximately ten years, but may be shorter if Bloomberg Financial Services does not provide historical closing prices for the entirety of such period (whether due to the applicable inception date occurring less than ten years from the date hereof or otherwise).
You should not take the historical closing prices of the shares as an indication of the future performance of the shares. We cannot give you any assurance that the future performance of the shares will result in your receiving an amount greater than the outstanding face amount of your CDs on the stated maturity date. Neither we nor any of our affiliates make any representation to you as to the performance of the shares. Before investing in the offered CDs, you should consult publicly available information to determine the relevant fund closing prices between the date of this disclosure statement supplement and the date of your purchase of the offered CDs. The actual performance of the fund over the life of the offered CDs, as well as the payment amount at maturity may bear little relation to the historical prices shown below.
The graph below shows the daily historical prices of the shares of the fund from May 30, 2004 through May 30, 2014. We obtained the closing prices shown in the graph below from Bloomberg Financial Services without independent verification.
“iShares®” is a registered trademark of BlackRock Institutional Trust Company, N.A. (BITC). The index is not sponsored, endorsed, sold, or promoted by BITC. BITC makes no representations or warranties to the owners of the index or any member of the public regarding the advisability of investing in the index. BITC has no obligation or liability in connection with the operation, marketing, trading or sale of the index.

S-124
Alerian MLP ETF
The shares of the Alerian MLP ETF (the “fund”) are issued by ALPS ETF Trust (the “trust”), a registered investment company.
• The fund is a tracking ETF in that it seeks investment results which correspond generally to the price and yield performance, before fees and expenses, of the index.
• The index it tracks is the Alerian MLP Infrastructure Index (the “index”), which is a subset of the Alerian MLP Index.
• The fund’s investment advisor is ALPS Advisors, Inc. (“ALPS”).
• The fund’s shares trade on the NYSE Arca under the ticker symbol “AMLP”.
• The trust’s SEC CIK Number is 0001414040.
• The inception date of the fund was August 25, 2010.
• The fund’s shares are issued or redeemed only in creation units of 50,000 units.
We obtained the following fee information from the fund’s website without independent verification. ALPS is entitled to receive a management fee from the fund payable on a monthly basis at the annual rate (as of March 31, 2014) of 0.85% of the fund’s average daily net assets. As further described below, the fund also accrues deferred income tax expense that is estimated (as of March 31, 2014) to be 7.71% of the fund’s average daily net assets on an annual basis, which results in estimated annual operating expenses of 8.56% of the fund’s average daily net assets.
For additional information regarding the trust and ALPS, please consult the reports (including the Annual Report to Shareholders on Form N−CSR for the fiscal year ended November 30, 2013) and other information the trust files with the SEC. In addition, information regarding the fund, including its top portfolio holdings, may be obtained from other sources including, but not limited to, press releases, newspaper articles, other publicly available documents, at http://www.alerianetfs.com and http://www.alerianmlp.com. We are not incorporating by reference the websites, the sources listed above or any material they include in this disclosure statement supplement.
Investment Objective and Strategy
The Alerian MLP ETF seeks investment results that correspond generally to the price and yield performance, before fees and expenses, of the index. The fund’s investment objective may be changed by its board of trustees without shareholder approval. The fund will normally invest at least 90% of its total assets in component securities (or depositary receipts based on such securities) of the index. The fund generally will invest in all of the securities that comprise the index in proportion to their weightings in the index; however, under various circumstances, it may not be possible or practicable to purchase all of the securities in the index in those weightings. In addition, the fund may not be fully invested at times as a result of cash flows into the fund or reserves of cash held by the fund to meet redemptions and expenses. In any of those circumstances, the fund may purchase a sample of the securities in the index or utilize various combinations of other available investment techniques in seeking performance which corresponds to the performance of the index. The fund may invest its remaining assets in money market instruments, including repurchase agreements or other funds which invest exclusively in money market instruments, convertible securities, structured CDs (CDs on which the amount of principal repayment and interest payments are based on the movement of one or more specified factors, such as the movement of a particular stock or stock index), forward foreign currency exchange contracts and in swaps, options and futures contracts. Swaps, options and futures contracts (and convertible securities and structured CDs) may be used by the fund in seeking performance that corresponds to the index, and in managing cash flows. The fund will not invest in money market instruments as part of a temporary defensive strategy to protect against potential stock market declines. ALPS anticipates that it may take approximately three business days (i.e., each day the NYSE Arca is open) for additions and deletions to the index to be reflected in the portfolio composition of the fund.
About MLPs
Master limited partnerships (“MLPs”) are partnerships that derive at least 90% of their income from activities that meet the requirements of the Internal Revenue Code of 1986 as amended (the tax code), including the transportation, storage and processing of minerals and natural resources. By deriving their income from qualifying sources, the MLP does not pay

S-125
entity level (corporate) tax. MLP interests trade on public securities exchanges such as the New York Stock Exchange and the NASDAQ Stock Market.
The Fund’s Holdings
The following table displays the top ten holdings of the fund. We obtained the information in the tables below from the fund’s website without independent verification.
Alerian MLP ETF as of May 27, 2013
MLP Unit Issuer Percentage(%) Enterprise Products Partners LP 9.83%
Kinder Morgan Energy Partners LP 8.95% Magellan Midstream Partners LP 7.71% Plains All American Pipeline LP 6.81%
Energy Transfer Partners LP 6.64% MarkWest Energy Partners LP 5.55%
Buckeye Partners LP 4.74% Williams Partners LP 4.70%
Regency Energy Partners LP 4.52% ONEOK Partners LP 4.44%
Total 63.89% Correlation
The performance of the fund and the index may vary due to a variety of factors. Unlike many ETFs, the fund expects to effect redemptions of creation units for cash, rather than in-kind. The fund may not be fully invested at times, either as a result of cash flows into the fund or reserves of cash held by the fund to meet redemptions and expenses. In addition, another significant factor is the fund’s tax expense (as described in the next paragraph), as well as the fund’s operating expenses (including management fees) and costs the fund incurs in buying and selling securities, especially when rebalancing the fund’s holdings to reflect changes in the composition of the index.
Unlike most other investment companies, the fund is not eligible to elect to be treated as a regulated investment company for tax purposes because of its investments primarily in MLPs invested in energy assets. Thus, the fund is obligated to pay applicable federal and state corporate income taxes on its taxable income. The amount of taxes paid by the fund will vary depending on the amount of income and gains derived from investments or sales of MLP interests and these taxes will reduce the return on an investment in the fund. In addition, the fund expects that a portion of the quarterly and other distributions it receives from the MLPs it holds may be treated as a tax deferred return of capital, thus reducing the fund’s adjusted tax basis in the relevant MLP units. These reductions in the fund’s adjusted tax basis in the MLP units will increase the amount of gain (or decrease the amount of loss) recognized by the fund on a subsequent sale of the securities. The fund will accrue deferred income taxes for any future tax liability associated with that portion of MLP distributions considered to be a tax-deferred return of capital as well as capital appreciation of its investments. Upon the sale of an MLP unit, the fund may be liable for previously deferred taxes. The index, however, is calculated without any deductions for taxes. As a result, the fund’s after tax performance could differ significantly from the index even if the pretax performance of the fund and the performance of the index are closely correlated.
For the period ended April 30, 2014, ALPS gave the following performance figures for market price of a fund share and the index: fund—3 months, 3.34%; 1 year on an annualized basis, 8.22%; since inception on August 25, 2010 on an annualized basis, 11.58%; index—3 months, 5.21%; 1 year on an annualized basis, 13.31%; since August 25, 2010 on an annualized basis, 18.90%.
The Index
The Alerian MLP Infrastructure Index is comprised of 25 energy infrastructure MLPs and is a midstream-focused (i.e., not focused on production or sales of energy commodities) subset of the Alerian MLP Index, which is comprised of 50 energy MLPs. The MLPs in the index earn a majority of their revenues from transportation, storage and processing of energy commodities. The index constituents earn the majority of their cash flow from the transportation, storage, and processing of energy commodities. The index is calculated using a capped, float-adjusted, capitalization-weighted

S-126
methodology and is disseminated real-time on a price-return basis by the NYSE under the ticker “AMZI” and by other data vendors. The base date for the index is December 29, 1995, with a base value of 100. The index is sponsored and maintained by Alerian and is calculated by Standard & Poor’s. Additional information about the index may be obtained from other sources including, but not limited to, press releases, newspaper articles, other publicly available documents, and on the index sponsor’s website, www.alerian.com. We are not incorporating by reference the website, the sources listed above or any material they include in this disclosure statement supplement.
Quarterly Reconstitution of the Index
The constituents of the index are reviewed quarterly in connection with quarterly rebalancings of the index. The prices, units outstanding, and investable weight factors of all eligible companies and partnerships as of 4:00 pm Eastern Standard Time on the first Friday of March, June, September, and December, respectively, are used to determine if constituent changes will take place.
A non-incumbent will be added to the index during the rebalancing process only if (a) it meets all Tier 1 and Tier 2 (described below) criteria and exceeds each of an incumbents security’s market capitalization, adjusted market capitalization, and last full month’s median daily dollar trading volume by at least 10%; or (b) it meets all Tier 1 criteria and (i) an incumbent fails to meet all Tier 1 criteria or (ii) an incumbent is being removed due to a corporate action, such as a merger of two constituents, delisting, or bankruptcy. Constituents that are halted from trading may remain in the index at the index sponsor’s discretion until trading resumes.
If the number of qualifying non-incumbents to be added does not match the number of incumbents to be removed, preference is given according to the following criteria, in order: (i) fewest number of failed Tier 2 criteria and (ii) adjusted market capitalization. These criteria are reviewed regularly to ensure consistency with industry trends.
The following Tier 1 criteria must be met for a current constituent to be eligible to remain in the index or for a new constituent to be eligible for addition to the index:
• Trades on the NYSE or NASDAQ;
• Is a publicly traded partnership or limited liability company ;
• Earns the majority of its pro forma cash flow from the transportation, storage, and processing of energy commodities (which is not meant to include production, retail marketing, royalty, shipping, and wholesale distribution);
• Represents the primary limited partner interests of a partnership or LLC that is an operating company (excluding, among others, the following types of securities: General partner interests, i-units, closed-end funds, exchange-traded products, income trusts, investment vehicles, and royalty trusts);
• Paid at least its pro rata minimum quarterly distribution for the trailing two quarters;
• Maintained or grew its distribution quarter-over-quarter for at least one of the trailing two quarters;
• Has a distribution policy intended to consistently maintain or increase distributions over time;
• Has a split-adjusted median daily unit trading volume for each of the trailing six full months of at least 25,000 units;
• Has a market capitalization of at least $500 million; and
• Has an adjusted market capitalization of at least $250 million.
In addition, preference is given to MLPs meeting the following Tier 2 criteria:
• Closes above $10 on each trading day during the last full month;
• Has a split-adjusted median daily unit trading volume for each of the trialing six full months of at least 50,000 units;
• Has an adjusted market capitalization of at least $500 million; and
• Has an investable weight factor (as described below) of at least 20%

S-127
Calculation of and Adjustments to the Index
The index is calculated by Standard & Poor’s using a float-adjusted, capitalization-weighted methodology. That means the level of an index reflects the total market value of all the constituent MLP units relative to a particular base period. The index value at any time equals the aggregate index market capitalization divided by the divisor. The divisor is intended to ensure consistency over time relative to the base period. The divisor was initially equal to the index market capitalization on December 29, 1995 divided by 100, and is adjusted following each quarterly rebalancing to equal the post-rebalancing index market capitalization divided by the index value prior to the rebalancing. The index does not account for cash distributions as it is not a “total return” index.
A constituent’s investable weight factor has three components: its numerator, units outstanding, and general partner (GP) adjustment. The numerator is equal to the number of tradable units and is calculated as units outstanding minus non-common units minus unregistered common units minus insider-owned common units. Types of units included in the calculation of units outstanding include common units, subordinated units, special class units, and paid-in-kind units.
The units outstanding generally reflects that disclosed in the MLP’s latest annual or quarterly report, unless otherwise indicated by a press release or in an applicable registration statement or prospectus filed with the SEC. The units outstanding will be adjusted for public secondary offerings at the time of pricing of that offering, for over-allotment option exercises or unit repurchases at the earlier of the press release or filing of a current report, for common units issued in a private investment in public equity (PIPE) transaction at the time of closing of such transaction and common units issued pursuant to equity distribution agreements at the time such agreements are reported in periodic reports, proxy statements or prospectuses.
Non-common units consist of tradable preferred stock, tradable institutional units (i-units), tradable rights, tradable warrants, tradable shares, tradable subordinated units, and similar instruments that do not represent common units of the MLP. Unregistered common units are common units issued in PIPE transactions, which are not considered to be freely tradable until the expiration of the lock-up period or, if no lock-up period is specified, the earlier of the effective date of any accompanying SEC registration statement or 180 days after the closing of the PIPES transaction. Insider-owned common units are those which are included in Item 12 (“Security Ownership of Certain Beneficial Owners and Management”) of a constituent’s latest annual report or proxy statement and includes units owned by all directors and named executive officers, plus common units owned by GPs and/or persons or entities with board representation. Other documents (e.g., press releases, 8-Ks and prospectus supplements) indicating changes to ownership by a GP are reflected immediately.
The GP adjustment is a percentage equal to 100% minus the GP percentage. For constituents with a non-economic GP or no GP at all, the GP percentage is 0%. For traditional MLPs, the index sponsor states that the GP percentage typically starts at 2%, but may fall if the GP does not participate in future offerings and is therefore its GP interest is diluted. The index sponsor will only update the GP percentage upon the filing of the constituents’ annual reports indicating such a change.
Index Rebalancings. Index rebalancings fall into two groups: quarterly rebalancings and special rebalancings. Quarterly rebalancings occur on the third Friday of each March, June, September, and December, and are effective at the open of the next trading day. In the event that the major U.S. exchanges on the third Friday of March, June, September, or December, are closed, the rebalancing will take place after market close on the immediately preceding trading day. The prices, units outstanding, and IWFs of all eligible companies and partnerships as of 4:00 p.m., Eastern Standard Time, on the first Friday of March, June, September, and December, respectively, are used to determine if constituent changes will take place. After market close on the quarterly rebalancing date, each constituent in the Alerian MLP Index is assigned a weight according to its proportion of the total float-adjusted market capitalization of the index, as calculated from its index shares on the first Friday of March, June, September, and December, respectively.
Special rebalancings are triggered by corporate actions and take place one full trading session after the constituent’s issuance of a press release indicating all needed merger votes have passed. On special rebalancing dates, only new and triggering constituents will be updated to reflect the latest information available. A triggering constituent is defined as a surviving constituent of the corporate action that triggered the special rebalancing, e.g., the acquirer in a merger of two constituents. No other constituent units outstanding or IWFs will be affected.
Index Governance: An independent advisory board of auditors, MLP executives, institutional fund managers, legal partners, and other senior financial professionals reviews all methodology modifications and constituent changes to ensure that they are made objectively and without bias. The board is comprised of a minimum of five members and a maximum of thirteen members, all of whom must be independent.

S-128
Historical Closing Prices of the Fund’s Shares
The closing price of shares of the fund has fluctuated in the past and may, in the future, experience significant fluctuations. Any historical upward or downward trend in the closing price of the shares during the period shown below is not an indication that the shares are more or less likely to increase or decrease at any time during the life of your CDs. The period shown below will be approximately ten years, but may be shorter if Bloomberg Financial Services does not provide historical closing prices for the entirety of such period (whether due to the applicable inception date occurring less than ten years from the date hereof or otherwise).
You should not take the historical closing prices of the shares as an indication of the future performance of the shares. We cannot give you any assurance that the future performance of the shares will result in your receiving an amount greater than the outstanding face amount of your CDs on the stated maturity date. Neither we nor any of our affiliates make any representation to you as to the performance of the shares. Before investing in the offered CDs, you should consult publicly available information to determine the relevant fund closing prices between the date of this disclosure statement supplement and the date of your purchase of the offered CDs. The actual performance of the fund over the life of the offered CDs, as well as the payment amount at maturity may bear little relation to the historical prices shown below.
The graph below shows the daily historical prices of the shares of the fund from August 25, 2010 through May 30, 2014. We obtained the closing prices shown in the graph below from Bloomberg Financial Services without independent verification.
The Index is not issued, sponsored, endorsed, sold or promoted by Alerian.

S-129
PowerShares® Senior Loan Portfolio
The shares of the PowerShares® Senior Loan Portfolio (the “fund”) are issued by the PowerShares Exchange-Traded Fund Trust II (the “trust”), a registered investment company.
• The fund is a tracking ETF that seeks investment results which correspond generally to the price and yield performance, before fees and expenses, of the index.
• The index it tracks is the S&P/LSTA U.S. Leveraged Loan 100 Index (the “index”).
• Investment Advisor: Invesco PowerShares Capital Management LLC (“Invesco PowerShares”).
• Investment Sub-Adviser: Invesco Senior Secured Management, Inc. (“Invesco Senior Secured”).
• The fund’s shares trade on the NYSE Arca under the ticker symbol “BKLN”.
• The trust’s SEC CIK Number is 0001378872.
• The fund’s inception date was March 3, 2011.
• The fund’s shares are issued or redeemed only in creation units of 100,000 shares.
We obtained the following fee information from the PowerShares® website without independent verification. The investment advisor is entitled to receive a management fee from the fund based on a percentage of the fund’s value at an annual rate of 0.65%. In addition, the fund incurs indirect fees and expenses at an annual rate of 0.01% of the fund’s value as a result of investing in the shares of other investment companies. As of May 27, 2014, the fund’s annual operating expenses were 0.65% of the fund’s value.
For additional information regarding the trust, Invesco PowerShares or Invesco Senior Secured, please consult the reports (including the Annual Report to Shareholders on Form N-CSR for the fiscal year ended October 31, 2013) and other information the trust files with the SEC. In addition, information regarding the fund, including its top portfolio holdings, may be obtained from other sources including, but not limited to, press releases, newspaper articles, other publicly available documents, and the PowerShares® website at http://www.invescopowershares.com/seniorloans/. We are not incorporating by reference the website, the sources listed above or any material they include in this disclosure statement supplement.
Investment Objective and Strategy
The fund seeks to provide investment results that generally correspond, before fees and expenses, to the price and yield of the index, which the fund believes is designed to track the market-weighted performance of the largest institutional leveraged loans based on market weightings, spreads and interest payments. Standard & Poor’s Financial Services LLC (S&P) compiles, maintains and calculates the index. For more information on the index, see “The Index” below.
The fund utilizes a sampling methodology to seek to achieve its investment objective. For more information about the sampling methodology, see “Sampling” below.
The fund generally invests at least 80% of its net assets, plus any borrowings for investment purposes, in senior loans that comprise the index. As defined by Invesco PowerShares and Invesco Senior Secured, senior loans include loans rated below investment grade quality or unrated but deemed to be of comparable quality (“leveraged loans”), bank loans and/or floating rate loans. Lending institutions such as banks typically issue senior loans to corporations, partnerships and other entities (“borrowers”), often in connection with such borrowers’ recapitalizations, acquisitions, leveraged buyouts and refinancings. These borrowers operate in a variety of industries and geographic regions, including foreign countries. Senior loans generally are structured and administered by a financial institution that serves as agent for the lenders. The fund generally purchases loans from banks and other financial institutions through assignments or participations. More specifically, the fund may acquire a direct interest in a loan from the agent or another lender by assignment or an indirect interest in a loan as a participation in another lender’s portion of a loan. The fund generally sells loans it holds by means of an assignment, but it also may sell participation interests in such loans to facilitate its ability to fund redemption requests. During the fiscal year ended October 31, 2013, the fund did not purchase any interests in senior loans on a participation (indirect) basis.
The fund invests in loans that are expected to be below investment grade quality and bear interest at a floating rate that periodically resets. The index may include, and the fund may acquire and retain, loans of borrowers that have filed for bankruptcy protection. Non-investment grade loans and bonds, and unrated loans and bonds of comparable credit quality

S-130
are subject to the increased risk (as compared to investment grade debt) of a borrower’s or issuer’s inability to meet principal and interest payment obligations.
The fund may also invest up to 20% of its assets in other securities not included in the index, in money market instruments, including repurchase agreements or other funds that invest exclusively in money market instruments (subject to applicable limitations under the Investment Company Act of 1940, as amended, or exemptions therefrom), convertible securities, structured notes (notes on which the amount of principal repayment and interest payments is based on the movement of one or more specified factors, such as the movement of a particular security or securities index) and in closed-end funds that invest all or a portion of their assets in senior loans and other liquid instruments such as high-yield securities (commonly referred to as “junk bonds”). Convertible securities and structured notes may be used by the fund in seeking performance that corresponds to the index and in managing cash flows. Invesco PowerShares anticipates that it may take approximately three business days for Invesco PowerShares to fully reflect the additions and deletions to the index in the portfolio composition of the fund.
The fund has entered into a committed, unsecured line of credit with State Street Bank and Trust Company that allows the fund to borrow an amount up to 331/3% of its assets for temporary or emergency purposes or to allow for an orderly liquidation of securities to meet redemption requests. The fund bears any interest expenses associated with the line of credit. Invesco PowerShares pays the set-up fees and the commitment fee for the line of credit based on the amount of the commitment that has not been utilized.
The fund’s investment objective, as well as the fund’s policy to invest 80% of its net assets in senior loans that comprise the index, constitutes a non-fundamental policy that the Board of Trustees of the trust may change at any time without shareholder approval, upon 60 days’ prior written notice to shareholders.
As of May 27, 2014, the fund had 122 holdings. The following table displays the top ten holdings of the fund. The weights below represent single loan holding weights and not the aggregate holdings of each issuer held by the fund (if more than one loan is held by the fund). We obtained the information in the table below from the PowerShares® website without independent verification.
PowerShares® Senior Loan Portfolio Top Holdings as of May 27, 2014
Company Coupon
Rate Maturity
Date S&P/Moody’s
Rating Percentage of Total Holdings
H.J. Heinz Company 3.50% 6/5/2020 BB/Ba2 1.96%
Fortescue Metal 3.75% 06/30/20190 BBB-/Baa3 1.95%
Hilton Worldwide Finance, LLC 3.50% 10/26/2020 BB/Ba3 1.94%
Asurion Corp 5.00% 05/24/2019 B/Ba3 1.94%
Tribune Company TL 4.00% 12/27/2020 BB+/Ba3 1.75%
First Data Corporation 6.75% 11/1/2020 B+/B1 1.60%
Intelsat Jackso 3.75% 06/30/2019 BB/Ba3 1.56%
Valeant Pharm. International, Inc. 3.75% 08/05/2020 BB/Ba1 1.49%
Neiman Marcus Group Inc. 4.25% 10/25/2020 B/B2 1.47%
Biomet 3.66% 07/25/2017 BB-/B1 1.45%
As of May 27, 2014, 85.06% of the fund’s holdings were loans and 8.54% of the fund’s holdings were high-yield securities. As of May 16, 2014, the fund’s loans had an average yield to maturity of 5.11%, an average years to maturity of 5.10 years, a weighted average coupon of 4.18%, and the average number of days until the floating rate coupons on the loans reset was 40.88 days. As of May 27, 2014, 1.72% of the fund’s loans had a maturity of up to one year, 36.23% had a maturity of up to five years, and 62.05% had a maturity of between five and ten years. No loan held by the fund as of that date had a maturity of more than ten years.

S-131
PowerShares® Senior Loan Portfolio Credit Rating Distribution as of May 27, 2014
Credit Rating S&P Moody’s
BBB/Baa 7.00% 6.00%
BB/Ba 42.00% 43.00%
B/B 41.00% 41.00%
CCC/Caa 5.00% 3.00%
CC/Ca 0.00% 0.00%
Not Rated 4.00% 7.00%
* Percentages may not sum to 100% due to rounding.
No industry breakdown in respect of the fund’s holdings is available from the PowerShares® website. The industry breakdown in respect of the index is available under “— The Index” below. Although the fund tracks the index, the fund may also invest up to 20% of its assets in other securities not included in the index. Therefore, the industry breakdown in respect of the index’s holdings may not accurately represent the industry sector breakdown in respect of the fund’s holdings.
Sampling
The fund uses a sampling approach to achieve its investment objective. Sampling means that Invesco PowerShares and Invesco Senior Secured use a quantitative analysis to select securities from the index to obtain a representative sample of securities that have, in the aggregate, investment characteristics similar to the index in terms of key risk factors, performance attributes and other characteristics. These attributes and other characteristics include duration, maturity, credit quality, yield and coupon. Invesco PowerShares and Invesco Senior Secured generally expect the fund, as it does currently, to hold less than the total number of loans in the index, but reserve the right to hold as many loans and other securities as they believe necessary to achieve the fund’s investment objective. This may cause the fund to not be as well correlated with the return of the index as would be the case if the fund purchased all the loans in the index in the proportions represented in the index.
Correlation
Invesco PowerShares and Invesco Senior Secured seek correlation over time of 0.95 or better between the fund’s performance and the performance of the index (a figure of 1.00 would represent perfect correlation). Another means of evaluating the relationship between the returns of the fund and index is to assess the “tracking error” between the two. Tracking error refers to the variation between the fund’s annual return and the return of the index, expressed in terms of standard deviation. The fund seeks to have a tracking error of less than 5%, measured on a monthly basis over a one-year period by taking the standard deviation of the difference in the fund’s return versus the index’s returns. Since the fund uses an indexing approach to try to achieve its investment objective, the fund does not take temporary defensive positions during periods of adverse market, economic or other conditions. For the period ended April 30, 2014, the PowerShares website gave the following performance figures for market price of a fund share (based on the midpoint of the bid/ask spread at 4:00 p.m. ET) and the index: fund—year to date, 1.17%; 1 year on an annualized basis, 2.65%; 3 years on an annualized basis, 4.19%; since inception on March 3, 2011 on an annualized basis, 4.32%; index—year to date, 1.14%; 1 year on an annualized basis, 3.40%; 3 years on an annualized basis, 4.66%; since the fund’s inception on March 3, 2011 on an annualized basis, 4.60%.
The Index
The S&P/LSTA U.S. Leveraged Loan 100 Index is a market value-weighted index designed to measure the performance of the largest facilities in the U.S. leveraged loan market based on market weightings, spreads and interest payments. The constituents of the index are drawn from a universe of syndicated leveraged loans representing over 90% of the leveraged loan market. The index consists of 100 loan facilities drawn from a larger benchmark—the S&P/LSTA (Loan Syndications and Trading Association) Leveraged Loan Index (the “leveraged loan index”). The index is rules-based in order to allow for transparency; the S&P/LSTA U.S. Leveraged Loan 100 Index Committee (the “index committee”), however, reserves the right to exercise discretion when necessary.
The index is reported by Bloomberg L.P. under the ticker symbol “SPBDLL”.

S-132
Eligibility Criteria: All syndicated leveraged loans covered by the leveraged loan index are eligible for inclusion in the index. Term loans from syndicated credits must meet the following criteria at issuance in order to be eligible for inclusion in the leveraged loan index: (1) senior secured; (2) minimum initial term of one year; (3) minimum initial spread of 125 basis points over LIBOR; (4) denominated in U.S. dollars and (5) par amount outstanding of $50 million or greater. Only the 100 largest first-lien facilities from the leveraged loan index that meet all eligibility requirements are considered for inclusion in the index. While the index covers all issuers regardless of origin, all facilities must be denominated in U.S. dollars. All constituents of the index must have a publicly assigned CUSIP.
Index Calculation: The index is a market value-weighted index. LSTA/LPC Mark-to-Market Pricing is used to price each loan in the index. LSTA/LPC Mark-to-Market Pricing is based on bid/ask quotes gathered from dealers and is not based upon derived pricing models. The index uses the average bid for its market value calculation.
Each loan facility’s total return is calculated by aggregating the interest return, reflecting the return due to interest paid and accrued interest, and price return, reflecting the gains or losses due to changes in end-of-day prices and principal prepayments.
The return of each loan facility is weighted in the index based upon its market value outstanding, which reflects both the prior period’s price as well as accrued interest. The overall index return is the composite of each component loan facility’s return multiplied by the market value outstanding from the prior time period.
Calculation of Daily Index Returns and Daily Index Values: The individual index loan returns are aggregated to calculate returns for the index. Specifically, the total return for the index, on a given day, is equal to a weighted average of the returns of the index loans that constitute the index—with the weight of each index loan return being equal to the relative weight of that index loan in the index as of the previous calendar day (adjusted for principal pre-payments, etc.). The index return is therefore the sum of the result, for each index loan, of the market value of the index loan at the beginning of that day times the total return for such index loan on such day divided by market value of such loan at the beginning of that day. Index values are calculated each day by applying the current day’s index return to the previous day’s index value.
Calculation of Index Loan Market Values: The market value for each index loan is calculated as of the close on each calendar day. The market value of an index loan on a day is calculated as the product of the investable weight factor (used to adjust the par amount when a loan is capped (0 ≤ IWF ≤1.0) as described below) times the par amount of index loan as of the last weekly rebalancing (as adjusted for principal pre-payments and similar events through that day) times a fraction, the numerator of which is the sum of the price of the index loan plus its accrued interest (calculated on a 360-day basis) through that day and the denominator of which is 100.
If the calculation date is not a business day, the market value is based on the price as of the immediate prior business day, plus interest accrued to the valuation date.
The investable weight factor (“IWF”) is used to reduce the weight of a loan to less than 2% if the loan exceeds the maximum 2% weight in the index. At each weekly rebalancing, the loan weights are checked; if any loan exceeds 2%, its IWF is reduced until its weight is 1.90% and all the loans are reviewed for adjusted weights. If necessary, further IWF adjustments are made until no loan exceeds 2% weight.
Calculation of Relative Weights: The relative weight of an index loan is defined as the market value of that loan times its investable weight factor and expressed as a percentage of the aggregate market value of all index loans.
Calculation of Total Return: Returns are calculated for all index loans on every calendar day. The total return of an index loan is the sum of the interest return plus the market price return. Price return measures the return due to the change in the market price of the loan. Interest return (or coupon return) includes the return due to the interest earned on that loan. The interest return for each index loan is calculated as the product of IWF for that index loan times its par amount times the loan’s interest rate divided by 360 and divided by that index loan’s market value at the beginning of that day. The index interest rate is determined by the weighted average spread to LIBOR over the rate as provided by Wall Street OfficeTM. The price return of an index loan is calculated to give effect both to changes in the market price of the loan and any realized return due to receiving a principal repayment at the redemption price (which could differ from par).
Index Maintenance: The index is reviewed each week. Weekly index rebalancing maintenance (additions, deletions, pay-downs, and other changes to the index) is based on data as of Friday (or the last business day of the week in the case of holidays) and is announced the following Thursday (or Wednesday in the case of a holiday) for implementation on the following Friday. Announcements are made only if there are changes to the index. Highly probable weekly pay-downs

S-133
are estimated each Friday and enter the return universe at that time, until they are adjusted with actual data the following week. Publicly available information, up to and including each Thursday’s close, is considered in each weekly rebalancing.
Index changes published in the announcement generally will not be subject to revision and will become effective on the date listed in the announcement.
Facilities are retired from the index when they are repaid or are no longer priced by the LSTA/LPC Mark-to-Market Pricing.A complete review and rebalancing of all index constituents is completed on a semi-annual basis coinciding with the last weekly rebalance in June and December. Eligible loan facilities approved by the index committee are added to the index during the semi-annual rebalancing, but eligible loan facilities are added to the index at the weekly review only if other facilities are repaid or otherwise drop out of the index, in order to maintain 100 index loans. Index additions are also reviewed weekly and are made according to par outstanding and overall liquidity. Liquidity is determined by the par outstanding and number of market bids available. Any loan facility that fails to meet any of the eligibility criteria described above or that has a term to maturity less than or equal to 12 months plus one calendar day, as of the weekly rebalancing date, is not included in the index. Par amounts of index loans are adjusted on the weekly rebalancing date to reflect any changes that have occurred since the previous rebalancing date, due to partial pre-payments, pay-downs, and similar events. Constituent facilities are capped at 2% of the index and drawn-down at the weekly rebalancing through adjustment of the IWF as described above.
Cash Flows: Interest payments are considered paid on a rolling 90-day basis from the date each loan enters the index and are reinvested in the index, on a relative-weight basis, after 90 days. Pre-payments, pay-downs, and most other forms of cash flow (other than scheduled interest payments) are reconciled at the end of each week to be considered part of that week’s total return.
Index Governance: The index committee maintains the index. The index committee is comprised of employees of S&P Dow Jones Indices and Leverage Commentary & Data. The index committee is chaired by the Managing Director and Index Committee Chairman at S&P Dow Jones Indices. Meetings are held annually and as needed. It is the responsibility solely of the index committee to decide on all matters relating to methodology, maintenance, constituent selection and index procedures.
The index is calculated on all business days of the year following the SIFMA holiday schedule.
S&P/LSTA U.S. Leveraged Loan 100 Index: Top 10 Issuers By Weight as of May 27, 2014
The following table displays the top constituents of the index. We obtained the information in the table below from the index sponsor’s website without independent verification.
Issuers Index
Weight
H.J. Heinz Company 3.22% TXU Corp 3.21%
Clear Channel Communications 2.76% First Data Corp 2.54%
Dell Inc 2.53% HCA - The Healthcare Company 1.95% Community Health Systems Inc 1.90%
Hilton Hotels Corp 1.89% Fortescue Metals Group 1.89%
Asurion Corporation 1.86% The following table displays the industry breakdown of the index. We obtained the information in the table below from
the index sponsor’s website without independent verification.

S-134
S&P/LSTA U.S. Leveraged Loan 100 Index: LCD Broad Industry Breakdown as of May 27, 2014
Industry Index Weight Aerospace & Defense 1.88% Air Transport 0.85% All Telecom 6.72% Automotive 1.42% Building & Development 0.86% Business Equipment & Services 5.59% Cable & Satellite Television 4.36% Chemicals & Plastics 4.04% Containers & Glass Products 1.00% Drugs 1.32% Ecological Services & Equipment 0.79% Electronics/Electrical 6.19% Financial Intermediaries 5.17% Food Products 5.39% Food Service 3.25% Food/Drug Retailers 0.66% Health Care 11.40% Industrial Equipment 1.72% Insurance 2.74% Leisure Goods/Activities/Movies 3.31% Lodging & Casinos 8.32% Nonferrous Metals/Minerals 1.63% Oil & Gas 1.00% Publishing 3.31% Radio & Television 5.85% Retailers (Except Food & Drug) 5.24% Steel 1.89% Utilities 4.11%
Additional information regarding the index may be obtained from other sources including, but not limited to, press releases, newspaper articles, other publicly available documents, and the index sponsor’s website at http://us.spindices.com/indices/fixed-income/sp-lsta-us-leveraged-loan-100-index. We are not incorporating by reference the website, the sources listed above or any material they include in this disclosure statement supplement.
Historical Closing Prices of the Fund’s Shares
The closing price of shares of the fund has fluctuated in the past and may, in the future, experience significant fluctuations. Any historical upward or downward trend in the closing price of the shares during the period shown below is not an indication that the shares are more or less likely to increase or decrease at any time during the life of your CDs. The period shown below will be approximately ten years, but may be shorter if Bloomberg Financial Services does not provide historical closing prices for the entirety of such period (whether due to the applicable inception date occurring less than ten years from the date hereof or otherwise).
You should not take the historical closing prices of the shares as an indication of the future performance of the shares. We cannot give you any assurance that the future performance of the shares will result in your receiving an amount greater than the outstanding face amount of your CDs on the stated maturity date. Neither we nor any of our affiliates make any representation to you as to the performance of the shares. Before investing in the offered CDs, you should consult publicly available information to determine the relevant fund closing prices between the date of this disclosure statement supplement and the date of your purchase of the offered CDs. The actual performance of the fund over the life of the offered CDs, as well as the payment amount at maturity may bear little relation to the historical prices shown below.

S-135
The graph below shows the daily historical prices of the shares of the fund from March 3, 2011 through May 30, 2014. We obtained the closing prices shown in the graph below from Bloomberg Financial Services without independent verification.
PowerShares® is a registered trademark of Invesco PowerShares Capital Management LLC (“Invesco PowerShares”). Invesco PowerShares Capital Management LLC and Invesco Distributors, Inc. are indirect, wholly owned subsidiaries of Invesco Ltd. PowerShares® makes no representations or warranties to the owners of the index or any product linked to the Index or any member of the public regarding the advisability of investing in the Index or such product. PowerShares® has no obligation or liability in connection with the operation, marketing, trading or sale of the index.

S-136
General Questions and Answers Regarding Commodity Eligible ETFs
What Is a Commodity Contract?
A commodity contract is an agreement either to buy or sell a set amount of a physical commodity at a predetermined price and delivery period (which is generally referred to as a “delivery month”), or to make and receive a cash payment based on changes in the price of the commodity. Generally speaking, the return on an investment in commodity contracts is correlated with, but different from, the return on buying and holding physical commodities. Each index currently tracked by a commodity eligible ETF is comprised solely of commodity contracts on physical commodities traded on regulated futures trading facilities. However, it is possible that an index tracked by a commodity eligible ETF will in the future include swaps or other derivatives that are cleared through a centralized clearing house.
Why Do the Commodity Eligible ETFs Track Commodity Contracts And Not Physical Commodities?
While holding an inventory of physical commodities may have certain economic benefits (for example, a refinery could use a reserve of crude oil for the continuation of its operations), it also poses administrative burdens and costs, including those arising from the need to store or transport physical commodities. These requirements and costs may prove unattractive to investors who are interested solely in the price movement of commodities. Commodity contracts permit an investor to obtain exposure to the prices of commodities without directly incurring these requirements and costs. However, an investor in commodity contracts, or in an index of commodity contracts, can be indirectly exposed to these costs, which may be reflected in the prices of the commodity contracts and therefore in the index level. In addition, the fact that commodity contracts have publicly available prices allows calculation of an index based on these prices. The use of commodity contracts, therefore, allows the index sponsor to separate the exposure to price changes from the ownership of the underlying physical commodity, and thus allow participation in the upside and downside movement of commodity prices independently of the physical commodity itself.
If the Price of the Underlying Physical Commodities Goes Up, Will the Level of the Related Eligible ETF, Therefore, Also Go Up?
Not necessarily, for two reasons:
First, the commodity eligible ETFs track the commodity contract or contracts included in their respective index, rather than individual physical commodities themselves. Changes in the prices of commodity contracts should generally track changes in the prices of the underlying physical commodities, but, as described above under “Why Do the Commodity Eligible ETFs Track Commodity Contracts And Not Physical Commodities?”, the prices of commodity contracts might from time to time move in ways or to an extent that differ from movements in physical commodity prices. Therefore, you may observe prices of a particular commodity going up and the index level not changing in the same way.
Second, because commodity contracts have expiration dates – i.e., dates upon which trading of the commodity contract ceases, there are certain adjustments that need to be made to a commodity index in order to retain an investment position in the commodity contracts. These adjustments, which are described below and primarily include the mechanic of “rolling,” may have a positive or negative effect on the level of the index. As a result, these adjustments may, in certain instances, cause a discrepancy between the performance of the index and the performance of the underlying commodity contracts.
What Does “Rolling” a Commodity Contract Mean?
Since any commodity contract has a predetermined expiration date on which trading of the commodity contract ceases, holding a commodity contract until expiration will result in delivery of the underlying physical commodity or the requirement to make or receive a cash settlement. “Rolling” the commodity contracts, i.e., (i) selling near-dated (i.e., commodity contracts that are nearing expiration) commodity contracts before they expire and (ii) buying longer-dated contracts (i.e., commodity contracts that have an expiration date further in the future), allows an investor to maintain an investment position in commodities without receiving delivery of physical commodities or making or receiving a cash settlement.
Each index replicates an actual investment in commodity contracts, and therefore takes into account the need to roll the commodity contracts included in such index, and reflects the effects of this rolling. Specifically, as a commodity contract included in an index approaches expiration, such index is calculated as if the commodity contract in the first delivery month is sold and the proceeds of that sale are used to purchase a commodity contract of equivalent value in the next available delivery month. If the price of the second commodity contract is lower than the price of the first commodity contract, the “rolling” process results in a greater quantity of the second commodity contract being acquired for the same value.

S-137
Conversely, if the price of the second commodity contract is higher than the price of the first contract, the “rolling” process results in a smaller quantity of the second commodity contract being acquired for the same value.
What Do “Contango” and “Backwardation” Mean?
When the price of a near-dated commodity contract is greater than that of a longer-dated commodity contract, the market for such contracts is referred to as in “backwardation”. On the other hand, the market is referred to as in “contango” when the price of a near-dated commodity contract is less than that of a longer-dated commodity contract. “Rolling” commodity contracts in a backwardated or contango market can affect the level of an index.
How Does Rolling Affect the Level of an Index Underlying a Commodity Eligible ETF?
“Rolling” can affect an index in the following two ways:
First, if, as described above under “What Does “Rolling” a Commodity Contract Mean?”, an index theoretically owns more commodity contracts as a result of the rolling process (albeit at a lower price), the gain or loss on the new position for a given movement in the prices of the commodity contracts will be greater than if the index had owned the same number of commodity contracts as before the rolling process. Conversely, if an index theoretically owns fewer commodity contracts as a result of the rolling process (albeit at a higher price), the gain or loss on the new position for a given movement in the prices of the commodity contracts will be less than if such index had owned the same number of commodity contracts as before the rolling process. Therefore, these differentials in the quantities of contracts sold and purchased may have a positive or negative effect on the level of such index (measured on the basis of its dollar value).
Second, an index theoretically sells a near-dated commodity contract when it gets close to expiry and buys the longer-dated commodity contract. In a contango market, longer-dated commodity contracts are at higher prices than the near-dated commodity contracts. In the absence of significant market changes, the prices of the longer-dated commodity contracts which such index theoretically buys and holds are expected to (but may not) decrease over time as they near expiry. This expected decrease in price of these longer-dated commodity contracts as they near expiry can potentially cause the level of the index to decrease. However, there are a number of different factors affecting the index level. In a backwardated market, where the prices of near-dated commodity contracts are greater than the prices of longer-dated commodity contracts, the price of longer-dated commodity contracts which an index theoretically buys and holds are expected to (but may not) increase as they near expiry.
Can We Assume Any of Such Factors Will Have a Direct Effect on the Level of a Commodity Eligible ETF?
These factors are interrelated in complex ways and affect the performance of the commodity contracts comprising the index and, therefore, may offset each other in calculation of the level of a commodity eligible ETF. Therefore, you should not assume any one of these factors, the effect of rolling or any other factors (e.g., the positive price movement of any underlying physical commodity) will have a direct and linear effect on the performance of the commodity contracts and the level of the commodity eligible ETFs at any given time. The level of an eligible ETF, and therefore the level of the index, may decline even when one or more of such factors are favorable, due to the reasons explained in this subsection entitled “Questions and Answers”.

S-138
PowerShares® DB Commodity Index Tracking Fund
The PowerShares® DB Commodity Index Tracking Fund (the “fund”), is organized as a Delaware statutory trust. The fund issues common units of beneficial interest (“shares”), which represent units of fractional undivided beneficial interest in and ownership of the fund. The fund trades exchange-traded futures on the commodities comprising the DBIQ Optimum Yield Diversified Commodity Index Excess Return™, which we call the index, with a view to tracking the index over time. The index is intended to reflect the change in market value of the 14 specified commodities included in the index. The commodities included in the index are light sweet crude oil (WTI), heating oil, RBOB (reformulated gasoline blendstock for oxygen blending) gasoline, natural gas, Brent crude oil, gold, silver, aluminum, zinc, copper grade A, corn, wheat, soybeans, and sugar. The notional amounts of each index commodity included in the index are broadly in proportion to the levels of the world’s production and stocks of the index commodities at the time the index was established in 1997. The fund also invests in United States Treasury securities and other short-term fixed income securities. The shares trade on the NYSE Arca under the symbol “DBC.”
We obtained the following fee information from the PowerShares® website without independent verification. The manage is entitled to receive a management fee based on the net asset value of the fund, at an annualized rate of 0.85% of the net asset value of fund. This fee is payable by fund monthly in arrears. The fund also pays brokerage commissions and fees related to its trading activities, which are not expected to exceed 0.08% of the fund’s net asset value per annum. As of May 27, 2014, the estimated expense ratio of the trust was 0.93% per annum.
We have derived all information regarding the fund and the shares contained in this disclosure statement supplement from publicly available information without independent verification. For additional information regarding the fund, please consult the reports (including the annual report on Form 10-K for the fiscal year ended December 31, 2013 and other information the fund files with the SEC. Information provided to or filed with the SEC can be inspected and copied at the public reference facilities maintained by the SEC or through the SEC’s website at www.sec.gov and can be located by reference to SEC CIK number 0001328237. Additional information regarding the fund may be obtained from other sources including, but not limited to, press releases, newspaper articles, other publicly available documents, and the PowerShares® website at http://invescopowershares.com/products/overview.aspx?ticker=dbc. We are not incorporating by reference the website, the sources listed above or any material they include in this disclosure statement supplement.
Fund Structure
Wilmington Trust Company (the “trustee”), a Delaware trust company, is the sole trustee of the fund. The trustee has delegated to the manager certain of the power and authority to manage the business and affairs of the fund and has only nominal duties and liabilities to the fund. DB Commodity Services LLC serves as the manager (the “manager”) of the fund. The manager serves as both commodity pool operator and commodity trading advisor of the fund.
The manager has been registered with the Commodity Futures Trading Commission as a commodity pool operator and commodity trading advisor since June 7, 2005 and has been a member of the National Futures Association since June 16, 2005. The manager is a wholly-owned subsidiary of DB U.S. Financial Markets Holding Corporation, which is a wholly-owned, indirect subsidiary of Deutsche Bank AG. DB U.S. Financial Markets Holding Corporation has been a principal of the manager since May 31, 2005. The registration of the manager with the CFTC and its membership in the NFA must not be taken as an indication that either the CFTC or the NFA has recommended or approved the manager or the fund.
The shareholders take no part in the management or control, and have no voice in the operations or the business of the fund. Shareholders, may, however, remove and replace the manager as the manager of the fund, and may amend the trust declaration, except in certain limited respects, by the affirmative vote of a majority of the outstanding shares then owned by shareholders (as opposed to by the manager and its affiliates). The owners of a majority of the outstanding shares then owned by shareholders may also compel dissolution of the fund.
Investment Objective
The fund seeks to track changes, whether positive or negative, in the level of the index, over time, plus the excess, if any, of the fund’s interest income from its holdings of United States Treasury and other short-term fixed income securities over the expenses of the fund. The fund is managed to maintain correspondence between the composition and weightings of the index commodities comprising the index and the investments of the fund. The manager adjusts the fund’s investments from time-to-time to conform to periodic changes in the identity and/or relative weighting of the index commodities. The manager aggregates certain of the adjustments and makes changes to the portfolio at least monthly or more frequently in the case of significant changes to the index.

S-139
The value of the shares fluctuates in relation to changes in the value of the fund’s portfolio. The market price of the shares may not be identical to the net asset value per share.
The CFTC and/or commodity exchanges, as applicable, may impose position limits on market participants trading in certain commodities. If the manager determines in its commercially reasonable judgment that it has become impracticable or inefficient for any reason for the fund to gain full or partial exposure to any index commodity by investing in a specific futures contract that is a part of the index, the fund may invest in a futures contract referencing the particular index commodity other than the specific contract that is a part of the index or, in the alternative, invest in other futures contracts not based on the particular index commodity if, in the commercially reasonable judgment of the manager, such futures contracts tend to exhibit trading prices that correlate with a futures contract that is a part of the index.
Creation and Redemption of Fund Shares
The fund creates and redeems shares from time-to-time, but only in one or more baskets. A basket is a block of 200,000 shares. Except when aggregated in baskets, the shares are not redeemable securities. Baskets may be created or redeemed only by authorized participants (typically large financial institutions). The shares are not redeemable except in baskets.
Fees and Expenses
The fund pays the manager a management fee, monthly in arrears, in an amount equal to 0.85% per annum of the daily net asset value of the fund. The management fee is paid in consideration of the manager’s commodity futures trading advisory services. Expenses incurred in connection with the continuous offering of shares of the fund are paid by the manager. The manager will not allocate to the fund the indirect expenses of the manager.
The fund pays to the commodity broker all brokerage commissions, including applicable exchange fees and other transaction related fees and expenses charged in connection with its trading activities. The manager does not expect brokerage commissions and fees to exceed 0.08% of the net asset value of the fund in any year, although the actual amount of brokerage commissions and fees in any year or any part of any year may be greater.
The manager pays all routine operational, administrative and other ordinary expenses of the fund, generally, as determined by the manager. The manager expects that all of the routine operational, administrative and other ordinary expenses of the fund will be approximately 0.40% per annum of the fund’s net asset value. The fund pays all its extraordinary fees and expenses (as defined in the trust declaration) of the fund generally, if any, as determined by the manager. Extraordinary fees and expenses are fees and expenses which are non-recurring and unusual in nature, such as legal claims and liabilities and litigation costs or indemnification or other unanticipated expenses.
The management fee and the brokerage commissions and fees of the fund are paid first out of interest income from the fund’s holdings of U.S. Treasury bills and other short-term fixed income securities on deposit with the commodity broker as margin or otherwise. The interest income has historically been sufficient to cover the fees and expenses of the fund. If, however, the interest income is not sufficient to cover the fees and expenses of the fund during any period, the excess of the fees and expenses over the interest income will be paid out of income from futures trading, if any, or from sales of the fund’s fixed income securities.
Correlation
The performance of the fund and the index may vary due to, among other things, market disruptions affecting the commodity contracts, position limits on the index commodity, the fund’s operating expenses (including management fees) and costs the fund incurs in buying and selling the commodity contracts and other securities. The Fund seeks to track the excess return version of the index (ticker DBLCDBCE). Because the fund collateralizes its futures positions with positions in 3-month U.S. Treasuries, when providing performance data, PowerShares® displays the results of the total return version of the index (ticker DBLCDBCT) for comparison.
For the period ended April 30, 2014, the PowerShares website gave the following performance figures for market price of a fund share (based on the midpoint of the bid/ask spread at 4 pm ET) and the total return version index: fund—year to date, 3.02%; 1 year on an annualized basis, 0.27%; 3 years on an annualized basis, -6.20%; 5 years on an annualized basis, 5.83%; since fund inception on February 3, 2006 on an annualized basis, 1.92%; index—year to date, 3.21%; 1 year on an annualized basis, 1.15%; 3 years on an annualized basis, -5.42%; 5 years on an annualized basis, 6.52%; since fund inception on an annualized basis, 2.84%.

S-140
Termination Events
The fund will dissolve at any time upon the happening of any of the following events:
• The filing of a certificate of dissolution or revocation of the manager’s charter (and the expiration of 90 days after the date of notice to the manager of revocation without a reinstatement of its charter) or upon the withdrawal, removal, adjudication or admission of bankruptcy or insolvency of the manager, or an event of withdrawal unless (i) at the time there is at least one remaining manager and that remaining manager carries on the business of the fund or (ii) within 90 days of such event of withdrawal all the remaining shareholders agree in writing to continue the business of the fund and to select, effective as of the date of such event, one or more successor managers. If the fund is terminated as the result of an event of withdrawal and a failure of all remaining shareholders to continue the business of the fund and to appoint a successor managing owner as provided above within 120 days of such event of withdrawal, Shareholders holding shares representing at least a majority (over 50%) of the net asset value (not including shares held by the manager and its affiliates) may elect to continue the business of the fund by forming a new statutory trust, or reconstituted trust, on the same terms and provisions as set forth in the trust declaration. Any such election must also provide for the election of a manager to the reconstituted trust. If such an election is made, all shareholders of the fund shall be bound thereby and continue as shareholders of the reconstituted trust.
• The occurrence of any event which would make unlawful the continued existence of the fund.
• In the event of the suspension, revocation or termination of the manager’s registration as a commodity pool operator, or membership as a commodity pool operator with the NFA (if, in either case, such registration is required at such time unless at the time there is at least one remaining managing owner whose registration or membership has not been suspended, revoked or terminated).
• The fund becomes insolvent or bankrupt.
• The shareholders holding shares representing at least a majority (over 50%) of the net asset value (which excludes the shares of the manager) vote to dissolve the fund, notice of which is sent to the manager not less than ninety (90) business days prior to the effective date of termination.
• The determination of the manager that the aggregate net assets of the fund in relation to the operating expenses of the fund make it unreasonable or imprudent to continue the business of the fund, or, in the exercise of its reasonable discretion, the determination by the manager to dissolve the fund because the aggregate net asset value of the fund as of the close of business on any business day declines below $10 million.
• The fund is required to be registered as an investment company under the Investment Company Act of 1940.
• DTC is unable or unwilling to continue to perform its functions, and a comparable replacement is unavailable.
The Index
Overview
The fund pursues its investment objective by investing in a portfolio of exchange-traded futures on the index commodities. The index commodities are light sweet crude oil (WTI), heating oil, RBOB (reformulated gasoline blendstock for oxygen blending) gasoline, natural gas, Brent crude oil, gold, silver, aluminum, zinc, copper grade A, corn, wheat, soybeans, and sugar. The index is composed of notional amounts of each of the index commodities. The notional amounts of each index commodity included in the index are broadly in proportion to the levels of the world’s production and supplies of the index commodities at the index’s base date of September 3, 1997. The sponsor of the index is Deutsche Bank AG London.
The index is calculated on an excess return, or unfunded basis. The futures contract price for each index commodity will be the exchange closing prices for such index commodity on each weekday when banks in New York, New York are open, or index business days. If a weekday is not a trading day on the relevant exchange for a particular commodity but is an index business day, the exchange closing price from the previous index business day will be used for each index commodity. The closing level of the index is calculated by the index sponsor based on the closing price of the futures contracts for each of the index commodities and the notional amount of such index commodity. The composition of the index may be adjusted in the event that the index sponsor is not able to calculate the closing prices of the index commodities.

S-141
The index calculation is expressed as the weighted average return of the index commodities. The index is re-weighted on an annual basis on the sixth index business day of each November, to ensure that each of the index commodities is weighted in the same proportion that such index commodities were weighted on September 3, 1997, which serves as the base date for the index, on which date the closing level was 100. The following table reflects the index base weights of each index commodity on the base date:
Index Commodity Index Base Weight
Light Crude 12.38%
Heating Oil 12.38%
RBOB Gasoline 12.38%
Natural Gas 5.50%
Brent Crude 12.38%
Gold 8.00%
Silver 2.00%
Aluminum 4.17%
Zinc 4.17%
Copper Grade A 4.17%
Corn 5.63%
Wheat 5.63%
Soybeans 5.63%
Sugar 5.63%
Closing Level on Base Date: 100.00%
The index commodities are traded on the following futures exchanges:
Exchange Commodities
New York Mercantile Exchange Light Sweet Crude Oil (WTI), Heating Oil, RBOB Gasoline and Natural Gas
ICE-Futures Europe Brent Crude
Commodity Exchange Inc., New York Gold and Silver
The London Metal Exchange Limited Aluminum, Zinc and Copper Grade A
Board of Trade of the City of Chicago Inc. Corn, Wheat and Soybeans
ICE Futures U.S., Inc. Sugar
The index includes provisions for the replacement of futures contracts as they approach maturity. This replacement takes place over a period of time in order to lessen the impact on the market for the futures contracts being replaced. With respect to each index commodity, the fund employs a rule-based approach when it ‘rolls’ from one futures contract to another. Rather than select a new futures contract based on a predetermined schedule (e.g., monthly), each index commodity rolls to the futures contract which generates the best possible “implied roll yield” (as determined by the index sponsor). The futures contract with a delivery month within the next thirteen months which generates the best possible implied roll yield will be included in the index. As a result, each index commodity is able to potentially maximize the roll benefits in backwardated markets and minimize the losses from rolling in contangoed markets.
Contract Selection
On the first New York business day of each month, each index commodity futures contract will be tested in order to determine whether to continue including it in the index. If the index commodity futures contract requires delivery of the

S-142
underlying commodity in the next month, known as the delivery month, a new index commodity futures contract will be selected for inclusion in the index. For each index commodity in the index, the new index commodity futures contract selected will be the index commodity futures contract with the best possible implied roll yield (as determined by the index sponsor) based on the closing price for each eligible index commodity futures contract. Eligible index commodity futures contracts are any index commodity futures contracts having a delivery month no sooner than the month after the delivery month of the index commodity futures contract currently in the index, and no later than the thirteenth month after the testing date. For example, if the first New York business day is May 1, 2014 and the delivery month of an index commodity futures contract currently in the index is therefore June 2014, the delivery month of an eligible new index commodity futures contract must be between July 2014 and July 2015. The implied roll yield is then calculated and the futures contract on the index commodity with the best possible implied roll yield is then selected. If two futures contracts have the same implied roll yield, the futures contract with the minimum number of months prior to the delivery month is selected.
Monthly Index Roll Period
After the futures contract selection, the monthly roll for each index commodity subject to a roll in that particular month unwinds the old futures contract and enters a position in the new futures contract. This takes place between the second and sixth index business day of the month. On each day during the roll period, new notional holdings are calculated. The calculations for the old index commodities that are leaving the index and the new index commodities are then calculated. On all days that are not monthly index roll days, the notional holding of each index commodity future remains constant.
Interruption of Index Calculation
Calculation of the index may not be possible or feasible under certain events or circumstances, including, without limitation, a systems failure, natural or man-made disaster, act of God, armed conflict, act of terrorism, riot or labor disruption or any similar intervening circumstance, that is beyond the reasonable control of the index sponsor and that the index sponsor determines affects the index or any index commodity. Upon the occurrence of such force majeure events, the index sponsor may, in its discretion, elect one (or more) of the following options:
• make such determinations and/or adjustments to the terms of the index as it considers appropriate to determine any closing level on any such appropriate index business day; and/or
• defer publication of the information relating to the index until the next index business day on which it determines that no force majeure event exists; and/or
• permanently cancel publication of the information relating to the index.
Additionally, calculation of the index may also be disrupted by an event that would require the index sponsor to calculate the closing price in respect of the relevant index commodity on an alternative basis were such event to occur or exist on a day that is a trading day for such index commodity on the relevant exchange. If such an index disruption event in relation to an index commodity as described in the prior sentence occurs and continues for a period of five successive trading days for such index commodity on the relevant exchange, the index sponsor will, in its discretion, either
• continue to calculate the relevant closing price for a further period of five successive trading days for such index commodity on the relevant exchange; or
• if such period extends beyond the five successive trading days, the index sponsor may elect to replace the exchange traded instrument with respect to a specific index commodity and shall make all necessary adjustments to the methodology and calculation of the index as it deems appropriate.
Historical Closing Prices of the Fund’s Shares
The closing price of shares of the fund has fluctuated in the past and may, in the future, experience significant fluctuations. Any historical upward or downward trend in the closing price of the shares during the period shown below is not an indication that the shares are more or less likely to increase or decrease at any time during the life of your CDs. The period shown below will be approximately ten years, but may be shorter if Bloomberg Financial Services does not provide historical closing prices for the entirety of such period (whether due to the applicable inception date occurring less than ten years from the date hereof or otherwise).
You should not take the historical closing prices of the shares as an indication of the future performance of the shares. We cannot give you any assurance that the future performance of the shares will result in your receiving an amount greater than the outstanding face amount of your CDs on the stated maturity date. Neither we nor any of our

S-143
affiliates make any representation to you as to the performance of the shares. Before investing in the offered CDs, you should consult publicly available information to determine the relevant fund closing prices between the date of this disclosure statement supplement and the date of your purchase of the offered CDs. The actual performance of the fund over the life of the offered CDs, as well as the payment amount at maturity may bear little relation to the historical prices shown below.
The graph below shows the daily historical prices of the shares of the fund from May 3, 2006 through May 30, 2014. We obtained the closing prices shown in the graph below from Bloomberg Financial Services without independent verification.
PowerShares® is a registered trademark of Invesco PowerShares Capital Management LLC (“Invesco PowerShares”). Invesco PowerShares Capital Management LLC and Invesco Distributors, Inc. are indirect, wholly owned subsidiaries of Invesco Ltd. PowerShares® makes no representations or warranties to the owners of the Index or any product linked to the Index or any member of the public regarding the advisability of investing in the Index or such product. PowerShares® has no obligation or liability in connection with the operation, marketing, trading or sale of the Index.

S-144
SPDR® Gold Trust
The SPDR® Gold Trust (the “trust”) issues SPDR® Gold Shares, which represent units of fractional undivided beneficial interest in and ownership of the trust (the “shares”). The trust holds gold bars and intends for its shares to reflect the performance of the price of gold bullion minus the trust’s expenses and fees. The shares trade under the ticker symbol “GLD” on the NYSE Arca.
We have derived all information regarding the trust and the shares contained in this disclosure statement supplement from publicly available information without independent verification. For additional information regarding the trust, please consult the reports (including the annual report on Form 10-K for the fiscal year ended September 30, 2013) and other information the trust files with the SEC. Information provided to or filed with the SEC can be inspected and copied at the public reference facilities maintained by the SEC or through the SEC’s website at www.sec.gov and can be located by reference to SEC CIK number 0001222333. Additional information regarding the trust may be obtained from other sources including, but not limited to, press releases, newspaper articles, other publicly available documents, and the SPDR® Gold Shares website at www.spdrgoldshares.com. We are not incorporating by reference the website, the sources listed above or any material they include in this disclosure statement supplement.
The Trust
The SPDR® Gold Trust is an investment trust, formed on November 12, 2004, that holds gold bars and is expected from time to time to issue blocks of 100,000 trust shares (called baskets) in exchange for deposits of gold and to distribute gold in connection with redemptions of baskets.
The trust’s sponsor is World Gold Trust Services, LLC, a Delaware limited liability company, which is wholly-owned by the World Gold Council, a not-for-profit association registered under Swiss law. The sponsor established the trust and generally oversees the performance of the trustee and the trust’s principal service providers, but does not exercise day-to-day oversight. The sponsor may remove the trustee and appoint a successor in certain circumstances.
The trustee is BNY Mellon Asset Servicing, a division of The Bank of New York Mellon. The trustee is generally responsible for the day-to-day administration of the trust. This includes selling the trust’s gold as needed to pay the trust’s expenses (gold sales are expected to occur approximately monthly in the ordinary course), calculating the net asset value (NAV) of the trust and the NAV per trust share, receiving and processing orders from authorized participants to create and redeem baskets and coordinating the processing of such orders with the custodian and The Depository Trust Company and monitoring the custodian. The trustee determines the NAV of the trust on each day that the NYSE Arca is open for regular trading, at the earlier of the afternoon session of the twice daily fix of the price of an ounce of gold which starts at 3:00 PM London, England time (known as the London PM Fix), or 12:00 PM New York time. The London PM Fix is performed in London by the five members of the London Bullion Market Association (LBMA). The NAV of the trust is the aggregate value of the trust’s assets less its estimated accrued but unpaid liabilities (which include accrued expenses). In determining the trust’s NAV, the trustee values the gold held by the trust based on the London PM Fix price for an ounce of gold. The trustee also determines the NAV per trust share.
The custodian is HSBC Bank USA, N.A. The custodian is responsible for the safekeeping of the trust’s gold bars transferred to it in connection with the creation of baskets. The custodian also facilitates the transfer of gold in and out of the trust through gold accounts it maintains for authorized participants and the trust. The custodian is a market maker, clearer and approved weigher under the rules of the LBMA.
Shareholders of the trust have no voting rights, except in limited circumstances. Shareholders holding at least 66 2/3% of the shares outstanding may vote to remove the trustee. The trustee may terminate the trust upon the agreement of shareholders owning at least 66 2/3% of the outstanding shares. In addition, certain amendments to the trust indenture require 51% or unanimous consent of the shareholders.
The trust is not registered as an investment company under the Investment Company Act of 1940 and is not required to register under that act. The trust will not hold or trade in commodity futures contracts regulated by the Commodity Exchange Act of 1936 (the CEA), as administered by the Commodity Futures Trading Commission (the CFTC). The trust is not a commodity pool for purposes of the CEA, and none of the sponsor, the trustee or the marketing agent, State Street Global Markets, LLC, is subject to regulation as a commodity pool operator or a commodity trading advisor in connection with the shares.

S-145
Investment Objective
The investment objective of the trust is for the shares to reflect the performance of the price of gold bullion, less the trust’s expenses. The sponsor believes that, for many investors, the shares represent a cost-effective investment relative to traditional means of investing in gold. The sponsor intends the shares to offer investors an opportunity to participate in the gold market through an investment in securities without the logistics of buying, storing and insuring gold. The trust has no fixed termination date and will terminate upon the occurrence of a termination event listed in the trust indenture.
The trust indenture provides for distributions to shareholders in only two circumstances. First, if the trustee and the sponsor determine that the trust’s cash account balance exceeds the anticipated expenses of the trust for the next 12 months and the excess amount is more than $0.01 per share outstanding, they shall direct the excess amount to be distributed to the shareholders. Second, if the trust is terminated and liquidated, the trustee will distribute to the shareholders any amounts remaining after the satisfaction of all outstanding liabilities of the trust and the establishment of such reserves for applicable taxes, other governmental charges and contingent or future liabilities as the trustee shall determine. Shareholders of record on the record date fixed by the trustee for a distribution will be entitled to receive their pro rata portion of any distribution. The trust does not make any other distributions to shareholders.
Creation and Redemption of the Shares of the Trust
The trust creates and redeems its shares from time to time, but only in one or more baskets (a basket equals a block of 100,000 trust shares). The creation and redemption of baskets requires the delivery to the trust or the distribution by the trust of the amount of gold and any cash represented by the baskets being created or redeemed, the amount of which is based on the combined NAV of the number of trust shares included in the baskets being created or redeemed. The initial amount of gold required for deposit with the trust to create shares for the period from the formation of the trust to the first day of trading of the trust shares on the NYSE was 10,000 ounces per basket. The number of ounces of gold required to create a basket or to be delivered upon the redemption of a basket gradually decreases over time, due to the accrual of the trust’s expenses and the sale of the trust’s gold to pay the trust’s expenses. Baskets may be created or redeemed only by an authorized participant, which is a person who is a registered broker-dealer or other securities market participant such as a bank or other financial institution which is not required to register as a broker-dealer to engage in securities transactions, is a participant in the Depository Trust Company system, has entered into an agreement with the sponsor and the trustee which provides the procedures for the creation and redemption of baskets and for the delivery of the gold and any cash required for such creations and redemptions and has established an unallocated gold account with the custodian.
Termination Events
The sponsor may, and it is anticipated that the sponsor will, direct the trustee to terminate and liquidate the trust at any time if the NAV of the trust is less than $350 million (as adjusted over time for inflation). The sponsor may also direct the trustee to terminate the trust if the CFTC determines that the trust is a commodity pool under the CEA. The trustee may also terminate the trust upon the agreement of trust shareholders owning at least 66⅔% of the outstanding trust shares.
In addition, the trustee will terminate and liquidate the trust if one of the following events occurs:
• The Depository Trust Company, the securities depository for the shares of the trust, is unwilling or unable to perform its functions under the trust indenture and no suitable replacement is available;
• The shares of the trust are de-listed from the NYSE Arca and are not listed for trading on another U.S. national securities exchange or through the NASDAQ Stock Market within five business days from the date the shares of the trust are de-listed;
• The NAV of the trust remains less than $50 million for a period of 50 consecutive business days;
• The sponsor resigns or is unable to perform its duties or becomes bankrupt or insolvent and the trustee has not appointed a successor and has not itself agreed to act as sponsor;
• The trustee resigns or is removed and no successor trustee is appointed within 60 days;
• The custodian resigns and no successor custodian is appointed within 60 days;

S-146
• The sale of all of the trust’s assets;
• The trust fails to qualify for treatment, or ceases to be treated, for U.S. federal income tax purposes, as a grantor trust; or
• The maximum period for which the trust is allowed to exist under New York law ends.
Upon the termination of the trust, the trustee will, within a reasonable time after the termination of the trust, sell the trust’s gold bars and, after paying or making provision for the trust’s liabilities, distribute the proceeds to the shareholders of the trust.
Valuation of Gold and NAV
As of the London PM Fix on each day that NYSE Arca is open for regular trading or, if there is no London PM Fix on such day or the London PM Fix has not been announced by 12:00 PM New York time on such day, as of 12:00 PM New York time on such day, the trustee values the gold held by the trust and determines both the adjusted NAV and the NAV of the trust. The trustee values the trust’s gold on the basis of that day’s London PM Fix or, if no London PM Fix is made on such day or has not been announced by the valuation time, the next most recent London gold price fix (AM or PM) determined prior to that time is used, unless the trustee, in consultation with the sponsor, determines that such price is inappropriate as a basis for valuation. In the event the trustee and the sponsor determine that the London PM Fix or last prior London fix is not an appropriate basis for valuation of the trust’s gold, they shall identify an alternative basis for such valuation to be employed by the trustee. Once the value of the gold has been determined, the trustee subtracts all estimated accrued but unpaid fees (other than the fees accruing for the evaluation day which are computed by reference to the adjusted NAV of the trust or the custody fees accruing for the evaluation day which are based on the value of the gold held by the trust), expenses and other liabilities of the trust from the total value of the gold and all other assets of the trust (other than any amounts credited to the trust’s reserve account, if established). The resulting figure is the adjusted NAV of the trust. The adjusted NAV of the trust is used to compute the fees of the sponsor, the trustee and the marketing agent. To determine the trust’s NAV, the trustee subtracts the amount of estimated accrued but unpaid fees accruing for the evaluation day which are computed by reference to the adjusted NAV of the trust and to the value of the gold held by the trust from the adjusted NAV of the trust. The resulting figure is the NAV of the trust. The trustee also determines the NAV per trust share by dividing the NAV of the trust by the number of the trust shares outstanding as of the close of trading on NYSE Arca (which includes the net number of any trust shares created or redeemed on such evaluation day).
The shares may trade at, above or below the NAV per share. The NAV per share fluctuates with changes in the market value of the trust’s assets. The trading price of the shares fluctuates in accordance with changes in the NAV per share as well as market supply and demand.
Expenses and Fees
The trust’s ordinary operating expenses are accrued daily and are reflected in the NAV of the trust. The trust’s expenses include fees and expenses of the trustee (which include fees and expenses paid to the custodian by the trustee for the custody of the trust’s gold), the fees and expenses of the sponsor, the fees and expenses of the trustee, certain taxes, the fees of the marketing agent, printing and mailing costs, legal and audit fees, registration fees, NYSE Arca listing fees and other marketing costs and expenses. In order to pay the trust’s expenses, the trustee sells gold held by the trust on an as needed basis. As a result, the amount of gold sold will vary from time to time depending on the level of the trust’s expenses and the market price of gold. Each sale of gold by the trust is a taxable event to shareholders of the trust. Cash held by the trustee does not bear any interest.
The sponsor’s fee is payable monthly in arrears and is accrued daily at an annual rate equal to 0.15% of the daily adjusted NAV of the trust. The marketing agent’s fee is payable monthly in arrears and is accrued daily at an annual rate equal to 0.15% of the daily adjusted NAV of the trust. If at the end of any month, the estimated ordinary expenses of the trust exceed an amount equal to 0.40% per year of the daily adjusted NAV of the trust for such month, the marketing agent and the sponsor will waive the amount of such excess from the fees payable to them from the assets of the trust for such month in equal shares up to the amount of their fees. Additionally, if the trust incurs unforeseen expenses that cause the total ordinary expenses of the trust to exceed 0.70% per year of the daily adjusted NAV of the trust, the ordinary expenses will accrue at a rate greater than 0.40% per year of the daily adjusted NAV of the trust, even after the sponsor and the marketing agent have completely waived their combined fees of 0.30% per year of the daily adjusted NAV of the trust.

S-147
The trustee’s fee is payable monthly in arrears and is accrued daily at an annual rate equal to 0.02% of the adjusted NAV of the trust, subject to a minimum fee of $500,000 and a maximum fee of $2,000,000 per year. The custodian’s fee is computed at an annual rate equal to 0.10% of the average daily aggregate value of the first 4.5 million ounces of gold held in the trust and 0.06% of the average daily aggregate value of all gold held in the trust in excess of 4.5 million ounces.
Understanding the LBMA and the London Fix
Although the market for physical gold is global, most over the counter market trades are cleared through London. In addition to coordinating market activities, the LBMA acts as the principal point of contact between the market and its regulators. A primary function of the LBMA is its involvement in the promotion of refining standards by maintenance of the “London Good Delivery Lists,” which are the lists of LBMA accredited melters and assayers of gold. The LBMA also coordinates market clearing and vaulting, promotes good trading practices and develops standard documentation.
Twice daily during London trading hours there is a fix which provides reference gold prices for that day’s trading. Many long-term contracts will be priced on the basis of either the morning (AM) or afternoon (PM) London fix, and market participants will usually refer to one or the other of these prices when looking for a basis for valuations. The London fix is the most widely used benchmark for daily gold prices and is quoted by various financial information sources. Formal participation in the London fix is traditionally limited to five members, each of which is a bullion dealer and a member of the LBMA. The chairmanship rotates annually among the five member firms. Orders are placed either with one of the five fixing members or with another bullion dealer who will then be in contact with a fixing member during the fixing. The fixing members net-off all orders when communicating their net interest at the fixing.
Historical Closing Prices of the Fund’s Shares
The closing price of shares of the fund has fluctuated in the past and may, in the future, experience significant fluctuations. Any historical upward or downward trend in the closing price of the shares during the period shown below is not an indication that the shares are more or less likely to increase or decrease at any time during the life of your CDs. The period shown below will be approximately ten years, but may be shorter if Bloomberg Financial Services does not provide historical closing prices for the entirety of such period (whether due to the applicable inception date occurring less than ten years from the date hereof or otherwise).
You should not take the historical closing prices of the shares as an indication of the future performance of the shares. We cannot give you any assurance that the future performance of the shares will result in your receiving an amount greater than the outstanding face amount of your CDs on the stated maturity date. Neither we nor any of our affiliates make any representation to you as to the performance of the shares. Before investing in the offered CDs, you should consult publicly available information to determine the relevant fund closing prices between the date of this disclosure statement supplement and the date of your purchase of the offered CDs. The actual performance of the fund over the life of the offered CDs, as well as the payment amount at maturity may bear little relation to the historical prices shown below.
The graph below shows the daily historical prices of the shares of the fund from March 1, 2005 through May 30, 2014. We obtained the closing prices shown in the graph below from Bloomberg Financial Services without independent verification.

S-148
“SPDR®” is a registered trademark of Standard & Poor's Financial Services LLC (S&P) and Dow Jones is a registered trademark of Dow Jones Trademark Holdings LLC (Dow Jones) and have been licensed for use by S&P Dow Jones Indices LLC. The index is not sponsored, endorsed, sold or promoted by S&P Dow Jones Indices LLC, Dow Jones, S&P or their respective affiliates, and neither S&P Dow Jones Indices LLC, Dow Jones, S&P or their respective affiliates make any representation regarding the advisability of investing in the index.

S-149
iShares® TIPS Bond ETF
The shares of the iShares® TIPS Bond ETF (the “fund”) are issued by iShares® Trust, a registered investment company. On July 1, 2013, the iShares® TIPS Bond Fund changed its name to iShares® TIPS Bond ETF.
• The fund is a tracking ETF that seeks investment results which correspond generally to the price and yield performance, before fees and expenses, of the index.
• The index it tracks is the Barclays U.S. Treasury Inflation Protected Securities (TIPS) Index (Series-L) (the “index”).
• Investment Advisor: BlackRock Fund Advisors (“BFA”).
• The fund’s shares trade on the NYSE Arca under the ticker symbol “TIP”.
• The iShares® Trust’s SEC CIK Number is 0001100663.
• The fund’s inception date was December 4, 2003.
• The fund’s shares are issued or redeemed only in creation units of 100,000 shares or multiples thereof.
We obtained the following fee information from the iShares® website without independent verification. The investment advisor is entitled to receive a management fee from the fund based on the fund’s allocable portion of an aggregate management fee based on the aggregate average daily net assets of the fund and a set of other iShares® funds as follows: 0.2000% per annum of the aggregate net assets of the funds less than or equal to $121.0 billion, plus 0.1900% per annum of the aggregate net assets of the funds on amounts greater than $121.0 billion up to and including $211.0 billion, plus 0.1805% per annum of the aggregate net assets of the funds on amounts greater than $211.0 billion. As of March 31, 2014, the expense ratio of the fund was 0.20% per annum.
For additional information regarding iShares® Trust or BFA, please consult the reports (including the Annual Report to Shareholders on Form N−CSR for the period ended October 31, 2013) and other information iShares® Trust files with the SEC. In addition, information regarding the fund, including its top portfolio holdings, may be obtained from other sources including, but not limited to, press releases, newspaper articles, other publicly available documents, and the iShares® website at http://us.ishares.com/product_info/fund/overview/TIP.htm. We are not incorporating by reference the website, the sources listed above or any material they include in this disclosure statement supplement.
Investment Objective and Strategy
The fund seeks to provide investment results that correspond generally to the price and yield performance, before fees and expenses, of the index. The fund’s investment objective and the index that the fund tracks may be changed without shareholder approval.
BFA uses a representative sampling strategy to attempt to track the performance of the index. For the fund, this strategy involves investing in a representative sample of securities that collectively have an investment profile similar to that of the index. The securities selected are expected to have aggregate investment characteristics (based on factors such as market capitalization and industry weightings), fundamental characteristics (such as return variability, duration, maturity or credit ratings and yield) and liquidity measures similar to those of the index. The fund may or may not hold all of the securities in the index.
The fund generally invests at least 90% of its assets in the bonds in the index and at least 95% of its assets in U.S. government bonds. The fund may invest up to 10% of its assets in U.S. government bonds not included in the index, but which BFA believes will help the fund track the index. For example, the fund may invest in bonds or other assets not included in the index in order to reflect changes in the index (such as reconstitutions, additions and deletions). The fund may also invest up to 5% of its assets in repurchase agreements collateralized by U.S. government obligations and in cash and cash equivalents, including shares of money market funds advised by BFA or its affiliates. The fund may lend securities representing up to one-third of the value of the fund’s total assets (including the value of the collateral received).
The Fund’s Holdings
The following table displays the top holdings of the fund. We obtained the information in the tables below from the iShares® website without independent verification.

S-150
iShares® TIPS Bond ETF Top Ten Holdings as of May 27, 2014
Treasury Inflation-Protected Note Percentage (%)
0.13% due 4/15/2018 12.42%
0.63% due 1/15/2024 6.77%
1.13% due 1/15/2021 6.73%
0.13% due 4/15/2017 6.69%
0.13% due 7/15/2022 4.36%
0.13% due 1/15/2023 4.09%
2.00% due 1/15/2016 3.98%
0.13% due 1/15/2022 3.76%
0.63% due 7/15/2021 3.50%
3.88% due 4/15/2029 3.20%
Total 55.50%
The following table displays additional information about the bonds held by the fund as of May 27, 2014. We obtained the information in the table below from the iShares® website without independent verification.
Weighted average maturity 8.47 years
Weighted average coupon 1.02%
Real modified duration 7.71
Weighted average maturity is the length of time until the average security in the fund will mature or be redeemed by its issuer. Weighted average coupon is the average coupon of the bonds in the fund weighted by relative size in the portfolio. Real modified duration is a measure of the responsiveness of an inflation-linked bond or portfolio price to parallel shifts in real interest rates (as opposed to nominal interest rates).
As of May 23, 2014, the fund had 39 holdings and 98.80% of which were U.S. Treasury bonds and 1.20% of which were cash or short-term securities. As of May 27, 2014, 94.70% of the fund’s holdings were rated Aaa by Moody’s and 94.70% of the fund’s holdings were rated AA+ by S&P.
Tracking Error
The performance of the fund and the index may vary due to a variety of factors, including transaction costs, timing variances and differences between the fund’s portfolio and the index resulting from legal restrictions (such as diversification requirements) that apply to the fund but not to the index or to investors using a representative sampling strategy in general. BFA expects that, over time, the fund’s tracking error will not exceed 5%. The fund’s use of a representative sampling strategy can be expected to produce a greater tracking error over a period of time than would result if the fund used an indexing strategy in which a fund invests in substantially all of the securities in its index in approximately the same proportions as in the index.
As of April 30, 2014, iShares reported the following average annual returns on the market price of the fund’s shares and the index. The market price of the fund’s shares takes into account distributions on the shares and the returns shown account for changes in the mid-point of the bid and ask prices at 4:00 p.m., Eastern time on the relevant date. Fund shares: 1 year, -6.01; 3 years, 2.96; 5 years, 5.33; 10 years, 5.02; since inception, 4.91; index: 1 year, -5.97; 3 years, 3.11; 5 years, 5.58; 10 years, 5.19%; since fund inception, 5.07.
The Index
The index is sponsored by Barclays Capital Inc. (Barclays), which determines the composition and relative weightings of the securities in the index and publishes information regarding its market value. The index measures the performance of the inflation-protected public obligations of the U.S. Treasury, commonly known as “TIPS.” TIPS are securities issued by the U.S. Treasury that are designed to provide inflation protection to investors. TIPS are income-generating instruments whose interest and principal payments are adjusted for

S-151
inflation — a sustained increase in prices that erodes the purchasing power of money. The inflation adjustment, which is typically applied monthly to the principal of the bond, follows a designated inflation index, the non-seasonally adjusted Consumer Price Index for All Urban Consumers, or the CPI-U (the “CPI”), and TIPS’ principal payments are adjusted according to changes in the CPI. A fixed coupon rate is applied to the inflation-adjusted principal so that as inflation rises, both the principal value and the interest payments increase. This can provide investors with a hedge against inflation, as it helps preserve the purchasing power of an investment. Because of this inflation adjustment feature, inflation-protected bonds typically have lower yields than conventional fixed-rate bonds. The index is calculated in U.S. dollars on a total return (gross) basis.
The index includes all publicly-issued U.S. Treasury inflation-protected securities that have at least one year remaining to maturity, are rated investment grade (Baa3/BBB- or higher using the middle rating of Moody’s, S&P and Fitch) and have $250 million or more of outstanding face value. In determining index eligibility, U.S. Treasuries held in the Federal Reserve system open market account are deducted from the total amount outstanding as follows. New issuances bought at auction by the Federal Reserve do not enter the index, and net secondary market purchases/sales by the Federal Reserve are adjusted at each month-end with a one-month lag.
In addition, the securities must be denominated in U.S. dollars, bear interest at a fixed rate and may not be convertible. The index does not include certain issues, such as state and local government series bonds, Treasury bills, bellwether securities, or coupon issues that have been stripped from bonds. The index is market capitalization weighted and includes all of the securities that meet the index criteria. The securities in the index are updated on the last calendar day of each month.
Rebalancing the Index. The index is rebalanced at each month-end, and this represents the fixed set of bonds on which index returns are calculated for the ensuing month. During the month, indicative changes to securities (credit rating change, sector reclassification, amount outstanding changes, corporate actions, ticker changes) are reflected on a daily basis. These changes will affect the composition of the bonds in the index at month-end, when the index is rebalanced. Eligible securities issued, but not necessarily settled, on or before the month-end rebalancing date qualify for inclusion in the following month’s index if required security reference information and pricing are readily available.
Intra-month cash flows. Intra-month cash flows from interest and principal payments contribute to monthly index returns, but are not reinvested at any short-term reinvestment rate in between rebalance dates to earn an incremental return. However, after the rebalancing, cash is effectively reinvested into the index for the following month, so that index results over two or more months reflect monthly compounding.
Calculation. The amount outstanding reported for the TIPS is equal to the notional par value of each TIP security available for purchase by the public as reported by the Treasury in the Quarterly Treasury Bulletin. This number is then adjusted (divided) by the compounded rate of inflation since the date of issue (represented by the “index ratio” described below). The number is updated quarterly at the end of a month that the Quarterly Treasury Bulletin is released.
When a new TIPS is issued or an existing issue is reopened, its full amount outstanding is included in the index for returns purposes on the first day of the following month. Once the new issuance or reopening is published in the Quarterly Treasury Bulletin, the amount is adjusted to reflect the amount outstanding net of holdings by the Treasury.
The “index ratio” is used as a multiplier to adjust the nominal principal and coupon payments of the security, so that their real values remain unchanged. The calculation of the index ratio is as follows: index ratio = (reference CPI) / (base CPI). The base CPI is calculated by linearly interpolating between the two most recent CPI levels available as of the start of the month, assuming a next calendar day settlement.
The index ratio is used to calculate the inflated price and the inflated accrued interest of the bonds held in the index. The inflated price is equal to the quoted (uninflated) price * index ratio. The inflated accrued interest is equal to ½ of the annual coupon times (number of days accrued / number of days in coupon period) * par value * index ratio. The market value of the index is equal to (inflated price + inflated accrued interest) / 100) * amount outstanding.
Real yields on the bonds in the index are converted into nominal terms through the use of an assumed inflation rate. The assumed inflation rate is used to project inflated cash flows for TIPS. The assumed inflation

S-152
rate is based on breakeven inflation rates extracted from the inflation swaps market with adjustments for seasonality.
Additional information regarding the index may be obtained from other sources including, but not limited to, press releases, newspaper articles, other publicly available documents, and the US TIPS (Series-L) Index factsheet available at https://ecommerce.barcap.com/indices/show?url=Home/Guides_and_Factsheets. We are not incorporating by reference the website, the sources listed above or any material they include in this disclosure statement supplement.
Historical Closing Prices of the Fund’s Shares
The closing price of shares of the fund has fluctuated in the past and may, in the future, experience significant fluctuations. Any historical upward or downward trend in the closing price of the shares during the period shown below is not an indication that the shares are more or less likely to increase or decrease at any time during the life of your CDs. The period shown below will be approximately ten years, but may be shorter if Bloomberg Financial Services does not provide historical closing prices for the entirety of such period (whether due to the applicable inception date occurring less than ten years from the date hereof or otherwise).
You should not take the historical closing prices of the shares as an indication of the future performance of the shares. We cannot give you any assurance that the future performance of the shares will result in your receiving an amount greater than the outstanding face amount of your CDs on the stated maturity date. Neither we nor any of our affiliates make any representation to you as to the performance of the shares. Before investing in the offered CDs, you should consult publicly available information to determine the relevant fund closing prices between the date of this disclosure statement supplement and the date of your purchase of the offered CDs. The actual performance of the fund over the life of the offered CDs, as well as the payment amount at maturity may bear little relation to the historical prices shown below.
The graph below shows the daily historical prices of the shares of the fund from August 26, 2004 through May 30, 2014. We obtained the closing prices shown in the graph below from Bloomberg Financial Services without independent verification.
“iShares®” is a registered trademark of BlackRock Institutional Trust Company, N.A. (BITC). The index is not sponsored, endorsed, sold, or promoted by BITC. BITC makes no representations or warranties to the owners of the index or any member of the public regarding the advisability of investing in the index. BITC has no obligation or liability in connection with the operation, marketing, trading or sale of the index.

S-153
Money Market Position
The money market position is included in the cash equivalent asset class and reflects the notional return accruing to a hypothetical investor from an investment in a notional overnight money account denominated in U.S. dollars that accrues interest at a rate determined by reference to the overnight interest rate, which is the federal funds effective rate.
The table set forth below illustrates the historical levels of the federal funds effective rate since January 1, 2003. The level of the federal funds effective rate has fluctuated in the past and may, in the future, experience significant fluctuations. Any historical upward or downward trend in the level of the federal funds effective rate during the period shown below is not an indication that the level of the federal funds effective rate is more or less likely to increase or decrease at any time during the life of the CDs.
You should not take the historical level of the federal funds effective rate as an indication of future levels of the federal funds effective rate. We cannot give you any assurance that the future levels of the federal funds effective rate will result in your receiving a return on your CDs that is greater than the return you would have realized if you invested in a debt security of comparable maturity that bears interest at a prevailing market rate.
In light of current market conditions, the trends reflected in the historical levels of the federal funds effective rate may be less likely to be indicative of the levels of the federal funds effective rate during the term of the CDs.
Neither we nor any of our affiliates make any representation to you as to the performance of the federal funds effective rate. The actual levels of the federal funds effective rate may bear little relation to the historical levels of the federal funds effective rate shown below.
The graph below shows the daily historical levels of the federal funds effective rate from May 30, 2004 through May 30, 2014. We obtained the federal funds effective rates shown in the graph below from Reuters, without independent verification.
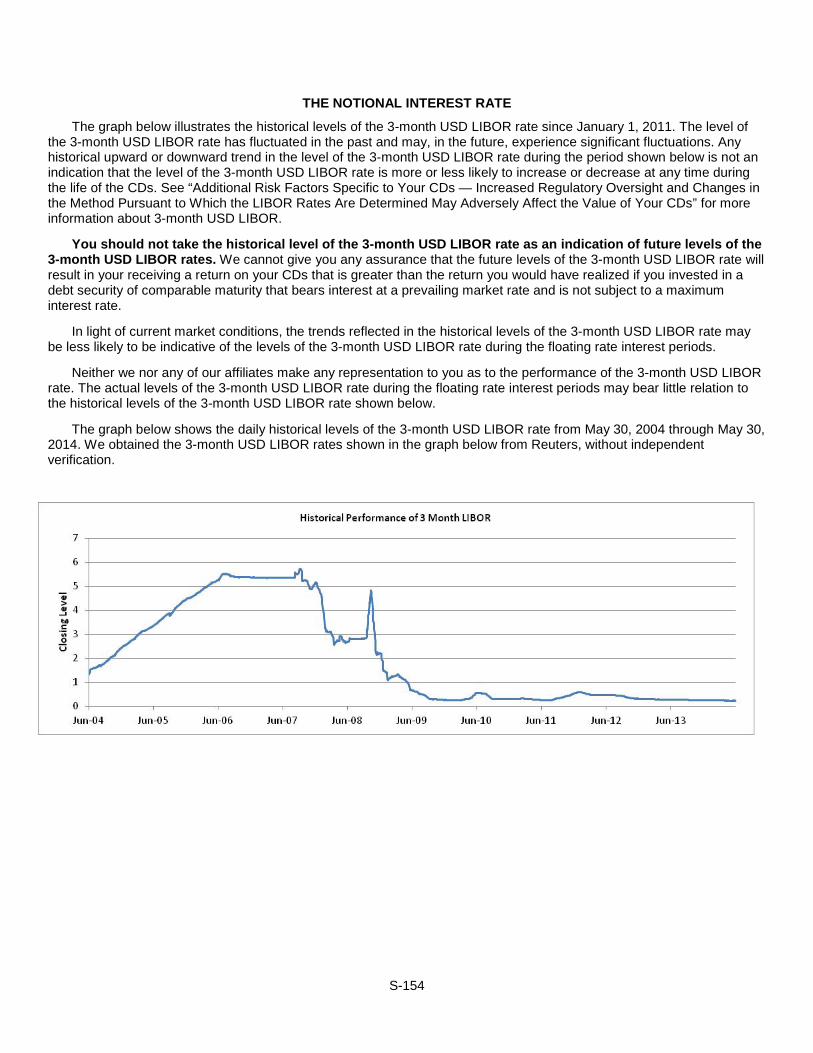
S-154
THE NOTIONAL INTEREST RATE
The graph below illustrates the historical levels of the 3-month USD LIBOR rate since January 1, 2011. The level of the 3-month USD LIBOR rate has fluctuated in the past and may, in the future, experience significant fluctuations. Any historical upward or downward trend in the level of the 3-month USD LIBOR rate during the period shown below is not an indication that the level of the 3-month USD LIBOR rate is more or less likely to increase or decrease at any time during the life of the CDs. See “Additional Risk Factors Specific to Your CDs — Increased Regulatory Oversight and Changes in the Method Pursuant to Which the LIBOR Rates Are Determined May Adversely Affect the Value of Your CDs” for more information about 3-month USD LIBOR.
You should not take the historical level of the 3-month USD LIBOR rate as an indication of future levels of the 3-month USD LIBOR rates. We cannot give you any assurance that the future levels of the 3-month USD LIBOR rate will result in your receiving a return on your CDs that is greater than the return you would have realized if you invested in a debt security of comparable maturity that bears interest at a prevailing market rate and is not subject to a maximum interest rate.
In light of current market conditions, the trends reflected in the historical levels of the 3-month USD LIBOR rate may be less likely to be indicative of the levels of the 3-month USD LIBOR rate during the floating rate interest periods.
Neither we nor any of our affiliates make any representation to you as to the performance of the 3-month USD LIBOR rate. The actual levels of the 3-month USD LIBOR rate during the floating rate interest periods may bear little relation to the historical levels of the 3-month USD LIBOR rate shown below.
The graph below shows the daily historical levels of the 3-month USD LIBOR rate from May 30, 2004 through May 30, 2014. We obtained the 3-month USD LIBOR rates shown in the graph below from Reuters, without independent verification.

S-155
SUPPLEMENTAL DISCUSSION OF UNITED STATES FEDERAL INCOME TAX CONSEQUENCES United States Internal Revenue Service Circular 230 Notice: To ensure compliance with requirements imposed by the
IRS, you are hereby notified that: (a) any U.S. tax advice contained or referred to in this offering circular or any document referred to herein is not intended or written to be used, and cannot be used by you for the purpose of avoiding penalties that may be imposed on you under the U.S. Internal Revenue Code; (b) any such tax advice is written for use in connection with the promotion or marketing of the transactions or matters addressed herein; and (c) you should seek advice based on your particular circumstances from an independent tax advisor.
This section supplements the discussion of U.S. federal income taxation in the accompanying disclosure statement, and is the opinion of Sidley Austin LLP, counsel to Goldman Sachs Bank USA. Notwithstanding the preceding sentence, the terms “we” and “us” in this section refers to Goldman Sachs Bank USA. In addition, notwithstanding any disclosure in the accompanying disclosure statement to the contrary, our counsel in this transaction is Sidley Austin LLP. This section applies to you only if you hold your CDs as capital assets for tax purposes. This section does not apply to you if you are a member of a class of holders subject to special rules, such as:
• a dealer in securities or currencies;
• a trader in securities that elects to use a mark-to-market method of accounting for your securities holdings;
• a bank;
• a regulated investment company;
• a life insurance company;
• a tax-exempt organization;
• a partnership;
• a person that owns the CDs as a hedge or that is hedged against interest rate risks;
• a person that purchases or sells the CDs as part of a wash-sale for tax purposes
• a person that owns the CDs as part of a straddle or conversion transaction for tax purposes; or
• a United States holder whose functional currency for tax purposes is not the U.S. dollar. This section is based on the U.S. Internal Revenue Code of 1986, as amended, its legislative history, existing and
proposed regulations under the Internal Revenue Code, published rulings and court decisions, all as currently in effect. These laws are subject to change, possibly on a retroactive basis.
You should consult your tax advisor concerning the U.S. federal income tax and other tax consequences of your investment in the CDs, including the application of state, local or other tax laws and the possible effects of changes in federal or other tax laws.
United States Holders
The discussion herein describes the tax consequences to a United States holder (as defined under “United States Taxation” in the accompanying disclosure statement).
Your CDs will be treated as debt instruments subject to special rules governing contingent payment debt instruments for U.S. federal income tax purposes. Under those rules, if you are a U.S. individual or taxable entity, you generally will be required to accrue interest on a current basis in respect of the CDs over their term based on the comparable yield for the CDs and pay tax accordingly, even though you will not receive any payments from us until maturity. This comparable yield is determined solely to calculate the amount on which you will be taxed prior to maturity and is neither a prediction nor a guarantee of what the actual yield will be. In addition, any gain you may recognize on the sale, exchange or maturity of the CDs would be taxed as ordinary interest income and any loss you may recognize on the sale, exchange or maturity of the CDs would generally be ordinary loss to the extent of the interest you previously included as income in respect of the CDs and thereafter would be capital loss. If you are a noncorporate holder, you would generally be able to use such ordinary loss to offset your income only in the taxable year in which you recognize the ordinary loss and would generally not be able to carry such ordinary loss forward or back to offset income in other taxable years.
We have determined that the comparable yield for the CDs is equal to % per annum, compounded semi-annually with a projected payment at maturity of $ based on an investment of $1,000.
Based on this comparable yield, if you are an initial holder that holds a CD until maturity and you pay your taxes on a calendar year basis, we have determined that you would be required to report the following amounts as ordinary income,

S-156
not taking into account any positive or negative adjustments you may be required to take into account based on the actual payments on the CDs, from the CD each year:
Accrual Period
Interest Deemed to Accrue During Accrual Period (per $1,000 CD)
Total Interest Deemed to Have Accrued from
Original Issue Date (per $1,000 CD) as of End of
Accrual Period
through December 31, 2014
January 1, 2015 through December 31, 2015
January 1, 2016 through December 31, 2016
January 1, 2017 through December 31, 2017
January 1, 2018 through December 31, 2018
January 1, 2019 through December 31, 2019
January 1, 2020 through December 31, 2020
January 1, 2021 through ,
The comparable yield and projected payment schedule are not provided to you for any purpose other than the determination of your interest accruals in respect of your CDs, and we make no representation regarding the amount of the contingent payment with respect to your CDs.
If you purchase your CDs for an amount that differs from the principal amount of the CDs, you may be subject to special tax rules as described in “United States Taxation—United States Holders—Indexed and Other Certificates of Deposit” in the accompanying disclosure statement (in particular, the rules that apply when a U.S. holder purchases a contingent payment debt instrument for an amount that differs from the adjusted issue price of that contingent payment debt instrument at the time of the purchase). These rules are complex and therefore because any Form 1099-OID that you receive will not reflect the effects of positive or negative adjustments resulting from your purchase of CDs at a price other than the adjusted issue price determined for tax purposes, you are urged to consult their tax advisors regarding these rules.
For a further discussion of the tax treatment of your CDs, please see the discussion under the heading “United States Taxation—United States Holders—Indexed and Other Certificates of Deposit” in the accompanying disclosure statement.
United States Alien Holders If you are a United States alien holder (as defined under “United States Taxation” in the accompanying disclosure
statement), please see the discussion under “United States Taxation —Taxation of Debt Securities — United States Alien Holders” in the accompanying disclosure statement for a description of the tax consequences relevant to you.
The Treasury Department has issued proposed regulations under which amounts paid or deemed paid on certain financial instruments that are treated as attributable to U.S.-source dividends could be treated, in whole or in part depending on the circumstances, as a “dividend equivalent” payment that is subject to tax at a rate of 30% (or a lower rate under an applicable treaty), which in the case of any amounts you receive upon sale, exchange or maturity of your CDs, could be collected via withholding. The proposed regulations, if finalized in their current form, would apply to payments made or deemed made on or after January 1, 2016. In a recently published notice, the Internal Revenue Service and the Treasury Department announced their intent that the proposed regulations, if finalized, would only apply to financial instruments that are issued on or after 90 days after the date of publication of final regulations. Accordingly, the proposed regulations, if finalized, should not apply to the CDs. As significant aspects of the application of these regulations to the CDs are uncertain, depending upon the exact content of any final regulations, we may be required to withhold such taxes if any dividends are paid on any ETFs included in the index during the term of the CDs. We could also require you to make certifications prior to maturity of the CDs in order to avoid or minimize withholding obligations, and we could withhold accordingly (subject to your potential right to claim a refund from the Internal Revenue Service) if such certifications were not received or were not satisfactory. If withholding is required, we will not be required to pay any additional amounts with respect to amounts so withheld. You should consult your tax advisor concerning the potential

S-157
application of these regulations (or subsequent regulations and other official guidance) to amounts you receive on the CDs and regarding any other possible alternative characterizations of your CDs for U.S. federal income tax purposes.
Foreign Account Tax Compliance Act Withholding (FATCA)
Pursuant to Treasury regulations, Foreign Account Tax Compliance Act (FATCA) withholding (as described in “United States Taxation — Foreign Account Tax Compliance” in the accompanying disclosure statement) will generally not apply to obligations that are issued prior to July 1, 2014; therefore, the CDs will not be subject to FATCA withholding.
S-158
SUPPLEMENTAL PLAN OF DISTRIBUTION The CDs may be distributed through dealers who may receive a fee up to % of the aggregate face amount of the
CDs being sold as a result of the services of the dealers. The original issue price for CDs purchased by certain fee-based advisory accounts will vary between % and 100% of the face amount of the CDs. Any sale of a CD to a fee-based advisory account at an original issue price below 100% of the face amount will reduce the placement fee specified on the cover of this disclosure statement supplement with respect to such CD, but will not affect the amount received by the issuer. The original issue price paid by any fee-based advisory account will be reduced by the amount of any fees foregone by the dealers involved in the sale of the CDs to such advisory account, but not by more than % of the face amount of the CDs. Please note that the information about the issue date and original issue price set forth on the cover of this disclosure statement supplement relate only to the initial distribution.
This disclosure statement may be used by Goldman, Sachs & Co. in connection with offers and sales of the CDs in market-making transactions. In a market-making transaction, Goldman, Sachs & Co. may resell CDs it acquires from other holders, after the original offering and sale of the CDs. Resales of this kind may occur in the open market or may be privately negotiated, at prevailing market prices at the time of resale or at related or negotiated prices. For more information about the plan of distribution and possible market-making activities, see “Plan of Distribution” on page 56 of the accompanying disclosure statement.

We have not authorized anyone to provide any information or to make
any representations other than those contained or incorporated by reference in this disclosure statement supplement or the accompanying disclosure statement. We take no responsibility for, and can provide no assurance as to the reliability of, any other information that others may give you. This disclosure statement supplement and the accompanying disclosure statement is an offer to sell only the CDs offered hereby, but only under circumstances and in jurisdictions where it is lawful to do so. The information contained in this disclosure statement supplement and the accompanying disclosure statement is current only as of the respective dates of such documents.
TABLE OF CONTENTS
Disclosure Statement Supplement
$
Goldman Sachs Bank USA
GS Momentum Builder® Multi-Asset 5 ER Index-Linked Certificates of Deposit due 2021
Certificates of Deposit
___________________
___________________
Page
Summary Information S-4 Additional Risk Factors Specific to Your Certificates of Deposit S-19 Specific Terms of Your Certificates of Deposit S-41 Hypothetical Examples S-47 Use of Proceeds S-50 Hedging S-50 The Index S-51 The Eligible Underlying Assets S-74 The Notional Interest Rate S-154 Supplemental Discussion of Federal Income Tax Consequences S-155 Supplemental Plan of Distribution S-158
Disclosure Statement dated December 19, 2011
Available Information 3 Notice to Investors 3 Goldman Sachs Bank USA 3 The Goldman Sachs Group, Inc. 4 Supervision and Regulation 4 Status of Certificates of Deposit 5 Use of Proceeds 12 Risk Factors 13 Description of the Certificates of Deposit We May Offer 19 Legal Ownership and Payment 38 United States Taxation 41 Employee Retirement Income Security Act 55 Plan of Distribution 56 Conflicts of Interest 57 Annex 58