Embed Size (px)
Citation preview

SUBJECT INDEX
l.Do’s and Don’ts
2. Lab Exercise:
1. Measurement of the efficiency of a flat plate collector.
2. Measuring the efficiency and concentration ratio of a linear parabolic
concentrating collector.
3. Series-parallel connection of solar panel and the effect of shading.
4. Study of sun tracking system.
5. Study of temperature dependence of solar cell characteristics.
6. Characteristics of dc motor when driven by photovoltaic (PV) panels.
7. Study of Wind Generators.
8. Study of fuel cell.
9. Study of Micro-hydel pumped storage system.
10. Grid-connected induction generator.
11. Study of the self-excitation characteristics of an induction generator.
4

A. Do’s and Don’ts in Laboratory
1. Understand the matlab software
2. Understand the all the matlab library.
3. Study the use of all the equipments provided in the library of matlab.
4. Study the simulation demos provided by matlab.
5. Develop the program and simulation as per instructions in the manual.
6. Follow all the rules and regulation of the lab.
7. Carefully handle the devices in computer lab.
5

Instruction for Laboratory Teachers
1. Submission related to whatever lab work has been completed should be done during the next lab session. The printouts related to submission have to be checked on the day of practical.
2. Students should be taught for taking the observations/readings of different measuring instruments under the guidance of lab teacher.
3. The promptness of submission should be encouraged by way of marking and evaluation patterns that will benefit the sincere students.
6

Practical name listsr. no. Page no.
Measurment of the efficiency of flat plat collector 71
Measuring the efficincy & concentration ratio of a linear parabolic concentrating collector
2 9
series parallel connection of solar panal and the effect of shadding
3 11
Study of sun tracking system 124
Study of temprature dependance of solar cell charectristics5 14
Charectristics of dc motor when driven by PV panels 156
Study of wind generators 187
Study of fule cell 198
Study of micro-hydel pumped storage system 259
Grid connected induction genrator 2610i
Study of the self excitation charectristics of an induction generator
2911

B. Lab Exercises
Exercise Nol: (2 Hours) - 1 Practical
TITLE:- Measurement of the efficiency of a flat plate collector
AIM:- To measure of the efficiency of a flat plate collector.
THEORY:-
1. Discuss the structural features of the collector
2. Plot the graphs of the temperature difference versus flow rate and efficiency versus flow-rate.
Flat Plate CollectorThermometer
K’Jim
T-’0''■"4
Thermometer<
//■, -<aAbi*ri»a >
/ / m^-iniulLiia^ ‘ ■
§//FIsfW TvUrs
Procedure:
1. Keep the collector facing South, inclined at the latitude angle.
2. Connect the water piping to use the lower end as inlet and the upper end as outlet.
3. Attach thermometers to the inlet and the outlet ends. Make sure the heads of the thermometer are submerged in water.
7

4. Measure the solar energy incident on the collector using a horizontally placed pyranometer, the area, and inclination of the collector.
5. Measure the output thermal energy using temperature difference between the inlet and the outlet, and the flow rate. The latter is obtained by collecting the outlet water in a bucket over a certain period of time, and by measuring the quantity using a measuring cylinder.
Result:-
Conclusion:-
8

Exercise No2: (2 Hours) - 1 Practical
TITLE:- Measuring the efficiency and concentration ratio of a linear parabolic concentrating collector
AIM:- To Measuring the efficiency and concentration ratio of a linear parabolic concentrating Collector
THEORY:-
1. Describe the constructional features of the collector from your observation of the actual system.
2. Plot the temperature difference versus flow rate and the efficiency versus flow rate.
Procedure:
1. Align the concentrator east-west, and incline at angle corresponding to the season. Make sure the image is formed on the collector pipe.2. Measure the intercepted area and the plane area through the collector. This gives the concentration ratio.3. Attach thermometers to the inlet and outlet ends. Make sure the heads of the thermometers are submerged in water.
9

4. Measure the solar energy incident on the collector using a horizontally placed pyranometer, the area, and inclination of the collector.5. Measure the output thermal energy using the temperature difference between the inlet and the outlet, and the flow rate. The latter is obtained by the collecting the outlet water in a bucket over a certain period of time, and by measuring the quantity using a measuring cylinder.
Result:-
Conclusion:-
10

Exercise No3: (2 Hours) - 1 Practical
TITLE:- Series parallel connection of solar panel and the effect of shading.
AIM:- Series parallel connection of solar panel and the effect of shading.
THEORY:-1. Draw the unshaded and shaded V-I characteristics on the same graph paper.
2. Draw conclusions about the series, parallel and series-parallel connections, possible areas of practical application, necessary precautions etc. Explain the reasons behind the observed effects of shading in the three cases.
© "•■s1yolarPanel 'Sufcn
Panel© -cSolarPanel
r-V* © V"•Solti i Ri.iaol
>Sol MlPiuiul >So iti i
PtmolSokn Pan e 1 iioiar
Panel
PtirullolSoiiois
■s A
iSolar Pun cl
SolarPanel ©©SolarFund
SolarPanel
L
i wo ir series & two in parallel
Procedure:
1. Take 4 solar panels. Connect all of them in series and measure the V-I characteristics. Then shade one of the panels and measure the V-I characteristics again.
2. Repeat this procedure for the panels connected in parallel, and two in series and two in parallel.
Result:-
Conclusion:-
11

Exercise No4: (2 Hours) - 1 Practical
TITLE:- Study of sun tracking system.
AIM:- Study of sun tracking system.
THEORY:-
1. The mechanism of the tracking system; the graphs; general conclusions about the perfonnance of the sun tracker from the point of view of control system.
2. Measure the rise time, delay time and setting time etc.
12

Procedure:
1. Study the system for its performance as a feedback control system.2. Start from some initial deflection along one of the axes and record the tracking action
(change of angle as a function of time).3. Draw a graph.4. Now start the tracking action at various initial deflections (in steps of 10 degrees) and
record the time taken to track.5. Repeat this procedure for the two axes independently and also for the case where the
initial deflection is in both the axes.
Result:-
Conclusion:-
/
i.
13
Exercise No5: (2 Hours) - 1 Practical
TITLE:- Study of temperature dependence of solar cell characteristics
AIM:- Study of temperature dependence of solar cell characteristics
THEORY:-
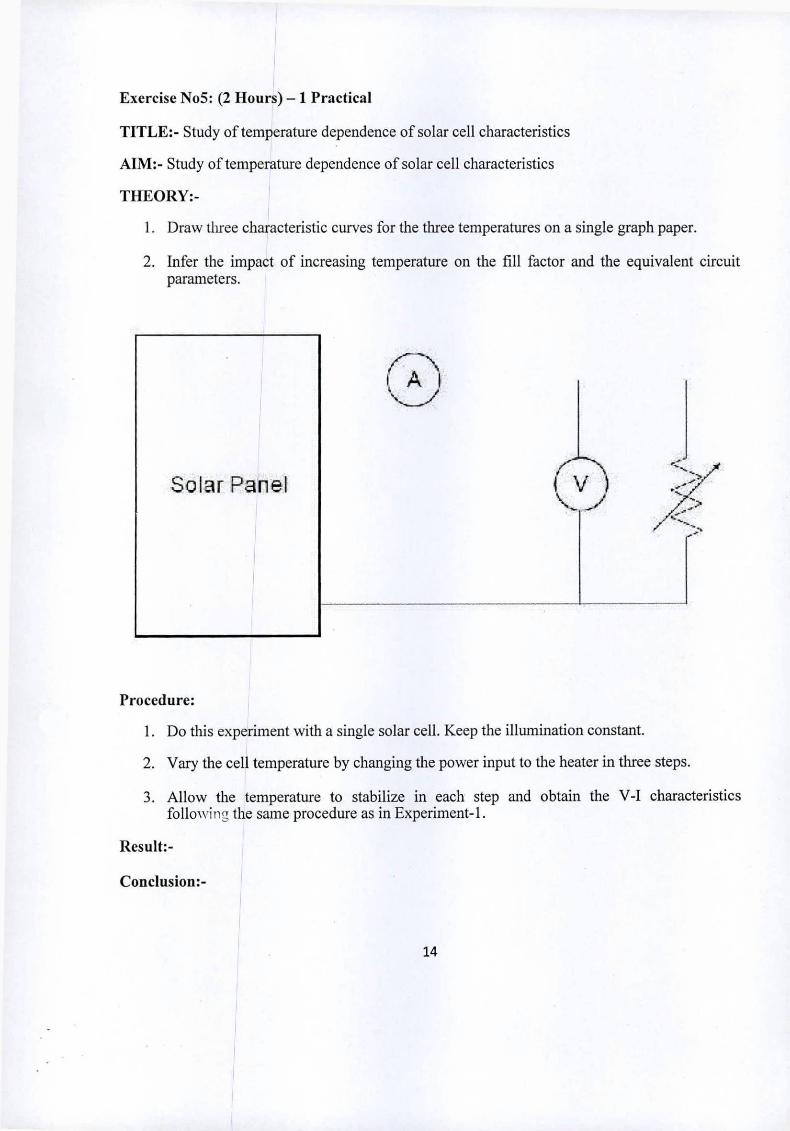
1. Draw three characteristic curves for the three temperatures on a single graph paper.
2. Infer the impact of increasing temperature on the fill factor and the equivalent circuit parameters.
f v ')Solar Panel <2>
>
Procedure:
1. Do this experiment with a single solar cell. Keep the illumination constant.
2. Vary the cell temperature by changing the power input to the heater in three steps.
3. Allow the temperature to stabilize in each step and obtain the V-I characteristics following the same procedure as in Experiment-1.
Result:-
Conclusion:-
14
Exercise No6: (2 Hours) - 1 Practical
TITLE:- Chai'acteristies of dc motor when driven by photovoltaic (PV) panels
AIM:- Study of Characteristics of dc motor when driven by photovoltaic (PV) panels
THEORY:-
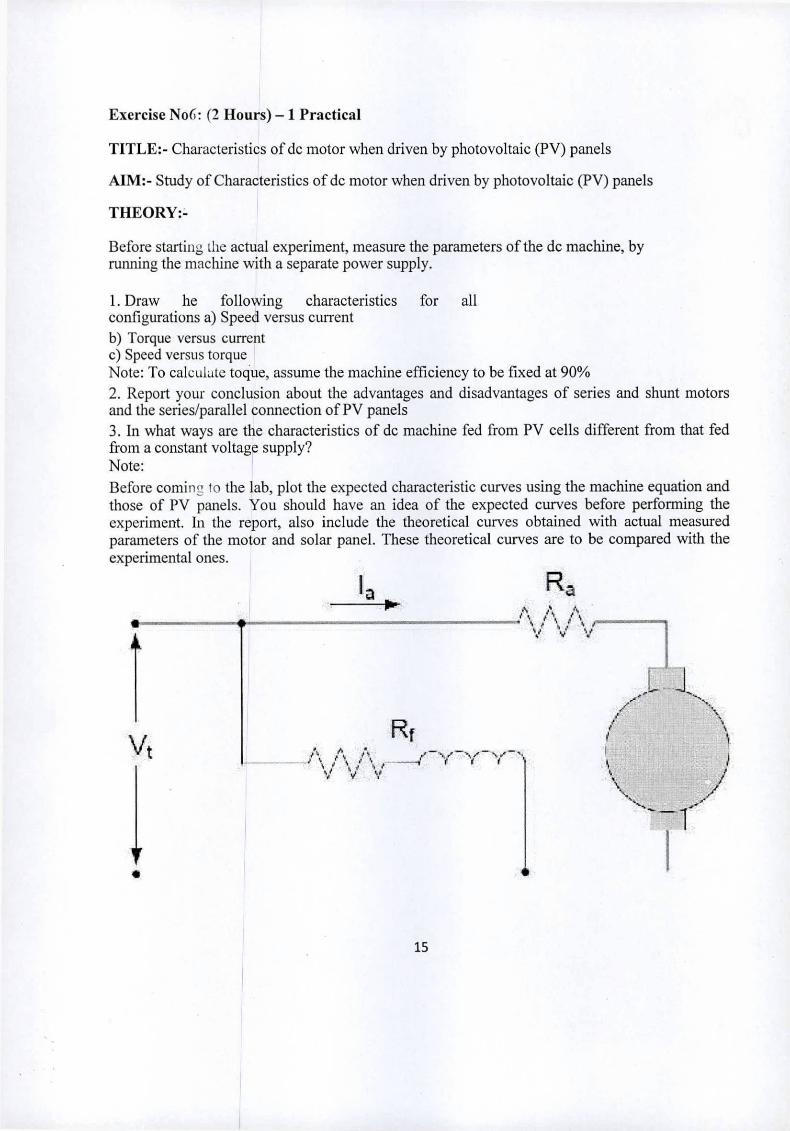
Before starting the actual experiment, measure the parameters of the dc machine, by running the machine with a separate power supply.
1. Draw he following characteristics for all configurations a) Speed versus currentb) Torque versus currentc) Speed versus torqueNote: To calculate toque, assume the machine efficiency to be fixed at 90%2. Report your conclusion about the advantages and disadvantages of series and shunt motors and the series/parallel connection of PV panels3. In what ways are the characteristics of dc machine fed from PV cells different from that fed from a constant voltage supply?Note:Before coming lo the lab, plot the expected characteristic curves using the machine equation and those of PV panels. You should have an idea of the expected curves before performing the experiment. In the report, also include the theoretical curves obtained with actual measured parameters of the motor and solar panel. These theoretical curves are to be compared with the experimental ones.
Rala'\A/VV vV
i i
L lN\/Rf s
< •<Vt Wv /■y y v/V
\ y\'^4-r
15
Measure and by Ohm’s Law. The motor equations are:
V,Eb = K<t>n 5 Eb = K'. Again, Eb = Vt-IaRa.11Rf
RfUse these to measure K', the motor constant K' = (Vt-IaRa)n.Vt
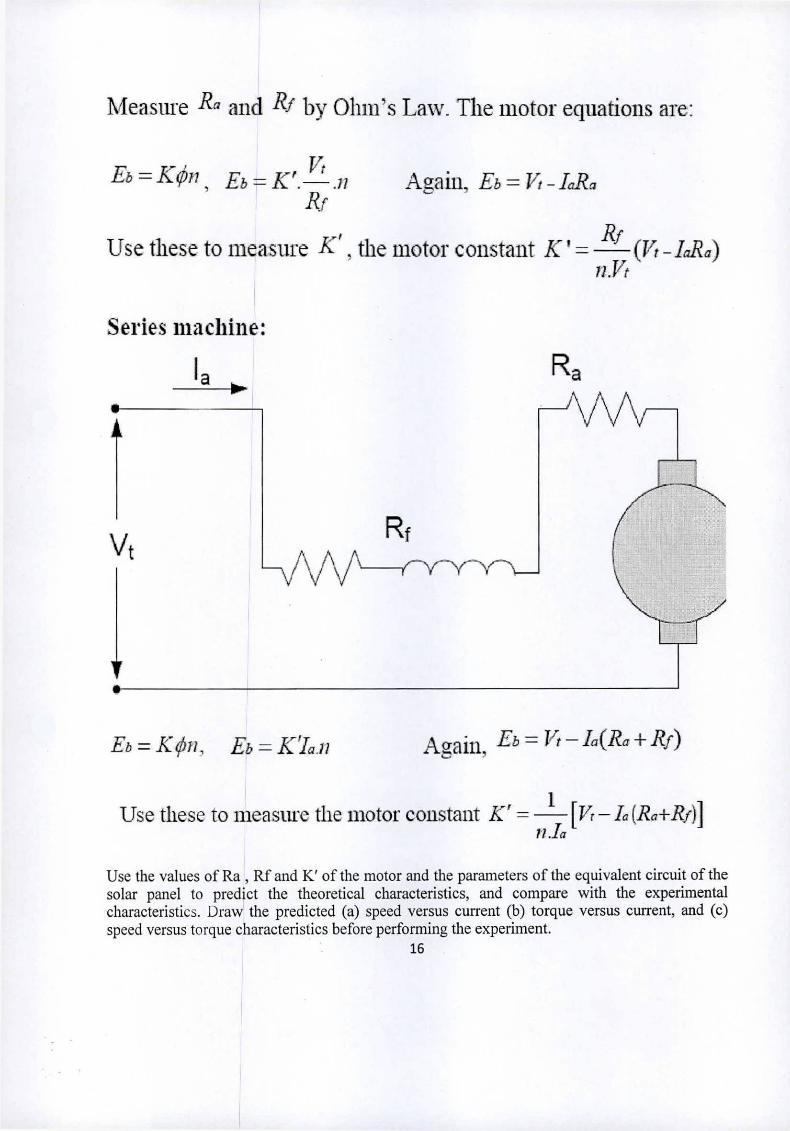
Series machine:
a
RtVt
Again ~ ^ Ia{Ra + Rf)v—- *Eb = K'L.nEt =
1 [Vt-L{Ra+Rf)}Use these to measure the motor constant K’ =tl .la
Use the values of Ra , Rf and K' of the motor and the parameters of the equivalent circuit of the solar panel to predict the theoretical characteristics, and compare with the experimental characteristics. Draw the predicted (a) speed versus current (b) torque versus current, and (c) speed versus torque characteristics before performing the experiment.
16

Procedure of the experiment:
1. Issue a number of panels to match the power rating (not the voltage rating) of dc motor.2. Connect the panels in series and give the supply to the machine terminals.3. Connect appropriate meters to measure the voltage and current input to the motor.
Increase the4. mechanical load in steps and measure the voltage, current and speed.5. Repeat the procedure for series and shunt motors with panels connected in series and
parallel.Result:-
Conclusion:-
17

Exercise No7: (2 Hours) - 1 Practical
TITLE:- Study of Wind Generators
AIM:- Study of Wind Generators
THEORY:-
The three graphs and the conclusions derived from these.
Procedure:
1. Run the fan, and set the pitch angle of the wind machine at some fixed value, say 10 degrees. Connect a load resistance, an ammeter and a voltmeter to the wind generator. Vary the load in 10 steps and plot the power versus load resistances. Obtain the maximum power point.2. For a fixed pitch angle, vary the wind speed and plot the maximum power versus wind speed. Take 10 readings.3. For the fixed wind velocity, vary the pitch angle in steps of 5 degrees and plot the maximum power output versus pitch angle.Result:-
Conclusion:-
18

Exercise No8: (2 Hours) - 1 Practical
TITLE:- Study of fuel cell
AIM:- Study of voltage-current characteristics of the Fuel Cell
THEORY:-
To determine the voltage-current characteristics of the Fuel Cell (FC50) and to investigate the effect of the following on the characteristic curve of the fuel cell.i) Increased internal resistance using FC hardware setup only.ii) Reduced air supply using the FC50 software.iii) Increased FC stack temperature using FC50 software.
VOLTAGE-CURRENT CHARACTERISTICS OF FUEL CELL (FC50)Procedure:1. Set up1.1. Connect the AC power pack cable to the 12VDC power input on the FC50 Fuel Cell. Connect the other end of the AC power pack to a source of AC power. On the front panel of the EL200 Electronic Load ensure the toggle switch is OFF. Use the AC power cord to connect the EL200 to a source of AC power; then turn on the main power switch located behind the EL200 front panel.1.2. Use two short test leads to connect the FC50 with the EL200, paying attention to the polarity.1.3 Attach the hydrogen supply quick-coupler to the FC50. Connect the 9-pin plug of the hydrogen supply’s solenoid valve to the H2 SUPPLY connector on the FC50.1.4. Comiect the required RS-232 interface to the computer.2. Start up2.1 Starting the electrolyser1. Comiect the AC power Cable to the supply and switch it ON.2. There will be a self check of 20 seconds by the electrolyser system. After that the main screen of the Graphic display will show STANDBY.3. Press the Start button and wait until the internal pressure reaches 100%. Now the display shows ready.4. Press Open. The external pressure will reach to the set pressure and the display will show Normal flow and Normal pressure.2.2 For the EL200 ensure that the 10-tum potentiometer is set to zero. Then turn ON the toggle switch on the front panel.2.3. Ensure the fan control knob is at AUTO. Set the main switch to ON and press the START button in the FC 50 module. After completing a system test, the green OPERATION light comes on and the FC50 is ready for use. If an error occurs, the error code will appear in theH2 Flow display. The descriptions of the error are given in Appendix 1.3. Data acquisition3.1 For these measurements, the fuel cell should be at a temperature of 35 °C.This temperature can be reached by loading the fuel cell for a few minutes with a current of approximately 5 A. Using the potentiometer of the EL200, increase the load current until the Current display on the
19
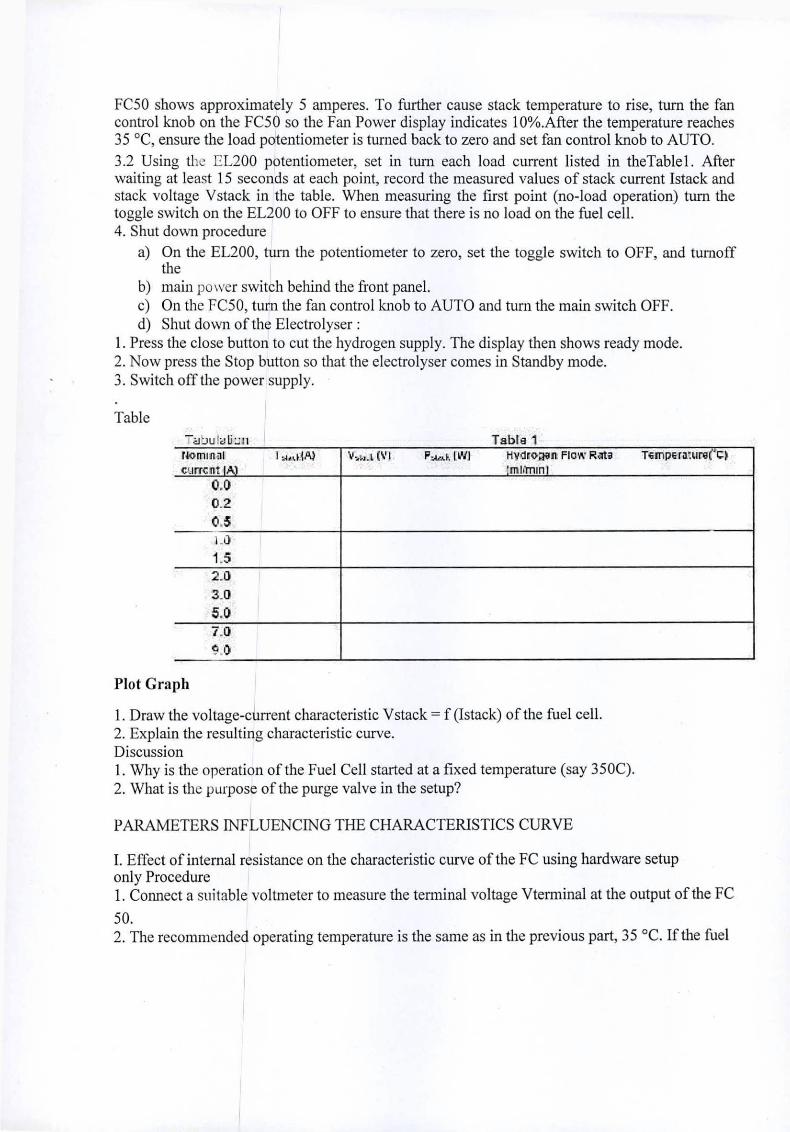
FC50 shows approximately 5 amperes. To further cause stack temperature to rise, turn the fan control knob on the FC50 so the Fan Power display indicates 10%.After the temperature reaches 35 °C, ensure the load potentiometer is turned back to zero and set fan control knob to AUTO.3.2 Using the EL200 potentiometer, set in turn each load current listed in theTablel. After waiting at least 15 seconds at each point, record the measured values of stack current Istack and stack voltage Vstack in the table. When measuring the first point (no-load operation) turn the toggle switch on the EL200 to OFF to ensure that there is no load on the fuel cell.4. Shut down procedure
a) On the EL200, turn the potentiometer to zero, set the toggle switch to OFF, and turnoff the
b) main power switch behind the front panel.c) On the FC50, turn the fan control knob to AUTO and turn the main switch OFF.d) Shut down of the Electrolyser :
1. Press the close button to cut the hydrogen supply. The display then shows ready mode.2. Now press the Stop button so that the electrolyser comes in Standby mode.3. Switch off the power supply.
Tableubuiyliun Tabla 1
hvdrosaji Flow Rats TsiriperouirefC)Mommnl current {A)
I (VI PataklWI
0.00.2051.01.52.03.05.07.0«0
Plot Graph
1. Draw the voltage-current characteristic Vstack = f (Istack) of the fuel cell.2. Explain the resulting characteristic curve.Discussion1. Why is the operation of the Fuel Cell started at a fixed temperature (say 350C).2. What is the purpose of the purge valve in the setup?
PARAMETERS INFLUENCING THE CHARACTERISTICS CURVE
I. Effect of internal resistance on the characteristic curve of the FC using hardware setup only Procedure1. Connect a suitable voltmeter to measure the terminal voltage Vterminal at the output of the FC50.2. The recommended operating temperature is the same as in the previous part, 35 °C. If the fuel

cell has cooled, heat it again as described in 3.1.4. Use the load potentiometer of the EL200 to set in sequence the current values given in the
table 2. Wait for at least 15 s at each current setting before copying the measured values of stack current Istack, stack voltage Vstack and terminal voltage Vterminal to the measured value table. In each series, for the first measuring point of zero-amperes, you can simply turn the EL200 toggle switch OFF, to ensure no load is applied to the system
5. Shut down procedureFollow the instructions as given in first part of the experiment.
Table
TrlblllrSlior Tflhte 2
Hydrogen Flew Tennp&RturefC) Rntc
Nomina current I'At
I rJ.vj<lA[ V„v.< (VI Vnnr.r.* (V)
0.00.2!0.51.01.52.03.05.07.09.0
Graph
1. Plot Vstack and Vterminal against Istack on the same graph.
2. Draw an equivalent circuit of the fuel cell showing its stack resistance and the additional ohmic resistance.
Discussion
1. Which physical causes can the ohmic resistance be attributed to within the fuel cell stacks. What optimization possibilities exist
2. Effect of the air supply on the characteristic curve of the FC using FC50 software
3. This is a software assisted experiment, hence switch off the FC 50 and start the FC 50 software on the PC. Select the appropriate experiment and wait until the program gives a request to press the FC 50 start button.
Note 1: Ensure that the fan control knob is set to AUTO.Note 2: Ensure (hat the potentiometer knob is locked.
21
Procedure
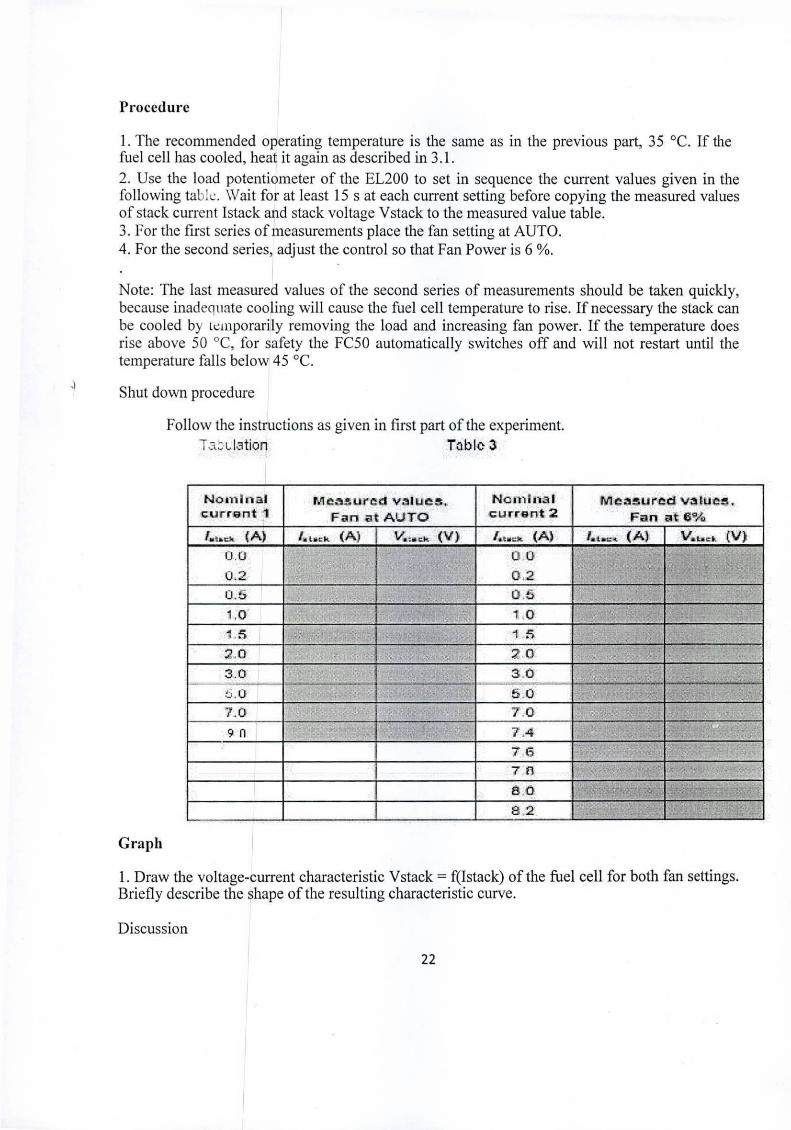
1. The recommended operating temperature is the same as in the previous part, 35 °C. If the fuel cell has cooled, heat it again as described in 3.1.2. Use the load potentiometer of the EL200 to set in sequence the current values given in the following tabic. Wait for at least 15 s at each current setting before copying the measured values of stack current Istack and stack voltage Vstack to the measured value table.3. For the first series of measurements place the fan setting at AUTO.4. For the second series, adjust the control so that Fan Power is 6 %.
Note: The last measured values of the second series of measurements should be taken quickly, because inadequate cooling will cause the fuel cell temperature to rise. If necessary the stack can be cooled by icmporarily removing the load and increasing fan power. If the temperature does rise above 50 °C, for safety the FC50 automatically switches off and will not restart until the temperature falls below 45 °C.
Shut down procedure
Follow the instructions as given in first part of the experiment.Tac elation Table 3
Nominal current 2
Nominal current 1
Measured values. Fan at 6%
Measured values. Fan at AUTO
<A) 4 lack (A) A.M.k (A) (A) V,uc>. (V)V.-MCk (V)
'0.0 0 0kimi
0 20.2 :;-v
0.6 0 61.0 1 01 5 1 5
2 02 03.0 3 0
6 06.07.0 7.0■7::
7.49 n7 f>7 n t *
ma o*8 2
Graph
1. Draw the voltage-current characteristic Vstack = f(Istack) of the fuel cell for both fan settings. Briefly describe the shape of the resulting characteristic curve.
Discussion
22

1. Explain the divergence of the reduced-air characteristic curve. On the graph mark the individual ranges of the reduced-air characteristic Effect of the increased FC stack temperature on the characteristic curve of a fuel cell using FC50 software This is also a software assisted experiment as done previously, hence switch off the FC 50 and start the FC 50 software on the PC. Select the appropriate experiment and wait until the program gives a request to press the FC 50 start button.
Note 1: Ensure that the fan control knob is set to AUTO.1. Note 2: Ensure that the potentiometer knob is locked
Procedure
1. Take the reading of stack current and voltage for two different temperature preferably 30oC and 40oC.During the experiment temperatures will unavoidably drift. In order to keep the deviations small, currents and voltages should be measured and recorded as quickly as possible. It is recommended to take first the series of measurements at the lower temperature. If the temperature is already too high, the fan can be used to lower it. Cool the fuel cell as quickly as possible to avoid drying the membranes.2. After reaching the desired operating temperature, reset the fan control to AUTO.3. To reach the fuel cell temperature of the second series of measurements load the fuel cell for a few minutes with a current of approximately 7 A. Using the potentiometer of the EL200, increase the lond current until the Current display on the FC50 shows approximately 7 amperes. To further cause stack temperature to rise, turn the fan control knob on the FC50 so the Fan Power display indicates 12%.4. After the temperature reaches 40 °C, ensure the load potentiometer is turned back to zero and set fan control knob to AUTO.5. Use the load potentiometer of the EL200 to set in sequence the current values given in the Table4.Begin the first series of measurements at a stack temperature of approx. 30 °C, the second series of measurements at approx. 40 °C.
Shut down procedure
Follow the instructions as given in first part of the experiment.
23

Ri=!i>rjrr 20Table 4T nhutation
Nominal Mi&Bsured valuaBT sr.-ri; 40J%>Tsssrjc
V>.,:^Vji0.00.2D.b1.01.02.03.05.07.05.0
Graph
1. Draw the voltage-current characteristic curve for each operating temperature and describe the shape of the curve.
Discussion
1. Draw conclusions about the optimum operating temperature.
Result:-
Conclusion:-
24

Exercise No9: (2 Hours) - 1 Practical
TITLE:- Study of Micro-hydel pumped storage system
AIM:- To Study Micro-hydel pumped storage system
THEORY:-
Fidd Coil''"V'-V'Y"''-
■
i.
: DigitalPovverMeter
\ Alternator 40CV3phi Loading
RhucstatX
•• Xd.c:'~K ISupoly
Generator circuit
A'ZL Decide the equipmeni ratings dcpcndhig on the machine ratings:
Procedure:-
1. Run the motor-pump system.2. Open the turbine inlet valve. Vary the load and obtain the load current versus power output characteristics.3. Again fill the tank and keep the motor-pump system running. Open the valve in four stages. In each stage, obtain the hydraulic power input from head and flow rater readings and electrical power from wattmeter. For each flow rate, obtain the maximum electrical power and draw the efficiency against flow rate.4. Starting from an empty tank, fill it up fully. Keep the turbine valve closed. Note down the electrical energy spent in the pumping process. Open the valve; keep the resistance fixed close to the maximum power point. Note down the power against time using a stop watch. From the area under the curve, obtain the energy recovered. Calculate the full cycle efficiency of the pumped storage scheme.Result:-
Conclusion:-
25

Exercise NolO: (2 Hours) - 1 Practical
TITLE:-: Grid-connected induction generator
AIM:- Determination of the equivalent circuit parameters and the performance characteristics of a grid-connected induction generator
THEORY:-
In the open-circuit test, connect the circuit as shown in the figure. The stator supply is given through an nntotransformer. In this experiment the measurements are to be done when the machine is rotating exactly at the synchronous speed (which cannot be achieved simply by running at no-load). First start the induction machine as a motor with the help of the autotransformer. Once it reaches approximately the rated speed, open the shorting switch across the ammeter and wattmeter. In order to bring it to exactly the synchronous speed, give field supply to the coupled dc machine. The d.c. machine is to be connected to the d.c. supply terminals in the separately excited configuration, with two different switches for the field and the armature.Voltage builds up at the armature terminals. This voltage and the supply voltage appear at the two ends of the armature switch. By varying the field resistance, bring the armature voltage to the d.c. supply voltage. After checking the polarity and magnitudes of these two voltages, close the armature switch. Then increase the speed by reducing the field current of the d.c. machine. The slip of the induction machine can be measured in two different ways. If it is a wound-rotor machine, connect a zero-centred d.c. ammeter across two of the rotor terminals, and shunt it with an SPST switch. The other two rotor terminals are shorted. The current passing through the ammeter will be exactly at the slip frequency. As a result the pointer will oscillate at that frequency, which can be easily measured by counting the number of oscillations per minute. If the machine is squirrel cage, the rotor terminals are not available. In that case the slip is to be obtained with a line-frequency stroboscope. Put a chalk-mark on the rotor shaft. When the strobe is on, the chalk-mark will appear to rotate at the slip frequency, which can be also be measured by counting the number of oscillations per minute.To measure the 3-phase active and reactive power, two wattmeters are used, as the load can be assumedto be balanced. One LPF wattmeter, with the line current in the current coil and the same phase voltage in the pressure coil, measures the active power (3-phase power = 3 times wattmeter reading). Another wattmeter, with the line current in the current coil and the voltage between the other two lines in the pressure coil, measures the reactive power (3-phase reactive power = V3 times the wattmeter reading). If three-phase active/reactive power meters are available, these can also be used. As the speed is increased by reducing the dc machine field current, the oscillation of the rotor ammeter of the induction machine slows down, indicating a decrease in slip. Finally bring it to a standstill by adjusting the field rheostat. The induction machine is now running at synchronous speed; the rotor is truly opencircuited.
26

n‘
■r^WX^
^jfiac /i/x.
%i \i V —'fY^'1—V-ij-iil
-vA_fi» Vy
Kig. 1: Ciraiir diagram for the opcn-cireint test a nd lead teat.
Then obtain the open-circuit voltage-current characteristics by varying the stator voltage of the induction machine in steps, while varying the d.c. field resistance to keep the machine always at synchronous speed. Try to obtain approximately equally spaced points on the curve, till the typical bend (knee point) is visible. Plot while you take the readings (current in the x-axis and voltage in the y-axis).Use the same circuit as in the open circuit test. The only difference is that the ammeter, voltmeter, and wattmeter ratings should correspond to the machine ratings. Use normal wattmeter’s instead of the LPF wattmeter’s. After the synchronous speed is reached, increase the speed further by reducing the field current of the d.c. machine. The induction machine then runs in the generator mode. Increase the speed in steps up to the maximum permissible value, and take the readings. Limit the range of experiment to the stable zone of the torque-slip characteristics. If the oscillation of the rotor ammeters become too fast to count, short the SPST switch and use a stroboscope to measure the slip. Calculate and plot the torque, power output, power factor and efficiency against slip.
Unstable Nl X lift 4:
X-ITP
ofr -a-?nt
u3CJ
Q
fipftftd 0
27
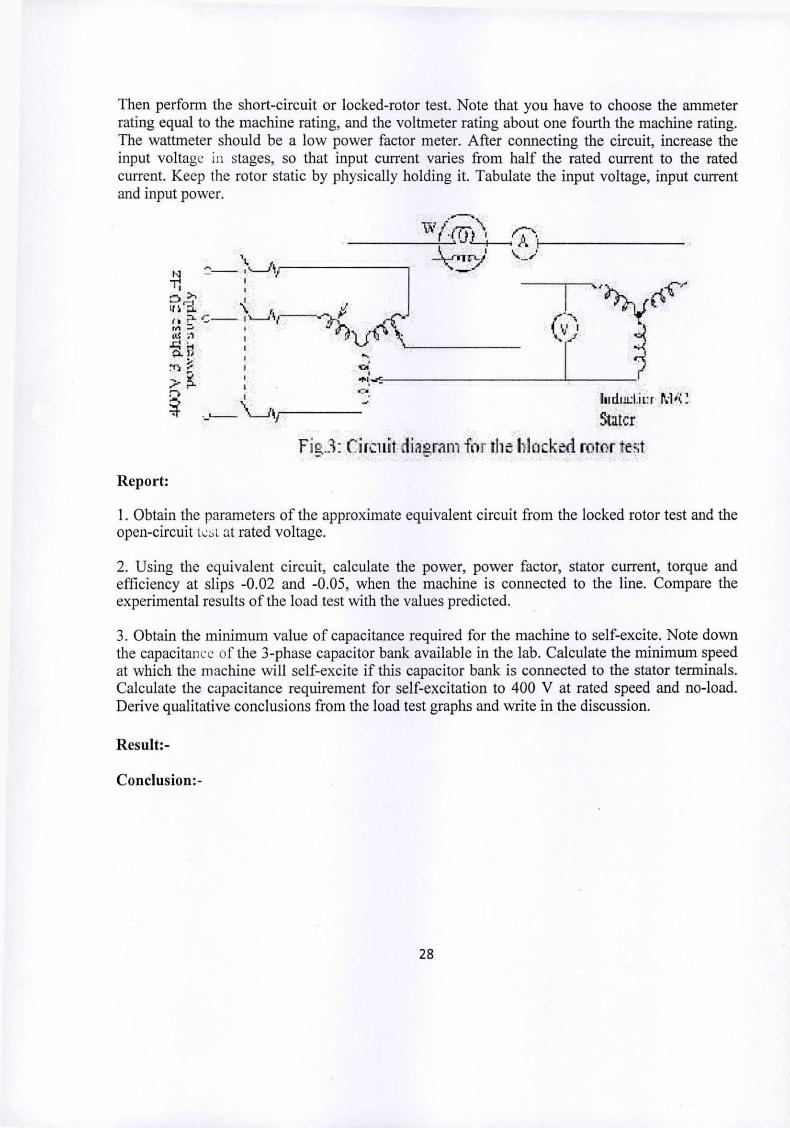
Then perform the short-circuit or locked-rotor test. Note that you have to choose the ammeter rating equal to the machine rating, and the voltmeter rating about one fourth the machine rating. The wattmeter should be a low power factor meter. After connecting the circuit, increase the input voltage in stages, so that input current varies from half the rated current to the rated current. Keep the rotor static by physically holding it. Tabulate the input voltage, input current and input power.
\~—A3 Xv 6rA -* i ̂ Si
■§.[5
>Wv if
* miffl (vH- C--------
o•mAs> p- *7*£ .
? ...----V_Ay Iiidud.iurSlater
Fig.3: Circuit diagram for the blocked rotor test
Report:
1. Obtain the parameters of the approximate equivalent circuit from the locked rotor test and the open-circuit test at rated voltage.
2. Using the equivalent circuit, calculate the power, power factor, stator current, torque and efficiency at slips -0.02 and -0.05, when the machine is connected to the line. Compare the experimental results of the load test with the values predicted.
3. Obtain the minimum value of capacitance required for the machine to self-excite. Note down the capacitance of the 3-phase capacitor bank available in the lab. Calculate the minimum speed at which the machine will self-excite if this capacitor bank is connected to the stator terminals. Calculate the capacitance requirement for self-excitation to 400 V at rated speed and no-load. Derive qualitative conclusions from the load test graphs and write in the discussion.
Result:-
Conclusion:-
28

Exercise Noll: (2 Hours) - 1 Practical
TITLE:- Study of the self-excitation characteristics of an induction generator
AIM:- To Study self-excitation characteristics of an induction generator
THEORY:-1. For each capacitance value, first predict the speed of self-excitation from the data of Expt.l, and then confirm the prediction with the experiment. State why the rotor ammeter was stationary throughout the experiment.2. Explain why the slip increased with increased loading though the speed is constant. Report the qualitative conclusions regarding the characteristics of a self-excited induction generator.
t-j—i
'i
il W>-'y-5 «
i*
£ «; -d;' n.‘-
II:
____d—J'lr1
* hf— ■
Procedure:
Do this experiment on the same machine for which you obtained the equivalent circuit parameters in Expt.. This experiment actually consists of three parts. In the first part, the selfexcitation is studied at different capacitance values and in the second part the speed versus voltage characteristic is studied at a certain value of capacitance. These two parts are performed at no load. In the third part, the load-test is performed.1. Connect a three-phase capacitor bank (of capacity higher than the calculated minimum value) across the stator terminals of the induction machine. Connect a zero-centered MC ammeter across two of the rotor terminals to indicate the slip. Start the d.c. machine as a motor with armature resistance. As the machine picks up speed, initially a very small voltage appears in the induction machine terminals. Then, at a certain speed, self-excitation takes place and the stator voltage will shoot up. Note down the speed and the voltage. Repeat this procedure at various values of capacitance.2. In the second part, take a capacitance of value above the minimum value required for operation at 50 Hz. Obtain self-excitation, and then increase the speed in steps. Note the voltage and speed.3. Add a three phase loading rheostat through a switch, to the stator of the induction machine. First obtain self-excitation and then increase the speed so that the terminal voltage reaches the
29

rated value. Close the loading switch and increase the load in steps. Keep the speed constant with the help of the d.c. machine. Note all the meter readings. It is desirable to increase the loading in small steps, because the voltage will collapse if the load is increased beyond a threshold value. Plot voltage versus current, efficiency versus loading, power output versus loading, and slip versus loading.4. Now keep the load constant and vary the speed, simulating a wind turbine supplying a heating load. Note all meter readings again. Plot the terminal voltage versus speed. Measure the slip by counting the oscillations of the rotor ammeter in case of wound-rotor machine. For a squirrel- cage machine, connect a line-frequency stroboscope to the stator terminals (not to the power line), and count the revolutions of the chalk-mark on the rotor.Result:-
Conclusion:-
30


![MCA Lab Manual VB.NET - MGM's JNEC[MTL-I]VB.NET For S.Y (M.C.A) Students ... session. The immediate arrangements for printouts related to submission on the day of practical assignments](https://img.pdfslide.us/doc/110x75/5fe212d86e3c7f474c6be59c/mca-lab-manual-vbnet-mgms-jnec-mtl-ivbnet-for-sy-mca-students-session.jpg)