Embed Size (px)
Citation preview
THE STATE EDUCATION DEPARTMENT/THE UNIVERSITY OF THE STATE OF NEW YORK/ALBANY, NY 12234
TO: Subcommittee on State Aid and the Full Board
FROM: Johanna Duncan-Poitier
SUBJECT: Regents 2009-10 Proposal on State Aid to School Districts
DATE: December 10, 2008
STRATEGIC GOAL: 1, 2, 3 and 5
AUTHORIZATION(S):
SUMMARY Issue for Discussion
What is the Regents State Proposal that the Subcommittee approved on behalf
of the Board of Regents? What are projected cost savings for mandates for which we are seeking relief?
Reason(s) for Consideration
Policy implementation.
Proposed Handling These questions will come before the Subcommittee at their December meeting.
Procedural History The Regents Subcommittee on State Aid began its discussion about the
development of the Regents 2009-10 State Aid proposal at its May 2008 meeting. Subcommittee members discussed recommendations included in the reports issued by the New York State Commission on Local Government Efficiency and Competitiveness and the New York State Commission on Property Tax Relief in July. In September, the Subcommittee discussed foundation aid and in October, a report on BOCES and feedback from the Education Finance Advisory Group. At the November meeting, the
Board of Regents authorized the Subcommittee to act on the State Aid Proposal on behalf of the full Board and asked the Subcommittee chair to report to the Full Board at the December meeting. The Subcommittee met on December 4, 2008 and approved the Regents State Aid proposal. Changes have been made to the proposal as follows: Staff revised Figure 1 on page 7 to show that graduation has increased beyond enrollment increases in response to concerns expressed by Regent Cohen at the meeting; and staff added a reference to the need for flexibility in universal pre-kindergarten funding (see page 14).
Background Information
In seeking to close the student achievement gap, funding is one key component of a solution. The Regents proposal seeks to achieve equity, adequacy, accountability and balance between stable and targeted funding. New data on high school completions shows the achievement gap remains an urgent need. New methods of linking funding to results make the goals of this proposal more possible than ever. The Regents have carefully crafted this proposal to retain those critical funding directions necessary to continue the State’s progress toward educational adequacy, despite the State’s worsening revenue picture. This report presents the proposal approved by the Regents Subcommittee on State Aid on December 4 and will be accompanied by an oral report by its chair, Regent James R. Tallon Jr.
Recommendation
Not applicable.
Timetable for Implementation Following the Regents approval of the final State Aid proposal for 2009-10, the
Governor will issue his budget recommendations in mid-December and has asked the Legislature to approve a State budget before April 1. Attachment
2
Regents Proposal on State Aid to School Districts
For School Year 2009-10
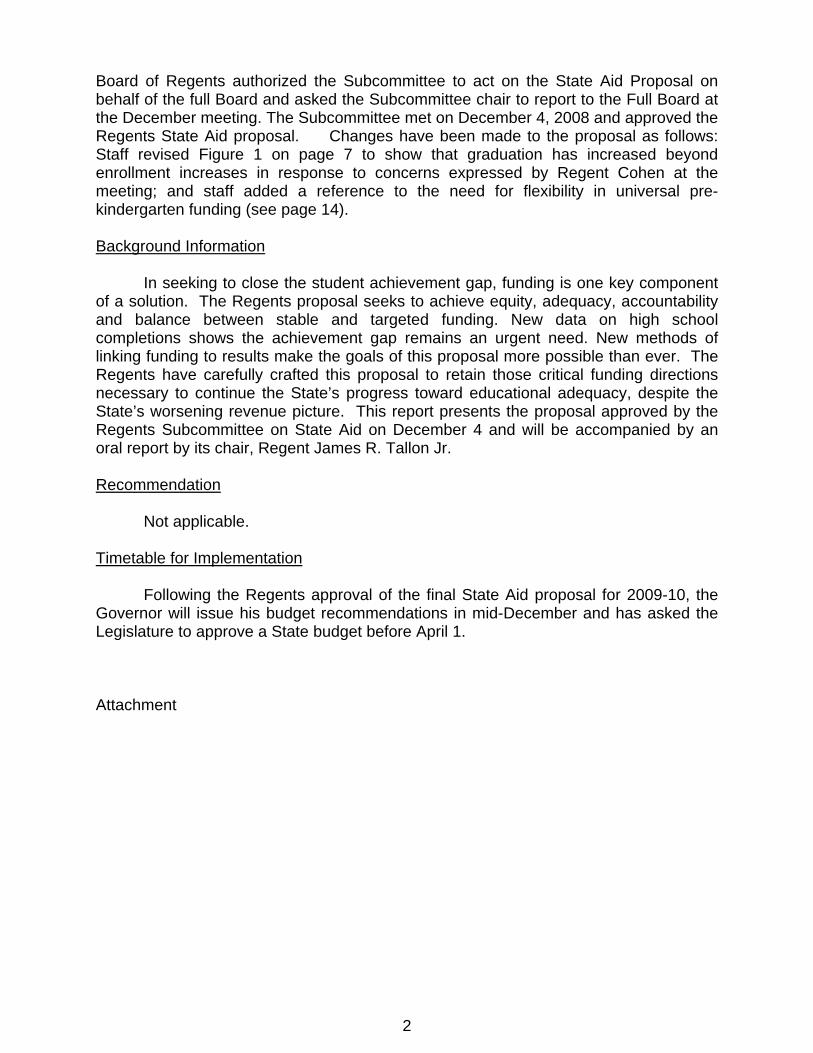
Executive Summary The Regents proposal recommends an $879 million, 4.1 percent increase for school year 2009-10 over the previous year. This increase represents almost a $1 billion reduction in aid included in the State’s financial plan in response to an economic crisis of significant proportions. The Regents recommend that the State direct $586 million of this increase to continue the phase in of the foundation formula enacted by the State in 2007. The Regents recommend continued implementation of Contracts for Excellence accountability requirements, a $61 million increase to continue the State’s phase in of Universal Pre-Kindergarten education program and $50 million for High Tax Aid. The table titled 2009-10 State Aid Budget on page 5 provides the details of the Regents request. The following pie chart shows the distribution of the increase in computerized aids proposed by the Regents: 44 percent to the New York City School District, 13 percent to the Big Four City School Districts, eight percent to high need urban/suburban districts, 13 percent to high need rural districts and 22 percent to average and low need districts.
New York City44%
Large Cities (Big 4)13%
Urban-Suburban High Need8%
Rural High Need13%
All Other Districts22%
Share of Computerized Aid Increase for 2009-10 School Year
Regents State Aid Proposal
New York City44%
Large Cities (Big 4)13%
Urban-Suburban High Need8%
Rural High Need13%
All Other Districts22%
Share of Computerized Aid Increase for 2009-10 School Year
Regents State Aid Proposal
Note: This pie chart depicts the share of computerized aids including Foundation Aid and many other categories as described in the chart on page 5.
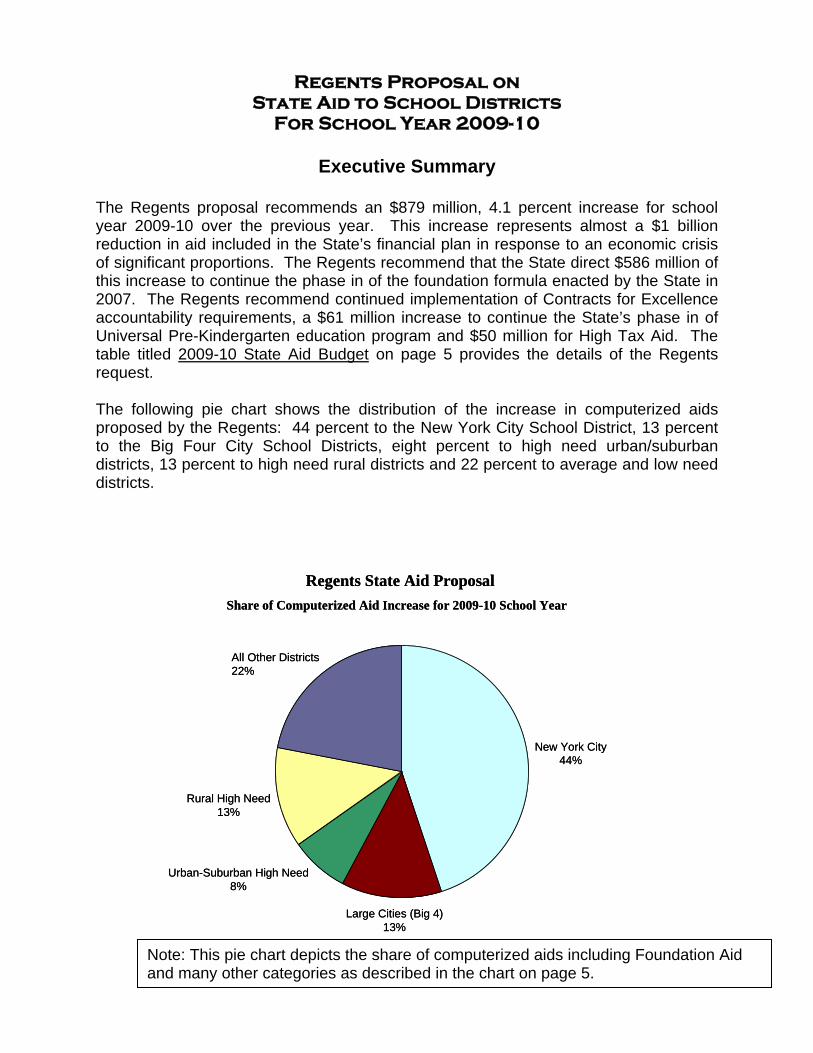
The following bar graph shows the distribution of the Regents proposal to high need and
s
3
other districts. In the budget that the State enacted for 2008-09, approximately 67 percent of the increase was directed to high need school districts. The Regentrecommend that this percentage be increased for 2009-10 to approximately 78 percent. Computerized State Aid Increases
How They Are Distributed
$1,147 million
$569 million
$700 million
$195 million
0
200
400
600
800
1,000
1,200
1,400Share of Increase
2008-09 as Enacted 66.8% 33.2%
High Need All Other
78.2% 21.8%2009-10 Regents State Aid Proposal
Computerized State Aid IncreasesHow They Are Distributed
$1,147 million
$569 million
$700 million
$195 million
0
200
400
600
800
1,000
1,200
1,400Share of Increase
2008-09 as Enacted 66.8% 33.2%
High Need All Other
78.2% 21.8%2009-10 Regents State Aid Proposal
All OthersHigh Need All OthersHigh Need
2008-09 as Enacted
2009-10 Regents State Aid Proposal
2008-09 as Enacted
2009-10 Regents State Aid Proposal
2008-09 as Enacted
2009-10 Regents State Aid Proposal
4
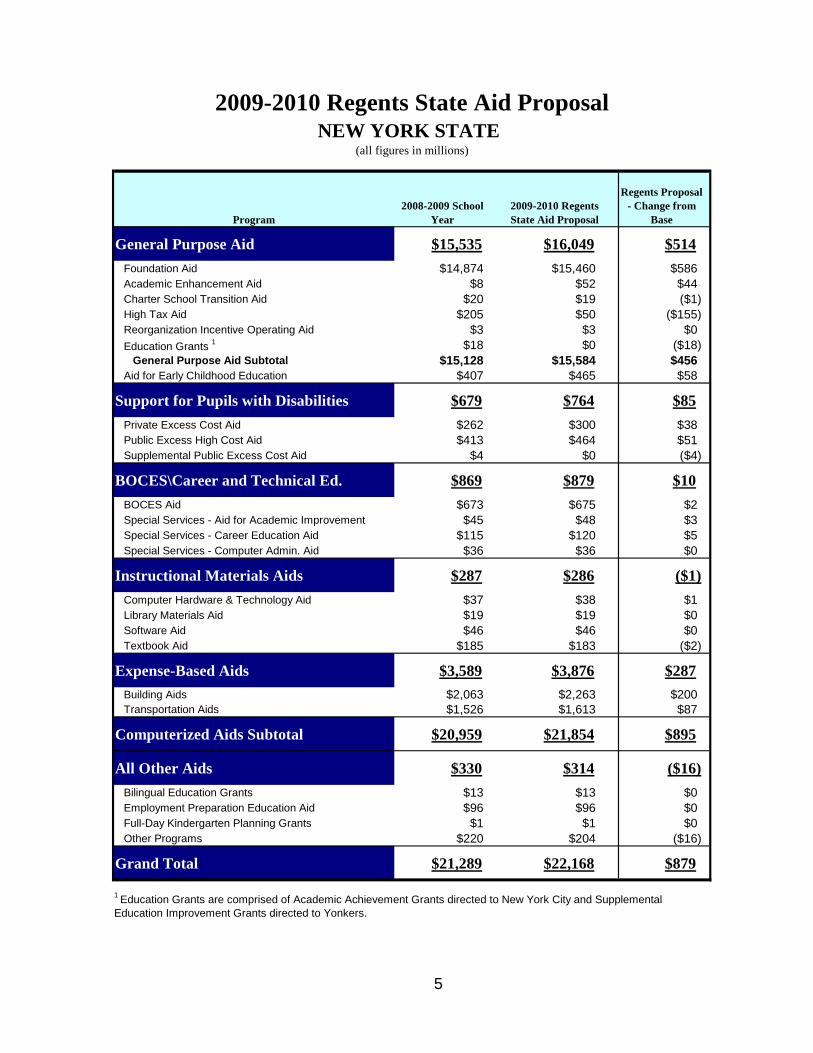
2009-2010 Regents State Aid ProposalNEW YORK STATE
(all figures in millions)
Program2008-2009 School
Year2009-2010 Regents State Aid Proposal
Regents Proposal - Change from
Base
General Purpose Aid $15,535 $16,049 $514Foundation Aid $14,874 $15,460 $586Academic Enhancement Aid $8 $52 $44Charter School Transition Aid $20 $19 ($1)High Tax Aid $205 $50 ($155)Reorganization Incentive Operating Aid $3 $3 $0Education Grants 1 $18 $0 ($18)
General Purpose Aid Subtotal $15,128 $15,584 $456Aid for Early Childhood Education $407 $465 $58
Support for Pupils with Disabilities $679 $764 $85Private Excess Cost Aid $262 $300 $38Public Excess High Cost Aid $413 $464 $51Supplemental Public Excess Cost Aid $4 $0 ($4)
BOCES\Career and Technical Ed. $869 $879 $10BOCES Aid $673 $675 $2Special Services - Aid for Academic Improvement $45 $48 $3Special Services - Career Education Aid $115 $120 $5Special Services - Computer Admin. Aid $36 $36 $0
Instructional Materials Aids $287 $286 ($1)Computer Hardware & Technology Aid $37 $38 $1Library Materials Aid $19 $19 $0Software Aid $46 $46 $0Textbook Aid $185 $183 ($2)
Expense-Based Aids $3,589 $3,876 $287Building Aids $2,063 $2,263 $200Transportation Aids $1,526 $1,613 $87
Computerized Aids Subtotal $20,959 $21,854 $895
All Other Aids $330 $314 ($16)Bilingual Education Grants $13 $13 $0Employment Preparation Education Aid $96 $96 $0Full-Day Kindergarten Planning Grants $1 $1 $0Other Programs $220 $204 ($16)
Grand Total $21,289 $22,168 $879
1 Education Grants are comprised of Academic Achievement Grants directed to New York City and Supplemental Education Improvement Grants directed to Yonkers.
5
Conceptual Proposal The Regents State Aid proposal for school year 2009-10 details critical funding recommendations to provide an adequate basic education to the State’s children. It also includes recommendations to reduce spending through mandate relief, shared services and changes in special education. The pupil needs this proposal is designed to address remain pressing and are likely to grow even more dire as a result of the troubled economic times we are facing. The Regents urge the State to continue to support the work begun and progress made in prior years. This proposal recommends preserving the foundation formula advocated by the Regents and enacted in the past two State budgets. The current recession, as others before it, will impact New York State more deeply and for a longer period of time than other regions. Therefore, it is certain that poverty and the increased educational need associated with it will deepen. Not only must we maintain our investment, and move closer to adequacy based on past inequities, we will need more resources to address the future need.
Principles
Four principles continue to guide this Regents proposal. During difficult economic times adhering to these principles is even more important.
Adequacy— Ensure that all districts have the resources to give all students the opportunity to achieve high minimum outcomes.
Equity—The funding system must be fair for all students and taxpayers. State resources should be allocated on the basis of fiscal capacity, cost and student needs. The emphasis is providing a set of inputs (qualified teachers, appropriate facilities and other educational resources) to adequately educate students regardless of where they attend school.
Accountability—The education system will measure outcomes and use those measures to ensure that financial resources are used effectively. The Regents will employ a two-pronged strategy to ensure education resources will be used or maintained in the public interest. The Department will give greater flexibility to districts with acceptable student achievement, while working closely with districts not yet meeting State standards.
Balance—The State should balance stability in funding with targeting aid to close student achievement gaps. It should drive aid based on current needs, while establishing reasonable amounts of hold-harmless aid to provide stability.
Statement of Need This proposal pursues three Regents goals: to close the gap between actual and desired student achievement; to ensure that public education resources are adequate; and that school districts use these resources effectively and efficiently. At the September 2008 board meeting, the Regents cited examples of improvement in student
6
achievement since 1996 when the Regents began to raise standards for all grade levels and imposed graduation requirements aligned with these new standards. 1 The data show that student success is growing and reforms are achieving results. Despite this, serious challenges remain and we must continue to seek adequate funding for all of our school districts.
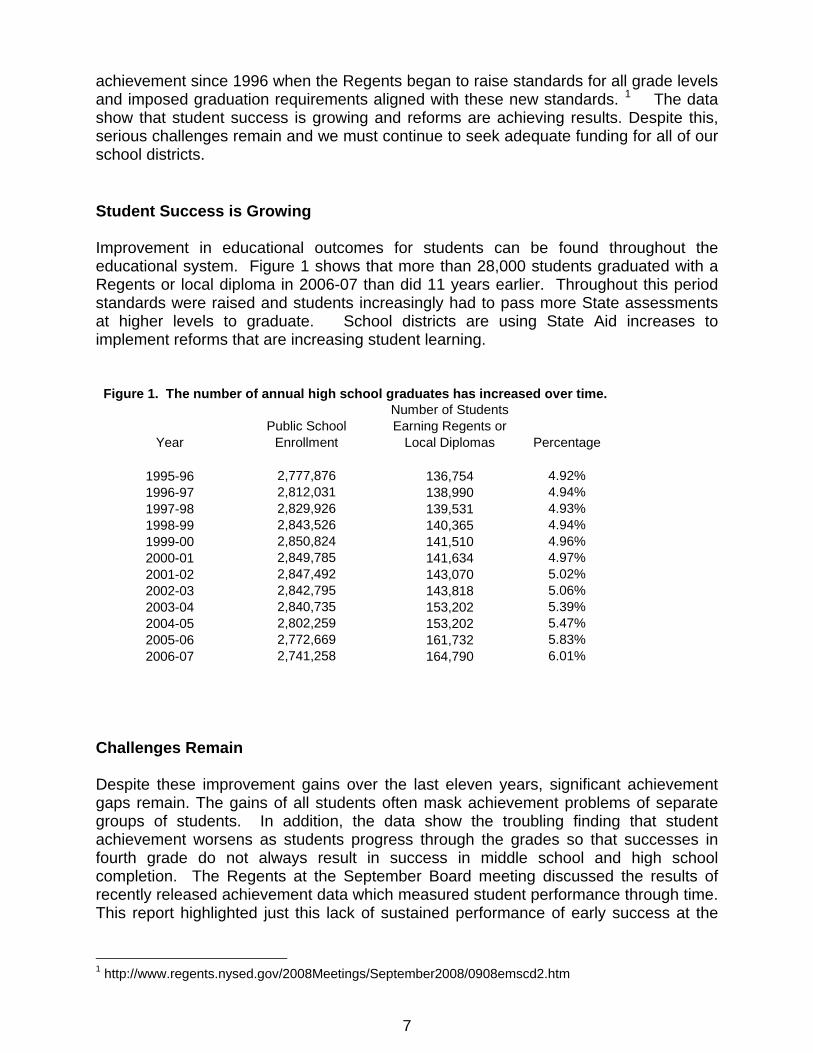
Student Success is Growing Improvement in educational outcomes for students can be found throughout the educational system. Figure 1 shows that more than 28,000 students graduated with a Regents or local diploma in 2006-07 than did 11 years earlier. Throughout this period standards were raised and students increasingly had to pass more State assessments at higher levels to graduate. School districts are using State Aid increases to implement reforms that are increasing student learning.
Figure 1. The number of annual high school graduates has increased over time.
YearPublic School
Enrollment
Number of Students Earning Regents or
Local Diplomas Percentage
1995-96 2,777,876 136,754 4.92%1996-97 2,812,031 138,990 4.94%1997-98 2,829,926 139,531 4.93%1998-99 2,843,526 140,365 4.94%1999-00 2,850,824 141,510 4.96%2000-01 2,849,785 141,634 4.97%2001-02 2,847,492 143,070 5.02%2002-03 2,842,795 143,818 5.06%2003-04 2,840,735 153,202 5.39%2004-05 2,802,259 153,202 5.47%2005-06 2,772,669 161,732 5.83%2006-07 2,741,258 164,790 6.01%
Challenges Remain Despite these improvement gains over the last eleven years, significant achievement gaps remain. The gains of all students often mask achievement problems of separate groups of students. In addition, the data show the troubling finding that student achievement worsens as students progress through the grades so that successes in fourth grade do not always result in success in middle school and high school completion. The Regents at the September Board meeting discussed the results of recently released achievement data which measured student performance through time. This report highlighted just this lack of sustained performance of early success at the
1 http://www.regents.nysed.gov/2008Meetings/September2008/0908emscd2.htm
7
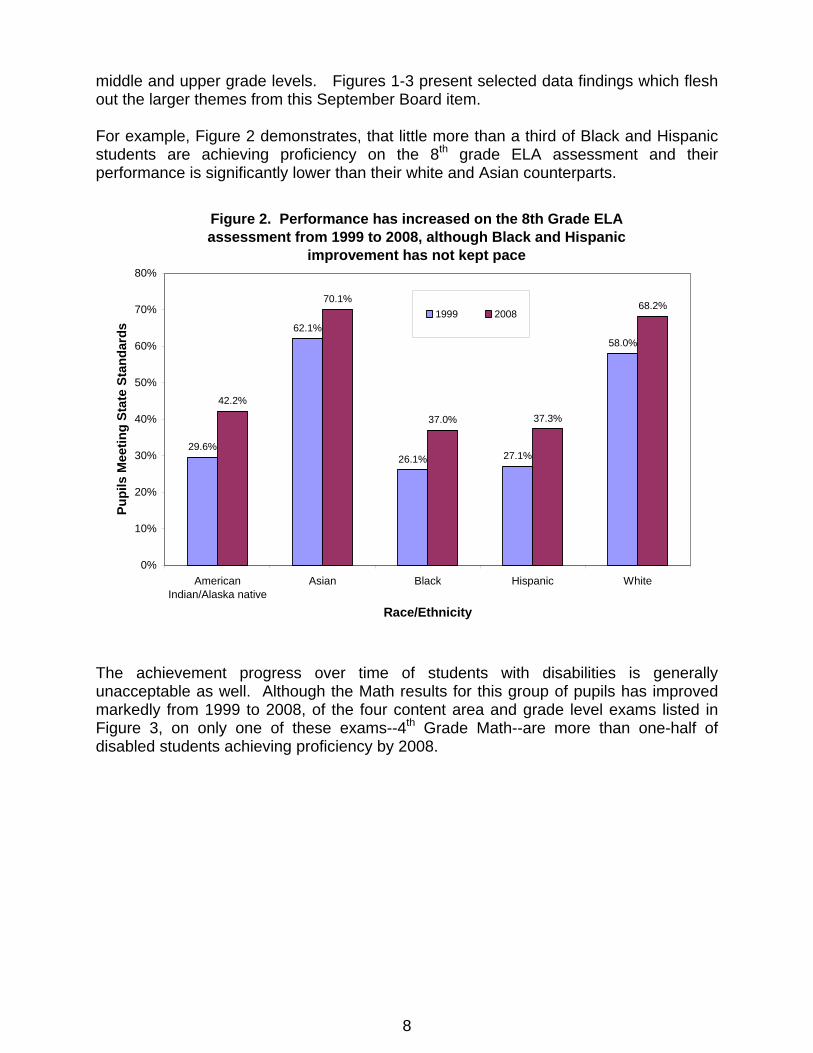
middle and upper grade levels. Figures 1-3 present selected data findings which flesh out the larger themes from this September Board item. For example, Figure 2 demonstrates, that little more than a third of Black and Hispanic students are achieving proficiency on the 8th grade ELA assessment and their performance is significantly lower than their white and Asian counterparts.
Figure 2. Performance has increased on the 8th Grade ELA assessment from 1999 to 2008, although Black and Hispanic
improvement has not kept pace
29.6%
62.1%
26.1% 27.1%
58.0%
42.2%
70.1%
37.0% 37.3%
68.2%
0%
10%
20%
30%
40%
50%
60%
70%
80%
AmericanIndian/Alaska native
Asian Black Hispanic White
Race/Ethnicity
Pupi
ls M
eetin
g St
ate
Stan
dard
s
1999 2008
The achievement progress over time of students with disabilities is generally unacceptable as well. Although the Math results for this group of pupils has improved markedly from 1999 to 2008, of the four content area and grade level exams listed in Figure 3, on only one of these exams--4th Grade Math--are more than one-half of disabled students achieving proficiency by 2008.
8

Figure 3. The achievement progress of students with disabilities over time, is generally unacceptable, although Math results are more promising
7.1%
17.1%
29.8%
53.4%
31.0%
8.6%
35.7%
17.7%
10.5%
44.8%
26.5%
13.3%
0%
10%
20%
30%
40%
50%
60%
ELA Grade 4 Math Grade 4 ELA Grade 8 Math Grade 8
Content Area and Grade Level
Perc
enta
ge o
f Pup
ils P
rofic
ient
(L
evel
s 3
and
4)
1999 2006 2008
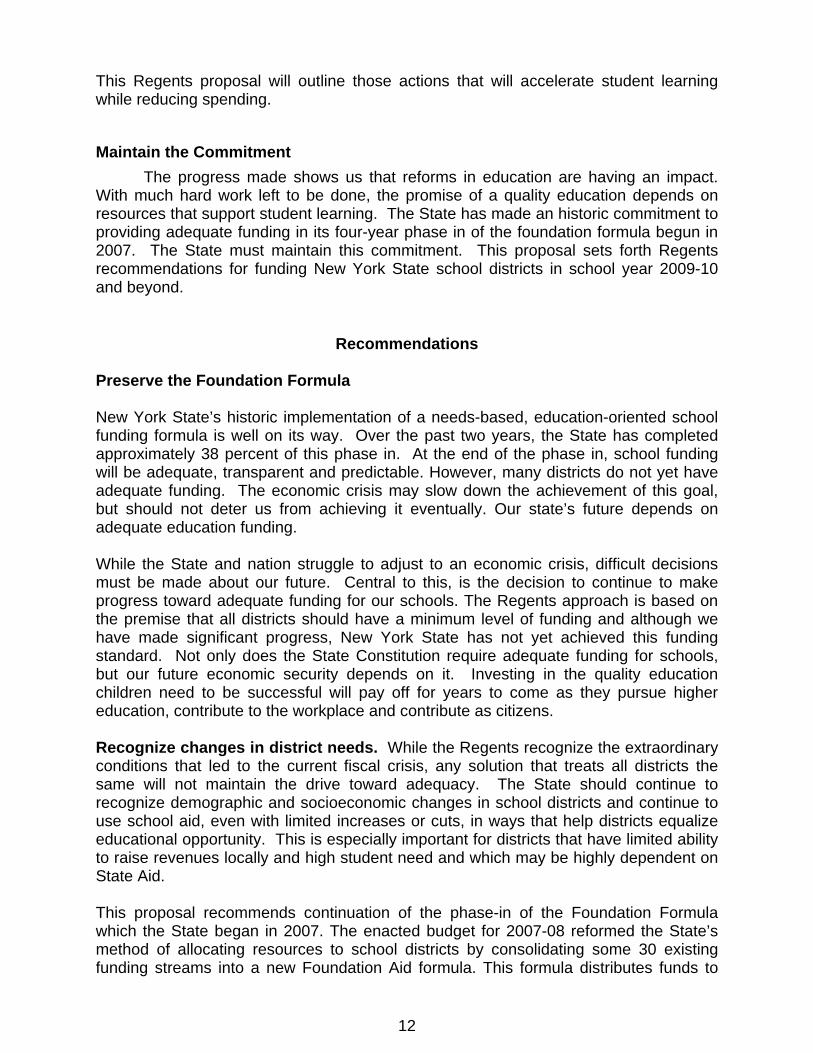
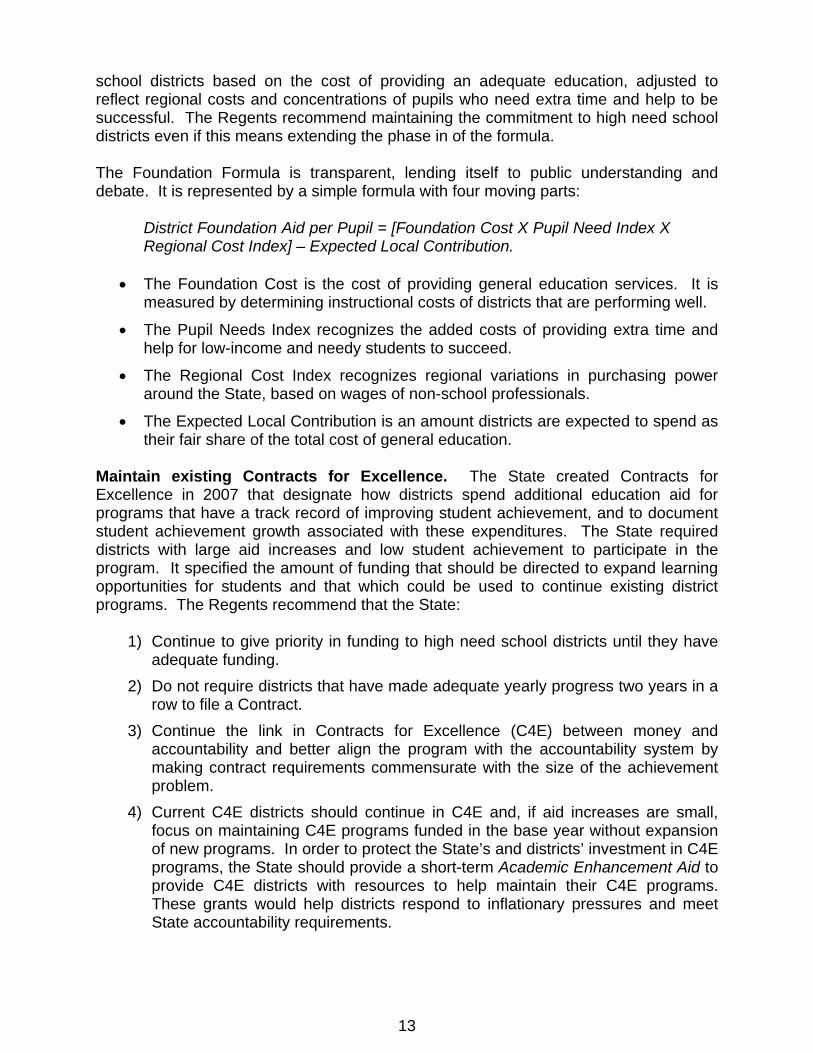
The Regents also examined achievement for districts grouped by need and resource capacity. The Department’s data indicate that high need/resource capacity districts have a greater incidence of students from poverty backgrounds, English language learners and students with disabilities and fewer resources to respond to these greater student needs. Figure 4 shows that districts with greater need/resource capacity status have lower high school graduation attainment than do those with lower pupil needs. When we adjust for these greater needs2, we find that high need groups of districts, including New York and the Big 4 Cities spend considerably less on a per pupil basis than do average and low need districts, as Figure 5 displays. On average, low need districts characterized by greater incomes and less needy students, expend roughly 40 percent more per pupil than do these other groups of districts. The result of this lower investment in education results at least in part, in a less qualified teaching workforce. As Figure 6 shows, the Big 4 Cities, who in Figure 4 had the lowest rate of Regents diploma graduation attainment, have less qualified teachers, as measured by credentials, than the rest of the State’s school districts.
2 A student living in poverty is weighted at 2.0; while a student who is not poor is weighted at 1.0.
9
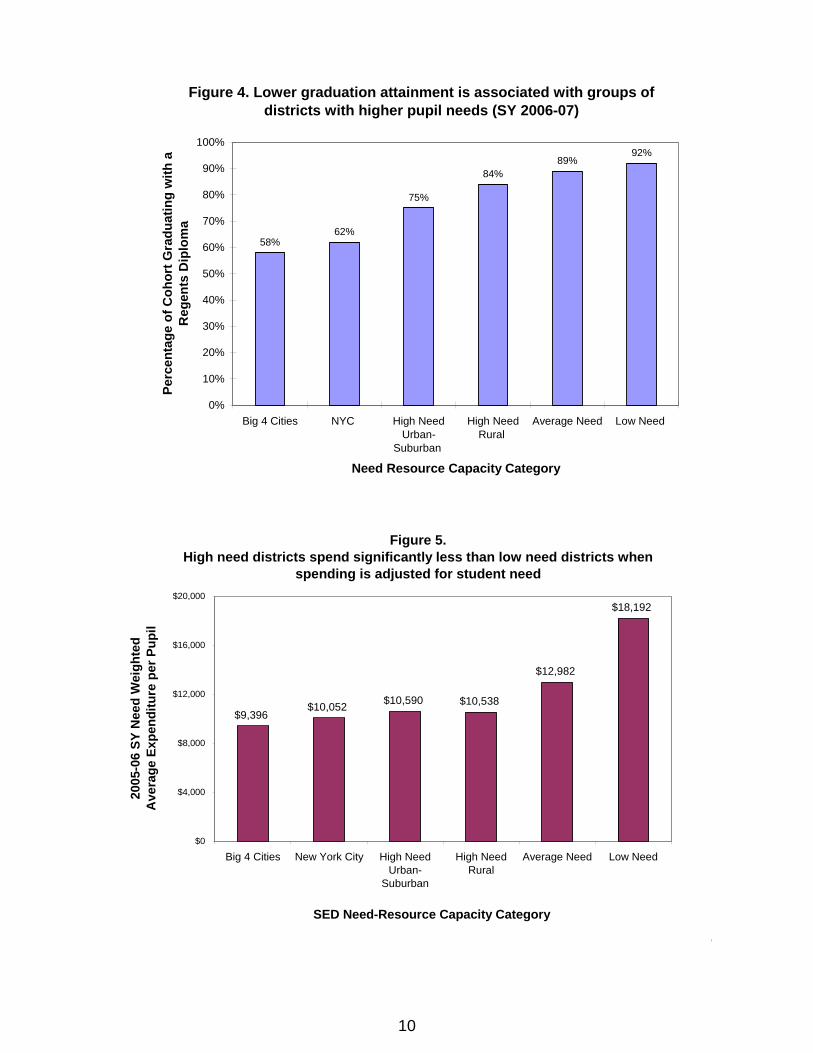
Figure 4. Lower graduation attainment is associated with groups of districts with higher pupil needs (SY 2006-07)
58%62%
75%
84%89%
92%
0%
10%
20%
30%
40%
50%
60%
70%
80%
90%
100%
Big 4 Cities NYC High NeedUrban-
Suburban
High NeedRural
Average Need Low Need
Need Resource Capacity Category
Perc
enta
ge o
f Coh
ort G
radu
atin
g w
ith a
R
egen
ts D
iplo
ma
Figure 5. High need districts spend significantly less than low need districts when
spending is adjusted for student need
$9,396$10,052 $10,590 $10,538
$12,982
$18,192
$0
$4,000
$8,000
$12,000
$16,000
$20,000
Big 4 Cities New York City High NeedUrban-
Suburban
High NeedRural
Average Need Low Need
SED Need-Resource Capacity Category
2005
-06
SY N
eed
Wei
ghte
d A
vera
ge E
xpen
ditu
re p
er P
upil
10
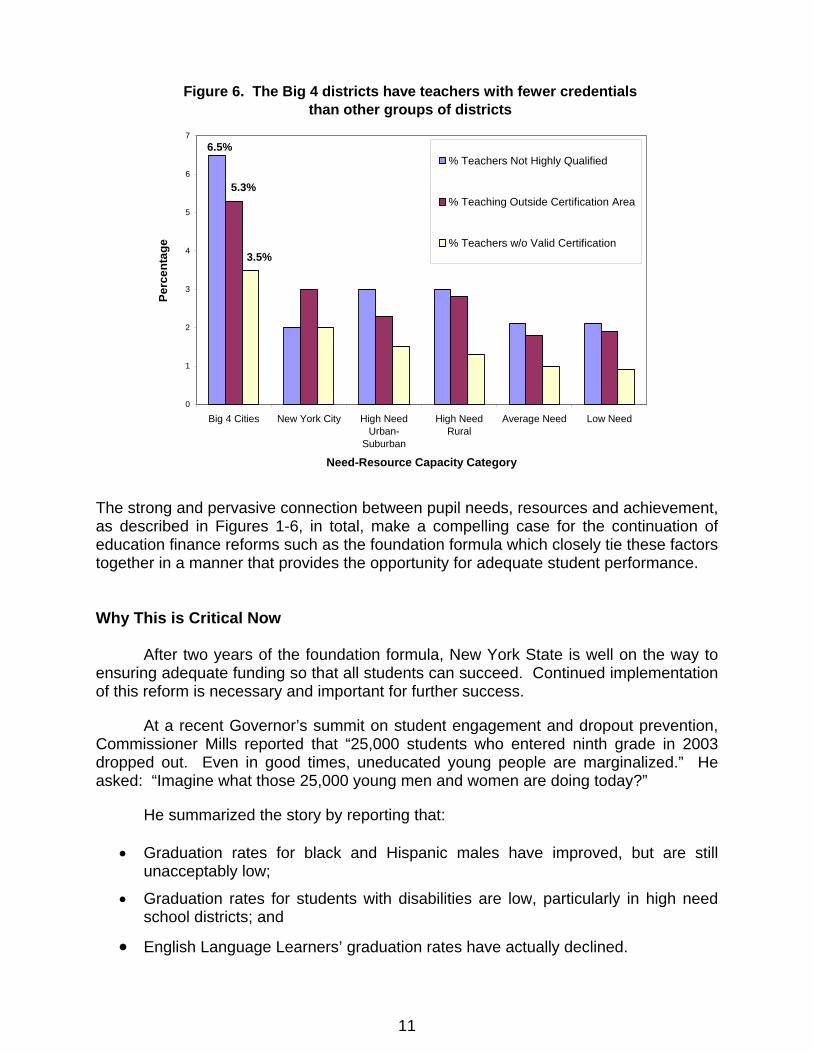
Figure 6. The Big 4 districts have teachers with fewer credentials than other groups of districts
0
1
2
3
4
5
6
7
Big 4 Cities New York City High NeedUrban-
Suburban
High NeedRural
Average Need Low Need
Need-Resource Capacity Category
Perc
enta
ge% Teachers Not Highly Qualified
% Teaching Outside Certification Area
% Teachers w/o Valid Certification
6.5%
5.3%
3.5%
The strong and pervasive connection between pupil needs, resources and achievement, as described in Figures 1-6, in total, make a compelling case for the continuation of education finance reforms such as the foundation formula which closely tie these factors together in a manner that provides the opportunity for adequate student performance. Why This is Critical Now
After two years of the foundation formula, New York State is well on the way to ensuring adequate funding so that all students can succeed. Continued implementation of this reform is necessary and important for further success.
At a recent Governor’s summit on student engagement and dropout prevention, Commissioner Mills reported that “25,000 students who entered ninth grade in 2003 dropped out. Even in good times, uneducated young people are marginalized.” He asked: “Imagine what those 25,000 young men and women are doing today?”
He summarized the story by reporting that:
• Graduation rates for black and Hispanic males have improved, but are still unacceptably low;
• Graduation rates for students with disabilities are low, particularly in high need school districts; and
• English Language Learners’ graduation rates have actually declined.
11
This Regents proposal will outline those actions that will accelerate student learning while reducing spending. Maintain the Commitment
The progress made shows us that reforms in education are having an impact. With much hard work left to be done, the promise of a quality education depends on resources that support student learning. The State has made an historic commitment to providing adequate funding in its four-year phase in of the foundation formula begun in 2007. The State must maintain this commitment. This proposal sets forth Regents recommendations for funding New York State school districts in school year 2009-10 and beyond.
Recommendations
Preserve the Foundation Formula New York State’s historic implementation of a needs-based, education-oriented school funding formula is well on its way. Over the past two years, the State has completed approximately 38 percent of this phase in. At the end of the phase in, school funding will be adequate, transparent and predictable. However, many districts do not yet have adequate funding. The economic crisis may slow down the achievement of this goal, but should not deter us from achieving it eventually. Our state’s future depends on adequate education funding. While the State and nation struggle to adjust to an economic crisis, difficult decisions must be made about our future. Central to this, is the decision to continue to make progress toward adequate funding for our schools. The Regents approach is based on the premise that all districts should have a minimum level of funding and although we have made significant progress, New York State has not yet achieved this funding standard. Not only does the State Constitution require adequate funding for schools, but our future economic security depends on it. Investing in the quality education children need to be successful will pay off for years to come as they pursue higher education, contribute to the workplace and contribute as citizens. Recognize changes in district needs. While the Regents recognize the extraordinary conditions that led to the current fiscal crisis, any solution that treats all districts the same will not maintain the drive toward adequacy. The State should continue to recognize demographic and socioeconomic changes in school districts and continue to use school aid, even with limited increases or cuts, in ways that help districts equalize educational opportunity. This is especially important for districts that have limited ability to raise revenues locally and high student need and which may be highly dependent on State Aid. This proposal recommends continuation of the phase-in of the Foundation Formula which the State began in 2007. The enacted budget for 2007-08 reformed the State’s method of allocating resources to school districts by consolidating some 30 existing funding streams into a new Foundation Aid formula. This formula distributes funds to
12
school districts based on the cost of providing an adequate education, adjusted to reflect regional costs and concentrations of pupils who need extra time and help to be successful. The Regents recommend maintaining the commitment to high need school districts even if this means extending the phase in of the formula. The Foundation Formula is transparent, lending itself to public understanding and debate. It is represented by a simple formula with four moving parts:
District Foundation Aid per Pupil = [Foundation Cost X Pupil Need Index X Regional Cost Index] – Expected Local Contribution.
• The Foundation Cost is the cost of providing general education services. It is
measured by determining instructional costs of districts that are performing well.
• The Pupil Needs Index recognizes the added costs of providing extra time and help for low-income and needy students to succeed.
• The Regional Cost Index recognizes regional variations in purchasing power around the State, based on wages of non-school professionals.
• The Expected Local Contribution is an amount districts are expected to spend as their fair share of the total cost of general education.
Maintain existing Contracts for Excellence. The State created Contracts for Excellence in 2007 that designate how districts spend additional education aid for programs that have a track record of improving student achievement, and to document student achievement growth associated with these expenditures. The State required districts with large aid increases and low student achievement to participate in the program. It specified the amount of funding that should be directed to expand learning opportunities for students and that which could be used to continue existing district programs. The Regents recommend that the State:
1) Continue to give priority in funding to high need school districts until they have adequate funding.
2) Do not require districts that have made adequate yearly progress two years in a row to file a Contract.
3) Continue the link in Contracts for Excellence (C4E) between money and accountability and better align the program with the accountability system by making contract requirements commensurate with the size of the achievement problem.
4) Current C4E districts should continue in C4E and, if aid increases are small, focus on maintaining C4E programs funded in the base year without expansion of new programs. In order to protect the State’s and districts’ investment in C4E programs, the State should provide a short-term Academic Enhancement Aid to provide C4E districts with resources to help maintain their C4E programs. These grants would help districts respond to inflationary pressures and meet State accountability requirements.
13
5) Modify Chapter 57 requirements for districts in need of improvement to require greater transparency and public posting of district improvement plans. Suspend requirements related to redirecting resources to C4E allowable programs.
Continue the State’s Commitment to Universal Pre-K The State has made steady progress in the implementation of universal pre-kindergarten for four year olds, with funding for 2008-09 at an estimated $451 million statewide. Funding for pre-kindergarten programs together with adequate funding for K-12 programs provided by Foundation Aid, gives districts a solid foundation with which to close the achievement gap. Research has documented the lasting impact of quality early childhood programs followed by well planned and funded early grade programs in schools. Achievement results improve, the need for special education and academic intervention declines, graduation rates increase, workforce earnings increase and crime decreases. Quality early childhood education makes good education sense and makes good economic sense. The Regents recommend that funding for early childhood education should continue to be provided as a single funding stream, separate from but aligned with funding for kindergarten through grade 12. Funding for pre-kindergarten through grade 12 should provide school districts with the resources needed to give all students the opportunity to meet State learning standards. Funding for pre-kindergarten education should be increased to ensure continued progress toward universal availability of pre-kindergarten education to all four year olds. The Regents recommend the State continue the phase-in specified in the State’s financial plan, by increasing funding for universal pre-kindergarten by $61 million over 2008-09. Additional flexibility in the use of funds should be afforded to districts that are already offering universally-available pre-kindergarten programs and full-day kindergarten, so that they are able to offer full-day pre-kindergarten programming where appropriate. Strengthen the Role of BOCES in Shared Services
Make improvements to BOCES Aid. The Regents proposal seeks to maximize the potential of BOCES while improving the assessment of fiscal capacity for the distribution of BOCES Aid. They recommend increasing the equalization of the BOCES Aid formula by eliminating the aid ratio option that benefits wealthier school districts. This would provide additional aid for increased costs that BOCES incur for employee salaries and would enhance the State’s role of providing educational opportunity by equalizing aid so that poorer districts receive more aid and wealthier districts receive less. Give the Big Four City School Districts access to BOCES services. The Regents recommend that the existing practice of excluding large city school districts from accessing BOCES services be discontinued. They recommends that the Big Four city school districts (Yonkers, Rochester, Syracuse and Buffalo) be given the authority to
14
contract with a neighboring BOCES for services in critical service areas where BOCES’ expertise is strong and the city’s is weak or non-existent. A program should be established authorizing the Big Four city school districts to participate in BOCES and purchase services from them. A corresponding increase in aid should be provided to the New York City school district to allow it to fund similar programs within the city district without BOCES. Such regional services can include:
Arts and cultural programs for students;
Career and technical programs for students;
Staff development as part of a district-required professional development plan and annual professional performance review;
Technology services provided through BOCES; and
Regional teacher certification. A CO-SER Committee of District Superintendents and Department staff has been established to develop options to expand the delivery of BOCES services to help the State accomplish its educational mission and identifying any legislative changes needed. The following proposals are under consideration and development by the CO-SER Committee. Encourage regional school transportation services. To reduce the cost of transporting non-public school students and students with disabilities within a BOCES region, school districts could jointly provide transportation for students crossing district lines or with similar needs. In addition, BOCES could offer transportation administration services to school districts on a regional basis as a shared service to increase the efficiency of routing and reduce the cost of administration. This shared service would generate Transportation Aid for participating school districts. The State should facilitate a demonstration project or projects to determine the effectiveness of this approach and whether it should be encouraged for statewide use. Central business office demonstration. To encourage the use of BOCES for back-office school district operations like payroll and purchasing, the State should facilitate a demonstration project that will serve as a model for school districts in other BOCES regions. Regional financial planning services. Promote BOCES as a resource to assist districts in developing long-term financial plans including for example, the costs of contract settlements and future liabilities for retiree health benefits, where such competence exists. Such assistance can aid districts in collective bargaining agreements, among other operations. Provide greater sharing through BOCES than they currently provide. BOCES are primarily limited to providing shared services related to education for two or more school districts. This recommendation is suggested by way of testimony presented to the Local Government Commission and is not a formal recommendation of the Commission. The suggestion is that BOCES could share with municipalities other than school districts,
15
provided that this sharing did not detract from BOCES educational mission. For example, BOCES might provide services or products to public libraries and/or municipalities such as:
Broadband width; Assisting with implementing energy efficient buildings; Sharing transportation and maintenance; and Processing payroll or purchasing.
The trade-off is that although greater cost savings may be generated through scale economies, State Education Aid may actually remain the same or grow as districts claim BOCES aid on new cooperative services. The CO-SER Committee is examining the parameters under which BOCES services should be expanded.
Establish a BOCES statewide energy purchasing program to save energy costs. The Regents support the recommendation of the Executive Commission on Local Government Efficiency and Competitiveness to encourage the expansion or replication of the New York State Energy Municipal Cooperative of the Onondaga-Cortland-Madison BOCES to help school districts reduce their energy costs. This cooperative is a corporation established under Article 5G of General Municipal Law to coordinate the purchase of natural gas and electricity for local governments in the regions served by National Grid and the New York State Electric and Gas. Reduce Costs through Mandate Relief Mandate relief can reduce the costs of education services while maintaining the commitment to improving student results. The Regents recommend three directions for reducing costs through mandate relief: streamlining school district planning and reporting; enacting a simplified cost allowance for State Building Aid and making aid reforms for future projects; and reducing unnecessary interest payments for school district short-term borrowing. Streamline school district planning and reporting. The Regents have recommended a mandate relief bill for school districts that would eliminate duplicative reporting and give the Commissioner authority to further streamline school district and BOCES planning and reporting. Streamlining will also help the Department, BOCES and district staff to use information more strategically and comprehensively and also focuses Departmental staff resources on its core operational missions and responsibilities. The bill requires the Department to conduct a review of Commissioner’s regulations within a year and eliminate duplicative or unnecessary reporting requirements for school districts that are contained in regulation. Simplify State Building Aid and make reforms going forward. The Regents recommend that the Governor and Legislature simplify the maximum cost allowance formula for State Building Aid. The law sets a reasonable cost ceiling for all capital projects. However, the current system is an overly complex and inefficient process that, in some cases, forces a district to compromise the desired educational goal in order to
16
achieve maximum reimbursement. The Regents propose that the State calculate a cost allowance based on a certain allotment of space and cost per enrolled pupil, according to the following formula:
Cost Allowance = Projected Pupil Enrollment x Allowed Square Feet
Per Pupil x Allowed Cost per Square Foot x Regional Cost Factor
The current New York State Labor Department Cost Index would be used to update allowable costs on a monthly basis. Unlike the Regents Regional Cost Index enacted for Foundation Aid, which is fundamentally a professional wage index, the New York State Labor Department cost index is based solely on the wages of three major occupational titles critical to the building industry. A simplified cost allowance would offer greater educational flexibility, more intelligent planning of school capital needs, ease of understanding and transparency.
The Regents also recommend that staff explore options for reforming Building Aid in the future to promote efficiency and effectiveness of investment in school district capital assets. The State should eliminate the selected Building Aid ratio option that allows districts to use their most favorable aid ratio going back to 1981-82. In cases where district wealth has increased over the years, the State is compensating a wealthy district if it were poor. Reduce unnecessary interest payments for school district short-term borrowing. School districts around the State issue tax warrants in August and collect tax levy in September to coincide with the start of school. Only Suffolk County sends its tax bills in December. This results in the need for extensive short-term borrowing by school districts in the form of tax anticipation notes. Although Tax anticipation notes are usually short-term notes, the interest paid can be substantial if the amount borrowed is large. The practice of issuing these notes occurs throughout the State, but is particularly noteworthy in Suffolk County; in 2006-07, districts in Suffolk issued $870 million in tax anticipation notes, approaching 60 percent of the statewide total of about $1.4 billion. This borrowing in Suffolk has been common practice and may be caused by property tax bills going out in December, instead of September as in other counties. Fifty-six of the 65 districts in Suffolk issued Tax anticipation notes in each of the last three years. The interest paid by Suffolk districts on Tax anticipation notes exceeded $32 million in 2006-07, representing 66 percent of the interest paid statewide on these notes. Even districts in serious financial difficulty issue Tax anticipation notes in Suffolk; only the very wealthiest of districts seem to avoid this practice. Districts in Nassau County paid $11 million in interest on Tax anticipation notes, or 23 percent of the statewide total. Districts in Westchester County paid $3 million, or 6 percent of the total. Over the last three years alone, interest payments exceeded $100 million statewide just for these notes. Suffolk County school districts could reduce costs for short term through a change in the tax law to conform Suffolk County to the tax collection schedule of the rest of the State. The Department will explore options for phasing in a transition to the new schedule.
17
Avoid Costly Spending and Improve Outcomes for Students with Disabilities It is important to examine areas where costs are increasing and we have done so in the area of the education of students with disabilities. Our approach recognizes that students with disabilities are among the most vulnerable of our pupils and must be protected and supported by our school system if they are going to succeed and live productive lives. The following recommendations which were included in Deputy Commissioner Rebecca Cort’s testimony to the New York State Commission on Property Tax Relief aim to identify cost drivers that can be affected by specific actions that will reduce special education expenditures while contributing to improved performance:
⎯ Adequate funding for general education. Our analysis of the performance of students with disabilities reveals the finding that the whole school affects the performance of each student. The research shows clearly that outcomes for students with disabilities are directly related to the quality of the general education program. In our highest need and under funded districts, only 20 percent of students with disabilities graduate while in our low need, amply funded school districts, 70 percent do. Adequate general education funding for high need districts will contribute mightily to the reduction of special education costs.
⎯ Early intervention. Control the special education classification rate through early intervening services such as research-based instructional and behavioral programs, integrated pre-k programs and programs for students with disabilities that are English language learners.
⎯ In-district programs. Many districts have reduced special education program costs by bringing back to or servicing students with disabilities in-district by broadening the options offered or by developing consortium programs with neighboring districts.
⎯ Focus on parents. Districts need to place a greater priority on building relationships of trust with parents that result in more individualized responses to meet students’ needs. Parents are much less likely to resort to costly due process proceedings if they feel that they are being listened to and their child’s needs are being met.
⎯ Research-based programs and continuous review of outcome data. Strong instructional programs should be accompanied by the frequent review of data reflecting student progress, and the adjustment of instructional methodologies when progress is not occurring.
18
Conclusion
The Regents recommend an approach to school aid for school year 2009-10 that continues to support the success of New York State school districts in educating the State’s neediest students, while reducing costs through mandate relief, increasing the use of shared services, and supporting approaches that will slow the growth of costly special education programs. The State should preserve the foundation formula even if it must moderate the phase in of the formula. Contracts for Excellence should be maintained and school districts should be asked to reduce costs and increase graduation rates through use of BOCES. The State should continue the planned expansion of universal pre-k programs that are so critical to the State’s education success. The State should use the economic crisis to emphasize the priority of adequate funding for school districts as a platform for the State’s future economic health.
Selected Bibliography Duncan-Poitier, Johanna. The Achievement Gap: What the Data Show. Report to the Regents Committee on Elementary, Middle, Secondary and Continuing Education. Albany, New York: New York State Education Department, September 2008. http://www.regents.nysed.gov/2008Meetings/September2008/0908emscd2.doc Fiscal Analysis and Research Unit. The Calculation of A Regional Cost Index: 2006 Update. Albany, New York: New York State Education Department, 2006. http://oms32.nysed.gov/faru/Articles/RCI_2006update.htm Fiscal Analysis and Research Unit. Towards An Understanding of the Relationships Among Student Need, Expenditures and Academic Performance. Albany, New York: New York State Education Department, 2003. http://oms32.nysed.gov/faru/documents/RG_RNfo2FINAL.doc Fiscal Analysis and Research Unit. The Successful Schools Study. Estimating the Additional Cost of Providing an Adequate Education. Excerpted from the Regents Proposal on State Aid to School Districts for School Year 2004-05. Albany, New York: New York State Education Department, 2004. http://oms32.nysed.gov/faru/Articles/SuccessfulSchools.html State Aid Work Group. Introduction to the Concept of Adequacy. Discussion paper prepared for the Board of Regents. Albany, New York: New York State Education Department, 1999. http://oms32.nysed.gov/faru/PDFDocuments/adequacyprinciples.pdf
19
20
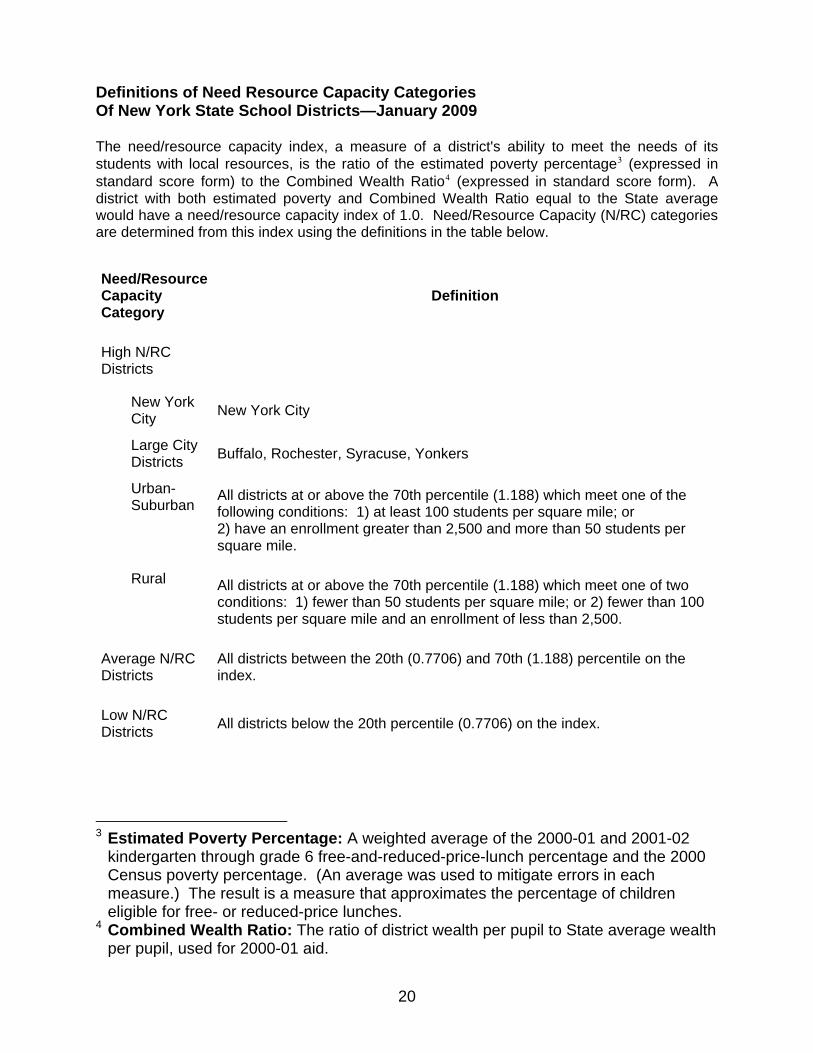
Definitions of Need Resource Capacity Categories Of New York State School Districts—January 2009 The need/resource capacity index, a measure of a district's ability to meet the needs of its students with local resources, is the ratio of the estimated poverty percentage3 (expressed in standard score form) to the Combined Wealth Ratio4 (expressed in standard score form). A district with both estimated poverty and Combined Wealth Ratio equal to the State average would have a need/resource capacity index of 1.0. Need/Resource Capacity (N/RC) categories are determined from this index using the definitions in the table below.
Need/Resource Capacity Category
Definition
High N/RC Districts
New York City New York City
Large City Districts Buffalo, Rochester, Syracuse, Yonkers
Urban-Suburban
All districts at or above the 70th percentile (1.188) which meet one of the following conditions: 1) at least 100 students per square mile; or 2) have an enrollment greater than 2,500 and more than 50 students per square mile.
Rural All districts at or above the 70th percentile (1.188) which meet one of two
conditions: 1) fewer than 50 students per square mile; or 2) fewer than 100 students per square mile and an enrollment of less than 2,500.
Average N/RC Districts
All districts between the 20th (0.7706) and 70th (1.188) percentile on the index.
Low N/RC Districts All districts below the 20th percentile (0.7706) on the index.
3 Estimated Poverty Percentage: A weighted average of the 2000-01 and 2001-02
kindergarten through grade 6 free-and-reduced-price-lunch percentage and the 2000 Census poverty percentage. (An average was used to mitigate errors in each measure.) The result is a measure that approximates the percentage of children eligible for free- or reduced-price lunches.
4 Combined Wealth Ratio: The ratio of district wealth per pupil to State average wealth per pupil, used for 2000-01 aid.
21
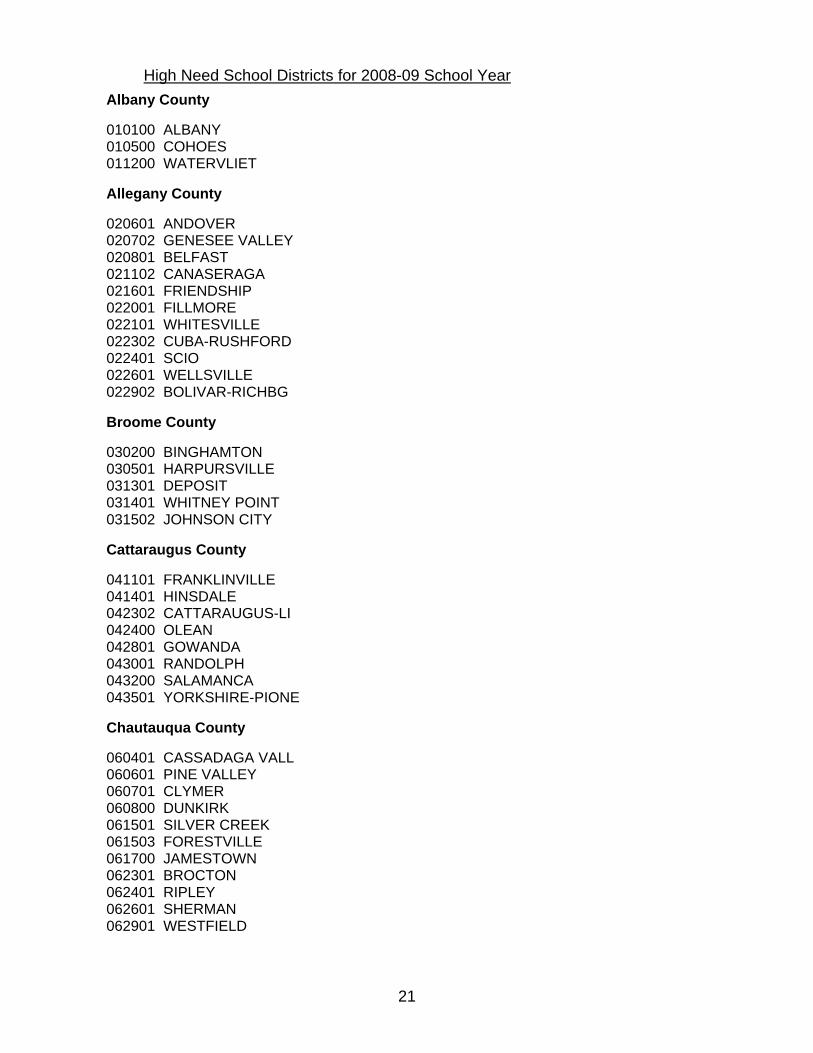
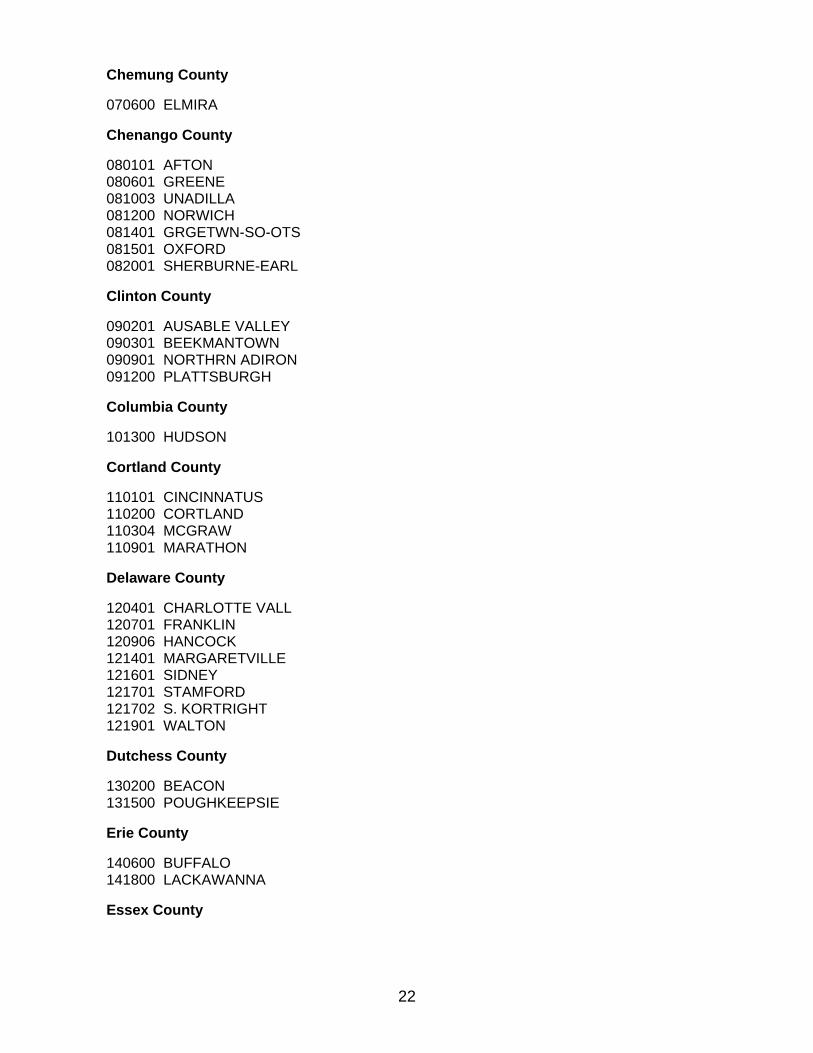
High Need School Districts for 2008-09 School Year Albany County
010100 ALBANY 010500 COHOES 011200 WATERVLIET
Allegany County
020601 ANDOVER 020702 GENESEE VALLEY 020801 BELFAST 021102 CANASERAGA 021601 FRIENDSHIP 022001 FILLMORE 022101 WHITESVILLE 022302 CUBA-RUSHFORD 022401 SCIO 022601 WELLSVILLE 022902 BOLIVAR-RICHBG
Broome County
030200 BINGHAMTON 030501 HARPURSVILLE 031301 DEPOSIT 031401 WHITNEY POINT 031502 JOHNSON CITY
Cattaraugus County
041101 FRANKLINVILLE 041401 HINSDALE 042302 CATTARAUGUS-LI 042400 OLEAN 042801 GOWANDA 043001 RANDOLPH 043200 SALAMANCA 043501 YORKSHIRE-PIONE
Chautauqua County
060401 CASSADAGA VALL 060601 PINE VALLEY 060701 CLYMER 060800 DUNKIRK 061501 SILVER CREEK 061503 FORESTVILLE 061700 JAMESTOWN 062301 BROCTON 062401 RIPLEY 062601 SHERMAN 062901 WESTFIELD
22
Chemung County
070600 ELMIRA
Chenango County
080101 AFTON 080601 GREENE 081003 UNADILLA 081200 NORWICH 081401 GRGETWN-SO-OTS 081501 OXFORD 082001 SHERBURNE-EARL
Clinton County
090201 AUSABLE VALLEY 090301 BEEKMANTOWN 090901 NORTHRN ADIRON 091200 PLATTSBURGH
Columbia County
101300 HUDSON
Cortland County
110101 CINCINNATUS 110200 CORTLAND 110304 MCGRAW 110901 MARATHON
Delaware County
120401 CHARLOTTE VALL 120701 FRANKLIN 120906 HANCOCK 121401 MARGARETVILLE 121601 SIDNEY 121701 STAMFORD 121702 S. KORTRIGHT 121901 WALTON
Dutchess County
130200 BEACON 131500 POUGHKEEPSIE
Erie County
140600 BUFFALO 141800 LACKAWANNA
Essex County

23
150203 CROWN POINT 150901 MORIAH 151501 TICONDEROGA
Franklin County
160801 CHATEAUGAY 161201 SALMON RIVER 161501 MALONE 161601 BRUSHTON MOIRA 161801 ST REGIS FALLS
Fulton County
170500 GLOVERSVILLE 170600 JOHNSTOWN 171001 OPPENHEIM EPHR
Genesee County
180300 BATAVIA
Greene County
190401 CATSKILL
Herkimer County
210302 WEST CANADA VA 210501 ILION 210502 MOHAWK 210601 HERKIMER 210800 LITTLE FALLS 211003 DOLGEVILLE 211103 POLAND 211701 VAN HORNSVILLE 212001 BRIDGEWATER-W
Jefferson County
220301 INDIAN RIVER 220909 BELLEVILLE-HEN 221301 LYME 221401 LA FARGEVILLE 222000 WATERTOWN 222201 CARTHAGE
Lewis County
230201 COPENHAGEN 230901 LOWVILLE 231101 SOUTH LEWIS
Livingston County

24
240901 MOUNT MORRIS 241101 DALTON-NUNDA
Madison County
250109 BROOKFIELD 250301 DE RUYTER 250401 MORRISVILLE EA 251501 STOCKBRIDGE VA
Monroe County
261600 ROCHESTER
Montgomery County
270100 AMSTERDAM 270301 CANAJOHARIE 270701 FORT PLAIN 271102 ST JOHNSVILLE
Nassau County
280201 HEMPSTEAD 280208 ROOSEVELT 280209 FREEPORT 280401 WESTBURY
New York City
300000 NEW YORK CITY
Niagara County
400800 NIAGARA FALLS
Oneida County
410401 ADIRONDACK 410601 CAMDEN 411800 ROME 412300 UTICA
Onondaga County
421800 SYRACUSE
Ontario County
430700 GENEVA
Orange County
441000 MIDDLETOWN 441202 KIRYAS JOEL 441600 NEWBURGH 441800 PORT JERVIS
25
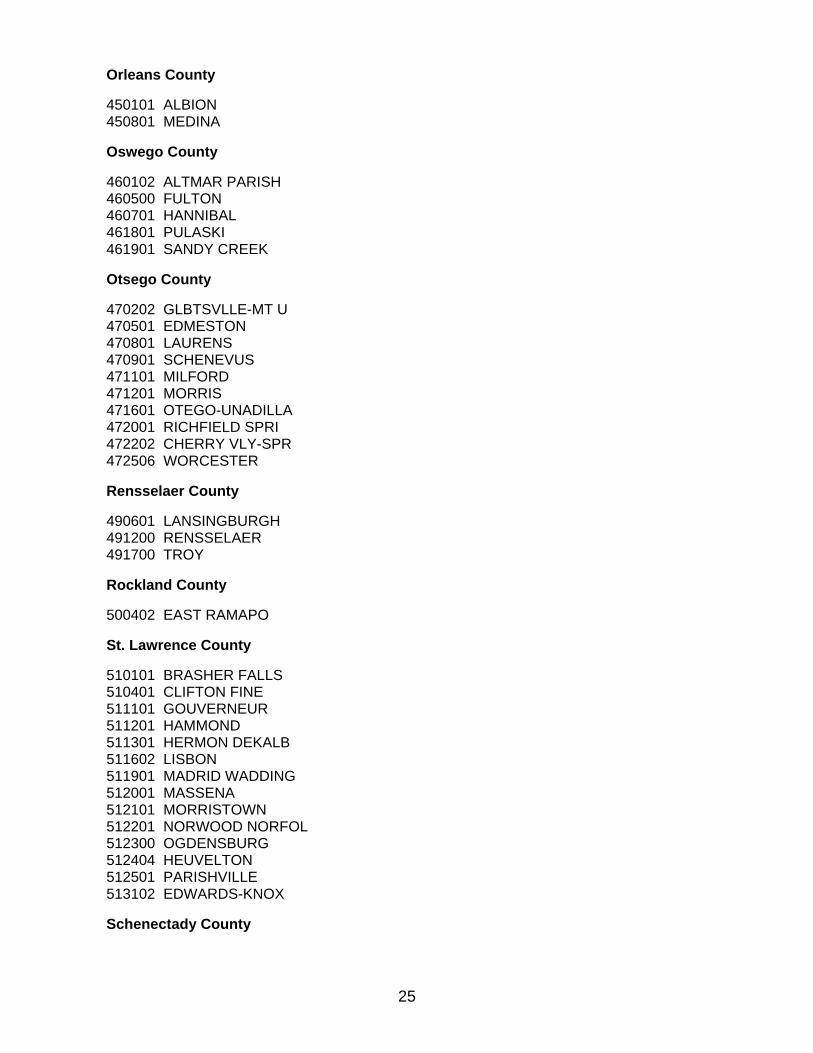
Orleans County
450101 ALBION 450801 MEDINA
Oswego County
460102 ALTMAR PARISH 460500 FULTON 460701 HANNIBAL 461801 PULASKI 461901 SANDY CREEK
Otsego County
470202 GLBTSVLLE-MT U 470501 EDMESTON 470801 LAURENS 470901 SCHENEVUS 471101 MILFORD 471201 MORRIS 471601 OTEGO-UNADILLA 472001 RICHFIELD SPRI 472202 CHERRY VLY-SPR 472506 WORCESTER
Rensselaer County
490601 LANSINGBURGH 491200 RENSSELAER 491700 TROY
Rockland County
500402 EAST RAMAPO
St. Lawrence County
510101 BRASHER FALLS 510401 CLIFTON FINE 511101 GOUVERNEUR 511201 HAMMOND 511301 HERMON DEKALB 511602 LISBON 511901 MADRID WADDING 512001 MASSENA 512101 MORRISTOWN 512201 NORWOOD NORFOL 512300 OGDENSBURG 512404 HEUVELTON 512501 PARISHVILLE 513102 EDWARDS-KNOX
Schenectady County

26
530600 SCHENECTADY
Schoharie County
540901 JEFFERSON 541001 MIDDLEBURGH 541401 SHARON SPRINGS
Schuyler County
550101 ODESSA MONTOUR
Seneca County
560501 SOUTH SENECA 561006 WATERLOO CENT
Steuben County
570101 ADDISON 570201 AVOCA 570302 BATH 570401 BRADFORD 570603 CAMPBELL-SAVON 571502 CANISTEO-GREEN 571800 HORNELL 572301 PRATTSBURG 572702 JASPER-TRPSBRG
Suffolk County
580105 COPIAGUE 580106 AMITYVILLE 580109 WYANDANCH 580232 WILLIAM FLOYD 580512 BRENTWOOD 580513 CENTRAL ISLIP
Sullivan County
590501 FALLSBURGH 590901 LIBERTY 591302 LIVINGSTON MAN 591401 MONTICELLO
Tioga County
600101 WAVERLY 600903 TIOGA
Tompkins County
610901 NEWFIELD
Ulster County
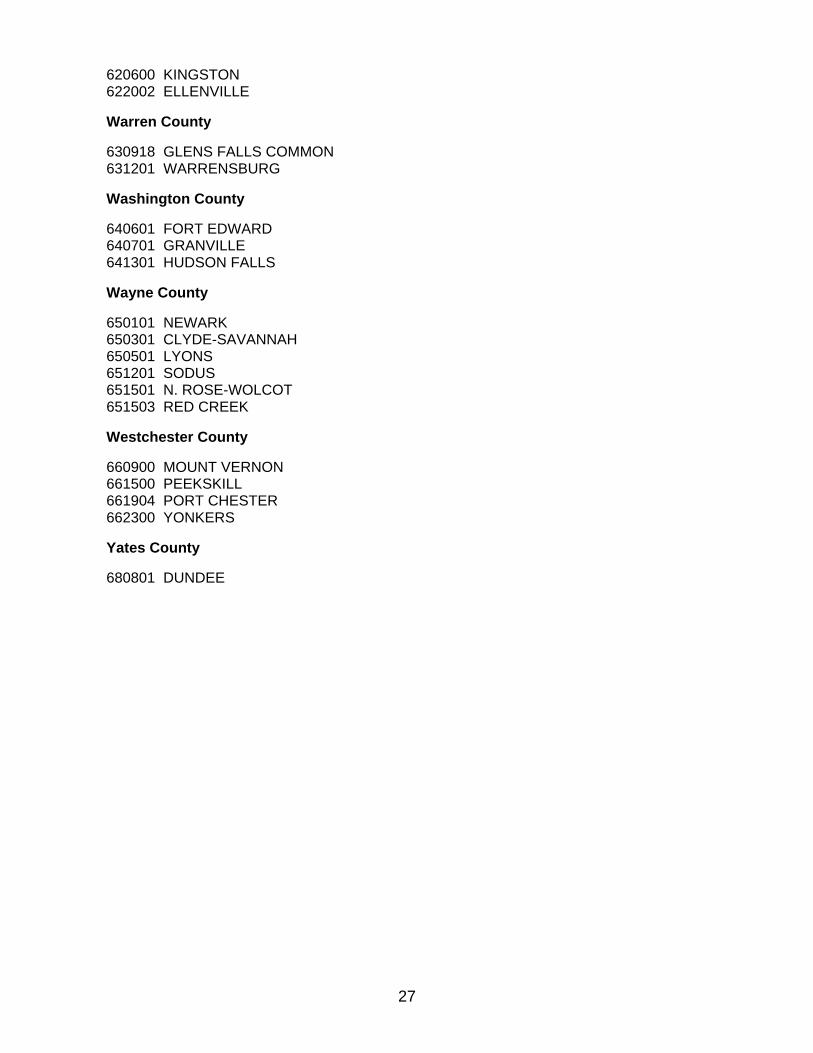
620600 KINGSTON 622002 ELLENVILLE
Warren County
630918 GLENS FALLS COMMON 631201 WARRENSBURG
Washington County
640601 FORT EDWARD 640701 GRANVILLE 641301 HUDSON FALLS
Wayne County
650101 NEWARK 650301 CLYDE-SAVANNAH 650501 LYONS 651201 SODUS 651501 N. ROSE-WOLCOT 651503 RED CREEK
Westchester County
660900 MOUNT VERNON 661500 PEEKSKILL 661904 PORT CHESTER 662300 YONKERS
Yates County
680801 DUNDEE
27
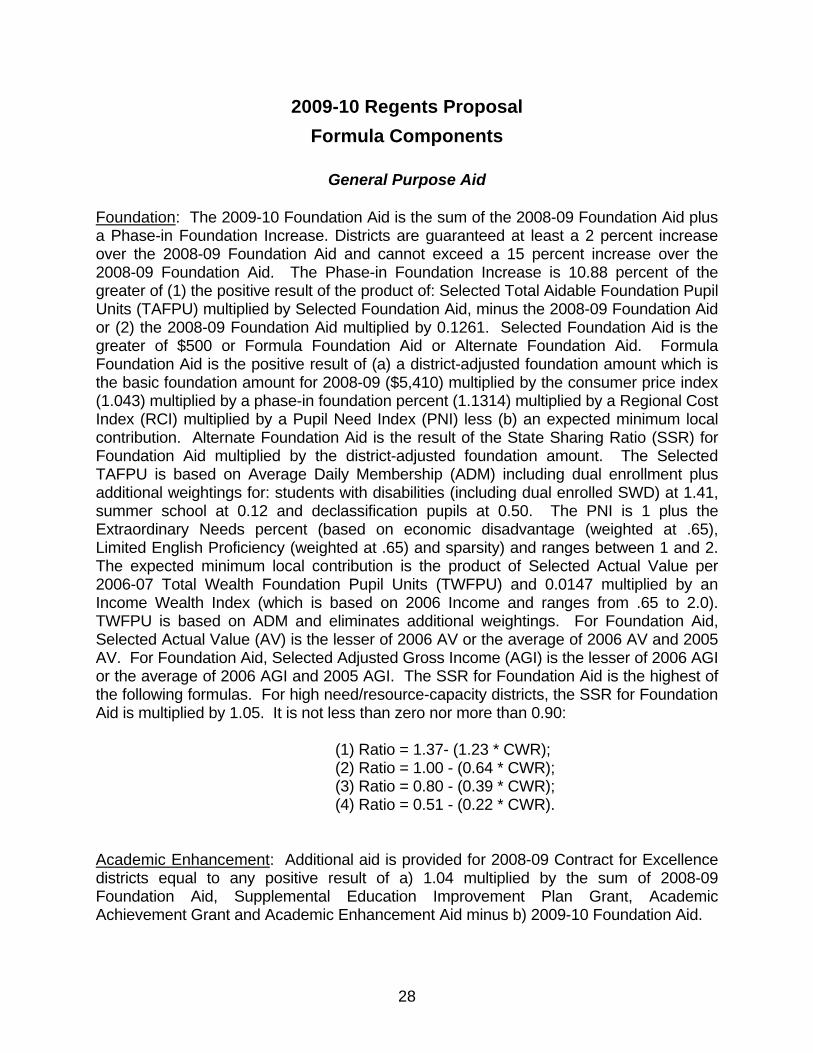
2009-10 Regents Proposal Formula Components
General Purpose Aid Foundation: The 2009-10 Foundation Aid is the sum of the 2008-09 Foundation Aid plus a Phase-in Foundation Increase. Districts are guaranteed at least a 2 percent increase over the 2008-09 Foundation Aid and cannot exceed a 15 percent increase over the 2008-09 Foundation Aid. The Phase-in Foundation Increase is 10.88 percent of the greater of (1) the positive result of the product of: Selected Total Aidable Foundation Pupil Units (TAFPU) multiplied by Selected Foundation Aid, minus the 2008-09 Foundation Aid or (2) the 2008-09 Foundation Aid multiplied by 0.1261. Selected Foundation Aid is the greater of $500 or Formula Foundation Aid or Alternate Foundation Aid. Formula Foundation Aid is the positive result of (a) a district-adjusted foundation amount which is the basic foundation amount for 2008-09 ($5,410) multiplied by the consumer price index (1.043) multiplied by a phase-in foundation percent (1.1314) multiplied by a Regional Cost Index (RCI) multiplied by a Pupil Need Index (PNI) less (b) an expected minimum local contribution. Alternate Foundation Aid is the result of the State Sharing Ratio (SSR) for Foundation Aid multiplied by the district-adjusted foundation amount. The Selected TAFPU is based on Average Daily Membership (ADM) including dual enrollment plus additional weightings for: students with disabilities (including dual enrolled SWD) at 1.41, summer school at 0.12 and declassification pupils at 0.50. The PNI is 1 plus the Extraordinary Needs percent (based on economic disadvantage (weighted at .65), Limited English Proficiency (weighted at .65) and sparsity) and ranges between 1 and 2. The expected minimum local contribution is the product of Selected Actual Value per 2006-07 Total Wealth Foundation Pupil Units (TWFPU) and 0.0147 multiplied by an Income Wealth Index (which is based on 2006 Income and ranges from .65 to 2.0). TWFPU is based on ADM and eliminates additional weightings. For Foundation Aid, Selected Actual Value (AV) is the lesser of 2006 AV or the average of 2006 AV and 2005 AV. For Foundation Aid, Selected Adjusted Gross Income (AGI) is the lesser of 2006 AGI or the average of 2006 AGI and 2005 AGI. The SSR for Foundation Aid is the highest of the following formulas. For high need/resource-capacity districts, the SSR for Foundation Aid is multiplied by 1.05. It is not less than zero nor more than 0.90: (1) Ratio = 1.37- (1.23 * CWR); (2) Ratio = 1.00 - (0.64 * CWR); (3) Ratio = 0.80 - (0.39 * CWR); (4) Ratio = 0.51 - (0.22 * CWR). Academic Enhancement: Additional aid is provided for 2008-09 Contract for Excellence districts equal to any positive result of a) 1.04 multiplied by the sum of 2008-09 Foundation Aid, Supplemental Education Improvement Plan Grant, Academic Achievement Grant and Academic Enhancement Aid minus b) 2009-10 Foundation Aid.
28
Charter School Transitional: Transitional aid is provided for districts whose charter school enrollment exceeds 2 percent of resident public school enrollment or whose charter school payments exceed 2 percent of total general fund expense. High Tax: If 2007-08 Approved Operating Expense per TAPU for Expense is greater than the State Average ($11,400) and the Income Wealth Ratio is less than 2.5 and the Tax Effort Ratio (i.e., 2006 residential levy as a percent of 2006 Income) is greater than 3.58 percent (i.e., 1.35 times the State average), then aid is the greater of $25,000 or the product of $250 multiplied by the State Sharing Ratio multiplied by 2008-09 Enrollment. Operating Reorganization Incentive: Operating Reorganization Incentive Aid is up to 40 percent of 2006-07 Formula Operating Aid for districts that reorganize after July 1, 2007. The sum of 2006-07 Formula Operating Aid and Incentive Operating Aid is limited to 95 percent of 2007-08 Approved Operating Expense.
Early Childhood Education Full Day Kindergarten Conversion: For eligible districts, aid is based on Selected Foundation Aid per pupil multiplied by the increase in full day kindergarten enrollment from the base year to the current year. Universal Pre-Kindergarten: The 2008-09 maximum grant is the sum of the 2006-07 Universal Pre-K, Supplemental Universal Pre-K and Targeted Pre-K grants paid plus an increase calculated as the grant per pupil multiplied by the 2009-10 maximum pupils minus the 2006-07 base aidable pre-K pupils (BAPP). The grant per pupil for the increase is based on the greater of the 2006-07 grant per pupil or 0.50 multiplied by the Selected Foundation Aid per pupil (excluding New York City). The 2009-10 maximum pupils are the sum of the 2009-10 base aidable pre-K pupils and the 2009-10 additional aidable pre-k pupils. The 2009-10 BAPP is the sum of the 2006-07 BAPP on the SA0708 run, the 2007-08 additional aidable pre-K pupils on the SA0708 run and the 2008-09 additional aidable pre-K pupils on the SA0809 run. The 2009-10 additional aidable pre-K pupils equal the phase-in factor multiplied by the result of the 2009-10 unserved count minus the 2009-10 BAPP. The 2009-10 unserved count is the product of 0.85 multiplied by the remainder of the 2007-08 total public and non-public kindergarten count minus the 2007-08 resident four-year old pupils served in section 4410 programs for more than four hours per day. The phase-in factor is the three-year average Free and Reduced-Price Lunch (FRPL) percent with caps. Category 1 districts are capped at a minimum of 10 percent and a maximum of 25 percent, category 2 districts have no phase-in factor and category 3 districts are capped at between 7 and 15 percent. A district is in category 1 if the 2008-09 maximum allocation is greater than 0 and: a) the 2008-09 payable grant is greater than the maximum allocation minus $2,700; or b) the district has a fully implemented UPK program for 2008-09; or c) the district is NYC. A district is in category 2 if it is not in category 1 and: a) the 2008-09 maximum allocation is 0; or b) the 2008-09 payable grant is less than or equal to the 2007-08 grant paid. A district is in category 3 if it does not qualify for category 1 or 2.
29
Support for Pupils with Disabilities Excess Cost - Private: Aid is for public school students attending private schools for students with disabilities. Net tuition expense is multiplied by the 2006 AV/2007-08 TWPU Aid Ratio (1 - (0.15 * Combined Wealth Ratio), with a .50 minimum). Excess Cost – Public High Cost: Aidable high cost expense per pupil must exceed 3.0 times the district’s 2007-08 Approved Operating Expense/TAPU for Expense. The net aidable expense is then multiplied by the 2006 AV/2007-08 TWPU Aid Ratio (1 – (0.51 * Combined Wealth Ratio), minimum 0.25, maximum 1.0).
BOCES/Career and Technical Education BOCES: BOCES Aid is included for administrative, shared services, rental and capital expenses. Save-harmless is continued. Approved expense for BOCES Administrative and Shared Services Aids is based on a salary limit of $30,000. Aid is based on approved 2008-09 administrative and service expenses and the 2006 AV/2007-08 RWADA Aid Ratio: (1 - (.51 * RWADA Wealth Ratio)) with a .36 minimum and .90 maximum. Rent and Capital Aids are based on 2009-10 expenses multiplied by the 2006 AV/2007-08 RWADA Aid Ratio with a .00 minimum and a .90 maximum. Payable aid is the sum of these aids. Special Services Academic Improvement: Academic Improvement Aid equals the 2006 AV/2007-08 TWPU Aid Ratio (1 - (.59 * Combined Wealth Ratio)) with a .36 minimum multiplied by an amount, multiplied by the 2008-09 Career Education pupils including the pupils in business and marketing sequences weighted at 0.16. The amount is $100 plus the result of $1,000 divided by the Combined Wealth Ratio (with a maximum of 1.0). Special Services Career Education: Career Education Aid equals the 2006 AV/2007-08 TWPU Aid Ratio (1 - (.59 * Combined Wealth Ratio)) with a .36 minimum multiplied by $3,900, multiplied by the 2008-09 Career Education pupils including the pupils in business and marketing sequences weighted at 0.16. Special Services Computer Administration: Computer Administration Aid equals the 2006 AV/2007-08 TWPU Aid Ratio (1 - (.51 * Combined Wealth Ratio)) with a .30 minimum multiplied by approved expenses not to exceed the maximum of $62.30 multiplied by the Fall 2008 public school enrollment with half-day kindergarten weighted at 1.0.
30
Instructional Materials Aids Hardware and Technology: Aid is based on 2008-09 approved instructional computer hardware expenses (acquisition and limited repair and staff development expenses) up to the product of $24.20 multiplied by the 2007-08 public and nonpublic enrollment multiplied by the 2006 AV/2007-08 RWADA Aid Ratio (1 – (.51 * RWADA Wealth Ratio)). Library Materials: Aid is based on 2008-09 approved library materials expenses up to the product of $6.25 multiplied by the 2008-09 public and nonpublic enrollment. Software: Aid is based on 2008-09 approved computer software expenses up to the product of $14.98 multiplied by the 2008-09 public and nonpublic enrollment. Textbook: Aid is based on 2008-09 approved textbook expenses up to the product of $58.25 multiplied by the 2008-09 resident public and nonpublic enrollment.
Expensed-Based Aids Building: Aid is equal to the product of the estimated approved building expenses multiplied by the highest of the 1981-82 through the 2008-09 AV/RWADA Aid Ratios or the Current 2006 AV/2007-08 RWADA Aid Ratio. For projects approved by voters on or after July 1, 2000, expenses are multiplied by the higher of the Building Aid Ratio used for 1999-00 aid less .10 or the Current 2006 AV/2007-08 RWADA Aid Ratio. Up to 10 percent of additional building aid is provided for projects approved by voters on or after July 1, 1998. Building expenses include certain capital outlay expenses, lease expenses, and an assumed debt service payment based on the useful life of the project and a statewide average interest rate. Both the low income aid ratio option and the high need supplemental building aid ratio option are continued. Aid is not estimated for those prospective and deferred projects that had not fully met all eligibility requirements as of the November 2008 database. Simplified Building Aid Calculations: The Regents propose to simplify the calculation of the maximum cost allowance that is used to determine Building Aid. The changes described below will allow school administrators to accurately predict Building Aid prior to building design. The new formula would be:
Maximum Cost Allowance = Projected Enrollment X Allowed Square Feet per Student X Allowed Cost per Square Foot x Regional Cost Factor
1. The projected enrollment would continue to be the enrollment projected five years out for grades Pre-K - 6, seven years for grades 7 - 9 and ten years for high school.
31
2. The “allowed per square feet per pupil” is based on the median values of New York State school buildings constructed in the last five years. The values are: Grades Pre-K – 6 = 130 square feet per pupil Grades 7 - 9 = 160 square feet per pupil Grades 7 - 12 = 180 square feet per pupil
3. The “allowed cost per square foot” is set at a level to ensure reasonable
construction costs for instructional facilities will be fully covered – the average maximum cost allowance for new buildings will not change under the new simplified formula. The values are: Grades Pre-K – 6 = $138 per square foot Grades 7 - 9 = $145 per square foot Grades 7 - 12 = $151 per square foot
The allowed cost per square foot would be adjusted monthly by the change in the construction cost index.
4. The current regional cost factor methodology would remain unchanged.
Building Reorganization Incentive: Building Reorganization Incentive Aid on capital outlay, lease and debt service is subjected to the same requirements as regular Building Aid. Transportation: Non-capital aid is based upon estimated approved transportation operating expense plus capital expenses multiplied by the selected Transportation Aid Ratio with a .9 maximum and a .065 minimum. Aid for capital expenses (regular and summer) is computed as above but based on the assumed amortization of purchase, lease and equipment costs over five years, at a statewide average interest rate. The selected Aid Ratio is the highest of 1.263 multiplied by the State Sharing Ratio or 1.01 - (.46 * RWADA Wealth Ratio) or 1.01 – (.46 * Enrollment Wealth Ratio), plus a sparsity adjustment. The sparsity adjustment is the positive result of 21 minus the district’s 2007-08 enrollment per square mile, divided by 317.88. The State Sharing Ratio is the greater of: 1.37 – (1.23 * Combined Wealth Ratio) or 1.0 – (0.64 * Combined Wealth Ratio) or 0.80 – (0.39 * Combined Wealth Ratio) or 0.51 – (0.22 * Combined Wealth Ratio), with a maximum of .90. Summer School Transportation: Transportation Aid for summer school programs is based on estimated approved transportation operating expense multiplied by the selected Transportation Aid Ratio with a .9 maximum and a .065 minimum. Aid is prorated to remain within a $5.0 million appropriation. This proposal combines summer school and regular transportation aid. Aid is shown separately in a subsequent table for the purpose of comparison to the base year.
32
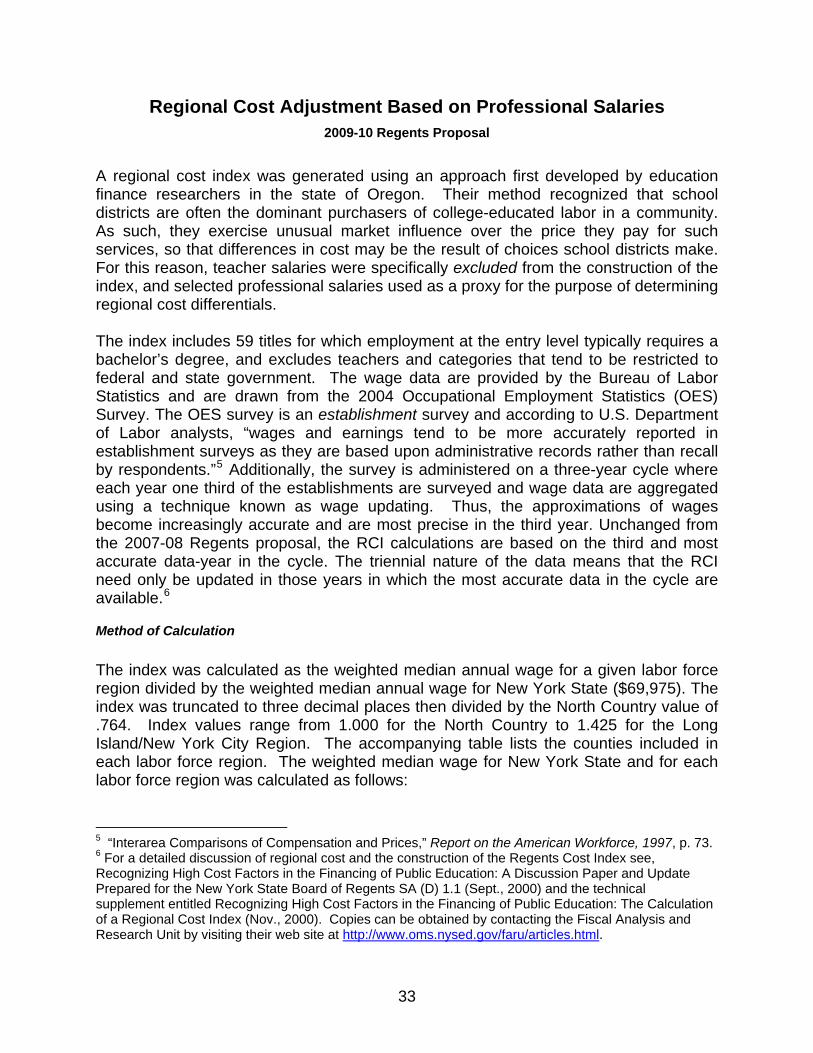
Regional Cost Adjustment Based on Professional Salaries 2009-10 Regents Proposal
A regional cost index was generated using an approach first developed by education finance researchers in the state of Oregon. Their method recognized that school districts are often the dominant purchasers of college-educated labor in a community. As such, they exercise unusual market influence over the price they pay for such services, so that differences in cost may be the result of choices school districts make. For this reason, teacher salaries were specifically excluded from the construction of the index, and selected professional salaries used as a proxy for the purpose of determining regional cost differentials. The index includes 59 titles for which employment at the entry level typically requires a bachelor’s degree, and excludes teachers and categories that tend to be restricted to federal and state government. The wage data are provided by the Bureau of Labor Statistics and are drawn from the 2004 Occupational Employment Statistics (OES) Survey. The OES survey is an establishment survey and according to U.S. Department of Labor analysts, “wages and earnings tend to be more accurately reported in establishment surveys as they are based upon administrative records rather than recall by respondents.”5 Additionally, the survey is administered on a three-year cycle where each year one third of the establishments are surveyed and wage data are aggregated using a technique known as wage updating. Thus, the approximations of wages become increasingly accurate and are most precise in the third year. Unchanged from the 2007-08 Regents proposal, the RCI calculations are based on the third and most accurate data-year in the cycle. The triennial nature of the data means that the RCI need only be updated in those years in which the most accurate data in the cycle are available.6
Method of Calculation The index was calculated as the weighted median annual wage for a given labor force region divided by the weighted median annual wage for New York State ($69,975). The index was truncated to three decimal places then divided by the North Country value of .764. Index values range from 1.000 for the North Country to 1.425 for the Long Island/New York City Region. The accompanying table lists the counties included in each labor force region. The weighted median wage for New York State and for each labor force region was calculated as follows:
5 “Interarea Comparisons of Compensation and Prices,” Report on the American Workforce, 1997, p. 73. 6 For a detailed discussion of regional cost and the construction of the Regents Cost Index see, Recognizing High Cost Factors in the Financing of Public Education: A Discussion Paper and Update Prepared for the New York State Board of Regents SA (D) 1.1 (Sept., 2000) and the technical supplement entitled Recognizing High Cost Factors in the Financing of Public Education: The Calculation of a Regional Cost Index (Nov., 2000). Copies can be obtained by contacting the Fiscal Analysis and Research Unit by visiting their web site at http://www.oms.nysed.gov/faru/articles.html.
33

Weighted Median Hourly Wage = The sum of: (Title Weight * Median Annual Wage) for all
59 titles making up the index.
1. Title Weight = the number of employees in a given title statewide divided by the
number of employees in the 59 titles statewide. Applying title weights to each labor
force region prevents the index from being skewed by variations in occupational mix
across regions.
2. Median Annual Wage = median annual wage rate reported for each title in each labor force region and statewide. A separate index was created for each labor force region based on a subset of 50 of the 59 titles. These 50 occupations represent those titles for which there were no missing data in any of the labor force regions. This index was then used to estimate the median annual wage of titles with missing data in any given labor force region. This was done by multiplying the statewide median annual wage for the title with missing data by the 50-title index for the specific labor force region for which the salary data was missing. For the purpose of index construction, the New York City and Long Island labor force regions were treated as a single labor force region. The New York City/Long Island weighted median wage was calculated as follows: NYC/LI Weighted Median Wage = The sum of (Title Weight * NYC/LI Median Annual Wage)
for all 59 titles making up the index 1. Title Weight = same as above.
2. NYC/LI Median Annual Wage = for each title: [(# of emp LI * LI median annual wage)+(# of emp NYC * NYC median annual wage)] (# of employees in LI + # of employees in NYC)
34
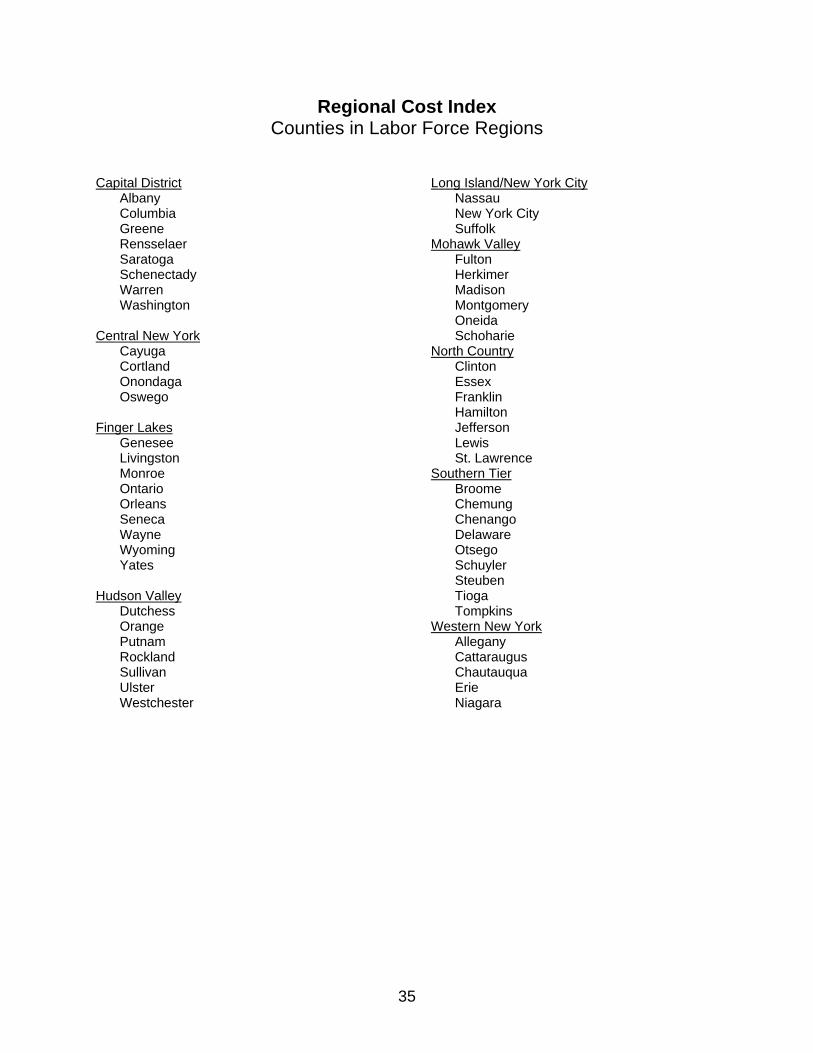
Regional Cost Index Counties in Labor Force Regions
Capital District Albany Columbia Greene Rensselaer Saratoga Schenectady Warren Washington Central New York Cayuga Cortland Onondaga Oswego Finger Lakes Genesee Livingston Monroe Ontario Orleans Seneca Wayne Wyoming Yates Hudson Valley Dutchess Orange Putnam Rockland Sullivan Ulster Westchester
Long Island/New York City Nassau New York City Suffolk Mohawk Valley Fulton Herkimer Madison Montgomery Oneida Schoharie North Country Clinton Essex Franklin Hamilton Jefferson Lewis St. Lawrence Southern Tier Broome Chemung Chenango Delaware Otsego Schuyler Steuben Tioga Tompkins Western New York Allegany Cattaraugus Chautauqua Erie Niagara
35
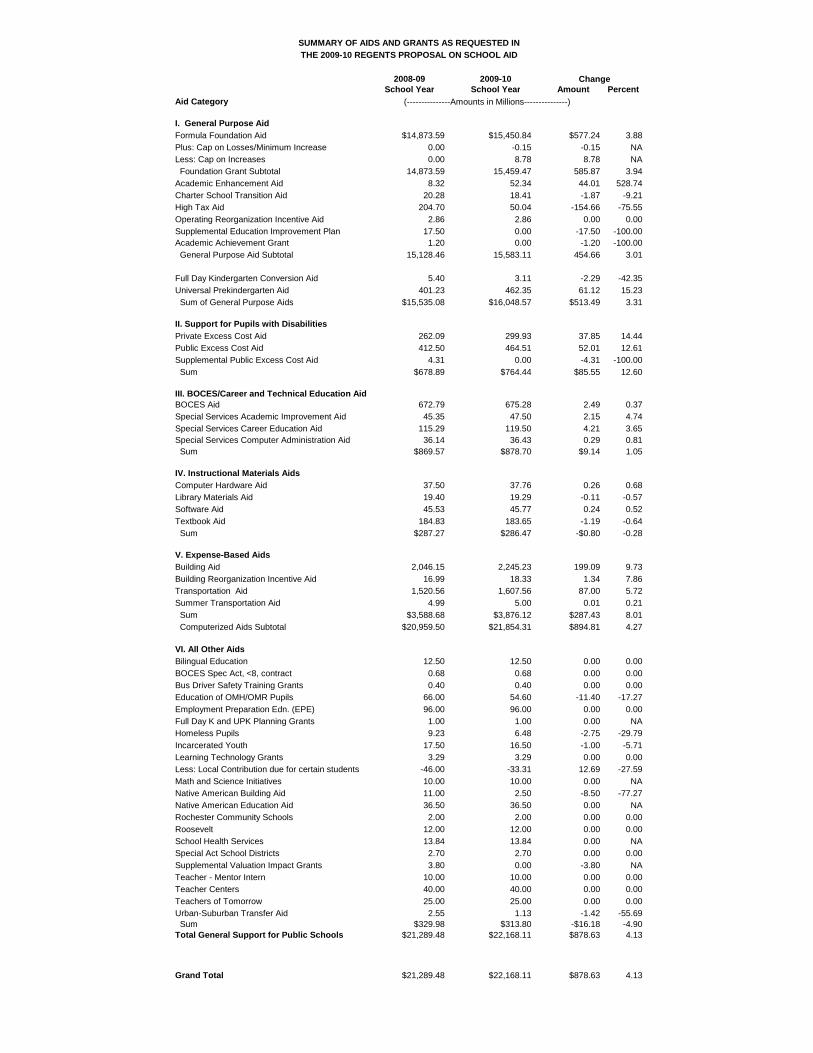
SUMMARY OF AIDS AND GRANTS AS REQUESTED INTHE 2009-10 REGENTS PROPOSAL ON SCHOOL AID
2008-09 2009-10 School Year School Year Amount Percent
Aid Category
I. General Purpose AidFormula Foundation Aid $14,873.59 $15,450.84 $577.24 3.88Plus: Cap on Losses/Minimum Increase 0.00 -0.15 -0.15 NALess: Cap on Increases 0.00 8.78 8.78 NA Foundation Grant Subtotal 14,873.59 15,459.47 585.87 3.94Academic Enhancement Aid 8.32 52.34 44.01 528.74Charter School Transition Aid 20.28 18.41 -1.87 -9.21High Tax Aid 204.70 50.04 -154.66 -75.55Operating Reorganization Incentive Aid 2.86 2.86 0.00 0.00Supplemental Education Improvement Plan 17.50 0.00 -17.50 -100.00Academic Achievement Grant 1.20 0.00 -1.20 -100.00 General Purpose Aid Subtotal 15,128.46 15,583.11 454.66 3.01
Full Day Kindergarten Conversion Aid 5.40 3.11 -2.29 -42.35Universal Prekindergarten Aid 401.23 462.35 61.12 15.23 Sum of General Purpose Aids $15,535.08 $16,048.57 $513.49 3.31
II. Support for Pupils with DisabilitiesPrivate Excess Cost Aid 262.09 299.93 37.85 14.44Public Excess Cost Aid 412.50 464.51 52.01 12.61Supplemental Public Excess Cost Aid 4.31 0.00 -4.31 -100.00 Sum $678.89 $764.44 $85.55 12.60
III. BOCES/Career and Technical Education AidBOCES Aid 672.79 675.28 2.49 0.37Special Services Academic Improvement Aid 45.35 47.50 2.15 4.74Special Services Career Education Aid 115.29 119.50 4.21 3.65Special Services Computer Administration Aid 36.14 36.43 0.29 0.81 Sum $869.57 $878.70 $9.14 1.05
IV. Instructional Materials AidsComputer Hardware Aid 37.50 37.76 0.26 0.68Library Materials Aid 19.40 19.29 -0.11 -0.57Software Aid 45.53 45.77 0.24 0.52Textbook Aid 184.83 183.65 -1.19 -0.64 Sum $287.27 $286.47 -$0.80 -0.28
V. Expense-Based AidsBuilding Aid 2,046.15 2,245.23 199.09 9.73Building Reorganization Incentive Aid 16.99 18.33 1.34 7.86Transportation Aid 1,520.56 1,607.56 87.00 5.72Summer Transportation Aid 4.99 5.00 0.01 0.21 Sum $3,588.68 $3,876.12 $287.43 8.01 Computerized Aids Subtotal $20,959.50 $21,854.31 $894.81 4.27
VI. All Other AidsBilingual Education 12.50 12.50 0.00 0.00BOCES Spec Act, <8, contract 0.68 0.68 0.00 0.00Bus Driver Safety Training Grants 0.40 0.40 0.00 0.00Education of OMH/OMR Pupils 66.00 54.60 -11.40 -17.27Employment Preparation Edn. (EPE) 96.00 96.00 0.00 0.00Full Day K and UPK Planning Grants 1.00 1.00 0.00 NAHomeless Pupils 9.23 6.48 -2.75 -29.79Incarcerated Youth 17.50 16.50 -1.00 -5.71Learning Technology Grants 3.29 3.29 0.00 0.00Less: Local Contribution due for certain students -46.00 -33.31 12.69 -27.59Math and Science Initiatives 10.00 10.00 0.00 NANative American Building Aid 11.00 2.50 -8.50 -77.27Native American Education Aid 36.50 36.50 0.00 NARochester Community Schools 2.00 2.00 0.00 0.00Roosevelt 12.00 12.00 0.00 0.00School Health Services 13.84 13.84 0.00 NASpecial Act School Districts 2.70 2.70 0.00 0.00Supplemental Valuation Impact Grants 3.80 0.00 -3.80 NATeacher - Mentor Intern 10.00 10.00 0.00 0.00Teacher Centers 40.00 40.00 0.00 0.00Teachers of Tomorrow 25.00 25.00 0.00 0.00Urban-Suburban Transfer Aid 2.55 1.13 -1.42 -55.69 Sum $329.98 $313.80 -$16.18 -4.90Total General Support for Public Schools $21,289.48 $22,168.11 $878.63 4.13
Grand Total $21,289.48 $22,168.11 $878.63 4.13
(---------------Amounts in Millions---------------)
Change
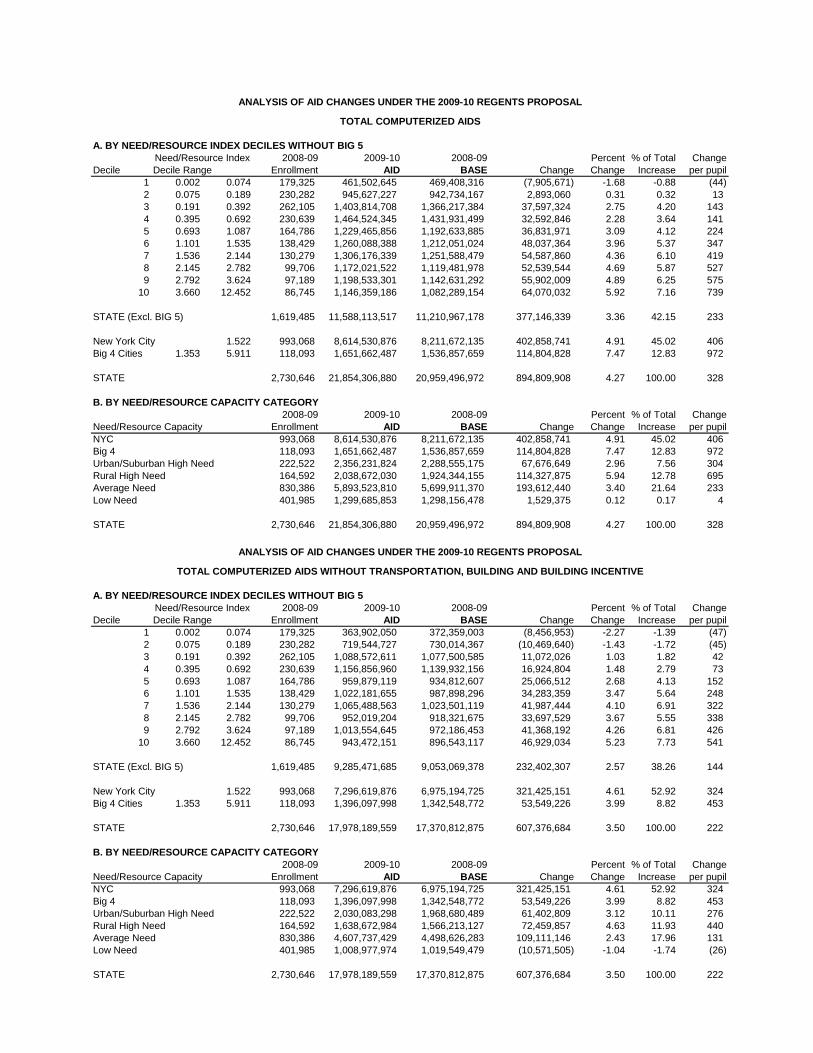
A. BY NEED/RESOURCE INDEX DECILES WITHOUT BIG 52008-09 2009-10 2008-09 Percent % of Total Change
Decile Decile Range Enrollment AID BASE Change Change Increase per pupil1 0.002 0.074 179,325 461,502,645 469,408,316 (7,905,671) -1.68 -0.88 (44) 2 0.075 0.189 230,282 945,627,227 942,734,167 2,893,060 0.31 0.32 13 3 0.191 0.392 262,105 1,403,814,708 1,366,217,384 37,597,324 2.75 4.20 143 4 0.395 0.692 230,639 1,464,524,345 1,431,931,499 32,592,846 2.28 3.64 141 5 0.693 1.087 164,786 1,229,465,856 1,192,633,885 36,831,971 3.09 4.12 224 6 1.101 1.535 138,429 1,260,088,388 1,212,051,024 48,037,364 3.96 5.37 347 7 1.536 2.144 130,279 1,306,176,339 1,251,588,479 54,587,860 4.36 6.10 419 8 2.145 2.782 99,706 1,172,021,522 1,119,481,978 52,539,544 4.69 5.87 527 9 2.792 3.624 97,189 1,198,533,301 1,142,631,292 55,902,009 4.89 6.25 575
10 3.660 12.452 86,745 1,146,359,186 1,082,289,154 64,070,032 5.92 7.16 739
STATE (Excl. BIG 5) 1,619,485 11,588,113,517 11,210,967,178 377,146,339 3.36 42.15 233
New York City 1.522 993,068 8,614,530,876 8,211,672,135 402,858,741 4.91 45.02 406 Big 4 Cities 1.353 5.911 118,093 1,651,662,487 1,536,857,659 114,804,828 7.47 12.83 972
STATE 2,730,646 21,854,306,880 20,959,496,972 894,809,908 4.27 100.00 328
B. BY NEED/RESOURCE CAPACITY CATEGORY2008-09 2009-10 2008-09 Percent % of Total Change
Need/Resource Capacity Enrollment AID BASE Change Change Increase per pupilNYC 993,068 8,614,530,876 8,211,672,135 402,858,741 4.91 45.02 406 Big 4 118,093 1,651,662,487 1,536,857,659 114,804,828 7.47 12.83 972 Urban/Suburban High Need 222,522 2,356,231,824 2,288,555,175 67,676,649 2.96 7.56 304 Rural High Need 164,592 2,038,672,030 1,924,344,155 114,327,875 5.94 12.78 695 Average Need 830,386 5,893,523,810 5,699,911,370 193,612,440 3.40 21.64 233 Low Need 401,985 1,299,685,853 1,298,156,478 1,529,375 0.12 0.17 4
STATE 2,730,646 21,854,306,880 20,959,496,972 894,809,908 4.27 100.00 328
A. BY NEED/RESOURCE INDEX DECILES WITHOUT BIG 52008-09 2009-10 2008-09 Percent % of Total Change
Decile Decile Range Enrollment AID BASE Change Change Increase per pupil1 0.002 0.074 179,325 363,902,050 372,359,003 (8,456,953) -2.27 -1.39 (47) 2 0.075 0.189 230,282 719,544,727 730,014,367 (10,469,640) -1.43 -1.72 (45) 3 0.191 0.392 262,105 1,088,572,611 1,077,500,585 11,072,026 1.03 1.82 42 4 0.395 0.692 230,639 1,156,856,960 1,139,932,156 16,924,804 1.48 2.79 73 5 0.693 1.087 164,786 959,879,119 934,812,607 25,066,512 2.68 4.13 152 6 1.101 1.535 138,429 1,022,181,655 987,898,296 34,283,359 3.47 5.64 248 7 1.536 2.144 130,279 1,065,488,563 1,023,501,119 41,987,444 4.10 6.91 322 8 2.145 2.782 99,706 952,019,204 918,321,675 33,697,529 3.67 5.55 338 9 2.792 3.624 97,189 1,013,554,645 972,186,453 41,368,192 4.26 6.81 426
10 3.660 12.452 86,745 943,472,151 896,543,117 46,929,034 5.23 7.73 541
STATE (Excl. BIG 5) 1,619,485 9,285,471,685 9,053,069,378 232,402,307 2.57 38.26 144
New York City 1.522 993,068 7,296,619,876 6,975,194,725 321,425,151 4.61 52.92 324 Big 4 Cities 1.353 5.911 118,093 1,396,097,998 1,342,548,772 53,549,226 3.99 8.82 453
STATE 2,730,646 17,978,189,559 17,370,812,875 607,376,684 3.50 100.00 222
B. BY NEED/RESOURCE CAPACITY CATEGORY2008-09 2009-10 2008-09 Percent % of Total Change
Need/Resource Capacity Enrollment AID BASE Change Change Increase per pupilNYC 993,068 7,296,619,876 6,975,194,725 321,425,151 4.61 52.92 324 Big 4 118,093 1,396,097,998 1,342,548,772 53,549,226 3.99 8.82 453 Urban/Suburban High Need 222,522 2,030,083,298 1,968,680,489 61,402,809 3.12 10.11 276 Rural High Need 164,592 1,638,672,984 1,566,213,127 72,459,857 4.63 11.93 440 Average Need 830,386 4,607,737,429 4,498,626,283 109,111,146 2.43 17.96 131 Low Need 401,985 1,008,977,974 1,019,549,479 (10,571,505) -1.04 -1.74 (26)
STATE 2,730,646 17,978,189,559 17,370,812,875 607,376,684 3.50 100.00 222
ANALYSIS OF AID CHANGES UNDER THE 2009-10 REGENTS PROPOSAL
TOTAL COMPUTERIZED AIDS
Need/Resource Index
ANALYSIS OF AID CHANGES UNDER THE 2009-10 REGENTS PROPOSAL
TOTAL COMPUTERIZED AIDS WITHOUT TRANSPORTATION, BUILDING AND BUILDING INCENTIVE
Need/Resource Index