Embed Size (px)
Citation preview

1
EDUCATION QUALITY IN SOUTH AFRICA AND
SUB-SAHARAN AFRICA: AN ECONOMIC APPROACH
By
Nicholas Spaull
October 2014
Thesis presented for the degree:
Doctor of Philosophy (Economics)
Supervisor: Professor Servaas van der Berg
University of Stellenbosch | Department of Economics

2
DECLARATION
By submitting this dissertation electronically, I declare that the entirety of the work contained
therein is my own, original work, that I am the sole author thereof (save to the extent
explicitly otherwise stated), that reproduction and publication thereof by Stellenbosch
University will not infringe any third party rights and that I have not previously in its entirety or
in part submitted it for obtaining any qualification.
Copyright © 2014 Stellenbosch University
All rights reserved
Notwithstanding the above, the following chapters of the present work have been submitted
for publication and subsequently accepted. The publication of these articles does not infringe
upon my right to use these articles in this dissertation or to publish the completed
dissertation via Stellenbosch University’s SunScholar portal. These publications are listed in
full below:
Chapter 1:
Spaull, N., (2013). Poverty & Privilege: Primary school inequality in South Africa. International Journal of Educational Development. Vol. 33, p.436–447.
Chapter 3
Spaull, N., and Kotze, J. (2015). Starting behind and staying behind in South Africa: The case of insurmountable learning deficits in mathematics. International Journal of Educational Development. Vol 41 (March) pp12-24
Chapter 4:
Spaull, N., Taylor, S., (2015). Access to what? Creating a composite measure of educational quantity and educational quality for 11 African countries. Comparative Education Review. Vol. 58, No. 1.
Spaull, N., Taylor, S., (2014). Combining educational access and educational quality into a single statistic (PB 14/31), World Bank Jobs Knowledge Platform. Cape Town.
Chapter 5:
Taylor, S., and Spaull, N. (2015). Measuring access to learning over a period of increased access to schooling: The case of Southern and Eastern Africa since 2000. International Journal of Educational Development. Vol. 41 (March) p.47-59

3
Declarations with respect to co-authoring:
With regard to Chapter 2, the nature and scope of my contribution were as follows:
Nature of contribution Extent of contribution (%)
Developing the method of calibrating learning deficits using multiple data sets, analysis of the following datasets: Systemic Evaluation, SACMEQ, TIMSS, majority of the write-up and editing of the paper.
80%
The following co-author(s) have contributed to Chapter 2:
Name E-mail address Nature of contribution Extent of contribution (%)
Janeli Kotze
Helped with the literature review and the analysis of the NSES data.
20%
Signature of candidate:
Date: 1 October 2014
Declaration by co-authors:
The undersigned hereby confirm that:
1. the declaration above accurately reflects the nature and extent of the contributions of the candidate and the co-authors to Chapter 2,
2. no other authors contributed to Chapter 2 besides those specified above, and
3. potential conflicts of interest have been revealed to all interested parties and that the necessary arrangements have been made to use the material in Chapter 2 of this dissertation.
Signature of co-author:
Date: 1 October 2014

4
With regard to Chapters 4 and 5, the nature and scope of my contributions were as follows:
Nature of contribution Extent of contribution (%)
Chapter 4: Developing the conceptual framework behind the access-to-quality measure, undertaking the literature review, analysing the DHS and SACMEQ data to create the composite statistic. Writing up the analysis.
Chapter 5: Automating the data-combination process in STATA and generating graphs and tables for the analysis. Helped with the write-up and editing of the paper.
80%
40%
The following co-authors have contributed to Chapter 4 and 5:
Name E-mail address Nature of contribution Extent of contribution (%)
Stephen Taylor
Chapter 4: Conceptual development of the access-quality measure and editing the paper.
Chapter 5: First co-author contributing to the write-up of the research, the data analysis and sensitivity checks, and the literature review.
20%
60%
Signature of candidate:
Date: 1 October
Declaration by co-authors:
The undersigned hereby confirm that:
1. the declaration above accurately reflects the nature and extent of the contributions of the candidate and the co-authors to Chapters 4 and 5,
2. no other authors contributed to Chapters 4 and 5 besides those specified above, and
3. potential conflicts of interest have been revealed to all interested parties and that the necessary arrangements have been made to use the material in Chapters 4 and 5 of this dissertation.
Signature of co-author:
Date: 2 October 2014

5
ABSTRACT
Education has always occupied a central role in the discipline of economics, featuring prominently in the theoretical constructs of the discipline and, more recently, in their empirical applications. While one can trace the origins of Human Capital theory all the way back to Adam Smith’s ‘The Wealth of Nations’, the two major advances in our understanding of education’s role in economic development transpired in the last 50 years. The first was half way through the 20th century with the work of work of Mincer (1958), Schultz (1961) and particularly that of Becker (1962) who formalized the idea of Human Capital. The second advance was at the turn of the 21st century when Hanushek and Kimko (and later Wößmann) incorporated measures of education quality into their models of economic growth. This latest strand of research serves as the point of departure for this thesis, placing education quality at the centre of the discussion.
The thesis begins by focussing on the South African case and highlighting three broad issues that characterise education in the country: (1) the high levels of inequality that can be seen when comparing student performance by race, language, geographic location and socioeconomic status. New evidence is presented to show that South Africa does indeed have two public schooling systems, reiterating and confirming the findings of other South African scholars. (2) Using intra-survey benchmarks of student achievement, Chapter 2 develops a new method of quantifying learning deficits in mathematics by using three different datasets covering grades 3, 4, 5, 6 and 9. The learning gap between the poorest 60% of students and the wealthiest 20% of students is found to be approximately three grade-levels in grade 3 and grows to between four and five grade-levels by grade 9. (3) The focus then shifts to the complex issue of language and performance, which is addressed in Chapter 3. Here the aim is to exploit an unusual occurrence whereby a large group of South African students were tested twice, one month apart, on the same test in different languages. Using a simplified difference-in-difference methodology it becomes possible to identify the causal impact of writing a test in English when English is not a student’s home language.
The final two chapters of the thesis widen the remit of analysis to include 11 countries in Sub-Saharan Africa, viz. Kenya, Lesotho, Malawi, Mozambique, Namibia, South Africa, Swaziland, Tanzania, Uganda, Zambia and Zimbabwe. Here the aim is to develop a composite measure of education access and education quality by combining household data (DHS) on grade completion and survey data (SACMEQ) on cognitive outcomes. The new measure, termed access-to-literacy and access-to-numeracy is reported for all countries and important sub-groups in Chapter 4. The method is then used in Chapter 5 to compare access-to-learning over a period of increased access to schooling (2000-2007). In all countries there was an improvement in access to literacy and numeracy, challenging the widely held perception that there is always an access-quality trade-off in education. In particular, girls and those in relatively poor households benefited most from this improvement in access to literacy and numeracy.
The thesis ultimately concludes that if children are to realize their full potential, the expansion of physical access to schooling in the developing world must be accompanied by meaningful learning opportunities. The acquisition of knowledge, skills and values must be the central aim of educational expansion.

6
OPSOMMING
Onderwys het nog altyd ʼn rol in ekonomie as vakgebied gespeel. Dit is verstaanbaar, want vaardighede en onderwys was nog altyd ʼn prominente deel van die teoretiese konstrukte en meer onlangs ook van empiriese toepassings in die dissipline. Terwyl die oorsprong van menslike-kapitaalteorie teruggevoer kan word na Adam Smith se Wealth of Nations, het die twee grootste deurbrake met die verstaan van onderwys se rol in ekonomiese ontwikkeling in die laaste vyftig jaar plaasgevind. Die werk van Mincer (1958), Schultz (1961) en veral Becker (1962), wat in die middel van die vorige eeu formele gestalte aan die begrip ‘menslike kapitaal’ gegee het, was die eerste deurbraak. Die tweede deurbraak was teen die eeuwending toe Hanushek en Kimko (en later Wößmann) maatstawwe van onderwysgehalte in hulle ekonomiese groeimodelle begin insluit het. Hierdie nuwe tak van die navorsing plaas onderwys vierkant in die sentrum en dien as vertrekpunt vir hierdie proefskrif.
Die proefskrif begin deur aandag op drie breë kwessies te vestig wat kenmerkend is van onderwys in Suid-Afrika: (1) Die hoë vlakke van ongelykheid volgens ras, taal, geografiese gebied en sosio-ekonomiese status in studente se prestasie. (2) In hoofstuk 2 word ʼn nuwe metode aangebied om leeragterstrande kwantitatief te meet met behulp van norme van leerlingprestasie in skoolvlak-opnames vir grade 3, 4, 5, 6 en 9. Daar word bevind dat die leergaping tussen die armste 60% en die rykste 20% van studente in graad 3 ongeveer drie jaar is en teen graad 9 tot vier of vyf jaar aangroei. (3) Die fokus verskuif daarna na die verwikkelde kwessie van taal en skoolprestasie, wat in hoofstuk 3 bespreek word. Hier is die doel om die ongewone geval uit te buit waar ʼn groot groep Suid-Afrikaanse leerlinge binne die verloop van ʼn maand tweemaal dieselfde toets geskryf het, maar in twee verskillende tale. Met behulp van ʼn vereenvoudigde verskil-tussen-verskille-benadering is dit moontlik om te bepaal hoe groot die kousale effek is waar ʼn leerling wie se moedertaal nie Engels is nie die toets in Engels moes skryf.
Die laaste twee hoofstukke van die proefskrif bevat ʼn wyer analise van elf lande in Sub-Sahara Afrika, naamlik Kenia, Lesotho, Malawi, Mosambiek, Namibia, Suid-Afrika, Swaziland, Tanzanië, Uganda, Zambië en Zimbabwe. Die doel is om ʼn saamgestelde maatstaf van onderwys-toegang en -gehalte te skep deur huishoudingsdata (DHS) oor graadvoltooiing en skoolopnamedata (SACMEQ) oor kognitiewe uitkomste te kombineer. Die nuwe maatstaf, genaamd ‘toegang-tot-geletterdheid’ en ‘toegang-tot-syfervaardigheid’, word in hoofstuk 4 vir al die lande en subgroepe opgestel. Die metode word dan in hoofstuk 5 gebruik om toegang-tot-leergeleenthede te vergelyk oor ʼn periode waartydens skooltoegang verbreed het (2000-2007). Daar was ʼn verbetering in toegang tot geletterdheid en syfervaardigheid in alle lande, teenstrydig met die wyd-gehuldigde siening dat daar altyd ʼn afruiling tussen toegang en gehalte van onderwys bestaan. In besonder word bevind dat meisies sowel as kinders uit arm huishoudings die meeste by die toename in toegang tot geletterdheid en syfervaardigheid gebaat het.
Die gevolgtrekking is dat die vervulling van die potensiaal van kinders in die ontwikkelende wêreld vereis dat die verbreding van fisiese toegang tot skole met beduidende leergeleenthede gepaard moet gaan. Die aanleer van kennis, vaardighede en waardes moet die sentrale doel van die uitbreiding van onderwysgeleenthede wees.
7
TABLE OF CONTENTS
THE QUALITY OF EDUCATION IN SOUTH AFRICA AND SUB-SAHARAN AFRICA ................................ 1
DECLARATION ......................................................................................................................................... 2
ABSTRACT .............................................................................................................................................. 5
TABLE OF CONTENTS................................................................................................................................ 7
LIST OF FIGURES .................................................................................................................................... 10
LIST OF TABLES ..................................................................................................................................... 12
CHAPTER 1: INTRODUCTION AND BACKGROUND ........................................................................ 16
1.1 THESIS STRUCTURE ....................................................................................................................... 19
1.2 BACKGROUND TO SOUTH AFRICAN EDUCATION ................................................................................. 20
1.3 SOUTH AFRICA: A NATION DIVIDED ................................................................................................. 22
1.4 BIMODALITY ................................................................................................................................ 26
1.5 IMPLICATIONS OF A DUALISTIC EDUCATION SYSTEM ............................................................................ 31
1.5.1 Descriptive and Reporting purposes ................................................................................. 31
1.5.2 Research purposes ............................................................................................................ 32
CHAPTER 2: THE CASE OF INSURMOUNTABLE LEARNING DEFICITS IN MATHEMATICS .................. 34
2.1 INTRODUCTION ............................................................................................................................ 34
2.2 BACKGROUND ............................................................................................................................. 35
2.3 DATA ......................................................................................................................................... 38
2.3.1 Systemic Evaluation – grade 3 (2007) ............................................................................... 38
2.3.2 National School Effectiveness Study (NSES) – grade 3 (2007), grade 4 (2008), grade 5
(2009)... ......................................................................................................................................... 38
2.3.3 Southern and Eastern African Consortium for Monitoring Educational Quality (SACMEQ)
– grade 6 (2007) ............................................................................................................................ 39
2.3.4 The Trends in International Mathematics and Science Study (TIMSS) – grade 9 (2011) .. 39
2.4 LEARNING DEFICITS ...................................................................................................................... 40
2.4.1 The South African case ...................................................................................................... 40
2.4.2 Learning deficits in grades 3, 4 and 5 ............................................................................... 43
2.5 MOVING FROM LEARNING DEFICITS TO LEARNING TRAJECTORIES .......................................................... 47
2.6 CONCLUSION ............................................................................................................................... 58

8
CHAPTER 3: HOW LARGE DOES LANGUAGE LOOM FOR LEARNERS’ LITERACY AND NUMERACY
PERFORMANCE IN GRADE THREE IN SOUTH AFRICA .................................................................... 63
3.1 INTRODUCTION ............................................................................................................................ 63
3.2 LITERATURE REVIEW AND BACKGROUND .......................................................................................... 64
3.3 CAVEATS AND EXTENSION .............................................................................................................. 69
3.4 LANGUAGE IN EDUCATION IN SOUTH AFRICA .................................................................................... 71
3.5 DATA AND IDENTIFICATION STRATEGY .............................................................................................. 73
3.5.1 Matching students across tests ........................................................................................ 75
3.5.2 Data structure ................................................................................................................... 78
3.5.3 Difference-in-difference analysis ...................................................................................... 79
3.6 BACKGROUND INFORMATION ON THE TEST INSTRUMENTS ................................................................... 80
3.6.1 Literacy test....................................................................................................................... 81
3.6.2 Numeracy test ................................................................................................................... 82
3.6.3 Identifying home language ............................................................................................... 83
3.7 FINDINGS .................................................................................................................................... 84
3.7.1 Language results and literacy processes .......................................................................... 84
3.7.2 Numeracy results and language-content ......................................................................... 91
3.7.3 Summary of findings and robustness checks .................................................................... 95
3.7.4 Limitations and caveats .................................................................................................... 97
3.8 SUMMARY AND CONCLUSION ......................................................................................................... 98
CHAPTER 4: ACCESS TO WHAT? CREATING A COMPOSITE MEASURE OF EDUCATIONAL ACCESS AND
EDUCATIONAL QUALITY FOR 11 AFRICAN COUNTRIES ............................................................... 101
4.1 INTRODUCTION AND RESEARCH QUESTION ...................................................................................... 101
4.2 ACCESS AND QUALITY: THE EXTANT LITERATURE .............................................................................. 102
4.3 DATA ....................................................................................................................................... 106
4.4 METHOD .................................................................................................................................. 110
4.4.1 Sub-national differences ................................................................................................. 122
4.5 DISCUSSION .............................................................................................................................. 129
4.6 ACCESS, QUALITY AND THE POST-2015 MILLENNIUM DEVELOPMENT GOALS ....................................... 138
4.7 CONCLUSION ............................................................................................................................. 139
CHAPTER 5: MEASURING ACCESS TO LEARNING OVER A PERIOD OF INCREASED ACCESS TO
SCHOOLING: THE CASE OF SOUTHERN AND EASTERN AFRICA 2000-2007 ................................... 141
5.1 INTRODUCTION .......................................................................................................................... 141
5.2 DATA AND METHODOLOGY .......................................................................................................... 144

9
5.2.1 Data on educational achievement .................................................................................. 144
5.2.2 Data on access (grade 6 completion) ............................................................................. 147
5.3 EMPIRICAL FINDINGS: ACCESS TO LEARNING SINCE 2000 .................................................................. 150
5.3.1 Country access-to-literacy and access-to-numeracy rates in 2000 and 2007 ................ 151
5.3.2 Access-to-literacy and access-to-numeracy by gender ................................................... 156
5.3.3 Access-to-literacy and access-to-numeracy by household wealth ................................. 158
5.4 EXTENSIONS .............................................................................................................................. 160
5.4.1 Access to higher order literacy and numeracy ................................................................ 160
5.4.2 Completion of higher levels of schooling ........................................................................ 161
5.4.3 Measuring access to learning using administrative data ............................................... 163
5.4.4 Changes in social composition ........................................................................................ 165
5.4.5 School resources ............................................................................................................. 166
5.5 CONCLUSION ............................................................................................................................. 169
CHAPTER 6: CONCLUSION ......................................................................................................... 172
6.1 SUMMARY OF MAIN FINDINGS ...................................................................................................... 172
REFERENCES ............................................................................................................................ 176
APPENDIX A: CHAPTER 2 ...................................................................................................................... 190
APPENDIX B: CHAPTER 3 ...................................................................................................................... 193
APPENDIX C: CHAPTER 4 ...................................................................................................................... 194
APPENDIX D1: CHAPTER 5 .................................................................................................................... 196
APPENDIX D2: CHAPTER 5 CONT. ........................................................................................................... 198
D2.1 Enrolment profiles by age circa 2003 for countries and sub-groups .................................. 198
D2.2 Enrolment profiles by age circa 2010 for countries and sub-groups .................................. 220
APPENDIX D3: CHAPTER 5 GRAPH APPENDIX ............................................................................................ 242
D3.1 Access to literacy graphs .................................................................................................... 242
D3.2 Access to numeracy ............................................................................................................ 253
APPENDIX D4: CHAPTER 5 SUPPLEMENTARY TABLES ................................................................................. 264

10
LIST OF FIGURES
FIGURE 1: READING PERFORMANCE IN SACMEQ III (2007) AND THE IMPACT OF SOCIOECONOMIC BACKGROUND ...................... 25
FIGURE 2: MATHEMATICS PERFORMANCE IN SACMEQ III (2007) AND THE IMPACT OF SOCIOECONOMIC BACKGROUND .............. 25
FIGURE 3: DISTRIBUTION OF GRADE 6 READING PERFORMANCE BY SCHOOL WEALTH QUARTILE (DATA: SACMEQ 2007) .............. 25
FIGURE 4: DISTRIBUTION OF GRADE 5 LITERACY PERFORMANCE BY LANGUAGE OF SCHOOL (DATA: PIRLS 2006), SOURCE: SHEPHERD
(2011) .......................................................................................................................................................... 25
FIGURE 5: DISTRIBUTION OF GRADE 4 NUMERACY PERFORMANCE BY HISTORICAL EDUCATION DEPARTMENT (DATA: NSES 2007/8/9)
SOURCE: TAYLOR (2011) ................................................................................................................................... 26
FIGURE 6: KERNEL DENSITY OF MEAN GRADE 3 PERFORMANCE ON GRADE 3 LEVEL ITEMS FOR QUINTILE 1-4 (POOREST 80% OF
STUDENTS) AND QUINTILE 5 (WEALTHIEST 20% OF STUDENTS) (SYSTEMIC EVALUATION 2007) ....................................... 42
FIGURE 7: NSES GRADE 3 (PANEL 1) AND GRADE 5 (PANEL 2) PERFORMANCE ON NO-LANGUAGE ITEMS BY QUINTILE OF STUDENT
SOCIOECONOMIC STATUS (WEIGHTED AND OVERLAYED - FULL SAMPLE) ....................................................................... 45
FIGURE 8: NATIONAL SCHOOL EFFECTIVENESS STUDY - PROPORTION OF STUDENTS ANSWERING THE ITEM CORRECTLY BY GRADE AND
QUINTILE OF STUDENT SOCIOECONOMIC STATUS (NSES QUESTION 21) ....................................................................... 46
FIGURE 9: NATIONAL SCHOOL EFFECTIVENESS STUDY - PROPORTION OF STUDENTS ANSWERING THE ITEM CORRECTLY BY GRADE AND
QUINTILE OF STUDENT SOCIOECONOMIC STATUS (NSES QUESTION 42) ....................................................................... 47
FIGURE 10: SOUTH AFRICAN MATHEMATICS LEARNING TRAJECTORIES BY NATIONAL SOCIOECONOMIC QUINTILES (BASED ON NSES
2007/8/9 FOR GRADES 3/4/5, SACMEQ 2007 FOR GRADE 6 AND TIMSS 2011 FOR GRADE 9, INCLUDING 95%
CONFIDENCE INTERVAL) ...................................................................................................................................... 56
FIGURE 11: BREAKDOWN OF LANGUAGE OF LEARNING AND TEACHING (LOLT) BY GRADE - ANNUAL NATIONAL ASSESSMENTS 2013
(N=7,630,240, OWN CALCULATIONS USING ‘LOA_LANG’) ....................................................................................... 71
FIGURE 12: AVERAGE PERFORMANCE (%) IN TEST 1 (SYSTEMIC EVALUATION) AND TEST 2 (NSES) BY LITERACY PROCESS FOR
STUDENTS WHOSE HOME LANGUAGE IS NOT ENGLISH (N=2811) ................................................................................ 88
FIGURE 13: AVERAGE PERFORMANCE (%) IN TEST 1 (SYSTEMIC EVALUATION) AND TEST 2 (NSES) BY LITERACY PROCESS FOR
STUDENTS WHOSE HOME LANGUAGE IS ENGLISH (N=132) ........................................................................................ 88
FIGURE 14: BOXPLOTS OF STUDENT SOCIOECONOMIC STATUS BY COUNTRY (SACMEQ 2007) DIAMOND REPRESENTS THE MEDIAN
................................................................................................................................................................... 110
FIGURE 15: PROPORTION OF 19-23 YEAR OLDS IN EACH COUNTRY BY ENROLMENT STATUS AND LITERACY PROFICIENCY ............... 117
FIGURE 16: PROPORTION OF 19-23 YEAR OLDS IN EACH COUNTRY BY ENROLMENT STATUS AND NUMERACY PROFICIENCY............ 118
FIGURE 17: GAPS IN ACCESS-TO-LITERACY RATES BY GENDER, GENDER-WEALTH INTERACTION, AND WEALTH WITH 95% CONFIDENCE
INTERVALS ..................................................................................................................................................... 132
FIGURE 18: GAPS IN ACCESS-TO-NUMERACY RATES BY GENDER, GENDER-WEALTH INTERACTION, AND WEALTH WITH 95%
CONFIDENCE INTERVAL ..................................................................................................................................... 132
FIGURE 19: ACCESS TO LITERACY RATES FOR MOZAMBICAN SUB-GROUPS (DHS 2011, SACMEQ 2007) ................................ 134
FIGURE 20: STACKED AREA CHART FOR ENROLMENT STATUS BY AGE FOR LESOTHO DHS 2009, POOREST 40% OF BOYS .............. 128
FIGURE 21: STACKED AREA CHART FOR ENROLMENT STATUS BY AGE FOR LESOTHO DHS 2009, POOREST 40% OF GIRLS.............. 128
FIGURE 22: ACCESS TO LITERACY FOR LESOTHO 19-23 YEAR OLD SUB-GROUPS (DHS 2009, SACMEQ 2007) ........................ 136

11
FIGURE 23: GRADE 6 COMPLETION DIFFERENTIAL (ACCESS) AND NUMERACY AND LITERACY DIFFERENTIAL (QUALITY) BETWEEN RICHEST
20% AND POOREST 40% OF STUDENTS WITH 95% CONFIDENCE INTERVAL (ALL CALCULATIONS ARE RICHEST 20% MINUS
POOREST 40%) .............................................................................................................................................. 138
FIGURE 24: ACCESS-TO-LITERACY RATES IN 2000 AND 2007 ........................................................................................... 151
FIGURE 25: ACCESS-TO-NUMERACY RATES IN 2000 AND 2007 ........................................................................................ 152
FIGURE 26: ACCESS TO SCHOOLING AND ACCESS TO LITERACY OVER TIME ........................................................................... 153
FIGURE 27: ACCESS TO SCHOOLING AND ACCESS TO NUMERACY OVER TIME ........................................................................ 154
FIGURE 28: NUMBERS OF GRADE 6 PUPILS ACHIEVING AT VARIOUS PERFORMANCE LEVELS IN LITERACY IN MOZAMBIQUE IN 2000 AND
2007 ........................................................................................................................................................... 156
FIGURE 29: GENDER PARITY INDEX WITH RESPECT TO ACCESS-TO-LITERACY IN 2000 AND 2007 ............................................ 157
FIGURE 30: GENDER PARITY INDEX WITH RESPECT TO ACCESS-TO-NUMERACY IN 2000 AND 2007 ......................................... 157
FIGURE 31: ACCESS TO HIGHER LITERACY IN 2000 AND 2007 .......................................................................................... 161
FIGURE 32: ACCESS TO HIGHER NUMERACY IN 2000 AND 2007 ....................................................................................... 161
FIGURE 33: MEAN READING ACHIEVEMENT BY MOTHER'S EDUCATION IN 2000 AND 2007 (WITH 95% CONFIDENCE INTERVALS) . 169

12
LIST OF TABLES
TABLE 1: DISTRIBUTION OF VARIOUS SCHOOLING STATISTICS ACROSS SCHOOL WEALTH QUARTILES (GRADE 6 - SACMEQ 2007 OWN
CALCULATIONS) ................................................................................................................................................ 30
TABLE 2: PROPORTION OF GRADE 3 STUDENTS PERFORMING AT THE GRADE 3 LEVEL BY PROVINCE AND STUDENT SOCIOECONOMIC
QUINTILE (SYSTEMIC EVALUATION 2007) ............................................................................................................. 42
TABLE 3: QUANTIFICATION OF A YEAR'S WORTH OF LEARNING IN SOUTH AFRICA (NSES 2007/8/9 TIMSS 2002) ..................... 51
TABLE 4: FACTORS RELATED TO LANGUAGE OF LEARNING AND TEACHING (LOLT) AND STUDENT PERFORMANCE ON ASSESSMENTS . 66
TABLE 5: VORSTER ET AL'S (2013: P. 150) COMPARISON BETWEEN THE MATCHED (SE AND NSES) AND UNMATCHED (NSES ONLY)
SAMPLES (REPRODUCED VERBATIM) ...................................................................................................................... 76
TABLE 6: LITERACY AND NUMERACY SCORES FOR GRADE 3 STUDENTS IN THE SYSTEMIC EVALUATION AND NSES BY UNIQUELY
IDENTIFIED INDIVIDUALS AND DUPLICATES .............................................................................................................. 77
TABLE 7: AVERAGE STUDENT PERFORMANCE IN NUMERACY AND LITERACY IN THE SYSTEMIC EVALUATION AND THE NSES BY MATCHED
AND UNMATCHED SAMPLES ................................................................................................................................. 78
TABLE 8: DISTRIBUTION OF LITERACY TEST ITEMS IN TEST 1 AND TEST 2 ACCORDING TO TEXT TYPE AND LITERACY PROCESS (SOURCE:
VORSTER ET AL, 2013, P. 33) ............................................................................................................................. 82
TABLE 9: DISTRIBUTION OF ITEMS IN TEST 1 AND TEST 2 GRADE 3 NUMERACY TEST BY GRADE-LEVEL AND LANGUAGE-CONTENT ..... 83
TABLE 10: TOTAL NUMBER OF STUDENTS MATCHED CONSISTENTLY ON HOME-LANGUAGE VARIABLE BETWEEN SYSTEMIC EVALUATION
AND NSES....................................................................................................................................................... 84
TABLE 11: AVERAGE PERFORMANCE (%) BY LITERACY PROCESS IN TEST 1 (SYSTEMIC EVALUATION) AND TEST 2 (NSES) FOR
STUDENTS WHOSE HOME LANGUAGE IS AND IS NOT ENGLISH [STANDARD ERRORS CLUSTERED AT THE INDIVIDUAL LEVEL]. ...... 87
TABLE 12: AVERAGE LITERACY SCORE (%) BY QUESTION FORMAT BETWEEN TEST 1 (SYSTEMIC EVALUATION) AND TEST 2 (NSES) FOR
STUDENTS WHOSE HOME LANGUAGE IS NOT ENGLISH AND THOSE FOR WHOM IT IS [STANDARD ERRORS CLUSTERED AT THE
INDIVIDUAL LEVEL] ............................................................................................................................................ 91
TABLE 13: AVERAGE NUMERACY PERFORMANCE (%) BY LANGUAGE-CONTENT IN TEST 1 (SYSTEMIC EVALUATION) AND TEST 2 (NSES)
FOR STUDENTS WHOSE HOME LANGAUGE IS NOT ENGLISH [STANDARD ERRORS CLUSTERED AT THE INDIVIDUAL LEVEL] ........... 95
TABLE 14: SIZE OF VARIOUS "EFFECTS" IN STANDARD DEVIATIONS FOR STUDENTS WHOSE HOME LANGAUGE IS NOT ENGLISH .......... 96
TABLE 15: COMPARISON BETWEEN ENROLMENT AND COMPLETION RATES FOR 15-19 YEAR OLDS AND 19-21 YEAR OLDS IN FOUR
COUNTRIES (USING THE SAME DHS DATA AS PRITCHETT, 2013) .............................................................................. 114
TABLE 16: DEMOGRAPHIC AND HEALTH SURVEY (DHS) GRADE 6 COMPLETION RATE FOR 19-23 YEAR OLDS [M=MALE; F=FEMALE]
................................................................................................................................................................... 119
TABLE 17: PROPORTION OF SACMEQ 2007 SAMPLE THAT ARE LITERATE (SACMEQ LEVEL 3+) (NOT CORRECTED FOR THOSE WHO
DO NOT COMPLETE GRADE 6) ............................................................................................................................ 120
TABLE 18: PROPORTION OF THE SACMEQ 2007 SAMPLE THAT ARE NUMERATE (SACMEQ LEVEL 3+) ( NOT CORRECTED FOR THOSE
WHO DO NOT COMPLETE GRADE 6) ..................................................................................................................... 121
TABLE 19: ACCESS-TO-LITERACY RATES FOR 19-23 YEAR OLDS BY SUB-GROUPS - COMBINING SACMEQ AND DHS ................... 126
TABLE 20: ACCESS-TO-NUMERACY RATES FOR 19-23 YEAR OLDS BY SUB-GROUPS - COMBINING SACMEQ AND DHS ................ 127

13
TABLE 21: PROPORTION OF 19-23 YEAR OLDS WHO NEVER ENROLLED IN SCHOOL FROM THE DEMOGRAPHIC AND HEALTH SURVEY
(DHS) .......................................................................................................................................................... 128
TABLE 22: COUNTRY AVERAGE SCORES, PROPORTION OF GRADE 6 CHILDREN FUNCTIONALLY LITERATE AND FUNCTIONALLY NUMERATE
IN 2000 AND 2007 ........................................................................................................................................ 146
TABLE 23: PROPORTION OF CHILDREN ENROLLED IN GRADES 1 TO 6 BY AGE FOR EACH COUNTRY ............................................. 148
TABLE 24: GRADE 6 COMPLETION RATES AROUND 2003 AND AROUND 2010 (19-23 YEAR-OLDS) ......................................... 149
TABLE 25: ACCESS-TO-LITERACY RATES BY SOCIOECONOMIC STATUS IN 2000 AND 2007 ...................................................... 159
TABLE 26: ACCESS-TO-NUMERACY RATES BY SOCIOECONOMIC STATUS IN 2000 AND 2007 ................................................... 159
TABLE 27: GRADE 9 COMPLETION RATES AROUND 2003 AND AROUND 2010 (22-24 YEAR OLDS) ......................................... 163
TABLE 28: PROPORTION OF MOTHERS WITH AT LEAST COMPLETE SECONDARY EDUCATION (SACMEQ) .................................... 165
TABLE 29: SELECTED SCHOOL INPUTS IN 2000 AND 2007 ............................................................................................... 167

14
List of abbreviations
ANA Annual National Assessment
DBE Department of Basic Education
ECD Early Childhood Development
EFA Education For All
DET Department of Education and Training
DHS Demographic and Health Survey
EMIS Education Management Information System
FAL First Additional Language
FR Free Response
GER Gross Enrolment Rate
GHS General Household Survey
GPI Gender Parity Index
IEA International Association for the Evaluation of Educational
Achievement
LOLT Language of Learning and Teaching
MC Multiple Choice
MDG Millennium Development Goals
NAR Net Attendance Rate
NCS National Curriculum Statement
NER Net Enrolment Rate
NGO Non-Governmental Organization
NSES National School Effectiveness Study
PASEC Programme d’Analyse des Systèmes Educatifs de la CONFEMEN
PCA Principal Component Analysis
PIRLS Progress in International Reading Literacy Study
SACMEQ Southern and Eastern African Consortium for Monitoring
Educational Quality
SE Systemic Evaluation
SES Socioeconomic Status
SERCE Segundo Estudio Regional Comparativo y Explicativo
TIMSS Trends in International Mathematics and Science Study
Wealth groups
o Poor40 Poorest 40% of the distribution
o Mid40 Middle 40% of the distribution
o Rich20 Richest 20% of the distribution
o Poor40M Poorest 40% of boys in the distribution of boys
o Poor40F Poorest 40% of girls in the distribution of girls

15
Acknowledgements
In many ways the completion of this thesis is one of the more prominent milestones in a
career of research, teaching and policy-analysis. Before I came to Stellenbosch I knew very
little about education, or socioeconomic policy, and yet as I look to the future I cannot
imagine myself doing something outside of the broad field of education. This is largely
thanks to professor Servaas van der Berg and his team of researcher-colleagues. I owe an
enormous debt of gratitude to Prof Van der Berg - I could not have asked for a better
supervisor or mentor. Over the last five years he has taught me, both in the classroom and
out, almost everything I know about education, social policy and research more generally.
He is approachable, discerning, generous, good-natured, wise, patient and kind. I also want
to thank all the researchers at ReSEP and the lecturers in the Economics Department who
made me feel welcome and taught me all the things that I now find myself teaching others.
Parts of the research presented in this thesis originated as joint work with my friends and
colleagues Janeli Viljoen and particularly with Stephen Taylor. Thank you for your
suggestions, comments and for putting up with the numerous rounds of back-and-forth that
were always inevitable. The research presented in this thesis has benefitted greatly from the
inputs of various people, including that of Ronelle Burger, Martin Gustafsson, Lant Pritchett,
Luis Crouch and especially Servaas van der Berg who read and commented on numerous
versions of the papers that now make up this thesis. Thanks also to the four anonymous
reviewers from Comparative Education Review who commented extensively on the article
versions of Chapters 4 – the method and results are much improved thanks to their detailed
comments and insight into education in Sub-Saharan Africa. It has been an extremely
rewarding process to nurture research ideas from inception to publication, a process that
was facilitated and expedited by many of those mentioned above. Thank you to the
numerous researchers and research organizations that collected and cleaned the data that I
have used in this thesis. Without their pain-staking (and often thankless) work, this kind of
research would not be possible. Thank you. Thank you.
Thank you to the Deutcher Akademischer Austausch Dienst (DAAD) who provided part
funding for my Masters degree and now my PhD. Thanks also to Servaas van der Berg who
provided additional financial support. Not having to worry about finances while studying is a
luxury afforded to few people in South Africa and I am grateful to be one of them.
To my family and friends, thank you for being there for me, for giving me perspective, for
loving me, for travelling with me, and for putting up with me – I love you all. Thank you Dad
for proofreading my final draft, and for all the years of linguistic punctiliousness.

16
CHAPTER 1: INTRODUCTION AND BACKGROUND
Education occupies a pre-eminent role in the disciplines of sociology, anthropology,
economics, philosophy and psychology, and particularly so in their sub-fields focussing on
development, modernization and social stratification. In the discipline of economics,
numerous authors have stressed the economic benefits of education, both to the individual
and to society at large. This is understandable since skills and education have always
featured in the theoretical constructs of economics and, more recently, in their empirical
applications. For example, if one agrees that the discipline of economics was born with the
publication of Adam Smith’s ‘The Wealth of Nations’, then the notion of labour quality (i.e.
human capital) has been present in nascent form since the inception of the discipline. As
early as 1776, Smith had already identified that the quality of labour should be seen in the
same way as that of traditional capital:
“The improved dexterity of a workman may be considered in the same light as a
machine or instrument of trade which facilitates and abridges labour, and which,
though it costs a certain expense, repays that expense with a profit” (Smith,
1776, p. 166).
Slightly over a decade later, Alfred Marshall (1890, p. 115) also illustrated that his
understanding of capital included what we now term human capital: “Capital consists in a
great part of knowledge and organisation…Knowledge is our most powerful engine of
production; it enables us to subdue Nature and force her to satisfy our wants.”
Although ideas of skills, training and education were regularly included in the thinking of
economists during the 19th century, it was only in the middle of the 20th century that
American economists created the theory of Human Capital and operationalized it in empirical
analyses. The work of Mincer (1958), Schultz (1961) and particularly that of Becker (1962),
pioneered a new field of economics and significantly expanded the borders of what counted
as economics.
While it is true that economists increasingly tried to incorporate new and different measures
of education into their analyses, it is also true that these measures were particularly
inadequate and required unreasonably stringent assumptions. Most economists used
enrolment ratios, primary or secondary completion rates, educational expenditure or some
combination thereof. However this assumes that a year of education (or primary school
completion) in Japan is equivalent to a year of education (or primary school completion) in
Peru or Mali or Mongolia, for example. This is an obviously untrue assumption with large

17
confounding potential. These limitations were usually not unacknowledged by authors, they
were rather stated but left unexplored. Already in 1976 Blaug speaks about the “unresolved
problem” in rate of return studies and explains that “students choose, not just schooling, but
schooling of a certain type and quality, and few rate-of-return calculations have succeeded in
successfully standardizing the calculated yields for quality of educational institutions” (Blaug,
1976, p. 841). This was the case throughout the second half of the 20th century, and it was
only in 2000 that the quality problem began to be addressed using an approach that was
more theoretically and empirically legitimate.
The first substantial study to incorporate a measure of education quality was that of
Hanushek and Kimko (2000) who developed indices of educational quality for 38 countries
using cross-national tests of educational achievement in mathematics and science between
1965 and 1991. By using a direct measure of cognitive outcomes that was comparable
across countries and over time, Hanushek and Kimko began to solve one of the major
problems that had been plaguing economics for 40 years. Other researchers subsequently
built on these findings and expanded the number of countries under review (Bosworth and
Collins, 2003; Ciccone and Papaioannou, 2009). Perhaps the single best summary of this
new approach is the seminal article by Hanushek and Wößmann (2008) titled “The Role of
Cognitive Skills in Economic Development.” Here they show that when trying to explain
economic growth using a model of income and years of schooling, the share of the variation
in economic growth explained by the model jumps from 0,25 to 0,73 when cognitive skills are
added to the model. (Importantly, the coefficient on years of education is no longer
statistically significant).
In a very real sense, one can see distinct research programmes before and after the pivotal
work of Hanushek and Kimko/Wößmann in the early 2000’s. Where pre-2000 research
focussed on the quantity of education, the most influential economic research on education
post-2000 has prioritized and privileged the notion of quality. Incorporating measures of
educational quality has greatly increased our understanding of the relative contribution of
education quality (as proxied by test scores) to economic growth. It has also forced
economists to re-evaluate and ultimately change their assumptions and interpretations of
purely quantitative proxies of education. The research of Hanushek and his co-authors
shows all too clearly that there are significant gains to be had from incorporating education
research into economics and from applying the methods and habitus of economics to the
field of education. By using this inter-disciplinary approach, the research presented in this
thesis aims to contribute to the education-quality debates in both fields.

18
This distinction between quantity and quality, or access and learning, is one of the motifs
that runs throughout my thesis. Indeed, the method of combining educational quantity and
quality that is developed in Chapter 4, and applied in Chapter 5, is arguably the main
contribution of my research. In the process of surveying the economic and educational
literatures on education quality it became apparent that authors in both fields make important
assumptions that are simply untrue, and can be shown to be untrue. On the one hand
educationists frequently make claims about causality and generalize their findings to large
populations without any discussion about endogeneity, external validity or sample size -
something I take issue with in Chapter 3 with respect to language research in South Africa.
On the other hand, economists frequently make unfounded assumptions about schooling in
Sub-Saharan Africa that are empirically unfounded. In their quest to include in their analyses
as many countries as possible they typically brush over regional peculiarities and use
statistics such as Net Enrolment Rates which are widely reported and readily available, but
also highly suspect, as is illustrated in Chapter 4. Furthermore, even if one looks to the most
prolific and influential economists in the field (Filmer, 2010; Hanushek and Wößmann, 2008;
Pritchett, 2013), all of them make assumptions about age-for-grade progression and late-
completion that have little bearing in reality, at least not in sub-Saharan Africa (according to
DHS data). These assumptions are non-trivial and lead to findings that substantially
underestimate grade completion in more than a few countries in Africa.
Lastly, researchers who use cross-national data on educational achievement (both
educationists and economists) almost never take into account how non-enrolment, late
entry, grade repetition and dropout affect the samples’ representivity. While 95% of a cohort
of South African children will complete grade 6, only 53% of a Mozambican cohort will do so.
If one simply compares the unadjusted average test scores of Mozambican and South
African grade 6 children – as many researchers do - the picture will be necessarily
misleading. In Chapter 4 and Chapter 5 I present one way of taking these differentials into
account, differentials that are particularly important in Sub-Saharan Africa.
Thus the central aim of this thesis is to add to the existing body of knowledge that is broadly
related to the quality of education in South Africa and sub-Saharan Africa. By using some of
the econometric methods and approaches typically employed in economics I am able to
contribute to the educational literature on learning deficits in mathematics (Chapter 2) and
the impact of language on performance (Chapter 3). By giving sufficient attention to
concerns that are the mainstays of economic research – notably sample selection,
endogeneity, external validity, and causality – I am able to shed light on South African

19
problems that were previously un(der)-analysed. Furthermore, by identifying regional
peculiarities and adjusting assumptions and analyses in light of them, I show that there is far
less empirical support for the commonly held notion that there was an access-quality trade-
off in Sub-Saharan Africa between 2000 and 2007. Ultimately I argue that we need to be
more nuanced in our discussions about access and quality and engage more meaningfully
with the data that can answer the kinds of questions we are asking.
1.1 THESIS STRUCTURE
The central motif that runs through most of my thesis is that the quality of education must
become the central focus of education policy and research in South Africa, and indeed
throughout Sub-Saharan Africa. Using a variety of different datasets and methodologies, and
analysing a number of different - but interconnected - topics my aim is to show that focussing
on the over-arching goal of improving the quality of education in Africa is supported by the
empirical evidence and is one of the most judicious uses of limited human and physical
resources.
The thesis begins by focussing on the South African case and highlighting three broad
issues that characterise education in the country: (1) inequality - Chapter 1, (2) cumulative
learning deficits - Chapter 2, and (3) language and performance – Chapter 3. The first is
addressed in the remainder of this chapter and explains how and why South Africa is a
nation divided. Given the political history of colonisation and then apartheid, it is not possible
to speak of South Africa without also speaking about inequality. When looking specifically at
education one can see two distinct public education systems that operate quite differently to
each other and produce vastly different outcomes. After establishing this fact and elucidating
some of the implications arising from it, Chapter 2 explores the second characteristic feature
of insurmountable learning deficits in mathematics in South Africa.
It is now well acknowledged that irrespective of which grade one chooses to assess, the vast
majority of South African children are well behind as far as the curriculum is concerned, and
perhaps more importantly, have not reached most of the local and international age-
appropriate educational benchmarks. Yet most of the research in the field of educational
backlogs in South Africa is either qualitative, empirically unsophisticated, or cross-sectional
in nature. All of these limitations make it difficult to determine whether learning deficits in
South Africa grow, shrink or remain unchanged as students progress through school.
Answering this last question is the aim of Chapter 2.

20
The focus then shifts to the complex issue of language and performance, which is addressed
in Chapter 3. Here the aim is to exploit an unusual occurrence whereby a large group of
South African students were tested twice, one month apart, with the first test being
administered in the language-of-learning-and-teaching (LOLT) of the school in grade 3
(usually an African language) and the second test being administered in English. Using a
simplified difference-in-difference methodology it becomes possible to identify the causal
impact of writing a test in English when English is not a student’s home language. The
chapter concludes by framing the analysis within the broader language debate in South
Africa and specifically the extent to which language factors (relative to non-language factors)
can explain the high levels of underperformance in South Africa.
The remaining chapters in the thesis (Chapter 4 and Chapter 5) widen the remit of analysis
and move beyond South Africa to look at 11 countries in Sub-Saharan Africa. The quality of
education remains the focus of the research but is now analysed and discussed in relation to
educational access (enrolment and grade survival). Chapter 4 situates the ‘access-quality’
discussion and develops a new composite measure encompassing both education quantity
(grade survival) and quality (learning outcomes), what I refer to as access-to-literacy and
access-to-numeracy. The chapter concludes by using the new method and reporting
differences in access-to-learning by important sub-groups for each country.
Chapter 5 extends the analysis presented in the previous chapter by adding an inter-
temporal element to the analysis. This is in contrast to Chapter 4, which reported the new
statistic for only one point in time (2007). Doing so allows me to show how access-to-
learning has changed over a period of increased access (2000 to 2007) for 10 countries in
Sub-Saharan Africa and ultimately show that the traditional idea that there is a strong
access-quality trade-off has less empirical support than was previously thought to be the
case. Chapter 6 concludes.
1.2 BACKGROUND TO SOUTH AFRICAN EDUCATION
Preamble to the South African Schools Act (South Africa, 1996):
“This country requires a new national system for schools which will redress past
injustices in educational provision, provide an education of progressively high
quality for all learners and in so doing lay a strong foundation for the development
of all our people’s talents and capabilities, advance the democratic transformation
of society, combat racism and sexism and all other forms of unfair discrimination
and intolerance, contribute to the eradication of poverty and the economic well-
being of society…”

21
In the years following the political transition in South Africa, the most important item on the
national agenda was the social, economic and political integration of all South African
people, particularly those marginalized under apartheid. After decades of systematic
segregation and legislated racial exclusivity, the post-apartheid government faced the
mammoth task of expanding service delivery, reducing widespread unemployment, and
facilitating economic growth. As a means to this end, and to promote social cohesion,
education was prioritized as an area for expansion and reform. Under apartheid there were
multiple racially defined departments of education, each of which provided very different
types and qualities of education based on the perceived role of that race-group in the
apartheid society (Fiske and Ladd, 2004). Given the centrality of education to the inculcation
and maintenance of the apartheid ideology, it is unsurprising that this area of social policy
was highlighted for systemic reform in the post-apartheid years.
However, while there was a sharp break in political ideology between the pre and post
apartheid governments, many of the country’s social institutions, such as schools, continued
to function as they did under apartheid. The racially defined departments were abolished in
favour of nine provincial Departments of Education that operated in collaboration with a
single national Department of Education. This being said, schools were and are still
managed and run at the school-level by principals and, in the new dispensation, also by
school governing bodies. Although the formal schooling institutions of apartheid were
abolished (particularly racial segregation and inferior curricula), the informal schooling
institutions inherent in non-White1 schools remained largely intact. These on-going informal
institutions of disorder, distrust, rebellion, and lack of cooperation have undermined efforts to
create an appropriate culture of teaching and learning in these schools. As the African
National Congress (ANC) noted in 1994,
“Apartheid education and its aftermath of resistance has destroyed the culture of
learning within large sections of our communities, leading in the worst-affected
areas to a virtual breakdown of schooling and conditions of anarchy in relations
between students, teachers, principals, and the education authorities” (ANC,
1994).
Fiske and Ladd (2004, p. 59) further elaborate on this concept and explain that in low
income families there was a “lingering fear of education as an instrument of political
subjugation” in the years following the political transition. Partly as a result of this social
1 The use of race as a form of classification and nomenclature in South Africa is still widespread in the academic literature with
the four largest race groups being Black African, Indian, Coloured (mixed-race) and White. This serves a functional (rather than normative) purpose and any other attempt to refer to these population groups would be cumbersome, impractical or inaccurate.

22
inertia, in combination with a host of other factors, many of the ex-Black schools, which were
entirely dysfunctional under apartheid, remain largely dysfunctional today. They are
characterized by severe underperformance, high grade repetition, high dropout, and high
teacher absenteeism (Fleisch, 2008; Taylor et al., 2003). While many of these factors are
certainly attributable to the socio-economic disadvantage of the students they serve, there is
also an undeniable impact of more intangible elements such as ill discipline, inefficient
management, and low cognitive demand – all legacies of apartheid. This low quality of
education is further accentuated when compared to former ‘Model-C’ schools (ex-White) that
are not dissimilar to schools in developed countries – both in terms of educational inputs and
educational outcomes.
In comparison to some other developing countries, South Africa has a relatively small
percentage of students in private schools (called Independent schools in South Africa). Of
the 12,489,648 students enrolled in 2013, only 531,804 (or 4.3%) were in Independent
schools (DBE, 2013: p1). Of the 425,023 teachers only 33,194 (or 7.8%) were in
Independent schools, and of the 25,720 schools in the country, only 1584 (or 6.2%) were
Independent schools (DBE, 2013: p1).
1.3 SOUTH AFRICA: A NATION DIVIDED
Apartheid, which literally means ‘separateness’ in Afrikaans, aimed to create separate, and
racially homogenous states, each of which would be ruled by its own people. While this aim
was never fully realized, the systematic racial segregation practiced under apartheid, in
conjunction with an overtly white supremacist ideology, has had, and continues to have a
profound impact on the face of South African society. Twenty years after the political
transition, race remains the sharpest distinguishing factor between the haves and the have-
nots, and while the upper-class of society is no longer entirely White - due largely to the slow
emergence of a Black middle class - approximately 90% of the South African poor are Black
(Leibbrandt et al., 2011). The links between affluence and educational quality in South
Africa can partially explain this outcome since the poor receive a far inferior quality of
education when compared to their wealthier counterparts (Van der Berg, 2007). It is now well
established in the literature that the quality and duration of schooling that individuals receive
is directly correlated with their labour-market prospects. Consequently, offering an inferior
quality of education to the poor disadvantages them in the labour market and entrenches
their poverty. What is all the more disconcerting is that this does not refer to a minority of
students, but rather the vast majority of the student population.

23
In the previous decade, South African primary education has been the subject of much
research and debate. Of particular importance are the results of national and international
assessments of student achievement. Internationally, South Africa has participated in three
major cross-national comparisons of primary school student achievement, namely:
SACMEQ2 (2000 and 2007, grade 6), TIMSS (2003 and 2011, grade 8 and 9), and PIRLS
(2006 and 2011, grade 4 and 5), as well as a host of national standardized testing
programmes, the most important of which are the Systemic Evaluations (2001 and 2007,
grade 3), National School Effectiveness Study - NSES (2007-2009, grades 3-5), and most
recently, the Annual National Assessments - ANA (2011-2014, grades 1-6 and 9). All of
these datasets have been analysed by academic researchers, policy-makers and
educational NGO’s yielding a considerable amount of insight3 into the performance of South
African students, and the generative mechanisms behind that performance (Carnoy et al.,
2012; Van der Berg et al., 2011). Unfortunately the picture that emerges time and again is
both dire and consistent: However one measures learner performance, and at whichever
grade one chooses to test, the vast majority of South African primary school learners are
significantly below where they should be in terms of the curriculum, and more generally,
have not reached a host of normal literacy and numeracy milestones.
National averages of 30-35% on tests of numeracy and literacy are the norm for tests
calibrated to measure grade-appropriate performance as a 50% score, and can be seen in
both the NSES (Taylor et al., 2013) and the ANA evaluations (DBE, 2011a). Similarly, South
Africa either has the lowest average score of all developing countries participating in
international assessments (as in TIMSS and PIRLS), or, when the sample is limited to only
Sub-Saharan Africa (as in SACMEQ) performs worse than many other countries which are
considerably poorer, such as Kenya, Swaziland and Tanzania (Hungi et al., 2010).
In addition to low and unequal performance, the South African education system also
exhibits low levels of social mobility (Adato et al., 2006). One way of measuring and
comparing educational inequality and social mobility across countries is to calculate what
proportion of the variation in reading and mathematics achievement is explained by a
student’s socioeconomic background. If a high proportion of the variation in achievement is
explained by family background and socioeconomic status, this means that we can predict
2 SACMEQ – Southern and Eastern African Consortium for Monitoring Educational Quality, TIMSS – Trends in
International Mathematics and Science Study, PIRLS – Progress in International Reading and Literacy Study.
3 The most comprehensive reports for each of these datasets are as follows: SACMEQ (Moloi and Chetty, 2011),
TIMSS (Reddy, 2006), PIRLS (Howie, et al., 2008), Systemic Evaluations (Department of Education, 2008), National School Effectiveness Study (Taylor et al., 2013),and the Annual National Assessments (DBE, 2011a).

24
educational success or failure based largely on non-schooling factors like parental education
and income. Figure 1 and Figure 2 below show this relationship for the fifteen education
systems that took part in SACMEQ 2007. The x-axis shows the proportion of the variation in
student achievement that is explained by an index of asset wealth (whether or not students
had 31 possessions in their homes) and the square of this asset index, mother’s education,
father’s education and the number of books at home – collectively defined as socioeconomic
status. One can see that countries such as Tanzania and Swaziland perform well in that they
have high quality (SACMEQ scores) and high equity (low proportion of variation explained by
socioeconomic status alone). In contrast, South Africa performs slightly below average in
terms of quality, but is the most inequitable country by a large measure. More than 30% of
the variation in student reading and mathematics achievement in South Africa can be
explained by socioeconomic status alone. Many countries both rich (Japan, Finland,
Canada) and poor (Tanzania, Kenya, Swaziland) manage to provide adequate basic
education to most students, not only the rich, and thus they show that “poor performance in
school does not automatically follow from a disadvantaged background” (Schleicher, 2009,
p. 253), as indeed it does in South Africa.
As Schleicher (2010) explains, the strength of the relationship between social background
and educational outcomes is a good indication of how well a country is utilizing its human
capital potential. If the relationship is strong – as it is in South Africa (i.e. socioeconomic
status largely determines outcomes) - this means that a country is wasting a lot of its human
capital potential.

25
FIGURE 1: READING PERFORMANCE IN SACMEQ III (2007) AND THE IMPACT OF SOCIOECONOMIC BACKGROUND
FIGURE 2: MATHEMATICS PERFORMANCE IN SACMEQ III (2007) AND THE IMPACT OF SOCIOECONOMIC
BACKGROUND

26
0
.002
.004
.006
.008
Density
0 200 400 600 800 1000Learner Reading Score
Poorest 25% Second poorest 25%
Second wealthiest 25% Wealthiest 25%
Given the highly unequal nature of the South African education system, averages are
uniquely misleading. It is now commonly accepted that when looking at learner performance
in South Africa there is a minority of learners (roughly 25%) who attend mostly functional
schools and perform acceptably on local and international tests while the majority of learners
(roughly 75%) perform extremely poorly on these tests (Fleisch, 2008). Thus, there is a
bimodal distribution of achievement in the country. As a result, the median reading score
(SACMEQ - 464) is significantly lower than the mean (SACMEQ - 495), that is to say that the
better performing 25% of students raise the extremely low average of the bottom 75%.
Consequently, national averages overestimate the performance of the majority of South
African learners since the distribution is skewed to the right. Because of this, the ‘average’
South African learner does not exist in any meaningful sense. However misleading this
measure is, the national and provincial averages of learner performance remain the most
commonly reported measure of achievement in government and international reports.
1.4 BIMODALITY
The bimodality of South African student performance is impervious to the grade or subject
under assessment or the dataset under analysis. It can be seen as early as Grade 3 (S.
Taylor, 2011), and remains unabated until the national school leaving exam (Van der Berg,
2007). Furthermore, the bimodality of performance can be seen not only when the sample is
split by wealth quartiles (Figure 3 - SACMEQ), but also by school language (Figure 4 -
PIRLS), and former-department (Figure 5 - NSES). This is unsurprising given the strong
correlations between language, socioeconomic status, and current school choice. The fact
that these three figures are drawn from three independently conducted surveys at three
different grades and at three different points in time further illustrates the consistency of the
bimodal distribution in South Africa.
FIGURE 3: DISTRIBUTION OF GRADE 6 READING PERFORMANCE BY SCHOOL WEALTH QUARTILE (DATA:
SACMEQ 2007)

27
Importantly, it is not only student performance that is distributed in this dualistic way, but also
various school level and home-background factors. Observing Table 1 shows that the
wealthiest quartile (25%) of students seems to attend vastly differing schools than the
remaining three quartiles (75%). In top quartile schools students are far more likely to have
their own textbook, receive homework frequently, experience less teacher absenteeism,
repeat fewer grades, live in urban areas, speak English more frequently at home, and have
more educated parents (Table 1). All of these factors are likely to contribute to the better
performance of this school sub-system. It is important to note that there is not a steady
progression in any of these measures from quartiles one to three (as is the case in most
0
.00
1.0
02
.00
3.0
04
.00
5
kden
sity
re
ad
ing te
st s
core
0 200 400 600 800reading test score
African language schools English/Afrikaans schools
0
.005
.01
.015
.02
.025
Den
sity
0 20 40 60 80 100Numeracy score 2008
Ex-DET/Homelands schools Historically white schools
FIGURE 4: DISTRIBUTION OF GRADE 5 LITERACY ACHIEVEMENT BY LANGUAGE OF SCHOOL (DATA:
PIRLS 2006), SOURCE: SHEPHERD (2011)
FIGURE 5: DISTRIBUTION OF GRADE 4 NUMERACY ACHIEVEMENT BY HISTORICAL
EDUCATION DEPARTMENT (DATA: NSES 2007/8/9) SOURCE: TAYLOR (2011)

28
other countries); the poorest three quartiles all have similar levels of grade repetition,
teacher absenteeism, and textbook access.
The main explanation behind the bimodality of the schooling system in South Africa is
twofold: (1) For whatever reason, historically disadvantaged schools remain dysfunctional
and unable to produce student learning, while historically advantaged schools remain
functional and able to impart cognitive skills; (2) The constituencies of these two school
systems are vastly different with the historically Black schools still being racially
homogenous (i.e. Black, despite the abolition of racial segregation) and largely poor; while
the historically White and Indian schools serve a more racially diverse constituency, although
almost all of these students are from middle and upper class backgrounds, irrespective of
race.
It is helpful to provide an overview of the extent of racial transformation in the schooling
system. Using the Annual National Assessments (ANA), a population-wide testing program
implemented in 2011, it becomes possible to do so. Looking at ANA 2012 Grade 6 one can
see that of the 950,459 students in the database, 85.6% where Black, 8.4% were coloured,
1.3% were Indian, 4.2% were White and 0.5% were classified as Other. The racial
breakdown of schools by ex-department is also revealing. Of the 63,353 students in former
White schools (House of Assembly, HOA), 54% were Black, 6.6% were Coloured, 4.1%
were Indian 34.3% were White and 1.1% were Other. That is to say that more than half of
students in former White schools are Black. These formerly ‘White-only’ schools are now
much more representative of the population (although still not fully representative). In
contrast, of the 232,332 students in former Black schools (Department of Education and
Training, DET4) in 2012, 97.5% were Black. If one looks at the racial breakdown of “good”
schools, this shows that Black children also make up the majority in these schools. Of the
87,823 grade 6 students in the best-performing5 10% of schools 46,017 (52.4%) were Black
and 26,494 (30.2%) were White. In contrast, in the worst performing 50% of schools 93%
were Black and 0.08% were White. Importantly those 46,017 Black students in well-
performing schools make up only 6.2% of all Black students in grade 6.
An important recent contribution by Yamauchi (2011) provides one explanation for this
4 Given that there were 18 different education department’s, of which the HOA and DET are only two,
these figures do not sum to the total number of students in the system. However the DET education department had the largest single number of schools (5,483 schools) among the other systems
5 Using the average grade 6 mathematics score for each school to rank them in deciles of
performance.

29
scenario. Using multiple data sources he shows that the spatial segregation policies of
apartheid have had lasting impacts on the inequality of opportunity to quality education.
Black students usually live far from good schools (situated in expensive neighbourhoods),
which make such schools geographically inaccessible, and those same schools usually
charge higher school fees, which makes them financially inaccessible. Consequently, ex-
Black schools have remained Black, while ex-White schools have become more racially
diverse, with wealthier Black, Coloured and Indian students (Soudien, 2004).
The specific reasons for this bimodality are beyond the purview of this chapter; they have
been dealt with elsewhere in the literature (Fleisch, 2008; Gustafsson, 2005; Taylor et al.,
2013; Van der Berg et al., 2011). It is sufficient for the purposes of this chapter to accept that
there is in fact a bimodal distribution of performance in South Africa, and that there are in
fact two types of school systems, largely split along historical-school-system and
socioeconomic lines. This is not a hypothesis, but rather stating one of the consistent
characteristics of education data in South Africa.
There is an important distinction to be made between the South African case and that of
most developed countries. In the latter the ‘dysfunctional’ part of the schooling system
makes up a minority whereas in South Africa this is the vast majority of the schooling
system. Looking at the SACMEQ (2007) Grade 6 data one can see that although the
national average reading score was 495 (SD 116), in the poorest 80% of schools the mean
reading score was only 460 (SD 91). The fact that this represents 80% of the schooling
system and that the standard deviation is 91 means that this ‘dysfunctional’ part of the
schooling system may still contribute a large portion of human capital to the economy. For
example, of the 1825 students that achieved more than 600 on the reading test, 564
students (31%) came from the poorest 80% of schools.
Following on from the preceding discussion on the bimodality of the South African schooling
system, it is worth asking whether the Department of Basic Education in South Africa has
taken sufficient cognizance of this feature of the South African schooling system. Two areas
where it has particular relevance are (1) for descriptive or reporting purposes, and (2) for
prescriptive or policy-making purposes.

30
TABLE 1: DISTRIBUTION OF VARIOUS SCHOOLING STATISTICS ACROSS SCHOOL WEALTH QUARTILES (GRADE 6 - SACMEQ 2007 OWN CALCULATIONS)
Category Variable School Wealth Quartiles
Quartiles relative to national average
1 2 3 4 Total 1 2 3 4 Total
Performance
Reading score 430.5 457.8 474.0 623.7 494.9 -13% -8% -4% 26% 0%
Mathematics score 450.9 467.1 470.7 593.8 494.8 -9% -6% -5% 20% 0%
Proportion functionally illiterate 43.3% 33.3% 25.6% 4.1% 27.3% 59% 22% -6% -85% 0%
Proportion functionally innumerate 56.9% 48.6% 44.8% 8.4% 40.2% 42% 21% 12% -79% 0%
Reading teacher reading score 731.8 738.9 732.9 827.0 757.7 -3.4% -2.5% -3.3% 9.1% 0%
Maths teacher mathematics score 719.6 729.1 751.7 863.5 763.6 -5.8% -4.5% -1.6% 13.1% 0%
Textbooks Has own reading textbook 34.4% 42.3% 38.2% 66.1% 45.0% -24% -6% -15% 47% 0%
Has own mathematics textbook 27.6% 35.8% 32.3% 50.9% 36.4% -24% -2% -11% 40% 0%
School factors
Homework "Most days of the week" 49.9% 52.1% 46.1% 75.8% 56.1% -11% -7% -18% 35% 0%
Self-reported teacher absenteeism (days)
24.2 22.7 20.1 11.6 19.7 23% 15% 2% -41% 0%
Repeated at least 2 grades 10.9% 9.3% 10.3% 1.8% 8.1% 34% 15% 27% -78% 0%
Pupil-Teacher-Ratio 36.3 34.8 35.5 30.5 34.3 6% 1% 3% -11% 0%
School in urban area 5.5% 21.4% 31.2% 73.3% 31.9% -83% -33% -2% 130% 0%
Student very old (14y+) 23.7% 20.1% 14.0% 2.0% 15.3% 55% 31% -9% -87% 0%
Home background
Speaks English at home 'Always' 5.6% 7.4% 9.2% 39.5% 15.3% -64% -52% -40% 158% 0%
Student has used a PC before 11.8% 39.9% 51.4% 94.9% 47.8% -75% -16% 7% 99% 0%
More than 10 books at home 17.3% 23.0% 30.8% 67.2% 34.1% -49% -33% -10% 97% 0%
At least one parent has matric 29.9% 40.6% 49.3% 77.2% 48.5% -38% -16% 2% 59% 0%
At least one parent has a degree 4.7% 7.8% 10.7% 28.7% 12.8% -63% -39% -16% 125% 0%

31
1.5 IMPLICATIONS OF A DUALISTIC EDUCATION SYSTEM
1.5.1 DESCRIPTIVE AND REPORTING PURPOSES
The practice of regularly reporting educational statistics is important for a variety of reasons.
The most prominent of these is to tell if an education system is improving or deteriorating
over time, which is necessary for accountability purposes, as well as being able to ascertain
what does and does not work. This is especially true in developing countries where it is
possible for relatively large changes in educational outcomes to occur in a single decade. In
South Africa, most government reports present educational statistics at the provincial level of
aggregation, rather than by wealth quartile or quintile6 (see DBE, 2011b, 2009 for examples).
Given that the school system is administrated at the provincial level, and that provinces have
a large degree of autonomy, this would seem to be the most logical practice. However, since
there are two different types of education systems in South Africa distributed across all
provinces, one functional, the other not, reporting mean achievement scores can potentially
be very misleading. For example, national and provincial averages always overestimate the
achievement of the majority of South African learners because the median is so far below
the mean, as discussed above. Similarly for other measures of school functionality, averages
shroud the true picture. Looking at self-reported teacher absenteeism, the national average
of 19.7 days per year hides significant variation between the four wealth quartiles (Table 1).
While teachers in quartile 1, 2 and 3 reported that they were absent for 24, 22, and 21 days
respectively, teachers in the wealthiest quartile reported being absent for only 12 days in the
preceding year. The same is true for functional illiteracy: while more than 25% of students in
the poorest 3 quartiles are functionally illiterate, only 4% of quartile four students are thus
classified (Table 1). If one only observed the national average, 27% functional illiteracy, this
would not be apparent (see Spaull, 2011, p. 34 for a discussion on the definition of functional
literacy used here).
Since there is reason to believe that schools, students and school sub-systems are far more
homogenous within wealth quartiles than within provinces, it is somewhat perplexing that the
6 The Department of Basic Education uses “quintiles” to rank schools based on need. Quintile 1 is supposed to
represent the poorest 20% of schools and quintile 5 the wealthiest 20% of schools. However, because funding is allocated based on quintile status, with more funding allocated to lower quintiles, there is a strong incentive for schools to be classified in lower quintiles. Consequently the DBE quintiles do not each represent 20%. For example if one looks at the National EMIS database of December 2011, the proportion of the 24,062 schools in each quintile are as follows: quintile 1 (33%), quintile 2 (24%), quintile 3 (24%), quintile 4 (10%) (This excludes schools without a quintile classification). As one would expect, the number of students in each quintile differs substantially: quintile 1 (2,789,127), quintile 2 (2,292,880), quintile 3 (3,031,453), quintile 4 (1,811,770), and quintile 5 (1,578,450). These do not sum to the total number of students due to “Not applicable” and “To be updated” categories.

32
former measure of aggregation is not used more frequently in government reports in addition
to provincial averages, which are also important (although for different reasons). If student
achievement was reported by wealth quartile or quintile in addition to province, one could
determine if national trends are being driven by improvements in the wealthier or poorer
schools, or one of a number of possible combinations of results. There is no reason to
believe that these vastly differing school sub-systems would both rise or fall uniformly over
time, as would be suggested if only a single average score was reported per province. If one
agrees that there are indeed two underlying data-generating processes involved (and that
average school wealth is strongly associated with performance), then reporting educational
statistics by wealth quartile/quintile in addition to province is the most logical way forward.
1.5.2 RESEARCH PURPOSES
The distinction between the two school sub-systems in South Africa is useful not only for
descriptive purposes, but also for modelling and analytic purposes. In their report “Low
quality education as a poverty trap” Van der Berg et al. (2011, p. 11) explain some of the
quantitative reasons why modelling a single education system, when in fact there are two,
can lead to spurious results:
“There are important statistical and methodological reasons to analyse the two sub-
systems separately when investigating what drives educational achievement in South
Africa. Particular school inputs, teacher practices or other characteristics may affect
student achievement differently across the two sub-systems. It is possible, for
example, that an advanced media technology may be effective in the well-functioning
system but ineffective in the historically disadvantaged system where schools may not
have the expertise to implement the technology or the security to protect the
equipment from theft and vandalism. In this way, important dynamics in one section of
the school system can be glossed over by estimating a single model for the entire
school system, alternatively, it is possible that a single model will suggest a
relationship that is in fact invalid and is driven by differences between the two sub-
systems. For example, it may be that within each sub-system additional resources do
not produce improved student achievement, but that the one system has far superior
resource endowments than the other and also produces better student achievement.
Treating these two systems in a single model would suggest that additional resources
do lead to better student achievement, when in fact this merely reflects overlapping
differences between the two systems” (Van der Berg et al., 2011, p. 11).
Given the bimodality of student performance seen in the SACMEQ 2007 South Africa data
(Figure 1), and the dualistic nature of many educational inputs and indicators (Table 1), student
performance is disaggregated by socioeconomic quintile in Chapter 2, Chapter 4 and
Chapter 5. Given that the focus of Chapter 3 is on language (rather than socioeconomic
status), the analysis in that chapter is split along linguistic lines. Language is one of the

33
numerous inter-connected and highly correlated factors in the South African context and
thus provides a useful lens through which to observe South African student performance.
Unless otherwise stated, the measures of socioeconomic status used throughout this thesis
are either those created by particular research organizations (like SACMEQ or TIMSS) or is
the first component of a Principal Component Analysis (PCA) of available possession
questions.

34
CHAPTER 2: THE CASE OF INSURMOUNTABLE LEARNING DEFICITS
IN MATHEMATICS
2.1 INTRODUCTION
Few would argue that the state of mathematics education in South Africa is something other
than dire. This belief is widespread among academic researchers and those in civil society,
and is also strongly supported by a host of local and international assessments of
mathematical achievement extending back to at least 1995 (Fleisch, 2008; Howie and
Hughes, 1998; Reddy, 2006; Spaull, 2013; Taylor et al., 2013). Many of these studies, and
particularly those that focus on mathematics, have identified that students acquire learning
deficits early on in their schooling careers and that these backlogs seem to be the root cause
of underperformance in later years. They argue that any attempts to raise students’
mathematical proficiency must first address these deficits if they are to be successful (Taylor
et al., 2003). The present study adds further evidence to this body of work by using
nationally representative data over multiple grades to provide some indication of the true
size and scope of these learning deficits.
Both Prichett and Beatty (2012) and Banerjee and Duflo (2012) have identified that students
in developing countries have large learning deficits. They show that even children with
relatively high levels of educational attainment often have very few cognitive skills to show
for all their years of schooling. They theorise that this is the result of weaker students falling
progressively further and further behind the curriculum to the extent that they eventually fall
so far behind that no learning takes place whatsoever. Muralidharan and Zieleniak (2013)
found support for this hypothesis with data from the Andra Pradesh Randomized Evaluation
Studies from India, by means of tracking the learning of a group of students over a five year
period. Their results show that only 60% of students reach a grade 1 level after five years of
formal full-time schooling, and furthermore, that the learning trajectories of the weakest
performers flatten off completely in the later grades. This provides empirical support to
Lewin’s (2007, p. 10) notion of ‘silent exclusion’ where students are enrolled and attending
school but learning little.
In South Africa, research in this area has generally focussed on in-depth localized studies of
student workbooks and classroom observation (Ensor et al., 2009). For some examples,
Carnoy et al. (2012) observe mathematics learning in grade 6 classrooms from 60 schools in
one South African province (North West) and compare these classrooms to 60 schools in
neighbouring Botswana (see also Carnoy and Arends, 2012). On a smaller scale, Venkat

35
and Naidoo (2012) focus on 10 primary schools in Gauteng and analyse coherence for
conceptual learning in a grade 2 numeracy lesson. Similarly Schollar (2008) conducted
interviews and classroom observations as well as analysed a large sample of learner scripts
to determine the development (or lack thereof) of mathematical concepts through the
grades.
Where the present research differs from these earlier studies is that it focuses on quantifying
national learning deficits in mathematics, rather than in specific mathematical learning areas.
While the latter are essential for understanding what the problems are and how to fix them,
analyses at the national level are also needed if we are to understand the extent and
distribution of the problem, both of which are imperative for policy-making purposes. This is
only possible by analysing multiple nationally representative surveys of student
achievement, which is the focus of the present study. The two core research questions that
are addressed in this chapter are as follows:
1. How large are mathematics learning deficits in South Africa and how are they
distributed in the student population?
2. Do mathematics learning deficits grow, shrink or remain unchanged as students
progress to higher grades?
To answer these questions analysis was performed on four nationally representative
datasets of mathematics achievement, namely: (1) the Systemic Evaluation 2007 (grade 3),
(2) the National School Effectiveness Study 2007/8/9 (grade 3, 4 and 5), (3) the Southern
and Eastern African Consortium for Monitoring Educational Quality (SACMEQ) 2007 (grade
6), (4) and the Trends in International Mathematics and Science Study (TIMSS) 2011 (grade
9).
2.2 BACKGROUND
Independent studies in economics, neuroscience and developmental psychology all confirm
that the mastery of the skills which are essential for economic success and personal
development largely follow hierarchical rules (Knudsen et al., 2006). The later acquisition of
these skills builds on the foundations laid down in earlier years. That is, earlier mastery of
certain cognitive, social and emotional capabilities help foster more efficient learning at later
ages. Conversely, the lack of certain capabilities creates a low ceiling beyond which
progress is improbable. Developing a theory of learning that incorporates these insights,
Robert Gagné (1962) proposed the notion of ‘learning hierarchies’ as a set of ordered
intellectual skills which are hierarchically inter-related. He posited that a final capability can

36
be broken into subordinate skills in such a manner that lower-level capabilities generate a
substantial amount of positive transfer to the learning of higher order capabilities that have
not yet been acquired (see also Scandura and Wells, 1967). These theories have
considerable empirical support, with numerous studies finding early numeracy skills to be
good predictors of later mathematics performance (Aubrey and Godfrey, 2003; Aubrey et al.,
2006; Aunio and Niemivirta, 2010). Counting skills, in particular, have been shown to
estimate basic arithmetic skills in the early grades of primary school relatively accurately
(Aunola et al., 2004; Desoete et al., 2008; Jordan et al., 2007).
An epistemological analysis of mathematics reveals a latent hierarchy of knowledge and
intellectual skill - what Posner and Strike (1976) refer to as content structure; “Content
structure refers to the content elements and the ordering relationships that exist between
them … Most questions about content structure can be reduced to questions concerning
what content comes before what other content and the rationale for that order” (Posner and
Strike, 1976, p. 666 cited in; Reeves and McAucliffe, 2012, p. 11). Consequently the
acquisition of higher order knowledge and intellectual skills requires first the mastery of
subordinate skills and a clear understanding of foundational mathematical knowledge. This
implicit knowledge structure is made explicit in the sequencing and structuring of curricula
where simple antecedents precede more complex concepts and ways of thinking. Although
this is true of many - if not most - subjects, mathematics is perhaps the best example of such
a subject due to the strong vertical demarcation and integration of concepts. For example,
without an understanding of the concepts of number and equipartitioning a student will not
be able to understand or manipulate fractions which are necessary for fraction equivalence
and comparison.
The extant research on mathematics learning in South Africa strongly supports this
conclusion with numerous researchers highlighting the inadequate acquisition of basic skills
and the consequent negative effects on furtherP learning. Taylor and Vinjevold (1999)
summarise the findings from 54 studies 7 commissioned by the President’s Education
Initiative and conclude that:
“At all levels investigated by the [President’s Education Initiative], the conceptual
knowledge of students is well below that expected at the respective grades.
Furthermore, because students are infrequently required to engage with tasks at
any but the most elementary cognitive level, the development of higher order
skills is stunted” (Taylor and Vinjevold, 1999, p. 231).
7 The full list of research papers can be found at http://www.jet.org.za/publications/pei-research

37
This lack of engagement with higher order content is the prime focus of Muller and Reeves’
(2005) analysis of Opportunity-to-Learn (OTL) and mathematics achievement in South
Africa, where OTL is the curriculum actually made available to learners in the classroom
(see also Reeves et al., 2013a). Taylor et al. (2003, p. 129) in their book Getting Schools
Working summarise succinctly the debilitating effects of cumulative learning deficits:
“At the end of the Foundation Phase [grades 1-3], learners have only a
rudimentary grasp of the principles of reading and writing. ... it is very hard for
learners to make up this cumulative deficit in later years ... particularly in those
subjects that ... [have] vertical demarcation requirements (especially
mathematics and science), the sequencing, pacing, progression and coverage
requirements of the high school curriculum make it virtually impossible for
learners who have been disadvantaged by their early schooling to ‘catch-up’ later
sufficiently to do themselves justice at the high school exit level.’
And lastly, Schollar (2008) summarises the findings of the Primary Mathematics Research
Project which looked at over 7000 learners from 154 schools in South Africa and concludes
as follows:
“Phase 1 concluded that the fundamental cause of poor learner performance
across our education system was a failure to extend the ability of learners from
counting to true calculating in their primary schooling. All more complex
mathematics depends, in the first instance, on an instinctive understanding of
place value within the base-10 number system, combined with an ability to
readily perform basic calculations and see numeric relationships … Learners are
routinely promoted from one grade to the next without having mastered the
content and foundational competences of preceding grades, resulting in a large
cognitive backlog that progressively inhibits the acquisition of more complex
competencies. The consequence is that every class has become, in effect, a
‘multi-grade’ class in which there is a very large range of learner abilities and this
makes it very difficult, or even impossible, to consistently teach to the required
assessment standards for any particular grade. Mathematics, however, is an
hierarchical subject in which the development of increasingly complex cognitive
abilities at each succeeding level is dependent on the progressive and
cumulative mastery of its conceptual frameworks, starting with the absolutely
fundamental basics of place value (the base-10 number system) and the four
operations (calculation)” (Schollar, 2008, p. 1).
However, few of these studies use nationally representative samples in their analysis of
student achievement, and none when looking specifically at learning deficits. This is not to
say that there have not been a number of reports that have looked at the nationally

38
representative datasets of educational achievement in South Africa8. However, these reports
do not focus on learning deficits but rather the levels and trends of performance in the
country. In this sense there is a bifurcation in the literature where small-scale studies focus
on learning deficits without being able to make population-wide claims, while large-scale
studies which can make population-wide claims do not look specifically at learning deficits.
2.3 DATA
To construct the learning trajectories of South African children, it is necessary to have
objective measures of achievement at multiple points in the education system. For the
present analysis three data sets are used which cover five grades from grade 3 to grade 9.
The data are drawn from the National School Effectiveness Study (NSES) for grades 3, 4
and 5; from the Southern and Eastern African Consortium for Monitoring Educational Quality
(SACMEQ) for grade 6; and from the Trends in International Mathematics and Science
Study (TIMSS) for grade 9. Given that some reference is made to the Systemic Evaluation of
2007 (grade 3) background information for that data set is also provided.
2.3.1 SYSTEMIC EVALUATION – GRADE 3 (2007)
The 2007 Systemic Evaluation tested a nationally representative sample of grade 3 students
in numeracy and literacy. A random sample of about 54 000 grade 3 students from 2 340
primary schools participated in the study (DoE, 2008). These students were assessed
though standardised literacy and numeracy tests that measured their levels of achievement
in terms of the grade appropriate curriculum. To achieve this measure, the test included
grade 1 to grade 4 level questions, with the vast majority being set at the grade 3 level. The
tests were administered in all 11 official South African languages according to the Language
of Learning and Teaching (LoLT) specified by the school.
2.3.2 NATIONAL SCHOOL EFFECTIVENESS STUDY (NSES) – GRADE 3 (2007), GRADE 4
(2008), GRADE 5 (2009)
The NSES study is the first large-scale (almost nationally representative9) panel data set
which focuses specifically on schooling and educational outcomes (for a full discussion see
8 For some examples see Fiske and Ladd (2004), Reddy (2006), Fleisch (2008), Taylor and Yu (2009), Van der
Berg, et al., (2011), Moloi and Chetty (2011) and Spaull (2013).
9 The panel does not include Gauteng but is representative of the other 8 provinces. Gauteng was not included in
the NSES sample due to the fact that other testing was being conducted in that province at the same time. To give some idea of how this could influence the results, I briefly analysed the SACMEQ (2007) grade 6 reading and maths data sets and calculcated summary statistics including and excluding Gauteng. The mean reading score for SACMEQ South Africa was 495 (SD 116) and the mean maths score was 495 (SD 98). However when

39
Taylor et al., 2013). The panel followed one cohort of students and tested them in grade 3
(2007), grade 4 (2008) and grade 5 (2009). Approximately 15 000 students from 266 schools
were tested each year with 8 383 students matched consistently across the three years and
24 000 tested in total across the three years. In this chapter the 8 383 students who were
observed in all three years are referred to as the panel sample, while the full 24 000 students
are referred to as the full sample. The students wrote the exact same literacy and numeracy
tests in each consecutive year, thereby producing comparable results over time. Both the
literacy and numeracy test paper were exact replicas of the Systemic Evaluation (2007) test
papers, with the exception that the NSES was administered only in English. The questions
included in the literacy and numeracy tests ranged from grade 1 to grade 4 level, specified
according to the National Curriculum Statement (NCS).10 Additional information with regards
to student background, teacher characteristics and school principal characteristics were also
collected over those years.11
2.3.3 SOUTHERN AND EASTERN AFRICAN CONSORTIUM FOR MONITORING
EDUCATIONAL QUALITY (SACMEQ) – GRADE 6 (2007)
SACMEQ is a consortium of education ministries, policy-makers and researchers who, in
conjunction with UNESCO’s International Institute for Educational Planning (IIEP), aims to
improve the research capacity and technical skills of educational planners in participating
countries in Africa (Moloi and Strauss, 2005, p. 12; Murimba, 2005). These surveys collect
extensive background information on the schooling and home environments of grade 6
students, and in addition, test students and teachers in both numeracy and literacy (see
Hungi et al., 2010; Ross et al., 2005). Currently there are 15 participating countries including
South Africa. The data set used for the present analysis is SACMEQ III (2007) South Africa,
which tested 9071 grade 6 students from 392 schools, forming a large nationally
representative sample (Moloi and Chetty, 2011).
2.3.4 THE TRENDS IN INTERNATIONAL MATHEMATICS AND SCIENCE STUDY (TIMSS) –
GRADE 9 (2011)
one excludes Gauteng the mean scores and the standard deviations drop. The mean reading score for the 8 provinces (i.e. excluding Gauteng) was 479 (SD 108) and the mean maths score for this group was 484 (SD 94). This is to be expected since Gauteng is a relatively well-performing province with above-average variation in acheivment.
10 The National Curriculum Statement is the curriculum which was taught in schools from 2002 until 2009
(Department of Education, 2002).
11 Teacher questionnaires were only administered in the years 2008 and 2009.

40
TIMSS is a cross-national study which tests the mathematics and science knowledge of
grade 8 students in over 60 countries in such a way that they are comparable across
countries and over time (Mullis et al., 2012). In the 2002 TIMSS, South Africa tested grade 9
students in addition to grade 8 students, since earlier rounds of TIMSS indicated that the
international grade 8 test was too difficult for South African students, and consequently too
many students were performing at guessing level on the multiple choice questions (i.e. no
better than random). This decreases the reliability and accuracy of the tests (Foy et al.,
2010) and thus in 2011, only grade 9 South African students wrote the TIMSS grade 8 test.
In TIMSS 2011 South Africa tested a nationally representative sample of 11 969 grade 9
students from 285 schools in both mathematics and science (Reddy et al., 2012).
2.4 LEARNING DEFICITS
2.4.1 THE SOUTH AFRICAN CASE
Given the cumulative nature of learning deficits, it seems logical to determine when these
learning deficits arise, as well as their size and distribution in the student population. In an
ideal world one would have longitudinal data on the social, emotional and cognitive skills of
children before they enter school and then follow these same children as they progress
through school, assessing them at each grade. Such data would allow for the disaggregation
of learning deficits and indicate which portion of the deficit is from a child’s home background
and which portion is from the child’s schooling experiences (see, for example, the Early
Childhood Longitudinal Study by the Institute of Educational Science in the USA).
Unfortunately these data do not yet exist in South Africa. Although the recent Annual
National Assessments (ANAs) tested all South African grade 1-6 students in 2011, 2012,
2013 and 2014, these tests were not psychometrically calibrated to be comparable over time
or across grades making them unusable for comparison purposes (for a full discussion see
Spaull, 2013). Although there are no reliable nationally-representative data sets for grades 1
or 2, there are two studies which tested nationally representative samples of grade 3
students in 2007. The first of these studies was the 2007 Systemic Evaluation (SE)
conducted in September 2007 and the second study, the National School Effectiveness
Study (NSES) tested a sub-sample of students from the Systemic Evaluation one month
later in October 2007. The only difference between the Systemic and NSES grade 3 tests
was that the Systemic Evaluation (September) was conducted in the language of learning
and teaching (LOLT) of the school – i.e. all 11 official languages - whereas the NSES test
(October) was conducted only in English.

41
The school language policy in South Africa is currently implemented in such a way that the
language of learning and teaching (LOLT) for the vast majority of students is their home-
language for grades 1, 2 and 3 and that from grade 4 there is a LOLT switch to English for
the remaining school years (Taylor and Coetzee, 2013).12 Given that the grade 3 Systemic
Evaluation of 2007 was conducted in the language of learning and teaching of the school,
this should provide an accurate reflection of the state of mathematics learning at the grade 3
level since there are no obvious confounding language factors. The grade 3 Systemic
Evaluation mathematics test consisted of 53 questions which varied according to the nature
of the mathematical tasks, the difficulty level of the items, whether the item was in verbal or
symbolic form, and whether the item was multiple choice or free response (Vorster et al,
2013) . Furthermore, the question items were also classified by learning area and grade-
level in accordance with the prevailing curriculum, the National Curriculum Statement (NCS).
Of the 53 questions in the test, three were set at a grade 1 level, 14 at a grade 2 level, 30 at
a grade 3 level, and six at a grade 4 level. Using this information I calculate the average
numeracy score for each child using only the subset of 30 grade-3 level questions. The
reason for this sub-classification is to calculate the proportion of students that are performing
at the grade-appropriate level in grade 3. Following Muralidharan and Zieleniak (2013)
students are classified as performing at the grade-appropriate level if they obtain a mean
score of 50% or higher on the full set of grade 3 level questions.
Figure 6 below shows the distribution of mean grade 3 performance on grade 3 level items
disaggregated by quintile of student socioeconomic status into the wealthiest 20% of
students (Quintile 5) and the poorest 80% of students (Quintile 1-4). All students achieving a
mean score of 50% or higher can be said to be performing at the grade-appropriate level.
The graph reveals the dire situation in South Africa where the vast majority (88%) of Quintile
1 – 4 students in grade 3 are not performing at the grade-appropriate level. Looking at the
distribution of Quintile 1-4 students, it becomes clear that these students are substantially
behind the benchmark (50%). The majority of Quintile 1-4 students are concentrated around
the 20% performance mark, a full one and a half standard deviations below the 50%
threshold. Although Quintile 5 students perform much better than their poorer counterparts,
only slightly more than half (51%) are performing at the grade-appropriate level (see Table 2
below).
12
English and Afrikaans students learn in their home-language from grade 1 to grade 12 and do not switch in grade 4. For a full discussion of the school language dynamics in South Africa see Taylor and Coetzee (2013).

42
FIGURE 6: KERNEL DENSITY OF MEAN GRADE 3 PERFORMANCE ON GRADE 3
LEVEL ITEMS FOR QUINTILE 1-4 (POOREST 80% OF STUDENTS) AND QUINTILE 5
(WEALTHIEST 20% OF STUDENTS) (SYSTEMIC EVALUATION 2007)
TABLE 2: PROPORTION OF GRADE 3 STUDENTS PERFORMING AT THE GRADE 3 LEVEL BY PROVINCE AND STUDENT SOCIOECONOMIC QUINTILE (SYSTEMIC EVALUATION 2007)
Province
Proportion of grade 3 students performing at the appropriate grade 3
level*
Quintile of student SES
Proportion of grade 3 students performing at the appropriate grade 3
level*
Eastern cape 17%
Quintile 1 10%
Free State 25%
Quintile 2 10%
Gauteng 26%
Quintile 3 12%
KwaZulu-Natal 13%
Quintile 4 29%
Limpopo 6%
Quintile 1-4 11%
Mpumalanga 11%
Quintile 5 51%
North West Province 10%
Northern Cape 17%
Western Cape 32%
South Africa 16%
* Students are classified as performing at the grade-appropriate level if they obtain a mean score of 50% or higher on the full set of grade 3 level questions. Quintile 1 is the poorest 20% of students and Quintile 5 is the wealthiest 20% of students using an index of student socioeconomic status.
0
.005
.01
.015
.02
.025
Kern
el densi
ty o
f G
rade 3
-leve
l sco
res
0 10 20 30 40 50 60 70 80 90
Systemic 2007 Grade 3 mean score (%) on Grade 3 level items
Quintile 5 Quintile 1-4
(Grade-3-appropriate level)

43
If one looks at the country as a whole, less than one in five (16%) grade 3 students are
performing at the grade 3 level. That is to say that only the top 16% of grade 3 students are
performing at the grade 3 level. Importantly, these Systemic assessments were conducted in
the language of learning and teaching (LOLT) of the school in grade 3, i.e. before any switch
to English in grade 4.
It is indisputable that by grade 3 there already exist large learning deficits such that the vast
majority of South African students (eight year olds) are well behind the curriculum. However,
the origin of these learning deficits is less clear. Without longitudinal data on student
achievement which covers the period before and during primary school, one cannot
determine the source of these deficits, i.e. are they primarily attributable to having a
disadvantaged home background, weak early childhood development or weak instruction in
grades 1, 2 and 3? Although we cannot answer this question with the data available in South
Africa, we can answer another important and related question; whether learning deficits
grow, shrink or remain constant as students’ progress through the schooling system. To
answer this question one needs to look at surveys of student performance at multiple points
in the education system.
2.4.2 LEARNING DEFICITS IN GRADES 3, 4 AND 5
One of the major nationally-representative datasets of student achievement in South Africa -
and the only educational panel dataset in the country - is the National School Effectiveness
Study (NSES) covering grades 3, 4 and 5. All NSES tests were written in English only. Given
the complex language dynamics in South Africa, with most students switching language in
grade 4, I chose to sub-classify the items in the mathematics test into “high-language” items
and “no-language” items. An item was said to be a “high language” item if it was practically
impossible to solve the problem without an understanding of the language, whereas items
were classified as “no language” items if they required no language proficiency to solve them
(i.e. they were entirely in number/symbol format). Of the 53 questions in the test 12 items13
had high language content and 15 items14 had no language content.
By focussing on the ‘no-language’ items and observing how students perform on these items
as they progress from grade 3 to grade 5 it is possible to isolate the effect of increased
mathematical proficiency from any confounding language factors. If we use the 50%-on-
grade-three-level-items threshold as a measure of the proportion of students operating at a
13
These 12 items were questions 10, 19, 22, 27, 29, 30, 33, 38, 43, 51, 52 and 53.
14 These 15 items were questions 20, 21, 24, 25, 26, 28, 31, 32, 35, 36, 37, 39, 40, 41 and 42.

44
grade three level (as in Figure 6 above), and now also impose the “no language” restriction,
we are left with nine items. In Panel 1 of Figure 7 below, only 8% of grade 3 students from
Quintile 1-4 were performing at the grade 3 level according to these nine items. By contrast,
35% of Quintile 5 students were performing at the grade-appropriate level. The second
panel of Figure 7 shows that by grade 5 this figure has increased substantially to 26% for
Quintiles 1-4 and 55% for Quintile 5 students. It is disconcerting to note that only one in four
(26%) grade five students from Quintile 1-4 were operating at a grade three level in 2009, at
least according to these nine items, and furthermore that 45% of the wealthiest students
(Quintile 5) are still not operating at a grade 3 level by the end of grade 5.

45
FIGURE 7: NSES GRADE 3 (PANEL 1) AND GRADE 5 (PANEL 2) PERFORMANCE ON NO-LANGUAGE ITEMS BY
QUINTILE OF STUDENT SOCIOECONOMIC STATUS (WEIGHTED AND OVERLAYED - FULL SAMPLE)
The above graphs clearly show that the majority of South African children are
underperforming relative to the grade-appropriate curriculum. However, such aggregated
measures make it difficult to appreciate just how low the levels of performance really are,
and how little learning occurs over the three years from grades 3 to 5. To provide an
alternative measure of performance, two examples of no-language items in NSES are

46
included below. The graphs show when students answer the question correctly – i.e. in
grade 3, grade 4, grade 5 or not by the end of grade 5. Given that one needs to follow the
same students from grade 3 to 5 the sample is limited here to the panel sample of NSES
students only (8383 students). Figure 8 below shows a simple question testing two and three
digit addition with no carrying. This is within the grade 3 curriculum which states that
students should be able to “perform calculations using the appropriate symbols to solve
problems involving addition of whole numbers with at least three digits.” Although this is a
grade 3 level item and contains no language content, only 20% of Quintile 1-4 students
could answer this correctly in grade 3, with the proportion in Quintile 5 being twice as high
(42%) but still low. While there is evidently some learning taking place in grade 4 and 5,
more than 40% of Quintile 1-4 children still could not answer this grade 3 level problem at
the end of grade 5. In Quintile 5 this figure was only 22%.
FIGURE 8: NATIONAL SCHOOL EFFECTIVENESS STUDY - PROPORTION OF STUDENTS ANSWERING THE ITEM
CORRECTLY BY GRADE AND QUINTILE OF STUDENT SOCIOECONOMIC STATUS (NSES QUESTION 21)
Figure 9 below shows a similar situation where the vast majority of grade 3 children cannot
answer this grade 3 division problem. While some children learn the skill in grade 4 or 5, the
majority of children still cannot answer this problem at the end of grade 5, despite it being set
at the grade 3 level.
16% 18% 19% 22%
42% 18% 17% 17%
16%
20%
19% 21% 21% 20%
15% 46% 44% 44% 41%
22%
0%
10%
20%
30%
40%
50%
60%
70%
80%
90%
100%
Q1 Q2 Q3 Q4 Q5
Question 21
" 270 + 28 = _____ "
Still wrong in Gr5
Correct in Gr5
Correct in Gr4
Correct in Gr3

47
FIGURE 9: NATIONAL SCHOOL EFFECTIVENESS STUDY - PROPORTION OF STUDENTS ANSWERING THE ITEM
CORRECTLY BY GRADE AND QUINTILE OF STUDENT SOCIOECONOMIC STATUS (NSES QUESTION 42)
It is important to remember that while the NSES mathematics test (set at the grade 3 level)
was the same in grades 3, 4 and 5, the expectations of the curriculum in each year
proceeded unhindered by the fact that most children still had not acquired the necessary
foundational skills in the previous grade. Weak assessment practices combined with low
expectations and institutional inertia mean that most students are promoted to the next
grade irrespective of whether or not they have acquired the necessary skills in the previous
grade (Van der Berg et al., 2011). The growing disconnect between the real mathematics
proficiency of students relative to the expectations of the curriculum mean that students fall
further and further behind even while they proceed to higher grades eventually leading to a
situation of “silent exclusion” (Lewin, 2009).
2.5 MOVING FROM LEARNING DEFICITS TO LEARNING TRAJECTORIES
While the previous sections have identified the proportion of students that are not operating
at a grade 3 level, they do not provide much guidance in terms of learning trajectories into
later grades. The figures above show that some students are only learning part of the grade
3 curriculum in either grade 4 or grade 5 and that many never seem to acquire these skills.
However one cannot say to what extent they are also acquiring grade 4 level skills in grade 4
and grade 5 level skills in grade 5, although this is unlikely. This is because the NSES test
was set at a grade 3 level with only a small number of questions set at the grade 4 level.
16% 19% 17% 17%
39% 13% 10% 12% 12%
14%
13% 14% 14% 15%
13%
59% 57% 57% 55%
35%
0%
10%
20%
30%
40%
50%
60%
70%
80%
90%
100%
Q1 Q2 Q3 Q4 Q5
Question 42
" 24 ÷ 3 = ______ "
Still wrong in Gr5
Correct in Gr5
Correct in Gr4
Correct in Gr3

48
One could use SACMEQ (grade 6) and TIMSS (grade 9) as measures of mathematical
proficiency at higher levels, but these tests are not calibrated to be comparable to each
other, or to earlier tests like the NSES. This is problematic since learning trajectories require
data points distributed across the full range of educational phases. One alternative method
to overcome the lack of inter-survey comparability is to measure the size of learning deficits
in each data set using intra-survey benchmarks.
While most benchmarks in education are norm-referenced benchmarks (like being able to
read by the age of eight), it is also possible to use the achievement level of an identifiable
group as one benchmark, particularly when the composition of that group is relatively stable
over time. For the purposes of the present analysis a benchmark was created which was
equal to the average performance of South Africa’s quintile five students (i.e. wealthiest 20%
of students) in each survey. There are three reasons why this is a useful and appropriate
benchmark: (1) Given the low intra-generational social mobility in South Africa, there is a
strong case to be made that the size and composition of the wealthiest 20% of students is
relatively stable over time; (2) Previous South African research has shown that this particular
grouping of students performs noticeably better than the South African average, and can be
seen as having its own data generating process, as discussed in Chapter 1 (Spaull, 2013);
and (3) The quintile 15 system is a widely used and recognized form of classification,
appearing in government reports and academic research alike.
For the analysis the average performance of quintile five students was calculated for each of
the following three assessments: NSES16 2007/8/9 for grades 3, 4 and 5; SACMEQ 2007 for
grade 6; and TIMSS 2011 for grade 9. This level of performance was then used as the
reference category to compare other levels of performance (by quintile and province) relative
to these within-survey benchmarks. The Quintile 5 average was set to be equal to the
“grade-appropriate level” and used to compare all other levels of performance relative to this
Quintile 5 average. It is important to note that this is necessarily a lower-bound estimate of
curriculum mastery or grade-appropriate performance since some Quintile 5 students will not
be performing at the grade appropriate level. The preceding analysis of the Systemic
Evaluation 2007 and NSES 2007/8/9 has shown that this is in fact the case – many Quintile
15
This can be a source of confusion since researchers and departmental officials can mean different things when they talk about “quintiles.” As mentioned earlier, departmental ‘quintiles’ are not quintiles in the sense that they represent 20% of the underlying population. In contrast the quintiles used in this thesis are actual quintiles (20% each). They are all quintiles of students socioeconomic status unless otherwise mentioned.
16 To ensure that there are no confounding language factors we only use the sub-set of 15 no-language items for
the NSES grade 3, 4 and 5 scores. A sensitivity analysis is provided later in the Chapter which compares the full test results with that of the sub-set of 15 no-language items. This can be found in Table 3.

49
5 students are performing well below the expectations of the curriculum. Notwithstanding the
above, this is still a useful benchmark against which to compare other sub-groups. While the
ultimate aim of any education system is to ensure that all children attain the full curriculum
and exhibit sufficient mastery of it, comparisons to the tangible group of Quintile 5 students
in the country has more conceptual purchase than pegging the benchmark to a somewhat
arbitrary point of curriculum mastery that is in any event not possible to do with the current
data.
By using all three data sets (NSES, SACMEQ and TIMSS), it is possible to calculate the
difference in scores between the average Quintile 5 student and the average student in a
particular sub-group, say Quintile 1 (poorest 20% of students). However, given that each of
the three surveys uses a different metric to measure student performance it is not possible to
use raw survey-specific scores to make comparisons across all the grades. To overcome
this comparability problem I use the within-survey national standard deviation of South Africa
as a unit of measurement. Given that the standard deviation is not a function of the specific
unit of measurement (like SACMEQ points or TIMSS points) but rather a statistic describing
the distribution of performance, it is possible to compare differences in student achievement
across surveys that are otherwise not comparable.
One can go further and convert these standard deviation differences into grade-level
differences, as has been done in other countries. Using seven nationally normed tests of
student reading and mathematics achievement, Hill et al. (2007, p. 172) compare the annual
learning gain per grade for American students from grade K – 12 in standard deviations.
They find that the annual learning gains vary by grade with greater gains at earlier grades.
For example, in mathematics the learning from grade 1 to 2 was 1.03 standard deviations,
from grade 4 to 5 was 0.56 standard deviations and from grade 8 to 9 was 0.22 standard
deviations (Hill et al., 2007, p. 3). The average math test score gain across all seven grade
levels was 0.47 standard deviations per year, which has been used elsewhere as a
benchmark for one grade-level of learning in America (Washington State Institute for Public
Policy, 2011). Unfortunately, similarly rich data do not exist for South Africa. The only two
data sets which allow for the estimation of learning gains in South Africa are the NSES study
(2007/8/9) for primary school, and TIMSS (2003) study for high school. Given that NSES
followed the same students over time as they moved from grade 3 into grade 4 and 5 and
tested these students using the same test, one can estimate the amount of learning between
grade 3 and 4 as a percentage of the average standard deviation between the two years.
One can also calculate the learning gains between grade 4 and 5 using NSES although
these are likely to be biased given that the NSES test was set at the grade 3 level.

50
When using the NSES numeracy tests to calculate learning gains there are two important
caveats: Firstly, one should use only those items that have no language content in them to
ensure that the gains are due to increased numeracy proficiency rather than increased
language proficiency (as discussed above), and secondly, the results of the analysis are
likely to be different based on whether one uses the panel sample (i.e. only those we can
follow across all years), or the full sample (i.e. all students in each grade). Table 3 below
reports the average numeracy score for grade 3, 4 and 5 as well as the learning gains (both
in percentage points and as a percentage of the average standard deviation between the
two years) for both the full numeracy test and the sub-set of 15 no-language items. As a
robustness check I also impute17 scores for those grade 3 children who are not found in the
grade 4 and grade 5 NSES sample either due to dropout, moving or grade repetition.
17
The predicted scores were calculated by first regressing the 2008 numeracy scores on the 2007 numeracy
scores and including other explanatory variables such as a student’s gender, socio-economic status, whether the
student is over age or too old, whether a student’s home language is English, whether the student is part of a
large household as well as school fixed effects. This regression included only those students who were observed
in both 2007 and 2008, and the coefficients were then used to predict the 2008 scores of those students who
were not observed in 2008. The resultant scores were imputed into the 2008 numeracy distribution to render a
new numeracy score distribution with which to do the sensitivity analysis. The process was repeated for the 2009
numeracy scores, regressing the 2009 scores on the new 2008 numeracy scores, including the imputed values.

51
TABLE 3: QUANTIFICATION OF A YEAR'S WORTH OF LEARNING IN SOUTH AFRICA (NSES 2007/8/9 TIMSS 2002)
NSES
Percentage Points
Gains as % SD
Grade 3 Grade 4 Grade 5 Gains
Fu
ll n
um
era
cy te
st
Panel sample
Gr3 - Gr4 29.38 35.5
6.12 0.28
Gr4 - Gr5
35.5 47.04 11.54 0.54
Full sample
Gr3 - Gr4 20.22 27.88
7.66 0.38
Gr4 - Gr5
27.88 39.66 11.78 0.58
Full sample – imputed
Gr3 - Gr4 25.85 32.33
6.48 0.31
Gr4 - Gr5
32.33 44.16 11.84 0.61
Su
b-s
et
of 1
5 n
o-l
an
gu
ag
e ite
ms
on
ly
Panel sample
Gr3 - Gr4 27.64 34.53
6.88 0.28
Gr4 - Gr5
34.53 40.99 6.46 0.43
Full sample
Gr3 - Gr4 17.92 26.47
8.54 0.38
Gr4 - Gr5
26.47 38.84 12.38 0.52
Full sample – imputed
Gr3 - Gr4 23.78 31.43
7.65 0.33
Gr4 - Gr5
31.43 42.81 11.37 0.52
TIMSS
Standardized TIMSS Points
Gains as % SD
Grade 8 Grade 9
Gains
Full sample Gr8 - Gr9 264 285
21 0.2
While the NSES is helpful to estimate the amount of learning per grade in grade 3, the best
data set to calculate the amount of learning at a higher grade is TIMSS 2003. In TIMSS 2003
the principal investigators decided to test both grade 8 students and grade 9 students (from
the same sampled schools) using the same grade 8 test. This was out of a concern that the
TIMSS grade 8 test was too difficult for South African grade 8 students and thus that future
administrations of TIMSS may be done at the grade 9 level and would need a baseline for
comparability (Reddy et al., 2012). This is in fact what happened in TIMSS 2011 when only
grade 9 students were tested using the grade 8 test. By comparing the average TIMSS
score of grade 8 and 9 students in 2003 (from the same schools) on the same test and
calculating this as a percentage of the South African TIMSS 2003 standard deviation, one
can get an estimate of the amount of learning in one grade at the high school level. While it
would be ideal to follow the same students from grade 8 to grade 9 (as NSES did between
grades 3, 4 and 5), this has not been done before in South Africa and thus the best estimate

52
available is that of the TIMSS 2003 grade 8 and 9 students from the same schools on the
same test.
One other method of calculating grade-level equivalents is to use the benchmarks calculated
by cross-national testing regimes themselves. For example, the Trends in International
Mathematics and Science Study (TIMSS) study estimates that within a 4-year testing cycle a
country could improve by a maximum of 40 points which is referred to elsewhere as “one
grade level” (Reddy et al., 2012, p. 3). This is equal to 0.4 TIMSS standard deviations and
0.5 South African TIMSS standard deviations.18 While this is a useful measure for comparing
improvements across countries, it has not been calibrated using South African data and is
therefore not specific to South Africa but rather a generic loose measure for cross-country
comparisons. As we have shown in Table 3 above, the real level of learning occurring
between grade 8 and grade 9 in South Africa is only 20 points (0.2 TIMSS 2003 South Africa
standard deviations).
Since there are numerous estimates for “learning gains” presented in Table 3, it is important
to motivate for the particular learning gain estimates used below. Given that the test was
calibrated at the grade 3 level, the distribution of the grade 5 students on the grade 3 test
may not be an accurate reflection of the true grade 5 distribution since it may be constrained
due to a ceiling-effect leading to over-concentration at the top end of the distribution.
Consequently, it is arguable that the learning gains between grades 3 and 4 are a more
accurate reflection of true learning gains than those between grades 4 and 5 in NSES.
Secondly, given that we are only trying to measure the increase in mathematical proficiency
and not the portion attributable to increased language competency, it is arguable that the
estimates using the sub-set of no-language items is more accurate than those for the full
test. Furthermore, if one uses the full test results for grade 3 NSES, it will necessarily
overestimate the learning between grades 3 and 4 due to underestimating the baseline
learning in grade 3 due to language issues. Lastly, if one has to choose between the full
sample and the panel sample (i.e. only those we can follow from grades 3 to 4), it is
arguable that when trying to estimate learning in a year it makes sense to choose the panel
sample. This is because the students who are in the NSES grade 4 sample but who are not
in the grade 3 sample are more likely to have repeated grade 4 and thus this would
overestimate the amount of learning occurring in grade 4. As a result of the above I use the
no-language balanced panel estimate for the learning gain for a single year between grades
3 and 4, i.e. 0.28 standard deviations. Incidentally this is the same as the learning gain seen
18
The TIMSS standard deviation is roughly 100 points while the South African TIMSS 2011 standard deviation was 86 points (Mullis et al., 2012, p. 488).

53
in the full test balanced panel sample for the same grades. For the learning gain between
grade 8 and grade 9 there is only one estimate: 0.2 standard deviations (using TIMSS).
Given that all of these tests were administered at the end of the year, the learning gains are
for the later grade, i.e. 0.28 is the learning that occurs in grade 4 and 0.2 is the learning gain
that occurs in grade 9, on average, in South Africa.
Given that there are in essence only two points in the South African system for which we
have psychometrically comparable data for a year of learning (grades 3 to 4 and grades 8 to
9), and also due to a lack of South African scholarship in this area with which to compare the
above results, I provide two types of analysis. The first uses a single rough estimate applied
uniformly across the grades. Given the estimates presented in Table 3 above and the
preceding motivation, a reasonable rule of thumb for a year of learning in South Africa is 0.3
standard deviations. After this I allow for the amount of learning (in standard deviations) to
differ by grade.
Applying the above method it is possible to calculate the difference in average achievement
between Quintile 1 (poorest 20% of students) and Quintile 5 (wealthiest 20% of students) for
the different surveys and then convert these into a common standard-deviation metric. The
difference between Quintiles 1 and 5 is 28 percentage points in NSES grade 3, 130
SACMEQ points in grade 6, and 122 TIMSS points in grade 9. These different metrics are
not directly comparable and there is no simple way of equating the scores. Consequently I
convert the differences into within-survey standard deviations using the full national standard
deviation and then, using the 0.3 standard deviation benchmark as one year of learning, one
can convert the difference and say that it is equal to 4 grade-levels in grade 319 (NSES), 4.4
grade-levels in grade 6 (SACMEQ) and 4.7 grade-levels in grade 9 (TIMSS).
Lewin (2007) provides a useful conceptual model for the trajectory needed to reach a
particular goal – in this case matric (grade 12). He refers to an ‘on-track-line’ and an ‘off-
track-line’ where the off-track-line is any line below the on-track-line. In the present example,
the on-track-line is calibrated to be equal to the average performance of Quintile 5 students.
To illustrate the above in a graph, I set the average Quintile 5 achievement to be equal to the
‘grade-appropriate’ benchmark such that the learning trajectory of these students is on the
“on-track” trajectory and will reach matric (grade 12) performing at roughly a grade 12 level. I
then calculate the difference between this ‘benchmark performance’ and the average
19
This would essentially place most Quintile 1 grade 3 students at a level below grade 1, i.e. grade R.

54
performance of Quintiles 1, 2, 3 and 4 and then convert this difference into grade-level
equivalents using 0.3 standard deviations as equal to one grade-level of learning. Doing so
is essentially create a learning trajectory spanning from grade 3 (NSES) to grade 9 (TIMSS)
with linear projections for those grades where there is no data (grade 7, 8, 10, 11 and 12).
The exact figures for all calculations are provided in Appendix A. Figure 10a below shows
the likely learning trajectories of the average student in each quintile of student
socioeconomic status. It shows that the average student in Quintile 1, 2 and 3 is functioning
at approximately three grade-levels lower than the Quintile 5 benchmark in grades 3, 4, 5
and 6. Observing average performance by quintile in grade 9 shows that the difference
between Quintile 1, 2 and 3 students and Quintile 5 students (the benchmark) has now
grown to more than four grade-levels. If it is assumed that Quintile 5 students in grade 9 are
functioning at roughly a grade 9 level, then Quintile 1 and 2 students are functioning at
roughly a grade 4.5 level in grade 9. The trajectory lines, one for Quintile 5 and one for the
average of Quintiles 1-4, show that in grade 3 there already exist large differences in
performance (approximately three grade-levels) and that by the time children enter grade 9
this gap in performance has grown to about four grade-levels. The linear trend in
performance between these two groups suggests that if the same number of students in
Quintiles 1-4 in grade 9 continued in schooling until grade 12 (i.e. no drop out between these
two periods) they would be functioning at approximately 4.9 grade levels lower than their
Quintile 5 counterparts in grade 12 (1,5 standard deviations lower).
The reason why one cannot easily use the matric (grade 12) data as another point in the
learning trajectory is the substantial number of students that drop out of schooling between
grade 9 and grade 12 in South Africa. Taylor (2012, p. 6) shows that the average enrolment
in grades 4, 7 and 10 between 2008 and 2011 in South Africa was approximately 1 000 000
in each grade, but by grade 12 this figure drops to roughly 600 000 students. Consequently,
if one were to include grade 12 as a data point one would need to make a number of
assumptions about dropout and the differential distribution of dropout across the
socioeconomic spectrum. This is not included in the present chapter.
Returning to Lewin’s (2007) notion of an “on-track” progress line, perhaps the most important
conclusion arising from this conceptual framework is that any performance below the “on-
track” line creates an increasing gradient of expectation as the pupil moves into higher
grades. As pupils’ learning deficits grow, the gradient of what needs to be achieved to reach
the goal then progressively steepens to the point where it enters what Lewin (2007, p. 7)
refers to as a ‘Zone of Improbable Progress.’ For example, the improvement that is required
to bring the average grade 9 Quintile 1 student in South Africa up to the required benchmark

55
by grade 12 is unrealistic given that they are performing at roughly a grade 5 level in grade
9. By contrast, the gradient of achievement required to bring the average Quintile 1 grade 3
pupil up to the required benchmark by matric is slightly more manageable. The clear
conclusion arising from this analysis is that intervening early to correct and prevent learning
deficits is the only sustainable approach to raising average achievement in under-performing
schools.
What we would add to this conclusion is that the root cause of these weak educational
outcomes is that children are acquiring debilitating learning deficits early on in their schooling
careers and that these remain with them as they progress through school. Because they do
not master elementary numeracy and literacy skills in the foundation and intermediate
phases, they are precluded from further learning and engaging fully with the grade-
appropriate curriculum, in spite of being enrolled in school. Lewin (2007, p. 10) refers to
these children as ‘silently excluded’ since they are enrolled and attending school but learning
little.
Variable learning gains per year
Given that the international literature shows that there are in fact differential learning gains
(in standard deviations) by level of study, with larger gains at earlier years (Hill et al, 2007), I
calculate probable learning gains for each grade between grade 3 and 9. Table 3 above
shows that the learning gain in grade 3 was 0.28 standard deviations and in grade 8 was 0.2
standard deviations. Using a linear interpolation I calculate the learning gains (in standard
deviations) for each intervening grade. I then recalibrate the graph (Figure 10a) using these
new learning metrics and create Figure 10b. From the latter figure one can see that although
students are still approximately three grade levels behind in grade 3, this grows to 5,5 years
behind by grade 9. Using differential learning gains across different grades shows that
poorer students fall further and further behind their wealthier peers as they progress into
higher grades.

56
FIGURE 10A: SOUTH AFRICAN MATHEMATICS LEARNING TRAJECTORIES BY NATIONAL SOCIOECONOMIC QUINTILES USING A CONSTANT STANDARD DEVIATION (0.28) FOR ONE
YEAR OF LEARNING (BASED ON NSES 2007/8/9 FOR GRADES 3/4/5, SACMEQ 2007 FOR GRADE 6 AND TIMSS 2011 FOR GRADE 9, INCLUDING 95% CONFIDENCE INTERVAL)
0
1
2
3
4
5
6
7
8
9
10
11
12
13
Gr3 Gr4 Gr5 Gr6 Gr7 Gr8 Gr9 Gr10 Gr11 Gr12
(NSES 2007/8/9) (SACMEQ2007)
Projections (TIMSS2011)
Projections
Eff
ecti
ve g
rad
e
Actual grade (and data source)
Quintile 1
Quintile 2
Quintile 3
Quintile 4
Quintile 5
Q1-4 Trajectory
Q5 Trajectory

57
FIGURE 10B: SOUTH AFRICAN MATHEMATICS LEARNING TRAJECTORIES BY NATIONAL SOCIOECONOMIC QUINTILES USING A VARIABLE STANDARD DEVIATION FOR A YEAR OF
LEARNING (0.28 IN GRADE 3 TO 0.2 IN GRADE 8 WITH INTERPOLATED VALUES FOR IN-BETWEEN GRADES (BASED ON NSES 2007/8/9 FOR GRADES 3/4/5, SACMEQ 2007 FOR
GRADE 6 AND TIMSS 2011 FOR GRADE 9, INCLUDING 95% CONFIDENCE INTERVAL)
0
1
2
3
4
5
6
7
8
9
10
11
12
13
Gr3 Gr4 Gr5 Gr6 Gr7 Gr8 Gr9 Gr10 Gr11 Gr12
(NSES 2007/8/9) (SACMEQ2007)
Projections (TIMSS 2011) Projections
Effe
ctiv
e g
rad
e
Actual grade (and data source)
Quintile 1
Quintile 2
Quintile 3
Quintile 4
Quintile 5
Q1-4 Trajectory
Q5 Trajectory

58
METHODOLOGICAL CAVEAT
Given that each of the three tests used in this analysis was developed and
administered by a different organization, it is useful to provide some indication of how
these tests were developed, the content that they covered and whether or not they
were aligned to the South African curriculum at each grade. Full discussions of the
psychometric properties of the items in each test are beyond the scope of this study
but are available for each test; NSES (Taylor et al, 2013, Ch. 2), SACMEQ (Ross et
al, 2005, Ch. 2) and TIMSS (Foy, Arora, & Stanco, 2013).
The NSES numeracy test was constructed to be completely aligned with the National
Curriculum Statement, which was the curriculum at the time. As mentioned
previously, the test was the same as the grade 3 Systemic Evaluation of 2007, which
was commissioned by the Department of Basic Education to monitor grade 3
outcomes relative to the grade 3 curriculum (Taylor et al., 2013). Approximately 60%
of the items in the test covered four tasks which forms the fundamental building
blocks of mathematics namely: counting and ordering whole numbers, addition,
multiplication and subtraction (Taylor et al. 2013). The remainder of the problems
were split between items dealing with fractions, decimals, patterns, graphs, shapes
and measurement (Taylor & Taylor, 2013). The difficulty level of these questions
ranged from a Grade 1 level to a Grade 4 level, as discussed in the data section
above. Given that the same test was administered in grades three, four and five, one
can think of the test becoming easier over time as students acquire new skills and
find the test questions from earlier grades easier to understand and answer correctly.
Since the NSES test was predominantly a grade 3 test, we do not interpret the
learning gains from grade 4 to grade 5 as being authoritative and prefer to use the
gains between grade 3 and grade 4. This is discussed in more detail below with
reference to Table 1.
The construction of the SACMEQ test was done so as to ensure congruence with the
curricula, syllabi, exams and textbooks used in all of the participating countries (Ross
et al., 2005). The content of the SACMEQ test falls under three broad domains
namely number, space and data, and measurement. Given that there are multiple
countries that participate in SACMEQ, and that the SACMEQ assessments need to
find common domains across most education systems, these tests can be thought of
as assessing the core mathematics curriculum and competencies at the grade 6 level
(Ross et al, 2005). In the South African SACMEQ 2007 report, written by the South

59
African Department of Basic Education, they explain that “In the national curriculum
statement emphasis is placed on teachers designing tasks in such a way as to
ensure that a variety of skills are assessed. The eight SACMEQ levels for reading
literacy and mathematics presented in this report provide an appropriate benchmark
to model assessments and structure learning such that learners may be exposed to
the expected range of competencies for their age group (Moloi & Chetty 2011, p. 7;
emphasis added).
The TIMSS mathematics test covered the broad content areas of number, data and
chance, algebra and geometry, and the cognitive domains of reasoning, knowing and
applying (Mullis et al., 2012). A comparison between the TIMSS 2011 mathematics
assessment framework and the Revised National Curriculum Statement (the
curriculum in use at the time of testing) indicates that there is a 94% overlap (Reddy,
et al., 2012). It is also important to remember that South Africa takes part in TIMSS
by testing its grade 9 students despite this being a grade 8 test internationally.
As can be seen in the discussion above, the type of mathematics tested in each of
these tests differs to some degree between the three assessments since each test
may place more or less weight on a particular learning area. This is an important
point since it is possible that student outcomes (or the gaps between rich and poor
students) are also a function of the items on the test rather than their true
performance (or the true gaps between rich and poor students). For example, if one
looks at TIMSS, South African students achieved at the bottom of the international
TIMSS 2011 mathematics rankings, with 32% performing no better than random
guessing (Mullis et al., 2012, p. 457). Consequently, it is prudent to ask whether or
not the 2011 TIMSS international grade 8 test was more challenging than the grade 9
curriculum in South Africa. If this is the case – and the performance of quintile 5
students declines less than that of students in quintile 1-4 as a result - then the gap
between rich and poor could be seen to grow between grade 6 (SACMEQ) and
grade 9 (TIMSS) when perhaps the gap remained unchanged in reality.
However this does not seem to be the case. If one looks at the performance of South
African grade 9 students on the TIMSS 2011 grade 8 mathematics test, one can see
that only 3% of students achieved the ‘High’ or ‘Advanced’ TIMSS benchmarks
(Reddy et al., 2012, p. 11). If one compares this to the performance of all grade 9
students on the South African grade 9 Annual National Assessments (ANA)
conducted in 2012 and 2013 in South Africa, one sees similar results. Only 2-3% of

60
grade 9 students in each year reached “Acceptable achievement” as defined by the
Department of Basic Education (DBE, 2013, p. 53). Importantly these tests are
specifically aligned to the South African curriculum. Given these low results the
Minister of Basic Education in South Africa convened a task team to look at the
grade 9 mathematics ANA test to determine if it was too difficult. The task team
concluded that the test was “fair, valid and reliable” leading the Minister to conclude:
“the results are a genuine and credible reflection of the learning achievements in
grade 9 maths” (Motshekga, 2013). Therefore, while it is true that South African
students do seem to find the TIMSS test more difficult, this is largely because they
are falling behind relative to the curriculum not because the tests are unreasonably
difficult relative to the curriculum.
To summarize the methodological discussion above, it has been argued that the
three tests (NSES, SACMEQ and TIMSS) are a relatively accurate representation of
the broad mathematics achievement of South African students at each stage (grade
3, 4, 5; 6 and 9 respectively). The aim in using these three assessments is not to
estimate the gaps in learning with pinpoint precision – that would require longitudinal
data. However, longitudinal data spanning these seven years is not available in
South Africa. Consequently, we use multiple cross-sectional datasets and argue that
they are broadly aligned to the curriculum at grade 3, 6 and 9. It is possible that this
curriculum-alignment assumption is false. If, for example the grade 9 test (TIMSS) is
more difficult that the average mathematics found in the curriculum at grade 9, the
gap between quintile 5 and quintile 1 could possibly increase even if the ‘true’ gap
remains unchanged. This would only be the case if the standard deviation did not
increase and simultaneously quintile 1-4 students did disproportionately worse than
quintile 5 students. However it is also possible that a more right-skewed distribution
(due to a more difficult test) could decrease the standard deviation due to additional
bunching at the bottom of the distribution. Given that the gap in years is a function of
both the standard deviation and the absolute gap between the quintile 5 and the
other quintiles (and that these could move in different directions), it is unclear what
the net-effect would be on the size of the gap if the tests were of vastly differing
curriculum-alignment. However, as is argued above, we do not believe that any of
these tests is grossly misaligned with the curriculum at that grade.
The practice of comparing standard deviations across different samples and different
assessments (as I do in this chapter) is something that has only recently begun to be

61
scrutinized by the academic community. For example, McKenzie (2015) in reflecting
on the most recent American Economic Association conference (2015) questions
whether the difference in observed effect sizes between NGO interventions and
government interventions can be explained by different samples. He explains by
using the following example:
“Consider the following example, where both run the same intervention to try to improve test scores in India. The NGO works with a very homogeneous group (control mean score 50%, standard deviation of 5%). The NGO increases test scores by 1 percentage point, which is a 0.2 S.D. improvement. The Government works with a much more diverse set of kids, with the same control mean (50%), but standard deviation of 20%. The Government program increases test scores by 2 percentage points. Despite this being twice as large as the NGO effect, when converted into units of S.D., it is only half the size (0.1 S.D.). i.e. comparing effect sizes in terms of units of standard deviations artificially inflates the effectiveness of interventions done on more homogeneous groups, all else equal” (emphasis in original) (McKenzie, 2015).
Commenting on McKenzie’s review, Singh (2015) cautions against comparing
standard deviations when there are different samples, different tests and/or different
scaling procedures, arguing that all of these can influence the standard deviation and
thus comparability across samples, tests and contexts. The caution regarding
different samples and different contexts is less applicable here given that all three
studies tested nationally representative20 samples in the same context (South Africa).
However, it is possible that the standard deviation in each study is influenced by the
content covered and the scaling procedures used. Given that these differ somewhat
across the three studies, these factors could influence the results. Given that this is a
particularly recent concern raised in the literature there are currently no clear
solutions or alternatives.
2.6 CONCLUSION
The above analysis has provided an overview of the size and distribution of learning
deficits in the South African education system. Using local and international
assessments of mathematics achievement and converting test-score gaps into
standard deviations and then into grade-levels of learning, it was possible to estimate
20
The National School Effectiveness Study (NSES) is not nationally representative because it did not include Gauteng (as explained earlier) but still spans the full socioeconomic spectrum of South African students and schools.

62
empirically and illustrate graphically the learning trajectories of wealthy and poor
students in South Africa. The key finding emerging from this research is that by
grade 3, children in Quintiles 1-3 are already three years’ worth of learning behind
their Quintile 5 peers and that this gap grows as they progress through school to the
extent that by grade 9 they are four years’ worth of learning behind their Quintile 5
peers. Previous studies have shown that this low quality of education offered to the
poor eventually becomes a poverty trap (Van der Berg et al., 2011). Thus one can
say that poor children in South Africa, who make up the majority, are starting behind
and staying behind, casting doubt on the ability of the South African schooling
system to impart to students the knowledge, skills and values they need to become
full members of society and thus promote social mobility.
The clear policy recommendation that proceeds from these findings is that any
intervention to improve learning in South Africa needs to intervene as early as
possible. Given South Africa’s egregiously high levels of inequality, it should come
as no surprise that poor children in South Africa find themselves at a nexus of
disadvantage, experiencing a lack of social, emotional and cognitive stimulation in
early childhood. These children then enter a primary school system that is unable to
equip them with the skills needed to succeed in life, let alone to remediate the large
learning deficits they have already accumulated to date.
When faced with limited resources and a choice of where to intervene in the
schooling system, the counsel from both the local and international literatures is
unequivocal; the earlier the better. The need to focus on the primary grades, and
especially the pre-primary years, is not only driven by the fact that underperformance
is so widespread in these phases, but also because remediation is most possible and
most cost-effective when children are still young (Heckman, 2000). Due to the
cumulative negative effects of learning deficits - particularly for vertically-integrated
subjects like mathematics - it is not usually possible to fully remediate pupils if the
intervention is too late (i.e. in high school), as too many South African interventions
are. Nobel Laureate Professor James Heckman summarises the above succinctly
when he explains that:
“Policies that seek to remedy deficits incurred in early years are much
more costly than early investments wisely made, and do not restore lost
capacities even when large costs are incurred. The later in life we attempt
to repair early deficits, the costlier the remediation becomes” (Heckman,
2000, p. 5).

63
CHAPTER 3: HOW LARGE DOES LANGUAGE LOOM FOR
LEARNERS’ LITERACY AND NUMERACY PERFORMANCE IN
GRADE THREE IN SOUTH AFRICA
3.1 INTRODUCTION
The topic of language in education is a contentious one internationally, and this is
particularly the case in the South African context. While many countries have
suffered the subjugating effects of colonisation and linguistic imperialism – including
South Africa under the British – South Africa was also subject to 46 years of
legislated racial exclusivity and linguistic inequality under apartheid. The language
policies introduced during apartheid held both symbolic and practical value for the
ruling government and were consequently resented by the majority of black South
Africans. This resentment reached its zenith in the Soweto Uprising on the 16th of
June 1976 when over 20,000 students protested in the streets in opposition to the
introduction of Afrikaans as the medium of instruction, with hundreds of students
massacred by the police (Ndlovu, 2004).
While the Soweto Uprising is chiefly remembered as a reaction to the Afrikaans
language policy, it was also precipitated by the unequal quality of education offered
to black students under apartheid (see also Fiske and Ladd, 2004; Mesthrie, 2002).
While it may seem strange to discuss the intricacies of the Soweto Uprising in a
chapter dedicated to the causal impact of language on performance, this is done so
as to highlight an important parallel between the two topics: the distinction between
the language of instruction and the quality of instruction. More often than not
language scholars conflate these two issues of language and quality but then
proceed to talk about only language, as if quality was somehow subsumed under the
all-encompassing umbrella of language. As will become clear, it does not. Isolating
the causal impact of either of these factors is particularly difficult in South Africa
given that they are both highly correlated and also strongly associated with other
factors that influence performance, factors such as parental education, teacher
quality, resources, geographic location, school functionality and socioeconomic
status.
The aim of this chapter is to try and disentangle these two highly correlated impacts
in order to provide some empirical evidence regarding the size of these effects, and

64
particularly the impact of language after accounting for quality and home
background. To do so I exploit two factors: (1) the fact that the vast majority of South
African students are taught in their mother tongue for the first three years of
schooling before switching to English21 in grade four, and (2) that it is possible to
identify and match 3402 grade three students who were sampled and included in
both the Systemic Evaluation of September 2007 and then also the National School
Effectiveness Study (NSES) of October 2007. These two surveys used the same test
instrument with the exception that the first test (Systemic Evaluation) was written in
the language of learning and teaching (LOLT) of the school – typically an African
language when the majority of the students are black - and the second test (NSES)
written one month later was written in English. Importantly, the NSES sample was a
sub-sample of the Systemic Evaluation, making it possible to match a significant
number of students across the two surveys. Using these matched students and their
performance in the two tests one can identify what proportion of the score achieved
by students in numeracy and literacy is attributable to writing in English and what
proportion is attributable to other factors.
3.2 LITERATURE REVIEW AND BACKGROUND
Throughout the world scholars have been at pains to stress the links between
language and nationhood (Weber, 1976), language and identity (Edwards, 2012),
language and culture (Kramsch, 1993) and language and power (Fairclough, 1989).
Most of these scholars – and particularly those that deal with language and
education – have argued that policy decisions about language in education must
consider far more than simply communicative efficiency, test scores or functional
literacy. Applying these insights to the South African context, Neville Alexander has
argued persuasively that South Africa’s colonial and apartheid history further cement
these links between language, class, power and identity (see Alexander, 2005 for an
overview).
While it is true that that the issue of language in education cannot be reduced to a
discussion of fluency, proficiency and literacy scores (in either home language or in
21
Technically students can switch to either English or Afrikaans, but in reality almost all students who do
switch language in grade four switch to English (Taylor and Coetzee, 2013). See also Figure 11 below.
For the remainder of the chapter I therefore speak about “switching to English” rather than “switching to English or Afrikaans.” The language used by teachers in South African primary and secondary schools is often not a clear cut match to the Language of Learning and Teaching due the widepsread practice of code-switching and code-mixing (Fleisch, 2008; Heugh, 2012). Consequently, much of the switch to English from an African language occurs through books students are given.

65
English), it is also true that these are legitimate areas of enquiry when speaking
about language in South Africa, or any other country. Given that this is the focus of
the present study, and that the broader issues have been discussed at length
elsewhere (see Mesthrie, 2002 and Murray, 2002 for overviews), the discussion turns
to the relationship between language proficiency and academic achievement.
Fleisch (2008) and Hoadley (2012) usefully summarize the most prominent causal
theories showing how these two outcomes (language and achievement) are inter-
related. The five “mutually reinforcing and interconnected causal mechanisms”
(Fleisch, 2008, p. 105) that they identify are (1) transfer theory and the density of
unfamiliar words, (2) emotions of second-language teaching, (3) code-switching, (4)
English language infrastructure, and (5) language and power. Table 4 below
summarises some of the literature from each of these areas and categorises each
one according to the purposes of this study. These are (1) language factors, (2) non-
language factors, and (3) factors where there is an interaction between language and
non-language factors. It further splits the literature by (1) learners/learning,
households/parents (2) teachers/teaching, and (3) assessment. The intention here is
not to provide an exhaustive list of factors but rather a list that is indicative of the
types of factors in each category. Unfortunately almost all of the studies reported
here are small in size and their account of the “language question” continues to
underemphasize unobservable characteristics that are correlated with language.
They have not attempted to tease these out empirically, or at least not with any
technical rigor.
While most of the issues in Table 4 are self-explanatory, it is worth briefly discussing
the issue of transfer theory and the density of unfamiliar words (Fleisch, 2008, p.
105), partly because this has received considerable scholarly attention (both locally
and internationally) but also because it provides a good case study of the limitations
of qualitative research, particularly as related to language. Drawing on language
acquisition theory and particularly the work of Cummins (2000, 1984) and Skutnabb-
Kangas (2000, 1988), researchers have argued that students need to first master the
decontextualized discourse of schooling before switching to a second language
(Alidou et al., 2006; Heugh, 2012, 2005a, 2005b, 1993). For example, Macdonald
(1990) identified that black grade five Setswana children had at most 700 words in
English when the curriculum required at least 7000 words (Hoadley, 2012, p. 189).
This, together with their insufficient grasp of the linguistic structure of English,
seriously limited their ability to read (and particularly to read for meaning) in English.
Following on from this, children who have not learnt to read cannot read to learn.

66
TABLE 4: FACTORS RELATED TO LANGUAGE OF LEARNING AND TEACHING (LOLT) AND STUDENT PERFORMANCE ON ASSESSMENTS
Factors related to LOLT,
performance and
assessments
Teachers/teaching Learners/learning and households/parents
Assessment
Language factors
(1) Teacher proficiency in LOLT (Cazabon et al., 1997; Heugh, 2012; Macdonald and Burroughs, 1991), (2) Teacher training in LOLT, (3) Teacher confidence in LOLT, (4) Lack of teacher support material in the LOLT (Welch, 2011)
(1) Density of unfamiliar words and the inability to ‘move’ to a new language (Heugh, 2012; Macdonald and Burroughs, 1991) (2) Emotions of learning in a second language (Probyn, 2001), (3) Lack of exposure to English language infrastructure in the school, community and the home (especially for rural students) (Setati et al., 2002; Welch, 2011)
(1) Lack of exposure to the test language (English) at home (Howie et al., 2007; Reddy, 2006) (2) understanding of the language-content of the test (3) the quality of the translation/versioning (Stubbe, 2011)
Non-language factors
(1) Teacher content knowledge (Carnoy and Chisholm, 2008; N. Taylor and Taylor, 2013; Venkat and Spaull, 2014), (2) Pedagogical content knowledge (Ball et al., 2005; Carnoy et al., 2012), (3) curriculum coverage (Reeves et al., 2013b) (4) teacher absenteeism (Prinsloo and Reddy, 2012), (5) teacher professionalism (NPC, 2012; N. Taylor, 2011), (6) school functionality (NEEDU, 2013).
(1) Parental education and household socioeconomic status (Timæus et al., 2013) (2) Exposure to quality preschool education (Heckman, 2000), (3) nutrition, socio-emotional stimulation and child health (Shonkoff et al., 2012)
(1) Psychometric validity of the test, (2) difficulty level of the test, (3) length of the test (for overviews see Greaney and Kellaghan, 2008; Postlethwaite and Kellaghan, 2008)
Interaction between language and non-language factors
(1) Teachers restrict classroom interactions to low-level cognitive tasks due to children's insufficient language proficiency (Heugh, 2005a, 2005b; Macdonald and Burroughs, 1991; Macdonald, 1990), (2) Teaching using code-switching and language-translation takes additional time that the curriculum may not accommodate (Setati and Adler, 2000).
(1) Students that cannot read (properly) in the LOLT cannot learn (properly) in the LOLT (Macdonald, 1990; Mullis et al., 2011)

67
One of the most prominent research projects looking at language and the transition from
mother tongue to English in South Africa was the Threshold Project carried out by Carol
Macdonald and various colleagues in 1987. These case studies focussed on the language
learning difficulties of black children when they switch from their mother tongue to English in
four schools. In their discussion of this project, Macdonald and Burroughs (1991, p. 58)
conclude as follows:
“In the DET22 curriculum, the present policy means that not enough time is given
to English in order to prepare the children for learning in English in Standard 3
[Grade 5]. In other words, English is merely taught as a subject in the lower
primary, which is unsatisfactory if English is to become the language of
instruction in Standard 3 [Grade 5]. Up to a third of the total teaching and
learning time should be devoted to the learning of English.”
The research emanating from the Threshold Project has been particularly influential as far as
South African language policy and research is concerned. For example, despite being
conducted in 1987, the above quote from 1991 essentially summarises the view that has
subsequently found its way into the new curriculum (DBE, 2011c, p. 9), which introduces a
minimum time requirement for First Additional Language (English in most cases). It is also
expressed in the National Development Plan which states that, “Learners’ home language
should be used as medium of instruction for longer and English introduced much earlier in
the foundation phase” (NPC, 2012, p. 304). The Threshold Project is still regularly referred to
in the literature (Fleisch, 2008; Heugh, 2012; Hoadley, 2012) despite having been conducted
in 1987. To be sure, the influence of these case studies is largely warranted given their in-
depth, innovative, and methodologically rigorous approach to the topic.
Notwithstanding the above, it is worth emphasising three points that call into question the
external validity of the study: (1) the Threshold Project was essentially a case study of four
schools (Lefofa, St Camillus, Selang and Seroto) which were all situated in one circuit
(Moretele Circuit) in one homeland (Bophuthatswana) (Macdonald, 1990, p. 8), (2) due to
the fact that homelands were linguistically-zoned, all of these students were Setswana
speakers (Setswana is now one of the 11 official South African languages), and (3) the
majority of the research was conducted almost three decades ago in 1987 when there was a
different curriculum, with different teacher training institutions, different levels of resources,
and when the language switch to English happened one year later (grade five) than it does
now (grade four). It is unfortunate that the study has not been replicated in other contexts or
22
The term ‘Department of Education and Training’ (DET) referred to the education system reserved for Black
South Africans under apartheid.

68
in more recent years since these newer studies could point to context-specific factors (if
there are any) or how things have changed since 1987.
In essence the Threshold Project tells us a great deal about how the children in these four
Setswana schools managed the transition from an African language to English in grade 5.
Many of these findings do seem to be generalizable to other African-language students who
face similar constraints (linguistic and otherwise) when switching from an African language
to English. This being said, we should be cautious about immediately generalizing findings
from any case study to the thousands of South African schools where students switch from
an African language to English. The four schools that were included in the Threshold Project
may have been more or less functional than the average school, may have had more or less
resources than the average school, may have had more or less capable teachers than the
average school, may have had students who were more or less linguistically homogenous
than the average school, etc. All of these factors are likely to affect how students transition
from their home language into English at school.
While these four schools may have been relatively representative of primary schools in the
Bophuthatswana homeland, one should be cautious of extending the generalizability to
schools in other homelands, since Bophuthatswana may have been quite different to the
other homelands. For example Chisholm (2013) explains that by 1985 the vast majority of
primary schools in Bophuthatswana (760/840 schools) had experienced the Primary
Education Upgrade Programme (PEUP). In this regard she explains that “A decade after it
was first introduced, the PEUP was described as having ‘infused primary education in
Bophuthatswana with a new spirit and orientation’ and for being responsible for its much
better educational showing than other Bantustans (Taylor, 1989)” (Chisholm, 2013, p. 403).
The aim in highlighting these potential external validity concerns is not to call into question
the findings of the Threshold Project - findings which seem to have been confirmed in other
less in-depth studies (Setati et al., 2002; Taylor et al., 2013) -, but rather to stress the paucity
of rigorous research on language transition in South Africa post-apartheid. Thus Hoadley
(2012, p. 193) is correct in stating that:
“The question of why, and by how much language and especially learning in an
additional language, affects achievement remains open. Fleisch (2008) makes
the important observation that it is very likely that the use of English as the
language of instruction is likely to have different effects across different groups of
learners, especially with regard to social class and those in rural and urban
areas. In other words, a consideration of the social context in which any
language is being taught needs to be considered.”

69
This is in stark contrast to Heugh (2012), who summarises the “large body of South
African research on bilingual education and transitional bilingual programmes” and
concludes that:
“There is no need for more research to identify the problem or how to remedy it.
The answers to these questions have already been established through research
conducted in South Africa. There is no reliance on international research in this
regard” (Heugh, 2012, p. 14).
However, it is not entirely clear which ‘large body’ of South African research Heugh is
referring to. It is perhaps telling to look at the studies which Heugh (2012, p. 13) presents as
her selection of this large body. Apart from the work of Malherbe (1946), the remaining three
references are two case studies and a policy document. The first case study (Ianco-Worrall,
1972) observes 30 White Afrikaans-English bilinguals in Pretoria, the second (Macdonald,
1990) looks at four schools in Bophuthatswana in 1987, as discussed above, and the policy
document (LANGTAG, 1996) is not even a research document and does not present
research findings, it was meant to advise the Minister of Education on developing a National
Language Plan for South Africa. For a similarly small, case-study type approach, Brock-Utne
(2007) observes two classes of isiXhosa children and concludes that they learn better when
being instructed in their home language (for similar studies in other African coutries see
Alidou et al., 2006).
While case studies are especially important in this field, they cannot be generalized to large
populations unless they are designed in such a way that they can be regarded as a sample
that is representative of that underlying population (which has never been done in South
Africa), or are replicated in a number of different contexts. Case studies are indicative and
can point to underlying problems and potential solutions, but before they can inform policy
they need to be replicated in multiple contexts or with a large sample of schools, both of
which ensure that findings are not context-dependent. Unfortunately educationists continue
to limit themselves to largely qualitative methodologies and undertake small-scale studies
that lack external validity. (For a recent exception to this general paucity, see Taylor and
Coetzee (2013) who employ a quantitative approach using administrative and assessment
data for 9 180 schools in South Africa).
3.3 CAVEATS AND EXTENSION
Where the present study differs from most previous quantitative work on language and
achievement is that it focuses on grade three, the period before students switch to English in
grade four. By observing students ‘pre-switch’ we are essentially controlling for all the

70
“language factors” in Table 4 and avoiding confounding influences inherent in any analysis of
language post-switch. If one were to analyse students in grade 6, for example, it would be
difficult to disaggregate what proportion of a student’s performance was ‘attributable’ to
language and what proportion to other factors like teacher quality, parental education or
resources at home – all of which interact with language in complex ways. Given how highly
correlated language and non-language factors are, if non-English grade 6 students write a
test in English it is unclear what proportion of their performance is attributable to language
factors and what proportion to non-language factors. Even if one tried to control for language
by testing these grade 6 students in their home language this would be problematic since
they would then be writing in a language (home language) that they had not been learning in
for the previous two years (English). One would also not be able to disaggregate factors
such as the impact of being taught in English for two years by a teacher who may not be
familiar with (or sufficiently proficient in) English. By looking at grade 3 these confounding
factors fall away – students are assessed in the language they know best and in which they
have been taught for three years, most teachers are teaching in their mother tongue (which
is also the LOLT of the school) and students have not yet switched to English. Thus, there
are few (if any) confounding language factors that could affect a child’s numeracy or literacy
performance at the end of grade 3. Put differently, one cannot talk about language factors
being a main cause of poor performance for non-English students at the end of grade 3 -
something which is probably not true of student performance in grade 4 or grade 6, for
example.
By the end of grade 3 most non-English students have had very little (if any) exposure to
English in or outside the classroom (Fleisch, 2008). Tellingly, English instruction was not
timetabled in the grade 3 National Curriculum Statement (NCS) – the prevailing curriculum in
2007, the period under analysis. The Department of Basic Education (DBE), for example,
explains that, “In 2009, less than 1% of learners studied English as an additional language in
the Foundation Phase [grades 1-3]…this despite the fact that the majority of learners in
grade 4 learnt via the medium of either English or Afrikaans” (DBE, 2010, p. 20). Given that
almost all non-English students switch to English as LOLT in grade 4, the difference in
performance when students write a test in their home language relative to English is likely to
be higher in grade 3 than in any subsequent grade. This is the reason why the estimates
presented in this paper cannot be generalized to higher grades. In higher grades students’
prior exposure to English should decrease the difference in performance between a test
written in their home language and one written in English. Thus one can think of the
estimates presented here as the maximum possible language disadvantage attributable to
writing a test in English for non-English students.

71
3.4 LANGUAGE IN EDUCATION IN SOUTH AFRICA
The language in education policy in South Africa encourages that children should be taught
in their home language for at least the first three grades of primary school and thereafter to
switch to either English or Afrikaans. Figures from the 2011 Census show that only 23% of
South African citizens speak either English or Afrikaans as their first language (StatsSA,
2012, p. 23), and consequently it is the vast majority of students that experience a LOLT
switch in grade 4. Figure 11 vividly illustrates this switch to English using data from the
Annual National Assessments (ANAs) of 2013, which tested all students in grades 1-6 and 9
in languages and mathematics. From Figure 11 one can see that while 32% of students
learn in English or Afrikaans in grades 1-3, this figure increases dramatically to 99% in grade
4. Almost all students that learn in an African language in grades 1-3 switch to English in
grade 4.
FIGURE 11: BREAKDOWN OF LANGUAGE OF LEARNING AND TEACHING (LOLT) BY GRADE - ANNUAL NATIONAL
ASSESSMENTS 2013 (N=7 630 240, OWN CALCULATIONS USING VARIABLE ‘LOA_LANG’)
The reasons for the aspirational status of English in South Africa are not difficult to identify.
English is the language of commerce, law, government, parliament, higher education, and
the media in South Africa and is also widely seen as a necessary (although not sufficient)
condition for entry into the upper parts of the labour market. Given its status as “the
language of power” (Murray, 2002, p. 440), there are also significant returns to English
proficiency in South Africa (Posel and Casale, 2011). Internationally, English is also
regarded as the language of global interchange given that it is spoken in more countries
6% 5% 5%
0% 0% 0%
8% 8% 8%
0% 0% 0% 0%
9% 8% 8%
9% 9% 9% 8%
9% 8% 8%
0% 0% 0% 0%
13% 22% 20%
1% 0% 0% 0%
23% 19% 19%
0% 0% 0% 0%
23% 23% 24%
90% 90% 90% 91%
0%
10%
20%
30%
40%
50%
60%
70%
80%
90%
100%
Gr1 Gr2 Gr3 Gr4 Gr5 Gr6 Gr9
English
isiZulu
isiXhosa
Sepedi
Afrikaans
Setswana
Sesotho
Xitsonga
siSwati
Venda
isiNdebele

72
(101 countries) than any other language and has the third largest number of speakers in the
world (behind Chinese and Spanish) (Wiley et al., 2014, p. xii). For these reasons, English is
often perceived as the language of social and economic mobility, as it is in other post-
colonial countries. To provide one poignant example, in India English is seen as a “passport
to the future” (Tollefson and Tsui, 2014, p. 200).
The present study does not look at whether, when, why or how students should transition
from an African language to English, this chapter is instead aimed at contributing some
empirical evidence to the debate regarding how much language (as opposed to other
factors) affects student achievement.
Research questions
The aim of the present chapter is to isolate the causal impact of writing a test in English
when English is not a student’s home language. This broad research area can be broken
down into the following research questions:
1. What is the “cost” (in terms of lost marks) when students are forced to write a
numeracy test in English when English is not their home language?
a. How much worse do students do on high-language-content numeracy items
versus no-language-content numeracy items when they are posed in English
when English is not their home language?
2. What is the “cost” (in terms of lost marks) when students are forced to write a literacy
test in English when English is not their home language?
For students’ whose home-language is not English, does the “cost”
mentioned above differ between items testing the five different literacy
processes of: (1) cloze items and items requiring students to match words to
pictures, (2) items which require that students focus on and retrieve explicitly
stated information, (3) items which require students to make straightforward
inferences, (4) items which require students to interpret and integrate ideas
and information, and (5) items which require students to write sentences. If
so, how large are these differences?
For students’ whose home-language is not English, does the “cost”
mentioned above differ when items are phrased in multiple-choice format or
free-response format? If so, how large is the difference?
The major problem inherent in answering these questions in the South African context is that
one cannot simply use a single test written in English and compare the outcomes of students

73
whose home language is English with the outcomes of students for whom English is a
second (or third) language. This is because English and non-English students differ in a
number of observable and unobservable ways which confound the comparison. This is a fact
that is widely acknowledged in the South African literature:
“There is an association between lower achievement and not speaking the
language of the test at home. However, the effect of language proficiency and
achievement scores is not straightforward. While it is acknowledged that
proficiency in the language of the test is a contributor to the average
achievement score…there are factors other than language that contribute to low
achievement scores – factors such as socioeconomic variables, the nature of
teaching and, importantly, the level of cognitive demand in classroom
interactions in whatever language is used” (Reddy, 2006, p. 90).
“The extent to which language factors contribute to this low performance is not
clear, given that language disadvantages are so strongly correlated with other
confounding factors such as historical disadvantage, socio-economic status,
geography, the quality of school management and the quality of teachers”
(Taylor and Coetzee, 2013, p. 3).
3.5 DATA AND IDENTIFICATION STRATEGY
To estimate the causal impact of test-language on test-performance in the South African
context one can employ one of two methods; either one can sample a large group of
students and then randomly allocate half to writing the test in English and the other half to
writing it in their mother-tongue. Provided that the group is sufficiently large, any observed or
unobserved differences in student attributes should be negligible across the two groups.
Alternatively, one can test the same group of students twice in a relatively short space of
time, once in the LOLT of the school and once in English. The advantage of the second
method is that one does not need as large a sample since factors that do not change
between the tests will be differenced out (things like teacher quality, home background,
parental education, etc.). By using the same group of students across the two tests one is
effectively imposing ceteris paribus conditions with two exceptions: (1) Because students will
have already seen the test, they may perform better on Test 2 than on Test 1 simply
because they remember some of the items, and (2) students may learn new skills or
reinforce previous work in the period between the two tests, which would lead to better
marks in the second test that are independent of language. Both of these instances would
lead to a positive bias in the second test. Given that our a priori is that students perform

74
better on assessments when they are set in their home-language it is arguable23 that the
best sequencing of the two tests would be to test students in their mother-tongue first and in
English second, rather than the other way around. This is the conservative method of
estimating the difference since the positive biases mentioned above (if they exist) will
decrease the difference between the two tests rather than increase the difference as would
be the case if students were tested in English first.
Running a large experiment for the sole purpose of testing the causal impact of test-
language was not possible in the present instance, however, it was possible to exploit a
unique situation in South Africa where a group of students happened to be sampled twice -
for two different surveys – with tests written one month apart. In September 2007 the
Systemic Evaluation tested a nationally representative sample of 54 298 grade 3 students
from 2 327 primary schools (DoE, 2008, p. 1). The aim was to measure the levels of
achievement in literacy and numeracy relative to grade-appropriate curriculum outcomes. At
the same time, the National School Effectiveness Study (NSES) was being planned and
implemented by the Joint Education Trust (JET), the same organization that was providing
technical support to government for the Systemic Evaluation (SE) Test. The NSES decided
to test a sub-sample of grade 3 students from the Systemic Evaluation sample one month
later (October) and tested approximately 16000 students from 268 schools. The NSES used
the same instrument as the Systemic Evaluation, with one major exception: where the
Systemic Evaluation tests (Test 1) were written in the LOLT24 of the school at the grade 3
level, the NSES tests (Test 2) were written in English (Taylor et al., 2013, p. 18). The
implementers of the NSES explain their rationale as follows:
“While SE tests were written in the home language of the learners at Grade 3
level, the NSES tests were written in English. The reason behind this decision
23
It is perhaps easiest to explain by example: if we assume that students score 25% when they write a test in English and 45% when they write the same test in their home-language the ‘true’ causal impact would be negative 20 percentage points. Let us further assume that the two biases mentioned above contribute to an additional 5 percentage points for the second test relative to the first test due to their “learning effect”. Given that we do not know the size of this learning effect bias, if we tested students first in English and second in mother-tongue we would estimate the causal impact to be 25 percentage points (25% - (45%+5%). If we tested students first in mother-tongue and second in English we would estimate the causal impact to be 15 percentage points (45% - (25%+5%). Given that we would rather be conservative in our estimate we would argue that it is better to test students first in their mother-tongue and secondly in English and estimate a lower-bound causal impact of writing a test in English when English is not a student’s mother-tongue. Furthermore, by including a within-test difference (in addition to the between-test difference), the present difference-in-difference analysis accounts for both of these biases as long as they affect all item categories equally – this is discussed in more detail later in the chapter where the difference-in-difference method is explained further.
24 Although the Vorster et al. (2013) quote says “in the home language of the learners”, this is technically not true.
To the extent that the home language of the learner corresponds to the LOLT of the school (which is not always the case) this is correct, since the Systemic Evaluation was conducted in the LOLT of the school, not in the home language of the learner.

75
was that the NSES followed the same cohort of learners for three years,
administering the same test annually. Because most schools for African learners
change their medium of instruction in Grade 4 from mother tongue to English, we
wanted to have comparable scores for the same learners for each of the three
years. Thus while at Grade 4 level the learners would have been disadvantaged
by writing in a language with which they are unfamiliar, this design enabled us to
compare scores directly across the three years. Because the NSES schools
were a subsample of the SE sample the design also provided a unique
opportunity to compare scores by the same Grade 3 learners on the same test
written first in their mother-tongue and second in English.” (Taylor et al., 2013, p.
18).
3.5.1 MATCHING STUDENTS ACROSS TESTS
Given that South African students do not have unique identification numbers, it was not
possible to match all students between the two tests. In addition the selection procedures
employed by the NSES were different to that of the Systemic Evaluation. Where the
Systemic Evaluation randomly selected 25 students from a class, the NSES tested all
students in the class (Vorster et al., 2013, p. 147). In their analysis of learner performance in
the NSES, Vorster et al. (2013) also compare the performance of students between the
Systemic Evaluation and the NSES using a similar method to that employed here. To match
individuals between the two samples they used four initial matching criteria: (1) the unique
school administrative (EMIS25) number, (2) the first three letters of the child’s surname, (3)
the first letter of their first name, and (4) the child’s gender (Vorster et al., 2013, p. 147).
Using this approach they were able to match 2 119 learners in both the NSES and the
Systemic Evaluation datasets. The matching criteria employed by these authors is relatively
stringent as the authors themselves acknowledge: “The matching process was
conservatively done in the sense that errors of excluding learners who did in fact participate
in both evaluations were far more likely than errors of false matches” (Vorster et al., 2013, p.
147). Given that Vorster et al. (2013) were only able to match 2 119 students of the 16 000
that participated in NSES, and that these 2 119 may be quite different to the unmatched
students, they provide a sensitivity analysis comparing performance on the NSES between
the matched and unmatched sample – reproduced below in Table 5. It is important to note
that the lack of Gauteng’s participation in the NSES study will lower the possible matching
rate (since no Gauteng students that participated in SE will be able to be matched in NSES).
25
EMIS stands for the Education Management Information System. Schools’ EMIS numbers uniquely identify all schools in South Africa.

76
TABLE 5: VORSTER ET AL’S (2013: P. 150) COMPARISON BETWEEN THE MATCHED (SE AND NSES) AND
UNMATCHED (NSES ONLY) SAMPLES (REPRODUCED VERBATIM)
NSES Literacy Score
NSES Numeracy score
Number of learners
Unmatched (NSES only) 17,34% 24,57% 14 384
Matched sample 23,08% 33,62% 2 119
Vorster et al. (2013) explain that the difference in performance between the matched and
unmatched sample could be driven by two factors, (1) that weaker children were more likely
to make mistakes writing their names than more literate children leading to more non-
matches among weaker children, and (2) because the selection of the 25 students in the
Systemic Evaluation may not have been entirely random and instead teachers may have
somehow ensured that better students were selected for the Systemic Evaluation (and could
thus effectively be matched) (Vorster et al., 2013, p. 148).
The present comparison employs a different matching technique facilitating the matching of
significantly more students. To match students I used two initial criteria: (1) the school’s
unique administrative (EMIS) code, and (2) the student’s birthday, birth-month and birth-
year. Doing so allowed me to match 3402 unique students, which amounts to 61% more
students than those matched by Vorster et al. (2013). The major problem with this matching
strategy is that there is a relatively high probability that two children in a particular class will
share a birthday. Using the formula below one can see that in a class of 30 students the
probability is 70,6% that two randomly chosen students share the same birthday.
𝑝(𝑛) = 1 − 365!
365𝑛(365 − 𝑛)!
While this may seem problematic at first, the reduction in sample size from dropping all
students who share birthdays in a particular school is relatively small compared to more
stringent matching criteria. Furthermore, it is arguable that sharing a birthday with someone
else in the class is completely random and therefore exogenous to student achievement or
selection. Consequently, dropping these students from the analysis should not bias the
results. However, given that one can only match students with non-missing birthday
information, it is possible that in matching we select stronger students who are more
numerate and therefore less likely to make mistakes. This is unavoidable but is also partially

77
accounted for in the difference-in-difference analysis as discussed below. Table 6 shows the
average numeracy and literacy scores for students in the Systemic Evaluation and the NSES
for ‘unique’ students (i.e. no common birthdays) and duplicate students (common birthdays),
as well as all students (both groups). One possible reason why duplicates (or students
missing date of birth information) perform worse is if weaker students are more likely to
either forget their birthdays, make mistakes in writing them down, or forget to fill them in. If
one compares the average numeracy and literacy scores for the total sample of students
and those who do not share a birthdate (i.e. unique observations after duplicates and
missing data have been dropped), the average scores are not statistically significantly
different.26
TABLE 6: LITERACY AND NUMERACY SCORES FOR GRADE 3 STUDENTS IN THE SYSTEMIC EVALUATION AND
NSES BY UNIQUELY IDENTIFIED INDIVIDUALS AND DUPLICATES
Test 2 - NSES Gr3 (October) Test 1 - Systemic Evaluation Gr 3 (September)
Total Unique
Duplicates
and missing
(on school
and birthdate)
Total Unique
Duplicates
and missing
(on school
and birthdate)
Mean literacy % 18,2% 19,2% 14,6% 32,4% 32,6% 30,2%
Std Err 0,75% 0,77% 0,87% 0,25% 0,25% 0,53%
Mean numeracy % 26,0% 27,5% 20,4% 33,8% 34,0% 31,7%
Std Err 1,18% 1,19% 1,50% 0,36% 0,36% 0,76%
Sample size 16525 13033 3492 54298 49456 4842
One further potential source of false matching is if students forget their birthdates and write
something else down. This is unlikely to lead to false matches since it would require that two
students both forget their birthdate in one of the assessments and then both decide to pick
the other student’s birthdate as their own for the next assessment. This is highly improbable.
Table 7 below reports the average numeracy and literacy performance for the matched and
unmatched samples of the NSES and the Systemic Evaluation. Summing the number of
students between the unmatched Systemic Evaluation (46 054) and matched Systemic
Evaluation and NSES (3402) provides the total unique observations in the Systemic
26
Throughout the present analysis, standard errors are calculated with clustering at the school level if average scores are being calculated and clustering at the individual level if the analysis is at the item-level.

78
Evaluation (49 456) in Table 6 above and similarly for the NSES where the unmatched (9
631) and matched (3402) samples sum to the total unique observations in the NSES (13
033) in Table 6.
TABLE 7: AVERAGE STUDENT PERFORMANCE IN NUMERACY AND LITERACY IN THE SYSTEMIC EVALUATION AND
THE NSES BY MATCHED AND UNMATCHED SAMPLES
Number of students
Numeracy Literacy
SE NSES SE NSES
Unmatched Systemic Evaluation Gr3 (Sept 2007)
46054 34,0%
33,8%
Std. Err.
0,10%
0,08%
Unmatched NSES Gr3 (Oct 2007)
9631
25,7%
18,7%
Std. Err.
0,22%
0,15%
Matched NSES-SE sample 3402 33,4% 32,7% 34,4% 23,2%
Std. Err.
0,38% 0,40% 0,29% 0,26%
From Table 7 above one can see that matched students perform significantly better in the
NSES than unmatched students in the NSES in both numeracy and literacy. However, for
the Systemic Evaluation matched and unmatched students perform essentially the same.
Given that the method employed here takes into account almost all observed and
unobserved heterogeneity – as discussed below – this is not particularly problematic.
One additional concern when employing any matching technique is the impact of matching
on the representivity of the underlying sample. While the NSES 27 and the Systemic
Evaluation were both sampled in such a way that they were nationally representative, the
subset of matched students is not necessarily nationally representative. I return to this in
section 3.7.4 ‘Limitations and caveats.”
3.5.2 DATA STRUCTURE
In order to perform the difference-in-difference analysis, the data needs to be at the item
level rather than the student level. That is to say that it should be transformed from a person-
level database with 𝑁 rows to an item-level database with 𝑁 × 𝐾 × 𝑇 rows, where 𝑁 is the
27
As mentioned previously, the NSES test did not sample students from Gauteng because there were alternative testing programs under way in that province in 2007. In this sense the NSES is nationally representative except for Gauteng.

79
number of students, 𝐾 is the number of items (40 in the case of literacy and 53 in the case of
numeracy) and 𝑇 is the number of tests (2). That is to say that the traditional dataset of one
row per student should be transformed, reshaping twice from wide to long to a dataset of
one row per item per test per student. In matrix-vector format this transformation is
represented as follows:
𝑨:
[ 𝒒𝟏𝟏 𝒒𝟏𝟐
𝒒𝟐𝟏 𝒒𝟐𝟐
𝒒𝟏𝟑 … 𝒒𝟏𝑲
𝒒𝟐𝟑 … 𝒒𝟐𝑲𝒒𝟑𝟏 𝒒𝟑𝟏
⋮ ⋮𝒒𝑵𝟏 𝒒𝑵𝟐
𝒒𝟑𝟏 … 𝒒𝟑𝑲
⋮ ⋱ ⋮𝒒𝑵𝟑 … 𝒒𝑵𝑲]
𝑩:
[ (𝒒𝟏𝟏)
′ (𝒒𝟏𝟐)′
(𝒒𝟐𝟏)′ (𝒒𝟐𝟐)
′
(𝒒𝟑𝟏)′ (𝒒𝟑𝟐)
′
… (𝒒𝟏𝑲)′
… (𝒒𝟐𝑲)′
… (𝒒𝟑𝑲)′
⋮ ⋮(𝒒𝑵𝟏)
′ (𝒒𝑵𝟐)′
⋱ ⋮… (𝒒𝑵𝑲)′]
𝑪:
[ (𝒒𝟏𝟏)
′
(𝒒𝟏𝟐)′
(𝒒𝟏𝟑)′
⋮(𝒒𝟏𝑲)′
(𝒒𝟐𝟏)′
(𝒒𝟐𝟐)′
(𝒒𝟐𝟑)′⋮
(𝒒𝟐𝑲)′⋮
(𝒒𝑵𝟏)′
(𝒒𝑵𝟐)′
(𝒒𝑵𝟑)′
⋮(𝒒𝑵𝑲)′]
where 𝒒𝟏𝟏 = [𝑞1𝑎 𝑞1𝑏]𝑛=1 where a represents the NSES test and b represents the
Systemic Evaluation.
It is not possible to use the weights provided in either the NSES or the Systemic Evaluation
since the weights attached to students correspond to the original samples and not the
smaller matched sample. Consequently the sample is not weighted and is not necessarily
nationally representative. Standard errors are adjusted to account for clustering. When
calculating mean scores clustering is calibrated at the school level (student responses are
clustered in schools), and when calculating mean scores for item-categories clustering is
calibrated at the individual level (item responses are clustered within an individual).
3.5.3 DIFFERENCE-IN-DIFFERENCE ANALYSIS
Estimating the difference-in-difference model for the language test can be accomplished in
one of two ways: One could estimate the regression equation:
𝐿𝑛𝑘𝑡 = 𝜆 + 𝛿𝑁𝑆𝐸𝑆𝑛𝑡 + 𝜑1−4𝐿𝑖𝑡_𝐶𝑎𝑡𝑖𝑘 + 𝛽1−4(𝑁𝑆𝐸𝑆 ∗ 𝐿𝑖𝑡_𝐶𝑎𝑡)𝑛𝑘𝑡 + 휀𝑛𝑘𝑡

80
Where 𝐿𝑛𝑘𝑡 = is the average percentage correct in the literacy test for individual 𝑛 on item-
category 𝑘 in test 𝑡 where 𝑛 ∈ (1,2811); 𝑘 ∈ (1,5); 𝑡 ∈ (0,1) where 𝑡 = 0 for the Systemic
Evaluation, 𝑡 = 1 for the NSES, 𝑘 = 1 for the ‘cloze/word-matching’ category of items, 𝑘 = 2
for the ‘retrieve’ category of items, 𝑘 = 3 for the ‘infer’ category of items, 𝑘 = 4 for the
‘interpret’ category of items and 𝑘 = 5 for the ‘write a sentence’ category of items. 𝜑1−4 are
the four coefficients corresponding to the four dummy variables of literacy categories (with
‘cloze/word-matching’ as reference group). This is typically the strategy employed where
there is no data for the “no treatment state” (Angrist and Pischke, 2009, p. 227). However,
for the present analysis we have data for all individuals on all items for both tests (i.e. for the
treatment and control arms), and thus do not need to make additional assumptions about
omitted variable bias and the required level of aggregation for differentiation.
Given that we have data on all outcomes (treatment and non-treatment) for all students,
using the regression equation to predict outcomes for sub-groups – the purpose of the
present analysis - is mathematically equivalent to a table of means with 𝑡 rows and 𝑘
columns. Calculating the difference-in-difference from this table of means is equivalent to
predicting the outcomes for each combination of literacy category (𝑘) and specific test (𝑡).
Given that the regression coefficients are not directly interpretable (they must be summed
across the combinations of dummy-variable categories and multiple interaction terms) we
decided to rather use the table of means approach, which is more parsimonious and easier
to interpret.
For the present difference-in-difference analysis, the first difference is the difference
between the student’s score on a particular item in the Systemic Evaluation relative to that
student’s score on that item in the NSES, i.e. a between-test difference. The second
difference is the difference between item categories within a particular test, i.e. a within-test
difference. The between-test difference takes into account the difference in the language of
the test and the within-test difference takes into account any student-specific or test-specific
factors that may be different between the two tests but similar between item categories.
3.6 BACKGROUND INFORMATION ON THE TEST INSTRUMENTS
For the language test the item categories follow the literacy-process categorization of the
items (match, retrieve, infer, interpret, write). For the numeracy test the items are
categorized according to the language content of the item (no language content, high
language content, ambiguous language content). These categories are all discussed below.

81
3.6.1 LITERACY TEST
The literacy test that was administered to grade three students in both the Systemic
Evaluation (SE) and the National School Effectiveness Study (NSES) was designed to
reflect the reading and writing proficiency of grade 3 students in South Africa. Of the 40
items included in the test, most were set at the grade 3 level (30 items) but there were also
questions set at earlier grade levels, specifically at the grade 2 (7 items) and grade 1 (3
items) levels. Vorster et al. (2013, p. 31) have classified the 40 items that made up the
literacy assessment according to the PIRLS28 framework. PIRLS identifies four processes of
comprehension: (1) focus on and retrieve explicitly stated information, (2) make
straightforward inferences, (3) interpret and integrate ideas and information, and (4) examine
and evaluate content, language and contextual elements (Howie et al., 2007). Although
PIRLS is a reading assessment, the literacy assessment used in the Systemic Evaluation
and NSES covered both reading and writing. Consequently, Vorster et al. (2013) extend the
PIRLS framework and include two additional categories: (1) cloze items and matching words
to pictures, and (2) writing tasks. The literacy test did not contain any items in the ‘examine
and evaluate content, language, and textual elements’ category and consequently this
category is dropped from the analysis in this chapter. Thus Vorster et al. (2013) end up with
five categories which they refer as ‘literacy processes.’ Test items were also classified on
whether they are multiple-choice items (MC) or free-response items (FR). The distribution of
test items by text type, literacy process and answering format can be seen in Table 8 below
(reproduced from Vorster et al., 2013, p. 33). For the present analysis I use the same
categorisation of items and collapse the categories of “matching a word to a picture” and “fill
in a missing word (cloze)” primarily because the National Curriculum Statement (NCS), the
prevailing curriculum at the time of testing, prescribes that these types of items should be
mastered at the grade 1 level.
28
PIRLS stands for the Progress in International Reading Literacy Study

82
TABLE 8: DISTRIBUTION OF LITERACY TEST ITEMS IN TEST 1 AND TEST 2 ACCORDING TO TEXT TYPE AND
LITERACY PROCESS (SOURCE: VORSTER ET AL., 2013, P. 33)
3.6.2 NUMERACY TEST
The numeracy test used in the Systemic Evaluation and the NSES consisted of 53 questions
with items set at the grade 1 (2 items), grade 2 (14 items), grade 3 (30 items) and grade 4
level (7 items). Table 9 below reports the breakdown of items by grade-level and language-
content. The grade-level distinctions are sourced from Vorster et al. (2013, p. 34). Given that
the focus of the present analysis is the causal impact of writing a test in a second-language,
the 53 numeracy items were split into one of three categories based on the language-
content of the item. If a question consisted only of numbers and symbols (for example “24 ÷
3 = ___”) it was classified as a “No language content” item. If a question had some language
content but could be solved by deductive reasoning without any understanding of the
language, that item was classified as an “Ambiguous item.” For example question 4 is
worded as follows: “Count forward in 2s. Fill in the next number in the space provided; 74
Format
Item number by purposes of reading (types of text) Total
no. Items
Visual cue
Poster Bar graph
Non-fiction descriptive
Fiction narrative
Lit
era
cy p
roc
ess
es
Matching word to picture
MC 1, 2 2
Fill in missing word (cloze)
MC 3, 4, 5, 6, 7, 8, 9
7
Retrieve MC 10, 11 14, 15
19, 20, 21, 22, 23, 24
30, 31, 31
13
FR 12, 13 25,26 4
Infer MC 33, 34 2
FR 27, 28 2
Interpret
MC 35, 36, 37
3
FR 29 38, 39, 40
4
Evaluate 0
Write a sentence FR 16, 17, 18
3
Write a paragraph 0
Total number of items 12 2 4 11 11 40

83
76 78 ___.” An item was classified as a “High language content item” if it was
not possible to solve the problem without understanding the language content of the
question. For example question 22 asked, “Mother is 77 years old. Father is 6 years older
than her. How old is father? ____.” The aim in grouping items along a language-content
dimension was to test the finding in the literature that students who write a test in a second
language find word-problems more difficult than those problems posed in symbolic format
(for some examples see Adetula, 1990; Bernardo, 1999; Ní Ríordáin and O’Donoghue,
2008).
TABLE 9: DISTRIBUTION OF ITEMS IN TEST 1 AND TEST 2 GRADE 3 NUMERACY TEST BY GRADE-LEVEL AND
LANGUAGE-CONTENT
Item number by language-content
No language content
Ambiguous items High language content
Total
Grade-level
Grade 1 28 13 2
Grade 2 35, 36 2, 3, 4, 16, 17 1, 10, 14, 19, 22, 29, 30,
14
Grade 3 20, 21, 23, 24, 25, 37, 39, 42, 49
6, 7, 8, 18, 31, 32, 38, 45
9, 11, 12, 15, 33, 43, 44, 46, 47, 48, 51, 52, 53
30
Grade 4 26, 34, 40, 41, 5 27, 50 7
Total 16 14 23 53
3.6.3 IDENTIFYING HOME LANGUAGE
In order to estimate the causal impact of writing a test in English when English is not a
student’s home-language, it is necessary to identify which students have English as their
home language and which do not. This involves a second round of matching based on the
question asking what a student’s home-language was. Table 10 below shows the breakdown
between matched and unmatched students by home-language. From the table one can see
that 459 students from 158 schools could not be matched on the home-language variable
across the two surveys, either because the variable was missing in one of the two surveys or
because the listed home-language was different between the two surveys.29
29
Note that the total number of matched schools (223) does not equal the sum of the total number of matched-schools-by-language. This is because it is possible to have students from multiple home-languages in a single school. This is also the reason why the framing of the research question refers to students “whose home-language is not English” rather than “for whom English is a second language” since many of these students will

84
The focus of most of this chapter is on the 2 811 students who do not share a birthday with
someone in their class (the first round of matching) and whose home-language was
consistently matched between the two tests (the second round of matching) and was also
not English. The 132 successfully matched English home-language students will be used for
robustness checks since these students wrote the same test twice in the same language one
month apart and therefore create a useful reference category for test-specific differences.
TABLE 10: TOTAL NUMBER OF STUDENTS MATCHED CONSISTENTLY ON HOME-LANGUAGE VARIABLE BETWEEN
SYSTEMIC EVALUATION AND NSES
Language groups matched consistently on home-language
English home language
Non-English home-language
Total number of unique schools
Total
Afrikaans
499 43
English 132
24
isiNdebele
49 10
isiXhosa
498 58
isiZulu
786 66
Sepedi
286 37
Sesotho
131 23
Setswana
256 26
SiSwati
109 13
Tshivenda
66 7
Xitsonga
131 17
Total matched 132 2811 223 2943
Total unmatched 459 158 459
Total 3402
3.7 FINDINGS
3.7.1 LANGUAGE RESULTS AND LITERACY PROCESSES
Table 11, Figure 12 and Figure 13 below report the main findings from the literacy test
analysis for students whose home language is English (n=132) and those for whom it is not
(n=2811). As one would expect, students’ whose home language is not English performed
statistically significantly better when they wrote the test in the LOLT of the school (Test 1:
only learn English as a third or fourth language. For example, an isiXhosa student living in KwaZulu-Natal may be in an isiZulu school and therefore learning in isiZulu in grades one to three before switching to English (their third language) in grade 4.

85
average score 33%) than when they wrote it one month later in English (Test 2: average
score 22%). Given that the standard deviation 30 for these students in the Systemic
Evaluation literacy test (n=2811) was 15,8%, one can say that students performed 0,69
(10,97/15,8) of a standard deviation worse in Test 2 (in English) than they did in Test 1 (in
the LOLT of the school).
One could argue that the 0,69 estimate is a lower bound estimate since it is the net effect of
the positive “learning/familiarity” gain (from writing the same test twice, albeit in a different
language) and the negative language cost (from writing Test 2 in English, a language with
which they are unfamiliar). If we assume that the learning/familiarity gain (or measurement
error) among the English students between the two tests (2 percentage points) is the same
as the learning/familiarity gain among the non-English students between the two tests, then
the language effect grows from 0,69 of a standard deviation to 0,82 of a standard deviation.
Observing the outcomes in the Systemic Evaluation (Test 1 – in the LOLT of the school) one
can clearly see that students found the ‘cloze/matching’ items easiest (average score of
57%) and the ‘interpret’ questions most difficult (average score of 9%). Importantly, the
average score for the whole test when written in the LOLT of the school was still only 33%.
This is after students have been learning in their home-language for three years and before
any switch to English in grade 4. This low level of performance ‘pre-language-switch’
provides some backing to the arguments made by Murray (2002) and reiterated by Hoadley
(2012), who argue that there should be as much attention paid to the quality of instruction as
there is to the language of instruction. This is one of the motifs that runs through much of
the present analysis.
If one thinks that the three main factors affecting students’ performance are (1) home
background, (2) school quality, and (3) language factors, it is possible to provide rough
estimates for the size of the impact of (3) and a composite estimate of (1) and (2) combined.
We have already seen that non-English students performed 0,69-0,82 of a standard
deviation worse when writing in English relative to the LOLT of the school. This could be
considered one estimate for the size of the ‘language factor.’ If one then only looks at the
Systemic Evaluation and compares the performance of English home language students
30
The standard deviations for the various groups are as follows: For all matched students (n=3402) the standard deviation for the Systemic Evaluation (Test 1) literacy test was 16,4% and the standard deviation for the Systemic Evaluation numeracy test was 22,2%. For students whose home language was English (n=132) the figures for the Systemic Evaluation literacy test standard deviation were 18,6% and for the numeracy test 26,9%. If one looks only at students who do not speak English as a home language (n=2811) the figures were 15,82% for literacy and 21,6% for numeracy.

86
(average score 50%) and non-English home language students (average score 33%) the
difference amounts to 1,08 (0,17/0,158) of a standard deviation.31 This can be thought of as
a composite estimate of (1) home background and (2) school quality. Disentangling (1) and
(2) is far more difficult since one does not have exogenous variation in either (1) or (2) as we
do for language with the two tests.
Observing the outcomes in the NSES (Test 2 – in English), one can see that non-English
home language students performed statistically significantly worse in this test than in the
Systemic Evaluation (Test 1) in three of the five categories (cloze/matching, retrieve, write a
sentence), with roughly similar performance in the ‘infer’ and ‘interpret’ categories. By
contrast, English-home-language students – who wrote the same test in English twice -
performed better in Test 2 than in Test 1 for all literacy processes except the three “write a
sentence” items.
31
This is calculated relative to the standard deviation of non-English home language students in the Systemic
Evaluation. One could argue for using a different standard deviation – perhaps the full Systemic Evaluation sample standard deviation. However, the differences can become confusing (and potentially misleading) since it is not only the difference that is changing but also the standard deviation that one is using to scale the difference. Furthermore the difference in standard deviations between non-English Systemic Evaluation (15.8%) and total-matched Systemic Evaluation (16.4%) is not large. For this reason I use the same standard deviation (Systemic Evaluation non-English sample) but have already reported alternate standard deviations in a previous footnote.

87
TABLE 11: AVERAGE PERFORMANCE (%) BY LITERACY PROCESS IN TEST 1 (SYSTEMIC EVALUATION) AND TEST 2
(NSES) FOR STUDENTS WHOSE HOME LANGUAGE IS AND IS NOT ENGLISH [STANDARD ERRORS CLUSTERED AT
THE INDIVIDUAL LEVEL].
Non-English-home-language students (n=2811)
Cloze /matching-word-to-picture (9
items)
Retrieve (17 items)
Infer (4 items)
Interpret (7 items)
Write a sentence (3 items)
Total (40 items)
Test 2
(in English) 51,14 27,09 15,48 7,00 8,90 22,07
Standard error 0,41 0,36 0,31 0,16 0,34 0,25
Test 1 (in Home Language)
56,69 33,91 16,03 8,51 43,51 33,04
Standard error 0,45 0,40 0,32 0,18 0,58 0,30
Difference (Test2 -Test1)
-5,55 -6,82 -0,55 -1,51 -34,61 -10,97
Standard error 0,61 0,54 0,45 0,24 0,67 0,39
English home-language students (n=132)
Cloze /matching-word-to-picture
(9 items)
Retrieve (17 items)
Infer (4 items)
Interpret (7 items)
Write a sentence (3 items)
Total (40 items)
Test 2
(in English) 81,57 64,87 39,85 22,04 42,23 52,06
Standard error 1,05 1,93 2,37 1,54 2,23 1,46
Test 1 (in Home Language)
75,42 57,58 36,21 14,60 57,32 50,04
Standard error 1,52 2,30 2,23 1,04 2,56 1,62
Difference (Test2 -Test1)
6,14 7,30 3,64 7,44 -15,09 2,02
Standard error 1,85 3,00 3,25 1,86 3,40 2,19

88
FIGURE 12: AVERAGE PERFORMANCE (%) IN TEST 1 (SYSTEMIC EVALUATION) AND TEST 2 (NSES) BY LITERACY
PROCESS FOR STUDENTS WHOSE HOME LANGUAGE IS NOT ENGLISH (N=2811)
FIGURE 13: AVERAGE PERFORMANCE (%) IN TEST 1 (SYSTEMIC EVALUATION) AND TEST 2 (NSES) BY LITERACY
PROCESS FOR STUDENTS WHOSE HOME LANGUAGE IS ENGLISH (N=132)
The most striking feature of the comparison between the two tests for non-English home
language students is their performance on the three items that require students to write a
sentence about a picture. On these three items32 students performed considerably better
when they were able to write in the LOLT of the school (average score 44%) than when they
32
An example of one of these items is included in Appendix B.
51
27 15 7 9
22
57
34
16 9
44 33
0
10
20
30
40
50
60
70
Test 2 (in English) Test 1 (in Home Language)
82 65
40 22
42 52
75 58
36 15
57 50
0102030405060708090
Test 2 (in English) Test 1 (in Home Language)

89
were forced to write in English (average score 9%). While this could reflect the fact these
items were the most heavily influenced by the language of the test, it is also possible that the
Test 2 markers marked these items more strictly than the Test 1 markers. Given that the
“write a sentence” items were out of four marks, there is more room for marker-discretion
than there is for the items in the other categories, which were mostly out of one mark. Given
that the people marking the two tests were not the same people, it is possible that Test 2
markers marked more strictly than Test 1 markers33. This hypothesis is supported by the
results of the 132 English-home-language students who performed worse in Test 2 only in
the “write a sentence” category. A priori we would expect the English students to do the
same, or better, on all items in Test 2 than in Test 1 given that they wrote the same test
twice, both times in their home language. The fact that English students do worse in Test 2
on the “write a sentence” questions is most likely due to differential marking practices on
these items across the two tests. It is highly unlikely that their sentence-writing abilities have
deteriorated substantially over the one-month period, though stochastic processes may also
have been at work.
One could look at English home-language students and use the difference between Test 1
and Test 2 on the “write a sentence” items as a lower bound estimate of the cost of the
presumed harsher marking (i.e. negative 15.09 percentage points). This is a lower bound
estimate since this is the effect of the positive learning-bias, the positive test-familiarity bias,
and the negative stringency-bias from the harsher marking in Test 2. Using this estimate as
a lower-bound estimate of the cost of harsher marking requires us to assume that Test 2
markers were equally strict when marking the scripts of English and non-English home-
language students. If markers were not consistent across language groupings within an
item-category, it is not possible to benchmark across language groupings, as we do here.
Comparing the differences across item categories and language-groupings (English and
non-English home language), it is clear that non-English home language students did
considerably worse than English home language students and that this difference was
largest for the “write a sentence” items, even after accounting for harsher marking in Test 2.
Looking at the nine ‘cloze/matching’ items, students whose home language is not English
perform 9.8% worse (5.55 percentage points) when they wrote the test in English as
33
This was clarified through personal communication with Carla Perreira (2014), the Chief Operating Officer at JET Education Services (the technical adviser for the Systemic Evaluation, and the implementing agent for the NSES). The Systemic Evaluation markers were recruited and managed by the Department of Basic Education (DBE). Although JET provided training and supported the process of the Systemic Evaluation, the DBE was responsible for the marking and moderation processes. For the NSES, JET did the marking and moderation using the same marking memos and the same training procedures, albeit with different markers.

90
compared to writing the test in the LOLT of their school. Looking at the 17 ‘retrieve’ items,
these same students perform 20% worse (6.82 percentage points) when they write the test
in English as compared to writing the test in the LOLT of their school. There is a strong case
to be made that both of these estimates represent the causal impact of writing these kinds of
items in English relative to the LOLT of the school, when a student’s home language is not
English.
Looking at the differences between the two tests for the four ‘infer’ items and the seven
‘interpret’ items, it is less clear that these differences represent the causal impacts of
anything. It would seem that most students whose home language is not English found these
items to be too difficult for them to provide meaningful information on the impact of language.
When written in the LOLT of the school (Test 1) students scored an average of 16,03% on
the ‘infer’ items and 8,51% on the ‘interpret’ items, dropping to 15,48% and 7,00%
respectively. Given that half of these questions were structured as multiple-choice questions
with four choices (see Table 8) and that multiple-choice questions overestimate true ability
due to random guessing, it is highly likely that the ‘true score’ here is essentially zero – that
is if we corrected for guessing. In these instances it would seem that language is a second-
order concern. If students already perform extremely poorly in their home-language (as in
the ‘infer’ and ‘interpret’ items) – perhaps because the cognitive demand was too high - then
asking the same questions in English is unlikely to lead to a significant drop in average
performance. On the other hand, if students are able to answer the questions in their home-
language but not in English this suggests that the language-content of the items is
preventing them from understanding the questions rather than not having the ability, skill or
understanding to answer the question (as in ‘cloze/matching’ and ‘retrieve’ items).
An alternative to grouping items by literacy process is to group items by item format, that is
to say whether the item is a multiple-choice item or a free-response item. Table 12 below
reports the average literacy score by language groups and question format. From the table
one can see that the difference in performance between the two tests for non-English
students is largest for free-response items, while for English students the difference is
largest for free-response items. As mentioned previously, for the multiple-choice items one
would expect that the difference between the two tests would be smaller the lower the
students’ performance (i.e. that the attenuation of the difference is largest for non-English
students where the impact of guessing is highest).
One method of illustrating the above is to correct these scores for random guessing using
Frary’s (1988, p. 33) formula FS = R – W/(C – 1) where FS is the ‘corrected’ score, R is the
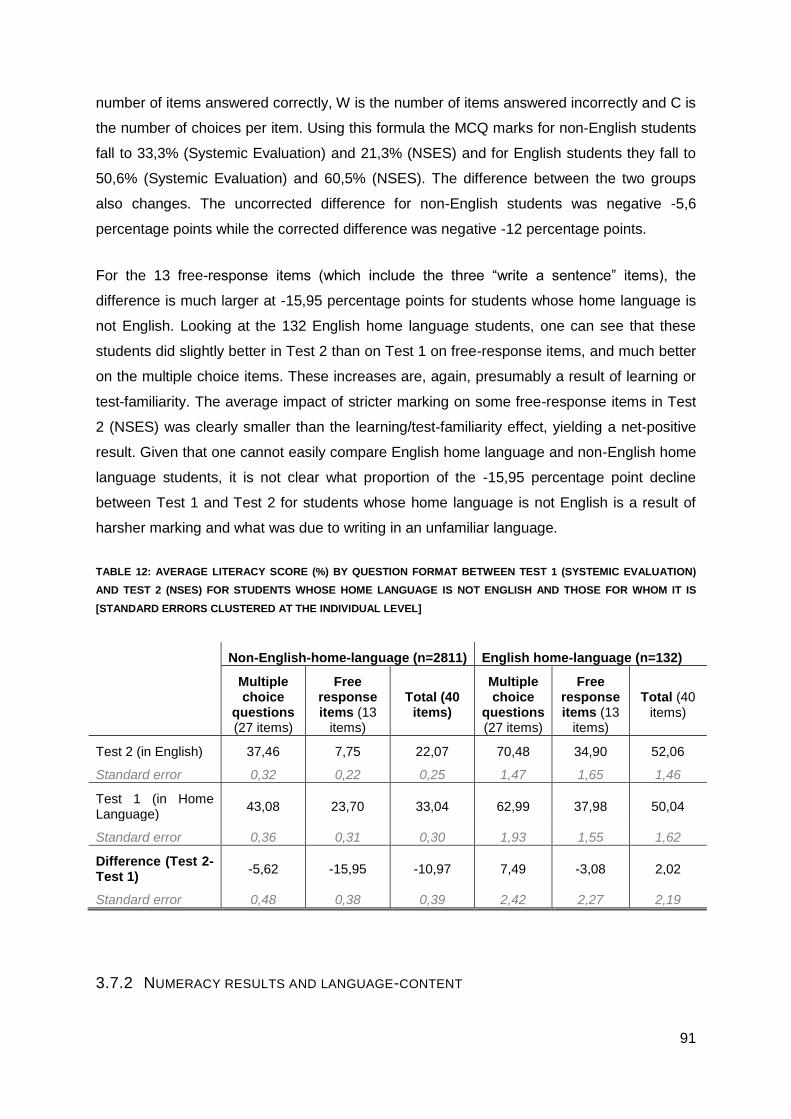
91
number of items answered correctly, W is the number of items answered incorrectly and C is
the number of choices per item. Using this formula the MCQ marks for non-English students
fall to 33,3% (Systemic Evaluation) and 21,3% (NSES) and for English students they fall to
50,6% (Systemic Evaluation) and 60,5% (NSES). The difference between the two groups
also changes. The uncorrected difference for non-English students was negative -5,6
percentage points while the corrected difference was negative -12 percentage points.
For the 13 free-response items (which include the three “write a sentence” items), the
difference is much larger at -15,95 percentage points for students whose home language is
not English. Looking at the 132 English home language students, one can see that these
students did slightly better in Test 2 than on Test 1 on free-response items, and much better
on the multiple choice items. These increases are, again, presumably a result of learning or
test-familiarity. The average impact of stricter marking on some free-response items in Test
2 (NSES) was clearly smaller than the learning/test-familiarity effect, yielding a net-positive
result. Given that one cannot easily compare English home language and non-English home
language students, it is not clear what proportion of the -15,95 percentage point decline
between Test 1 and Test 2 for students whose home language is not English is a result of
harsher marking and what was due to writing in an unfamiliar language.
TABLE 12: AVERAGE LITERACY SCORE (%) BY QUESTION FORMAT BETWEEN TEST 1 (SYSTEMIC EVALUATION)
AND TEST 2 (NSES) FOR STUDENTS WHOSE HOME LANGUAGE IS NOT ENGLISH AND THOSE FOR WHOM IT IS
[STANDARD ERRORS CLUSTERED AT THE INDIVIDUAL LEVEL]
Non-English-home-language (n=2811) English home-language (n=132)
Multiple choice
questions (27 items)
Free response items (13
items)
Total (40 items)
Multiple choice
questions (27 items)
Free response items (13
items)
Total (40 items)
Test 2 (in English) 37,46 7,75 22,07 70,48 34,90 52,06
Standard error 0,32 0,22 0,25 1,47 1,65 1,46
Test 1 (in Home Language)
43,08 23,70 33,04 62,99 37,98 50,04
Standard error 0,36 0,31 0,30 1,93 1,55 1,62
Difference (Test 2-Test 1)
-5,62 -15,95 -10,97 7,49 -3,08 2,02
Standard error 0,48 0,38 0,39 2,42 2,27 2,19
3.7.2 NUMERACY RESULTS AND LANGUAGE-CONTENT

92
In addition to comparing the literacy test results from Test 1 (written in the LOLT of the
school) and Test 2 (written in English), one can also compare the numeracy test results
between these two tests. One of the major advantages when looking at the numeracy test is
that all items were either correct or incorrect (one mark questions) and therefore it left little
room for differential marking across the two tests, unlike the literacy test – as discussed
above. Rather than compare numeracy processes across the two tests (see Taylor and
Reddi, 2013), the focus here is on the difference in performance on item-groupings based on
the language-content of those items. As mentioned, the three groups are (1) high language
items, (2) no language items, and (3) ambiguous items (i.e. items that could not be classified
as either ‘high language’ or ‘no language’ items).
Table 13 below reports the numeracy results for Test 1 (in the LOLT of the school) and Test
2 (in English) for students whose home language is not English, and for those for whom it is.
Looking first at students’ whose home language is not English, it is interesting to note that
the overall difference between Test 1 and Test 2 is not statistically significant – on average
students scored 33% on both tests. However if one looks at the results disaggregated by
language-content, one can see that students did slightly better in Test 2 on the ‘no-language’
and ‘ambiguous’ items than they did in Test 1, and slightly worse in Test 2 on the ‘high-
language’ items, as one might expect. On both tests students found the 23 high-language
items slightly easier than the 16 no-language items. From Table 13 below one can see that
students whose home language is not English scored 5,2% (1,87 percentage points) worse
when writing high-language content items in English compared to writing those same items
in the LOLT of their school. This is arguably the causal impact of writing high-language
content mathematics items in English when English is not a student’s home language.
If students learned new skills or consolidated old skills in the month between the two tests,
one would expect them to perform better on Test 2 than on Test 1. Similarly, if students
became familiar with the test (remembered test items), we would also expect them to
perform better in Test 2 than in Test 1. We do in fact see improvement in performance for
the ‘no-language’ and ‘ambiguous’ items for students whose home language is not English.
If we assume that these three effects are equal across the three item categories (something
which may or may not be true), we can employ a second-difference to difference out these
biases. By comparing the difference between the two tests (first difference) and the
difference between the item-categories (second difference), one can estimate the causal
impact of writing high-language content items relative to low-language content items for
students whose home language is not English (accounting for all biases, assuming that
these biases affect all three categories equally).

93
Table 13 below shows that this effect is negative, -8,1% (-2,91 percentage points) for high-
language content items. One can thus think of these two estimates (-5,2% and -8,1%) as a
lower bound and an upper bound estimate of the causal impact of writing high-language
content items in English relative to writing them in the LOLT of the school, when English is
not a student’s home language.
Students whose home language is English perform better in Test 2 (67%) than in Test 1
(60%), and the gains are largest for the high language content items. The difference-in-
difference analysis shows that the difference between high-language and no-language items
was larger in Test 2 than in Test 1, that is to say that English students either (1) learned
more content relating to the high-language items than the no-language items in the
intervening month between the tests, or (2) remembered the high-language items better than
the no-language items between the two tests. While this is an interesting finding in and of
itself, one could possibly use this information to inform the difference-in-difference analysis
for students whose home language is not English. However, this would require that we
assume that the same amount of learning takes place in schools that English-home-
language students attend, and those that non-English-home-language students attend,
something that is almost certainly untrue (Shepherd, 2011; Spaull, 2013; Taylor and Yu,
2009). Furthermore, the sample of 132 English students is relatively small with concomitantly
large standard errors.
Using a similar framework for the numeracy test as for the literacy test, one can identify what
difference in achievement is attributable to (1) home background and (2) school quality
(jointly); and (3) language for non-English home language students. Table 13 shows that
there is practically no difference between Test 1 and Test 2 suggesting that the language
factor is only a very small part of the story in the underperformance of non-English students
in mathematics. It would be prudent to ask whether the “learning/familiarity gains” (between
Test 1 and Test 2) and the “language cost” (due to writing in English) are not simply
cancelling each other out, creating a net effect of zero. While this may be true, it is difficult to
estimate the size of the “learning/familiarity gain.” However, if we assume that non-English
students learn as much in the intervening month as do their English peers, and remember as
much of the test as their English peers (which is unlikely given that they have seen the test
in two languages whereas the English students saw the exact same test twice), then we can
use the gains seen in the English home language sample (7 percentage points) as an upper
bound estimate of the “learning/familiarity gain” and thus as an upper bound estimate of the
“language cost.” This amounts to 0.32 (0.07/0.22) of a standard deviation.

94
Using the standard deviation of 22,2% (from non-English students in the Systemic
Evaluation Numeracy - Test 1), the difference between English home language students
(average score 60%) and non-English home language students (average score 33%)
amounts to 1,22 (0.27/0.222) standard deviations. This can be thought of as a composite
estimate of the impact of (1) home background and (2) school quality.

95
TABLE 13: AVERAGE NUMERACY PERFORMANCE (%) BY LANGUAGE-CONTENT IN TEST 1 (SYSTEMIC
EVALUATION) AND TEST 2 (NSES) FOR STUDENTS WHOSE HOME LANGAUGE IS NOT ENGLISH [STANDARD
ERRORS CLUSTERED AT THE INDIVIDUAL LEVEL]
3.7.3 SUMMARY OF FINDINGS AND ROBUSTNESS CHECKS
Table 14 presents the various “effect sizes” discussed in this paper. The composite effect of
(1) home background and (2) school quality was calculated as the difference between the
score of English students on the Systemic Evaluation and the score of non-English students
on the Systemic Evaluation. Given that all students wrote the Systemic Evaluation in the
Non-English-home-language students (n=2811)
High language items (23 items)
Ambiguous items (14 items)
No language items (16 items)
Total (53 items)
Test 2 (in English) 34,02 34,88 30,03 33,04
Standard error 0,41 0,49 0,48 0,41
Test 1 (in Home Language) 35,89 33,13 29,00 33,08
Standard error 0,39 0,49 0,47 0,41
Difference (Test2-Test1) -1,87 1,75 1,03 -0,04
Standard error 0,57 0,69 0,67 0,58
Difference-in-difference (relative to no language items)
-2,91 -2,78 - -1,07
Standard error 0,88 0,97 - 0,89
English-home-language students (n=132)
High language items (23
items)
Ambiguous items (14
items)
No language items (16
items)
Total (53 items)
Test 2 (in English) 69,47 68,99 62,26 67,17
Standard error 2,01 1,97 2,45 2,00
Test 1 (in Home Language) 59,22 64,94 56,82 60,01
Standard error 2,24 2,49 2,69 2,34
Difference (Test2-Test1) 10,24 4,06 5,45 7,16
Standard error 3,01 3,18 3,64 3,08
Difference-in-difference (relative to no language items)
4,80 -1,39 - 1,72
Standard error 4,72 4,83 - 4,76

96
LOLT of the school, we argue that this is the sum of all non-language factors (summarised
as “home background and school quality”). The effect of language was calculated as the
difference between Test 2 (NSES written in English) and Test 1 (Systemic Evaluation written
in LOLT of the school). The lower-bound estimate is the straight-forward difference between
the two tests while the upper-bound estimate assumes that non-English students would have
learnt as much in the intervening month as English students did and would remember as
much of the test as English students, and is thus calculated as the difference between Test 2
and Test 1 in addition to the learning/familiarity gain seen among the English students. All
differences are expressed as a percentage of a standard deviation found among non-English
students in the Systemic Evaluation test (15,6% for literacy and 22,2% for numeracy). It is
perhaps helpful to contextualise the standard deviation metric; half of a standard deviation
improvement would take somebody from the middle of the distribution (50th percentile) to the
69th percentile, and a one standard deviation improvement would take them to the 84th
percentile.
TABLE 14: SIZE OF VARIOUS "EFFECTS" IN STANDARD DEVIATIONS FOR STUDENTS WHOSE HOME LANGAUGE IS
NOT ENGLISH
In addition to the effect sizes, Table 14 also reports the results of a sensitivity analysis for
the literacy results. Given that NSES markers seemed to be more strict than the Systemic
Evaluation markers on the “write a sentence” questions (as discussed above), the analysis
was re-done excluding the three “write a sentence” items. These results are reported as (1a)
(2a) and (3a) in Table 14. Given the data presented in Table 13 and the discussion about the
different marking procedures employed, there is a strong case to be made that the results in
(1a) (2a) and (3a) are more reliable than those in (1) (2) and (3).
Literacy Numeracy
Lower-bound Upper-bound Lower-bound Upper-bound
(1) Home background
-1,08 -1,22 (2) School Quality
(3) Language -0,69 -0,82 0 -0,32
(1a) Home background
-1,13 -1,22 (2a) School Quality
(3a) Language (excluding 3
write-a-sentence items) -0,29 -0,71 0 -0,32

97
Perhaps the most important finding emerging from Table 14 is the relative size of the impact
of language as compared to the composite impact of home-background and school-quality.
While it is not possible to disentangle the separate impacts of home-background and school-
quality with the existing data, it is still useful to compare the size of the language factor and
the composite non-language factor. The findings presented here suggest that one should
exercise caution when comparing the results of English and non-English students in South
Africa. While it is true that non-English students perform considerably worse than English
students, and also true that part of this underperformance is attributable to language,
claiming that language is the main cause of underperformance lacks empirical evidence.
Howie (2003), for example, states that, “The most significant factor in learning science and
mathematics isn’t whether learners are rich or poor. It’s whether they are fluent in English”
(cited in Fleisch, 2008, p. 99). Using slightly less totalising language, Motala (2009) provides
a similar argument explaining that, “For those children who struggle with its expressions and
idioms, for those who listen but cannot understand, English is the fundamental barrier to
learning” (Motala, 2009, p. 5; emphasis added). While the latter statement seems quite
reasonable, it cannot explain why students perform so poorly before switching to English in
grade 4. Therefore these arguments do not hold weight in the Foundation Phase when the
child is still learning in the LOLT of the school (which, in most instances, is the home
language of the child).
3.7.4 LIMITATIONS AND CAVEATS
Given the nature of the language debate in South Africa, it is worth reiterating what these
findings do and (importantly) do not show. They provide no evidence on the impact of
learning in an African language relative to learning in an additional language (English). They
provide no evidence about whether or not non-English students should transition to English
earlier or later than they currently do (grade 4). Both of these issues have been discussed in
the local and international literature (Heugh, 2012; Macdonald, 1990; Skutnabb-Kangas,
2000; Taylor and Coetzee, 2013). While it is true that almost all studies in Africa have been
small-scale qualitative studies, it is telling that there are currently no studies (that I am aware
of) that show that a straight-for-English approach is superior to learning initially in a child’s
home language in the African context. As Heugh (2012, p. 40) concludes:
“Almost every commission of enquiry into language and education, every
language in education conference and every set of recommendations on the
matter, in Africa, over the last 100 years, has concluded that education must
begin in the mother tongue of the child or in that language of the immediate
community which the child knows and uses best.”

98
As a caveat to this last statement, one should note that in some environments there is no
obvious dominant mother tongue among students due to the high levels of linguistic diversity
in the classroom – particularly in urban areas (NEEDU, 2013). In these instances a straight-
for-English approach may be the best alternative, even if it is not ideal. For example,
Gustafsson (2013) shows that there is considerable within-school linguistic diversity in the
highly urban province of Gauteng, with 41% of schools being in a situation where less than
50% of students in the school speak the largest home language. It is unclear which home-
language one should use in these instances. However in provinces like KwaZulu-Natal and
the Eastern Cape – which are both far more linguistically homogenous - the comparable
figures are 1% and 2% respectively. The full table is reported in Appendix B.
Another important caveat regarding the existing study is that it is not nationally
representative, even though it does cover a large number of students in each of eight
provinces. Although it uses large-scale data from nationally representative34 samples, it is
unclear how the matching procedure employed affected the representivity of the underlying
samples. Notwithstanding the above, Table B2 in Appendix B does show that the overall
provincial breakdown of students in the NSES and the matched NSES-Systemic-Evaluation
samples do not differ by more than three percentage points in any one province.
3.8 SUMMARY AND CONCLUSION
To summarise the main findings from this analysis:
Non-English grade 3 students performed between 0,29 and 0,71 standard deviations
worse in literacy when writing the test in English compared to writing the test in the
LOLT of the school. This impact can be regarded as causal.
Non-English grade 3 students performed 1,08 standard deviations worse in literacy
than English grade 3 students when both groups of students wrote the test in the
LOLT of their respective schools. This can be regarded as the size of the effect on
literacy of home background and school quality factors combined.
Non-English grade 3 students performed between 0 and 0,32 standard deviations
worse in numeracy when writing the test in English compared to writing the test in
the LOLT of the school. This impact can be regarded as causal.
34
As mentioned previously, the NSES test did not sample students from Gauteng because there were alternative testing programs under way in that province in 2007. In this sense the NSES is nationally representative except for Gauteng.

99
Non-English grade 3 students performed 1,22 standard deviations worse in
numeracy than English grade 3 students when both groups of students wrote the
test in the LOLT of their respective schools. This can be regarded as the size of the
effect in numeracy of home background and school quality factors combined.
The analysis of the literacy tests showed that students whose home language is not
English found it particularly difficult to write a sentence in English, even after
accounting for the fact that the test markers for Test 2 (NSES in English) seemed to
mark more strictly than those for Test 1 (Systemic Evaluation in the LOLT of the
school). The results further showed that student performance on the ‘infer’ and
interpret’ items in Test 1 (written in the LOLT of the school) was so low to begin with
that there was hardly any difference in performance when it was written in English in
Test 2 (NSES). This is keeping with the findings of Vorster et al. (2013: 150) who find
that “at the lowest levels of achievement there was little difference between
performance in the SE and NSES (non-English speakers only). This may reflect that
the knowledge base of these learners was so low that writing in their home language
yielded no substantial improvement, or in other words, learners are not learning
much in either language.”
The analysis of the literacy test confirmed the international literature (Adetula, 1990)
that student’s whose home language is different to the language of the test find free-
response questions more difficult than multiple choice questions.
Analysis of the numeracy test for non-English students showed only slight differences
in performance across the two tests, with a slightly larger ‘cost’ for high-language
items relative to no-language items.
Where the present study differs from earlier research is that it focuses on the grade 3 level,
which is before any LOLT-switch to English. By taking this approach it was possible to
isolate the impacts of language-factors on the one hand, and home-background and school-
quality on the other. In essence this chapter has extended the analysis of Vorster et al.
(2013) in two important ways; firstly by improving their matching algorithm (matching 61%
more students), and secondly by disaggregating students’ numeracy and literacy
performance by item category, language content and question format. This was done in an
attempt to provide empirical estimates of the language cost associated with different literacy
processes and question types for literacy; and for numeracy the differences between high
language and no language items. The findings presented here agree with those of Vorster et
al. (2013) who found that the performance gap between the SE and NSES was largest for
non-English speakers.

100
Perhaps the most important finding emerging from the present analysis is that the size of the
composite effect of home-background and school-quality is 1,6 to 3,9 times larger than the
impact of language for literacy and at least 3,8 times larger for numeracy. To put this in
terms of ‘years worth of learning’, if one uses 0,3 standard deviations as an approximation of
one year of learning in South Africa (as per the discussion in Chapter 2), then the size of the
‘language cost’ is approximately one to two years worth of learning for literacy and one year
for numeracy. By contrast, the size of the composite effect of home background and school
quality is roughly four years worth of learning for both numeracy (1,2 standard deviations)
and literacy (1,15 standard deviations). This finding reiterates those expressed by other
authors in the literature (Fleisch, 2008; Hoadley, 2012; Murray, 2002), for example Hoadley
(2012) concludes that:
“Divided opinions over the language of instruction issue have masked the issue of
poor literacy teaching per se, as is evident in the low home language literacy levels
amongst learners…To a certain extent, in other words, debates around language
deflect attention from the quality of instruction, irrespective of the language of
instruction” (Hoadley, 2012, p. 192).
The intention of these authors is not to negate the importance of language, but rather to
situate the language effect within the discussion of a generally dysfunctional schooling
system. By doing so, these findings – including those presented in this chapter - aim to
stress the importance of the quality of instruction, not only the language of learning. The fact
that the literacy and numeracy achievement of South African children is so low prior to any
language switch to English should give pause to those who argue that language is the most
important factor in determining achievement, or lack thereof, in South Africa.
The results from the quantitative analysis presented in this chapter give us some indication
of the average size of the impacts of language and non-language factors on achievement.
This is something that is not possible using qualitative research methods. In order to move
the language debate forward we need to avoid basing language policies on ideological
statements or solely on case-study research, and instead use systematic evidence to
improve our understanding of the language dynamics in South Africa.

101
CHAPTER 4: ACCESS TO WHAT? CREATING A COMPOSITE
MEASURE OF EDUCATIONAL ACCESS AND EDUCATIONAL QUALITY
FOR 11 AFRICAN COUNTRIES
“Defining the scope of the problem of “lack of education” must begin with the
objectives of education – which is to equip people with the range of
competencies…necessary to lead productive and fulfilling lives fully integrated
into their societies and communities. Many of the international goals are framed
exclusively as targets for universal enrolments or universal completion. But
getting and keeping children ‘in school’ is merely a means to the more
fundamental objectives of … creating competencies and learning achievement”
(Pritchett, 2004, p. 1)
4.1 INTRODUCTION AND RESEARCH QUESTION
A sequential analysis of the access-to-education literature, and subsequent policy dialogues,
shows an important development in the thinking of educational researchers. What started
out as an almost single-minded focus on access, ‘Education For All’, has slowly developed
into a more nuanced concept of quality education for all (Lewin, 2007; UNESCO, 2005). As
more and more countries approach universal enrolment, there is a shift away from simplistic
measures of access to schooling and towards a fuller concept of access to learning. It is now
widely accepted that the ability of a country to educate its youth cannot be measured by
access to schooling or enrolment rates alone, but rather by its ability to impart to students
the knowledge, skills, abilities, cultural understandings and values that are necessary to
function as full members of their society, their polity, and their economy (Pritchett, 2013).
While access is a necessary condition for this type of education, it is by no means a
sufficient one.
As a result of this new consensus view, few would argue that access and quality are not
intimately related. The inter-relationships between these two dimensions of education are
many, varied and complex and important for both academic inquiry and policy-analysis. Yet
the extant literature on education is almost entirely bifurcated with research focussing on
either access to education or the quality of education, but rarely both simultaneously. This is
problematic for two reasons: 1) Observing access to education without regard for the quality
of that education clouds the analysis, primarily because the underlying assumption that
enrolment and attainment are correlated with learning is often not true, as will become
evident; 2) Analysing educational outcomes for those attending school without taking
cognizance of the enrolment and dropout profiles of the countries under review is likely to

102
bias the results. Developing countries with lower enrolments and higher dropout rates
perform better on average, than otherwise similar countries that have higher enrolments and
fewer dropouts (UNESCO, 2005, p. 48). This is largely due to the selection effects involved
where the ‘strongest’ (i.e. the wealthiest, most advantaged, and most able) students enroll
and then remain in the schooling system (Lambin, 1995).
The aim of the present study is to integrate these two dimensions of education by providing
a composite measure of educational access and educational quality, what we call access-to-
literacy and access-to-numeracy. To do so we combine country-specific household data on
grade completion (from Demographic and Health Surveys) with cross-national data on
cognitive outcomes (from the Southern and Eastern African Consortium for Monitoring
Educational Quality – SACMEQ 2007) for 11 African countries, namely, Kenya, Lesotho,
Malawi, Mozambique, Namibia, South Africa, Swaziland, Tanzania, Uganda, Zambia, and
Zimbabwe. In doing so we aim to answer the following research questions:
1. In each country what proportion of children:
i) never enrol,
ii) enrol but drop out prior to grade 6,
iii) enrol and complete grade 6 but without acquiring functional literacy and
functional numeracy by this time,
iv) enrol and complete grade 6 having acquired basic numeracy and literacy skills,
v) enrol and complete grade 6 having acquired higher order numeracy and literacy
skills.
2. In each country how do the proportions of children identified in (1) above differ by the
sub-national categories of:
i) gender (boys and girls),
ii) wealth (poorest 40%, middle 40% and wealthiest 20%), and
iii) a gender-wealth interaction (poorest 40% of girls compared to poorest 40% of
boys, middle 40% of girls compared to middle 40% of boys, and wealthiest 20%
of girls compared to the wealthiest 20% of boys).
4.2 ACCESS AND QUALITY: THE EXTANT LITERATURE
That education is important for economic growth is now part of the received wisdom in
economics. Numerous authors have made compelling arguments linking both the quantity of
education and the quality of education to increased economic growth (Barro and Lee, 2001;
Bosworth and Collins, 2003; Ciccone and Papaioannou, 2009; Hanushek and Kimko, 2000;

103
Hanushek and Wößmann n, 2008). Historically, much of the associated empirical work on
education and economic growth focussed on within country analyses (see for example
Solow, 1957; Jorgenson and Griliches, 1967; and Denison, 1985). The introductory chapter
of this thesis outlined the intellectual trajectory of human capital studies and argued that the
most recent findings have fore-grounded the notion of education quality over education
quantity when looking at economic growth. However, given that most of these studies have
had an economic agenda – focussing on either individual or national incomes – there has
been less emphasis on the non-economic benefits of education. If one looks at the
motivations behind what is arguably the most successful educational ‘movement’ in the last
three decades - the Education For All (EFA) movement – one can see that it cannot be
linked solely to an economic rationale. Improved labour-market outcomes and increased
economic growth are only two of a myriad of benefits associated with expanding educational
opportunity to those currently excluded from formal education.
Some of these non-economic benefits include: lower fertility (Basu, 2002), improved child
health (Currie, 2009), reduced societal violence and improved human rights (Salmi, 2000),
promotion of a national - as opposed to a regional or ethnic - identity (Glewwe, 2002), and
lastly, increased social cohesion (Heyneman, 2003). Moving beyond these specific atomised
benefits of education, Sen (1999) and Nussbaum (2006) provide a generalized theory where
education occupies a central role in expanding the capabilities and freedoms of individuals,
enabling them to pursue the sort of lives they have reason to value.
Largely as a result of the above consensus view on the importance of education for
development (both social and economic), the EFA initiative was created as a vehicle to
facilitate and monitor the expansion of primary education in developing countries. The
commitments to universal primary education that were outlined at education conferences in
Jomtien, Thailand in 1990, and reiterated in Dakar, Senegal 2000, have been met with
widespread approval both within developing countries, and by external stakeholders. The
movement has also been tremendously successful. Between 1980 and 2010 the proportion
of people aged 15 and over living in developing countries that had no schooling decreased
by 54% from 37.7% in 1980 to 17.4% in 2010, with the average years of schooling
increasing from 4.3 years to 7.1 years over the same period (Barro and Lee 2013).
Recent education scholarship, however, has begun to draw attention to the increasing
disconnect between schooling (access) and learning (quality) in developing countries. Filmer
et al. (2006) for example, provide a detailed critique of the access-dominated Millennium
Development Goal on education (Goal 2), namely: “To ensure that by 2015, children

104
everywhere, boys and girls alike will be able to complete a full course of primary schooling.”
In their article titled “A Millennium Learning Goal: Measuring real progress in education” they
conclude as follows:
“We demonstrate that even in countries meeting the [Millennium Development
Goal] of primary completion, the majority of youth are not reaching even minimal
competency levels, let alone the competencies demanded in a globalized
environment … While nearly all countries’ education systems are expanding
quantitatively nearly all are failing in their fundamental purpose. Policymakers,
educators and citizens need to focus on the real target of schooling: adequately
equipping their nation’s youth for full participation as adults in economic, political
and social roles. A goal of school completion alone is an increasingly inadequate
guide for action … focusing on the learning achievement of all children in a
cohort a [Millennium Learning Goal] eliminates the false dichotomy between
“access/enrolment” and “quality of those in school”: reaching an MLG depends
on both” (Filmer et al. 2006, 1).
There is growing evidence of exceedingly low levels of learning in many developing
countries including, India, Indonesia, Malaysia, Mexico, Pakistan, Thailand, Turkey and
South Africa (Pritchett 2013; Muralidharan and Zieleniak 2013; Taylor et al. 2013). Not only
are the levels of learning typically low, but the actual learning associated with a year of
schooling differs widely across countries. Majgaard and Mingat (2012, 7), for example,
demonstrate for a selection of African countries that adults with the same years of schooling
differ widely in their reading ability depending on which country they are from. Following
logically from the above, Hanushek and Wößmann (Hanushek and Wößmann n, 2008) show
that cognitive skills acquired, in addition to years of education attained, is an important
determinant of human capital and economic growth:
“It is both conventional and convenient in policy discussions to concentrate on
such things as years of school attainment or enrolment rates at schools. These
things are readily observed and measured. They appear in administrative data,
and they are published on a consistent basis in virtually all countries of the world.
And they are very misleading in the policy debates. Cognitive skills are related,
among other things, to both quantity and quality of schooling. But schooling that
does not improve cognitive skills, measured here by comparable international
tests of mathematics, science, and reading, has limited impact on aggregate
economic outcomes and on economic development … We provide strong
evidence that ignoring differences in cognitive skills significantly distorts the
picture about the relationship between education and economic outcomes”
(Hanushek and Wößmann 2008, 608).
While Filmer et al. (2006) and Hanushek and Wößmann (Hanushek and Wößmann n, 2008)
both use cognitive skills as a proxy for education quality, this is primarily because these are

105
the elements of education quality that are more easily quantifiable. If one were to create an
indicator which comprehensively reflects the quality of education provided it would have to
include factors like artistic creativity, empathy, democratic values, preference for political
participation, the extent to which schooling successfully socializes children into their
societies, whether children have an increased appreciation for social diversity, inclusivity and
the need for egalitarian principles (attitudinal modernity) (Heneveld and Craig 1996;
UNESCO 2005, 30). The most prominent reason why these are not included in empirical
studies of education is that they are notoriously difficult to measure reliably. Consequently
we too use cognitive outcomes, and specifically numeracy and literacy, as a proxy for
education quality. This was a pragmatic, rather than ideological, choice and does not deny
the importance of other subjects or the myriad of (as yet) unquantifiable benefits associated
with education. We see the acquisition of basic numeracy and literacy skills as a low
benchmark that is a necessary but not sufficient condition for quality education.
On a practical level, the existing emphasis on enrolment and attainment in developing
countries over-estimates the progress that has been made in education because these
statistics ignore learning, or the absence of learning. While many more children now have a
physical place in a building called a school, there is mounting evidence that too many of
these children are not acquiring even the most basic numeracy and literacy skills.
In the same way that many studies of educational access ignore the quality of that
education, studies of educational quality often make implicit assumptions that effectively
ignore all non-enrolled students. Almost all studies that compare countries based on the
results of cross-national school-based assessments do not take into account differential
enrolment and dropout rates (see for examples Fehrler et al., 2009; Hungi and Thuku, 2010;
Lee et al., 2005). This is primarily because the assessments themselves use the school-
going-population as their sampling frame, excluding individuals who are not in school. By
using unadjusted data from TIMSS, PIRLS or SACMEQ (for example), the researcher makes
the implicit assumption that the enrolment and dropout rates of various countries are either
equal or inconsequential to the analysis at hand, neither of which is likely to be true –
especially in developing countries. As Lambin (1995, 174) explains, “The greater the dropout
rate is and/or the smaller the proportion of an age group participating in the study, the better
the average performance of those who are taking the test”35. This is largely due to the
35
This may seem contradictory to the findings of Hanushek and Wößmann (2011, p. 79) who find that “Countries having more schools and students excluded from the targeted sample, having schools and students who are less likely to participate in the test, and having higher overall school enrolment at the relevant age level tend to perform better on the international tests.” However, this statement is made with respect to countries that

106
selection effects involved where the ‘strongest’ (i.e. wealthiest, most advantaged, and most
able) students remain in the schooling system. These enrolment and dropout differentials
are significantly different between developing countries, and, within countries, between sub-
groups (Filmer and Pritchett, 1999; Lewin, 2009). This points to the need to correct for those
students who are not currently in school due to dropout or non-enrolment.
The only three exceptions to the ‘bifurcated literature’ discussion above that we are aware of
are the aforementioned article by Filmer et al. (2006), the seminal article by Hanushek and
Wößmann (Hanushek and Wößmann n, 2008) and the recent book by Pritchett (2013). In
each of these instances, the authors combine World Bank survey data with micro data from
at least one international student achievement test. For example, Hanushek and Wößmann
(Hanushek and Wößmann n, 2008) sub-divide the grade 9 aged population into “never
enrolled”, “dropout”, “finished grade 9 without basic reading skills” and “finished grade 9 with
basic reading skills.” The authors are thus able to combine measures of both access and
quality and provide a more accurate depiction of the educational system in those countries.
However, the only sub-Saharan African countries to feature in their paper are Ghana (using
TIMSS 2003) and South Africa (using TIMSS 1999). Given that the world’s lowest enrolment
rates and highest dropout rates are in sub-Saharan Africa, it is unfortunate that most
countries from this region did not participate in any TIMSS surveys and thus were excluded
from Hanushek and Wößmann’s analysis. Filmer et al (2006), and Pritchett (2013) both
include a variety of developing countries but do not aim, as we do, to develop a single metric
for measuring both access to education and the quality of that education. Furthermore, we
use a different – and we argue, more correct – measure of access than either Filmer et al.
(2006) or Pritchett (2013). In this way we hope to contribute to the literature and build on the
work of these earlier authors.
4.3 DATA
In this paper, we use the latest data from the Southern and Eastern African Consortium for
Monitoring Educational Quality (hereafter SACMEQ) survey in combination with data on
grade completion from the most recent Demographic and Health Survey (DHS) conducted in
each country.
SACMEQ is a consortium of African education ministries, policy-makers and researchers
who, in conjunction with UNESCO’s International Institute for Educational Planning (IIEP),
participate in PISA and TIMSS, the bulk of whom are either high-income countries or upper-middle-income countries, in contrast to Lambin (1995) who is referring to education systems generally.

107
aims to improve the research capacity and technical skills of educational planners in Africa
(Moloi and Strauss 2005, 12). To date, it has conducted three nationally representative
school surveys in participating countries, specifically SACMEQ I (1995), SACMEQ II (2000),
and SACMEQ III (2007)36. These surveys collect extensive background information on the
schooling and home environments of students, and in addition, test students and teachers in
both numeracy and literacy (Murimba, 1991; Ross et al., 2005). SACMEQ 2007 tested
61,396 Grade 6 students from 2,779 schools in 14 countries (Hungi et al., 2010). This
dataset represents the most recent and comprehensive survey on educational quality in
Sub-Saharan Africa37.
For the data on educational access, we use the grade 6 completion rate from the most
recent Demographic and Health Surveys (DHS) of each country. DHS surveys are an
important source of data for public health and social science research, and are widely used
in both fields.
DHS uses a stratified, two stage cluster design. Countries are stratified by rural-urban
location and region that is usually defined as a province or district38. Enumerator areas are
used as primary sampling units and are selected with probability proportional to size. DHS
surveys use existing, officially recognized sampling frames with weights calculated as the
product of the selection probability and the inverse of the response rate group. Further
information on sampling can be found in Appendix A of the final country reports (ICF
International, 2012)
There are a number of benefits to using the DHS data over other sources:
1) Self-reported enrolment and grade completion rates are often more accurate than
administrative records - the quality of which varies widely between countries
(UNESCO Institute for Statistics, 2010). Unlike country-specific administrative data,
the uniformity of the DHS surveys means that DHS data are in fact more comparable
across countries and over time.
2) They can be linked with household characteristics like socioeconomic status (Filmer
and Pritchett, 2001), and not simply gender which is one of the limitations of
administrative data.
36
Although SACMEQ IV (2013) has been conducted, the data from this round is only expected to be released in 2015.
37 SACMEQ is not representative of sub-Saharan Africa since this includes Central and West Africa.
SACMEQ seems representative of about half of sub-Saharan Africa.
38 Tanzania is stratified by mainland / Zanzibar as well as urban / rural.

108
3) When calculating an enrolment or attendance rate from DHS, the numerator (number
of the age-specific population that are enrolled) and the denominator (total number of
the age-specific population) are taken from the same source whereas traditional
Gross Enrolment rates (GERs) and Net Enrolment Rates (NERs) use administrative
data for the numerator and population estimates from a different source for the
denominator, leading to potentially large biases (UNESCO Institute for Statistics,
2010).
4) It provides accurate age-specific grade-completion rates, which are necessary for the
present analysis. Calculating age-specific grade completion rates from administrative
data is problematic because the UN Population Division only publishes population
figures in five-year age groups. However, given that entry and exit ages for primary
school are different for different countries, it is necessary to disaggregate this five-
year group into single-year-of-age estimates. To do this one has to use Sprague’s
fifth difference osculatory interpolation formula and then re-aggregate for each
country. This introduces additional variance into the estimator and can lead to
inaccurate grade completion rates, particularly in certain countries. See UNESCO
Institute of Statistics (2010, p. 21) for further discussion. In addition to the above, if
one uses the readily available primary school Net Enrolment Rates (NER) from
UNESCO’s EFA reports, one makes the implicit assumption that the entry,
progression and drop-out profiles across countries are either equal or
inconsequential, neither of which are likely to be true.
5) Enrolment rates from UNESCO’s EFA reports often do not agree with the on-the-
ground reality in many African countries. The primary school NER reported in the
EFA Global Monitoring Report (UNESCO, 2011, p. 344) for our eleven countries,
based on 2008 enrolment data, are completely at odds with the expectations of
anyone doing research on education in Africa. For example, observing the primary
school NERs for our sample of countries shows that the poorest countries have
almost complete primary school enrolment (Zambia 95%, Uganda 97%, Tanzania
99% and Malawi 91%) while the wealthier countries have the lowest NER’s (South
Africa 87%, Namibia 89%). The results from the DHS surveys used in our analysis
(reported in Table 15) are far more congruent with the existing body of knowledge on
primary school enrolment in sub-Saharan Africa. Whether this is due to
methodological complications in the calculation of NER, as outlined above, or

109
incorrect administrative data39 provided by member countries is inconsequential for
our purposes.
6) Grade completion rates, which we regard as the most meaningful measure of access
to education at least for the purposes of this paper, cannot be calculated reliably
using administrative education data.
It would be remiss not to include a brief list of the limitations of household survey data.
These include: sampling errors, household non-response, excluding homeless children from
the sampling frame, measurement error, and the problems with capturing school attendance.
However, given that DHS data has been used in hundreds of peer-reviewed academic
publications for a variety of purposes, including educational attainment (Filmer and Pritchett,
1999) and enrolment (Hanushek and Wößmann n, 2008), we do not believe that any of
these problems outweigh the serious limitations of the alternative.
In order to calculate a measure of socioeconomic status DHS uses information on assets
(electricity, radio, television, bicycle and refrigerator), services (sanitation, drinking water and
electricity), vehicles (motorcycle, scooter, car and truck), building material quality (floor, wall
and roof material), ownership of agricultural land, employing a domestic servant and other
country specific assets. These variables are then converted to dichotomous variables and
principal component analysis is used to construct a wealth index (Ruthstein and Jonson,
2004). For the SACMEQ data we use the socioeconomic status variable created by
SACMEQ which was created by combining variables that described the educational level of
the students’ parents, the materials used in the construction of students’ homes, and the
number of possessions in students’ homes (Ross et al., 2005, p. 37). Figure 14 below shows
the box-plots of the SACMEQ student socioeconomic status (SES) variable for each of the
11 countries. If one compares students from South Africa and those from the poorest 6
countries (Malawi, Tanzania, Mozambique, Uganda, Kenya, and Zambia), one can see that
South African students who are at the 25th percentile in the South African SES distribution
have a higher level of socioeconomic status than their peers in these poorer countries who
are at or above the 75th percentile in their respective countries. It is important to bear these
inter-country differences in mind when comparing the poorest 40% of South African students
with the poorest 40% of Malawian students (for example), since the former are considerably
wealthier than the latter.
39
Local schools may misrepresent their enrolment figures since school funding or personnel are often allocated based on enrolment figures. In addition, small local discrepancies in enrolments can become large once aggregated to the national level.

110
FIGURE 14: BOXPLOTS OF STUDENT SOCIOECONOMIC STATUS BY COUNTRY (SACMEQ 2007) DIAMOND
REPRESENTS THE MEDIAN
Of the 14 SACMEQ countries, 11 have reliable and recent survey data on grade completion
and therefore we include these 11 countries in our analysis. The specific dates that each
DHS survey was conducted in 9 of the 11 countries are: Kenya (2008-9), Lesotho (2009),
Malawi (2010), Mozambique (2011), Namibia (2006-7), Tanzania (2010), Uganda (2011),
Zambia (2007) and Zimbabwe (2010/11). For South Africa, we follow Filmer (2010) and use
the South African General Household Survey from 2009 given that the South African DHS
data have not been released to date. In order to find a sufficiently recent dataset for
Swaziland, we use the Multiple Indicator Cluster Survey (MICS) for 2010. MICS And DHS
collaborate closely using inter-agency processes to harmonize their survey tools to ensure
maximum comparability (Hancioglu and Arnold, 2013). Observing only these 11 countries,
the SACMEQ survey tested 49,733 Grade 6 students in 2,247 primary schools.
4.4 METHOD
Educational quality, as proxied by student numeracy and literacy test scores, is a continuous
variable while educational access is binary (completed grade 6 or not). Thus some
transformation is necessary in order to create a single indicator of education system
performance. This is possible by making certain assumptions about the numeracy and
literacy competency of children who will never complete grade 6. Since we have data on
300
400
500
600
700
800
Stu
den
t socio
econ
om
ic s
tatu
s
MAL TAN MOZ UGA KEN ZAM LES NAM ZIM SWA SOU
excludes outside values

111
both the educational competencies of the school-going population (from SACMEQ), and also
the proportion of a cohort that will complete grade 6 (from DHS), we calculate the proportion
of a cohort of children (whether in school or out) that have acquired basic numeracy and
literacy skills – what we call the access-to-literacy and access-to-numeracy rates.
Given that the present study aims to combine statistics on access and quality, and that the
only cross-national measure of education quality in Africa is at the grade 6 level, an accurate
measure of access to the grade 6 level was required. There are various different methods for
calculating such a measure. We provide an overview of each method (in increasing order or
technical correctness) and explain their limitations:
1. Use the primary school Net Enrolment Rate (NER). These rates are reported in
the UNESCO Global Monitoring Reports (UNESCO 2005, 291 for example) and are
available for almost all countries. Two problems are immediately evident: (1) the
primary school NER overstates access to grade 6 since it calculates enrolment over
the full range of primary grades such that many children who are “enrolled” by this
measure will never actually complete grade 6. While single-year-of-age enrolment
estimates are technically possible, they are also problematic 40 ; (2) The NER is
calculated by using administrative data for the numerator and population estimates
from a different source for the denominator, leading to potentially large biases (for a
comprehensive discussion see UNESCO Institute for Statistics, 2010).
2. Calculate age-specific Net Attendance Rates (NAR) from household survey
data. Instead of using administrative data, one could use nationally representative
household survey data on enrolment. This ensures that both the numerator and
denominator are sourced from the same data and thus overcomes some of the
problems highlighted in (1) above. This was the first approach we employed in a
preliminary 41 version of the present analysis. There we calculated the country-
specific median age of children in SACMEQ and then observed the Net Attendance
Rate for children of that age in the DHS (Spaull and Taylor, 2012). However, this
method overstates access to grade 6 since it assumes that all children of the median
40
Calculating age-specific enrolment rates from administrative data is problematic because the UN Population Division only publishes population figures in five-year age groups. However, given that entry and exit ages for primary school are different for different countries, it is necessary to disaggregate this five-year group into single-year-of-age estimates. To do this one has to use Sprague’s fifth difference osculatory interpolation formula and then re-aggregate for each country. This introduces additional variance into the estimator and can lead to inaccurate enrolment rates, particularly in certain countries. See UNESCO Institute for Statistics (2010, 21) for further discussion. In addition to the above, if one uses the readily available primary school Net Enrolment Rates (NER) from UNESCO’s EFA reports, one makes the implicit assumption that the entry, progression and drop-out profiles across countries are either equal or inconsequential, neither of which are likely to be true.
41 We are indebted to an anonymous reviewer who highlighted the shortcomings of the methods we used in two
earlier versions of this paper, and particularly the limitations of the Kaplan-Meier method for the present analysis. Their detailed and constructive comments and suggestions led to significant improvements in our methodology.

112
age that are attending school have reached, or will reach, grade 6. Given the large
variance in ages across grades in sub-Saharan Africa (Lewin and Little, 2011), many
children of the SACMEQ median-age have not yet reached grade 6 and may never
reach grade 6.
3. Use Kaplan-Meier survival probabilities to estimate grade survival. In the
second iteration of the present study (Spaull and Taylor, 2014) we used Filmer’s
(2010) estimates of grade survival probabilities to grade 6 for the 10-19 year old
cohort in each country. Filmer (2007) calculates these probabilities by using the
Kaplan-Meier method which, he argues, “implicitly accounts for the fact that some in
the cohort are still in school and will ultimately complete a higher grade than they are
currently observed to be in” (Filmer 2007, 166). The Kaplan-Meier method was
developed for medical trials to estimate the probability of survival from data that may
be incomplete (i.e. in the presence of censoring). However, this method requires
independence between censoring and survival (Szklo and Nieto 2012, 55). That is to
say that individuals who are censored, or “lost to follow up” (i.e. no longer in the
sample) have the same prospect of survival as those who continued to be followed
(i.e. remain in the sample). If this assumption is not met the resulting probabilities will
be biased. In Filmer’s educational application of the method, the number who have
dropped out of school is analogous to the number in the medical sample who died,
while the number of children who are delayed (i.e. who have not dropped out of
school but are behind their age-appropriate peers) are analogous to those who are
“lost to follow up” (censored observations) in the medical sample. Because the
Kaplan-Meier method assumes that censored observations have the same
probability of survival as those who remain in the sample, Filmer is essentially
assuming that those who are delayed have the same probability of dropping out of
school as those who are not delayed (i.e. those who are progressing at the
appropriate rate), something that is almost certainly not true. Research has
consistently shown that overage students are more likely to drop out than their age-
appropriate peers (Lewin and Little, 2011).
4. Use Grade completion of an older cohort. One method that overcomes the
limitations of methods (1), (2) and (3), is to use household survey data (DHS) but to
calculate the grade 6 completion rate for a cohort of children where practically all
children who will complete grade 6 have completed grade 6. Pritchett (2013, 76)
employs this method and, using DHS data, calculates the grade 6 completion rate for
15-19 year olds in each SACMEQ country. Pritchett does not explicitly motivate why
he uses the 15-19 year old cohort. We assume he selected this cohort since they are
a few years beyond the usual statutory age for grade 6 completion (approximately 13

113
years old), and thus most students should have already completed grade 6.
However, this underestimates the true extent of grade-repetition and late entry in
sub-Saharan Africa. If there are children who only complete grade 6 when they are
15, 16, 17, 18 or 19, this method will underestimate the grade 6 completion rate
(potentially quite severely). To explain by example, Pritchett (2013, 76) reports that
only 54% of Ugandan 15-19 year olds had completed grade 6. Using the same data
as Pritchett (Uganda DHS 2006) we find that 23% of Ugandan 15-19 year olds were
still enrolled in grade 1-6 and therefore may yet go on to complete grade 6. Indeed,
DHS data show that the grade 6 completion rate for Ugandan 14-16 year olds (36%)
is almost half that of Ugandan 17-18 year olds (64%) illustrating that many Ugandan
children only complete grade 6 when they are 17 or 18 years old. It is worth
emphasizing that Uganda is by no means unique among SACMEQ countries42. Table
15 below shows the proportions of children currently enrolled in grades 1 to 6 and the
proportion who have completed grade 6 for two cohorts and four countries: (1) 15-19
year olds and 19-21 year olds. The year of each DHS was chosen to match those
used by Pritchett (2013). The higher grade 6 completion rates among the 19-21 year
old cohort are clearly driven by the fact that many students are only completing grade
6 at ages well beyond those stipulated by their governments. The fact that Hanushek
and Wößmann (2008, p. 656) also use 15-19 year olds in their analysis of developing
countries is also problematic, particularly because they also look at an even higher
grade (grade nine) which is likely to exacerbate this problem further. While systemic
over-age enrolment is obviously a problem in and of itself, for the purposes of
calculating a measure of access to grade 6, one has to include students that are
over-age or risk seriously underestimating access. Importantly, SACMEQ takes as its
sampling frame all students that are enrolled in grade 6 in a country (irrespective of
age), which explains the high proportions43 of students aged 15 and older in each
country; a full 22% of the SACMEQ 2007 grade 6 sample is 15 years or older. For
the purposes of the present study we needed to calculate the proportion of a cohort
that made it into the SACMEQ sampling frame (i.e. made it to grade 644), while the
age at which they do so is less important for our purposes.
42
For each country the proportion of students aged 15-19 currently enrolled in grades 1-6 is as follows (using the same DHS data as Pritchett (2013)): Kenya (11%), Lesotho (8%), Malawi (18%), Mozambique (35%), Namibia (7%), South Africa (1%), Swaziland (13%), Tanzania (6%), Uganda (23%), Zambia (14%), Zimbabwe (2%).
43 The specific proportions of SACMEQ III (2007) children aged fifteen and older for each country are as follows:
Kenya (23.7%), Lesotho (26.7%), Malawi (32%), Mozambique (30.3%), Namibia (18.4%), South Africa (7.2%), Swaziland (25.6%), Tanzania (36.8%), Uganda (28,7%), Zambia (29%), and Zimbabwe (2.1%).
44 Given that the SACMEQ test was administered towards the end of the grade 6 academic year, and due to
dropout during grade 6, grade 6 completion is arguably a better measure of access than grade 5 completion.

114
TABLE 15: COMPARISON BETWEEN ENROLMENT AND COMPLETION RATES FOR 15-19 YEAR OLDS AND 19-21
YEAR OLDS IN FOUR COUNTRIES (USING THE SAME DHS DATA AS PRITCHETT, 2013)
DHS year Country Currently enrolled in Grades 1-6 Completed Grade 6
15-19 years 19-21 years 15-19 years 19-21 years
2008 Kenya 11% 1% 81% 88%
2005 Malawi 18% 2% 54% 60%
2006 Uganda 23% 2% 55% 64%
2007 Zambia 14% 2% 73% 76%
5. Use Grade completion of a sufficiently older cohort. In order to decide which
cohort of DHS students to use, the proportion of students currently enrolled in grades
1-6 by year of age was calculated with the intention of selecting a cohort where
almost no children were still enrolled in grades 1-6. By 19 years of age, less than 5%
of individuals were enrolled in grades 1-6 in all countries and thus, to ensure
sufficiently large samples in each country we chose the cohort of 19-23 year olds for
the present analysis. While one could use an even lower threshold (<1%), this would
require an even older cohort, which would be problematic in a context where there
has been a recent rapid expansion of access to schooling, as in some sub-Saharan
African countries. Much older cohorts would not have been exposed to this newly
expanded education system, and thus their grade 6 completion rates would
underestimate the “true” current grade 6 completion rate. There is thus a tension
between selecting a cohort of students that is old enough to have been given
sufficient time to complete grade 6, but young enough that they represent the current
reality in each country. In order to decrease the potential downward bias of selecting
older cohorts (that have not benefited from very recent expansions), we use the most
recent DHS data that is available for each country. Thus, although we are reporting
grade 6 completion rates for 19-23 year olds who are much older than most
SACMEQ students in 2007, in 8 of the 11 countries the most recent DHS data was
collected in 2009 or later. For example, 30% of grade 6 students in the SACMEQ
Mozambique sample were 15 years or older in 2007 (when SACMEQ was
conducted) and thus these 30% of students would be 19 years or older in 2011 when
the DHS Mozambique was conducted. Therefore the 19-23 year old sample in DHS
Mozambique 2011 is not a bad estimate of the schooling opportunities available to
the SACMEQ cohort of Mozambican children. Although it would be ideal if all
countries had DHS data for 2011 or later, we are restricted to use the most recent

115
DHS data for each country. We would argue that excluding countries entirely simply
because their most recent DHS was only in 2006/7 is like throwing the baby out with
the bath water.
Based on the results of the numeracy and literacy tests, SACMEQ classifies participants into
one of eight categories for reading, ranging from pre-reading (level 1) to critical reading
(level 8), and similarly for mathematics, where the levels range from pre-numeracy (level 1)
to abstract problem solving (level 8). The eight competency levels are described in the online
technical appendix, and a more detailed discussion can be found in Ross et al. (2005) and
Hungi et al. (2010, 6). According to this classification system, if children have not reached
level 3 in either reading (‘basic reading’) or mathematics (‘basic numeracy’) by the time they
complete grade 6 they are deemed functionally illiterate and functionally innumerate
respectively. As the SACMEQ researchers Ross et al. (2005, 262) explain, “It is only at level
3 that pupils can be said to read [otherwise they] could be said to be illiterate.” By this
definition, if students are functionally illiterate45 they cannot read a short and simple text and
extract meaning; and if students are functionally innumerate they cannot translate graphical
information into fractions or interpret common everyday units of measurement. This
threshold of competency has been used elsewhere in the literature before. For example,
Shabalala (2005, 222) also uses the bottom two SACMEQ levels and deems students below
this threshold as ‘non-readers’ and ‘non-numerate’ (see also Spaull, 2013).
In this paper we assume that all children who never complete grade 6 are functionally
illiterate and functionally innumerate. Whether these children never enrolled in the first place,
or enrolled but dropped out prior to grade 6, is an important question, and one which we
return to later in the paper. For those children that never enroll, it is highly unlikely that they
would learn to read, write and compute at a sufficient level to be able to pass competency
level one and two on the SACMEQ tests46. For those children that do enroll but drop out
before grade 6, it is also improbable that they would have acquired these skills prior to
45
The terms “illiterate” and “innumerate” have a number of possible meanings ranging from the inability to write a sentence or complete a one-step arithmetic sum, to more demanding definitions which include reading for meaning or using numerical skills in everyday life. We take the latter approach and use the terms ‘functionally illiterate’ and ‘illiterate’ interchangeably in the paper. It is of little use if children can write down and read a memorised paragraph if they do not understand what they are reading or writing. Similarly, if children cannot relate basic arithmetic skills into real world situations, these skills are only of limited value.
45 While there will obviously be exceptions to the rule where educated parents may teach their children informally
at home, this is so small as to be negligible on a national scale.
46 While there will obviously be exceptions to the rule where educated parents may teach their children informally
at home, this is so small as to be negligible on a national scale.

116
dropping out47. Many students that drop out do so because they have failed previous grades
or repeated grades multiple times. Those that drop out due to income constraints or
remoteness are also statistically less likely to be in the better performing part of the
distribution prior to dropout. Lastly, given that many of the students who remain in school do
not reach level 3 by grade 6 (our literacy threshold), it is unlikely that those who have
dropped out would have already reached level 3 prior to dropping out. For example, we
believe it is reasonable to assume that the 4% of Zimbabwean children who enroll initially
but do not complete grade 6 would not have been a more literate group than the 17% of
Zimbabwean children that complete grade 6 but were not yet literate (see Figure 15).
Moreover, given that non-enrolled children are mainly found in poor communities and remote
areas (Lewin, 2007), it is unlikely that such children would have gained significantly from
home-based literacy activities.
In addition to the illiteracy category, we group competency levels three, four and five (basic
reading, reading for meaning, and interpretive reading) under the heading ‘basic reading
skills’, and competency levels six, seven and eight (inferential reading, analytical reading,
and critical reading) as ‘higher order reading skills’. The corresponding numeracy
designations are ‘basic numeracy skills’ with competency levels 3, 4 and 5 (basic numeracy,
beginning numeracy, and competent numeracy), and ‘higher order mathematics skills’ with
competency levels 6, 7 and 8 (mathematically skilled, concrete problem solving, and abstract
problem solving (Ross et al., 2005). Figure 15 and Figure 16 below use these designations
and follow the approach of Hanushek and Wößmann (2008, 656). This makes it possible to
combine educational access (enrolment and grade completion) and educational quality
(cognitive skills) in a single graph.
47
There are only two countries where this is a possibility, Swaziland and Tanzania. In both of these countries almost all children that complete grade 6 are functionally literate. Thus it is sensible to ask whether or not some children that only complete grade 5 (but not grade 6) may also be functionally literate. To test this we calculated the proportion of children that complete grade 5 but not grade 6 in Tanzania (2.3%) and Swaziland (4.1%). Given that these are small proportions, even in the event that children with only grade 5 completion were literate, this would not change the overall picture significantly.

117
FIGURE 15: PROPORTION OF 19-23 YEAR OLDS IN EACH COUNTRY BY ENROLMENT STATUS AND LITERACY
PROFICIENCY
14%
33%
12%
34%
7%
Mozambique
7%
30%
23%
39%
1%
Malawi
7%
19%
33%
36%
5%
Zambia
5%
26%
14%
45%
10%
Uganda
5%
17%
17% 53%
8%
Lesotho
1%
4%
26%
44%
25%
South Africa
15%
11%
3%
26%
45%
Tanzania
6%
9%
11%
57%
17%
Namibia
1%
4%
17%
52%
26%
Zimbabwe
5%
8%
7%
46%
34%
Kenya
2%
11%
1%
53%
33%
Swaziland

118
FIGURE 16: PROPORTION OF 19-23 YEAR OLDS IN EACH COUNTRY BY ENROLMENT STATUS AND NUMERACY
PROFICIENCY
14%
33%
17%
35%
1%
Mozambique
7%
30%
38%
25%
0%
Malawi
7%
19%
50%
24%
0%
Zambia
6%
26%
26%
41%
1%
Uganda
5%
17%
33%
44%
1%
Lesotho
15%
11%
10% 55
%
9%
Tanzania
1%
4%
38%
49%
8%
South Africa
6%
9%
41%
42%
2%
Namibia
1%
4%
25%
60%
10%
Zimbabwe
5%
8%
10%
65%
12%
Kenya
1%
11%
8%
75%
5%
Swaziland

119
TABLE 16: DEMOGRAPHIC AND HEALTH SURVEY (DHS) GRADE 6 COMPLETION RATE FOR 19-23 YEAR OLDS [M=MALE; F=FEMALE]
National
(%) SE (%) Boys (%) SE (%) Girls (%) SE (%)
Poor40 (%)
SE (%) Mid40
(%) SE (%)
Rich20 (%)
SE (%)
Kenya 87,21 1,00 88,36 1,13 86,20 1,43 78,49 2,07 89,44 1,36 93,92 1,35
Lesotho 77,97 1,00 65,48 1,52 90,00 0,84 61,13 1,70 82,95 1,14 95,82 0,81
Malawi 62,86 0,99 67,10 1,26 58,85 1,11 42,21 1,32 64,57 1,36 89,23 0,89
Mozambique 53,01 1,37 62,79 1,57 44,93 1,62 25,64 1,72 52,07 1,94 87,94 0,96
Namibia 85,42 0,84 81,42 1,25 88,98 0,88 76,18 1,59 85,99 1,07 97,57 0,71
South Africa 95,42 0,33 94,16 0,48 96,64 0,37 92,58 0,67 97,24 0,30 98,90 0,33
Swaziland 87,73 2,41 86,39 6,98 94,43 2,10 77,90 5,53 89,78 2,67 95,38 2,47
Tanzania 74,12 1,41 78,50 1,45 70,24 1,79 57,37 2,43 78,00 1,36 92,36 1,19
Uganda 68,53 1,34 70,49 1,54 67,05 1,72 48,98 2,19 71,56 2,09 89,46 1,20
Zambia 74,03 1,22 80,91 1,36 67,98 1,60 51,58 2,26 76,89 1,56 95,21 1,11
Zimbabwe 95,21 0,46 94,73 0,61 95,59 0,56 89,41 1,16 96,98 0,48 99,29 0,33
Poor40M
(%) SE (%)
Poor40F (%)
SE (%) Mid40M
(%) SE (%)
Mid40F (%)
SE (%) Rich20M
(%) SE (%)
Rich20F (%)
SE (%)
Kenya 82,49 2,21 74,96 2,97 89,97 1,57 88,93 2,12 93,03 2,00 94,57 1,53
Lesotho 42,63 2,09 81,26 1,88 73,40 1,85 92,29 1,05 92,77 1,60 98,14 0,62
Malawi 48,50 1,90 37,03 1,50 67,39 1,89 61,80 1,67 89,25 1,18 89,20 1,28
Mozambique 39,05 2,68 15,22 1,90 62,93 2,45 43,45 2,24 88,92 1,14 87,03 1,33
Namibia 71,82 2,24 80,37 1,95 81,33 1,66 90,15 1,07 96,84 1,28 98,15 0,75
South Africa 90,42 0,94 94,69 0,76 96,59 0,50 97,87 0,34 98,76 0,52 99,03 0,41
Swaziland 85,99 6,53 90,49 7,09 81,88 11,09 95,19 2,57 99,75 0,26 96,41 2,84
Tanzania 64,78 2,71 51,29 2,85 79,62 1,82 76,36 2,17 97,19 1,09 88,56 1,79
Uganda 56,85 2,92 43,00 2,72 72,13 2,37 71,09 2,64 86,39 2,32 91,60 1,24
Zambia 65,71 3,08 40,54 2,69 81,92 1,68 72,20 2,34 95,21 1,63 95,21 1,40
Zimbabwe 87,72 1,60 90,71 1,35 97,26 0,62 96,75 0,73 98,83 0,71 99,64 0,23

120
TABLE 17: PROPORTION OF SACMEQ 2007 SAMPLE THAT ARE LITERATE (SACMEQ LEVEL 3+) (NOT CORRECTED FOR THOSE WHO DO NOT COMPLETE GRADE 6)
National
(%) SE (%) Boys (%) SE (%) Girls (%) SE (%)
Poor40 (%)
SE (%) Mid40
(%) SE (%)
Rich20 (%)
SE (%)
Kenya 91,96 1,00 91,45 0,97 92,48 1,39 87,58 1,97 92,88 0,75 97,51 0,55
Lesotho 78,80 1,30 76,06 1,71 81,09 1,31 72,89 1,90 78,00 1,48 87,73 1,68
Malawi 63,40 1,77 66,40 2,04 60,31 1,95 58,29 2,77 62,56 2,04 69,45 2,26
Mozambique 78,49 1,13 79,46 1,25 77,34 1,42 66,48 3,07 76,66 1,48 87,65 1,22
Namibia 86,37 0,76 83,50 0,99 89,01 0,81 80,61 1,28 86,60 0,90 94,94 0,76
South Africa 72,74 1,19 68,83 1,32 76,52 1,25 57,76 1,60 76,13 1,17 94,08 0,85
Swaziland 98,52 0,40 97,96 0,53 99,09 0,33 97,65 0,79 98,76 0,33 99,50 0,26
Tanzania 96,50 0,52 96,77 0,65 96,24 0,62 94,54 0,98 96,64 0,70 98,71 0,39
Uganda 79,65 1,30 80,82 1,39 78,50 1,51 72,53 2,09 77,62 1,45 90,67 1,16
Zambia 55,91 1,68 58,25 1,88 53,45 2,15 48,34 2,41 51,72 2,00 70,85 2,41
Zimbabwe 81,50 1,55 77,64 1,95 84,47 1,72 74,92 2,24 80,55 2,05 95,12 1,37
Poor40M
(%) SE (%)
Poor40F (%)
SE (%) Mid40M
(%) SE (%)
Mid40F (%)
SE (%) Rich20M
(%) SE (%)
Rich20F (%)
SE (%)
Kenya 87,18 1,57 87,97 2,68 92,48 1,08 93,50 1,18 97,03 0,93 97,68 0,79
Lesotho 67,88 2,83 75,97 1,99 74,24 1,98 81,32 1,70 86,44 1,89 89,10 1,93
Malawi 58,48 3,27 54,93 3,30 65,77 2,67 60,20 2,57 75,95 2,70 64,91 2,53
Mozambique 69,26 3,34 63,69 4,60 79,36 1,67 74,54 2,07 88,56 1,36 84,90 1,66
Namibia 77,35 1,75 83,49 1,46 82,76 1,30 89,66 0,98 93,88 1,08 96,83 0,71
South Africa 54,14 1,77 60,71 1,92 71,08 1,57 81,74 1,18 91,32 1,28 96,39 0,85
Swaziland 96,93 0,99 98,68 0,55 98,48 0,49 99,01 0,38 98,87 0,59 100,00
Tanzania 95,05 1,42 93,53 1,37 97,03 0,74 96,78 0,91 98,64 0,53 98,46 0,63
Uganda 74,59 2,30 72,26 2,30 78,79 1,76 75,85 1,83 92,37 1,43 88,46 1,51
Zambia 51,02 2,87 45,43 3,56 55,14 2,38 49,05 2,69 73,57 2,64 66,92 3,37
Zimbabwe 69,92 3,25 78,72 2,25 77,35 2,26 83,71 2,45 91,90 2,59 96,43 1,76

121
TABLE 18: PROPORTION OF THE SACMEQ 2007 SAMPLE THAT ARE NUMERATE (SACMEQ LEVEL 3+) ( NOT CORRECTED FOR THOSE WHO DO NOT COMPLETE GRADE 6)
National
(%) SE (%) Boys (%) SE (%) Girls (%) SE (%)
Poor40 (%)
SE (%) Mid40
(%) SE (%)
Rich20 (%)
SE (%)
Kenya 88,77 1,04 89,92 1,07 87,59 1,47 84,65 1,89 89,44 0,97 94,40 1,04
Lesotho 58,19 1,59 57,72 1,93 58,59 1,74 50,64 2,03 57,05 1,82 69,79 2,40
Malawi 40,12 1,80 44,50 2,07 35,61 2,18 37,87 2,86 40,22 1,97 42,10 2,36
Mozambique 67,27 1,26 70,38 1,42 63,58 1,69 55,41 2,27 65,97 1,77 75,69 1,59
Namibia 52,31 1,35 52,39 1,56 52,24 1,48 38,28 1,82 50,38 1,53 77,60 1,71
South Africa 59,83 1,38 57,53 1,55 62,05 1,46 43,08 1,74 61,30 1,37 88,40 1,13
Swaziland 91,41 0,93 92,76 0,92 90,07 1,17 89,00 1,34 91,53 1,10 95,13 0,86
Tanzania 86,76 1,07 89,67 1,05 83,96 1,45 81,30 1,92 86,80 1,21 93,49 0,88
Uganda 61,26 1,58 63,45 1,76 59,14 1,81 52,86 2,25 58,64 1,74 74,62 1,89
Zambia 32,68 1,42 36,09 1,75 29,08 1,73 25,73 2,03 28,34 1,50 47,16 2,89
Zimbabwe 73,45 1,70 71,76 2,34 74,76 1,84 62,80 2,60 73,36 1,90 92,69 1,44
Poor40M
(%) SE (%)
Poor40F (%)
SE (%) Mid40M
(%) SE (%)
Mid40F (%)
SE (%) Rich20M
(%) SE (%)
Rich20F (%)
SE (%)
Kenya 86,98 1,74 83,34 2,40 90,06 1,15 87,85 1,59 94,86 1,56 93,83 1,40
Lesotho 49,85 2,90 50,51 2,24 54,70 2,42 59,00 2,36 69,71 2,92 71,17 2,91
Malawi 40,61 3,11 31,45 4,11 45,86 2,73 37,29 2,50 46,63 3,21 36,71 3,08
Mozambique 58,08 2,79 52,99 3,79 70,98 2,03 59,43 2,44 80,25 1,94 71,37 2,12
Namibia 38,24 2,17 38,70 2,09 49,65 2,04 50,95 1,77 77,95 2,05 76,73 2,00
South Africa 41,66 2,12 44,58 1,99 57,97 1,68 64,51 1,49 85,97 1,56 90,49 1,28
Swaziland 90,56 1,60 87,55 1,65 93,33 0,96 90,14 1,67 95,63 0,98 94,62 1,29
Tanzania 85,60 2,03 77,51 2,82 91,10 1,13 83,66 1,55 92,72 1,33 91,94 1,33
Uganda 56,31 2,60 52,30 2,66 61,08 1,93 54,61 2,30 76,71 2,27 72,56 2,23
Zambia 28,31 2,74 22,89 2,20 33,44 2,10 24,94 1,95 51,42 3,34 40,48 3,67
Zimbabwe 60,94 3,76 64,03 2,56 71,81 2,85 75,07 2,22 90,79 2,27 93,63 2,11

122
By using the SACMEQ categories and assuming that children who will never complete grade
6 are illiterate and innumerate we are able to create a single composite statistic of
educational access and educational quality. Rather than simply report the grade 6
completion rate, which can be thought of as an access-to-grade-6-schooling rate, we use the
SACMEQ levels and create an access-to-learning rate, what we term the access-to-literacy
and access-to-numeracy rates. Using the example of South Africa to illustrate, Figure 15
above shows that 1% of children never enrolled, 4% of children enrolled initially but did not
complete grade 6, 26% completed grade 6 but were functionally illiterate, 44% completed
grade 6 and acquired basic literacy skills, and 25% completed grade 6 and acquired higher
order reading skills. Traditionally one would only see the grade 6 completion rate for South
Africa (95%), whereas we combine this with the SACMEQ levels and report the access-to-
literacy rate. To calculate the access-to-literacy rate one simply multiplies the grade 6
completion rate (Table 16, 95% for South Africa) by the proportion of the SACMEQ sample
that is literate (Table 17, 73% for South Africa) yielding an access-to-literacy rate of 69%
(95% x 73%). This is the same as summing the proportion of children in South Africa who
had acquired basic (44%) or higher order (25%) reading skills. That is to say that only 69%
of the 19-23 year old cohort in South Africa completed grade 6 and acquired basic literacy
skills (Table 19). The access-to-numeracy rate is considerably lower at 57%, meaning that of
the 19-23 year old cohort in South Africa, only 57% will complete grade 6 and acquire basic
numeracy skills (Table 20).
This highlights the fact that 26% of a South African cohort will not acquire basic literacy skills
even though they do complete grade 6 (Figure 15), and that 38% of children will not acquire
basic numeracy skills even though they do complete grade 6 (Figure 16). Given that these
children do not have access-to-learning (literacy and numeracy respectively) for our
purposes we group them with those that never complete grade 6. The access-to-numeracy
and access-to-literacy rate statistics are meant to complement existing enrolment, grade-
survival and quality assessment statistics, rather than replace them. There are clear
administrative reasons why ministries of education collect separate statistics for access and
quality. However the argument presented here is that these data should be used together to
provide a more accurate and holistic picture of access, throughput and learning.
4.4.1 SUB-NATIONAL DIFFERENCES
While national comparisons of access and quality are useful, there are also significant sub-
national differences by gender and wealth for both access (Filmer and Pritchett, 1999) and
quality (Hungi et al., 2010). Table 16 shows the differences in grade 6 completion rates by

123
gender and wealth as well as an interaction between gender and wealth, using DHS data.
We use the same categories as those of Filmer (2010), namely separating students into one
of three categories: the poorest 40% of students, the middle 40% of students, and the
wealthiest 20% of students48. Due to the large differences in grade 6 completion rates within
countries, comparing school quality across sub-groups without taking into account sub-
national grade-completion differentials will necessarily bias the results in cases where sub-
national completion differences are non-trivial.
In keeping with the above, we calculate the proportion of a cohort (whether in school or out)
that is literate and numerate in each country, and, within each country by important sub-
groups (Table 19 and Table 20). Given the assumption that children who never complete
grade 6 are illiterate and innumerate, it becomes possible to simply multiply the functional
literacy rates of boys and girls in grade 6 (from SACMEQ) by the respective grade 6
completion rates for boys and girls (from DHS). For example, in Lesotho the SACMEQ tests
showed that 81% of girls and 76% of boys in school in grade 6 were functionally literate
(Table 17). However, according to the DHS survey, only 65% of boys will complete grade 6
in contrast to 90% of girls (Table 16). If one assumes that those boys and girls who never
complete grade 6 (35% of boys and 10% of girls) are functionally illiterate, one can say that
73% (81.1% x 90.0%) of a cohort of girls in Lesotho are functionally literate. In contrast, only
50% (76.1% x 65.5%) of a cohort of boys in Lesotho are functionally literate (I return to the
reasons for this Lesotho gender differential later in the chapter).
One of the most consistent findings in the educational literature is that children from rural
areas are at a distinct disadvantage relative to their urban peers (Sahn and Stifel, 2003;
UNESCO, 2005). Consequently it would be logical to include school location (urban-rural) as
one of the sub-national differences. Unfortunately this was not possible with the existing
data. In the DHS there is an objective measure of whether the household is in a rural area or
an urban area, whereas in SACMEQ principals were asked to identify whether their school
was in an urban area or not. In order to combine statistics from SACMEQ and DHS the
underlying populations should be broadly equal (as in the case of gender or socioeconomic
status), which is not the case with geographic location. The proportion of households
classified as rural in DHS is sometimes significantly different to the proportion of schools
classified as rural in SACMEQ, with particularly large discrepancies in some countries
(Mozambique and Zambia) and very small discrepancies in other countries (Malawi and
Tanzania). In Mozambique for example, the DHS shows that 59% of households were in a
48
The wealth quintiles used here were created by DHS (variable: hv270).

124
rural area, whereas in SACMEQ, only 37% of principals reported that they were in a rural
area (i.e. a 23 percentage point difference). One cannot therefore multiply statistics from
these two (different) categories and thus geographic location has been excluded from the
present analysis.
In addition to gender, previous studies have shown that large wealth-based differentials also
exist for both school quality (Hungi, et al., 2010) and enough (Filmer and Pritchett, 1999).
Taking Mozambique as an example, only 26% of the poorest 40% of children will complete
grade 6, compared to 88% of the richest 20% of children. Unfortunately one cannot simply
multiply literacy rates for the poorest 40% of children in SACMEQ with the grade 6
completion rates for the poorest 40% of children in DHS because these categories do not
represent the same underlying population. The poorest 40% of children in DHS represent
the poorest 40% of children in the country, while the poorest 40% of children in SACMEQ
represent the poorest 40% of children who completed grade 6.
This is made clearer using a hypothetical example. If one assumes that there are 1000
children in a particular cohort and that the national grade 6 completion rate is 85% and we
know that the grade 6 completion rate for each of the three wealth groups are as follows: of
the poorest 400 students only 300 complete grade 6 (75% grade 6 completion rate), of the
middle 400 students 350 complete grade 6 (87.5% grade 6 completion rate), and of the
wealthiest 200 students all complete grade 6 (100% grade 6 completion rate). This would
equate to a national grade 6 completion rate of 85% {(300 + 350 + 200)/1000}.
If one were to ignore the grade 6 survival rate differentials for these three groups, and simply
calculate the poorest 40%, middle 40% and richest 20% of students using the SACMEQ
sample of 850 students one would get categories that had 340 students in the poorest 40%,
340 students in the middle 40% and 170 students in the richest 20% category. However,
only 300 of the 850 students actually come from the poorest 40% of households, not 340,
and 200 students come from the richest 20%, not 170. Thus if one did not apply a correction
to account for the differential grade 6 survival rates one would overestimate the literacy
achievement of the poorest 40% of children.
Thus, the distribution of students in SACMEQ is ordered from poorest to wealthiest and then
split according to the grade 6 completion rates of each wealth group to obtain SACMEQ

125
wealth groups that are comparable to DHS wealth groups49. This process of splitting the
SACMEQ sample into groups that are representative of DHS categories is shown
mathematically by the following formula:
𝑇𝑜𝑡𝑎𝑙 𝑆𝐴𝐶𝑀𝐸𝑄 𝑠𝑎𝑚𝑝𝑙𝑒 = ∫ 𝐶𝑁𝑠𝑒𝑠
(𝐶𝑅𝑝𝑜𝑜𝑟40
0.4∗𝐶𝑅𝑡𝑜𝑡𝑎𝑙)∗𝑁
0
+ ∫ 𝐶𝑁𝑠𝑒𝑠
(𝐶𝑅𝑚𝑖𝑑40
0.4∗𝐶𝑅𝑡𝑜𝑡𝑎𝑙)∗𝑁
(𝐶𝑅𝑝𝑜𝑜𝑟40
0.4∗𝐶𝑅𝑡𝑜𝑡𝑎𝑙)∗𝑁
+ ∫ 𝐶𝑁𝑠𝑒𝑠
(𝐶𝑅𝑟𝑖𝑐ℎ20
0.2∗𝐶𝑅𝑡𝑜𝑡𝑎𝑙)∗𝑁
(𝐶𝑅𝑚𝑖𝑑40
0.4∗𝐶𝑅𝑡𝑜𝑡𝑎𝑙)∗𝑁
where CRpoor40 is the grade 6 completion rate for the poorest 40% of 19-23 year olds in the
country, CRmid40 is the grade 6 completion rate for the middle 40% of 19-23 year olds in the
country, SRrich20 is the grade 6 completion rate for the richest 20% of 19-23 year olds in the
country, CRtotal is the national grade 6 completion rate, N is the total population of grade six
students obtained by inflating the SACMEQ sample to the population of grade six students
using the SACMEQ raising factor variable “rf2”. This is the inverse of the probability of
selecting a student into the sample and is derived from the SACMEQ sampling procedure
(Ross et al. 2005, 36). The variable CNses is the cumulative distribution of the grade six
school-going population sorted from poorest to wealthiest. The first integral represents the
SACMEQ students that correspond to the poorest 40% of 19-23 year olds from DHS, the
second integral represents the SACMEQ students that correspond to the middle 40% of 19-
23 year olds in the DHS sample and the last integral represents the SACMEQ students that
correspond to the richest 20% of the 19-23 year olds in the DHS sample.
49
Given that SACMEQ is a sample of the total school-going population, we created a cumulative distribution of students using the SACMEQ “rf2” (raising factor) variable.

126
TABLE 19: ACCESS-TO-LITERACY RATES FOR 19-23 YEAR OLDS BY SUB-GROUPS - COMBINING SACMEQ AND DHS50
National
(%) SE (%)
Boys (%)
SE (%) Girls (%) SE (%) Poor40
(%) SE (%)
Mid40 (%)
SE (%) Rich20
(%) SE (%)
Kenya 80,19 1,42 80,80 1,49 79,71 2,00 68,74 2,86 83,08 1,55 91,59 1,46
Lesotho 61,44 1,64 49,80 2,29 72,98 1,55 44,56 2,55 64,70 1,86 84,06 1,87
Malawi 39,86 2,03 44,56 2,39 35,49 2,24 24,60 3,07 40,40 2,45 61,97 2,43
Mozambique 41,61 1,77 49,90 2,01 34,75 2,15 17,05 3,52 39,92 2,44 77,08 1,55
Namibia 73,77 1,13 67,99 1,60 79,20 1,19 61,41 2,04 74,47 1,40 92,63 1,04
South Africa 69,41 1,23 64,81 1,40 73,95 1,31 53,47 1,74 74,03 1,21 93,05 0,91
Swaziland 86,44 2,44 84,63 7,00 93,56 2,12 76,07 5,59 88,66 2,69 94,90 2,48
Tanzania 71,52 1,50 75,96 1,59 67,60 1,89 54,24 2,62 75,37 1,52 91,17 1,25
Uganda 54,58 1,87 56,97 2,07 52,64 2,29 35,52 3,03 55,54 2,55 81,12 1,67
Zambia 41,39 2,08 47,13 2,32 36,33 2,68 24,94 3,30 39,77 2,54 67,46 2,65
Zimbabwe 77,59 1,62 73,55 2,05 80,75 1,81 66,98 2,53 78,12 2,10 94,44 1,41
Poor40M
(%) SE (%)
Poor40F (%)
SE (%) Mid40M
(%) SE (%)
Mid40F (%)
SE (%) Rich20M
(%) SE (%)
Rich20F (%)
SE (%)
Kenya 71,92 2,71 65,95 4,00 83,20 1,90 83,14 2,42 90,27 2,20 92,38 1,72
Lesotho 28,94 3,52 61,74 2,74 54,49 2,71 75,05 2,00 80,19 2,48 87,44 2,03
Malawi 28,36 3,78 20,34 3,63 44,32 3,27 37,20 3,07 67,79 2,94 57,89 2,84
Mozambique 27,05 4,29 9,69 4,98 49,94 2,97 32,39 3,05 78,74 1,77 73,89 2,13
Namibia 55,55 2,84 67,10 2,44 67,31 2,11 80,83 1,45 90,91 1,67 95,04 1,03
South Africa 48,95 2,00 57,49 2,06 68,65 1,65 79,99 1,23 90,20 1,38 95,46 0,94
Swaziland 83,35 6,60 89,30 7,11 80,64 11,10 94,24 2,60 98,62 0,65 96,41 2,84
Tanzania 61,57 3,06 47,97 3,16 77,26 1,97 73,90 2,35 95,88 1,21 87,20 1,90
Uganda 42,41 3,71 31,07 3,56 56,83 2,96 53,93 3,21 79,79 2,73 81,03 1,96
Zambia 33,52 4,21 18,42 4,46 45,17 2,92 35,42 3,57 70,05 3,10 63,71 3,65
Zimbabwe 61,33 3,62 71,40 2,62 75,23 2,34 80,99 2,56 90,82 2,68 96,07 1,78
50
Given that SACMEQ and DHS use different samples in their surveys, the samples are independent and thus the composite standard errors are simply the square-root of the sum of the squared standard errors of each sample, i.e. Sqrt(SE1DHS
2 + SE2SACMEQ
2).

127
TABLE 20: ACCESS-TO-NUMERACY RATES FOR 19-23 YEAR OLDS BY SUB-GROUPS - COMBINING SACMEQ AND DHS51
National (%) SE (%) Boys (%) SE (%) Girls (%) SE (%) Poor40
(%) SE (%) Mid40 (%) SE (%) Rich20
(%) SE (%)
Kenya 77,42 1,44 79,45 1,56 75,50 2,05 66,44 2,80 80,00 1,67 88,66 1,70
Lesotho 45,37 1,88 37,79 2,46 52,73 1,93 30,96 2,65 47,32 2,14 66,88 2,53
Malawi 25,22 2,05 29,86 2,42 20,96 2,44 15,99 3,15 25,97 2,39 37,56 2,52
Mozambique 35,66 1,86 44,19 2,12 28,57 2,34 14,21 2,85 34,35 2,63 66,57 1,85
Namibia 44,68 1,59 42,65 2,00 46,48 1,73 29,16 2,42 43,33 1,87 75,71 1,85
South Africa 57,09 1,42 54,18 1,62 59,96 1,51 39,88 1,87 59,61 1,40 87,43 1,17
Swaziland 80,20 2,58 80,14 7,04 85,05 2,40 69,33 5,69 82,18 2,89 90,73 2,62
Tanzania 64,31 1,77 70,39 1,79 58,98 2,30 46,64 3,10 67,70 1,81 86,34 1,48
Uganda 41,98 2,07 44,72 2,34 39,65 2,49 25,89 3,14 41,96 2,72 66,76 2,24
Zambia 24,19 1,88 29,20 2,22 19,77 2,36 13,27 3,04 21,79 2,16 44,90 3,10
Zimbabwe 69,94 1,76 67,98 2,41 71,47 1,93 56,15 2,84 71,15 1,96 92,03 1,48
Poor40M (%) SE (%) Poor40F
(%) SE (%) Mid40M (%) SE (%) Mid40F
(%) SE (%) Rich20M (%) SE (%) Rich20F
(%) SE (%)
Kenya 71,75 2,82 62,47 3,81 81,03 1,94 78,12 2,65 88,26 2,53 88,74 2,08
Lesotho 21,25 3,58 41,05 2,92 40,15 3,05 54,45 2,58 64,67 3,33 69,85 2,98
Malawi 19,69 3,65 11,65 4,37 30,91 3,32 23,05 3,01 41,62 3,41 32,75 3,34
Mozambique 22,68 3,87 8,07 4,24 44,67 3,19 25,82 3,32 71,36 2,25 62,11 2,50
Namibia 27,47 3,11 31,10 2,86 40,38 2,63 45,93 2,06 75,49 2,42 75,31 2,14
South Africa 37,67 2,32 42,21 2,13 55,99 1,75 63,14 1,53 84,91 1,65 89,62 1,35
Swaziland 77,86 6,72 79,23 7,28 76,42 11,13 85,80 3,06 95,39 1,01 91,22 3,12
Tanzania 55,45 3,39 39,76 4,01 72,54 2,15 63,89 2,66 90,12 1,72 81,42 2,23
Uganda 32,01 3,91 22,49 3,80 44,06 3,06 38,82 3,50 66,27 3,24 66,47 2,55
Zambia 18,60 4,12 9,28 3,47 27,39 2,69 18,01 3,04 48,96 3,72 38,55 3,92
Zimbabwe 53,46 4,09 58,08 2,90 69,84 2,91 72,63 2,34 89,72 2,38 93,29 2,12
51
Given that SACMEQ and DHS use different samples in their surveys, the samples are independent and thus the composite standard errors are simply the square-root of the sum of the squared standard errors of each sample, i.e. Sqrt(SE1DHS
2 + SE2SACMEQ
2).

128
TABLE 21: PROPORTION OF 19-23 YEAR OLDS WHO NEVER ENROLLED IN SCHOOL FROM THE DEMOGRAPHIC AND HEALTH SURVEY (DHS)
National (%) SE (%) Boys (%) SE (%) Girls (%) SE (%) Poor40
(%) SE (%) Mid40 (%) SE (%) Rich20
(%) SE (%)
Kenya 5,26 0,72 2,81 0,54 7,40 1,20 10,41 1,67 3,32 0,91 2,20 0,79
Lesotho 4,87 0,46 9,26 0,87 0,63 0,19 10,42 1,01 2,32 0,38 0,90 0,39
Malawi 7,09 0,45 6,03 0,55 8,09 0,61 12,43 0,94 5,96 0,60 1,32 0,35
Mozambique 13,67 0,84 7,95 0,85 18,39 1,21 22,10 1,60 14,03 1,31 2,81 0,50
Namibia 5,89 0,46 7,41 0,66 4,53 0,54 8,80 0,96 6,20 0,67 1,08 0,49
South Africa 1,13 0,21 1,29 0,26 0,98 0,23 1,38 0,45 0,99 0,18 0,74 0,27
Swaziland 1,42 0,32 2,44 1,09 1,89 0,94 3,08 1,02 0,82 0,23 0,57 0,25
Tanzania 14,56 1,16 10,44 1,19 18,20 1,49 27,71 2,34 10,10 0,98 2,61 0,68
Uganda 5,68 0,61 5,29 0,74 5,97 0,71 11,33 1,47 3,03 0,56 2,03 0,49
Zambia 7,03 0,56 3,28 0,54 10,33 0,95 13,87 1,31 5,18 0,69 2,09 0,75
Zimbabwe 0,91 0,18 0,71 0,20 1,06 0,29 1,70 0,39 0,75 0,32 0,21 0,13
Poor40M (%) SE (%) Poor40F
(%) SE (%) Mid40M (%) SE (%) Mid40F
(%) SE (%) Rich20M (%) SE (%) Rich20F
(%) SE (%)
Kenya 5,70 1,35 14,56 2,59 1,66 0,62 4,96 1,71 1,14 0,70 2,96 1,19
Lesotho 18,72 1,77 1,40 0,48 4,29 0,71 0,39 0,21 2,08 0,88 0,00 0,00
Malawi 9,88 1,11 14,52 1,29 6,04 0,96 5,88 0,68 1,34 0,46 1,29 0,54
Mozambique 10,48 1,67 31,12 2,47 9,89 1,55 17,31 1,65 2,59 0,55 3,00 0,76
Namibia 9,93 1,31 7,70 1,15 8,31 0,98 4,32 0,79 1,52 0,84 0,74 0,41
South Africa 1,46 0,49 1,32 0,48 1,25 0,29 0,74 0,19 0,80 0,42 0,69 0,35
Swaziland 6,29 4,48 3,66 3,18 1,98 0,96 0,95 0,80 0,00 0,00 2,17 1,97
Tanzania 20,39 2,38 33,71 2,96 8,00 1,26 12,21 1,55 0,00 0,00 4,65 1,21
Uganda 8,65 1,65 13,36 1,75 3,55 0,96 2,61 0,67 3,33 0,94 1,12 0,49
Zambia 5,03 1,21 20,78 2,11 3,32 0,78 6,92 1,14 1,40 0,95 2,72 1,22
Zimbabwe 1,92 0,58 1,53 0,50 0,27 0,22 1,15 0,55 0,00 0,00 0,36 0,00

129
4.5 DISCUSSION
The objective of the ‘access-to-learning’ method presented in this paper is to calculate the
proportion of a cohort of youth (whether in school or out) that are functionally literate and the
proportion that are functionally numerate by the end of grade 6 (the access-to-literacy and
access-to-numeracy rates). Figure 15 and Figure 16 above provide an introduction to this
way of thinking by including on the same graph the proportions of children who never enrol,
those who never complete grade 6, those who complete grade 6 but remain functionally
illiterate and innumerate, and those who complete grade 6 and acquire either basic or higher
order reading and mathematics skills.
Clearly some countries have a greater problem ensuring that all children enrol, while others
have near universal initial enrolment but high drop out before grade 6 (i.e. low grade 6
completion rates). Compare for example two neighbouring countries, Tanzania and Uganda,
and the literacy achievement of their children (Figure 15). In Tanzania a large proportion
(15%) of children never enrol, while in Uganda, the proportion of children never enrolling is
considerably lower (5%). Yet Uganda has a far higher proportion of children that drop out
before grade 6 (26%) compared to Tanzania (11%). Furthermore, of those children who do
complete grade 6 in Tanzania, almost all are functionally literate (only 3% will complete
grade 6 but remain functionally illiterate) In contrast, in Uganda a considerable proportion of
children will complete grade 6 but remain functionally illiterate (14% of Ugandan children
remain in school and complete grade 6 but are functionally illiterate). Using these three
criteria (initial access, dropout and learning) one can characterize countries in a relatively
parsimonious way. South Africa, for example, is a country with very high initial access (only
1% never enrol), very low dropout before grade 6 (only 4% enrol but do not complete grade
6) but low learning for those who do complete grade 6 (26% complete grade 6 but remain
functionally illiterate), with Zimbabwe having a similar profile. By contrast, Zambia has
moderately high initial access (only 7% never enrol), high dropout (19% enrol but do not
complete grade 6) and very low levels of learning for those who do reach grade 6 (33% will
complete grade 6 but remain functionally illiterate), with Malawi having a similar profile.
Figure 16 shows that in all countries there are more children that are functionally innumerate
than there are children that are functionally illiterate, with the same holding true for the
acquisition of basic and higher order mathematics skills compared to basic and higher order
reading skills. Clearly children in all countries found the numeracy test more challenging than
the literacy test.

130
A useful way of summarizing the above results is to collapse the proportion of children that
acquired basic literacy skills and those that acquired higher order literacy skills and refer to
these children as functionally literate, and to collapse the categories of (1) never enrolled, (2)
enrolled but never completed grade 6, and (3) completed grade 6 but remained functionally
illiterate; and to refer to these children as those who are functionally illiterate. The
proportions of children in a cohort that has access-to-literacy (i.e. completed grade 6 and
acquired basic literacy skills) are reported in Table 19, while those that have access-to-
numeracy (i.e. reached grade 6 and acquired basic numeracy skills) are reported in Table
20. For the remainder of the paper we refer to the former as the access-to-literacy rate and
the latter as the access-to-numeracy rate.
Looking at the national access-to-literacy rates in Table 19, one can see that there are
effectively three groups of countries: the first group consists of those that have relatively high
access-to-literacy rates (>80% of a cohort of youth) with this group consisting of Swaziland
(86%) and Kenya (80%). The second group consists of those that have relatively low
access-to-literacy rates (60-80%) and includes Zimbabwe (78%), Namibia (74%), Tanzania
(72%), South Africa (69%) and Lesotho (61%). The last group consists of those that have
extremely low access-to-literacy rates (<60%) and includes Uganda (55%), Mozambique
(42%), Zambia (41%) and Malawi (40%).
Looking at national access-to-numeracy rates in Table 20 and using the same grouping as
above one can see that only Swaziland is in the top category with an 80% access-to-
numeracy rate. The countries in the middle category (60-80%) are Kenya (77%), Zimbabwe
(70%) and Tanzania (64%), and all the remaining countries are in the low category (<60%):
South Africa (57%), Lesotho (45%), Namibia (45%), Uganda (42%), Mozambique (36%),
Malawi (25%) and Zambia (24%).
Table 21 reports the proportion of 19-23 year olds that never enrolled in school for each of
the sub-groups. Comparing Table 6 and Table 1 allows one to determine if a low grade 6
completion rate is due to dropout or due to low levels of initial access, an important
distinction for policy and research purposes.
The exceedingly low levels of literacy and numeracy learning in Zambia, Malawi and
Mozambique are cause for grave concern. Furthermore, Figure 15 illustrates that this is not
caused primarily by a lack of access since only 7-14% of children in these countries never
enrol. Rather it is due to dropout and especially due to the high prevalence of what Lewin
(2007, 10) refers to as ‘silent exclusion’ – that is, children that are in school but learning so

131
little that they are in effect excluded. In Zambia 33% of children in a cohort will enrol in
school and complete grade 6 but remain functionally illiterate. Half (50%) of Zambian youth
will enrol and complete grade 6 but remain functionally innumerate. Even in a middle-
income country like South Africa there are a high proportion of children that remain
functionally illiterate (26%) and functionally innumerate (38%) despite completing six years
of formal full time schooling.
Table 19 and Table 20 also report the access-to-literacy and access-to-numeracy rates for
three important subgroups: (1) boys and girls, (2) the poorest 40%, middle 40% and richest
20% of children, and (3) the poorest 40% of girls and the poorest 40% of boys, the middle
40% of girls and the middle 40% of boys, and the richest 20% of girls and the richest 20% of
boys. We report the gender-wealth interaction primarily because previous studies have
shown that girls who are poor face a double disadvantage which is compounded by being
jointly part of two groups that are both at risk of being socially excluded from education –
girls and the poor (Lewis and Lockheed, 2007, 2006). We summarize the differences
between the “top” and “bottom” categories for each group in Figure 17 (for access-to-literacy
rates) and Figure 18 (for access-to-numeracy rates). To provide one example, the access-to-
literacy wealth differential is 60 percentage points for Mozambique. This is calculated by
subtracting the access-to-literacy rate for the poorest 40% of children in Mozambique
(17.1%) from the access-to-literacy rate for the richest 20% of children in Mozambique
(77.1%). We also calculate the confidence intervals by combining the standard errors from
the grade 6 completion rate from the DHS with the standard errors from the proportion
literate and numerate from SACMEQ. Given that the two samples are independent we take
the square root of the sum of the squared standard errors52.
52
In a formula this is SECOMPOSITE = Sqrt((SESACMEQ)2+(SEDHS)
2)

132
FIGURE 17: GAPS IN ACCESS-TO-LITERACY RATES BY GENDER, GENDER-WEALTH INTERACTION, AND WEALTH
WITH 95% CONFIDENCE INTERVALS
FIGURE 18: GAPS IN ACCESS-TO-NUMERACY RATES BY GENDER, GENDER-WEALTH INTERACTION, AND WEALTH
WITH 95% CONFIDENCE INTERVAL
-60
-40
-20
0
20
40
60
80
Dif
fere
nti
al (p
erc
en
tag
e p
oin
ts)
Gender Differential (Male-Female) Gender-Wealth Differential (Poor40M-Poor40F)
Wealth Differential (Rich20-Poor40)
-40
-30
-20
-10
0
10
20
30
40
50
60
70
Dif
fere
nti
al (p
erc
en
tag
e p
oin
ts)
Gender Differential (Male-Female) Gender-Wealth Differential (Poor40M-Poor40F)
Wealth Differential (Rich20-Poor40)

133
There are a number of notable findings that emerge from Figure 17 and Figure 18:
1. In all countries, the access-to-literacy gap between rich and poor is considerably
larger than the gap between boys and girls. Even in the country with the largest pro-
boy access-to-literacy gap (Mozambique), the gap between rich and poor (60
percentage points) is four times larger than the gap between boys and girls (15
percentage points).
2. In poorer countries (Mozambique, Zambia, Tanzania and Malawi) boys have higher
access-to-literacy and access-to-numeracy rates than girls, driven primarily by higher
grade 6 completion rates rather than superior learning outcomes.
3. Only 17% of the poorest Mozambican 19-23 year olds had completed grade 6 and
acquired basic literacy skills (for numeracy the figure is 14%) (Table 19 and Table
20), primarily due to low initial access (26% grade 6 completion rate). Furthermore,
poor girls are considerably worse off than poor boys. While 28% of the poorest 19-23
year old boys completed grade 6 and acquired basic literacy skills, only 9% of the
poorest 19-23 year old girls had completed grade 6 and acquired basic literacy skills
in Mozambique. Figure 19 below illustrates that this is primarily due to high dropout
rather than low initial access. It is interesting to note that Mozambique has a
comparatively small proportion of children who reach grade 6 but remain illiterate yet
very high proportions that drop out without completing grade 6. That is to say that
most of the children who do complete grade 6 in Mozambique do also acquire basic
reading skills in Portuguese (the language of assessment in grade 6). One possible
explanation is that Mozambique is one of only three countries in the sample that has
a national primary-school level exam. 53 In Mozambique this national exam is
administered at the end of grade 5 and is used for grade promotion purposes (World
Bank, 2009, p. 6). It is highly plausible that this exam acts as a gateway such that
only well-performing students pass the exam and thus make it into grade 6 (and into
the SACMEQ sampling frame). While quality-assurance exams clearly have a place
in national education policies, they can also lead to early dropout (Greaney and
Kellaghan, 2008, p. 15). A further issue complicating the matter is that this grade
promotion test is conducted in Portuguese, which is a second-language for most
Mozambican students. Many students are only starting to become proficient in this
language when they are tested in it, with the results from this test determining
whether or not they proceed to a higher grade. Given when and how this test is
administered in Mozambique – and the fact that it is used for grade-promotion
53
The other two countries are Malawi and Uganda.

134
purposes -, further research is needed to understand the implications for equity and
fairness, particularly for those students who are not fluent in Portuguese.
FIGURE 19: ACCESS TO LITERACY RATES FOR MOZAMBICAN SUB-GROUPS (DHS 2011, SACMEQ 2007)
4. Closer inspection of Lesotho shows an atypical case where boys are considerably
less likely to have access-to-literacy (and access-to-numeracy) than girls, with the
effect being compounded for the poorest 40% of boys. While 73% of a cohort of girls
will be functionally literate and complete grade 6, the figure for the corresponding
cohort of boys is only 50%. If one looks specifically at the poorest 40% of boys and
the poorest 40% of girls the situation becomes even starker. While 62% of the
poorest girls have access-to-literacy, only 29% of the poorest boys have access to
literacy. Looking at Table 16 it becomes clear that this trend is driven by the fact that
boys (and poor boys in particular) are significantly less likely to complete grade 6
than girls (and poor girls). While 90% of girls will complete grade 6, only 65% of boys
will do so (Table 16). Similarly, while 81% of poor girls in Lesotho will complete grade
6, only 43% of poor boys will do so. Table 16 shows that this low grade 6 completion
rate is largely due to dropout rather than low initial access. Only 19% of poor boys
aged 19-23 had never enrolled in school. This can further be illustrated by looking at
the changing enrolment status of poor boys and poor girls as they get older. Figure
20 shows that the low grade 6 completion rate among poor boys is driven by dropout
rather than non-enrolment. Comparing Figure 20 (poor boys) and Figure 21 (poor

135
girls) in conjunction with one can see that this pattern of dropout is unique to poor
boys
FIGURE 20: STACKED AREA CHART FOR ENROLMENT STATUS BY AGE FOR LESOTHO DHS 2009,
POOREST 40% OF BOYS
FIGURE 21: STACKED AREA CHART FOR ENROLMENT STATUS BY AGE FOR LESOTHO DHS 2009, POOREST
40% OF GIRLS

136
FIGURE 22: ACCESS TO LITERACY FOR LESOTHO 19-23 YEAR OLD SUB-GROUPS (DHS 2009, SACMEQ 2007)
The situation of under-participation of boys in Lesotho is driven primarily by the
cultural and economic tradition of boys (and particularly poor boys) herding livestock
(Jha and Kelleher, 2006). This leads to a situation where boys have higher rates of
non-enrolment, absenteeism, grade-repetition and drop-out (Jha and Kelleher 2006,
96). It is worth noting that Jha and Kelleher use primary school NER data to illustrate
the gap between boys and girls and report that the NER was 83% for boys and 89%
for girls. However, this seriously underestimates the true disadvantage boys face in
Lesotho. If we instead compare the access-to-literacy rates for boys (50%) and girls
(73%) and poor boys (29%) and poor girls (62%) one begins to appreciate how large
these differentials really are. This also further illustrates why traditional measures of
access (such as NER) are inadequate and inferior relative to this new method.
In South Africa, Namibia and Zimbabwe girls have higher access-to-literacy rates
than boys and this is primarily because they do better in school rather than due to
grade completion advantages. In contrast, where boys have higher access-to-literacy
rates than girls (Mozambique, Tanzania, Malawi and Zambia), it is primarily because
boys are more likely to complete grade 6 (Table 16), rather than due to any superior
performance in school (Table 17 and Table 18). That is to say that in countries where
the gap is pro-boy, the majority of the difference in access-to-literacy rates between
boys and girls is driven by considerably higher dropout (or non-enrolment) rates
among girls.

137
5. The gaps in access-to-literacy and access-to-numeracy rates between the richest
20% of students and the poorest 40% of students in Mozambique, South Africa,
Namibia, Uganda and Tanzania are truly astounding. While 67% of the richest of
children in Mozambique will complete grade 6 and acquire basic numeracy skills,
only 14% of the poorest Mozambican children will do so (a gap of 53 percentage
points). From Table 16 one can see that this is primarily driven by inequalities in
grade 6 completion, rather than inequalities in learning (Table 17 and Table 18). To
be specific, in Mozambique the grade 6 completion rates for the poor (26%) are only
a fraction of the grade 6 completion rate for the rich (88%) (Table 16). The situation
in South Africa is completely different; here the access-to-numeracy differential
between rich and poor (47 percentage points) is driven almost exclusively by
differential school quality (low learning) rather than differential grade 6 completion.
Ninety-three percent of poor children in South Africa will complete grade 6, compared
to 99% of rich children in the country (Table 16). However, of those that are in school
(i.e. looking at the SACMEQ sample only – Table 18), only 46% of poor children are
functionally numerate in South Africa compared to 85% of rich children.54 Figure 23
below illustrates the situation graphically by showing the differentials between the
richest 20% of students and the poorest 40% of students for grade 6 completion
rates (from DHS) and numeracy and literacy rates (from SACMEQ).
54
The gaps in learning outcomes between the richest 20% and the poorest 40% of students reflect more than merely the “value-added” by schools. While the quality of schools may well differ by wealth, those schools serving poorer communities also must work with children who had less effective early childhood stimulation, less educational support at home, worse nutrition, etc. Differences in functional literacy and numeracy by wealth thus reflect wider societal inequalities, rather than merely the school “value-added”.

138
FIGURE 23: GRADE 6 COMPLETION DIFFERENTIAL (ACCESS) AND NUMERACY AND LITERACY DIFFERENTIAL
(QUALITY) BETWEEN RICHEST 20% AND POOREST 40% OF STUDENTS WITH 95% CONFIDENCE INTERVAL (ALL
CALCULATIONS ARE RICHEST 20% MINUS POOREST 40%)
4.6 ACCESS, QUALITY AND THE POST-2015 MILLENNIUM DEVELOPMENT
GOALS
Over the last two decades the Millennium Development Goals (MDG) developed by the
United Nations have been tremendously influential on foreign aid allocations and on the
global development agenda more broadly. These goals are set to expire in 2015 at which
time new targets will be set. The existing MDG relating to education is worded as follows:
“By 2015, children everywhere, boys and girls alike, will be able to complete a full course of
primary schooling.” In this goal it is implicitly assumed that children who progress through
school learn as they go, something that may not in fact be true. Indeed, passing grades in
the absence of quality-assured standardized assessments is a very poor indication of
learning. As Pritchett (2004, 11) notes, “The completion of primary schooling or higher in
itself does not guarantee that a child has mastered the needed skills and competencies. In
fact, all of the available evidence suggests that in nearly all developing countries the levels
of learning achievement are strikingly, abysmally low.” The statistics reported in this paper
highlight the prevalence of this in Sub-Saharan Africa.
6%
10%
15% 17%
21%
35% 35%
40% 44%
47%
62%
-10%
0%
10%
20%
30%
40%
50%
60%
70%
Access differential Literacy differential Numeracy differential

139
The increased emphasis on learning (quality), rather than a naïve focus on schooling
(access) has prompted a variety of stakeholders to lobby for quality-informed targets for the
post-2015 MDG replacements. The United Nations ‘Report of the High-Level Panel of
Eminent Persons on the Post-2015 Development Agenda”, for example, argues for an
education-related goal worded as follows: “Ensure every child, regardless of circumstance,
completes primary education able to read, write and count well enough to meet minimum
learning standards” (United Nations 2013, 36). Similarly the UNESCO Institute for Statistics
and the Center for Universal Education at the Brookings Institution have convened the
Learning Metrics Task Force (LMTF) to “Catalyse a shift in the global education conversation
from access to access plus learning” (UNESCO/CUE 2013, 2). The statistics presented in
this paper – access-to-literacy rates and access-to-numeracy rates – which combine
measures of access and quality, could be one such statistic on which to base the post-2015
MDG replacements.
4.7 CONCLUSION
The aim of the present study has been to create a composite measure of educational access
and educational quality. Doing so allows for the calculation of the proportion of a particular
cohort that are functionally numerate and the proportion that are functionally literate. Building
on the conceptual framework of Pritchett (2004) and extending the empirical work of
Hanushek and Wößmann (Hanushek and Wößmann n, 2008) we calculated the proportion
of a cohort of youth (19-23 years old) that were functionally literate and functionally
numerate for each country, and within each country by gender and wealth – what we term
the access-to-literacy and access-to-numeracy rates. Importantly, this new method of
measuring education system performance distinguishes between those children who have
been excluded from school (those who never enrol and those who drop out before grade 6)
and those who are in school but have been excluded from learning (those who complete
grade 6 but remain illiterate and innumerate). We believe this distinction is an important one
both from a research and reporting point of view, and from a policy-making and planning
perspective.
The results presented here show that learning deficits are considerably greater than access
deficits in all of the 11 countries, and that late (or delayed) grade 6 completion is widespread
in sub-Saharan Africa. Large wealth differentials (greater than 30 percentage points) exist in
all countries except Zimbabwe, Kenya and Swaziland, and pro-boy gender differentials of
around 10 percentage points were found in Malawi, Tanzania, and Zambia, rising to 15
percentage points in Mozambique. Lesotho shows an atypically large pro-girl trend in both

140
access-to-literacy and access-to-numeracy rates, driven primarily by boys’ lower rate of
grade 6 completion, particularly for poor boys.
In light of the approaching expiration of the MDGs and the on-going talks surrounding the
form of their replacement, the analysis presented in this paper provides strong evidence that
any post-2015 educational goals should include learning outcomes as explicit criteria.
Achieving Schooling For All (rather than Learning For All) will be an important but hollow
achievement which is at odds with the United Nations Millennium Declaration. If children are
to realize their full potential, the expansion of physical access to schooling in the developing
world must be accompanied by meaningful learning opportunities. The acquisition of
knowledge, skills and values must be the central aim of educational expansion.

141
CHAPTER 5: MEASURING ACCESS TO LEARNING OVER A PERIOD
OF INCREASED ACCESS TO SCHOOLING: THE CASE OF SOUTHERN
AND EASTERN AFRICA 2000-2007
5.1 INTRODUCTION
The aim of the previous chapter was to create a composite statistic of educational access
and educational quality, providing a cross-sectional snapshot of the state of education in 11
countries in sub-Saharan Africa. The measures – termed access-to-literacy and access-to-
numeracy - used data from SACMEQ 2007 and grade-survival data from the most recent
DHS survey in each country. In the present chapter I extend this analysis by introducing an
inter-temporal comparison and calculate the composite measure at two points in time (2000
and 2007). Perhaps most importantly, the present inter-temporal analysis sheds light on the
interplay between access to and quality of education in sub-Saharan Africa – and specifically
whether or not there seems to be a trade-off between expanding access and declining
quality - a topic of perennial interest to both policy-makers and academics.
The substantial improvements in access to primary education in many African countries has
led to a growing perception that school quality may have suffered as a result. Strong policy
drives have led to considerable expansions in school access, although enrolment rates in
Sub-Saharan Africa continue to lag behind the rest of the developing world (Easterly, 2009;
Majgaard and Mingat, 2012). Meanwhile, the dismal performance of African countries in
recent international assessments of educational achievement such as PISA, TIMSS, PIRLS
and SACMEQ55 has led many critics to argue that schooling which fails to produce learning
is of limited value (Lewin, 2009; Pritchett, 2013). Furthermore, Hanushek and Wößmann
(Hanushek and Wößmann, 2008) have shown that the quality of education is more important
than educational attainment in determining both the economic growth of nations and the
labour market performance of individuals, as discussed in the previous chapter.
Consequently, the call for a shift of attention from education access to education quality is
now becoming familiar, and rightly so.
However, in much of the literature on schooling in Africa there is a notion, either implicit or
explicit, that this increased access has caused deterioration in the effectiveness of education
55
PISA stands for Programme for International Student Assessment; TIMSS stands for Trends in International Maths and Science Study; PIRLS stands for Progress in International Reading Literacy Study; SACMEQ stands for Southern and East African Consortium for Monitoring Educational Quality.

142
systems to produce learning. Colclough, Kingdon and Patrinos (2009, p. 2), for example,
suggest that “in some African cases, the expansion of the primary system appears to have
been accompanied by sharp declines in school quality, such that literacy and numeracy are
no longer so readily delivered by the primary system.” Chimombo, Kunje, Chimuzu, and
Mchikoma (2005, p. 16) maintain that the introduction of free primary education in Malawi led
to a deterioration in the quality of education being offered. Chimombo (2009, p. 309) argues
that, “the impressive achievements made in improving access to school have to be balanced
against issues of declining quality” and that the poor are most at risk of a consequently low
quality education. Zuze and Leibbrandt (2011), in view of the low quality of education
observed in Uganda, suggest that the expansion of access to schooling should perhaps
have been phased in more slowly so as to allow better planning and preparation. Crouch
and Vinjevold (2006) argue that while many countries have managed to improve both access
and quality, the region of Southern Africa is unique in that there has been an over-emphasis
on access at the expense of learning, thus creating an imbalance between access and
quality and therefore demonstrating the tension between access and quality. Most recently,
when discussing education in sub-Saharan Africa Glewwe et al. (2014, p. 391) state that “the
rapid increases in school enrolment almost certainly have reduced school quality as schools
became overcrowded and existing resources were strained.”
There are a number of mechanisms through which one might expect increased access to
schooling to cause a decline in quality, as measured by test scores; (1) the changing social
composition of schools (i.e. an influx of disadvantaged children) is likely to drive down
average scores even if the value added by schools remains unaffected; (2) the changing
social composition of schools could negatively influence the learning outcomes of children
who would have been enrolled even in the absence of the increased access through peer
effects; (3) a strain on resources such as pupil-teacher ratios may reduce school
effectiveness; and (4) if the expansion is driven by abolishing school fees this may weaken
local accountability if, as is often believed, school fees promote accountability. 56
To some extent, the perception of deteriorating quality arose due to a lack (until recently) of
comparable test score data over time. For example, Kadzamira and Rose (2003, p. 511),
56
There may also be other less expected consequences of free primary education. Two recent studies find that abolishing fees in Kenya in 2003 created a perception of lower public school quality amongst parents (mainly signalled by higher pupil-teacher ratios), which led to substantially increased enrolments in private schools (Bold et al., 2011b; Nishimura and Yamano, 2013). As a consequence, public school enrolments stagnated while more affluent children migrated to the expanding private school sector. Moreover, Bold, Kimenyi, Mwabu and Sandefur (2011a) find that private schools caused improved performance amongst those attending with the result that overall education performance in Kenya remained stable despite the increased numbers of poor children attending public schools.

143
who maintain that free primary education in Malawi had a negative impact on school quality,
concede that they were not able to “compare what would have happened in the absence of
the rapid expansion of enrolments nor with test results in previous years.” Therefore, as test
score data became available in recent years analysts, perhaps reasonably, suspected that
the dismal performance may have been linked to the rapid expansions of earlier periods.
Perhaps to a greater extent, confusion about the relationship between educational access
and school quality has arisen because measures of access, such as gross and net
enrolment ratios, are invariably treated separately from measures of quality, such as country
average test scores. Consequently, deteriorating education system quality is typically
conceptualized as a decline in average test scores amongst those enrolled. This chapter
argues that education system quality should rather be conceptualized as the amount of
learning that takes place in the overall population of children (those enrolled and those not
enrolled). Measurement of this concept requires that enrolment or grade survival data
(access) be combined with test score data (quality), as per the method developed in the
previous chapter.
An important reason for the confusion around the relationship between education access
and education quality is that quality, which can be defined in various ways, is often not
clearly defined. School quality could be defined as the average performance within a school
(proxied by test scores). Or, it could be defined as the ‘value-added’ by a school, which
allows for the possibility that one school may record lower test scores than another school
but is more effective given its social composition of pupils. In this chapter, the focus is
primarily on the success of the education system as a whole in providing the entire
population of children with access to learning. In this conception of quality, a successful
education system is one in which children remain in school and acquire specific learning
outcomes.
The present chapter does not attempt to identify the causal impact of increased access to
school on education quality, however quality is defined. Measuring the causal impact of
increased access is problematic because many other factors change over time apart from
access to schooling. These include economic growth, political dispensations as well as
specific education policies. For example, economic growth may simultaneously contribute to
increased access (through various mechanisms such as increased demand for schooling
and increased government capacity to build schools) and to increased school quality
(through for instance increased government ability to procure educational resources).

144
In order to estimate the causal impact of increased access one would therefore require some
exogenous factor (unrelated to school quality) that caused some countries or regions to
expand school participation, thus creating a natural experiment. However, we know of no
such factor. Alternatively, one would need to identify a “treatment group” of enrolled students
in a time period of “high access” and a similar “comparison group” of pupils enrolled in a time
period of “low access”. However, even if one is able to identify pupils with similar observable
characteristics (such as parental education level) enrolled at two different time periods, these
two groups will no doubt be different on unobservable characteristics (such as parental
motivation or disposition towards education).
However, as Bold et al (2011a, p. 36) argue, free primary education and other Education For
All policy initiatives provided a substantial supply-side shock. The evidence presented in this
chapter about the production of literacy and numeracy in countries that expanded access to
schooling is therefore relevant to policy questions and development theory regarding
expanding access to education.
After briefly discussing the relevant data on access to schooling and learning achievement,
the main results of how access to learning changed in the ten countries under consideration
between 2000 and 2007 are presented followed by several extensions and robustness
checks.
5.2 DATA AND METHODOLOGY
As mentioned in the previous chapter, the salient goal for an education system is to increase
the proportion of all children in the population who attain particular levels of academic
performance.57 Although previous initiatives such as the Jomtien declaration explicitly aimed
for wider access to a better quality of schooling (e.g. article IV of the Jomtien Declaration),
the policy response within countries and the monitoring of Education For All targets has
largely focussed on either access or test score data, but without a suitable composite
measure.
5.2.1 DATA ON EDUCATIONAL ACHIEVEMENT
The present chapter uses the same methodology as that employed in the previous chapter
with the extension that I now consider both SACMEQ 2000 and SACMEQ 2007 with
corresponding DHS data for both 2000 and 2007. Because the present chapter aims to
57
While there are no doubt other important non-academic purposes of education, this goal is salient in so far as it is more relevant than merely increased school attendance or increased country average test scores.

145
compare access to learning at two points in time, only those countries that participated in
both SACMEQ 2000 and SACMEQ 2007 were included in the analysis. Thus, while
Zimbabwe was included in the previous chapter, it is excluded here since it only participated
in SACMEQ 2007 and not SACMEQ 2000. Consequently the 10 education systems
analysed in this chapter are those of Kenya, Lesotho, Malawi, Mozambique, Namibia, South
Africa, Swaziland, Tanzania, Uganda and Zambia.58
In 2000, SACMEQ tested 41686 students in 2294 schools across 14 education systems
(treating Tanzania and Zanzibar as separate systems). In 2007, with the addition of
Zimbabwe, SACMEQ tested 61396 students in 2779 schools across 15 education systems
(Hungi et al., 2010). Administrative data on school enrolments were used as the basis for
sampling. Consequently, the SACMEQ datasets contain a raising factor variable which
inflates the sample to the estimated size of the grade 6 population, thus providing a measure
of the number of grade 6 enrolments in 2000 and 2007 (Ross et al., 2005). This raising
factor variable is used later in the chapter as a robustness check on the DHS grade survival
data. In all calculations involving SACMEQ data the appropriate adjustments for complex
sampling and weighting were made.
Table 22 reports the country average reading and mathematics scores in SACMEQ 2000
and 2007 for the 10 education systems considered in this chapter. The scores in the 2000
survey were set to have a scale average of 500 and a standard deviation of 100 across all
students from all countries with sampling weights applied (Ross et al., 2005). The 2007
scores were then calculated on the same scale as the 2000 scores so as to ensure
comparability. Zambia and Malawi had the worst performing grade 6 students on average. In
2007, Tanzania had the best-performing grade 6 students in reading while Kenya had the
highest-performing students in mathematics. Most countries improved their average scores
in both reading and mathematics between 2000 and 2007, especially in the cases of
Namibia and Tanzania. On the other hand, average reading and mathematics scores
declined in Mozambique and mathematics scores declined in Uganda.
58
The other education systems in SACMEQ are Botswana, Mauritius, Seychelles, Zimbabwe and Zanzibar, which, though part of Tanzania, participated in SACMEQ as a separately analysed education system. We were not able to locate comparable household data for Botswana, Mauritius and Seychelles. This is not too unfortunate since these countries have high levels of primary school participation and did not substantially expand access over the relevant period.

146
TABLE 22: COUNTRY AVERAGE SCORES, PROPORTION OF GRADE 6 CHILDREN
FUNCTIONALLY LITERATE AND FUNCTIONALLY NUMERATE IN 2000 AND 2007
Literacy
SACMEQ 2000
SACMEQ 2007
Country Average
score SE
Proportion functionally
literate
SE Average
score SE
Proportion functionally
literate
SE
Kenya 546.50 4.58 94.39 0.81 543.11 5.08 91.96 1.00
Lesotho 451.23 3.07 70.64 1.96 467.87 2.86 78.80 1.30
Malawi 428.92 2.41 55.51 2.18 433.50 2.62 63.40 1.77
Mozambique 516.66 2.44 93.84 0.63 476.04 2.82 78.49 1.13
Namibia 448.78 3.53 56.55 1.49 496.92 2.99 86.37 0.76
South Africa 492.26 9.06 68.99 2.11 494.95 4.55 72.74 1.19
Swaziland 529.59 3.79 98.01 0.47 549.39 2.99 98.52 0.40
Tanzania 545.88 4.82 91.70 0.90 577.76 3.45 96.50 0.52
Uganda 482.39 6.21 74.48 2.18 478.68 3.57 79.65 1.30
Zambia 440.12 4.51 52.33 2.22 434.41 3.36 55.91 1.68
Numeracy
SACMEQ 2000
SACMEQ 2007
Country Average
score SE
Proportion functionally numerate
SE Average
score SE
Proportion functionally numerate
SE
Kenya 563.25 4.30 89.29 1.01 556.96 4.11 88.77 1.04
Lesotho 447.18 3.33 34.13 2.08 476.91 2.61 58.19 1.59
Malawi 432.93 2.28 25.77 1.52 447.02 2.87 40.12 1.80
Mozambique 530.01 2.18 87.01 0.90 483.81 2.29 67.27 1.26
Namibia 430.86 3.23 23.38 1.35 471.03 2.51 52.31 1.35
South Africa 486.15 7.26 47.74 2.63 494.84 3.81 59.83 1.38
Swaziland 516.54 3.45 77.97 1.38 540.84 2.39 91.41 0.93
Tanzania 522.40 4.17 74.53 1.54 552.72 3.54 86.76 1.07
Uganda 506.28 8.29 61.18 2.58 481.90 3.03 61.26 1.58
Zambia 435.21 3.54 28.82 1.73 435.15 2.44 32.68 1.42

147
Educational experts from SACMEQ have categorized scores in these tests into eight
competency levels ranging from pre-reading (level 1) to critical reading (level 8) in the case
of literacy, and from pre-numeracy (level 1) to abstract problem solving (level 8) in the case
of mathematics (Ross et al., 2005). The eight competency levels for literacy and numeracy
are described in detail by Hungi et al (2010) in Appendix C. According to this categorisation,
children failing to reach level 3 in either reading (‘basic reading’) or mathematics (‘basic
numeracy’) can be regarded as functionally illiterate and functionally innumerate
respectively, as discussed in the previous chapter.
Table 22 also reports the proportions of grade 6 students that were functionally literate and
functionally numerate in 2000 and in 2007, by country. In 2007, Zambia had the smallest
proportions of grade 6 students that were functionally literate (56%) and functionally
numerate (33%). Interestingly, Swaziland had the highest proportions of students reaching
functional literacy and numeracy in 2007, despite not having the highest country average
score in either reading or mathematics. This indicates that Swaziland has a relatively
equitable school system that succeeds in providing basic skills to the majority of students.
Namibia recorded the greatest improvement in the proportions of grade 6 children reaching
functional literacy and numeracy between 2000 and 2007. In contrast, the proportions of
students reaching functional literacy and numeracy declined substantially in Mozambique.
5.2.2 DATA ON ACCESS (GRADE 6 COMPLETION)
In addition to measuring the proportion of grade 6 children acquiring basic literacy and
numeracy, one has to estimate the proportion of children who reach grade 6 in the first
place, in order to arrive at a meaningful estimate of access to learning amongst the full
population.
As per the previous chapter, we obtain data on survival to grade 6 for these countries from
the Demographic and Health Surveys (DHS), or strictly comparable data from other
household surveys. In the case of Swaziland, we use the Multiple Indicator Cluster Surveys
(MICS) and for South Africa we use the annual General Household Surveys (GHS). These
surveys are all widely used for research purposes and contain comparable information on
educational participation and attainment.
In order to estimate survival to grade 6 we make use of the question in these surveys on
highest grade completed. This meant that we had to either use grade 6 completion rates
(which underestimates the proportion of people who attend grade 6) or grade 5 completion
rates (which overestimates the proportion of children who attend grade 6). Since the

148
SACMEQ testing was conducted fairly late in the school year, we decided to use grade 6
completion rates.
An important question when estimating grade 6 completion rates is what age group of survey
respondents to use. Although this was covered briefly in the previous chapter, it is worth
emphasizing why we chose the age group 19-23 year olds. Table 23 shows the proportion of
children enrolled in grades 1 to 6 by age for each country.59
TABLE 23: PROPORTION OF CHILDREN ENROLLED IN GRADES 1 TO 6 BY AGE FOR
EACH COUNTRY
Country
Year of Survey
Age16
Age 17
Age 18
Age 19
Age 20
Age 21
Kenya 2007-2008 14.70 7.24 4.55 1.78 0.96 0.50
Lesotho 2009 10.16 6.00 2.19 1.06 0.95 0.13
Malawi 2010 23.36 12.54 7.53 3.92 1.52 0.91
Mozambique 2011 18.82 9.56 5.96 3.58 2.27 1.63
Namibia 2006-2007 8.22 3.86 2.24 0.59 0.68 0.74
South Africa 2009 3.86 1.18 0.62 0.47 0.20 0.00
Swaziland 2007 19.33 9.98 4.50 0.71 0.31 0.16
Tanzania 2010 7.39 2.41 1.17 1.06 0.09 0.18
Uganda 2010 43.55 22.24 7.60 4.31 1.30 1.43
Zambia 2007 14.26 12.79 4.78 2.41 1.67 1.04
As evident in Table 23, 19-year-olds were the youngest single-year age group for which all
countries satisfied the rule of having less than 5% of an age-group still enrolled in grades 1-
6. The upper limit of the age bracket was set to 23-year-olds so as to include enough
observations for an acceptable level of precision (i.e. small enough standard errors).
Since the best measure of grade 6 completion is obtained from 19- to 23-year-olds it has to
be recognised that this reflects school participation roughly two to six years prior.
Unfortunately, comparable household survey data is not available on an annual basis for the
59
Appendix D2 shows stacked area plots of four categories of education status (not yet enrolled, currently
enrolled in grades 1 to 6, dropped out prior to completing grade 6, and completed grade 6) by age for each country and various sub-groups within each country.

149
countries in the sample, but only every few years, depending on each particular case.
Therefore, we used household data as close as possible to 2003 to reflect access to grade 6
in 2000 (when SACMEQ was administered) and household data as close as possible to
2010 to reflect access to grade 6 in 2007 (when SACMEQ was administered again).
Table 24 shows grade 6 completion rates amongst 19-23 year-olds around 2003 and around
2010 for the ten countries in the sample. Arguably, these estimates provide a more
meaningful picture of access to primary schooling in the region than most other commonly
reported statistics, such as Gross Enrolment Ratios (GERs) or Net Enrolment Ratios
(NERs). In both time periods, the grade 6 completion rate was highest in South Africa and
lowest in Mozambique, although the increase over the interim period was the largest for
Mozambique. In many of these countries there were substantial increases in the proportion
of children who completed grade 6 (Kenya-7%, Lesotho-9%, Malawi-7%, Mozambique-96%,
Swaziland-12%, Tanzania-11%, Uganda-8% and Zambia-8%; all in percentage points).
TABLE 24: GRADE 6 COMPLETION RATES AROUND 2003 AND AROUND 2010 (19-23
YEAR-OLDS)
Circa 2003
Circa 2010
Country Year of Survey
Grade 6 completion rate (%)
Year of Survey
Grade 6 completion rate (%)
Kenya 2003 81.26 (1.07) 2007-2008 87.21 (1.00)
Lesotho 2004 71.26 (1.01) 2009 77.97 (1.00)
Malawi 2004 58.61 (1.26) 2010 62.86 (0.99)
Mozambique 2003 26.99 (1.14) 2011 53.01 (1.37)
Namibia 2000 82.45 (1.43) 2006-2007 85.42 (0.84)
South Africa 2004 94.04 (0.31) 2009 95.42 (0.33)
Swaziland 2000 76.66 (1.51) 2007 85.69 (1.45)
Tanzania 2004-2005 66.89 (1.67) 2010 74.12 (1.41)
Uganda 2006 63.36 (1.29) 2010 68.53 (1.34)
Zambia 2001-2002 68.56 (1.33) 2007 74.03 (1.22)
Source: Own calculations using DHS, MICS (for Swaziland) and GHS (for South Africa data. Standard errors in parenthesis.
When one considers these enrolment trends in combination with the educational
achievement trends (Table 22) it is clear that there is a need for a combined indicator of

150
education system performance. A comparison of South Africa and Tanzania demonstrates
this. South Africa has the highest grade completion rate but a relatively large proportion of
functionally illiterate and innumerate grade 6 students. In contrast, a high proportion of
Tanzanian grade 6 students reach functional literacy and numeracy but a considerable
proportion of the population does not reach grade 6. Moreover, there is ambiguity regarding
the development of the education system since 2000 in a case such as Mozambique where
access to primary schooling increased impressively but the country average score declined.
It is therefore not immediately clear if the net effect was positive or negative.
There were also some countries where both access and country scores improved between
2000 and 2007, such as Tanzania, Lesotho and Swaziland. The 2011 EFA Global
Monitoring Report recognizes this and argues that these trends “call into question the
widespread claim that increased enrolment across the region has been universally
accompanied by a steep decline in quality, implying a trade-off between learning levels and
access” (UNESCO, 2011, p. 85). The EFA report, however, still uses separate measures of
access and quality and therefore remains ambiguous about the cases of Mozambique and
Uganda.
The composite measure of access-to-literacy and access-to-numeracy is calculated in the
same way as in the previous chapter and is therefore not discussed further here.
5.3 EMPIRICAL FINDINGS: ACCESS TO LEARNING SINCE 2000
Appendix D4 reports the proportions of 19-23 year olds60 that never enrol and those that
complete grade 6 as well as the proportion of the SACMEQ sample reaching basic literacy
and numeracy, access-to-literacy rates (grade 6 completion rate multiplied by the proportion
of grade 6 pupils that reached basic literacy) and access-to-numeracy rates (grade 6
completion rate multiplied by the proportion of grade 6 pupils that reached basic numeracy).
All statistics are reported for the years 2000 and 2007, for all ten countries and for the
following sub-groups: boys, girls, the poorest 40% of the population, the middle 40% of the
population, the richest 20% of the population, the poorest 40% of boys, the poorest 40% of
60
The results in the Appendix are also reported for the sub-groups of gender, wealth and a gender-wealth interaction, as per Chapter 4.

151
girls, the middle 40% of boys, the middle 40% of girls, the richest 20% of boys, and the
richest 20% of girls.61 Standard errors are also reported.
5.3.1 COUNTRY ACCESS-TO-LITERACY AND ACCESS-TO-NUMERACY RATES IN 2000 AND
2007
Figure 24 shows access-to-literacy rates for all ten countries in 2000 and 2007. Figure 25
shows the same information for numeracy. The figures also show the 95% confidence
intervals of the estimated rates, which were calculated by combining the standard errors
from the grade 6 completion rates with the standard errors from the proportion literate and
numerate from SACMEQ. Since the two samples are independent, the standard error of the
composite index is the square root of the sum of the squared standard errors.62
FIGURE 24: ACCESS-TO-LITERACY RATES IN 2000 AND 2007
61
The procedure for calculating access-to-literacy (or numeracy) rates when interacting gender and wealth, is the same as that for overall wealth, but done separately for the population of females and of males in turn.
62 In a formula this is SECOMPOSITE = Sqrt((SESACMEQ)
2+(SEDHS)
2)
0
10
20
30
40
50
60
70
80
90
100
MAL ZAM MOZ UGA LES SOU TAN NAM KEN SWA
Pe
rce
nta
ge o
f ch
ildre
n
2000
2007

152
FIGURE 25: ACCESS-TO-NUMERACY RATES IN 2000 AND 2007
Figure 24 and Figure 25 indicate that the best performing education systems, according to
the combined measures of access and learning, were Tanzania, Kenya and Swaziland. In
contrast, the countries with the lowest access to learning were Malawi, Zambia and
Mozambique. Some countries have similar access-to-learning rates but have very different
patterns in grade survival and in learning outcomes. For example, South Africa – with high
grade 6 completion rates but low levels of learning amongst grade 6 pupils – has a similar
access-to-literacy rate to Tanzania – with low grade 6 completion but high levels of learning
amongst grade 6 pupils.
Perhaps the most striking feature of Figure 24 and Figure 25 is that in all countries access-
to-literacy and access-to-numeracy improved between 2000 and 2007. In some countries
the improvement was not statistically significant but in other countries the improvement was
both statistically significant and substantial (Mozambique, Lesotho, Tanzania, Namibia,
Swaziland). Irrespective of the impact of expanded school participation on specific schools
or individuals, this represents compelling evidence that during a period of considerable
expansion to primary schooling, there was a concomitant improvement in access to learning.
Figure 26 (for literacy) and Figure 27 (for numeracy) consolidate all the information about
changes in grade 6 completion, changes in average test scores and changes in access to
learning into a single graph. The horizontal axis shows the percentage point change in the
grade 6 completion rate for each country. The vertical axis shows the ratio of access-to-
literacy (or numeracy) in 2007 to access-to-literacy (or numeracy) in 2000. A ratio above
0
10
20
30
40
50
60
70
80
90
ZAM MAL MOZ UGA NAM LES SOU TAN KEN SWA
Pe
rce
nta
ge o
f ch
ildre
n
2000
2007

153
one means that access-to-literacy (or numeracy) was higher in 2007 than in 2000. The size
of the bubbles indicates the magnitude of the change in the country average test score
between SACMEQ 2000 and SACMEQ 2007. For thick red bubbles the change in SACMEQ
average score was negative while for thin black bubbles the change was positive.
FIGURE 26: ACCESS TO SCHOOLING AND ACCESS TO LITERACY OVER TIME

154
FIGURE 27: ACCESS TO SCHOOLING AND ACCESS TO NUMERACY OVER TIME
The graphs show four quadrants corresponding to the four possible combinations of
increases or decreases in grade completion (access) and increases or decreases in access
to learning. For both literacy and numeracy, all countries are located in the top right
quadrant, indicating that both access to schooling and access to basic learning improved
over the period for all countries. Some countries improved access to learning between 2000
and 2007 without substantial changes in the grade 6 completion rate. Namibia is the chief
example of this. Some countries (Tanzania, Swaziland and Lesotho) experienced higher
grade 6 completion rates and still achieved higher average test scores. Some countries,
most notably Mozambique, achieved improved access to learning in the overall population
but experienced a decline in average test scores amongst those reaching grade 6.
Using the case of literacy in Mozambique, Figure 28 illustrates how improved access to
learning for the population can be consistent with lower average test scores. The graph

155
shows the numbers of grade 6 students in Mozambique who reached each of the eight
competency levels of reading performance in 2000 and 2007. The numbers were obtained
using the raising factor variable (“rf2”) in the SACMEQ datasets63. From the figure there are
two important findings worth emphasizing: (1) There was a shift in the distribution of
performance with many more children achieving at lower competency levels (levels 1-3) in
2007 than in 2000; and (2) At every competency level there were more students in 2007
than in 2000 due to the expansion of the schooling system and including previously
excluded children. These two points in conjunction with each other explain how it is possible
to say that the Mozambican education system improved access to learning at the same time
that the average Mozambican test score declined. The majority of those children bringing the
average down in 2007 would not have been in school had the grade 6 completion rate of
2000 still prevailed. The fact that these previously excluded children were not included in
SACMEQ 2000, but were included in SACMEQ 2007 (and achieved at relatively low levels)
helps explain how a reduction in average test scores following a rapid expansion of access
is not necessarily an obviously negative outcome. The important thing here is that there
were also more children reaching higher competency levels in 2007 than in 2000, even after
adjusting for population growth. When one looks at the case of Mozambique in this way it
would seem that expanded access to primary schooling was an unambiguously positive
development. For the overall population of children, there was greater access to literacy in
2007 than in 2000.
63
The 2007 numbers of grade 6 pupils were deflated to adjust for population growth between 2000 and 2007.

156
FIGURE 28: NUMBERS OF GRADE 6 PUPILS ACHIEVING AT VARIOUS PERFORMANCE LEVELS IN LITERACY IN
MOZAMBIQUE IN 2000 AND 2007
5.3.2 ACCESS-TO-LITERACY AND ACCESS-TO-NUMERACY BY GENDER
Appendix D4 reports the access-to-literacy and access-to-numeracy rates by gender for all
ten countries in 2000 and 2007. To facilitate an overview of the trends between 2000 and
2007, we derived a Gender Parity Index (GPI) for each of the two periods, defined as the
access-to-literacy rate for girls over the access-to-literacy rate for boys. Figure 29 shows
this GPI for access-to-literacy in 2000 and in 2007. Figure 30 presents the same analysis for
access-to-numeracy.
0 10000 20000 30000 40000 50000 60000 70000
Pre Reading
Emergent Reading
Basic Reading
Reading for meaning
Interpretive reading
Inferential reading
Analytical reading
Critical Reading
Number of grade 6 enrolments
SACMEQ 2007
SACMEQ 2000

157
FIGURE 29: GENDER PARITY INDEX WITH RESPECT TO ACCESS-TO-LITERACY IN 2000 AND 2007
FIGURE 30: GENDER PARITY INDEX WITH RESPECT TO ACCESS-TO-NUMERACY IN 2000 AND 2007
Based on Figure 29 and Figure 30, several points can be made about gender patterns in
access to learning in the region. Firstly, girls typically have lower access to learning than
boys in poorer countries (Mozambique, Uganda, Kenya) and in the East African countries
(Tanzania, Uganda, Kenya). Secondly, analysing only gender inequalities in access to
schooling or only gender inequalities in test scores generally understates the overall gender
gap in access to learning. For example, 64% of girls in the Mozambique SACMEQ sample
had acquired basic numeracy compared with 70% of boys, which would yield a GPI of 0.90.
0
0.2
0.4
0.6
0.8
1
1.2
1.4
1.6
1.8
MOZ ZAM MAL TAN UGA KEN SWA SOU NAM LES
GPI 2000
GPI 2007
0
0.2
0.4
0.6
0.8
1
1.2
1.4
1.6
MOZ ZAM MAL TAN UGA KEN SWA NAM SOU LES
GPI 2000
GPI 2007

158
The grade 6 completion rate for girls was 45% compared with 63% for boys, which would
yield a GPI of 0.72. When combining these figures, however, the access-to-numeracy rate
for girls is 28.57% compared with 44.19% for boys, which yields a GPI of 0.65 (see Lewis
and Lockheed, 2006 for a full discussion of this “double disadvantage”)
Thirdly, girls are outperforming boys in most Southern African countries, especially in
Lesotho – as was discussed in the previous chapter. Fourthly, access-to-learning GPIs in
2007 were lower in numeracy than in literacy for all ten countries, with the percentage point
differential ranging from 3.4 in South Africa to 9.4 in Zambia. This is consistent with the
traditional perception that numeracy tends to favour boys – though of course this result may
not reflect any inherent advantage for boys in numeracy, but rather the effects of a self-
fulfilling socially constructed perception of such an advantage.
Fifthly, in most cases the GPI increased between 2000 and 2007, indicating a relative
improvement for girls. In Mozambique, Uganda and Malawi, the improvement in access to
learning for girls relative to boys was substantial. In these countries, the benefits of
expanded access to primary schooling were enjoyed disproportionately by girls. This points
to the equity-enhancing nature of the recent expansions in school access in the region.
5.3.3 ACCESS-TO-LITERACY AND ACCESS-TO-NUMERACY BY HOUSEHOLD WEALTH
Table 25 shows access-to-literacy rates for the poorest 40%, middle 40% and richest 20% of
households in all ten countries in 2000 and in 2007. Table 26 shows the same information for
numeracy. In all countries the gap in access to learning between the wealthiest 20% of the
population and the poorest 40% of the population is substantial. The inequalities in access
to learning are clearly of a larger magnitude across the wealth dimension than by gender.
The two right-hand columns in Table 25 and Table 26 show the ratio of access-to-literacy
(numeracy) rates amongst the poorest 40% to those amongst the richest 20%. For 2000
and 2007 and for both literacy and numeracy, the lowest ratios (i.e. most unequal) were
obtained for Mozambique, indicating that in this country the poor are at an extreme
disadvantage in having access to learning. For example, the access to numeracy rate for the
wealthiest 20% of children in Mozambique (67%) was almost five times as much as that of
the poorest 40% of children (14%).
In contrast, Swaziland is the most equitable country on this measure. The most encouraging
trend that is evident in these two tables is that the gaps between the richest 20% and the
poorest 40% in access to learning declined in most cases. For access-to-literacy, there was
a decline in inequality in nine of the ten countries, while for numeracy there was a decline in

159
inequality in eight of the ten countries. This reduction in inequality in access to learning was
driven mainly by increased grade 6 completion rates amongst the poor. This again points to
the equity-enhancing nature of the expanded access to schooling in the region since 2000.
TABLE 25: ACCESS-TO-LITERACY RATES BY SOCIOECONOMIC STATUS IN 2000 AND 2007
2000 2007 2000 2007
Country Poor 40%
Mid 40% Rich 20%
Poor 40%
Mid 40% Rich 20%
Ratio:
Poor40: Rich20
Ratio:
Poor40: Rich20
Kenya 62.15 79.88 89.77 69.25 82.61 91.48 0.69 0.76
Lesotho 35.17 53.56 70.98 44.38 64.68 84.48 0.50 0.53
Malawi 19.85 29.40 59.46 24.10 40.26 63.24 0.33 0.38
Mozambique 6.42 21.00 51.71 17.33 39.66 77.03 0.12 0.23
Namibia 32.31 44.59 76.83 61.32 74.42 92.92 0.42 0.66
South Africa 48.82 67.60 93.24 53.80 73.74 92.96 0.52 0.58
Swaziland 67.31 75.79 85.32 76.23 85.60 92.97 0.79 0.82
Tanzania 37.27 68.44 86.51 54.32 75.47 90.81 0.43 0.60
Uganda 34.26 44.31 70.51 35.65 55.57 80.80 0.49 0.44
Zambia 16.25 36.56 70.90 25.02 39.60 67.65 0.23 0.37
TABLE 26: ACCESS-TO-NUMERACY RATES BY SOCIOECONOMIC STATUS IN 2000 AND 2007
2000 2007 2000 2007
Country Poor 40%
Mid 40%
Rich 20%
Poor 40%
Mid 40%
Rich 20%
Ratio:
Poor40: Rich20
Ratio:
Poor40: Rich20
Kenya 58.49 75.63 85.43 66.71 79.82 88.47 0.68 0.75
Lesotho 16.50 25.24 36.68 30.68 47.28 67.52 0.45 0.45
Malawi 9.67 12.12 29.99 15.65 26.22 37.73 0.32 0.41
Mozambique 5.83 19.64 48.02 14.23 34.20 66.79 0.12 0.21
Namibia 8.18 14.28 50.75 29.36 43.40 75.19 0.16 0.39
South Africa 27.83 44.19 81.36 39.87 59.66 87.32 0.34 0.46
Swaziland 52.72 59.23 71.77 69.40 79.31 89.13 0.73 0.78
Tanzania 27.37 56.51 75.64 47.27 67.66 85.15 0.36 0.56
Uganda 25.75 38.21 58.58 26.20 41.65 66.77 0.44 0.39
Zambia 8.53 19.15 42.09 13.62 21.89 44.02 0.20 0.31

160
5.4 EXTENSIONS
5.4.1 ACCESS TO HIGHER ORDER LITERACY AND NUMERACY
Thus far the focus has been on access to basic literacy and basic numeracy, as defined by
reaching at least level three of the eight achievement levels in the SACMEQ tests. It is
conceivable that an expansion of primary school participation may lead to increased
acquisition of basic literacy and numeracy in the population but may adversely affect the
acquisition of higher order skills due to a trade-off between quantity and quality. To
investigate this, we analyse access to higher order literacy and higher order numeracy, as
defined by reaching at least level five out of the eight achievement levels in the SACMEQ
test. Level five literacy (“interpretive reading”) requires the ability to combine information
from various parts of a text and interpret it relative to external or recalled information in order
to complete and contextualise meaning (Ross et al., 2005). Level five numeracy
(“competent numeracy”) requires the ability to solve multiple-operation problems, using
whole and mixed numbers as well as the conversion of measurement units from one level to
another. A full description of all eight levels of literacy and numeracy in the SACMEQ tests
is provided in Appendix C.
The calculation of access to higher literacy and higher numeracy was the same as that for
access-to-literacy and access-to-numeracy. The grade 6 completion rate was multiplied by
the proportion of grade 6 pupils who reached at least level five in SACMEQ. As before, we
assume that those who did not enrol in school or dropped out before grade 6 did not acquire
higher order skills. Figure 31 shows access to higher order literacy in 2000 and 2007, and
Figure 32 shows the same for access to higher order numeracy. Clearly there are substantial
differences in the proportion of students attaining higher-order numeracy and literacy skills. If
one looks at the results for 2007 one can see that more than 50% of children in Kenya,
Tanzania and Swaziland achieved at least level five in literacy (interpretive reading),
compared to less than 20% in Malawi, Zambia, Mozambique and Lesotho.
The general trend is again positive. In most countries there was greater access to higher
order literacy and higher order numeracy in 2007 than in 2000. In Lesotho, Namibia,
Tanzania and Swaziland there were substantial increases in access to higher order learning.
The only decreases were observed for Zambia, Mozambique (numeracy only) and Uganda
(numeracy only), but these declines were not statistically significant. Therefore, the period of
increased school participation between 2000 and 2007 in Southern and Eastern Africa was
accompanied by increased access to higher order learning (in most countries) in addition to
increased access to basic learning (in all countries).

161
FIGURE 31: ACCESS TO HIGHER LITERACY IN 2000 AND 2007
FIGURE 32: ACCESS TO HIGHER NUMERACY IN 2000 AND 2007
5.4.2 COMPLETION OF HIGHER LEVELS OF SCHOOLING
0%
10%
20%
30%
40%
50%
60%
70%
MAL ZAM MOZ LES UGA NAM SOU KEN TAN SWA
Acc
ess
to
Hig
he
r Li
tera
cy
2000
2007
0%
5%
10%
15%
20%
25%
30%
35%
MAL ZAM MOZ LES UGA NAM SOU SWA TAN KEN
Acc
ess
to
Hig
he
r N
um
era
cy
2000
2007

162
Lewin (2007) observes that increased primary school access can lead to bottlenecks later in
the system if there are binding resource constraints at higher levels of education. This may
occur when aid programmes are earmarked for primary schooling only and are limited for a
specific time period. Somerset (2007) argues that Kenya’s abolition of school fees in 1974
led to a massive increase in grade 1 enrolments but a huge increase in drop-out thereafter.
To investigate whether increased access to primary schooling was accompanied by
increased throughput to higher levels of schooling, we calculated grade 9 completion rates
amongst 22- to 24-year-olds using the same household survey data as for the calculation of
grade 6 completion rates. The results are reported in Table 27. In all ten countries, the grade
9 completion rate increased over the period. In Mozambique, Swaziland and Tanzania,
where the grade 6 completion rate had increased substantially, the grade 9 completion rate
also increased substantially. 64 This would suggest that increased primary school access
has also been associated with improved participation in higher levels of education.
64 For Tanzania, this contradicts a study by Hoogeveen and Rossi (2013), who use a difference-in-difference
approach to estimate the impact of the introduction of free primary schooling on grade attainment. They argue that although children under the reform achieved more schooling than those who were just too young to be affected, the marginal impact of the reform was to decrease grade attainment by 0.6 years of schooling. However, there are some reservations about their identification of treatment (i.e. being born in 1992 or after versus being born in 1991 or earlier) and about the use of baseline grade attainment for treated and non-treated groups. Given that grade attainment was higher overall for those under the reform but the coefficient on the interaction between time and treatment was negative, we suspect that strong baseline grade attainment amongst the younger cohort (perhaps due to earlier school enrolment) may have affected the comparability of baseline measures between the older and younger cohorts and may have driven the result.

163
TABLE 27: GRADE 9 COMPLETION RATES AROUND 2003 AND AROUND 2010 (22-24 YEAR OLDS)
Grade 9
completion rate
Circa 2003 SE
Grade 9
completion rate
Circa 2010 SE
Kenya 40.06 1.53 43.34 1.94
Lesotho 36.97 1.39 42.16 1.62
Malawi 28.78 1.48 33.75 1.12
Mozambique 8.37 0.81 22.53 1.25
Namibia 59.01 2.19 65.67 1.32
South Africa 79.00 0.71 83.91 0.66
Swaziland 59.64 2.24 85.14 1.59
Tanzania 9.97 1.02 18.12 1.26
Uganda 30.62 1.52 37.03 1.52
Zambia 36.19 1.72 41.44 1.78
5.4.3 MEASURING ACCESS TO LEARNING USING ADMINISTRATIVE DATA
The main disadvantage with using grade 6 completion rates obtained from household survey
data to calculate access to learning is that there is a lag between the year of grade 6 testing
and the year of the household survey and that the magnitude of this lag is slightly different
across countries due to limited data availability. Therefore, as a robustness check we
employ an alternative method to measure access to literacy and access to numeracy in our
sample of ten countries.
The number of grade 6 pupils achieving basic literacy or basic numeracy can be estimated
directly from the SACMEQ data using the raising factor variable (“rf2”). This raising factor
inflates the total weighted number of students in the sample to be equal to the estimated
population of grade 6 pupils in each country. The SACMEQ project adjusted official school
census data estimates of grade 6 enrolments in response to actual enrolments as observed
in schools during fieldwork. These were then used to adjust the sampling frame to re-
calculate the probability of selection into the sample and hence the raising factor variable.
Therefore, these estimates of the total grade 6 population in each country should be more
accurate than official administrative data, which are typically used to calculate Gross

164
Enrolment Ratios and the like. It is possible to inflate any subgroup within the SACMEQ
sample to the estimated population total of enrolled grade 6 pupils for that subgroup. For
example, one can calculate and compare the estimated total number of functionally literate
grade 6 pupils in a country in 2000 with that in 2007.
Because of population growth, however, it is possible that a country may have had more
functionally literate grade 6 pupils in 2007 than in 2000 even though the proportion of
children in the population that were functionally literate declined. To adjust for this, the
United Nations (2012) medium variant population estimates for 10 - 14 year olds were used
to calculate an appropriate population growth deflator so as to make the total number of
grade 6 students in 2007 comparable with that in 2000. Under the assumption that
population growth was not significantly correlated with the likelihood of being enrolled, the
population growth deflator was multiplied by the total number of functionally literate
(numerate) children in 2007 to obtain an adjusted number of grade 6 pupils reaching basic
literacy (numeracy) in 2007. This process is analogous to adjusting for inflation.
The disadvantages of using this alternative method include concerns around the quality and
comparability of administrative data on enrolments across countries and time, the need to
incorporate population growth estimates, which opens up another possible source of
measurement error, and the sensitivity of the method to changing rates of grade repetition.
The SACMEQ data indicate that in 2007 there were generally lower rates of grade repetition
than in 2000. Since grade repetition leads to a type of “double-counting”, declining grade
repetition should have a diminishing effect on the number of grade 6 enrolments.
The estimated numbers of functionally literate (and numerate) grade 6 children and the UN
medium variant population estimates (as well as the formulas applied to calculate country-
specific deflators) are reported in Appendix D1. Column J in Tables A1 (literacy) and A2
(numeracy) report the ratio of the number reaching basic literacy (or numeracy) in 2007 to
the number reaching basic literacy (or numeracy) in 2000. In all countries, for both literacy
and numeracy, the ratios were greater than one, indicating that access-to-learning also
improved between 2000 and 2007 using this alternative method. Although these ratios differ
somewhat from those reported in the rest of the chapter (based on household survey data),
this sensitivity analysis confirms the broad pattern that access to learning improved over the
period of expanded school participation between 2000 and 2007.

165
5.4.4 CHANGES IN SOCIAL COMPOSITION
The household data analysed in this paper confirm that children from poor households are
less likely to complete grade 6 than more affluent children. Therefore, as access is
expanded one would expect the social composition of schools to reflect a larger proportion of
children of lower socio-economic status. Table 28 provides an indication of the changing
social composition amongst grade 6 pupils in 2000 and 2007, using mother’s educational
attainment as a proxy for socio-economic status.
TABLE 28: PROPORTION OF MOTHERS WITH AT LEAST COMPLETE SECONDARY EDUCATION (SACMEQ)
Country
2000
SE
2007
SE
Percentage increase
Kenya 35.06 0.02 30.64 0.02 -12.60
Lesotho 19.49 0.02 23.46 0.01 20.34
Malawi 13.94 0.02 10.25 0.01 -26.46
Mozambique 13.23 0.01 7.61 0.01 -42.46
Namibia 34.74 0.02 33.46 0.01 -3.67
South Africa 42.77 0.02 42.99 0.01 0.51
Swaziland 31.67 0.02 38.55 0.02 21.74
Tanzania 17.74 0.02 7.33 0.01 -58.67
Uganda 21.09 0.02 14.87 0.01 -29.52
Zambia 31.57 0.02 19.51 0.01 -38.20
Table 28 shows that in most countries where grade 6 completion rates had increased over
the period the proportion of grade 6 pupils whose mother had completed secondary school
declined between 2000 and 2007. One would generally expect that the proportion of
mothers in the overall population (i.e. irrespective of whether their children reach grade 6)
with at least complete secondary education would be increasing over time due to historical
expansions in access to schooling. Therefore, the fact that in most countries the proportion
of pupils whose mothers had completed secondary education declined can be taken to
reflect the changing social composition due to increased access to primary schooling. In
some countries the changing social composition according to this measure was substantial
(Mozambique, Tanzania, Zambia). In Lesotho and Swaziland, the proportion of pupils whose

166
mothers had completed secondary school actually increased. This is a bit unexpected given
that the grade 6 completion rate increased over the period, but it may reflect sizable
historical increases in secondary school completion.
The changing social composition is likely to have had a direct negative effect on country
average test scores since poorer children tend to achieve lower test scores. However, there
may also have been an indirect effect of the changing social composition through peer
effects – pupils in 2007 perform worse than similar children in 2000 because of a weaker
peer group.
5.4.5 SCHOOL RESOURCES
One of the main reasons why one might expect a trade-off between access and school
performance is the stretch on resources as more students enter the system. Table 29
describes the state of selected school inputs in 2000 and in 2007. Pupil-teacher ratios
increased in most of the countries in which substantial expansions occurred (Kenya, Malawi,
Mozambique, Tanzania and Zambia). The same countries also experienced increases in the
ratio of pupils to physical classrooms. There was no clear pattern with respect to changes in
access to reading textbooks, with some countries improving access to textbooks and others
going backwards. 65 In no countries were there substantial increases in parent financial
contributions and in some countries there were noticeable declines (Kenya, Lesotho,
Tanzania and Zambia).66 This is what one might expect to observe in a context of fee
abolitions and increasing participation of children with parents of low socio-economic status.
Apart from the effect on school budgets and resources, declining parental contributions may
be expected to reduce local accountability. Teacher content knowledge, as measured by
detailed tests taken by grade 6 teachers, declined on average in Kenya (although Kenya
remained the top-performer on this measure), Mozambique and Zambia, and increased in
Namibia, Tanzania and Uganda.
65
Good access to textbooks was defined as either each child has a textbook or children share a textbook with at most one other child.
66 A summative index was generated based on 14 questions in the school principal questionnaires about whether
parents contribute in various ways, including helping with building maintenance, purchasing of stationary and paying examination fees.

167
TABLE 29: SELECTED SCHOOL INPUTS IN 2000 AND 2007
Pupil teacher
ratio
Pupils per
classroom
Access to
reading
textbooks
Parent
financial
contributions
Mathematics
teacher
content
knowledge
Country 2000 2007 2000 2007 2000 2007 2000 2007 2000 2007
Kenya 33.36 42.85 46.98 63.51 51.11 39.28 9.00 4.50 968.52 906.05
Lesotho 53.85 41.80 84.15 60.23 71.57 75.37 8.64 3.70 739.38 738.79
Malawi 69.97 87.96 146.86 160.26 71.67 36.60 3.52 4.18 776.03 762.42
Mozambique 51.32 57.99 157.98 189.95 73.37 66.91 2.65 2.46 782.79 745.57
Namibia 31.47 31.08 50.77 40.16 76.73 63.25 4.03 4.92 734.83 771.13
South Africa 36.53 34.33 47.20 50.45 66.25 73.17 5.11 4.54 - 763.62
Swaziland 35.11 34.24 40.90 41.82 90.12 99.38 8.91 8.36 808.06 811.10
Tanzania 47.06 62.86 96.30 100.15 15.89 13.19 5.70 4.06 794.29 825.79
Uganda 57.98 55.67 132.72 114.14 26.60 31.97 4.18 4.39 822.88 833.27
Zambia 53.71 74.52 81.05 97.94 41.76 43.45 6.25 4.81 759.12 740.39
Any strong conclusions about what successful countries did to manage expansions in
access without large quality deteriorations based on only ten countries would be tenuous. A
much closer analysis would be required. However, there are one or two broad points worth
noting from Table 29. In Kenya and Tanzania – two of the top-performing countries in the
sample and both having experienced increases in grade 6 completion – pupil-teacher ratios
and pupil-to-classroom ratios increased considerably but the quality of teachers, as
measured by content knowledge, remained at a high level compared with other countries.
This is consistent with Mingat’s (1998) argument that Asian countries that successfully
managed to expand access and quality placed more emphasis on teacher quality (as
reflected in teacher remuneration) than on pupil-teacher ratios. These observations are at
least consistent with one of the main findings from the education production function
literature, namely that additional resources are no guarantee of better outcomes, but rather
that aspects of teacher quality, teacher motivation and school management are likely to be
the important drivers of school performance (Hanushek, 2003; Van der Berg, 2008).

168
Figure 33 provides a crude assessment of how children of similar socio-economic status
performed in 2000 and in 2007. Mother’s education is again used as a proxy for socio-
economic status. The figure shows that some countries (Kenya, Malawi, South Africa,
Uganda and Zambia) achieved similar levels of reading achievement in 2000 and in 2007 at
given levels of mother’s education. Other countries (Lesotho, Swaziland and Tanzania)
actually achieved higher reading scores in 2007 at given levels of mother’s education.
Namibia achieved considerably higher reading achievement in 2007, controlling for mother’s
education, but this was not in the context of a substantial change in grade 6 completion.
Only in Mozambique was there a decline in reading achievement for children with the same
mother’s education. This is in line with Crouch’s (2011) conclusion that changes in social
composition cannot fully explain Mozambique’s decline in average achievement. It should
also be mentioned that holding mother’s education constant does not adequately control for
socio-economic differences between grade 6 pupils in 2000 and 2007. This is because, even
amongst children with the same maternal education, there are likely to be unobserved
differences in socio-economic status and parental support of education, that would
systematically be educationally less favourable amongst those in 2007 (since more children
were enrolled in this year). Therefore, the finding that in most countries test scores were no
worse in 2007, holding mother’s education constant, is conservatively made.
A broad interpretation of Figure 33 thus points to the following conclusion: Either the
combined effects of negative peer group influences and resource constraints were small or
they were offset by other positive educational factors, such as improved policies, school
management and instructional practice.

169
FIGURE 33: MEAN READING ACHIEVEMENT BY MOTHER'S EDUCATION IN 2000 AND 2007 (WITH 95% CONFIDENCE
INTERVALS)
5.5 CONCLUSION
Viewing country average test scores or enrolment rates in isolation is misleading, particularly
when evaluating trends over time. A decline in a country average score does not necessarily
reflect deterioration in the education system. In order to meaningfully assess education
system performance in countries with incomplete (or changing) access to education it is
imperative to use a combined measure of access and quality. In this chapter it was argued
that education system performance should be re-conceptualized and measured as the
amount of learning that takes place in the overall population of children (those enrolled and
those not enrolled).
Using a new measure of “access to learning” – the proportion of children who reach a
particular grade and have acquired specific learning outcomes – it was shown that the
expansion of access to primary schooling in Southern and Eastern Africa since 2000
contributed to improved access to literacy and numeracy in these countries. In particular,
girls and those in relatively poor households benefited most from this improvement in access
300
350
400
450
500
550
600
650K
EN1
KEN
2
LES1
LES2
MA
L1M
AL2
MO
Z1M
OZ2
NA
M1
NA
M2
SOU
1SO
U2
SWA
1SW
A2
TAN
1TA
N2
UG
A1
UG
A2
ZAM
1ZA
M2
Re
adin
g sc
ore
SACMEQ 2000
SACMEQ 2007
1 = Less than complete secondary education
2 = At least complete secondary education

170
to literacy and numeracy. Not only did access to basic literacy and numeracy improve, but so
did access to higher order literacy and numeracy learning. The improvements in access to
learning at the grade 6 level were also accompanied by increased attainment of higher levels
of schooling, as measured by grade 9 completion rates. The results are robust to an
alternative method for measuring access to learning that uses administrative data on school
enrolments rather than household survey data.
The analysis presented here illustrates the general principle that a downward shift in the
distribution of test scores (amongst those enrolled) can be completely congruent with
improved access to learning (in the overall population). Having noted this, there may well be
merit in retaining some focus on the average quality of achievement within particular
schools. The new measure proposed in this paper should therefore be seen as a
complement to existing measures of quality rather than as a substitute.
This main contribution of this analysis is limited to describing access to learning between
2000 and 2007. The paper does not separate out the “value-added” by teachers and schools
from the influence of peers; nor does it measure the causal effect of an expansion on
children who would otherwise have been enrolled in the absence of an expansion.
As countries approach universal primary education a similar challenge is bound to emerge
around the expansion of access to secondary and pre-school education. While these
expansions may have their own unique challenges, this paper has shown that simply
increasing the opportunity to learn through school attendance is likely to lead to a superior
production of human capital in the overall population.
Despite these large gains through expanded access, the key challenge going forward is to
improve the quality of schooling in these countries. The participation of some Southern
African countries in PIRLS and TIMSS, interpreted in combination with the SACMEQ
assessments, has indicated that most countries in the region are performing far below
developed country standards and some perform significantly worse than otherwise similar
developing countries. Raising the quality of primary schooling in these countries may now be
the most important component in improving access to secondary and tertiary education, and
consequently, improving the economic prospects and social development of these countries.
By describing what actually happened in Southern and Eastern Africa between 2000 and
2007, this chapter has shown that the perception of an access-quality trade-off may not have
as much empirical support as was previously thought. Indeed, it was found that the

171
substantial expansions of access to primary education since 2000 did not reduce education
system effectiveness, when properly defined, but rather facilitated a greater proportion of
children enjoying access to learning.

172
CHAPTER 6: CONCLUSION
The research presented in this thesis began with the specific case of South Africa and then
moved toward the generalized case of Sub-Saharan Africa. The aim in doing so was to show
in as vivid terms as possible, that access to education alone is not enough. South Africa is a
middle-income country with almost universal primary school completion, comparatively high
grade-attainment and significant government expenditures on education. Yet, in spite of this,
educational outcomes are abysmal. Most countries in Sub-Saharan Africa have not yet
reached universal primary school enrolment or completion, but they are well on their way to
doing so (Pritchett, 2013). However, without an appropriate focus on the quality of education
that is being provided at these buildings we call ‘schools’, we are likely to see many more
examples like South Africa on the rest of the continent. While it is true that the idea of a
strong access-quality trade-off has less empirical support than was previously believed to be
the case, this does not mean that the quality of education in Sub-Saharan Africa should
receive less attention in the coming decades. If anything the focus on quality needs to move
to the front and centre. Educational outcomes in Sub-Saharan Africa are still exceedingly low
when compared to developing countries around the world. In a rapidly globalizing and
increasingly knowledge-based world, the skills and education of a country are of paramount
importance for sustained prosperity. Equally as important, citizens in Sub-Saharan Africa
deserve as much as anyone else the meaningful opportunities that would allow for the free
unfolding of their personalities and the full exploration of their talents.
6.1 SUMMARY OF MAIN FINDINGS
The scope of the research presented in this thesis is large, ranging from the impact of
language, the size of mathematical learning deficits and the interplay between access and
quality in 11 Sub-Saharan African countries. Consequently, it is perhaps helpful to
summarise the main findings presented in this thesis and explain how they contribute to the
economic and education literatures.
6.1.1 Education quality in South Africa: Inequality, language and learning deficits
Chapter 1: Inequality: Given the country’s colonial and apartheid history, South Africa
is an extremely unequal country. This inequality is reflected in - and propagated by -
the education system. Apartheid policies discriminated along multiple criteria and
consequently the inequalities found in education can still be seen along any of these
dimensions: race, geographic location, language, province and former educational
department. It was argued that in South Africa we have two public schooling systems

173
not one. The lower tier system consists of approximately 75-80% of students
attending largely dysfunctional schools with the upper tier of the system consisting of
approximately 20-25% of students attending mostly functional schools. Because
there are two data generating processes at play – one in each system, if one reports
averages for the system as a whole this is uniquely misleading. Furthermore,
conflating two systems that operate very differently to each other can lead to
spurious results. The major contribution here was to collate existing studies (Fleisch,
2008; Shepherd, 2011; Spaull, 2013; S. Taylor, 2011) and show that the two
schooling systems can be seen across numerous dimensions. Also to quantify how
large the two systems are relative to each other and to do so on empirical grounds.
Chapter 2: Learning deficits: Chapter 2 quantified a year’s worth of mathematics
learning in South Africa (0.3 standard deviations) and used this measure to develop
empirically calibrated learning trajectories. This was made possible by using within-
survey benchmarks and comparing actual and effective grades using three nationally
representative surveys of educational achievement across grades 3, 4, 5, 6 and 9.
Two main findings were, (1) only the top 16% of South African grade 3 children are
performing at an appropriate Grade 3 level. (2) The learning gap between the poorest
60% of students and the wealthiest 20% of students is approximately three grade-
levels in grade 3, growing to four to five grade-levels by grade 9. Quantifying learning
deficits across multiple grades using numerous surveys adds further empirical
support to a host of qualitative and small-scale studies that find similar results.
Chapter 3: Language: The analysis presented in chapter 3 exploited an unusual
occurrence whereby the same students were tested twice, one month apart, once in
the LOLT of the school and once in English. Using a difference-in-difference
approach it was possible to tease out the causal impact of language on performance
in grade 3. The size of the composite effect of home-background and school-quality
was found to be 1,6 to 3,9 times larger than the impact of writing a test in English (for
non-English students) for literacy and at least 3,8 times larger for numeracy. To put
this in terms of ‘years worth of learning’, if one uses 0,3 standard deviations as an
approximation of one year of learning in South Africa (as per the discussion in
Chapter 2), then the size of the ‘language cost’ is approximately one to two years
worth of learning for literacy and one year for numeracy. By contrast, the size of the
composite effect of home background and school quality is roughly four years worth
of learning for both numeracy (1,2 standard deviations) and literacy (1,15 standard
deviations). The data and methods used in this chapter allow for causal
interpretations of the impact of language, something that is especially rare in the field

174
of language and education. It also shows that while writing a test in English is costly
for non-English students, this cannot explain the full extent of underperformance in
South Africa, contrary to the conclusions of some language scholars.
6.1.2 Educational access and educational quality in Sub-Saharan Africa
Chapter 4: Access and quality: This chapter created a composite statistic of
educational quantity and educational quality by combining household data (DHS) on
grade completion and survey data (SACMEQ) on cognitive outcomes for 11 countries
in Sub-Saharan Africa. It showed why various measures of access that have been
used in the past (and particularly the assumptions made about progression and late
completion) are inappropriate and potentially misleading. By using a cohort of 19-23
year olds it was possible to avoid these untrue assumptions. The composite statistic,
termed access-to-literacy and access-to-numeracy, was reported for all countries and
all sub-groups for 2007. It was found that learning deficits are considerably greater
than access deficits in all of the 11 countries, and that late (or delayed) grade 6
completion is widespread in Sub-Saharan Africa. Large wealth differentials in access-
to-literacy/numeracy (greater than 30 percentage points) exist in all countries except
Zimbabwe, Kenya and Swaziland, and pro-boy gender differentials of around 10
percentage points were found in Malawi, Tanzania, and Zambia, rising to 15
percentage points in Mozambique. Lesotho shows an atypically large pro-girl trend in
both access-to-literacy and access-to-numeracy rates, driven primarily by boys’ lower
rate of grade 6 completion, particularly for poor boys. Although access to literacy and
numeracy rates were reported for all 11 countries for both periods, the aim was not to
provide extended analysis on individual countries. The examples of Lesotho and
Mozambique were included as case-study examples of how these composite
statistics can shed new light on education in these countries. The chapter concluded
by situating the analysis in the discussions around the post-2015 Millennium
Development Goals and argued that the new goals should have an explicit ‘quality
element’ to ensure that children receive meaningful learning opportunities rather than
simply physical places in buildings called schools.
Chapter 5: Access and quality over time: Using the method developed in chapter 4
this chapter showed how access-to-literacy and access-to-numeracy changed over
the period 2000-2007, a period of substantial increase in access to schooling for
many countries. In all 10 countries67 there was an improvement in access to literacy
and numeracy, challenging the widely held perception that there is always an access-
67
Only 10 countries had test score data for both periods since Zimbabwe did not participate in SACMEQ 2000.

175
quality trade-off in education. In particular, girls and those in relatively poor
households benefited most from this improvement in access to literacy and
numeracy. Furthermore, there was also greater access to higher order literacy and
numeracy learning and improvements in higher grade attainment levels, as
measured by grade 9 completion rates. The results were also shown to be robust to
an alternative method for measuring access to learning that uses administrative data
on school enrolments rather than household survey data. The chapter concluded by
stressing that the quality of education needs to remain the focus of the discourse, but
also that we need to look at what has actually happened in Africa before making
conclusions about an access-quality trade-off.
The research presented in this thesis was deliberately inter-disciplinary in nature aiming to
contribute to both the education and economic literatures. By using the methods of
economics and the insights of education it was possible to expand our understanding of how
and why learning does or does not happen in South Africa. Perhaps most importantly, this
approach birthed a new way of looking at education system performance in Sub-Saharan
Africa and indeed in any developing country with incomplete access or significant dropout.
The relatively simple measures of access-to-literacy and access-to-numeracy developed in
this thesis have displayed an amazing fecundity, providing new insight into the access-
quality dynamics within and between countries in Sub-Saharan Africa. There is no reason
why this method could not be applied to francophone West Africa (using PASEC68 data) or
Latin America (using SERCE69 data) or any developing country with a reliable cross-national
test of educational achievement and DHS or comparable household survey data. Similarly
the method for calculating learning trajectories developed in Chapter 2 could easily be
applied to other countries provided that they have multiple data sets of educational
achievement across grades, as many developing countries do. This illustrates some of the
scientific contributions and research potential of the methods and approaches developed in
this thesis.
Education is arguably one of the most important generative mechanisms of economic growth
and social development in a country. It is the centre-piece of human capital theory, the
lynchpin of the capabilities approach, and rightfully occupies pride of place in discussions
about equality of opportunity and the dignity of individuals. South Africa is the example par
68
PASEC stands for the Programme d’Analyse des Systèmes Educatifs de la CONFEMEN and is very similar to SACMEQ but is run in francophone West Africa.
69 SERCE stands for Segundo Estudio Regional Comparativo y Explicativo, and is very similar to SACMEQ but is
run in Latin America.

176
excellence; hundreds of thousands of South Africa children attend dysfunctional schools that
are unable or unwilling to teach students even the most basic cognitive skills that they
should be acquiring in this formative phase of their lives. In the absence of such meaningful
learning opportunities it is imperative to draw the distinction between access-to-schooling
and access-to-learning. If one thinks of education as the process of refining consciousness it
becomes clear that this will not occur unless that education is of sufficient quality. The
underlying motivation behind most of the research presented here is this very topic, that
there is a need to return to the fundamentals of why we care about education. We care
about education because we care about learning. Schools gain their legitimacy by fulfilling
the function for which we created them; to provide the knowledge, skills and values children
need to flourish in society.
In sum, this thesis has intended to refocus the discussion on education in Africa by
prioritizing educational quality. Looking at mathematical learning deficits in South Africa, as
well as the language-dynamics and high levels of inequality in the country, it was argued that
the education system is failing the majority of youth in South Africa. Moving beyond South
Africa, the research presented in chapters 4 and 5 refocused the discussion on education
system performance in Sub-Saharan Africa and placed educational outcomes at the centre
of the discourse. If children are to realize their full potential, the expansion of physical
access to schooling in the developing world must be accompanied by meaningful learning
opportunities. The acquisition of knowledge, skills and values must be the central aim of
educational expansion.

177
REFERENCES
Adato, M., Carter, M.R., May, J., 2006. Exploring poverty traps and social exclusion in South Africa using qualitative and quantitative data. J. Dev. Stud. 42, 226–247.
Adetula, L.O., 1990. Language factor: Does it affect children’s performance on word problems? Educ. Stud. Math. 21, 351–365.
Alexander, N., 2005. Language, class and power in post-apartheid South Africa. In: Harold Wolpe Memorial Trust Lecture, October. Wolpe Trust, Cape Town.
Alidou, H., Boly, A., Brock-utne, B., Satina, Y., 2006. Optimizing Learning and Education in Africa – the Language Factor 1–186.
ANC, 1994. A Policy Framework for Education and training. Pretoria.
Angrist, J.D., Pischke, J.-S., 2009. Mostly harmless econometrics: An empiricist’s companion, An empiricist’s companion. Princteon University Press, Princeton and Oxford.
Aubrey, C., Godfrey, R., 2003. The development of children’s early numeracy through key stage 1. Br. Educ. Res. J. 29, 821–840.
Aubrey, C., Godfrey, R., Dahl, S., 2006. Early mathematics development and later achievement: Further evidence. Math. Educ. Res. J. 18, 27–46.
Aunio, P., Niemivirta, M., 2010. Predicting children’s mathematical performance in grade one by early numeracy. Learn. Individ. Differ. 20, 427–435.
Aunola, K., Leskinen, E., Lerkkanen, M.-K., Nurmi, J.-E., 2004. Developmental Dynamics of Math Performance From Preschool to Grade 2. J. Educ. Psychol. 96, 699–713.
Ball, D.L., Hill, H.C., Bass, H., 2005. Knowing Mathematics for Teaching. American Educator. 29 (1)
Banerjee, A. V., Duflo, E., 2012. Poor Economics. PublicAffairs
Barro, B.R.J., Lee, J., 2001. International data on educational attainment : updates and implications 3, 541–563.
Barro, R., Lee, J.-W., 2013. A new data set of educational attainment in the world, 1950–2010. J. Dev. Econ.
Basu, A.M., 2002. Why does education lead to lower fertility? A critical review of some of the possibilities. World Dev. 30, 1779–1790.
Becker, G.S., 1962. Investment in Human Capital: A Theoretical Analysis. J. Polit. Econ. 70 (5), 9-49
Bernardo, A.B.I., 1999. Overcoming Obstacles to Understanding and Solving Word Problems in Mathematics. Educ. Psychol. 19, 149–163.

178
Blaug, M., 1976. The Empirical Status of Human Capital Theory: A Slightly Jaundiced Survey. J. Econ. Lit. 14, 827–855.
Bold, T., Kimenyi, M., Mwabu, G., Sandefur, J., 2011a. Does abolishing fees reduce school quality? Evidence from Kenya ( No. 2011-04), CSAE Working Paper. Oxford.
Bold, T., Kimenyi, M., Mwabu, G., Sandefur, J., 2011b. Why did abolishing fees not increase public school enrollment in Kenya? ( No. 271). Washington.
Bosworth, B., Collins, S., 2003. The empirics of growth: An update. Brookings Pap. Econ. Act.
Brock-Utne, B., 2007. Language of instruction and student performance: new insights from research in Tanzania and South Africa. Int. Rev. Educ. 53, 509–530.
Carnoy, M., Arends, F., 2012. Explaining mathematics achievement gains in Botswana and South Africa. Prospects 42, 453–468.
Carnoy, M., Chisholm, L., 2008. Towards understanding student performance in South Africa: A pilot study of grade 6 mathematics lessons in Guateng province. Cape Town.
Carnoy, M., Chisholm, L., Chilisa, B., 2012. The Low Achievement trap: Comparing Schooling in Botswana and South Africa. HSRC Press, Cape Town.
Cazabon, M.T., Nicoladis, E., Lambert, W.E., 1997. Becoming Bilingual in the Amigos Two-Way Immersion Program. Research Report 3.
Chimombo, J., 2009. Changing patterns of access to basic education in Malawi: a story of a mixed bag? Comp. Educ. 45, 297–312.
Chimombo, J., Kunje, D., Chimuzu, T., Mchikoma, C., 2005. The SACMEQ II Project in Malawi: A Study of the Conditions of Schooling and the Quality of Education. Harare.
Chisholm, L., 2013. Bantustan Education History: The “Progressivism” of Bophutatswana’s Primary Education Upgrade Programme (PEUP), 1979–1988. South African Hist. J. 65, 403–420.
Ciccone, A., Papaioannou, E., 2009. Human Capital, the Structure of Production, and Growth. Rev. Econ. Stat. 91, 66–82.
Colclough, C., Kingdon, G., Patrinos, H., 2009. The pattern of returns to education and its implications. Policy Br.
Crouch, L., 2011. Task Order 11: Gap Analysis: Education Information and Education Policy and Planning in Mozambique.
Crouch, L., Vinjevold, P., 2006. Access Before Quality and What to do Now? Profesorado-Revista Curric. y Form. del Profr. 10.
Cummins, J., 1984. Bilingualism and Special Education: Issues in Assessment and Pedagogy. Multilingual Matters Limited.

179
Cummins, J., 2000. Language, Power, and Pedagogy: Bilingual Children in the Crossfire. Multilingual Matters.
Currie, J., 2009. Healthy, Wealthy, and Wise: Socioeconomic Status, Poor Health in Childhood, and Human Capital Development. J. Econ. Lit.
DBE, 2009. Trends in Education Macro Indicators Report. Pretoria.
DBE, 2010. The status of the language of learning and teaching (LOLT) in schools: A quantitative overview. Department of Basic Education, Pretoria.
DBE, 2011a. Report on the Annual National Assessments of 2011. Pretoria.
DBE, 2011b. Macro Indicator Trends in Schooling: Summary report 2011. Pretoria.
DBE, 2011c. Curriculum and Assessment Policy Statement (CAPS): Foundation Pase Grades 1-3 First Additional Language. Pretoria.
DBE, 2013. School Realities 2013. Department of Basic Education. Pretoria.
Denison, E.F., 1985. Trends in American Economic Growth, 1929-1982. The Brookings Institution.
Department of Education, 2002. Revised National Curriculum Statement Grades R-9. South Africa.
Desoete, A., Stock, P., Schepens, A., Baeyens, D., Roeyers, H., 2008. Classification, Seriation, and Counting in Grades 1, 2, and 3 as Two-Year Longitudinal Predictors for Low Achieving in Numerical Facility and Arithmetical Achievement?. J. Psychoeduc. Assess. 27, 252–264.
DoE, 2008. Grade 3 Systemic Evaluation 2007 Leaflet. Pretoria.
Easterly, W., 2009. How the millennium development goals are unfair to Africa. World Dev. 37.
Edwards, J., 2012. Language and identity. In: Chapelle, C. (Ed.), The Encyclopedia of Applied Linguistics. John Wiley & Sons.
Ensor, P., Hoadley, U., Jacklin, H., Kuhne, C., Schmitt, E., Lombard, A., Van den Hevel-Panhuizen, M., 2009. Specialising pedagogic text and time in Foundation Phase numeracy classrooms. J. Educ. 47, 5–30.
Fairclough, N., 1989. Language and power. Longman Group UK, London.
Fehrler, S., Michaelowa, K., Wechtler, A., 2009. The Effectiveness of Inputs in Primary Education: Insights from Recent Student Surveys for Sub-Saharan Africa. J. Dev. Stud. 45, 1545–1578.
Filmer, D., 2007. Education inequalities around the world. In: Commonwealth Education Partnerships.

180
Filmer, D., 2010. Educational Attainment and Enrollment around the World [WWW Document]. Dev. Res. Gr. World Bank. URL http://iresearch.worldbank.org/edattain/
Filmer, D., Hasan, A., Pritchett, L., 2006. A Millennium Learning Goal: Measuring Real Progress in Education. SSRN Electron. J.
Filmer, D., Pritchett, L., 1999. The effect of household wealth on educational attainment: evidence from 35 countries. Popul. Dev. Rev. 25, 85–120.
Filmer, D., Pritchett, L., 2001. Estimating wealth effects without expenditure data—Or tears: An application to educational enrollments in states of India*. Demography.
Fiske, E.B., Ladd, H.F., 2004. Elusive Equity: Education Reform in Post-apartheid South Africa. Brookings Institution Press, Washington, DC.
Fleisch, B., 2008. Primary Education in Crisis: Why South African Schoolchildren underachieve in reading and mathematics. Juta & Co, Cape Town.
Foy, P., Martin, M.O., Mullis, I., 2010. The limits of measurement: problems with estimating reading achievement in PIRLS 2006 for low performing countries. Boston.
Foy, P., Arora, A. & Stanco, G. M. 2013 TIMSS 2011 User Guide for the international database. Boston. TIMSS & PIRLS Study Center.
Frary, R., 1988. Formula Scoring of Multiple Choice Tests (Correction for Guessing). Madison.
Gagne, R., 1962. The acquisition of knowledge. Psychol. Rev. 69, 355–365.
Glewwe, P., 2002. Schools and Skills in Developing Countries: Education Policies and Socioeconomic Outcomes. J. Econ. Lit.
Glewwe, P., Maiga, E., Zheng, H., 2014. The Contribution of Education to Economic Growth: A Review of the Evidence, with Special Attention and an Application to Sub-Saharan Africa. World Dev. 59, 379–393.
Greaney, V., Kellaghan, T., 2008. Assessing national achievement levels in education. World Bank Publications.
Gustafsson, M., 2005. The Relationship Between Schooling Input and Output in South Africa - Methodologies and Policy Recommendations Based on SACMEQ 2000. In: Southern and Eastern African Consortium for Monitoring Educational Quality. SACMEQ.
Gustafsson, M., 2013. Some points on the 2013 NEEDU report (unpublished report). Stellenbosch.
Hancioglu, A., Arnold, F., 2013. Measuring coverage in MNCH: tracking progress in health for women and children using DHS and MICS household surveys. PLoS Med. 10, e1001391.
Hanushek, E., Kimko, D., 2000. Schooling, labor force quality, and the growth of nations. Am. Econ. Rev. 90 (5) 1184-1208

181
Hanushek, E., Wößmann, L., 2008. The role of cognitive skills in economic development. J. Econ. Lit. 46, 607–668.
Hanushek, E., 2003. The Failure of Input‐based Schooling Policies. Econ. Journ. 113 (Feb).
Hanushek, E., Wößmann, L., 2011. Sample selectivity and the validity of international student achievement tests in economic research. Econ. Lett. 110, 79–82.
Heckman, J.J., 2000. Policies to foster human capital. Res. Econ. 54, 3–56.
Heneveld, W., Craig, H., 1996. Schools Count: World Bank Project Designs and the Quality of Primary Education in Sub-Saharan Africa, Volumes 23-303. World Bank Publications.
Heugh, K., 1993. Not so Straight for English. Bua! 8.2.
Heugh, K., 2005a. The merits of mother tongue education. SA Reconcil. Barom. 3, 8–9.
Heugh, K., 2005b. Mother tongue education is best. HSRC Rev. 3, 6–7.
Heugh, K., 2012. The Case against Bilingual and Multilingual Education in South Africa ( No. 6), PRAESA Occasional Paper. Cape Town.
Heyneman, S.P., 2003. Education, Social Cohesion, and the Future Role of International Organizations. Peabody J. Educ.
Hill, C., Bloom, H., Black, A., Lipsey, M., 2007. Empirical benchmarks for interpretting effect sizes in research ( No. 7), MDRC Working Papers on Research Methodology. New York.
Hoadley, U., 2012. What do we know about teaching and learning in South African primary schools? 16, 37–41.
Hoogeveen, J., Rossi, M., 2013. Enrolment and Grade Attainment following the Introduction of Free Primary Education in Tanzania. J. Afr. Econ. 22, 375–393.
Howie, S., Hughes, C., 1998. Mathematics and sceince literacy of final-year school students in South Africa: a report of South African students in the Third International Mathematics and Science Study (TIMSS). Human Sciences Research Council, Pretoria.
Howie, S., Venter, E., Van Staden, S., Zimmerman, S., Long, C., Scherman, V., 2007. PIRLS 2006 Summary Report: South African children’s reading achievement. Pretoria.
Hungi, N., Makuwa, D., Ross, K., Saito, M., Dolata, S., Van Capelle, F., 2010. SACMEQ III Project Results: Pupil Achievement Levels in Reading and Mathematics. Paris.
Hungi, N., Thuku, F.W., 2010. Variations in Reading Achievement Across 14 Southern African School Systems: Which Factors Matter? Int. Rev. Educ. 56, 63–101.
Ianco-Worrall, A., 1972. Bilingualism and cognitive development. Child Dev.

182
ICF International, 2012. Demographic and Health Survey: Sampling and Household Listing Manual. ICF International, Calverton, Maryland.
Jha, J., Kelleher, F., 2006. Boys’ Underachievement in Education: An Exploration in Selected Commonwealth Countries. Commonwealth Secretariat and the Commonwealth of Learning.
Jordan, N.C., Kaplan, D., Locuniak, M.N., Ramineni, C., 2007. Predicting First-Grade Math Achievement from Developmental Number Sense Trajectories. Learn. Disabil. Res. Pract. 22, 36–46.
Jorgenson, D.W., Griliches, Z. 1967. The explanation of productivity change. Rev. Econ. Stuf. 34 (3), 249-282.
Kadzamira, E., Rose, P., 2003. Can free primary education meet the needs of the poor?: evidence from Malawi. Int. J. Educ. Dev. 23, 501–516.
Knudsen, E.I., Heckman, J.J., Cameron, J.L., Shonkoff, J.P., 2006. Economic, neurobiological, and behavioral perspectives on building America’s future workforce. Proc. Natl. Acad. Sci. U. S. A. 103, 10155–10162.
Kramsch, C., 1993. Context and culture in language teaching. Oxford University Press, Oxford.
Lambin, R., 1995. What can Planners Expect from International Quantitative Studies ? Reflections Educ. Achiev. Pap. Honor T. Nev. Postlethwaite 169–182.
LANGTAG, 1996. Towards a National Language Plan for South africa. Pretoria.
Lee, V.E., Zuze, T.L., Ross, K.N., 2005. School effectiveness in 14 sub-Saharan African countries: Links with 6th Graders’ reading achievement. Stud. Educ. Eval. 31, 207–246.
Leibbrandt, M., Wegner, E., Finn, A., 2011. The policies for reducing income inequality and poverty in South Africa ( No. 64), SALDRU Working Papers. Cape Town.
Lewin, K.M., 2007. Transitions and Equity. Improving Access , Equity and Transitions in Education : Creating a Research Agenda ( No. 1), CREATE, CREATE Monograph.
Lewin, K.M., 2009. Access to education in sub‐Saharan Africa: patterns, problems and
possibilities. Comp. Educ. 45, 151–174.
Lewin, K.M., Little, A.W., 2011. Access to education revisited: Equity, drop out and transitions to secondary school in South Asia and Sub-Saharan Africa. Int. J. Educ. Dev. 31, 333–337.
Lewis, M., Lockheed, M., 2006. Inexcusable absence: Why 60 million girls still aren’t in school and what to do about it. Cent. Glob. Dev.
Lewis, M., Lockheed, M., 2007. Exclusion, gender and education: Case studies from the developing world. Cent. Glob. Dev.
Macdonald, C., 1990. Crossing the threshold into standard three. Main report of the Threshold Project. Human Sciences Research Council, Pretoria.

183
Macdonald, C., Burroughs, E., 1991. Eager to talk and learn and think: Bilingual primary education in South Africa. Maskew Miller Longman, Cape Town.
Majgaard, K., Mingat, A., 2012. Education in Sub-Saharan Africa: a comparative analysis. World Bank Publications.
Malherbe, E., 1946. The Bilingual School. Longman, London.
Marshall, A., 1890. The Principles of Economics. Macmillan.
McKenzie, D., 2015. Notes from the AEAs: Present bias 20 years on + Should we give up on S.D.s for Effect Size? Development Impact. World Bank.
Mesthrie, R., 2002. South Africa: a sociolinguistic overview. In: Mesthrie, R. (Ed.), Language in South Africa. Cambridge University Press, Cambridge.
Mincer, J., 1958. Investment in Human Capital and Personal Income Distribution. J. Polit. Econ.
Mingat, A., 1998. The strategy used by high-performing Asian economies in education: Some lessons for developing countries. World Dev. 26, 695–715.
Moloi, M., Chetty, M., 2011. The SACMEQ III Project in South Africa: A Study of the Conditions of Schooling and the Quality of Education. Pretoria.
Moloi, M., Strauss, J., 2005. The SACMEQ II Project in South Africa: A study into the confitions of schooling and the quality of education. Harare.
Motala, S., 2009. Preface to: The impact of language on educational access in South Africa ( No. 2), Research Monograph. Johannesburg.
Motshekga, A. 2013 Statement on the Release of the Annual National Assessment Results for 2013. Delivered at Mahlahle Primary School, Atteridgeville.
Mullis, I., Martin, M.O., Foy, P., Arora, A., 2012. TIMSS 2011 International Results in Mathematics. TIMESS & PIRLS International Study Center and IEA, Chestnut Hill, USA.
Mullis, I.V.S., Martin, M.O., Kennedy, A.M., Trong, K.L., Sainsbury, M., 2011. PIRLS 2011 Assessment Framework. TIMESS & PIRLS International Study Center and IE, Boston.
Muralidharan, K., Zieleniak, Y., 2013. Measuring learning trajectories in developing countries. In: Young Lives Conference Oxford. Oxford.
Murimba, S., 1991. SACMEQ: MISSION , APPROACH AND PROJECTS. Prospects XXXV.
Murimba, S., 2005. The Southern and Eastern African Consortium for Monitoring Educational Quality (SACMEQ): Mission, approach and projects. Prospects XXXV.
Murray, S., 2002. Language issues in South African education: An overview. In: Mesthrie, R. (Ed.), Language in South Africa. Cambridge University Press, Cambridge.

184
Ndlovu, S., 2004. The Sowetho Uprising. In: The Road to Democracy in South Africa, Vol 2, 1970-1980. UNISA Press.
NEEDU, 2013. NEEDU National Report 2012. Pretoria.
Ní Ríordáin, M., O’Donoghue, J., 2008. The relationship between performance on mathematical word problems and language proficiency for students learning through the medium of Irish. Educ. Stud. Math. 71, 43–64.
Nishimura, M., Yamano, T., 2013. Emerging Private Education in Africa: Determinants of School Choice in Rural Kenya. World Dev. 43, 266–275.
NPC, 2012. National Development Plan 2030: Our future - make it work. Pretoria.
Nussbaum, M.C., 2006. Education and Democratic Citizenship: Capabilities and Quality Education. J. Hum. Dev.
Posel, D., Casale, D., 2011. Language proficiency and language policy in South Africa: Findings from new data. Int. J. Educ. Dev. 31, 443–451.
Posner, G.J., Strike, K.A., 1976. A Categorization Scheme for Principles of Sequencing Content. Rev. Educ. Res. 46, 665–690.
Postlethwaite, T.N., Kellaghan, T., 2008. National assessments of educational achievement. UNESCO, Paris.
Prinsloo, C., Reddy, V., 2012. Educator leave in the South African public schooling system. Pretoria.
Pritchett, L., 2004. Towards a new consensus for addressing the global challenge of the lack of education. Cent. Glob. Dev. Work. Pap.
Pritchett, L., 2013. The Rebirth of Education: Schooling Aint Learning. Center for Global Development, Washington.
Pritchett, L., Beatty, A., 2012. The Negative Consequences of Overambitious Curricula in Developing Countries. Harvard Kennedy Sch. Work. Pap. RWP12-035.
Probyn, M., 2001. Teachers Voices: Teachers Reflections on Learning and Teaching through the Medium of English as an Additional Language in South Africa. Int. J. Biling. Educ. Biling. 4, 249–266.
Reddy, V., 2006. Mathematics and Science Achievement in South African Schools in TIMSS 2003. Human Sciences Research Council, Cape Town.
Reddy, V., Prinsloo, C., Visser, M., Arends, F., Winnaar, L., Rogers, S., 2012. Highlights from TIMSS 2011: The South African perspective. Pretoria.
Reeves, C., Carnoy, M., Addy, N., 2013a. Comparing opportunity to learn and student achievement gains in southern African primary schools: A new approach. Int. J. Educ. Dev. 33, 426–435.

185
Reeves, C., Carnoy, M., Addy, N., 2013b. Comparing opportunity to learn and student achievement gains in southern African primary schools : A new approach. Int. J. Educ. Dev.
Reeves, C., McAucliffe, S., 2012. Is curricular incoherence slowing down the pace of school mathematics in South Africa? A methodology for assessing coherence in the implemented curriculum and some implications for teacher education. J. Educ. 61, 9–36.
Reeves, C., Muller, J., 2005. Picking up the pace : variation in the structure and organization of learning school mathematics. J. Educ. 37, 1–28.
Ross, K.N., Dolata, S., Ikeda, M., Zuze, L., Murimba, S., 2005. The Conduct of the SACMEQ II Project in Kenya. Harare.
Ruthstein, S., Jonson, K., 2004. The DHS wealth index (DHS Comparative Reports No. 6), Demographic and Health Survey. ORC Macro, Calverton, Maryland.
Sahn, D.E., Stifel, D.C., 2003. Urban-Rural Inequality in Living Standards in Africa. J. African Econ. 12, 564–597.
Salmi, J., 2000. Violence, democracy and education: An analytical framework. LCSHD Pap. Ser. Dep. Hum. … 1–21.
Scandura, J.M., Wells, J.N., 1967. Advance organizers in learning abstract mathematics. Am. Educ. Res. J. 4, 295–301.
Schleicher, A., 2009. Securing quality and equity in education: Lessons from PISA. Prospects 39, 251–263.
Schleicher, A., 2010. PISA 2009: Evaluating systems to improve education. Asia Soc.
Schollar, E., 2008. Final Report: The Primary Mathematics Research Project 2004-2007: Towards evidence-based educational development in South Africa. Eric Schollar and Associates, Johannesburg.
Schultz, T.W., 1961. Investment in Human Capital. Am. Econ. Rev. 51, 1–17.
Sen, A., 1999. Development as Freedom. Oxford University Press.
Setati, M., Adler, J., 2000. Between languages and discourses: Language practices in primary multilingual mathematics classrooms in South Africa. Educ. Stud. Math. 43, 243–269.
Setati, M., Adler, J., Reed, Y., Bapoo, A., 2002. Incomplete Journeys: Code-switching and Other Language Practices in Mathematics, Science and English Language Classrooms in South Africa. Lang. Educ. 16, 128–149.
Shabalala, J., 2005. The SACMEQ II Project in Swaziland: A Study of the Conditions of Schooling and the Quality of Education. Harara.
Shepherd, D.L., 2011. Constraints to school effectiveness: what prevents poor schools from delivering results ? ( No. 05/11), Stellenbosch Economic Working Papers. Stellenbosch.

186
Shonkoff, J.P., Richter, L., van der Gaag, J., Bhutta, Z.A., 2012. An integrated scientific framework for child survival and early childhood development. Pediatrics 129, e460–72.
Singh, A., 2015. How standard deviation? A cautionary note on using SDs to compare across impact evaluations in education. Development Impact. World Bank.
Skutnabb-Kangas, T., 1988. Minority education: from shame to struggle. Multilingual Matters.
Skutnabb-Kangas, T., 2000. Linguistic Genocide in Education--or Worldwide Diversity and Human Rights? Routledge.
Smith, A., 1776. The Wealth of Nations. Digireads.com.
Solow, R.M., 1957. Technical change and the aggregate production function. Rev. Econ. Stat. 39 (3), 312-320.
Somerset, A., 2007. A Preliminary Note on Kenya Primary School Enrolment Trends over Four Decades.
Soudien, C., 2004. “Constituting the class”: an analysis of the process of “integration” in South Afrcan schools. In: Chisholm, L. (Ed.), Changing Class: Education and Social Change in Post-Apartheid South Africa. HSRC Press, Cape Town.
South Africa, 1996. South African Schools Act. South Africa.
Spaull, N., 2011. Primary School Performance in Botswana, Mozambique, Namibia and South Africa ( No. 8), SACMEQ Working Papers. Paris.
Spaull, N., 2013. Poverty & privilege: Primary school inequality in South Africa. Int. J. Educ. Dev. 33, 436–447.
Spaull, N., Taylor, S., 2012. Effective enrolment–Creating a composite measure of educational access and educational quality to accurately describe education system performance in sub-Saharan Africa ( No. 21/12), Stellenbosch Economic Working Papers. Stellenbosch.
Spaull, N., Taylor, S., 2014. Combining educational access and educational quality into a single statistic ( No. PB 14/31), Jobs Knowledge Platform. Cape Town.
StatsSA, 2012. Census 2011 in Brief. Statistics South Africa. Pretoria.
Stubbe, T.C., 2011. How do different versions of a test instrument function in a single language? A DIF analysis of the PIRLS 2006 German assessments. Educ. Res. Eval. 17, 465–481.
Szklo, M., Nieto, F.J., 2012. Epidemiology: Beyond the Basics. Jones & Bartlett Learning.
Taylor, N., 2011. Priorities for Addressing South Africa’s Education and Training Crisis: A Review commissioned by the National Planning Commission. Johannesburg.
Taylor, N., Muller, J., Vinjevold, P., 2003. Getting Schools Working. Pearson, Cape Town.

187
Taylor, N., Reddi, B., 2013. Writing and learning mathematics. In: Creating Effective Schools. Pearson, Cape Town, p. 281.
Taylor, N., Taylor, S., 2013. Teacher knowledge and professional habitus. In: Taylor, N., Van der berg, S., Mabogoane, T. (Eds.), Creating Effective Schools. Pearson, Cape Town.
Taylor, N., Van der berg, S., Mabogoane, T., 2013. What makes schools effective? Report of the National School Effectiveness Study. Pearson, Cape Town.
Taylor, N., Vinjevold, P., 1999. Getting Learning Right: Report of the President’s Education Initiative research Project. Joint Education Trust, Johannesburg.
Taylor, S., 2011. Uncovering indicators of effective school management in South Africa using the National School Effectiveness Study ( No. 10), Stellenbosch Economic Working Papers.
Taylor, S., 2012. A Note on Matric Result Trends (unpublished report). Stellenbosch.
Taylor, S., Coetzee, M., 2013. Estimating the impact of language instruction in South African primary schools: a fixed effects approach ( No. 21/13), Stellenbosch Economic Working Papers. Stellenbosch.
Taylor, S., Taylor, N., 2013. Learner performance in the NSES. In: Creating Effective Schools. Pearson, Cape Town.
Taylor, S., Yu, D., 2009. The importance of socioeconomic status in determining educational achievement in South Africa ( No. 1), Stellenbosch Economic Working Papers. Stellenbosch.
Timæus, I.M., Simelane, S., Letsoalo, T., 2013. Poverty, Race, and Children’s Progress at School in South Africa. J. Dev. Stud. 49, 270–284.
Tollefson, J.W., Tsui, A.B.M., 2014. Language Diversity and Language Policy in Educational Access and Equity. Rev. Res. Educ. 38, 189–214.
UNESCO, 2005. Education For All Global Monitoring Report 2005: The Quality Imperative. Paris.
UNESCO, 2011. EFA Global Monitoring Report 2011: Armed conflict and education. UNESCO Publishing, Paris.
UNESCO Institute for Statistics, 2010. Measuring educational participation: Analysis of data quality and methodology based on ten studies (Technical Paper 4).
UNESCO/CUE, 2013. Learning Metrics Task Froce: Recommendations for Universal Learning. Washington.
United Nations, 2012. Medium Variant Population Estimates [WWW Document]. URL http://esa.un.org/unpd/wpp/unpp/panel_population.htm (accessed 4.5.12).
United Nations, 2013. A New Global Partnership: Eradicate poverty and transform economies through sustainable development. New York.

188
Van der Berg, S., 2007. Apartheid’s enduring legacy: Inequalities in education. J. Afr. Econ.
Van der Berg, S., 2008. Studies in Educational Evaluation How effective are poor schools ? Poverty and educational outcomes 34, 145–154.
Van der Berg, S., Burger, C., Burger, R., De Vos, M., Du Rand, G., Gustafsson, M., Moses, E., Shepherd, D., Spaull, N., Taylor, S., Van Broekhuizen, H., Von Fintel, D., 2011. Low quality education as a poverty trap. Stellenbosch.
Venkat, H., Naidoo, D., 2012. Analyzing coherence for conceptual learning in a Grade 2 numeracy lesson. Educ. as Chang. 16, 21–33.
Venkat, H., Spaull, N., 2014. What do we know about primary teachers’ mathematical content knowledge in South Africa? An analysis of SACMEQ 2007 ( No. 13), Stellenbosch Working Paper Series. Stellenbosch.
Vorster, C., Mayet, A., Taylor, S., 2013. The language of teaching and learning in South African schools. In: Creating Effective Schools. Pearson, Cape Town.
Washington State Institute for Public Policy, 2011. The Economic Value of Learning Time in K-12 Schools: A Summary of Research Evidence and an Economic Analysis. Washington, DC.
Weber, E., 1976. Peasants into Frenchmen: The Modernization of Rural France, 1870-1914. Stanford University Press, Palo Alto.
Welch, T., 2011. Review of Foundation Phase Literacy Resource Packages for evaluation of Gauteng Primary Literacy Strategy. Johannesburg.
Wiley, T.G., Garcia, D.R., Danzig, A.B., Stigler, M.L., 2014. Language Policy, Politics, and Diversity in Education. Rev. Res. Educ. 38, vii–xxiii.
World Bank, 2009. Mozambique SABER Country Report. World Bank Publications, Washington, DC.
Yamauchi, F., 2011. School Quality, Clustering and Government Subsidy in Post-apartheid South Africa. Econ. Educ. Rev. 30, 146–156.
Zuze, T.L., Leibbrandt, M., 2011. Free education and social inequality in Ugandan primary schools: A step backward or a step in the right direction? Int. J. Educ. Dev. 31, 169–178.
Data sets used:
Department of Basic Education. 2007. Systemic Evaluation Grade 3. Data manager: Meshack Moloi. Pretoria
Department of Basic Education. 2012. Annual National Assessment (ANA) 2012. Data manager: Meshack Moloi. Pretoria
ICF International. 2001-2011. Demographic and Health Surveys (various countries) [2001-2011]. Calverton, Maryland: ICF International, 2012

189
International Institute for Educational Planning (IIEP). 2007. Southern and Eastern African Consortium for Monitoring Educaitonal Quality (SACMEQ). Data manager: Toziba Masalila. Paris
JET Education Services. 2010. National School Effectiveness Study (NSES). Data manager: Nick Taylor. Johannesburg.
TIMSS and PIRLS Study Center. 2011. Trends in International Mathematics and Science Study (TIMSS) 2011. Boston

190
APPENDIX A: CHAPTER 2
Achievement scores for various assessments (NSES using no-language items only) – constant standard deviation for a year of learning by grade
NSES 2007/8/9 SACMEQ 2007 TIMSS 2011 Grade 3 SE Grade 4 SE Grade 5 SE Grade 6 SE Gr9 SE
Student wealth quintiles
Quintile 1 13.74 0.039 27.25 0.039 37.44 0.044 452.80 4.14 316 5.7
Quintile 2 24.56 0.040 27.56 0.039 40.06 0.044 463.80 3.15 318 3.6
Quintile 3 23.49 0.040 29.09 0.041 41.10 0.047 478.00 3.42 336 4
Quintile 4 25.93 0.046 32.30 0.045 44.39 0.052 505.70 5.14 360 5.6
Quintile 5 43.30 0.064 48.90 0.066 59.11 0.062 583.10 6.56 438 9.7
Province averages ECA 26.34 0.047 29.83 0.046 42.55 0.052 468.77 10.3 316
FST 28.26 0.072 31.78 0.069 42.48 0.068 491.57 10.1 359
KZN 26.31 0.047 36.72 0.045 45.35 0.048 485.23 8.22 337
LMP 14.60 0.040 24.31 0.045 36.27 0.053 446.72 5.3 322
MPU 26.23 0.074 31.76 0.071 45.08 0.074 476.12 8.2 344
NCA 26.46 0.142 35.88 0.134 44.82 0.158 498.72 10.8 366
NWP 27.71 0.077 30.36 0.076 45.54 0.086 503.00 13.1 350
WCA 36.74 0.089 46.85 0.081 59.85 0.079 565.69 12 404
Province averages excluding Q5
ECA 23.83 0.046 27.65 0.043 40.30 0.050 465.14 9.8
FST 21.82 0.061 26.92 0.062 38.41 0.063 471.74 6.4
KZN 23.66 0.044 33.52 0.039 42.23 0.044 465.88 6.4
LMP 14.17 0.041 24.06 0.047 35.39 0.055 441.45 3.3
MPU 22.29 0.073 28.55 0.069 41.33 0.076 460.89 4.1
NCA 20.83 0.128 32.68 0.132 39.72 0.157 473.00 5
NWP 22.71 0.070 25.76 0.063 41.09 0.086 462.11 4.8
WCA 24.49 0.107 39.02 0.105 54.31 0.112 518.53 8.1
National avg 25.85 0.023 32.74 0.022 44.34 0.024 494.84 3.8 352 2.5
National SD 22.04 20.87 21.46 98.68 86

191
Number of years behind relative to Quintile 5 (benchmark) – constant standard deviation for a year of learning
NSES 2007/8/9
SACMEQ
TIMSS
Grade 3 SE Grade 4 SE Grade 5 SE Grade 6 SE Gr9 SE
Student wealth quintiles
Quintile 1 4.7 0.011 3.4 0.012 3.4 0.012 4.4 0.262 4.7 0.436
Quintile 2 3.0 0.011 3.4 0.012 3.0 0.012 4.0 0.246 4.7 0.401
Quintile 3 3.1 0.011 3.1 0.012 2.9 0.012 3.6 0.250 4.0 0.407
Quintile 4 2.8 0.012 2.6 0.013 2.3 0.013 2.6 0.282 3.0 0.434
Quintile 5 0.0 0.014 0.0 0.015 0.0 0.014 0.0 0.313 0.0 0.532
Province averages
ECA 2.7 0.012 3.0 0.013 2.6 0.013 3.9 0.412 4.7
FST 2.4 0.015 2.7 0.015 2.6 0.014 3.1 0.407 3.1
KZN 2.7 0.012 1.9 0.013 2.2 0.012 3.3 0.355 3.9
LMP 4.6 0.011 3.9 0.013 3.6 0.013 4.6 0.285 4.5
MPU 2.7 0.015 2.7 0.015 2.2 0.015 3.6 0.355 3.6
NCA 2.7 0.024 2.1 0.024 2.3 0.026 2.9 0.427 2.8
NWP 2.5 0.015 2.9 0.016 2.2 0.017 2.7 0.495 3.4
WCA 1.0 0.017 0.3 0.017 -0.1 0.016 0.6 0.462 1.3
Province averages
excluding Q5
ECA 3.1 0.012 3.4 0.013 3.0 0.012 4.0 0.398
FST 3.4 0.013 3.5 0.014 3.3 0.014 3.8 0.310
KZN 3.1 0.012 2.4 0.012 2.7 0.012 4.0 0.310
LMP 4.6 0.012 3.9 0.013 3.8 0.013 4.8 0.248
MPU 3.3 0.015 3.2 0.015 2.8 0.015 4.1 0.261
NCA 3.6 0.022 2.6 0.024 3.1 0.026 3.7 0.279
NWP 3.3 0.014 3.7 0.015 2.9 0.017 4.1 0.275
WCA 3.0 0.019 1.6 0.020 0.8 0.020 2.2 0.352
National avg 2.8 0.010 2.6 0.011 2.3 0.010 3.0 0.256 3.3

192
Calculating effective grade by sub-group – constant standard deviation for a year of learning
(NSES 2007/8/9) (SACMEQ 2007) Projections
(TIMSS 2011) Projections
Gr3 Gr4 Gr5 Gr6 Gr7 Gr8 Gr9 Gr10 Gr11 Gr12
Student wealth
quintiles
Quintile 1 -1.69 0.56 1.56 1.60 4.27
Quintile 2 0.02 0.61 1.98 1.97
4.35
Quintile 3 -0.14 0.86 2.14 2.45
5.05
Quintile 4 0.24 1.36 2.66 3.39
5.98
Quintile 5 3.00 4.00 5.00 6.00
9.00
Q1-4 Trajectory -0.39 -0.39 -0.39 -0.39 -0.39 -0.39 4.91 4.91 4.91 4.91
Q5 Trajectory 3.00 4.00 5.00 6.00 7.00 8.00 9.00 10.00 11.00 12.00
Province averages
ECA 0.31 0.97 2.37 2.14 4.27
FST 0.61 1.28 2.36 2.91
5.94
KZN 0.30 2.07 2.81 2.69
5.09
LMP -1.55 0.10 1.37 1.39
4.50
MPU 0.29 1.28 2.77 2.39
5.36
NCA 0.33 1.93 2.73 3.15
6.21
NWP 0.52 1.06 2.85 3.29
5.59
WCA 1.96 3.67 5.12 5.41 7.68
Province averages
excluding Q5
ECA -0.09 0.63 2.01 2.02
FST -0.41 0.51 1.71 2.24
KZN -0.12 1.56 2.32 2.04
LMP -1.62 0.06 1.23 1.22
MPU -0.33 0.77 2.18 1.87
NCA -0.57 1.43 1.92 2.28
NWP -0.27 0.33 2.14 1.91
WCA 0.01 2.43 4.24 3.82

193
APPENDIX B: CHAPTER 3
Table B1: Grades 1 to 3 learners by home language majority within that school (Annual
Survey of Schools 2011). Source: Gustafsson70 (2013)
% of learners using the largest home language in grades 1 to 3
EC FS GP KN MP NC NW WC SA
100% 79 10 5 76 24 33 21 12 42
≥95%, <100% 4 26 6 7 10 29 29 34 13
≥90%, <95% 2 13 6 3 7 7 12 9 6
≥75%, <90% 5 24 13 7 17 14 15 14 11
≥50%, <75% 8 22 29 6 24 14 14 26 16
>0%, <50% 2 6 41 1 18 3 8 5 12
Total 100 100 100 100 100 100 100 100 100
Table B2: Provincial distribution of NSES sample and NSES-Systemic Evaluation matched
sample
NSES Sample (%) NSES-Systemic
Evaluation matched sample (%)
Western Cape 9,66 10,11
Eastern Cape 17,15 16,87
Northern Cape 6,91 5,29
Free State 8,7 8,41
KwaZulu-Natal 21,25 23,6
North West 7,57 9,23
Mpumalanga 14,98 12,9
Limpopo 13,78 13,58
Gauteng - -
Total (%) 100 100
Total (students) 13033 3402
70
I am grateful to Martin Gustafsson who kindly shared with me his own language research on the Annual Survey of Schools.

194
APPENDIX C: CHAPTER 4
SACMEQ Reading Competency Levels
Description of levels
Range on 500 point scale
Skills
Level 1 Pre-reading < 373
Matches words and pictures involving concrete concepts and everyday objects. Follows short simple written instructions.
Level 2 Emergent reading 373 414
Matches words and pictures involving prepositions and abstract concepts; uses cuing systems (by sounding out, using simple sentence structure, and familiar words) to interpret phrases by reading on.
Level 3 Basic reading 414 457
Interprets meaning (by matching words and phrases, completing a sentence, or matching adjacent words) in a short and simple text by reading on or reading back.
Level 4 Reading for meaning
457 509
Reads on or reads back in order to link and interpret information located in various parts of the text.
Level 5 Interpretive reading 509 563
Reads on and reads back in order to combine and interpret information from various parts of the text in association with external information (based on recalled factual knowledge) that “completes” and contextualizes meaning.
Level 6 Inferential reading 563 618
Reads on and reads back through longer texts (narrative, document or expository) in order to combine information from various parts of the text so as to infer the writer’s purpose
Level 7 Analytical reading 618 703
Locates information in longer texts (narrative, document or expository) by reading on and reading back in order to combine information from various parts of the text so as to infer the writer’s personal beliefs (value systems, prejudices, and/or biases).
Level 8 Critical reading
703+
Locates information in a longer texts (narrative, document or expository) by reading on and reading back in order to combine information from various parts of the text so as to infer and evaluate what the writer has assumed about both the topic and the characteristics of the reader – such as age, knowledge, and personal beliefs (value systems, prejudices, and/or biases).
Source: (Hungi et al., 2010)

195
SACMEQ Mathematics Competency Levels
Description of levels
Range on 500 point
scale
Skills
Level 1 Pre-numeracy < 364
Applies single step addition or subtraction operations. Recognizes simple shapes. Matches numbers and pictures. Counts in whole numbers.
Level 2 Emergent numeracy 364 462
Applies a two-step addition or subtraction operation involving carrying, checking (through very basic estimation), or conversion of pictures to numbers. Estimates the length of familiar objects. Recognizes common two-dimensional shapes.
Level 3 Basic numeracy
462 532
Translates verbal information presented in a sentence, simple graph or table using one arithmetic operation in several repeated steps. Translates graphical information into fractions. Interprets place value of whole numbers up to thousands. Interprets simple common everyday units of measurement.
Level 4 Beginning numeracy
532 587
Translates verbal or graphic information into simple arithmetic problems. Uses multiple different arithmetic operations (in the correct order) on whole numbers, fractions, and/or decimals.
Level 5 Competent numeracy
587 644
Translates verbal, graphic, or tabular information into an arithmetic form in order to solve a given problem. Solves multiple-operation problems (using the correct order of arithmetic operations) involving everyday units of measurement and/or whole and mixed numbers. Converts basic measurement units from one level of measurement to another (for example, metres to centimetres).
Level 6 Mathematically skilled
644 720
Solves multiple-operation problems (using the correct order of arithmetic operations) involving fractions, ratios, and decimals. Translates verbal and graphic representation information into symbolic, algebraic, and equation form in order to solve a given mathematical problem. Checks and estimates answers using external knowledge (not provided within the problem).
Level 7 Concrete problem solving
720 806
Extracts and converts (for example, with respect to measurement units) information from tables, charts, visual and symbolic presentations in order to identify, and then solves multi-step problems.
Level 8 Abstract problem solving >806
Identifies the nature of an unstated mathematical problem embedded within verbal or graphic information, and then translate this into symbolic, algebraic, or equation form in order to solve the problem.
Source: (Hungi et al., 2010)

196
APPENDIX D1: CHAPTER 5
Table A1
Calculating the population growth-adjusted ratios of functional literacy in 2007 to functional literacy in 2000
A B C D E F G H I J
Number of grade 6
children Flit in 2000
Number of grade 6
children Flit in 2007
Population of 10 -1 4
year-olds in 2000
Population of 10 -1 4
year-olds in 2005
Population of 10 -1 4
year-olds in 2010
Annual population growth rate (2005 - 2010)
Calculated estimate of
2007 population
Population Deflator (𝝉)
Deflated Number of
grade 6 children Flit
in 2007
Population growth adjusted ratio of
Flit2007 : Flit2000
Kenya 549857 685722 4283000 4387000 4821000 0.0190 4555703 0.064 642061 1.17
Lesotho 27425 35554 256000 265000 270000 0.0037 266989 0.043 34028 1.24
Malawi 88395 122846 1400000 1688000 1914000 0.0254 1775008 0.268 89940 1.02
Mozambique 114805 250581 2218000 2523000 2918000 0.0295 2674142 0.206 199048 1.73
Namibia 27360 41674 230000 258000 268000 0.0076 261954 0.139 35884 1.31
South Africa 622080 675350 5021000 4979000 4963000 -0.0006 4972594 -0.010 681861 1.10
Swaziland 24593 27639 158000 156000 149000 -0.0091 153161 -0.031 28486 1.16
Tanzania 450163 931624 4345000 4831000 5467000 0.0250 5076003 0.168 774888 1.72
Uganda 246078 487165 3181000 3752000 4392000 0.0320 3995974 0.256 362353 1.47
Zambia 85465 135219 1283000 1436000 1688000 0.0329 1531940 0.194 108982 1.28
Source SACMEQ 2 SACMEQ 3 UN UN UN - - - - -
Formula - - - - - 𝐹𝑖 = (𝐸𝑖
𝐷𝑖)0.2
− 1 𝐺𝑖 = 𝐷𝑖(1 + 𝐹𝑖)2
𝐻𝑖 =𝐺𝑖 − 𝐶𝑖
𝐶𝑖
𝐼𝑖 = 𝐵𝑖 − 𝐵𝑖 . 𝐻𝑖 𝐽𝑖 =
𝐼𝑖𝐴𝑖
=𝜏 ∑𝐿𝐼𝑇𝑖,𝑡+1
∑𝐿𝐼𝑇𝑖,𝑡
Notes: The source of population growth rates was the United Nations Medium Variant Population Estimates (United Nations, 2012).. The letters in the formulas refer to the columns. ‘Flit’ stands for functionally literate.

197
Table A2
Calculating the population growth-adjusted ratios of functional numeracy in 2007 to functional numeracy in 2000
A B C D E F G H I J
Number of grade 6 children Fnum in
2000
Number of grade 6 children Fnum in
2007
Population of 10 -1 4
year-olds in 2000
Population of 10 -1 4
year-olds in 2005
Population of 10 -1 4
year-olds in 2010
Annual population growth rate (2005 - 2010)
Calculated estimate of
2007 population
Population Deflator (𝝉)
Deflated Number of
grade 6 children
Fnum in 2007
Population growth adjusted ratio of
Fnum2007 : Fnum2000
Kenya 520192 662040 4283000 4387000 4821000 0.0190 4555703 0.064 619887 1.19
Lesotho 13325 26259 256000 265000 270000 0.0037 266989 0.043 25131 1.89
Malawi 41495 77816 1400000 1688000 1914000 0.0254 1775008 0.268 56972 1.37
Mozambique
106735 215352 2218000 2523000 2918000 0.0295 2674142 0.206 171064 1.60
Namibia 11744 25242 230000 258000 268000 0.0076 261954 0.139 21735 1.85
South Africa 437075 556346 5021000 4979000 4963000 -0.0006 4972594 -0.010 561710 1.29
Swaziland 19565 25646 158000 156000 149000 -0.0091 153161 -0.031 26431 1.35
Tanzania 366154 837643 4345000 4831000 5467000 0.0250 5076003 0.168 696718 1.90
Uganda 203222 375081 3181000 3752000 4392000 0.0320 3995974 0.256 278985 1.37
Zambia 47870 79704 1283000 1436000 1688000 0.0329 1531940 0.194 64239 1.34
Source SACMEQ 2 SACMEQ 3 UN UN UN - - - - -
Formula - - - - - 𝐹𝑖 = (𝐸𝑖
𝐷𝑖)0.2
− 1 𝐺𝑖 = 𝐷𝑖(1 + 𝐹𝑖)2
𝐻𝑖 =𝐺𝑖 − 𝐶𝑖
𝐶𝑖
𝐼𝑖 = 𝐵𝑖 − 𝐵𝑖 . 𝐻𝑖 𝐽𝑖 =
𝐼𝑖𝐴𝑖
=𝜏 ∑𝑁𝑈𝑀𝑖,𝑡+1
∑𝑁𝑈𝑀𝑖,𝑡
Notes: The source of population growth rates was the United Nations Medium Variant Population Estimates (United Nations, 2012). The letters in the
formulas refer to the columns. ‘Fnum’ stands for functionally numerate.

198
APPENDIX D2: CHAPTER 5 CONT.
D2.1 ENROLMENT PROFILES BY AGE CIRCA 2003 FOR COUNTRIES AND SUB-GROUPS
For the graphs below the following labelling abbreviations are used:
National = ‘national’
Males = ‘boys’
Females = ‘girls’
Poorest 40% of students = ‘sespoor’
Middle 40% of students = ‘sesmid’
Richest 20% of students = ‘sesrich’
Poorest 40% of male students = ‘Msespoor’
Middle 40% of male students = ‘Msesmid’
Richest 20% of male students = ‘Msesrich’
Poorest 40% of female students = ‘Fsespoor’
Middle 40% of female students = ‘Fsesmid’
Richest 20% of female students = ‘Fsesrich’

199
Kenya 2003

200

201
Lesotho 2004

202

203
Malawi 2004

204

205
Mozambique 2003

206

207
Namibia 2000

208

209
South Africa 2004

210

211
Swaziland 2000

212

213
Tanzania 2004/5

214

215
Uganda 2006

216

217
Zambia 2001-02

218

219
Zimbabwe 2005-06

220
D2.2 ENROLMENT PROFILES BY AGE CIRCA 2010 FOR COUNTRIES AND SUB-GROUPS
Kenya 2008/9

221

222
Lesotho 2009

223

224
Malawi 2010

225

226
Mozambique 2011

227

228
Namibia 2006/7

229

230
South Africa GHS 2009

231

232
Swaziland 2010 (MICS)

233

234
Tanzania 2010

235

236
Uganda 2011

237

238
Zambia 2007

239

240
Zimbabwe 2010/11

241

242
APPENDIX D3: CHAPTER 5 GRAPH APPENDIX
D3.1 ACCESS TO LITERACY GRAPHS

243

244

245

246

247

248

249

250

251

252
[Zimbabwe did not participate in SACMEQ 2000]

253
D3.2 ACCESS TO NUMERACY

254

255

256

257

258

259

260

261

262

263
[Zimbabwe did not participate in SACMEQ 2000]

264
APPENDIX D4: CHAPTER 5 SUPPLEMENTARY TABLES
Never enrolled (19-23) from DHS (circa 2000)
National (%)
SE (%)
Boys (%)
SE (%)
Girls (%)
SE (%)
Poor40 (%)
SE (%)
Mid40 (%)
SE (%)
Rich20 (%)
SE (%)
Poor40M (%)
SE (%)
Poor40F (%)
SE (%)
Mid40M (%)
SE (%)
Mid40F (%)
SE (%)
Rich20M (%)
SE (%)
Rich20F (%)
SE (%)
Kenya 6,98 0,73 5,72 0,79 8,13 0,94 14,08 1,86 3,79 0,65 3,99 0,98 10,36 1,90 17,78 2,45 2,95 0,77 4,54 0,93 4,37 1,23 3,67 1,10
Lesotho 8,34 0,58 14,98 1,05 1,58 0,27 17,05 1,21 3,76 0,49 2,53 0,64 28,85 2,03 3,58 0,63 7,08 0,95 0,36 0,19 4,55 1,24 0,86 0,59
Malawi 10,01 0,61 7,09 0,69 12,41 0,83 15,58 1,12 9,02 0,82 3,27 0,68 10,79 1,23 19,18 1,55 7,30 1,04 10,33 1,07 2,17 0,86 4,43 0,99
Mozambique 30,62 1,20 19,34 1,12 39,88 1,54 49,44 1,93 29,70 1,72 11,55 1,35 29,53 2,59 62,25 2,10 20,47 1,80 37,18 2,38 9,85 1,23 13,37 2,14
Namibia 9,08 0,99 10,31 1,41 7,88 1,05 13,83 1,71 9,02 1,34 1,95 0,59 15,01 2,47 12,65 2,25 10,43 1,72 7,61 1,37 2,22 1,00 1,70 0,87
South Africa 1,39 0,15 1,62 0,24 1,17 0,18 2,12 0,29 0,97 0,19 0,52 0,30 2,71 0,48 1,60 0,33 1,09 0,31 0,85 0,20 0,21 0,15 0,85 0,60
Swaziland 8,52 0,88 9,43 1,32 7,72 1,09 12,85 1,43 7,16 1,48 4,89 1,61 13,38 2,02 12,30 1,99 7,20 2,01 7,11 1,93 7,38 3,61 3,26 1,22
Tanzania 20,16 1,53 15,83 1,51 23,63 1,86 36,68 2,73 15,18 1,55 5,05 1,17 27,35 2,56 44,05 3,29 13,06 2,08 16,97 1,82 4,20 1,30 5,70 1,55
Uganda 8,14 0,70 5,02 0,68 10,63 1,01 14,55 1,52 6,21 0,83 2,19 0,51 9,04 1,60 18,16 1,93 3,24 0,89 9,10 1,42 2,82 0,82 1,68 0,67
Zambia 9,33 0,73 5,96 0,76 12,41 1,02 17,17 1,47 7,10 0,85 1,25 0,44 12,56 1,83 20,81 1,84 4,19 0,74 9,94 1,41 0,23 0,23 2,32 0,86
Completed Gr6 (19-23) from DHS (circa 2000)
National (%)
SE (%)
Boys (%)
SE (%)
Girls (%)
SE (%)
Poor40 (%)
SE (%)
Mid40 (%)
SE (%)
Rich20 (%)
SE (%)
Poor40M (%)
SE (%)
Poor40F (%)
SE (%)
Mid40M (%)
SE (%)
Mid40F (%)
SE (%)
Rich20M (%)
SE (%)
Rich20F (%)
SE (%)
Kenya 81,26 1,07 80,70 1,31 81,77 1,31 68,30 2,44 84,24 1,38 90,45 1,25 69,23 2,89 67,37 3,10 83,48 1,88 84,93 1,76 89,54 1,67 91,22 1,43
Lesotho 71,26 1,01 59,01 1,48 83,75 1,00 52,61 1,56 77,58 1,27 90,70 1,13 36,26 2,08 71,28 1,84 67,55 1,87 87,88 1,34 86,00 2,03 94,59 1,25
Malawi 58,61 1,26 64,73 1,58 53,57 1,37 41,18 1,45 57,69 1,53 86,18 1,47 50,14 2,02 34,43 1,71 62,42 1,96 54,07 1,91 86,14 2,16 86,23 1,82
Mozambique 26,99 1,14 35,44 1,34 20,05 1,14 7,03 0,78 22,42 1,33 54,12 1,81 12,52 1,67 3,51 0,76 32,83 1,87 13,98 1,33 56,87 2,00 51,16 2,43
Namibia 82,45 1,43 80,03 1,87 84,83 1,51 71,38 2,60 84,72 1,84 94,77 1,07 68,49 2,88 74,29 3,15 81,76 2,30 87,70 2,02 94,99 1,78 94,57 1,77
South Africa 94,04 0,31 92,55 0,48 95,46 0,37 90,23 0,59 96,07 0,38 99,08 0,36 87,81 0,91 92,40 0,74 94,69 0,65 97,45 0,37 99,15 0,39 98,99 0,62
Swaziland 76,66 1,51 73,81 2,19 79,19 1,80 68,63 2,14 77,76 2,71 86,27 2,70 66,86 2,79 70,43 2,78 76,42 3,81 79,01 3,31 81,15 5,76 89,62 2,19
Tanzania 66,89 1,67 67,76 1,87 66,19 2,00 44,82 2,48 72,55 1,85 88,42 1,56 48,62 2,78 41,81 2,97 72,66 2,59 72,47 2,15 86,69 2,38 89,73 1,94
Uganda 63,36 1,29 70,67 1,72 57,52 1,55 47,62 1,91 62,64 2,00 84,68 1,34 61,05 2,84 38,84 2,14 70,31 2,67 55,16 2,45 82,18 2,21 86,71 1,49
Zambia 68,56 1,33 74,13 1,47 63,46 1,62 43,95 2,03 74,04 1,51 96,16 0,74 51,20 2,52 38,23 2,24 77,97 1,80 70,22 2,03 97,51 0,92 94,77 1,14

265
Proportion literate from SACMEQ 2000
National (%)
SE (%)
Boys (%)
SE (%)
Girls (%)
SE (%)
Poor40 (%)
SE (%)
Mid40 (%)
SE (%)
Rich20 (%)
SE (%)
Poor40M (%)
SE (%)
Poor40F (%)
SE (%)
Mid40M (%)
SE (%)
Mid40F (%)
SE (%)
Rich20M (%)
SE (%)
Rich20F (%)
SE (%)
Kenya 94,39 0,75 94,06 0,85 94,72 0,90 90,82 1,55 94,81 1,04 99,02 0,34 90,16 1,74 91,17 1,56 95,01 1,05 94,87 1,15 98,29 0,66 99,67 0,25
Lesotho 70,64 1,96 66,86 2,18 73,66 2,19 66,94 3,05 68,74 2,43 78,17 2,27 63,54 3,79 68,37 3,53 64,89 2,64 73,68 2,59 72,73 3,19 81,58 2,40
Malawi 55,51 2,18 57,50 2,37 53,33 2,58 47,79 3,19 51,04 2,70 68,84 2,70 53,96 4,18 42,57 3,65 51,48 2,79 48,94 3,40 70,31 3,34 67,39 3,18
Mozambique 93,84 0,63 93,94 0,65 93,70 0,99 91,35 1,47 93,14 0,83 95,07 0,82 90,66 1,80 91,29 2,76 93,78 0,85 92,25 1,59 95,57 0,95 94,82 1,06
Namibia 56,55 1,49 54,86 1,66 58,12 1,71 45,04 1,82 52,32 1,78 81,44 1,95 44,98 2,29 45,73 2,35 48,70 2,13 54,87 2,17 79,70 2,35 83,58 2,00
South Africa 68,99 2,11 66,24 2,19 71,48 2,38 54,52 2,73 69,37 2,43 94,59 1,23 53,12 3,24 54,72 3,15 65,19 2,78 74,34 2,76 91,37 2,10 97,13 0,91
Swaziland 98,01 0,47 97,49 0,71 98,50 0,38 97,63 0,55 97,78 0,77 99,04 0,38 97,16 1,03 97,91 0,65 97,54 0,72 98,41 0,61 97,95 0,90 99,57 0,30
Tanzania 91,70 0,90 92,47 1,10 90,98 1,09 82,06 2,10 93,97 0,80 97,72 0,64 82,33 2,82 81,93 2,11 95,99 0,99 92,37 1,28 97,94 0,84 97,16 0,99
Uganda 74,48 2,18 75,08 2,34 73,75 2,60 71,22 3,27 71,68 2,32 82,29 2,71 71,29 3,58 69,05 3,93 74,69 2,64 70,02 2,97 81,36 3,02 82,62 3,59
Zambia 52,33 2,22 53,41 2,51 51,26 2,40 35,27 3,06 48,85 2,25 73,28 2,73 39,97 3,98 31,53 3,88 50,15 2,42 47,41 2,66 72,67 3,26 72,90 3,38
Proportion numerate from SACMEQ 2000
National (%)
SE (%)
Boys (%)
SE (%)
Girls (%)
SE (%)
Poor40 (%)
SE (%)
Mid40 (%)
SE (%)
Rich20 (%)
SE (%)
Poor40M (%)
SE (%)
Poor40F (%)
SE (%)
Mid40M (%)
SE (%)
Mid40F (%)
SE (%)
Rich20M (%)
SE (%)
Rich20F (%)
SE (%)
Kenya 89,29 0,94 91,48 0,92 87,13 1,29 85,30 1,75 89,70 1,30 94,56 0,96 87,02 1,77 82,53 2,00 92,72 1,15 87,42 1,85 96,06 1,17 93,39 1,38
Lesotho 34,13 2,08 34,25 2,28 34,04 2,30 31,11 2,37 33,47 2,34 38,77 3,15 30,59 3,17 32,04 2,99 30,93 2,69 33,58 2,68 42,50 4,03 37,92 3,58
Malawi 25,77 1,52 30,24 1,97 20,87 1,56 22,71 2,63 22,41 1,84 33,17 2,52 30,15 3,49 16,00 2,74 25,80 2,35 15,98 2,13 36,77 3,25 30,84 2,91
Mozambique 87,01 0,90 89,12 0,89 83,84 1,42 84,76 2,01 85,36 1,35 88,98 1,03 85,61 1,98 76,24 4,77 88,80 1,26 81,14 2,25 91,06 1,26 86,40 1,36
Namibia 23,38 1,35 24,73 1,58 22,13 1,38 11,51 1,01 16,18 1,12 54,14 3,17 12,57 1,45 10,00 1,11 16,66 1,58 15,67 1,43 56,21 3,45 53,07 3,35
South Africa 47,74 2,63 47,14 2,45 48,29 3,20 30,51 2,41 45,48 2,77 82,87 3,10 32,88 3,16 28,65 2,97 43,29 3,07 48,05 3,81 79,03 3,71 84,85 2,85
Swaziland 77,97 1,38 81,26 1,27 74,88 2,24 76,58 1,58 76,24 1,95 83,29 2,20 78,08 1,94 73,29 2,60 80,05 1,71 73,83 2,82 88,75 1,99 79,23 2,99
Tanzania 74,53 1,54 79,64 1,71 69,85 1,93 60,57 2,32 76,79 1,77 84,95 1,84 67,50 3,04 54,50 2,94 83,11 1,93 71,08 2,50 87,42 2,23 82,10 2,70
Uganda 61,18 2,58 63,70 2,63 58,05 3,48 54,23 3,51 61,83 2,82 67,99 3,68 58,26 3,65 47,94 4,97 64,92 3,33 57,15 3,88 69,57 3,95 68,15 5,11
Zambia 28,82 1,73 32,45 2,32 25,04 1,85 17,27 1,76 25,99 1,93 43,72 3,19 21,78 2,97 10,84 1,89 30,74 3,51 21,58 1,93 46,46 3,71 41,53 3,95

266
Access-to-literacy (circa 2000)
National (%)
SE (%)
Boys (%)
SE (%)
Girls (%)
SE (%)
Poor40 (%)
SE (%)
Mid40 (%)
SE (%)
Rich20 (%)
SE (%)
Poor40M (%)
SE (%)
Poor40F (%)
SE (%)
Mid40M (%)
SE (%)
Mid40F (%)
SE (%)
Rich20M (%)
SE (%)
Rich20F (%)
SE (%)
Kenya 76,70 1,31 75,91 1,56 77,45 1,59 62,03 2,89 79,86 1,73 89,56 1,30 62,42 3,38 61,42 3,47 79,31 2,16 80,57 2,10 88,01 1,80 90,92 1,45
Lesotho 50,34 2,20 39,45 2,63 61,69 2,41 35,22 3,42 53,32 2,74 70,91 2,54 23,04 4,32 48,73 3,98 43,83 3,24 64,75 2,92 62,54 3,78 77,17 2,70
Malawi 32,53 2,52 37,22 2,85 28,57 2,92 19,68 3,50 29,45 3,10 59,33 3,07 27,06 4,64 14,66 4,03 32,13 3,41 26,46 3,90 60,56 3,97 58,11 3,67
Mozambique 25,33 1,31 33,30 1,49 18,79 1,51 6,42 1,67 20,88 1,57 51,46 1,99 11,35 2,46 3,20 2,86 30,79 2,05 12,90 2,07 54,35 2,21 48,51 2,65
Namibia 46,63 2,06 43,90 2,50 49,31 2,28 32,15 3,17 44,32 2,56 77,18 2,22 30,81 3,68 33,97 3,93 39,82 3,13 48,12 2,97 75,71 2,95 79,04 2,67
South Africa 64,88 2,13 61,30 2,24 68,24 2,41 49,19 2,79 66,65 2,46 93,72 1,28 46,65 3,37 50,56 3,24 61,73 2,86 72,44 2,79 90,59 2,14 96,15 1,10
Swaziland 75,14 1,58 71,96 2,31 78,00 1,83 67,00 2,21 76,03 2,82 85,45 2,72 64,97 2,97 68,96 2,86 74,54 3,88 77,75 3,37 79,49 5,83 89,23 2,21
Tanzania 61,33 1,89 62,66 2,17 60,22 2,27 36,78 3,25 68,17 2,02 86,41 1,69 40,03 3,96 34,25 3,65 69,74 2,77 66,94 2,50 84,90 2,52 87,17 2,18
Uganda 47,20 2,54 53,06 2,90 42,42 3,02 33,92 3,79 44,90 3,06 69,69 3,02 43,52 4,57 26,82 4,48 52,51 3,75 38,62 3,85 66,86 3,75 71,64 3,89
Zambia 35,88 2,59 39,59 2,91 32,53 2,90 15,50 3,67 36,17 2,71 70,47 2,83 20,46 4,71 12,05 4,48 39,10 3,02 33,29 3,35 70,86 3,39 69,08 3,57
Access-to-numeracy (circa 2000)
National (%)
SE (%)
Boys (%)
SE (%)
Girls (%)
SE (%)
Poor40 (%)
SE (%)
Mid40 (%)
SE (%)
Rich20 (%)
SE (%)
Poor40M (%)
SE (%)
Poor40F (%)
SE (%)
Mid40M (%)
SE (%)
Mid40F (%)
SE (%)
Rich20M (%)
SE (%)
Rich20F (%)
SE (%)
Kenya 72,56 1,42 73,83 1,60 71,25 1,84 58,26 3,00 75,56 1,90 85,53 1,58 60,25 3,39 55,60 3,69 77,40 2,21 74,24 2,56 86,01 2,04 85,19 1,98
Lesotho 24,32 2,31 20,21 2,72 28,51 2,51 16,37 2,84 25,97 2,66 35,17 3,35 11,09 3,79 22,84 3,50 20,89 3,27 29,51 3,00 36,55 4,52 35,87 3,79
Malawi 15,10 1,97 19,58 2,52 11,18 2,08 9,35 3,00 12,93 2,39 28,59 2,92 15,12 4,03 5,51 3,23 16,10 3,06 8,64 2,86 31,67 3,90 26,60 3,44
Mozambique 23,48 1,46 31,59 1,61 16,81 1,82 5,96 2,16 19,14 1,90 48,16 2,08 10,71 2,59 2,67 4,83 29,15 2,25 11,35 2,61 51,79 2,36 44,20 2,78
Namibia 19,27 1,96 19,79 2,45 18,78 2,05 8,22 2,79 13,71 2,15 51,31 3,34 8,61 3,23 7,43 3,34 13,63 2,79 13,74 2,48 53,39 3,88 50,19 3,79
South Africa 44,90 2,65 43,63 2,50 46,09 3,23 27,53 2,48 43,70 2,80 82,10 3,12 28,87 3,29 26,48 3,06 40,99 3,14 46,83 3,83 78,36 3,73 83,99 2,91
Swaziland 59,77 2,05 59,97 2,54 59,30 2,87 52,56 2,66 59,28 3,34 71,86 3,48 52,21 3,39 51,62 3,81 61,18 4,18 58,33 4,35 72,02 6,09 71,01 3,71
Tanzania 49,85 2,27 53,97 2,54 46,24 2,78 27,15 3,40 55,72 2,56 75,11 2,41 32,82 4,12 22,79 4,18 60,39 3,23 51,51 3,30 75,78 3,26 73,67 3,33
Uganda 38,77 2,89 45,02 3,15 33,39 3,81 25,82 4,00 38,73 3,46 57,57 3,92 35,57 4,63 18,62 5,41 45,64 4,27 31,52 4,59 57,17 4,52 59,09 5,33
Zambia 19,76 2,18 24,06 2,75 15,89 2,46 7,59 2,69 19,25 2,46 42,04 3,28 11,15 3,89 4,15 2,93 23,97 3,94 15,15 2,80 45,30 3,82 39,36 4,11

267
Never enrolled (19-23) from DHS (circa 2007)
National (%)
SE (%)
Boys (%)
SE (%)
Girls (%)
SE (%)
Poor40 (%)
SE (%)
Mid40 (%)
SE (%)
Rich20 (%)
SE (%)
Poor40M (%)
SE (%)
Poor40F (%)
SE (%)
Mid40M (%)
SE (%)
Mid40F (%)
SE (%)
Rich20M (%)
SE (%)
Rich20F (%)
SE (%)
Kenya 5,26 0,72 2,81 0,54 7,40 1,20 10,41 1,67 3,32 0,91 2,20 0,79 5,70 1,35 14,56 2,59 1,66 0,62 4,96 1,71 1,14 0,70 2,96 1,19
Lesotho 4,87 0,46 9,26 0,87 0,63 0,19 10,42 1,01 2,32 0,38 0,90 0,39 18,72 1,77 1,40 0,48 4,29 0,71 0,39 0,21 2,08 0,88 0,00 0,00
Malawi 7,09 0,45 6,03 0,55 8,09 0,61 12,43 0,94 5,96 0,60 1,32 0,35 9,88 1,11 14,52 1,29 6,04 0,96 5,88 0,68 1,34 0,46 1,29 0,54
Mozambique 13,67 0,84 7,95 0,85 18,39 1,21 22,10 1,60 14,03 1,31 2,81 0,50 10,48 1,67 31,12 2,47 9,89 1,55 17,31 1,65 2,59 0,55 3,00 0,76
Namibia 5,89 0,46 7,41 0,66 4,53 0,54 8,80 0,96 6,20 0,67 1,08 0,49 9,93 1,31 7,70 1,15 8,31 0,98 4,32 0,79 1,52 0,84 0,74 0,41
South Africa 1,13 0,21 1,29 0,26 0,98 0,23 1,38 0,45 0,99 0,18 0,74 0,27 1,46 0,49 1,32 0,48 1,25 0,29 0,74 0,19 0,80 0,42 0,69 0,35
Swaziland 1,42 0,32 2,44 1,09 1,89 0,94 3,08 1,02 0,82 0,23 0,57 0,25 6,29 4,48 3,66 3,18 1,98 0,96 0,95 0,80 0,00 0,00 2,17 1,97
Tanzania 14,56 1,16 10,44 1,19 18,20 1,49 27,71 2,34 10,10 0,98 2,61 0,68 20,39 2,38 33,71 2,96 8,00 1,26 12,21 1,55 0,00 0,00 4,65 1,21
Uganda 5,68 0,61 5,29 0,74 5,97 0,71 11,33 1,47 3,03 0,56 2,03 0,49 8,65 1,65 13,36 1,75 3,55 0,96 2,61 0,67 3,33 0,94 1,12 0,49
Zambia 7,03 0,56 3,28 0,54 10,33 0,95 13,87 1,31 5,18 0,69 2,09 0,75 5,03 1,21 20,78 2,11 3,32 0,78 6,92 1,14 1,40 0,95 2,72 1,22
Completed Gr6 (19-23) from DHS (circa 2007)
National (%)
SE (%)
Boys (%)
SE (%)
Girls (%)
SE (%)
Poor40 (%)
SE (%)
Mid40 (%)
SE (%)
Rich20 (%)
SE (%)
Poor40M (%)
SE (%)
Poor40F (%)
SE (%)
Mid40M (%)
SE (%)
Mid40F (%)
SE (%)
Rich20M (%)
SE (%)
Rich20F (%)
SE (%)
Kenya 87,21 1,00 88,36 1,13 86,20 1,43 78,49 2,07 89,44 1,36 93,92 1,35 82,49 2,21 74,96 2,97 89,97 1,57 88,93 2,12 93,03 2,00 94,57 1,53
Lesotho 77,97 1,00 65,48 1,52 90,00 0,84 61,13 1,70 82,95 1,14 95,82 0,81 42,63 2,09 81,26 1,88 73,40 1,85 92,29 1,05 92,77 1,60 98,14 0,62
Malawi 62,86 0,99 67,10 1,26 58,85 1,11 42,21 1,32 64,57 1,36 89,23 0,89 48,50 1,90 37,03 1,50 67,39 1,89 61,80 1,67 89,25 1,18 89,20 1,28
Mozambique 53,01 1,37 62,79 1,57 44,93 1,62 25,64 1,72 52,07 1,94 87,94 0,96 39,05 2,68 15,22 1,90 62,93 2,45 43,45 2,24 88,92 1,14 87,03 1,33
Namibia 85,42 0,84 81,42 1,25 88,98 0,88 76,18 1,59 85,99 1,07 97,57 0,71 71,82 2,24 80,37 1,95 81,33 1,66 90,15 1,07 96,84 1,28 98,15 0,75
South Africa 95,42 0,33 94,16 0,48 96,64 0,37 92,58 0,67 97,24 0,30 98,90 0,33 90,42 0,94 94,69 0,76 96,59 0,50 97,87 0,34 98,76 0,52 99,03 0,41
Swaziland 87,73 2,41 86,39 6,98 94,43 2,10 77,90 5,53 89,78 2,67 95,38 2,47 85,99 6,53 90,49 7,09 81,88 11,09 95,19 2,57 99,75 0,26 96,41 2,84
Tanzania 74,12 1,41 78,50 1,45 70,24 1,79 57,37 2,43 78,00 1,36 92,36 1,19 64,78 2,71 51,29 2,85 79,62 1,82 76,36 2,17 97,19 1,09 88,56 1,79
Uganda 68,53 1,34 70,49 1,54 67,05 1,72 48,98 2,19 71,56 2,09 89,46 1,20 56,85 2,92 43,00 2,72 72,13 2,37 71,09 2,64 86,39 2,32 91,60 1,24
Zambia 74,03 1,22 80,91 1,36 67,98 1,60 51,58 2,26 76,89 1,56 95,21 1,11 65,71 3,08 40,54 2,69 81,92 1,68 72,20 2,34 95,21 1,63 95,21 1,40

268
Proportion literate from SACMEQ 2007
National (%)
SE (%)
Boys (%)
SE (%)
Girls (%)
SE (%)
Poor40 (%)
SE (%)
Mid40 (%)
SE (%)
Rich20 (%)
SE (%)
Poor40M (%)
SE (%)
Poor40F (%)
SE (%)
Mid40M (%)
SE (%)
Mid40F (%)
SE (%)
Rich20M (%)
SE (%)
Rich20F (%)
SE (%)
Kenya 91,96 1,00 91,45 0,97 92,48 1,39 87,58 1,97 92,88 0,75 97,51 0,55 87,18 1,57 87,97 2,68 92,48 1,08 93,50 1,18 97,03 0,93 97,68 0,79
Lesotho 78,80 1,30 76,06 1,71 81,09 1,31 72,89 1,90 78,00 1,48 87,73 1,68 67,88 2,83 75,97 1,99 74,24 1,98 81,32 1,70 86,44 1,89 89,10 1,93
Malawi 63,40 1,77 66,40 2,04 60,31 1,95 58,29 2,77 62,56 2,04 69,45 2,26 58,48 3,27 54,93 3,30 65,77 2,67 60,20 2,57 75,95 2,70 64,91 2,53
Mozambique 78,49 1,13 79,46 1,25 77,34 1,42 66,48 3,07 76,66 1,48 87,65 1,22 69,26 3,34 63,69 4,60 79,36 1,67 74,54 2,07 88,56 1,36 84,90 1,66
Namibia 86,37 0,76 83,50 0,99 89,01 0,81 80,61 1,28 86,60 0,90 94,94 0,76 77,35 1,75 83,49 1,46 82,76 1,30 89,66 0,98 93,88 1,08 96,83 0,71
South Africa 72,74 1,19 68,83 1,32 76,52 1,25 57,76 1,60 76,13 1,17 94,08 0,85 54,14 1,77 60,71 1,92 71,08 1,57 81,74 1,18 91,32 1,28 96,39 0,85
Swaziland 98,52 0,40 97,96 0,53 99,09 0,33 97,65 0,79 98,76 0,33 99,50 0,26 96,93 0,99 98,68 0,55 98,48 0,49 99,01 0,38 98,87 0,59 100,00
Tanzania 96,50 0,52 96,77 0,65 96,24 0,62 94,54 0,98 96,64 0,70 98,71 0,39 95,05 1,42 93,53 1,37 97,03 0,74 96,78 0,91 98,64 0,53 98,46 0,63
Uganda 79,65 1,30 80,82 1,39 78,50 1,51 72,53 2,09 77,62 1,45 90,67 1,16 74,59 2,30 72,26 2,30 78,79 1,76 75,85 1,83 92,37 1,43 88,46 1,51
Zambia 55,91 1,68 58,25 1,88 53,45 2,15 48,34 2,41 51,72 2,00 70,85 2,41 51,02 2,87 45,43 3,56 55,14 2,38 49,05 2,69 73,57 2,64 66,92 3,37
Proportion numerate from SACMEQ 2007
National (%)
SE (%)
Boys (%)
SE (%)
Girls (%)
SE (%)
Poor40 (%)
SE (%)
Mid40 (%)
SE (%)
Rich20 (%)
SE (%)
Poor40M (%)
SE (%)
Poor40F (%)
SE (%)
Mid40M (%)
SE (%)
Mid40F (%)
SE (%)
Rich20M (%)
SE (%)
Rich20F (%)
SE (%)
Kenya 88,77 1,04 89,92 1,07 87,59 1,47 84,65 1,89 89,44 0,97 94,40 1,04 86,98 1,74 83,34 2,40 90,06 1,15 87,85 1,59 94,86 1,56 93,83 1,40
Lesotho 58,19 1,59 57,72 1,93 58,59 1,74 50,64 2,03 57,05 1,82 69,79 2,40 49,85 2,90 50,51 2,24 54,70 2,42 59,00 2,36 69,71 2,92 71,17 2,91
Malawi 40,12 1,80 44,50 2,07 35,61 2,18 37,87 2,86 40,22 1,97 42,10 2,36 40,61 3,11 31,45 4,11 45,86 2,73 37,29 2,50 46,63 3,21 36,71 3,08
Mozambique 67,27 1,26 70,38 1,42 63,58 1,69 55,41 2,27 65,97 1,77 75,69 1,59 58,08 2,79 52,99 3,79 70,98 2,03 59,43 2,44 80,25 1,94 71,37 2,12
Namibia 52,31 1,35 52,39 1,56 52,24 1,48 38,28 1,82 50,38 1,53 77,60 1,71 38,24 2,17 38,70 2,09 49,65 2,04 50,95 1,77 77,95 2,05 76,73 2,00
South Africa 59,83 1,38 57,53 1,55 62,05 1,46 43,08 1,74 61,30 1,37 88,40 1,13 41,66 2,12 44,58 1,99 57,97 1,68 64,51 1,49 85,97 1,56 90,49 1,28
Swaziland 91,41 0,93 92,76 0,92 90,07 1,17 89,00 1,34 91,53 1,10 95,13 0,86 90,56 1,60 87,55 1,65 93,33 0,96 90,14 1,67 95,63 0,98 94,62 1,29
Tanzania 86,76 1,07 89,67 1,05 83,96 1,45 81,30 1,92 86,80 1,21 93,49 0,88 85,60 2,03 77,51 2,82 91,10 1,13 83,66 1,55 92,72 1,33 91,94 1,33
Uganda 61,26 1,58 63,45 1,76 59,14 1,81 52,86 2,25 58,64 1,74 74,62 1,89 56,31 2,60 52,30 2,66 61,08 1,93 54,61 2,30 76,71 2,27 72,56 2,23
Zambia 32,68 1,42 36,09 1,75 29,08 1,73 25,73 2,03 28,34 1,50 47,16 2,89 28,31 2,74 22,89 2,20 33,44 2,10 24,94 1,95 51,42 3,34 40,48 3,67

269
Access-to-literacy (circa 2007)
National (%)
SE (%)
Boys (%)
SE (%)
Girls (%)
SE (%)
Poor40 (%)
SE (%)
Mid40 (%)
SE (%)
Rich20 (%)
SE (%)
Poor40M (%)
SE (%)
Poor40F (%)
SE (%)
Mid40M (%)
SE (%)
Mid40F (%)
SE (%)
Rich20M (%)
SE (%)
Rich20F (%)
SE (%)
Kenya 80,19 1,42 80,80 1,49 79,71 2,00 68,74 2,86 83,08 1,55 91,59 1,46 71,92 2,71 65,95 4,00 83,20 1,90 83,14 2,42 90,27 2,20 92,38 1,72
Lesotho 61,44 1,64 49,80 2,29 72,98 1,55 44,56 2,55 64,70 1,86 84,06 1,87 28,94 3,52 61,74 2,74 54,49 2,71 75,05 2,00 80,19 2,48 87,44 2,03
Malawi 39,86 2,03 44,56 2,39 35,49 2,24 24,60 3,07 40,40 2,45 61,97 2,43 28,36 3,78 20,34 3,63 44,32 3,27 37,20 3,07 67,79 2,94 57,89 2,84
Mozambique 41,61 1,77 49,90 2,01 34,75 2,15 17,05 3,52 39,92 2,44 77,08 1,55 27,05 4,29 9,69 4,98 49,94 2,97 32,39 3,05 78,74 1,77 73,89 2,13
Namibia 73,77 1,13 67,99 1,60 79,20 1,19 61,41 2,04 74,47 1,40 92,63 1,04 55,55 2,84 67,10 2,44 67,31 2,11 80,83 1,45 90,91 1,67 95,04 1,03
South Africa 69,41 1,23 64,81 1,40 73,95 1,31 53,47 1,74 74,03 1,21 93,05 0,91 48,95 2,00 57,49 2,06 68,65 1,65 79,99 1,23 90,20 1,38 95,46 0,94
Swaziland 86,44 2,44 84,63 7,00 93,56 2,12 76,07 5,59 88,66 2,69 94,90 2,48 83,35 6,60 89,30 7,11 80,64 11,10 94,24 2,60 98,62 0,65 96,41 2,84
Tanzania 71,52 1,50 75,96 1,59 67,60 1,89 54,24 2,62 75,37 1,52 91,17 1,25 61,57 3,06 47,97 3,16 77,26 1,97 73,90 2,35 95,88 1,21 87,20 1,90
Uganda 54,58 1,87 56,97 2,07 52,64 2,29 35,52 3,03 55,54 2,55 81,12 1,67 42,41 3,71 31,07 3,56 56,83 2,96 53,93 3,21 79,79 2,73 81,03 1,96
Zambia 41,39 2,08 47,13 2,32 36,33 2,68 24,94 3,30 39,77 2,54 67,46 2,65 33,52 4,21 18,42 4,46 45,17 2,92 35,42 3,57 70,05 3,10 63,71 3,65
Access-to-numeracy (circa 2007)
National (%)
SE (%)
Boys (%)
SE (%)
Girls (%)
SE (%)
Poor40 (%)
SE (%)
Mid40 (%)
SE (%)
Rich20 (%)
SE (%)
Poor40M (%)
SE (%)
Poor40F (%)
SE (%)
Mid40M (%)
SE (%)
Mid40F (%)
SE (%)
Rich20M (%)
SE (%)
Rich20F (%)
SE (%)
Kenya 77,42 1,44 79,45 1,56 75,50 2,05 66,44 2,80 80,00 1,67 88,66 1,70 71,75 2,82 62,47 3,81 81,03 1,94 78,12 2,65 88,26 2,53 88,74 2,08
Lesotho 45,37 1,88 37,79 2,46 52,73 1,93 30,96 2,65 47,32 2,14 66,88 2,53 21,25 3,58 41,05 2,92 40,15 3,05 54,45 2,58 64,67 3,33 69,85 2,98
Malawi 25,22 2,05 29,86 2,42 20,96 2,44 15,99 3,15 25,97 2,39 37,56 2,52 19,69 3,65 11,65 4,37 30,91 3,32 23,05 3,01 41,62 3,41 32,75 3,34
Mozambique 35,66 1,86 44,19 2,12 28,57 2,34 14,21 2,85 34,35 2,63 66,57 1,85 22,68 3,87 8,07 4,24 44,67 3,19 25,82 3,32 71,36 2,25 62,11 2,50
Namibia 44,68 1,59 42,65 2,00 46,48 1,73 29,16 2,42 43,33 1,87 75,71 1,85 27,47 3,11 31,10 2,86 40,38 2,63 45,93 2,06 75,49 2,42 75,31 2,14
South Africa 57,09 1,42 54,18 1,62 59,96 1,51 39,88 1,87 59,61 1,40 87,43 1,17 37,67 2,32 42,21 2,13 55,99 1,75 63,14 1,53 84,91 1,65 89,62 1,35
Swaziland 80,20 2,58 80,14 7,04 85,05 2,40 69,33 5,69 82,18 2,89 90,73 2,62 77,86 6,72 79,23 7,28 76,42 11,13 85,80 3,06 95,39 1,01 91,22 3,12
Tanzania 64,31 1,77 70,39 1,79 58,98 2,30 46,64 3,10 67,70 1,81 86,34 1,48 55,45 3,39 39,76 4,01 72,54 2,15 63,89 2,66 90,12 1,72 81,42 2,23
Uganda 41,98 2,07 44,72 2,34 39,65 2,49 25,89 3,14 41,96 2,72 66,76 2,24 32,01 3,91 22,49 3,80 44,06 3,06 38,82 3,50 66,27 3,24 66,47 2,55
Zambia 24,19 1,88 29,20 2,22 19,77 2,36 13,27 3,04 21,79 2,16 44,90 3,10 18,60 4,12 9,28 3,47 27,39 2,69 18,01 3,04 48,96 3,72 38,55 3,92

270
*** END ***