Embed Size (px)
Citation preview
1
Sub-national PPPs: Methodology and Application by using CPI data
Luigi Biggeri (University of Florence, Italy)
Laureti Tiziana (University of Tuscia, Italy)
Paper Prepared for the IARIW 33rd
General Conference
Rotterdam, the Netherlands, August 24-30, 2014
Session 8C
Time: Friday, August 29, Afternoon
2
Sub-national PPPs: Methodology and Application by using CPI data Luigi Biggeri and Tiziana Laureti
Department of Statistics, University of Florence, Florence, Italy
Email: [email protected]
Department of Economics and Management, University of Tuscia, Viterbo, Italy
Email: [email protected]
(provisional version)
1. Introduction1
The need for constructing sub-national Purchasing Power Parities (PPPs) to carry out analyses on
inter-area price level, living standards and real income comparisons in the context of poverty, rural-
urban and regional (local) differences has been discussed since long time in literature (see for
example Kokoski, 1991, Moulton, 1995, Bretell and Gardiner, 2002).
However, while considerable resources have been spent by the international and national statistical
agencies on calculating PPPs rates between countries, the issue of intra-national PPPs has received
much less attention.
In surveying international practice, it can be seen that an increasing number of scholars are
conducting interesting experimental estimations of PPPs within country, but only few countries
produce official indexes of spatial prices and without any international framework guiding the
construction of PPPs, both from a methodological and an empirical point of view.
In 2010, the need of constructing sub-national PPPs in the framework of the International
Comparison Program (ICP) and using the CPI data has been stressed and discussed during the 2nd
Meeting of the Technical Advisory Group (TAG) of the ICP, also with the aim of implementing an
international project in this field (Biggeri et al, 2010; McCarthy, 2010).
As we will illustrate in detail in the following section, all the analyses of available data and the
experiments undertaken until now have highlighted significant differences in the level of prices and
the cost of living within countries, both for large and medium size countries, reinforcing the need
for the computation of sub-national PPPs. In any case, the main issues to face refer to the
characteristics of data available and to the choice of the method to estimates the PPPs. Up to now,
two main general approaches for computing sub-national PPPs has been proposed which are based,
respectively, on:
(i) the consumer prices collected from retail outlets throughout the country for the compilation
of the Consumer Price Indices (CPI), and the use of the GEKS method or the methods
belonging to the family of the Country Product Dummy (CPD) models;
(ii) data collected using sample surveys on household consumption expenditure (Expenditure
Consumer Surveys) and the adoption of a demand system based methodology.
In this context, the aim of this paper is twofold. First, to review the proposals and the experiments
carried out in order to develop a framework for evaluating and addressing the problems of data
collection and of the choice of the methods for computing and implementing temporally consistent
spatial indexes. Second, to explore characteristics and reliability of PPPs estimated by using
different CPD models and by carrying out some experiments on Italian data concerning the 20
regional chief towns.
1 The authors wish to thank Federico Polidoro and Stefania Occhiobello working at the Italian Statistical Institute (Istat) for their support and
assistance in interpreting and examining the price data collected for CPI computations and used for constructing spatial price indexes.
3
Working in the line of the ICP, and thinking to a general project under its umbrella, this paper
focuses on the construction of spatial indices using CPI data. Indeed this kind of data may be
readily available as every National Statistical Offices (NSOs) conducts on a regular basis the
collection of price data with high frequency due to their important role in conjuntural analysis. This
should allow to save resources by the requested integration between PPP and CPI construction
(Rao, 2001; Biggeri and Laureti, 2009) and to compute sub-national PPPs and national and
international PPPs in a consistent framework.
An important general issue on which various authors have focused (Hill and Hill, 2009; Hill and
Syed, 2014) is that of obtaining reliable PPPs at the basic heading (BH) level. Thus, the role of the
CPD method for constructing intra-national PPPs at the lowest level of aggregation is analysed and
discussed in this paper. Specific issues which arise in the context of sub-national PPP construction
are examined. In particular, we focus on the need to take into account the spatial autocorrelation
among price relatives (Aten, 1996; Rao, 2004) that surely will be more important among the areas
within a country than among countries. Bearing in mind the importance of use of CPI data, the
various CPD model specifications, based on average and individual price data and including or not
quality characteristics, are directly compared both on a methodological and on empirical point of
view.
In order to evaluate the reliability of the sub-national PPPs the statistical uncertainty associated with
the point estimates are presented and discussed.
The remainder of this paper is structured as follows. Section 2 reviews the proposals and the
experiments carried out for constructing intra-national PPPs with the aim of obtaining some
guidelines for future works, which will be briefly illustrated in Section3. Section 4 deals with the
methodological and empirical problems related to the estimation of sub-national PPPs using CPD
methods at the lowest level of aggregation where information on expenditures or quantities is not
available.
In Section 5 five different CPD models are directly compared by using CPI ISTAT data for the
estimation of PPP for the BH preserved milk and other products. The results obtained are presented
and discussed. Section 6 provides some concluding remarks.
2. Review of proposals and experiments conducted for the computation of sub-
national PPPs
In surveying works on the construction of sub-national spatial prices indexes, taking into account
the aim of this paper, it is convenient to start with the official computation and dissemination of
those indexes (i.e. the works carried out by the National Statistical Agencies).
Not-withstanding the first official measure of inter-area differences in the cost of living was
developed in the 1940s in the US, using the standard budget of the Family Budget program of the
Bureau of Labor Statistics, up to now only few countries produce official indexes of spatial prices
or have carried out experiments to do it (US, Australia, UK and Italy).
In the US, the inter-area price level comparisons reached an interesting development in the mid-
1990s as a result of the studies conducted by various researchers, belonging essentially to the
Bureau of Labor Statistics and the Bureau of Economic Analysis (BEA), see for example Kokoski,
1991 and Kokoski, Moulton and Zieschang, 1999. Then further developments has been carried out
in the mid of 2000s with many research conducted by Aten (see for example, 2005 and 2006). She
has continued to work by improving researches in this field both as number of products and areas
considered, arriving to compute Regional Price Partities (RPPs) for 50 states and the District of
4
Columbia and for 366 metropolitan areas. In the last years, BEA disseminated currently data on
regional price parities and real personal income for States and Metropolitan Areas (Aten, Figueroa
and Martin, 2014). These works used detailed data on prices collected for the CPI and data on the
expenditure weights taken from the Consumer Expenditure Survey. The analysis of the
characteristics of data and, above all, the methods of computation of PPPs at product level, Basic
Headings (BH) and aggregated commodity group level were improved in the last decennium, up to
include the measures in an economic approach framework (Aten and Reinsdorf, 2010). The RPPs
compare the average price level of an area with the national average price level for all the areas. For
the compilation both the GEKS and various kind and modified versions of CPD methods have been
subsequently applied.
The UK Office for National Statistics (ONS) carried out in 2000 a one-off exercise to produce
indicative figures on the variation in prices between regions. Then ONS published estimates of
regional price level comparisons in 2004 for the year 2003. These first two exercises were done as a
by-product of a survey conducted to provide data for Eurostat’s Purchasing Power Parities (PPP)
programme (Fenwick and O’Donoghue, 2003). In 2005, the ONS produced relative regional
consumer price levels based on CPI price data (mainly food items, tobacco and drinks)
supplemented with administrative data sources and, above all, with a purpose-designed regional
price level survey for items of expenditure where suitable data was not available (mainly clothing,
furniture, electrical goods and travel), as explained in Wingfield, Fenwick and Smith, 2005.
Then ONS produced Relative Regional Consumer Price Levels (RRCPLs) for 2010 with more
adequate procedure (ONS, 2011) using data on price observations from the existing monthly CPI
collection and regional price survey conducted for the computation of the Spatial Adjustment
Factors (SAFs) requested by Eurostat-OECD PPP program. The methodology adopted by ONS in
constructing RRCPLs is consistent with the approach used by Eurostat in the calculation of the
PPPs for the mentioned program.
The Australian Bureau of Statistics (ABS) worked to compile and disseminate experimental indexes
on living costs in the 8 capital cities using existing price data collected for CPIs and calculated
spatial price using GEKS (Waschka, Milne, Khoo, Quirey and Zhao, 2003). ABS continued to
compute and disseminate this kind of information, every time call for caution in the interpretation of
the results.
In 2011, as written in the June CPI release, the ABS discontinued the publication of the Average
Retail Prices of Selected Items in Eight Capital Cities.
The Italian Statistical Institute (ISTAT) conducted one experiment for the computation of regional
PPPs. ISTAT started a research project in 2005 aimed at testing the possibility of using and
integrating the statistical information currently supplied within the CPI surveys and only refers to
some expenditure divisions: Food and beverages, Clothing and footwear and Furniture for the
home, which represent about 34% of the total consumer expenditures.
In order to calculate sub-national PPPs for consumer prices for 20 cities (the regional capitals), the
procedure for international comparison, following the principle of strict comparability of the
products, has been adopted. For this reason, a complicated analysis of data collected for CPIs was
carried out to check if the characteristics of products included in that list were the same in the
different cities. Regarding Food and beverage products ISTAT was able to use the CPI data (of
about 1,300 products) after having achieved comparability; while for Clothing and Furniture
products it was necessary to carry out an ad hoc survey in order to collect new data for strictly
comparable products in the 20 cities. The computation of PPPs were made for the BHs of each
mentioned division of expenditure and the results referring to year 2009 were published in 2010
(ISTAT, 2010).
5
Due to the cost of ad hoc survey, ISTAT has started to implement a new strategy to compute sub-
national PPPs using essentially existing CPI data.
We have to mention that Statistics New Zealand (SNZ) has also investigated the possibility of
carrying out spatial comparisons of prices since 2005. In fact the SNZ asked two experts to develop
a methodology for constructing Spatial Cost of Living Indexes. The report prepared by the experts
(Melser and Hill, 2005) is very exhaustive facing all the problems and giving solutions or
suggestions both conceptual and practical for the construction of sub-national PPPs and can surely
be considered a reference text for their implementation in different countries as well. However, to
the authors’ knowledge, SNZ has never disseminated data on sub national PPPs.
Besides the national statistical agencies, many researchers have conducted studies and experiments
to estimate sub-national PPPs. Usually, the studies have been implemented through the cooperation
or agreement with national statistical agency and/or international agencies that provided data for the
experiments.
As far as these estimations of sub-national PPPs are concerned, in surveying international literature
it can be seen that these works are referred essentially to large countries, such as Brazil, India,
China and so on, where the differences in the standards of living and level of prices are likely to be
substantial. Aside from differential costs incurred in transporting goods, the differences between
regions are likely higher in countries with historically different regional patterns of development.
However, it is obvious that the differences in intra country levels of prices can also be due to the
differences in terms of climate and tastes and preferences.
As we have already mentioned, in these works two main general methods of computation of sub-
national PPPs has been proposed, which are based, respectively, on:
1. the consumer prices collected from retail outlets throughout the country for the compilation of
the Consumer Price Indices (CPI), and the use of the GEKS method or the methods that belonging
to the family of the Country Product Dummy (CPD) methods;
2. data collected using sample surveys on household consumption expenditure (Expenditure
Consumer Surveys) and adoption of a demand system based methodology.
Mentioning here only the most quoted papers, in the first group it is important to refer to the work
developed by Aten (1999) using the CPD method for estimating the 1987 price levels on food
products and the general price level in 10 cities in Brazil. At that time regional prices statistics were
not widely available. She discussed the practices for price collection and examined three alternative
index number methods for the construction of the spatial regional indexes: the Geary, Gini-Elteto-
Koves-Szulc (GEKS) and Fisher averages methods. A first analysis was based on food prices only.
In a second analysis the price of services were included to test if they affect the price levels in any
systematic manner.
A study to compute regional purchasing power parities of China in the year 2002 has been
conducted by three authors (Xiumin Li, Zhang and Du, 2005). The study was based on average
prices data from 31 cities and districts within the provinces, and Shanghai was taken as the base
(norm) province. The comparison study was based on the average prices on 127 goods and services
across China. The computation carried out were very simple. The authors used two methods,
namely Loven’s formula that calculates the two weighted average values (prices) and Paasche’s
price formula that creates the indices. The final PPP is obtained from calculating the weight mean
value of each subclass’s PPP.
Other experimental projects have been conducted along the research lines of the international
agencies and/or stimulated by them.
6
Eurostat have implemented the discussion on the topic in several meeting of its Working groups and
supported the experiments in some countries as we have seen above for UK, NSO, enlarging
regional price survey conducted for the computation of the Spatial Adjustment Factors (SAFs)
requested by Eurostat-OECD PPP program.
The World Bank and Asian Development Bank developed a specific experiment in the Philippines
(McCarthy, 2010; Dikhanov, Palanyandy and Capilit, 2011). This is a very important experiment
because aims at analysing the plausibility of integrating ICP with the Philippines’ CPI by
computing subnational PPPs using regional prices and expenditure weights from the CPI. The study
also aims at finding out whether prices collected for the CPI could be used to provide reliable
estimates of price levels for a range of products in each region and to verify if the results are
consistent with the information coming from the ICP process. The paper explains all the phases
implemented for the construction of the regional PPPs pointing out the main issues and the ways to
solve them, both for the data preparation and the methods of index computation and aggregation.
The CPD method was used in elementary aggregation and the chain Tornkqvist index was adopted
for the higher level aggregation. The work showed that the subnational price levels obtained from
both the CPI and ICP processes are broadly similar.
The second approach to estimate the consumer PPPs using a demand system model applied to data
collected with sample surveys on household consumption expenditure, acquired importance also for
the estimation of regional PPPs with the work done by Coondoo, Ray and Majumder (2004), which
presented an illustrative evidence for India. The study was carried out for a subset of 45 food items
and 25 states. The Authors used a regression based procedure for the estimation of multilateral
consumer price indexes using micro-level data (e.g. the household level data on commodity-
prices/unit values). As illustrated in the paper, first, the authors specified and estimated the set of
item-specific price equations using the pooled data for all regions and including in the regression a
set of regional dummy variables for each equation. Second, the set of multilateral consumer price
indexes are obtained , again using regression analysis, by relating the slope and intercepts terms of
the estimated item-specific price equations. The Authors explained that their suggested procedure
belongs, in a generic sense, to the CPD methodology as the price equations essentially shares the
hedonic feature, with few basic differences.
Majumder, Ray and Sinha have continued to work on using this approach to compute the regional
PPPs for India and also for Indonesia and Vietnam, enlarging and improving the analyses up to
propose a unified framework for the estimation of intra and inter country purchasing power parities,
and obtaining very interesting results (Majumder, Ray and Sinha, 2013, 2013 and 2014).
The approach followed by the authors is very interesting and it is important to verify its possible
extension to other countries and to check the validity and kind of the results obtained comparing
them with the results provided by the experiments done using other methods of computation.
However, taking into account the aims of this paper, from here on we will focus only on the results
of the experiments conducted using the CPI data and the methods to compute the sub-national PPPs
in lines with those used by the ICP and EUROSTAT-OECD Program. The availability, in most of
the countries in the world, of price data collected, frequently on monthly basis, to compute CPI
constrains to try to use these data also to compute the sub-national PPPs. This could allow both to
save resources, as the ICP surveys could reduce the collection of data, and to obtain coherent sub-
national and national PPPs.
7
3. The definition of an international framework to compute sub-national PPPs:
the main issues for data preparation and for the choice of the methods of
computation
From the national and international experiments examined, we can pick up some suggestions to
prepare an international project to compute consumer sub-national PPPs based on the same general
framework.
The main issues for the implementation of a project to construct the above PPPs using CPI and
consumption expenditures data, as for inter country PPPs, concern (Biggeri et al, 2010):
(i) data preparation;
(ii) aggregation at the Basic Heading (BH) Level
(iii) aggregation above the BH level.
At the national level, the need of carrying out spatial price comparisons across sub-regions cannot
be understated as they are essential both for research analysis and social-economic political
interventions. Much research has been focused on exploring the possibility of using, as much as
possible, existing price data collected through the national price surveys conducted as a part of the
CPI computations.
Obviously, the estimates of regional price levels or changes are not a natural by-product of the CPI
computation. However, although the CPI survey is not designed as an inter-area survey, it is
possible to use its price observations and expenditure (or sampling) weights to obtain sub-national
PPPs.
As the main purposes of the CPIs and spatial PPPs are quite different, the price data available from
the CPI sources are usually not in a form suitable for spatial price comparisons. Though the issues
of comparability and representativity are likely to be less serious in the context of sub-national
PPPs, they need to be considered carefully in making use of the CPI data. However products
collected for CPI may neither be comparable nor representative across different regions especially if
the countries are large or diverse in terms of climate and tastes and preferences. On the other end,
the current ICP methodology is not designed to make an efficient use of CPI price data if the items
are not comparable within all the regions.
Therefore the first and most important stage in constructing PPPs is the data preparation based on
CPI data and other existing data at country level.
In order to identify the most suitable methodology that allows using existing data in an efficient
way, detailed information on the available data and related database must be provided. Specific
information may be required depending on the objective of the PPPs computation, which can be
carried out for the region-to-region and/or rural-urban comparisons.
The main information and technical requirements needed for the data preparation phase can be
specified separately for CPI structure and price collection and for the estimation of the expenditure
weights, along with the data that would be needed.
To this end, it is necessary to have both the prices and expenditure weights databases. Information
on data structure and data descriptors of the databases is required.
Firstly it is necessary to have the prices database at a very detailed level, which include elementary
price data collected for each product in each outlet.
If this kind of database with detailed data is not available, a less detailed database which considers
the average prices (among outlets), of each product for each territorial area, can be used.
Moreover an analysis of the variability of territorial area price levels and of the relationships
between product prices across product groups should be carry out.
8
A matrix of prices by products and territorial area must be prepared and the classification of
products must be as much as possible comparable with that used at level of the ICP Basic Heading.
Secondly, the matrix of expenditure weights at detailed level by products and territorial areas used
for the compilation of CPIs is needed. Also in this case it is necessary to verify the correspondence
of the system of weights both with the national accounts household data and the expenditure
weights used for the aggregation above the BH level in the ICP exercise. It is worth nothing that the
system of expenditure weights used for the CPI may be not split by territorial areas.
At the end of these processes the matrix of prices will be, almost surely, not complete and a lot of
cells will not contain data due to the lack of identical or similar products in all the territorial areas.
To compute the Sub-National PPPs at BH level it is necessary to impute the missing data,
identifying the most appropriate method.
The previous suggestions are quite general but they can be specified and clarified only after many
experiments.
In this paper we present a first experiment that we are carrying out in the context of a scientific
cooperation with ISTAT. The issues which characterized the data preparation phase have been
faced essentially by ISTAT researchers, while we focused on the methods for the computation of
the sub-national PPPs.
Therefore, before presenting our experiment, the role of the CPD method for constructing reliable
intra-national PPPs at the lowest level of aggregation (BH) has to be analysed and discussed in the
following section. Specific advantages and issues which arise in the context of sub-national PPP
construction must be also examined. In particular, we focus on the need to take into account the
spatial autocorrelation among price relatives that surely will be more important among the areas
within a country than among countries. Bearing in mind the importance of using CPI data, the
various CPD model specifications, based on average and individual price data and including or not
quality characteristics, are directly compared both on a methodological and on empirical point of
view. Indeed, one of the concern of this paper is with regression-based parity estimators that
incorporate quality adjustments for non-comparable products, primarily through the use of a
hedonic framework (Silver, 2009).
4. The CPD methods for estimating sub-national PPPs
4.1 The CDP model using average prices: unweighted vs weighted approach
The most widely used statistical approach to the multilateral aggregation of prices at the first stage
of aggregation is the Country Product Dummy (CPD) method, proposed by Summers (1973). This
method for making international comparisons of prices can be viewed as a very simple type of
hedonic regression model where the only characteristic of the commodity is the commodity itself2.
The CPD method can also be viewed as an example of the stochastic approach to index numbers
(Diewert, 2010).
Suppose that we are attempting to make an intra-national comparison of prices between R regions at
the Basic Heading (BH) level (no expenditure weights are available for the price comparisons). For
each BH let nrp denote the average price of item n in region R (n=1,2,…N; r=1,2,…,R).
2 In the 2005 ICP round it has been the recommended method of aggregation below the basic heading level. The CPD
model has gained popularity as an aggregation method for aggregation above the basic heading level (see Rao, 2004,
2005; Diewert, 2005). Hill and Syed (2010) used detailed price data, provided by the Word Bank that also funding the
project, with the aim of analysing how the CPD could improve PPP estimates in the context of the ICP.
9
The basic statistical model that is assumed is:
r n nrnrp u (1)
where the r and n are unknown parameters to be estimated and nru are independently and
identically distributed random variables. The parameter r is to be interpreted as the average level
of prices (over all items in this group of items) in region r relative to other regions, and the
parameter n is to be interpreted as the average (over all regions) multiplicative premium that item
n is worth relative to an average item in this grouping of items.
Therefore, r are the basic heading region price levels that we want to determine while n are item
or individual product effects. It is usually assumed that the disturbances are log-normally distributed
or that ln nru ‘s are normally distributed with mean 0 and a constant variance 2 .
Taking logarithms of both sides of (1) leads to a linear model:
ln ln ln lnr n nrnr
r n nr
p u
a b v
(2)
where nrv are random disturbance terms which are independently and identically (normally)
distributed with zero mean and variance 2. The CPD model can be seen as a simple fixed effects
model where region-effects provide estimates of purchasing power parities and commodity-specific
effects provide estimates of national prices (Rao, 2004). A major advantage of the method is that
standard errors are obtained for the parity estimates.
Thus model (2) can be written as
*
1 1
lnR N
r r n n nrnr
r n
p a D b D v
(3)
where Dr (r=1,2,…,R) and *
nD are respectively country and commodity dummy variables.
The intra-national PPP for region r is given by:
expr rPPP a (4)
Usually, price observations used are annual average price for the commodity n. Recently, Dikhanov
et al (2011) suggested a combined spatial-temporal model, called Country-Time-Product-Dummy
method, to use quarterly CPI data.
Thus far in ICP the average price used has been the arithmetic mean. However, various authors
have argued that the geometric means are better as they rely on weaker assumptions (Rao, 2004,
Hill and Syed, 2014). It is possible to express it as the average of logarithm of price quotes:
1
1ln ln
nrK
nrknr
knr
p pK
(5)
The CPD formulation (3) is unweighted and is estimated using OLS, which implies giving equal
weight to the average prices of all regions. However, the various price observations may have
different levels of reliability. Rao (2004) suggested that under the assumption that individual price
quotes are independently and identically distributed with variance 2 a natural choice of weights
10
for use in Weighted Least Square (WLS) is simply wnr=Knr as the CPD model (3) based on (5) will
have heteroskedastic disturbances given that:
21nr
nr
Var pK
Diewert (2005) and Rao (2002, 2004) have shown that specific weights used in weighted–least-
squares (WLS) estimators for CPD parity estimates correspond to specific index number formulas.
As underlined by Silver (2009) the use of the CPD method as formulated in equation (3) suffers
from both the use of grouped data and the inability to included quality variations3.
Hill and Syed (2014) suggested to measure reliability by the variance of the log average prices
which in the case of geometric mean can be calculated as follows:
var ln
var lnnrk
nr
nr
pp
K
Thus weights can be expressed by:
1
wvar var ln
nr
n nrp
(6)
Where varn is the average variance of the log average prices across the whole set of regions and is
included to ensure that wnr is still defined when for a particular region r var ln 0nr
p .
4. 2 CDP regression using price quotes: the hedonic approach
If data on prices for each product from each outlet (price quotes) in each region are available, intra-
national PPPs can be estimated using CPD models for ungrouped data (Diewert, 2004, Silver,
2009). In this case, it would be possible to extend the CPD model to incorporate additional
characteristics associated with each quotation, including information on the type of outlet and
product brand.
Indeed, as a normal part of CPI calculations each of product price will have attached the detailed
specifications which define the type of product (size, brand) and the type of outlet in which the
product is sold.
Although representativity is not viewed as an issue in these subnational comparisons because a
product will not be included in a country’s CPI basket unless it is representative, the actual products
priced for the CPI are not necessarily identical in different regions.
Different brands may be preferred in the various regions. In addition distribution channels are
different and reflect different consumption habits.
Therefore, it is essential to include these information into the CPD model specification in order to
improve PPP estimations.
Let Z1, Z2, .. . ., ZJ represent a set of quality characteristics then the hedonic CPD model would be:
*
1 1 1
lnR N J
knr r r n n j j knr
r n j
p a D b D Z v
(7)
3 Kmenta (1986) demonstrates that OLS parameter estimates based on group means are unbiased, though the disturbances are likely
to be heteroskedastic and estimates inefficient, as a result of varying within group sample sizes. Such heteroskedasticity is avoided if
the number of observations (outlets sampled for each product group in each region) is the same.
11
where knrp is the price in outlet k of product n in region r .
This approach generalizes the usual CPD method in that the price variability is modeled right down
to the level of the individual prices that are collected by the regions involved in the comparison
(Diewert, 2004). Incorporating quality characteristics into the estimation of CPD price parities will
improve the efficiency of the estimates, remove potential bias, and enable the inclusion of strictly
non-comparable items4.
Silver (2009) suggested that it is possible to improve on the specification of (7) by also introducing
quality and product interaction terms.
4.3 The CPD Model with spatially auto-correlated error structure
When estimating sub-national PPPs an issue which can frequently arise is that of spatial
autocorrelation. However, in the context of sub-national PPP construction using CPD models, the
possible presence of autocorrelation among disturbances across regions for a specific commodity
has not been investigated.
Referring to international comparison, evidence of spatial autocorrelation for a number of
commodity groups among countries has been found by Aten (1996). Rao (2004) has drawn
attention to the effects of spatial autocorrelation and the necessary adjustments to the estimates.
Previously, Rao(2001) obtained estimated PPP using the CPD model after accounting for the
presence of spatial autocorrelation for aggregation above the basic heading parities.
To test for the presence of spatial autocorrelation we can use the well-known Moran’s I statistic.
Rao (2004) suggested using residuals from an OLS CPD regression to test for spatially
autocorrelated errors as the disturbance term for the n-th commodity in region r is the logarithm of
price of commodity n, pnr, converted using PPPr and expressed relative to the national average price
of same commodity.
The Moran’s I is essentially a cross product correlation measure that incorporates "space" by means
of a spatial weight matrix W. Significance can be based on analytical derivations, or, more
commonly, on a comparison to a reference distribution obtained by randomly permuting the
observed values. This statistic can be expressed as follows:
1 1
2
1 1 1
ˆ ˆ ˆ ˆ
ˆ ˆ
R S
rs nr ns
r s
R S R
rs nr
r s r
w v v v vR
I r s
w v v
Measures of spatial autocorrelation for residuals take into account the dependence among
observations by means of a spatial weight matrix W, which defines the structure of spatial
relationships. For a set of R regions the spatial matrix W is a RxR matrix with the diagonal
elements equal to zero; the other elements rsw represent the intensity of the effects of the region r on
region s (Anselin and Bera, 1998).
It is worth noting that since measures of spatial autocorrelations may depend on various
specifications of W (Fischer and Getis, 2010), the sensitivity of the results should be assessed by
using different representations of spatial structure. In literature there are very few formal guidelines
concerning the choice of the most adequate spatial weights. However, variables that show a good
4 The use of a CPD model incorporating quality adjustments was suggested in Kokoski, Moulton and Zieschang (1996)
in the context of inter-area price comparisons.
12
deal of local spatial heterogeneity for the selected scale of analysis would probably be more
appropriately modeled by few links in W, while a homogeneous or spatial trending variable would
be better modeled by a W with many links. This implies that the scale characteristics of data are
crucial elements in the creation of W. As spatial units become larger, the spatial dependence
between the units tends to decrease.
Aten (1996) provided more details on the choice of weights in modelling spatial autocorrelation in
the CPD context.
By focusing on the results of the Moran I test, it is possible to determine whether the classical CPD
regression or a spatial-adapted CPD should be estimated. Whenever spatial dependence is not negligible, a Spatial Error model (SEM) may be specified.
Referring to the CPD model (3) and stacking all the R observations for each commodity into a
vector, then the model containing spatial dependence in the disturbances can be expressed as
follows:
ln n nnp v x
n n nv v W
With the data generating process (LeSage and Pace, 2009):
1
2
ln
0,
n n nn
n n
p I
N I
x W
5. A first exploration of the various CPD specifications using Italian data for
regional capital cities
As a first analysis of the various CPD models to be used for constructing intra-national PPPs we
refer to a specific dataset constructing by using CPI data.
This data set consists of both elementary price quotes and average prices referred to March 2013, to
the products of consumer prices Italian basket belonging to the basic heading “Preserved milk and
other milk products”, which is composed of 5 products (UHT milk, dry milk, yogurt, organic
yogurt double cream), for 20 regional chief towns.
The data set was provided by the Italian Statistical Institute (ISTAT), in the context of a scientific
cooperation with the University of Florence and the University of Tuscia. The elementary price
quotes were treated in order to respect the statistical confidentiality and the authors worked at
ISTAT offices to test various hypotheses of CPD approach to subnational PPPs compilation.
PPPs are expressed as a percentage of the price level for the city of Rome, which is equal to 100.0.
Focusing on this BH we compare PPP estimation results obtained by using the following CPD
specifications:
1. CPD model (3) with geometric mean for average prices expressed by (5), which is the
standard (unweighted) CPD method estimated by using OLS;
2. CPD (wgm) which uses geometric means and is estimated using WLS with weights wnr=Knr;
3. CPD (wgm1) which uses geometric means and is estimated using WLS with weights
specified in (6);
4. CPD (quote) which is based on the individual price quotes;
5. Hedonic CPD (quote) which uses individual price quotes and incorporates quality
characteristics, i.e. brand and outlet type.
13
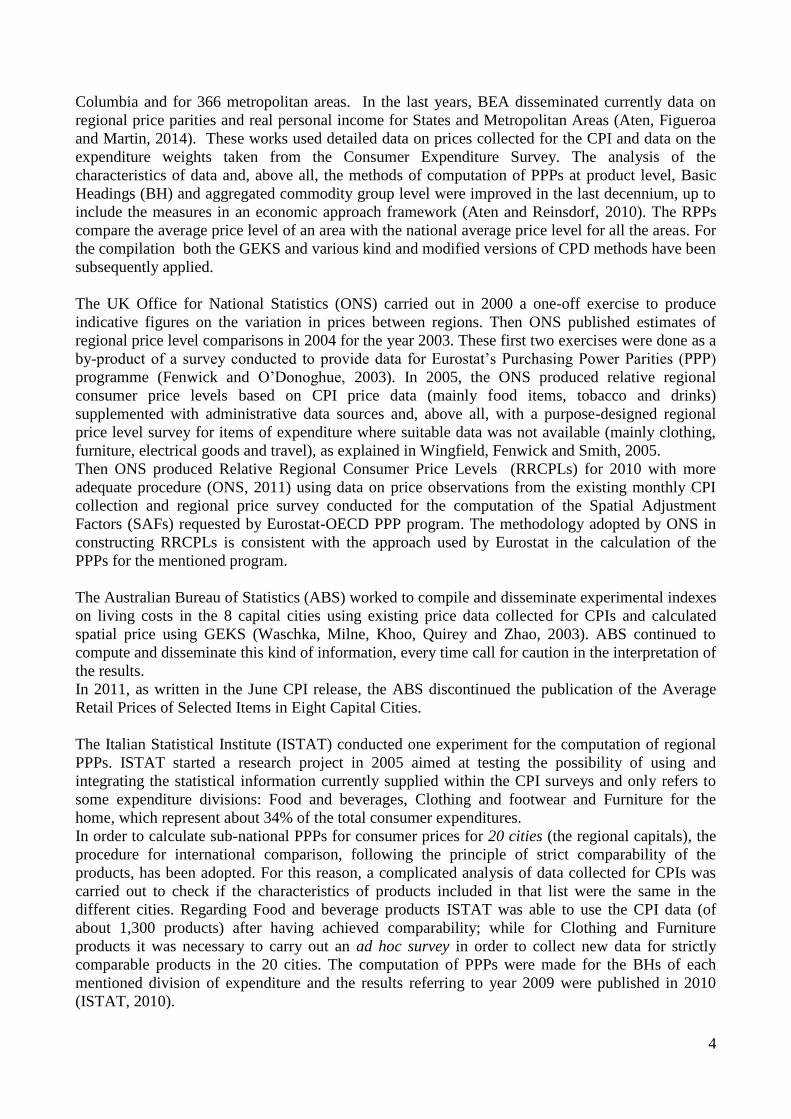
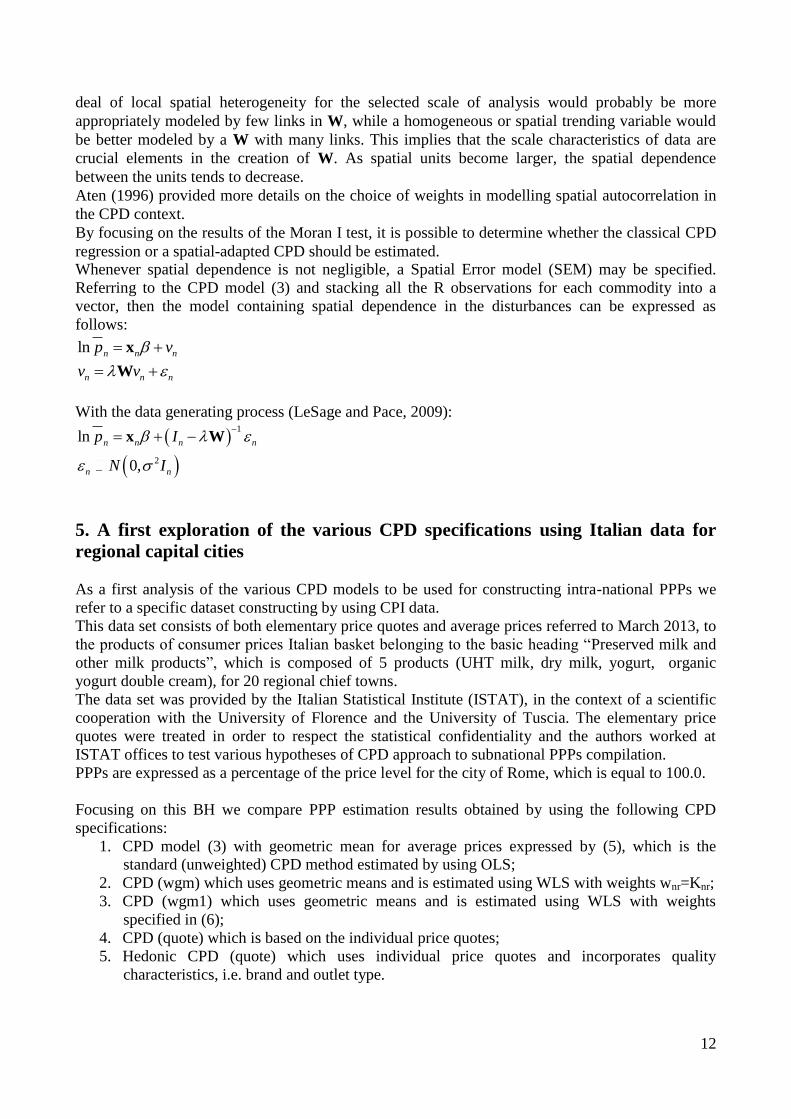
Firstly, let us examine the spatial variability of prices by using the box-plot. As an example, Figure
1 shows the box-plots for the price of preserved milk for March 2014 across the 20 regional capital
cities .
A greater level of variability emerges for the cities of Florence, Genoa and Rome.
Figure 1 Price level variability for the 20 regional chief towns: UHT Milk
.51
1.5
22.5
.51
1.5
22.5
.51
1.5
22.5
.51
1.5
22.5
Ancona Aosta Aquila Bari Bologna
Cagliari Campobasso Catanzaro Firenze Genova
Milano Napoli Palermo Perugia Potenza
Roma Torino Trento Trieste Venezia
Pri
ce le
vels
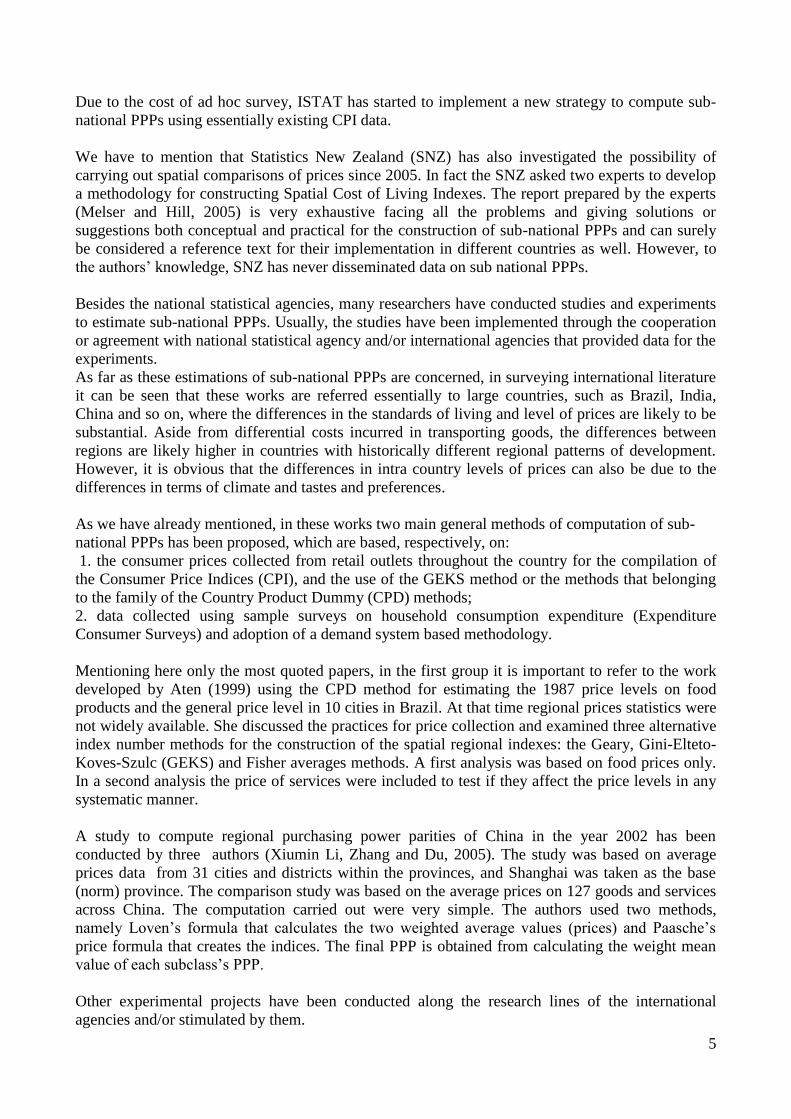
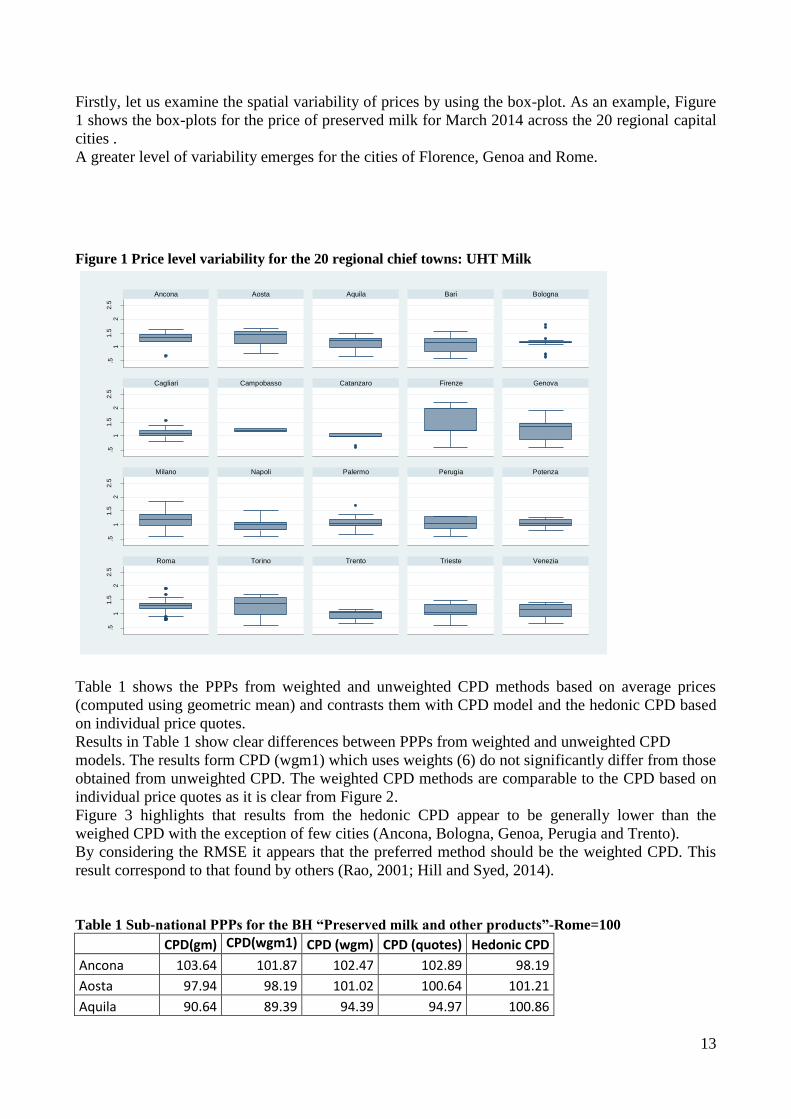
Table 1 shows the PPPs from weighted and unweighted CPD methods based on average prices
(computed using geometric mean) and contrasts them with CPD model and the hedonic CPD based
on individual price quotes.
Results in Table 1 show clear differences between PPPs from weighted and unweighted CPD
models. The results form CPD (wgm1) which uses weights (6) do not significantly differ from those
obtained from unweighted CPD. The weighted CPD methods are comparable to the CPD based on
individual price quotes as it is clear from Figure 2.
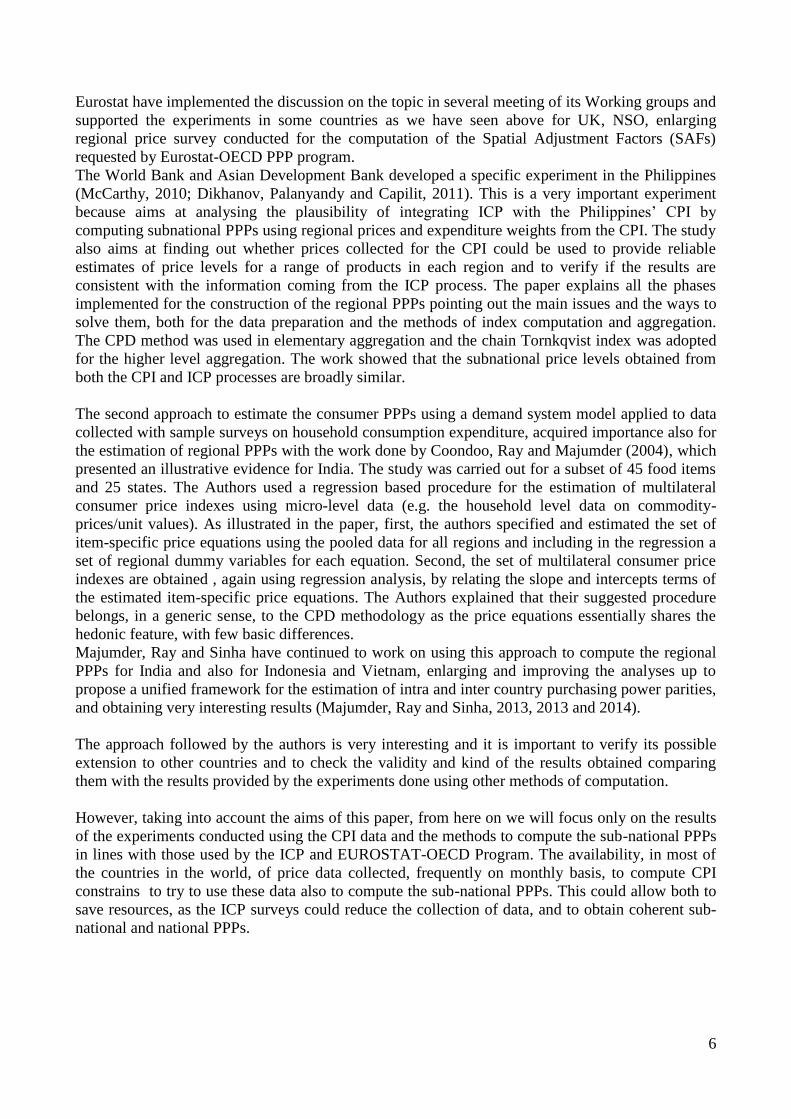
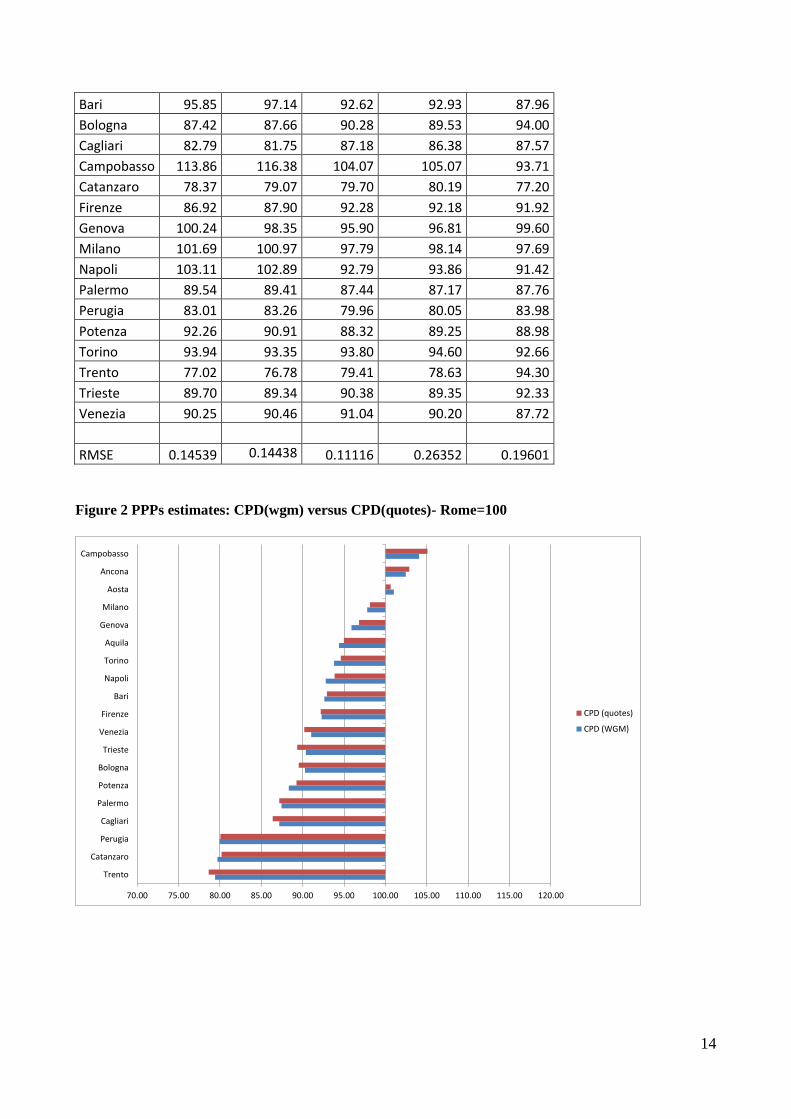
Figure 3 highlights that results from the hedonic CPD appear to be generally lower than the
weighed CPD with the exception of few cities (Ancona, Bologna, Genoa, Perugia and Trento).
By considering the RMSE it appears that the preferred method should be the weighted CPD. This
result correspond to that found by others (Rao, 2001; Hill and Syed, 2014).
Table 1 Sub-national PPPs for the BH “Preserved milk and other products”-Rome=100
CPD(gm) CPD(wgm1) CPD (wgm) CPD (quotes) Hedonic CPD
Ancona 103.64 101.87 102.47 102.89 98.19
Aosta 97.94 98.19 101.02 100.64 101.21
Aquila 90.64 89.39 94.39 94.97 100.86
14
Bari 95.85 97.14 92.62 92.93 87.96
Bologna 87.42 87.66 90.28 89.53 94.00
Cagliari 82.79 81.75 87.18 86.38 87.57
Campobasso 113.86 116.38 104.07 105.07 93.71
Catanzaro 78.37 79.07 79.70 80.19 77.20
Firenze 86.92 87.90 92.28 92.18 91.92
Genova 100.24 98.35 95.90 96.81 99.60
Milano 101.69 100.97 97.79 98.14 97.69
Napoli 103.11 102.89 92.79 93.86 91.42
Palermo 89.54 89.41 87.44 87.17 87.76
Perugia 83.01 83.26 79.96 80.05 83.98
Potenza 92.26 90.91 88.32 89.25 88.98
Torino 93.94 93.35 93.80 94.60 92.66
Trento 77.02 76.78 79.41 78.63 94.30
Trieste 89.70 89.34 90.38 89.35 92.33
Venezia 90.25 90.46 91.04 90.20 87.72
RMSE 0.14539 0.14438 0.11116 0.26352 0.19601
Figure 2 PPPs estimates: CPD(wgm) versus CPD(quotes)- Rome=100
70.00 75.00 80.00 85.00 90.00 95.00 100.00 105.00 110.00 115.00 120.00
Trento
Catanzaro
Perugia
Cagliari
Palermo
Potenza
Bologna
Trieste
Venezia
Firenze
Bari
Napoli
Torino
Aquila
Genova
Milano
Aosta
Ancona
Campobasso
CPD (quotes)
CPD (WGM)
15
Figure 3 PPPs estimates: CPD(wgm) versus Hedonic CPD- Rome=100
70.00 75.00 80.00 85.00 90.00 95.00 100.00 105.00 110.00 115.00 120.00
Trento
Catanzaro
Perugia
Cagliari
Palermo
Potenza
Bologna
Trieste
Venezia
Firenze
Bari
Napoli
Torino
Aquila
Genova
Milano
Aosta
Ancona
Campobasso
Hedonic CPD
CDP(wgm)
Besides the analysis of the various PPP estimates, it is important to verify their accuracy in order to
determine if the purchasing power of a country’s currency unit in a region can be distinguished
from the others in that country significantly (i.e. purchasing power of euro in the various Italian
regions represented by the regional chief towns).
This issue is particularly important considering the possible use of PPPs for converting household
consumption expenditure or income levels.
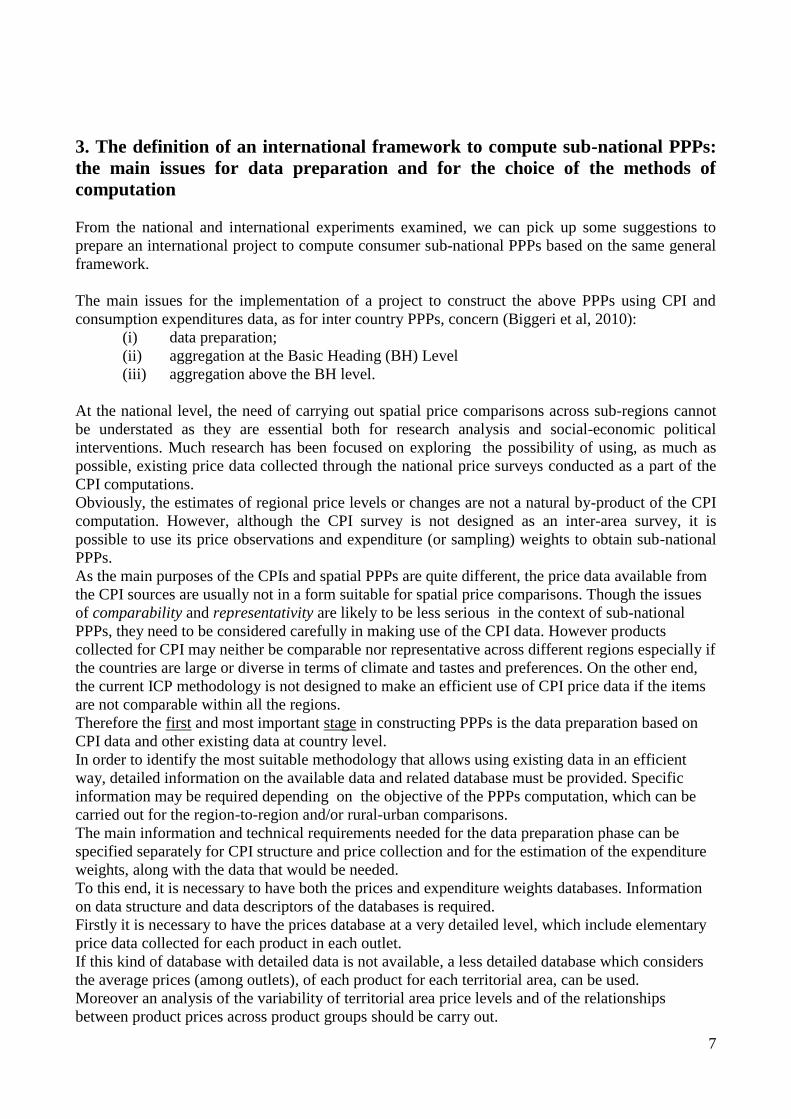
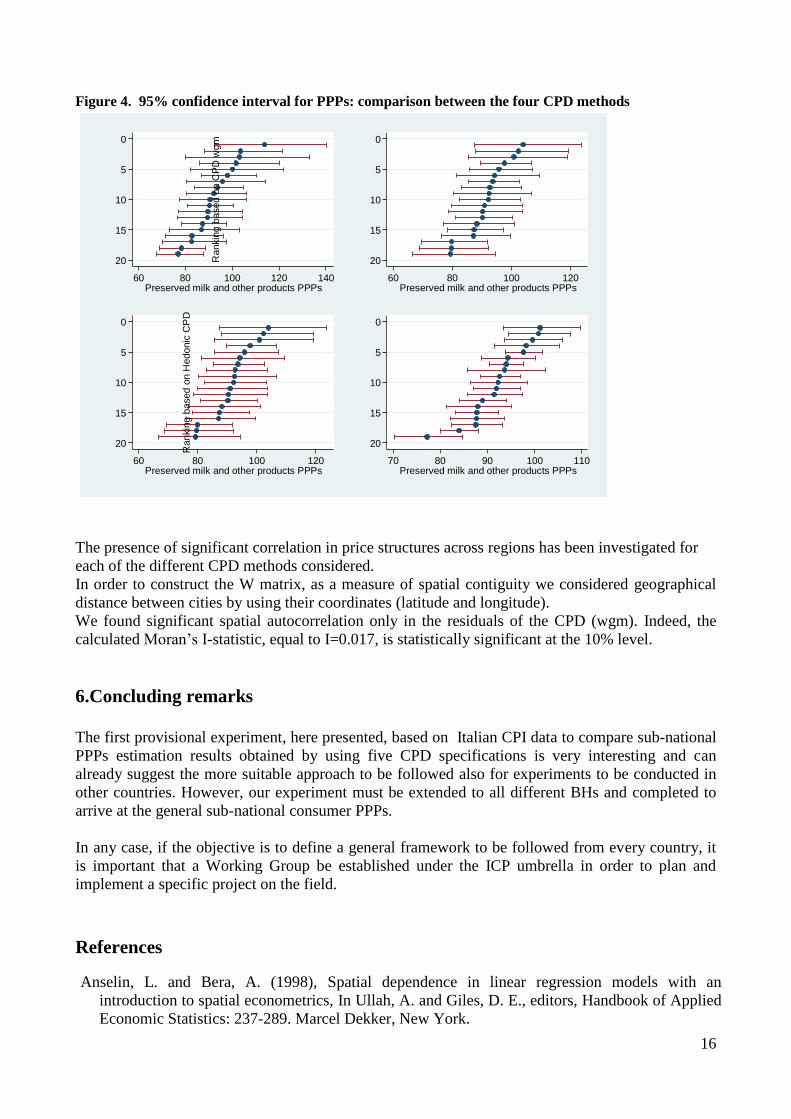
Figure 4 shows the estimated PPPs (the blue dots in the figure below) for each regional chief towns
obtained from the four CPD models together with the 95% confidence intervals associated with the
point-estimates. Confidence intervals that do not overlap enable us to consider the purchasing
power of a country’s currency unit in a region significantly different from the others while a
considerable overlapping in the confidence intervals suggests that there is a low level of precision in
the estimates thus emphasizing a high level of uncertainty in the rankings.
Two main issues are observed by analysing the four rankings presented in Figure 4. The average
lengths of the confidence intervals decrease for the hedonic CPD compared to the unweighed CPD
(CPDgm). Moreover, significant changes in the magnitude and the distribution of the point
estimates are observed since the S-shaped distribution of the estimated PPPs characterizing the
unweighted CPD considerably increased for the hedonic CPD thus making the comparison among
purchasing power in the various regions more reliable.
16
Figure 4. 95% confidence interval for PPPs: comparison between the four CPD methods
0
5
10
15
20
Rankin
g b
ased o
n u
nw
eig
hte
d C
PD
60 80 100 120 140Preserved milk and other products PPPs
0
5
10
15
20Rankin
g b
ased o
n C
PD
wgm
60 80 100 120Preserved milk and other products PPPs
0
5
10
15
20
Rankin
g b
ased o
n C
PD
(quote
s)
60 80 100 120Preserved milk and other products PPPs
0
5
10
15
20
Rankin
g b
ased o
n H
edonic
CP
D
70 80 90 100 110Preserved milk and other products PPPs
The presence of significant correlation in price structures across regions has been investigated for
each of the different CPD methods considered.
In order to construct the W matrix, as a measure of spatial contiguity we considered geographical
distance between cities by using their coordinates (latitude and longitude).
We found significant spatial autocorrelation only in the residuals of the CPD (wgm). Indeed, the
calculated Moran’s I-statistic, equal to I=0.017, is statistically significant at the 10% level.
6.Concluding remarks
The first provisional experiment, here presented, based on Italian CPI data to compare sub-national
PPPs estimation results obtained by using five CPD specifications is very interesting and can
already suggest the more suitable approach to be followed also for experiments to be conducted in
other countries. However, our experiment must be extended to all different BHs and completed to
arrive at the general sub-national consumer PPPs.
In any case, if the objective is to define a general framework to be followed from every country, it
is important that a Working Group be established under the ICP umbrella in order to plan and
implement a specific project on the field.
References
Anselin, L. and Bera, A. (1998), Spatial dependence in linear regression models with an
introduction to spatial econometrics, In Ullah, A. and Giles, D. E., editors, Handbook of Applied
Economic Statistics: 237-289. Marcel Dekker, New York.
17
Aten, B. H. (1996), “Evidence of Spatial Autocorrelation in International Prices”, Review of Income
and Wealth, June, 42, 2, 149–63.
Aten, B. H. (2005), "Report on Interarea Price Levels" Working Paper No. 2005-11, Bureau of
Economic Analysis, May.
Aten, B. H. (2006), “Interarea Price Levels: An Experimental Methodology”, Monthly Labor
Review, September, 129, 9, 47–61.
Aten, B.H. and Reinsdorf M., (2010), “Comparing the Consistency of Price Parities for Regions on
the U.S. in an Economic Approach Framework”, Paper presented at the 31st General Conference
of IARIW, St. Gallen Switzerland.
Aten H.B., E.B.Figueroa and T. M. Martin (2014), “Regional Price Parities for States and
Metropolitan Ares, 2006-2010”, Survey of Current Business,Bureau of Economic Analisis,
Washington, US.
Biggeri L. et al. (2010), Sub National PPPs based on integration with CPIs, Research Project, Draft
Proposal, Paper presented at the 2nd
ICP Technical Advisory Group Meeting, Washington DC,
February 17-19.
Biggeri L., De Carli R. and Laureti T. (2008), “The interpretation of the PPPs: a method for
measuring the factors that affect the comparisons and the integration with the CPI work at
regional level”, paper presented at the Joint UNECE/ILO meeting on Consumer Price Indices,
May 8-9, Geneva.
Biggeri L. and Laureti T. (2009), “Are integration and comparison between CPIs and PPPs
feasible?” , in Price Indices in Time and Space, Luigi Biggeri and Guido Ferrari (eds.),Springer,
2009, forthcoming.
Bretell S. and B. Gardiner (2002), “The development of a System of European Regional Purchasing
Power Parities”, European Regional Science Association Congress, Dortmund, 27-31 August,
2002.
Chun Y. and Griffith D.A (2013), Spatial statistics & Geostatistics. SAGE Publications Ltd.
Coondoo D., A. Majumder and R. Ray (2004), “A method of calculating regional consumer price
differentials with illustrative evidence from India”, Review of Income and Whealth, Series 50,
Number 1, march.
De Carli R. (2008), “An experiment to calculate PPPs at regional level in Italy: procedure adopted
and analyses of the results”, paper presented at the Joint UNECE/ILO meeting on Consumer
Price Indices, May 8-9, Geneva.
Dikhanov Y., C. Palanyandy and E. Capilit (2011), “Subnational Purchasing Power Parities toward
Integration of International Comparison Program and the Consumer Price Index: The Case of
Philippines”, ADB Economics Working Paper Series, n.290, Asian Development Bank.
Diewert, W. E. (2004), “On the Stochastic Approach to Linking Regions in the ICP.” Paper
prepared for Development Economics Data Group (DECDG), World Bank, Washington DC.
Diewert, W. E. (2005), “Weighted Country Product Dummy Variable Regressions and Index
Number Formulae”, Review of Income and Wealth, 51, 4, December, 561–70.
Diewert, W. E. (2008), “New Methodology for Linking Regional PPPS”, ICP Bulletin, 5,2, August,
1, 10–21.
Diewert, E. (2010), “New methodological developments for the international comparison program”,
Review of Income and Wealth Series 56, Special Issue 1, S11- S31.
Fenwick, D. and O’Donoghue J. (2003), “Developing estimates of relative regional consumer price
levels”, Economic Trends No. 599 October 2003, .72-83
Fischer, M.M. and Getis, A. (eds.) (2010). Handbook of Applied Spatial Analysis, Springer, Berlin,
Heidelberg and New York.
Heston, A.W. (1996), "Some problems in item Price Comparisons with Special Reference to uses of
CPI Prices in Estimating Spatial Heading Parities", in Improving the Quality of Price Indices:
CPI and PPP, EUROSTAT, Proceedings of the International Seminar held in Florence,
December 18-20, 1995
18
Hill, P. (2007), Estimation of PPPs for Basic Headings Within Regions, Chapter 11 in ICP 2003-
2006 Handbook, Washington D.C.: The World Bank.
Hill R.J. and T.P.Hill (2009), “Recent Developments in the International Comparison of Prices and
Real Output”, Macroeconomic Dynamics, 13 (Supplement 2), 2009, 194–217.
Hill, R. and I.A. Syed (2010), “Accounting for Unrepresentative Products and Urban-Rural Price
Diffrences in International Comparisons of Real Income: An Application to the Asia-Pacific
Region”, UNSW, Australian School of Business, Research Paper, N. 2010 ECON 25
Hill R.J. and I.A. Syed (2014), “Improving International Comparisons of Prices at Basic Heading
Level: an Application to the Asia-Pacific Region”, Review of Income and Wealth, DOI:
10.1111/roiw.12116
ISTAT (2010), La differenza nel livello dei prezzi al consumo tra i capoluoghi delle regioni
italiane, Anno 2009. Kmenta, Jan (1986), Elements of Econometrics, 2nd Edition, New York: Maxwell Macmillan
International Edition.
Kokoski M. (1991), “New Research on Interarea Consumer Price Differences”, Monthly Labor
Review, Vol. 114.
Kokoski, M. and Moulton B, and Zieschang K. (1999), “Interarea Price Comparisons for
Heterogenous Goods and Several Levels of Commodity Aggregation”, in International and
Interarea Comparisons of Income, Output and Prices, ed.,by Alan Heston and Robert Lipsey,
123-66. University of Chicago Press.
LeSage J. and Pace, R.K. (2009), Introduction to Spatial Econometrics, Chapman &Hall.
Majumder A., R.Ray and K. Sinha (2013), “Spatial Comparisons of Prices and Expenditure in a
Heterogeneous Country: Methodology with application to India”, forthcoming in
Macroeconomic Dynamics, received by the authors.
Majumder A., R.Ray and K. Sinha (2013), “Estimating Purchasing Power Parities from Household
Expenditure Data Using Complete Demand Systems with Application to Living Standards
Comparisons: India and Vietnam”, Review of Income and Wealth.
Majumder A., R.Ray and K. Sinha (2014), “A Unified Framework for the Estimation of Intra and
Inter Country Food Purchasing Power Parities with Application to Cross Country Comparisons
of Food Expenditure: India, Indonesia and Vietnam”, paper provided by the authors.
McCarthy P. (2010), Asia and Pacific Region, Sub-National Purchasing Power Parities – Case
study for the Philippines, Paper presented at the 2nd
ICP Technical Advisory Group Meeting,
Washington DC, February 17-19.
McCarthy P. (2010), Asia and Pacific Region, Sub-National Purchasing Power Parities – Case
study for the Philippines, Paper presented at the 2nd ICP Technical Advisory Group Meeting,
Washington DC, February 17-19.
Melser D. and R.Hill (2005), Developing A Methodology for Constructing Spatial Cost of living
Indexes, Economic Department, University of New South Wales, Sidney, Australia
ONS (2011), UK Relative Regional Consumer Price levels for Goods and Services for 2010, Uk.
Rao D. S. P. (2001), “Integration of CPI and PPP: Methodological Issues, Feasibility and
Recommendations”, Joint World Bank-OECD Seminar on PPP, Washington, DC.
Rao, D. S. P.(2002), “On the Equivalence of Weighted Country-Product-Dummy (CPD) Method
and the Rao System for Multilateral Price Comparisons”, School of Economics, University of
New England, Armidale, Australia, March.
Rao, D. S. Prasada (2004), “The Country-Product-Dummy Method: A Stochastic Approach to the
Computation of Purchasing Power Parities in the ICP”, Paper presented at the SSHRC
Conference on Index Numbers and Productivity Measurement, Vancouver, June 30–July 3,
2004.
Silver, M. (2009), “The Hedonic Country Product Dummy Method and Quality Adjustments for
Purchasing Power Parity Calculations”, IMF working paper WP/09/271.
19
Xiumin L., L. Zhang and Y. Du (2005), “Study on the Method of Regional Purchasing Power Parity
in China”, China-USA Business Review Jul. 2005, Volume 4, No.7 (Serial No.25).
Waschka, A. M., W. Khoo, J. Quirey T. and Zhao, S. (2003), Comparing Living Costs in Australian
Capital Cities. A Progress Report on Developing Experimental Spatial Price Indexes for
Australia, Australian Bureau of Statistics.
Wingfield D., Fenwick D. and Smith K. (2005), “Relative regional consumer price levels in 2004”,
Economic Trends, N. 615, February 2005, 36-46