Embed Size (px)
Citation preview
2017-09-01
Sub Group on Advanced Biofuels
Cost of Biofuel
Disclaimer
This report has been prepared for the SGAB group as background material and as such has been accepted and used as working material by the group. However, the view and opinions in this report are the author’s and do not necessarily state or reflect those of the Commission or any of the individuals or organization that are members of, or observers to the SGAB group.
References to products, processes, or services by trade name, trademark, manufacturer or the like does not constitute or imply an endorsement or recommendation of these by the Commission or the Organizations represented by the SGAB Members' and Observers
Neither the Commission nor any person acting on the Commission’s, or, the Organizations represented by the SGAB Members' and Observers' behalf make any warranty, or assumes any legal liability or responsibility for the accuracy, completeness, or usefulness of any information contained herein.
Date: 12 February 2017 (First Published) Revised: 01 September 2017

2017-09-01
SGAB Cost of Biofuels SGAB Cost of Biofuels .............................................................................................................................. 3
Abbreviations .......................................................................................................................................... 6
Conversion Factors and Units .............................................................................................................. 7
SGAB Renewable Fuel Targets; biofuel quantities and relation to the EU use of energy for transports 8
Take Away Messages ........................................................................................................................... 8
1 Background and purpose of this memo ........................................................................................ 11
1.1 Technology Status ................................................................................................................. 12
2 Methodology and Data used ......................................................................................................... 15
2.1 Gathering of information ...................................................................................................... 15
2.2 Data ....................................................................................................................................... 17
2.3 Methodology ......................................................................................................................... 18
3 Thermochemical and chemical conversion (incl. lipid routes) ...................................................... 19
3.1 Synthetic fuels via gasification .............................................................................................. 19
3.1.1 Capital Expenditure (CAPEX) ......................................................................................... 20
Methane and methanol production .......................................................................................... 20
Production of FT products ......................................................................................................... 21
3.1.2 Operating Expenditure (OPEX) ...................................................................................... 21
Methane and methanol production .......................................................................................... 21
FT liquids production ................................................................................................................. 22
3.1.3 Cost of production ......................................................................................................... 23
3.1.4 Feedback from SGAB members ..................................................................................... 25
European Biogas Association (EBA) ........................................................................................... 25
3.2 Pyrolysis oil upgrading ........................................................................................................... 25
3.2.1 Cost of Production ......................................................................................................... 26
3.2.2 Capital Expenditure (CAPEX) ......................................................................................... 27
3.2.3 Operating Expenditure (OPEX) ...................................................................................... 29
3.3 Wastes lipids to Hydrotreated Vegetable Oils (HVO) ............................................................ 30
3.3.1 Production cost ............................................................................................................. 30
3.3.2 Capital Expenditure (CAPEX) ......................................................................................... 30
3.3.3 Operating Expenditure (OPEX) ...................................................................................... 31
3.3.4 Feedstock....................................................................................................................... 31
3.3.5 Stakeholder feedback .................................................................................................... 32
3.4 Waste lipid-based biodiesel .................................................................................................. 32

2017-09-01
3.4.1 Feedstocks ..................................................................................................................... 33
3.4.2 CAPEX ............................................................................................................................ 35
3.4.3 OPEX .............................................................................................................................. 36
3.4.4 Production Cost ............................................................................................................. 36
3.4.5 Stakeholder feedback .................................................................................................... 37
4 Biochemical Conversion-methane ................................................................................................ 38
4.1 Ethanol from lignocellulosic sugar via fermentation ............................................................ 38
4.1.1 Production cost ............................................................................................................. 38
4.1.2 Capital Expenditure (CAPEX) ......................................................................................... 38
4.1.3 Operation Expenditure (OPEX) ...................................................................................... 40
4.1.4 Performance .................................................................................................................. 43
4.1.5 Feedback from SGAB members ..................................................................................... 43
DuPont ....................................................................................................................................... 43
St1 .............................................................................................................................................. 43
Abengoa..................................................................................................................................... 44
Clariant ...................................................................................................................................... 45
4.2 Biomethane via anaerobic digestion ..................................................................................... 46
4.2.1 Production cost ............................................................................................................. 47
4.2.2 Capital Expenditure (CAPEX) ......................................................................................... 47
4.2.3 Operational Expenditure (OPEX) ................................................................................... 48
4.2.4 Feedstock and performance .......................................................................................... 48
4.2.5 Feedback from stakeholders ......................................................................................... 49
EBA ............................................................................................................................................ 49
4.3 Hydrocarbons and alcohols from waste gaseous material via gas fermentation ................. 50
LanzaTech .................................................................................................................................. 50
5 Aviation fuels ................................................................................................................................. 53
5.1 Alternative production routes ............................................................................................ 53
5.2 Market conditions and available incentives ...................................................................... 55
5.3 Bio-kerosene fuel production cost ..................................................................................... 58
5.4 Comments to production cost data for aviation fuels .......................................................... 59
Comment 1: ATJ via Ethanol ...................................................................................................... 59
Comment 2: HDO technology from oil seeds to aviation fuels ................................................. 59
Comment 3: Aviation fuel via pyrolysis of cellulosic materials ................................................. 59
Comment 4 SIP from sugars ................................................................................................... 61
2017-09-01
Comment 5 Forest biomass and straw to aviation fuels via HTL .............................................. 61
Comment 6 Aviation fuels from FT ........................................................................................ 62
6 Comparison of the results and discussion ..................................................................................... 63
6.1 Production Cost Summary ..................................................................................................... 64
6.2 Plant investment ................................................................................................................... 65
6.3 Synthetic long chain hydrocarbons via the FT route ............................................................. 66
6.4 Oxygenates such as methanol and DME and biomethane ................................................... 67
6.5 Upgrading of pyrolysis oil ...................................................................................................... 68
6.6 Hydrotreated Vegetable Oils (HVO) ...................................................................................... 69
6.7 Waste lipid-based biodiesel, UCOME .................................................................................... 69
6.8 Ethanol from lignocellulosic sugar via fermentation ............................................................ 70
6.9 Biomethane via anaerobic digestion ..................................................................................... 70
6.10 Aviation fuels ......................................................................................................................... 71
6
2017-09-01
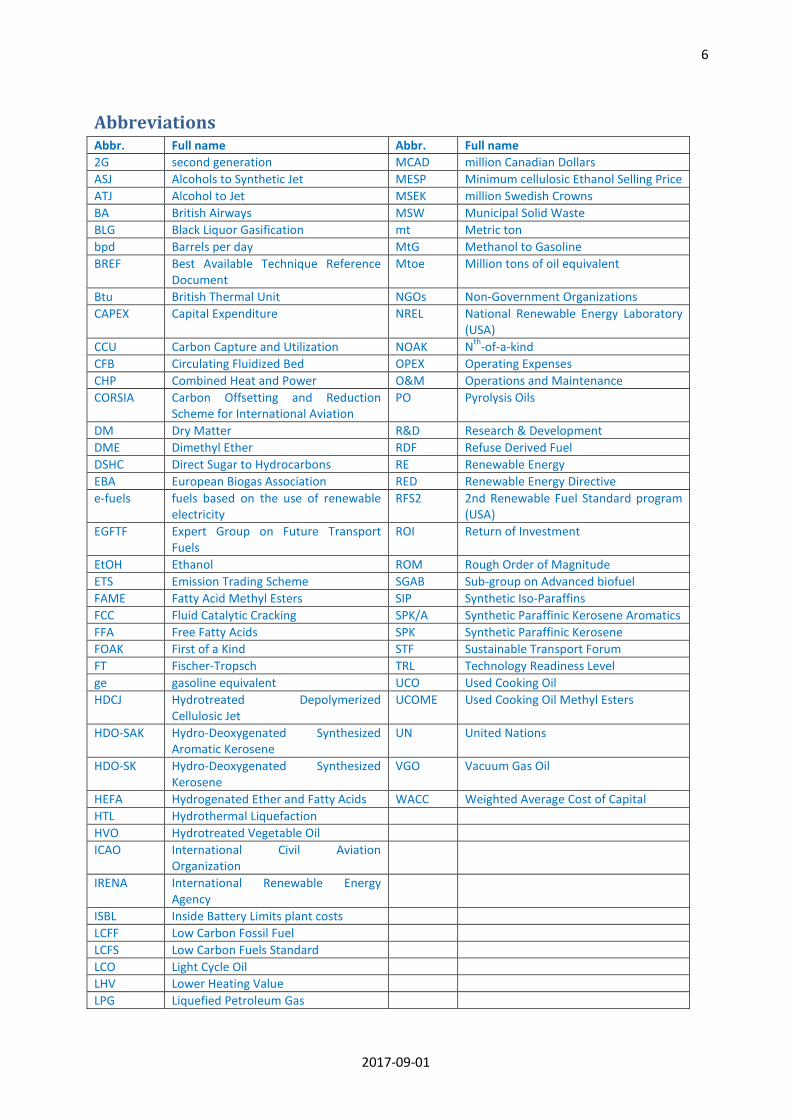
Abbreviations Abbr. Full name Abbr. Full name 2G second generation MCAD million Canadian Dollars ASJ Alcohols to Synthetic Jet MESP Minimum cellulosic Ethanol Selling Price ATJ Alcohol to Jet MSEK million Swedish Crowns BA British Airways MSW Municipal Solid Waste BLG Black Liquor Gasification mt Metric ton bpd Barrels per day MtG Methanol to Gasoline BREF Best Available Technique Reference
Document Mtoe Million tons of oil equivalent
Btu British Thermal Unit NGOs Non-Government Organizations CAPEX Capital Expenditure NREL National Renewable Energy Laboratory
(USA) CCU Carbon Capture and Utilization NOAK Nth-of-a-kind CFB Circulating Fluidized Bed OPEX Operating Expenses CHP Combined Heat and Power O&M Operations and Maintenance CORSIA Carbon Offsetting and Reduction
Scheme for International Aviation PO Pyrolysis Oils
DM Dry Matter R&D Research & Development DME Dimethyl Ether RDF Refuse Derived Fuel DSHC Direct Sugar to Hydrocarbons RE Renewable Energy EBA European Biogas Association RED Renewable Energy Directive e-fuels fuels based on the use of renewable
electricity RFS2 2nd Renewable Fuel Standard program
(USA) EGFTF Expert Group on Future Transport
Fuels ROI Return of Investment
EtOH Ethanol ROM Rough Order of Magnitude ETS Emission Trading Scheme SGAB Sub-group on Advanced biofuel FAME Fatty Acid Methyl Esters SIP Synthetic Iso-Paraffins FCC Fluid Catalytic Cracking SPK/A Synthetic Paraffinic Kerosene Aromatics FFA Free Fatty Acids SPK Synthetic Paraffinic Kerosene FOAK First of a Kind STF Sustainable Transport Forum FT Fischer-Tropsch TRL Technology Readiness Level ge gasoline equivalent UCO Used Cooking Oil HDCJ Hydrotreated Depolymerized
Cellulosic Jet UCOME Used Cooking Oil Methyl Esters
HDO-SAK Hydro-Deoxygenated Synthesized Aromatic Kerosene
UN United Nations
HDO-SK Hydro-Deoxygenated Synthesized Kerosene
VGO Vacuum Gas Oil
HEFA Hydrogenated Ether and Fatty Acids WACC Weighted Average Cost of Capital HTL Hydrothermal Liquefaction HVO Hydrotreated Vegetable Oil ICAO International Civil Aviation
Organization
IRENA International Renewable Energy Agency
ISBL Inside Battery Limits plant costs LCFF Low Carbon Fossil Fuel LCFS Low Carbon Fuels Standard LCO Light Cycle Oil LHV Lower Heating Value LPG Liquefied Petroleum Gas
7
2017-09-01
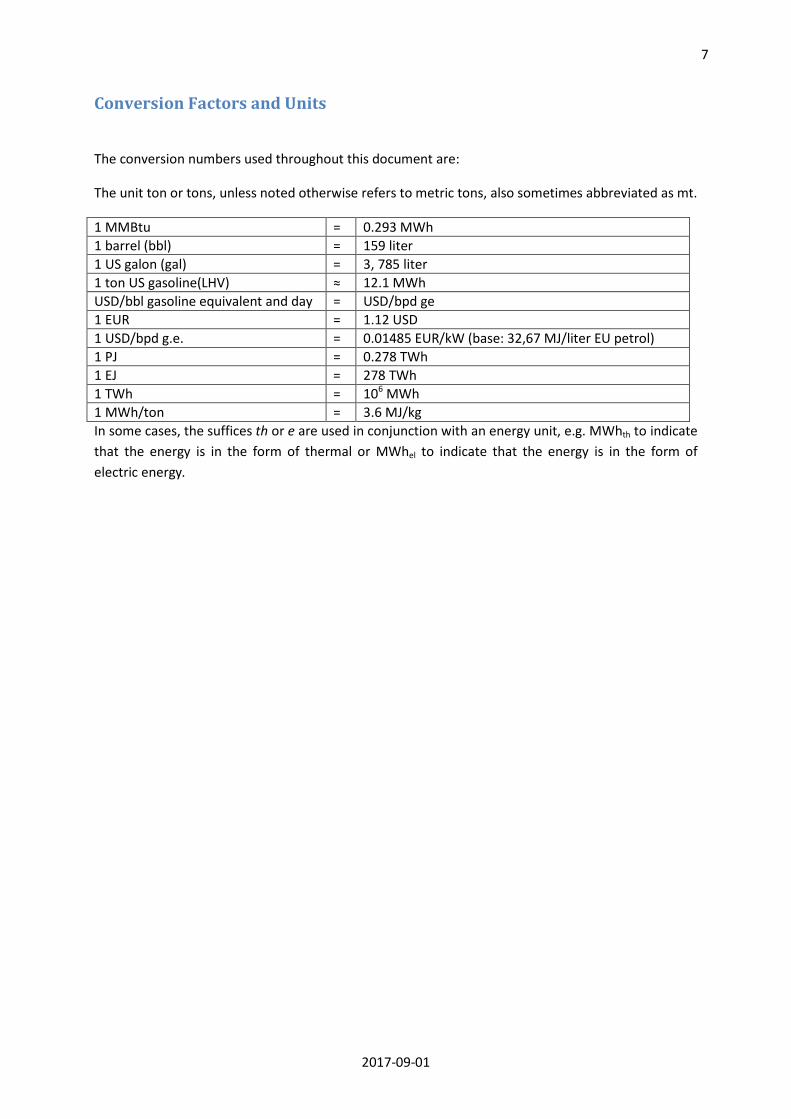
Conversion Factors and Units
The conversion numbers used throughout this document are:
The unit ton or tons, unless noted otherwise refers to metric tons, also sometimes abbreviated as mt.
1 MMBtu = 0.293 MWh 1 barrel (bbl) = 159 liter 1 US galon (gal) = 3, 785 liter 1 ton US gasoline(LHV) ≈ 12.1 MWh USD/bbl gasoline equivalent and day = USD/bpd ge 1 EUR = 1.12 USD 1 USD/bpd g.e. = 0.01485 EUR/kW (base: 32,67 MJ/liter EU petrol) 1 PJ = 0.278 TWh 1 EJ = 278 TWh 1 TWh = 106 MWh 1 MWh/ton = 3.6 MJ/kg In some cases, the suffices th or e are used in conjunction with an energy unit, e.g. MWhth to indicate that the energy is in the form of thermal or MWhel to indicate that the energy is in the form of electric energy.

8
2017-09-01
SGAB Renewable Fuel Targets; biofuel quantities and relation to the EU use of energy for transports
Take Away Messages Biofuels will remain more expensive than fossil fuels (with rare exceptions) unless the costs of mitigating climate change are going to be factored in the cost of fossil fuels.
• The cost of biofuels is mainly governed by the cost of the resource (feedstock) and cost of capital (the investment) and only value chains based on waste streams with zero or negative cost offer possibilities for competitive cost production at present.
Fuels for aviation • Aviation fuel is one product or side product in processes that generate drop-in fuels (diesel,
gasoline, kerosene) in varying proportions, such that production cost is related to the product slate and value of all products
• Aviation Hydrogenated Ether and Fatty Acids (HEFA) can be produced at a cost of 80-90 EUR/MWh
• Aviation via Fischer-Tropsch (FT) synthesis or through sugar pathway can be produced at a cost of 110-140 EUR/MWh
Commercially available biofuels • Biomethane produced from waste streams and via biogas (anaerobic digestion) has at
present the lowest cost at about 40-50 EUR/MWh. In certain niche markets it can be competitive to fossil fuels.
• Hydrotreated Vegetable Oils (HVO) has a production cost in the range of 50-90 EUR/MWh subject to the cost of the feedstock.
Cellulosic ethanol at the stage of early commercialisation • The production cost of cellulosic ethanol is estimated in the range of 90-110 EUR/MWh
subject to the feedstock cost. Biofuels in the stage of First of a Kind (FOAK)
• Biomethane, methanol, ethanol and DME from waste and biomass via gasification have a production cost of 60-80 EUR/MWh.
• Transport fuels via the FT process have a production cost of 90-140 EUR/MWh subject to the feedstock cost and comparably high investment intensity.
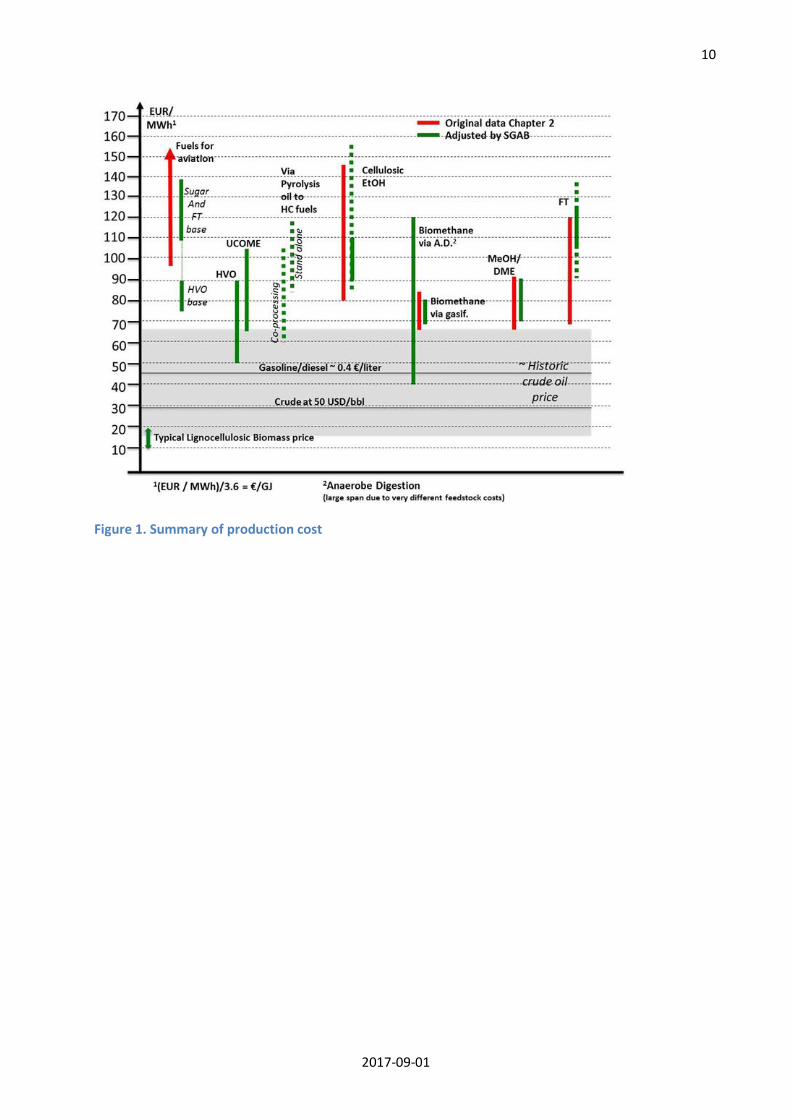
The key Take Away messages are based on work carried out by the SGAB group. Production cost data are summarized the Table 1. They are a summary of information provided in Figure 1 and from data taken from the memo.
9
2017-09-01
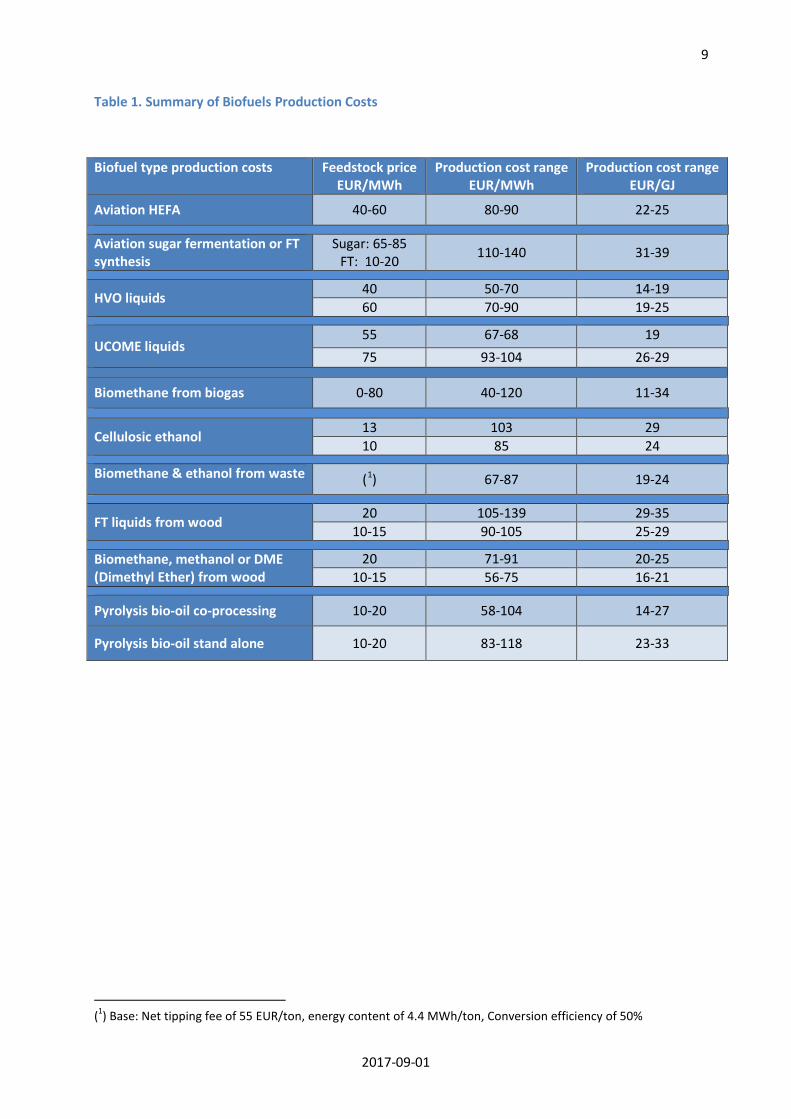
Table 1. Summary of Biofuels Production Costs
Biofuel type production costs Feedstock price EUR/MWh
Production cost range EUR/MWh
Production cost range EUR/GJ
Aviation HEFA 40-60 80-90 22-25
Aviation sugar fermentation or FT synthesis
Sugar: 65-85 FT: 10-20 110-140 31-39
HVO liquids 40 50-70 14-19 60 70-90 19-25
UCOME liquids 55 67-68 19 75 93-104 26-29
Biomethane from biogas 0-80 40-120 11-34
Cellulosic ethanol 13 103 29 10 85 24
Biomethane & ethanol from waste (1) 67-87 19-24
FT liquids from wood 20 105-139 29-35 10-15 90-105 25-29
Biomethane, methanol or DME (Dimethyl Ether) from wood
20 71-91 20-25 10-15 56-75 16-21
Pyrolysis bio-oil co-processing 10-20 58-104 14-27
Pyrolysis bio-oil stand alone 10-20 83-118 23-33
(1) Base: Net tipping fee of 55 EUR/ton, energy content of 4.4 MWh/ton, Conversion efficiency of 50%
10
2017-09-01
Figure 1. Summary of production cost

11
2017-09-01
1 Background and purpose of this memo
The Sub-group on Advanced biofuels (SGAB), to the Sustainable Transport Forum (STF), is chaired by the EC and has some thirty members that represent biofuel, fuel, vehicle and transport industries, while other stakeholders such as national authorities, Non-Government Organizations (NGOs) and others are welcomed as observers. SGAB, which had its first meeting in December 2015 and the end meeting in October 2016, had a main defined deliverable to give a recommendation on targets for advanced biofuels in 2030. Furthermore, SGAB was invited to propose suitable policy measures to facilitate the establishment of flagship, First-of-a-kind (FOAK) plants, and stimulate further duplication and deployment of such technologies to arrive at fully commercial so-called Nth-of-a-kind (NOAK) plants. Such policy measures include, but is not limited to, various means of economically supporting innovation and technical developments to go from pilot plants to prototypes and later more widely adopted for industrial deployment.
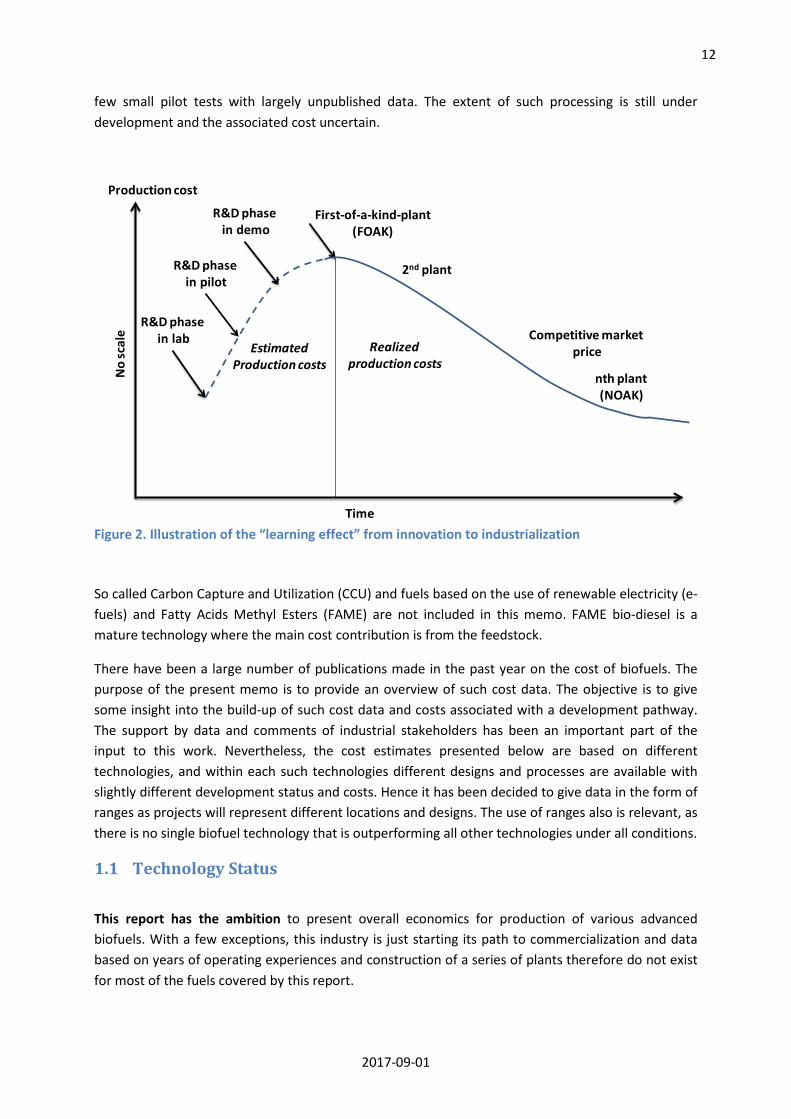
The advanced renewable fuel technologies under discussion span over a wide range of technical readiness. Some fuels, like e.g. hydrogenated lipids (often referred to as HVO) is already a commercial technology with a global capacity approaching 4 Million tons of oil equivalent (Mtoe) per year, other technologies have industrial prototype installations in early operation whereas yet other technologies are partly demonstrated or have only yet reached further than to a conceptual stage. This has an impact on the judgment of the economic performance while moving through the development stages to the FOAK stage. This is illustrated in Figure 2. Increased insight in the overall process is often accompanied by a cost increase as more detailed designs involves additions to the core process concept to have an operable industrial unit, while societal aspects also influence the design in terms of e.g. environmental performance and other factors not readily available in the Research & Development (R&D) phase. Once a FOAK plant comes into operation and is replicated towards the NOAK stage, costs are reduced as learning and innovation are added to the next design, and risk allowances can be reduced.
For this reason, reference should be made to the separate SGAB memo, Technology status and reliability of the value chains. Since there is a scarcity of quality data for technologies that have yet not reached Technology Readiness Level (TRL) of 7-9, i.e. FOAK development stage the technologies considered in this memo are:
- oxygenates and hydrocarbons from thermochemical processing of lignocellulosic biomass or waste streams,
- drop-in hydrocarbon fuels from hydrogenation of waste lipids (HVO), - oxygenates and hydrocarbons from biochemical processing of lignocellulosic biomass or waste
streams and, - bio-methane from anaerobic digestion or from gasification of lignocellulosic materials or waste
streams
Technologies that are being pursued and where SGAB has considered these possible to be introduced and used in 2030, but still to some extent covered in this memo are the upgrading of Pyrolysis Oils (PO) to hydrocarbon drop-in fuels and so-called Low Carbon Fossil Fuel (LCFF) fuels. In the case of pyrolysis oils, the FOAK stage for the intermediate pyrolysis oil has been reached in Canada, USA, Finland and the Netherlands. However, the upgrading has this far been tested at R&D scale and in a
12
2017-09-01
few small pilot tests with largely unpublished data. The extent of such processing is still under development and the associated cost uncertain.
Figure 2. Illustration of the “learning effect” from innovation to industrialization
So called Carbon Capture and Utilization (CCU) and fuels based on the use of renewable electricity (e-fuels) and Fatty Acids Methyl Esters (FAME) are not included in this memo. FAME bio-diesel is a mature technology where the main cost contribution is from the feedstock.
There have been a large number of publications made in the past year on the cost of biofuels. The purpose of the present memo is to provide an overview of such cost data. The objective is to give some insight into the build-up of such cost data and costs associated with a development pathway. The support by data and comments of industrial stakeholders has been an important part of the input to this work. Nevertheless, the cost estimates presented below are based on different technologies, and within each such technologies different designs and processes are available with slightly different development status and costs. Hence it has been decided to give data in the form of ranges as projects will represent different locations and designs. The use of ranges also is relevant, as there is no single biofuel technology that is outperforming all other technologies under all conditions.
1.1 Technology Status
This report has the ambition to present overall economics for production of various advanced biofuels. With a few exceptions, this industry is just starting its path to commercialization and data based on years of operating experiences and construction of a series of plants therefore do not exist for most of the fuels covered by this report.
Production cost
R&D phasein lab
R&D phasein pilot
R&D phasein demo
Competitive market price
First-of-a-kind-plant(FOAK)
2nd plant
nth plant(NOAK)
No
scal
e
Time
EstimatedProduction costs
Realized production costs
13
2017-09-01
• Lignocellulosic or second generation (2G) Ethanol (EtOH) is on the verge of being commercial with several industrial scale FOAK plants using a variety of integrated technologies in early operation. The technology developers are competing in licensing their technology to locations with strong support policies. All of them are based on agricultural residues while technologies based on forestry residues still have to reach the level of industrial scale demonstration.
• Gasification technologies lag relative to 2G EtOH, with a small number of plants in early operation and in pilots. Technically it could provide quantities in 2030 if the move to scale can be accomplished during the coming years. Due to high investment intensity for demo scale plants, larger scale installed plant capacities are in focus which makes it more complex to realize the FOAK industrial scale plant even though their total fuel production costs are comparably attractive.
Another hampering circumstance is that gasification based production utilizes a number of processes in combination. Successful gasification technology development needs to be combined with synthesis gas conditioning and cleaning and with synthesis technology to generate the desired product from the syngas. Investors tend to demand wraparound guarantee from one single company for the whole plant to feel comfortable to get involved. This can cause difficulties especially for FOAK plant for which commercial performance is jet not demonstrated.
• Two relatively small trials of co-processing PO in refineries in Brazil and the USA are known to have taken place. Upgrading capacity for pyrolysis oil will at first instance largely use existing refinery infrastructure.
Exceptions where industry is already commercial today relates to two conversion routes, HVO production from a variety of feedstocks and biomethane through anaerobic digestion of biological material.
• Hydrogenated Vegetable Oil (HVO) production is today at a scale of millions of tons produced from large plants integrated into the existing oil industry. The EU oil industry is retrofitting existing refineries to produce HVO. Future production capacity growth is limited by availability of sustainable oils but could double. However, when used oils and process residues from industrial operations are taken into consideration on a global scale the capacity can increase significantly. The expansion can be based on proprietary technologies from several licensors representing both own-operate entities but also at least two world-scale contractors that can provide technology to any third party.
• Biomethane through anaerobic digestion is already commercially available for use as transport fuel in captive fleets or injecting in the natural gas grid. The further development with respect to the scale that bio-based methane is used in transport depends on the competitive demand for biomethane for use in Combined Heat and Power (CHP)-plants.
This report does not have the ambition to draw “the final conclusion” of all good work generated in the field of advanced biofuels during the last couple of years. It will however claim to draw well based conclusions on the topic “Cost of Advanced Biofuels”. Chapter 2 describes how information has been gathered and reviewed. Results of this work are compared with other relevant work in the field of advanced biofuels. This is done on a fuel by fuel basis in the chapters thereafter.

14
2017-09-01
The overall results are presented in Chapter 6. Production cost of biofuels are there presented as cost of energy and data are presented as a span. It will give a well-founded base for how much production cost of advanced biofuels differs from cost of today’s main fuels, gasoline and diesel and can therefore be used when investigating what level of incentives would be needed in order to introduce advanced biofuels into the market.
Even commercially mature technologies for advanced biofuels need some kind of economic incentive to bring its products to the market. The level of incentive varies depending on cost of feedstock, production pathway and maturity of technology as is further elaborated in the next chapter.
15
2017-09-01
2 Methodology and Data used
2.1 Gathering of information
Members of SGAB have been asked to comment a base document sent by the SGAB core team (from Vice Chair Ingvar Landälv). The objective was presented as follows:
As we have seen from investigations within the SGAB group and from what we heard today (June 9, 2016) from the presentation by the Commission there is a strong consensus regarding the fact that biofuels cannot compete head to head with fossil fuels on a cost per energy basis. We often come back to the issue of the lack of long term support schemes to enable the introduction of advanced biofuels. We often get the question - How much support? - For how long time? - What is needed to bridge the difference? - Etc. We believe that well based information regarding these matters will add value to the final work delivered from SGAB to the Sustainable Transport Forum.
Due to limitations in time and resources, it was not considered possible to produce a new and comprehensive report on the Cost of Biofuels topic covering all pathways. Instead, the approach selected was to present a base of estimated production cost ranges for most of the different pathways to the group, and to which members were invited to comment.
With a very active and knowledgeable group of stakeholders including active developers and producers, as is the case in the SGAB group, it can be expected that the participants who would not agree to what is presented would comment and give corrections. The invitation to respond to the cost has been brought forth in all meetings except for the very first one. In addition, this invitation has also gone out three times via email. The outcome has been that information and comments have indeed been received from the stakeholders.
To get industry and developers to react to compiled data from other recent sources means to get the first-hand views of the active stakeholder on the economic situation of their respective pathways at a generic level.
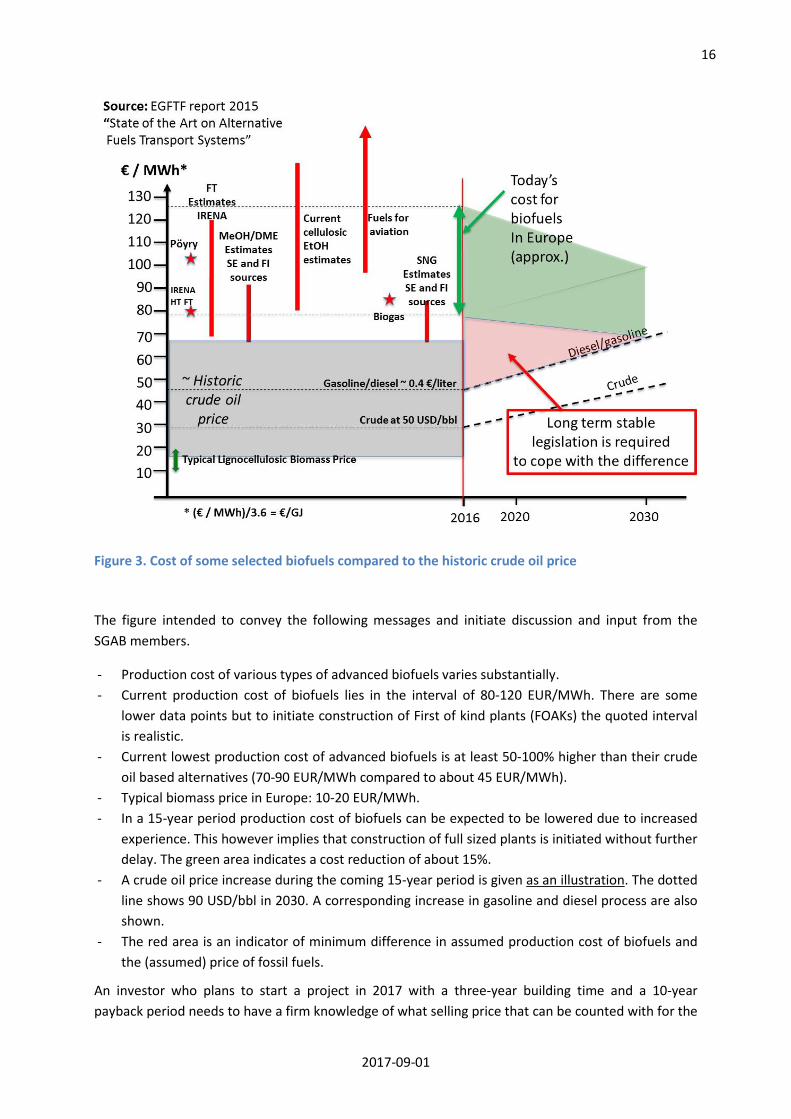
The “Cost of Biofuels” discussion was triggered by Figure 3 which was developed firstly to put in comparison some current published data on production costs of a number of the biofuels, secondly to show them in relation to cost of crude oil based fuels and finally to illustrate the often referred need for “long term stable legislation” required to launch advanced biofuels into the market.
16
2017-09-01
Figure 3. Cost of some selected biofuels compared to the historic crude oil price
The figure intended to convey the following messages and initiate discussion and input from the SGAB members.
- Production cost of various types of advanced biofuels varies substantially. - Current production cost of biofuels lies in the interval of 80-120 EUR/MWh. There are some
lower data points but to initiate construction of First of kind plants (FOAKs) the quoted interval is realistic.
- Current lowest production cost of advanced biofuels is at least 50-100% higher than their crude oil based alternatives (70-90 EUR/MWh compared to about 45 EUR/MWh).
- Typical biomass price in Europe: 10-20 EUR/MWh. - In a 15-year period production cost of biofuels can be expected to be lowered due to increased
experience. This however implies that construction of full sized plants is initiated without further delay. The green area indicates a cost reduction of about 15%.
- A crude oil price increase during the coming 15-year period is given as an illustration. The dotted line shows 90 USD/bbl in 2030. A corresponding increase in gasoline and diesel process are also shown.
- The red area is an indicator of minimum difference in assumed production cost of biofuels and the (assumed) price of fossil fuels.
An investor who plans to start a project in 2017 with a three-year building time and a 10-year payback period needs to have a firm knowledge of what selling price that can be counted with for the
17
2017-09-01
coming 13-year period. The difference between the required selling price and the actual prevailing cost of fuel in the market may shrink (lower subsidy required over time) or increase. A necessary support mechanism should preferably account for this.
Based on provided information the SGAB members were specifically asked to revert with comments and input relating to the following:
1. Comment to the overall task and to the presented cost data. Is it an effort worthwhile doing? Can this work add substantial value to the discussion regarding the role of biofuels in the transport sector?
2. Insert other sources of information with respect to production cost of advanced biofuels, your own data and/or data from reports you find well based.
3. Cost of fuel e.g. as EUR/MWh or EUR/GJ (lower heating value). 4. Cost of Capital. One source specifies capital cost as 10% Weighted Average Cost of Capital
(WACC) while another source presents it as “Capital cost” and Return of Investment (ROI) without giving any specifics.
5. Cost of Feedstock. To be presented as cost per ton of material with the water content specified. Cost per ton on a dry basis is preferred.
13 members of SGAB have come back with either identified reports they recognize as good sources of information or with own comments to the material. Stakeholder input is reflected in the chapters covering the various biofuels as well as in the Summary chapter.
2.2 Data
The cost data regarding Capital Expenditure (CAPEX) have, with the exception of data directly received from SGAB stakeholders, been found in publicly available documents, and have been cited when possible. Further sources are compilations and analyses of such data, made and analyzed by others. This category consists both of information published in publicly available reports and non-published material available to the authors of this memo, and here the full background cannot be disclosed.
Regarding Operating Expenses (OPEX), there is less specific information available in public or shared by the stakeholders. In most cases OPEX has been specified as a yearly cost related to a percentage of the plant investment. See the various biofuels for further information.
Performance i.e. the relation between the feedstock input and the product output has been based on a similar set of sources as for the CAPEX.
The cost of feedstock used in the estimates have been based on the values of traded feedstocks whenever possible, complemented by estimates from other sources or cost related to alternative processing cost, this latter is in particular applicable to wastes.
18
2017-09-01
2.3 Methodology
The methodology is based on a simplified methodology by estimating the production cost from a capital cost contribution, an OPEX contribution and the feedstock contribution. The CAPEX data have been collected from projects that have been or is in construction whenever possible, otherwise the cost is based on the cost estimates representing cost estimates for projects close to an investment decision that was not, or still is not reached. CAPEX has been converted to an investment intensity, expressed as medium value with a +/- and has been expressed as EUR/kW (some places complemented with USD/bpd ge or other units due to source of information) to allow comparison of capital expenditure for various biofuels and with other technologies also outside the biofuel area. Typical plants size varies considerably between small biogas plants to large plants for HVO production. Investment intensity (EUR/kW) should be studied having this in mind.
CAPEX is seen as equal to the overnight investment cost for building the plant and no cost for interest during construction or working capital has been added. The capital recovery charge is composed of an annual cost estimated as an annuity based on the CAPEX using a real interest of 10% for 15 years, i.e. a factor of 13.3% per year. Elements of a fully elaborated project economic model such as level of grant support, debt-to-equity ratio, loan repayment grace and amortization periods, etc. have been ignored.
OPEX, less feedstock, as used, have been expressed as an annual percentage of CAPEX or as a percentage of the production cost. The percentage includes co-feeds, labor, feedstock associated costs on the site, maintenance, by-product disposal etc. When available, relevant data from project estimates have been the basis for the percentage or other figures used.
Feedstock cost contribution is estimated from the performance data and feedstock cost.
The production cost estimated as the sum of the capital recovery charge, OPEX and feedstock procurement costs on an annual basis divided by the production output.
19
2017-09-01
3 Thermochemical and chemical conversion (incl. lipid routes)
This chapter covers various thermochemical routes and is divided into:
- Gasification to synthesis gas (syngas) to synthetic fuels, chapter 3.1 - Pyrolysis oil routes and, chapter 3.2 - Wastes lipids to Hydrotreated Vegetable Oils (HVO), chapter 3.3 - Waste lipid-based biodiesel, chapter 3.4
Production cost is covering cost at plant gate and disregarding distribution, storage and final use by the customer.
Pyrolysis oil may be a pretreatment step to gasification and for this application it is part of the first mentioned section. Pyrolysis oil for further processing into final or semi-final products is described in section 3.2.
3.1 Synthetic fuels via gasification
Biofuel products via gasification covered in this section can be divided as follows:
• Synthetic long chain hydrocarbons in the form of diesel (so called FT diesel), gasoline and kerosene.
• Oxygenates such as methanol, ethanol and DME. • Bio-methane.
Other product routes not mentioned but of often listed together with the above are hydrogen and (mix of) higher alcohols.
It should be noted that using the gasification route to utilize a certain feedstock (biomass, waste, black liquor in pulp mills etc.) generates a syngas which can be synthesized to any of the mentioned syngas derived products as well as other products produced via syngas.
From production point of view the production pathway is very similar in terms of its main process steps. The fuel is pre-treated by drying and sizing to suit the gasification technology used before being fed to the gasifier. In the gasification step (most likely being at elevated pressure and utilizing pure oxygen and steam as oxidant) the fuel is converted to a raw syngas is then followed by gas conditioning and purification where impurities and carbon dioxide is removed and finally, the clean synthesis gas is fed to a synthesis unit where it is reacted to desired product, which is upgraded to the marketable quality. Especially for the bio-methane route a low temperature, indirectly heated gasifier system can be advantageous because it generates considerable amount of methane already in the gasifier and the oxygen plant investment can be avoided.
The overall conversion efficiency is in principle the product of the individual conversion efficiencies of the four mentioned main process steps. Even if there may be other, exothermic conversion steps in the chain overall these have lower impact. Overall conversion, i.e. from fuel as received, up to ready for delivery product, ends up in the interval 40-65% (Low Heating Value - LHV) on an energy basis.

20
2017-09-01
There are some special applications such as gasification of black liquor in pulp mills where the overall conversion can reach around 70% and even higher. Utilization on of the by-products like steam/heat can increase the overall energy efficiency of the plant up to 5-10%, when integrated to district heating or combined heat and power production.
Another general observation is that long chain hydrocarbons are more energy consuming products. FT diesel and kerosene have the lowest yield from feedstock to product, and at the same time the highest investment. Production of biomethane (and also hydrogen), on the other hand, have high overall conversion efficiency and relatively low investment. The difference between these two extremes is quite significant.
3.1.1 Capital Expenditure (CAPEX)
Methane and methanol production
Capital cost has been evaluated in quite some detail by stakeholders and institutions involved in advanced technology development such as E.ON (200 MW output biomethane plant2), Chemrec (100 MW output methanol plant3) and VTT (200 MW output methanol plant4). When these plants are compared investment intensity are calculated to be 1,850 to 2,050 EUR/kW for the two larger plants and 3,450 EUR/kW for the smaller plant. If the latter plant is scaled to the size of the larger plant the investment will decrease to about 2,800 EUR/kW. The remaining difference is mainly due to a high level of reliability measures of redundancy in order to reach the demand for very high availability set by the commercially operated host pulp mill in this black liquor gasification case. The referred black liquor case (Chemrec) will in its commercial application be credited for avoiding the investment in the alternative technology; the today used recovery boiler technology. This leads to that the net investment is brought down to approximately half or 1,300-1,400 EUR/kWh.
A specific investment of 2,000 EUR/kW, operating 8,000 hours per year and a capital cost corresponding to 15 years and 10% results in a cost of capital in the product cost of 33 EUR/MWh. Deviation ±20% corresponds to a span of 26-40 EUR/kWh.
The company Enerkem has constructed a waste to methanol / ethanol plant in Edmonton, Canada (output ethanol approx. 22 MW). It is a first of a kind plant construction which can be expected to carry a higher investment than investments which will follows in its footsteps. Although the investment costs have not been disclosed by Enerkem, it has been publicly quoted by a non-Enerkem source to amount to 120 MCAD5 while the waste separation and Refuse Derived Fuel (RDF) fuel
2 Möller F.B, Molin A., Stahl. Kr.: “Bio2G - A Full-Scale Reference Plant in Sweden for Production of bio-SNG (Biomethane) based on thermal Gasification of Biomass”. 21st European Biomass Conference & Exhibition Copenhagen, Denmark, 3-7 June 2013. http://www.gastechnology.org/tcbiomass/tcb2013/04-Moller-tcbiomass2013-presentation-Wed.pdf. 3 Chemrec AB. 4 Ilkka Hannula and Esa Kurkela “Liquid transportation fuels via large-scale fluidised-bed gasification of lignocellulosic biomass”. VTT Technical Research Centre of Finland, Tekniikantie 4 A, Espoo, FI-02044, Finland. ISBN 978-951-38-7979-2, ISSN 2242-122X (Online). 2013. http://www.vtt.fi/inf/pdf/technology/2013/t91.pdf. 5 Atwell R.: “Task force’s work on waste management left out of plan”, 27-09-2016, Saanich News and Black Press Group Ltd, https://www.saanichnews.com/opinion/task-forces-work-on-waste-management-left-out-of-plan/, Accessed 28-06-2017.
21
2017-09-01
preparation plant cost 40 MCAD6,7 , i.e the total investment amounts to 160 MCAD, corresponding to approximately 105 MEUR. This gives an investment intensity of about and 4,700 EUR/kW and a capital-related cost of production of 77 EUR/MWh. For the Enerkem part the capital-related cost of production would amount to 57 EUR/MWh based on an investment intensity of 3,480 EUR/kW (investment of 120 MCAD). This concept uses assorted wastes as a feedstock, and economics are to an extent compensated due to zero to negative feedstock cost.
Production of FT products
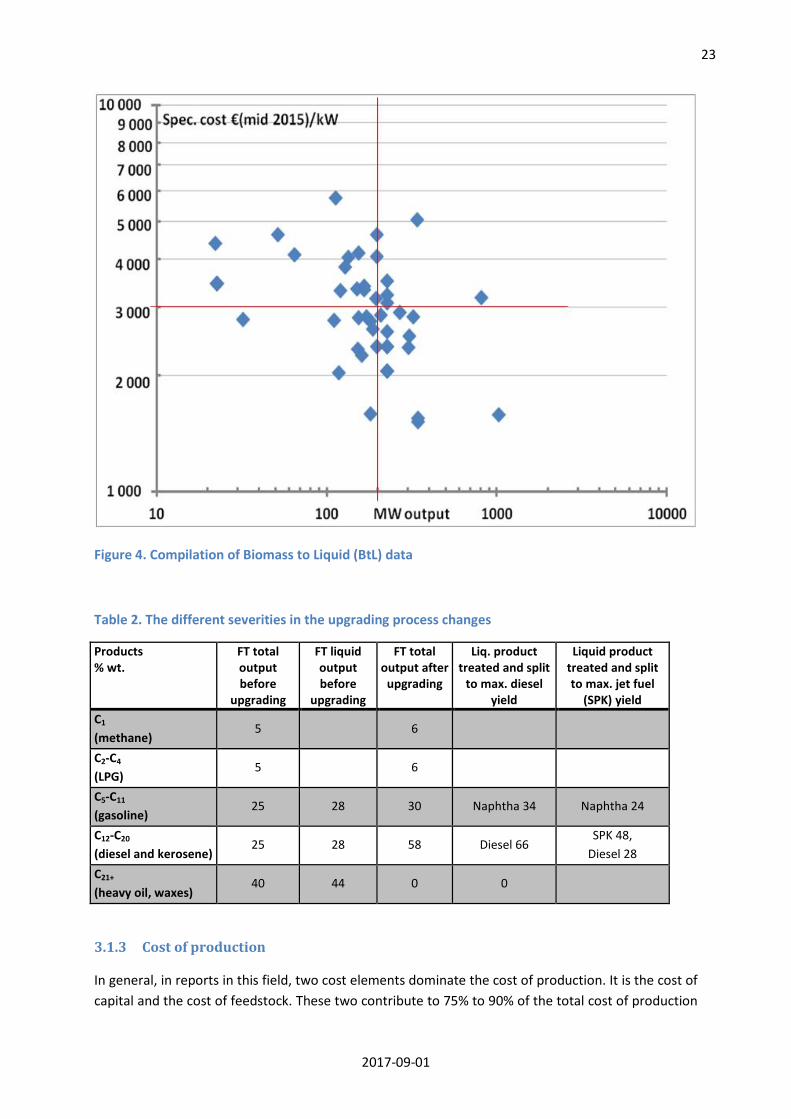
For the FT production data8 the information was based on a large number of studies and the estimates used are summarized in Figure 4. The spread of data is considerable and no clear trend in terms of economy of scale can be seen. In the figure, there is an indication of an FT product capacity of 200 MW. This number is chosen as being an average sized production for the data included in the diagram. “FT product” includes here all sellable products (see below). The selected plant size corresponds approximately to an investment intensity of 3,000 EUR/kW. With the same capital charge as for the methane/methanol cases, the capital cost contribution to the production cost is 49 EUR/MWh. A spread of ±750 EUR/kW (±50,000 USD/bpd ge) corresponds to a span of 37-61 EUR / MWh.
3.1.2 Operating Expenditure (OPEX)
Methane and methanol production
Conversion efficiency for biomass to methane and methanol is in the range of 60 to 70%. Biomass to methanol is typically around 60% and methane some percentage points higher while conversion to methanol in pulp mills around 70%.
With these conversion efficiencies and a feedstock price of 20 EUR/MWh this part of the production cost will contribute with 29-33 EUR/MWh for biomass to product.
Other operating costs (covering staff, maintenance, utility costs including electric power as well as catalyst replacements and chemicals consumed etc.) typically contributes about 20% (range 10-25%) to the total cost of production. This corresponds to an annual cost relative to the investment of 5-6%.
In the case of waste, the feedstock could be free, or even be associated with a “tipping fee”. The range varies between different countries from 0 EUR/MWh up to e.g. 20 EUR/MWh (in the UK). This would result that the feedstock cost in Table 2 (showing normal feedstock process) would change sign, which has a dramatic impact on the production cost picture. The following calculation case should be seen as an example:
6 Lane J.: “Enerkem: Alberta’s municipal waste to fuels juggernaut, in pictures”, Biofuels Digest Premium WordPress Themes, 22-10-2014 http://www.biofuelsdigest.com/bdigest/2014/10/22/enerkem-albertas-municipal-waste-to-fuels-juggernaut-in-pictures/ Accessed 28-06-2017. 7 City of Edmonton: “Factsheet - Edmonton Waste-to-Biofuels Initiative”, June 2014, https://www.edmonton.ca/programs_services/documents/PDF/Fact_Sheet_June_2014.pdf, Accessed 28-06-2017. 8 Waldheim Consulting unpublished work.

22
2017-09-01
- “1 solid ton of feed generates 100 gal of EtOH” (Ref to Rosemount Minnesota refinery9): - “a solid ton” contain 4.4 MWh (10% inorganics). - 50% approximately energy conversion efficiency from feedstock (MSW) to product. - 100 gal of ethanol contain 2.2 MWh. - Assume a credit of 55 EUR/ton of feed leads to a credit of feed energy of 12.5 EUR/MWh
(55/4.4) Therefore, to produce 1 MWh of ethanol there is a need for 2 MWh of waste energy with a credit to the plant of 2 x 12.5 = 25 EUR/MWh of product. This corresponds to a credit of 185 EUR/ton of ethanol (1 ton of ethanol holds 7.4 MWh of energy, 7.4 x 25 = 185) or 147 EUR/m3 of ethanol.
O&M costs for an Enerkem plant can be approximately determined via relating the yearly cost of O&M to plant investment. 6% of investment as yearly O&M would give 35 EUR/MWh of product (based on full investment 105 MEUR).
FT liquids production
The overall conversion efficiency from biomass to FT products is in the order of 40-55%, depending on the feedstock, the gasification technology, the FT technology and product slate optimization, plant capacity, etc. As the large span indicates conversion efficiency cannot be defined in detail. The product slate between the liquid product fractions of naphtha (gasoline), kerosene and diesel is defined by the raw FT liquid (“FT crude”) upgrading process design severity which can to some degree be optimized for specific market demands to generate either diesel and gasoline only or also have a significant fraction of Synthetic Paraffinic Kerosene (SPK) bio-kerosene to be used as aviation fuel.
Table 2 gives an indicative example of the magnitude of how different severities in the upgrading process changes the product slate from a diesel only case to a high yield of kerosene case (SPK bio-jet). It should also be noted that the C21+ waxes produced are important industrial products with a commercial value, such that also other combinations can be obtained.
In any case the FT process is not a single product process. All products are present in significant quantities regardless which way the upgrading is designed.
With a background in how different the various technologies for the gasification and the upgrading steps can be, a large span with respect to conversion efficiency is obtained. A feedstock price of 20 EUR/MWh will thus contribute with 36-50 EUR/MWh to the production cost of FT products.
Other operating costs contribute to about 15-25% to the total cost of production. Another way to determine these costs is to estimate them as annual cost relative to the investment. Typical number used is 5-10%.
9 Dawes T, “Enerkem proposes construction of $200 million Minnesota biofuel facility”, Cantech letter, 5-10-2016, http://www.cantechletter.com/2016/10/enerkem-proposes-construction-200-million-minnesota-biofuel-facility, Accessed25-06-2017.
23
2017-09-01
Figure 4. Compilation of Biomass to Liquid (BtL) data
Table 2. The different severities in the upgrading process changes
Products % wt.
FT total output before
upgrading
FT liquid output before
upgrading
FT total output after
upgrading
Liq. product treated and split
to max. diesel yield
Liquid product treated and split to max. jet fuel
(SPK) yield C1
(methane) 5 6
C2-C4 (LPG)
5 6
C5-C11 (gasoline)
25 28 30 Naphtha 34 Naphtha 24
C12-C20 (diesel and kerosene)
25 28 58 Diesel 66 SPK 48,
Diesel 28 C21+ (heavy oil, waxes)
40 44 0 0
3.1.3 Cost of production
In general, in reports in this field, two cost elements dominate the cost of production. It is the cost of capital and the cost of feedstock. These two contribute to 75% to 90% of the total cost of production
24
2017-09-01
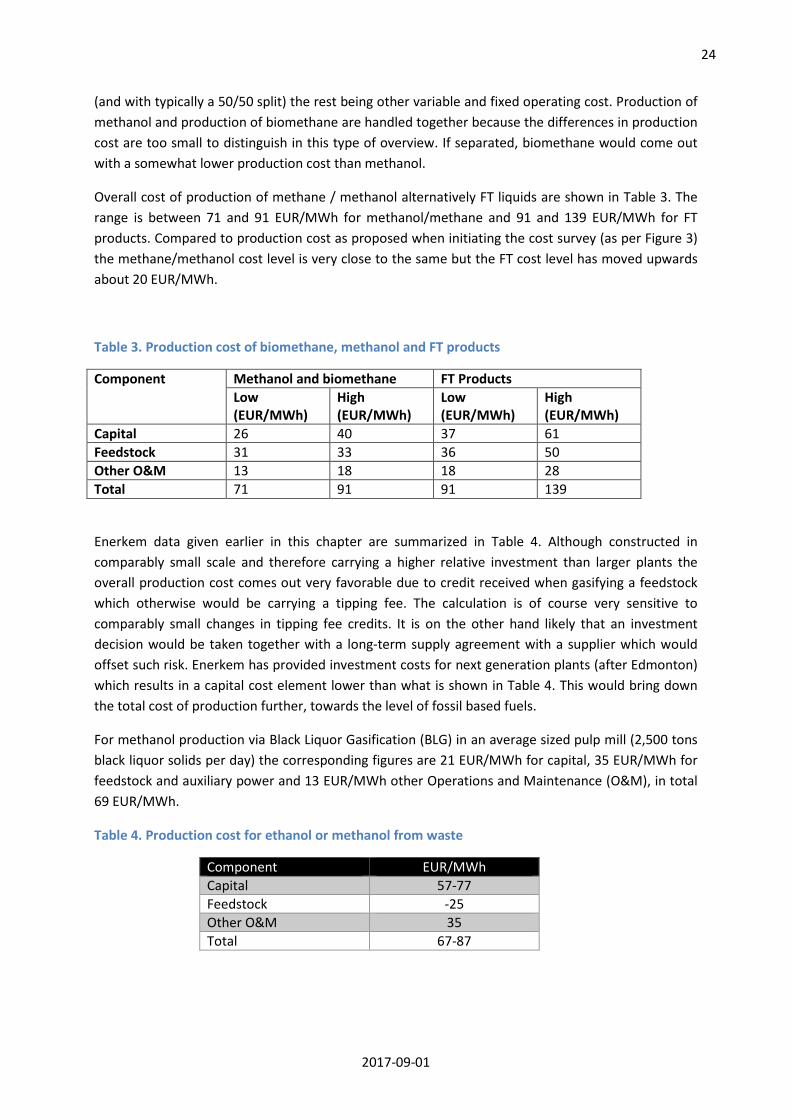
(and with typically a 50/50 split) the rest being other variable and fixed operating cost. Production of methanol and production of biomethane are handled together because the differences in production cost are too small to distinguish in this type of overview. If separated, biomethane would come out with a somewhat lower production cost than methanol.
Overall cost of production of methane / methanol alternatively FT liquids are shown in Table 3. The range is between 71 and 91 EUR/MWh for methanol/methane and 91 and 139 EUR/MWh for FT products. Compared to production cost as proposed when initiating the cost survey (as per Figure 3) the methane/methanol cost level is very close to the same but the FT cost level has moved upwards about 20 EUR/MWh.
Table 3. Production cost of biomethane, methanol and FT products
Component Methanol and biomethane FT Products Low (EUR/MWh)
High (EUR/MWh)
Low (EUR/MWh)
High (EUR/MWh)
Capital 26 40 37 61 Feedstock 31 33 36 50 Other O&M 13 18 18 28 Total 71 91 91 139
Enerkem data given earlier in this chapter are summarized in Table 4. Although constructed in comparably small scale and therefore carrying a higher relative investment than larger plants the overall production cost comes out very favorable due to credit received when gasifying a feedstock which otherwise would be carrying a tipping fee. The calculation is of course very sensitive to comparably small changes in tipping fee credits. It is on the other hand likely that an investment decision would be taken together with a long-term supply agreement with a supplier which would offset such risk. Enerkem has provided investment costs for next generation plants (after Edmonton) which results in a capital cost element lower than what is shown in Table 4. This would bring down the total cost of production further, towards the level of fossil based fuels.
For methanol production via Black Liquor Gasification (BLG) in an average sized pulp mill (2,500 tons black liquor solids per day) the corresponding figures are 21 EUR/MWh for capital, 35 EUR/MWh for feedstock and auxiliary power and 13 EUR/MWh other Operations and Maintenance (O&M), in total 69 EUR/MWh.
Table 4. Production cost for ethanol or methanol from waste
Component EUR/MWh Capital 57-77 Feedstock -25 Other O&M 35 Total 67-87
25
2017-09-01
3.1.4 Feedback from SGAB members
• European Biogas Association (EBA)
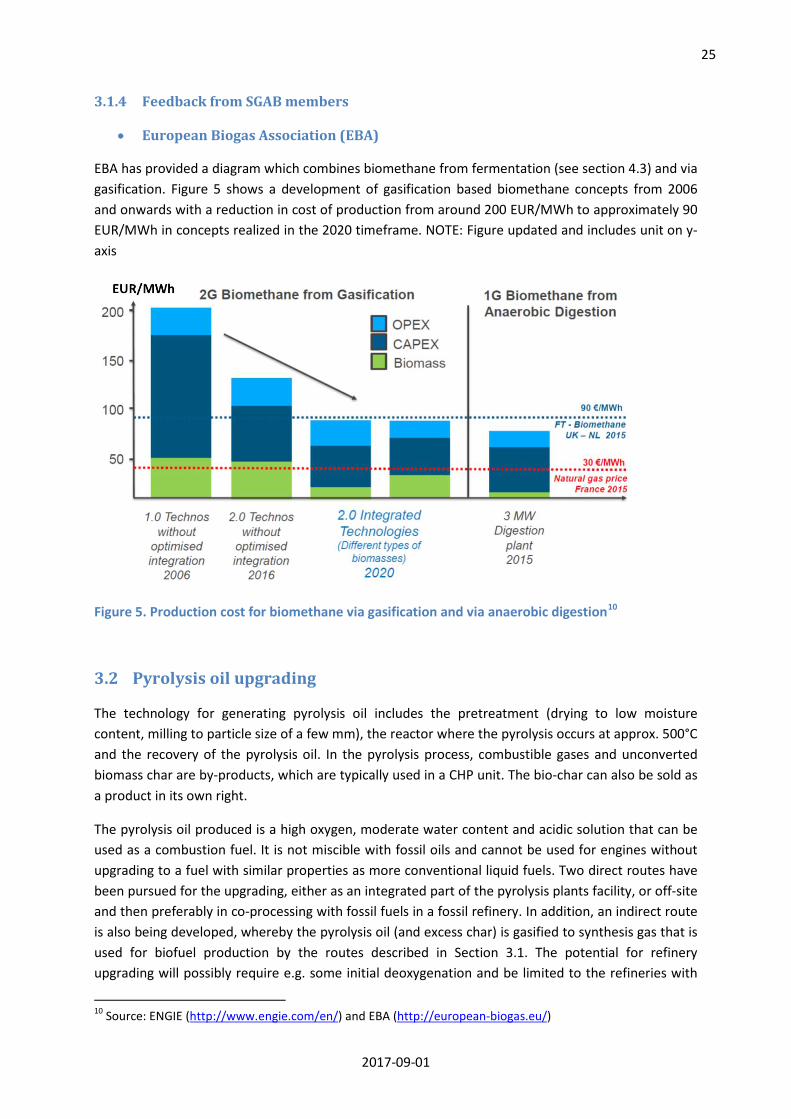
EBA has provided a diagram which combines biomethane from fermentation (see section 4.3) and via gasification. Figure 5 shows a development of gasification based biomethane concepts from 2006 and onwards with a reduction in cost of production from around 200 EUR/MWh to approximately 90 EUR/MWh in concepts realized in the 2020 timeframe. NOTE: Figure updated and includes unit on y-axis
Figure 5. Production cost for biomethane via gasification and via anaerobic digestion10
3.2 Pyrolysis oil upgrading
The technology for generating pyrolysis oil includes the pretreatment (drying to low moisture content, milling to particle size of a few mm), the reactor where the pyrolysis occurs at approx. 500°C and the recovery of the pyrolysis oil. In the pyrolysis process, combustible gases and unconverted biomass char are by-products, which are typically used in a CHP unit. The bio-char can also be sold as a product in its own right.
The pyrolysis oil produced is a high oxygen, moderate water content and acidic solution that can be used as a combustion fuel. It is not miscible with fossil oils and cannot be used for engines without upgrading to a fuel with similar properties as more conventional liquid fuels. Two direct routes have been pursued for the upgrading, either as an integrated part of the pyrolysis plants facility, or off-site and then preferably in co-processing with fossil fuels in a fossil refinery. In addition, an indirect route is also being developed, whereby the pyrolysis oil (and excess char) is gasified to synthesis gas that is used for biofuel production by the routes described in Section 3.1. The potential for refinery upgrading will possibly require e.g. some initial deoxygenation and be limited to the refineries with
10 Source: ENGIE (http://www.engie.com/en/) and EBA (http://european-biogas.eu/)
26
2017-09-01
suitable technologies (Fuel Catalytic Cracking (FCC), hydrotreatment etc.). The blend-in rate of into the fossil streams in such refineries is therefore in practice limited to a magnitude of 2-10%, depending on the pre-processing of the PO intermediate11, 12 (deoxygenation etc.).
Both routes have significant technical challenges, and the integrated route has only been pursued at laboratory scale this far, i.e. below TRL 5. The co-processing route has been explored in pilot tests in a refinery in Brazil with, and will be tested also by Valero in California, in both cases using PO from Ensyn Corp., Canada. The figures given below then give very indicative production costs for co-processing and for a dedicated upgrading.
3.2.1 Cost of Production
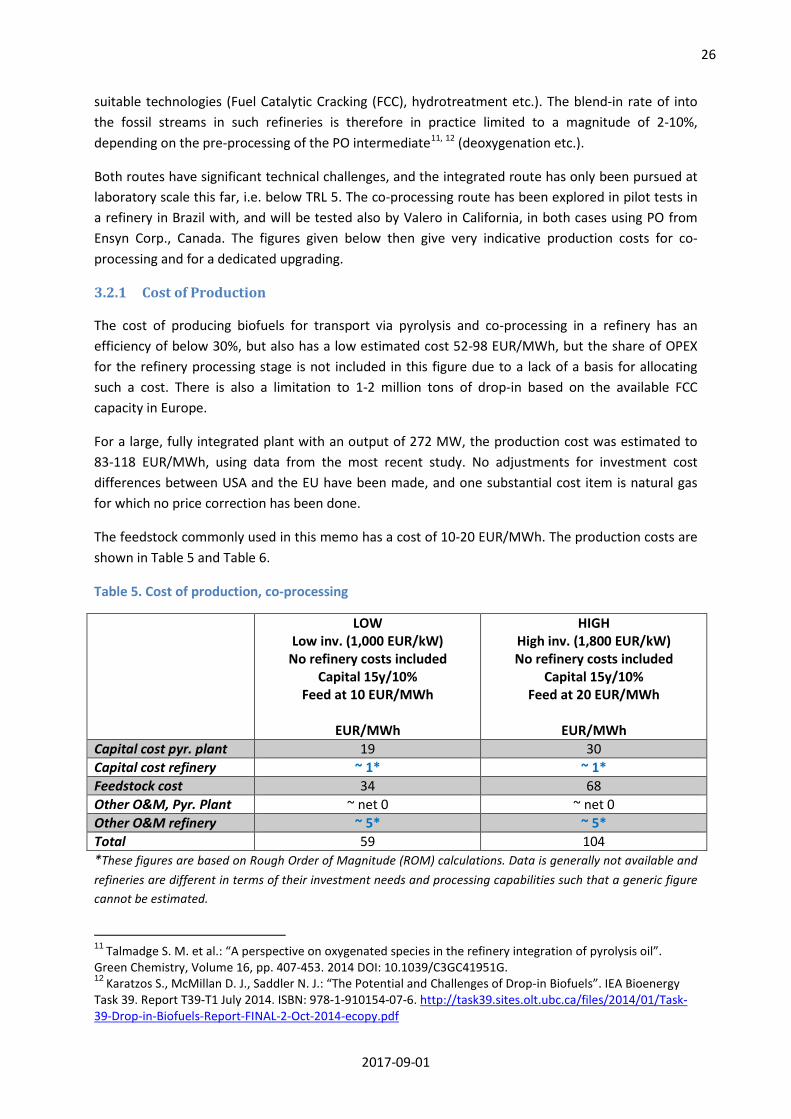
The cost of producing biofuels for transport via pyrolysis and co-processing in a refinery has an efficiency of below 30%, but also has a low estimated cost 52-98 EUR/MWh, but the share of OPEX for the refinery processing stage is not included in this figure due to a lack of a basis for allocating such a cost. There is also a limitation to 1-2 million tons of drop-in based on the available FCC capacity in Europe.
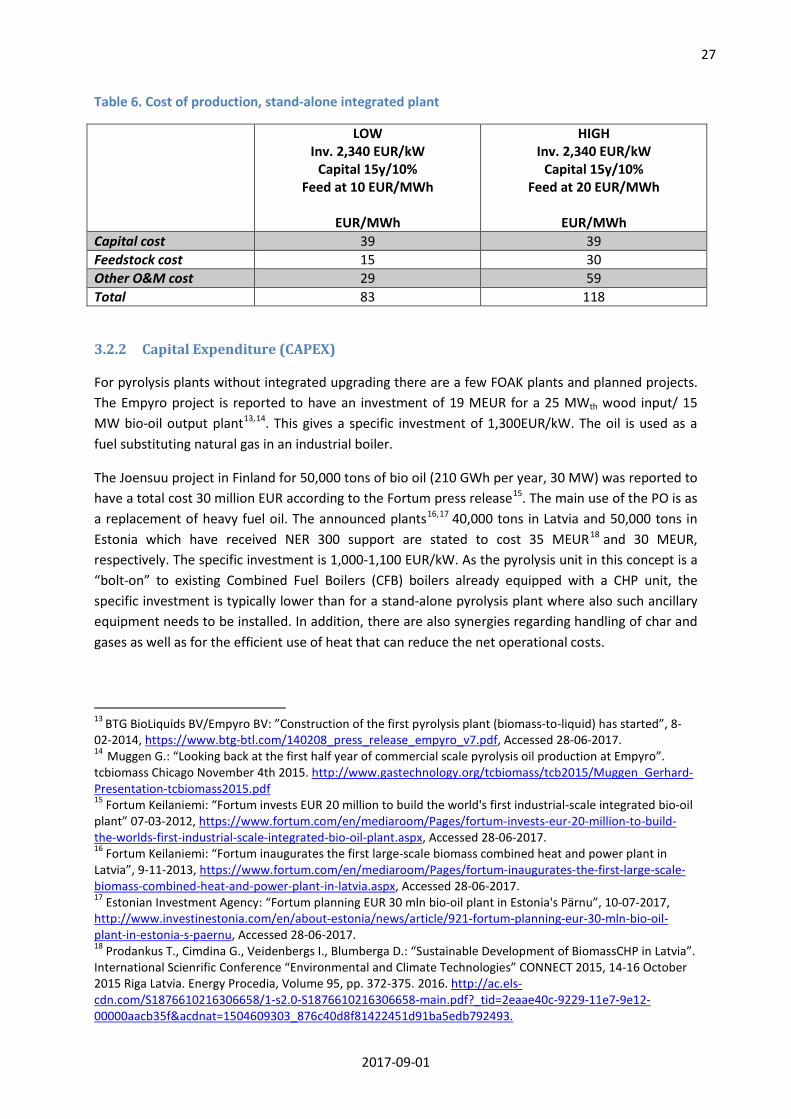
For a large, fully integrated plant with an output of 272 MW, the production cost was estimated to 83-118 EUR/MWh, using data from the most recent study. No adjustments for investment cost differences between USA and the EU have been made, and one substantial cost item is natural gas for which no price correction has been done.
The feedstock commonly used in this memo has a cost of 10-20 EUR/MWh. The production costs are shown in Table 5 and Table 6.
Table 5. Cost of production, co-processing
LOW Low inv. (1,000 EUR/kW)
No refinery costs included Capital 15y/10%
Feed at 10 EUR/MWh
EUR/MWh
HIGH High inv. (1,800 EUR/kW) No refinery costs included
Capital 15y/10% Feed at 20 EUR/MWh
EUR/MWh
Capital cost pyr. plant 19 30 Capital cost refinery ~ 1* ~ 1* Feedstock cost 34 68 Other O&M, Pyr. Plant ~ net 0 ~ net 0 Other O&M refinery ~ 5* ~ 5* Total 59 104 *These figures are based on Rough Order of Magnitude (ROM) calculations. Data is generally not available and refineries are different in terms of their investment needs and processing capabilities such that a generic figure cannot be estimated.
11 Talmadge S. M. et al.: “A perspective on oxygenated species in the refinery integration of pyrolysis oil”. Green Chemistry, Volume 16, pp. 407-453. 2014 DOI: 10.1039/C3GC41951G. 12 Karatzos S., McMillan D. J., Saddler N. J.: “The Potential and Challenges of Drop-in Biofuels”. IEA Bioenergy Task 39. Report T39-T1 July 2014. ISBN: 978-1-910154-07-6. http://task39.sites.olt.ubc.ca/files/2014/01/Task-39-Drop-in-Biofuels-Report-FINAL-2-Oct-2014-ecopy.pdf
27
2017-09-01
Table 6. Cost of production, stand-alone integrated plant
LOW Inv. 2,340 EUR/kW
Capital 15y/10% Feed at 10 EUR/MWh
EUR/MWh
HIGH Inv. 2,340 EUR/kW
Capital 15y/10% Feed at 20 EUR/MWh
EUR/MWh
Capital cost 39 39 Feedstock cost 15 30 Other O&M cost 29 59 Total 83 118
3.2.2 Capital Expenditure (CAPEX)
For pyrolysis plants without integrated upgrading there are a few FOAK plants and planned projects. The Empyro project is reported to have an investment of 19 MEUR for a 25 MWth wood input/ 15 MW bio-oil output plant13,14. This gives a specific investment of 1,300EUR/kW. The oil is used as a fuel substituting natural gas in an industrial boiler.
The Joensuu project in Finland for 50,000 tons of bio oil (210 GWh per year, 30 MW) was reported to have a total cost 30 million EUR according to the Fortum press release15. The main use of the PO is as a replacement of heavy fuel oil. The announced plants16,17 40,000 tons in Latvia and 50,000 tons in Estonia which have received NER 300 support are stated to cost 35 MEUR18 and 30 MEUR, respectively. The specific investment is 1,000-1,100 EUR/kW. As the pyrolysis unit in this concept is a “bolt-on” to existing Combined Fuel Boilers (CFB) boilers already equipped with a CHP unit, the specific investment is typically lower than for a stand-alone pyrolysis plant where also such ancillary equipment needs to be installed. In addition, there are also synergies regarding handling of char and gases as well as for the efficient use of heat that can reduce the net operational costs.
13 BTG BioLiquids BV/Empyro BV: ”Construction of the first pyrolysis plant (biomass-to-liquid) has started”, 8-02-2014, https://www.btg-btl.com/140208_press_release_empyro_v7.pdf, Accessed 28-06-2017. 14 Muggen G.: “Looking back at the first half year of commercial scale pyrolysis oil production at Empyro”. tcbiomass Chicago November 4th 2015. http://www.gastechnology.org/tcbiomass/tcb2015/Muggen_Gerhard-Presentation-tcbiomass2015.pdf 15 Fortum Keilaniemi: “Fortum invests EUR 20 million to build the world's first industrial-scale integrated bio-oil plant” 07-03-2012, https://www.fortum.com/en/mediaroom/Pages/fortum-invests-eur-20-million-to-build-the-worlds-first-industrial-scale-integrated-bio-oil-plant.aspx, Accessed 28-06-2017. 16 Fortum Keilaniemi: “Fortum inaugurates the first large-scale biomass combined heat and power plant in Latvia”, 9-11-2013, https://www.fortum.com/en/mediaroom/Pages/fortum-inaugurates-the-first-large-scale-biomass-combined-heat-and-power-plant-in-latvia.aspx, Accessed 28-06-2017. 17 Estonian Investment Agency: “Fortum planning EUR 30 mln bio-oil plant in Estonia's Pärnu”, 10-07-2017, http://www.investinestonia.com/en/about-estonia/news/article/921-fortum-planning-eur-30-mln-bio-oil-plant-in-estonia-s-paernu, Accessed 28-06-2017. 18 Prodankus T., Cimdina G., Veidenbergs I., Blumberga D.: “Sustainable Development of BiomassCHP in Latvia”. International Scienrific Conference “Environmental and Climate Technologies” CONNECT 2015, 14-16 October 2015 Riga Latvia. Energy Procedia, Volume 95, pp. 372-375. 2016. http://ac.els-cdn.com/S1876610216306658/1-s2.0-S1876610216306658-main.pdf?_tid=2eaae40c-9229-11e7-9e12-00000aacb35f&acdnat=1504609303_876c40d8f81422451d91ba5edb792493.
28
2017-09-01
A Swedish study19 indicates investment costs of 211 million Swedish Crowns (MSEK) (≈23 MEUR) for a stand-alone 15 MW bio-oil products, 281-504 MSEK (≈31-56 MEUR) for a 30 MW oil output unit co-located with a CHP plant, and 607-810 MSEK (≈67-90 MEUR ) for a 60 MW bio-oil product unit co-located with a pulp mill. The data is based on supplier information (average numbers have been used), and there are synergies in the use of power and heat. This translates to 1,500 EUR/kW, 1,100-1,800 EUR/kW and 1,100-1,500 EUR/kW, the span being dependent how the CHP potential would be fitted into the existing boiler and turbine facilities of the mill.
The investments for upgrading at the refinery end could constitute tanks, pumps and other conventional equipment. This is site specific but not expected to involve any major sums.
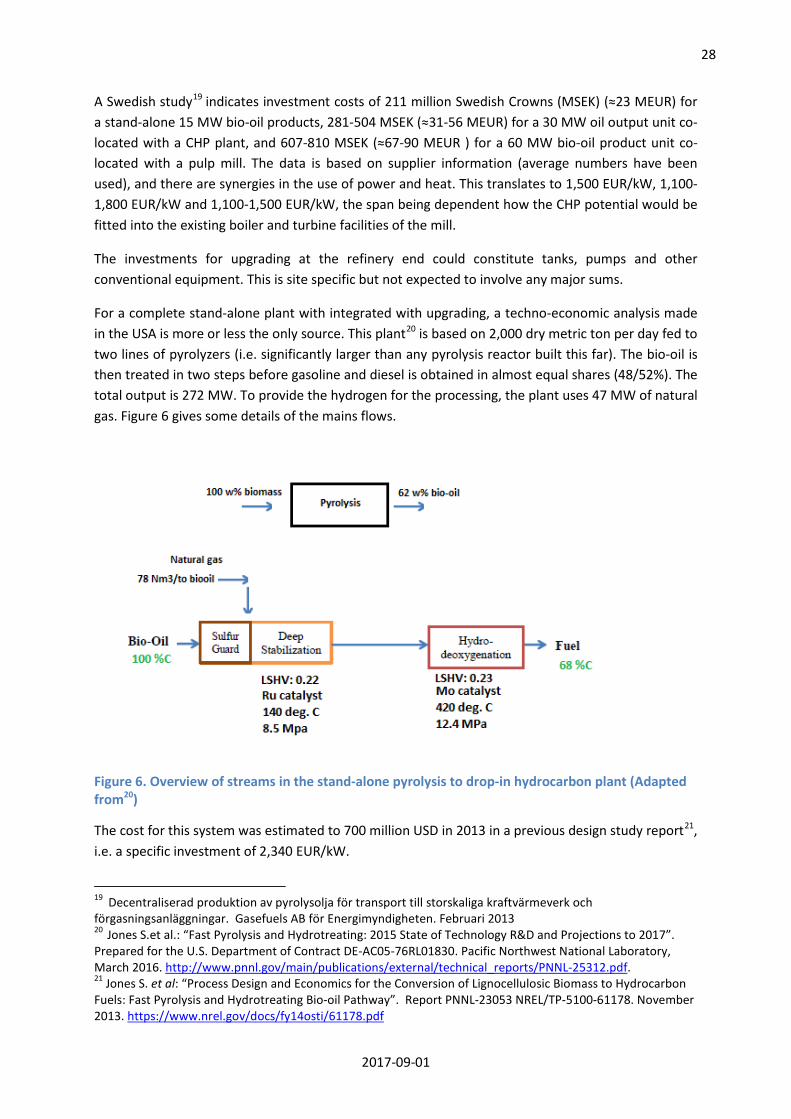
For a complete stand-alone plant with integrated with upgrading, a techno-economic analysis made in the USA is more or less the only source. This plant20 is based on 2,000 dry metric ton per day fed to two lines of pyrolyzers (i.e. significantly larger than any pyrolysis reactor built this far). The bio-oil is then treated in two steps before gasoline and diesel is obtained in almost equal shares (48/52%). The total output is 272 MW. To provide the hydrogen for the processing, the plant uses 47 MW of natural gas. Figure 6 gives some details of the mains flows.
Figure 6. Overview of streams in the stand-alone pyrolysis to drop-in hydrocarbon plant (Adapted from20)
The cost for this system was estimated to 700 million USD in 2013 in a previous design study report21, i.e. a specific investment of 2,340 EUR/kW.
19 Decentraliserad produktion av pyrolysolja för transport till storskaliga kraftvärmeverk och förgasningsanläggningar. Gasefuels AB för Energimyndigheten. Februari 2013 20 Jones S.et al.: “Fast Pyrolysis and Hydrotreating: 2015 State of Technology R&D and Projections to 2017”. Prepared for the U.S. Department of Contract DE-AC05-76RL01830. Pacific Northwest National Laboratory, March 2016. http://www.pnnl.gov/main/publications/external/technical_reports/PNNL-25312.pdf. 21 Jones S. et al: “Process Design and Economics for the Conversion of Lignocellulosic Biomass to Hydrocarbon Fuels: Fast Pyrolysis and Hydrotreating Bio-oil Pathway”. Report PNNL-23053 NREL/TP-5100-61178. November 2013. https://www.nrel.gov/docs/fy14osti/61178.pdf
29
2017-09-01
3.2.3 Operating Expenditure (OPEX)
For pyrolysis plants producing bio-oil as their main product, the typical O&M costs are of the order of 4-7% of the investment per year for maintenance, staffing and normal utilities. However, as these typically product heat and power (and possibly bio-char), revenues from these balances the O&M costs, such that including these by-products the net is here taken as zero. For the OPEX for the upgrading stage by co-processing in a refinery, the first assumption is that there is capacity available in the FCC unit, so the economic impact of displacement of fossil products have not been considered. The OPEX related to the bio-oil fraction in co-processing is not readily available for estimation at present. This relates to a general lack of process data and that the refineries will differ. However, contacts with experts in the field gave some basic numbers that was used to arrive at a Rough Order of Magnitude (ROM) figure.
For the larger integrated installation with integrated product upgrading, the non-feedstock OPEX is given as 59 EUR/MWh product for the state-of-the-art 2015 plant, the contribution to this figure being 73% being related to the upgrading step. This includes natural gas but also catalyst replacement of 82 million USD per year, or 34 EUR/MWh. Projections for 2017 reduce the OPEX to 29 EUR/MWh.
The pyrolysis unit in itself typically has a conversion efficiency from (dry) biomass, as fed to the reactor, to pyrolysis oil of 65-70% on a mass basis. The lower number is used.
An article22 describing the tests with 5-10% of bio-oil in Vacuum Gas Oil (VGO) in the Brazilian refinery had as one of its main results that some 30% of the biogenic carbon in the bio-oil ended up in the liquid products during co-processing with fossil fuels. So, as a simple estimate, biomass hold 48 % carbon as did the bio-oil in the tests. Then the product (as CH2) per weight of dry biomass can be calculated to 109 kg/ton dry biomass, and using an energy content of 11.9 MWh/ton for fuel fractions and 4.5 MWh per ton for wet biomass, the energy efficiency is 29%. The cited article does not indicate the split between the raw gasoline and Light Cycle Oil (LCO) (diesel precursor) fractions for the bio-oil, but the overall split was 2/3 gasoline and 1/3 LCO (the output stream that can be upgraded to diesel and kerosene).
For the case with the integrated fuel production facility, the carbon efficiency from bio-oil to fuel was given as 68%. Doing the same estimate as above, the yield would be 248 ton/ton or 66% on an energy basis from the as-received biomass.
However, according to a graph in the 2015 Refinery Best Available Technique Reference Document (BREF)23, the total FCC capacity in Europe is approx. 2,500,000 bpd or 100 million tons per year, split on 56 different refineries. Replacing 5-10% of the VGO with bio-oil, and use the same arithmetic’s as above for the bio-oil only, this would result in a maximum yield of 0.16 tons hydrocarbons/ton of bio-oil which would give 0.8-1.6 million tons of bio-based drop-in fuels. 22 Pinho de Rezende A. et al: “Fast pyrolysis oil from pinewood chips co-processing with vacuum gas oil in an FCC unit for second generation fuel production”. Fuel 188, pp. 462–473, 2017. http://ac.els-cdn.com/S0016236116309802/1-s2.0-S0016236116309802-main.pdf?_tid=fb5410be-963e-11e7-aae9-00000aacb35d&acdnat=1505058470_e4350b0cfb6cf457d427e112a27f26e8. 23 Barthe P. et al.: “Best Available Techniques (BAT) Reference Document for the Refining of Mineral Oil and Gas”. Industrial Emissions Directive 2010/75/EU Integrated Pollution Prevention and control. JRC 2015 EUR 27140 EN. http://eippcb.jrc.ec.europa.eu/reference/BREF/REF_BREF_2015.pdf

30
2017-09-01
3.3 Wastes lipids to Hydrotreated Vegetable Oils (HVO)
The HVO process converts any fatty acid containing raw materials such as such as free fatty acids or triglycerides (three fatty acid chains with up to 24 carbons joined together with a glycerol unit) with hydrogen using catalysts under high pressure at temperatures in the range of 300-400°C. Hydrotreatment accomplishes deoxygenation and saturation of double bonds. The process consists of pretreatment, hydrotreatment and isomerization steps. The main product is in the diesel range but also kerosene and gasoline is obtained in the process to some varying degree, depending on the process severity and also to some degree on the feedstock composition. By-products are propane from the hydrogenation of the glycerol and light gases, as well as water and CO2. The hydrogen can either be derived from the propane or be produced from natural gas, in which case the propane can be sold as a renewable LPG.
The scale of HVO units range from 0.05 to 1 million (metric) tons output, and the world annual production is around 4 million tons, and growing. There are stand-alone plants built specifically for the purpose of HVO, revamps of existing refineries to produce HVO and revamps to allow co-processing of HVO with fossil streams in existing refineries.
3.3.1 Production cost
Based on the data below, the cost of production falls in the range 600- 1,100 EUR/ton, or approx. 50-90 EUR/MWh as shown in Table 7. The dominating cost, 60-80 %, is the contribution of the feedstock cost.
Table 7. Cost of production, HVO
LOW Low inv. (200 EUR/kW)
Capital 15y/10% Feed at 40 EUR/MWh
EUR/MWh
MEDIUM Medium inv. (600 EUR/kW)
Capital 15y/10% Feed at 60 EUR/MWh
EUR/MWh
HIGH High inv. (1,000 EUR/kW)
Capital 15y/10% Feed at 60 EUR/MWh
EUR/MWh
Capital 3 6 15 Feedstock 40 60 60 Other O&M 8 12 16 Total 51 78 91
3.3.2 Capital Expenditure (CAPEX)
The CAPEX figures are based on publicly available data24 and data available from stakeholders.
Currently, the majority of HVO production facilities are stand-alone plants. CAPEX for stand-alone plants, reflecting a span from 0.1 to 1Mton per year capacity can range from 300-1,000 EUR/kW product (500-1,500 EUR/ yearly ton or 23,000 to 70,000 USD/bpd gasoline equivalent (ge) for 2,500-25,000 bpd ge capacity).
24 Kotrba R.: “Total’s La Mède Conversion: The Unabridged Version”, BBI International, 13-01-2016, http://www.biodieselmagazine.com/articles/677239/totalundefineds-la-mede-conversion-the-unabridged-version, Accessed 28-06-2017.
31
2017-09-01
Another option is to perform a conversion of traditional oil refineries to HVO production or co-production. Based on published figures, such installations with capacities between 0.2 and 0.5 Mtons per year have a CAPEX of 200-250 EUR/kW product (300-400 EUR/ton per year or 15,000-20,000 USD/bpd ge for capacity is 5,000-15,000 bpd ge). Both stand-alone plants as well as refinery conversions produce 100% HVO fuels.
In addition to the 100% HVO production, biofuels can be produced through co-processing. In co-processing, biomaterial is fed into refinery units together with fossil feeds typically in low (<5-10%) blends although there is at least one unit going up to 30%.
3.3.3 Operating Expenditure (OPEX)
The process cost or OPEX less feedstock is mainly reflecting the use of hydrogen for the process (if sourced externally) plus the normal costs for utilities, catalysts maintenance and staff.
As a typical OPEX value, 100-200 USD/ton can be used for HVO production. The exact value is depending on the type of feedstocks and associated upstream purification requirement, the process design and catalysts used, the market price for natural gas which is used for hydrogen production and the capacity and the location of the plant.
The yield of hydrocarbon liquid primarily as diesel (liquid fuel product / feed lipids) is typically 80-85% on a mass basis, and close to 100% on an energy basis, as most energy used in the process is derived from the hydrogen consumed. Hydrogen is added to the lipids and at the same time oxygen is removed which increases the energy content of the product over the feed. Hydrogen consumption is 3-4% on a mass basis or 10% on a direct energy basis relative to the feedstock. Most of the hydrogen is consumed for removing oxygen from the triglyceride as water but also to hydrogenate the glycerol part to propane and hydrogenate unsaturated fatty acids.
If the process is configured to maximize the yield of HEFA aviation fuels, the increased severity in the processing reduces the liquid yields by 5-10%. There will also be some diesel formed so the overall yield reduction can be minimized. In addition to HEFA aviation fuel, also HEFA+ aviation fuels can be produced. HEFA+ are renewable aviation fuels which can be used in lower blends than HEFA aviation fuels25.
3.3.4 Feedstock
For advanced biofuels, the feedstock for the HVO process is lipid residues from forest and other industries and waste and residue materials such as UCO, tallow. The feedstocks can be any fatty acid containing materials: As an example, Neste uses animal fats, waste fish fats, fatty acid distillates and acid oils from vegetable oil refining and food processing, technical corn oil, sludge oils, etc. UPM and PREEM, on the other hand uses tall oil by-products from pulp mills. These waste and processing residue streams origin from the oleochemical, biodiesel, vegetable oil refining, food processing and animal fat rendering industries.
25 NESTE: “Revolution In Plane Sight”, 23-12-2015, https://www.neste.com/en/revolution-plane-sight, Accessed 28-06-2017.

32
2017-09-01
Based on public sources26, 27, 28, 29 the cost of such materials is in the range of 400-600 EUR/ton (assumed to have 10 MWh/ton).
3.3.5 Stakeholder feedback
• NESTE
Neste have provided data for the document and also have reviewed and commented on the document.
3.4 Waste lipid-based biodiesel Since the waste lipid biodiesel production was not considered in the SGAB Technology Report, the description of this technology in this report is somewhat longer than the description of other technologies in this report.
In the case of waste lipid biodiesel plants, these can be either constructed specifically for the purpose of processing waste lipids (termed as greenfield below) or be a retrofit of an upstream purification process to an existing biodiesel plant originally designed to process virgin oils (termed retrofit below).
Compared to virgin vegetable oil, Used Cooking Oil (UCO) contains contaminants from the food processed (solids, proteins etc.) and products of the decomposition of oil from the high temperature experienced, mainly Free Fatty Acids (FFA, typically less than 2% in most virgin oils, higher in some specific virgin oils and in UCO, raw UCO can have above 5%), moisture and other impurities30. To arrive at a feed acceptable to a transesterification process, the raw UCO is purified by washing, removal of solids etc., water removal by vacuum drying and the removal of FFA by stripping. The FFA is recovered for further, separate conversion to Used Cooking Oli Methyl Esters (UCOME) by acid transesterification. Alternatively, FFA can be transformed into biodiesel by acid esterification, see below, in an integrated process unit upstream of the transesterification main conversion step.
The refined UCO (FFA <0.5%) is processed by the transesterification reaction with an excess of dry methanol at atmospheric pressure and 60°C in several steps, using a base, commonly sodium methoxide (CH3ONa) or potassium hydroxide (KOH) as a catalyst (In addition, there are processes based on heterogeneous catalysis and enzymatic reactions, but not in common use at present). The
26 Toop G., Alberici S., Spoettle M., van Steen H.: “Trends in the UCO market - Input to DRAFT PIR”, BIOUK10553. Ecofys November 2013 for UK Department for Transport (DfT). https://www.gov.uk/government/uploads/system/uploads/attachment_data/file/266089/ecofys-trends-in-the-uco-market-v1.2.pdf. 27 GREENEA: “Used Cooking Oil collection: a market worth 470 million euros, with France representing only 5%”. 24-11-2014. https://www.greenea.com/publication/used-cooking-oil-collection-a-market-worth-470-million-euros-with-france-representing-only-5/. Accessed 28-06-2017. 28 Meyer G.: “Grease Lightning pays price as oil cools”.. Financial Times 22-02-2016. https://www.ft.com/content/0a6f3f60-d750-11e5-829b-8564e7528e54. Accessed 28-06-2017. 29 Centrec Consulting Group, LLC: “BIODIESEL DEMAND FOR ANIMAL FATS AND TALLOW GENERATES AN ADDITIONAL REVENUE STREAM FOR THE LIVESTOCK INDUSTRY”. Prepared for the National Biodiesel Board, September 2014. http://biodiesel.org/docs/default-source/news---supporting-files/animal-fats-and-tallow-bd-demand-impact-report.pdf?sfvrsn=2 30 Greenea: “Pricing of UCO, Animal Fat and Waste-Based Biofuel: an Achilles Heel of this Market”. 27-11-2014. https://www.greenea.com/publication/pricing-of-uco-animal-fat-and-waste-based-biofuel-an-achilles-heel-of-this-market/. Accessed 28-06-2017.
33
2017-09-01
by-product glycerol (aka glycerine) formed by the reaction is separated by gravity or centrifuges and pumped to glycerol recovery. The separated crude UCOME is treated by vacuum flashing or distillation to remove excess methanol, which is recovered and recycled, and thereafter by decanting to remove any residual glycerine. The crude UCOME is then water-washed in the presence of citric acid (C6H8O7) and vacuum stripped to remove residual moisture and methanol before cooling and a final filtering step. Alternatively, the washed UCOME can also be purified by a distillation step.
As glycerol can be a valuable by product, the glycerol/water/salt/methanol mixture is subject to treatment to recover FFA, methanol and a glycerol product. The glycerol product quality can range from crude glycerol (typically 80% glycerol) or to a number of traded qualities obtained by distillation etc., from distilled glycerol to pharmaceutical grade (99.5-99.7% glycerol).
The FFA recovered in the UCO purification and glycerol upgrading are reacted by acidic esterification with methanol (CH3OH) and sulphuric acid (H2SO4) at 9 bar pressure and 125°C through a continuous loop reactor. A methanol-rich phase is separated by flashing and decanting and transferred to methanol recovery while the ester phase is returned to the inlet of the transesterification stage for purification in the main UCOME purification process.
Typically, starting from UCO, the yield of UCOME is 97-98% of the UCO feed on a mass basis. (The transesterification theoretically gives a yield of just slightly above 100% mass for a pure vegetable feed: Typical mass yields are close to 100%). The use of methanol, although lightly depending on the feed is approximately 10% of the feed oil, and approximately 10% glycerol is formed from the process.
3.4.1 Feedstocks
There are two main sources for waste lipids for methyl ester biodiesel production, UCO and animal fat.
UCO is collected31, 32 by recycling entities from restaurants food industries and to some degree also from household collections systems33,. The recovery of UCO from commercial facilities are typically done on a local or regional basis. Data on the UCO market is shown in Table 8.
31 Toop G., Alberici S., Spoettle M., van Steen H., Weddige U.: “Trends in the UCO market”, Ecofys 7-03-2014 by order of: Department for Transport. Project number: BIOUK10553. https://www.gov.uk/government/uploads/system/uploads/attachment_data/file/307119/trends-uco-market.pdf. 32 Tacconi D., Chiaramonti D., Prussi M., Buffi M.: “D2.7 Information related to economic, social and environmental parameters 3rd”. ITAKA Collaborative Project FP7 – 308807, 19/02/2015. http://www.itaka-project.eu/Shared%20Documents/D2.7_web.pdf. 33 Hillairet F., Allemandou V., Golab K.: “Analysis of the current development of household UCO collection systems in the EU”. 23rd May 2016. GREENEA The project was supported by the European Climate Foundation. http://www.theicct.org/sites/default/files/publications/Greenea%20Report%20Household%20UCO%20Collection%20in%20the%20EU_ICCT_20160629.pdf.
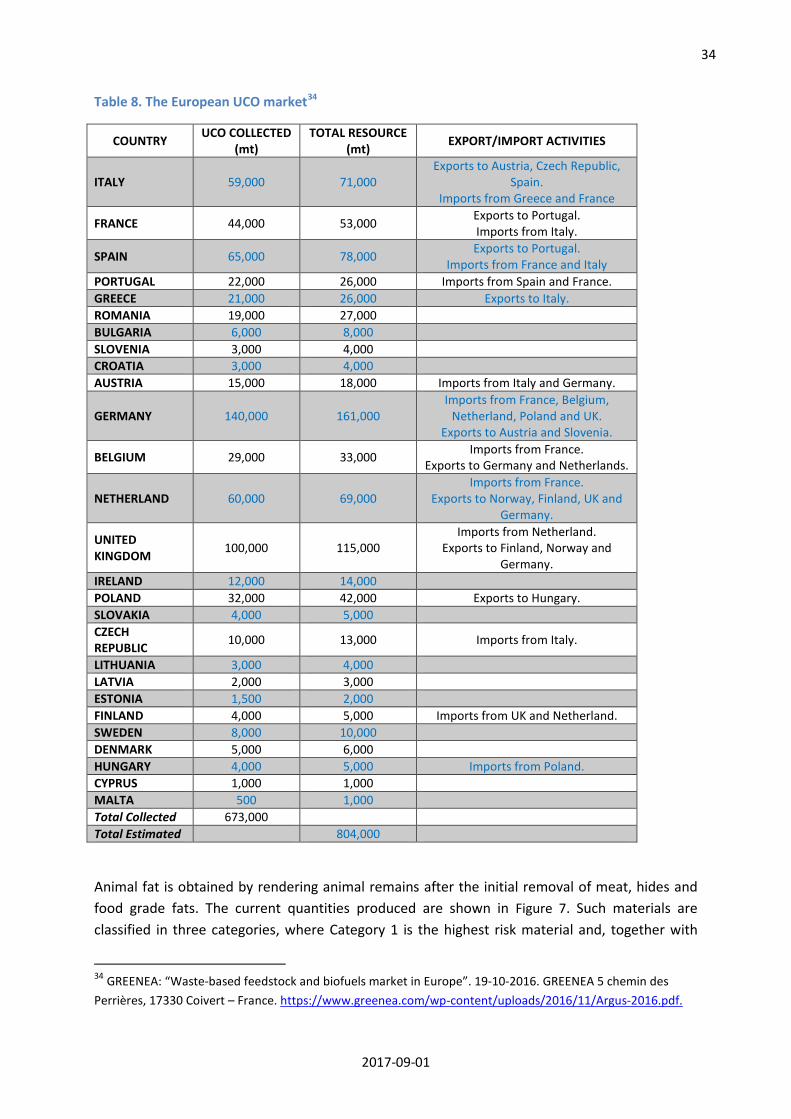
34
2017-09-01
Table 8. The European UCO market34
COUNTRY UCO COLLECTED (mt)
TOTAL RESOURCE (mt) EXPORT/IMPORT ACTIVITIES
ITALY 59,000 71,000 Exports to Austria, Czech Republic,
Spain. Imports from Greece and France
FRANCE 44,000 53,000 Exports to Portugal. Imports from Italy.
SPAIN 65,000 78,000 Exports to Portugal. Imports from France and Italy
PORTUGAL 22,000 26,000 Imports from Spain and France. GREECE 21,000 26,000 Exports to Italy. ROMANIA 19,000 27,000 BULGARIA 6,000 8,000 SLOVENIA 3,000 4,000 CROATIA 3,000 4,000 AUSTRIA 15,000 18,000 Imports from Italy and Germany.
GERMANY 140,000 161,000 Imports from France, Belgium,
Netherland, Poland and UK. Exports to Austria and Slovenia.
BELGIUM 29,000 33,000 Imports from France. Exports to Germany and Netherlands.
NETHERLAND 60,000 69,000 Imports from France.
Exports to Norway, Finland, UK and Germany.
UNITED KINGDOM 100,000 115,000
Imports from Netherland. Exports to Finland, Norway and
Germany. IRELAND 12,000 14,000 POLAND 32,000 42,000 Exports to Hungary. SLOVAKIA 4,000 5,000 CZECH REPUBLIC 10,000 13,000 Imports from Italy.
LITHUANIA 3,000 4,000 LATVIA 2,000 3,000 ESTONIA 1,500 2,000 FINLAND 4,000 5,000 Imports from UK and Netherland. SWEDEN 8,000 10,000 DENMARK 5,000 6,000 HUNGARY 4,000 5,000 Imports from Poland. CYPRUS 1,000 1,000 MALTA 500 1,000 Total Collected 673,000 Total Estimated 804,000
Animal fat is obtained by rendering animal remains after the initial removal of meat, hides and food grade fats. The current quantities produced are shown in Figure 7. Such materials are classified in three categories, where Category 1 is the highest risk material and, together with
34 GREENEA: “Waste-based feedstock and biofuels market in Europe”. 19-10-2016. GREENEA 5 chemin des Perrières, 17330 Coivert – France. https://www.greenea.com/wp-content/uploads/2016/11/Argus-2016.pdf.
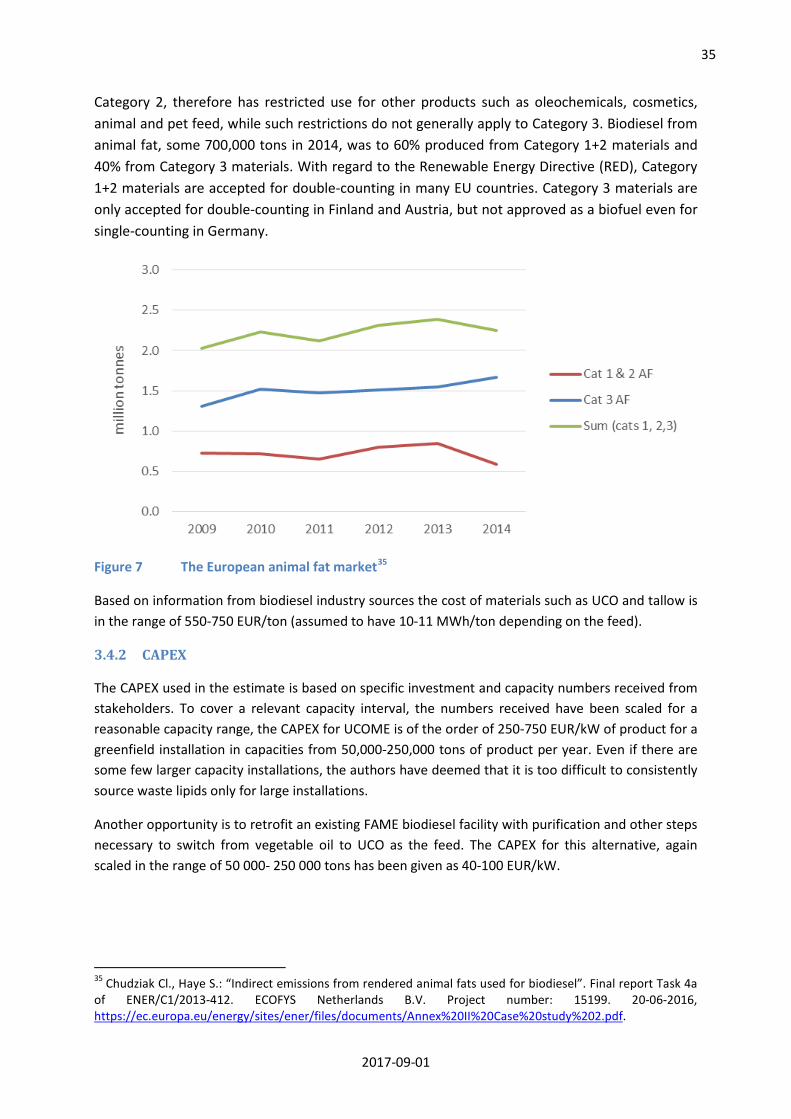
35
2017-09-01
Category 2, therefore has restricted use for other products such as oleochemicals, cosmetics, animal and pet feed, while such restrictions do not generally apply to Category 3. Biodiesel from animal fat, some 700,000 tons in 2014, was to 60% produced from Category 1+2 materials and 40% from Category 3 materials. With regard to the Renewable Energy Directive (RED), Category 1+2 materials are accepted for double-counting in many EU countries. Category 3 materials are only accepted for double-counting in Finland and Austria, but not approved as a biofuel even for single-counting in Germany.
Figure 7 The European animal fat market35
Based on information from biodiesel industry sources the cost of materials such as UCO and tallow is in the range of 550-750 EUR/ton (assumed to have 10-11 MWh/ton depending on the feed).
3.4.2 CAPEX
The CAPEX used in the estimate is based on specific investment and capacity numbers received from stakeholders. To cover a relevant capacity interval, the numbers received have been scaled for a reasonable capacity range, the CAPEX for UCOME is of the order of 250-750 EUR/kW of product for a greenfield installation in capacities from 50,000-250,000 tons of product per year. Even if there are some few larger capacity installations, the authors have deemed that it is too difficult to consistently source waste lipids only for large installations.
Another opportunity is to retrofit an existing FAME biodiesel facility with purification and other steps necessary to switch from vegetable oil to UCO as the feed. The CAPEX for this alternative, again scaled in the range of 50 000- 250 000 tons has been given as 40-100 EUR/kW.
35 Chudziak Cl., Haye S.: “Indirect emissions from rendered animal fats used for biodiesel”. Final report Task 4a of ENER/C1/2013-412. ECOFYS Netherlands B.V. Project number: 15199. 20-06-2016, https://ec.europa.eu/energy/sites/ener/files/documents/Annex%20II%20Case%20study%202.pdf.
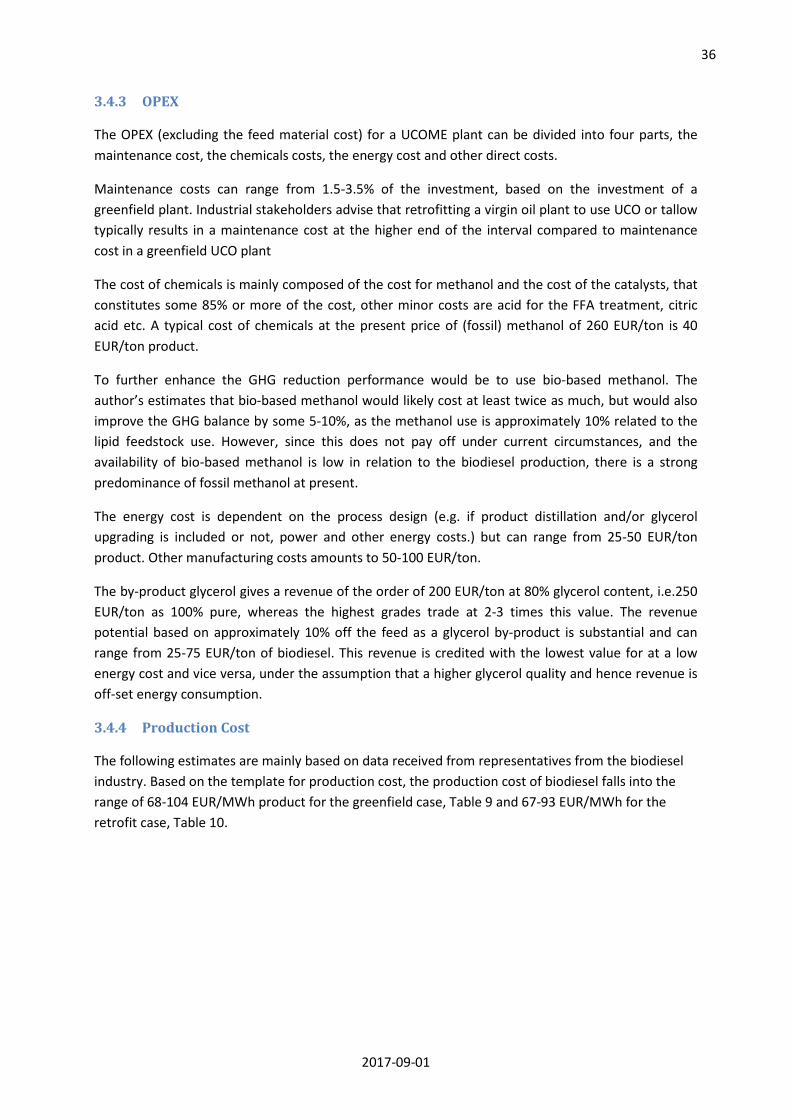
36
2017-09-01
3.4.3 OPEX
The OPEX (excluding the feed material cost) for a UCOME plant can be divided into four parts, the maintenance cost, the chemicals costs, the energy cost and other direct costs.
Maintenance costs can range from 1.5-3.5% of the investment, based on the investment of a greenfield plant. Industrial stakeholders advise that retrofitting a virgin oil plant to use UCO or tallow typically results in a maintenance cost at the higher end of the interval compared to maintenance cost in a greenfield UCO plant
The cost of chemicals is mainly composed of the cost for methanol and the cost of the catalysts, that constitutes some 85% or more of the cost, other minor costs are acid for the FFA treatment, citric acid etc. A typical cost of chemicals at the present price of (fossil) methanol of 260 EUR/ton is 40 EUR/ton product.
To further enhance the GHG reduction performance would be to use bio-based methanol. The author’s estimates that bio-based methanol would likely cost at least twice as much, but would also improve the GHG balance by some 5-10%, as the methanol use is approximately 10% related to the lipid feedstock use. However, since this does not pay off under current circumstances, and the availability of bio-based methanol is low in relation to the biodiesel production, there is a strong predominance of fossil methanol at present.
The energy cost is dependent on the process design (e.g. if product distillation and/or glycerol upgrading is included or not, power and other energy costs.) but can range from 25-50 EUR/ton product. Other manufacturing costs amounts to 50-100 EUR/ton.
The by-product glycerol gives a revenue of the order of 200 EUR/ton at 80% glycerol content, i.e.250 EUR/ton as 100% pure, whereas the highest grades trade at 2-3 times this value. The revenue potential based on approximately 10% off the feed as a glycerol by-product is substantial and can range from 25-75 EUR/ton of biodiesel. This revenue is credited with the lowest value for at a low energy cost and vice versa, under the assumption that a higher glycerol quality and hence revenue is off-set energy consumption.
3.4.4 Production Cost
The following estimates are mainly based on data received from representatives from the biodiesel industry. Based on the template for production cost, the production cost of biodiesel falls into the range of 68-104 EUR/MWh product for the greenfield case, Table 9 and 67-93 EUR/MWh for the retrofit case, Table 10.
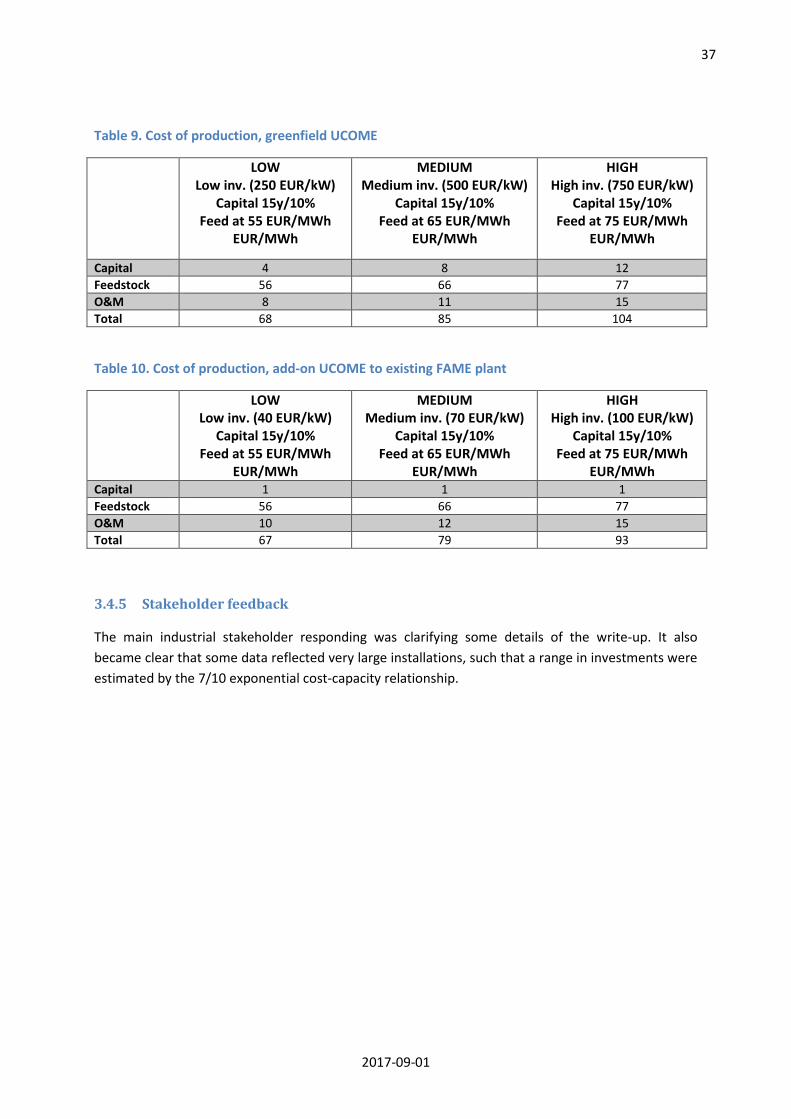
37
2017-09-01
Table 9. Cost of production, greenfield UCOME
LOW Low inv. (250 EUR/kW)
Capital 15y/10% Feed at 55 EUR/MWh
EUR/MWh
MEDIUM Medium inv. (500 EUR/kW)
Capital 15y/10% Feed at 65 EUR/MWh
EUR/MWh
HIGH High inv. (750 EUR/kW)
Capital 15y/10% Feed at 75 EUR/MWh
EUR/MWh
Capital 4 8 12 Feedstock 56 66 77 O&M 8 11 15 Total 68 85 104
Table 10. Cost of production, add-on UCOME to existing FAME plant
LOW Low inv. (40 EUR/kW)
Capital 15y/10% Feed at 55 EUR/MWh
EUR/MWh
MEDIUM Medium inv. (70 EUR/kW)
Capital 15y/10% Feed at 65 EUR/MWh
EUR/MWh
HIGH High inv. (100 EUR/kW)
Capital 15y/10% Feed at 75 EUR/MWh
EUR/MWh Capital 1 1 1 Feedstock 56 66 77 O&M 10 12 15 Total 67 79 93
3.4.5 Stakeholder feedback
The main industrial stakeholder responding was clarifying some details of the write-up. It also became clear that some data reflected very large installations, such that a range in investments were estimated by the 7/10 exponential cost-capacity relationship.
38
2017-09-01
4 Biochemical Conversion-methane
4.1 Ethanol from lignocellulosic sugar via fermentation
4.1.1 Production cost
Ethanol being one of the advanced biofuels which has entered the commercialization phase there is a lot of material available through reports and other well recognized sources of information. The material presented to the group originated from two different sources and gave a converging story. The data still shows a wide range with respect to cost of production and this is not surprising as such. Cost of feedstock plays a comparably big role in the production cost with a conversion efficiency of typically 30-40% on energy basis. This leads to large handling and processing of feedstock material which is reflected in investment intensity for these types of plants. Figure 8 shows projected production costs for cellulosic ethanol.
It should specifically be noted that the plants shown in Figure 8 are first of a kind (FOAK) plants and built with different type of technologies in very different geographical locations and with different start-up years. They also differ in size and also have quite different scope, e.g. with and without own utility units producing power and steam.
Figure 8 illustrates the following:
• For cellulosic ethanol plants cash cost contributes with a large portion to the overall production cost and with cost of feedstock often being the biggest single element (strongly dependent on cost of feedstock and ethanol yield)
• Based on the reported cellulosic ethanol plant data for feedstock, O&M and capital costs one of the plants reaches a total ethanol production cost below 85 EUR/MWh, four in the interval 105 to 130 EUR/MWh and one more than 180 EUR/MWh.
Another source of information comes from survey carried out by Bloomberg in 2013 named CELLULOSIC ETHANOL COSTS: SURVEYING AN INDUSTRY (March 18, 2013). The result is shown in Figure 9.
4.1.2 Capital Expenditure (CAPEX)
The producer of the data for Figure 8, Lux Research, Inc. used by PennEnergy to make the illustration was contacted to comment cost of capital. They informed the following:
“Our capital-related assumptions are as follows: straight-line capital depreciation over 15 years at a loan rate of 8% with an investor return on investment of 20% the capital cost, and other operations cost calculated as 4% of investment per year. This result in the proportional observation you made for most of the cases, given that the investment cost for these projects were all very similar (approximately 10 USD/installed gallon per year) except for Hugoton Plant and DuPont.”
Lux Research has thus used the same investment intensity for all plants i.e. investment directly proportional to the plant capacity. 10 USD/installed gallon of ethanol per year corresponds to 3,600 USD/kW or about 3,300 EUR/kW (calculated for 8,000 hours of operation per year). If using officially

39
2017-09-01
available investment numbers for the various plants, investment intensity varies considerably, from 160,000 to about 450,000 USD/bpd ge This corresponds to 2,380 to over 6,700 EUR/kW of ethanol production capacity.
Investment relating to Figure 9 (Source: Bloomberg) was for 2013 estimated to 270 MUSD for a plant producing 90,000 m3 of ethanol (66 MW of ethanol for 8,000h). This corresponds well with plant data presented in Figure 8. The investment was calculated to fall from 270 MUSD to 190 MUSD in 2016 which equals a decrease in investment intensity from 3,650 to 2,570 EUR/kW.
2,570 EUR/kW and a capital cost corresponding to 15 years and 10% results in a cost of capital in the product cost of 42 EUR/MWh. Corresponding number for 3,650 EUR/MWh is 60 EUR/MWh.
Figure 8. Projected production costs for major first of a kind Cellulosic ethanol projects36
36 Essery M.: “Raizen Has Lowest Price as Cellulosic Ethanol Hinges on Feedstock Cost”, Lux Research, Inc. 24-02-2016. http://www.luxresearchinc.com/news-and-events/press-releases/read/raizen-has-lowest-price-cellulosic-ethanol-hinges-feedstock-cost, Accessed 280-06-2017 and contacts with LUX Research Inc.

40
2017-09-01
Figure 9. Minimum cellulosic ethanol selling price (MESP) in USD/liter, 2008 – 201637.
4.1.3 Operation Expenditure (OPEX) Feedstock costs in the Bloomberg report was put at 13 EUR/MWh. With 40% conversion efficiency from biomass feedstock to ethanol it results in a feedstock cost in cost of production of 33 EUR/MWh. If feedstock price is at 20 EUR/MWh corresponding number is 50 EUR/MWh. This latter cost of feedstock coincides approximately with three of the cases in Figure 8.
Table 11. Production cost of lignocellulosic ethanol
LOW MEDIUM HIGH Low (2570 EUR/kW)
Capital 20y/8% Feed at 10 EUR/MWh
EUR/MWh
Low (2570 EUR/kW) Capital 15y/10%
Feed at 13 EUR/MWh
EUR/MWh
High (3650 EUR/kW) Capital 15y/10%
Feed at 20 EUR/MWh
EUR/MWh Capital 32 42 60 Feedstock 25 33 50 Enzymes 15 15 30 Other O&M 13 13 18 Total 85 103 158
Besides cost of feedstock cost of enzymes is an important part of MESP. The enzyme supplier Novozymes has provided the following information together with an illustrative graph showing how cost of enzymes relating to MESP has developed during the last 15 years.
37 Used with permission from Bloomberg New Energy Finance
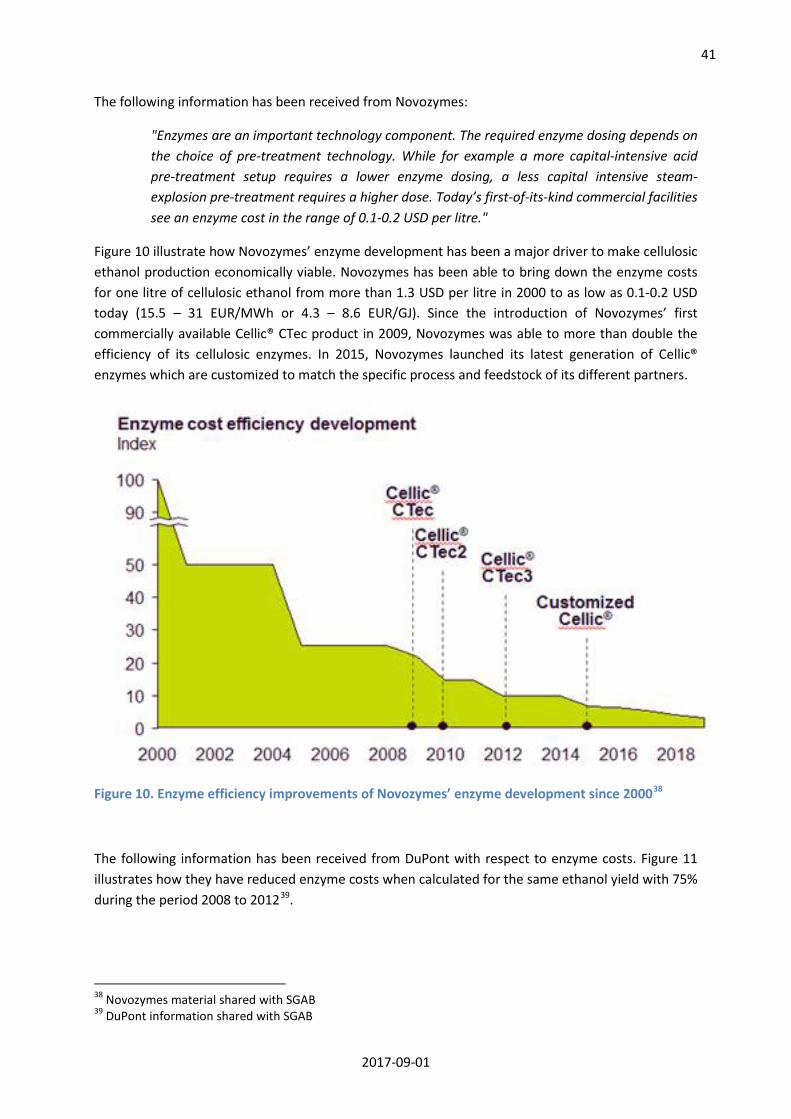
41
2017-09-01
The following information has been received from Novozymes:
"Enzymes are an important technology component. The required enzyme dosing depends on the choice of pre-treatment technology. While for example a more capital-intensive acid pre-treatment setup requires a lower enzyme dosing, a less capital intensive steam-explosion pre-treatment requires a higher dose. Today’s first-of-its-kind commercial facilities see an enzyme cost in the range of 0.1-0.2 USD per litre."
Figure 10 illustrate how Novozymes’ enzyme development has been a major driver to make cellulosic ethanol production economically viable. Novozymes has been able to bring down the enzyme costs for one litre of cellulosic ethanol from more than 1.3 USD per litre in 2000 to as low as 0.1-0.2 USD today (15.5 – 31 EUR/MWh or 4.3 – 8.6 EUR/GJ). Since the introduction of Novozymes’ first commercially available Cellic® CTec product in 2009, Novozymes was able to more than double the efficiency of its cellulosic enzymes. In 2015, Novozymes launched its latest generation of Cellic® enzymes which are customized to match the specific process and feedstock of its different partners.
Figure 10. Enzyme efficiency improvements of Novozymes’ enzyme development since 200038
The following information has been received from DuPont with respect to enzyme costs. Figure 11 illustrates how they have reduced enzyme costs when calculated for the same ethanol yield with 75% during the period 2008 to 201239.
38 Novozymes material shared with SGAB 39 DuPont information shared with SGAB

42
2017-09-01
Figure 11. Reduction of relative enzyme dozing 2008-201240
Figure 12. Enzyme cost as function of place of production and sugar source41 42
40 Source: DuPont 41 Source: Clariant 42 Johnson E.: “Integrated enzyme production lowers the cost of cellulosic ethanol”. Biofuels. Bioproducts & Biorefining, Volume 10, pp. 164 – 174. 2016. DOI: 10.1002/bbb.1634. http://onlinelibrary.wiley.com/doi/10.1002/bbb.1634/epdf.
43
2017-09-01
The company Clariant is also developing technology for the lignocellulosic ethanol conversion route. They highlight another important aspect of the technology, namely how the overall cost of enzymes is influenced by where and how they are produced. 43 Figure 12 illustrates savings made by production place (enzymes produced at another location, at the plant site or completely integrated into the process) for the enzymes as well as which sugar type is used for their production (glucose or from sugar actually being part of the plant process).
The cost of cellulase has been one of the deterrents in the profitable business case of a commercial scale cellulosic ethanol plant. The integrated enzyme production substantially lowers this cost as depicted in Figure 12 and makes the business case profitable for commercial scale production reaching cost savings of more than - 50% compared to on-site enzyme production and of more than - 70% compared to off-site enzyme production. The total OPEX is also reduced due to the benefits that are offered by the development of process specific enzymes integrated in the production itself.
Other OPEX costs besides feedstock and enzymes are by Bloomberg estimated to be a yearly cost of 4% of plant investment. For the 90,000 m3 per year plant referred to in their survey this would add 18 EUR/MWh for the year 2013 estimate and 13 EUR/MWh for the 2016-year estimate.
4.1.4 Performance
Today, the typical ethanol yield ranges between 250-350 liter per dry tone of feedstock.
In addition, the lignin solid residue is used within the plant in a co-generation unit to generate thermal heat and power. Depending on the individual process, the location and support to RE power, it may also be advantageous to export Renewable Energy (RE) power from the plant. Alternatively, and where it makes economic sense, the lignin can be further processed to chemicals or biokerosene44.
4.1.5 Feedback from SGAB members • DuPont
Agree with the ranges of production costs shown in the background material (as per chapter 2), that it corresponds to where the industry is at this stage.
Similarly, the Weighted Average Cost of Capital (WACC) likely differs by project depending on debt / equity ratio as well as by region and is likely to be higher than normal due to the risk component of these projects at this early stage. Suspect that WACC is likely between 10-13% but can be substantially higher when going outside of the Euro region.
Judge cost of feedstock to be at 50 EUR/ton ±20 EUR (dry) corresponding to 10 ± 4 EUR/MWh
• St1
St1 has different ethanol production costs in their different production units with different feedstocks and technologies. St1 cannot go into details of price structure of ethanol produced from
43 Clariant information shared with SGAB 44 Biochemtex is coordinating the project "BIOREFLY" to produce bio-kerosene from the lignin residue of their Cresentino plant.
44
2017-09-01
different waste and residue feedstocks. However, they can confirm that our cost level ranges from the bottom line (80 EUR/MWh) to 75% percentile (140EUR/MWh).
• Abengoa
Comments to the cellulosic ethanol concept
An updated base case from Abengoa coincides well with presented data in Figure 8. Cost are revised to 2,61 USD/US gallon which is in line with cash cost in the referred figure. If one applies a standard feedstock cost to the four non-Brazilian plants in the figure then, visually, cash costs (no capital cost) even up considerably between technologies.
The plant having the lowest production cost in the quoted figure is around 80 EUR/MWh. To lower that 10-15% over time due to various improvements sounds like a reasonable target within the short to medium term. For cereal residues, 80 EUR/MWh is a long-term goal. For the US, it seems feasible. For the EU, the problem will be competing demand for the biomass and the insecurity of supply.
Technically, energy crops have more cost-saving potential than agricultural residues, but it will also have the problem with competing demand of the biomass.
Data regarding a Municipal Solid Waste (MSW) to ethanol concept
Abengoa has spent considerable time and effort in their pilot plant in Salamanca, Spain to test sorted MSW feedstock as feedstock to their biochemical ethanol process. Based on operation experiences from the pilot plant and market investigations with respect to MSW quality and availability in Europe (and World-wide) Abengoa has developed a MSW to ethanol concept. Their provided data is brought into the same type of overall economic figures as other production concepts in this report.
The presented case is based on a tipping fee of 70 EUR/ton MSW and a size of the operation of 500,000 t/y MSW (both data given “as received” basis). The income from the “tipping fee” is thus 35 MEUR/year. The investment is a MSW to ethanol plant is divided into two parts where the first part handles the pretreatment of the raw feedstock into recycling, RDF residual, landfilling streams and to a suitable organic waste stream fed to the second part. The second part converts the organic feedstock (bio-waste) to ethanol. Abengoa calculates that investment in the pretreatment can be carried by part of the “tipping fee” and the net credit from selling or disposing of the various recycle and waste streams from the pretreatment part of the business. The credit carried through to the organic feedstock stream of the ethanol plant (the bio-waste) corresponds to 27.6 MEUR/year or 180 EUR/ton organic waste.
The Bio-waste to ethanol plant produces 14,100 t/y of ethanol (98.7%) corresponding to 89,500 MWh/y and carries an investment of 127 MEUR. Assuming 8000 hours of operation per year the investment intensity becomes 11,350 EUR/kW. Capital element in the production cost is calculated as for other concepts in this report (annuity factor of 0.133) and becomes 189 EUR/MWh of ethanol. Enzymes are calculated to a cost corresponding to 42 EUR/MWh. Other O&M costs are specified to 15.2 MEUR corresponding to 170 EUR/MWh and finally the credit for the feedstock is a credit to the calculation corresponding to 308 EUR/MWh. The data are compiled in Table 12. The table includes two different cases where cost of capital has been varied in same way as for the cellulosic ethanol presented earlier in this chapter (see Table 11).

45
2017-09-01
Table 12. Production cost for MSW based ethanol (biochemical pathway)
Capital 15y/10% Capital 20y/8% EUR/MWh EUR/MWh
Capital 189 145 Feedstock -308 -308 Enzymes 42 42 Other O&M 170 170 Total 93 49
Comments from the authors: The calculations in Table 12 are sensitive to small variations in the main cost elements as the result is a difference between comparably large numbers. The Abengoa calculation also includes quite large deviations from key numbers coming out from similar technologies e.g. investment intensities for the FOAK lignocellulosic plants presented in chapter 4.1.1, as is the cost of enzymes and O&M.
The effective feedstock credit for the organic waste as fed to the conversion plant is also considerably higher compared to other MSW- or RDF-based concepts presented in this report. However, this cost difference arises in the MSW separation plant and its mass balance and economics rather than in the downstream conversion plant. It is therefore recommended to develop all the MSW to ethanol concepts being part of this report further, with the attempt to bring all concepts to a level playing field. This is outside of the scope of this work and also need involvement of specialists in the waste management field.
• Clariant
Clariant is aligned on the general range of the production cost depicted in Figure 8. This corresponds with its base case although they are of the opinion that this figure is misleading. The major difference between the listed companies as depicted is stemming from the cost of feedstock not from the technology. Although this is mentioned in the text it is not a fair reflection of the available technologies. Also, this does not take into account two things:
1. Differences in feedstock cost per quantity of ethanol produced may result from either yield (a technical reason) or feedstock purchase cost (a non-technical reason).
2. Neither the figure nor the text take into account that the byproduct lignin can be used for energy generation or used to add additional income and thus bring down operating costs.
Clariant suggests to either take feedstock costs out of the graph completely or at least move it to the top to be better able to compare differences in production costs by technology.
Production costs do differ by technology. For example, enzyme production has a strong impact on overall production costs being one of the major cost drives. See Figure 12, A recent study analysed and compared three production methods (off-site, on-site and integrated) and their effect on overall cellulosic ethanol production costs, coming to the following conclusions:

46
2017-09-01
- The cost of enzyme is one of the most significant cost factors in cellulosic ethanol production - Integrated enzyme production is the most cost efficient way - The cost of enzyme production is the most variable single input item by production
approach
Breaking down the enzyme production costs, it is shown, that by changing from off-site to on-site to integrated enzyme production, the cost for enzymes can be lowered by 23% and 52% respectively, and thus enzyme production is the most variable of cost factors. This quite dramatic decrease is mainly attributed to the difference in feedstock for enzyme production and the huge price difference between biomass for integrated production versus sugars in the off-site and on-site case. Hence, it is not surprising, that a reduction in enzyme costs has a significant impact on overall cellulosic ethanol costs. The study looked at the annual cash costs, which showed a reduction of 8% and 20%, respectively, by shifting from off-site to on-site to integrated production, and at annual full costs (including capital costs), with a reduction of 7% and 19% respectively. Overall cellulosic ethanol production costs were calculated to decrease from 2.78 USD/gallon to 2.61 USD/gallon to 2.36 USD/gallon, with enzyme costs making up 0.78 USD/gallon, 0.58 USD/gallon and 0.23 USD/gallon respectively.
The overall predicted production costs for cellulosic ethanol from both sources correspond with our data as mentioned above. We agree that a 10-15% decrease over time due to the learning curve is reasonable.
Each company has their internal guidance on discounting factors (e.g. WACC), also dependent on the country and location, so these are likely to vary by project.
4.2 Biomethane via anaerobic digestion
Anaerobic digestion technologies use a substrate which is most commonly wet. However, dry substrates (in the range of 30-35% dry matter content) are also increasingly used in the so called solid state fermentation, especially for waste fractions. The substrate is processed in a digester under anaerobic conditions at atmospheric pressure and temperatures slightly above ambient, in the range between 35°C and 60°C
The process of hydrolyzing the substrate and generate methane takes one to fifty days, depending on the substrate and temperature used. The product, so-called biogas, mainly contains methane up to 50-70% vol., CO2 and some minor constituents/contaminants. To use the biogas as a transport fuel it is upgraded by removal of the contaminants and the CO2 to reach 97% vol. methane or more. There are a variety of proven technologies for this purpose.
The technologies used for the biogas generation and for the upgrading are well-known, there are over 17,000 biogas plants in Europe mainly used for CHP applications, but already over 350 units have an integrated upgrading technology to biomethane. Therefore, the technology is at the right-hand side of the learning curve, Figure 2, such that the improvements over time have a slower pace than for other, less well-established technologies.
However, compared to other biofuel technologies the processing via anaerobic digestion is done at smaller capacity, typical state-of-the-art installations in the upper end of the capacity scale are below
47
2017-09-01
20 MW product output, i.e. approximately 2,000 Nm3/hr, corresponding to 350 bpd. There are smaller capacity biogas installations available, well below 1 MW units, but in such small installations the upgrading of the biogas is rarely motivated. The focus has therefore been on the larger scale more relevant for vehicle fuel (or for injection into gas grid).
4.2.1 Production cost
The production cost of biomethane, based on estimates from different sources45, 46, 47, is given in Figure 13 and Figure 14. Figure 13 shows the impact of scale and upgrading technology. Figure 14, which is based on Swedish conditions and a scale48 of 50-100 GWh per year (600-1,200 Nm3/hr) shows the impact of different substrates.
Based on a 10 kWh/Nm3, the total costs fall within 40-120 EUR/MWh or 4-12 EUR/Nm3. The range relates to the cost of the substrate where wastes of different kinds can have negative or zero cost, while other materials comes with a cost, e.g. grass at approximately 86 EUR/ton Dry Matter (DM) (18-19 EUR/MWH) on the average in Germany. The second factor is the economy of scale, indicated by Figure 13.
4.2.2 Capital Expenditure (CAPEX)
Information from the cited sources and for real projects in Sweden and Germany for the upper capacity range indicate that the investment cost is of the order of corresponds to around 1,500-2,000 EUR/kW or 15,000-20,000 EUR/Nm3. (or in the region of 100,000-130,000 USD/bpd gasoline equivalents). There is also a fairly large scale factor disfavoring smaller plant, the specific investment cost goes up by 50-100% when going significantly below 5 MW output, but such smaller installations have not been considered further.
45 Data obtained from EBA (European Biogas Association) 46 Stürmer B., Kirchmeyr F., Kovacs K., Hofmann F., Collins D., Ingremeau Cl., Stambasky J.: “D3.4 | Technical-economic analysis for determining the feasibility threshold for tradable biomethane certificates”. Biosurf project. 24 -06-2016. http://www.biosurf.eu/wordpress/wp-content/uploads/2015/07/BIOSURF-D3.4.pdf. 47 Publically available data for individual projects from press releases etc. 48 Personal communication, B. Fredriksson-Möller, EON Sverige.

48
2017-09-01
Figure 13. Cost of production of biomethane at different scales and upgrading systems (Substrate not known)46
4.2.3 Operational Expenditure (OPEX)
The magnitude of the operating cost, other than for the substrate feedstock, is similar to the capital cost, e.g. in the range of 10-15% of the investment per year. The main cost drivers are the heat required for the process and the electricity used both in the biogas plant and in the upgrading and compression part. Also, regarding the OPEX, there are considerable scale effects as the staffing requirements are more or less independent of the capacity, and can then become the dominant cost at smaller capacities.
4.2.4 Feedstock and performance
There is a large variety of substrates available for biogas plants, organic waste fractions, farm-yard manure, sludge from sewage treatment, food and meat processing industrial wastes but also energy crops and straw, alone or in combinations. The feedstock cost could therefore range from negative up to the cost of straw, e.g. up to 100 EUR/ton.

49
2017-09-01
Figure 14. Cost of production of biomethane from different substrates (Adapted from graph in49)
In addition, the choice of feedstock also affects the value or cost of disposal of the digestate. Furthermore, the gas yield from the variety of substrates may in practice range from 150 to 600 Nm3/ton dry substance, and where manures are both low in the theoretical yield and in the conversion efficiency in the digester50. For these reasons the feedstock component of the production cost is a complex matter beyond the scope of this memo, and the reader is referred to more specialized literature on this subject.
A survey46 made among biogas plant operators in the EU gave a range of feedstock cost, expressed as feedstock contributions to the biogas production cost ranging from 3-60 EUR/MWh.
4.2.5 Feedback from stakeholders
• EBA
EBA have provided information e.g. the cost reduction estimates in Figure 5 and have made comments on the drafts.
49 Vestman J., Liljemark S., Svensson M.: ”Kostnadsbild för produktion och distribution av fordonsgas (Cost benchmarking of the production and distribution of biomethane/CNG in Sweden)”. Svenskt Gastekniskt Center AB, Nordenskiöldsgatan 6, 211-19 MALMÖ. SGC Rapport 2014:296. http://www.sgc.se/ckfinder/userfiles/files/SGC296_v2.pdf. 50 Styrmedel för biogasproduction. U2014-02. Avfall Sverige. (In Swedish)
0,00
20,00
40,00
60,00
80,00
100,00
120,00
Organic waste Sludge Agwastes Ind. wastes Energy crops Manure
€/MWh
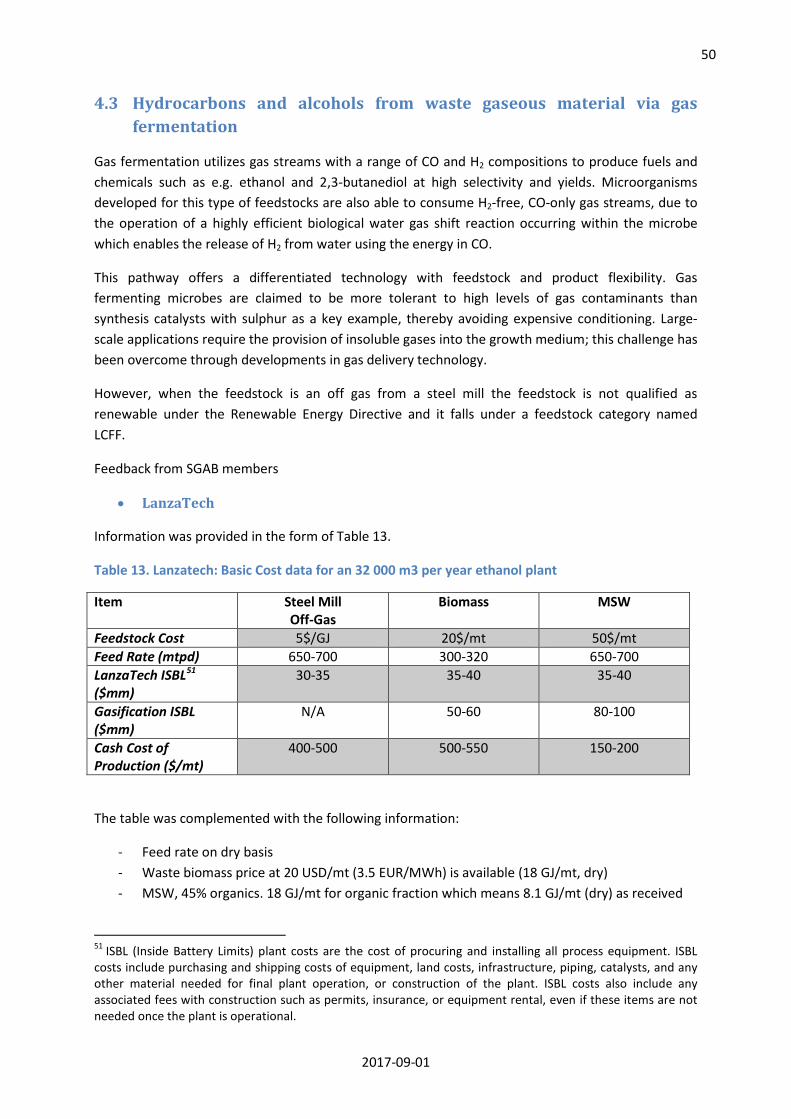
50
2017-09-01
4.3 Hydrocarbons and alcohols from waste gaseous material via gas fermentation
Gas fermentation utilizes gas streams with a range of CO and H2 compositions to produce fuels and chemicals such as e.g. ethanol and 2,3-butanediol at high selectivity and yields. Microorganisms developed for this type of feedstocks are also able to consume H2-free, CO-only gas streams, due to the operation of a highly efficient biological water gas shift reaction occurring within the microbe which enables the release of H2 from water using the energy in CO.
This pathway offers a differentiated technology with feedstock and product flexibility. Gas fermenting microbes are claimed to be more tolerant to high levels of gas contaminants than synthesis catalysts with sulphur as a key example, thereby avoiding expensive conditioning. Large-scale applications require the provision of insoluble gases into the growth medium; this challenge has been overcome through developments in gas delivery technology.
However, when the feedstock is an off gas from a steel mill the feedstock is not qualified as renewable under the Renewable Energy Directive and it falls under a feedstock category named LCFF.
Feedback from SGAB members
• LanzaTech
Information was provided in the form of Table 13.
Table 13. Lanzatech: Basic Cost data for an 32 000 m3 per year ethanol plant
Item Steel Mill Off-Gas
Biomass MSW
Feedstock Cost 5$/GJ 20$/mt 50$/mt Feed Rate (mtpd) 650-700 300-320 650-700 LanzaTech ISBL51 ($mm)
30-35 35-40 35-40
Gasification ISBL ($mm)
N/A 50-60 80-100
Cash Cost of Production ($/mt)
400-500 500-550 150-200
The table was complemented with the following information:
- Feed rate on dry basis - Waste biomass price at 20 USD/mt (3.5 EUR/MWh) is available (18 GJ/mt, dry) - MSW, 45% organics. 18 GJ/mt for organic fraction which means 8.1 GJ/mt (dry) as received
51 ISBL (Inside Battery Limits) plant costs are the cost of procuring and installing all process equipment. ISBL costs include purchasing and shipping costs of equipment, land costs, infrastructure, piping, catalysts, and any other material needed for final plant operation, or construction of the plant. ISBL costs also include any associated fees with construction such as permits, insurance, or equipment rental, even if these items are not needed once the plant is operational.
51
2017-09-01
- Tipping fee for MSW at 50 USD/ton which gives a credit to the feedstock corresponding to 20 EUR/MWh.
- Steel mill off-gas at 5.4 GJ/mt and at cost of 16 EUR/MWh (5 USD/GJ) - Cash cost includes fixed and variable operating expenses as are typical, but does not include
repayment of capital. - Commercial plant sizes in multiples of 300 mt/d for feedstocks like waste biomass and MSW. - Typical gasification energy conversion efficiency is 65-75%. - Cash cost of production includes fixed and variable operating expenses as are typical
The following can be concluded from supplied data.
- The 32,000 t/year ethanol plants have a capacity of 23.4 MW ethanol during 8,000 h/y operation.
- 675 t/d of steel waste gas corresponds to 42 MW of gas - 310 t/d of dry biomass corresponds to 64 MW which can be converted to 45 MW of (raw)
syngas with 70% cold gas efficiency. - Conversion from feed gas/syngas to ethanol has an energy conversion efficiency of 52-56%
(to be compared with theoretical value of 73 % and 86 % from reaction of 6 moles of CO or 6 H2, respectively, to form 1 mole ethanol)
- Including the gasifier conversion, the energy yield is 35-40 % from fuel to ethanol - 675 t/d MSW with energy content of 8.1 GJ/mt corresponds to 63 MW which can be
converted to 44 MW of (raw) syngas with 70% cold gas efficiency. CAPEX for the proposed process is 1,260 EUR/kW for the steel mill gas case, 3,590 EUR/kW for the biomass case and 4,950 EUR/kW for the MSW case. With a 15 year/10% annuity factor of 0.1315 this give a capital cost for element in the fuel production cost of 21, 59 and 81 EUR/MWh respectively. Feedstock cost in the ethanol production cost for the cases are for steel gas 29 EUR/MWh, for biomass 10 EUR/MWh and for MSW a credit of 54 EUR/MWh. Cash costs element are said to have average values of 450, 525 and 175 USD/mt for the steel gas, biomass and MSW cases which can be recalculated to 54, 63 and 21 EUR/MWh for the respective cases. O&M costs excluding feedstock can thus be calculated to be 25, 53 and 75 EUR/MWh for the steel gas, biomass and MSW cases. Table 14 summarizes the cost elements and gives total ethanol production cost.
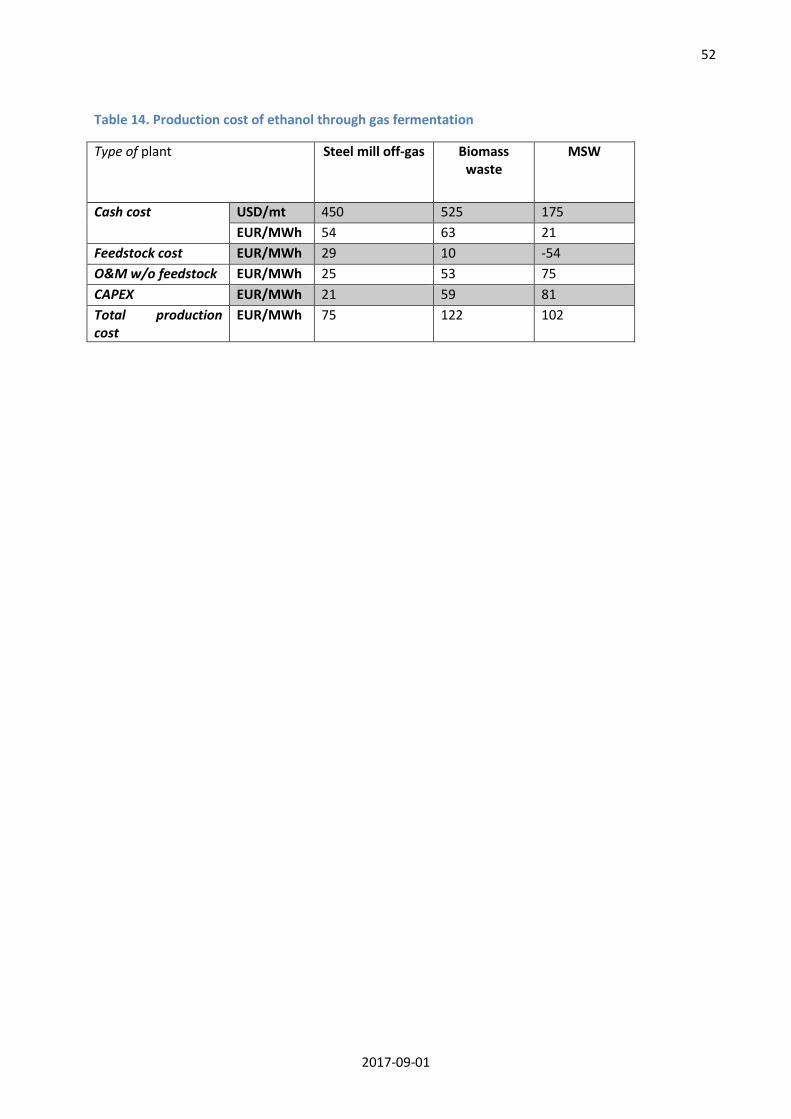
52
2017-09-01
Table 14. Production cost of ethanol through gas fermentation
Type of plant Steel mill off-gas Biomass waste
MSW
Cash cost USD/mt 450 525 175 EUR/MWh 54 63 21
Feedstock cost EUR/MWh 29 10 -54 O&M w/o feedstock EUR/MWh 25 53 75 CAPEX EUR/MWh 21 59 81 Total production cost
EUR/MWh 75 122 102
53
2017-09-01
5 Aviation fuels
The global jet fuel market is above 300 million m3 per year52. For aviation fuels, only drop-in hydrocarbon fuels can be accepted, i.e. bio-kerosene, and the properties and conditions for these fuels are defined by an ASTM standard53. The blended Fuel (i.e. fossil + abio-jet) fuels must also meet the regular fuel standard54. The production of aviation fuels does not imply any specific technology in itself; several of the technology developments discussed in this report and in the Technology Status Report are capable of providing bio-jet with more or less processing of the primary biofuel product. Irrespective of the processing route, all such processes, and in addition to the bio-kerosene product, also yield other hydrocarbon fractions as by-products that are suitable for ground transport fuels, or for the fraction below C5, use as energy carriers.
5.1 Alternative production routes
At present, there are five fully accepted forms of bio-kerosene as defined by annexes to the cited standard
- FT-SPK (Synthetic Paraffinic Kerosene) from different forms and product streams of the FT process, blend ratio (bio-jet/total jet fuel) 50%.
- FT-Synthetic Paraffinic Kerosene Aromatics (SPK/A) from different forms and product streams of the Fischer Tropsch (FT) process, blend ratio 50%.
- HEFA-SPK from the HVO process, blend ratio 50%. - Synthetic Iso-Paraffins (SIP), derived from sugar-based organics, notably farnesene produced by
Amyris, blend ratio 10% and finally, - Alcohol to Jet (ATJ)-SPK , made from iso-butanol obtained via fermentation of sugars, blend ratio
30% (approved early 2016).
In practice, the actual tank blend level will be lower than the cap in the ASTM specification since an operational aircraft normally has a significant part of the fuel left in the tanks from the previous flight as a safety precaution when refueling. Several other annexes are in preparation such as Alcohol to Jet Synthezised Kerosene with ATJ-SKA (Synthezised Kerosene with Aromatics), HFP-HEFA (fka HEFA+), Hydrotreated Depolymerized Cellulosic Jet (HDCJ), Hydro-Deoxygenated Synthesized Kerosene (HDO-SK), Hydro-Deoxygenated Synthesized Aromatic Kerosene (HDO-SAK), CH Catalytic Hydrothermolysis etc. The HFP-HEFA annex would be a relaxation of the already approved HEFA annex such that only after blending, all the properties of the jet fuel are met. This would mean that HVO diesel could be used more or less as-is but in a more limited blend ratio of the same order of magnitude as for SIP. If accepted in 2017, the
52 Radich T.: “The Flight Paths for Biojet Fuel”. 9th Oct. 2015. U.S. Energy Information Administration. Washington, DC 20585. http://www.eia.gov/workingpapers/pdf/flightpaths_biojetffuel.pdf. 53 ASTM D7566-17, Standard Specification for Aviation Turbine Fuel Containing Synthesized Hydrocarbons, ASTM International, West Conshohocken, PA, 2017, www.astm.org. DOI: 10.1520/D7566-17. 54 ASTM D1655-17, Standard Specification for Aviation Turbine Fuels, ASTM International, West Conshohocken, PA, 2017, www.astm.org. DOI: 10.1520/D1655-17.
54
2017-09-01
availability of bio-kerosene would improve significantly based on already operating HVO plants. In the event of such an approval, it is not unlikely that also other pathways will try the same thing to obtain e.g. SPK+ or ASJ+. As far as their respective blend-walls are far away e.g. 10% in a large quantity of biofuel used in a major airport, this could increase the market (Stockholm Arlanda Airport consumes some 0.7 million m3 per year, Schiphol around 4.4 million m3). FT-SPK/A, ATJ-SKA and HDO-SAK are of some additional interest in addition to the fuel value, as these fuels are higher in aromatics than the SPK, SIP and SK fuels, and since after blending a minimum requirement for aromatics of 8% must be retained to meet specifications. However, since the aromatics are also increasing soot particle emissions, fossil jet typically is not overshooting this specification such that the aromatics can be a limiting factor for the blending.
HEFA has been the predominant fuels for test flights and more extended tests. None of the HVO plants that were in operation before 2016 produce a dedicated stream of bio-jet, they are all mainly focusing on renewable diesel. The 100,000 ton per year Altair plant in California, USA, that came on stream in 2016, is the first plant that produces a combination of a dedicated stream of HEFA bio-jet and HVO bio-diesel.
With regard to SIP, this is a product developed by Amyris, and it is demonstrated in a plant in Brazil with a capacity of 0.05 million m3 per year. The original product farnesene is hydrogenated to farnesane and used as the bio-jet component55. Since farnesene is also used for lubricants, bio-polymers and –resins, the actual production of bio-jet is not known.
At present., there is no biomass FT plant in operation and hence no SPK bio-jet is produced. There are several plans for such installations, mainly in the USA (Red Rock Biofuels, 0.05 million m3 per year off which 40 % aviation fuel, Fulcrum Sierra Biofuels, 0.04 million m3 per year). In the EU some project with NER300 contracts56 were planned to produce FT liquids. FT-SPK/A relates to the use of the high temperature FT process used by Sasol.
ATJ-SPK covers synthetic kerosene produced from C2-C5 alcohols. Currently the only qualified pathway starts with iso-butanol, a technology developed by Butamax and Gevo, where the initial production of the butanol is still in the pilot/demonstration phase. Since at present both SIP and ATJ-SPK are produced from crop-based sugars, they are not advanced biofuels according to the SGAB definitions. However, other ATJ technologies exist and are currently in review by ASTM, including one developed by LanzaTech to convert ethanol to SPK. LanzaTech’s technology is in particular said to allow the use of ethanol from any source, including cellulosic and industrial waste gas feedstocks, for conversion to drop-in jet fuel blendstocks.
There are also various technologies in various stages of developments below an actual demonstration such as pyrolysis oil upgrading, sugar chemical conversion to hydrocarbons and conversion of ethanol to hydrocarbons. Recently an FP7 project presented a review of the status of
55 GreenAir Communications “Amyris/Total renewable jet fuel gets ASTM green light as SIP fuels are approved for commercial aviation use”. 20-06-2014. http://www.greenaironline.com/news.php?viewStory=1955, Accessed 28-06-2017. 56 See SGAB memo “NER 300 Initiative and Status of Bioenergy Projects”
55
2017-09-01
ASTM approval and of the pathways mentioned above, and also listed over a dozen pathways in the pipeline to initiate qualification57.
5.2 Market conditions and available incentives
Despite of the more restrictive quality demands for aviation fuel relative to road transport fuels, the price of kerosene does not significantly deviate from the price of diesel, Figure 15, and sometimes even fall below this price.
For this reason, aviation biofuel does not in itself have a sufficient additional value, relative to drop-in HVO diesel or some other advanced biofuel, to give an incentive to focus on this product, in particular as in most cases a focus aviation fuels causes a slight overall loss in yield of liquid products relative to producing ground transport fuels.
Another observation is that many of the feedstocks used for production of biofuels and bio-jet are also part of the commodity markets such that synergistic effects have an impact on the market price. When fossil fuel prices increase, there is tendency that the price of alcohols, vegetable oils, that are both to considerable extent used for transport fuels, follows. Therefore, the gap between the costlier biofuels and the fossil fuels is not necessarily reduced to the same extent that could be expected if there were no such synergies.
Furthermore, for ground transport there are various support mechanisms in place in the EU (targets in ground transport etc.) and in the USA (RFS2) to bridge the price difference between biofuels and fossil fuels, and where aviation fuels can be included on the same terms as other biofuels. The RFS2 covers jet fuel, and language has been proposed to modify California’s Low Carbon Fuels Standard (LCFS) to also cover bio-jet fuel, which could provide significant incentives for alternative jet fuel production. Cellulosic jet fuels would benefit from cellulosic and LCFS credits; approximately 60-70 USD/MWh and 15-20 USD/MWh, respectively, but so would also ground transport biofuels. The Flightpath EU 2020 cooperation involving various stakeholders, has formulated a non-binding target of 2 million tons of bio-jet in 2020, and without any economic incentives than what the member states have for the implementation of the RED. So, in general, no additional mechanisms to the benefits for biofuels in general are in place for aviation biofuels fuels to compensate for the additional cost burdens and to stimulate producers to go beyond the ground transport biofuels to this more demanding market.
In the US, initiatives and support has largely been channeled through the Department of Defense for support and procurement of biofuel batches. The airline industry in the EU has also opted in into the third phase of the Emission Trading Scheme (ETS) cap-and trade system covering flights within the EU, and the EC the ambition to also include non-EU airlines flying to and from the EU in the fourth phase. However, these airlines protested directly, and also via diplomatic channels, and the proposal was not pursued, as it would then have disadvantaged EU carriers. The complexity of trying to regulate an industry where both the fuel used and the activities have such an international
57 Quignard A.: “Final Report on Technical Compatibility, Certification and Deployment”. Work Package 5, D5.2. CORE-JetFuel, 07.09.2016. Grant Agreement no.: FP7-605716. http://www.core-jetfuel.eu/Shared%20Documents/GA_605716_CORE-JetFuel_Deliverable_5%202_Final%20_Report_on_Technical_Compatibility_and_deployment_160907.pdf.
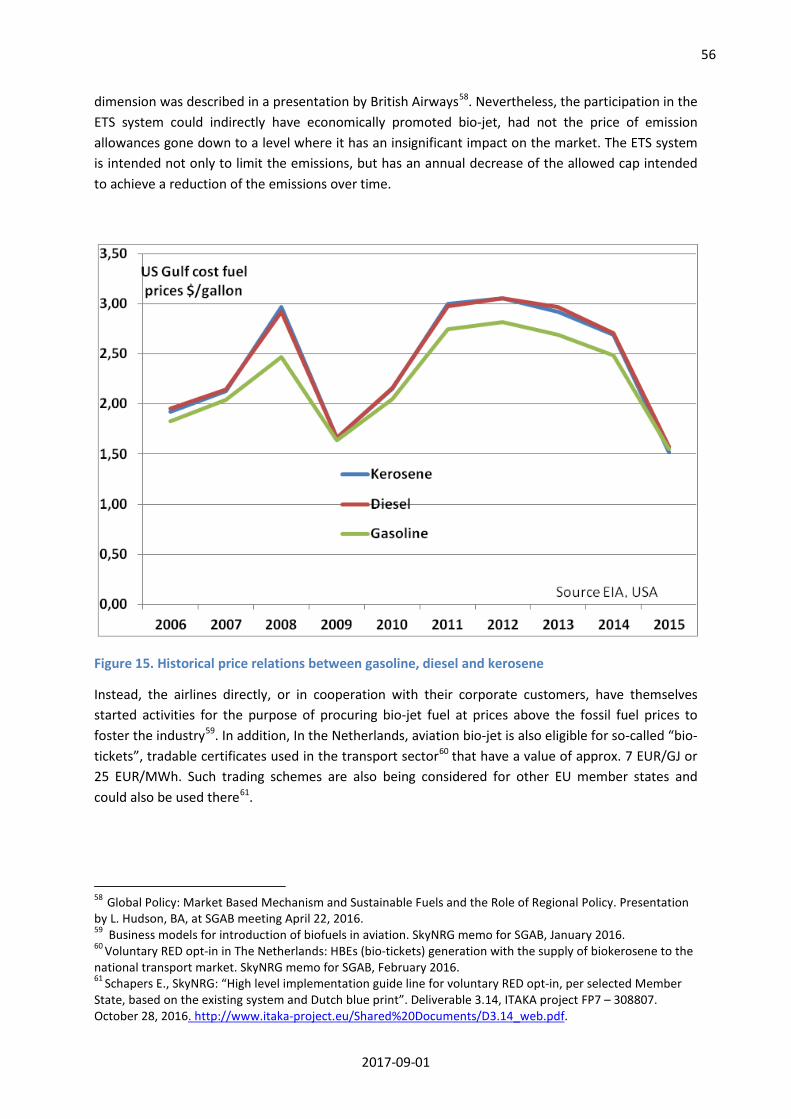
56
2017-09-01
dimension was described in a presentation by British Airways58. Nevertheless, the participation in the ETS system could indirectly have economically promoted bio-jet, had not the price of emission allowances gone down to a level where it has an insignificant impact on the market. The ETS system is intended not only to limit the emissions, but has an annual decrease of the allowed cap intended to achieve a reduction of the emissions over time.
Figure 15. Historical price relations between gasoline, diesel and kerosene
Instead, the airlines directly, or in cooperation with their corporate customers, have themselves started activities for the purpose of procuring bio-jet fuel at prices above the fossil fuel prices to foster the industry59. In addition, In the Netherlands, aviation bio-jet is also eligible for so-called “bio-tickets”, tradable certificates used in the transport sector60 that have a value of approx. 7 EUR/GJ or 25 EUR/MWh. Such trading schemes are also being considered for other EU member states and could also be used there61.
58 Global Policy: Market Based Mechanism and Sustainable Fuels and the Role of Regional Policy. Presentation by L. Hudson, BA, at SGAB meeting April 22, 2016. 59 Business models for introduction of biofuels in aviation. SkyNRG memo for SGAB, January 2016. 60 Voluntary RED opt-in in The Netherlands: HBEs (bio-tickets) generation with the supply of biokerosene to the national transport market. SkyNRG memo for SGAB, February 2016. 61 Schapers E., SkyNRG: “High level implementation guide line for voluntary RED opt-in, per selected Member State, based on the existing system and Dutch blue print”. Deliverable 3.14, ITAKA project FP7 – 308807. October 28, 2016. http://www.itaka-project.eu/Shared%20Documents/D3.14_web.pdf.
57
2017-09-01
Example of airline engagement in the biofuel industry is e.g. off-take agreements62 by Fed EX and Southwest Airlines with Red Rock Biofuels for 3 million gallons per year each (approximately 11,000 m3 each), thereby buying all aviation fuel produced in this 15 million gallon per year plant and by United Airlines off-take agreement63 from Altair for 5 million gallons per year, or some 15 % of the output. Also, the US Navy has a take-off agreement for 78 million gallons of diesel at 2 USD/gallon64. Fulcrum Sierra Biofuels has a combination of stakeholder and off-take agreements with Cathay Pacific (investment not known, 375 million gallons over 10 years), United Airlines65 (30 million USD, 90 million gallons per year) and very recently also BP66 (30 million USD, 50 million gallons per year). These volumes are based on that the Sierra Biofuels plant should be replicated in 5-8 other locations. The price in the take-off agreements is not known, but a 1 USD/gallon production cost have been stated, as the plants will be using wastes with zero cost at the gate.
Within the UN air transport industry umbrella organization ICAO, the participating states have also recently agreed on the Carbon Offsetting and Reduction Scheme for International Aviation (CORSIA)67 as a complement to other measures in international aviation. Implementation of the CORSIA will begin with states signing up for a voluntary pilot phase from 2021 through 2023, followed by an, again voluntary, first phase, from 2024 through 2026. The third phase from 2027 to 2035 would see all states on board, with some exemptions. The average level of CO2 emissions from international aviation covered by the scheme between 2019 and 2020 represents the baseline for carbon neutral growth from 2020. If emissions any year thereafter exceed this baseline, the difference becomes the off-setting requirement for that year i.e. CORSIA stabilizes the emissions but does not necessarily decrease the emissions, as the EU ETS system intends. The emissions can increase by the growth of the industry and hence an increased use of fuel and decrease by more efficient aircrafts, operational improvements and use of less emitting fuels, e.g. bio-jet. Initially, up to 2029, this off-set will be managed of the sector as a collective, whereas thereafter individual carriers will be responsible for 20% of their own growth of emissions, this share to be increased to 70% in 2035. The off-setting of any difference in emissions is planned to be performed via a market based mechanism whereby eligible emission rights in acknowledged, already operative carbon trading systems are acquired and redeemed or by carbon off-setting projects.
62 Lane J.: “FedEx joins Southwest Airlines to buy out Red Rock’s entire 8-year jet fuel inventory — key milestone for project construction”. Biofuels Digest 21-07-2015. http://www.biofuelsdigest.com/bdigest/2015/07/21/fedex-southwest-airlines-combine-to-buy-entire-jet-fuel-output-of-red-rock-biorefinery-through-2024/. Accessed 28-06-2017. 63 Zia H.: “Biofuels in Defense, Aviation, and Marine. Bioenergy Technologies Office Peer Review”. U.S. Department of Energy, March 24, 2015. https://www.energy.gov/sites/prod/files/2015/04/f21/day_2_plenary_haq_aviation.pdf. 64 Harrington K.: “US Navy Green Fleet Makes Biofuels the New Normal”. American Institute of Chemical Engineers 29-01-2016. http://www.aiche.org/chenected/2016/01/us-navy-green-fleet-makes-biofuels-new-normal. Accessed 28-06-2017. 65 Lane J.: “United Airlines invests $30M in Fulcrum BioEnergy; inks $1.5B+ in aviation biofuels contracts”. Biofuels Digest 30-06-2015. http://www.biofuelsdigest.com/bdigest/2015/06/30/united-airlines-invests-30m-in-fulcrum-bioenergy-inks-1-5b-in-aviation-biofuels-contracts/. Accessed 28-07-2017. 66 Lane J.: “Air BP, BP Ventures invest $30M in biojet producer Fulcrum Bioenergy; ink 500M gallon, 10-year offtake deal”. Biofuels Digest 07-11-2016. http://www.biofuelsdigest.com/bdigest/2016/11/07/air-bp-and-bp-ventures-invest-30m-in-biojet-producer-fulcrum-bioenergy-ink-500m-gallon-10-year-offtake-deal/. Accessed 28-07-2017. 67 International Civil Aviation Organization: “What is CORSIA and how does it work?”. http://www.icao.int/environmental-protection/Pages/A39_CORSIA_FAQ2.aspx. Accessed 28-07-2017.
58
2017-09-01
5.3 Bio-kerosene fuel production cost
The actual data for bio-jet production cost are scarce. For the drop-in fuels already discussed in this report, i.e. HVO installations, HEFA and gasification based FT plants (SPK), the higher requirements on a plant that has a dedicated bio-aviation fuel output is associated with an overall marginally higher investment and a loss of yield. In all cases, also such plants produce diesel and gasoline by-products in significant quantities, such that the aviation fuel cost can be expected to be in the higher part of the interval given in Section 3.1 and Section 3.3, respectively. This would imply 70-90 EUR/MWh for HEFA and 110-140 EUR/MWh for SPK. If, and when, a HFP-HEFA annex is adopted, more or less regular HVO diesel could be used and production cost would drop down into the lower part of the interval, i.e. 55-65 EUR/MWh. For the SIP pathway, starting with crop-based sugars, data from one of the co-developers68 gives the price as 8 USD/liter (750 EUR/MWh) in 2010, 2 USD/liter (185 EUR/MWh) today with a target of 1 USD/liter (93 EUR/MWh) in the coming decade.
There have been many attempts to estimate the cost of bio-jet production, both regarding individual technology pathways and to compare different pathways. These also involve the less developed pathways.
One such recent attempt done by US National Renewable Energy Laboratory (NREL) is summarized inTable 15. (For details, further data and references see the original report69. These authors have tried to collect data for different pathways from the feed (for vegetable oils the starting points is the seed and the oil is the intermediate))
However, this compilation based on numerous references is not very conclusive. The span in yield of bio-jet is often quite large. For HEFA and HDO, the feed is on one hand based on seeds with a convertible oil content of 30-50%, on the other hand it is based on algae biomass, dairy wastes and cooking oil with higher lipid content than the seeds. The ATJ and the SPK has a factor of 10 and 4, respectively, in the yield which is difficult to explain. The cost data does not reflect this span. Cost of production is however in line with other calculations done for the FT route. In the case of pyrolysis oil, the almost lowest yield of bio-jet product (an energy efficiency of around 15%) gives one of the lowest product cost. The authors of this report also conclude that data is often lacking.
Another recent attempt70 to estimate the costs used a consistent modeling approach to estimate the cost for both the FOAK and the NOAK cases, Figure 16. However, basic data on yield and investments etc. to use as inputs are based on more or less the same published data as in the previous report.
Again, pyrolysis oil but also Hydrothermal Liquefaction (HTL) come out as the low-cost alternatives together with HEFA. One reason for these surprisingly low costs are that the energy efficiency figures are very high for these pathways, 80 % and 60 % from fuel to jet for HTL and pyrolysis oil, respectively, while the specific investment cost is only some 2/3 of the FT plants. HTL is a technology at lower TRL that pyrolysis oil and FT, so the results seem speculative, and again reference should be made to the Mountain of Death graph, Figure 2.
68 Sugar to biofuels: the roadmap, presentation slide provided for SGAB by Total.

59
2017-09-01
5.4 Comments to production cost data for aviation fuels
Comment 1: ATJ via Ethanol
The market value of ethanol already lies at 70-100 EUR/MWh depending on the location, and from chapter 4.1, it is clear that cellulosic ethanol still has some ground to cover to reach such cost levels. Under such circumstances, it is not self-evident that post-processing to ATJ, at an even higher cost of production per unit of energy is motivated. This increases the gap to the competing commodity even more, and is not a strengthening of the business case. The maximum value in Table 15which is 3 MWh of fuel per ton corresponds to 60% energy efficiency from biomass to aviation fuels which is theoretically not possible when proceeding via ethanol. Establishing the right incentive framework which properly rewards the investment needed to produce alternative jet fuels would correct this imbalance.
Comment 2: HDO technology from oil seeds to aviation fuels
Cost of product is considerable lower than the indicated cost of the intermediate, due to that table entries have not reported both, such that these does not reflect the evolution of cost from feed over intermediate to product.
Comment 3: Aviation fuel via pyrolysis of cellulosic materials
Biomass conversion to pyrolysis oil can be carried out with an energy efficiency of 65-70%, and the complete conversion can, based on the material discussed in Section 3.2, have an overall energy efficiency (hydrocarbons/ wood at plant gate) from 30% in co-processing to around 60% for a stand-alone integrated plant, in the latter case not including the natural gas used for hydrogen production. Technology development status regarding this upgrading are on low TRL levels. It is therefore premature to conclude that the pyrolysis route can lead to efficient and very low cost production of aviation fuels, as proposed in Table 15 and also inFigure 16.
The table also shows a comparably low yield (0.7 MWh per dry ton of biomass which equals about 15% energy conversion efficiency) which does not support a low production cost. In this case the yield is the only number reported from seven studies, while the cost comes from other studies where cost, but not yields were reported. With a feedstock price of 10-20 EUR/MWh just the cost of feedstock in the product would account for a large fraction in the product cost bars. The estimates made in Section 3.2 also indicate that co-processing is indeed low cost at the level indicated in the blue bar, 60 EUR/MWh. However, this comes with the limitation that the FCC unit capacity would only allow production at this cost level of some 0.3-0.6 million tons maximum. To apply a stand-alone integrated plant technology to reach higher production volumes would shift the production cost to a higher value.

60
2017-09-01
Table 15. Estimated yields and costs for bio-jet from a variety of feedstocks and processing routes. (Adapted from69)
Category Technology Biomass Intermediate Yield
Intermediate Cost
Jet Fuel Yield Jet Fuel Cost
Notes
l/tonne dry EUR/MWh l/tonne dry
MWh/tonne dry
EUR/MWh
Alcohol to Jet (ATJ)
Ethanol to Jet (e.g. ATJ)
Corn, Corn Stover, Wood, Straw, Sugarcane, Switchgrass
Ethanol 67-442
51-173 46-330 0.4-3.0 103-362 1
N-butanol to Jet Corn, Corn Stover, Wheat Straw, Wood
N-butanol 129-238
94-135 96-179 0.9-1.6 103-189
I-butanol to Jet (e.g. ASJ)
Corn Stover, Wood Chips
I-butanol 230
121 171-200 1.6-1.8 130-162
Oil to Jet
Hydrotreated Renewable Jet (e.g. HEFA)
Soyabean, Algae, Pongamia, palm Seed, Rapeseed, Jatropha Seed, Camelina Seed, Salicornia, Cooking Oil
Vegetable or Algae Oil 209-589
26-604 117-363 1.0-3.6 65-863
Catalytic Hydrothermolysis (e.g. HDO-SAK)
Algae Biomass, Siybean, Jatropha Seed, Tung Seed, Dairy Waste
Vegetable or Algae Oil 209-426
130-208 33-509 0.3-4.8 89-121 2
Pyrolysis/ Hydropyrolysis (e.g. HDCJ)
Corn Stover, Wood Pyrolysis Oil 209-639
22-100 79 0.7 97 3
Gas to Jet
FT (e.g. SPK) Corn Stover, Wood FT-Crude 184-463
84-168 38-158 0.3-1.4 156
Gas Fermentation Wood, Yard, Vegetative & Household Waste
Ethanol 275-321
40 184-217 1.7-2.0 Not Available
Sugar to jet
Catalytic APR Corn Stover, Wood Sugars 111-262 58-104 0.6-0.9 Not Available
Catalytic HMF & DMF
Fructose (to HMF and DMF)
HMF, or DMF 192-318 217-259 0.6-2.4 Not Available
Sugar Fermentation (e.g. SIP)
Corn Stover, Sugarcane, wood, Wheat Straw
Sugars 183 100-179 0.9-1.7 10-620
69 Wang Wei-Cheng, Tao L., Markham J., Zhang Y., Tan E., Batan L., Warner E., Biddy M.: “Review of Biojet Fuel Conversion Technologies”. National Renewable Energy Laboratory (NREL) Technical Report NREL/TP-5100-66291, Contract No. DE-AC36-08GO28308. July 2016. https://www.nrel.gov/docs/fy16osti/66291.pdf.

61
2017-09-01
Figure 16. Estimate FOAK and NOAK minimum selling price for bio-jet (Adapted from70).
Comment 4 SIP from sugars
The cited authors70 also notes that farnesene in itself has a value of over 5,000 EUR/ton as a chemical intermediate in its own right. The potential markets for farnesene are discussed in a recent report71, where it is concluded that the opportunities in high price niche markets (e.g. squalene at 30 USD/liter) may be more attractive than in commodity fuels markets.
Comment 5 Forest biomass and straw to aviation fuels via HTL
HTL based technology is at a very early stage of development and it is questionable if a conversion route at this very early stage should be shown in the same picture as conversion pathways where technology is available although at cost and efficiency levels which seems to be less attractive than the HTL based (or pyrolysis oil based) route. According to the authors of this report data cannot be directly compared.
70 Sierk de Jong, Hoefnagels R., Faaij A., Slade R., Mawhood R., Junginger M.: “The feasibility of short-term production strategies for renewable jet fuels – A comprehensive techno-economic comparison”. Biofuel, Bioprod. Bioref. Volume 9, Issue 6, pp. 778–800. 2015. DOI: 10.1002/bbb.1613. 71 E4TECH, RE-CORD and WUR: “From the Sugar Platform to biofuels and biochemical” Final report for the European Commission Directorate-General Energy Contract No. ENER/C2/423-2012/SI2.673791. April 2015. https://ec.europa.eu/energy/sites/ener/files/documents/EC%20Sugar%20Platform%20final%20report.pdf.
3. 5.
Notes

62
2017-09-01
Comment 6 Aviation fuels from FT
The cost of aviation fuels from FT in Table 15 deviates from our estimates by being significantly higher than what presented in section 3.1. This probably relates to that in the cited paper the conversion factor in the cited paper from wood to fuel seem to be lower than what we have used.

63
2017-09-01
6 Comparison of the results and discussion
To assist the reader of the report to link resources, conversion pathways or technologies, their readiness in view of market deployment and the possible products for use in the market, the SGAB has developed the Table 16 "Classification of BIO, Low Carbon Fossil Fuels, e- & Hydrogen Transport Fuels". The SGAB does not claim that this table covers all resources, all conversion pathways or technologies and all possible fuels, or that the technology readiness is accurately representing all possible variations. However, the SGAB is of the opinion that the table is a good reference for discussion amongst all stakeholders.
Table 16. Classification of BIO, LCFF, e- & Hydrogen Transport Fuels
Classification of BIO, LCFF, e- & Hydrogen transport Fuels Raw Material Technology Type of Biofuel Status TRL1 Application
Conv
entio
nal
Sugar* Fermentation Ethanol
Commercial
Gasoline blend, E10, E85, ED95£, upgrade to biokerosene Starch*
Vegetable oils* Esterification or Transesterification FAME/Biodiesel Diesel blend, B7, B10, B30, 100%
Fats
Food Crops Biogas Production & Removal of CO2 Biomethane
100% heavy duty transport, Flexy Fuel Vehicles, captive fleets, injected in the
gas grid
Adva
nced
Waste streams of oils & fats Esterification or Transesterification FAME/Biodiesel
Commercial
Diesel blend, B7, B10, B30, 100% MSW2, sewage sludge, animal manures, agricultural residues,
energy crops
Biogas or Landfill production & removal of CO2 Biomethane
100%in heavy duty transport, flex fuel vehicles, captive fleets, injected in the
gas grid. Vegetable oils*, fats, Used Cooking Oils, Liquid waste
streams & effluents7 Hydrotreatment Hydrogenated Diesel drop in or 100%, bio-kerosene$
Lignocellulosics
MSW, solid industrial waste streams/residues3
Enzymatic hydrolysis + Fermentation Ethanol TRL 8-9
Gasoline blend, E10, E85, ED95, upgrade to biokerosene
Other Alcohols TRL 6-7
Gasification + Fermentation Ethanol TRL 6-7
Lignocellulosics, MSW, Liquid Industrial Waste streams & effluents5 or Intermediate
Energy Carriers6
Gasification + Catalytic Synthesis Synthetic4 TRL 6-8
Depends on fuel type; can be used for blends or drop-in with diesel, gasoline,
kerosene, bunker fuel or as pure biofuel e.g. BioSNG, DME, MD95
Algal Oils8 and other non-food oils
Hydrotreatment Hydrogenated TRL 4-5 Diesel drop-in or 100%, bio-kerosene Esterification FAME/Biodiesel TRL 5-6 Diesel blend, B7, B10, B30, 100%.
Pyrolysis Oils from lignocellulosics, MSW, waste
streams
Hydrotreatment Hydrotreated TRL 5-6 Diesel drop-in or 100% Co-processing in existing petroleum
refineries9 Petrol, Diesel, Kerosene TRL 5-6 All of the above
Non-lignocellulosic biomass (algae, non-food biomass)10 Various as above Petrol, Diesel. Methane,
Hydrogenated TRL 4-5 Various as above
Sugars 11(cellulosic, non-food) Microbial Petrol, Diesel, Kerosene TRL 4-6 Diesel drop-in or 100%, bio-kerosene
Supply of waste/byproducts gases Technology Type of Biofuel Status Application
Low
Car
bon
Foss
il Fu
els
Steel & Chemical Industry
Fermentation Ethanol TRL 6-7 Gasoline blend, E10, E85, E95
Upgrading & Catalytic Synthesis
Methanol TRL 5-6 Shipping, Blends with gasoline, M95, M100
Methane TRL 5-6 100% in heavy duty transport, Flex
Fuel Vehicles, captive fleets injected in the gas grid.
Waste Polymers, Plastics, non-biodegradable fraction of MSW Gasification + Catalytic Synthesis Synthetic4 TRL 6-8
Depends on fuel type; can be used for blends with diesel, gasoline, kerosene,
drop-in
Supply of H2 Technology Type of Biofuel Status Application
e-Fu
els
RES electricity Catalysis
Methanol
TRL 5-6
Shipping, blends with gasoline, M95, M100
Methane 100% in heavy duty transport, Flex
Fuel Vehicles, Captive Fleets, injected in the gas grid
Synthetic2 Depends on fuel type; can be used for blends with diesel, gasoline, kerosene,
drop-in
*Capped by ILUC £ ED95: 95% hydrous ethanol + additives for medium & heavy duty transport $ There is always also a smaller fraction of gasoline (nafta) from Hydrotreatment processes. 1Technology Readiness Level,
http://ec.europa.eu/research/participants/data/ref/h2020/wp/2014_2015/annexes/h2020-wp1415-
64
2017-09-01
annex-g-trl_en.pdf, as of medio 2016. Needs dedicated financial mechanisms: Note: Value chains at low TRL need financial support for longer duration while value chains at high TRL need financial support for relative shorter period, however, the financial support for high TRL technologies is by order of magnitude higher than that of low TRL per project. This is due to the high investment costs for the hardware or "steel in the ground".
2Municipal Solid Waste biodegradable fraction 3Waste fibres 4Synthetic biofuels are produced from the catalytic synthesis of CO+H2 and can be: Liquid: ethanol, methanol, Fischer Tropsch (diesel replacement), dimethyl ether (LPG replacement or
100% in vapour phase), Gas: biomethane, 5E.g. tall oil, black liquor 6Pyrolysis oils 7Waste streams from food industry, or pulp & paper (tall Oil) 8Oils extracted from algae 9In co-processing the bio component ends up in all output streams of the refinery 10Algae: they can be used as biomass in gasification processes or anaerobic digestion or extract algal oils
and therefore can produce all types of biofuels 11Produced from lignocellulosic biomass, MSW and other waste streams 12The ethanol, methanol or methane have to be bio- or RES-
6.1 Production Cost Summary
Data released to the SGAB groups in documentation as described in Chapter 2 has been investigated as presented in chapter 3 to 5. The material has been reviewed by the by SGAB members. The original data (from chapter 2) and the resulting set of data (chapter 3 to 5) have also been compared with relevant data recently released in a report by IRENA (International Renewable Energy Agency) named INNOVATION OUTLOOK, Advanced Liquid Biofuels72. The three set of data are summarized in Figure 17. The result is shown as follows:
- Original data from Chapter 2 in red, - Adjusted data from the authors and the SGAB group in green - Data from the referred UN International Renewable Energy Agency (IRENA) report in blue.
A summary of each type of fuel follows after a summary chapter covering the investment intensity of various production pathways.
72 International Renewable Energy Agency: “Innovation Outlook – Advanced Liquid Biofuels” 2016. ISBN: 978-92-95111-52-3 (PDF). http://www.irena.org/DocumentDownloads/Publications/IRENA_Innovation_Outlook_Advanced_Liquid_Biofuels_2016.pdf.
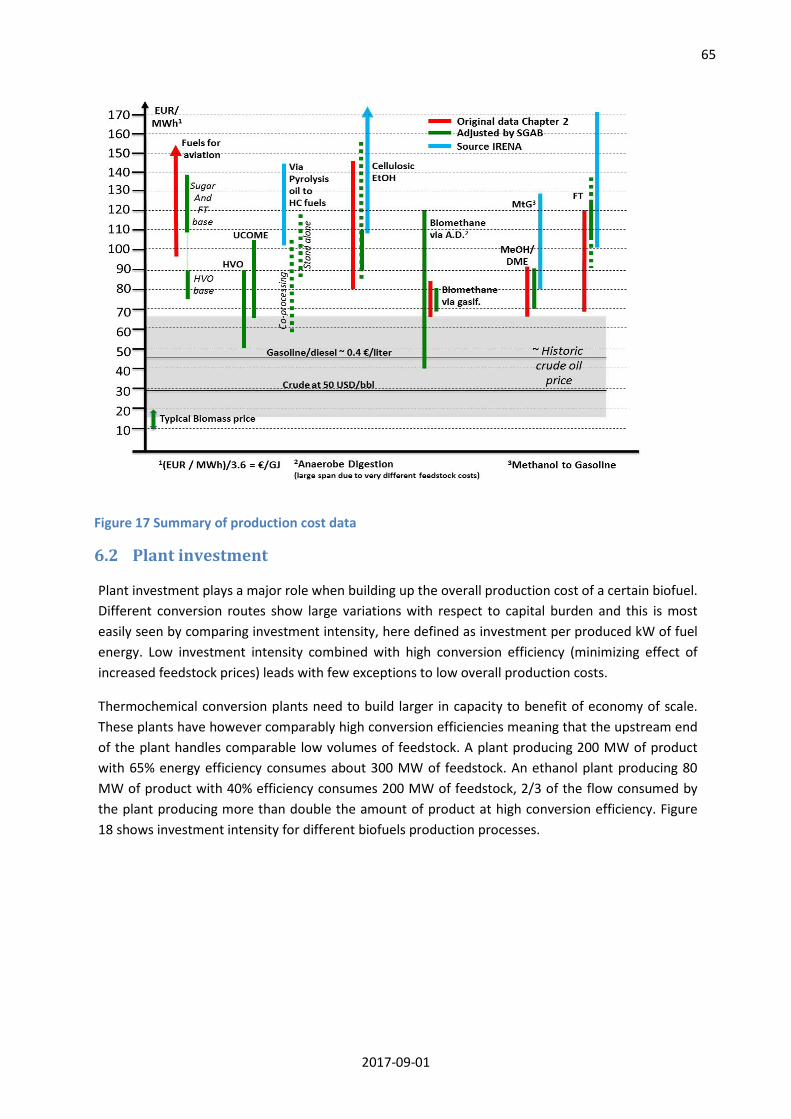
65
2017-09-01
Figure 17 Summary of production cost data
6.2 Plant investment
Plant investment plays a major role when building up the overall production cost of a certain biofuel. Different conversion routes show large variations with respect to capital burden and this is most easily seen by comparing investment intensity, here defined as investment per produced kW of fuel energy. Low investment intensity combined with high conversion efficiency (minimizing effect of increased feedstock prices) leads with few exceptions to low overall production costs.
Thermochemical conversion plants need to build larger in capacity to benefit of economy of scale. These plants have however comparably high conversion efficiencies meaning that the upstream end of the plant handles comparable low volumes of feedstock. A plant producing 200 MW of product with 65% energy efficiency consumes about 300 MW of feedstock. An ethanol plant producing 80 MW of product with 40% efficiency consumes 200 MW of feedstock, 2/3 of the flow consumed by the plant producing more than double the amount of product at high conversion efficiency. Figure 18 shows investment intensity for different biofuels production processes.
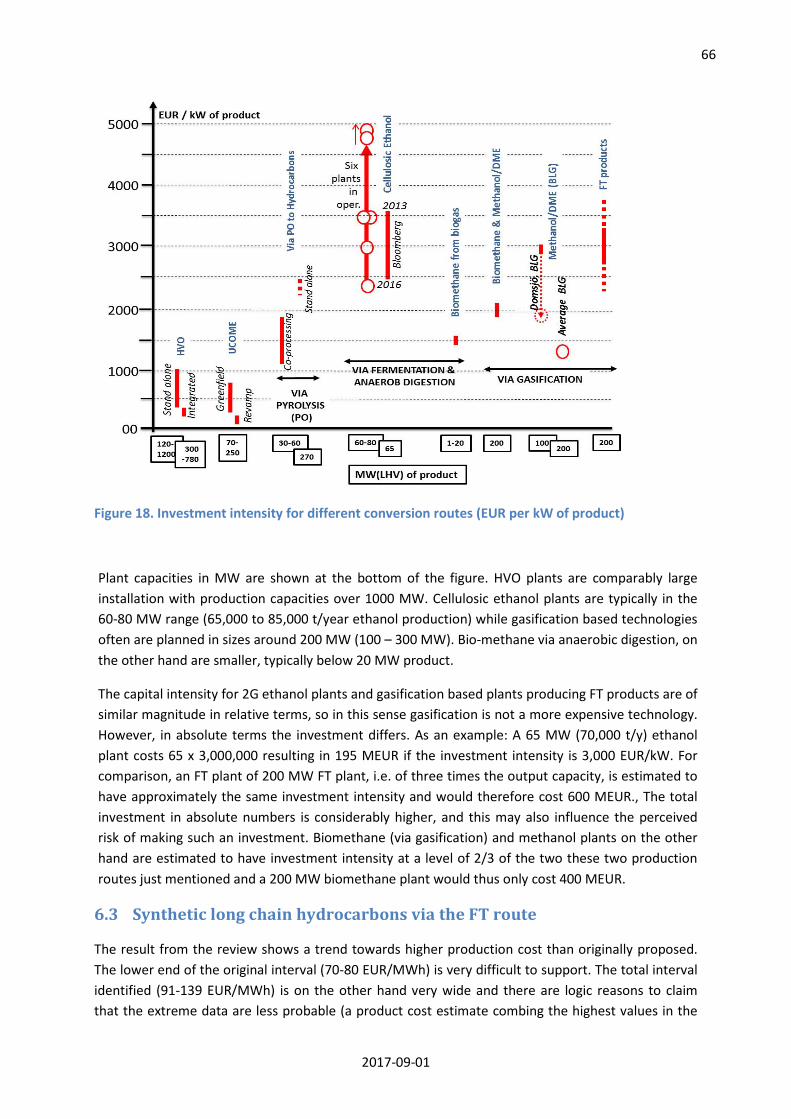
66
2017-09-01
Figure 18. Investment intensity for different conversion routes (EUR per kW of product)
Plant capacities in MW are shown at the bottom of the figure. HVO plants are comparably large installation with production capacities over 1000 MW. Cellulosic ethanol plants are typically in the 60-80 MW range (65,000 to 85,000 t/year ethanol production) while gasification based technologies often are planned in sizes around 200 MW (100 – 300 MW). Bio-methane via anaerobic digestion, on the other hand are smaller, typically below 20 MW product.
The capital intensity for 2G ethanol plants and gasification based plants producing FT products are of similar magnitude in relative terms, so in this sense gasification is not a more expensive technology. However, in absolute terms the investment differs. As an example: A 65 MW (70,000 t/y) ethanol plant costs 65 x 3,000,000 resulting in 195 MEUR if the investment intensity is 3,000 EUR/kW. For comparison, an FT plant of 200 MW FT plant, i.e. of three times the output capacity, is estimated to have approximately the same investment intensity and would therefore cost 600 MEUR., The total investment in absolute numbers is considerably higher, and this may also influence the perceived risk of making such an investment. Biomethane (via gasification) and methanol plants on the other hand are estimated to have investment intensity at a level of 2/3 of the two these two production routes just mentioned and a 200 MW biomethane plant would thus only cost 400 MEUR.
6.3 Synthetic long chain hydrocarbons via the FT route
The result from the review shows a trend towards higher production cost than originally proposed. The lower end of the original interval (70-80 EUR/MWh) is very difficult to support. The total interval identified (91-139 EUR/MWh) is on the other hand very wide and there are logic reasons to claim that the extreme data are less probable (a product cost estimate combing the highest values in the

67
2017-09-01
interval of investment, OPEX and fuel cost contribution). As examples see data in Table 3: In a high-level investment scenario it is likely that conversion efficiency to sellable products is high and therefore high investment numbers should be combined with lower feedstock costs. Other O&M costs are proportional to investment which will keep that part of the cost high, but a high investment could mean that the ASU is within battery limits, and lower OPEX than if oxygen is bought over the fence. In a corresponding way if investment is kept low the conversion efficiency is low (feedstock costs high) and other O&M is low following the investment. Average numbers for investment and feedstock costs are also a logic scenario. These three alternatives identify the interval 105-125 EUR/MWh of product and are shown as a solid bar in Figure 17. There can be specialty solutions where special products from the FT synthesis can generate a credit for the overall production cost level but such solutions can only affect the overall result marginally.
The single most important independent variable which would influence the overall production cost is feedstock price. This report has mostly used 20 EUR/MWh as delivered price at plant gate. A 10 or 15 EUR/MWh price would lower cost of feedstock in the final product cost from the interval 36-50 EUR/MWh to 18-25 EUR/MWh or 27-38 EUR/MWh respectively. As an average impact, it could lower the total production cost to 90-105 EUR/MWh.
The quoted IRENA report presents a higher and very wide production cost interval with its lower part being in line with the identified range above, 105-120 EUR/MWh.
FT liquids Production costs Feedstock price at 20 EUR/MWh. Production cost range: 105-125 EUR/MWh or 29-35 EUR/GJ Feedstock price at 10-15 EUR/MWh Production cost range: 90-105 EUR/MWh or 25-29 EUR/GJ
6.4 Oxygenates such as methanol and DME and biomethane
Result from this review shows good agreement with the original proposed production cost range. The identified production cost interval is between 71 and 91 EUR/MWh.
The single most important independent variable which would influence the overall production cost is feedstock price. This report has mostly used 20 EUR/MWh as delivered price at plant gate. A 10 or 15 EUR/MWh price would lower cost of feedstock in the final product cost from the interval 31-33 EUR/MWh to 16-17 EUR/MWh or 23-25 EUR/MWh respectively. As an average impact, it could lower the total production cost to 56-75 EUR/MWh.
Production cost of methanol through Black Liquor Gasification (BLG) in pulp mills can due to low investment intensity and high energy conversion efficiency be accomplished at 69 EUR/MWh and somewhat lower at lower feedstock prices as per previous paragraph.
The IRENA reference indicates higher production cost (80-130 EUR/MWh) but this is for production of synthetic gasoline via methanol (MtG) and DME routes. Elimination of the last stage (methanol/DME to gasoline) will lead to substantial decrease of the investment as well as increased
68
2017-09-01
yield and would thus lower the indicated interval to harmonize with production cost level of the single molecule cases (methane, methanol and DME) or even below.
Waste gasification to methanol or ethanol has a potential for low or even very low production costs depending on what net tipping fee the plant can credit to its cost of production. With a conversion efficiency of 50% waste to product and a net tipping fee of 12.5 EUR/MWh (55 EUR/ton and energy content of 4.4 MWh/ton) of feedstock the overall production cost is estimated to be 82 EUR/MWh. Lower energy content per ton (but with same 55 EUR/ton credit) will increase credit to the production cost and so would of course higher net tipping fee. Also, lower conversion efficiency (using more tons of credited feedstock per product MWh of product) would also decrease the total cost of production. These variables are company secrets and this report does not expect to get these numbers published. Smaller deviation in positive direction of one or more of the mentioned variables would easily move the total cost of production 10-20 EUR/MWh lower.
Biomethane, methanol and DME production costs (from biomass) Feedstock price at 20 EUR/MWh. Production cost range: 71-91 EUR/MWh or 20-25 EUR/GJ Feedstock price at 10-15 EUR/MWh Production cost range: 56-83 EUR/MWh or 16-21 EUR/GJ Methanol and Ethanol production costs (from waste) Base: Net tipping fee of55 EUR/ton, energy content of 4.4 MWh/ton, Conversion efficiency of 50% Production cost: 67-87 EUR/MWh or 19-24 EUR/GJ
6.5 Upgrading of pyrolysis oil
In the originally proposed graph, Figure 3, there was no data for pyrolysis upgrading.
The technology for generating pyrolysis oil is being demonstrated at present I Finland, the Netherlands and Canada at the scale of 20,000- 50,000 tons of bio-oil, i.e. below 50 MW.
Two routes have been pursued for the upgrading, either as a stand-alone plant, i.e. the upgrading is fully integrated with the pyrolysis plant, or off-site and then preferably in co-processing with fossil fuels in a fossil refinery. The potential for refinery upgrading is limited to the refineries with suitable technologies (FCC, hydrocracking etc.). The blend-in rate of into the fossil streams in such refineries is therefore in practice limited to a magnitude of 2-10%. The availability of FCC units also imposes a limit for the volume that can be expected from the co-processing route to 1-2 million tons in the North and West Europe, including the EU.
Both routes have significant technical challenges, and the stand-alone, integrated route has only been pursued at laboratory scale this far, i.e. below TRL 5. The co-processing route has been explored in pilot tests in a refinery in Brazil, and will be tested also by Valero in California. The figures given below then give very indicative production costs for co-processing and for the integrated stand-alone facility.
69
2017-09-01
The cost of producing biofuels for transport via pyrolysis and co-processing in a refinery has an efficiency of below 30%, but also has a low estimated cost 58-104 EUR/MWh. There is also a limitation to 1-2 million tons of drop-in based on the available FCC capacity in Europe.
For a large, fully integrated stand-alone plant with an output of 272 MW, the production cost was 83-118 EUR/MWh. No adjustments for investment cost differences between USA and the EU has been made, and one substantial cost item is natural gas for which no price correction have been done.
Pyrolysis bio-oil upgrading Co-processing Feedstock price at 10-20 EUR/MWh. Production cost range: 58-104 EUR/MWh or 14-27 EUR/GJ Stand-alone Feedstock price at 10-20 EUR/MWh Production cost range: 83-118 EUR/MWh or 23-33 EUR/GJ
6.6 Hydrotreated Vegetable Oils (HVO) The originally proposed graph, Figure 3, did not include any data for HVO production cost. HVO plants are commercially available at 0.05 to 1 million (metric) tons per year output. There are stand-alone plants built specifically for the purpose of HVO, revamps of existing refineries to produce HVO and revamps to allow co-processing of HVO with fossil streams in existing refineries. The nature of the plant and its capacity has a high impact on the investment cost. Nevertheless, the dominating cost, 65-80 %, is the contribution of the feedstock cost.
The estimated cost of production falls in the range 600- 1,100 EUR/ton, or approx. 50-90 EUR/MWh. Feedstocks such as UCO, yellow grease etc. have a cost of 400- 600 EUR/ton according to the sources reviewed but the cost of other potential feeds like tall oil is less readily available.
HVO liquids Production costs Feedstock price at 40 EUR/MWh. Production cost range: 50-70 EUR/MWh or 14-19 EUR/GJ Feedstock price at 60 EUR/MWh Production cost range: 70-90 EUR/MWh or 19-25 EUR/GJ
6.7 Waste lipid-based biodiesel, UCOME The originally proposed graph, Figure 3, did not include any data for UCO based fuels. UCO based plants are commercially available and typically built in sizes of 50-250,000 tons of production per year output. There are greenfield installations and revamp of existing FAME production facilities. The letter approach results in very low capital costs associated with production costs. In the same way as for HVO facilities the nature of the plant and its capacity has a high impact on the investment cost. Nevertheless, as for HVO technology the dominating cost element in the production is the cost of the feedstock which typically corresponds to 75-85%.
The estimated cost of production falls in the range of 65-105 EUR/MWh.

70
2017-09-01
UCOME liquids Production costs Greenfield plants Feedstock price at 56-77 EUR/MWh. Production cost range: 68-104 EUR/MWh or 19-29 EUR/GJ Retrofitted FAME plants Feedstock price at 56-77 EUR/MWh Production cost range: 67-93 EUR/MWh or 19-26 EUR/GJ
6.8 Ethanol from lignocellulosic sugar via fermentation The result from the review shows a positive learning curve where more recent sources indicates production cost at the lower end of the originally presented interval corresponding to 85-110 EUR/MWh of ethanol. The review shows clearly that overall investment via the cost of capital and the cost of feedstock influences the production cost most. The full interval identified (85-158 EUR/MWh) is very wide and the three mentioned components are the ones to focus in order to keep production cost down.
As examples see data in Table 11. With investment at the lower end of identified data and with a lower payback demand on investment, the cost of capital element in the production cost is reduced from 60 to 32 EUR/MWh. Due to comparably low conversion efficiency of the technology (40% used in these calculations, already in the higher end of the state-of-the-art) cost of feedstock has a major impact and reducing cost from 20 to 10 EUR/MWh lower the feedstock element in the production cost with 25 EUR/MWh.
The IRENA reference indicates a higher cost of production then has been identified from the work with this report.
Cellulosic ethanol production costs Feedstock price at 13 EUR/MWh and investment at low end of estimates Production cost: 103 EUR/MWh or 29 EUR/GJ Feedstock price at 10 EUR/MWh, investment low combined with decreased payback pace Production cost: 85 EUR/MWh or 24 EUR/GJ
6.9 Biomethane via anaerobic digestion
In the original graph, Figure 3, biomethane via fermentation was only added as a point at 85 EUR/MWh. In the present analysis of the production costs falls within 40-120 EUR/MWh but this is explainable. There is a large variety of substrates available for biogas plants, waste or energy crops and straw, alone or in combinations. The feedstock cost could therefore range from negative up to the cost of straw, e.g. up to 100 EUR/ton. The specific investment cost is of the order of corresponds to around 1,500-2,000 EUR/kW, i.e. between HVO and the 2G technologies. Anaerobic digestion technologies for upgrading to bio-methane are in general in the range of 1-20 MW output. There are considerable scale effects on the cost, and for these relatively small plants scale effects also influences the OPEX more than for larger plants.
71
2017-09-01
Bio-methane production cost Substrate cost at 0-80 EUR/ton. Production cost range: 40-120 EUR/MWh or 11-34 EUR/GJ For a feedstock associated with cost, also the methane potential affects the cost, such that no simplified estimate can be given.
6.10 Aviation fuels
With the exception of HEFA and the SIP process starting from sugars, and to some extent the better-known FT process, cost and performance data for other technology pathways to bio-jet are so uncertain and the global processing pathway not sufficiently developed to really assess their potential. It seems highly unlikely that the HTL and pyrolysis processes, including the upgrading of the intermediate products really has the economic benefits that results from studies pretend.
Cost of Aviation Fuels Production Via HEFA 80-90 EUR/MWh (potentially lower if HEFA+ annex is approved) For SIP (sugar fermentation) and SPK (via FT synthesis) 110-140 EUR/MWh