Embed Size (px)
Citation preview
STYRENE BIOREMEDIATION AND
POLYHYDROXYALKANOATE (PHA)
PRODUCTION:
ANALYTICAL METHODS DEVELOPMENT AND
MICROBIAL STUDY
TAN GIIN YU AMY
SCHOOL OF CIVIL AND ENVIRONMENTAL ENGINEERING
2015
STYRENE BIOREMEDIATION AND
POLYHYDROXYALKANOATE (PHA)
PRODUCTION:
ANALYTICAL METHODS DEVELOPMENT AND
MICROBIAL STUDY
TAN GIIN YU AMY
School of Civil and Environmental Engineering
A thesis submitted to the Nanyang Technological University
in fulfillment of the requirement for the degree of
Doctor of Philosophy
2015
i
Acknowledgments
I would like to express my gratitude to Associate Professor Wang Jing-Yuan who
played more than a supervisory role over the course of my PhD research. His firm belief
in my capabilities, and his wisdom, has empowered me with confidence and fresh
perspectives on how I could contribute to further environmental engineering research
with my biological sciences background. I would like to thank him for his unwavering
support and for providing me the opportunity to “evolve academically”.
I would also like to thank my mentor Dr Chen Chia-Lung who took time off his busy
schedule to teach me laboratory techniques and bounce ideas. He was also generous in
dispensing many distilled academic advice, which helped me mature in my academic
thinking.
My thanks also go to staff researchers Dr Ge Liya and Li Ling, student researchers Mo
Yu (2009 - 2010), Chong Wan Ying (2010 - 2011) and He Xiaoyun (2013 – 2014) for
their active involvement in this research project; staff researcher Wang Lin and fellow
PhD colleague Pan Chaozhi for their indirect contribution to this research project.
I would like to thank all the staff at Environment Laboratory for their kind assistance in
instrument operation. Special thanks go to my reporting laboratory technician Lim-Tay
Chew Wang for her assistance and advice in all my research-related administrative
matters.
My appreciation also goes to friends and colleagues at Residues and Resource
Reclamation Centre (NEWRI-R3C) for their thoughtful inspiration and bringing
laughter to my life over the course of my PhD research.
Last but not least, I would like to thank my family, my boyfriend and his family for
their unconditional love, patience, and moral support. Special thanks to my boyfriend
for being the best and harshest literary critic of this research work.
ii
Table of Contents Page
ACKNOWLEDGMENTS i
TABLE OF CONTENTS ii
EXECUTIVE SUMMARY viii
LIST OF TABLES x
LIST OF FIGURES xii
LIST OF SYMBOLS, UNITS AND ABBREVIATIONS xviii
PUBLICATIONS xxii
CHAPTER 1 INTRODUCTION 1
1.1 Background 2
1.1.1 Sources of styrene waste 2
1.1.2 Analytical methods for styrene monitoring 3
1.1.3 Treatment methods for styrene waste 4
1.1.4 Coupling styrene remediation to production of
valuable end-products
5
1.15 Polyhydroxyalkanoate (PHA) and its analytical
methods
5
1.16 Microbial MCL-PHA production from styrene 6
1.2 Problem Statements 7
1.3 Research Objectives 12
1.4 Scope of Work 12
1.5 Organization of Thesis 14
CHAPTER 2 LITERATURE REVIEW 16
2.1 Styrene Waste 17
2.1.1 Analytical methods for monitoring gaseous and
aqueous styrene samples
17
2.1.2 Non-biological styrene treatment methods 20
2.1.3 Biological styrene treatment methods 22
2.1.4 Microbes involved in styrene degradation 27
2.1.5 Styrene degradation pathways 33
iii
2.1.6 Up-recycling of styrene to value-added products 34
2.2 Polyhydroxyalkanoate (PHA) 38
2.2.1 Current analytical methods for PHA detection and
quantification
38
2.2.2 Properties and applications of PHA 42
2.2.3 PHA-producing bacteria and carbon sources for
PHA production
43
2.2.4 PHA bioaccumulation pathways 45
2.3 Bioconversion of Styrene to MCL-PHA 50
2.3.1 Microbes involved in bioconversion of styrene to
MCL-PHA
50
2.3.2 Metabolic pathway for bioconversion of styrene to
MCL-PHA
53
CHAPTER 3 STUDY 1: DEVELOPMENT OF A HPLC-DAD
METHOD FOR STYRENE AND BTEX DETECTION
55
3.1 Introduction 56
3.2 Materials and Methods 57
3.2.1 Chemicals and materials 57
3.2.2 Analytical standards preparation 57
3.2.3 HPLC operating conditions 58
3.2.4 Analytical parameters 58
3.3 Results 60
3.3.1 HPLC-DAD method development for aqueous
styrene analysis
60
3.3.2 Method optimization for concurrent analysis of
aqueous BTEXS
61
3.3.3 Determination of method analytical parameters 67
3.4 Discussion 68
3.5 Summary 76
iv
CHAPTER 4 STUDY 2: DEVELOPMENT OF A GC-MS METHOD
FOR PHA DETECTION
77
4.1 Introduction 78
4.2 Materials and Methods 79
4.2.1 PHA monomers, PHA polymers and chemicals 79
4.2.2 PHA analytical standard preparation 80
4.2.3 GC-MS analysis 80
4.2.4 Data collection and analysis 81
4.2.5 Method recovery 81
4.3 Results 82
4.3.1 GC-MS detection of PHA monomers 82
4.3.2 Relationship between PHA carbon number and
retention time (RT) or response factor (RF)
83
4.3.3 Method evaluation and recovery 86
4.4 Discussion 89
4.5 Summary 92
CHAPTER 5 STUDY 3: INVESTIGATION OF THE BACTERIAL
COMMUNITY STRUCTURE OF STYRENE-
ENRICHED ACTIVATED SLUDGE
93
5.1 Introduction 94
5.2 Materials and Methods 95
5.2.1 Operation of styrene-degrading bioreactor and
sample collection
95
5.2.2 Styrene biodegradation batch experiment 96
5.2.3 Styrene chromatographic determination methods 97
5.2.4 Total genomic DNA extraction 97
5.2.5 16S rDNA next-generation sequencing, data
processing and analysis
98
5.3 Results 99
5.3.1 Styrene biodegradation test 99
v
5.3.2 Alpha and beta diversity analyses of bacterial
community
101
5.3.3 Bacterial community structure analysis at phyla
level
104
5.3.4 Bacterial community structure analysis at class and
order level
107
5.4 Discussion 110
5.5 Summary 123
CHAPTER 6 STUDY 4: ISOLATION AND CHARACTERIZATION
OF STYRENE-DEGRADING AND MCL-PHA-
ACCUMULATING BACTERIA FROM ENRICHED
ACTIVATED SLUDGE
126
6.1 Introduction 127
6.2 Materials and Methods 127
6.2.1 Isolation of styrene-degrading bacteria 127
6.2.2 Total genomic DNA extraction, 16S rDNA and
phaC genetic characterization of bacterial isolates
129
6.2.3 Screening for MCL-PHA accumulation in styrene-
degrading bacterial isolates
130
6.2.4 Biochemical assay, temperature and pH shake-flask
studies
131
6.2.5 PCR amplification of phaZ gene and phylogenetic
tree construction
132
6.2.6 Transmission electron microscopy (TEM) 132
6.2.7 Bacterial cultivation for MCL-PHA polymer
extraction
133
6.2.8 MCL-PHA polymer analysis 134
6.3 Results 135
6.3.1 Bacterial isolation, genotypic and phenotypic
characterization
135
vi
6.3.2 Bioconversion of styrene to MCL-PHA by bacterial
isolates
143
6.3.3 Biochemical and genetic characterization of bacteria
isolate NBUS12
143
6.3.4 Characterization of MCL-PHA polymer produced
from styrene by P. putida NBUS12
148
6.4 Discussion 155
6.5 Summary 164
CHAPTER 7 CONCLUSIONS AND RECOMMENDATIONS 165
7.1 Conclusions 166
7.1.1 HPLC-DAD method for analysis of BTEXS at high
aqueous concentrations
166
7.1.2 GC-MS method development for analysis of PHA
biopolymer
167
7.1.3 Microbial profile analysis of styrene-degrading
bacterial consortium under prolonged enrichment
168
7.1.4 MCL-PHA-producing and/or styrene-degrading
bacterial isolates
170
7.2 Recommendations 171
7.2.1 Developing analytical methods for more PHA
monomer types
171
7.2.2 Widen styrene-degrading microbial community
analysis to non-bacterial microorganisms and
linking microbial profile to performance
172
7.2.3 Clarification of PHA-producing sub-population and
PHA production capability of styrene-degrading
microbial community
173
7.2.4 Increasing bacterial isolate diversity for the
formulation of styrene-degrading cum MCL-PHA-
producing defined microbial cocktails
174
vii
7.2.5 Investigation on P. putida NBUS12‟s metabolic
pathway and MCL-PHA polymer property
175
REFERENCES 177
APPENDIX FIGURES 207
viii
Executive Summary
Styrene waste is a principal effluent produced from polystyrene (PS) plastic production
and processing industries. The growing demand for PS plastics has imposed significant
environmental burden in the form of styrene pollution. The proper monitoring and
management of industrial waste styrene is pivotal to public health, ecological and
environmental protection. Aerobic biological treatment presents a rapid and green
approach to remediate styrene waste but generates high volumes of biomass by-product,
resulting in high management and disposal cost. Optimizing the aerobic process for
bioconversion of styrene to commercially-valuable medium-chain-length
polyhydroxyalkanoate (MCL-PHA) material could potentially alleviate pollution and
off-set biomass disposal cost. At the same time, the use of cheap or “free” carbon
substrates, such as styrene waste, may lower PHA production cost, bringing it closer to
commercialization. Separately, improving analytical methods for styrene waste and
PHA analysis is immensely important and beneficial in facilitating the work of both
field engineers and researchers. To this end, the objectives of this work were to (1)
develop analytical methods to facilitate routine styrene wastewater and PHA analysis, (2)
gain an understanding of aqueous styrene-degrading bacterial community, and (3)
increase the pool of styrene-degrading cum MCL-PHA-producing bacteria.
A new high performance liquid chromatography (HPLC-DAD) method was
successfully developed and optimized for the detection of styrene and common co-
occuring benzene, toluene, ethylbenzene, xylenes (BTEXS) at high equimolar aqueous
concentration of 2.0 mM. Chromatographic separation was achieved within 5.5 min,
making it one of the fastest methods to date. A gas chromatography mass spectrometry
(GC-MS) method was developed for PHA analysis based on the new finding that there
is a highly linear relationship between the carbon number of homologous saturated PHA
monomers and their respective retention times and response factors (adjusted R2 > 0.98).
High method recovery values (close to 100%) were demonstrated for PHA
homo/copolymers. To study the styrene-degrading consortium, next-generation
sequencing was performed. The dominant orders Pseudomonadales and Rhizobiales are
well-known for styrene degradation and potentially harbor styrene catabolic genes,
ix
respectively, suggesting that they probably form the core styrene-degrading population.
Equally prominent were the orders Sphingobacteriales, Clostridiales, and
Actinomycetales, which have versatile aromatic catabolic capability and may be
responsible for mineralization of styrene metabolites, forming the secondary styrene-
degrading population. Bacterial isolation yielded mostly Pseudomonas species, which
formed MCL-PHA at low levels (< 1% cell dry mass [CDM]), suggesting the
consortium‟s low MCL-PHA production capacity. Instead, a novel P. putida NBUS12
was successfully isolated from BTEXS-enriched activated sludge. The bacterium
accumulated up to 32.49% CDM of MCL-PHA, making it one of the highest styrene-
degrading and MCL-PHA-producing strains presently known.
The newly-developed analytical methods offer benefits over existing methods in terms
of protocol simplification and lower analysis price for BTEXS and PHA detection.
Additionally, the theoretical concept, behind the GC-MS method, may aid in the future
development of methods for better quantitation of more PHA types. New findings, from
microbial study, provided valuable information and new bacterial isolates, which could
aid in future selection of seeding sludge, bioaugmentation strategies and formulation of
defined microbial cocktails. This could reduce reactor start-up time, optimize styrene
biodegradation and expand the process for simultaneous MCL-PHA production. More
research is needed to investigate the functional roles of consortium members, and
determine the PHA-producing sub-population and PHA production capability of
aqueous styrene-degrading microbial community. Further research is needed to
elucidate the metabolic pathway and enhance the MCL-PHA polymer property of P.
putida NBUS12.
x
List of Tables
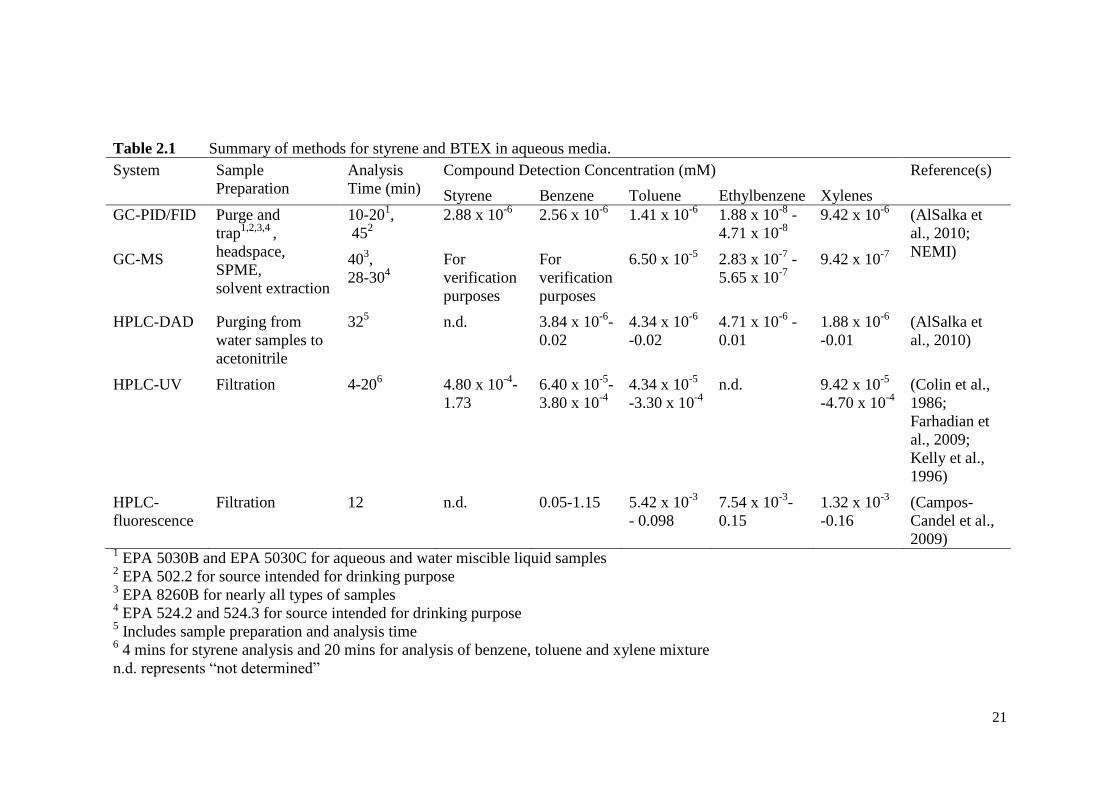
Table 2.1 Summary of methods for styrene and BTEX in aqueous media. 21
Table 2.2 Distribution of styrene-degrading capabilities among different
classes of prokaryotic microorganisms.
29
Table 2.3 Summary of styrene-degrading bacterial community. 30
Table 2.4 Polyhydroxyalkanoate (PHA)-accumulating genera of prokaryotic
micro-organisms.
44
Table 2.5 Summary of MCL-PHA-producing microbial strains available in
culture collections and carbon sources.
46
Table 3.1 Analytical parameters of the developed method for BTEXS
determination.
70
Table 3.2 Method recovery in different types of aqueous matrices (n = 3). 71
Table 3.3 Optimized protocol for HPLC-DAD analysis of styrene and
BTEXS
75
Table 4.1 Analytical parameters of the developed method for PHA
determination.
85
Table 5.1 Summary of raw, processed sequences and results from alpha
diversity analysis.
102
Table 5.2 Bacterial sequences assigned to classes and orders under phyla
that increased with styrene enrichment.
108
Table 5.3 Bacterial sequences assigned to classes and orders under phyla
that decreased with styrene enrichment.
111
Table 6.1 Phenotypic and genotypic characterization of phaC+ bacterial
isolates.
138
Table 6.2 Growth and MCL-PHA accumulation by bacterial isolates using
styrene as sole carbon source.
142
Table 6.3 Antibiotic sensitivity and carbon assimilation on Biolog GEN III
MicroPlateTM
by P. putida NBUS12.
145
Table 6.4 NMR chemical shift assignments of PHA monomers in MCL-
PHA produced from styrene by P. putida NBUS12.
153
xi
Table 6.5 A comparison of MCL-PHA polymer, produced from styrene by
P. putida NBUS12, with existing reports.
154
xii
List of Figures
Figure 1.1 Chemical structure of styrene. 3
Figure 1.2 Summary of scope of work for this thesis. 15
Figure 2.1 Typical flowsheet of the activated sludge process. 26
Figure 2.2 Microbial pathways of aerobic styrene degradation. Enzymes
are indicated as abbreviations.
35
Figure 2.3 Hypothetical microbial pathways of anaerobic styrene
degradation. The pathways are based on identified metabolites
from pure or mixed cultures. No data about involved enzymes
are available so far.
36
Figure 2.4 Chemical structure and nomenclature of PHA. 39
Figure 2.5 Microbial routes of PHA synthesis. The enzyme PHA
synthase, which is responsible for the polymerization of PHA
precurors to form SCL-PHA or MCL-PHA, is encoded by the
gene phaC.
51
Figure 3.1 Flow diagram of the HPLC-DAD parameters optimization
procedure.
59
Figure 3.2 Elution profile of a 2.0 mM styrene analytical standard under
mobile phases with various methanol contents. Analysis was
performed using 10 µL sample injection volume at a flow rate
of 1.2 mL.min -1.
61
Figure 3.3 DAD profile of a 2.0 mM styrene analytical standard. 62
Figure 3.4 Styrene calibration curve. (A) The complete curve constructed
based on styrene analytical standards of concentrations 0.0002
mM, 0.002 mM, 0.02 mM, 0.2 mM and 2.0 mM. (B) A
magnified portion of the calibration curve, demarcated with a
box in (A), with styrene analytical standards of concentrations
0.0002 mM, 0.002 mM and 0.02 mM.
64
xiii
Figure 3.5 Chromatogram of a standard 2.0 mM equimolar mixture of
BTEXS. Separation was conducted with 60% methanol mobile
phase and 10 µL sample injection volume at a flow rate of (A)
1.2 mL.min -1 and (B) 2.0 mL.min -1.
65
Figure 3.6 Effect of methanol content on the (A) elution time and (B)
resolution for a standard 2.0 mM equimolar mixture of
BTEXS. Sample injection volume and flow rate were 10 µL
and 1.2 mL.min-1
, respectively. Results are the average of
three independent experiments with standard deviations within
±0.006 and ±0.10 for elution time and resolution, respectively.
66
Figure 3.7 Effect of injection volume on the resolution of a standard 2.0
mM equimolar mixture of BTEXS. Separation was conducted
with 60% methanol mobile phase at a flow rate of 1.2 mL.min-
1. Results are the average of three independent experiments
with standard deviations within ±0.12.
67
Figure 3.8 Effect of flow rate on the (A) elution time and (B) resolution
of a standard 2.0 mM equimolar mixture of BTEXS.
Separation was conducted with 60% methanol mobile phase
and a sample injection volume of 10 μL. Results are the
average of three independent experiments with standard
deviations within ±0.006 and ±0.09 for elution time and
resolution respectively.
69
Figure 4.1 Methanolysis reaction for PHA monomer 3-hydroxyalkanoic
acid and PHA polymer poly(3-hydroxyalkanoate). The
nomenclature and carbon number for the homologous series
of saturated PHA monomers and polymers is determined by
the functional alkyl R group.
83
Figure 4.2 GC-MS total ion chromatograms of 3-hydroxyalkanoic acid
methyl esters derived from PHA monomer analytical
standards and methyl benzoate internal standard.
84
xiv
Figure 4.3 Mass fragmentation spectrum of PHA. Inset shows the
fragment ions generated, with their respective chemical
formula provided within the parentheses, under positive-ion
mode EI-MS analysis.
86
Figure 4.4 Graphs depicting the linear relationship between PHA
carbon number and (A) average retention time (RT), and (B)
average response factor (RF). The mean values represent
values from at least three independent experiments (n ≥ 3)
and the error bars represent standard deviations.
87
Figure 4.5 GC-MS total ion chromatograms of 3-hydroxyalkanoic acid
methyl esters derived from PHA polymers PHB, PHBHV
and MCL-PHA.
88
Figure 5.1 Amount of styrene in the gas and liquid phases, and total
styrene removal (bar chart) as a function of time for setup
inoculated with (A) styrene-enriched activated sludge, (B)
double-autoclaved styrene-enriched activated sludge, and (C)
setup without any sludge addition. Results are the average of
three independent experiments, and error bar represents
standard deviation.
100
Figure 5.2 Rarefaction curves at 3% cutoff for styrene enrichment time
points at 0, 3, 11, 17 and 19.5 months. Error bar represents
95% confidence interval.
103
Figure 5.3 Dendrogram based on Bray-Curtis dissimilarity for styrene
enrichment time points at 0, 3, 11, 17 and 19.5 months. The
numbers beside the nodes indicated bootstrap values based
on 1,000 iterations. The scale bar represents the difference in
Bray-Curtis indices between samples.
104
xv
Figure 5.4 Percentage of total bacterial sequences at various styrene
enrichment time points (i.e., 0, 3, 11, 17 and 19.5 months)
that are assigned to major bacterial phyla. The Unclassified
phylum consisted of bacterial sequences that could not be
classified into any known phyla.
105
Figure 5.5 Percentage of total bacterial sequences at various styrene
enrichment time points (i.e., 0, 3, 11, 17 and 19.5 months)
that are assigned to minor bacterial phyla.
106
Figure 6.1 Flow diagram of the styrene-degrading bacterial isolation
procedure.
129
Figure 6.2 PCR detection of phaC gene in bacteria isolated on (A)
sodium benzoate and (B) styrene. A 100 bp DNA molecular
mass marker was included. The presence of a phaC gene is
indicated by a PCR band of size around 500 bp. PHA
accumulator P. oleovorans served as a positive control while
non-PHA accumulator E. coli served as a negative control.
Empty is an empty control with no DNA template added.
136
Figure 6.3 Neighbor-joining phylogenetic tree based on partial 16S
rDNA sequences of bacterial isolates (designated in bold)
and closely-related bacteria for the phyla (A) Proteobacteria
and (B) Actinobacteria. Cellvibrio japonicas Ueda107
(NR074804) was included as the outgroup. The scale bar
represents the estimated number of nucleotide changes per
sequence position.
141
Figure 6.4 TEM micrograph of a P. putida NBUS12 bacterium with
intracellular MCL-PHA granules. Arrow indicates MCL-
PHA granule.
144
Figure 6.5 The growth of P. putida NBUS12 under different
temperatures.
146
Figure 6.6 The growth of P. putida NBUS12 under different pH values. 147
xvi
Figure 6.7 Neighbor-joining phylogenetic phylogenetic tree based on
(A) partial phaZ gene sequence and (B) PhaZ protein
sequence of P. putida NBUS12 (designated in bold),
Pseudomonas sp. VLB120 and known PHA-producing
Pseudomonad strains described by Solaiman and Ashby
(2005) with Burkholderia caryophylli as the outgroup.
Genbank accession numbers are provided within
parentheses. The numbers beside the nodes indicated
bootstrap values based on 1,000 replications. The scale bar
represents the estimated number of nucleotide changes per
sequence position.
150
Figure 6.8 MCL-PHA polymer extracted from P. putida NBUS12. 151
Figure 6.9 GC-MS chromatogram of MCL-PHA monomers detected in
the polymer extracted from P. putida NBUS12. The insert
shows a magnified version of the chromatogram.
151
Figure 6.10 (A) 1H-NMR and (B)
13C-NMR spectra of MCL-PHA
polymer from P. putida NBUS12 using styrene as the sole
carbon substrate. The signals corresponding to hydrogen
atoms in 1H-NMR spectrum are denoted by alphabet letters
while the signals corresponding to carbon atoms in 13
C-NMR
spectrum are denoted by numericals.
152
Figure A1 (A) 1H-NMR and (B)
13C-NMR spectra of MCL-PHA
polymer. The signals corresponding to hydrogen atoms in
1H-NMR spectrum are denoted by alphabet letters while the
signals corresponding to carbon atoms in 13
C-NMR spectrum
are denoted by numericals.
207
Figure A2 DSC thermogram of MCL-PHA polymer from P. putida
NBUS12. The mid-point of heat capacity change (-46.05 °C)
was determined as Tg while the maximum endothermic point
(50.67 °C) was taken as Tm.
208
xvii
Figure A3 XRD diagram of MCL-PHA polymer from P. putida
NBUS12. Crystalline peaks were detected at 2 theta values
of 19.05 ° and 21.68 °.
209
Figure A4 TGA thermogram of MCL-PHA polymer from P. putida
NBUS12. Decomposition temperature (DT) was determined
as the onset temperature of the derivative thermogravimetry
curve (277 °C).
210
xviii
List of Symbols, Units and Abbreviations
Symbols and units δ Chemical shifts
θ Theta
% Percentage
°C Degree Celsius
1/D Inverse Simpson
μg Microgram
µL Microliter
µm Micrometer
µM Micromolar
bp Base pair
cm Centimeter
COD Chemical oxygen demand
d Day
Da Dalton
eV Electron volts
g Centrifugal force
g Gram
H’ Shannon diversity index
h Hour
Kb Kilo base pair
Kg Kilogram
kV Kilovolt
L Liter
M Molar
m3
Cubic meter
mg Milligram
min Minute
mL Milliliter
mm Millimeter
mM Millimolar
mol Mole
m/z Mass-to-charge ratio
Mw Weight average molar mass
Mn Number average molar mass
nm Nanometer
OD600 Optical density at 600 nm
pg Picogram
ppm Parts per million
rpm Revolution per min
s Second
V Volt
v/v Volume/volume
w/w Weight/weight
w/v Weight/volume
xix
General abbreviations
ACE Abundance-based Coverage Estimator
BHT 2,6-di-tert-butyl-4-methylphenol
BLAST Basic Local Alignment Search Tool
BTEX Benzene, toluene, ethylbenzene, xylene
BTEXS Benzene, toluene, ethylbenzene, xylene, styrene
CCA Canoical correspondence analysis
CDM Cell dry mass
CI Confidence interval
DAD Diode array detector
DNA Deoxyribonucleic acid
DSC Differential scanning calorimetry
DT Decomposition temperature
E Inverse Simpson index
EDTA Ethylenediaminetetraacetic acid
EH Epoxide hydrolase
EI Electron impact
FTIR Fourier transform infrared spectroscopy
GAC Granular activated carbon
GC Gas chromatrography
GPC Gel permeation chromatography
FID Flamed ionization detector
HPLC High performance liquid chromatography
HRT Hydraulic retention time
J’ Shannon diversity index
LC Liquid chromatography
LCL Long-chain length
LOD Limits of Detection
logPOW Octanol–water partition coefficient
LOQ Limits of Quantification
MBR Membrane bioreactor
MCL Medium-chain length
MS Mass spectrometer
MSM Mineral salt medium
NCBI National Center for Biotechnology Information
NIST National Institute of Standards and Technology
NMR Nuclear magnetic resonance
OLR Organic loading rate
OTU Operational taxonomic unit
PAD Phenylacetaldehyde dehydrogenase
PBS Phosphate buffer saline
PCBs Polychlorinated biphenyls
PCR Polymerase chain reaction
PDI Polydispersity index
PE Polyethylene
PHA Polyhydroxyalkanoate
PhaG 3-hydroxyacyl-acyl carrier protein-CoA transacylase
PID Photoionization detector
xx
PS Polystyrene
PLFA Phospholipid fatty acid
RC Regenerated cellulose
RF Response factor
RI Refractive index
RDX Hexahydro-1,3,5-trinitro-1,3,5-triazine
RSD Relative standard deviation
rDNA Ribosomal deoxyribonucleic acid
RSGP Reverse sample genome probing
RT Retention time
SCL Short-chain length
SDD Styrene 2,3-dihydrodiol dehydrogenase
SDO Styrene 2,3-dioxygenase
SDS Sodium dodecyl sulfate
SIP Stable-isotope probing
SMO Styrene monooxygenase
SOI Styrene oxide isomerase
SPME Solid phase micro extraction
TAE Tris-acetate-EDTA
TEM Transmission electron microscopy
TGA Thermogravimetric analysis
THF Tetrahydrofuran
TMS Tetramethylsilane
Tg Glass to rubber transition temperature
Tm Crystalline phase melting temperature
TSS Total suspended solids
UASB Upflow Anaerobic Sludge Blanket reactor
US EPA United States Environment Protection Agency
UV Ultraviolet
UPGMA Unweighted pair group method with arithmetic mean
VFAs Volatile fatty acids
VSS Volatile suspended solids
WHO World Health Organization
XRD X-ray diffraction
xxi
PHA polymer abbreviations
P3HB poly(3-hydroxybutyrate), poly(3-hydroxybutyric acid)
P3HV poly(3-hydroxyvalerate)
P3HB3HV poly(3-hydroxbutyrate-co-3-hydroxyvalerate),
poly(3-hydroxybutyric acid-co-3-hydroxyvaleric acid)
P3HB4HB poly(3-hydroxbutyrate-co-4-hydroxybutyrate)
P3HBHHx poly(3-hydroxbutyrate-co-3-hydroxyhexanoate)
PHA monomers abbreviations
(R)-3-HA-CoA (R)-3-hydroxyacyl-CoA
3HB, C4 3-hydroxybutyrate, 3-hydroxybutyrtic acid
3HV, C5 3-hydroxyvalerate, , 3-hydroxyvaleric acid
C6 3-hydroxyhexanoate, 3-hydroxyhexanoic acid
C8 3-hydroxyoctanoate, 3-hydroxyoctanoic acid
C10 3-hydroxydecanoate, 3-hydroxydecanoic acid
C12 3-hydroxydodecanoate, 3-hydroxydodecanoic acid
C12:1 3-hydroxydodecenoate
C14 3-hydroxytetradecanoate
C16 3-hydroxyhexadecanoate, 3-hydroxyhexadecanoic acid
xxii
Publications
Journal papers
Tan, G.-Y.A., Chen, C.-L., Ge, L., Li, L., Tan, S.N., & Wang, J.-Y. (2015).
Bioconversion of styrene to poly(hydroxyalkanoate) (PHA) by a new bacterial
strain Pseudomonas putida NBUS12. Microbes and Environments, 30(1), 76-85.
Tan, G.-Y.A., Chen, C.-L.,Li, L., Ge, L., Wang, L., Razaard, I.M.N., Li, Y., Zhao,
L., Mo, Y., & Wang, J.-Y. (2014). Start a research on biopolymer
polyhydroxyalkanoate (PHA): a review. Polymers, 6(3), 706-754.
Tan, G.-Y.A., Chen, C.-L., Ge, L., Li, L., Wang, L., Zhao, L., Mo, Y., Tan, S.N., &
Wang, J.-Y. (2014). Enhanced gas chromatography-mass spectrometry method for
bacterial polyhydroxyalkanoates analysis. Journal of Bioscience and
Bioengineering, 117(3), 379-382.
Tan, G.-Y.A., Chen, C.-L., Zhao, L., Mo, Y., Chang, V.W.C., & Wang, J.-Y.
(2012). An HPLC-DAD method for rapid and high resolution analysis of
concentrated BTEX and styrene aqueous samples. Analytical Methods, 4(11), 3545-
3550.
Related journal paper
Ge, L., Tan, G.-Y.A., Wang, L., Chen, C.-L., Li, L., Tan, S.N., & Wang, J.-Y.
(2015). Determination of monomeric composition in polyhydroxyalkanoates by
liquid chromatography coupled with online mass spectrometry and offline nuclear
magnetic resonance. Talanta (under revision).
Conference papers and presentations
Tan, G.-Y.A., Chen, C.-L., Wang, J.-Y. (2015). Analyzing bacterial diversity,
community structure and polyhydroxyalkanoate (PHA) production potential in
styrene-enriched activated sludge. Second International Conference on Sustainable
Urbanization (ICSU 2015), 7-9 Jan, Hong Kong, China.
xxiii
Tan, G.-Y.A., Chen, C.-L., Li, L., Wang, L., Mo, Y., Zhao, L., & Wang, J.-Y.
(2013). Hunting for bacteria capable of bioconverting polystyrene waste to
polyhydroxyalkanote (PHA). International Conference on Solid Waste Management
2013 (ICSWHK 2013). 5-8 May, Hong Kong, China.
Chen, C.-L., Tan, G.-Y.A., Wang, L., & Wang, J.-Y. (2012). Polyhydroxyalkanote
(PHA) production from waste. Jade Mountain Forum on Sustainable Environment.
19-22 Apr, Tainan, Taiwan.
Chen, C.-L., Tan, G.-Y.A., & Wang, J.-Y. (2011). Polyhydroxyalkanote (PHA)
production from organic solid waste. Cross Taiwan Strait Conference on Urban
Solida Waste Sustainability and Management. 21-24 Oct, Xiamen, China.

1
CHAPTER 1
Introduction
2
Background
Polystyrene (PS) is a petrochemical plastic synthesized from styrene. Since its
advent, PS has become an indispensible part of modern life. Owing to its good
processing properties, PS is used as a starting material for a wide variety of
products ranging from to disposable laboratory consumables, containers, to the
ubiquitous arsenal of Styrofoam packaging products. Consequential of its vast
application, there is a strong and increasing global demand for PS. Between the
period 2010 and 2020, global demand for PS is predicted to grow at a compound
annual growth rate of 4.7%, reaching 23.5 million metric tons in 2020 (Plastemart,
2013). The burgeoning demand for PS plastics, however, has imposed significant
environmental burden and one of which is styrene pollution.
1.1.1 Sources of styrene waste
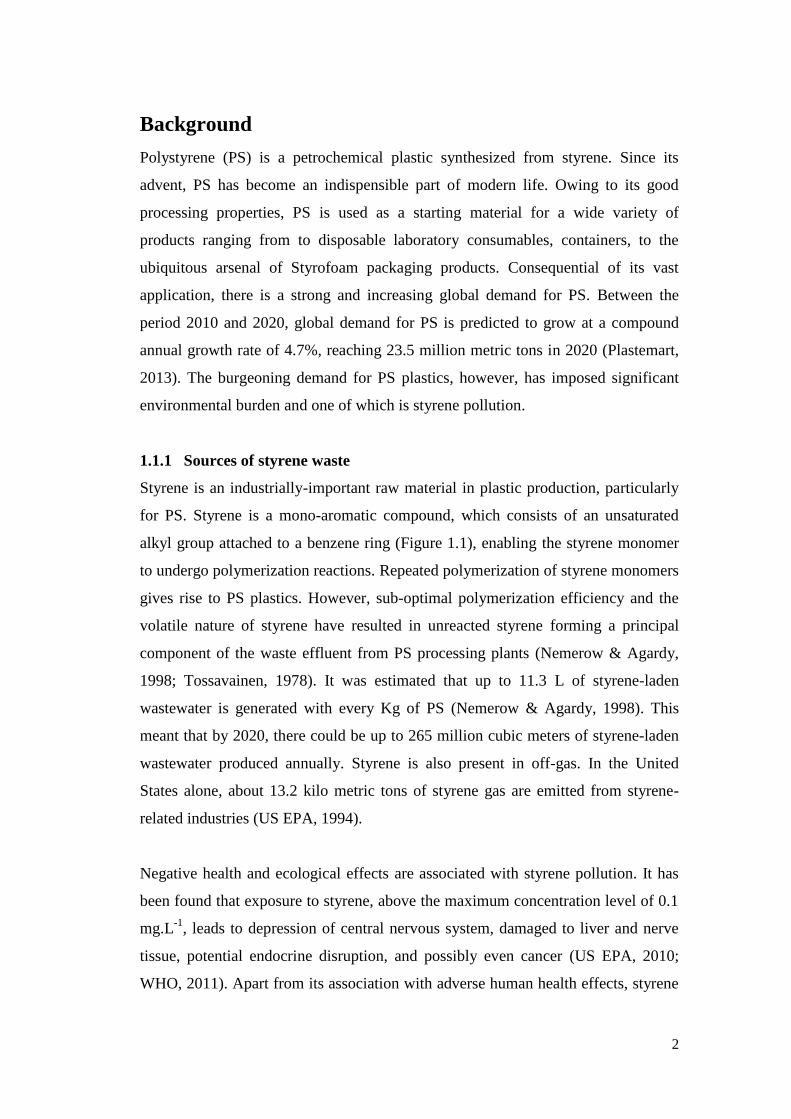
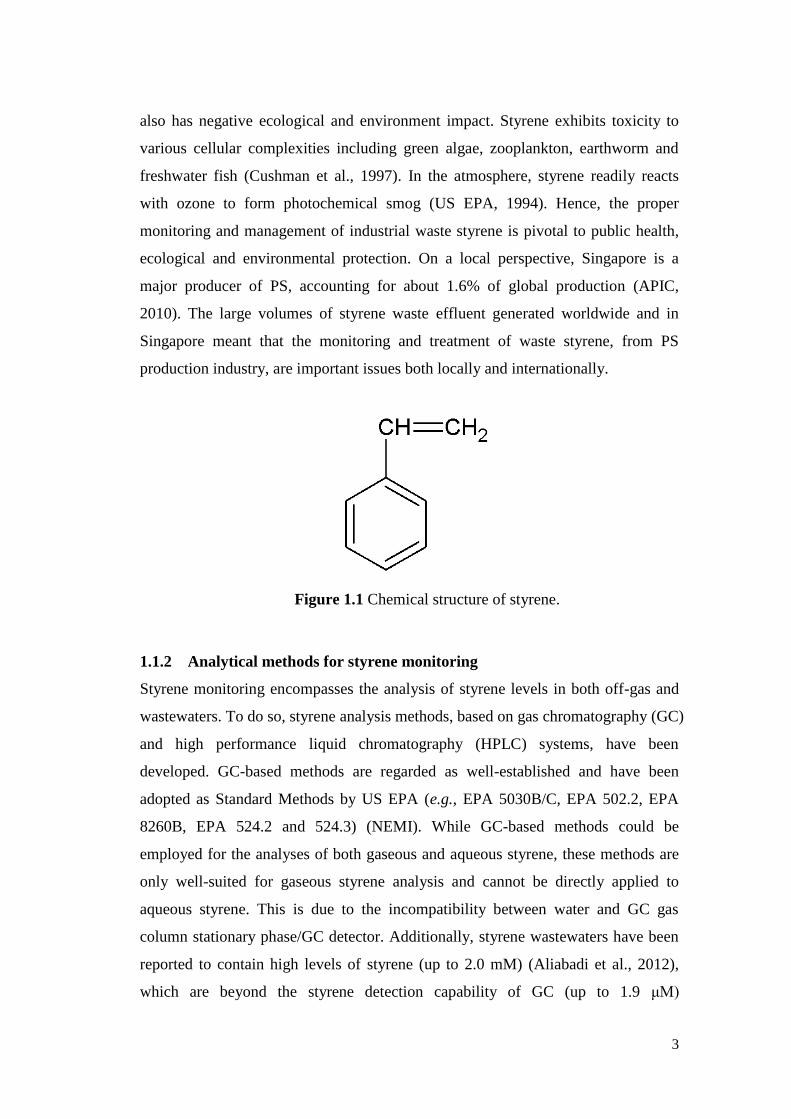
Styrene is an industrially-important raw material in plastic production, particularly
for PS. Styrene is a mono-aromatic compound, which consists of an unsaturated
alkyl group attached to a benzene ring (Figure 1.1), enabling the styrene monomer
to undergo polymerization reactions. Repeated polymerization of styrene monomers
gives rise to PS plastics. However, sub-optimal polymerization efficiency and the
volatile nature of styrene have resulted in unreacted styrene forming a principal
component of the waste effluent from PS processing plants (Nemerow & Agardy,
1998; Tossavainen, 1978). It was estimated that up to 11.3 L of styrene-laden
wastewater is generated with every Kg of PS (Nemerow & Agardy, 1998). This
meant that by 2020, there could be up to 265 million cubic meters of styrene-laden
wastewater produced annually. Styrene is also present in off-gas. In the United
States alone, about 13.2 kilo metric tons of styrene gas are emitted from styrene-
related industries (US EPA, 1994).
Negative health and ecological effects are associated with styrene pollution. It has
been found that exposure to styrene, above the maximum concentration level of 0.1
mg.L-1
, leads to depression of central nervous system, damaged to liver and nerve
tissue, potential endocrine disruption, and possibly even cancer (US EPA, 2010;
WHO, 2011). Apart from its association with adverse human health effects, styrene
3
also has negative ecological and environment impact. Styrene exhibits toxicity to
various cellular complexities including green algae, zooplankton, earthworm and
freshwater fish (Cushman et al., 1997). In the atmosphere, styrene readily reacts
with ozone to form photochemical smog (US EPA, 1994). Hence, the proper
monitoring and management of industrial waste styrene is pivotal to public health,
ecological and environmental protection. On a local perspective, Singapore is a
major producer of PS, accounting for about 1.6% of global production (APIC,
2010). The large volumes of styrene waste effluent generated worldwide and in
Singapore meant that the monitoring and treatment of waste styrene, from PS
production industry, are important issues both locally and internationally.
Figure 1.1 Chemical structure of styrene.
1.1.2 Analytical methods for styrene monitoring
Styrene monitoring encompasses the analysis of styrene levels in both off-gas and
wastewaters. To do so, styrene analysis methods, based on gas chromatography (GC)
and high performance liquid chromatography (HPLC) systems, have been
developed. GC-based methods are regarded as well-established and have been
adopted as Standard Methods by US EPA (e.g., EPA 5030B/C, EPA 502.2, EPA
8260B, EPA 524.2 and 524.3) (NEMI). While GC-based methods could be
employed for the analyses of both gaseous and aqueous styrene, these methods are
only well-suited for gaseous styrene analysis and cannot be directly applied to
aqueous styrene. This is due to the incompatibility between water and GC gas
column stationary phase/GC detector. Additionally, styrene wastewaters have been
reported to contain high levels of styrene (up to 2.0 mM) (Aliabadi et al., 2012),
which are beyond the styrene detection capability of GC (up to 1.9 μM)
4
(Demeestere et al., 2007; NEMI). This meant that pre-analysis sample preparation
steps (e.g., sample extraction and dilution) are necessary, leading to an increased
exposure risk to harmful carcinogens/solvents, higher analysis cost, potential
sample loss and measurement inaccuracies. HPLC-based methods, on the other
hand, can perform direct analysis of aqueous styrene and has higher styrene
detection capability (i.e., 1.73 mM) (Colin et al., 1986), making HPLC-based
methods more suitable for styrene wastewater analysis.
1.1.3 Treatment methods for styrene waste
Many treatment methods have been proposed for industrial waste styrene. These
treatment methods formed two board categories namely non-biological methods
(air-stripping and capture, chemical oxidation, granular activated carbon [GAC]
removal, etc) and biological methods (biofiltration, activated sludge process,
biofilm, membrane bioreactor process [MBR], anaerobic process, etc). While non-
biological approaches provide a rapid means of styrene removal, these approaches
are costly and often produce undesirable secondary pollutants (Farhadian et al.,
2008). Conversely, biological methods leverage on microorganisms as biocatalysts
for the elimination, attenuation or transformation of organic contaminants into
harmless material such as CO2 and water (Farhadian et al., 2008). This makes them
a “greener” approach and the preferred treatment process for styrene styrene waste
effluent.
Many studies have demonstrated that styrene biodegradation is favored under
aerobic conditions (Durán et al., 2008). It appears that oxygen molecule is an
essential signal to induce styrene catabolism (O'Leary et al., 2002), and is also an
important reactant for the initiation of styrene biodegradation (Tischler &
Kaschabek, 2012). However, high biomass yield is associated with aerobic
treatment. In the activated sludge process for an example, sludge management and
disposal represents a significant expenditure in the activated sludge process, and
was estimated to be as high as 60% of the total wastewater treatment cost (Wei et
al., 2003). This begs the question of whether the high operating cost is justifiable
for merely styrene removal, and if waste styrene and the final biomass by-product
5
could be put to better use.
1.1.4 Coupling styrene remediation to production of valuable end-products
To alleviate treatment cost, there has been a surge in interest to utilize bacterial
biomass as biofactories for bioconversion of organic waste into valuable chemicals
or raw materials (Drepper et al., 2006). Biotransformation of styrene to
commercially valuable products namely polyhydroxyalkanoate (PHA), styrene
oxide and 3-vinylcatechol have been reported (Ward et al., 2005; Warhurst et al.,
1994). Among the aforementioned products, only PHA is formed as an intracellular
product whereas styrene oxide and 3-vinylcatechol are secreted into the
extracellular cultivation medium (Ward et al., 2005). Hence, PHA is the most
suitable target end-product in the up-recycling of organics in wastewater. This is
because the intracellular PHA storage enables PHA product to be kept securely
within the bacterium and separated from waste effluent matrix, ensuring the
recovery of a high-purity product. Furthermore, the resultant biomass by-product
becomes a valuable store of PHA, which can potentially create commercial value to
the PHA-containing biomass generated from the biological treatment process.
1.1.5 Polyhydroxyalkanoate (PHA) and its analytical methods
There has been considerable amount of commercial interest in PHA polymer due to
its biodegradability and biocompatibility. At the molecular level, PHA is a
biopolyester comprising of (R)-β-hydroxy fatty acids monomers, also termed as
“PHA monomers”. PHA monomers harbor a functional R group, which is usually a
saturated alkyl group that varies in carbon length from methyl (C1) to pentadecyl
(C15) (Tan et al., 2014b). Depending on the total number of carbon atoms within a
PHA monomer, PHA can be classified as either short-chain length PHA (SCL-PHA;
3 to 5 carbon atoms), medium-chain-length PHA (MCL-PHA; 6 to 14 carbon
atoms), or long-chain length PHA (LCL-PHA; 15 or more carbon atoms) (Khanna
& Srivastava, 2005). Various combinations of PHA monomers constitute to the
chemical diversity of PHA, endowing PHA with a wide range of polymer properties
(Rai et al., 2011). Having a reliable and accurate way to analyze PHA is key to
understanding and predicting its polymer properties. Many methods have been
6
developed for the detection and analysis of microbial PHA (e.g., colony/cell
staining, crotonic acid assay, fourier transform infrared spectroscopy [FTIR], HPLC
and GC) (Tan et al., 2014b). Among these methods, GC-based methods are most
widely-used as these methods could achieve both qualitative and quantitative
analyses of the PHA monomeric composition within a relatively short analysis time.
1.1.6 Microbial MCL-PHA production from styrene
PHA has diverse applications ranging from biodegradable packaging materials to
pharmaceutical and biomedical products. In particular, MCL-PHA possesses
material properties which are suitable for high-end medical applications including
heart valves, cardiac patches, scaffold for tissue engineering, surgical sutures, stents
and controlled drug delivery matrices (Rai et al., 2011). MCL-PHA monomers,
arising from the depolymerization of MCL-PHA, are also know to exhibit
antimicrobial activity and serve as a platform for the production of a plethora of
pharmaceutical products including fungicides, flavors, pheromones, vitamins and
etc (Allen et al., 2012). Presently, while the commercialization of SCL-PHA has
been realized, MCL-PHA commercialization continues to be hindered by high
production cost. It has been suggested that using cheap or “free” carbon substrates,
such as waste, may decrease PHA cost (Choi & Lee, 1999). The production of
MCL-PHA, however, appears to be both bacterial and substrate-dependent. Based
on pure culture studies, MCL-PHA is typically produced by bacteria from the
Pseudomonas genus utilizing mono-aromatics, alkene, n-alkanes and n-alkanoate
substrates (Tan et al., 2014b). At the same time, the genus Pseudomonas is
frequently detected in styrene-degrading microbial communities (Alexandrino et al.,
2001; Arnold et al., 1997; Greene & Voordouw, 2004; Portune et al., 2015);
styrene-degrading pure culture Pseudomonas species have also been reported
(Tischler & Kaschabek, 2012). This meant that styrene, as a substrate, and its
naturally-occurring bacterial degraders constitute a favorable combination for
MCL-PHA production. Indeed, to date, four pure P. putida strains (i.e., P. putida
S12, P. putida CA-1, P. putida CA-3 [NCIMB 41162] , and Pseudomonas sp.
TN301) have been found to bioconvert styrene to MCL-PHA (Hartmans et al., 1990;
Narancic et al., 2012; O'Connor et al., 1995).
7
Taken together, the concept of bioconverting of waste styrene to MCL-PHA is
advantageous as it provides an environmentally friendly treatment approach to
address the issue of waste styrene generated from PS plastic processing industries.
More importantly, coupling styrene treatment process to the production of a
valuable MCL-PHA biomaterial creates additional value for the biological
treatment process and enables MCL-PHA to be cheaply produced from waste
carbon substrates. This has the potential benefits of off-setting biological treatment
costs and lowering MCL-PHA production costs, bringing MCL-PHA closer to
commercialization.
1.2 Problem Statements
PHA production is typically carried out in aqueous environment due to the ease of
achieving homogeneity in cultivation conditions required for inducing PHA
accumulation (e.g., feast/famine and aerobic/anaerobic cycles) in PHA-producing
microbes (Serafim et al., 2008). As such, this PhD study will focus on the microbial
production of MCL-PHA from styrene under aqueous environment. While the
technical feasibility of bioprocess has been proven in pure bacterial cultures,
extending the application to treat styrene waste still faces a number of challenges.
There are also limitations to the current analytical methods for styrene and PHA
analyses. The limitations and challenges are described below and formed the basis
for this PhD study.
(A) Limitations of existing chromatographic methods for aqueous styrene
analysis
Styrene is one of the main components in wastewater generated from PS production
and processing plants. High aqueous styrene concentrations of up to 2.0 mM have
been previously reported (Aliabadi et al., 2012). Nevertheless, monitoring styrene
levels may present a challenging task. This is due to the mixing of wastewaters
exiting PS and other petrochemical processing plants (Ahmad et al., 2008; Fallah et
al., 2010). Mono-aromatic compounds such as benzene, toluene, ethylbenzene and
xylenes (BTEX), and polyaromatic compounds such as naphthalene and indene are
8
known to co-occur with styrene in these wastewater mixtures. Specifically, styrene
and BTEX have been reported at similar concentrations (B:T:E:X:styrene ratio [in
mM] of 9.3:4.2:1:2.5:6.6) (Ahmad et al., 2008). Structural similarity, especially
between mono-aromatic compounds, may lead to a loss in chromatographic
resolution on HPLC systems, particularly so if the compounds co-exist at high
aqueous concentrations (AlSalka et al., 2010; Campos-Candel et al., 2009). Hence,
the presence of BTEX may interfere with styrene detection. Having a simple and
fast analysis method, suited for the detection and quantification of aqueous samples,
with high styrene and BTEX (BTEXS) concentration, would greatly facilitate the
routine environmental monitoring and remediation of contaminated waters. Current
HPLC methods are restricted to analyzing styrene and BTEX separately as these
methods were developed for application-specific analyses (e.g., BTEX analysis in
BTEX-contaminated water samples and occupational environments, and styrene
analysis in biological samples and food samples) (AlSalka et al., 2010; Campos-
Candel et al., 2009; Colin et al., 1986; Gawell & Larsson, 1980). Hence, there is no
chromatography method available for the direct analysis of aqueous samples
containing high concentrations of BTEXS. This necessitates the need to develop
such a method.
(B) Limitations of existing chromatographic methods for PHA analysis
The analysis of PHA biopolymer is a challenging task due to the myriad of
naturally-occurring PHA monomers, which can occur simultaneously within a
single biopolymer. For an example, MCL-PHA can comprise up to 9 or more PHA
monomers. This translates to a high calibration workload and cost. Furthermore,
traditional GC methods, coupled to flamed ionization detector (GC-FID) or mass
spectrometer (GC-MS), typically require PHA reference standards for robust
identification and quantification. However, many PHA reference standards are
either expensive, not readily-available or are commercially-unavailable (Escapa et
al., 2011; Furrer et al., 2007). Researchers have sought to overcome this problem by
using a combination of GC-MS (for tentative identification of PHA monomers) and
GC-FID (for the routine quantification of PHA monomers identified by GC-MS)
(Ward et al., 2006) to keep calibration workload manageable and calibration cost
9
low; chemically or biologically-synthesize PHA analytical standards that are
commercially unavailable (Sun et al., 2009); using commercially-available PHA
analytical standards to quantify chemically-similar but commercially-unavailable
PHA monomers (Oehmen et al., 2005). These measures can lead to errors in
measurements. Developing an accurate analytical method for PHA analysis has thus
proven to be a difficult, costly, tedious and time-consuming pursuit. This warrants a
need to develop a simple GC calibration method which reduces calibration
workload and cost while enabling accurate detection and quantification of a wide
range of PHA monomers using a limited inventory of PHA reference standards.
(C) Limited information on styrene-degrading microbial community structure
in aqueous environment
Industrial biological treatment of styrene is usually conducted under non-sterile
environment. To enhance the process for simultaneous styrene remediation and
MCL-PHA production under aerobic, non-sterile aqueous environment is a
challenging task due to several reasons. First, styrene is a recalcitrant compound
and requires specialized microbes for its assimilation (Babaee et al., 2010).
However, the providence of aeration, which is essential for rapid styrene
metabolism, causes styrene removal through abiotic air stripping instead of the
intended biotic action (Fallah et al., 2010). Therefore, styrene does not remain
sufficiently long enough in the aqueous environment to enrich for styrene-degrading
and PHA-producing microbes. Second, even though some pure P. putida cultures
(i.e., P. putida S12, P. putida CA-1, P. putida CA-3 [NCIMB 41162], and
Pseudomonas sp. TN301) could assimilate styrene for MCL-PHA production
(Hartmans et al., 1990; Narancic et al., 2012; O'Connor et al., 1995), the prolonged
survival and performance of pure cultures may be compromised under non-sterile
environments (Coats et al., 2007). Mixed microbial cultures on the other hand,
present higher microorganism diversity, have low sterility demand and greater
robustness (Cabrol & Malhautier, 2011; Satoh et al., 1998), which makes them
more suited for applications involving waste. However, mixed cultures tend to
produce lesser PHA compared to pure cultures due to the presence of low-PHA-
accumulating and non-PHA-accumulating microorganisms (Lee, 1996; Salehizadeh
10
& Van Loosdrecht, 2004). Bioaugmentation or formulating defined microbial
cocktails, which are representative of the naturally-occurring microflora, using
styrene-degrading and/or high PHA-producing bacterial strains, may overcome the
aforementioned challenges.
To facilitate the identification of suitable seeding sludge, achieve successful
bioaugmentation or the formulation of defined microbial cocktails, aimed at process
optimization and extension to concurrent PHA production, it is important to have an
understanding of the aqueous styrene-degrading microbial population. Much of the
current understanding about styrene-degrading microbial community structure has
been confined to biofilter and soil studies (Alexandrino et al., 2001; Arnold et al.,
1997; Greene et al., 2000; Portune et al., 2015). However, the microbial population
in aqueous environments was found to be distinct from that in non- or semi-aqueous
environments (Tresse et al., 2002). Hence, the information, gleaned from biofilter
and soil studies, may not provide an accurate picture of the microbial population in
aqueous environments. Further studies are needed to characterize styrene-degrading
microbial community structure in aqueous environments.
Thus far, the presence of potential PHA-accumulating microbial members within
styrene-degrading mixed consortia has yet to be reported. Nevertheless, the
microbial community analysis was reported for mixed consortia enriched on other
carbon substrates. These carbon substrates include volatile fatty acids (VFAs)
(Serafim et al., 2008), alkanoic acids (Lee et al., 2011), and etc. A comparison of
these studies reveals that different carbon substrates will result in distinct PHA-
producing microbial population due to the adaptation of microbial community.
Hence, much of the current understanding about PHA-producing bacteria within
mixed consortia may not be transferable to styrene-degrading microbial
communities. Further studies are needed to identify potential PHA-producing
members present within a styrene-degrading microbial consortium in aqueous
environments.
11
(D) Limited availability and diversity of styrene-degrading cum MCL-PHA-
producing pure microbial cultures
To achieve successful bioaugmentation or formulation of defined microbial
cocktails, which is representative of the naturally-occurring microflora, for process
optimization and simultaneous MCL-PHA production, it is essential to have a large
and diverse pool of pure microbial cultures. Current understanding of microbes
capable of both styrene-degradation and MCL-PHA accumulation are limited to
only four pure bacterial cultures, from the Pseudomonas species (P. putida CA-3, P.
putida CA-1, P. putida S12 and Pseudomonas sp. TN301) (Hartmans et al., 1990;
Narancic et al., 2012; O'Connor et al., 1995). However, most of them
bioaccumulate MCL-PHA at very low cellular content (3% to 14% cell dry mass
[CDM]). The only exception was P. putida CA-3 which could accumulate MCL-
PHA up to 33% CDM (Nikodinovic et al., 2008). However, P. putida CA-3 is a
patented bacterium and is not readily-accessible for further scientific investigation
and bioprocess application. Therefore, there is a lack of bacterial strains with the
metabolic capacity to bioconvert styrene into MCL-PHA efficiently, which warrants
the need to increase the pool of pure microbial cultures.
Furthermore, while Pseudomonas species is known to occur as part of a styrene-
degrading consortium, the consortium is a diverse one, comprising of many other
bacterial genera and species (Alexandrino et al., 2001; Arnold et al., 1997; Greene
et al., 2000). Culture-dependent studies have also unraveled many taxonomically-
distinct groups of styrene-degrading bacteria (Greene & Voordouw, 2004; Tischler
& Kaschabek, 2012) as well as PHA-accumulating bacteria (Koller et al., 2010; Tan
et al., 2014b). Cross-referencing between styrene-degrading and PHA-accumulating
bacteria reveals some overlaps between the two groups of bacteria. These genera
include Corynebacterium, Nocardia, Rhodococcus, Streptomyces, Xanthomonas
and Azohydromonas (formerly Alcaligenes). These genera have not been reported to
produce PHA from styrene but had been proven to do so using other carbon sources
(Reddy et al., 2003; Verma et al., 2002). In particular, some species from the genera
Corynebacterium and Streptomyces are known to biosynthesize MCL-PHA (Allen
et al., 2012; Shahid et al., 2013). Presently, it is unknown if there may be other
12
bacteria genera, apart from Pseudomonas, which are capable of converting styrene
into MCL-PHA, either as a pure culture or as part of a consortium. Hence, further
investigation is required.
1.3 Research Objectives
There are two main objectives for this PhD work. The first objective was to develop
simple and rapid analytical methods to facilitate the analysis of PHA, aqueous
styrene and other common co-occurring mono-aromatic compounds (i.e., BTEX).
The second objective was to identify the key bacterial players of the styrene-
degrading community, characterize the MCL-PHA production capabilities of
culturable bacterial species and increase the pool of pure bacterial cultures capable
of bioconverting styrene to MCL-PHA. Specific objectives were:
1. To develop a new and fast method suited for direct analysis of aqueous
samples containing high concentrations of BTEXS,
2. To develop a new and simple method for reliable qualitative and
quantitative analysis of a wide range of PHA compounds using limited
reference standards,
3. To characterize the aqueous bacterial community structure of styrene-
assimilating consortium in a laboratory-scale reactor fed with styrene as sole
carbon source, and
4. To isolate and characterize styrene-degrading and MCL-PHA-producing
bacterial cultures.
1.4 Scope of Work
To achieve the research objectives, the following scope of work was carried out:
Study 1
1. Assess the suitability of a new commercial high performance liquid
chromatography (HPLC) column, Acclaim Phenyl-1, for the direct analysis
of BTEXS at high aqueous concentrations,
13
2. Determine the optimal HPLC operation parameters (i.e., mobile phase
composition, sample injection volume and flow rate), and
3. Determine the analytical parameters (i.e., Limits of Detection/Limits of
Quantification [LOD/LOQ], repeatability, reproducibility and method
recovery) for the newly-developed HPLC method.
Study 2
1. Derive mathematical expressions describing the relationship between
homologous PHA carbon number and retention time or response factor
under GC analysis, and
2. Evaluate the accuracy of the mathematical expressions using PHA monomer
and PHA polymer reference standards.
Study 3
1. Test the styrene degradation capability of styrene-enriched activated sludge
consortium using HPLC method developed in Study 1,
2. Analyze the changes in the bacterial community structure under long-term
styrene enrichment using next-generation sequencing approach,
3. Conduct alpha and beta diversity analyses of styrene-degrading bacterial
community, and
4. Identify potential PHA-producing members present within the styrene-
degrading bacterial community.
Study 4
1. Isolate and identify pure bacterial cultures capable of bioconverting styrene
to MCL-PHA,
2. Determine the MCL-PHA quantity and composition using GC method
developed in Study 2,
3. Investigate the influence of temperature and pH on growth of pure styrene-
degrading and MCL-PHA-producing bacterial culture,
4. Visual inspection of intracellular MCL-PHA granules in pure bacterial
culture, and
14
5. MCL-PHA polymer extraction and characterization.
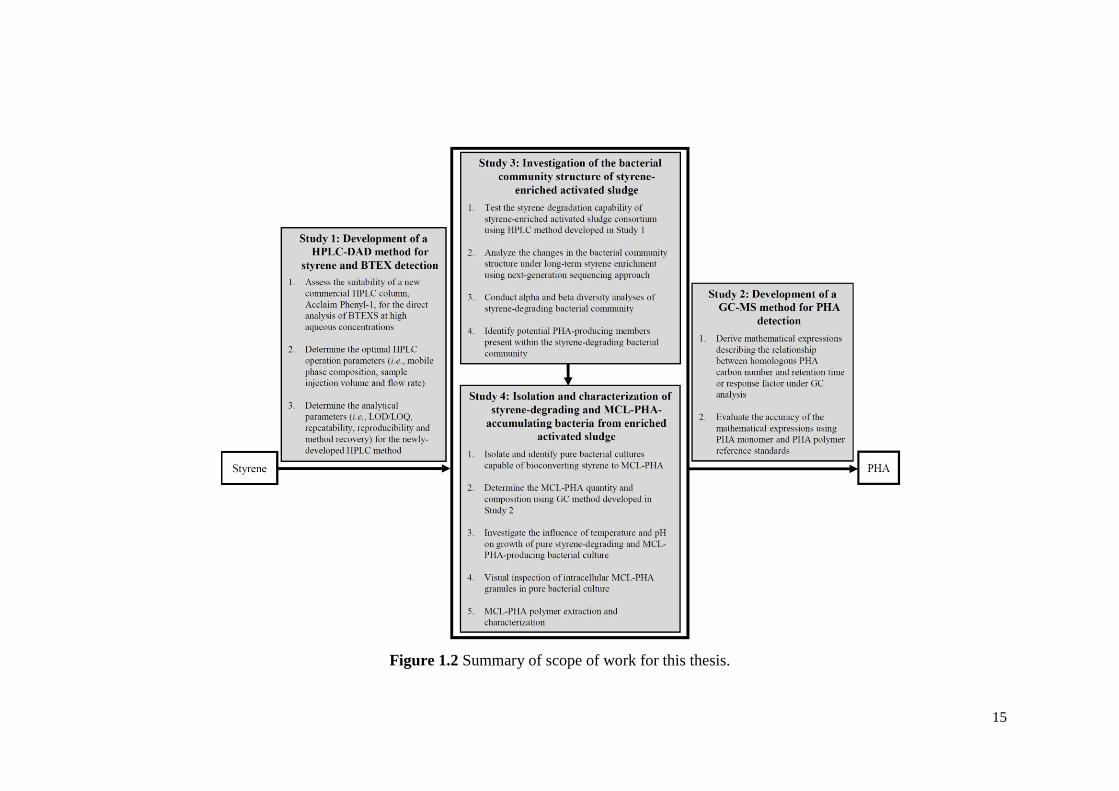
1.5 Organization of Thesis
The thesis consists of seven chapters. Chapter 1 provides a general introduction, the
problem statements, research aims, research objectives and scope of work. Chapter
2 provides a literature review on the current status of BTEXS and PHA analytical
methods as well as styrene waste bioremediation and PHA production with a focus
on bacteria species and bacterial metabolic pathway bridging the two biological
processes. Chapters 3 to 6 present the research findings of Study 1 to 4. Study 1
(Chapter 3) details the analytical method development for styrene analysis and
concurrent analysis of BTEXS mixture. Study 2 (Chapter 4) presents the analytical
method development for PHA analysis. Study 3 (Chapter 5) documents the bacterial
community structure of a styrene-degrading consortium. Study 4 (Chapter 6) details
the isolation and characterization of bacteria capable of bioconverting styrene to
MCL-PHA. Chapter 7 provides the overall conclusion and recommendations for
future work. The scope of work is summarized in Figure 1.2.
15
Figure 1.2 Summary of scope of work for this thesis.
16
CHAPTER 2
Literature Review
17
2.1 Styrene Waste
Styrene is the main raw material as well as the principal pollutant generated from
the industrial synthesis of PS plastics. PS production is a batch process that involves
two main steps – bulk polymerization and suspension method (Nemerow & Agardy,
1998). In bulk polymerization, polymerization of pure styrene monomers is
performed at 90 °C, in polymerization vessel, to about 30% completion to form a
prepolymer (i.e., partially polymerized mass). Following which, the prepolymer is
transferred to a suspension-polymerization reactor, containing water, suspending
and dispersing agents, where the prepolymer is dispersed into smaller droplets and
held in a suspension medium for the completion of polymerization. After complete
PS polymerization, the polymer suspension is transported to a blowdown tank
where unreacted styrene monomers are air-stripped and emitted as off-gas. The final
polymer product is washed and dewatered. The styrene-laden residual suspension
medium and washing water, which totaled at 11.3 L per Kg PS, are discharged as
wastewaters.
Literatures reported that the concentration range of industrial styrene emission is
between 0.01 ppm, and 300 ppm while that of styrene wastewaters is between 2.2
mg.L-1
and 300 mg.L-1
(Ahmad et al., 2008; Aliabadi et al., 2012; Araya et al., 2000;
Durán et al., 2008; Fallah et al., 2010; Tossavainen, 1978). At the aforementioned
concentration ranges, the levels of styrene gas and aqueous styrene have exceeded
World Health Organization (WHO) guideline values by 140 to 4,000,000 times (air
quality: 7e-5
ppm, 30-min average) and by 100 to 15,000 times (drinking water
quality: 0.02 mg.L-1
), respectively (WHO, 2000, 2011). If left untreated, styrene
pollution will bring about to serious health effects and negative ecological
repercussions (Cushman et al., 1997). As such, the monitoring and treatment of
styrene waste is pivotal to environment and public health protection.
2.1.1 Analytical methods for monitoring gaseous and aqueous styrene
samples
Styrene monitoring comprises of styrene analysis in both gas and aqueous samples.
Many styrene analysis methods, based on GC and HPLC systems, are currently
18
available (Table 2.1).
Gaseous styrene analysis
Gaseous styrene samples are typically analyzed on GC systems coupled to various
detectors (e.g., FID, PID and MS). Since GC analysis requires analyte to be in
gaseous form, gaseous styrene samples can be directly injected into GC systems.
GC methods are also adopted as Standard Methods (e.g., EPA 5030B/C, EPA 502.2,
EPA 8260B, EPA 524.2 and 524.3) for styrene analysis (NEMI). GC-MS is usually
utilized for qualitative analysis to verify the presence of styrene in gaseous samples
while GC-FID and GC-PID are used for quantification purposes.
Aqueous styrene analysis
Styrene is a principal component of wastewater generated from PS production and
processing plants (Nemerow & Agardy, 1998), However, the sample matrix
complexity increases when styrene wastewater is mixed with wastewaters from
other petrochemical processing plants (Ahmad et al., 2008; Fallah et al., 2010).
Mono-aromatic BTEX compounds reportedly co-occur with styrene in these
wastewater mixtures at similar concentrations (Ahmad et al., 2008). Due to the
structural similarity of mono-aromatic compounds, achieving good resolution is a
challenge for chromatographic separation, especially when the compounds co-exist
at high aqueous concentrations (AlSalka et al., 2010; Campos-Candel et al., 2009).
Conventionally, the focus in water sample analysis has been the trace detection of
BTEXS in water intended for portable use in accordance to WHO guidelines
(NEMI; WHO, 2011). GC-based methods are advantageous in terms of their higher
detection sensitivities and chromatographic resolutions. Styrene could be detected at
concentrations as low as 2.88 x 10⁻⁶
mM (Table 2.1), which is much lower than the
stipulated WHO guidelines (1.90 x 10⁻⁴
mM) (WHO, 2011). Similarly, the lower
detection limits for BTEX, achieved by GC-based methods, are about 102
folds to
105
folds lower than WHO guidelines (WHO, 2011). Despite superior detection
sensitivities and chromatographic resolutions, applying GC for aqueous sample
analysis is less straightforward as compared to gaseous sample analysis. This is due
19
to the inherent incompatibility between water and GC gas column stationary
phase/GC detector. This complicates the analysis of volatile mono-aromatics, thus
requiring sophisticated sample preparation to extract the compounds from aqueous
samples. Sample preparation is either an offline solvent extraction step or online
treatments requiring costly accessories such as purge and trap, headspace, and solid
phase micro extraction (SPME) (Farhadian et al., 2009). Sample may also require
dilution to prevent detector saturation (Farhadian et al., 2008). These preparative
steps prior to GC analysis increase human exposure risk to harmful
carcinogens/solvents. Additionally, the volatile nature of BTEXS inadvertently
constitutes to sample loss during sample preparation, possibly compromising the
accuracy of the measurement. While a direct aqueous injection method for GC has
been developed to circumvent the problem (Kubinec et al., 2005), the two-step
temperature ramp oven programme can be time-consuming. The total analysis time
of GC-based methods could take as long as 45 min (Table 2.1), which lowers the
overall analysis throughput.
On the other hand, HPLC requires analyte to be in dissolved in aqueous and/or
solvent media and is able to accept higher compound concentrations, which makes
it well-suited for the analysis of aqueous samples. Hence, unlike GC-based methods,
complicated and time-consuming sample preparations are typically not required for
HPLC-based methods. Sample preparation usually involves a simple filtration step.
Compared to GC-based methods, HPLC-based methods offer several advantages in
terms of minimal sample loss, time-savings, higher throughput, and lower capital
cost. The total analysis time of HPLC-based methods is usually less than 20 min
(Table 2.1), which is shorter than that of GC-based methods. Therefore, HPLC is
emerging as a popular alternative and complementary tool to GC for the analysis of
BTEXS compounds in water samples. HPLC-UV has been applied for styrene
analysis and could detect styrene at concentration between 4.80 x 10⁻⁴
and 1.73 mM
(Colin et al., 1986). HPLC-UV, HPLC-DAD and HPLC-fluorescence were applied
for BTEX analysis, but at lower concentration ranges compared to styrene (Table
2.1). To date, while the feasibility of HPLC for styrene and BTEX analysis has been
demonstrated, there is currently no available HPLC method for the concurrent
20
detection of BTEXS as existing methods were developed for application-specific
analyses. For an example, the BTEX analysis methods were specifically developed
for analyzing BTEX-contaminated water samples (AlSalka et al., 2010) and BTEX-
contaminated occupational environments (Campos-Candel et al., 2009) while
styrene analysis methods were specifically developed for analyzing styrene levels in
biological samples (Colin et al., 1986) and food samples (Gawell & Larsson, 1980).
HPLC methods based on reversed-phase C8 and C18 columns with methanol- or
acetonitrile-water mobile phases were commonly reported (AlSalka et al., 2010;
Farhadian et al., 2009; Kelly et al., 1996). Recently, a β-cyclodextrin stationary
phase column was also reported for BTEX analysis and has an advantage over
C8/C18 columns in its ability to achieve complete separation of m-xylene and p-
xylene (Campos-Candel et al., 2009). However, the upper detection limit of these
existing HPLC methods remains inadequate for analysis of high analytes
concentrations (AlSalka et al., 2010; Campos-Candel et al., 2009). This is due to the
deterioration of resolution, especially between ethylbenzene and xylenes, at high
analyte concentrations. Taken together, the limited analyte range and upper
detection limits of existing HPLC-based methods warranted more efforts in the
development of new HPLC method for the direct and concurrent analysis of
concentrated BTEXS aqueous samples.
2.1.2 Non-biological styrene treatment methods
Aside from routine monitoring of styrene effluents, treatment of these styrene waste
effluents are equally, if not, more important. Non-biological methods achieve
styrene remediation through various mechanisms. These mechanisms include
mechanical air-stripping which transfers styrene from liquid phase into gaseous
phase; physical adsorption of styrene through the use of GAC or oil absorptive
resins (US EPA, 1974; Wu & Zhou, 2009); chemical coagulation of styrene using
coagulants such as caustic, magnesium chloride, and polyacrylamide (Amosov et al.,
1976); oxidation of styrene to form unstable styrene epoxides using oxidants such
as hydrogen peroxide (De Paula et al., 2011); membrane-based separation of
styrene through microfiltration (Fallah et al., 2010) or pervaporation (Aliabadi et al.,
21
Table 2.1 Summary of methods for styrene and BTEX in aqueous media.
System Sample
Preparation
Analysis
Time (min)
Compound Detection Concentration (mM) Reference(s)
Styrene Benzene Toluene Ethylbenzene Xylenes
GC-PID/FID Purge and
trap1,2,3,4
,
headspace,
SPME,
solvent extraction
10-201,
452
2.88 x 10⁻⁶
2.56 x 10⁻⁶
1.41 x 10⁻⁶
1.88 x 10⁻⁸
-
4.71 x 10⁻⁸
9.42 x 10⁻⁶
(AlSalka et
al., 2010;
NEMI) GC-MS 40
3,
28-304
For
verification
purposes
For
verification
purposes
6.50 x 10⁻⁵
2.83 x 10⁻⁷
-
5.65 x 10⁻⁷
9.42 x 10⁻⁷
HPLC-DAD Purging from
water samples to
acetonitrile
325 n.d. 3.84 x 10
-6-
0.02
4.34 x 10⁻⁶
-0.02
4.71 x 10⁻⁶
-
0.01
1.88 x 10⁻⁶
-0.01
(AlSalka et
al., 2010)
HPLC-UV Filtration 4-206 4.80 x 10
-4-
1.73
6.40 x 10⁻⁵
-
3.80 x 10⁻⁴
4.34 x 10⁻⁵
-3.30 x 10⁻⁴
n.d. 9.42 x 10⁻⁵
-4.70 x 10⁻⁴
(Colin et al.,
1986;
Farhadian et
al., 2009;
Kelly et al.,
1996)
HPLC-
fluorescence
Filtration 12 n.d. 0.05-1.15 5.42 x 10⁻³
- 0.098
7.54 x 10⁻³
-
0.15
1.32 x 10⁻³
-0.16
(Campos-
Candel et al.,
2009) 1 EPA 5030B and EPA 5030C for aqueous and water miscible liquid samples
2 EPA 502.2 for source intended for drinking purpose
3 EPA 8260B for nearly all types of samples
4 EPA 524.2 and 524.3 for source intended for drinking purpose
5 Includes sample preparation and analysis time
6 4 mins for styrene analysis and 20 mins for analysis of benzene, toluene and xylene mixture
n.d. represents “not determined”
22
2012; Peng et al., 2003). These non-biological treatment methods typically offer a
rapid and efficient solution for styrene removal. For an example, up to 90%
reduction in aqueous styrene can be achieved within 20 min via air-stripping (Hsieh,
2000; Thibodeaux, 1974) while treatment efficiencies up to 99.47% can also be
achieved for styrene adsorption with GAC or oil absorptive 4-tert-butylstyrene-
divinylbenzene-ethylene/propylene/diene resins (US EPA, 1974; Wu & Zhou,
2009).
While non-biological approaches provide a rapid means of styrene removal, these
approaches are costly due to the high amount of energy required, particularly in the
providence of mechanical agitation for air-stripping, and maintenance of a vacuum
or gas purge and low temperature for membrane pervaporation (O‟Brien et al.,
2000). High treatment cost arising from chemicals supplementation is also
associated with treatment methods such styrene adsorption, coagulation and
oxidation. Apart from high treatment cost, non-biological methods often produce
undesirable secondary pollutants. For an example, air-stripping was often conducted
without downstream air emission control, causing air-pollution (Arnold et al., 1997;
Farhadian et al., 2008). In adsorption and chemical approaches, hazardous waste
such as spent GAC/resins and chemical by-products are formed respectively,
requiring additional expenditure in post-treatment processes to ensure that the final
disposed waste products are within legislated limits. Taken together, non-biological
methods may not present a cost-effective and environmentally-friendly solution for
styrene waste treatment.
2.1.3 Biological styrene treatment methods
Unlike non-biological methods, biological methods leverage on microorganisms as
biocatalysts for the elimination, attenuation or transformation of organic
contaminants into harmless material such as CO2 and water (Farhadian et al., 2008).
Styrene-degrading capabilities has been detected in seeding inoculums from various
environments such as soil (Jang et al., 2006; Okamoto et al., 2003), activated sludge
(Arnold et al., 1997; Babaee et al., 2010), pond sediments (Bouwer, 1989), and etc.
This shows that many naturally-occurring microorganisms can assimilate styrene
23
and form harmless by-products, presenting a “green” approach for the removal of
styrene. Compared to non-biological processes, biological treatment strategies are
also more economical and effective (Vidali, 2001). Hence, biological treatment
methods are widely-applied for the treatment of styrene effluents (Ahmad et al.,
2008; US EPA, 1974). Furthermore, microorganisms can be used as whole-cell
catalyst for bioconversion of waste substrates into valuable by-products, potentially
off-setting treatment cost (Drepper et al., 2006).
Anaerobic process
Both aerobic and anaerobic methods for treatment of styrene waste have been
reported. In anaerobic processes, styrene is biodegraded into VFAs and
subsequently converted into methane. This was demonstrated by Araya and
colleagues (2000) using an Upflow Anaerobic Sludge Blanket (UASB) reactor.
However, there have been few reports on anaerobic processes for styrene
bioremediation due to the recalcitrant nature of styrene under anaerobic conditions
(Field, 2002). The activation of styrene for metabolism occurs via an aromatic side-
chain oxygenation. In the absence of oxygen molecules, this proved to be
challenging and requires specialized microorganisms capable of catalyzing water-
mediated hydroxylation of styrene (Tischler & Kaschabek, 2012). This was evinced
in the study by Araya and colleagues (2000) who reported problematic start-up with
non-acclimatized sludge. They also observed reactor instability when fed with
industrial effluent containing 6 mg.L-1
styrene and other impurities at organic
loading rates lower than 3 kg.COD.m-3
.d-1
. Styrene was also found to have
inhibitory effect on acetoclastic and methanogenic activity between concentrations
of 0.45 mM to 1.6 mM, affecting the methane yield. As such, anaerobic processes
may not be robust enough to tolerate styrene toxicity. Cultivating specialized
anaerobes for metabolizing styrene may require long start-up time and does not
necessary generate high methane yield. Anaerobic bioremediation of mono-
aromatic compounds typically proceeds at slow degradation kinetics (Corseuil et al.,
1998), which meant that anaerobic methods may not present the most cost-efficient
method for styrene removal.
24
Aerobic processes: advantages and associated problems
Many studies have demonstrated that styrene biodegradation is favored under
aerobic conditions over anoxic or anaerobic conditions (Durán et al., 2008). The
supply of oxygen is key to aerobic styrene biodegradation for two reasons. The first
reason is that oxygen, together with styrene, form the chemical signal required for
activating the genetic expression of genes encoding for styrene catabolic enzymes
(O'Leary et al., 2002). The second reason is that oxygen is an important reactant
molecule for the initiation of styrene biodegradation (Tischler & Kaschabek, 2012).
Hence, aerobic degradation of styrene exhibits a faster kinetics with greater
elimination capacity and is also more robust toward changes in composition and
styrene loading (Durán et al., 2008).
Aerobic treatment methods include two-phase aqueous-organic solvent system
(Aalam et al., 1993; Han et al., 2006; Osswald et al., 1996), MBR (Fallah et al.,
2010), biofilm-based systems (e.g., biofilter, biofilm MBR and submerged
immobilized biofilm) (Chang et al., 2000; Gross et al., 2007; Gross et al., 2010;
Pérez et al., 2014) and the activated sludge process (US EPA, 1974). Two-phase
aqueous-organic solvent system involves the addition of organic solvents (e.g.,
silicone oil, n-hexadecane, bis(2-ethylhexyl)phthalate and dibutylphtalate) into the
aqueous cultivation medium to form an organic surface layer for enhancing styrene
solubilization for biological degradation while MBR and biofilm-based treatment
methods are advantageous due to their ability to achieve high active biomass
concentration for fast biotic styrene removal. Despite the advantages associated
with two-phase aqueous-organic solvent system, MBR and biofilm-based
approaches, these systems have not been widely-applied due to the difficulties in
scaling up, high cost and negative environmental impact. For the two-phase
aqueous-organic solvent system, the very same organic layer that impeded styrene
volatilization also constituted to oxygen mass transfer problem. This severely limits
the reactor size, particularly reactor depth. Furthermore, the organic solvents, which
typically make up about 20% volume/volume (v/v) of the total working volume, are
usually non-biodegradable or even toxic to the environment. Overall, the limitation
25
in reactor size, the high cost of chemical supplementation and downstream
environmental impact makes the two-phase aqueous-organic solvent system an
impractical system for large-scale styrene wastewater treatment. MBR and biofilm
on the other hand, are prone to biofouling, caused by excessive microbial growth
(Fallah et al., 2010; Gross et al., 2010). For biofilm systems, biofouling greatly
hinders the mass transfer of oxygen and substrates leading to a deterioration of
removal efficiency over time. Similarly in MBR, biofouling increases the
transmembrane pressure, reducing the reactor efficiency after prolonged operation.
Fallah et al. (2010) reported severe fouling issues when the hydraulic retention time
(HRT) was decreased from 24 h to 18 h after 100 days of continuous operation. The
same group also posited that the increase in styrene organic loading rate (OLR) may
have been responsible for the formation of fouling particles. Biofouling problems
necessitate periodic reactor downtime for maintenance or membrane replacement,
driving up the overall operation cost. Hence, MBR and biofilm-based approaches
are costly in the long run and may not be suitable for continual treatment of large
volumes of styrene waste.
On an industrial-scale, the most widely applied aerobic method for the treatment of
styrene under aqueous environment is the activated sludge process. Countries using
the activated sludge process for styrene treatment include USA, Singapore, Taiwan
Republic of China, Brazil, Spain, France, Saudi Arabia, and Iran (The Advent
Corporation; Ahmad et al., 2008; Fallah et al., 2010; Hsieh, 2000; Reis et al., 2007;
US EPA, 1974). The popularity of activated sludge process is attributed to its low
operation cost, low start-up time, high efficiency and ease of operation. Figure 2.1
illustrates a typical activated sludge process where the suspended but settable
particles in raw wastewater are first removed in a primary clarifier before entering
the aeration tank. It is in the aeration tank where the bulk of the soluble organics
fraction are degraded, through the biological action of the activated sludge microbes,
and converted into biomass also known as “secondary sludge”. In the secondary
clarifier, the biological sludge is allowed to settled and separated from the treated
water. Some biological sludge is recycled back to the aeration tanks while excess
sludge is treated for sludge disposal.
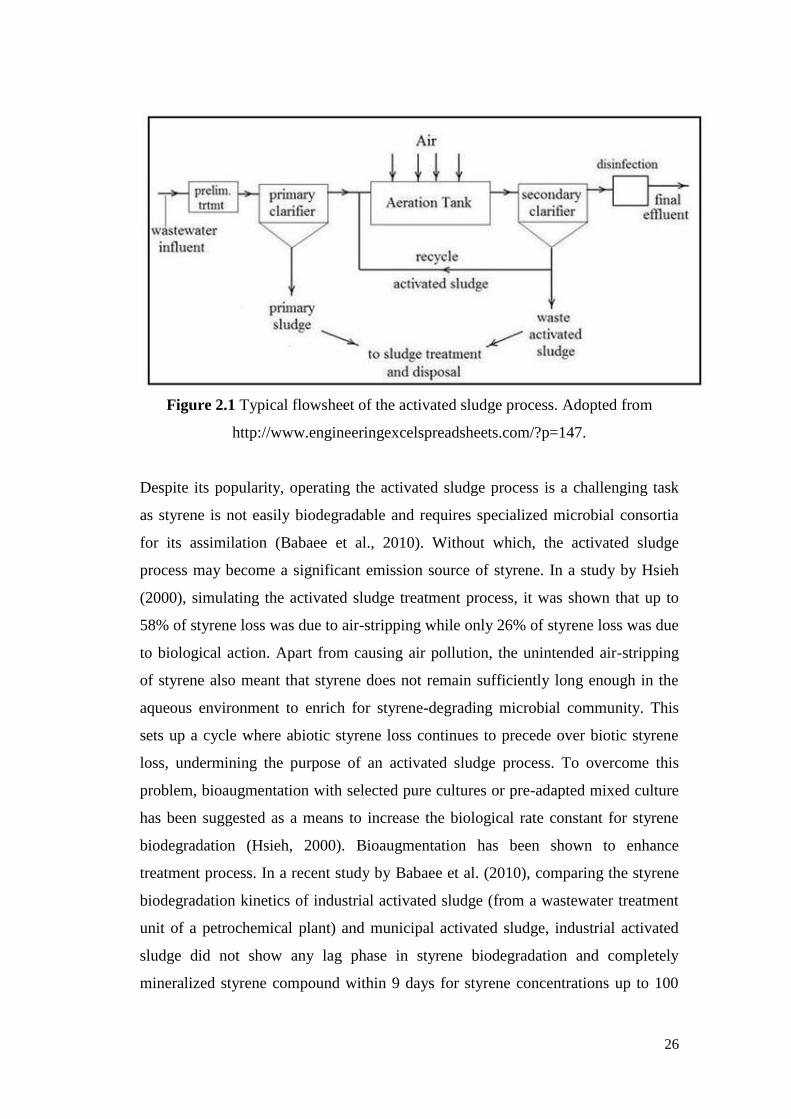
26
Figure 2.1 Typical flowsheet of the activated sludge process. Adopted from
http://www.engineeringexcelspreadsheets.com/?p=147.
Despite its popularity, operating the activated sludge process is a challenging task
as styrene is not easily biodegradable and requires specialized microbial consortia
for its assimilation (Babaee et al., 2010). Without which, the activated sludge
process may become a significant emission source of styrene. In a study by Hsieh
(2000), simulating the activated sludge treatment process, it was shown that up to
58% of styrene loss was due to air-stripping while only 26% of styrene loss was due
to biological action. Apart from causing air pollution, the unintended air-stripping
of styrene also meant that styrene does not remain sufficiently long enough in the
aqueous environment to enrich for styrene-degrading microbial community. This
sets up a cycle where abiotic styrene loss continues to precede over biotic styrene
loss, undermining the purpose of an activated sludge process. To overcome this
problem, bioaugmentation with selected pure cultures or pre-adapted mixed culture
has been suggested as a means to increase the biological rate constant for styrene
biodegradation (Hsieh, 2000). Bioaugmentation has been shown to enhance
treatment process. In a recent study by Babaee et al. (2010), comparing the styrene
biodegradation kinetics of industrial activated sludge (from a wastewater treatment
unit of a petrochemical plant) and municipal activated sludge, industrial activated
sludge did not show any lag phase in styrene biodegradation and completely
mineralized styrene compound within 9 days for styrene concentrations up to 100
27
mg.L-1
. Conversely, municipal activated sludge displayed a lag phase in styrene
biodegradation and mineralized less than 50% of styrene after 9 days when
incubated with 100 mg.L-1
of styrene. These evidence strongly suggested that
bioaugmentation with microbial inocula, pre-adapted to styrene, is pivotal to the
successful operation of activated sludge process for styrene wastewater treatment.
While bioaugmentation with styrene-degrading inocula is advantageous in
enhancing the activated sludge process, the main drawback of this strategy is high
sludge production. The yield coefficient of biomass with respect to oxygen demand
in activated sludge plants is typically 0.5 (Neyens et al., 2004). The yield
coefficients, specific to styrene degradation, can range from 0.2 (for industrial
activated sludge) up to 1.8 (for styrene-degrading pure culture) (Babaee et al., 2010;
Nikodinovic-Runic et al., 2011). Hence, the management of sludge represents a
significant expenditure in the activated sludge process. Treatment and sludge
disposal was estimated to be as high as 60% of the total wastewater treatment cost
(Wei et al., 2003). To alleviate the cost and value-add to the biomass by-product,
there has been a surge in interest to utilize bacterial biomass as biofactories for
bioconversion of organic waste into valuable chemicals and materials (Drepper et
al., 2006).
2.1.4 Microbes involved in styrene degradation
The microbes, involved in styrene degradation, have been studied at both the pure
culture level and at the community level. To date, styrene-degrading pure cultures
have been identified in the genera Corynebacterium, Mycobacterium, Nocardia,
Rhodococcus, Streptomyces, Tsukamurella, Bacillus, Sphingomonas, Xanthobacter,
Enterobacter, Pseudomonas, Xanthomonas and Sphinogobacterium. These genera
are distributed across 4 bacterial phyla (Actinobacteria, Firmicutes, Proteobacteria
and Bacteroidetes) and 5 bacterial classes (Actinobacteria, Bacilli,
Alphaproteobacteria, Gammaproteobacteria and Sphingobacteria) (Table 2.2).
While these pure cultures are capable of complete styrene catabolism, bacterial
community analysis has revealed that the styrene-degrading consortium is a far
more complex community.
28
The styrene-degrading bacterial communities have been previously examined
through culture-dependent isolation method, and culture-independent methods
including stable-isotope probing (SIP) cum phospholipid fatty acid (PLFA) analysis
and next-generation sequencing (Table 2.3). Two independent studies (Arnold et al.,
1997; Greene & Voordouw, 2004), using culture-dependent isolation method, found
that bacterial isolates from the phylum Proteobacteria and Actinobacteria formed
part of the styrene-degrading community. At the genera level, styrene-degrading
species from Azospirillum, Pseudomonas, Alcaligenes (Proteobacteria), and
Rhodococcus (Actinobacteria) were isolated from soil contaminated with 3%
weight/weight (w/w) styrene and other aromatic hydrocarbons (Greene &
Voordouw, 2004). The genera of styrene-metabolizing bacterial isolates, from
styrene-degrading biofilter, were slightly different and included Pseudomonas,
Sphingomonas, Xanthomonas, an unidentified genus (Proteobacteria), and
Tsukamurella (Acintobacteria) (Arnold et al., 1997). While culture-dependent
isolation method could provide concrete evidence of the identity and functional role
of consortium member, it is inherently bias towards culturable bacteria. From these
two existing studies, it appears that Proteobacteria and Acintobacteria bacterial
members tend to dominate in isolation studies. Valuable information on less-
culturable, fastidious bacteria or unculturable bacteria is lost. Furthermore, isolation
studies do not provide any conclusive quantitative information on the abundance of
consortium member. Hence, it is not possible to infer the level of importance of
bacterial isolates within the styrene-degrading community.
It has been suggested that more than 99% of naturally-occurring microbes are
unculturable microbes (Amann et al., 1995), prompting the use of culture-
independent techniques for the study of styrene-degrading bacterial community.
One of the earliest studies was conducted by Alexandrino et al. (2001) on an
experimental and a full-scale styrene-degrading biofilter, using a combination of
SIP and PLFA. The group employed deuterated styrene (2[H]8 styrene) as a tracer
compound and investigated its eventual assimilation as bacterial phospholipid fatty
acid. PLFA was conducted to identify both isotope-labeled and unlabeled lipids. In
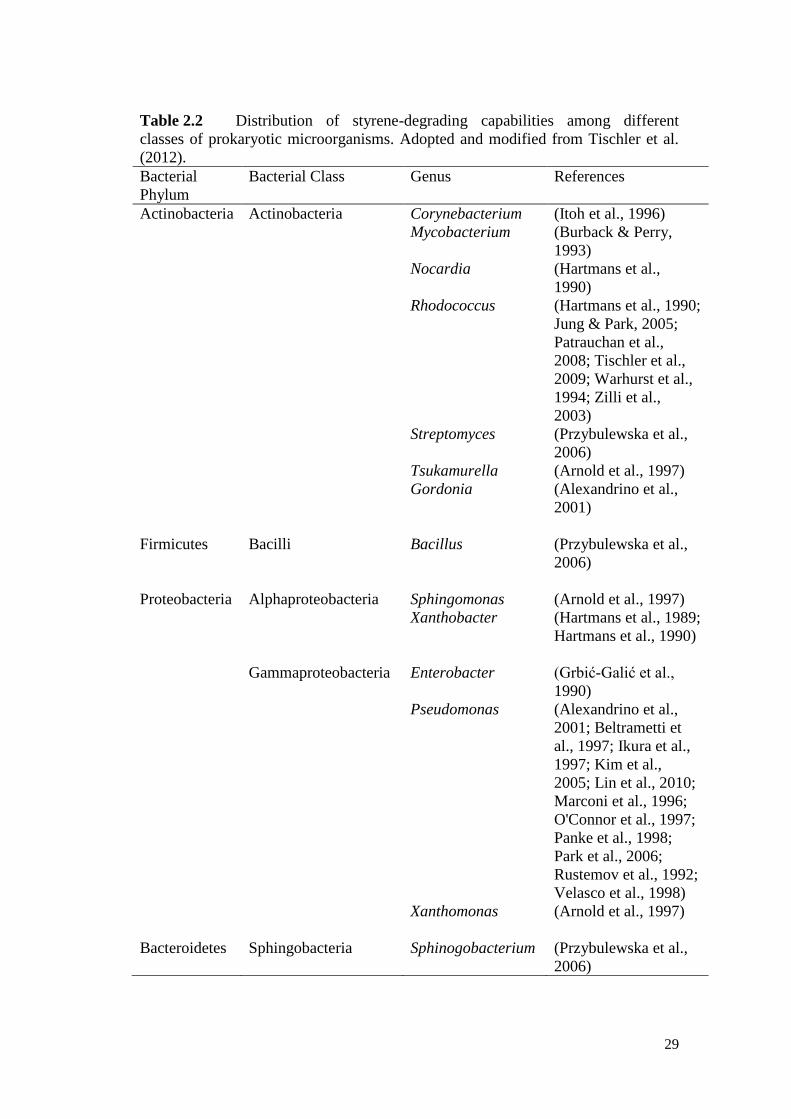
29
Table 2.2 Distribution of styrene-degrading capabilities among different
classes of prokaryotic microorganisms. Adopted and modified from Tischler et al.
(2012).
Bacterial
Phylum
Bacterial Class Genus References
Actinobacteria Actinobacteria Corynebacterium (Itoh et al., 1996)
Mycobacterium (Burback & Perry,
1993)
Nocardia (Hartmans et al.,
1990)
Rhodococcus (Hartmans et al., 1990;
Jung & Park, 2005;
Patrauchan et al.,
2008; Tischler et al.,
2009; Warhurst et al.,
1994; Zilli et al.,
2003)
Streptomyces (Przybulewska et al.,
2006)
Tsukamurella (Arnold et al., 1997)
Gordonia (Alexandrino et al.,
2001)
Firmicutes Bacilli Bacillus (Przybulewska et al.,
2006)
Proteobacteria Alphaproteobacteria Sphingomonas (Arnold et al., 1997)
Xanthobacter (Hartmans et al., 1989;
Hartmans et al., 1990)
Gammaproteobacteria Enterobacter (Grbić-Galić et al.,
1990)
Pseudomonas (Alexandrino et al.,
2001; Beltrametti et
al., 1997; Ikura et al.,
1997; Kim et al.,
2005; Lin et al., 2010;
Marconi et al., 1996;
O'Connor et al., 1997;
Panke et al., 1998;
Park et al., 2006;
Rustemov et al., 1992;
Velasco et al., 1998)
Xanthomonas (Arnold et al., 1997)
Bacteroidetes Sphingobacteria Sphinogobacterium (Przybulewska et al.,
2006)
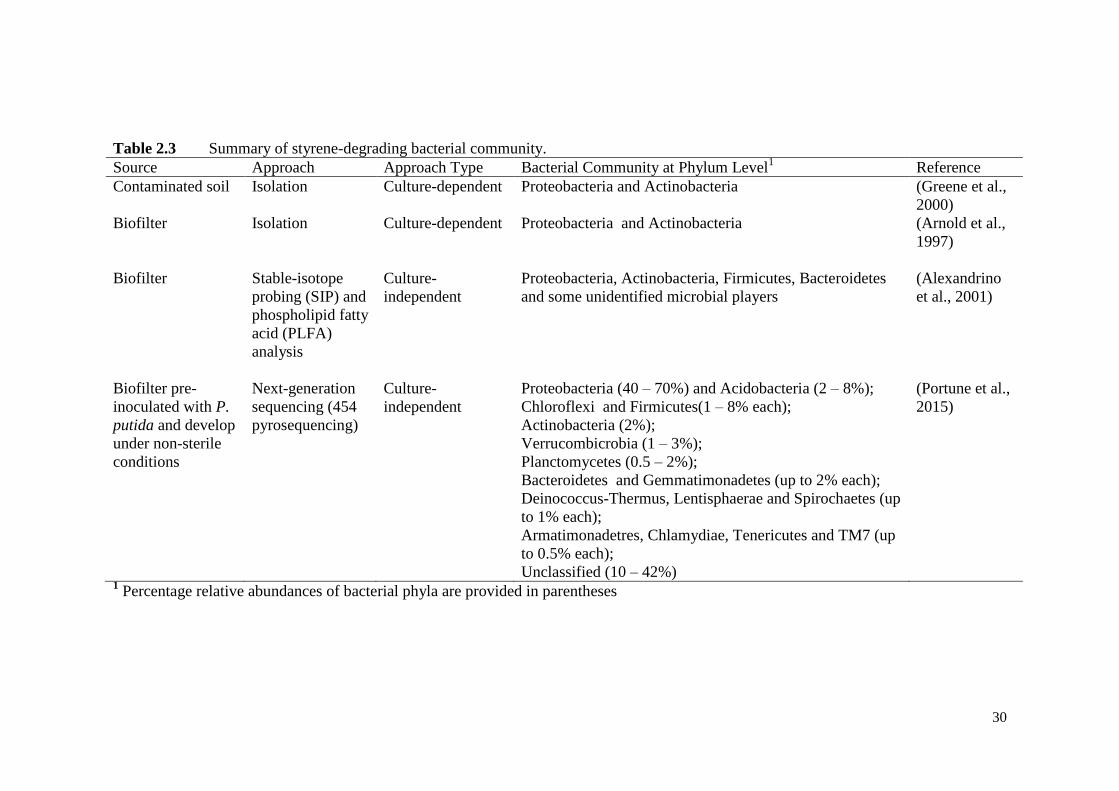
30
Table 2.3 Summary of styrene-degrading bacterial community.
Source Approach Approach Type Bacterial Community at Phylum Level1 Reference
Contaminated soil Isolation
Culture-dependent Proteobacteria and Actinobacteria
(Greene et al.,
2000)
Biofilter Isolation Culture-dependent
Proteobacteria and Actinobacteria
(Arnold et al.,
1997)
Biofilter Stable-isotope
probing (SIP) and
phospholipid fatty
acid (PLFA)
analysis
Culture-
independent
Proteobacteria, Actinobacteria, Firmicutes, Bacteroidetes
and some unidentified microbial players
(Alexandrino
et al., 2001)
Biofilter pre-
inoculated with P.
putida and develop
under non-sterile
conditions
Next-generation
sequencing (454
pyrosequencing)
Culture-
independent
Proteobacteria (40 – 70%) and Acidobacteria (2 – 8%);
Chloroflexi and Firmicutes(1 – 8% each);
Actinobacteria (2%);
Verrucombicrobia (1 – 3%);
Planctomycetes (0.5 – 2%);
Bacteroidetes and Gemmatimonadetes (up to 2% each);
Deinococcus-Thermus, Lentisphaerae and Spirochaetes (up
to 1% each);
Armatimonadetres, Chlamydiae, Tenericutes and TM7 (up
to 0.5% each);
Unclassified (10 – 42%)
(Portune et al.,
2015)
1 Percentage relative abundances of bacterial phyla are provided in parentheses
31
both experimental biofilter and full-scale biofilter, lipids that were characteristic of
bacterial members from the phyla Proteobacteria (Pasteurellaceae, Moraxellacea
and Xanthomonas), Actinobacteria (Microbacteriaceae, Streptomycetaceae and
Gordonia), Firmicutes (Bacillus-Staphylococcus group), and Bacteriodetes
(Bacteroides-Cytophaga) were detected, indicating the presence of these bacterial
members in biofilter consortia. However, isotope-labeled lipids were only detected
in some of these bacterial members. For the experimental biofilter, the highest
proportion of isotope labeling was found in Pseudomonas-like fatty acids (palmitic
acid [16:0], 9,10-methylenehexadecanoic acid [17:0 cyclo9-10], and vaccenic acid
[18:1 cis11]), indicating that styrene was most probably degraded by the genus
Pseudomonas. Interestingly, for the full-scale biofilter, isotope labeling was also
detected in Pseudomonas-like fatty acids but not at high levels. Instead, intensive
isotope labeling was observed for palmitic acid (16:0) and cis-11-hexadecenoic acid
(16:1 cis11), suggesting the presence of another unknown styrene-degrading taxon,
possibly microeukaryotes or bacterial taxa Pasteurellaceae. It was also interesting to
note that despite the presence of some known styrene-degraders such as
Xanthomonas spp. and Gordonia spp. in both biofilter samples, isotope
incorporation was not detected in their fatty acids. Hence, contrary to findings from
culture-dependent isolation studies, combined SIP and PLFA showed that some of
these known styrene-degraders do not appear to assimilate styrene directly when
they are part of a consortium. While SIP, used in conjunction with PLFA, was able
to offer in-situ information on active styrene-degraders within the microbial
community, some of the limitations of this method include the unequal
incorporation of isotope labels in fatty acids and the lack of a phylogenetic database,
which makes it less reliable for identifying quantifying and determining the
abundance of various consortium members. Additionally, this technique may not be
sufficiently sensitive to detect minor consortium members. Hence, gaining a
complete and precise picture of the microbial community structure is not possible.
The advent of next-generation sequencing, coupled by its decreasing cost, increased
analysis throughput, has made it an attractive option for microbial profiling studies.
At present, it is a technique that provides one of the most comprehensive and near
32
complete information about microbial community. Recently, Portune et al. (2015)
applied 454 pyrosequencing to study a styrene-degrading biofilter that was pre-
inoculated with a styrene-degrading P. putida strain. Despite pre-inoculation, a
complex microbial community developed after 80 days of operation. The styrene-
degrading microbial community was revealed to be a much more diverse
community compared to previous findings (Alexandrino et al., 2001; Arnold et al.,
1997; Greene & Voordouw, 2004). The research group observed that the system
was consistently dominated by the phyla Proteobacteria (40% to 70%) and a large
amount of bacterial sequences which could not be classified at the phylum level (10%
to 42%). Other more prominent phyla detected were Acidobacteria (2% to 8%),
Chloroflexi and Firmicutes (1% to 8% each), Actinobacteria (2%), Planctomycetes
(0.5% to 2%), Bacteroidetes and Gemmatimonadetes (up to 2% each). Minor phyla
such as Deinococcus-Thermus, Lentisphaerae, Spirochaetes, Armatimonadetres,
Chlamydiae, Tenericutes and TM7 were detected at low levels (less than 1%). At
the genera level, up to a total of 261 bacterial genera were detected, and among
them, Azoarcus, Pseudomonas and Brevundimonas had the highest relative
abundance (1% to 8% each). Canoical correspondence analysis (CCA), revealed
that many bacterial genera, including Pseudomonas, Brevundimonas,
Achromobacter and Hydrogenophaga, were positively associated with conditions of
increasing styrene outlet conditions, implying that they may play important roles in
styrene degradation under such conditions. Among them, a significant association
(p <0.05) were observed for genera Brevundimonas, Achromobacter and
Hydrogenophaga. Interestingly, styrene degradation has not been described in these
genera, but genetic evidence suggested that they possessed catabolic potential for
styrene degradation. Also noteworthy, is the observation that some known styrene-
degrading genera such as Rhodococcus, Xanthobacter, and Sphingomonas occurred
at low abundances (between less than 1% and 5%). Similar to the study by
Alexandrino et al. (2001), the study by Portune et al. (2015) provided additional
evidence to support the idea that some known styrene-degrading genera may not
necessary form the core styrene-assimilating population when they are part of a
consortium.
33
Collectively, these existing findings have yielded some interesting observations and
continue to refine the scientific understanding about styrene degraders, non-styrene-
degraders and their role in styrene-degrading community. Currently, the activated
sludge process is one of the most commonly applied aerobic methods for the
treatment of styrene wastewaters (Babaee et al., 2010; US EPA, 1974). Knowledge
of the aqueous styrene-degrading microbial community would facilitate seed sludge
selection, bioaugmentation and formulation of defined microbial cocktails to
enhance biological styrene removal. While studies on biofilter and contaminated
soil samples have shed some light on styrene-degrading microbial consortia, these
studies were limited to consortia from non-aqueous and semi-aqueous environments.
There is currently a lack of understanding on the styrene-degrading microbial
consortia present in aqueous environment. Furthermore, it has been reported that
styrene-degrading microbial communities would evolve differently to adapt to
various environs (Tresse et al., 2002). Hence, the existing information may not
accurately reflect the microbial population in aqueous environments. Examination
of the aqueous styrene-degrading microbial community is therefore necessary.
2.1.5 Styrene degradation pathways
Styrene could be degraded through either aerobic or anaerobic pathways. The
aerobic biodegradation of styrene is known to occur via either the direct ring
cleavage pathway or side-chain oxidation pathway (Figure 2.2). In the direct ring
cleavage pathway, oxygen atoms are added directly to the aromatic nucleus through
a dioxygenation process, catalyzed by styrene 2,3-dioxygenase (SDO), to form a
styrene cis-glycol. The cis-glycol is subsequently re-aromatization to 3-
vinylcatechol by styrene 2,3-dihydrodiol dehydrogenase (SDD). 3-vinylcatechol
undergoes ring cleavage at either the meta or ortho position to yield 2-vinyl-cis,cis-
muconic acid and 2-hydroxy-6-oxoocta-2,4,7-trienoic acid before entering the
central metabolic pathways. In the side-chain oxidation pathway, styrene first
undergoes oxygenation, catalyzed by styrene monooxygenase (SMO), to form
styrene oxide. Styrene oxide is highly unstable and is rapidly isomerized to
phenylacetaldehyde by styrene oxide isomerase (SOI) and further converted to
phenylacetic acid by phenylacetaldehyde dehydrogenase (PAD). In an alternative
34
side-chain oxidation pathway, the styrene oxide is hydrolyzed by epoxide hydrolase
(EH) to form phenyl-1,2-diol, followed by subsequent oxidation to mandelic acid
and decarboxylation to benzoate.
In comparison to aerobic pathway, the anaerobic pathway for styrene degradation is
less well-studied. However, three hypothetical pathways, involving the
phenylacetate and 2-ethylphenol intermediates, have been proposed (Grbić-Galić et
al., 1990) (Figure 2.3). In the phenylacetate route, oxygen was added to the side
chain group of styrene by hydratase-catalyzed addition of water to form 2-
phenylethanol. The compound is further oxidized by a series of dehydrogenases to
form phenylacetaldehyde, followed by phenylacetate. In the 2-ethylphenol route, a
hydroxyl group is added to the aromatic ring of styrene through water-mediated
hydroxylation to form 2-ethylphenol. The compound subsequently either undergoes
ring cleavage to form 2-ethylhexanol or side-chain oxidation to form 2-
hydroxyphenyl-acetic acid.
2.1.6 Up-recycling of styrene to value-added products
The application of bacterial biomass as whole-cell catalyst for bioconverting styrene
to valuable products has a relatively young history of 30 years but has gained much
momentum since its inception. The production of a commercially valuable product
from styrene biotransformation was first demonstrated for styrene oxide in 1970s,
followed by 3-vinylcatechol in 1990s, and PHAs in 2005 (Ward et al., 2005;
Warhurst & Fewson, 1994).
Styrene oxide and 3-vinylcatechol are metabolic intermediates formed during
styrene catabolism through the side-oxidation pathway and direct-ring cleavage
pathway respectively (Tischler & Kaschabek, 2012). Styrene oxide is an important
starting monomer for the chemical synthesis of pharmaceutical drugs such as
nematocide levamisole (Panke et al., 2000). The production of styrene oxide from
styrene has been reported in Mycobacterium sp. E3 and many Pseudomonads
including P. putida mt-2, P. putida F1, P. putida S12, and Pseudomonas sp.
VLB120 (Mooney et al., 2006; Panke et al., 1998). Similar to styrene oxide,
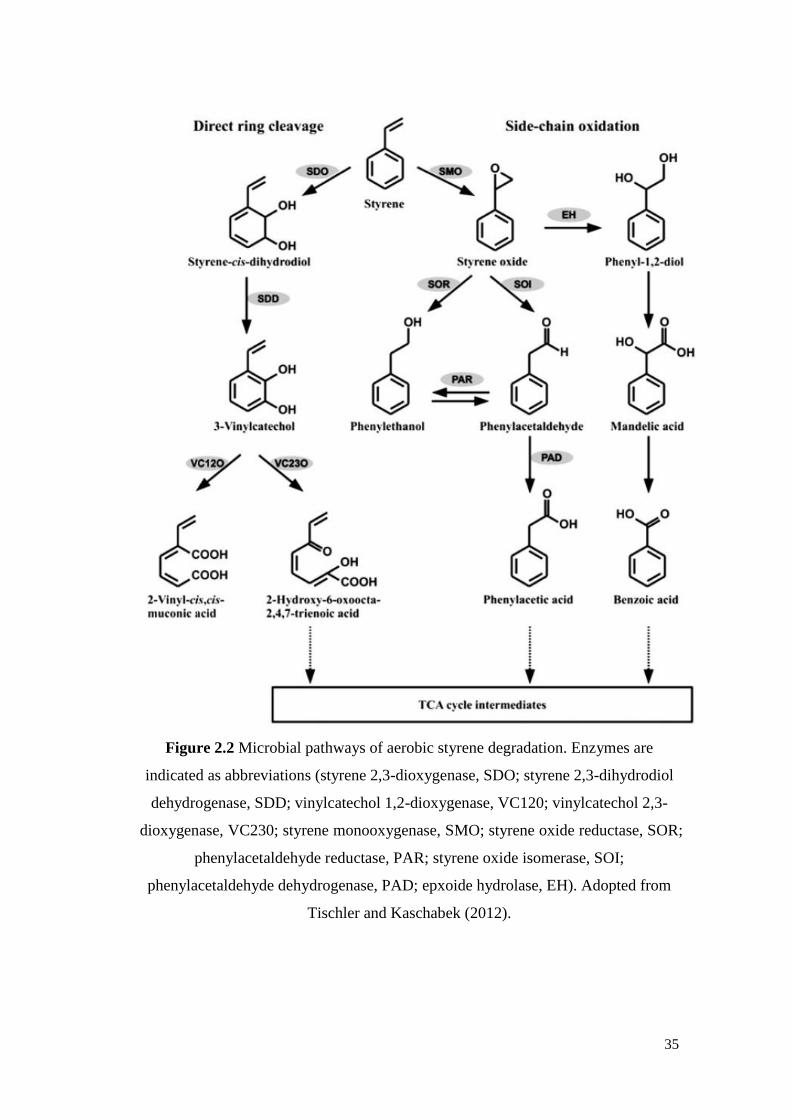
35
Figure 2.2 Microbial pathways of aerobic styrene degradation. Enzymes are
indicated as abbreviations (styrene 2,3-dioxygenase, SDO; styrene 2,3-dihydrodiol
dehydrogenase, SDD; vinylcatechol 1,2-dioxygenase, VC120; vinylcatechol 2,3-
dioxygenase, VC230; styrene monooxygenase, SMO; styrene oxide reductase, SOR;
phenylacetaldehyde reductase, PAR; styrene oxide isomerase, SOI;
phenylacetaldehyde dehydrogenase, PAD; epxoide hydrolase, EH). Adopted from
Tischler and Kaschabek (2012).
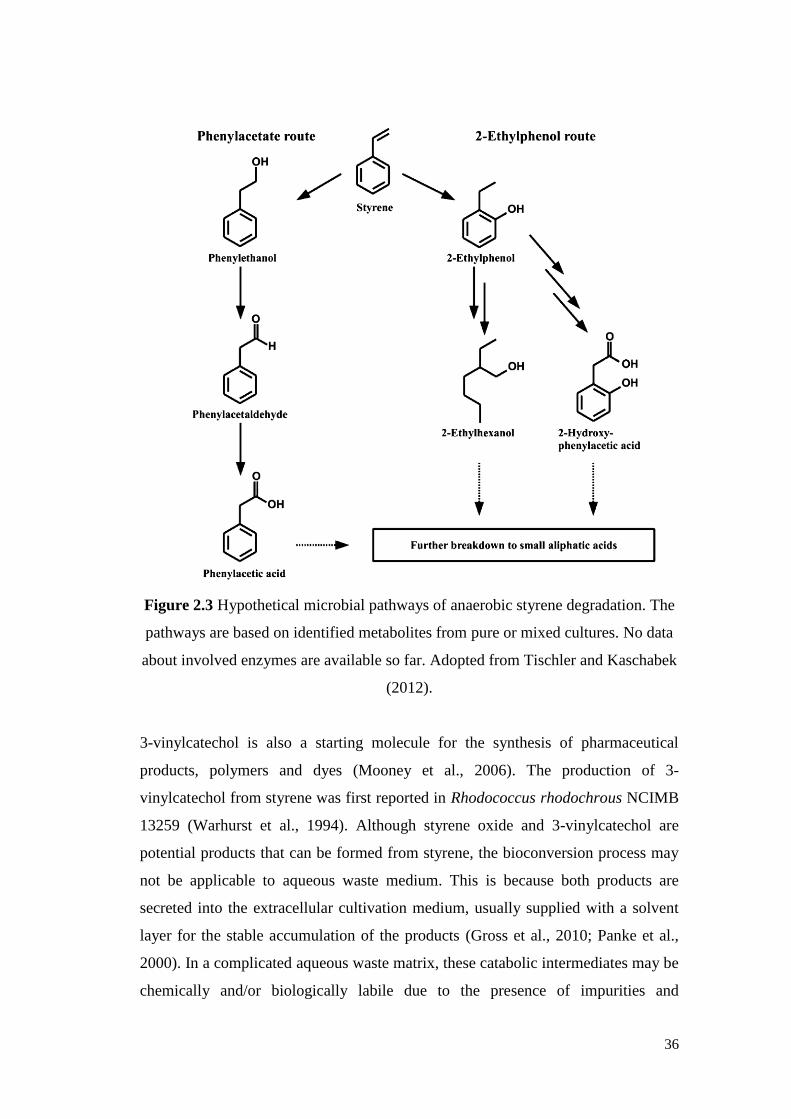
36
Figure 2.3 Hypothetical microbial pathways of anaerobic styrene degradation. The
pathways are based on identified metabolites from pure or mixed cultures. No data
about involved enzymes are available so far. Adopted from Tischler and Kaschabek
(2012).
3-vinylcatechol is also a starting molecule for the synthesis of pharmaceutical
products, polymers and dyes (Mooney et al., 2006). The production of 3-
vinylcatechol from styrene was first reported in Rhodococcus rhodochrous NCIMB
13259 (Warhurst et al., 1994). Although styrene oxide and 3-vinylcatechol are
potential products that can be formed from styrene, the bioconversion process may
not be applicable to aqueous waste medium. This is because both products are
secreted into the extracellular cultivation medium, usually supplied with a solvent
layer for the stable accumulation of the products (Gross et al., 2010; Panke et al.,
2000). In a complicated aqueous waste matrix, these catabolic intermediates may be
chemically and/or biologically labile due to the presence of impurities and
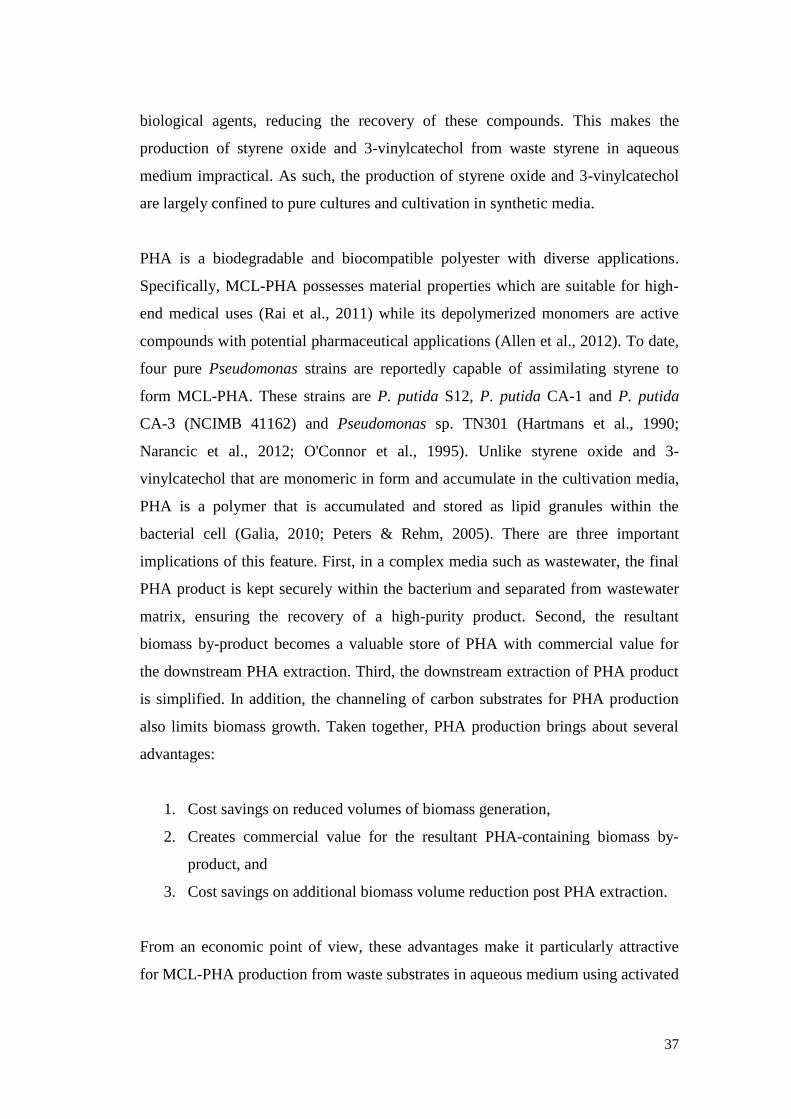
37
biological agents, reducing the recovery of these compounds. This makes the
production of styrene oxide and 3-vinylcatechol from waste styrene in aqueous
medium impractical. As such, the production of styrene oxide and 3-vinylcatechol
are largely confined to pure cultures and cultivation in synthetic media.
PHA is a biodegradable and biocompatible polyester with diverse applications.
Specifically, MCL-PHA possesses material properties which are suitable for high-
end medical uses (Rai et al., 2011) while its depolymerized monomers are active
compounds with potential pharmaceutical applications (Allen et al., 2012). To date,
four pure Pseudomonas strains are reportedly capable of assimilating styrene to
form MCL-PHA. These strains are P. putida S12, P. putida CA-1 and P. putida
CA-3 (NCIMB 41162) and Pseudomonas sp. TN301 (Hartmans et al., 1990;
Narancic et al., 2012; O'Connor et al., 1995). Unlike styrene oxide and 3-
vinylcatechol that are monomeric in form and accumulate in the cultivation media,
PHA is a polymer that is accumulated and stored as lipid granules within the
bacterial cell (Galia, 2010; Peters & Rehm, 2005). There are three important
implications of this feature. First, in a complex media such as wastewater, the final
PHA product is kept securely within the bacterium and separated from wastewater
matrix, ensuring the recovery of a high-purity product. Second, the resultant
biomass by-product becomes a valuable store of PHA with commercial value for
the downstream PHA extraction. Third, the downstream extraction of PHA product
is simplified. In addition, the channeling of carbon substrates for PHA production
also limits biomass growth. Taken together, PHA production brings about several
advantages:
1. Cost savings on reduced volumes of biomass generation,
2. Creates commercial value for the resultant PHA-containing biomass by-
product, and
3. Cost savings on additional biomass volume reduction post PHA extraction.
From an economic point of view, these advantages make it particularly attractive
for MCL-PHA production from waste substrates in aqueous medium using activated
38
sludge. MCL-PHA recovery may off-set treatment operation cost and cost
associated with post-operation sludge management. Previous studies by Hartmans et
al. (1990) and Ward et al. (2005), demonstrating the technical feasibility of
bioconverting styrene to MCL-PHA by Pseudomonads pure strains, provide a
promising start for MCL-PHA production from styrene waste under aqueous
medium. PHA is discussed in greater depth in the following Section 2.2.
2.2 Polyhydroxyalkanoate (PHA)
PHA is a biopolyester produced by some bacteria strains and was first discovered
by Lemogine in 1926 (Anderson & Dawes, 1990). The PHA-producing bacteria,
also termed as “PHA accumulators” usually synthesize PHA under nutrients stress
conditions where an essential nutrient (e.g., nitrogen, phosphorus, etc) is limiting in
the presence of excess carbon (Mooney et al., 2006). The excess carbons are
bioaccumulated as PHA and stored in the form of intracellular lipid granules. PHA
in turn acts as an energy reserve and promotes the long-term survival of PHA
accumulators (Kadouri et al., 2005).
At a molecular level, PHA polymer is composed of (R)-β-hydroxy fatty acids
monomer. A PHA molecule is typically made up of 600 to 35,000 monomer units
(Khanna & Srivastava, 2005) and has a molecular mass between 50,000 and
1,000,000 Da (Madison & Huisman, 1999). These monomers, also termed as “PHA
monomers” harbor a functional R group. The R group is usually a saturated alkyl
group that varies from methyl (C1) to pentadecyl (C15) (Figure 2.4) (Tan et al.,
2014b). SCL-PHA, MCL-PHA and LCL-PHA comprises of PHA monomers
between 3 to 5 carbon atoms, 6 to 14 carbon atoms and 15 or more carbon atoms,
respectively, (Khanna & Srivastava, 2005). Apart from saturated alkyl groups,
functional R groups can also take the form of unsaturated alkyl groups, branched
alkyl groups, substituted alkyl groups although these forms are less common (Zinn
et al., 2001).
2.2.1 Current analytical methods for PHA detection and quantification
Various methods are available for the detection and analysis of intracellular
39
Figure 2.4 Chemical structure and nomenclature of PHA. Adopted from Tan et al.
(2014b).
microbial PHA. These methods include colony/cell staining, crotonic acid assay,
FTIR, chromatography-based analysis. Colony/cell staining is often used as a front-
line method for high throughput screening and identification of novel microbes with
PHA production potential owing to the relative ease of sample preparation and short
analysis time. In colony/cell staining method, Nile red or Nile blue A dye is directly
added into the solid growth medium (Spiekermann et al., 1999), liquid cell cultures
(Melnicki et al., 2009; Wu et al., 2003) or onto heat-fixed smeared cells (Ostle &
Holt, 1982). Under UV illumination, Nile red and Nile blue A dye stains PHA to
give a pink/red/yellow/orange appearance enabling the PHA-producing microbes to
be identified and isolated. Although staining method provide a simple way to screen
for PHA-producing microbes efficiently, this methods is also prone to detection
errors. False positives may arise from the staining of other non-PHA lipid storage
compounds (Spiekermann et al., 1999). Hence, this method could only be employed
as a presumptive test of PHA production potential. Another downside of this
40
method is that it can neither quantify PHA nor provide qualitative information about
PHA monomeric composition.
Conversely, crotonic acid assay, FTIR and chromatography-based analysis methods
could provide quantitative and qualitative information about PHA, but to varying
extents. Crotonic acid assay was one of the earliest PHA quantitation methods
developed (Law & Slepecky, 1961; Slepecky & Law, 1960; Ward & Dawes, 1973)
but it is limited to SCL-PHA (i.e., P3HB) determination and is prone to
overestimation (Karr et al., 1983; Valappil et al., 2007). FTIR, on the other hand,
has been applied to detect and distinguish between the different types of PHA (i.e.,
SCL-PHA, MCL-PHA, and SCL-MCL-PHA), present within intact cells or as
purified polymers. Characteristic ester carbonyl band for intracellular SCL-PHA,
MCL-PHA, and SCL-MCL-PHA were observed at 1732 cm-1
, 1744 cm-1
and 1739
cm-1
, respectively, whereas the same band for purified polymer SCL-PHA, MCL-
PHA, and SCL-MCL-PHA were observed at 1728 cm-1
, 1740 cm-1
and 1732 cm-1
,
respectively (Hong et al., 1999). The solvent-less nature of the FTIR technique and
short analysis time eliminates risk exposure to hazardous chemicals while providing
fast data output. However, FTIR-based methods have lower detection sensitivities,
are inapt at describing or detecting changes in PHA monomeric composition, and
cannot discriminate between PHA blends and copolymers (Hong et al., 1999).
Hence, FTIR-based methods tend to be more suitable for routine monitoring of
PHA production for standard bioprocesses with well-characterized PHA products.
LC- and GC-based methods are the most frequently used analytical technique due to
automated sample analysis, and the ability to provide accurate PHA quantification
and qualitative information about PHA monomeric composition. Compared to
FTIR-based methods, chromatography-based methods have higher detection
sensitivities ranging from 0.014 to 14 μg for HPLC and 0.05 pg to 15 mg for GC
depending on the type of detectors and chemical derivatization methods used (de
Rijk et al., 2005). At present, GC remains the preferred method for qualitative and
quantitative analysis of PHA monomers owing to its high separation power and
detection sensitivity (de Rijk et al., 2005). One of the earliest works on GC
41
determination of PHA was reported by Braunegg et al. (1978), who developed a
method for accurate and reproducible determination of P3HB content in bacterial
biomass using GC-FID. They showed that after subjecting P3HB-containing
bacterial biomass to methanolysis, P3HB could be completely recovered in the form
of its methyl esters derivatives and quantified to levels as low as 10-5
g.L-1
. GC-FID
analysis was subsequently expanded to poly(3-hydroxyvalerate) (P3HV) and MCL-
PHA (Comeau et al., 1988; Lageveen et al., 1988). The robustness of GC-FID
determination however, is dependent on the inclusion of appropriate PHA analytical
standards. Conversely, GC-MS ensures more reliable detection, identity
confirmation and quantification of PHA monomers, as well as enables tentative
identification of novel PHA monomers in the absence of analytical standards
(Grubelnik et al., 2008; Lee & Choi, 1995). Nevertheless, GC-MS can only provide
a tentative identification of PHA. Further validation using suitable PHA analytical
standards is still essential in ensuring the accuracy of the detection method.
However, there is currently a lack of PHA analytical standards to represent the wide
chemical diversity of PHA monomers. System calibration is costly and also presents
significant workload, particularly for PHA polymers such as MCL-PHA and LCL-
PHA which may comprise of up to 9 or more PHA monomers. This has made PHA
analysis a particularly challenging task (Escapa et al., 2011; Furrer et al., 2007).
Some researchers attempted to overcome these problems through using a
combination of GC-MS (for tentative identification of PHA monomers) and GC-
FID (for the routine quantification of PHA monomers identified by GC-MS) (Ward
et al., 2006) to keep calibration workload manageable and calibration cost low;
chemically or biologically-synthesize PHA analytical standards that are
commercially unavailable (Sun et al., 2009); using commercially-available PHA
analytical standards to quantify chemically-similar but commercially-unavailable
PHA monomers (Oehmen et al., 2005). However, these measures can lead to errors
in measurements, and can be a tedious, time-consuming and expensive process.
Hence, there is a need to develop a simple GC-MS calibration method which
minimizes calibration workload and cost while enabling the analysis of a wide
range of PHA monomers even with a limited inventory of PHA analytical standards.
42
2.2.2 Properties and applications of PHA
As a polymeric material, PHA is completely biodegradable. PHA‟s biodegradation
has been observed in various environs including anaerboic sewage, sea water (Choi
& Lee, 1999), lake (Brandl & Püchner, 1991) and soil (Kim et al., 2000). PHA is
also a biocompatible material because it is a product of cell metabolism and its
biodegradation by-product, (R)-β-hydroxy fatty acid, is usually present as a soluble
component in blood (Zinn et al., 2001). This was further evinced by in vivo studies
where implantation of PHA material was made in rabbits and mice for a 6-month
period without eliciting inflammation response (Pouton & Akhtar, 1996; Qu et al.,
2006). The biodegradability and compatibility features make PHA a commercially-
valuable material. Coupled with the variable functional R group, the family of
PHAs exhibit a wide variety of physical-mechanical properties, ranging from hard
crystalline to elastic. For an example, SCL-PHAs typically have a glass to rubber
transition temperature (Tg) of -48 °C to 4 °C and a crystalline phase melting
temperature (Tm) of 53 °C to 180 °C (Lu et al., 2009). This meant that SCL-PHAs
tend to be more crystalline and exhibit thermoplastic properties. On the other hand,
MCL-PHAs generally have lower Tg values between -50 °C and 26 °C, and lower
Tm values between 42 and 67 °C (Rai et al., 2011; Zinn, 2010) giving MCL-PHAs
their elastomeric properties. The low stiffness and high flexibility of MCL-PHAs
makes them suitable for soft tissue regeneration such as heart valves, cardiac
patches, scaffold for tissue engineering, surgical sutures, stents and controlled drug
delivery matrices (Rai et al., 2011). MCL-PHA monomers, arising from the
depolymerization of MCL-PHA, are also know to exhibit antimicrobial activity and
serve as a platform for the production of a plethora of pharmaceutical products
including fungicides, flavors, pheromones, vitamins and etc (Allen et al., 2012).
Apart from medical and pharmaceutical applications, MCL-PHAs are also used in
plastic coatings and pressure sensitive adhesives (Madison & Huisman, 1999).
To date, although many types of PHA have been identified, only four types of PHA
are produced industrially. These PHAs are P3HB, P3HB-3HV, poly(3-
hydroxbutyrate-co-4-hydroxybutyrate) (P3HB4HB), and poly(3-hydroxbutyrate-co-
3-hydroxyhexanoate) (P3HBHHx) (Chen, 2010a). With the exception of P3HB-
43
HHx, which is a copolymer of SCL monomers and MCL monomers, all other
commercial PHAs are SCL-PHAs. Despite the potential applications of other non-
SCL-PHAs including MCL-PHA, their commercialization is hindered due to high
production cost. It has been estimated that at least 30% or more of PHA cost is
attributed to carbon and nutrients cost (Choi & Lee, 1999). This has led to an
interest to explore different carbon sources for PHA production as a means to
economically produce MCL-PHA and other types of non-SCL-PHA.
2.2.3 PHA-producing bacteria and carbon sources for PHA production
The feasibility of a carbon source as a feed substrate for PHA biosynthesis is largely
bacterial-dependent. This is so because the successful bioconversion of any carbon
source to PHA needs to fulfill two criteria: (1) Whether the bacteria possess the
relevant metabolic pathways for assimilation of the targeted carbon source, and (2)
whether the bacteria harbor the gene phaC, which encodes PHA synthase enzyme,
for PHA synthesis. If only the first criterion is met, carbon utilization will occur
without PHA accumulation. Conversely, if only the second criterion is met, despite
harboring the phaC gene, bacteria are unlikely to grow or accumulate PHA.
To date, PHA production has been reported in more than 100 bacterial genera
(Table 2.4) (Koller et al., 2010), of which species are commercially available from
culture collections (Tan et al., 2014b). Acting as biocatalysts, these PHA-producing
microorganisms enable the coupling of a myriad of carbon catabolic pathways
together with PHA anabolic pathways, thereby playing a key role in the
diversification of PHA production from various carbon sources. These carbon
sources include saccharides (e.g., fructose, maltose, lactose, xylose, arabinose, etc.),
n-alkanes (e.g., hexane, octane, dodecane, etc.), n-alkanoic acids (e.g., acetic acid,
propionoic acid, butyric acids, valeric acid, lauric acid, oleic acid, etc.), n-alcohols
(e.g.. methanol, ethanol, octanol, glycerol, etc.), and gases (e.g., methane, carbon
dioxide) (Anderson & Dawes, 1990; Tan et al., 2014b; Verlinden et al., 2007).
Wastestreams, which provide a free source of carbons, have also been identified for
PHA production (Koller et al., 2010). These include waste frying oil, vinegar waste,
waste fats, food waste, agricultural waste, domestic wastewater, plant oil mill
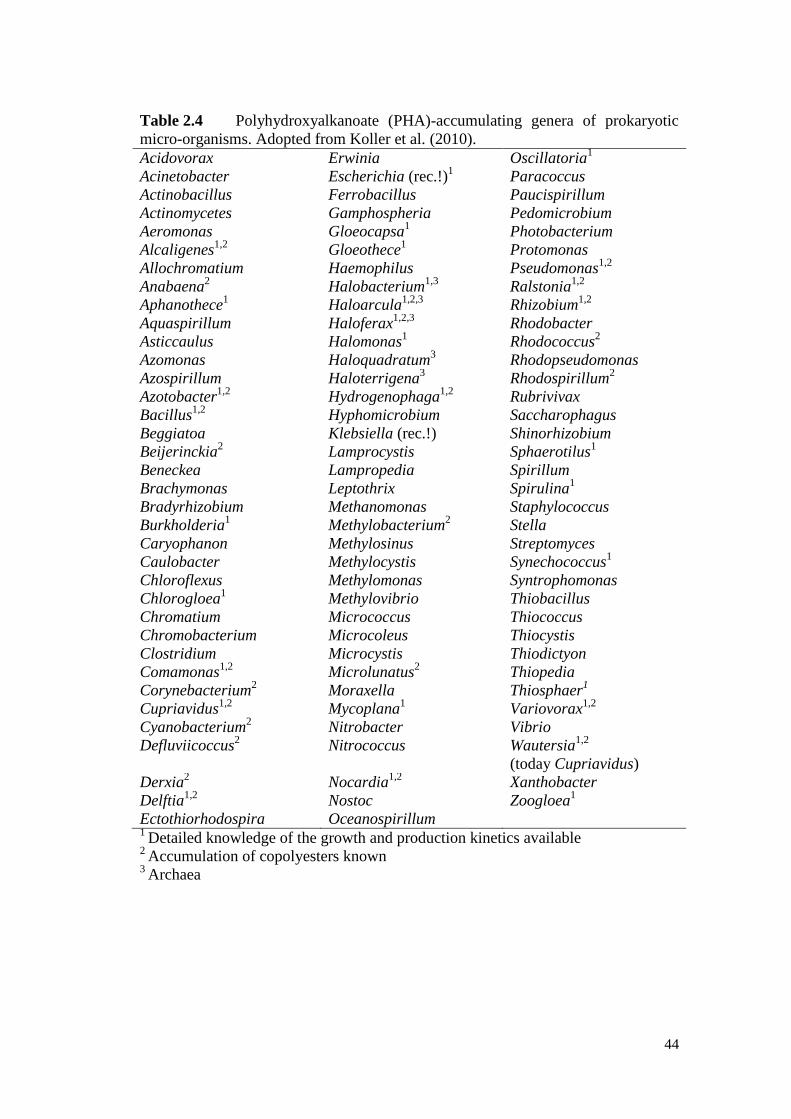
44
Table 2.4 Polyhydroxyalkanoate (PHA)-accumulating genera of prokaryotic
micro-organisms. Adopted from Koller et al. (2010).
Acidovorax Erwinia Oscillatoria1
Acinetobacter Escherichia (rec.!)1 Paracoccus
Actinobacillus Ferrobacillus Paucispirillum
Actinomycetes Gamphospheria Pedomicrobium
Aeromonas Gloeocapsa1 Photobacterium
Alcaligenes1,2
Gloeothece1 Protomonas
Allochromatium Haemophilus Pseudomonas1,2
Anabaena2 Halobacterium
1,3 Ralstonia
1,2
Aphanothece1 Haloarcula
1,2,3 Rhizobium
1,2
Aquaspirillum Haloferax1,2,3
Rhodobacter
Asticcaulus Halomonas1 Rhodococcus
2
Azomonas Haloquadratum3 Rhodopseudomonas
Azospirillum Haloterrigena3 Rhodospirillum
2
Azotobacter1,2
Hydrogenophaga1,2
Rubrivivax
Bacillus1,2
Hyphomicrobium Saccharophagus
Beggiatoa Klebsiella (rec.!) Shinorhizobium
Beijerinckia2 Lamprocystis Sphaerotilus
1
Beneckea Lampropedia Spirillum
Brachymonas Leptothrix Spirulina1
Bradyrhizobium Methanomonas Staphylococcus
Burkholderia1
Methylobacterium2 Stella
Caryophanon Methylosinus Streptomyces
Caulobacter Methylocystis Synechococcus1
Chloroflexus Methylomonas Syntrophomonas
Chlorogloea1 Methylovibrio Thiobacillus
Chromatium Micrococcus Thiococcus
Chromobacterium Microcoleus Thiocystis
Clostridium Microcystis Thiodictyon
Comamonas1,2
Microlunatus2 Thiopedia
Corynebacterium2 Moraxella Thiosphaer
1
Cupriavidus1,2
Mycoplana1 Variovorax
1,2
Cyanobacterium2 Nitrobacter Vibrio
Defluviicoccus2 Nitrococcus Wautersia
1,2
(today Cupriavidus)
Derxia2 Nocardia
1,2 Xanthobacter
Delftia1,2
Nostoc Zoogloea1
Ectothiorhodospira Oceanospirillum 1
Detailed knowledge of the growth and production kinetics available 2
Accumulation of copolyesters known 3
Archaea
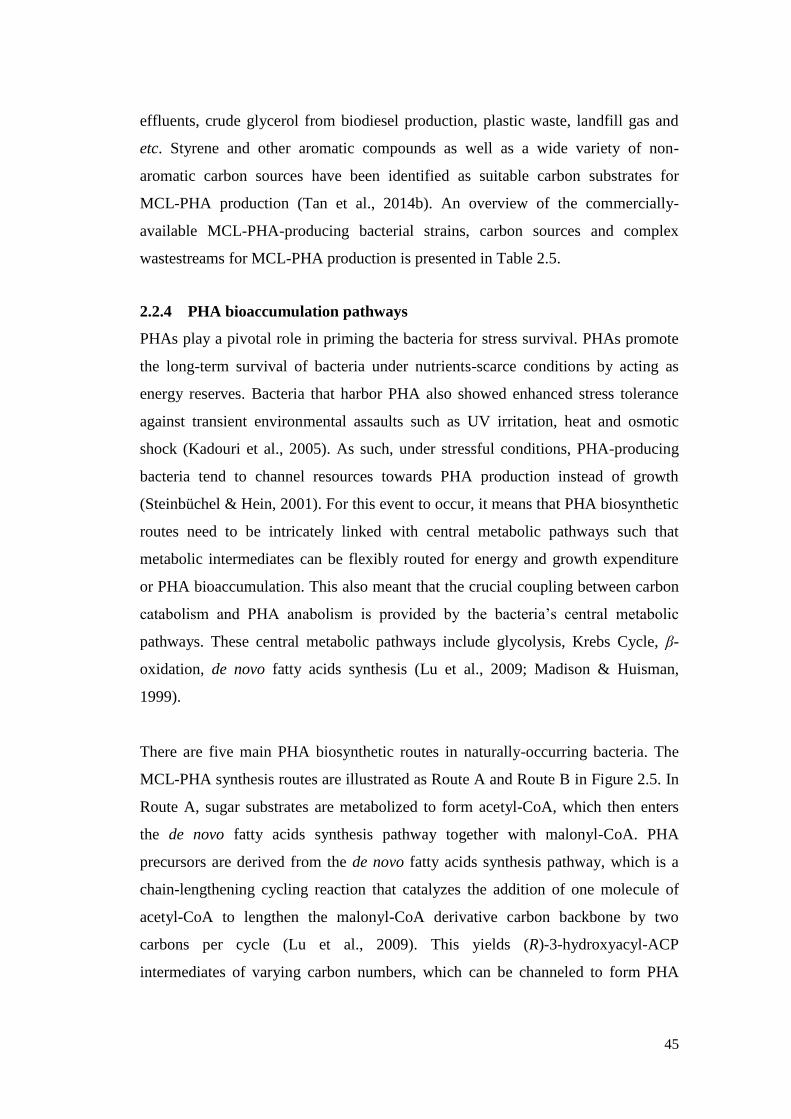
45
effluents, crude glycerol from biodiesel production, plastic waste, landfill gas and
etc. Styrene and other aromatic compounds as well as a wide variety of non-
aromatic carbon sources have been identified as suitable carbon substrates for
MCL-PHA production (Tan et al., 2014b). An overview of the commercially-
available MCL-PHA-producing bacterial strains, carbon sources and complex
wastestreams for MCL-PHA production is presented in Table 2.5.
2.2.4 PHA bioaccumulation pathways
PHAs play a pivotal role in priming the bacteria for stress survival. PHAs promote
the long-term survival of bacteria under nutrients-scarce conditions by acting as
energy reserves. Bacteria that harbor PHA also showed enhanced stress tolerance
against transient environmental assaults such as UV irritation, heat and osmotic
shock (Kadouri et al., 2005). As such, under stressful conditions, PHA-producing
bacteria tend to channel resources towards PHA production instead of growth
(Steinbüchel & Hein, 2001). For this event to occur, it means that PHA biosynthetic
routes need to be intricately linked with central metabolic pathways such that
metabolic intermediates can be flexibly routed for energy and growth expenditure
or PHA bioaccumulation. This also meant that the crucial coupling between carbon
catabolism and PHA anabolism is provided by the bacteria‟s central metabolic
pathways. These central metabolic pathways include glycolysis, Krebs Cycle, β-
oxidation, de novo fatty acids synthesis (Lu et al., 2009; Madison & Huisman,
1999).
There are five main PHA biosynthetic routes in naturally-occurring bacteria. The
MCL-PHA synthesis routes are illustrated as Route A and Route B in Figure 2.5. In
Route A, sugar substrates are metabolized to form acetyl-CoA, which then enters
the de novo fatty acids synthesis pathway together with malonyl-CoA. PHA
precursors are derived from the de novo fatty acids synthesis pathway, which is a
chain-lengthening cycling reaction that catalyzes the addition of one molecule of
acetyl-CoA to lengthen the malonyl-CoA derivative carbon backbone by two
carbons per cycle (Lu et al., 2009). This yields (R)-3-hydroxyacyl-ACP
intermediates of varying carbon numbers, which can be channeled to form PHA
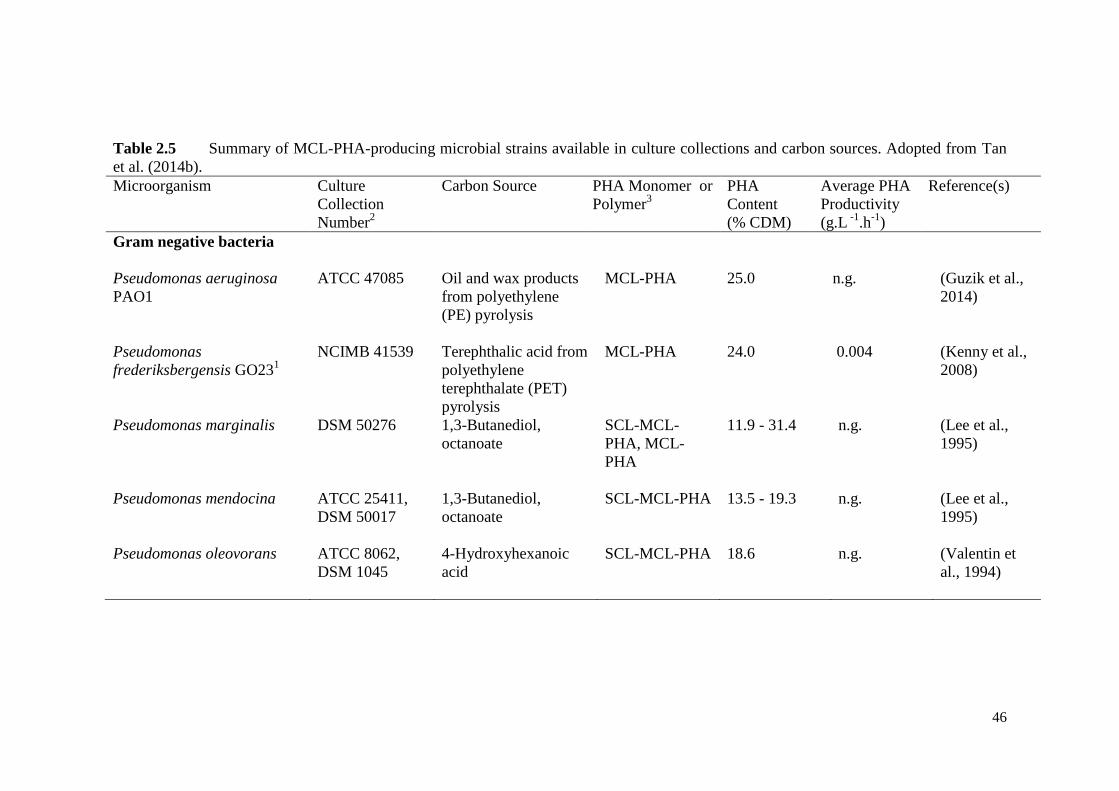
46
Table 2.5 Summary of MCL-PHA-producing microbial strains available in culture collections and carbon sources. Adopted from Tan
et al. (2014b).
Microorganism
Culture
Collection
Number2
Carbon Source PHA Monomer or
Polymer3
PHA
Content
(% CDM)
Average PHA
Productivity
(g.L -1
.h-1
)
Reference(s)
Gram negative bacteria
Pseudomonas aeruginosa
PAO1
ATCC 47085 Oil and wax products
from polyethylene
(PE) pyrolysis
MCL-PHA 25.0 n.g. (Guzik et al.,
2014)
Pseudomonas
frederiksbergensis GO231
NCIMB 41539 Terephthalic acid from
polyethylene
terephthalate (PET)
pyrolysis
MCL-PHA 24.0 0.004 (Kenny et al.,
2008)
Pseudomonas marginalis DSM 50276 1,3-Butanediol,
octanoate
SCL-MCL-
PHA, MCL-
PHA
11.9 - 31.4 n.g. (Lee et al.,
1995)
Pseudomonas mendocina ATCC 25411,
DSM 50017
1,3-Butanediol,
octanoate
SCL-MCL-PHA 13.5 - 19.3 n.g. (Lee et al.,
1995)
Pseudomonas oleovorans ATCC 8062,
DSM 1045
4-Hydroxyhexanoic
acid
SCL-MCL-PHA 18.6 n.g. (Valentin et
al., 1994)
47
Table 2.5 Cont.
Pseudomonas putida CA-31 NCIMB 41162 Styrene
MCL-PHA 31.8 0.063 (Nikodinovic-
Runic et al.,
2011)
Styrene from
polystyrene (PS)
pyrolysis
MCL-PHA 36.4 0.033 (Ward et al.,
2006)
Pseudomonas putida GO161 NCIMB 41538 Terephthalic acid from
polyethylene
terephthalate (PET)
pyrolysis
MCL-PHA 27.0 ~0.005,
0.0084
(Kenny et al.,
2008)
Pseudomonas putida GO191 NCIMB 41537 Terephthalic acid from
polyethylene
terephthalate (PET)
pyrolysis
MCL-PHA 23.0 ~0.005,
0.0084
(Kenny et al.,
2008)
Pseudomonas putida GPo1
(formerly Pseudomonas
oleovorans)
ATCC 29347 1-Alkenes, n-alkanes MCL-PHA 2.0 - 28.0 n.g. (Lageveen et
al., 1988)
n-alkanoates SCL-MCL-
PHA, MCL-
PHA
5.0 - 60.0 n.g. (Elbahloul &
Steinbuchel,
2009; Gross
et al., 1989)
Pseudomonas putida
KT2440
ATCC 47054 Nonanoic acid MCL-PHA 26.8 - 75.4 0.250 - 1.110
(Z. Sun et al.,
2007)
4-hydroxyhexanoic
acid
MCL-PHA 25.3 - 29.8 n.g. (Valentin et
al., 1994)
Glucose
MCL-PHA 32.1 0.006 (Davis et al.,
2013)
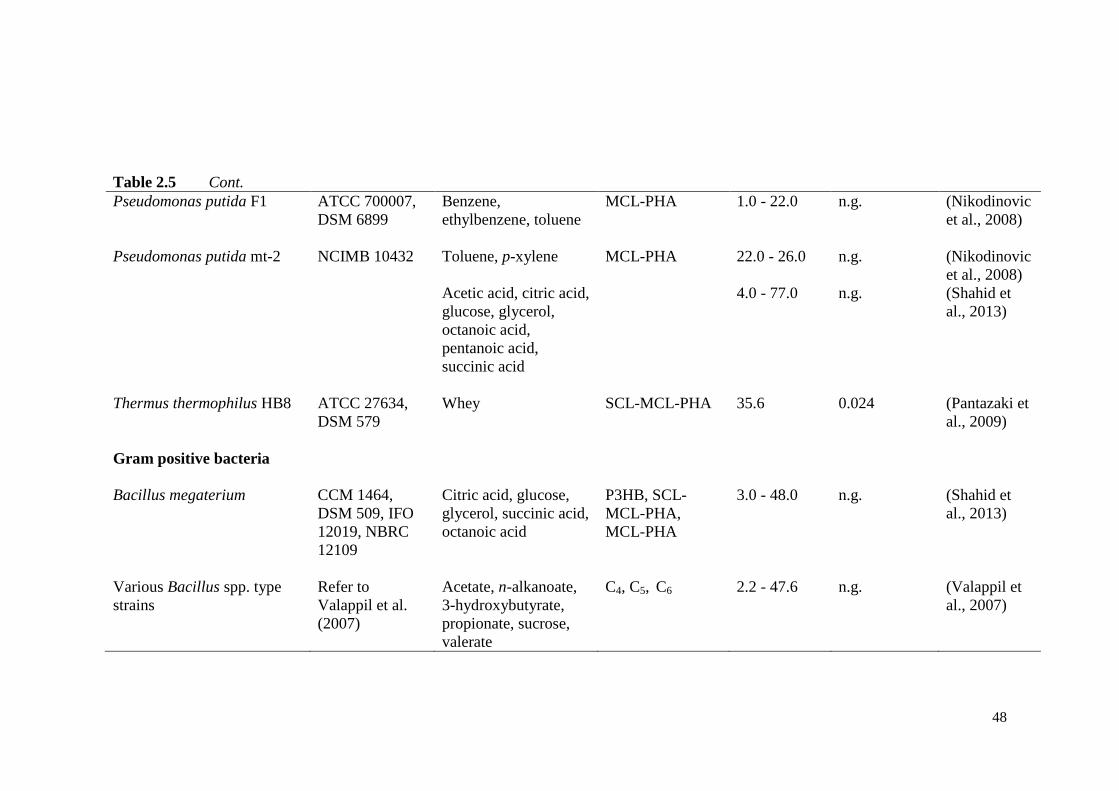
48
Table 2.5 Cont.
Pseudomonas putida F1 ATCC 700007,
DSM 6899
Benzene,
ethylbenzene, toluene
MCL-PHA 1.0 - 22.0 n.g. (Nikodinovic
et al., 2008)
Pseudomonas putida mt-2 NCIMB 10432 Toluene, p-xylene MCL-PHA 22.0 - 26.0 n.g. (Nikodinovic
et al., 2008)
Acetic acid, citric acid,
glucose, glycerol,
octanoic acid,
pentanoic acid,
succinic acid
4.0 - 77.0 n.g. (Shahid et
al., 2013)
Thermus thermophilus HB8 ATCC 27634,
DSM 579
Whey SCL-MCL-PHA 35.6 0.024 (Pantazaki et
al., 2009)
Gram positive bacteria
Bacillus megaterium CCM 1464,
DSM 509, IFO
12019, NBRC
12109
Citric acid, glucose,
glycerol, succinic acid,
octanoic acid
P3HB, SCL-
MCL-PHA,
MCL-PHA
3.0 - 48.0 n.g. (Shahid et
al., 2013)
Various Bacillus spp. type
strains
Refer to
Valappil et al.
(2007)
Acetate, n-alkanoate,
3-hydroxybutyrate,
propionate, sucrose,
valerate
C4, C5, C6 2.2 - 47.6 n.g. (Valappil et
al., 2007)
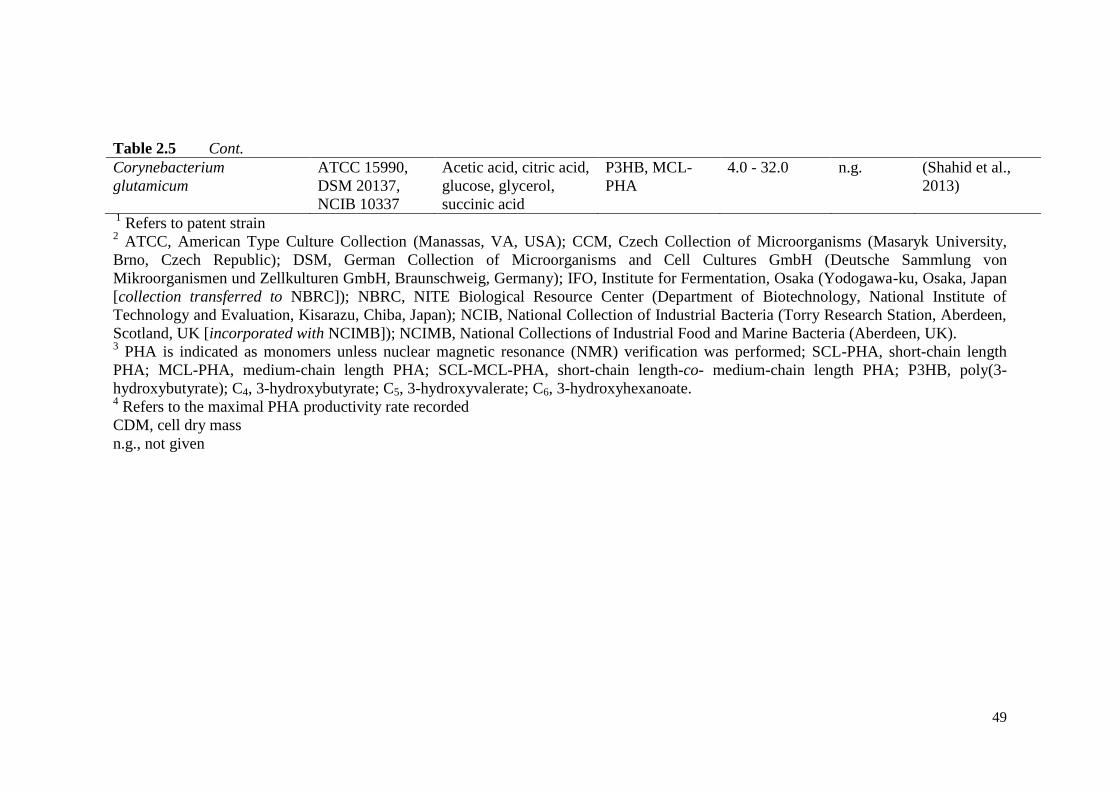
49
Table 2.5 Cont.
Corynebacterium
glutamicum
ATCC 15990,
DSM 20137,
NCIB 10337
Acetic acid, citric acid,
glucose, glycerol,
succinic acid
P3HB, MCL-
PHA
4.0 - 32.0 n.g. (Shahid et al.,
2013)
1 Refers to patent strain
2 ATCC, American Type Culture Collection (Manassas, VA, USA); CCM, Czech Collection of Microorganisms (Masaryk University,
Brno, Czech Republic); DSM, German Collection of Microorganisms and Cell Cultures GmbH (Deutsche Sammlung von
Mikroorganismen und Zellkulturen GmbH, Braunschweig, Germany); IFO, Institute for Fermentation, Osaka (Yodogawa-ku, Osaka, Japan
[collection transferred to NBRC]); NBRC, NITE Biological Resource Center (Department of Biotechnology, National Institute of
Technology and Evaluation, Kisarazu, Chiba, Japan); NCIB, National Collection of Industrial Bacteria (Torry Research Station, Aberdeen,
Scotland, UK [incorporated with NCIMB]); NCIMB, National Collections of Industrial Food and Marine Bacteria (Aberdeen, UK). 3 PHA is indicated as monomers unless nuclear magnetic resonance (NMR) verification was performed; SCL-PHA, short-chain length
PHA; MCL-PHA, medium-chain length PHA; SCL-MCL-PHA, short-chain length-co- medium-chain length PHA; P3HB, poly(3-
hydroxybutyrate); C4, 3-hydroxybutyrate; C5, 3-hydroxyvalerate; C6, 3-hydroxyhexanoate. 4 Refers to the maximal PHA productivity rate recorded
CDM, cell dry mass
n.g., not given
50
precursors (R)-3-hydroxyacyl-CoA ([R]-3-HA-CoA) through the action of an
enzyme 3-hydroxyacyl-acyl carrier protein-CoA transacylase (PhaG) (Zheng et al.,
2005). PHA accumulation via Route B is frequently reported for fatty acids and oils
(Costa et al., 2009; Fernández et al., 2005), which derives PHA precursors through
β-oxidation pathway. β-oxidation pathway is a chain-shortening cycling reaction
where each complete cycle removes two carbon atoms as acetyl-CoA (Gottschalk,
1986).While Route B generally leads to the production of MCL-PHA, the chain-
shortening function of β-oxidation pathway also means that PHA precursors of
shorter carbon numbers can be produced for SCL-PHA formation (Akiyama et al.,
1992; Madison & Huisman, 1999; Steinbüchel & Hein, 2001). SCL-PHA is also
synthesized through Route C, D and E, usually from sugars and volatile fatty acids
(acetic acid, propionate acid).
2.3 Bioconversion of Styrene to MCL-PHA
The concept of styrene bioconversion to PHA is relatively new and has only been in
existence for about 10 years. In the past decade, there has been some scientific
progress made on the understanding of microbes, capable of such metabolism, as
well as the coupling between styrene catabolic and PHA anabolic pathway.
2.3.1 Microbes involved in bioconversion of styrene to MCL-PHA
The feasibility of the biological conversion of styrene to PHA was first reported in
the patent strain P. putida CA-3 (NCIMB 41162) (Ward et al., 2005), and later
discovered in three other pure Pseudomonas spp. namely, P. putida S12, P. putida
CA-1 and Pseudomonas sp. TN301 (Hartmans et al., 1990; Narancic et al., 2012;
O'Connor et al., 1995). All three strains reportedly synthesize MCL-PHA with
similar monomeric composition consisting of 3-hydroxyhexanoate (C6), 3-
hydroxyoctanoate (C8), 3-hydroxydecanoate (C10), 3-hydroxydodecanoate (C12) and
3-hydroxydodecenoate (C12:1) monomers. Among the four strains, P. putida CA-3
was the most well-studied. P. putida CA-3 was found to be highly efficient at
metabolizing styrene and displayed the highest cellular PHA content at 30% CDM.
When styrene was supplied at a total concentration of 19.3 g.L-1
over a 48 h period,
P. putida CA-3 metabolized more than 99% of styrene for biomass growth
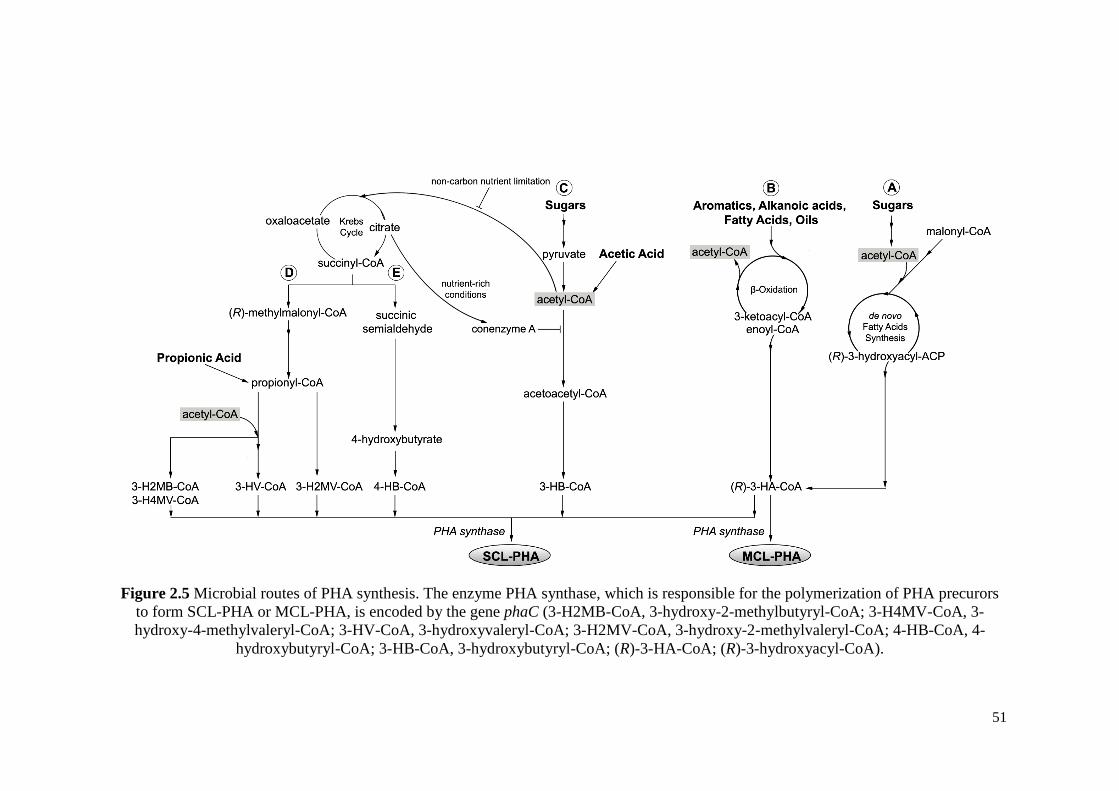
51
Figure 2.5 Microbial routes of PHA synthesis. The enzyme PHA synthase, which is responsible for the polymerization of PHA precurors
to form SCL-PHA or MCL-PHA, is encoded by the gene phaC (3-H2MB-CoA, 3-hydroxy-2-methylbutyryl-CoA; 3-H4MV-CoA, 3-
hydroxy-4-methylvaleryl-CoA; 3-HV-CoA, 3-hydroxyvaleryl-CoA; 3-H2MV-CoA, 3-hydroxy-2-methylvaleryl-CoA; 4-HB-CoA, 4-
hydroxybutyryl-CoA; 3-HB-CoA, 3-hydroxybutyryl-CoA; (R)-3-HA-CoA; (R)-3-hydroxyacyl-CoA).
52
(10.56 g.L-1
) and PHA accumulation (3.36 g.L-1
) with a PHA productivity of 0.07
g.L-1
.h-1
(Nikodinovic-Runic et al., 2011). While the study did not report the
monomeric constituents of MCL-PHA, based on previous studies, it can be
presumed that the MCL-PHA produced by P. putida CA-3 was likely to comprise
of MCL monomers C6, C8, C10, C12 and C12:1 with a predominance of C12 monomers
(Nikodinovic et al., 2008; Ward et al., 2006). The MCL-PHA polymer has a
decomposition temperature (DT) of 265 °C, Tg of 43 °C, and Tm of 38 °C, which are
polymer properties comparable to that of a typical elastomer (van der Walle et al.,
2001; Ward et al., 2005). Despite its good performance, P. putida CA-3 is a
patented bacterium and is not readily-accessible for further scientific investigation
and bioprocess application.
Although less well-studied, the bioconversion of styrene to MCL-PHA, with similar
monomeric composition, has also been reported in other Pseudomonas species P.
putida S12, P. putida CA-1 and Pseudomonas sp. TN301. However, these strains
accumulate MCL-PHA at lower cellular contents (14% CDM for P. putida S12, 8%
CDM for P. putida CA-1 and 3% CDM for Pseudomonas sp. TN301) (Narancic et
al., 2012; Tobin & O'Connor, 2005). Therefore, there is currently a lack of bacterial
strains with the metabolic capacity to bioconvert styrene into MCL-PHA efficiently,
which warrants the need to increase the pool of pure microbial cultures.
Furthermore, to date, only Pseudomonas species are found to be capable of
performing this bioconversion process. From the literature, styrene degradation
capabilities are found to be widespread across many bacterial genera and species
(Table 2.2). The same is true for PHA accumulation capabilities (Table 2.4) (Tan et
al., 2014b). Cross-referencing between styrene-degrading and PHA-accumulating
bacteria reveals some overlaps between the two groups of bacteria. These genera
include Corynebacterium, Nocardia, Rhodococcus, Streptomyces, Clostridium,
Xanthomonas and Alcaligenes. Although PHA accumulation in these genera
remained unreported for styrene, PHA accumulation was reported from other
carbon sources such as acetate, sucrose, alkanoic acids (Tan et al., 2014b; Valappil
et al., 2007; Verlinden et al., 2007). Hence, there may be other bacteria capable of
53
converting styrene into PHA. To address the limited availability of pure microbial
cultures and to investigate if there may be other genera of styrene-degrading cum
PHA-producing pure microbial cultures, further research is necessary.
2.3.2 Metabolic pathway for bioconversion of styrene to MCL-PHA
As established in Section 2.2.3, the bioconversion of styrene to PHA can only occur
if bacteria possess styrene catabolic pathway and PHA synthesis pathway. In
addition, there must be coupling between styrene catabolism and PHA anabolism
for the channeling of degradation intermediates towards PHA synthesis. To date,
two major pathways for aerobic styrene degradation (Section 2.1.5, Figure 2.2),
three hypothetical pathways for anaerobic styrene degradation (Section 2.1.5,
Figure 2.3), and five main PHA synthetic routes (Section 2.2.4, Figure 2.5) have
been identified. Among the aforementioned pathways and route, there is currently
only one known coupling between an aerobic styrene degradation pathway and a
MCL-PHA synthesis route. This coupling has been elucidated in P. putida CA-3. In
this bacterium, the side-chain oxidation of styrene to form phenylacetatic acid was
reportedly responsible for styrene catabolism and subsequently providing MCL-
PHA precursors, varying between six carbons to twelve carbons, for MCL-PHA
synthesis through Route A (Figure 2.5) (O'Connor et al., 1995; O'Leary et al., 2005).
This mechanism was discovered by Ward et al. (2005), who showed that chemical
inhibition of enzyme PhaG, by 2-bromooctanoic acid, inhibited MCL-PHA
accumulation in P. putida CA-3, providing the first evidence that MCL-PHA
synthesis from styrene occurs via Route A. The generation of acetyl-CoA from
styrene degradation intermediates was later affirmed by O'Leary et al. (2005) using
random mutagenesis approach. They showed that disrupting the β-oxidation gene 3-
hydroxyacyl-CoA dehydrogenase resulted in the disruption of phenylacetic acid
consumption and downstream MCL-PHA production. This led O'Leary and co-
workers (2005) to propose that phenylacetic acid, the side-chain oxidation product,
undergoes β-oxidation to yield acetyl-CoA as the end product of styrene
metabolism and acetyl-CoA molecules are in turn channeled to de novo fatty acids
synthesis pathway (Figure 2.5, Route A) for MCL-PHA biosynthesis.
54
Elucidating the metabolic activities of P. putida CA-3 has provided much insight on
the bioconversion of styrene to MCL-PHA. However, the understanding of this
process is confined to only this bacterium. Besides Route A, existing literature,
based on other styrene-related mono-aromatic compounds, suggests that there may
be alternative couplings between styrene cataoblic pathways and PHA anabolic
pathways. For an example, it has been found that the reaction steps of direct ring
cleavage pathway for styrene are consistent with the peripheral degradation
pathways of other related mono-aromatics namely benzene, toluene and
ethylbenzene, which yield catechol, 3-methylcatechol, and 3-ethylcatechol,
respectively (Tischler & Kaschabek, 2012). P. putida F1 could catalyze the
degradation of the aforementioned aromatic compounds through these peripheral
degradation pathways (Yu et al., 2001). P. putida F1 was later observed by
Nikodinovic et al. (2008) to accumulate MCL-PHA from benzene, toluene and
ethylbenzene, suggesting that the peripheral direct ring cleavage pathways were
likely to have provided degradation intermediates for MCL-PHA synthesis.
Therefore, it may be possible that other couplings between styrene degradation
pathway and PHA biosynthetic route exist and remain to be identified. Hence,
increasing the pool and diversity of styrene-degrading cum PHA-producing pure
microbial cultures may help shed more light in this area in the future.
55
CHAPTER 3
Study 1:
Development of a HPLC-DAD Method for Styrene
and BTEX Detection
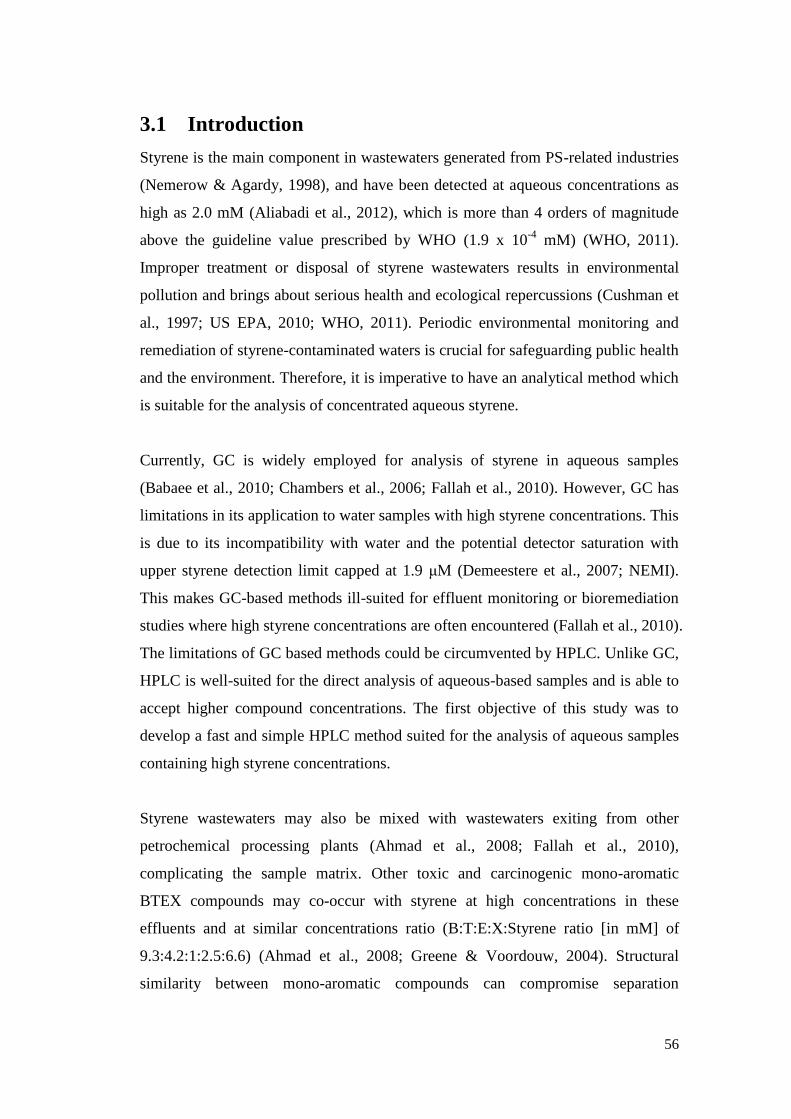
56
3.1 Introduction
Styrene is the main component in wastewaters generated from PS-related industries
(Nemerow & Agardy, 1998), and have been detected at aqueous concentrations as
high as 2.0 mM (Aliabadi et al., 2012), which is more than 4 orders of magnitude
above the guideline value prescribed by WHO (1.9 x 10⁻⁴
mM) (WHO, 2011).
Improper treatment or disposal of styrene wastewaters results in environmental
pollution and brings about serious health and ecological repercussions (Cushman et
al., 1997; US EPA, 2010; WHO, 2011). Periodic environmental monitoring and
remediation of styrene-contaminated waters is crucial for safeguarding public health
and the environment. Therefore, it is imperative to have an analytical method which
is suitable for the analysis of concentrated aqueous styrene.
Currently, GC is widely employed for analysis of styrene in aqueous samples
(Babaee et al., 2010; Chambers et al., 2006; Fallah et al., 2010). However, GC has
limitations in its application to water samples with high styrene concentrations. This
is due to its incompatibility with water and the potential detector saturation with
upper styrene detection limit capped at 1.9 μM (Demeestere et al., 2007; NEMI).
This makes GC-based methods ill-suited for effluent monitoring or bioremediation
studies where high styrene concentrations are often encountered (Fallah et al., 2010).
The limitations of GC based methods could be circumvented by HPLC. Unlike GC,
HPLC is well-suited for the direct analysis of aqueous-based samples and is able to
accept higher compound concentrations. The first objective of this study was to
develop a fast and simple HPLC method suited for the analysis of aqueous samples
containing high styrene concentrations.
Styrene wastewaters may also be mixed with wastewaters exiting from other
petrochemical processing plants (Ahmad et al., 2008; Fallah et al., 2010),
complicating the sample matrix. Other toxic and carcinogenic mono-aromatic
BTEX compounds may co-occur with styrene at high concentrations in these
effluents and at similar concentrations ratio (B:T:E:X:Styrene ratio [in mM] of
9.3:4.2:1:2.5:6.6) (Ahmad et al., 2008; Greene & Voordouw, 2004). Structural
similarity between mono-aromatic compounds can compromise separation
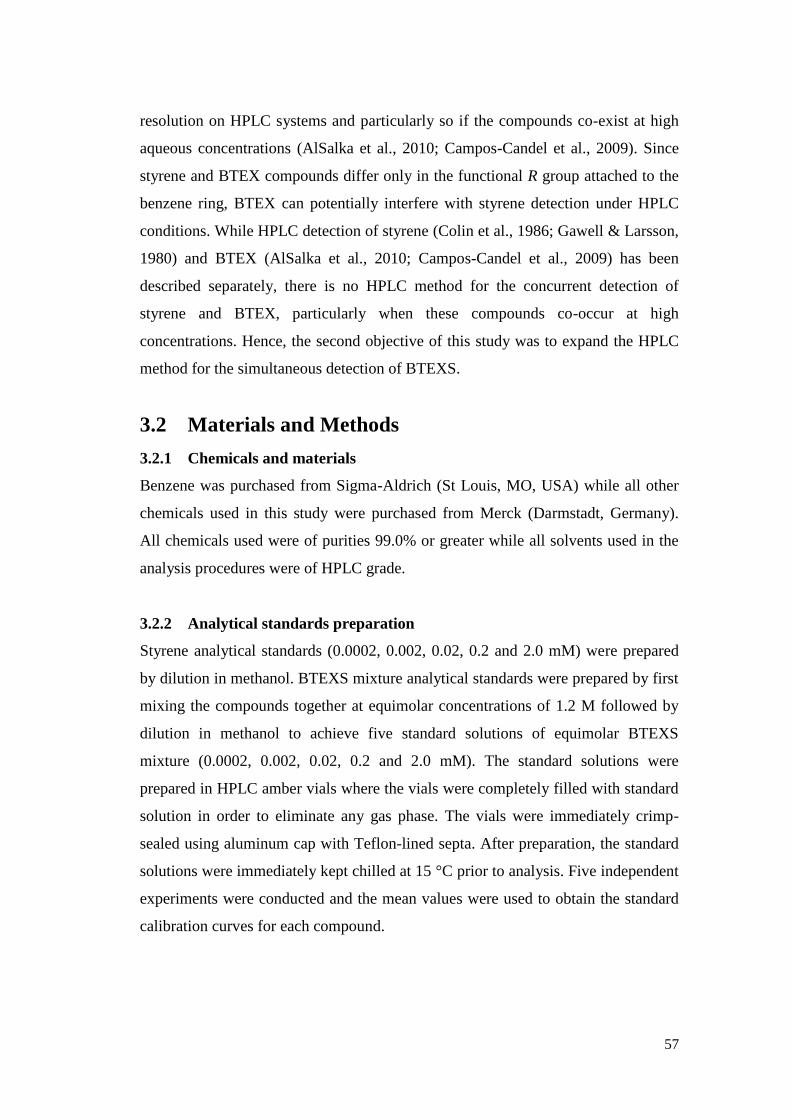
57
resolution on HPLC systems and particularly so if the compounds co-exist at high
aqueous concentrations (AlSalka et al., 2010; Campos-Candel et al., 2009). Since
styrene and BTEX compounds differ only in the functional R group attached to the
benzene ring, BTEX can potentially interfere with styrene detection under HPLC
conditions. While HPLC detection of styrene (Colin et al., 1986; Gawell & Larsson,
1980) and BTEX (AlSalka et al., 2010; Campos-Candel et al., 2009) has been
described separately, there is no HPLC method for the concurrent detection of
styrene and BTEX, particularly when these compounds co-occur at high
concentrations. Hence, the second objective of this study was to expand the HPLC
method for the simultaneous detection of BTEXS.
3.2 Materials and Methods
3.2.1 Chemicals and materials
Benzene was purchased from Sigma-Aldrich (St Louis, MO, USA) while all other
chemicals used in this study were purchased from Merck (Darmstadt, Germany).
All chemicals used were of purities 99.0% or greater while all solvents used in the
analysis procedures were of HPLC grade.
3.2.2 Analytical standards preparation
Styrene analytical standards (0.0002, 0.002, 0.02, 0.2 and 2.0 mM) were prepared
by dilution in methanol. BTEXS mixture analytical standards were prepared by first
mixing the compounds together at equimolar concentrations of 1.2 M followed by
dilution in methanol to achieve five standard solutions of equimolar BTEXS
mixture (0.0002, 0.002, 0.02, 0.2 and 2.0 mM). The standard solutions were
prepared in HPLC amber vials where the vials were completely filled with standard
solution in order to eliminate any gas phase. The vials were immediately crimp-
sealed using aluminum cap with Teflon-lined septa. After preparation, the standard
solutions were immediately kept chilled at 15 °C prior to analysis. Five independent
experiments were conducted and the mean values were used to obtain the standard
calibration curves for each compound.
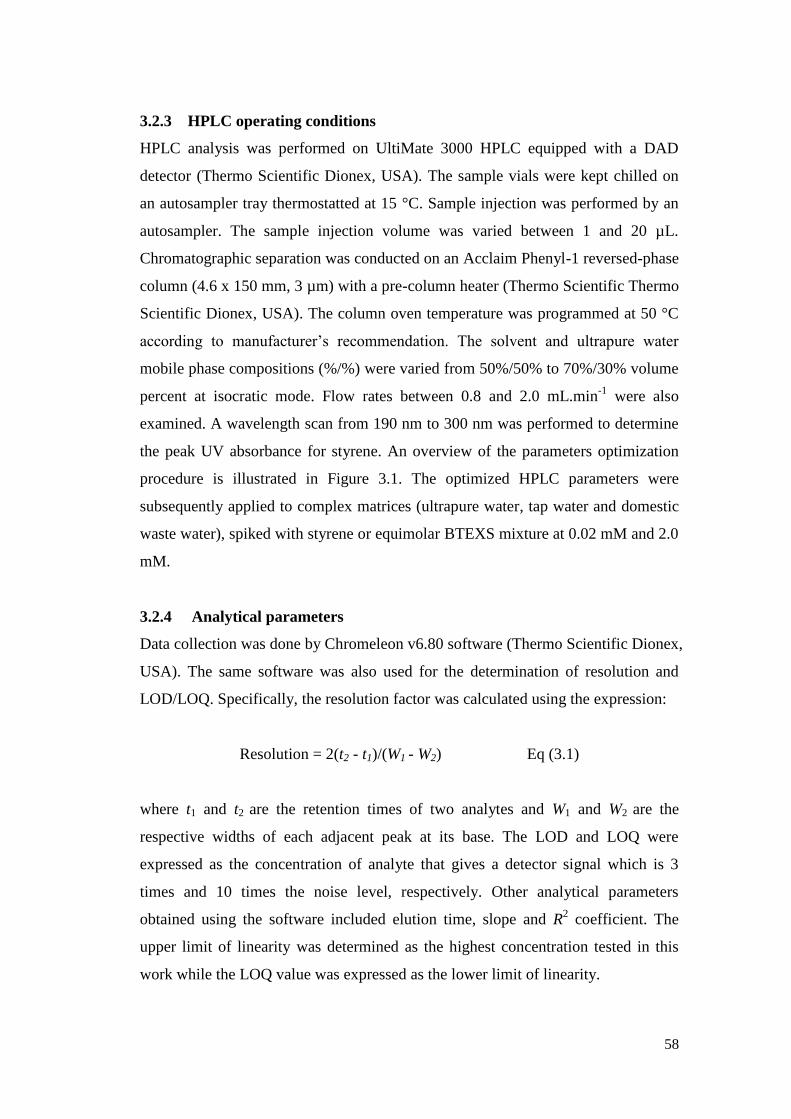
58
3.2.3 HPLC operating conditions
HPLC analysis was performed on UltiMate 3000 HPLC equipped with a DAD
detector (Thermo Scientific Dionex, USA). The sample vials were kept chilled on
an autosampler tray thermostatted at 15 °C. Sample injection was performed by an
autosampler. The sample injection volume was varied between 1 and 20 µL.
Chromatographic separation was conducted on an Acclaim Phenyl-1 reversed-phase
column (4.6 x 150 mm, 3 µm) with a pre-column heater (Thermo Scientific Thermo
Scientific Dionex, USA). The column oven temperature was programmed at 50 °C
according to manufacturer‟s recommendation. The solvent and ultrapure water
mobile phase compositions (%/%) were varied from 50%/50% to 70%/30% volume
percent at isocratic mode. Flow rates between 0.8 and 2.0 mL.min-1
were also
examined. A wavelength scan from 190 nm to 300 nm was performed to determine
the peak UV absorbance for styrene. An overview of the parameters optimization
procedure is illustrated in Figure 3.1. The optimized HPLC parameters were
subsequently applied to complex matrices (ultrapure water, tap water and domestic
waste water), spiked with styrene or equimolar BTEXS mixture at 0.02 mM and 2.0
mM.
3.2.4 Analytical parameters
Data collection was done by Chromeleon v6.80 software (Thermo Scientific Dionex,
USA). The same software was also used for the determination of resolution and
LOD/LOQ. Specifically, the resolution factor was calculated using the expression:
Resolution = 2(t2 - t1)/(W1 - W2) Eq (3.1)
where t1 and t2 are the retention times of two analytes and W1 and W2 are the
respective widths of each adjacent peak at its base. The LOD and LOQ were
expressed as the concentration of analyte that gives a detector signal which is 3
times and 10 times the noise level, respectively. Other analytical parameters
obtained using the software included elution time, slope and R2 coefficient. The
upper limit of linearity was determined as the highest concentration tested in this
work while the LOQ value was expressed as the lower limit of linearity.
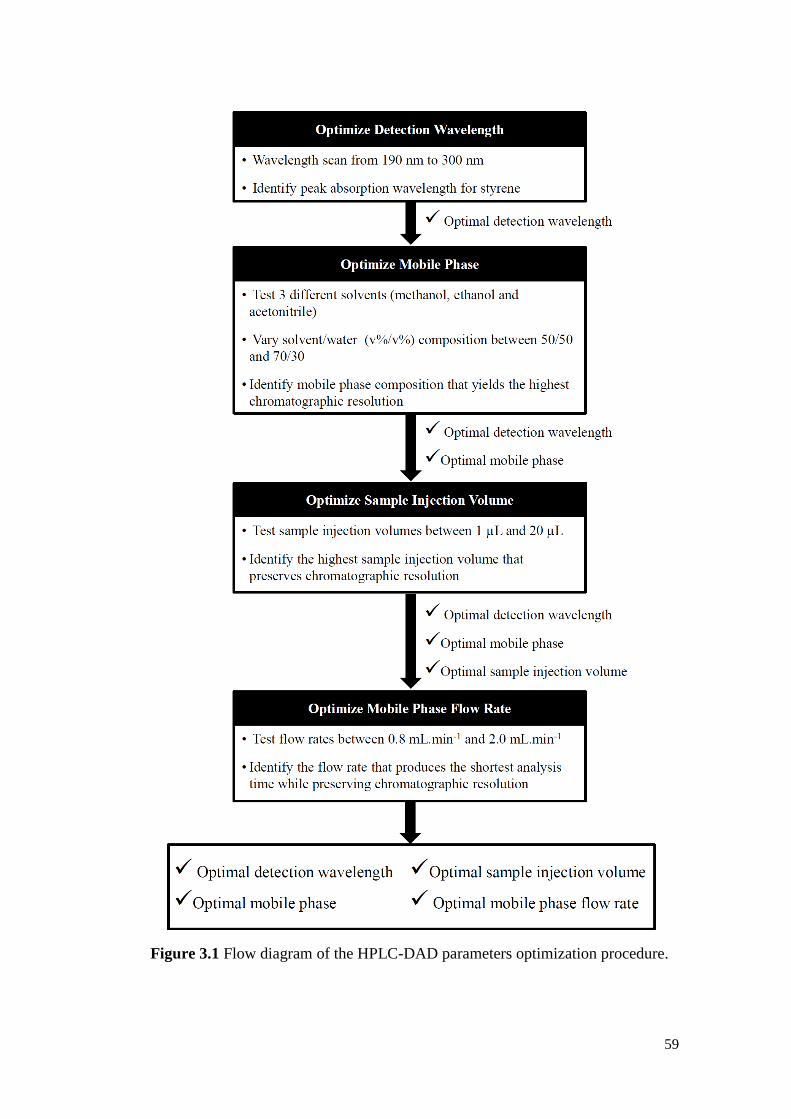
59
Figure 3.1 Flow diagram of the HPLC-DAD parameters optimization procedure.
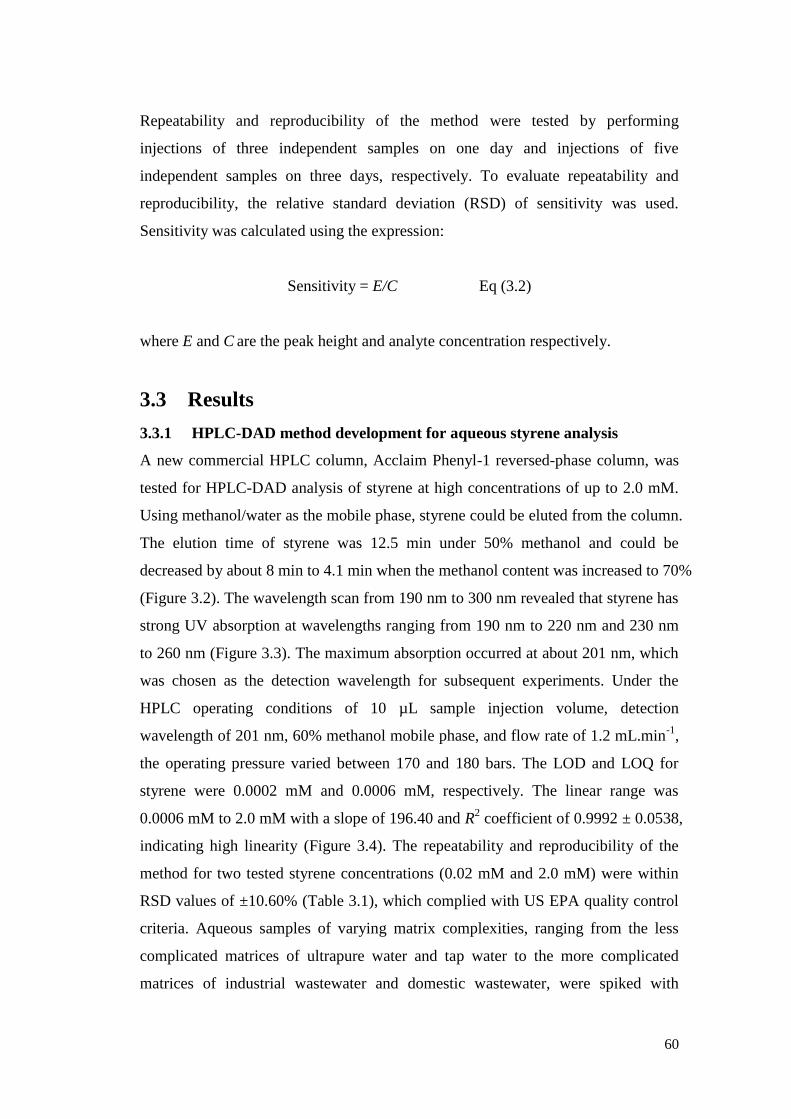
60
Repeatability and reproducibility of the method were tested by performing
injections of three independent samples on one day and injections of five
independent samples on three days, respectively. To evaluate repeatability and
reproducibility, the relative standard deviation (RSD) of sensitivity was used.
Sensitivity was calculated using the expression:
Sensitivity = E/C Eq (3.2)
where E and C are the peak height and analyte concentration respectively.
3.3 Results
3.3.1 HPLC-DAD method development for aqueous styrene analysis
A new commercial HPLC column, Acclaim Phenyl-1 reversed-phase column, was
tested for HPLC-DAD analysis of styrene at high concentrations of up to 2.0 mM.
Using methanol/water as the mobile phase, styrene could be eluted from the column.
The elution time of styrene was 12.5 min under 50% methanol and could be
decreased by about 8 min to 4.1 min when the methanol content was increased to 70%
(Figure 3.2). The wavelength scan from 190 nm to 300 nm revealed that styrene has
strong UV absorption at wavelengths ranging from 190 nm to 220 nm and 230 nm
to 260 nm (Figure 3.3). The maximum absorption occurred at about 201 nm, which
was chosen as the detection wavelength for subsequent experiments. Under the
HPLC operating conditions of 10 µL sample injection volume, detection
wavelength of 201 nm, 60% methanol mobile phase, and flow rate of 1.2 mL.min-1
,
the operating pressure varied between 170 and 180 bars. The LOD and LOQ for
styrene were 0.0002 mM and 0.0006 mM, respectively. The linear range was
0.0006 mM to 2.0 mM with a slope of 196.40 and R2 coefficient of 0.9992 ± 0.0538,
indicating high linearity (Figure 3.4). The repeatability and reproducibility of the
method for two tested styrene concentrations (0.02 mM and 2.0 mM) were within
RSD values of ±10.60% (Table 3.1), which complied with US EPA quality control
criteria. Aqueous samples of varying matrix complexities, ranging from the less
complicated matrices of ultrapure water and tap water to the more complicated
matrices of industrial wastewater and domestic wastewater, were spiked with
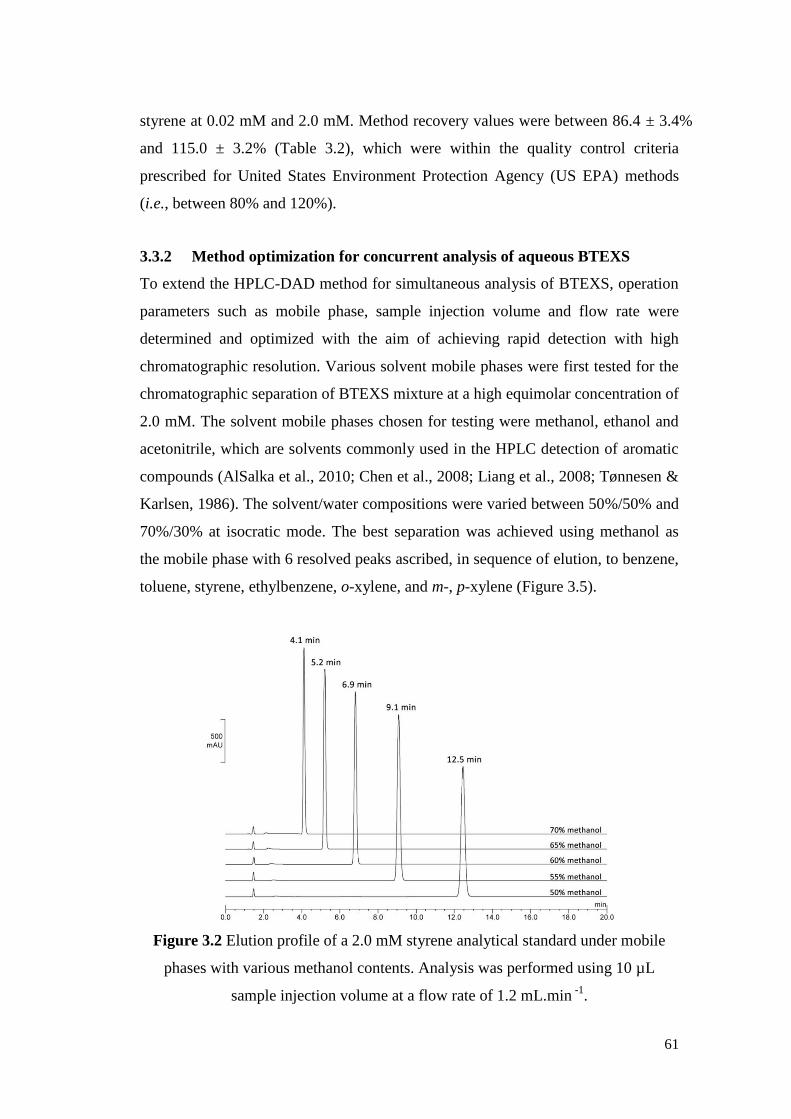
61
styrene at 0.02 mM and 2.0 mM. Method recovery values were between 86.4 ± 3.4%
and 115.0 ± 3.2% (Table 3.2), which were within the quality control criteria
prescribed for United States Environment Protection Agency (US EPA) methods
(i.e., between 80% and 120%).
3.3.2 Method optimization for concurrent analysis of aqueous BTEXS
To extend the HPLC-DAD method for simultaneous analysis of BTEXS, operation
parameters such as mobile phase, sample injection volume and flow rate were
determined and optimized with the aim of achieving rapid detection with high
chromatographic resolution. Various solvent mobile phases were first tested for the
chromatographic separation of BTEXS mixture at a high equimolar concentration of
2.0 mM. The solvent mobile phases chosen for testing were methanol, ethanol and
acetonitrile, which are solvents commonly used in the HPLC detection of aromatic
compounds (AlSalka et al., 2010; Chen et al., 2008; Liang et al., 2008; Tønnesen &
Karlsen, 1986). The solvent/water compositions were varied between 50%/50% and
70%/30% at isocratic mode. The best separation was achieved using methanol as
the mobile phase with 6 resolved peaks ascribed, in sequence of elution, to benzene,
toluene, styrene, ethylbenzene, o-xylene, and m-, p-xylene (Figure 3.5).
Figure 3.2 Elution profile of a 2.0 mM styrene analytical standard under mobile
phases with various methanol contents. Analysis was performed using 10 µL
sample injection volume at a flow rate of 1.2 mL.min -1
.
62
To determine the range of methanol content that produces fast separation with
reasonable chromatographic resolution, methanol/water compositions between
50%/50% and 70%/30% were studied. Increasing methanol content from 50 to 65%
did not change the elution order but resulted in reduced elution time for all tested
compounds, shortening the overall analysis time from 16 min to 6.5 min (Figure
3.6A). The separation quality was evaluated in terms of resolution between adjacent
peaks where a resolution of 1.5 or greater represents well-resolved adjacent peaks
(Tijssen et al., 1998).
Figure 3.3 DAD profile of a 2.0 mM styrene analytical standard.
Figure 3.6B shows that 50% methanol resulted in high resolution (> 1.5) between
all compounds with the exception of ethylbenzene/o-xylene (resolution of 1.1). 55
to 60% methanol provided high resolution of close to or greater than 1.5 for all
tested compounds. When methanol content was increased beyond 60% methanol,
the resolution for between all compounds remained above 1.5 with the exception of
63
o-xylene/m-, p-xylene (1.0 at 65% methanol and 0 at 70% methanol), causing the
adjacent peaks to overlap partially or completely. Taken together, 55 to 60%
methanol was regarded as most optimal for BTEXS separation. An interesting
phenomenon was also observed in which the resolution for ethylbenzene/o-xylene
increased from 1.1 to 1.8 despite a smaller elution time difference of 0.3 min at 65%
methanol compared to 0.4 min at 50% methanol (Figure 3.6).
Following the optimization of mobile phase, the optimal range of injection volume
was determined by varying this parameter between 1 and 20 µL. High resolutions (>
1.5) between the first four peaks (i.e., benzene/toluene, toluene/styrene and
styrene/ethylbenzene) were observed for all tested injection volumes (Figure 3.7).
For the last three peaks (i.e., ethylbenzene/o-xylene and o-xylene/m-, p-xylene)
however, chromatographic resolutions close to or above 1.5 were only observed for
injection volumes of up to 10 µL. As such, volume between 1 and 10 µL was
considered as the optimal injection volume for concentrated BTEXS samples.
Flow rate is also a parameter known to influence analysis time and chromatographic
resolution. Using 60% methanol as the mobile phase and 10 µL sample injection
volume, the mobile phase flow rate was varied between 0.8 and 2.0 mL.min-1
to
determine the optimal flow rate for rapid analysis without compromising resolution.
Increasing the flow rate from 0.8 to 2.0 mL.min-1
, which is the manufacturer‟s
recommended maximum flow rate, halved the analysis time from 12 to 5.5 min
(Figure 3.8A) with negligible decrease in resolution (Figure 3.8B). At a flow rate of
2.0 mL.min-1
, the elution times of benzene, toluene, styrene, ethylbenzene, o-xylene,
and m-, p-xylene were 2.5, 3.4, 4.2, 4.6, 4.8, and 5.0 min, respectively, shortening
the analysis time (Figure 3.5B).
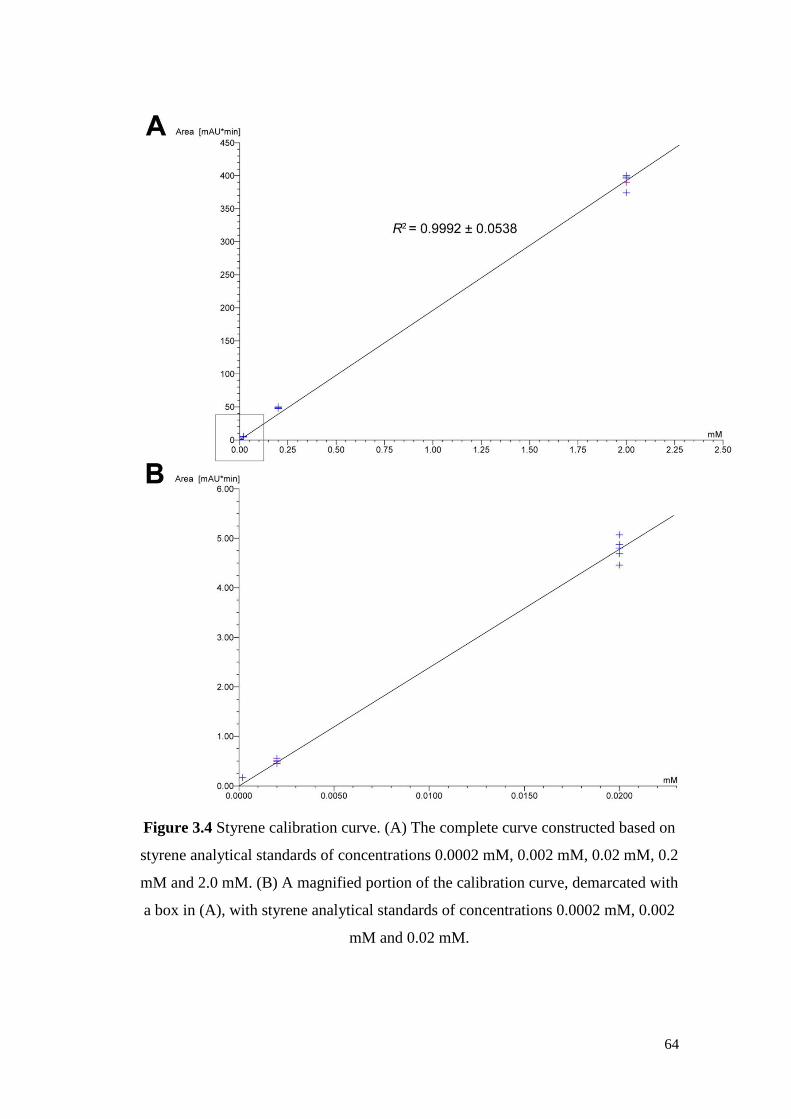
64
Figure 3.4 Styrene calibration curve. (A) The complete curve constructed based on
styrene analytical standards of concentrations 0.0002 mM, 0.002 mM, 0.02 mM, 0.2
mM and 2.0 mM. (B) A magnified portion of the calibration curve, demarcated with
a box in (A), with styrene analytical standards of concentrations 0.0002 mM, 0.002
mM and 0.02 mM.
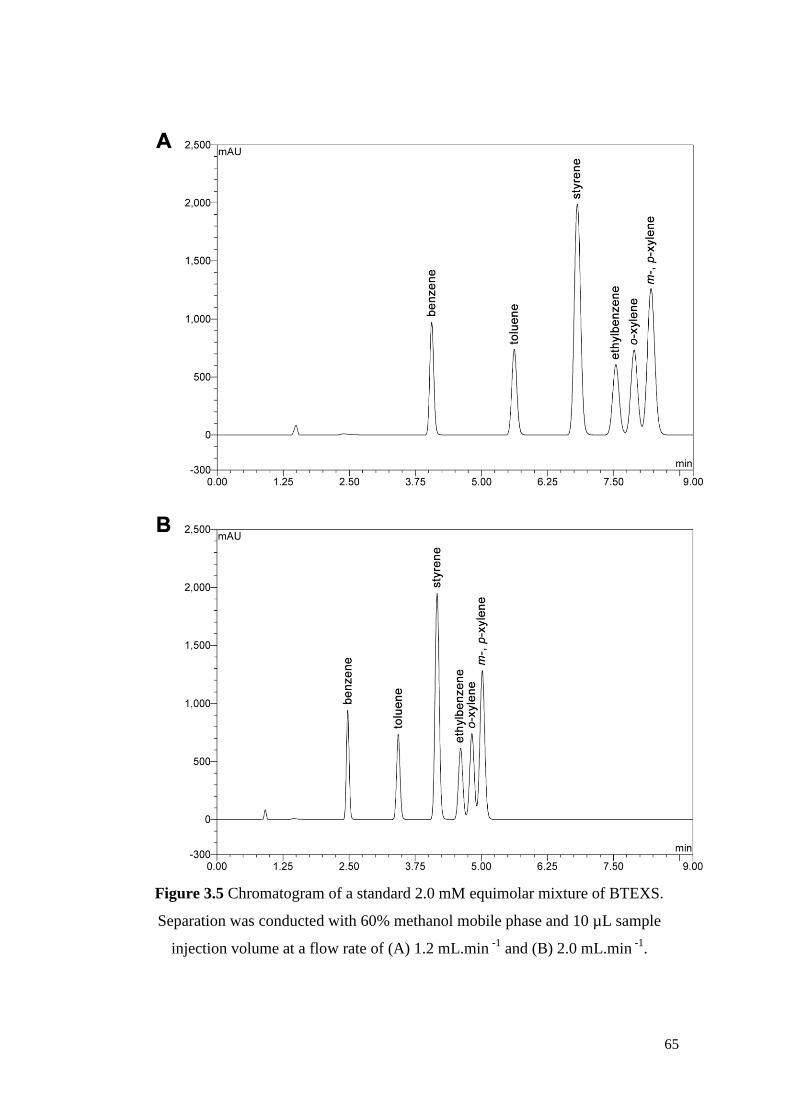
65
Figure 3.5 Chromatogram of a standard 2.0 mM equimolar mixture of BTEXS.
Separation was conducted with 60% methanol mobile phase and 10 µL sample
injection volume at a flow rate of (A) 1.2 mL.min -1
and (B) 2.0 mL.min -1
.
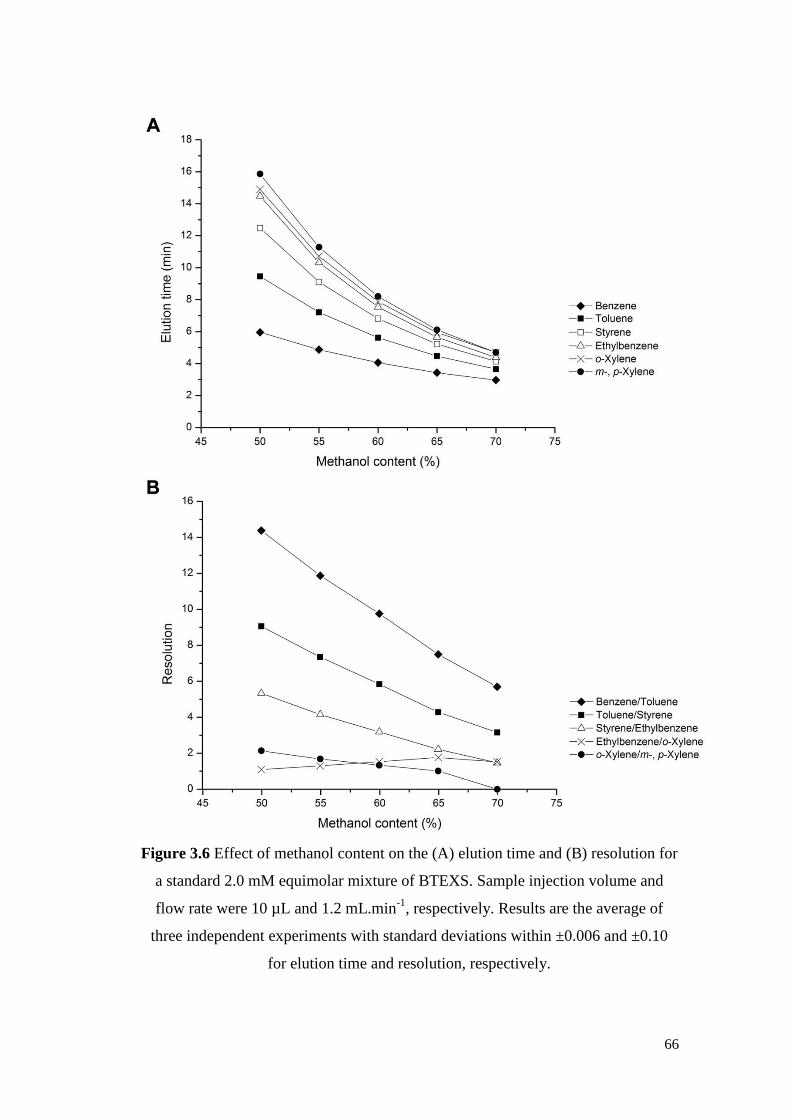
66
Figure 3.6 Effect of methanol content on the (A) elution time and (B) resolution for
a standard 2.0 mM equimolar mixture of BTEXS. Sample injection volume and
flow rate were 10 µL and 1.2 mL.min-1
, respectively. Results are the average of
three independent experiments with standard deviations within ±0.006 and ±0.10
for elution time and resolution, respectively.
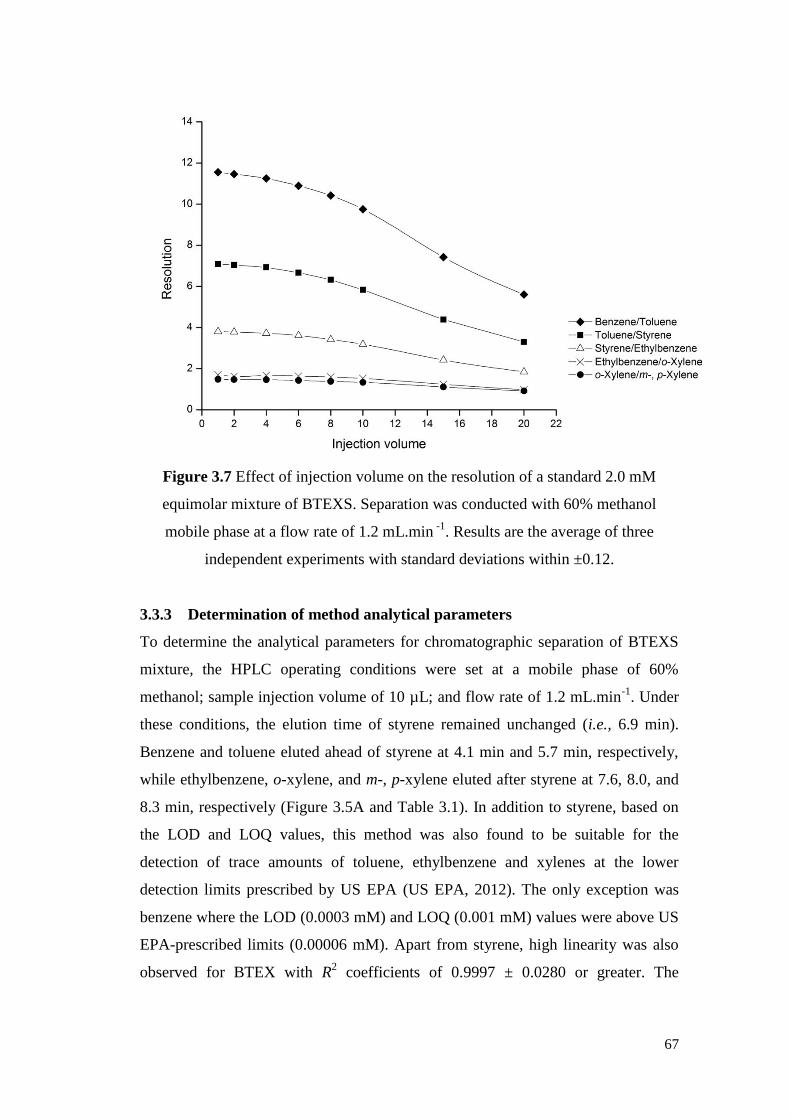
67
Figure 3.7 Effect of injection volume on the resolution of a standard 2.0 mM
equimolar mixture of BTEXS. Separation was conducted with 60% methanol
mobile phase at a flow rate of 1.2 mL.min -1
. Results are the average of three
independent experiments with standard deviations within ±0.12.
3.3.3 Determination of method analytical parameters
To determine the analytical parameters for chromatographic separation of BTEXS
mixture, the HPLC operating conditions were set at a mobile phase of 60%
methanol; sample injection volume of 10 µL; and flow rate of 1.2 mL.min-1
. Under
these conditions, the elution time of styrene remained unchanged (i.e., 6.9 min).
Benzene and toluene eluted ahead of styrene at 4.1 min and 5.7 min, respectively,
while ethylbenzene, o-xylene, and m-, p-xylene eluted after styrene at 7.6, 8.0, and
8.3 min, respectively (Figure 3.5A and Table 3.1). In addition to styrene, based on
the LOD and LOQ values, this method was also found to be suitable for the
detection of trace amounts of toluene, ethylbenzene and xylenes at the lower
detection limits prescribed by US EPA (US EPA, 2012). The only exception was
benzene where the LOD (0.0003 mM) and LOQ (0.001 mM) values were above US
EPA-prescribed limits (0.00006 mM). Apart from styrene, high linearity was also
observed for BTEX with R2 coefficients of 0.9997 ± 0.0280 or greater. The
68
repeatability and reproducibility of the method for two tested BTEXS equimolar
concentrations (0.02 mM and 2.0 mM) was found to be within RSD values of
±13.6%, meeting US EPA quality control criteria. Method recovery values for
BTEXS in different aqueous matrices of varying matrix complexities (i.e., ultrapure
water, tap water, industrial wastewater and domestic wastewater) were between
86.4 ± 3.4% and 115.9 ± 2.9% (Table 3.2), which fell within the quality control
criteria prescribed for US EPA methods.
3.4 Discussion
Existing methods for analysis of BTEXS are focused on trace detections and
typically developed on GC platforms (Almeida & Boas, 2004; Chambers et al.,
2006). GC-based methods however, cannot be directly applied for aqueous samples
containing high BTEXS concentrations, necessitating the need to develop new
analytical methods for this type of sample matrix. This study attempted to bridge
the research gap by developing a fast and simple HPLC-DAD method suitable for
the analysis of aqueous samples containing high styrene concentrations as well as
aqueous samples where BTEXS co-occur at high concentrations.
A newly-developed commercial HPLC column Acclaim Phenyl-1 reversed-phase
column was chosen for this study‟s purpose as the column‟s stationary phase
comprised of silanes bearing C11 alkyl aromatic moiety with a terminal electron-
withdrawing group. The retention mechanism is based on a combination of
hydrophobic and pi-pi interactions (Thermo Scientific Dionex, 2010). Conventional
HPLC methods for styrene or BTEX analysis employ C8 column (Farhadian et al.,
2009) or C18 column (AlSalka et al., 2010; Colin et al., 1986; Kelly et al., 1996;
Khaksar & Ghazi-Khansari, 2009), which comprises of octyl or octadecyl carbon
chain-bonded silica, respectively, and provide chromatographic selectivity through
hydrophobic interactions. Compared to C18 column, the additional
chromatographic selectivity of Acclaim Phenyl-1 column based on pi-pi
interactions was anticipated to provide enhanced chromatographic separation for
aromatic compounds such as BTEXS.
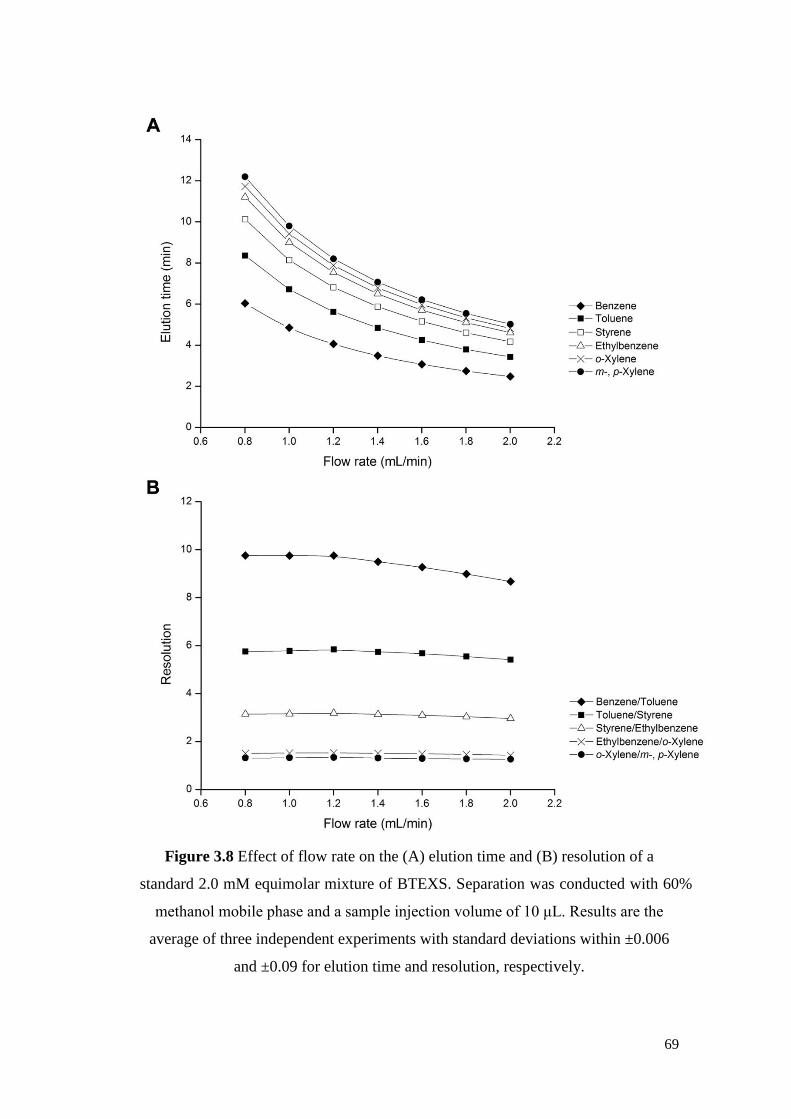
69
Figure 3.8 Effect of flow rate on the (A) elution time and (B) resolution of a
standard 2.0 mM equimolar mixture of BTEXS. Separation was conducted with 60%
methanol mobile phase and a sample injection volume of 10 μL. Results are the
average of three independent experiments with standard deviations within ±0.006
and ±0.09 for elution time and resolution, respectively.
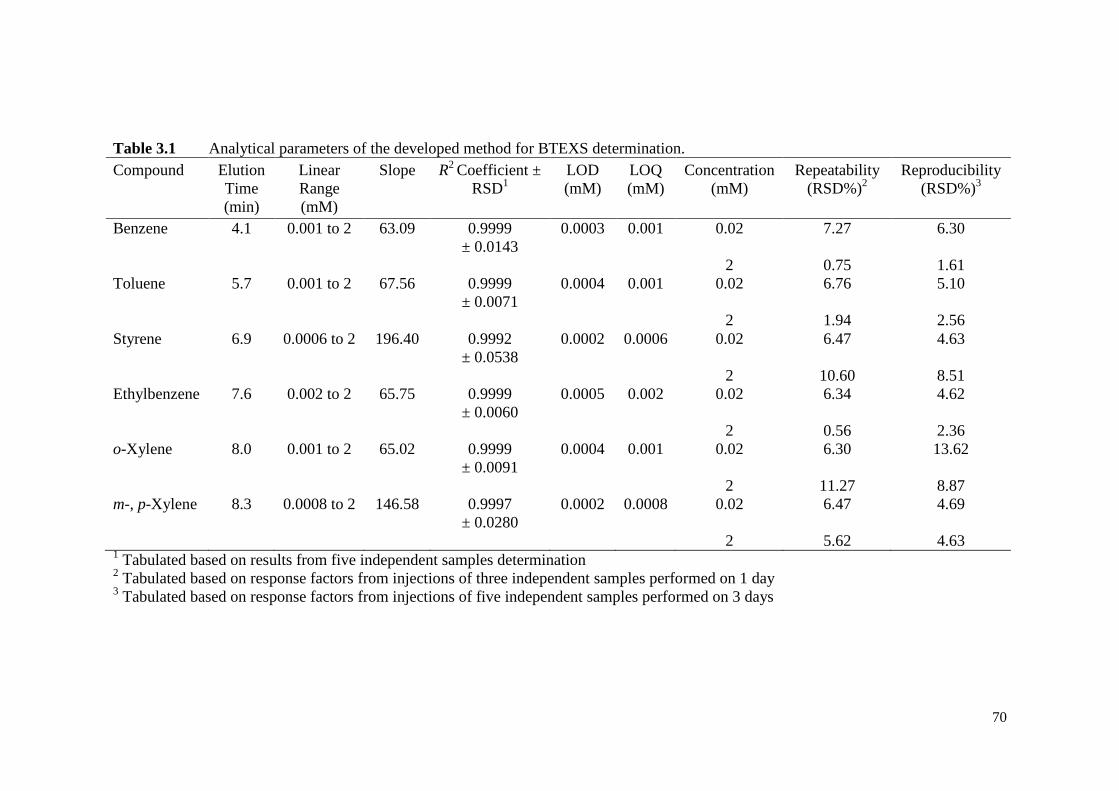
70
Table 3.1 Analytical parameters of the developed method for BTEXS determination.
Compound Elution
Time
(min)
Linear
Range
(mM)
Slope R2
Coefficient ±
RSD1
LOD
(mM)
LOQ
(mM)
Concentration
(mM)
Repeatability
(RSD%)2
Reproducibility
(RSD%)3
Benzene 4.1 0.001 to 2 63.09 0.9999
± 0.0143
0.0003 0.001 0.02
7.27 6.30
2 0.75 1.61
Toluene 5.7 0.001 to 2 67.56 0.9999
± 0.0071
0.0004 0.001 0.02
6.76 5.10
2 1.94 2.56
Styrene 6.9 0.0006 to 2 196.40 0.9992
± 0.0538
0.0002 0.0006 0.02
6.47 4.63
2 10.60 8.51
Ethylbenzene 7.6 0.002 to 2 65.75 0.9999
± 0.0060
0.0005 0.002 0.02
6.34 4.62
2 0.56 2.36
o-Xylene 8.0 0.001 to 2 65.02 0.9999
± 0.0091
0.0004 0.001 0.02
6.30 13.62
2 11.27 8.87
m-, p-Xylene 8.3 0.0008 to 2 146.58 0.9997
± 0.0280
0.0002 0.0008 0.02
6.47 4.69
2 5.62 4.63 1 Tabulated based on results from five independent samples determination
2 Tabulated based on response factors from injections of three independent samples performed on 1 day
3 Tabulated based on response factors from injections of five independent samples performed on 3 days
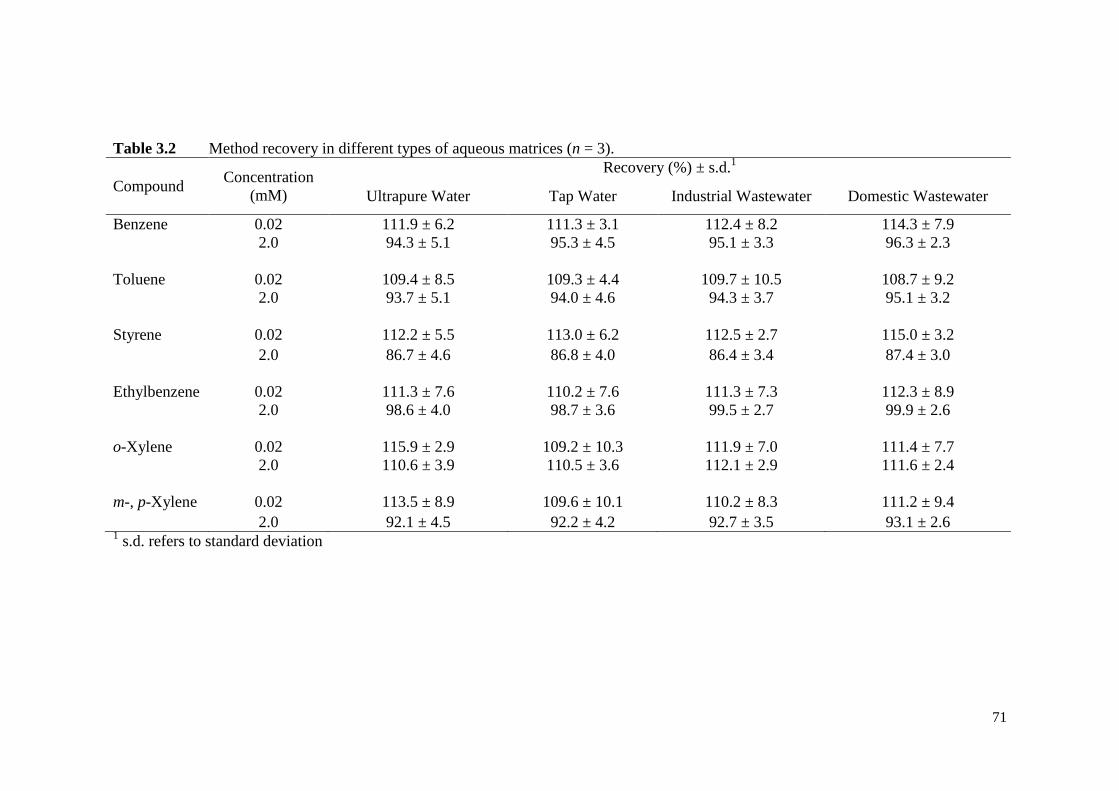
71
Table 3.2 Method recovery in different types of aqueous matrices (n = 3).
Compound Concentration
(mM)
Recovery (%) ± s.d.1
Ultrapure Water Tap Water Industrial Wastewater Domestic Wastewater
Benzene 0.02
111.9 ± 6.2 111.3 ± 3.1 112.4 ± 8.2 114.3 ± 7.9
2.0 94.3 ± 5.1 95.3 ± 4.5 95.1 ± 3.3 96.3 ± 2.3
Toluene 0.02
109.4 ± 8.5 109.3 ± 4.4 109.7 ± 10.5 108.7 ± 9.2
2.0 93.7 ± 5.1 94.0 ± 4.6 94.3 ± 3.7 95.1 ± 3.2
Styrene 0.02
112.2 ± 5.5 113.0 ± 6.2 112.5 ± 2.7 115.0 ± 3.2
2.0 86.7 ± 4.6 86.8 ± 4.0 86.4 ± 3.4 87.4 ± 3.0
Ethylbenzene 0.02
111.3 ± 7.6 110.2 ± 7.6 111.3 ± 7.3 112.3 ± 8.9
2.0 98.6 ± 4.0 98.7 ± 3.6 99.5 ± 2.7 99.9 ± 2.6
o-Xylene 0.02
115.9 ± 2.9 109.2 ± 10.3 111.9 ± 7.0 111.4 ± 7.7
2.0 110.6 ± 3.9 110.5 ± 3.6 112.1 ± 2.9 111.6 ± 2.4
m-, p-Xylene 0.02
113.5 ± 8.9 109.6 ± 10.1 110.2 ± 8.3 111.2 ± 9.4
2.0 92.1 ± 4.5 92.2 ± 4.2 92.7 ± 3.5 93.1 ± 2.6 1 s.d. refers to standard deviation
72
Styrene could be eluted from the Acclaim Phenyl-1 column using methanol/water
as the mobile phase. At a flow rate of 1.2 mL.min-1
, styrene could be rapidly eluted
at 4.1 min when 70% methanol was used as the mobile phase (Figure 3.2), which
was comparable to previous reports citing elution times of between 3.2 min and
11.6 min (Colin et al., 1986; Ekins et al., 1996; Flanjak & Sharrad, 1984; Gawell &
Larsson, 1980; Khaksar & Ghazi-Khansari, 2009; Marconi et al., 1996; Tawfik &
Huyghebaert, 1998). While this finding did not represent the shortest analysis time
for styrene, the analysis time is expected to be further shorten by increasing the
methanol content in the mobile phase or increasing flow rate although further
experiments would be needed for verification. Using a DAD detector, styrene was
found to show strong UV absorption at wavelengths ranging from 190 nm to 220
nm and 230 nm to 260 nm (Figure 3.3), which was in good agreement with previous
reports of styrene HPLC detection at 210 nm (Ekins et al., 1996), 245 nm (Colin et
al., 1986; Flanjak & Sharrad, 1984; Khaksar & Ghazi-Khansari, 2009; Tawfik &
Huyghebaert, 1998) and 254 nm (Gawell & Larsson, 1980; Marconi et al., 1996).
Within the range of 190 nm to 220 nm, peak UV absorption occurred at about 201
nm and this wavelength was subsequently chosen as the detection wavelength. The
Acclaim Phenyl-1 column was found to be suitable for the analysis of styrene at
high aqueous concentration of up to 2.0 mM, which was close to the maximum
solubility of styrene under ambient temperature. Compared to existing HPLC-based
(Colin et al., 1986; Khaksar & Ghazi-Khansari, 2009) and GC-based methods
(Chambers et al., 2006; Gilbert-López et al., 2010; NEMI), the upper detection limit
of this method was by far one of the highest to date. There was also high linearity
(R2 coefficient of 0.9992 ± 0.0538) over a large concentration range from 0.0006
mM to 2.0 mM (Figure 3.4). This meant that apart from analyzing styrene at high
concentrations, the method is also suitable for the detection of trace levels of
styrene at the lower detection limits prescribed by US EPA (US EPA, 2012).
Repeatability and reproducibility values (RSD of ±10.60%), and method recovery
values (between 86.4 ± 3.4% and 115.0 ± 3.2%) in various aqueous matrices (i.e.,
ultrapure water, tap water, industrial wastewater and domestic wastewater) were all
within the quality control criteria prescribed for US EPA methods.
73
The styrene analytical method was further expanded for the concurrent analysis of
BTEX as these mono-aromatic compounds commonly occur alongside styrene at
high concentrations, particularly in petrochemical wastewaters (Ahmad et al., 2008;
Greene & Voordouw, 2004). Among the various solvents (i.e., methanol, ethanol
and acetonitrile) and solvent/water composition tested, methanol/water achieved the
best chromatographic separation for BTEXS mixture at a high equimolar
concentration of 2.0 mM. Six resolved peaks (i.e., benzene, toluene, styrene,
ethylbenzene, o-xylene, and m-, p-xylene) were obtained for 7 compounds when
methanol content between 50% and 65% were used (Figure 3.5). Increasing
methanol content from 50% to 65% led to a decrease in the overall analysis time
from 16 min to 6.5 min (Figure 3.6A). A reasonable explanation could be that
higher methanol content created a more hydrophobic mobile phase environment,
favoring the dissolution of BTEXS. Since hydrophobic interactions are partially
responsible for column retention of BTEXS, a reduction in these interactions would
hasten the elution of aromatic analytes. The effect was most prominent for
compounds with greater hydrophobic character such as toluene, styrene,
ethylbenzene and xylene isomers which has octanol–water partition coefficient
values (logPOW) between 2.65 and 3.20 (Farhadian et al., 2009; Tischler &
Kaschabek, 2012). The reduction in elution time for the aforementioned compounds
was between 6 and 11 min (Figure 3.6A). In contrast, the least hydrophobic benzene
(logPOW of 2.13) registered a modest 3 min reduction in elution time. Additionally,
higher methanol content in the mobile phase also led to a decrease in resolution
between most compounds. The only exception was ethylbenzene/o-xylene where
the resolution increased from 1.1 (50 % methanol) to 1.8 (65% methanol) and 1.5
(70% methanol) (Figure 3.6B). This outlier was most likely attributed to the
changes in pi-pi selectivity of the stationary phase aromatic group in response to the
dielectric constant of the mobile phase (Carey, 2003; Vitha & Carr, 2006). Since
mobile phase containing between 55 and 60% methanol resulted in peak resolutions
of close to or greater than 1.5, it was considered as most optimal for BTEXS
separation. Similar to most chromatography methods (Almeida & Boas, 2004;
AlSalka et al., 2010; Shim & Yang, 1999; Shin & Kwon, 2000), the current method
was also unable to resolve positional isomers m-xylene and p-xylene peaks under
74
the tested conditions. Nevertheless, to our knowledge, this study provided the first
reference to demonstrate the feasibility of chromatographic separation of BTEXS at
high concentrations.
Under Acclaim Phenyl-1 column, injection volumes of between 1 µL and 10 µL
produced resolutions close to or above 1.5 and were considered as the optimal
injection volume for concentrated BTEXS samples (Figure 3.7). Beyond 10 µL,
resolutions for ehtylbenzene/o-xylene and o-xylene/m-, p-xylene deteriorated to
values of 1.0 and 0.9 respectively at 20 µL injection volume, producing notable
overlap between peaks (data not shown). High sample injection volumes of 50 µL
to 100 µL were frequently reported for BTEX separation on C8/C18 columns
(AlSalka et al., 2010; Farhadian et al., 2009; Kelly et al., 1996). However, such high
sample injection volumes were found to be detrimental to the Acclaim Phenyl-1
column. Column overloading and appearance of residual peaks were observed at
injection volumes greater than 50 µL (data not shown). Although attempts to
remove residual peaks by flushing the column with 100% methanol were successful,
the column could not be restored to its former resolving ability. Hence, overloading
the column, particularly with concentrated BTEXS samples, is not recommended.
Increasing flow rate reduced analysis time with negligible effect on resolution
(Figure 3.8). Complete BTEXS analysis could be achieved in as fast as under 5.5
min using a flow rate of 2.0 mL.min-1
(Figure 3.5B). Compared to existing HPLC
methods, which usually have an analysis time of 10 to 15 min (AlSalka et al., 2010;
Campos-Candel et al., 2009; Farhadian et al., 2009; Kelly et al., 1996), the proposed
method provided time-savings between 4 and 9.5 min per sample run (i.e., up to 60%
decrease in analysis time), leading to higher analysis throughput. This makes the
proposed method one of the fastest analytical methods reported to date and is
advantageous under circumstances where analysis of large number of samples are
required. Furthermore, the amount of solvent required per analysis was about 25%
lesser compared to existing methods, generating cost-savings from both solvent
usage and disposal.
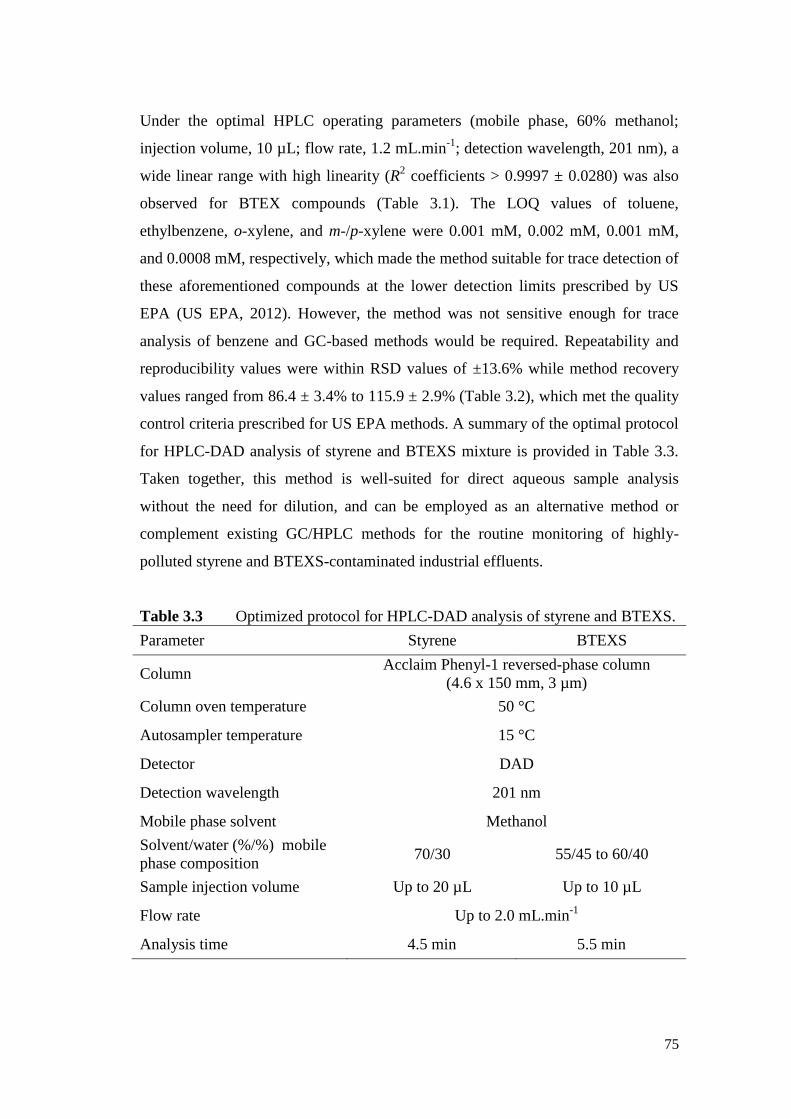
75
Under the optimal HPLC operating parameters (mobile phase, 60% methanol;
injection volume, 10 µL; flow rate, 1.2 mL.min-1
; detection wavelength, 201 nm), a
wide linear range with high linearity (R2 coefficients > 0.9997 ± 0.0280) was also
observed for BTEX compounds (Table 3.1). The LOQ values of toluene,
ethylbenzene, o-xylene, and m-/p-xylene were 0.001 mM, 0.002 mM, 0.001 mM,
and 0.0008 mM, respectively, which made the method suitable for trace detection of
these aforementioned compounds at the lower detection limits prescribed by US
EPA (US EPA, 2012). However, the method was not sensitive enough for trace
analysis of benzene and GC-based methods would be required. Repeatability and
reproducibility values were within RSD values of ±13.6% while method recovery
values ranged from 86.4 ± 3.4% to 115.9 ± 2.9% (Table 3.2), which met the quality
control criteria prescribed for US EPA methods. A summary of the optimal protocol
for HPLC-DAD analysis of styrene and BTEXS mixture is provided in Table 3.3.
Taken together, this method is well-suited for direct aqueous sample analysis
without the need for dilution, and can be employed as an alternative method or
complement existing GC/HPLC methods for the routine monitoring of highly-
polluted styrene and BTEXS-contaminated industrial effluents.
Table 3.3 Optimized protocol for HPLC-DAD analysis of styrene and BTEXS.
Parameter Styrene BTEXS
Column Acclaim Phenyl-1 reversed-phase column
(4.6 x 150 mm, 3 µm)
Column oven temperature 50 °C
Autosampler temperature 15 °C
Detector DAD
Detection wavelength 201 nm
Mobile phase solvent Methanol
Solvent/water (%/%) mobile
phase composition 70/30 55/45 to 60/40
Sample injection volume Up to 20 µL Up to 10 µL
Flow rate Up to 2.0 mL.min-1
Analysis time 4.5 min 5.5 min
76
3.5 Summary
A simple, rapid and reliable HPLC-DAD detection method for the direct analysis of
aqueous samples containing high styrene concentration or high BTEXS
concentrations was developed. The analysis of a single styrene compound could be
completed in under 4.5 min using a 70%/30% methanol/water mobile phase and
flow rate of 1.2 mL.min-1
. For the analysis of BTEXS mixture, the optimal HPLC
operation parameters, which provided high resolution of close to or greater than 1.5
for adjacent analyte peaks, were determined to be 55 to 60% methanol for mobile
phase, a maximum of 10 µL for sample injection volume, up to 2.0 mL.min-1
for
flow rate, and a detection wavelength of 201 nm. Under the optimal conditions,
chromatographic separation of concentrated BTEXS samples was completed within
5.5 min. To our knowledge, the method is also the first to demonstrate the
feasibility of chromatographic separation of styrene together with BTEX, expanding
the range of aromatic compounds detected in a single run. The method is versatile
in its applicability for trace analysis of styrene, toluene, ethylbenzene and xylenes
as well as direct analysis of BTEXS at high aqueous concentrations. Several
advantages of the proposed method include protocol simplification, high analysis
throughput, minimal sample loss, less solvent waste generation and lower price of
analysis. These key developments are immensely important and beneficial for both
field engineers and researchers alike, who have to perform routine monitoring or
handle a large number of samples.
77
CHAPTER 4
Study 2:
Development of a GC-MS Method for PHA
Detection
78
4.1 Introduction
PHA is a family of biopolyesters consisting of (R)-3-hydroxyalkanoic acids repeat
units of varying carbon lengths (Verlinden et al., 2007). Depending on the
functional R group, PHA may be classified as SCL-PHA (3 to 5 carbon atoms),
MCL-PHA (6 to 14 carbon atoms), LCL-PHA (15 or more carbon atoms) (Khanna
& Srivastava, 2005). The chemical heterogeneity of PHA monomers has made the
task of detecting and quantifying PHA a laborious and difficult one.
GC-FID is one of the most commonly-used methods (Furrer et al., 2007; Wang et
al., 2006). However, the robustness of GC-FID to identify and quantify PHA is
greatly dependent on the selection and inclusion of appropriate PHA analytical
standards. On the other hand, GC-MS enables putative PHAs to be identified
through the comparison of mass spectra pattern against the National Institute of
Standards and Technology (NIST) Standard Reference Library, which makes it
more robust in the detection of new putative PHAs (Lee & Choi, 1995; Lütke-
Eversloh et al., 2001). Nevertheless, GC-MS can only provide a tentative
identification of PHA. Further validation using suitable PHA analytical standards is
pivotal in ensuring the accuracy of the detection method.
Currently, the lack of readily- or commercially-available PHA analytical standards
to represent the chemical diversity of PHA monomers has made its analysis
particularly challenging (Escapa et al., 2011; Furrer et al., 2007). Existing literary
descriptions of GC-MS method are mostly confined to commercially-available PHA
standards (Oehmen et al., 2005; Werker et al., 2008). Some of the ways to
circumvent this problem include the chemical synthesis of PHA analytical standards
or deriving analytical standards through the biosynthesis of PHA by well-
characterized PHA accumulators (Sun et al., 2009); using commercially-available
PHA analytical standards to quantify chemically-similar but commercially-
unavailable PHA monomers (Oehmen et al., 2005). Furthermore, for each analyte,
system calibration typically requires at least 3 calibration points with 3 to 5
independent calibration standard samples for each calibration point. This represents
significant calibration workload and calibration cost. A combination of GC-MS (for
79
tentative identification of PHA monomers) and GC-FID (for the routine
quantification of PHA monomers identified by GC-MS) (Ward et al., 2006) can
keep calibration workload manageable and calibration cost low. However, these
aforementioned approaches may lead to errors in measurements, and can be a
tedious, time-consuming and expensive process. This warrants a need to develop a
GC-MS calibration method which minimizes calibration workload and cost while
enabling the analysis of a wide range of PHA monomers with a limited inventory of
PHA analytical standards.
GC-MS calibration for hydrocarbon compounds such as PHA is typically performed
through calculating a response factor (RF) for each PHA analytical standard while
the identification of PHA is done by comparing the retention times (RTs) of the
putative PHAs against the RTs of analytical standards (Lee & Choi, 1995; Werker
et al., 2008). Previous studies have reported correlations between the carbon
number (i.e., molecular weight) of homologous hydrocarbon series and RF
(Jorgensen et al., 1990; Tong et al., 1985), as well as between carbon number and
retention indices (Castello, 1999). These correlations can help to estimate the RF
and RT of other hydrocarbon homologues for which analytical standards are
unavailable. This study postulated that such correlations may also exist between the
carbon number and RF/RT for homologous PHAs. Based on this postulation, the
objective of this study was to develop a simple GC-MS calibration method that
enables reliable qualitative and quantitative analysis of PHAs in the absence of
reference standards using homologous saturated PHA monomers 3-hydroxyalkanoic
acids between carbon number 4 and 16.
4.2 Materials and Methods
4.2.1 PHA monomers, PHA polymers and chemicals
All PHA monomer analytical standards and PHA polymers were procured from
Sigma-Aldrich (St Louis, MO, USA). The PHA monomer standards included 3-
hydroxybutyric acid (C4; Cat. no. 54920), 3-hydroxyoctanoic acid (C8; Cat. no.
H3898), 3- hydroxydecanoic acid (C10; Cat. no. H3648), 3-hydroxydodecanoic acid
(C12; Cat. no. H3398) and 3-hydroxyhexadecanoic acid (C16; Cat. no. H4398). The
80
PHA polymers included poly(3-hydroxybutyric acid) (P3HB; Cat. no. 363502),
poly(3-hydroxybutyric acid-co-3-hydroxyvaleric acid) containing between 11 and
13 mol% of C5 monomeric unit (P3HB3HV; Cat. no. 403121), and a MCL-PHA
polymer with composition verified by proton nuclear magnetic resonance (H1-NMR)
and carbon-13 nuclear magnetic resonance (C13
-NMR) as C10 monomeric repeats
(Figure A1). The internal analytical standard methyl benzoate was procured from
Merck (Darmstadt, Germany). Chemicals used for the methanolysis reaction
included sulphuric acid (Merck, Darmstadt, Germany), LiChrosolv® grade
methanol (Merck, Darmstadt, Germany) GC grade chloroform (Sigma-Aldrich, St
Louis, MO, USA), and anhydrous sodium sulfate (Alfa Aesar, Ward Hill, MA).
4.2.2 PHA analytical standard preparation
PHA monomer analytical standards were subjected to acidic methanolysis to yield
their constituent 3-hydroxyalkanoic acid methyl esters according to the procedure
adapted from Oehmen et al. (2005) and Wang et al. (2010). Briefly, 5 mg (1250
mg.L-1
) of PHA monomer standard was dissolved in the methanolysis solution
comprising of 2 mL of chloroform and 2 mL of acidified methanol (15% [v/v]
H2SO4). Stock solution of methyl benzoate was prepared by dilution in methanol
and added to the methanolysis mixture at a final concentration of 5 mg.L-1
as an
internal standard. The methanolysis reaction was performed in 9 mL pyrex test
tubes tightly-capped with Teflon-lined screw caps and incubated at 100 °C for 3 h
on a dry-block heater (Grant Instruments, Cambridge, UK). The reaction mixture
was subsequently cooled to room temperature. Ultrapure water (1 mL) was added
and the mixture was vortex vigorously for 1 to 2 min to remove particulate debris
from the chloroform phase. The mixture was left to stand for 1 h to allow phase
separation. Using a glass pipette, the top layer (water) was removed. The bottom
layer (chloroform) was dried with 0.5 to 1 g of anhydrous sodium sulphate before
transferring into amber GC vials and crimp-sealed with aluminum cap with Teflon-
lined septa.
4.2.3 GC-MS analysis
Methanolysed sample (1 μL) was injected at a split ratio of 50:1 into a HP6890 GC
81
Series equipped with the 5975I MS detector (Agilent Technologies, Palo Alto,
Calif). Chromatographic analysis was achieved on a HP-5MS capillary column (30
m by 0.25 mm, 0.25-μm film thickness; Agilent Technologies, Palo Alto, Calif).
The temperatures of the injection port, interface, quadrupole and ion source was set
at 250, 280, 120 and 250 °C, respectively. Oven temperature was programmed at an
initial temperature of 40 °C and subsequently raised with a rate of 10 °C.min-1
to
280 °C and held for 5 min. Helium was used as a carrier gas at a flow rate of 1.2
mL.min-1
. Solvent delay was set at 2.5 min. The mass spectrometer setup was
operated in electron impact (EI) mode at 70 eV, full scans (mass range of m/z 40 to
600 with 0.1 mass accuracy).
4.2.4 Data collection and analysis
Data collection was performed by HPChem Station software (Hewlett-Packard,
Palo Alto, Calif). The observed response factor for each PHA monomer analytical
standard was calculated using the expression:
Response factor, RF = (AA x Ci)/(Ai x CA) Eq (4.1)
where is AA the sum of peak areas of the four main fragment ions of the PHA
analytical standard (i.e., m/z 43, 71, 74 and 103 ions), Ai is the peak area of the
characteristic m/z 105 ion of the methyl benzoate internal standard, and CA and Ci
are the concentrations of the PHA analytical standard and methyl benzoate internal
standard, respectively.
The relationships between the carbon number of PHA analytical standards and their
respective RTs as well as their respective RFs were analyzed using
OriginPro 8.5.1 (OriginLab Corporation, Northampton, MA, USA).
4.2.5 Method recovery
The method recovery for PHA quantification was determined by subjecting known
amounts of PHA monomers and PHA polymers to acidic methanolysis followed by
GC-MS analysis. The concentration of PHA monomers (C4/C8/C10/C12/C16) used
82
was 5 mg (i.e., 1250 mg.L-1
) while the concentration of PHA polymers used was 5.1
mg (i.e.,1275 mg.L-1
) for PHB, between 27.7 mg and 31.1 mg (i.e.,6925 and 7775
mg.L-1
) for PHBHV pellets, and between 5 mg and 7.7 mg (i.e.,1250 and 1925
mg.L-1
) for MCL-PHA. Methyl benzoate (5 mg.L-1
) was included as an internal
standard. Recovery was calculated as a percentage of deviation of the measured
values from the actual values using the following expression:
Method recovery (%) = [(Wm - WA)/(WA)] 100% Eq (4.2)
where Wm and WA are the calculated weight and actual weight of the PHAs,
respectively.
4.3 Results
4.3.1 GC-MS detection of PHA monomers
Homologous saturated PHA monomers with alkyl R groups, 3-hydroxyalkanoic
acids, were chosen for this study due to the commercial-availability of these
analytical standards, providing a good starting point for testing this study‟s
postulation. 3-hydroxyalkanoic acids of varying carbon number ranging from SCL-
PHA monomer (C4), to MCL-PHA monomers (C8, C10, C12) and LCL-PHA
monomer (C16) were subjected to methanolysis and GC-MS analysis. The
methanolysis reaction chemically converted 3-hydroxyalkanoic acids to their
respective 3-hydroxyalkanoic acid methyl esters (Figure 4.1). Under the GC-MS
conditions, the observed RTs of the different 3-hydroxyalkanoic acid methyl esters
were as follow: C4, 4.69 min; C8, 10.88 min; C10, 13.67 min; C12, 16.09 min; and
C16, 20.28 min (Figure 4.2 and Table 4.1). An increase in the carbon number of
PHA monomer was correlated to an increase in RT. Internal standard methyl
benzoate was detected at 8.53 min. The mass spectra of the 3-hydroxyalkanoic acid
methyl esters were characteristic of fragmentation patterns previously reported (de
Rijk et al., 2005), with a fragment ion at m/z 103, formed by an α cleaveage to the
hydroxyl functional group; at m/z 74, arising from McLafferty rearrangement; at
m/z 71, possibly from the expulsion of methanol from m/z 103; and at m/z 43,
attributed to either the saturated alkanoic portion or methyl ester moiety of the
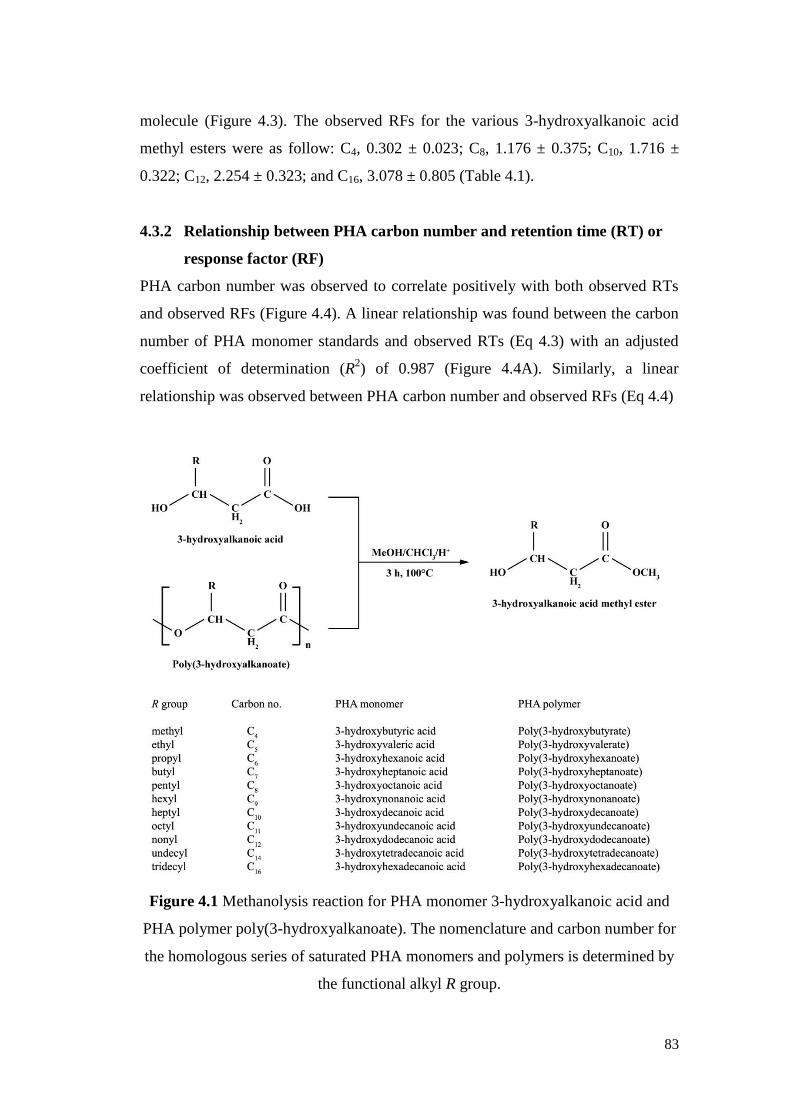
83
molecule (Figure 4.3). The observed RFs for the various 3-hydroxyalkanoic acid
methyl esters were as follow: C4, 0.302 ± 0.023; C8, 1.176 ± 0.375; C10, 1.716 ±
0.322; C12, 2.254 ± 0.323; and C16, 3.078 ± 0.805 (Table 4.1).
4.3.2 Relationship between PHA carbon number and retention time (RT) or
response factor (RF)
PHA carbon number was observed to correlate positively with both observed RTs
and observed RFs (Figure 4.4). A linear relationship was found between the carbon
number of PHA monomer standards and observed RTs (Eq 4.3) with an adjusted
coefficient of determination (R2) of 0.987 (Figure 4.4A). Similarly, a linear
relationship was observed between PHA carbon number and observed RFs (Eq 4.4)
Figure 4.1 Methanolysis reaction for PHA monomer 3-hydroxyalkanoic acid and
PHA polymer poly(3-hydroxyalkanoate). The nomenclature and carbon number for
the homologous series of saturated PHA monomers and polymers is determined by
the functional alkyl R group.
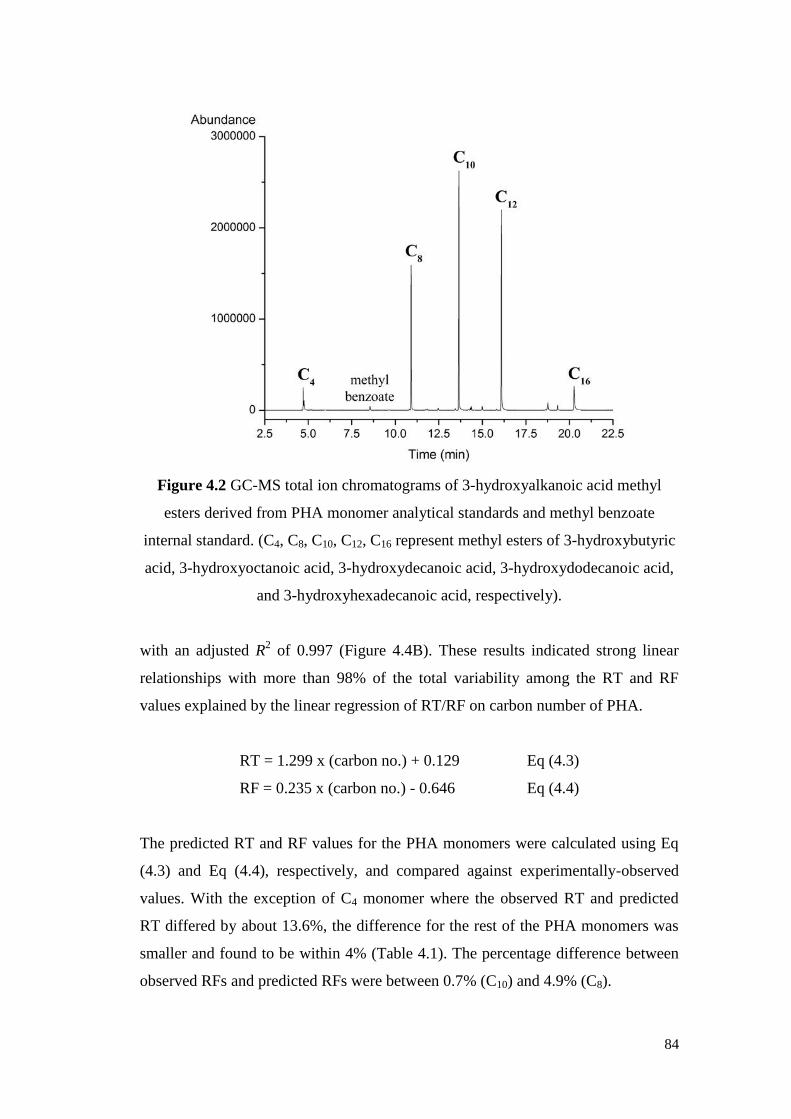
84
Figure 4.2 GC-MS total ion chromatograms of 3-hydroxyalkanoic acid methyl
esters derived from PHA monomer analytical standards and methyl benzoate
internal standard. (C4, C8, C10, C12, C16 represent methyl esters of 3-hydroxybutyric
acid, 3-hydroxyoctanoic acid, 3-hydroxydecanoic acid, 3-hydroxydodecanoic acid,
and 3-hydroxyhexadecanoic acid, respectively).
with an adjusted R2 of 0.997 (Figure 4.4B). These results indicated strong linear
relationships with more than 98% of the total variability among the RT and RF
values explained by the linear regression of RT/RF on carbon number of PHA.
RT = 1.299 x (carbon no.) + 0.129 Eq (4.3)
RF = 0.235 x (carbon no.) - 0.646 Eq (4.4)
The predicted RT and RF values for the PHA monomers were calculated using Eq
(4.3) and Eq (4.4), respectively, and compared against experimentally-observed
values. With the exception of C4 monomer where the observed RT and predicted
RT differed by about 13.6%, the difference for the rest of the PHA monomers was
smaller and found to be within 4% (Table 4.1). The percentage difference between
observed RFs and predicted RFs were between 0.7% (C10) and 4.9% (C8).
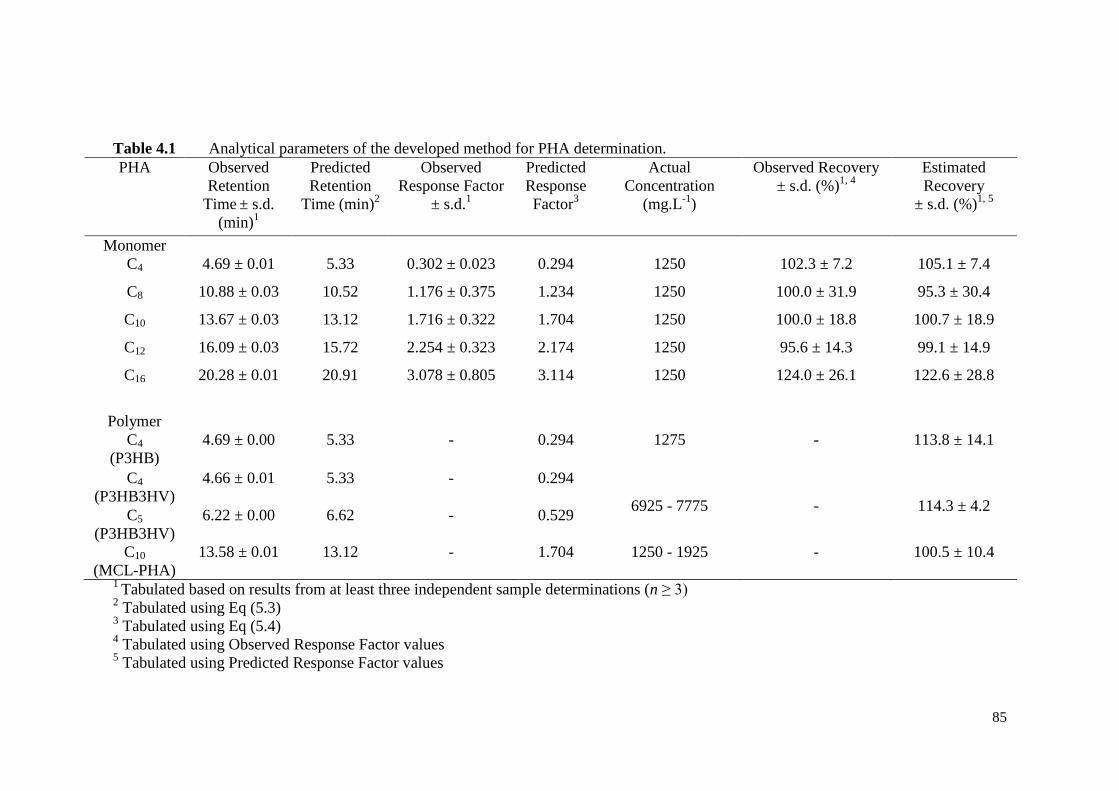
85
Table 4.1 Analytical parameters of the developed method for PHA determination.
PHA Observed
Retention
Time ± s.d.
(min)1
Predicted
Retention
Time (min)2
Observed
Response Factor
± s.d.1
Predicted
Response
Factor3
Actual
Concentration
(mg.L-1
)
Observed Recovery
± s.d. (%)1, 4
Estimated
Recovery
± s.d. (%)1, 5
Monomer
C4 4.69 ± 0.01 5.33 0.302 ± 0.023 0.294 1250 102.3 ± 7.2 105.1 ± 7.4
C8 10.88 ± 0.03 10.52 1.176 ± 0.375 1.234 1250 100.0 ± 31.9 95.3 ± 30.4
C10 13.67 ± 0.03 13.12 1.716 ± 0.322 1.704 1250 100.0 ± 18.8 100.7 ± 18.9
C12 16.09 ± 0.03 15.72 2.254 ± 0.323 2.174 1250 95.6 ± 14.3 99.1 ± 14.9
C16 20.28 ± 0.01 20.91 3.078 ± 0.805 3.114 1250 124.0 ± 26.1 122.6 ± 28.8
Polymer
C4
(P3HB)
4.69 ± 0.00 5.33 - 0.294 1275 - 113.8 ± 14.1
C4
(P3HB3HV)
4.66 ± 0.01 5.33 - 0.294
6925 - 7775 - 114.3 ± 4.2 C5
(P3HB3HV)
6.22 ± 0.00 6.62 - 0.529
C10
(MCL-PHA)
13.58 ± 0.01 13.12 - 1.704 1250 - 1925 - 100.5 ± 10.4
1 Tabulated based on results from at least three independent sample determinations (n ≥ 3)
2 Tabulated using Eq (5.3)
3 Tabulated using Eq (5.4)
4 Tabulated using Observed Response Factor values
5 Tabulated using Predicted Response Factor values
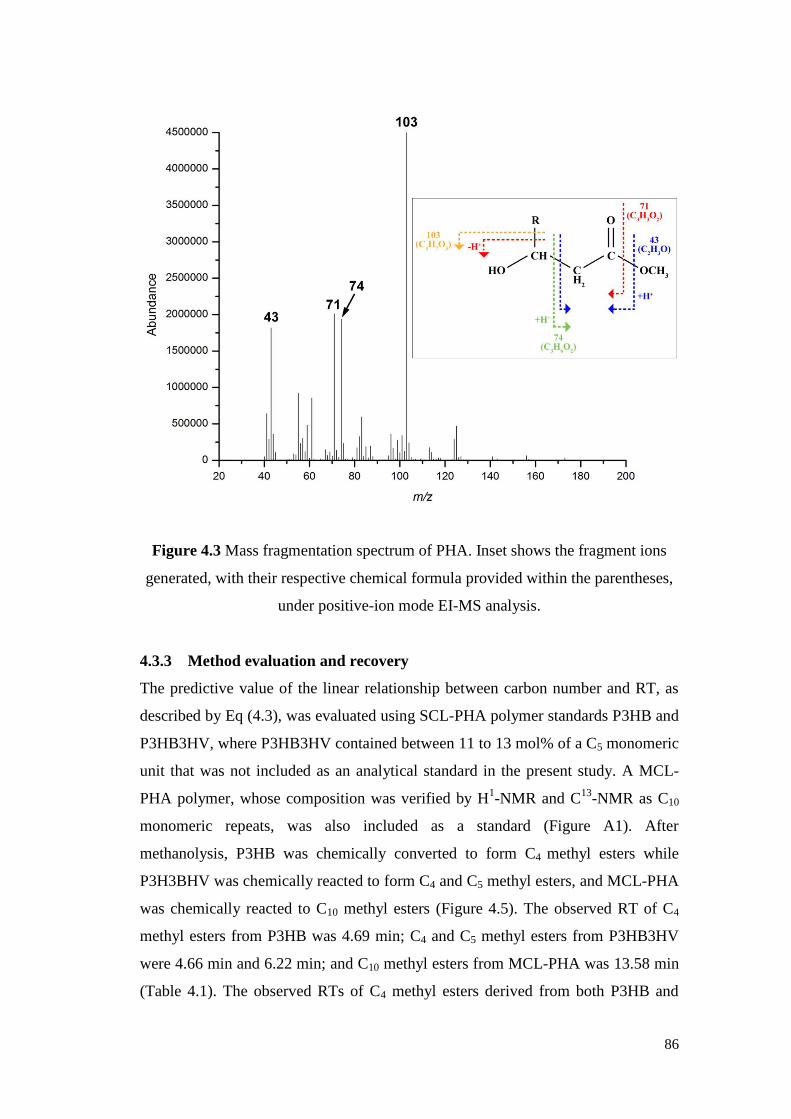
86
Figure 4.3 Mass fragmentation spectrum of PHA. Inset shows the fragment ions
generated, with their respective chemical formula provided within the parentheses,
under positive-ion mode EI-MS analysis.
4.3.3 Method evaluation and recovery
The predictive value of the linear relationship between carbon number and RT, as
described by Eq (4.3), was evaluated using SCL-PHA polymer standards P3HB and
P3HB3HV, where P3HB3HV contained between 11 to 13 mol% of a C5 monomeric
unit that was not included as an analytical standard in the present study. A MCL-
PHA polymer, whose composition was verified by H1-NMR and C
13-NMR as C10
monomeric repeats, was also included as a standard (Figure A1). After
methanolysis, P3HB was chemically converted to form C4 methyl esters while
P3H3BHV was chemically reacted to form C4 and C5 methyl esters, and MCL-PHA
was chemically reacted to C10 methyl esters (Figure 4.5). The observed RT of C4
methyl esters from P3HB was 4.69 min; C4 and C5 methyl esters from P3HB3HV
were 4.66 min and 6.22 min; and C10 methyl esters from MCL-PHA was 13.58 min
(Table 4.1). The observed RTs of C4 methyl esters derived from both P3HB and
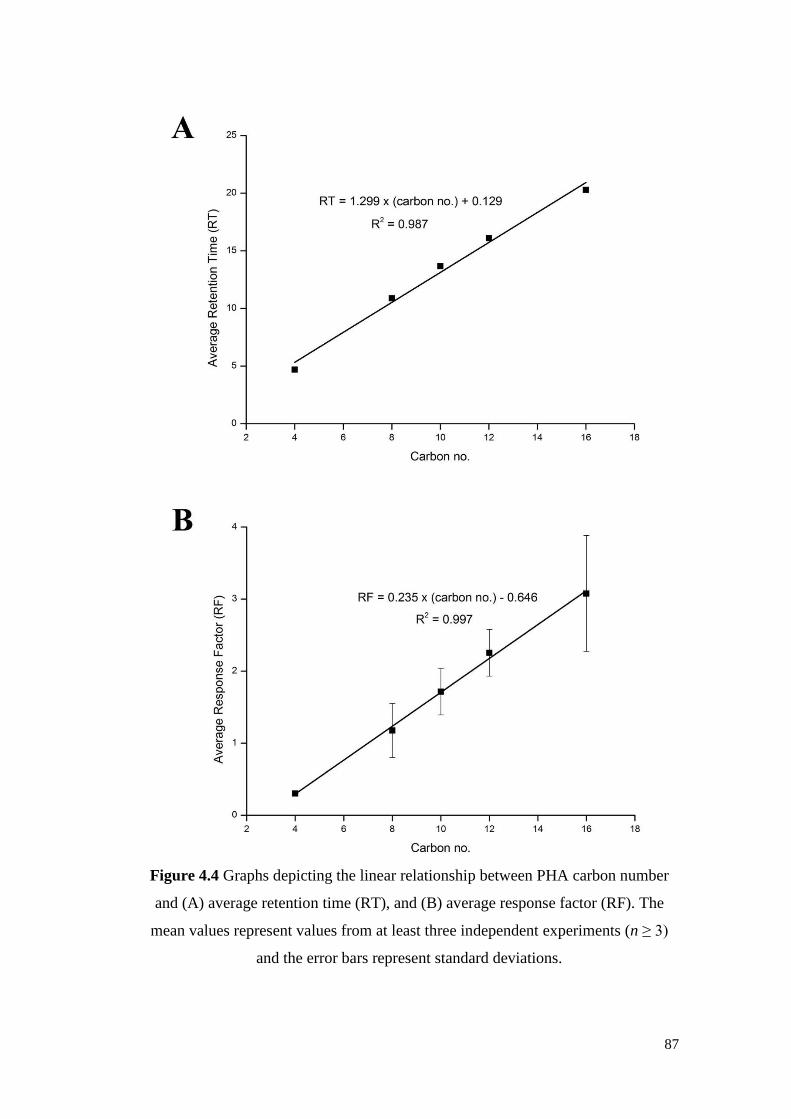
87
Figure 4.4 Graphs depicting the linear relationship between PHA carbon number
and (A) average retention time (RT), and (B) average response factor (RF). The
mean values represent values from at least three independent experiments (n ≥ 3)
and the error bars represent standard deviations.
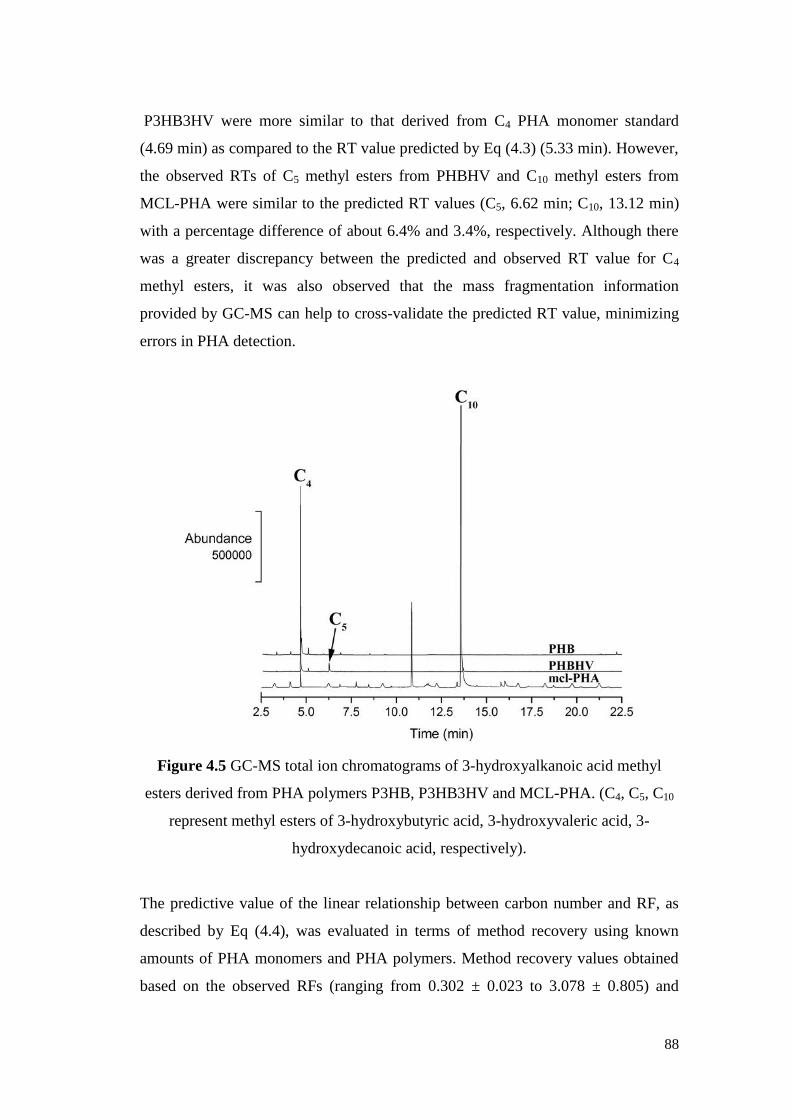
88
P3HB3HV were more similar to that derived from C4 PHA monomer standard
(4.69 min) as compared to the RT value predicted by Eq (4.3) (5.33 min). However,
the observed RTs of C5 methyl esters from PHBHV and C10 methyl esters from
MCL-PHA were similar to the predicted RT values (C5, 6.62 min; C10, 13.12 min)
with a percentage difference of about 6.4% and 3.4%, respectively. Although there
was a greater discrepancy between the predicted and observed RT value for C4
methyl esters, it was also observed that the mass fragmentation information
provided by GC-MS can help to cross-validate the predicted RT value, minimizing
errors in PHA detection.
Figure 4.5 GC-MS total ion chromatograms of 3-hydroxyalkanoic acid methyl
esters derived from PHA polymers P3HB, P3HB3HV and MCL-PHA. (C4, C5, C10
represent methyl esters of 3-hydroxybutyric acid, 3-hydroxyvaleric acid, 3-
hydroxydecanoic acid, respectively).
The predictive value of the linear relationship between carbon number and RF, as
described by Eq (4.4), was evaluated in terms of method recovery using known
amounts of PHA monomers and PHA polymers. Method recovery values obtained
based on the observed RFs (ranging from 0.302 ± 0.023 to 3.078 ± 0.805) and
89
predicted RFs (ranging from 0.294 to 3.114) were compared. Based on predicted
RF values, the estimated recovery for all the tested PHA monomers (i.e., C4, C8, C10,
C12, and C16) were between 95.3 ± 30.4% and 122.6 ± 28.8%, which were similar to
the recovery values obtained using observed RF values (between 95.6 ± 14.3% and
124.0 ± 26.1%) (Table 4.1). For PHA polymers, the estimated recoveries for P3HB
and MCL-PHA were 113.8 ± 14.1% and 100.5 ± 10.4%, respectively. To quantify
the estimated recovery for P3HB3HV, the predicted RF values for both C4 and C5
methyl esters had to be considered. Based on Eq (4.4), the RF value for C4 and C5
methyl esters was predicted to be 0.294 and 0.529, respectively (Table 4.1).
According to the predicted RF values, the estimated recovery was 114.3 ± 4.2%.
The estimated recovery values for all tested PHA polymers were within the range of
80 to 120%, which is the acceptable range according to the quality control criteria
prescribed for most US EPA methods. In addition, the monomeric composition of
P3HB3HV was found to be 90.6 ± 1.5 mol% of C4 monomer and 9.4 ± 1.5 mol% of
C5 monomer, which was a reasonable estimation of the actual values (i.e.,87 to 89
mol% of C4 monomer and 11 to 13 mol% of C5 monomer).
4.4 Discussion
PHA biopolymers usually comprised of several kinds of monomeric units, some of
which may not have readily-available analytical standards. This study attempted to
overcome this issue by developing a GC-MS calibration method based on the
relationship between the carbon number of homologous saturated PHA monomers
and their respective RT and RF. The carbon number of PHA monomers was found
to correlate with RT and RF in a linear fashion, which can be described by Eq (4.3)
and Eq (4.4), respectively (Figure 4.4). The adjusted R2 values were more than 0.98
for both equations, indicating the high strength of the linear relationships. This also
suggested that the equations may enable the RT and RF of saturated PHA
monomeric homologues to be estimated with high accuracy. Such correlations have
been previously demonstrated for homologous series of n-alkanes (Tong et al.,
1985), ketones, secondary alcohols, nitrogen heterocycles, and etc (Jorgensen et al.,
1990). To our best knowledge, the present study presents the first reference
demonstrating these linear correlations for PHA monomers under GC-MS analysis.
90
The linear equation Eq (4.3) was used to predict the RTs for various PHA
monomers and polymers. The predicted RT values were generally found to be a
reasonable estimate of the observed values. No more than 6.4% difference was
found between the predicted and observed RT values for PHA polymers and most
of the PHA monomers tested (Table 4.1). Most notably, in the absence of a C5
analytical standard, the RT of C5 methyl esters from P3HB3HV was predicted as
6.62 min, which was similar to the observed value of 6.27 min. The only exception
was C4 methyl esters derived from C4 PHA monomer, P3HB and P3HB3HV where
a 13.6% difference was observed. It appears that Eq (4.3) may provide a more
reliable estimation of RT for methyl esters of PHA with C5 or higher carbon number,
and was less reliable in estimating the RT for C4 methyl esters. Nevertheless, the
discrepancy between predicted and observed RT values can be easily overcome by
cross-validating with mass fragmentation information. As such, Eq (4.3) proved to
be useful in providing a reliable estimation for the RTs of homologous PHA,
especially when coupled with mass spectra information.
Likewise, RF values predicted by Eq (4.4) (i.e., 0.294 to 3.114) proved to be a close
estimate of the observed RF values (i.e., 0.302 ± 0.023 to 3.078 ± 0.805) (Table 4.1).
This was supported by further evaluation in terms of method recovery using known
amounts of PHA monomers and polymers. For PHA monomers, the estimated
recovery values calculated based on predicted RFs (between 95.3 ± 30.4% and
122.6 ± 28.8%) were similar to the observed recovery values obtained using
observed RF values (i.e., between 95.6 ± 14.3% and 124.0 ± 26.1%). For PHA
polymers P3HB and MCL-PHA, the estimated recovery values were 113.8 ± 14.1%
and 100.5 ± 10.4%, respectively. Importantly, Eq (4.4) could reliably predict the RF
value for C5 monomer (0.529), which was omitted from method development in this
present study, and together with the predicted RF values for C4 monomer (0.294),
yielded an estimated recovery for P3HB3HV of 114.3 ± 4.2%. As such, the
estimated recovery values for all tested PHA polymers fell within the range of 80 to
120%, which is the acceptable range according to the quality control criteria
prescribed for most US EPA methods. Furthermore, the predicted RF values
91
estimated the monomeric composition of P3HB3HV as 90.6 ± 1.5 mol% of C4
monomer and 9.4 ± 1.5 mol% of C5 monomer, which was similar to the actual
values (i.e.,87 to 89 mol% of C4 monomer and 11 to 13 mol% of C5 monomer).
These findings highlighted that Eq (4.4) could predict RF values for homologous
saturated PHA monomers with high accuracy and the predicted RFs could be
applied to the quantification of both PHA homopolymers as well as PHA
copolymers even in the absence of some analytical standards.
Collectively, the results suggested that the proposed method can provide a reliable
identification and quantification of saturated PHA monomer homologues between
the carbon number of C4 and C16. The proposed method may be particularly
advantageous in facilitating the analysis of some saturated PHA monomers with
odd-number carbon length for which analytical standards are less readily available
or expensive to procure (Mittendorf et al., 1998). This also eliminates the need to
include a full spectrum of PHA standards. The proposed method resulted in
calibration protocol simplification, significantly reducing the number of calibration
points and calibration standard samples. This leads to an 80% decreased in
calibration workload and cost.
It should be noted that the present study dealt with only saturated PHAs with alkyl
functional R groups, which are by no means exhaustive of all the PHAs currently
known to science. There are many types of PHA that currently exist without
readily-available commercial standards. These PHAs include most unsaturated
PHAs (Furrer et al., 2007) and branched PHAs (Lu et al., 2009). The chemical and
physical modifications of naturally-occurring PHAs (Olivera et al., 2010; Zinn &
Hany, 2005) and the creation of genetically-modified organisms (GMOs) to
produce PHAs with specialized functional groups (Escapa et al., 2011) has led to
the rapid development of new types of PHAs. While GC-MS is able to provide a
tentative identification of these unconventional PHAs, the analysis currently needs
to be further supported by NMR methods for compound validation and
quantification (Escapa et al., 2011). Nevertheless, it is anticipated that as more PHA
analytical standards become available, the present study may serve as a
92
methodological reference upon which GC-MS calibration methods for other types
of PHA could be similarly modeled after.
4.5 Summary
A GC-MS calibration method which could be applied to reliably detect and quantify
PHA polymers and a series of PHA monomer using a limited number of analytical
standards was successfully developed. Through this study, the carbon number of a
homologous saturated PHA monomer series (C4/C8/C10/C12/C16) was observed as
having a strong linear relationship with its respective RT (adjusted R2 of 0.987) and
RF (adjusted R2 of 0.997). The linear equations describing PHA carbon number and
RT (RT = 1.299 x [carbon no.] + 0.129), and PHA carbon number and RF (RF =
0.235 x [carbon no.] - 0.646) could predict RT and RF values within 4.9% accuracy
of experimentally-observed values for most of the PHA monomers tested (i.e.,
C8/C10/C12/C16 monomers). The only exception was the predicted RT value for C4
monomer which differed from the observed RT value by 13.6%. Nevertheless,
cross-validation with mass fragmentation information was found to minimize error
in the detection of C4 monomer. Method recovery values for known amounts of
PHA monomers were estimated at between 95.3 ± 30.4% and 122.6 ± 15.11%,
which were similar to the experimentally-observed values (between 95.6 ± 14.3%
and 124.0 ± 26.1%). The calibration method was successfully applied to the
quantification of known amounts of PHA homopolymers P3HB and C10-containing
MCL-PHA with estimated recovery values of 113.8 ± 14.1% and 114.3 ± 4.2%,
respectively. In the absence of C5 PHA standard, the method was demonstrated to
facilitate the detection and quantification of P3HB3HV copolymer, predicting a RT
value of 6.62 min for C5 monomer which was similar to the observed value (6.22
min) and an estimated recovery value of 100.5 ± 10.4%. This method is
advantageous in its simplification of calibration work, and in facilitating the
detection and quantification of PHA polymer, particularly when PHA polymer
comprises of several different PHA monomers and where analytical standards are
expensive or less readily available.
93
CHAPTER 5
Study 3:
Investigation of the Bacterial Community Structure
of Styrene-Enriched Activated Sludge
94
5.1 Introduction
The industrial production of PS plastics is primarily responsible for styrene-laden
wastewater and off-gas generation (Abduli et al., 2006; Tossavainen, 1978). Mixed
microbial cultures, such as activated sludge, are frequently applied for the
bioremediation of styrene-laden effluent and contaminated soil (Dehghanzadeh et
al., 2005; Fallah et al., 2010; Greene et al., 2000). Bioremediation also offers the
possibility for bioconverting waste into valuable PHA products, with potential
benefits to lower PHA production cost and off-set biological treatment cost through
PHA recovery. The feasibility of this concept was demonstrated for waste carbon
substrates from various organic wastestreams (i.e., biodiesel wastewater, oily waste
and VFAs); depending on the microbial community structure as well as operating
conditions, mixed cultures could accumulate between 1% CDM and 67% CDM
cellular PHA content (Dobroth et al., 2011; Salehizadeh & Van Loosdrecht, 2004;
Serafim et al., 2008). However, the production of MCL-PHA from styrene using
mixed cultures currently remains an unproven concept. Hence, an examination of
the styrene-degrading microbial consortium could serve as a knowledge base for
identification of suitable seeding sludge, process optimization, bioaugmentation and
formulation of defined microbial cocktails, aimed at enhancing styrene elimination
and expanding the biological process for simultaneous MCL-PHA production.
The biofilter and soil styrene-degrading microbial consortium were previously
investigated using both culture-dependent and culture-independent approaches.
Culture-dependent method, such as isolation, and a combination of culture-
dependent method and culture-independent method, such as reverse sample genome
probing (RSGP), has identified the presence of biofilter and soil styrene-degrading
bacterial species from the genera Pseudomonas, Azospirillum, Rhodococcus,
Alcaligenes, Tsukamurella, Sphingomonas, and Xanthomonas, which belonged to
the phyla Proteobacteria and Actinobacteria (Arnold et al., 1997; Greene et al.,
2000). Through the use of culture-independent methods alone, the styrene-
degrading microbial community was discovered to be a far more diverse
community. PLFA analysis, using isotope-labeled styrene, indicated the presence of
biofilter bacterial members from the phyla Proteobacteria, Actinobacteria,
95
Firmicutes, as well as some unidentified microbial players (Alexandrino et al.,
2001). Pyrosequencing provided an even more detailed insight into the biofilter
microbial community, revealing sixteen bacterial phyla and an unclassified bacterial
phylum (Portune et al., 2015). While much information on the styrene-degrading
microbial consortia could be gleaned from non- and semi-aqueous environments
such as biofilters and contaminated soil studies, these styrene-degrading microbial
communities reportedly evolve differently to adapt to various environs (Tresse et al.,
2002), which meant that the existing information may not accurately describe the
microbial population in aqueous environments. The objective of this study is to
bridge this research gap by investigating the aqueous microbial community
composition, under prolonged styrene enrichment, with the use of next-generation
16S rDNA sequencing technique.
5.2 Materials and Methods
5.2.1 Operation of styrene-degrading bioreactor and sample collection
The styrene-degrading bioreactor was a 2 L glass reactor with 1.4 L working
volume. Enriched domestic activated sludge, obtained from a BTEXS-degrading
reactor following 15 months of enrichment on BTEXS, were inoculated to 1X
mineral salt medium (MSM) at total suspended solids (TSS) and volatile suspended
solids (VSS) values of 3.33 g.L-1
and 3.07 g.L-1
, respectively. The cultivation
medium comprised of 3.70 g.L-1
KH2PO4, 5.80 g.L-1
K2HPO4, 0.2 g.L-1
MgSO4.7H2O, and 1.0 mL.L-1
microelements solution (2.78 g.L-1
FeSO4.7H2O,
1.98 g.L-1
MnCl2.4H2O, and 2.81 g.L-1
CoSO4.7H2O, 1.67 g.L-1
CaCl2.2H2O, 0.17
g.L-1
CuCl2.2H2O and 0.29 g.L-1
ZnSO4.7H2O in 0.1 M HCl). The pH of MSM
was adjusted to 7.2 using 3 M NaOH. Nitrogen source, in the form of (NH4)2SO4,
was added at 16 mM. Liquid styrene was added weekly at 1.8 mM as the sole
carbon source. The cultivation medium was replaced with fresh medium weekly.
Due to the volatile nature and therefore, short liquid retention time of styrene, the
substrate was also continuously delivered in a gaseous form as part of the aeration
source in order to ensure constant exposure of sludge microogranisms to styrene.
This was achieved by placing a styrene reservoir in between the bioreactor and an
aeration pump. The aeration pump delivered atmospheric air into the styrene
96
reservoir inducing the volatilization of styrene. The gaseous mixture, consisting of
atmospheric air and styrene was delivered to the bioreactor via an air sparger at a
flow rate of 440 ± 7.5 mL.min-1
, which delivered gaseous styrene to the reactor at
an average rate of 0.55 ± 0.03 g.h-1
. The bioreactor was operated for a total of 19.5
months. De-sludging was performed after 16 months of operation where 50%
sludge volume was removed, reducing TSS and VSS values to 13.08 g.L-1
and 9.77
g.L-1
, respectively. Sludge samples (2 mL) were collected at various time points
during the operation period (0, 3, 11, 17 and 19.5 months). The samples were
centrifuged at 9,425 g, 15 °C for 5 min and the supernatant was discarded, leaving
behind the sludge pellet. The sludge pellets were stored at -20 °C prior to total
genomic DNA extraction.
5.2.2 Styrene biodegradation batch experiment
The styrene degradation test was carried out in a 60 mL amber glass serum bottle
with a total working volume of 6.7 mL and 53.3 mL of headspace. The bottle was
first filled with 1X MSM containing 16 mM of (NH4)2SO4. Liquid styrene was
added to the cultivation medium at 2.3 mM, which also corresponded to a total
amount of 1.65 mg. After styrene addition, the serum bottle was immediately
crimp-sealed with Telfon-lined silicone septum and aluminum crimp cap, and
incubated overnight at 30 °C to allow for liquid-gas partitioning of styrene. Sludge,
taken from the styrene-degrading bioreactor after 16 months of enrichment, was
added into the serum bottle at a concentration of 300 VSS mg.L-1
. Sludge addition
was performed via injection using a plastic syringe with needle attached. Negative
control containing 300 VSS mg.L-1
of double-autoclaved sludge (i.e., sludge which
has been autoclaved twice), and empty control containing only the cultivation
medium without any sludge addition were similarly set up. The serum bottles were
incubated at 30 °C with shaking at 120 rpm for 48 h. Styrene determinations were
performed at 0, 2, 4, 6, 8 and 10 h. One bottle of setup, negative control and empty
control were sacrificed for each analysis. For aqueous styrene determination, 2 mL
of liquid culture was drawn from the serum bottle using a glass syringe with a
needle attached. Liquid culture was filtered through a 0.45 µm regenerated cellulose
(RC) filter membrane (Satorius Stedim, Germany). The filtrate was collected in and
97
completely filled the HPLC amber vials to eliminate any gas phase. The vial was
immediately crimp-sealed using aluminum cap with Teflon-lined septum, and kept
chilled at 15 °C prior HPLC-DAD analysis. For headspace gaseous styrene
determination, 10 µL of headspace gas was sampled by a gas-tight syringe and
manually injected into a GC-FID. The styrene analytical methods are described in
the following section. Triplicate experiments were performed.
5.2.3 Styrene chromatographic determination methods
Aqueous styrene was determined by HPLC-DAD (Thermo Scientific Dionex, USA)
using a mobile phase of 60% methanol with a flow rate of 1.2 mL.min-1
, a sample
injection volume of 10 µL and a detection wavelength of 201 nm. All other
operation parameters were kept the same, as previously described by Tan et al.
(2012) (Chapter 3). Headspace gaseous styrene was determined by manual injection
into a GC-FID (Agilent Technologies, Palo Alto, Calif) at a split ratio of 1:10.
Analysis was achieved on a ZB-5HT column (30 m by 0.25 mm, 0.25-μm film
thickness; Phenomenex, Torrance, CA, USA). The temperatures of the injection
port and detector heater were 250 and 300 °C, respectively. Oven temperature was
programmed at an initial temperature of 40 °C and subsequently raised with a rate
of 5 °C.min-1
to 65 °C. Helium was used as a carrier gas at a flow rate of 4.0
mL.min-1
. A calibration curve was used to determine the styrene amount.
5.2.4 Total genomic DNA extraction
Total genomic DNA of sludge samples were extracted using a chemical-lysis
method described by Liu et al. (1997). Briefly, the cell pellets were lysed in an
extraction buffer (100 mM Tris-HCl, 100 mM Ethylenediaminetetraacetic acid
(EDTA), 0.75 M sucrose), Lysozyme (10 mg.mL-1
), Achromopeptidease (1 mg.mL-
1), ProteaseK (20 mg.mL
-1) and 10% sodium dodecyl sulfate (SDS) at 37 °C.
Phenol/Chlorofinsorm/IAA (25:24:1) and Chlorofinsorm/IAA (24:1) were used at
least twice on the supernatant to purify the DNA solutions. Cold isopropanol was
used to precipitate the DNA. DNA pellet was subsequently washed by 70% ethanol
twice and dissolved in 100 µL water.
98
5.2.5 16S rDNA next-generation sequencing, data processing and analysis
Extracted DNA of sludge samples were sent to the Research and Testing Laboratory
(RTL; Lubbock, TX, USA) for next-generation 16S rDNA sequencing. Sequencing
was performed on the Illumina MiSeq platform (Illumina Inc, San Diego, CA, USA)
with at least an average of 15,000 reads per sample. The primer set used was
515F/909R, developed by RTL, which spans the V4 to V5 region of the bacterial
16S rRNA gene. Raw sequences were processed and analyzed using the software
Mothur (version 1.33.0) (Schloss et al., 2009) according to the protocol described
by Kozich et al. (2013), which is a standard operating procedure developed to
process 16S rDNA sequences generated from Illumina MiSeq platform. Briefly,
sequences that were shorter than 350 bp, longer than 400 bp or contained
ambiguous bases were discarded. The remaining sequences were sorted and
grouped based on sequence identity into groups of unique sequence. Sequences
were aligned to the SILVA-based bacterial reference alignment (Schloss, 2009),
followed by pre-clustering based on a pseudo-single linkage algorithm (Huse et al.,
2010). Using Mothur‟s in-built UCHIME algorithm (Edgar et al., 2011), the data
was checked for chimeras, and sequences, deemed as chimeric, were removed.
Using Mothur‟s classify.seq command, its in-built Bayesian classifier and Mothur-
formatted version of the Ribosomal Database Project (RDP-II) training set (v.9)
(Wang et al., 2007), taxonomy alignment was performed for the data at a
pseudobootstrap cutoff value of 80%. The data was further checked for sequences
arising from archaea, chloroplasts, mitochondria and eukaryotes, and these
sequences were also removed to produce the final processed sequences using
Mothur‟s remove.lineage command. The sequences were clustered into operational
taxonomic units (OTUs) using Mothur‟s cluster.split command to split at the order
level (i.e., taxlevel = 4) and clustered to a 0.15 cutoff. To obtain information on the
number of sequences in each OTU for each sludge DNA sample, a shared filed was
created using Mothur‟s make.shared command. Using Mothur‟s classify.otu
command with a default confidence threshold of 51%, consensus taxonomy
information for each OTU was obtained. The shared file was used for OTU-based
analyses. Rarefaction curves were generated using Mothur‟s rarefaction.single
command. Using Mothur‟s summary.single command, values for diversity indices
99
(Inverse Simpson [1/D] and Shannon diversity index [H’]), richness abundance
estimators (Chao1 and Abundance-based Coverage Estimator [ACE]), observed
OTUs, and Good‟s coverage were obtained for each sludge DNA sample. Alpha
diversity analysis including diversity indices, richness abundance estimators,
observed OTUs and Good‟s coverage were computed based on the number of
normalized sequences for all 5 sampling points (i.e., 84,942) at the 95% confidence
interval (CI) from 1,000 iterations of the subsamples. Evenness indices, based on
Inverse Simpson index (E) and Shannon diversity index (J’), were also obtained
with Mothur‟s summary.single command. A phylip-formatted distance matrix,
based on Bray-Curtis dissimilarity, was calculated using Mothur‟s dist.shared
command through 1,000 iterations of the subsamples (subsample size of 84,942).
Using the tree.shared command, the distance matrix was used in hierarchical
clustering by the unweighted pair group method with arithmetic mean (UPGMA)
algorithm to generate a dendrogram describing the similarities between the samples.
5.3 Results
5.3.1 Styrene biodegradation test
To ascertain the styrene degradation capability of the enriched sludge, the
biodegradation test was performed using 16-months styrene-enriched sludge. Prior
to sludge inoculation, it was observed that 1.65 mg of styrene partitioned such that
1.24 mg existed as a gas form in the serum bottle headspace and 0.41 mg existed as
an aqueous form in the cultivation medium (Figure 5.1). Within 4 h to 6 h of
inoculation with sludge, between 65.6% and 75.5% of styrene were degraded.
Aqueous styrene decreased to low levels between 0.015 and 0.075 mg while
headspace styrene gradually decreased to 0.55 mg (4 h) and subsequently to 0.33
mg (6 h) (Figure 5.1A). By 8 h, aqueous styrene was undetectable while headspace
styrene dropped to 0.04 mg (98.0% styrene removal). Headspace styrene decreased
slightly to 0.03 mg by 10 h, achieving a total styrene removal of 98.4%. No further
reduction of styrene was observed up to 48 h (data not shown). In the negative
control and blank control setups inoculated with double-autoclaved sludge and
without sludge addition, respectively, up to a 40% styrene reduction was observed
within 4 h. In both setups, headspace styrene decreased by about 0.44 mg to
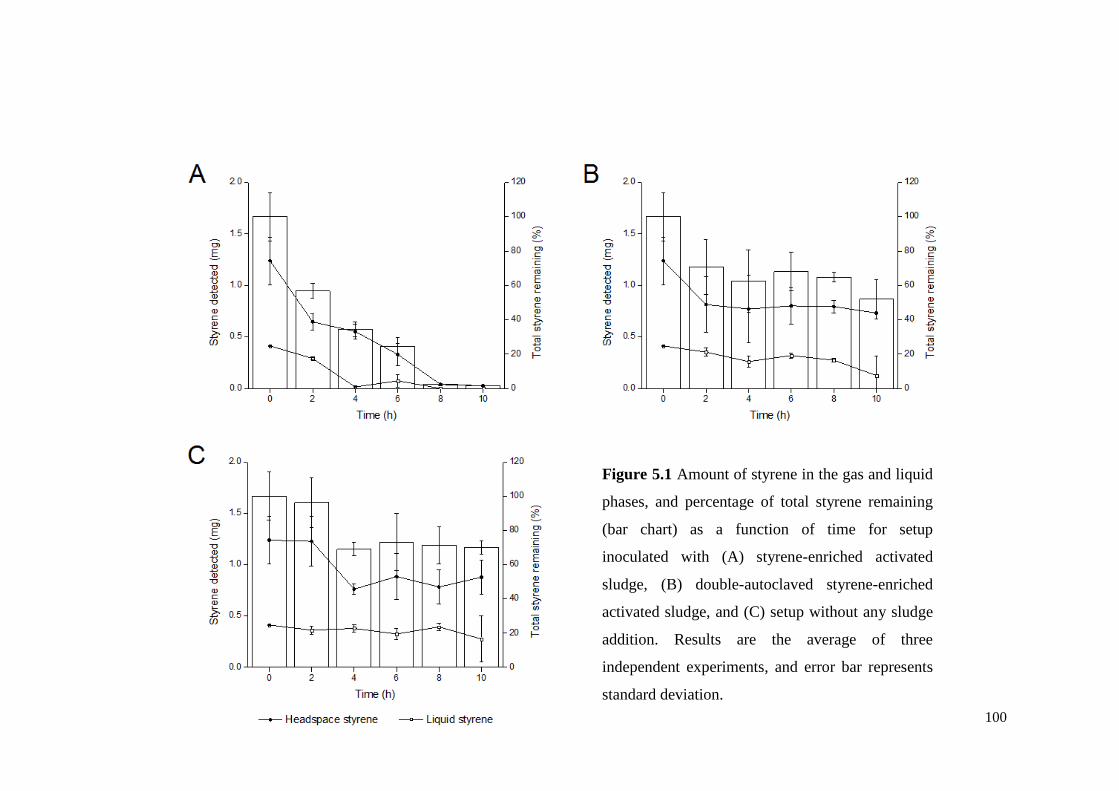
100
Figure 5.1 Amount of styrene in the gas and liquid
phases, and percentage of total styrene remaining
(bar chart) as a function of time for setup
inoculated with (A) styrene-enriched activated
sludge, (B) double-autoclaved styrene-enriched
activated sludge, and (C) setup without any sludge
addition. Results are the average of three
independent experiments, and error bar represents
standard deviation.
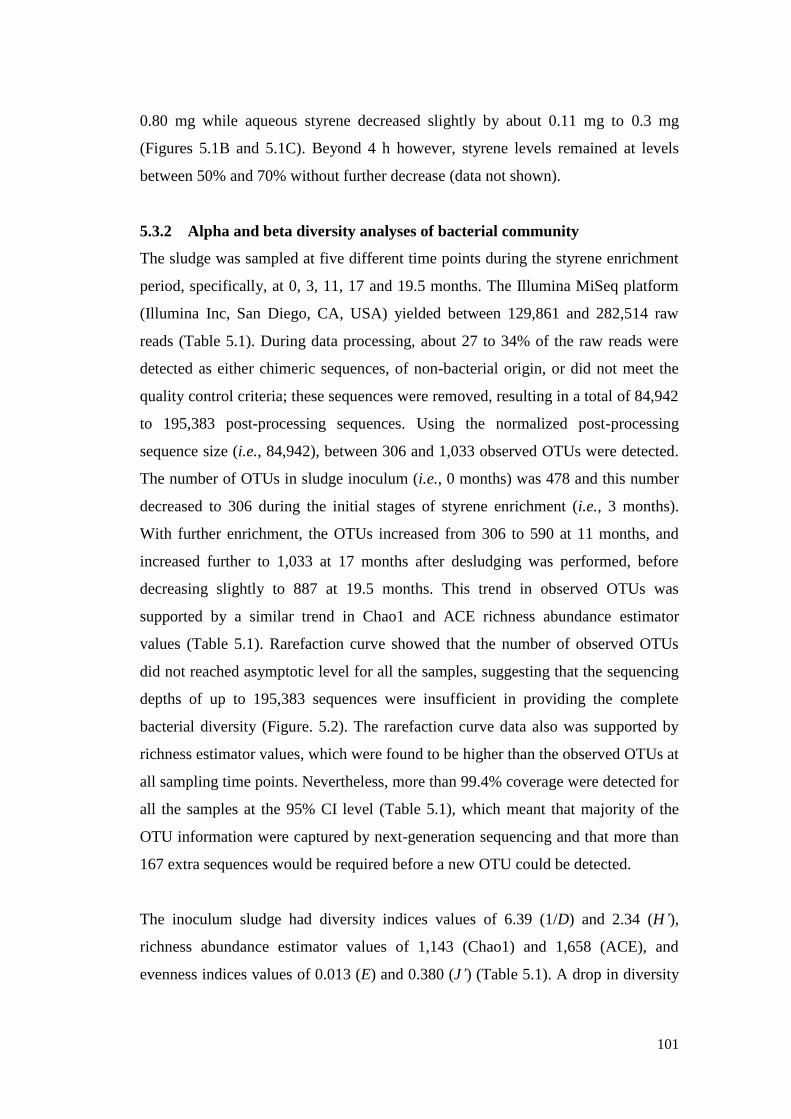
101
0.80 mg while aqueous styrene decreased slightly by about 0.11 mg to 0.3 mg
(Figures 5.1B and 5.1C). Beyond 4 h however, styrene levels remained at levels
between 50% and 70% without further decrease (data not shown).
5.3.2 Alpha and beta diversity analyses of bacterial community
The sludge was sampled at five different time points during the styrene enrichment
period, specifically, at 0, 3, 11, 17 and 19.5 months. The Illumina MiSeq platform
(Illumina Inc, San Diego, CA, USA) yielded between 129,861 and 282,514 raw
reads (Table 5.1). During data processing, about 27 to 34% of the raw reads were
detected as either chimeric sequences, of non-bacterial origin, or did not meet the
quality control criteria; these sequences were removed, resulting in a total of 84,942
to 195,383 post-processing sequences. Using the normalized post-processing
sequence size (i.e., 84,942), between 306 and 1,033 observed OTUs were detected.
The number of OTUs in sludge inoculum (i.e., 0 months) was 478 and this number
decreased to 306 during the initial stages of styrene enrichment (i.e., 3 months).
With further enrichment, the OTUs increased from 306 to 590 at 11 months, and
increased further to 1,033 at 17 months after desludging was performed, before
decreasing slightly to 887 at 19.5 months. This trend in observed OTUs was
supported by a similar trend in Chao1 and ACE richness abundance estimator
values (Table 5.1). Rarefaction curve showed that the number of observed OTUs
did not reached asymptotic level for all the samples, suggesting that the sequencing
depths of up to 195,383 sequences were insufficient in providing the complete
bacterial diversity (Figure. 5.2). The rarefaction curve data also was supported by
richness estimator values, which were found to be higher than the observed OTUs at
all sampling time points. Nevertheless, more than 99.4% coverage were detected for
all the samples at the 95% CI level (Table 5.1), which meant that majority of the
OTU information were captured by next-generation sequencing and that more than
167 extra sequences would be required before a new OTU could be detected.
The inoculum sludge had diversity indices values of 6.39 (1/D) and 2.34 (H’),
richness abundance estimator values of 1,143 (Chao1) and 1,658 (ACE), and
evenness indices values of 0.013 (E) and 0.380 (J’) (Table 5.1). A drop in diversity
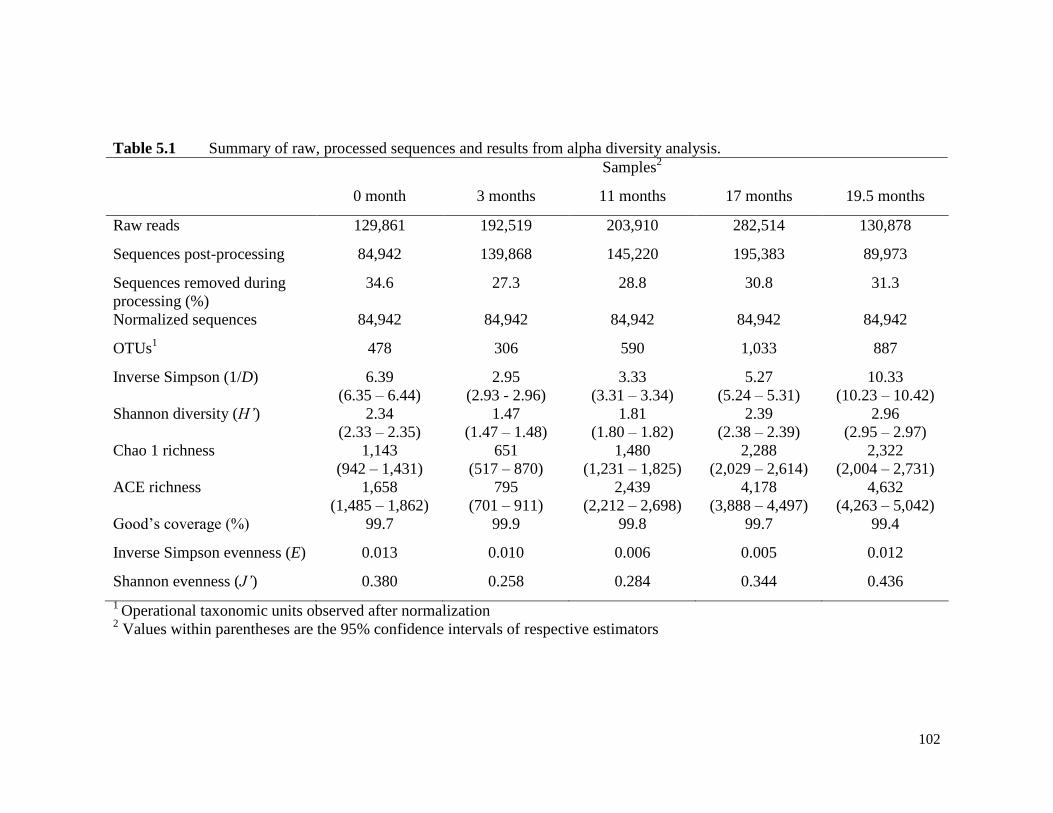
102
Table 5.1 Summary of raw, processed sequences and results from alpha diversity analysis.
Samples2
0 month 3 months 11 months 17 months 19.5 months
Raw reads 129,861 192,519 203,910 282,514 130,878
Sequences post-processing 84,942 139,868 145,220 195,383 89,973
Sequences removed during
processing (%)
34.6 27.3 28.8 30.8 31.3
Normalized sequences 84,942 84,942 84,942 84,942 84,942
OTUs1 478 306 590 1,033 887
Inverse Simpson (1/D)
6.39
(6.35 – 6.44)
2.95
(2.93 - 2.96)
3.33
(3.31 – 3.34)
5.27
(5.24 – 5.31)
10.33
(10.23 – 10.42)
Shannon diversity (H’)
2.34
(2.33 – 2.35)
1.47
(1.47 – 1.48)
1.81
(1.80 – 1.82)
2.39
(2.38 – 2.39)
2.96
(2.95 – 2.97)
Chao 1 richness
1,143
(942 – 1,431)
651
(517 – 870)
1,480
(1,231 – 1,825)
2,288
(2,029 – 2,614)
2,322
(2,004 – 2,731)
ACE richness
1,658
(1,485 – 1,862)
795
(701 – 911)
2,439
(2,212 – 2,698)
4,178
(3,888 – 4,497)
4,632
(4,263 – 5,042)
Good‟s coverage (%) 99.7 99.9 99.8 99.7 99.4
Inverse Simpson evenness (E)
0.013 0.010 0.006 0.005 0.012
Shannon evenness (J’)
0.380 0.258 0.284 0.344 0.436
1 Operational taxonomic units observed after normalization
2 Values within parentheses are the 95% confidence intervals of respective estimators
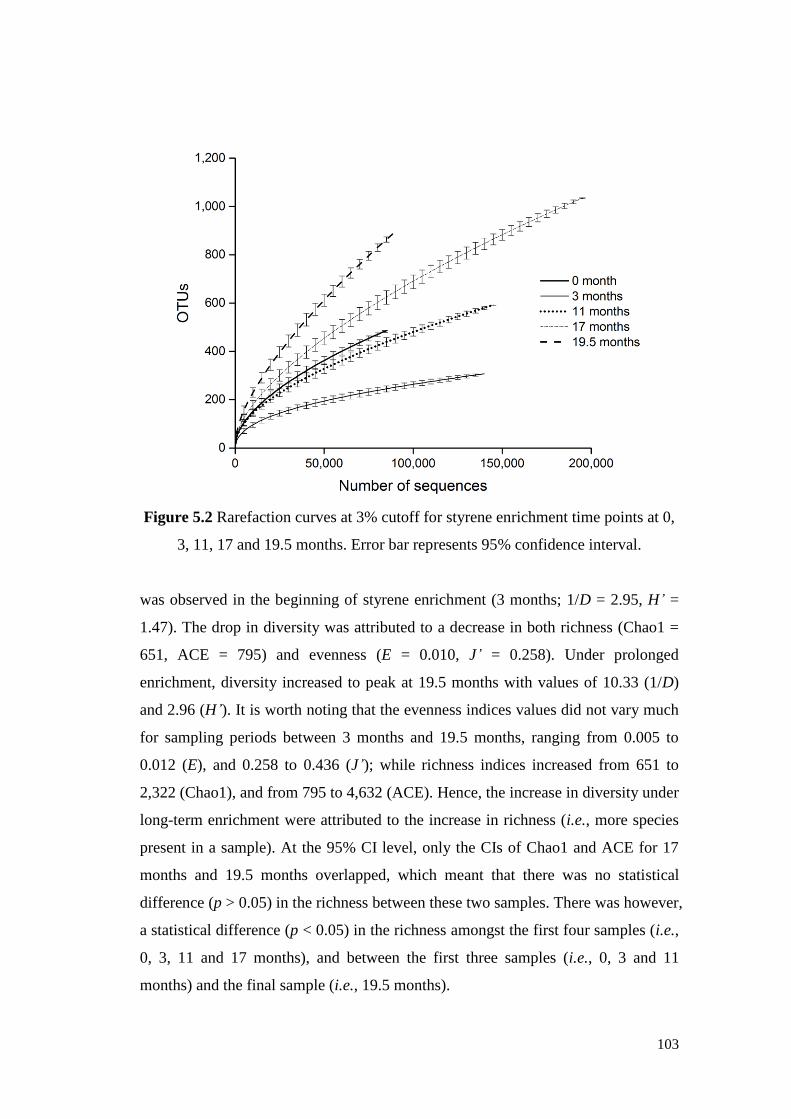
103
Figure 5.2 Rarefaction curves at 3% cutoff for styrene enrichment time points at 0,
3, 11, 17 and 19.5 months. Error bar represents 95% confidence interval.
was observed in the beginning of styrene enrichment (3 months; 1/D = 2.95, H’ =
1.47). The drop in diversity was attributed to a decrease in both richness (Chao1 =
651, ACE = 795) and evenness (E = 0.010, J’ = 0.258). Under prolonged
enrichment, diversity increased to peak at 19.5 months with values of 10.33 (1/D)
and 2.96 (H’). It is worth noting that the evenness indices values did not vary much
for sampling periods between 3 months and 19.5 months, ranging from 0.005 to
0.012 (E), and 0.258 to 0.436 (J’); while richness indices increased from 651 to
2,322 (Chao1), and from 795 to 4,632 (ACE). Hence, the increase in diversity under
long-term enrichment were attributed to the increase in richness (i.e., more species
present in a sample). At the 95% CI level, only the CIs of Chao1 and ACE for 17
months and 19.5 months overlapped, which meant that there was no statistical
difference (p > 0.05) in the richness between these two samples. There was however,
a statistical difference (p < 0.05) in the richness amongst the first four samples (i.e.,
0, 3, 11 and 17 months), and between the first three samples (i.e., 0, 3 and 11
months) and the final sample (i.e., 19.5 months).
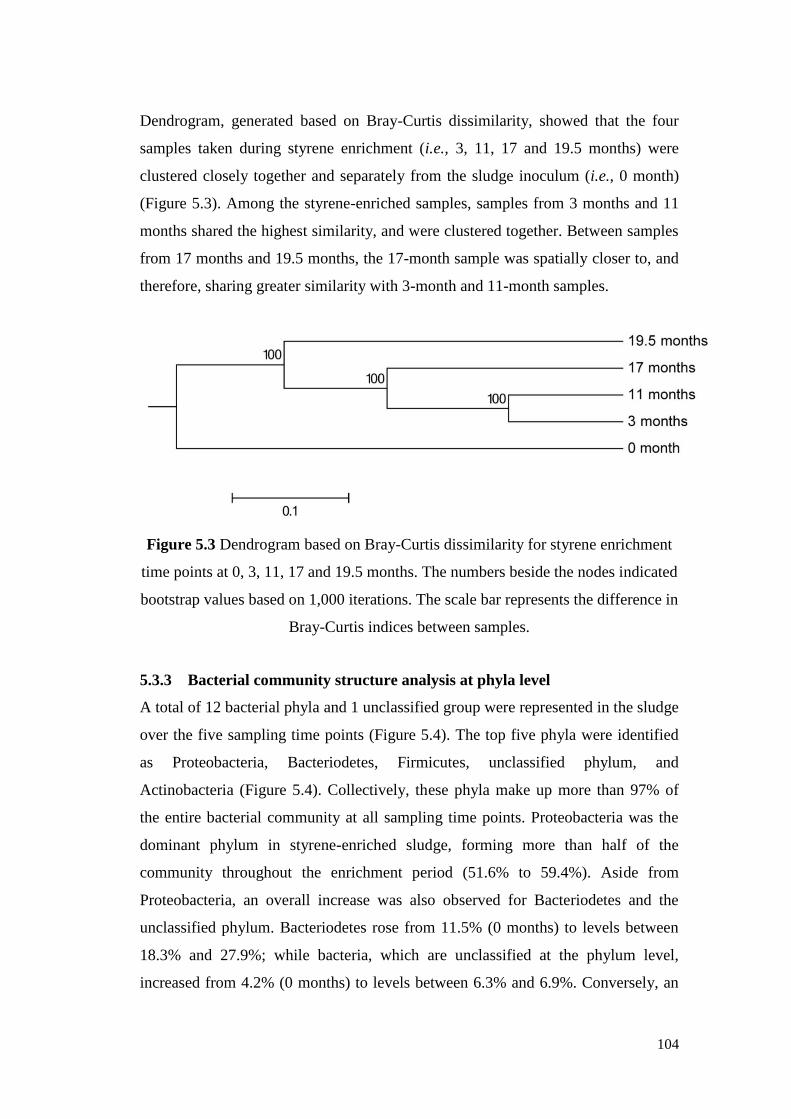
104
Dendrogram, generated based on Bray-Curtis dissimilarity, showed that the four
samples taken during styrene enrichment (i.e., 3, 11, 17 and 19.5 months) were
clustered closely together and separately from the sludge inoculum (i.e., 0 month)
(Figure 5.3). Among the styrene-enriched samples, samples from 3 months and 11
months shared the highest similarity, and were clustered together. Between samples
from 17 months and 19.5 months, the 17-month sample was spatially closer to, and
therefore, sharing greater similarity with 3-month and 11-month samples.
Figure 5.3 Dendrogram based on Bray-Curtis dissimilarity for styrene enrichment
time points at 0, 3, 11, 17 and 19.5 months. The numbers beside the nodes indicated
bootstrap values based on 1,000 iterations. The scale bar represents the difference in
Bray-Curtis indices between samples.
5.3.3 Bacterial community structure analysis at phyla level
A total of 12 bacterial phyla and 1 unclassified group were represented in the sludge
over the five sampling time points (Figure 5.4). The top five phyla were identified
as Proteobacteria, Bacteriodetes, Firmicutes, unclassified phylum, and
Actinobacteria (Figure 5.4). Collectively, these phyla make up more than 97% of
the entire bacterial community at all sampling time points. Proteobacteria was the
dominant phylum in styrene-enriched sludge, forming more than half of the
community throughout the enrichment period (51.6% to 59.4%). Aside from
Proteobacteria, an overall increase was also observed for Bacteriodetes and the
unclassified phylum. Bacteriodetes rose from 11.5% (0 months) to levels between
18.3% and 27.9%; while bacteria, which are unclassified at the phylum level,
increased from 4.2% (0 months) to levels between 6.3% and 6.9%. Conversely, an
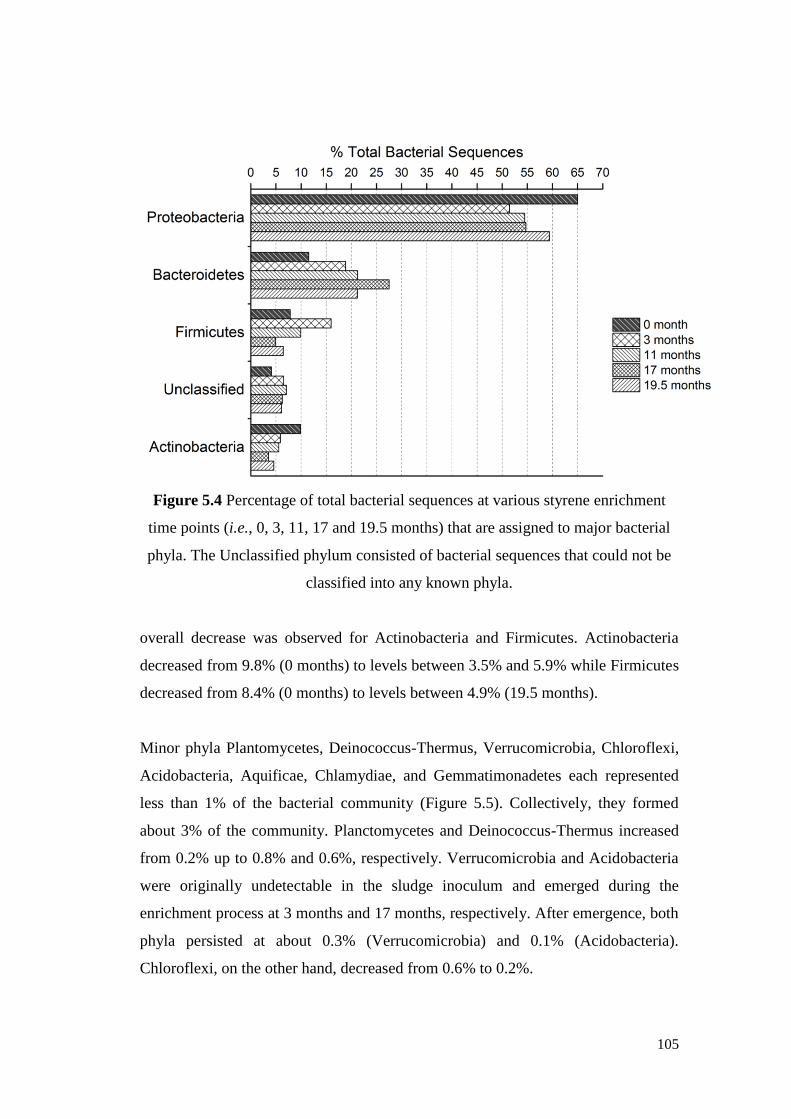
105
Figure 5.4 Percentage of total bacterial sequences at various styrene enrichment
time points (i.e., 0, 3, 11, 17 and 19.5 months) that are assigned to major bacterial
phyla. The Unclassified phylum consisted of bacterial sequences that could not be
classified into any known phyla.
overall decrease was observed for Actinobacteria and Firmicutes. Actinobacteria
decreased from 9.8% (0 months) to levels between 3.5% and 5.9% while Firmicutes
decreased from 8.4% (0 months) to levels between 4.9% (19.5 months).
Minor phyla Plantomycetes, Deinococcus-Thermus, Verrucomicrobia, Chloroflexi,
Acidobacteria, Aquificae, Chlamydiae, and Gemmatimonadetes each represented
less than 1% of the bacterial community (Figure 5.5). Collectively, they formed
about 3% of the community. Planctomycetes and Deinococcus-Thermus increased
from 0.2% up to 0.8% and 0.6%, respectively. Verrucomicrobia and Acidobacteria
were originally undetectable in the sludge inoculum and emerged during the
enrichment process at 3 months and 17 months, respectively. After emergence, both
phyla persisted at about 0.3% (Verrucomicrobia) and 0.1% (Acidobacteria).
Chloroflexi, on the other hand, decreased from 0.6% to 0.2%.
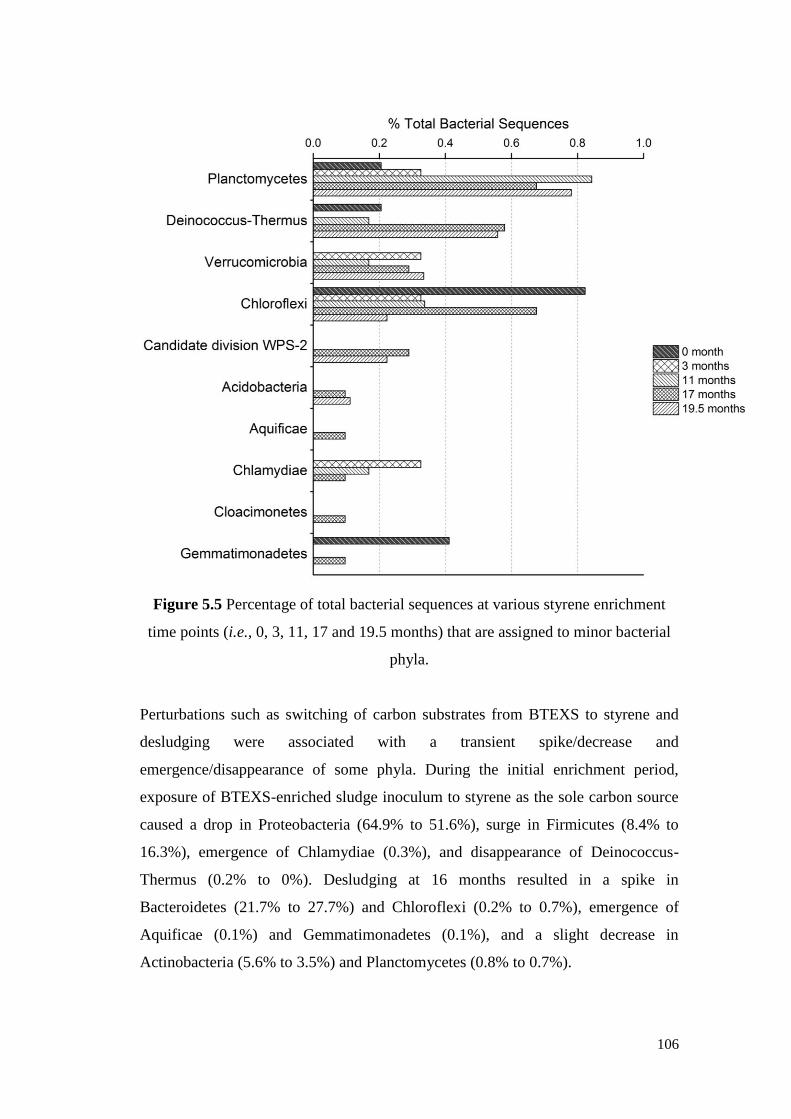
106
Figure 5.5 Percentage of total bacterial sequences at various styrene enrichment
time points (i.e., 0, 3, 11, 17 and 19.5 months) that are assigned to minor bacterial
phyla.
Perturbations such as switching of carbon substrates from BTEXS to styrene and
desludging were associated with a transient spike/decrease and
emergence/disappearance of some phyla. During the initial enrichment period,
exposure of BTEXS-enriched sludge inoculum to styrene as the sole carbon source
caused a drop in Proteobacteria (64.9% to 51.6%), surge in Firmicutes (8.4% to
16.3%), emergence of Chlamydiae (0.3%), and disappearance of Deinococcus-
Thermus (0.2% to 0%). Desludging at 16 months resulted in a spike in
Bacteroidetes (21.7% to 27.7%) and Chloroflexi (0.2% to 0.7%), emergence of
Aquificae (0.1%) and Gemmatimonadetes (0.1%), and a slight decrease in
Actinobacteria (5.6% to 3.5%) and Planctomycetes (0.8% to 0.7%).
107
5.3.4 Bacterial community structure analysis at class and order level
Major phyla that increased with styrene enrichment: Proteobacteria and
Bacteroidetes
Under the phylum Proteobacteria, bacterial classes Alphaproteobacteria,
Betaproteobacteria, Deltaproteobacteria and Gammaproteobacteria were detected.
While Proteobacteria consistently formed more than half of the sludge bacterial
community throughout the enrichment period (Figure 5.4), there was a shift in the
dominance of bacterial classes under this phylum. In the BTEXS-enriched sludge
inoculum, Alphaproteobacteria and Betaproteobacteria were the two dominant
bacterial classes (60.2%) while Gammaproteobacteria was detected at low level of
2.3% (Table 5.2). During styrene enrichment however, Gammaproteobacteria
increased by 10-fold to 22.2% and Betaproteobacteria decreased by 3-fold from
28.7% to 8.9% while Alphaproteobacteria decreased slightly but continued to
persist at high levels (12.7% to 30.4%), resulting in the dominance of
Alphaproteobacteria and Gammaproteobacteria (19.5 months, 43.7%). The increase
in Gammaproteobacteria was largely ascribed to the increase in bacterial order
Pseudomonadales (0.6% to 16.7%), followed by an unclassified order (0% to 3.4%)
and Xanthomonadales (1.3% to 2.1%) (Table 5.2). The decrease in
Betaproteobacteria was attributed to the decrease in the order Burkholderiales (24.5%
to 6.8%). Alphaproteobacteria was represented by the order Rhizobiales (between
6.9% and 20.7%), Sphingomonadales (between 0.9% and 2.8%), and an
unclassified order (between 1.0% and 6.4%). Under styrene enrichment, there was
also a slight increment in Deltaproteobacteria (0.6% to about 2.0%) with the order
Myxococcales emerging and forming 1.6% of the total bacterial population at 19.5
months. Epsilonproteobacteria and its corresponding order Campylobacterales were
initially undetectable in the sludge inoculum, but emerged and persisted at about
0.1%. For Bacteroidetes, classes Bacteroidia, Sphingobacteria, Flavobacteria and an
unclassified order were detected. Among these classes, the increase in
Sphingobacteria and its order Sphingobacteriales from 4% to levels between 8.5%
and 23.7% (Table 5.2) were observed to be most reflective of the increase in
Bacteroidetes.
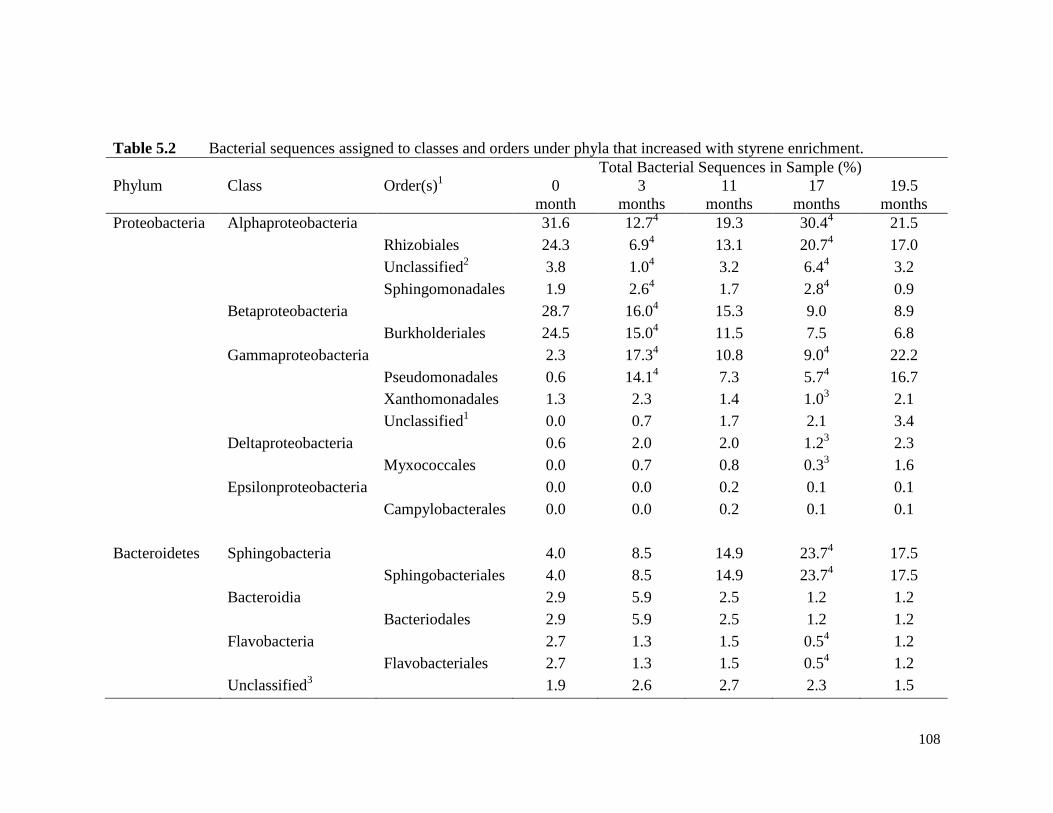
108
Table 5.2 Bacterial sequences assigned to classes and orders under phyla that increased with styrene enrichment.
Phylum Class Order(s)1
Total Bacterial Sequences in Sample (%)
0
month
3
months
11
months
17
months
19.5
months
Proteobacteria Alphaproteobacteria 31.6 12.74
19.3 30.44
21.5
Rhizobiales 24.3 6.94
13.1 20.74
17.0
Unclassified2
3.8 1.04
3.2 6.44
3.2
Sphingomonadales 1.9 2.64
1.7 2.84
0.9
Betaproteobacteria 28.7 16.04
15.3 9.0 8.9
Burkholderiales 24.5 15.04
11.5 7.5 6.8
Gammaproteobacteria 2.3 17.34
10.8 9.04
22.2
Pseudomonadales 0.6 14.14
7.3 5.74
16.7
Xanthomonadales 1.3 2.3 1.4 1.03
2.1
Unclassified1
0.0 0.7 1.7 2.1 3.4
Deltaproteobacteria 0.6 2.0 2.0 1.23
2.3
Myxococcales 0.0 0.7 0.8 0.33
1.6
Epsilonproteobacteria 0.0 0.0 0.2 0.1 0.1
Campylobacterales 0.0 0.0 0.2 0.1 0.1
Bacteroidetes Sphingobacteria 4.0 8.5 14.9 23.74
17.5
Sphingobacteriales 4.0 8.5 14.9 23.74
17.5
Bacteroidia 2.9 5.9 2.5 1.2 1.2
Bacteriodales 2.9 5.9 2.5 1.2 1.2
Flavobacteria 2.7 1.3 1.5 0.54
1.2
Flavobacteriales 2.7 1.3 1.5 0.54
1.2
Unclassified3
1.9 2.6 2.7 2.3 1.5
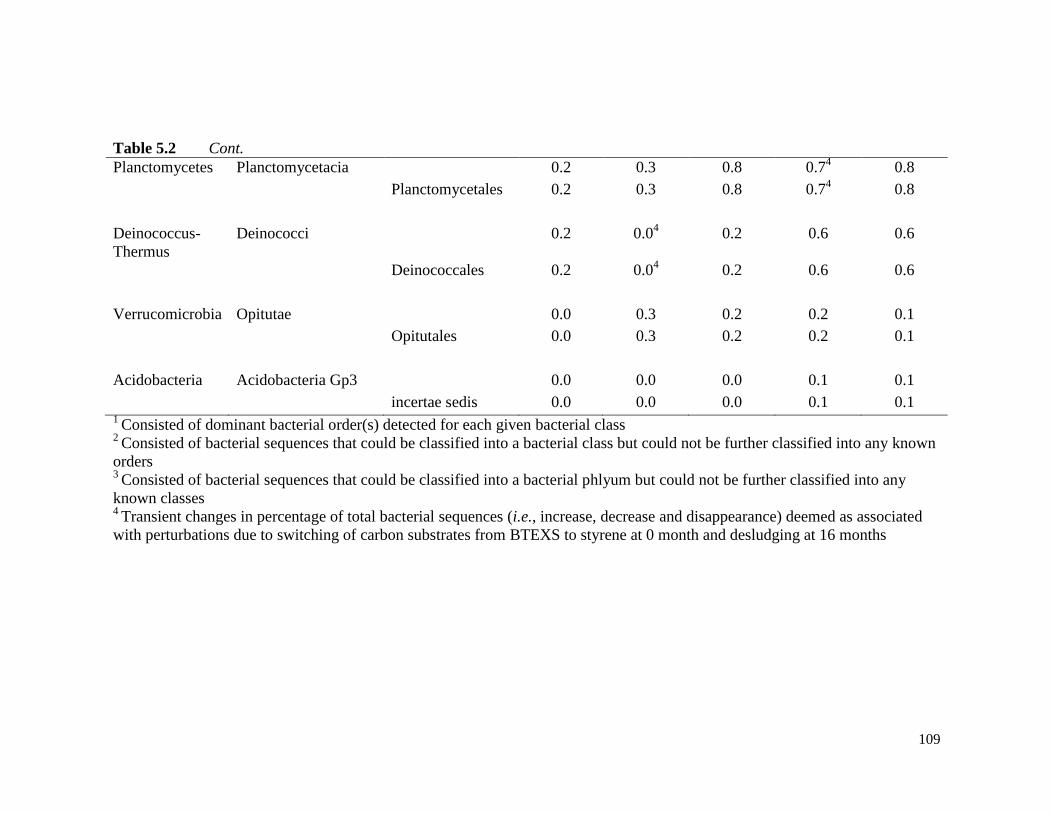
109
Table 5.2 Cont.
Planctomycetes Planctomycetacia 0.2 0.3 0.8 0.74
0.8
Planctomycetales 0.2 0.3 0.8 0.74
0.8
Deinococcus-
Thermus
Deinococci 0.2 0.04
0.2 0.6 0.6
Deinococcales 0.2 0.04
0.2 0.6 0.6
Verrucomicrobia Opitutae 0.0 0.3 0.2 0.2 0.1
Opitutales 0.0 0.3 0.2 0.2 0.1
Acidobacteria Acidobacteria Gp3 0.0 0.0 0.0 0.1 0.1
incertae sedis 0.0 0.0 0.0 0.1 0.1 1
Consisted of dominant bacterial order(s) detected for each given bacterial class 2
Consisted of bacterial sequences that could be classified into a bacterial class but could not be further classified into any known
orders
3 Consisted of bacterial sequences that could be classified into a bacterial phlyum but could not be further classified into any
known classes
4 Transient changes in percentage of total bacterial sequences (i.e., increase, decrease and disappearance) deemed as associated
with perturbations due to switching of carbon substrates from BTEXS to styrene at 0 month and desludging at 16 months
110
Minor phyla that increased with styrene enrichment: Planctomycetes, Deinococcus-
Thermus, Verrucomicrobia and Acidobacteria
The phyla Planctomycetes, Deinococcus-Thermus and Acidobacteria were each
represented by a single bacterial class and its corresponding bacterial order.
Planctomycetes was represented by the class Planctomycetacia and type order
Planctomycetales; Deinococcus-Thermus was represented by the class Deinococci
and order Deinococcales; and Acidobacteria was represented by the class
Acidobacteria Gp3 and order incertae sedis. Under the phylum Verrucomicrobia,
the main bacterial class and order detected was Opitutae and Opitutales,
respectively, which emerged at 3 months and persisted at levels of around 0.1% to
0.2% (Table 5.2).
Major phyla that decreased with styrene enrichment: Firmicutes and
Actinobacteria
Clostridia and Bacilli were the two main bacterial classes identified under phylum
Firmicutes. Clostridia and its representative order Clostridiales decreased slightly
from 6.1% to 4.8% and from 5.9% to 4.7%, respectively (Table 5.3). Conversely,
Bacilli and its representative order Bacillales remained at constant levels ranging
from 0.7% to 2% and 0.6% to 1.5%, respectively. For the Actinobacteria phylum,
most bacteria belonged to the order Actinomycetales, which exhibited a gradual
decrease from 9.8% to 3.8% under styrene enrichment (Table 5.3).
Minor phylum that decreased with styrene enrichment: Chloroflexi
The bacterial class Thermomicrobia and an unclassified class were detected under
Chloroflexi phylum. A slight decrease from 0.2% to 0.1% was observed for
Thermomicrobia and its order Sphaerobacterales while the unclassified bacteria
decreased from 0.4% to 0.1% (Table 5.3).
5.4 Discussion
Mixed cultures have been long and widely-applied for the bioremediation of styrene
wastewaters (Ahmad et al., 2008; Fallah et al., 2010; US EPA, 1974). However, to
date, studies on styrene-degrading microbial consortia were largely based on
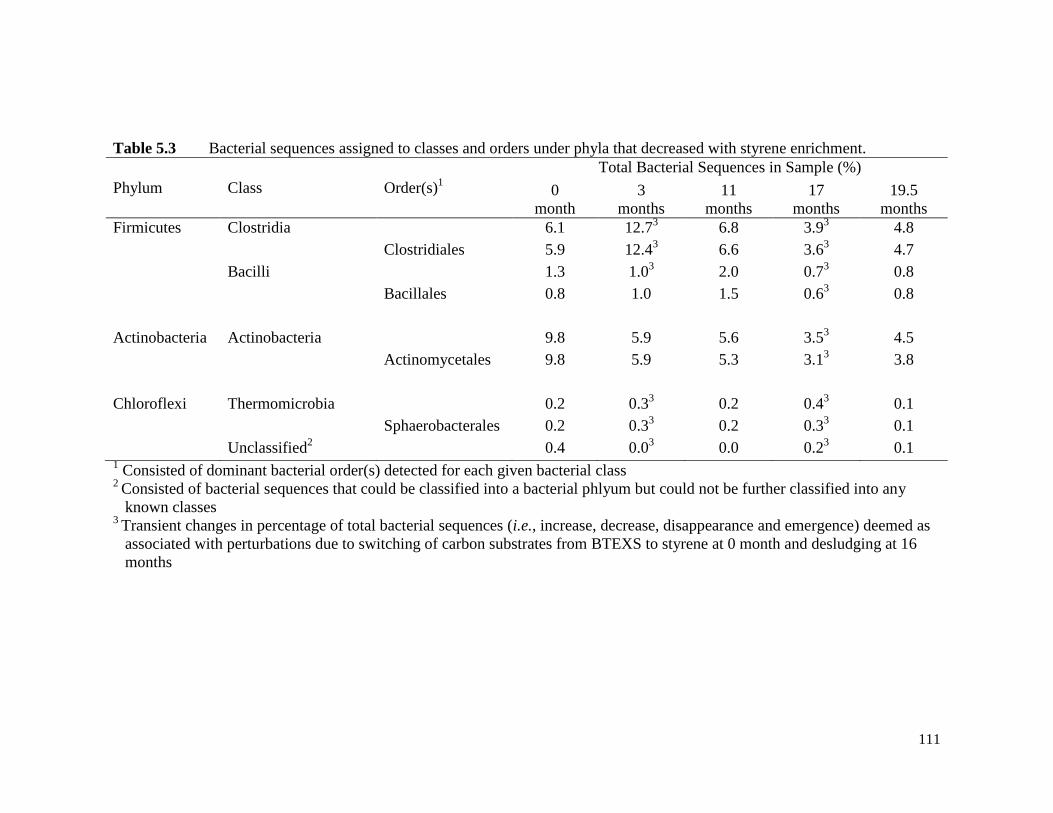
111
Table 5.3 Bacterial sequences assigned to classes and orders under phyla that decreased with styrene enrichment.
Phylum Class Order(s)1
Total Bacterial Sequences in Sample (%)
0
month
3
months
11
months
17
months
19.5
months
Firmicutes Clostridia 6.1 12.73
6.8 3.93
4.8
Clostridiales 5.9 12.43
6.6 3.63
4.7
Bacilli
1.3 1.03
2.0 0.73
0.8
Bacillales 0.8 1.0 1.5 0.63
0.8
Actinobacteria Actinobacteria 9.8 5.9 5.6 3.53
4.5
Actinomycetales 9.8 5.9 5.3 3.13
3.8
Chloroflexi Thermomicrobia
0.2 0.33
0.2 0.43
0.1
Sphaerobacterales 0.2 0.33
0.2 0.33
0.1
Unclassified2
0.4 0.03
0.0 0.23
0.1 1 Consisted of dominant bacterial order(s) detected for each given bacterial class
2 Consisted of bacterial sequences that could be classified into a bacterial phlyum but could not be further classified into any
known classes
3 Transient changes in percentage of total bacterial sequences (i.e., increase, decrease, disappearance and emergence) deemed as
associated with perturbations due to switching of carbon substrates from BTEXS to styrene at 0 month and desludging at 16
months
112
non-aqueous and semi-aqueous environments such as soil, biofilter and biotrickling
filters (Alexandrino et al., 2001; Arnold et al., 1997; Greene et al., 2000; Portune et
al., 2015). Little is known about the composition of styrene-degrading microbial
community as well as the potential PHA-producing members in aqueous
environments. This study was conducted to address the knowledge gap through
investigating the changes in the microbial community structure of activated sludge
under long-term styrene enrichment.
Validation of styrene degradation capability in enriched sludge
Styrene is considered a relatively recalcitrant compound, requiring specialized
microbial consortia for its biodegradation. Compared to enriched mixed cultures,
non-enriched cultures tend to exhibit a lag phase in styrene degradation and greater
sensitivity to the toxic effects of styrene due to the lack of microbial species
possessing styrene metabolism capabilities (Babaee et al., 2010). This could be
circumvented through long-term exposure of mixed cultures to styrene, providing a
favorable selection pressure for styrene-degrading microbial species. For this study,
municipal activated sludge, previously enriched on BTEXS for 15 months, was
used as an inoculum source for styrene enrichment. After 16 months of enrichment,
300 VSS mg.L-1
of styrene-enriched sludge was capable of removing 1.62 mg of
styrene within 10 h, achieving 98.4% of total styrene removal (Figure 5.1A). The
observed styrene degradation rate was higher when compared to a similar study,
which reported 6 days for the degradation of 1.7 mg styrene using 650 mg.L-1
of
petrochemical activated sludge (Babaee et al., 2010); but was comparable to another
study which reported the degradation of 1.07 mg to 2.16 mg of styrene within 4 to 8
h using 2.5 g of biomass from an active styrene filter bed (Jorio et al., 2005). Hence,
the mixed culture, cultivated through the course of this study, could be considered
as an active styrene-degrading consortium.
Negative control setup, containing double-autoclaved sludge, and blank control
setup, without any sludge addition, had up to a 50% decrease in styrene amount
(Figures 5.1B and 5.1C). However, unlike the test setup containing enriched sludge,
there was no further decrease in styrene amounts for control setups. Similar
113
phenomenon has also been observed previously (Jorio et al., 2005), suggesting that
styrene could be lost through abiotic means, which may include adsorption onto
cellular material, glass wall interface of serum bottle and reaction with Telfon-lined
spetum.
Overview of bacterial community
The initial bacterial community structure of the BTEXS-enriched sludge inoculum
and its evolution over the course of styrene enrichment was investigated through
samples taken at 0, 3, 11, 17 and 19.5 months into the enrichment. The application
of next-generation sequencing on the Illumina MiSeq platform (Illumina Inc, San
Diego, CA, USA) yielded sequencing depths ranging from 84,942 to 195,383
sequences, and detected between 306 and 1,033 OTUs (Table 5.1). While
rarefaction curve, richness abundance estimators and Good‟s coverage values
indicated that the bacterial diversity were not completely captured in this study, this
is a common observation across many studies (Claesson et al., 2010; Jiang et al.,
2013; Portune et al., 2015; Schloss et al., 2009). Nevertheless, the high throughput
nature of next-generation sequencing achieved between 99.4% and 99.9% of sample
coverage, providing a near-complete OTU information that should sufficiently
reflect the bacterial consortia.
At the superficial level, there were no major changes to the types of phyla detected
between the sludge inoculum (i.e., 0 month) and styrene-enriched samples (i.e., 3,
11, 17 and 19.5 months). It was observed that 97% of the bacterial community was
consistently dominated by the major phyla Proteobacteria, Bacteriodetes, Firmicutes,
Actinobacteria, and an unclassified phylum (Figure 5.4). The remaining 3% of the
bacterial community comprised of minor phyla Plantomycetes, Deinococcus-
Thermus, Verrucomicrobia, Chloroflexi, Acidobacteria, Aquificae, Chlamydiae,
and Gemmatimonadetes (Figure 5.5). Emergence and disappearance of phyla were
detected, but these instances were only observed in minor phyla (i.e., Deinococcus-
Thermus, Verrucomicrobia, Acidobacteria, Aquificae, Chlamydiae, and
Gemmatimonadetes). Despite the seemingly constant phyla composition, beta
analysis, based on Bray-Curtis dissimilarity, revealed that the initial BTEXS-
114
enriched bacterial community had evolved into a different community within 3
months of styrene enrichment, and continued evolving under prolonged enrichment
(Figure 5.3). In line with this observation, was an overall increase in species
richness (Chao 1: 1,143 to 2,322; ACE: 1,658 to 4,632) and therefore, an increase in
bacterial diversity (Inverse Simpson: 6.39 to 10.33; Shannon diversity: 2.34 to 2.96).
One of the contributing factors may have been the rise in the abundance of
bacterium that could not be assigned to a phylum (unclassified phylum: 4.2% to 7%)
(Figure 5.4) or an order (unclassified [Gammaproteobacteria]: 0% to 3.4%) (Table
5.2). The increase in unassigned bacteria sequences was also observed in styrene-
degrading biofilter, and could form up to 41% of the bacterial community (Portune
et al., 2015). The findings, from this study and the recent study Portune et al. (2015),
indicated that there is currently much unknown bacterial information associated
with styrene-degrading consortia.
Phyla that increase under styrene enrichment
Shifts in the relative abundance of classifiable phyla were also observed and
changes in the bacterial community structure became more apparent at lower
taxonomic levels such as class and order. Specifically, the major phyla
Proteobacteria and Bacteroidetes, and minor phyla Planctomycetes, Deinococcus-
Thermus, Verrucomicrobia and Acidobacteria were observed to increase with
styrene enrichment, suggesting that these phyla probably play an important role in
styrene degradation and/or flourish under the given condition. Throughout the
enrichment period, more than half of the bacteria consortium was dominated by the
phylum Proteobacteria. Nonetheless, a sharp decrease from 64.8% (0 months) to
51.6% (3 months) during the initial start up period was observed before the phylum
steadily increased to 59.4% (19.5 months) (Figure 5.4). This was linked to bacterial
succession at the class level. Most notably, Betaproteobaceria decreased by nearly
20% and became less dominant while Gammaproteobacteria increased by roughly
the same amount to form a more significant population (Table 5.2). Since the sludge
inoculum was derived from municipal activated sludge after 15 months of
enrichment on BTEXS, these findings suggested that Betaproteobaceria plays a
bigger role in BTEXS degradation while Gammaproteobacteria is more important
115
for styrene degradation. The notion that Betaproteobaceria is associated with BTEX
degradation was further supported by previous studies on bacterial consortia in
BTEX-contaminated aquifers, which detected Betaproteobaceria at dominant levels
between 27% and 75% (Alfreider & Vogt, 2007; Lee et al., 2010). At the order
level, Betaproteobacteria was represented by Burkholderiales (Table 5.2). This
bacterial order reportedly has widespread aromatic catabolic potential and the
highest heterogeneity in the distribution of aromatic catabolic genes among the
bacterial orders of Proteobacteria (Pérez-Pantoja et al., 2012; Pérez-Pantoja et al.,
2010). Members of Burkholderiales are known to possess enzymes for the direct
BTEX metabolism, and their degradation capabilities have been demonstrated in
pure cultures (Kanehisa & Goto, 2000; Kanehisa et al., 2014; Pruden & Suidan,
2004). Burkholderiales also harbors genes for metabolism of styrene degradation
intermediates, including benzoic acid, catechol, phenylacetyl-CoA and etc
(Kanehisa & Goto, 2000; Kanehisa et al., 2014; Pérez-Pantoja et al., 2012; Pruden
& Suidan, 2004). The broad aromatic catabolic capability of Burkholderiales could
be the main reason why it flourished under BTEXS mixture feed and became a
more prominent member in the sludge inoculum (24.5%) (Table 5.2). To date,
however, there were neither reports of styrene-degrading species (Tischler &
Kaschabek, 2012) nor genetic evidence for direct styrene metabolism among
Burkholderiales and other Betaproteobacteria members (Kanehisa & Goto, 2000;
Kanehisa et al., 2014), which could explain their reduced dominance when styrene
became the sole carbon source (Betaproteobacteria, 8.9%; Burkholderiales, 6.8%).
Gammaproteobacteria was largely represented by Pseudomonadales, which showed
the greatest increase (16.1%) among all the bacterial orders detected in the
consortium, suggesting its importance in styrene degradation (Table 5.2). Indeed,
members of Pseudomonadales, particularly from the genus Pseudomonas, are often
linked to the styrene removal ability of mixed cultures. In styrene-degrading
biofilter, the abundance of Pseudomonas was positively-correlated to styrene inlet
concentrations, achieving removal efficiencies of 83% to 97% (Portune et al., 2015).
SIP labeling, using deuterated styrene, further demonstrated styrene assimilation by
a primary styrene-degrading biofilter population with Pseudomonas-like fatty acid
116
profile (Alexandrino et al., 2001). Numerous studies have also reported the isolation
of styrene-degrading Pseudomonas strains from active biofilter (Arnold et al., 1997),
bioreactors (O'Connor et al., 1995; Tobin & O'Connor, 2005) and contaminated
environment samples (Greene et al., 2000; Narancic et al., 2012; Tobin & O'Connor,
2005). The styrene degradation pathways were elucidated for Pseudomonas, and
were found to involved either direct ring cleavage with the generation of 3-
vinylcatechol intermediate or side-chain oxidation with the generation of
phenylacetaldehyde intermediate (Tischler & Kaschabek, 2012). Collectively, this
information provides strong evidence that Pseudomonadales members form the core
styrene-metabolizing bacterial population in this study‟s enriched activated sludge.
In contrast to Betaproteobacteria and Gammaproteobacteria, Alphaproteobacteria
persisted at high levels under both BTEXS feed (31.6%) and styrene feed (12.7% to
30.4%) (Table 5.2). This result is in good agreement with existing findings.
Independent studies on consortia, exposed to BTEX and styrene, have similarly
reported the abundance of Alphaproteobacteria at levels between 20% and 30%
(Lee et al., 2010; Portune et al., 2015). Alphaproteobacteria was most prominently-
represented by the order Rhizobiales (between 17.0% and 24.3%). Aside from
Rhizobiales, the order Sphingomonadales was also detected, albeit at much lower
abundance between 0.9% and 2.8%. Genome analysis have unraveled high aromatic
catabolism versatility among Rhizobiales and Sphingomonadales members,
particularly in families Bradyrhizobiaceae, Xanthobacteraceae, Hyophomonadaceae,
Phyllobacteriaceae, and Sphingomonadaceae (Pérez-Pantoja et al., 2010), which
were also the bacterial families detected in this study (data not shown). Catabolic
genes include those involved in the direct and indirect metabolism of BTEXS
(Kanehisa & Goto, 2000; Kanehisa et al., 2014; Pérez-Pantoja et al., 2010), which
most likely enhanced Rhizobiales‟ and Sphingomonadales‟ adaptability to BTEXS
mixture feed. When the substrate feed was switched to styrene, Sphingomonadales
decreased slightly from 1.9% to 0.9% while Rhizobiales remained a prominent
population (6.9% to 20.7%) (Table 5.2). Styrene-degrading pure cultures, from both
bacterial orders, was previously reported, but were limited to the genera
Xanthobacter (Rhizobiales) and Sphingomonas (Sphingomonadales) (Tischler &
117
Kaschabek, 2012). Both genera were not detected at high abundances throughout
the enrichment period (between 0% and 0.3%, data not shown). Instead, the bulk of
the Alphaproteobacteria members detected, particularly from Rhizobiales, are
currently not known to assimilate styrene directly. While Rhizobiales is most well-
known for its nitrogen-fixing property and is typically associated with plant as a
root-nodule endosymbiont (Masson-Boivin et al., 2009), there are emerging genetic
evidence hinting at its involvement in direct styrene degradation. Intriguingly, 51%
polypeptide identity was found between NodW, a root nodulation response
regulator, and StyR, a response regulator responsible for up-regulating styrene
degradation genes (O'Leary et al., 2002). Another study identified a novel
functional smoA gene, from loam soil metagenome, which showed 95% genetic
similarity to uncharacterized homologs from Rhizobales; the gene encodes styrene
monooxygenase, which is an enzyme that catalyzes the epoxidation of styrene,
making the compound more liable to degradation (van Hellemond et al., 2007). This
genetic evidence, coupled with Rhizobiales‟ dominant presence in styrene-enriched
sludge, strongly suggests that Rhizobiales could be part of a core styrene-degrading
population alongside Pseudomonadales. However, further studies, focusing on the
function of Rhizobiales, would be required to confirm this theory.
Bacteroidetes formed the second largest bacterial population after Proteobacteria
and was detected at 21.4% following 19.5 months of enrichment (Figure 5.4).
Under Bacteroidetes, the class Sphingobacteria and its order Sphingobacteriales was
initially detected at 4%, but increased by more than 13%, and became as equally
dominant as Rhizobiales and Pseudomonadales (i.e., 17.5%) (Table 5.2). Styrene-
degrading capability has been reported for the genus Sphingobacterium
(Sphingobacteriales) (Przybulewska et al., 2006), but Sphingobacterium existed at
non-dominant levels (0.1% to 0.3%, data not shown), suggesting that it is not the
main styrene-degrading population in this study. Strikingly, the abundance of
Bacteroidetes and Sphingobacteria in styrene-enriched sludge was much higher than
what was previously reported in styrene-degrading biofilter (Bacteroidetes, about
2%; Sphingobacteria, less than 1%) (Portune et al., 2015). Sphingobacteriales have
also been identified in BTEX-contaminated groundwater (22% to 23%) (Lee et al.,
118
2010), phenol-degrading reactors (Basile & Erijman, 2010), soil contaminated with
cyclic explosive compound hexahydro-1,3,5-trinitro-1,3,5-triazine (RDX) (about
15%) (Jayamani et al., 2013), and sites polluted by polychlorinated biphenyls
(PCBs) (Luo et al., 2008). Genes involved in the catabolism of styrene metabolites
homogentisate and fumarylacetoacetate (i.e., homogentisate 1,2-dioxygenase and
fumarylacetoacetate hydrolyase), phenolic compounds (i.e., oxidoreductases, 2-
keto-4-pentenoate hydradatase and 2-oxohepta-3-ene-1,7-dioic acid hydratase) and
benozate (i.e., protocatechuate 3,4-dioxygenase) were identified, while
oxidioreductases-encoding genes involved in the catabolism of biphenyl, toluene
and xylene were predicted from Sphingobacteriales genomes (Kanehisa & Goto,
2000; Kanehisa et al., 2014; Ntougias et al., 2014). These findings imply that
Sphingobacteriales is genetically-primed to adapt and survive on various aromatic
and cyclic hydrocarbon compounds. Nevertheless, it is unclear why there is a huge
discrepancy of about 20% between the abundance of Bacteroidetes/Sphingobacteria
detected in this study and peat-inoculated styrene-degrading biofilter (Portune et al.,
2015). Inoculum abundance and richness did not appear to be a contributing factor.
Based on existing reports, the abundance of Bacteroidetes and Sphingobacteria in
peat (Bacteroidetes, 0% to 3.6%; Sphingobacteria, 0% to 3.3%) and air samples
(Bacteroidetes, 5% to 20%; Sphingobacteria, 0% to 6%) (Bowers et al., 2011; Sun
et al., 2014) were similar to this study‟s sludge inoculum (Bacteroidetes, 11.5%;
Sphingobacteria, 4.9%) (Figure 5.4 and Table 5.2). Higher richness was also
observed in peat (Chao1: 5,291 to 17282; ACE: 9,388 to 32,330) (Sun et al., 2014)
compared to this study‟s sludge inoculum (Chao1: 1,143; ACE: 1,658) (Table 5.1).
Hence, it could be that Bacteroidetes/Sphingobacteria has a higher proliferation rate
in aqueous environment or the group benefited from a favorable synergism within
aqueous consortium. More studies would be needed to address these speculations.
Proteobacteria members such as Xanthomonadales (Gammaproteobacteria; 1.3% to
2.1%), Myxococcales (Deltaproteobacteria; 0% to 1.6%) and Campylobacterales
(Epsilonproteobacteria; 0% to 0.1%) were detected at low levels but found to
emerge/increase under styrene enrichment. Similar trend was also observed for
some minor bacterial phyla and their corresponding orders. This includes the
119
phyla/orders Planctomycetes/Planctomycetales (0.2% to 0.8%), Deinococcus-
Thermus/Deinococcales (0.2% to 0.6%), Verrucomicrobia/Opitutales (0% to 0.1%)
and Acidobacteria/incertae sedis (0% to 0.1%) (Table 5.2). Xanthomonadales
members, particularly from the genus Stenotrophomonas, are known to degrade
styrene and BTEX (Dao et al., 2014; Lee et al., 2002). However, Stenotrophomonas
formed only about 0.2% of the consortium (data not shown). While existing studies
show a positive relationship between Stenotrophomonas abundance and styrene
inlet concentrations, Stenotrophomonas remained at low levels of 2% or less
(Juneson et al., 2001; Portune et al., 2015). The low abundance of
Stenotrophomonas suggests that it is not part of the main styrene-degrading
population. Furthermore, majority of the Xanthomonadales members detected
belonged to the genus Dokdonella (1.2%, data not shown), which are not known to
be styrene-degrading. Bacterial orders from Deltaproteobacteria (i.e, Myxococcales)
and minor phyla (i.e, Planctomycetales, Deinococcales, and Acidobacteria Gp3
incertae sedis) are also not known to assimilate styrene, but their presence have
been noted in styrene-degrading and phenol-degrading mixed cultures, and BTEX-
contaminated sites (Feris et al., 2004; Lee et al., 2010; Portune et al., 2015; Silva et
al., 2012). Species from some of these orders reportedly harbor aromatic catabolism
pathways. Arcobacter sp. (Campylobacterales) possesses the enzymes catechol 2,3-
dioxygenase and 2-hydroxymuconate-semialdehyde hydrolase, which are involved
in the breakdown of styrene metabolite 3-vinylcatechol (Kanehisa & Goto, 2000;
Kanehisa et al., 2014). A recent analysis on the core metabolic pathway of eleven
type strains, from the order Planctomycetales, revealed genetic potential for the
metabolism of diverse aromatic compounds including ethylbenzene, toluene,
benzoate, and etc, as well as dispensable pathways for styrene degradation (Guo et
al., 2014). Since the catabolism pathways for many aromatic compounds are known
to share common metabolites and many ring-cleavage enzymes have broad
substrate-specificity (Pérez-Pantoja et al., 2010), it is plausible that the emergence
and/or increase of these bacterial orders was due to their ability to utilize styrene
degradation intermediates, generated as a result of styrene metabolism by the core
styrene-degrading population, such as Pseudomonadales, within the consortium.
These styrene metabolites include phenylacetate and homogentisate generated from
120
the side chain oxidation pathway; 3-vinylcatechol, generated from the direct ring
cleavage pathway; and more downstream metabolites such as benzoate,
phenylalanine, Kreb Cycle intermediates, which could support non-styrene-
assimilating sub-populations within the consortium (Kanehisa & Goto, 2000;
Kanehisa et al., 2014; Tischler & Kaschabek, 2012).
Phyla that decrease under styrene enrichment
Major phyla Firmicutes and Actinobacteria, and minor phylum Chloroflexi initially
occur in BTEXS-enriched inoculum at 8.4%, 9.8% and 0.6%, respectively, but
decreased by about 0.4% to 5% with styrene enrichment, suggesting that these
phyla may play a less important role in styrene degradation (Figure 5.4). Within
Firmicutes, the classes Clostridia and Bacilli were detected. It was interesting to
note that most of the Firmicutes members belonged to Clostridia (4.8%), which is a
class of obligate anaerobes (Table 5.3). Clostridia was also reported at levels of 1%
to 2% in styrene-degrading filter (Portune et al., 2015). Its presence indicates that
despite aeration, the dissolved oxygen content in styrene-degrading systems may be
low. Dissolved oxygen contents, associated with active styrene-degrading system or
aromatic-contaminated sites, were detected at about 50% to 90% lower than non-
active system and non-polluted sites (Lee et al., 2010; Nikodinovic-Runic et al.,
2011). This is probably because the aerobic degradation of styrene and other
aromatic compounds is typically initiated by the addition of oxygen atoms to the
aromatic ring or side chains (Pérez-Pantoja et al., 2010; Tischler & Kaschabek,
2012), resulting in rapid oxygen consumption and therefore, lower dissolved
oxygen contents. In this study, the lack of stirring could have also given rise to
pockets of anaerobic zones within the system, favoring Clostridia‟s survival.
Clostridia was represented by the order Clostridiales. (Grbić-Galić et al., 1990)
reported the isolation of non-styrene-assimilating Clostridium species (Clostridiales)
from styrene-degrading anaerobic consortia as well as the detection of styrene
degradation compounds phenylacetic acid, benzyl alcohol, benzaladehyde, benozate
and phenol in the cultivation medium. Members of Clostridiales are known to
harbor xenobiotic compound-degrading enzymes that could assimilate the
aforementioned compounds. This include benzoyl-CoA reductase and
121
3-hydroxyacyl-CoA dehydrogenase, which participate in the metabolism of toluene,
and styrene metabolites benzoate and phenylalanine (Carmona et al., 2009;
Kanehisa & Goto, 2000; Kanehisa et al., 2014; Shah et al., 2013). Hence, this could
account for Clostridiales‟ adaptability and presence in styrene-degrading microbial
community.
The classes Bacilli (Firmicutes) and Acintobacteria (Actinobacteria) were detected
at levels ranging from 0.7% to 2% and 3.5% to 5.9%, respectively (Table 5.3). Both
classes were also identified in styrene-degrading biofilters and at levels similar to
this study (Alexandrino et al., 2001; Portune et al., 2015). Aromatic-degrading
ability was reported for pure cultures from both classes. Specifically, Bacilli
members could assimilate benzene, toluene and xylene (Jacques et al., 2007).
Actinobacteria members could metabolize a wide range of aromatics including
BTEX, catechol, PAH, biphenyl, and napthalene (Hori et al., 2009b; Jacques et al.,
2007; Kämpfer, 2010), which could explain their higher abundance in BTEXS
sludge inoculum (9.8%) (Table 5.3). Styrene degradation has also been reported in
the genera Rhodococcus, Mycobacterium, Tsukamurella (Actinobacteria) and
Bacillus (Bacilli) (Arnold et al., 1997; Burback & Perry, 1993; Jung & Park, 2005;
Warhurst et al., 1994). However, Bacillus was not detected in this study whereas all
known styrene-degrading species from Actinobacteria were detected at low levels
(0% to 0.3%) (data not shown). Therefore, known styrene degraders from
Actinobacteria and Bacilli did not appear to be a core styrene-degrading population.
Similar findings were also previously reported by Alexandrino et al. (2001). The
researchers used SIP method to investigate a styrene-degrading biofilter, and failed
to observe styrene assimilation by Bacilli and Acintobacteria despite being presence
in the biofilter. Taken together, the findings from this work and previous work
indicated that Bacilli and Actinobacteria does not appear to be the primary
degraders in styrene-degrading consortium.
The minor phylum Chloroflexi is not known to degrade styrene but have been noted
in styrene-degrading biofilter (1% to 7%) (Portune et al., 2015), phenol-degrading
sludge (Silva et al., 2012), anaerobic benzene-degrading environment (Herrmann et
122
al., 2008), PAH-contaminated groundwater site (23%) (Winderl et al., 2008). Genes
mapped to styrene, toluene and benzoate degradation have also been identified in
Chloroflexi (Kanehisa & Goto, 2000; Kanehisa et al., 2014).
Collectively, Firmicutes, Actinobacteria, and Chloroflexi members, detected in this
study, are frequently associated with environs exposed to aromatic compounds.
Despite their apparent limited potential for direct styrene assimilation, they possess
versatile catabolic potential for the metabolism of many other mono-aromatic
compounds. This suggests that they could be secondary degraders, who are
responsible for the mineralization of styrene degradation by-products. More studies
will be needed to clarify their functional roles.
Potential PHA-producing members
The PHA bioaccumulation trait is widespread within the bacterial domains and
occurs in species from more than 100 bacterial genera (Koller et al., 2010). In this
study, many of these bacterial genera were detected in the styrene-enriched sludge.
These genera include Pseuodmonas and Acinetobacter (Pseudomonadales,
Gammaproteobacteria), Hyphomicrobium, Methylobacterium, Nitrobacter,
Rhizobium, Rhodopseudomonas and Xanthobacter (Rhizobiales,
Alphaproteobacteria), Paracoccus (Rhodobacterales, Alphaproteobacteria),
Azospirillum (Rhodospirillales, Alphaproteobacteria), Comamonas, Cupriavidus
and Thiobacillus (Burkholderiales, Betaproteobacteria), Rhodococcus
(Actinomycetales, Actinobacteria), and Clostridium and Syntrophomonas
(Clostridales, Clostridia). While many of these genera belonged to orders, which
dominated the system and formed about 41% to 56.5% of the styrene-degrading
consortium (data not shown), the total abundance of these genera were only 2.8% to
5.9% (data not shown). Nonetheless, it was also observed that there were a total of
13.5% to 24.5% bacterial sequences, which belonged to the same family as the
aforementioned genera but could not be classified at the genus level (data not
shown). These unclassified sequences could have resulted in an underestimation of
these genera. In a study by Portune et al. (2015), the authors found that the
unclassified sequences within the family Pseudomonadaceae shared high sequence
identity to genus Pseudomonas. Hence, it may be possible that the genera, with
123
PHA-producing potential, are higher than the levels detected. It should be noted,
however, that there are variation in PHA biosynthesis abilities among species from
the same genus, which could in turn be influenced by predisposition of PHA
synthesis genes, carbon source and nutrients conditions (Choi & Lee, 1999). As
such, this study is unable to provide conclusive identification of the PHA producers.
Future studies would be needed to assess the PHA accumulation capability and to
identify the PHA producers of styrene-enriched sludge.
5.5 Summary
This study investigated the bacterial community structure of a styrene-degrading
activated sludge. BTEXS-enriched sludge served as the sludge inoculum for styrene
enrichment, and changes in bacterial composition over a 19.5-month period was
documented using next-generation 16S rDNA sequencing technique. Styrene
exposure increased species richness (Chao 1: 1,143 to 2,322; ACE: 1,658 to 4,632),
bacterial diversity (Inverse Simpson: 6.39 to 10.33; Shannon diversity: 2.34 to 2.96)
and altered the bacterial profile. The most abundant phylum was Proteobacteria,
which consistently made up more than half of the consortium (51.6% to 64.9%).
However, most strikingly, a shift in the dominance of Proteobacteria classes from
Alphaproteobacteria and Betaproteobacteria (0 month: 60.2%) to
Alphaproteobacteria and Gammaproteobacteria (19.5 months: 43.7%) was observed
under prolonged styrene enrichment. The shift was due to the decreased abundance
of Betaproteobaceria (28.7% to 8.9%) and increased abundance of
Gammaproteobacteria (2.3% to 22.2%), specifically, the well-known styrene-
degrading bacterial order Pseudomonadales (0.6% to 16.7%). Alphaproteobacteria
was represented by the order Rhizobiales (6.9% to 20.7%), which harbors putative
styrene catabolic smoA gene. Hence, Pseudomonadales and Rhizobiales probably
form the primary styrene-degrading bacterial population in activated sludge.
Aside from Proteobacteria, 11 other bacterial phyla and 1 unclassified phylum were
also detected. Amongst them, the presence of Aquificae, Chlamydiae, and
Gemmatimonadetes was transient and low (0% to 0.3%). Their temporary existence
in the consortium appeared to be associated with perturbations which include the
124
switch in carbon substrates from BTEXS to styrene (between 0 and 3 months) and
desludging (16 months). Hence, these phyla are not considered to be part of the
stable bacterial population in this study. An overall increase in abundance was
observed for Bacteriodetes (11.5% to 21.4%), Planctomycetes (0.2% to 0.8%),
Deinococcus-Thermus (0.2% to 0.6%), Verrucomicrobia (0% to 0.3%),
Acidobacteria (0% to 0.1%) and the unclassified phylum (4.2% to 6.3%), which
suggested that this study‟s styrene-degrading environ was favorable to these phyla.
In contrast, an overall decrease in abundance was noted for Firmicutes (8.4% to
6.3%), Actinobacteria (9.8% to 4.5%) and Chloroflexi (0.6% to 0.2%), suggesting
that the same environ was less favorable to these phyla. Some genera with known
styrene-degrading species were identified in this study including the Bacteroidetes
genus Sphingobacterium and Actinobacteria genera Rhodococcus, Mycobacterium
and Tsukamurella. However, these genera were detected at very low levels between
0% and 0.3%, which meant that they are not the core styrene-degraders in this
system. Aside from these species, there is limited evidence on direct styrene
metabolism for most members of the aforementioned phyla. Nevertheless, many
literatures have reported the presence of these members in aromatic-degrading
consortia and aromatic-contaminated environs, as well as their diverse aromatic
catabolic capability and potential. Hence, it is likely that these members assimilate
the styrene metabolites, and through synergistic degradation, work alongside the
styrene-degraders to achieve complete mineralization of styrene.
This study presents the first reference of the styrene-degrading bacterial community
in aqueous environment, providing a knowledge base to facilitate the selection of
seeding sludge for similar bioprocesses. Specifically, bacterial orders
Pseudomonadales and Rhizobiales are postulated as key to the styrene
biodegradation capability of the microbial community, and should be considered as
important biomarkers. Sphingobacteriales does not appear to form the primary
styrene-degrading population but this order of bacteria occurs at much higher
abundance in the aqueous consortium as compared to biofilter consortium,
suggesting that it could serve as an additional biomarker in aqueous seeding sludge.
Other biomarkers include Clostridiales, and Actinomycetales. This study also
125
identified potential PHA-producing members, notably, bacterial genera from the the
dominant bacterial orders Pseudomonadales and Rhizobiales (Pseuodmonas,
Acinetobacter, Hyphomicrobium, Methylobacterium, Nitrobacter, Rhizobium,
Rhodopseudomonas and Xanthobacter) and other less dominant or minor bacterial
orders Rhodobacterales, Rhodospirillales, Burkholderiales, Actinomycetales,
Clostridales (Paracoccus, Azospirillum, Comamonas, Cupriavidus, Thiobacillus,
Rhodococcus, Clostridium and Syntrophomonas). This suggests that PHA-
producing members could be native to aqueous styrene-degrading consortium,
providing a logical basis for future process optimization, bioaugmentation and
formulation of defined microbial cocktails to enhance the biological process for
simultaneous styrene elimination and PHA production.
However, this study has several limitations. First, the bacterial community was
largely classified at the order level. Beyond the order level and particularly at the
genus level, there were a high percentage of unclassified sequences. The same
outcome was observed with different taxonomy databases (i.e., SILVA and
Ribosomal Database Project [RDP] databases) and at two different commonly-used
pseudobootstrap cutoff values (i.e., 60% and 80%) (Gaidos et al., 2011; Mizrahi-
Man et al., 2013; Schloss, 2009). Hence, it was not possible to affirm the specific
identity for most bacterial community members. As this study is restricted to
genomic 16S rDNA analysis, this study could also neither confirm the identity of
PHA-producers nor provide conclusive evidence on the functional role of bacterial
members. Bacterial isolation study could help provide confirmative information on
the identity and role of culturable microbes within styrene-degrading consortium.
Furthermore, strategies such as bioaugmentation and creating defined microbial
cocktails are greatly dependent on the availability of pure bacterial isolates. Hence,
bacterial isolation study could also yield bacterial cultures that could be applied as
bioaugmentation strains or microbial cocktail members.
126
CHAPTER 6
Study 4:
Isolation and Characterization of Styrene-
Degrading and MCL-PHA-Accumulating Bacteria
from Enriched Activated Sludge
127
6.1 Introduction
The bioconversion of styrene to PHA has been described in four bacterial strains, all
of which belonged to Pseudomonas, under the class of Gammaproteobacteria
(Tobin & O'Connor, 2005). These bacterial strains are Pseudomonas sp. TN301, P.
putida CA-3 (NCIMB 41162), P. putida CA-1, and P. putida S12 (Narancic et al.,
2012; Tobin & O'Connor, 2005; Ward et al., 2005). These bacterial strains
assimilate styrene to form saturated PHA precursors (R)-3-hydroxyalkanoates of
varying carbon chain length between C6 to C12 and unsaturated C12:1 precursors. The
polymerization of the aforementioned PHA precursors gave rise to MCL-PHA,
through the de novo fatty acids synthesis pathway (Hume et al., 2009).
Most of these Pseudomonas species accumulate MCL-PHA at low cellular contents
of between 3 and 14% CDM. The only exception is P. putida CA-3, which can store
MCL-PHA up to 33% CDM and 31.8% CDM under shake-flask and fermentor
conditions, respectively (Nikodinovic-Runic et al., 2011; Nikodinovic et al., 2008).
However, P. putida CA-3 is a patented bacterium and is not readily-accessible for
further scientific investigation and bioprocess application. Therefore, there is a lack
of bacterial strains with the metabolic capacity to bioconvert styrene into MCL-
PHA efficiently, necessitating the need to increase the pool of pure microbial
cultures.
Chapter 5 has unraveled an aqueous styrene-degrading consortium with diverse
bacterial composition. Aside from Pseudomonas, potential PHA-producing
members were noted. Presently, it is unknown if there may be other bacteria genera,
which are capable of converting styrene into MCL-PHA. Hence, further
investigation is required. Additionally, this study could provide confirmative
information on the identity and role of culturable microbes within mono-aromatic-
degrading consortia such as the styrene-degrading consortium.
6.2 Materials and Methods
6.2.1 Isolation of styrene-degrading bacteria
Pure bacterial cultures were isolated from an aerobic bioreactor, seeded with
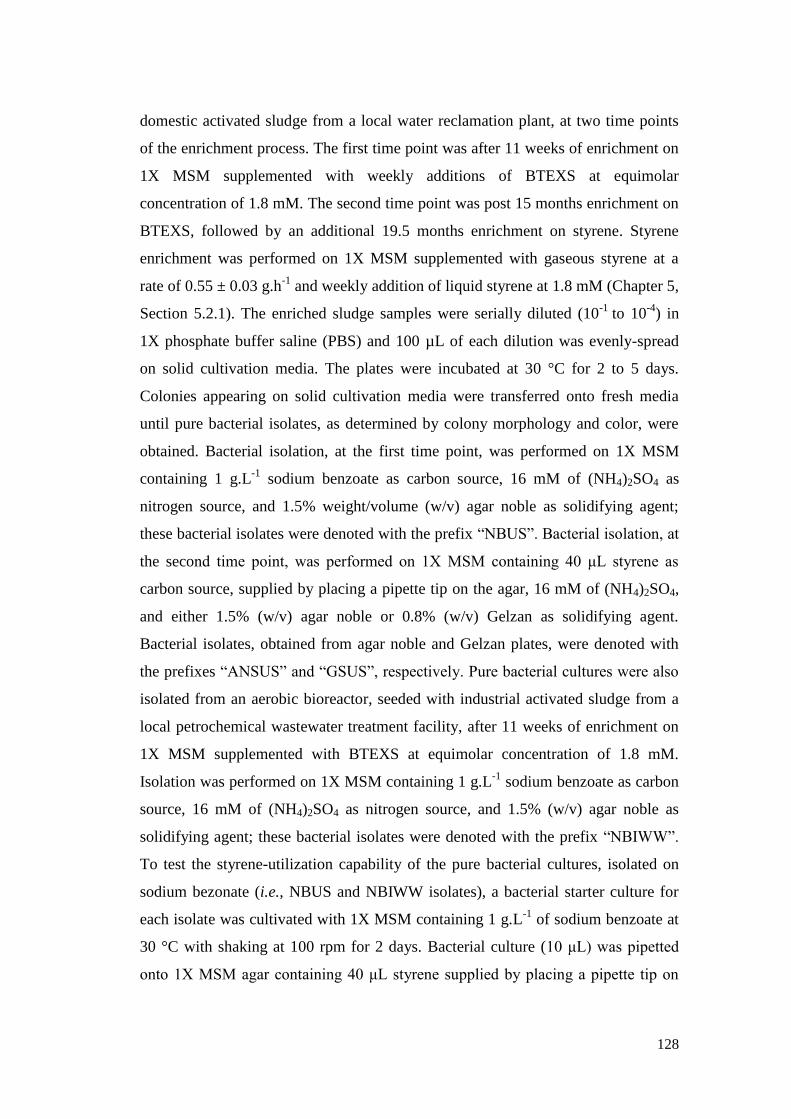
128
domestic activated sludge from a local water reclamation plant, at two time points
of the enrichment process. The first time point was after 11 weeks of enrichment on
1X MSM supplemented with weekly additions of BTEXS at equimolar
concentration of 1.8 mM. The second time point was post 15 months enrichment on
BTEXS, followed by an additional 19.5 months enrichment on styrene. Styrene
enrichment was performed on 1X MSM supplemented with gaseous styrene at a
rate of 0.55 ± 0.03 g.h-1
and weekly addition of liquid styrene at 1.8 mM (Chapter 5,
Section 5.2.1). The enriched sludge samples were serially diluted (10-1
to 10-4
) in
1X phosphate buffer saline (PBS) and 100 µL of each dilution was evenly-spread
on solid cultivation media. The plates were incubated at 30 °C for 2 to 5 days.
Colonies appearing on solid cultivation media were transferred onto fresh media
until pure bacterial isolates, as determined by colony morphology and color, were
obtained. Bacterial isolation, at the first time point, was performed on 1X MSM
containing 1 g.L-1
sodium benzoate as carbon source, 16 mM of (NH4)2SO4 as
nitrogen source, and 1.5% weight/volume (w/v) agar noble as solidifying agent;
these bacterial isolates were denoted with the prefix “NBUS”. Bacterial isolation, at
the second time point, was performed on 1X MSM containing 40 μL styrene as
carbon source, supplied by placing a pipette tip on the agar, 16 mM of (NH4)2SO4,
and either 1.5% (w/v) agar noble or 0.8% (w/v) Gelzan as solidifying agent.
Bacterial isolates, obtained from agar noble and Gelzan plates, were denoted with
the prefixes “ANSUS” and “GSUS”, respectively. Pure bacterial cultures were also
isolated from an aerobic bioreactor, seeded with industrial activated sludge from a
local petrochemical wastewater treatment facility, after 11 weeks of enrichment on
1X MSM supplemented with BTEXS at equimolar concentration of 1.8 mM.
Isolation was performed on 1X MSM containing 1 g.L-1
sodium benzoate as carbon
source, 16 mM of (NH4)2SO4 as nitrogen source, and 1.5% (w/v) agar noble as
solidifying agent; these bacterial isolates were denoted with the prefix “NBIWW”.
To test the styrene-utilization capability of the pure bacterial cultures, isolated on
sodium bezonate (i.e., NBUS and NBIWW isolates), a bacterial starter culture for
each isolate was cultivated with 1X MSM containing 1 g.L-1
of sodium benzoate at
30 °C with shaking at 100 rpm for 2 days. Bacterial culture (10 μL) was pipetted
onto 1X MSM agar containing 40 μL styrene supplied by placing a pipette tip on
129
Figure 6.1 Flow diagram of the styrene-degrading bacterial isolation procedure.
the agar. The petri dish was tightly-sealed with parafilm and placed in an air-tight
jar at 30 °C for up to 5 days. A negative control setup, without carbon substrate,
was included. A summary of the isolation procedure is provided in Figure 6.1.
6.2.2 Total genomic DNA extraction, 16S rDNA and phaC genetic
characterization of bacterial isolates
Total DNA of styrene-degrading bacterial isolates were extracted according to a
chemical-lysis method (Liu et al., 1997) described in Section 5.2.4. Extracted DNA
material served as template for PCR amplification of bacterial 16S rDNA using
primer set 8F/1490R (Weisburg et al., 1991) and PHA synthase phaC gene using
general primer set G-D/G-1R, which amplifies a section of the genes encoding
130
Class I PHA synthase (phaC) and Class II PHA synthases (phaC1 and phaC2)
(Romo et al., 2007). PCR reaction mixture consisted of 1X GoTaq Colorless
Mastermix (Promega, Madison, WI), with 0.2 µM of each primer, 3.0 mM MgCl2, 1
µL of DNA template, and nuclease-free water to complete the 50 µL reaction
mixture. Amplification was performed on a Bio-Rad C1000 Thermal Cycler (Bio-
Rad Laboratories Inc., Richmond, California) according to temperature programs
previously described (Romo et al., 2007; Weisburg et al., 1991). Gel electrophoresis
was used for detection of PCR products. Detection of 16S rDNA PCR products
were performed using gel electrophoresis at 100V for 30 min, on 1% (w/v) agarose
containing 0.2X Gel Red (Biotium, Hayward, CA, USA), and in 1X tris-acetate-
EDTA (TAE) buffer. The size of 16s rDNA PCR products was estimated using a 1
kb molecular mass marker (Promega, USA). Detection of phaC PCR products were
performed under gel electrophoresis conditions of 70V for 75 min, on 1.5% (w/v)
agarose containing 1X Gel Red (Biotium, Hayward, CA, USA). The size of phaC
PCR products was estimated using a 100 bp DNA molecular mass marker (Promega,
USA). PCR products were visualized under UV light and recorded with a gel
documentation system (UVItec, UK). Sequencing of the 16S rDNA PCR product
was performed by a local sequencing service company (Axil Scientific Pte Ltd,
Singapore). Partial 16S rDNA sequences of bacterial isolates (> 1,400 bp) were
compared to available sequences in GenBank using the National Center for
Biotechnology Information (NCBI) Basic Local Alignment Search Tool (BLAST)
program. MEGA5.2 software (Tamura et al., 2011) was used to align the 16S rDNA
sequences (with provided ClustalW function) and construct a neighbor-joining tree
with Juke-Cantor correction. Bootstrapping for 1,000 replicates was used to
estimate the confidence of the tree‟s topology.
6.2.3 Screening for MCL- PHA accumulation in styrene-degrading bacterial
isolates
Bacterial starter cultures were transferred to a 250 mL conical flask, containing 50
mL of 1X MSM and 0.25 g.L-1
NH4Cl (67 mg.L-1
nitrogen; nitrogen-limited), at a
final optical density at 600 nm (OD600) of 0.01. Styrene (350 μL) was added to a
central fused column, which enabled styrene to partition into the headspace and
131
liquid medium. The conical flasks were tightly-sealed and incubated at 30 °C at 200
rpm. After 48 h, the bacterial cultures were centrifuged (9840 g, 15 °C, 10 min) to
harvest the cell pellets. Cell pellets were washed twice with 1X PBS buffer and
freeze-dried. The CDM of freeze-dried biomass was determined. MCL-PHA
content was quantified by subjecting dried biomass (5 to 10 mg) to methanolysis
followed by GC-MS analysis according to the procedures described by Tan et al.
(2014a) (Chapter 4). Since the amount of styrene added is not completely converted
into biomass cells and MCL-PHA, to obtain a more accurate estimate of MCL-PHA
yield from styrene, PHA productivity and non-PHA biomass productivity values
were used to calculate the amount of styrene biotically consumed based on the
following stoichiometric equations:
Non-PHA biomass synthesis: C8H8 + NH4 + 5.25 O2 -> C5H7O2N + 3 CO2 + 2.5
H2O
C10 PHA monomer synthesis: 10 C8H8 + 46 O2 -> 4 C10H18O2 + 4 H2O + 40 CO2
PHA yield was computed based on the amount of MCL-PHA produced for a given
amount of styrene biotically consumed.
6.2.4 Biochemical assay, temperature and pH shake-flask studies
Gram staining was performed with a three-step Gram stain procedure kit (Becton
Dickinson Microbiology Systems, Cockeysville, Md.). Biochemical assay was
performed using Biolog GEN III MicroPlateTM
and analyzed using Biolog
MicroLog 3 v5.2.01 software (Biolog, Inc., Hayward CA, USA). For temperature
and pH study, bacterial starter culture was inoculated to 10 mL of 1X MSM,
containing 1 g.L-1
of sodium benzoate, at a final OD600 of 0.05. To determine the
optimum growth temperature of the selected bacterial isolate, the bacterial culture
was incubated at four different temperatures (i.e., 25, 30, 35 and 40 °C). The
optimum pH for growth medium was investigated at 30 °C in the pH range of 3 to
11 (i.e., 3, 4, 5.5, 6, 7, 8, 10 and 11) with pH adjustment by the addition of either
HCl or NaOH. In both studies, bacterial growth over the course of 72 h was
monitored by changes in OD600 readings with a Cary UV-Vis spectrophotometer
132
(Agilent Technologies, Palo Alto, California) at 12 h intervals and 24 h intervals for
temperature and pH studies, respectively. Results from the temperature and pH
studies were plotted using B-Spline and Spline curve-fitting functions, respectively,
with OriginPro 8.5.1 (OriginLab Corporation, Northampton, MA, USA).
6.2.4 PCR amplification of phaZ gene and phylogenetic tree construction
For amplification of PHA depolymerase phaZ gene, the primers DEV15R and
DEV15L (Solaiman & Ashby, 2005), were reverse-complemented and modified to
DEV15R-RC (5‟-GCA TCG GCG CCA ACC TGG-3‟) and DEV15L-RC (5‟-GRA
ACT TCA TGA TGA TCG GGG-3‟). Amplification was performed with
temperature program: 1 cycle at 95 ºC for 5 min, followed by 25 cycles at 94 ºC for
30 sec, 63.4 ºC for 30 sec and 72 ºC for 45 sec, and a final cycle at 72 ºC for 5 min.
DNA template from known PHA-accumulator P. putida mt-2 (NCIMB 10432)
served as a positive control while DNA template from non-PHA accumulator
Escherichia coli CN13 (ATCC 700609) served as a negative control. A PCR
reaction without DNA template was also included to serve as an empty control.
Sequencing of the phaZ PCR product was performed by Axil Scientific Pte Ltd
(Singapore). Partial phaZ sequences (> 600 bp) were compared to available
sequences in GenBank using the NCBI BLAST program and to other existing PHA-
producing Pseudomonads described by Solaiman and Ashby (2005). Phylogenetic
tree construction, based on partial phaZ sequences, was performed using MEGA5.2
software (Tamura et al., 2011) according to the procedures previously-described.
Phylogenetic tree of PhaZ protein sequences was constructed using the Neighbor-
joining (p-distance) algorithm with bootstrapping for 1,000 replicates to estimate
the confidence of the tree‟s topology.
6.2.6 Transmission electron microscopy (TEM)
Bacterial cells were recovered by centrifugation (9425 g, 10 min). Cell pellet was
resuspended in fixation buffer, containing 2% (v/v) paraformaldehyde and 2.5%
(v/v) glutaraldehyde, for 2 h. Following fixation, the immobilized cells were
washed thrice with 0.5X PBS and post-fixed with 1% (v/v) osmium tetraoxide for 2
h. The cells were washed thrice with 0.5X PBS and dehydrated through a graded
133
acetone series. The dehydrated cells were embedded with propylene oxide and
Spurr resin (1:1 ratio [v/v]) and polymerized. Ultrathin sections, between 70 and
100 nm in thickness, were cut with a Leica UCT ultramicrotome (Leica
Microsystems Inc., Bannockburn, IL, USA). Ultrathin sections were stained with
uranyl acetate followed by lead citrate before viewing with a JEOL JEM 2010F
TEM (JEOL, Tokyo, Japan), equipped with a field-emission gun, with an
accelerating voltage of 200 kV. Imagining was done at magnifications of 25,000 to
40,000X. Image capture was performed with a GATAN charge-coupled device
camera and analyzed using commercial GATAN software (Gatan Inc., Pleasanton,
CA, USA).
6.2.7 Bacterial cultivation for MCL-PHA polymer extraction
Overnight bacterial starter culture was inoculated to a 1 L cultivation reactor
containing 500 mL of 1X MSM at an initial OD600 of 0.1. Temperature and agitation
were controlled at 30 °C and 100 rpm, respectively. The initial pH of the cultivation
media was adjusted to 7.19 ± 0.15. A styrene reservoir was set up using a serum
bottle and placed in between the air pump and cultivation reactor. The air pump was
connected to the inlet of the reservoir to induce the volatilization of styrene.
Gaseous styrene exited the reservoir via a reservoir outlet and was supplied to the
culture via an air sparger. The flow rate of gas mixture was set to 500 mL.min-1
using an airflow regulator, delivering gaseous styrene to the reactor at an average
rate of 3.63 ± 0.54 g.h-1
. Nitrogen source NH4Cl was added at an initial
concentration of 191 mg.L-1
(50 mg.L-1
nitrogen) and further additions of 95.5
mg.L-1
(25 mg.L-1
nitrogen) at 24 and 48 h to maintain nitrogen at a limiting level
for MCL-PHA accumulation. After 72 to 120 h of cultivation, cell pellets were
harvested from bacterial cultures by centrifugation (9840 g, 15 °C, 10 min) and
washed twice with 1x PBS prior to freeze-drying. MCL-PHA polymer from 4.58 g
freeze-dried cells was extracted with dichloromethane (10% [w/v]) at 55 °C for 8 h
using a Soxhlet apparatus. The extract was filtered through Whatman No.4 filter
paper to remove cellular debris. Ice-cold methanol was added to the filtrate at 1:1
(v/v) ratio slowly under vigorous stirring to precipitate MCL-PHA. MCL-PHA was
subsequently separated from methanol-dichloromethane mixture by centrifugation
134
at 9425 g (-1 °C, 5 min), casted on a glass surface and air-dried overnight. MCL-
PHA yield was estimated based on the procedures described previously in Setion
6.2.3.
6.2.8 MCL-PHA polymer analysis
For GC-MS analysis, MCL-PHA polymer (5 to 10 mg) was derivatized according
to the procedures described by Tan et al. (2014a) (Chapter 4). For 1H-NMR and
13C-NMR analyses, 30 mg of PHA polymer was dissolved in 0.7 mL deuterated
chloroform containing 0.03% (v/v) tetramethylsilane (TMS). The solution was
transferred to a NMR tube (5 mm O.D., 7 inch length; Sigma-Aldrich, St Louis,
MO, USA). NMR spectra were recorded on a Bruker DRX-400 spectrometer at 400
MHz (Bruker, Switzerland) by using deuterated chloroform as a solvent with TMS
as an internal standard. Chemical shifts were given in ppm (δ) relative to the
chemical shift of solvent residual signals for deuterated chloroform at 7.26 and
77.00 ppm, respectively. The weight average molar mass (Mw), number average
molar mass (Mn), and polydispersity index (PDI) were determined by gel
permeation chromatography (GPC). An Agilent 1100 series GPC system equipped
with a LC pump, PLgel MIXED-C column (5 μm, 7.5 x 300 mm), and refractive
index (RI) detector were used (Agilent Technologies, Palo Alto, California). The
column was calibrated with polystyrene standards (EasiVial PS-H; Agilent
Technologies, Palo Alto, California). Tetrahydrofuran (THF), containing 250 ppm
of 2,6-di-tert-butyl-4-methylphenol (BHT) as inhibitor, was used as the mobile
phase at a flow rate of 1 mL.min-1
. Tg and Tm of MCL-PHA polymer were
determined using differential scanning calorimetry (DSC) on Mettler-Toledo DSC1
(Mettler-Toledo, Switzerland) at a heating rate of 10 °C.min-1
from -70 to 80 ºC
with a nitrogen purge at 80 mL.min-1
. The mid-point of heat capacity change was
determined as Tg while the maximum endothermic point was taken as Tm. DT was
determined as the onset temperature of the derivative thermogravimetry curve using
thermogravimetric analysis (TGA) on Netzsch STA 499 F3 (Netzsch, Germany)
with a heating rate of 10 °C.min-1
from 35 °C to 600 ºC under a nitrogen flow rate
of 50 mL.min-1
. Crystallinity of PHA polymer was determined by powder X-ray
diffraction (XRD) (Bruker AXS, D8 Advance, Karlsruhe, Germany) using Cu-K
135
radiation (K=1.5418 Å) over a 2 range of 10 to 50 °, 0.03 °.min-1
, 1 s.step-1
.
6.3 Results
6.3.1 Bacterial isolation, genotypic and phenotypic characterization
A total of 24 bacterial isolates were isolated. Of these, 17 bacterial isolates were
obtained on agar medium containing sodium benzoate; 3 bacterial isolates were
obtained on agar medium containing styrene; and 4 bacterial isolates were obtained
on Gelzan medium containing styrene. Bacterial cultures, isolated on sodium
benzoate medium, were further tested for their ability to grow using styrene as the
sole carbon source. Out of 17 benzoate-degrading bacterial isolates, only 4 isolates
(i.e., NBUS2, NBUS3, NBUS6 and NBIWW2) were unable to metabolize styrene
(data not shown).
The bacterial isolates were tested for phaC gene using a general primer set,
designed on the basis of conserved nuleic acid sequences in the regions of the Class
I and Class II PHA synthase genes (Romo et al., 2007). Class I PHA synthase gene
is reported in various genera such as Rhododoccus (Pieper & Steinbüchel, 1992),
Stenotrophomonas (Romo et al., 2014), Cupriavidus, Alcaligenes and etc (Romo et
al., 2007) while Class II PHA synthase genes are highly-conserved among PHA-
producing Pseudomonas species (Solaiman & Ashby, 2005). A PCR product with
an expected size of about 500 bp was obtained for most bacterial isolates (Figure
6.2). This indicated the presence of phaC gene and thereby, the genetic potential of
these bacterial isolates to synthesize PHA. Only two isolates, ANSUS1 and GSUS1,
both with close evolutionary relationship to Pseudomonas sp. (data not shown), did
not show any positive result for PCR detection of phaC gene.
Phylogentic clustering, based on 16S rDNA sequences, were performed for
bacterial isolates that tested positive for phaC gene. The bacterial isolates belonged
to either the phyla Proteobacteria or Actinobacteria (Figure 6.3). Under the phylum
Proteobacteria, one bacterial isolate (i.e., GSUS9) was identified as the genus
Stenotrophomonas while the rest were identified as the genus Pseudomonas. Under
the phylum Actinobacteria, both isolates NBUS4 and GSUS3 were identified as the
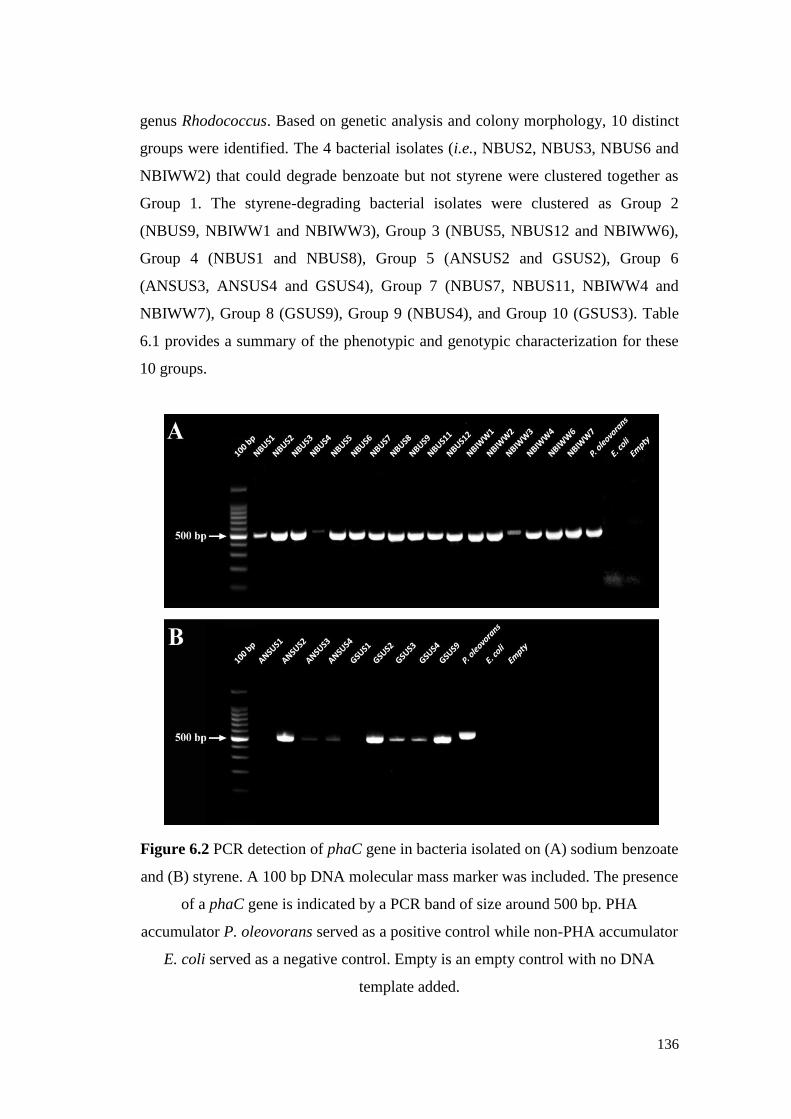
136
genus Rhodococcus. Based on genetic analysis and colony morphology, 10 distinct
groups were identified. The 4 bacterial isolates (i.e., NBUS2, NBUS3, NBUS6 and
NBIWW2) that could degrade benzoate but not styrene were clustered together as
Group 1. The styrene-degrading bacterial isolates were clustered as Group 2
(NBUS9, NBIWW1 and NBIWW3), Group 3 (NBUS5, NBUS12 and NBIWW6),
Group 4 (NBUS1 and NBUS8), Group 5 (ANSUS2 and GSUS2), Group 6
(ANSUS3, ANSUS4 and GSUS4), Group 7 (NBUS7, NBUS11, NBIWW4 and
NBIWW7), Group 8 (GSUS9), Group 9 (NBUS4), and Group 10 (GSUS3). Table
6.1 provides a summary of the phenotypic and genotypic characterization for these
10 groups.
Figure 6.2 PCR detection of phaC gene in bacteria isolated on (A) sodium benzoate
and (B) styrene. A 100 bp DNA molecular mass marker was included. The presence
of a phaC gene is indicated by a PCR band of size around 500 bp. PHA
accumulator P. oleovorans served as a positive control while non-PHA accumulator
E. coli served as a negative control. Empty is an empty control with no DNA
template added.
137
Phylogenetic analysis revealed that Group 1 and 2 bacterial isolates were closely-
related to styrene-degraders Pseudomonas sp. LQ26 and Pseudomonas sp. VLB120
(Lin et al., 2010; Panke et al., 1998) while bacterial isolates from Group 3, 6, 7, 8
and 10 were closely-related to species known to degrade various mono-aromatic,
poly-aromatic and crude oil compounds (Table 6.1). These species however, are not
known to accumulate PHA. On the other hand, Group 4, 5 and 9 bacterial isolates
were clustered together with bacterial strains known to accumulate PHA from
mono-aromatics (Figure 6.3). Group 4 was closely-related to P. putida F1, which
could biosynthesize PHA from benzene, toluene and ethylbenzene (Nikodinovic et
al., 2008); and with Pseudomonas sp. TN301, which could assimilate styrene and a
wide range of aromatic compounds for PHA production (Narancic et al., 2012).
Group 5 shared close evolutionary relationship with P. putida mt-2 and P. fulva
TY16, which reportedly produce PHA from BTEX (Ni et al., 2010; Nikodinovic et
al., 2008); and with P. putida KT2440, a bacterium capable of bioconverting many
non-aromatic substrates into PHA (Tan et al., 2014b; Wang & Nomura, 2010).
Group 9 was clustered together with Rhodococcus sp. JDC-11 and R aetherivorans
IAR1, which are bacterium strains capable of degrading phthalic acid esters and
metabolizing toluene for PHA biosynthesis, respectively (Hori et al., 2009b; Liang
et al., 2010).
Genetic comparisons between known styrene-degrading cum PHA-producing
bacteria and the newly-isolated bacteria were made. Within the Pseudomonas genus,
with the exception of Pseudomonas sp. TN301, the 16S rDNA gene sequences of
all existing styrene-degrading and PHA-producing Pseudomonas strains (i.e., P.
putida CA-3, P. putida CA-1 and P. putida S12) were unavailable. Hence, genetic
comparison could only be made between styrene-utilizing Pseudomonads isolates
and Pseudomonas sp. TN301. Group 2, Group 3 and Group 4 bacterial isolates were
evolutionarily closer to Pseudomonas sp. TN301 (99% genetic identity, 97%
coverage), followed by Group 5 and 6 (99% identity, 100% coverage), and Group 7
(96% identity, 96% coverage). To date, no bacterium from the genera
Stenotrophomonas and Rhodococcus has been reported to have the metabolic
capability of bioconverting styrene to PHA. As such, similar genetic comparisons
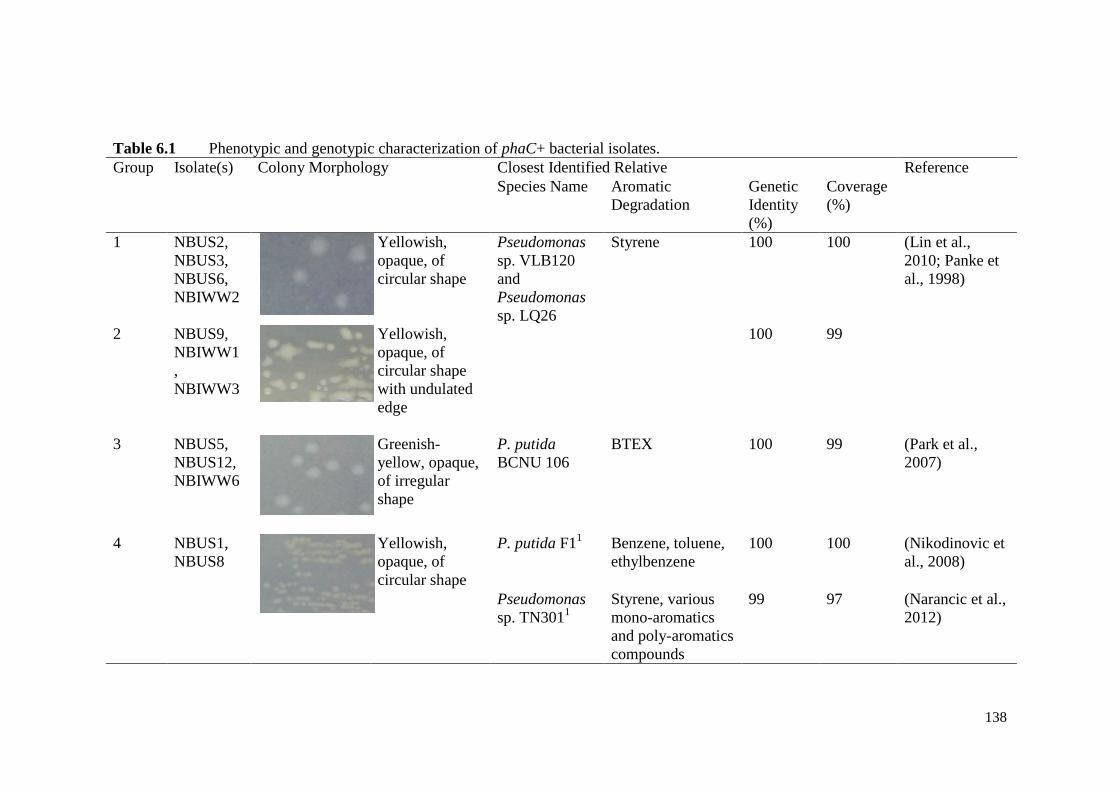
138
Table 6.1 Phenotypic and genotypic characterization of phaC+ bacterial isolates.
Group Isolate(s) Colony Morphology Closest Identified Relative Reference
Species Name Aromatic
Degradation
Genetic
Identity
(%)
Coverage
(%)
1 NBUS2,
NBUS3,
NBUS6,
NBIWW2
Yellowish,
opaque, of
circular shape
Pseudomonas
sp. VLB120
and
Pseudomonas
sp. LQ26
Styrene 100 100 (Lin et al.,
2010; Panke et
al., 1998)
2 NBUS9,
NBIWW1
,
NBIWW3
Yellowish,
opaque, of
circular shape
with undulated
edge
100 99
3 NBUS5,
NBUS12,
NBIWW6
Greenish-
yellow, opaque,
of irregular
shape
P. putida
BCNU 106
BTEX 100 99 (Park et al.,
2007)
4 NBUS1,
NBUS8
Yellowish,
opaque, of
circular shape
P. putida F11 Benzene, toluene,
ethylbenzene
100 100 (Nikodinovic et
al., 2008)
Pseudomonas
sp. TN3011
Styrene, various
mono-aromatics
and poly-aromatics
compounds
99 97 (Narancic et al.,
2012)
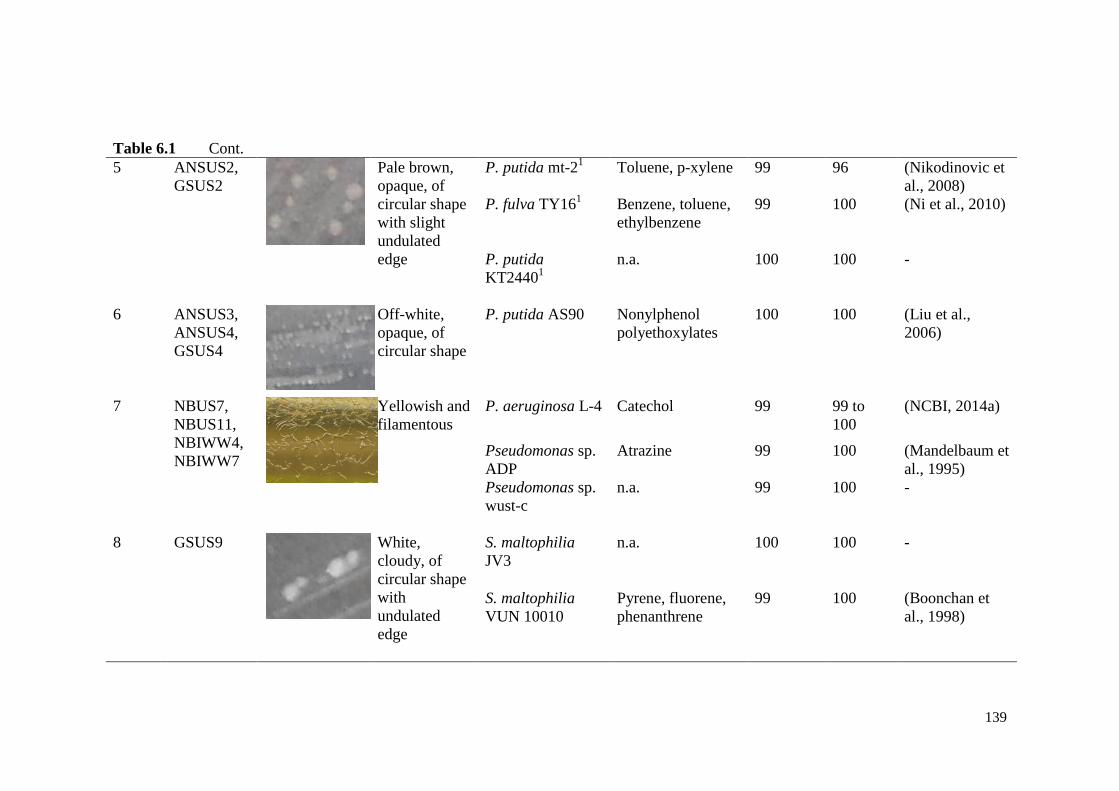
139
Table 6.1 Cont.
5 ANSUS2,
GSUS2
Pale brown,
opaque, of
circular shape
with slight
undulated
edge
P. putida mt-21
Toluene, p-xylene 99 96 (Nikodinovic et
al., 2008)
P. fulva TY161
Benzene, toluene,
ethylbenzene
99 100 (Ni et al., 2010)
P. putida
KT24401
n.a. 100 100 -
6 ANSUS3,
ANSUS4,
GSUS4
Off-white,
opaque, of
circular shape
P. putida AS90 Nonylphenol
polyethoxylates
100 100 (Liu et al.,
2006)
7 NBUS7,
NBUS11,
NBIWW4,
NBIWW7
Yellowish and
filamentous
P. aeruginosa L-4 Catechol 99 99 to
100
(NCBI, 2014a)
Pseudomonas sp.
ADP
Atrazine 99 100 (Mandelbaum et
al., 1995)
Pseudomonas sp.
wust-c
n.a. 99 100 -
8 GSUS9
White,
cloudy, of
circular shape
with
undulated
edge
S. maltophilia
JV3
n.a. 100 100 -
S. maltophilia
VUN 10010
Pyrene, fluorene,
phenanthrene
99 100 (Boonchan et
al., 1998)
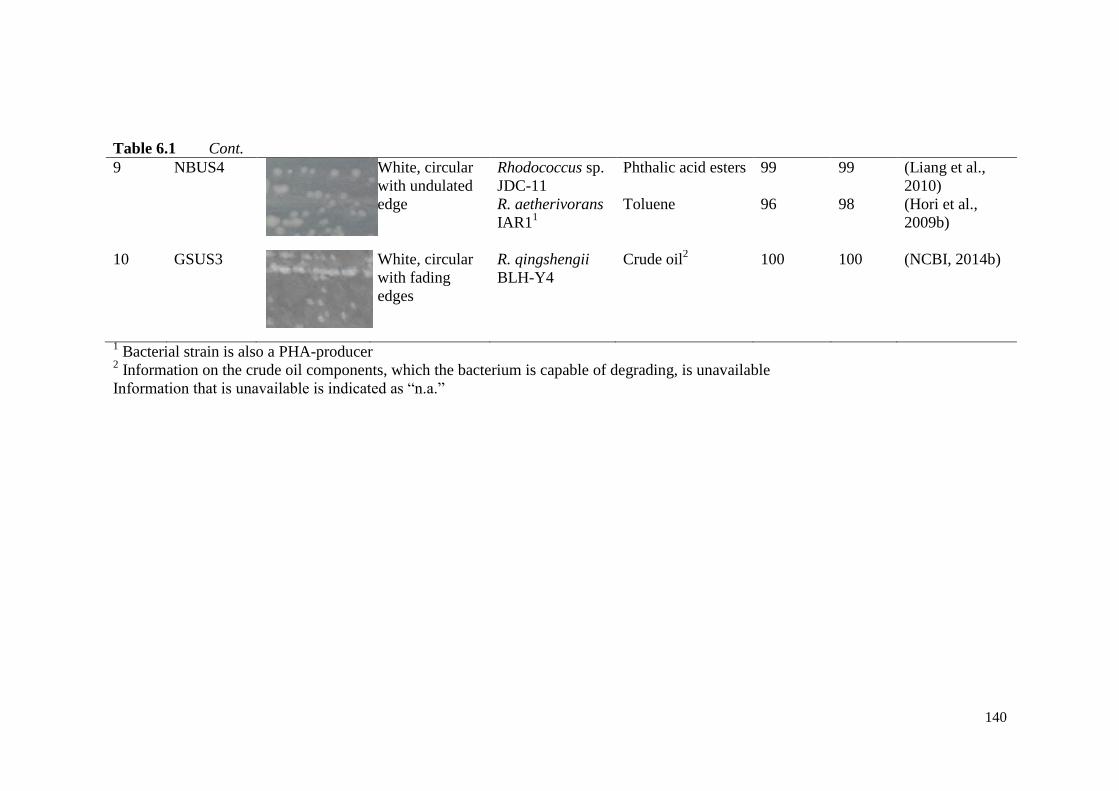
140
Table 6.1 Cont.
9 NBUS4
White, circular
with undulated
edge
Rhodococcus sp.
JDC-11
Phthalic acid esters 99 99 (Liang et al.,
2010)
R. aetherivorans
IAR11
Toluene 96 98 (Hori et al.,
2009b)
10 GSUS3
White, circular
with fading
edges
R. qingshengii
BLH-Y4
Crude oil2 100 100 (NCBI, 2014b)
1 Bacterial strain is also a PHA-producer
2 Information on the crude oil components, which the bacterium is capable of degrading, is unavailable
Information that is unavailable is indicated as “n.a.”
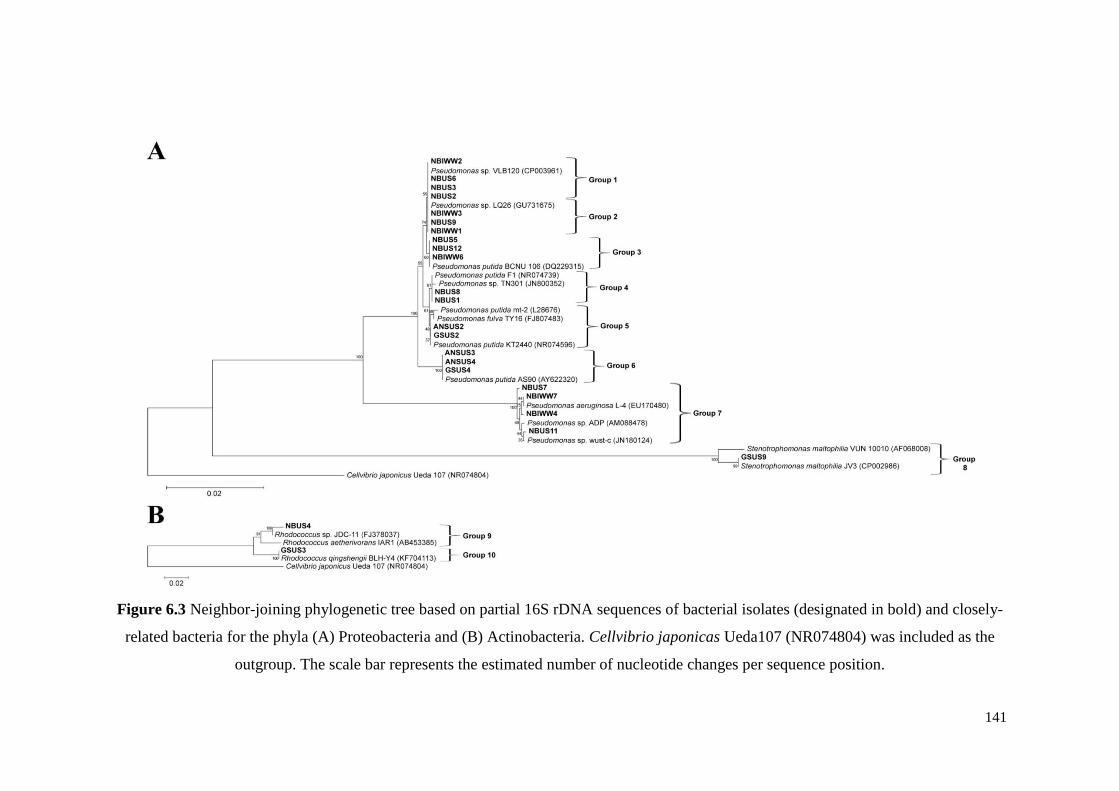
141
Figure 6.3 Neighbor-joining phylogenetic tree based on partial 16S rDNA sequences of bacterial isolates (designated in bold) and closely-
related bacteria for the phyla (A) Proteobacteria and (B) Actinobacteria. Cellvibrio japonicas Ueda107 (NR074804) was included as the
outgroup. The scale bar represents the estimated number of nucleotide changes per sequence position.
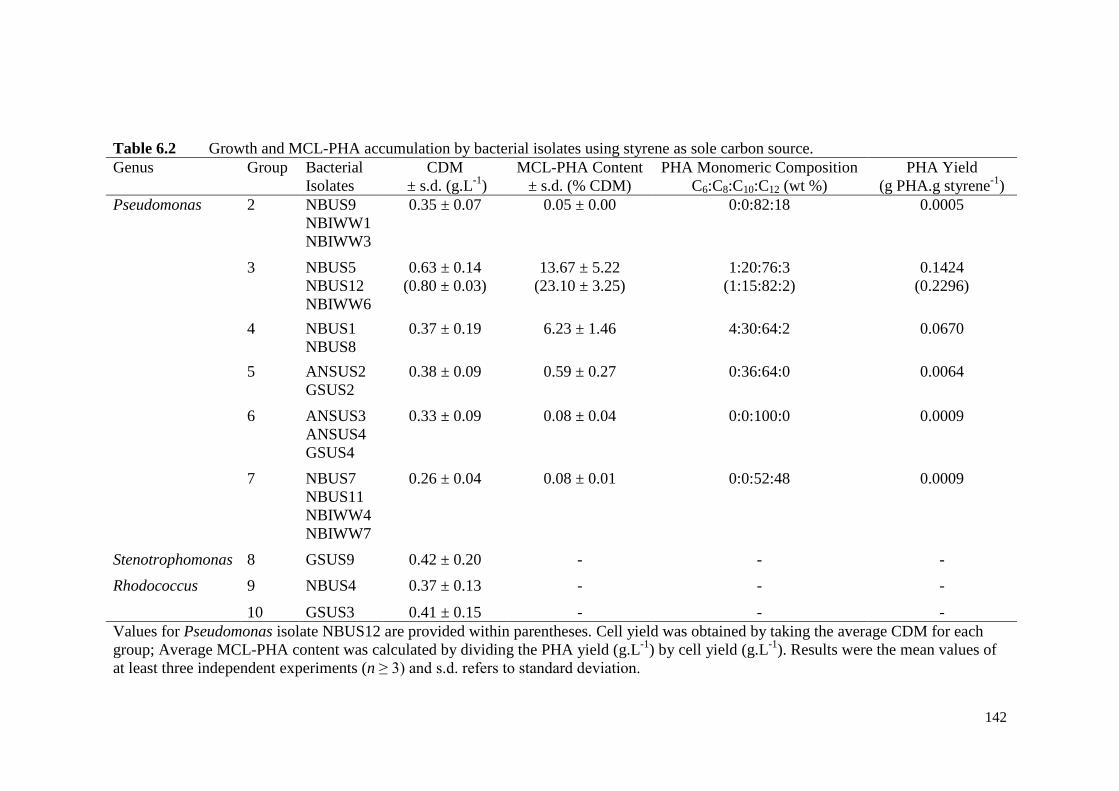
142
Table 6.2 Growth and MCL-PHA accumulation by bacterial isolates using styrene as sole carbon source.
Genus Group Bacterial
Isolates
CDM
± s.d. (g.L-1
)
MCL-PHA Content
± s.d. (% CDM)
PHA Monomeric Composition
C6:C8:C10:C12 (wt %)
PHA Yield
(g PHA.g styrene-1
)
Pseudomonas 2 NBUS9
NBIWW1
NBIWW3
0.35 ± 0.07 0.05 ± 0.00 0:0:82:18 0.0005
3 NBUS5
NBUS12
NBIWW6
0.63 ± 0.14
(0.80 ± 0.03)
13.67 ± 5.22
(23.10 ± 3.25)
1:20:76:3
(1:15:82:2)
0.1424
(0.2296)
4 NBUS1
NBUS8
0.37 ± 0.19 6.23 ± 1.46 4:30:64:2 0.0670
5 ANSUS2
GSUS2
0.38 ± 0.09 0.59 ± 0.27 0:36:64:0 0.0064
6 ANSUS3
ANSUS4
GSUS4
0.33 ± 0.09 0.08 ± 0.04 0:0:100:0 0.0009
7 NBUS7
NBUS11
NBIWW4
NBIWW7
0.26 ± 0.04 0.08 ± 0.01 0:0:52:48
0.0009
Stenotrophomonas 8 GSUS9
0.42 ± 0.20 - - -
Rhodococcus 9 NBUS4
0.37 ± 0.13 - - -
10 GSUS3 0.41 ± 0.15 - - -
Values for Pseudomonas isolate NBUS12 are provided within parentheses. Cell yield was obtained by taking the average CDM for each
group; Average MCL-PHA content was calculated by dividing the PHA yield (g.L-1
) by cell yield (g.L-1
). Results were the mean values of
at least three independent experiments (n ≥ 3) and s.d. refers to standard deviation.
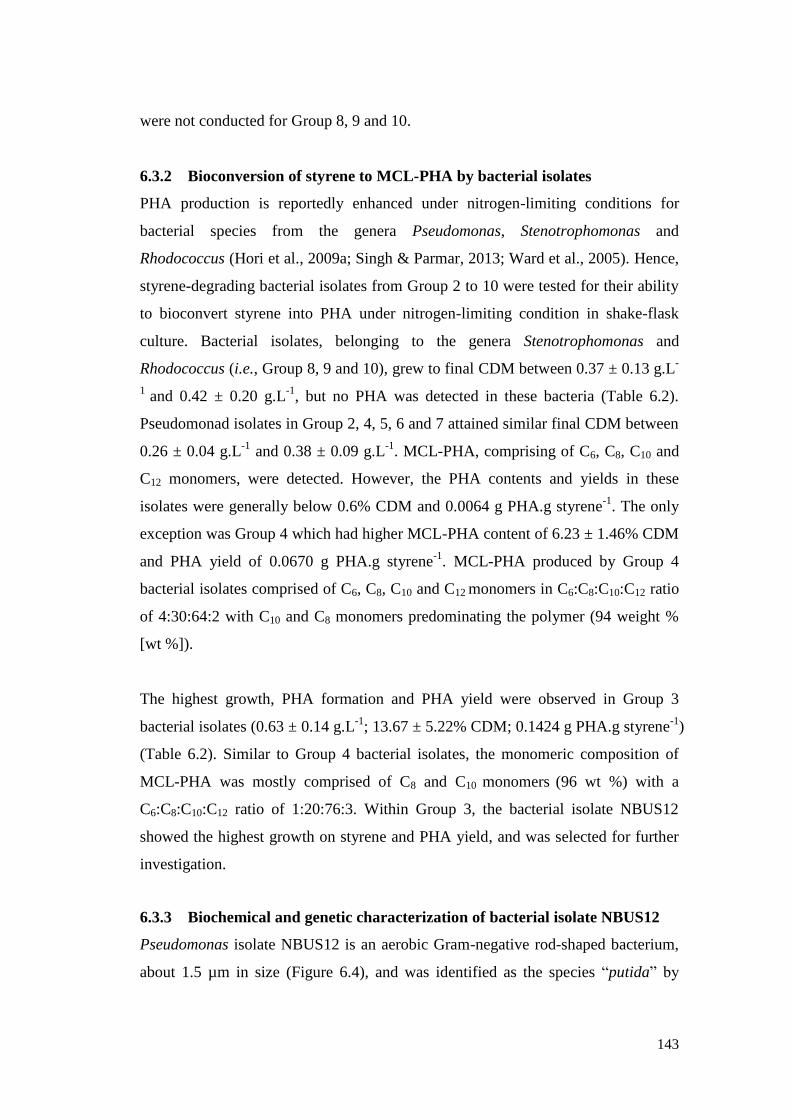
143
were not conducted for Group 8, 9 and 10.
6.3.2 Bioconversion of styrene to MCL-PHA by bacterial isolates
PHA production is reportedly enhanced under nitrogen-limiting conditions for
bacterial species from the genera Pseudomonas, Stenotrophomonas and
Rhodococcus (Hori et al., 2009a; Singh & Parmar, 2013; Ward et al., 2005). Hence,
styrene-degrading bacterial isolates from Group 2 to 10 were tested for their ability
to bioconvert styrene into PHA under nitrogen-limiting condition in shake-flask
culture. Bacterial isolates, belonging to the genera Stenotrophomonas and
Rhodococcus (i.e., Group 8, 9 and 10), grew to final CDM between 0.37 ± 0.13 g.L-
1 and 0.42 ± 0.20 g.L
-1, but no PHA was detected in these bacteria (Table 6.2).
Pseudomonad isolates in Group 2, 4, 5, 6 and 7 attained similar final CDM between
0.26 ± 0.04 g.L-1
and 0.38 ± 0.09 g.L-1
. MCL-PHA, comprising of C6, C8, C10 and
C12 monomers, were detected. However, the PHA contents and yields in these
isolates were generally below 0.6% CDM and 0.0064 g PHA.g styrene-1
. The only
exception was Group 4 which had higher MCL-PHA content of 6.23 ± 1.46% CDM
and PHA yield of 0.0670 g PHA.g styrene-1
. MCL-PHA produced by Group 4
bacterial isolates comprised of C6, C8, C10 and C12 monomers in C6:C8:C10:C12 ratio
of 4:30:64:2 with C10 and C8 monomers predominating the polymer (94 weight %
[wt %]).
The highest growth, PHA formation and PHA yield were observed in Group 3
bacterial isolates (0.63 ± 0.14 g.L-1
; 13.67 ± 5.22% CDM; 0.1424 g PHA.g styrene-1
)
(Table 6.2). Similar to Group 4 bacterial isolates, the monomeric composition of
MCL-PHA was mostly comprised of C8 and C10 monomers (96 wt %) with a
C6:C8:C10:C12 ratio of 1:20:76:3. Within Group 3, the bacterial isolate NBUS12
showed the highest growth on styrene and PHA yield, and was selected for further
investigation.
6.3.3 Biochemical and genetic characterization of bacterial isolate NBUS12
Pseudomonas isolate NBUS12 is an aerobic Gram-negative rod-shaped bacterium,
about 1.5 µm in size (Figure 6.4), and was identified as the species “putida” by
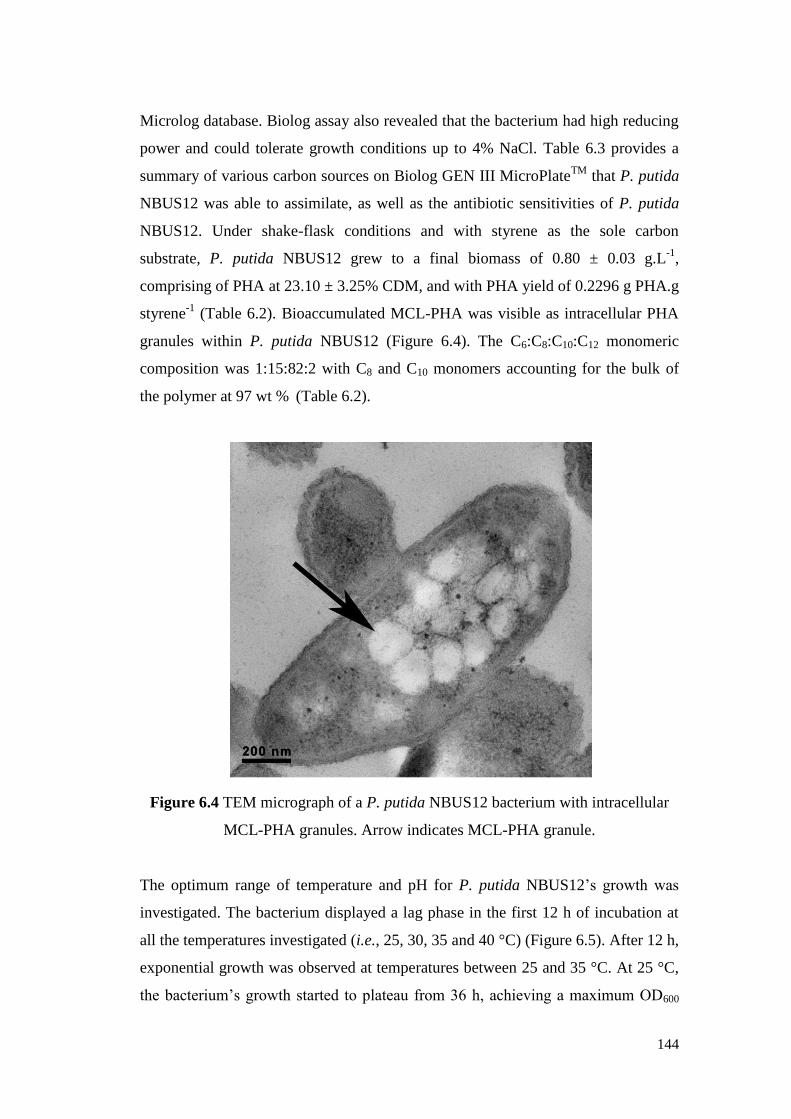
144
Microlog database. Biolog assay also revealed that the bacterium had high reducing
power and could tolerate growth conditions up to 4% NaCl. Table 6.3 provides a
summary of various carbon sources on Biolog GEN III MicroPlateTM
that P. putida
NBUS12 was able to assimilate, as well as the antibiotic sensitivities of P. putida
NBUS12. Under shake-flask conditions and with styrene as the sole carbon
substrate, P. putida NBUS12 grew to a final biomass of 0.80 ± 0.03 g.L-1
,
comprising of PHA at 23.10 ± 3.25% CDM, and with PHA yield of 0.2296 g PHA.g
styrene-1
(Table 6.2). Bioaccumulated MCL-PHA was visible as intracellular PHA
granules within P. putida NBUS12 (Figure 6.4). The C6:C8:C10:C12 monomeric
composition was 1:15:82:2 with C8 and C10 monomers accounting for the bulk of
the polymer at 97 wt % (Table 6.2).
Figure 6.4 TEM micrograph of a P. putida NBUS12 bacterium with intracellular
MCL-PHA granules. Arrow indicates MCL-PHA granule.
The optimum range of temperature and pH for P. putida NBUS12‟s growth was
investigated. The bacterium displayed a lag phase in the first 12 h of incubation at
all the temperatures investigated (i.e., 25, 30, 35 and 40 °C) (Figure 6.5). After 12 h,
exponential growth was observed at temperatures between 25 and 35 °C. At 25 °C,
the bacterium‟s growth started to plateau from 36 h, achieving a maximum OD600
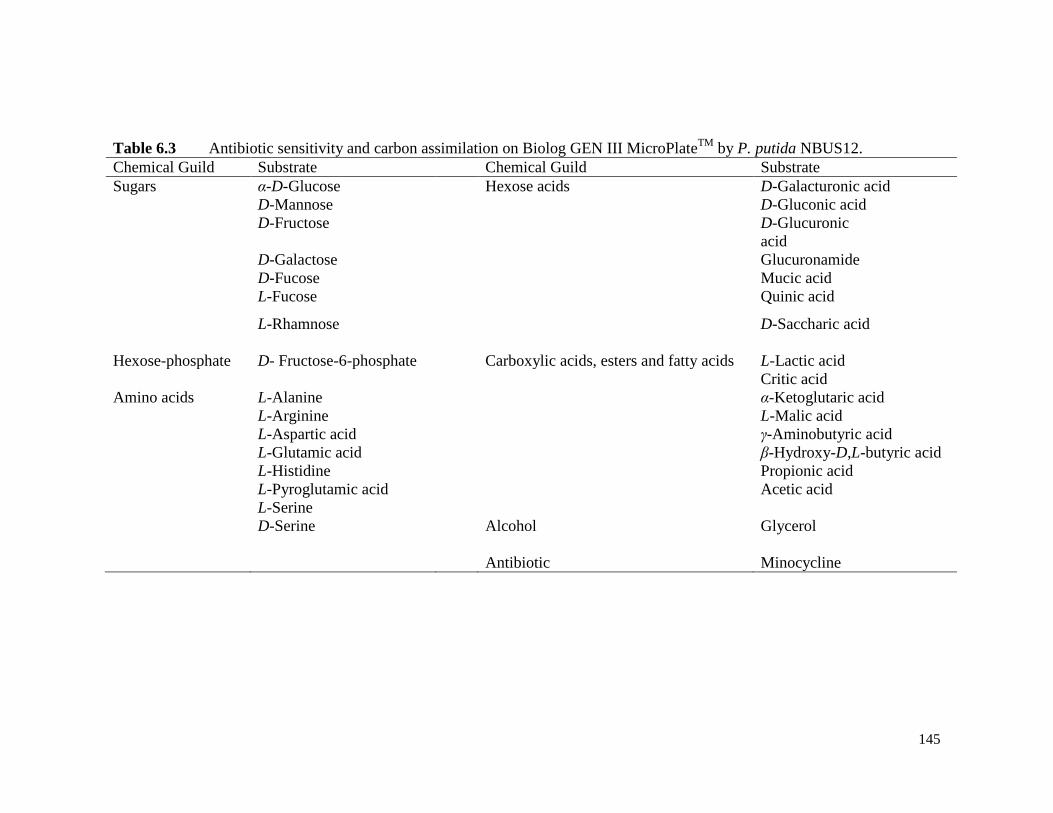
145
Table 6.3 Antibiotic sensitivity and carbon assimilation on Biolog GEN III MicroPlateTM
by P. putida NBUS12.
Chemical Guild Substrate Chemical Guild Substrate
Sugars α-D-Glucose Hexose acids D-Galacturonic acid
D-Mannose D-Gluconic acid
D-Fructose D-Glucuronic
acid
D-Galactose Glucuronamide
D-Fucose Mucic acid
L-Fucose Quinic acid
L-Rhamnose D-Saccharic acid
Hexose-phosphate D- Fructose-6-phosphate Carboxylic acids, esters and fatty acids L-Lactic acid
Critic acid
Amino acids L-Alanine α-Ketoglutaric acid
L-Arginine L-Malic acid
L-Aspartic acid γ-Aminobutyric acid
L-Glutamic acid β-Hydroxy-D,L-butyric acid
L-Histidine Propionic acid
L-Pyroglutamic acid Acetic acid
L-Serine
D-Serine Alcohol Glycerol
Antibiotic Minocycline
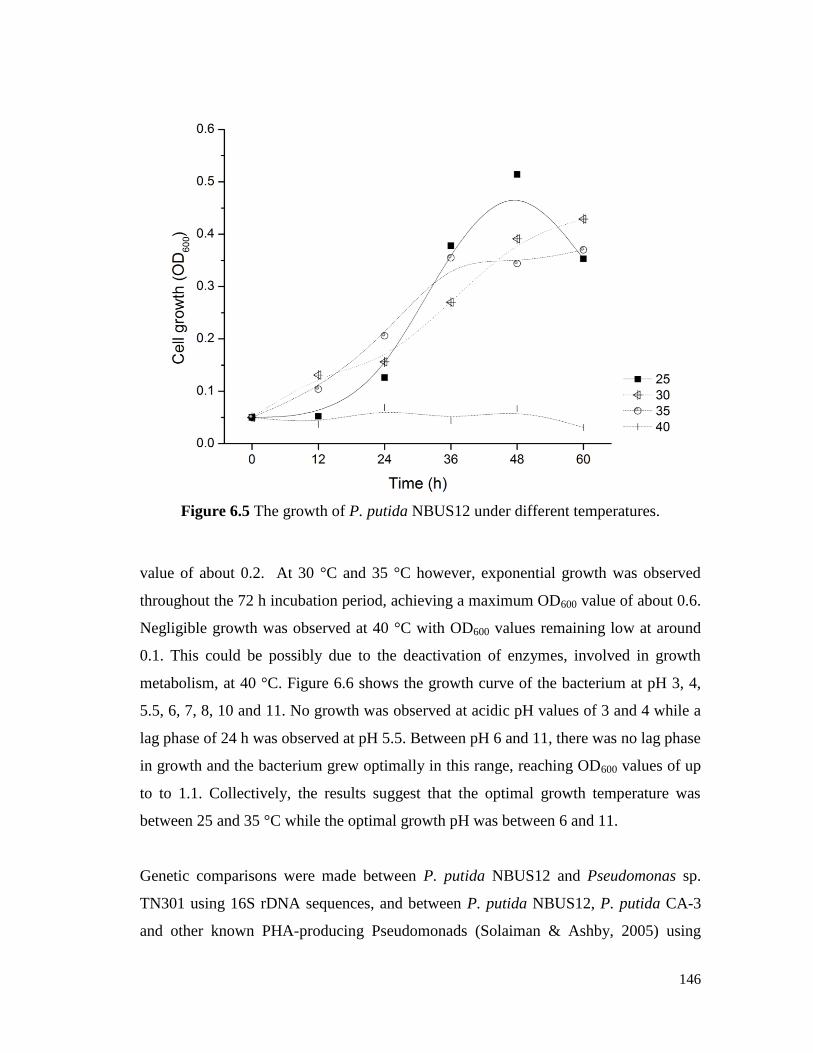
146
Figure 6.5 The growth of P. putida NBUS12 under different temperatures.
value of about 0.2. At 30 °C and 35 °C however, exponential growth was observed
throughout the 72 h incubation period, achieving a maximum OD600 value of about 0.6.
Negligible growth was observed at 40 °C with OD600 values remaining low at around
0.1. This could be possibly due to the deactivation of enzymes, involved in growth
metabolism, at 40 °C. Figure 6.6 shows the growth curve of the bacterium at pH 3, 4,
5.5, 6, 7, 8, 10 and 11. No growth was observed at acidic pH values of 3 and 4 while a
lag phase of 24 h was observed at pH 5.5. Between pH 6 and 11, there was no lag phase
in growth and the bacterium grew optimally in this range, reaching OD600 values of up
to to 1.1. Collectively, the results suggest that the optimal growth temperature was
between 25 and 35 °C while the optimal growth pH was between 6 and 11.
Genetic comparisons were made between P. putida NBUS12 and Pseudomonas sp.
TN301 using 16S rDNA sequences, and between P. putida NBUS12, P. putida CA-3
and other known PHA-producing Pseudomonads (Solaiman & Ashby, 2005) using
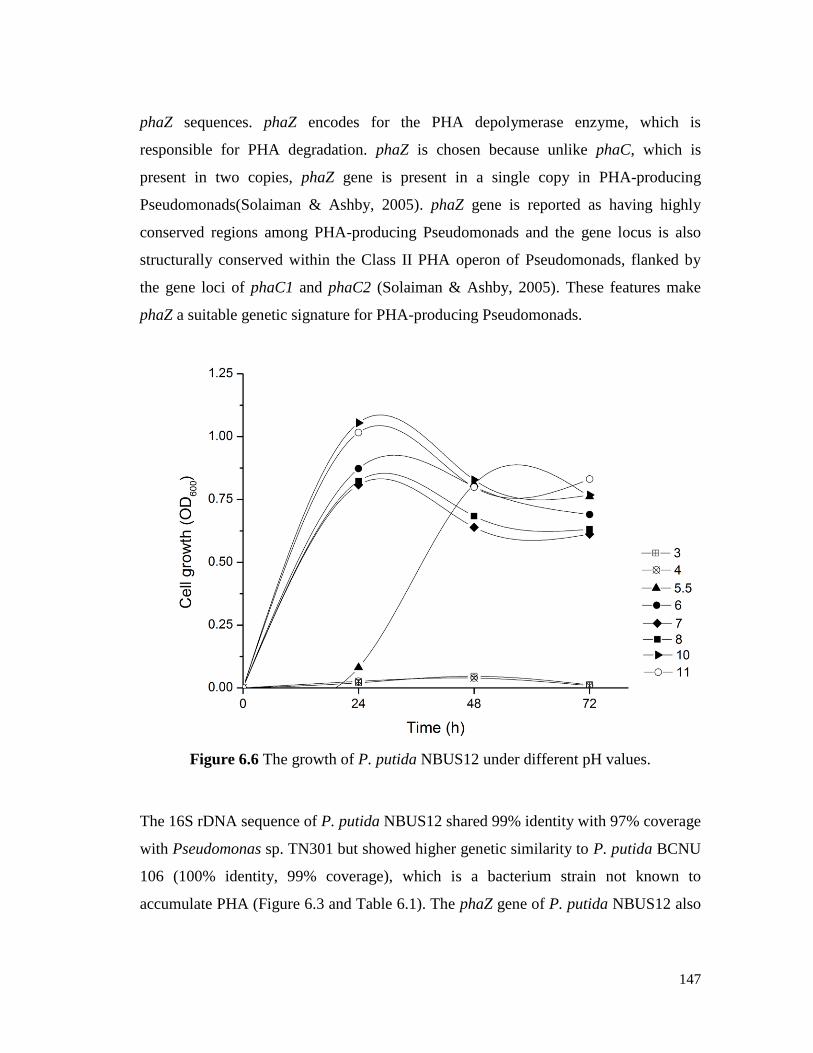
147
phaZ sequences. phaZ encodes for the PHA depolymerase enzyme, which is
responsible for PHA degradation. phaZ is chosen because unlike phaC, which is
present in two copies, phaZ gene is present in a single copy in PHA-producing
Pseudomonads(Solaiman & Ashby, 2005). phaZ gene is reported as having highly
conserved regions among PHA-producing Pseudomonads and the gene locus is also
structurally conserved within the Class II PHA operon of Pseudomonads, flanked by
the gene loci of phaC1 and phaC2 (Solaiman & Ashby, 2005). These features make
phaZ a suitable genetic signature for PHA-producing Pseudomonads.
Figure 6.6 The growth of P. putida NBUS12 under different pH values.
The 16S rDNA sequence of P. putida NBUS12 shared 99% identity with 97% coverage
with Pseudomonas sp. TN301 but showed higher genetic similarity to P. putida BCNU
106 (100% identity, 99% coverage), which is a bacterium strain not known to
accumulate PHA (Figure 6.3 and Table 6.1). The phaZ gene of P. putida NBUS12 also
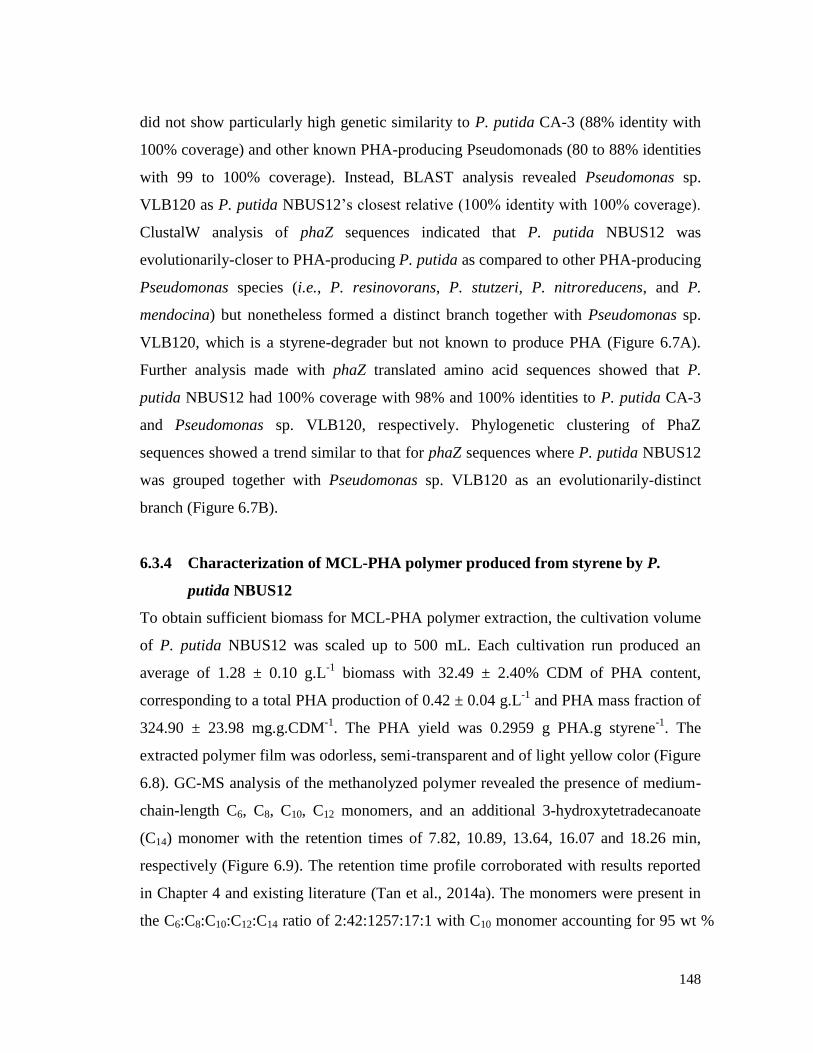
148
did not show particularly high genetic similarity to P. putida CA-3 (88% identity with
100% coverage) and other known PHA-producing Pseudomonads (80 to 88% identities
with 99 to 100% coverage). Instead, BLAST analysis revealed Pseudomonas sp.
VLB120 as P. putida NBUS12‟s closest relative (100% identity with 100% coverage).
ClustalW analysis of phaZ sequences indicated that P. putida NBUS12 was
evolutionarily-closer to PHA-producing P. putida as compared to other PHA-producing
Pseudomonas species (i.e., P. resinovorans, P. stutzeri, P. nitroreducens, and P.
mendocina) but nonetheless formed a distinct branch together with Pseudomonas sp.
VLB120, which is a styrene-degrader but not known to produce PHA (Figure 6.7A).
Further analysis made with phaZ translated amino acid sequences showed that P.
putida NBUS12 had 100% coverage with 98% and 100% identities to P. putida CA-3
and Pseudomonas sp. VLB120, respectively. Phylogenetic clustering of PhaZ
sequences showed a trend similar to that for phaZ sequences where P. putida NBUS12
was grouped together with Pseudomonas sp. VLB120 as an evolutionarily-distinct
branch (Figure 6.7B).
6.3.4 Characterization of MCL-PHA polymer produced from styrene by P.
putida NBUS12
To obtain sufficient biomass for MCL-PHA polymer extraction, the cultivation volume
of P. putida NBUS12 was scaled up to 500 mL. Each cultivation run produced an
average of 1.28 ± 0.10 g.L-1
biomass with 32.49 ± 2.40% CDM of PHA content,
corresponding to a total PHA production of 0.42 ± 0.04 g.L-1
and PHA mass fraction of
324.90 ± 23.98 mg.g.CDM-1
. The PHA yield was 0.2959 g PHA.g styrene-1
. The
extracted polymer film was odorless, semi-transparent and of light yellow color (Figure
6.8). GC-MS analysis of the methanolyzed polymer revealed the presence of medium-
chain-length C6, C8, C10, C12 monomers, and an additional 3-hydroxytetradecanoate
(C14) monomer with the retention times of 7.82, 10.89, 13.64, 16.07 and 18.26 min,
respectively (Figure 6.9). The retention time profile corroborated with results reported
in Chapter 4 and existing literature (Tan et al., 2014a). The monomers were present in
the C6:C8:C10:C12:C14 ratio of 2:42:1257:17:1 with C10 monomer accounting for 95 wt %
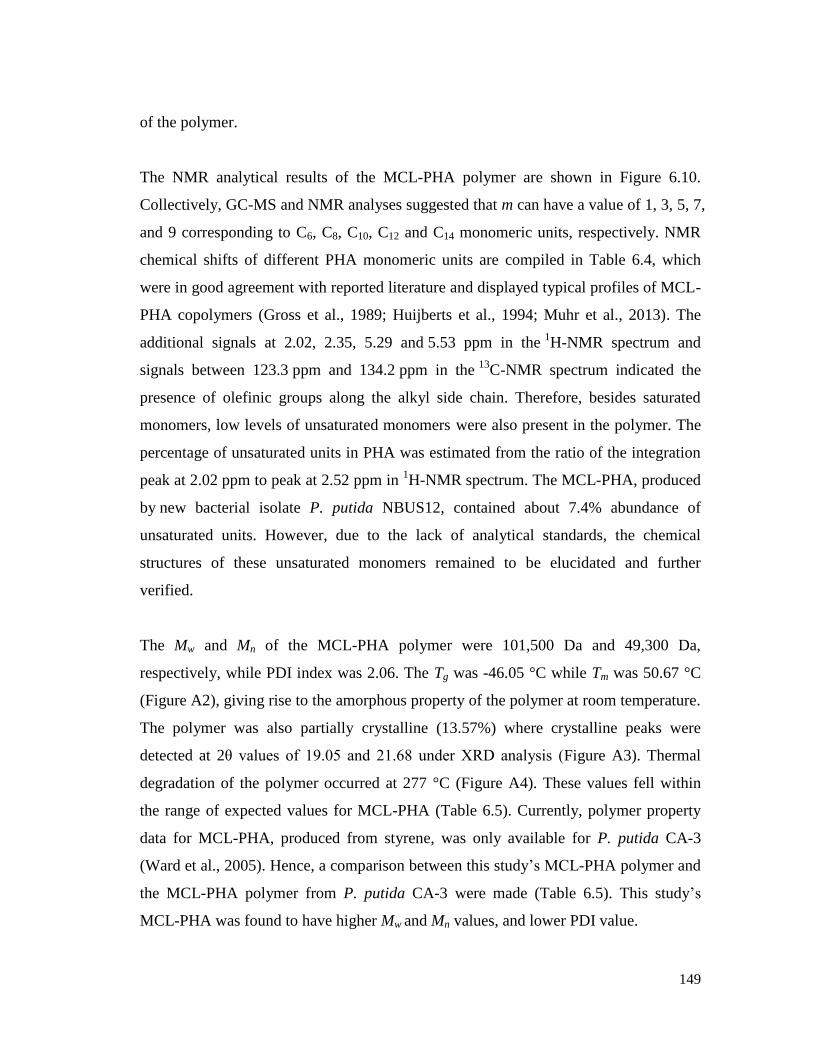
149
of the polymer.
The NMR analytical results of the MCL-PHA polymer are shown in Figure 6.10.
Collectively, GC-MS and NMR analyses suggested that m can have a value of 1, 3, 5, 7,
and 9 corresponding to C6, C8, C10, C12 and C14 monomeric units, respectively. NMR
chemical shifts of different PHA monomeric units are compiled in Table 6.4, which
were in good agreement with reported literature and displayed typical profiles of MCL-
PHA copolymers (Gross et al., 1989; Huijberts et al., 1994; Muhr et al., 2013). The
additional signals at 2.02, 2.35, 5.29 and 5.53 ppm in the 1H-NMR spectrum and
signals between 123.3 ppm and 134.2 ppm in the 13
C-NMR spectrum indicated the
presence of olefinic groups along the alkyl side chain. Therefore, besides saturated
monomers, low levels of unsaturated monomers were also present in the polymer. The
percentage of unsaturated units in PHA was estimated from the ratio of the integration
peak at 2.02 ppm to peak at 2.52 ppm in 1H-NMR spectrum. The MCL-PHA, produced
by new bacterial isolate P. putida NBUS12, contained about 7.4% abundance of
unsaturated units. However, due to the lack of analytical standards, the chemical
structures of these unsaturated monomers remained to be elucidated and further
verified.
The Mw and Mn of the MCL-PHA polymer were 101,500 Da and 49,300 Da,
respectively, while PDI index was 2.06. The Tg was -46.05 °C while Tm was 50.67 °C
(Figure A2), giving rise to the amorphous property of the polymer at room temperature.
The polymer was also partially crystalline (13.57%) where crystalline peaks were
detected at 2θ values of 19.05 and 21.68 under XRD analysis (Figure A3). Thermal
degradation of the polymer occurred at 277 °C (Figure A4). These values fell within
the range of expected values for MCL-PHA (Table 6.5). Currently, polymer property
data for MCL-PHA, produced from styrene, was only available for P. putida CA-3
(Ward et al., 2005). Hence, a comparison between this study‟s MCL-PHA polymer and
the MCL-PHA polymer from P. putida CA-3 were made (Table 6.5). This study‟s
MCL-PHA was found to have higher Mw and Mn values, and lower PDI value.
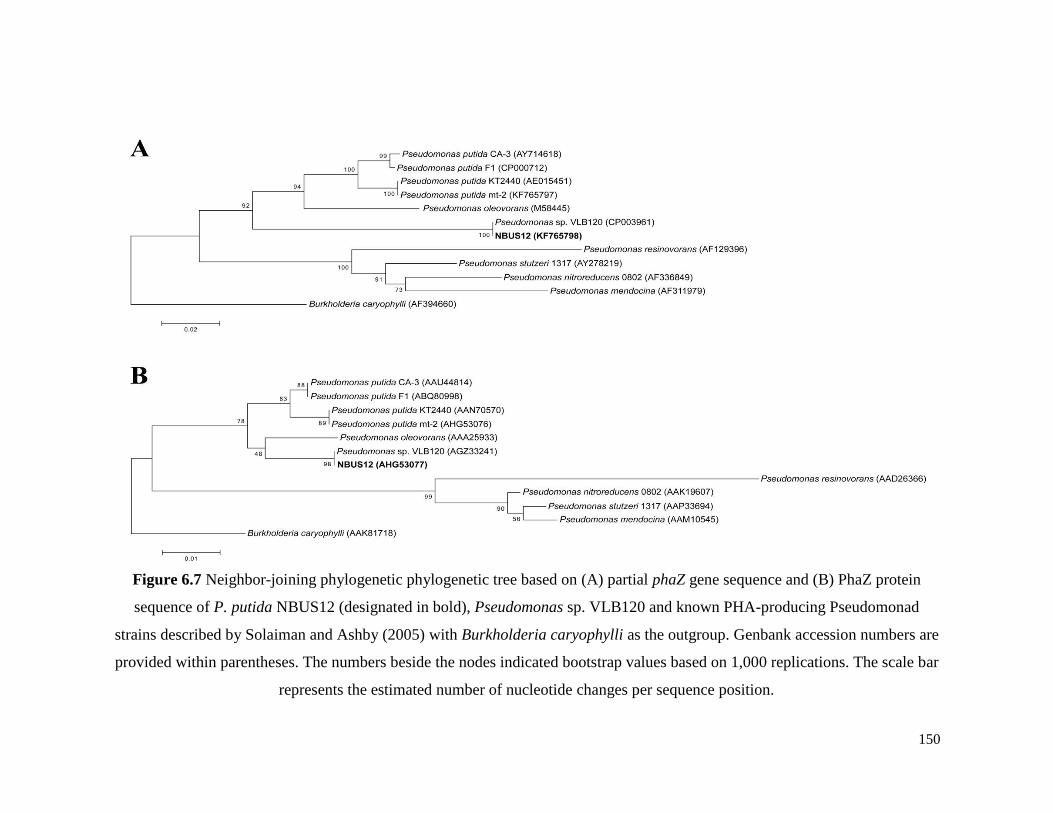
150
Figure 6.7 Neighbor-joining phylogenetic phylogenetic tree based on (A) partial phaZ gene sequence and (B) PhaZ protein
sequence of P. putida NBUS12 (designated in bold), Pseudomonas sp. VLB120 and known PHA-producing Pseudomonad
strains described by Solaiman and Ashby (2005) with Burkholderia caryophylli as the outgroup. Genbank accession numbers are
provided within parentheses. The numbers beside the nodes indicated bootstrap values based on 1,000 replications. The scale bar
represents the estimated number of nucleotide changes per sequence position.
151
Figure 6.8 MCL-PHA polymer extracted from P. putida NBUS12.
Figure 6.9 GC-MS chromatogram of MCL-PHA monomers detected in the
polymer extracted from P. putida NBUS12. The insert shows a magnified version
of the chromatogram (C6, 3-hydroxyhexanoate; C8, 3-hydroxyoctanoate; C10, 3-
hydroxydecanoate; C12, 3-hydroxydodecanoate; C14, 3-hydroxytetradecanoate).
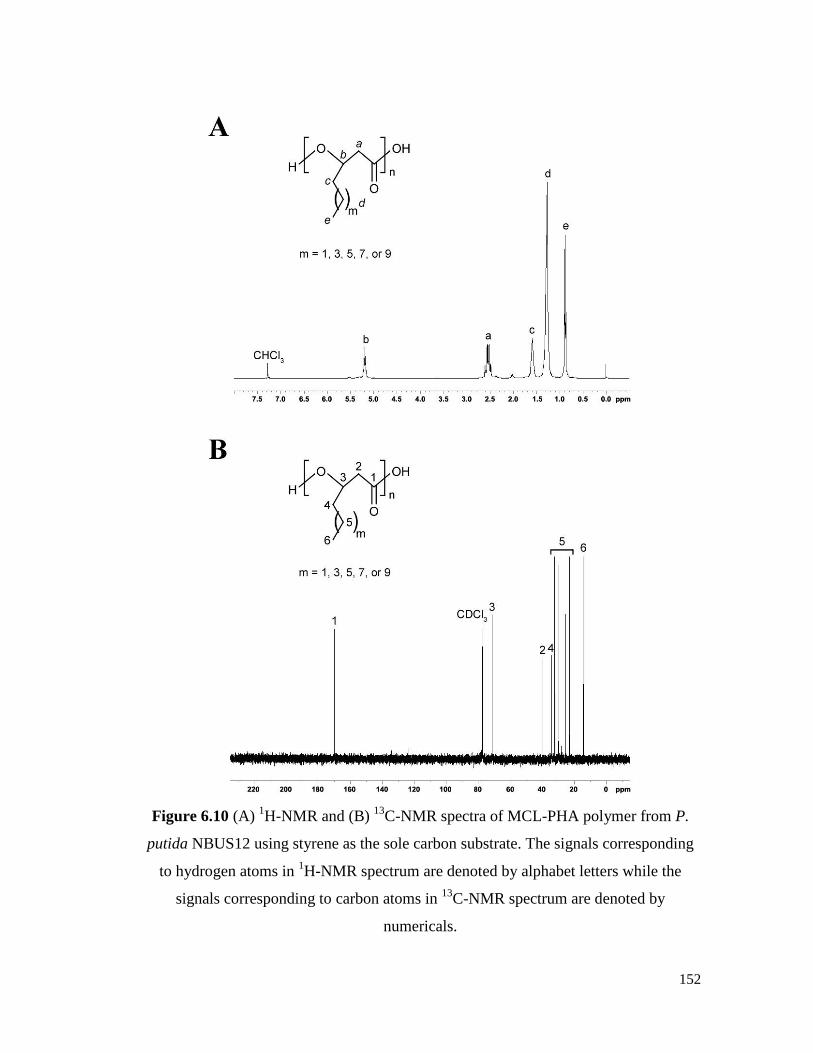
152
Figure 6.10 (A) 1H-NMR and (B)
13C-NMR spectra of MCL-PHA polymer from P.
putida NBUS12 using styrene as the sole carbon substrate. The signals corresponding
to hydrogen atoms in 1H-NMR spectrum are denoted by alphabet letters while the
signals corresponding to carbon atoms in 13
C-NMR spectrum are denoted by
numericals.
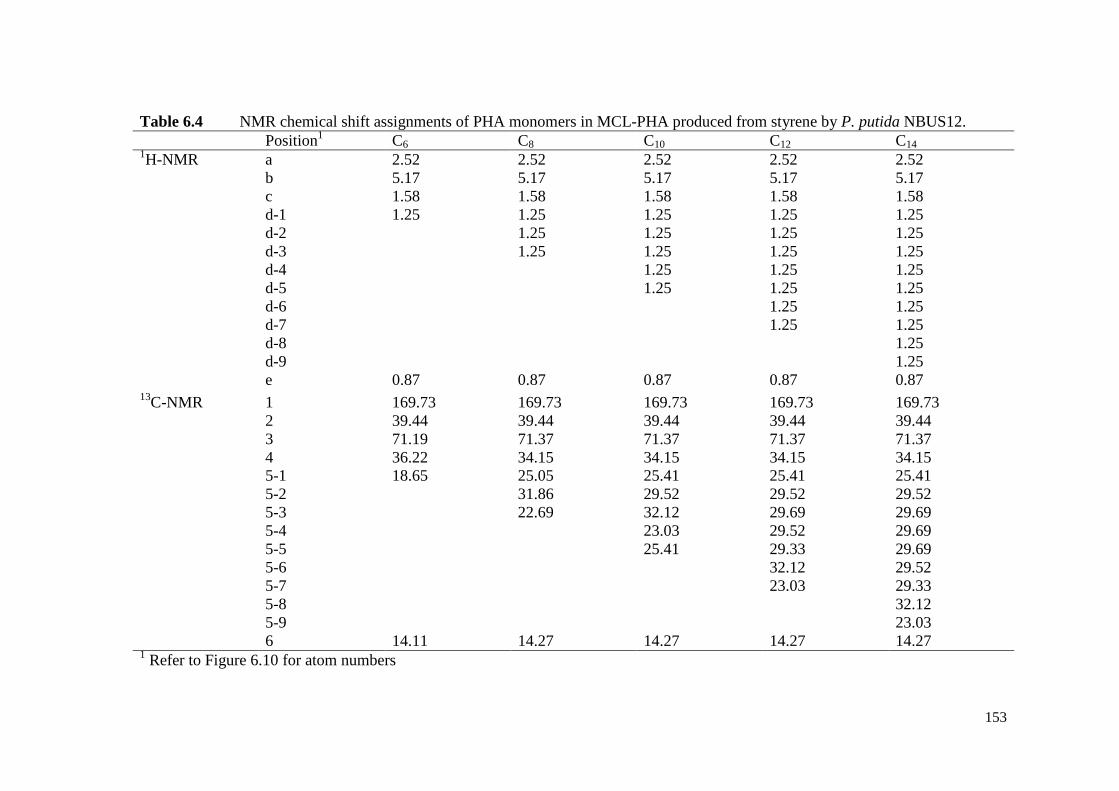
153
Table 6.4 NMR chemical shift assignments of PHA monomers in MCL-PHA produced from styrene by P. putida NBUS12.
Position1 C6 C8 C10 C12 C14
1H-NMR a 2.52 2.52 2.52 2.52 2.52
b 5.17 5.17 5.17 5.17 5.17
c 1.58 1.58 1.58 1.58 1.58
d-1 1.25 1.25 1.25 1.25 1.25
d-2 1.25 1.25 1.25 1.25
d-3 1.25 1.25 1.25 1.25
d-4 1.25 1.25 1.25
d-5 1.25 1.25 1.25
d-6 1.25 1.25
d-7 1.25 1.25
d-8 1.25
d-9 1.25
e 0.87 0.87 0.87 0.87 0.87 13
C-NMR 1 169.73 169.73 169.73 169.73 169.73
2 39.44 39.44 39.44 39.44 39.44
3 71.19 71.37 71.37 71.37 71.37
4 36.22 34.15 34.15 34.15 34.15
5-1 18.65 25.05 25.41 25.41 25.41
5-2 31.86 29.52 29.52 29.52
5-3 22.69 32.12 29.69 29.69
5-4 23.03 29.52 29.69
5-5 25.41 29.33 29.69
5-6 32.12 29.52
5-7 23.03 29.33
5-8 32.12
5-9 23.03
6 14.11 14.27 14.27 14.27 14.27 1 Refer to Figure 6.10 for atom numbers
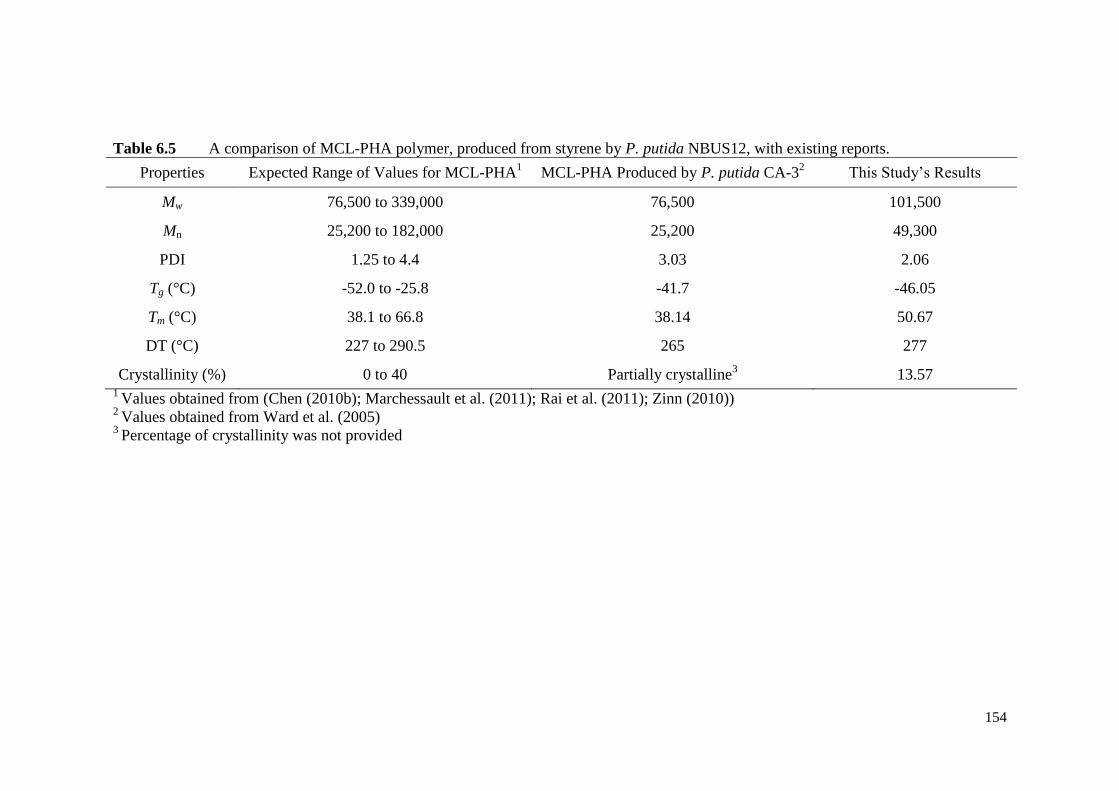
154
Table 6.5 A comparison of MCL-PHA polymer, produced from styrene by P. putida NBUS12, with existing reports.
Properties Expected Range of Values for MCL-PHA1 MCL-PHA Produced by P. putida CA-3
2 This Study‟s Results
Mw 76,500 to 339,000 76,500 101,500
Mn 25,200 to 182,000 25,200 49,300
PDI 1.25 to 4.4 3.03 2.06
Tg (°C) -52.0 to -25.8 -41.7 -46.05
Tm (°C) 38.1 to 66.8 38.14 50.67
DT (°C) 227 to 290.5
265 277
Crystallinity (%) 0 to 40 Partially crystalline3
13.57 1
Values obtained from (Chen (2010b); Marchessault et al. (2011); Rai et al. (2011); Zinn (2010)) 2
Values obtained from Ward et al. (2005) 3
Percentage of crystallinity was not provided
155
Additionally, this study‟s MCL-PHA displayed a wider temperature range of
between Tg and Tm (96.72 °C), and higher DT value.
6.4 Discussion
Environmental pollution with styrene is pervasive in land, water and air,
particularly in wastewaters and off-gases from PS-related industries (Aliabadi et al.,
2012; Tischler & Kaschabek, 2012). Styrene waste presents a large volume of
inexpensive carbon source that could be bioconverted and upcycled to high-value
MCL-PHA biopolymer, potentially lowering the price of PHA and off-setting waste
treatment cost. While much work on styrene bioremediation has been accomplished,
the bioconversion of styrene into a new resource, such as MCL-PHA, has received
limited attention. This study was aimed at addressing this research gap through the
isolation and characterization of bacteria that could bioconvert styrene into MCL-
PHA.
Aromatic-degrading and PHA-forming bacteria are usually isolated from
petrochemical-contaminated sites or bioreactors treating petrochemical industrial
effluents (Kenny et al., 2008; Narancic et al., 2012; Ni et al., 2010) as these pre-
enriched sources are more likely to contain microorganisms that could break down
petrochemical aromatics. In this study, domestic activated sludge from a water
reclamation plant treating municipal wastewater and industrial activated sludge
from a petrochemical wastewater treatment facility were tested as inoculum sources.
In the first round of isolation, sodium benzoate was used as the aromatic carbon
source due to its solubility, non-volatility and non-toxic nature. Past research has
also shown that benzoate-utilizing bacterial strains were capable of degrading
styrene (Lindsay et al., 2008). A total of 17 benzoate-degrading bacterial isolates
were isolated from both inoculum sources following 11 weeks of enrichment on
BTEXS mixture. The partial phaC, which is a gene encoding PHA synthase
responsible for PHA biosynthesis, were detected in all bacterial isolates (Figure
6.2A). Among these benzoate-degrading bacterial isolates, 12 were also found to be
styrene-degrading while 4 isolates (i.e., NBUS2, NBUS3, NBUS6 and NBIWW2)
could not grow on styrene. Benzoate is one of the by-products of styrene
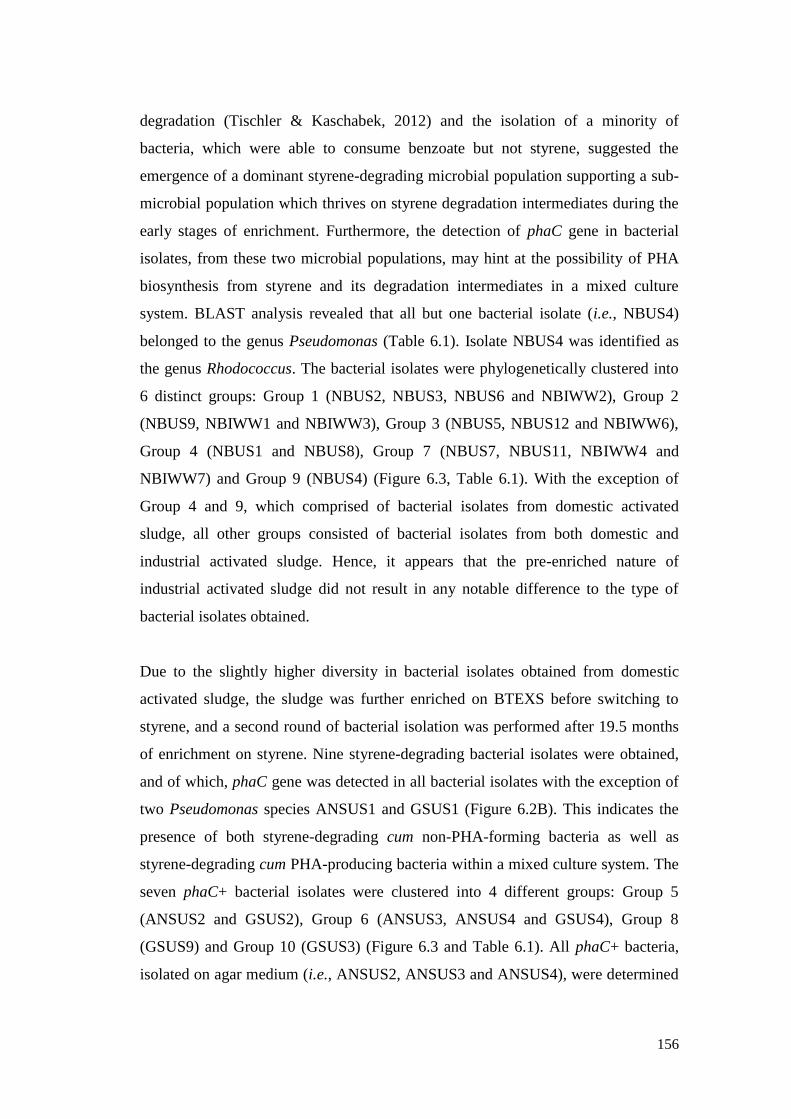
156
degradation (Tischler & Kaschabek, 2012) and the isolation of a minority of
bacteria, which were able to consume benzoate but not styrene, suggested the
emergence of a dominant styrene-degrading microbial population supporting a sub-
microbial population which thrives on styrene degradation intermediates during the
early stages of enrichment. Furthermore, the detection of phaC gene in bacterial
isolates, from these two microbial populations, may hint at the possibility of PHA
biosynthesis from styrene and its degradation intermediates in a mixed culture
system. BLAST analysis revealed that all but one bacterial isolate (i.e., NBUS4)
belonged to the genus Pseudomonas (Table 6.1). Isolate NBUS4 was identified as
the genus Rhodococcus. The bacterial isolates were phylogenetically clustered into
6 distinct groups: Group 1 (NBUS2, NBUS3, NBUS6 and NBIWW2), Group 2
(NBUS9, NBIWW1 and NBIWW3), Group 3 (NBUS5, NBUS12 and NBIWW6),
Group 4 (NBUS1 and NBUS8), Group 7 (NBUS7, NBUS11, NBIWW4 and
NBIWW7) and Group 9 (NBUS4) (Figure 6.3, Table 6.1). With the exception of
Group 4 and 9, which comprised of bacterial isolates from domestic activated
sludge, all other groups consisted of bacterial isolates from both domestic and
industrial activated sludge. Hence, it appears that the pre-enriched nature of
industrial activated sludge did not result in any notable difference to the type of
bacterial isolates obtained.
Due to the slightly higher diversity in bacterial isolates obtained from domestic
activated sludge, the sludge was further enriched on BTEXS before switching to
styrene, and a second round of bacterial isolation was performed after 19.5 months
of enrichment on styrene. Nine styrene-degrading bacterial isolates were obtained,
and of which, phaC gene was detected in all bacterial isolates with the exception of
two Pseudomonas species ANSUS1 and GSUS1 (Figure 6.2B). This indicates the
presence of both styrene-degrading cum non-PHA-forming bacteria as well as
styrene-degrading cum PHA-producing bacteria within a mixed culture system. The
seven phaC+ bacterial isolates were clustered into 4 different groups: Group 5
(ANSUS2 and GSUS2), Group 6 (ANSUS3, ANSUS4 and GSUS4), Group 8
(GSUS9) and Group 10 (GSUS3) (Figure 6.3 and Table 6.1). All phaC+ bacteria,
isolated on agar medium (i.e., ANSUS2, ANSUS3 and ANSUS4), were determined
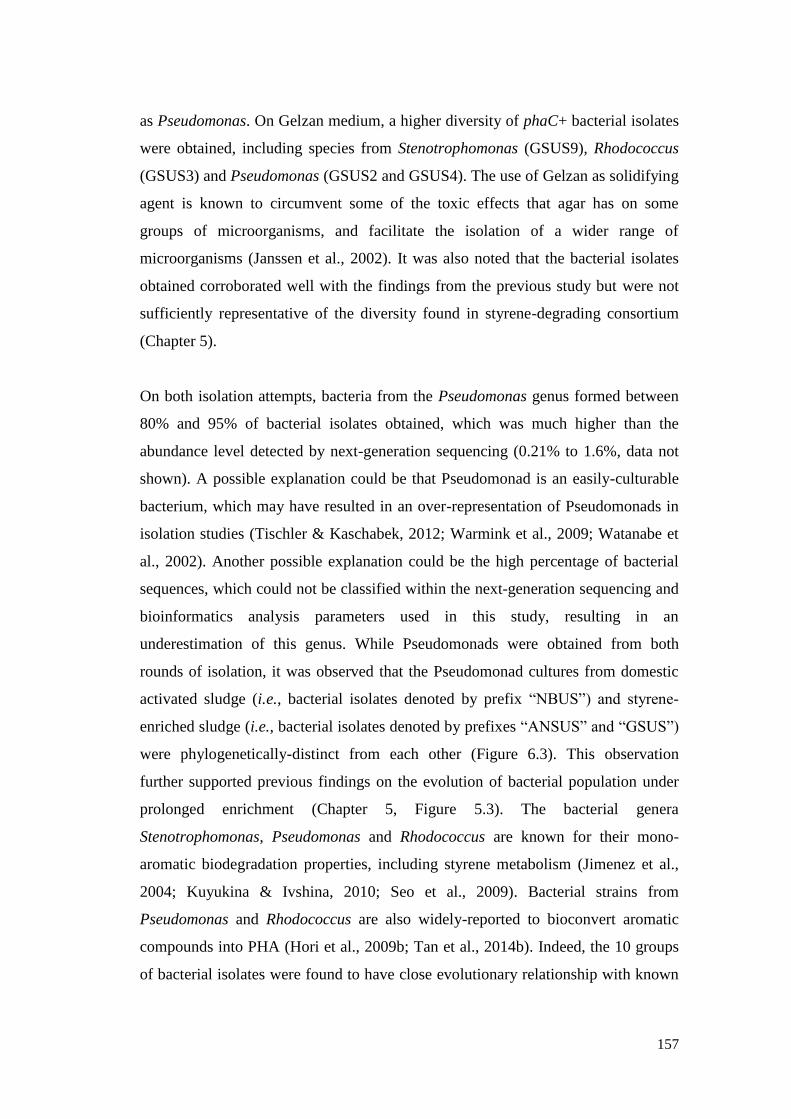
157
as Pseudomonas. On Gelzan medium, a higher diversity of phaC+ bacterial isolates
were obtained, including species from Stenotrophomonas (GSUS9), Rhodococcus
(GSUS3) and Pseudomonas (GSUS2 and GSUS4). The use of Gelzan as solidifying
agent is known to circumvent some of the toxic effects that agar has on some
groups of microorganisms, and facilitate the isolation of a wider range of
microorganisms (Janssen et al., 2002). It was also noted that the bacterial isolates
obtained corroborated well with the findings from the previous study but were not
sufficiently representative of the diversity found in styrene-degrading consortium
(Chapter 5).
On both isolation attempts, bacteria from the Pseudomonas genus formed between
80% and 95% of bacterial isolates obtained, which was much higher than the
abundance level detected by next-generation sequencing (0.21% to 1.6%, data not
shown). A possible explanation could be that Pseudomonad is an easily-culturable
bacterium, which may have resulted in an over-representation of Pseudomonads in
isolation studies (Tischler & Kaschabek, 2012; Warmink et al., 2009; Watanabe et
al., 2002). Another possible explanation could be the high percentage of bacterial
sequences, which could not be classified within the next-generation sequencing and
bioinformatics analysis parameters used in this study, resulting in an
underestimation of this genus. While Pseudomonads were obtained from both
rounds of isolation, it was observed that the Pseudomonad cultures from domestic
activated sludge (i.e., bacterial isolates denoted by prefix “NBUS”) and styrene-
enriched sludge (i.e., bacterial isolates denoted by prefixes “ANSUS” and “GSUS”)
were phylogenetically-distinct from each other (Figure 6.3). This observation
further supported previous findings on the evolution of bacterial population under
prolonged enrichment (Chapter 5, Figure 5.3). The bacterial genera
Stenotrophomonas, Pseudomonas and Rhodococcus are known for their mono-
aromatic biodegradation properties, including styrene metabolism (Jimenez et al.,
2004; Kuyukina & Ivshina, 2010; Seo et al., 2009). Bacterial strains from
Pseudomonas and Rhodococcus are also widely-reported to bioconvert aromatic
compounds into PHA (Hori et al., 2009b; Tan et al., 2014b). Indeed, the 10 groups
of bacterial isolates were found to have close evolutionary relationship with known
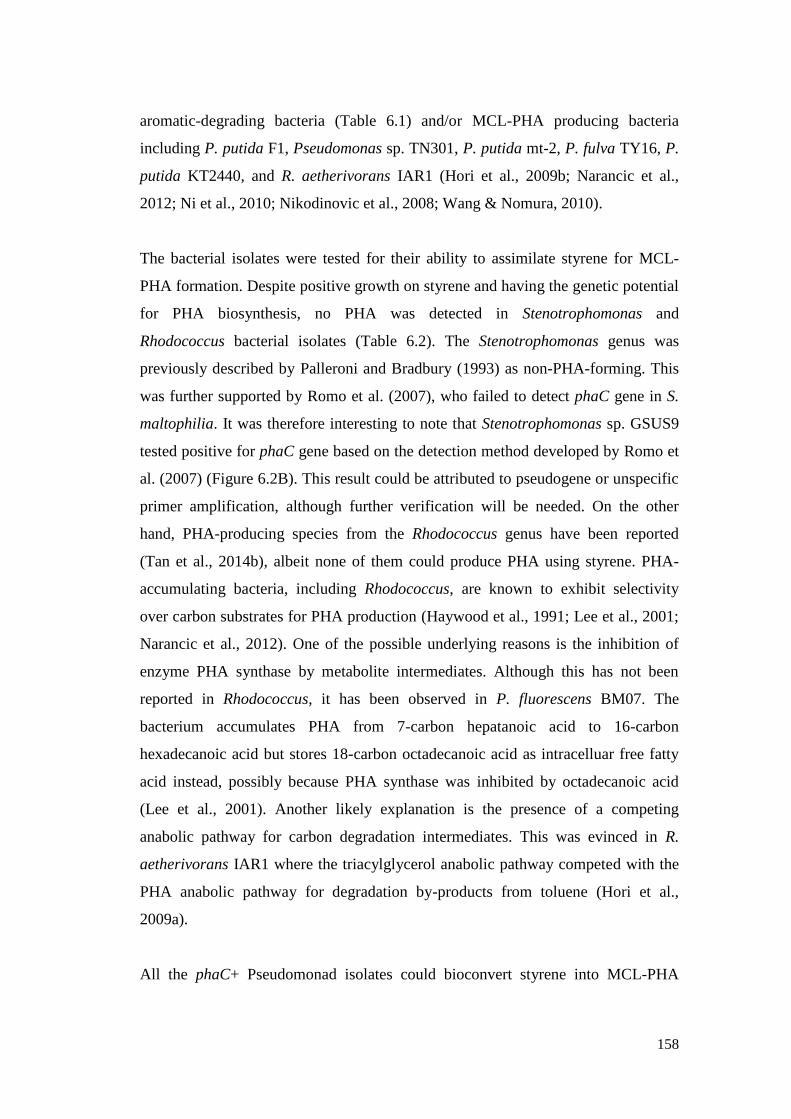
158
aromatic-degrading bacteria (Table 6.1) and/or MCL-PHA producing bacteria
including P. putida F1, Pseudomonas sp. TN301, P. putida mt-2, P. fulva TY16, P.
putida KT2440, and R. aetherivorans IAR1 (Hori et al., 2009b; Narancic et al.,
2012; Ni et al., 2010; Nikodinovic et al., 2008; Wang & Nomura, 2010).
The bacterial isolates were tested for their ability to assimilate styrene for MCL-
PHA formation. Despite positive growth on styrene and having the genetic potential
for PHA biosynthesis, no PHA was detected in Stenotrophomonas and
Rhodococcus bacterial isolates (Table 6.2). The Stenotrophomonas genus was
previously described by Palleroni and Bradbury (1993) as non-PHA-forming. This
was further supported by Romo et al. (2007), who failed to detect phaC gene in S.
maltophilia. It was therefore interesting to note that Stenotrophomonas sp. GSUS9
tested positive for phaC gene based on the detection method developed by Romo et
al. (2007) (Figure 6.2B). This result could be attributed to pseudogene or unspecific
primer amplification, although further verification will be needed. On the other
hand, PHA-producing species from the Rhodococcus genus have been reported
(Tan et al., 2014b), albeit none of them could produce PHA using styrene. PHA-
accumulating bacteria, including Rhodococcus, are known to exhibit selectivity
over carbon substrates for PHA production (Haywood et al., 1991; Lee et al., 2001;
Narancic et al., 2012). One of the possible underlying reasons is the inhibition of
enzyme PHA synthase by metabolite intermediates. Although this has not been
reported in Rhodococcus, it has been observed in P. fluorescens BM07. The
bacterium accumulates PHA from 7-carbon hepatanoic acid to 16-carbon
hexadecanoic acid but stores 18-carbon octadecanoic acid as intracelluar free fatty
acid instead, possibly because PHA synthase was inhibited by octadecanoic acid
(Lee et al., 2001). Another likely explanation is the presence of a competing
anabolic pathway for carbon degradation intermediates. This was evinced in R.
aetherivorans IAR1 where the triacylglycerol anabolic pathway competed with the
PHA anabolic pathway for degradation by-products from toluene (Hori et al.,
2009a).
All the phaC+ Pseudomonad isolates could bioconvert styrene into MCL-PHA
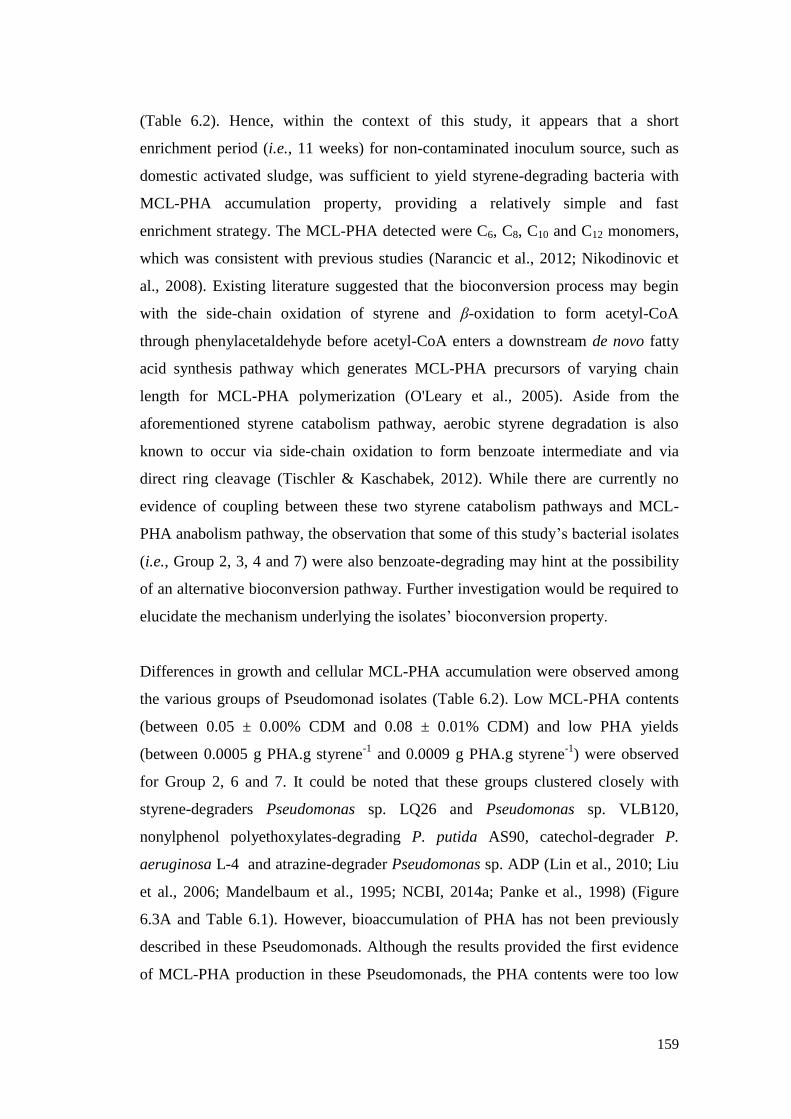
159
(Table 6.2). Hence, within the context of this study, it appears that a short
enrichment period (i.e., 11 weeks) for non-contaminated inoculum source, such as
domestic activated sludge, was sufficient to yield styrene-degrading bacteria with
MCL-PHA accumulation property, providing a relatively simple and fast
enrichment strategy. The MCL-PHA detected were C6, C8, C10 and C12 monomers,
which was consistent with previous studies (Narancic et al., 2012; Nikodinovic et
al., 2008). Existing literature suggested that the bioconversion process may begin
with the side-chain oxidation of styrene and β-oxidation to form acetyl-CoA
through phenylacetaldehyde before acetyl-CoA enters a downstream de novo fatty
acid synthesis pathway which generates MCL-PHA precursors of varying chain
length for MCL-PHA polymerization (O'Leary et al., 2005). Aside from the
aforementioned styrene catabolism pathway, aerobic styrene degradation is also
known to occur via side-chain oxidation to form benzoate intermediate and via
direct ring cleavage (Tischler & Kaschabek, 2012). While there are currently no
evidence of coupling between these two styrene catabolism pathways and MCL-
PHA anabolism pathway, the observation that some of this study‟s bacterial isolates
(i.e., Group 2, 3, 4 and 7) were also benzoate-degrading may hint at the possibility
of an alternative bioconversion pathway. Further investigation would be required to
elucidate the mechanism underlying the isolates‟ bioconversion property.
Differences in growth and cellular MCL-PHA accumulation were observed among
the various groups of Pseudomonad isolates (Table 6.2). Low MCL-PHA contents
(between 0.05 ± 0.00% CDM and 0.08 ± 0.01% CDM) and low PHA yields
(between 0.0005 g PHA.g styrene-1
and 0.0009 g PHA.g styrene-1
) were observed
for Group 2, 6 and 7. It could be noted that these groups clustered closely with
styrene-degraders Pseudomonas sp. LQ26 and Pseudomonas sp. VLB120,
nonylphenol polyethoxylates-degrading P. putida AS90, catechol-degrader P.
aeruginosa L-4 and atrazine-degrader Pseudomonas sp. ADP (Lin et al., 2010; Liu
et al., 2006; Mandelbaum et al., 1995; NCBI, 2014a; Panke et al., 1998) (Figure
6.3A and Table 6.1). However, bioaccumulation of PHA has not been previously
described in these Pseudomonads. Although the results provided the first evidence
of MCL-PHA production in these Pseudomonads, the PHA contents were too low
160
to be considered attractive for application purposes.
Group 4 and 5 both shared close evolutionary relationship to existing MCL-PHA
producing Pseudomonas strains (Figure 6.3A). Group 4 was closely-related to P.
putida F1, which reportedly produce MCL-PHA from benzene, toluene and
ethylbenzene (Nikodinovic et al., 2008), and with Pseudomonas sp. TN301 (99%
identity with 97% coverage), which could produce MCL-PHA from styrene
(Narancic et al., 2012). Compared to Pseudomonas sp. TN301 however, the growth
(0.37 ± 0.19 g.L-1
) and PHA content (6.23 ± 1.46% CDM) of Group 4 were about 2-
folds higher, implying that Group 4 isolates were more efficient at utilizing styrene
for PHA formation. Group 5 was closely-related to P. putida mt-2 which utilizes
toluene, p-xylene and various non-aromatic carbons for MCL-PHA production
(Nikodinovic et al., 2008); to P. fulva TY16, which reportedly produce MCL-PHA
from benzene, toluene and ethylbenzene (Ni et al., 2010); and to P. putida KT2440
which produces MCL-PHA from glucose and alkanoic acids (Tan et al., 2014b).
However, the cellular PHA content and PHA yield for Group 5 was low (0.59 ±
0.27% CDM; 0.0064 g PHA.g styrene-1
). Typically, MCL-PHA contents could
reach up to between 20 and 30% CDM with aromatic carbon substrates (Tan et al.,
2014b), which meant that PHA content of both Group 4 and 5 is low in comparison.
Nevertheless, Group 4 and Group 5‟s close evolutionary neighbors reportedly
utilized various aromatic compounds for PHA synthesis and accumulated high
amounts of MCL-PHA content (Pseudomonas sp. TN301, 23% CDM [naphthalene];
P. putida F1, 22% CDM [toluene]; P. putida mt-2, 26% CDM [p-xylene]; P. fulva
TY16, 58.9 %CDM [toluene]) (Narancic et al., 2012; Ni et al., 2010; Nikodinovic et
al., 2008). This offers the possibility that Group 4 and 5 bacterial isolates may be
able to metabolize other toxic aromatic pollutants and accumulate MCL-PHA in
higher amounts. Additional studies will be necessary for further verification.
Among all the groups of isolates, Group 3 showed the highest growth, MCL-PHA
content and PHA yield (0.63 ± 0.14 g.L-1
; 13.67 ± 5.22% CDM; 0.1424 g PHA.g
styrene-1
) (Table 6.1). An isolate, subsequently identified and designated as P.
putida NBUS12 (Figure 6.4), displayed the highest growth (0.80 ± 0.03 g.L-1
),
161
MCL-PHA accumulation (23.10 ± 3.25% CDM) and PHA yield (0.2296 g PHA.g
styrene-1
) on styrene. The cellular MCL-PHA content of P. putida NBUS12 was
similar to P. putida CA-3 (Ward et al., 2005) and about 9 to 20% CDM higher than
other styrene-degrading Pseudomonas strains (i.e., P. putida CA-1, P. putida S12,
and Pseudomonas sp. TN301) (Narancic et al., 2012; Tobin & O'Connor, 2005),
making it one of the highest PHA-producing strain among existing styrene-
degrading bacteria and warranted its selection for further investigation.
Genetic analyses revealed P. putida NBUS12 as an evolutionary-distinct strain from
known styrene-degrading and MCL-PHA-producing Pseudomonas strains. The 16S
rDNA and phaZ genes of P. putida NBUS12 did not share particularly high
similarity to that of Pseudomonas sp. TN301 (16S rDNA, 99% identity with 97%
coverage) and P. putida CA-3 (phaZ, 88% identity with 100% coverage) (Figures
6.3A and 6.7A). Instead, higher genetic similarity was observed with non-PHA-
producing Pseudomonas strains P. putida BCNU 106 (16S rDNA, 100% identity
with 99% coverage) and Pseudomonas sp. VLB120 (phaZ, 100% identity with 100%
coverage). While most of the genetic variations observed between phaZ sequences
from P. putida NBUS12 and P. putida CA-3 were attributed to codon degeneracy
(PhaZ, 98% identity with 100% coverage) (Figure 6.7B), some genetic variations
resulted in amino acid substitutions (data not shown). Additionally, ClustalW
analyses of phaZ sequences and PhaZ sequences showed P. putida NBUS12 as an
evolutionarily-distinct branch from P. putida CA-3 and other known PHA-
producing Pseudomonads (Solaiman & Ashby, 2005). This suggests that despite its
phenotypic-similarity to existing bacterial strains, P. putida NBUS12 could be
considered as a new styrene-degrading and MCL-PHA-producing bacterial strain.
A 500 mL volume of cultivation using a higher inoculum amount of P. putida
NBUS12 led to an improvement in final biomass production (1.28 ± 0.10 g.L-1
),
PHA production (0.42 ± 0.04 g.L-1
), which represented a 1.6-fold and 2.2-fold
increase, respectively, compared to shake-flask culture (Table 6.2). There was an
increase in PHA yield (0.2959 g PHA.g styrene-1
) compared to shake-flask
cultivation (0.2295 g PHA.g styrene-1
). Higher MCL-PHA content (32.49 ± 2.40%
162
CDM) was also observed and found to be comparable to values obtained by P.
putida CA-3 (Nikodinovic-Runic et al., 2011). The extracted MCL-PHA polymer
mainly comprised of C6, C8, C10, C12, C14 in the ratio of 2:42:1257:17:1, showing an
increased dominance of C10 monomer and an additional C14 monomer (Figures 6.9
and 6.10), which were previously not observed under shake-flask cultivation (Table
6.2). Variations in monomer content for the same bacterium are known to occur
(Rai et al., 2011), and may be ascribed to cultivation conditions which in turn
influence the activity of enzymes involved in the de novo fatty acid synthesis
pathway, leading to the increased synthesis of C10 monomer and synthesis of C14
monomers (Witholt & Kessler, 1999). PHA monomers such as C6, C8, C10, C12, and
C12:1 are known to arise from styrene metabolism (Narancic et al., 2012;
Nikodinovic et al., 2008; Tobin & O'Connor, 2005; Ward et al., 2005). While C14
monomer has been previously reported as a minor monomer in MCL-PHA formed
from glucose, long-chain alkanoic acids and tallow (Rai et al., 2011), this monomer
is not known to derive from styrene. This study presents the first report of C14
monomer synthesis from styrene.
The properties of PHA polymer produced by P. putida NBUS12 were found to be
in good agreement with those expected for MCL-PHA and the polymer was likely
to resemble thermoplastic elastomers (Table 6.5) (Muhr et al., 2013; Rai et al.,
2011). Unlike SCL-PHA, which typically has much higher Tm (up to 180 °C) and
crystallinity (up to 78%) (Peña et al., 2014), the combination of reduced Tm
(50.67 °C) and crystallinity (13.57%) made MCL-PHA more malleable and
biodegradable (Rai et al., 2011). Greater biocompatibility over SCL-PHA was also
reported for MCL-PHA due to a reduced cytotoxicity observed for PHA monomers
with longer carbon number (J. Sun et al., 2007). These attributes collectively meant
that MCL-PHA, produced from P. putida NBUS12, may have potential high-value
medical applications such as soft tissue regeneration, controlled drug delivery
matrices, or as plastic coatings and pressure sensitive adhesives (Madison &
Huisman, 1999; Rai et al., 2011). Compared to MCL-PHA polymer produced from
P. putida CA-3 using styrene (Ward et al., 2005), this study‟s polymer displayed
higher Mw (101,500 Da) and Mn values (49,300 Da), and lower PDI value (2.06).
163
Higher Mw values are usually associated with greater PHA polymer tensile strength
(Quagliano Javier & Miyazaki Silvia, 2002; Volova, 2004) suggesting that the
MCL-PHA obtained in this study may be more suitable for applications requiring
higher tensile strength. The wider temperature range of between Tg (-46.05 °C) and
Tm (50.67 °C), and higher DT value (277 °C) also meant that this polymer has a
wider processing and application temperature, which may expand the applicability
of the polymer. Nevertheless, the Mw of this study‟s polymer was still relatively low
compared to MCL-PHA produced from other carbon sources (e.g., sugars, alkanes,
alkenes and long-chain fatty acids) where Mw values ranged from 124,000 Da to
339,000 Da (Rai et al., 2011). Factors such as the state of inoculums, cultivation
media composition, fermentation conditions and PHA extraction process have been
asserted to influence PHA‟s Mw (Rai et al., 2011). The investigation of the
aforementioned factors on Mw of MCL-PHA from P. putida NBUS12 could be the
subject of future studies.
It is anticipated that P. putida NBUS12 could serve as a good candidate for the
bioaugmentation of styrene-degrading systems to shorten the start-up time of the
system and to enhance PHA production from styrene. However, there has been
reports of limited success with bioaugmentation due to poor survival and
performance of the exogenous species (Thompson et al., 2005). Given that there
were phylogenetic differences in Pseudomonad cultures obtained from the same
sludge inoculum but at different time points of the enrichment (Figure 6.3), it is
unknown if P. putida NBUS12, which was isolated from BTEXS-enriched sludge,
could be successfully established as a permanent member of a styrene-degrading
consortium. To verify, additional long-term bioaugmentation studies will be needed.
P. putida NBUS12 could also be utilized for the formulation of microbial cocktail
that may achieve higher PHA production as compared to mixed cultures. P. putida
NBUS12, together with the other pure cultures obtained in this study, belonged to
bacterial classes Gammaprotebacteria and Actinobacteria. While these two bacterial
classes were dominant in styrene-degrading community, there were also other
dominant classes detected, specifically, Alphaproteobacteria, Sphingobacteria and
Clostridia (Chapter 5, Tables 5.2 and 5.3). Hence, the diversity of culturable isolates
164
is currently limited and could not adequately reflect the bacterial community
structure of styrene-enriched consortium. Additionally, aside from Pseudomonads,
it is not known if there may be other culturable PHA-producing species present
within the consortium. Future isolation work, using varied cultivation strategies,
would be necessary to increase the diversity of pure isolates for the formulation of
microbial cocktails. The long-term robustness and performance of microbial
cocktails for bioconversion of styrene to PHA would also need to be assessed.
6.5 Summary
This study demonstrated a simple enrichment strategy for the isolation of bacteria,
capable of bioconverting organic pollutant styrene into MCL-PHA, from both
petrochemical-contaminated and non-contaminated inoculum sources. Seventeen
styrene-degrading and MCL-PHA-producing Pseudomonad isolates were obtained.
The best-performing isolate was a novel strain, P. putida NBUS12, which could
achieve a growth of 1.28 ± 0.10 g.L-1
, MCL-PHA content of 32.49 ± 2.40% CDM
and PHA yield of 0.2295 g PHA.g styrene-1
, making it one of the highest PHA-
producing strain among known styrene-degrading bacteria. MCL-PHA polymer
from P. putida NBUS12 showed monomeric components distinctive from existing
phenotypically-similar bacterial strains and provided the first evidence of C14
monomer synthesis from styrene. Besides saturated monomers (i.e., C6, C8, C10, C12,
C14), the PHA also contains unsaturated monomers, which hold the possibility for
further chemical modifications. The chemical modifications can greatly impact
PHA properties, and will expand its usage in the medical and environmental areas.
The higher degree of monomer heterogeneity may influence and result in different
polymer properties, expanding the possible applications of MCL-PHA polymer
derived from styrene-based source. Collectively, this study successfully increased
the limited pool of unique bacterial cultures which could aid in the development of
biotechnologies for simultaneous styrene effluent treatment and MCL-PHA
recovery. Future work will be focused on improving P. putida NBUS12‟s PHA
production and polymer properties to enhance the economic viability of this
bioprocess. The suitability of P. putida NBUS12 as a bioaugmentation strain should
be assessed as well.
165
CHAPTER 7
Conclusions and Recommendations
166
7.1 Conclusions
7.1.1 HPLC-DAD method for analysis of BTEXS at high aqueous
concentrations
A HPLC-DAD method, based on a new commercial reversed-phase column
Acclaim Phenyl-1, was successfully developed for the concurrent detection of
aqueous BTEXS. Optimal operation parameters were determined as detection
wavelength of 201 nm, column oven temperature of 50 °C, water/methanol mobile
phase compositions of 55%/45% to 60%/40%, flow rate sample injection volumes
of up to 10 µL and flow rates of up to 2.0 mL.min-1
. Under the optimal conditions,
chromatographic separation of BTEXS, co-occurring at high equimolar aqueous
concentration of up to 2.0 mM, could be achieved in 5.5 min. The method was also
suitable for the detection of styrene, toluene, ethylbenzene and xylenes at the lower
detection limits prescribed by US EPA. Repeatability, reproducibility and method
recovery values in various aqueous matrices (i.e., ultrapure water, tap water,
industrial wastewater and domestic wastewater) were all within the quality control
criteria prescribed for US EPA methods. The method offered several advantages
over existing methods: (1) protocol simplification, minimal sample loss and
minimized exposure to harmful compounds owing to direct injection and concurrent
analysis of aqueous BTEXS mixture, (2) decreased analysis time by up to 60%
which provides high analysis throughput, and (3) lowered analysis price due to
savings in chemical usage (by about 25%) and lower solvent waste generation.
The HPLC-DAD method was utilized concurrently with a GC-FID method for the
detection and quantification of aqueous styrene and gaseous styrene, respectively, in
a biodegradation test (Study 3, Chapter 5). It was observed that the biological
elimination of styrene from liquid phase occurred at a faster rate compared to the
elimination of styrene from gas phase. This observation further reinforced the idea
that styrene biodegradation occurred mostly in the liquid phase. Consequently, the
elimination of aqueous styrene provides a force that drives the partition of
headspace styrene to the cultivation medium, resulting in the observed elimination
of gaseous styrene. There are previous studies which performed the analysis of
either liquid styrene or headspace styrene and estimated the overall styrene amount
167
using the compound‟s gas-liquid partition coefficient (Babaee et al., 2010; Jung &
Park, 2005). This finding proved that this method is unlikely to yield an accurate
picture of the true styrene biodegradation kinetics. Therefore, the measurements of
styrene in both liquid and gaseous state are necessary for a more reliable
quantification of overall styrene elimination in a biological system.
7.1.2 GC-MS method development for analysis of PHA biopolymer
A key novel finding is the existence of a highly linear relationship between the
carbon number of homologous saturated PHA monomers and their respective RT
and RF. Based on this key discovery, the RTs and RFs of most saturated PHA
monomeric homologues were estimated with high accuracy, which enabled the
development of a GC-MS calibration method for various PHA monomers, ranging
from C4 to C16, using a limited inventory of reference standards. The only exception
was the RT of C4 monomer where a large difference between observed RT and
predicted RT was found. However, this discrepancy was circumvented through
cross-validation with mass fragmentation information. Hence, RT prediction should
be considered together with mass spectra information to minimize errors resulting
from the mathematical prediction. The calibration method was tested using known
amounts of various SCL-PHA and MCL-PHA co/homopolymers including PHBHV,
which contained C5 monomer that was excluded from method development. For all
the PHA polymers, the method showed high recovery values of close to 100%,
demonstrating its reliability and applicability to actual PHA samples even in the
absence of some analytical standards. Therefore, this method is the first of its kind
to prove the linear correlations between the carbon number of PHA monomer
reference standards and RT/RF under GC-MS analysis, and leverage on these
relationships to interpolate the RT/RF of other PHA monomers, for which reference
standards are unavailable, resulting in successful quantification of PHA polymers.
The GC-MS method was also used for the analysis of cellular MCL-PHA in
styrene-degrading bacterium isolates and MCL-PHA polymer produced by selected
isolate P. putida NBUS12. Among other monomers (i.e., C8, C10 and C12), the
method also successfully detected and quantified C6 and C14 monomers based on
predicted RT and RF values, respectively (Study 4, Chapter 6). It is noteworthy that
168
the GC-MS results for the MCL-PHA polymer were in good agreement with NMR
results, further attesting the accuracy and reliability of the method. The method
offered several advantages over existing methods: (1) higher accuracy for PHA
analysis even with incomplete analytical standard inventory, (2) calibration protocol
simplification and decreased calibration workload (by up to 80%), and (3)
decreased calibration cost (by up to 80%). Furthermore, the calibration method may
serve as a methodological reference for the future development of similar
calibration method for other types of PHA homologous series. This is crucial in
circumventing the lack of PHA analytical standards for many PHA monomer types
(e.g., unsaturated PHAs, branched PHAs, and PHA with specialized functional R
groups). Hence, this study has made a significant and positive impact on PHA
analysis.
7.1.3 Microbial profile analysis of styrene-degrading bacterial consortium
under prolonged enrichment
A styrene-degrading consortium was successfully enriched from a BTEXS-enriched
activated seed sludge. The bacterial community was mostly dominated by
Proteobacteria, followed by Bacteriodetes, Firmicutes, Actinobacteria and
unclassified phylum. The phyla Plantomycetes, Deinococcus-Thermus,
Verrucomicrobia, Chloroflexi, Acidobacteria, Aquificae, Chlamydiae, and
Gemmatimonadetes were also detected, but at non-dominant levels. At the order
level, the most striking increase was observed for Pseudomonadales
(Proteobacteria), strongly suggesting that this order is important for styrene
elimination. This observation was further supported by numerous existing reports of
styrene degradation capability for many pure isolates from Pseudomonadales
Arnold et al., 1997; Lin et al., 2010; Narancic et al., 2012; O'Connor et al., 1995;
Panke et al., 1998; Tobin & O'Connor, 2005). Rhizobiales (Proteobacteria) was also
a prominent order, and may harbor styrene catabolic genes (O'Leary et al., 2002;
van Hellemond et al., 2007). Taken together, these findings, coupled with current
literature data, suggest that Pseudomonadales and Rhizobiales may form the core
styrene-degrading bacterial population in this study‟s system.
169
Equally prominent in the system were the orders Sphingobacteriales (Bacteroidetes),
Clostridiales (Firmicutes), and Actinomycetales (Actinobacteria). Some genera
members of these orders are reportedly styrene-degraders. These include
Sphingobacterium (Sphingobacteriales) (Przybulewska et al., 2006), Rhodococcus,
Mycobacterium, Tsukamurella (Actinomycetales) (Arnold et al., 1997; Burback &
Perry, 1993; Jung & Park, 2005; Warhurst et al., 1994). However, these genera
members were detected at low levels, indicating that they are not the main styrene-
degrading population. Nevertheless, these orders are also known for their versatile
aromatic catabolic capability including styrene degradation intermediates (i.e.,
phenylacetic acid, catechol, homogentisate, fumarylacetoacetate, benzoate, etc).
This suggests that these orders could form the secondary styrene-degrading
bacterial population in this study‟s system, which was responsible for
mineralization of styrene degradation by-products.
Potential PHA-producing bacterial genera, from dominant phyla, were also detected.
These genera include Pseuodmonas, Acinetobacter, Hyphomicrobium,
Methylobacterium, Nitrobacter, Rhizobium, Rhodopseudomonas, Xanthobacter,
Paracoccus, Azospirillum, Comamonas, Cupriavidus and Thiobacillus
(Proteobacteria), Rhodococcus (Actinobacteria), and Clostridium and
Syntrophomonas (Firmicutes). This hints at the possibility that PHA-producing
members may be native to aqueous styrene-degrading consortium and the mixed
culture has the potential for PHA production.
Collectively, the findings from this study presented the first reference of an aqueous
styrene-degrading bacterial community. A key contribution of the study is the
identification of biomarkers (i.e., Pseudomonadales, Rhizobiales,
Sphingobacteriales, Clostridiales and Actinomycetales), which provided a
knowledge scaffold guiding future process enhancement strategies such as selection
of seeding sludge, bioaugmentation to reduce reactor start-up time and optimize the
biological process. Additionally, the knowledge could be applied to guide the
formulation of defined microbial cocktails for simultaneous styrene elimination and
MCL-PHA production.
170
7.1.4 MCL-PHA-producing and/or styrene-degrading bacterial isolates
A total of 20 styrene-degrading bacterial pure cultures, which also tested positive
for partial phaC gene detection, were isolated through two isolation attempts. Of
these, through the first isolation attempt, 5 Pseudomonas species were obtained
from industrial activated sludge while 7 Pseudomonas species and 1 Rhodococcus
species were obtained from domestic activated sludge following 11 weeks of
enrichment on BTEXS. Based on phylogenetic clustering, there was little difference
observed in the type of Pseudomonas species isolated from both inoculum sources
(Figure 6.3A and Table 6.1). The domestic activated sludge was further enriched for
a total of 15 months on BTEXS, followed by another 19.5 months on styrene,
before another round of isolation was conducted. The second isolation attempt
yielded 5 Pseudomonas species, 1 Rhodococcus species and 1 Stenotrophomonas
species. Phylogenetic clustering analysis revealed that the type of Pseudomonas
and Rhodococus species, obtained through the second isolation attempt, were
distinct from those obtained through the first isolation attempt (Figure 6.3A and
Table 6.1). This indicated an evolution in bacterial species within the domestic
activated sludge under prolonged BTEXS and styrene enrichment, which supported
the observed bacterial community evolution reported in Study 3 (Figure 5.3). The
genera of styrene-degrading bacterial isolates (i.e., Pseudomonas, Rhodococus and
Stenotrophomonas), from the second isolation attempt, corroborated with existing
literature (Jimenez et al., 2004; Kuyukina & Ivshina, 2010; Seo et al., 2009) and
were also in good agreement with those detected through bacterial community
profile analysis (Study 3, Chapter 5), affirming the presence and styrene-
assimilating function of these bacterial genera in styrene-degrading consortium.
Despite testing positive for partial phaC gene detection, PHA formation from
styrene was not observed in Rhodococus and Stenotrophomonas isolates. Only
Pseudomonas isolates were capable of bioconverting styrene to MCL-PHA
bioconversion (Table 6.2). Variation in MCL-PHA bioaccumulation abilities were
observed for different Pseudomonas species. Most Pseudomonas isolates, including
those obtained from the second isolation attempt, bioaccumulated MCL-PHA at low
amounts of less than 1.0% CDM, resulting in low PHA yields (Table 6.2). Hence,
171
while styrene-degrading consortium may comprise of MCL-PHA-producing
Pseudomonas species, these species did not appeared to be high PHA producers.
The highest MCL-PHA bioaccumulation (up to 32.49 ± 2.40% CDM) and PHA
yield (up to 0.2295 g PHA.g styrene-1
) was observed in a novel strain designated P.
putida NBUS12, which was isolated from domestic activated sludge in the first
isolation attempt. P. putida NBUS12 assimilated styrene for the biosynthesis of
MCL-PHA, which was comprised of C6, C8, C10, C12 and C14 monomers. The
biopolymer properties were well-aligned with previous reports (Muhr et al., 2013;
Rai et al., 2011) and resembled those of thermoplastic elastomers (Table 6.5).
Coupled with biodegradable and biocompatible attributes, the MCL-PHA
biopolymer could have potential high-value medical and pharmaceutical
applications (Madison & Huisman, 1999; Rai et al., 2011). This study has provided
alternative bacteria strains for further study and application, which may well
facilitate the development of a biotechnology that mines valuable MCL-PHA from
styrene waste. The newly-isolated MCL-PHA-producing and/or styrene-degrading
bacterial isolates, particularly P. putida NBUS12, may be applied as
bioaugmentation strains to shorten the start-up time of styrene-degrading reactors or
formulated as part of a defined microbial cocktail for enhanced MCL-PHA
production from styrene.
7.2 Recommendations
Several research outcomes have been achieved through this work: (1) a new
analytical method for BTEXS detection at high aqueous concentrations, (2) a new
analytical method for PHA detection, (3) new insights on the bacterial community
profile of an aqueous styrene-degrading microbial consortium, and (4) a novel
styrene-degrading cum MCL-PHA-producing bacterial culture. Nevertheless, the
findings from this work have also led to new research questions that need to be
addressed in the future.
7.2.1 Developing analytical methods for more PHA monomer types
An accurate and reliable analytical calibration method is integral to the detection
and quantification of PHA. Qualitative and quantitative information about PHA
172
may further impact the selection of biological process strategies and operation
parameters. While this work has developed a GC-MS calibration method for
saturated PHA monomers with alkyl functional R groups, there is currently a lack in
analytical methods for other types of PHA monomers such as unsaturated PHAs,
branched PHAs, and PHA with specialized functional R groups. The analysis of
these aforementioned PHA monomer types continues to pose difficulties to
researchers due to the lack of readily-available commercial standards. This work
may provide a methodological reference upon which GC-MS calibration methods
for other types of PHA could be similarly modeled after. Since the chemical
diversity of PHA monomers is largely dependent on its functional R group, it is
anticipated that a carefully-curated but limited inventory of homologous PHA
analytical standards, containing the desired functional R group, may be sufficient
for the development of a GC-MS calibration method that is capable of analyzing a
wide range of PHA monomers within the same homologue series. Hence, future
research efforts could build upon this work and expand the theoretical concept,
behind this work, for the development of analytical methods for other types of PHA
monomer.
7.2.2 Widen styrene-degrading microbial community analysis to non-
bacterial microorganisms and linking microbial profile to performance
This work presented a description of the bacterial community structure of a styrene-
degrading activated sludge, its changes under prolonged styrene exposure, and
identified potential PHA-accumulating members. Aside from bacteria, fungi are
also present in activated sludge, albeit at abundances ranging from two to three
orders below that of bacteria (Cooke & Pipes, 1970). Nevertheless, several fungi
species are also known to metabolize styrene (Tischler & Kaschabek, 2012), and
have been found to co-exist with bacteria in styrene-degrading consortia (Cox et al.,
1993; Hartmans et al., 1990). However, this study, as well as recent studies
(Alexandrino et al., 2001; Arnold et al., 1997; Portune et al., 2015), were centered
on bacteria population with little to no focus on fungi members in styrene-degrading
consortia. Future investigations should examine the non-bacterial population of a
styrene-degrading community. It is anticipated that, with the aid of modern
173
biomolecular techniques such as high-throughput next-generation sequencing, it
would now be possible to obtain a more comprehensive picture and enhance the
current understanding of the styrene-degrading microbial consortium. While
elucidating the microbial players is undoubtedly an important step towards gaining
a qualitative understanding on the signature „microbial markers‟ of styrene-
degrading activated sludge, the function of these consortium members also remains
an open question, which could only be inferred from existing literature and
bioinformatics databases. Future studies, involving a combination of several
biomolecular techniques, such as isolation, cloning, proteomics, transcriptome and
metabologenomics analyses, would be crucial in providing greater insights into the
functional roles of consortium members.
7.2.3 Clarification of PHA-producing sub-population and PHA production
capability of styrene-degrading microbial community
Based on this study and existing literature (Narancic et al., 2012; Tobin & O'Connor,
2005; Ward et al., 2005), only Pseudomonas isolates were capable of bioconverting
styrene to PHA. However, many bacterial genera, with reported PHA production
capabilities, have been detected in the aqueous styrene-degrading bacterial
community. It remains unknown if there may be other genera of styrene-degrading
cum MCL-PHA-producing bacterial genera. The abundance of these bacteria as
well as their MCL-PHA production capacity would have practical implications on
the application of styrene-enriched mixed cultures or the formulation of microbial
cocktails for PHA production from styrene wastewaters. Therefore, there is a need
to thoroughly investigate the PHA-producing sub-population and MCL-PHA
production capability of styrene-degrading microbial community. This may be
achieved through expanding culture-dependent isolation strategies to capture a
higher diversity of culturable bacteria. Culture-independent methods such as
transcriptomics and protemics, with a focus on PHA biosynthesis genes and
proteins expression analyses, could also be utilized to capture information from
unculturable bacteria.
174
7.2.4 Increasing bacterial isolate diversity for the formulation of styrene-
degrading cum MCL-PHA-producing defined microbial cocktails
The direct application of pure culture for MCL-PHA production from styrene
wastewaters may thwarted by poor prolonged survival and performance due to the
culture‟s high sterility demand and sensitivity to impurities. Mixed cultures may
generally display greater robustness in complex cultivation matrices (Cabrol &
Malhautier, 2011) but tend to produce lesser PHA compared to pure microbial
cultures due to the presence of low-PHA-accumulating and non-PHA-accumulating
microorganisms (Lee, 1996; Salehizadeh & Van Loosdrecht, 2004). On the other
hand, defined microbial cocktail, which is a microbial culture comprising of two or
more pure microbial isolates, may circumvent the disadvantages associated with the
conventional pure microbial cultures and mixed microbial cultures by displaying
greater robustness to cultivation matrix impurities (Bader et al., 2010) while
enabling a greater control over the microbial community structure such that high-
PHA-producing bacteria can be included as cocktail members while low- and non-
PHA-producing bacteria can be excluded.
To formulate a styrene-degrading cum PHA-producing defined microbial cocktail
that is robust enough to persist under the complex matrix of styrene wastewater,
sufficiently diverse bacterial isolates are required. The bacterial community profile
analysis has revealed an intricate styrene-degrading consortium, comprising of
many bacterial members (Tables 5.2 and 5.3). Despite the presence of many
culturable bacteria, only 3 genera of bacteria (i.e., Pseudomonas, Stenotrophomonas
and Rhodococcus), which belonged to 2 bacterial classes (i.e.,
Gammaproteobacteria and Actinobacteria), were successfully isolated. Of which,
only P. putida NBUS12 and its closely-clustered bacterial isolates (i.e., NBUS5,
NBIWW5) could metabolize styrene and bioaccumulate MCL-PHA at high
amounts (Table 6.2). Interestingly, Stenotrophomonas and Rhodococcus bacterial
isolates tested positive for partial phaC gene detection, but were not observed to
bioconvert styrene to PHA. PHA production has been previously-described in the
genus Rhodococcus but not the genus Stenotrophomonas. It is not known if partial
phaC gene detected were false positives attributed to pseudogene, unspecific primer
175
amplification or these two isolates are indeed capable of PHA production but were
unable to do so under the tested conditions. There were also many Pseudomonas
isolates that could accumulate MCL-PHA from styrene, but do so at low levels.
Based on phylogentic clustering, some Pseudomonas isolates have close
evolutionary relationship to existing Pseudomonas species that could produce
MCL-PHA at high amounts from other aromatic substrates (Figure 6.3 and Table
6.1). It may be possible that these Pseudomonas isolates could achieve higher
MCL-PHA production with other aromatic carbon substrates such as styrene
degradation intermediate compounds. As such, there is a need to address the
discrepancy observed in Stenotrophomonas and Rhodococcus bacterial isolates, to
clarify the PHA production of “low PHA-producing” Pseudomonas isolates using
styrene metabolites, and to increase the diversity of bacterial isolate that is capable
utilizing styrene or styrene metabolites for PHA production. To do so, cultivation
and isolation strategies could be further expanded to include more carbon substrates,
cultivation media, solidifying media, incubation parameters, and etc. Increasing
bacterial isolate diversity also enables the study of the functional role of different
consortium bacterial members, which could help to link microbial profile to reactor
performance.
7.2.5 Investigation on P. putida NBUS12’s metabolic pathway and MCL-PHA
polymer property
Some interesting observations were noted for the new styrene-degrading and high
MCL-PHA-producing isolate P. putida NBUS12. In particular, the bacterium was
able to metabolize both styrene and benzoate. Benzoate is typically a degradation
by-product from side-chain oxidation of styrene by fungi or from anaerobic styrene
catabolism by bacteria (Grbić-Galić et al., 1990; Tischler & Kaschabek, 2012).
Currently, the known pathway for styrene to MCL-PHA bioconversion came from
the studies of P. putida CA-3, and involved the side-chain oxidation styrene to form
phenylacetaldehyde intermediate for subsequent MCL-PHA formation (O'Leary et
al., 2005). There is currently no evidence of coupling between styrene catabolic
pathway and MCL-PHA anabolic pathway through benzoate intermediate. Hence, it
is uncertain at this point if the bacterium could utilize such an alternative
176
bioconversion pathway. Further clarification of the bacterium‟s bioconversion
metabolic pathways would be necessary.
Additionally, P. putida NBUS12 was observed to produce MCL-PHA containing
C14 monomer. This finding presents the first reference of C14 monomer, which is by
far the monomer with the longest functional R group known to arise from styrene
metabolism. The incorporation of PHA monomers with large R groups reportedly
disrupts the crystalline packing structure within MCL-PHA, lowering the polymer‟s
cystallinity (Rai et al., 2011). The biopolymer from P. putida NBUS12 was found
to display slightly different properties from that of P. putida CA-3, which makes the
polymer more suitable for applications requiring wider processing/application
temperature and higher tensile strength. However, the Mw of the polymer was still
relatively low compared to MCL-PHA produced from other carbon sources (Rai et
al., 2011). Higher Mw is known to enhance the mechanical properties, increasing
tensile strength (Quagliano Javier & Miyazaki Silvia, 2002; Volova, 2004) and
thereby expanding the potential application niches of MCL-PHA. Hence, more
research is needed to increase the Mw of MCL-PHA from P. putida NBUS12 and
examine the impact of C14 monomer incorporation on polymer property.
177
References
Aalam, S., Pauss, A., & Lebeault, J.-M. (1993). High efficiency styrene
biodegradation in a biphasic organic/water continuous reactor. Applied
Microbiology and Biotechnology, 39(6), 696-699.
Abduli, M. A., Abbasi, M., Nasrabadi, T., Hoveidi, H., & Razmkhah, N. (2006).
Solid waste management in Tabriz Petrochemical Complex. Iranian Journal
of Environmental Health, Science and Engineering, 3(3), 185-192.
The Advent Corporation. Company Profile and Statement of Qualifications
Ahmad, M., Bajahlan, A., & Hammad, W. (2008). Industrial effluent quality,
pollution monitoring and environmental management. Environmental
Monitoring and Assessment, 147(1), 297-306.
Akiyama, M., Taima, Y., & Doi, Y. (1992). Production of poly(3-
hydroxyalkanoates) by a bacterium of the genus Alcaligenes utilizing long-
chain fatty acids. Applied Microbiology and Biotechnology, 37(6), 698-701.
Alexandrino, M., Knief, C., & Lipski, A. (2001). Stable-isotope-based labeling of
styrene-degrading microorganisms in biofilters. Applied and Environmental
Microbiology, 67(10), 4796-4804.
Alfreider, A., & Vogt, C. (2007). Bacterial diversity and aerobic biodegradation
potential in a BTEX-contaminated aquifer. Water, Air, and Soil Pollution,
183(1-4), 415-426.
Aliabadi, M., Aroujalian, A., & Raisi, A. (2012). Removal of styrene from
petrochemical wastewater using pervaporation process. Desalination, 284,
116-121.
Allen, A., Daley, P., Ayorinde, F., Gugssa, A., Anderson, W., & Eribo, B. E. (2012).
Characterization of medium chain length (R)-3-hydroxycarboxylic acids
produced by Streptomyces sp. JM3 and the evaluation of their antimicrobial
properties. World Journal of Microbiology and Biotechnology, 28(9), 2791-
2800.
Almeida, C. M. M., & Boas, L. V. (2004). Analysis of BTEX and other substituted
benzenes in water using headspace SPME-GC-FID: method validation.
Journal of Environmental Monitoring, 6(1), 80-88.
178
AlSalka, Y., Karabet, F., & Hashem, S. (2010). Development and optimisation of
quantitative analytical method to determine BTEX in environmental water
samples using HPLC-DAD. Analytical Methods, 2(8), 1026-1035.
Amann, R. I., Ludwig, W., & Schleifer, K.-H. (1995). Phylogenetic identification
and in situ detection of individual microbial cells without cultivation.
Microbiological Reviews, 59(1), 143-169.
Amosov, V. V., Zilberman, A. G., & Kucheryavykh, E. I. (1976). Experience in
local treatment of wastewater from petrochemical production. Chemistry
and Technology of Fuels and Oils, 12(11-12), 850-852.
Anderson, A. J., & Dawes, E. A. (1990). Occurrence, metabolism, metabolic role,
and industrial uses of bacterial polyhydroxyalkanoates. Microbiological
Reviews, 54(4), 450-472.
APIC. (2010). Market Data: Singapore. Retrieved Apr 18, 2012, from
http://www.apic-online.org/countrydata_singapore.htm
Araya, P., Chamy, R., Mota, M., & Alves, M. (2000). Biodegradability and toxicity
of styrene in the anaerobic digestion process. Biotechnology Letters, 22(18),
1477-1481.
Arnold, M., Reittu, A., von Wright, A., Martikainen, P. J., & Suihko, M. L. (1997).
Bacterial degradation of styrene in waste gases using a peat filter. Applied
Microbiology and Biotechnology, 48(6), 738-744.
Babaee, R., Bonakdarpour, B., Nasernejad, B., & Fallah, N. (2010). Kinetics of
styrene biodegradation in synthetic wastewaters using an industrial activated
sludge. Journal of Hazardous Materials, 184(1–3), 111-117.
Bader, J., Mast-Gerlach, E., Popović, M. K., Bajpai, R., & Stahl, U. (2010).
Relevance of microbial coculture fermentations in biotechnology. Journal of
Applied Microbiology, 109(2), 371-387.
Basile, L. A., & Erijman, L. (2010). Maintenance of phenol hydroxylase genotypes
at high diversity in bioreactors exposed to step increases in phenol loading.
FEMS Microbiology Ecology, 73(2), 336-348.
Beltrametti, F., Marconi, A. M., Bestetti, G., Colombo, C., Galli, E., Ruzzi, M., et al.
(1997). Sequencing and functional analysis of styrene catabolism genes
179
from Pseudomonas fluorescens ST. Applied and Environmental
Microbiology, 63(6), 2232-2239.
Boonchan, S., Britz, M. L., & Stanley, G. A. (1998). Surfactant-enhanced
biodegradation of high molecular weight polycyclic aromatic hydrocarbons
by Stenotrophomonas maltophilia. Biotechnology and Bioengineering, 59(4),
482-494.
Bouwer, E. J. (1989). Biotransformation of aromatics in strip-pit pond. Journal of
Environmental Engineering, 115(4), 741-755.
Bowers, R. M., Sullivan, A. P., Costello, E. K., Collett, J. L., Knight, R., & Fierer,
N. (2011). Sources of bacteria in outdoor air across cities in the midwestern
United States. Applied and Environmental Microbiology, 77(18), 6350-6356.
Brandl, H., & Püchner, P. (1991). Biodegradation of plastic bottles made from
„Biopol‟ in an aquatic ecosystem under in situ conditions. Biodegradation,
2(4), 237-243.
Braunegg, G., Sonnleitner, B., & Lafferty, R. (1978). A rapid gas chromatographic
method for the determination of poly-β-hydroxybutyric acid in microbial
biomass. European Journal of Applied Microbiology and Biotechnology,
6(1), 29-37.
Burback, B. L., & Perry, J. J. (1993). Biodegradation and biotransformation of
groundwater pollutant mixtures by Mycobacterium vaccae. Applied and
Environmental Microbiology, 59(4), 1025-1029.
Cabrol, L., & Malhautier, L. (2011). Integrating microbial ecology in bioprocess
understanding: the case of gas biofiltration. Applied Microbiology and
Biotechnology, 90(3), 837-849.
Campos-Candel, A., Llobat-Estellés, M., & Mauri-Aucejo, A. (2009). Comparative
evaluation of liquid chromatography versus gas chromatography using a β-
cyclodextrin stationary phase for the determination of BTEX in occupational
environments. Talanta, 78(4-5), 1286-1292.
Carey, F. A. (2003). Organic chemistry (Fifth ed.). New York: McGraw-Hill.
Carmona, M., Zamarro, M. T., Blázquez, B., Durante-Rodríguez, G., Juárez, J. F.,
Valderrama, J. A., et al. (2009). Anaerobic catabolism of aromatic
180
compounds: a genetic and genomic view. Microbiology and Molecular
Biology Reviews, 73(1), 71-133.
Castello, G. (1999). Retention index systems: alternatives to the n-alkanes as
calibration standards. Journal of Chromatography A, 842(1–2), 51-64.
Chambers, D. M., McElprang, D. O., Waterhouse, M. G., & Blount, B. C. (2006).
An improved approach for accurate quantitation of benzene, toluene,
ethylbenzene, xylene, and styrene in blood. Analytical Chemistry, 78(15),
5375-5383.
Chang, C. N., Chen, H. R., Huang, C. H., & Chao, A. (2000). Using sequencing
batch biofilm reactor (SBBR) to treat ABS wastewater. Water Science &
Technology, 41(4-5), 433-440.
Chen, C.-L., Wu, J.-H., & Liu, W.-T. (2008). Identification of important microbial
populations in the mesophilic and thermophilic phenol-degrading
methanogenic consortia. Water Research, 42(8–9), 1963-1976.
Chen, G.-Q. (2010a). Industrial production of PHA. In G.-Q. Chen (Ed.), Plastics
from bacteria: Natural Functions and Applications (Vol. 14, pp. 121-132).
Berlin Heidelberg, Germany: Springer.
Chen, G.-Q. (2010b). Introduction of bacterial plastics PHA, PLA, PBS, PE, PTT,
and PPP. In G.-Q. Chen (Ed.), Plastics from Bacteria: Natural Functions
and Applications (Vol. 14, pp. 1-16). Berlin Heidelberg, Germany: Springer.
Choi, J., & Lee, S. Y. (1999). Factors affecting the economics of
polyhydroxyalkanoate production by bacterial fermentation. Applied
Microbiology and Biotechnology, 51(1), 13-21.
Claesson, M. J., Wang, Q., O'Sullivan, O., Greene-Diniz, R., Cole, J. R., Ross, R. P.,
et al. (2010). Comparison of two next-generation sequencing technologies
for resolving highly complex microbiota composition using tandem variable
16S rRNA gene regions. Nucleic Acids Research.
Coats, E. R., Loge, F. J., Smith, W. A., Thompson, D. N., & Wolcott, M. P. (2007).
Functional stability of a mixed microbial consortium producing PHA from
waste carbon sources. Applied Biochemistry and Biotechnology. In J. R.
Mielenz, K. T. Klasson, W. S. Adney & J. D. McMillan (Eds.), (pp. 909-
925): Humana Press.
181
Colin, P., Sirois, G., & Chakrabarti, S. (1986). Determination of styrene in
biological samples by reversed-phase liquid chromatography. Journal of
Chromatography B: Biomedical Sciences and Applications, 375, 431-437.
Comeau, Y., Hall, K. J., & Oldham, W. K. (1988). Determination of poly-β-
hydroxybutyrate and poly-β-hydroxyvalerate in activated sludge by gas-
liquid chromatography. Applied and Environmental Microbiology, 54(9),
2325-2327.
Cooke, W. B., & Pipes, W. O. (1970). The occurrence of fungi in activated sludge.
Mycopathologia et mycologia applicata, 40(3-4), 249-270.
Corseuil, H. X., Hunt, C. S., Ferreira dos Santos, R. C., & Alvarez, P. J. J. (1998).
The influence of the gasoline oxygenate ethanol on aerobic and anaerobic
BTX biodegradation. Water Research, 32(7), 2065-2072.
Costa, S., Lépine, F., Milot, S., Déziel, E., Nitschke, M., & Contiero, J. (2009).
Cassava wastewater as a substrate for the simultaneous production of
rhamnolipids and polyhydroxyalkanoates by Pseudomonas aeruginosa.
Journal of Industrial Microbiology & Biotechnology, 36(8), 1063-1072.
Cox, H. H., Houtman, J. H., Doddema, H. J., & Harder, W. (1993). Enrichment of
fungi and degradation of styrene in biofilters. Biotechnology Letters, 15(7),
737-742.
Cushman, J. R., Rausina, G. A., Cruzan, G., Gilbert, J., Williams, E., Harrass, M. C.,
et al. (1997). Ecotoxicity hazard assessment of styrene. Ecotoxicology and
Environmental Safety, 37(2), 173-180.
Dao, L., Grigoryeva, T., Laikov, A., Devjatijarov, R., & Ilinskaya, O. (2014). Full-
scale bioreactor pretreatment of highly toxic wastewater from styrene and
propylene oxide production. Ecotoxicology and Environmental Safety, 108,
195-202.
Davis, R., Kataria, R., Cerrone, F., Woods, T., Kenny, S., O‟Donovan, A., et al.
(2013). Conversion of grass biomass into fermentable sugars and its
utilization for medium chain length polyhydroxyalkanoate (mcl-PHA)
production by Pseudomonas strains. Bioresource Technology, 150(0), 202-
209.
182
De Paula, R., Simões, M. M. Q., Neves, M. G. P. M. S., & Cavaleiro, J. A. S.
(2011). Oxidation of styrene and of some derivatives with H2O2 catalyzed
by novel imidazolium-containing manganese porphyrins: a mechanistic and
thermodynamic interpretation. Journal of Molecular Catalysis A: Chemical,
345(1–2), 1-11.
de Rijk, T. C., van de Meer, P., Eggink, G., & Weusthuis, R. A. (2005). Methods
for analysis of poly(3-hydroxyalkanoate) (PHA) composition. In Y. Doi &
A. Steinbüchel (Eds.), Biopolymers Online (Vol. 3b, pp. 1-12). Weinheim,
Germany: Wiley-VCH.
Dehghanzadeh, R., Torkian, A., Bina, B., Poormoghaddas, H., & Kalantary, A.
(2005). Biodegradation of styrene laden waste gas stream using a compost-
based biofilter. Chemosphere, 60(3), 434-439.
Demeestere, K., Dewulf, J., De Witte, B., & Van Langenhove, H. (2007). Sample
preparation for the analysis of volatile organic compounds in air and water
matrices. Journal of Chromatography A, 1153(1–2), 130-144.
Dobroth, Z. T., Hu, S., Coats, E. R., & McDonald, A. G. (2011).
Polyhydroxybutyrate synthesis on biodiesel wastewater using mixed
microbial consortia. Bioresource Technology, 102(3), 3352-3359.
Drepper, T., Eggert, T., Hummel, W., Leggewie, C., Pohl, M., Rosenau, F., et al.
(2006). Novel biocatalysts for white biotechnology. Biotechnology Journal,
1(7-8), 777-786.
Durán, U., Monroy, O., Gómez, J., & Ramírez, F. (2008) Biological wastewater
treatment for removal of polymeric resins in UASB reactor: Influence of
oxygen. Vol. 57 (pp. 1047-1052).
Edgar, R. C., Haas, B. J., Clemente, J. C., Quince, C., & Knight, R. (2011).
UCHIME improves sensitivity and speed of chimera detection.
Bioinformatics, 27(16), 2194-2200.
Ekins, S., Williams, J. A., Murray, G. I., Burke, M. D., Marchant, N. C., Engeset, J.,
et al. (1996). Xenobiotic metabolism in rat, dog, and human precision-cut
liver slices, freshly isolated hepatocytes, and vitrified precision-cut liver
slices. Drug metabolism and disposition, 24(9), 990-995.
183
Elbahloul, Y., & Steinbuchel, A. (2009). Large-scale production of poly(3-
hydroxyoctanoic acid) by Pseudomonas putida GPo1 and a simplified
downstream process. Applied and Environmental Microbiology, 75(3), 643-
651.
Escapa, I. F., Morales, V., Martino, V. P., Pollet, E., Avérous, L., García, J. L., et al.
(2011). Disruption of β-oxidation pathway in Pseudomonas putida KT2442
to produce new functionalized PHAs with thioester groups. Applied
Microbiology and Biotechnology, 89(5), 1583-1598.
Fallah, N., Bonakdarpour, B., Nasernejad, B., & Alavi Moghadam, M. R. (2010).
Long-term operation of submerged membrane bioreactor (MBR) for the
treatment of synthetic wastewater containing styrene as volatile organic
compound (VOC): Effect of hydraulic retention time (HRT). Journal of
Hazardous Materials, 178(1-3), 718-724.
Farhadian, M., Duchez, D., Vachelard, C., & Larroche, C. (2008). Monoaromatics
removal from polluted water through bioreactors - a review. Water Research,
42(6-7), 1325-1341.
Farhadian, M., Duchez, D., Vachelard, C., & Larroche, C. (2009). Accurate
quantitative determination of monoaromatic compounds for the monitoring
of bioremediation processes. Bioresource Technology, 100(1), 173-178.
Feris, K., Hristova, K., Gebreyesus, B., Mackay, D., & Scow, K. (2004). A shallow
BTEX and MTBE contaminated aquifer supports a diverse microbial
community. Microbial Ecology, 48(4), 589-600.
Fernández, D., Rodríguez, E., Bassas, M., Viñas, M., Solanas, A. M., Llorens, J., et
al. (2005). Agro-industrial oily wastes as substrates for PHA production by
the new strain Pseudomonas aeruginosa NCIB 40045: effect of culture
conditions. Biochemical Engineering Journal, 26(2-3), 159-167.
Field, J. A. (2002). Limits of anaerobic biodegradation. Water Science and
Technology, 45(10), 9-18.
Flanjak, J., & Sharrad, J. (1984). Quantitative analysis of styrene monomer in foods.
A limited East Australian survey. Journal of the Science of Food and
Agriculture, 35(4), 457-462.
184
Furrer, P., Hany, R., Rentsch, D., Grubelnik, A., Ruth, K., Panke, S., et al. (2007).
Quantitative analysis of bacterial medium-chain-length poly([R]-3-
hydroxyalkanoates) by gas chromatography. Journal of Chromatography A,
1143(1), 199-206.
Gaidos, E., Rusch, A., & Ilardo, M. (2011). Ribosomal tag pyrosequencing of DNA
and RNA from benthic coral reef microbiota: community spatial structure,
rare members and nitrogen-cycling guilds. Environmental Microbiology,
13(5), 1138-1152.
Galia, M. B. (2010). Isolation and analysis of storage compounds. In K. N. Timmis
(Ed.), Handbook of Hydrocarbon and Lipid Microbiology (pp. 3725-3741).
Berlin Heidelberg, Germany: Springer.
Gawell, B.-M., & Larsson, B. (1980). Determination of styrene in foods by
reversed-phase high-performance liquid chromatography. Journal of
Chromatography A, 198(2), 198-202.
Gilbert-López, B., Robles-Molina, J., García-Reyes, J. F., & Molina-Díaz, A.
(2010). Rapid determination of BTEXS in olives and olive oil by headspace-
gas chromatography/mass spectrometry (HS-GC–MS). Talanta, 83(2), 391-
399.
Gottschalk, G. (1986). Bacterial metabolism. Gottingen, Germany: Springer-Verlag
Berlin Heidelberg GmbH.
Grbić-Galić, D., Churchman-Eisel, N., & Mraković, I. (1990). Microbial
transformation of styrene by anaerobic consortia. Journal of Applied
Microbiology, 69(2), 247-260.
Greene, E. A., Kay, J. G., Jaber, K., Stehmeier, L. G., & Voordouw, G. (2000).
Composition of soil microbial communities enriched on a mixture of
aromatic hydrocarbons. Applied and Environmental Microbiology, 66(12),
5282-5289.
Greene, E. A., & Voordouw, G. (2004). Biodegradation of C5+ hydrocarbons by a
mixed bacterial consortium from a C5+-contaminated site. Environmental
Technology, 25(3), 355-363.
185
Gross, R., Hauer, B., Otto, K., & Schmid, A. (2007). Microbial biofilms: new
catalysts for maximizing productivity of long-term biotransformations.
Biotechnology and Bioengineering, 98(6), 1123-1134.
Gross, R., Lang, K., Bühler, K., & Schmid, A. (2010). Characterization of a biofilm
membrane reactor and its prospects for fine chemical synthesis.
Biotechnology and Bioengineering, 105(4), 705-717.
Gross, R. A., DeMello, C., Lenz, R. W., Brandl, H., & Fuller, R. C. (1989). The
biosynthesis and characterization of poly(β-hydroxyalkanoates) produced by
Pseudomonas oleovorans. Macromolecules, 22(3), 1106-1115.
Grubelnik, A., Wiesli, L., Furrer, P., Rentsch, D., Hany, R., & Meyer, V. R. (2008).
A simple HPLC-MS method for the quantitative determination of the
composition of bacterial medium chain-length polyhydroxyalkanoates.
Journal of Separation Science, 31(10), 1739-1744.
Guo, M., Zhou, Q., Zhou, Y., Yang, L., Liu, T., Yang, J., et al. (2014). Genomic
Evolution of 11 Type Strains within Family Planctomycetaceae. PloS One,
9(1), e86752.
Guzik, M. W., Kenny, S. T., Duane, G. F., Casey, E., Woods, T., Babu, R. P., et al.
(2014). Conversion of post consumer polyethylene to the biodegradable
polymer polyhydroxyalkanoate. Applied Microbiology and Biotechnology,
1-10.
Han, J. H., Park, M. S., Bae, J. W., Lee, E. Y., Yoon, Y. J., Lee, S. G., et al. (2006).
Production of (S)-styrene oxide using styrene oxide isomerase negative
mutant of Pseudomonas putida SN1. Enzyme and Microbial Technology,
39(6), 1264-1269.
Hartmans, S., Smits, J., Van der Werf, M., Volkering, F., & De Bont, J. (1989).
Metabolism of styrene oxide and 2-phenylethanol in the styrene-degrading
Xanthobacter strain 124X. Applied and Environmental Microbiology,
55(11), 2850-2855.
Hartmans, S., Van der Werf, M. J., & De Bont, J. A. M. (1990). Bacterial
degradation of styrene involving a novel flavin adenine dinucleotide-
dependent styrene monooxygenase. Applied and Environmental
Microbiology, 56(5), 1347-1351.
186
Haywood, G. W., Anderson, A. J., Roger Williams, D., Dawes, E. A., & Ewing, D.
F. (1991). Accumulation of a poly(hydroxyalkanoate) copolymer containing
primarily 3-hydroxyvalerate from simple carbohydrate substrates by
Rhodococcus sp. NCIMB 40126. International Journal of Biological
Macromolecules, 13(2), 83-88.
Herrmann, S., Kleinsteuber, S., Neu, T. R., Richnow, H. H., & Vogt, C. (2008).
Enrichment of anaerobic benzene-degrading microorganisms by in situ
microcosms. FEMS Microbiology Ecology, 63(1), 94-106.
Hong, K., Sun, S., Tian, W., Chen, G.-Q., & Huang, W. (1999). A rapid method for
detecting bacterial polyhydroxyalkanoates in intact cells by fourier
transform infrared spectroscopy. Applied Microbiology and Biotechnology,
51(4), 523-526.
Hori, K., Abe, M., & Unno, H. (2009a). Production of triacylglycerol and poly(3-
hydroxybutyrate-co-3-hydroxyvalerate) by the toluene-degrading bacterium
Rhodococcus aetherivorans IAR1. Journal of Bioscience and
Bioengineering, 108(4), 319-324.
Hori, K., Kobayashi, A., Ikeda, H., & Unno, H. (2009b). Rhodococcus
aetherivorans IAR1, a new bacterial strain synthesizing poly(3-
hydroxybutyrate-co-3-hydroxyvalerate) from toluene. Journal of Bioscience
and Bioengineering, 107(2), 145-150.
Hsieh, C.-C. (2000). Removal mechanisms of VOCs in an activated sludge process.
Journal of Hazardous Materials, 79(1–2), 173-187.
Huijberts, G. N. M., De Rijk, T. C., De Waard, P., & Eggink, G. (1994). 13
C nuclear
magnetic resonance studies of Pseudomonas putida fatty acid metabolic
routes involved in poly(3-hydroxyalkanoate) synthesis. Journal of
Bacteriology, 176(6), 1661-1666.
Hume, A. R., Nikodinovic-Runic, J., & O'Connor, K. E. (2009). FadD from
Pseudomonas putida CA-3 is a true long-chain fatty acyl coenzyme A
synthetase that activates phenylalkanoic and alkanoic acids. Journal of
Bacteriology, 191(24), 7554-7565.
187
Huse, S. M., Welch, D. M., Morrison, H. G., & Sogin, M. L. (2010). Ironing out the
wrinkles in the rare biosphere through improved OTU clustering.
Environmental Microbiology, 12(7), 1889-1898.
Ikura, Y., Yoshida, Y., & Kudo, T. (1997). Physiological properties of two
Pseudomonas mendocina strains which assimilate styrene in a two-phase
(solvent-aqueous) system under static culture conditions. Journal of
Fermentation and Bioengineering, 83(6), 604-607.
Itoh, N., Yoshida, K., & Okada, K. (1996). Isolation and identification of styrene-
degrading Corynebacterium strains, and their styrene metabolism.
Bioscience, Biotechnology, and Biochemistry, 60(11), 1826-1830.
Jacques, R. J., Okeke, B. C., Bento, F. M., Peralba, M. C., & Camargo, F. A. (2007).
Characterization of a polycyclic aromatic hydrocarbon–degrading microbial
consortium from a petrochemical sludge landfarming site. Bioremediation
Journal, 11(1), 1-11.
Jang, J. H., Hirai, M., & Shoda, M. (2006). Effect of shutdown on styrene removal
in a biofilter inoculated with Pseudomonas sp. SR-5. Journal of Hazardous
Materials, 129(1-3), 223-227.
Janssen, P. H., Yates, P. S., Grinton, B. E., Taylor, P. M., & Sait, M. (2002).
Improved culturability of soil bacteria and isolation in pure culture of novel
members of the divisions Acidobacteria, Actinobacteria, Proteobacteria, and
Verrucomicrobia. Applied and Environmental Microbiology, 68(5), 2391-
2396.
Jayamani, I., Manzella, M. P., & Cupples, A. M. (2013). RDX degradation potential
in soils previously unexposed to RDX and the identification of RDX-
degrading species in one agricultural soil using stable isotope probing.
Water, Air, & Soil Pollution, 224(10), 1-15.
Jiang, X.-T., Peng, X., Deng, G.-H., Sheng, H.-F., Wang, Y., Zhou, H.-W., et al.
(2013). Illumina sequencing of 16S rRNA tag revealed spatial variations of
bacterial communities in a mangrove wetland. Microbial Ecology, 66(1), 96-
104.
Jimenez, J. I., Miñambres, B., Garcia, J. L., & Diaz, E. (2004). Genomic insights in
the metabolism of aromatic compounds in Pseudomonas. In J.-L. Ramos
188
(Ed.), Pseudomonas (pp. 425-462). London: Kluwer Academic / Plenum
Publishers.
Jorgensen, A. D., Picel, K. C., & Stamoudis, V. C. (1990). Prediction of gas
chromatography flame ionization detector response factors from molecular
structures. Analytical Chemistry, 62(7), 683-689.
Jorio, H., Brzezinski, R., & Heitz, M. (2005). A novel procedure for the
measurement of the kinetics of styrene biodegradation in a biofilter. Journal
of Chemical Technology & Biotechnology, 80(7), 796-804.
Juneson, C., Ward, O., & Singh, A. (2001). Microbial treatment of a styrene-
contaminated air stream in a biofilter with high elimination capacities.
Journal of Industrial Microbiology and Biotechnology, 26(4), 196-202.
Jung, I.-G., & Park, C.-H. (2005). Characteristics of styrene degradation by
Rhodococcus pyridinovorans isolated from a biofilter. Chemosphere, 61(4),
451-456.
Kadouri, D., Jurkevitch, E., Okon, Y., & Castro-Sowinski, S. (2005). Ecological
and agricultural significance of bacterial polyhydroxyalkanoates. Critical
Reviews in Microbiology, 31(2), 55-67.
Kämpfer, P. (2010). Actinobacteria. In K. N. Timmis (Ed.), Handbook of
Hydrocarbon and Lipid Microbiology (pp. 1819-1838). Germany Springer.
Kanehisa, M., & Goto, S. (2000). KEGG: kyoto encyclopedia of genes and
genomes. Nucleic Acids Research, 28(1), 27-30.
Kanehisa, M., Goto, S., Sato, Y., Kawashima, M., Furumichi, M., & Tanabe, M.
(2014). Data, information, knowledge and principle: back to metabolism in
KEGG. Nucleic Acids Research, 42(D1), D199-D205.
Karr, D. B., Waters, J. K., & Emerich, D. W. (1983). Analysis of poly-β-
hydroxybutyrate in Rhizobium japonicum bacteroids by ion-exclusion high-
pressure liquid chromatography and UV detection. Applied and
Environmental Microbiology, 46(6), 1339-1344.
Kelly, W. R., Hornberger, G. M., Herman, J. S., & Mills, A. L. (1996). Kinetics of
BTX biodegradation and mineralization in batch and column systems.
Journal of Contaminant Hydrology, 23(1-2), 113-132.
189
Kenny, S. T., Nikodinovic-Runic, J., Kaminsky, W., Woods, T., Babu, R. P., Keely,
C. M., et al. (2008). Up-cycling of PET (polyethylene terephthalate) to the
biodegradable plastic PHA (polyhydroxyalkanoate). Environmental Science
& Technology, 42(20), 7696-7701.
Khaksar, M.-R., & Ghazi-Khansari, M. (2009). Determination of migration
monomer styrene from GPPS (general purpose polystyrene) and HIPS (high
impact polystyrene) cups to hot drinks. Toxicology Mechanisms and
Methods, 19(3), 257-261.
Khanna, S., & Srivastava, A. K. (2005). Recent advances in microbial
polyhydroxyalkanoates. Process Biochemistry, 40(2), 607-619.
Kim, J., Ryu, H. W., Dong, J. J., Tae, H. L., & Cho, K.-S. (2005). Styrene
degradation in a polyurethane biofilter inoculated with Pseudomonas sp. IS-
3. Journal of Microbiology and Biotechnology, 15(6), 1207-1213.
Kim, M. N., Lee, A. R., Yoon, J. S., & Chin, I. J. (2000). Biodegradation of poly(3-
hydroxybutyrate), Sky-Green® and Mater-Bi® by fungi isolated from soils.
European Polymer Journal, 36(8), 1677-1685.
Koller, M., Atlić, A., Dias, M., Reiterer, A., & Braunegg, G. (2010). Microbial
PHA production from waste raw materials. In G.-Q. Chen (Ed.), Plastics
from Bacteria: Natural Functions and Applications (Vol. 14, pp. 85-119).
Berlin Heidelberg, Germany: Springer.
Kozich, J. J., Westcott, S. L., Baxter, N. T., Highlander, S. K., & Schloss, P. D.
(2013). Development of a dual-index sequencing strategy and curation
pipeline for analyzing amplicon sequence data on the MiSeq Illumina
sequencing platform. Applied and Environmental Microbiology, 79(17),
5112-5120.
Kubinec, R., Adamuščin, J., Jurdáková, H., Foltin, M., Ostrovský, I., Kraus, A., et
al. (2005). Gas chromatographic determination of benzene, toluene,
ethylbenzene and xylenes using flame ionization detector in water samples
with direct aqueous injection up to 250 μl. Journal of Chromatography A,
1084(1-2), 90-94.
190
Kuyukina, M., & Ivshina, I. (2010). Application of Rhodococcus in Bioremediation
of Contaminated Environments. Biology of Rhodococcus. In H. M. Alvarez
(Ed.), (Vol. 16, pp. 231-262): Springer Berlin / Heidelberg.
Lageveen, R. G., Huisman, G. W., Preusting, H., Ketelaar, P., Eggink, G., &
Witholt, B. (1988). Formation of polyesters by Pseudomonas oleovorans:
effect of substrates on formation and composition of poly-(R)-3-
hydroxyalkanoates and poly-(R)-3-hydroxyalkenoates. Applied and
Environmental Microbiology, 54(12), 2924-2932.
Law, J. H., & Slepecky, R. A. (1961). Assay of poly-β-hydroxybutyric acid.
Journal of Bacteriology, 82(1), 33-36.
Lee, E.-H., Kim, J., Kim, J.-Y., Koo, S.-Y., Lee, S.-D., Ko, K.-S., et al. (2010).
Comparison of microbial communities in petroleum-contaminated
groundwater using genetic and metabolic profiles at Kyonggi-Do, South
Korea. Environmental Earth Sciences, 60(2), 371-382.
Lee, E., Jendrossek, D., Schirmer, A., Choi, C., & Steinbüchel, A. (1995).
Biosynthesis of copolyesters consisting of 3-hydroxybutyric acid and
medium-chain-length 3-hydroxyalkanoic acids from 1,3-butanediol or from
3-hydroxybutyrate by Pseudomonas sp. A33. Applied Microbiology and
Biotechnology, 42(6), 901-909.
Lee, E. Y., & Choi, C. Y. (1995). Gas chromatography-mass spectrometric analysis
and its application to a screening procedure for novel bacterial
polyhydroxyalkanoic acids containing long chain saturated and unsaturated
monomers. Journal of Fermentation and Bioengineering, 80(4), 408-414.
Lee, E. Y., Jun, Y. S., Cho, K.-S., & Ryu, H. W. (2002). Degradation characteristics
of toluene, benzene, ethylbenzene, and xylene by Stenotrophomonas
maltophilia T3-c. Journal of the Air & Waste Management Association,
52(4), 400-406.
Lee, H. O. J., Choi, M. H., Kim, T. U. N., & Yoon, S. C. (2001). Accumulation of
polyhydroxyalkanoic acid containing large amounts of unsaturated
monomers in Pseudomonas fluorescens BM07 utilizing saccharides and its
inhibition by 2-bromooctanoic acid. Applied and Environmental
Microbiology, 67(3-12), 4963-4974.
191
Lee, S. H., Kim, J. H., Mishra, D., Ni, Y. Y., & Rhee, Y. H. (2011). Production of
medium-chain-length polyhydroxyalkanoates by activated sludge enriched
under periodic feeding with nonanoic acid. Bioresource Technology,
102(10), 6159-6166.
Lee, S. Y. (1996). Plastic bacteria? Progress and prospects for
polyhydroxyalkanoate production in bacteria. Trends in Biotechnology,
14(11), 431-438.
Liang, C., Huang, C.-F., & Chen, Y.-J. (2008). Potential for activated persulfate
degradation of BTEX contamination. Water Research, 42(15), 4091-4100.
Liang, R., Wu, X., Dai, Q., Jin, D., & Wang, Y. (2010). Genetic diversity of
phthalic acid esters-degrading bacteria isolated from different geographical
regions of China. Antonie van Leeuwenhoek, 97(1), 79-89.
Lin, H., Qiao, J., Liu, Y., & Wu, Z.-L. (2010). Styrene monooxygenase from
Pseudomonas sp. LQ26 catalyzes the asymmetric epoxidation of both
conjugated and unconjugated alkenes. Journal of Molecular Catalysis B:
Enzymatic, 67(3–4), 236-241.
Lindsay, D., Ntoampe, M., & Gray, V. M. (2008). Biodegradation of sodium
benzoate by a Gram-negative consortium in a laboratory-scale fluidized bed
bioreactor. Bioresource Technology, 99(11), 5115-5119.
Liu, W. T., Marsh, T. L., Cheng, H., & Forney, L. J. (1997). Characterization of
microbial diversity by determining terminal restriction fragment length
polymorphisms of genes encoding 16S rRNA. Applied and Environmental
Microbiology, 63(11), 4516-4522.
Liu, X., Tani, A., Kimbara, K., & Kawai, F. (2006). Metabolic pathway of
xenoestrogenic short ethoxy chain-nonylphenol to nonylphenol by aerobic
bacteria, Ensifer sp. strain AS08 and Pseudomonas sp. strain AS90. Applied
Microbiology and Biotechnology, 72(3), 552-559.
Lu, J., Tappel, R. C., & Nomura, C. T. (2009). Mini-review: biosynthesis of
poly(hydroxyalkanoates). Polymer Reviews, 49(3), 226-248.
Luo, W., D‟Angelo, E. M., & Coyne, M. S. (2008). Organic carbon effects on
aerobic polychlorinated biphenyl removal and bacterial community
composition in soils and sediments. Chemosphere, 70(3), 364-373.
192
Lütke-Eversloh, T., Bergander, K., Luftmann, H., & Steinbüchel, A. (2001).
Identification of a new class of biopolymer: bacterial synthesis of a sulfur-
containing polymer with thioester linkages. Microbiology, 147(1), 11-19.
Madison, L. L., & Huisman, G. W. (1999). Metabolic engineering of poly(3-
hydroxyalkanoates): from DNA to plastic. Microbiology and Molecular
Biology Reviews, 63(1), 21-53.
Mandelbaum, R. T., Allan, D. L., & Wackett, L. P. (1995). Isolation and
characterization of a Pseudomonas sp. that mineralizes the s-triazine
herbicide atrazine. Applied and Environmental Microbiology, 61(4), 1451-
1457.
Marchessault, R. H., Dou, H., & Ramsay, J. (2011). Microbial medium chainlength
poly [(R)-3-hydroxyalkanoate] shows liquid crystal behaviour. International
Journal of Biological Macromolecules, 48(2), 271-275.
Marconi, A. M., Beltrametti, F., Bestetti, G., Solinas, F., Ruzzi, M., Galli, E., et al.
(1996). Cloning and characterization of styrene catabolism genes from
Pseudomonas fluorescens ST. Applied and Environmental Microbiology,
62(1), 121-127.
Masson-Boivin, C., Giraud, E., Perret, X., & Batut, J. (2009). Establishing nitrogen-
fixing symbiosis with legumes: how many Rhizobium recipes? Trends in
Microbiology, 17(10), 458-466.
Melnicki, M. R., Eroglu, E., & Melis, A. (2009). Changes in hydrogen production
and polymer accumulation upon sulfur-deprivation in purple photosynthetic
bacteria. International Journal of Hydrogen Energy, 34(15), 6157-6170.
Mittendorf, V., Robertson, E. J., Leech, R. M., Krüger, N., Steinbüchel, A., &
Poirier, Y. (1998). Synthesis of medium-chain-length
polyhydroxyalkanoates in Arabidopsis thaliana using intermediates of
peroxisomal fatty acid β-oxidation. Proceedings of the National Academy of
Sciences, 95(23), 13397-13402.
Mizrahi-Man, O., Davenport, E. R., & Gilad, Y. (2013). Taxonomic classification
of bacterial 16S rRNA genes using short sequencing reads: evaluation of
effective study designs. PloS One, 8(1), e53608.
193
Mooney, A., Ward, P. G., & O‟Connor, K. E. (2006). Microbial degradation of
styrene: biochemistry, molecular genetics, and perspectives for
biotechnological applications. Applied Microbiology and Biotechnology,
72(1), 1-10.
Muhr, A., Rechberger, E. M., Salerno, A., Reiterer, A., Schiller, M., Kwiecień, M.,
et al. (2013). Biodegradable latexes from animal-derived waste: biosynthesis
and characterization of mcl-PHA accumulated by Ps. citronellolis. Reactive
and Functional Polymers, 73(10), 1391–1398.
Narancic, T., Kenny, S., Djokic, L., Vasiljevic, B., O'Connor, K., & Nikodinovic-
Runic, J. (2012). Medium-chain-length polyhydroxyalkanoate production by
newly isolated Pseudomonas sp. TN301 from a wide range of polyaromatic
and monoaromatic hydrocarbons. Journal of Applied Microbiology, 113(3),
508-520.
NCBI. (2014a). Pseudomonas aeruginosa strain L-4 16S ribosomal RNA gene,
partial sequence. Retrieved 13 Oct, 2014
NCBI. (2014b). Rhodococcus qingshengii strain BLH-Y4 16S ribosomal RNA gene,
partial sequence. Retrieved 13 Oct, 2014
Nemerow, N. L., & Agardy, F. J. (1998). Strategies of industrial and hazardous
waste management: Van Nostrand Reinhold.
NEMI. National Environmental Methods Index. Retrieved 25 Mar, 2012, from
http://www.nemi.gov
Neyens, E., Baeyens, J., Dewil, R., & De heyder, B. (2004). Advanced sludge
treatment affects extracellular polymeric substances to improve activated
sludge dewatering. Journal of Hazardous Materials, 106(2–3), 83-92.
Ni, Y. Y., Kim, D. Y., Chung, M. G., Lee, S. H., Park, H. Y., & Rhee, Y. H. (2010).
Biosynthesis of medium-chain-length poly(3-hydroxyalkanoates) by volatile
aromatic hydrocarbons-degrading Pseudomonas fulva TY16. Bioresource
Technology, 101(21), 8485-8488.
Nikodinovic-Runic, J., Casey, E., Duane, G. F., Mitic, D., Hume, A. R., Kenny, S.
T., et al. (2011). Process analysis of the conversion of styrene to biomass
and medium chain length polyhydroxyalkanoate in a two-phase bioreactor.
Biotechnology and Bioengineering, 108(10), 2447-2455.
194
Nikodinovic, J., Kenny, S. T., Babu, R. P., Woods, T., Blau, W., & O‟Connor, K. E.
(2008). The conversion of BTEX compounds by single and defined mixed
cultures to medium-chain-length polyhydroxyalkanoate. Applied
Microbiology and Biotechnology, 80(4), 665-673.
Ntougias, S., Lapidus, A., Lapidus, A., Han, J., Han, J., Mavromatis, K., et al.
(2014). High quality draft genome sequence of Olivibacter sitiensis type
strain (AW-6T), a diphenol degrader with genes involved in the catechol
pathway. Standards in Genomic Sciences, 9(3).
O'Connor, K. E., Buckley, C. M., Hartmans, S., & Dobson, A. D. W. (1995).
Possible regulatory role for nonaromatic carbon sources in styrene
degradation by Pseudomonas putida CA-3. Applied and Environmental
Microbiology, 61(2), 544-548.
O'Connor, K. E., Dobson, A., & Hartmans, S. (1997). Indigo formation by
microorganisms expressing styrene monooxygenase activity. Applied and
Environmental Microbiology, 63(11), 4287-4291.
O'Leary, N. D., O'Connor, K. E., & Dobson, A. D. W. (2002). Biochemistry,
genetics and physiology of microbial styrene degradation. FEMS
Microbiology Reviews, 26(4), 403-417.
O'Leary, N. D., O'Connor, K. E., Ward, P. G., Goff, M., & Dobson, A. D. W.
(2005). Genetic characterization of accumulation of polyhydroxyalkanoate
from styrene in Pseudomonas putida CA-3. Applied and Environmental
Microbiology, 71(8), 4380-4387.
O‟Brien, D. J., Roth, L. H., & McAloon, A. J. (2000). Ethanol production by
continuous fermentation–pervaporation: a preliminary economic analysis.
Journal of Membrane Science, 166(1), 105-111.
Oehmen, A., Keller-Lehmann, B., Zeng, R. J., Yuan, Z., & Keller, J. (2005).
Optimisation of poly-β-hydroxyalkanoate analysis using gas
chromatography for enhanced biological phosphorus removal systems.
Journal of Chromatography A, 1070(1–2), 131-136.
Okamoto, K., Izawa, M., & Yanase, H. (2003). Isolation and application of a
styrene-degrading strain of Pseudomonas putida to biofiltration. Journal of
Bioscience and Bioengineering, 95(6), 633-636.
195
Olivera, E. R., Arcos, M., Naharro, G., & Luengo, J. M. (2010). Unusual PHA
biosynthesis. In G.-Q. Chen (Ed.), Plastics from Bacteria: Natural
Functions and Applications (Vol. 14, pp. 133-186). Berlin Heidelberg,
Germany: Springer.
Osswald, P., Baveye, P., & Block, J. C. (1996). Bacterial influence on partitioning
rate during the biodegradation of styrene in a biphasic aqueous-organic
system. Biodegradation, 7(4), 297-302.
Ostle, A. G., & Holt, J. (1982). Nile blue A as a fluorescent stain for poly-beta-
hydroxybutyrate. Applied and Environmental Microbiology, 44(1), 238-241.
Palleroni, N. J., & Bradbury, J. F. (1993). Stenotrophomonas, a new bacterial genus
for Xanthomonas maltophilia (Hugh 1980) Swings et al. 1983. International
Journal of Systematic Bacteriology, 43(3), 606-609.
Panke, S., Witholt, B., Schmid, A., & Wubbolts, M. G. (1998). Towards a
biocatalyst for (S)-styrene oxide production: characterization of the styrene
degradation pathway of Pseudomonas sp. strain VLB120. Applied and
Environmental Microbiology, 64(6), 2032-2043.
Panke, S., Wubbolts, M. G., Schmid, A., & Witholt, B. (2000). Production of
enantiopure styrene oxide by recombinant Escherichia coli synthesizing a
two-component styrene monooxygenase. Biotechnology and Bioengineering,
69(1), 91-100.
Pantazaki, A. A., Papaneophytou, C. P., Pritsa, A. G., Liakopoulou-Kyriakides, M.,
& Kyriakidis, D. A. (2009). Production of polyhydroxyalkanoates from
whey by Thermus thermophilus HB8. Process Biochemistry, 44(8), 847-853.
Park, H., Bae, Y., Cho, S., Kim, S., Moon, J., Ha, K., et al. (2007). Toluene-induced
accumulation of trehalose by Pseudomonas sp. BCNU 106 through the
expression of otsA and otsB homologues. Letters in Applied Microbiology,
44(1), 50-55.
Park, J. B., Bühler, B., Habicher, T., Hauer, B., Panke, S., Witholt, B., et al. (2006).
The efficiency of recombinant Escherichia coli as biocatalyst for
stereospecific epoxidation. Biotechnology and Bioengineering, 95(3), 501-
512.
196
Patrauchan, M. A., Florizone, C., Eapen, S., Gómez-Gil, L., Sethuraman, B.,
Fukuda, M., et al. (2008). Roles of ring-hydroxylating dioxygenases in
styrene and benzene catabolism in Rhodococcus jostii RHA1. Journal of
Bacteriology, 190(1), 37-47.
Peña, C., Castillo, T., García, A., Millán, M., & Segura, D. (2014).
Biotechnological strategies to improve production of microbial poly-(3-
hydroxybutyrate): a review of recent research work. Microbial
Biotechnology, 7(4), 278-293.
Peng, M., Vane, L. M., & Liu, S. X. (2003). Recent advances in VOCs removal
from water by pervaporation. Journal of Hazardous Materials, 98(1–3), 69-
90.
Pérez-Pantoja, D., Donoso, R., Agulló, L., Córdova, M., Seeger, M., Pieper, D. H.,
et al. (2012). Genomic analysis of the potential for aromatic compounds
biodegradation in Burkholderiales. Environmental Microbiology, 14(5),
1091-1117.
Pérez-Pantoja, D., Donoso, R., Junca, H., González, B., & Pieper, D. H. (2010).
Phylogenomics of aerobic bacterial degradation of aromatics. In K. N.
Timmis (Ed.), Handbook of Hydrocarbon and Lipid Microbiology (pp.
1355-1397). Germany: Springer Berlin Heidelberg.
Pérez-Pantoja, D., González, B., & Pieper, D. (2010). Aerobic degradation of
aromatic hydrocarbons. In K. N. Timmis (Ed.), Handbook of hydrocarbon
and lipid microbiology (pp. 799-837). Germany: Springer.
Pérez, M. C., Álvarez-Hornos, F. J., Portune, K., & Gabaldón, C. (2014).
Abatement of styrene waste gas emission by biofilter and biotrickling filter:
comparison of packing materials and inoculation procedures. Applied
Microbiology and Biotechnology, 1-14.
Peters, V., & Rehm, B. H. A. (2005). In vivo monitoring of PHA granule formation
using GFP-labeled PHA synthases. FEMS Microbiology Letters, 248(1), 93-
100.
Pieper, U., & Steinbüchel, A. (1992). Identification, cloning and sequence analysis
of the poly (3-hydroxyalkanoic acid) synthase gene of the Gram-positive
bacterium Rhodococcus ruber. FEMS microbiology letters, 96(1), 73-79.
197
Plastemart. (2013). Rise in global demand for polystyrene and expandable
polystyrene is led by demand from Asia Pacific. Retrieved Jun 30, 2015,
from http://www.plastemart.com/Plastic-Technical-
Article.asp?LiteratureID=2032&Paper=rise-global-demand-polystyrene-
expandable%20polystyrene-EPS-led-by-asia-pacific
Portune, K. J., Pérez, M. C., Álvarez-Hornos, F. J., & Gabaldón, C. (2015).
Investigating bacterial populations in styrene-degrading biofilters by 16S
rDNA tag pyrosequencing. Applied Microbiology and Biotechnology, 1-16.
Pouton, C. W., & Akhtar, S. (1996). Biosynthetic polyhydroxyalkanoates and their
potential in drug delivery. Advanced Drug Delivery Reviews, 18(2), 133-162.
Pruden, A., & Suidan, M. (2004). Effect of benzene, toluene, ethylbenzene, and p-
xylene (BTEX) mixture on biodegradation of methyl tert-butyl ether (MTBE)
and tert-butyl alcohol (TBA) by pure culture UC1. Biodegradation, 15(4),
213-227.
Przybulewska, K., Wieczorek, A., & Nowak, A. (2006). Isolation of
microorganisms capable of styrene degradation. Polish Journal of
Environmental Studies, 15(5), 777.
Qu, X.-H., Wu, Q., Zhang, K.-Y., & Chen, G.-Q. (2006). In vivo studies of poly(3-
hydroxybutyrate-co-3-hydroxyhexanoate) based polymers: biodegradation
and tissue reactions. Biomaterials, 27(19), 3540-3548.
Quagliano Javier, C., & Miyazaki Silvia, S. (2002). Microbial production of the
biodegradable polyester poly-3-hydroxybutyrate (PHB) from Azotobacter
Chroococcum 6B: relation between PHB molecular weight, thermal stability
and tensile strength. In A. Durieux & J. Simon (Eds.), Applied Microbiology
(Vol. 2, pp. 135-140). Netherlands: Springer.
Rai, R., Keshavarz, T., Roether, J. A., Boccaccini, A. R., & Roy, I. (2011). Medium
chain length polyhydroxyalkanoates, promising new biomedical materials
for the future. Materials Science and Engineering: R: Reports, 72(3), 29-47.
Reddy, C. S. K., Ghai, R., Rashmi, & Kalia, V. C. (2003). Polyhydroxyalkanoates:
an overview. Bioresource Technology, 87(2), 137-146.
198
Reis, J. L. R., Dezotti, M., & Sant'Anna Jr, G. L. (2007). Toxicity evaluation of the
process effluent streams of a petrochemical industry. Environmental
Technology, 28(2), 147-155.
Romo, D. M. R., Grosso, M. V., Solano, N. C. M., & Castaño, D. M. (2007). A
most effective method for selecting a broad range of short and medium-
chain-length polyhidroxyalcanoate producing microorganisms. Electronic
Journal of Biotechnology, 10(3), 348-357.
Romo, D. M. R., Obando, M. C., Perdomo, M. I. G., & Izquierdo, P. F. (2014).
PHA synthase genes in oil-degrading marine bacteria from the Colombian
Pacific Coast. International Journal of Advanced Biotechnology and
Research, 5(3), 404-414.
Rustemov, S., Golovleva, L., Alieva, R., & Baskunov, B. (1992). New pathway of
styrene oxidation by a Pseudomonas putida culture. Microbiology, 61(1), 1-
5.
Salehizadeh, H., & Van Loosdrecht, M. C. M. (2004). Production of
polyhydroxyalkanoates by mixed culture: recent trends and biotechnological
importance. Biotechnology Advances, 22(3), 261-279.
Satoh, H., Iwamoto, Y., Mino, T., & Matsuo, T. (1998). Activated sludge as a
possible source of biodegradable plastic. Water Science and Technology,
38(2), 103-109.
Schloss, P. D. (2009). A high-throughput DNA sequence aligner for microbial
ecology studies. PloS One, 4(12), e8230.
Schloss, P. D., Westcott, S. L., Ryabin, T., Hall, J. R., Hartmann, M., Hollister, E.
B., et al. (2009). Introducing mothur: open-source, platform-independent,
community-supported software for describing and comparing microbial
communities. Applied and Environmental Microbiology, 75(23), 7537-7541.
Seo, J.-S., Keum, Y.-S., & Li, Q. X. (2009). Bacterial degradation of aromatic
compounds. International Journal of Environmental Research and Public
Health, 6(1), 278-309.
Serafim, L. S., Lemos, P. C., Albuquerque, M. G. E., & Reis, M. A. M. (2008).
Strategies for PHA production by mixed cultures and renewable waste
materials. Applied Microbiology and Biotechnology, 81(4), 615-628.
199
Shah, V., Zakrzewski, M., Wibberg, D., Eikmeyer, F., Schlüter, A., & Madamwar,
D. (2013). Taxonomic profiling and metagenome analysis of a microbial
community from a habitat contaminated with industrial discharges.
Microbial Ecology, 66(3), 533-550.
Shahid, S., Mosrati, R., Ledauphin, J., Amiel, C., Fontaine, P., Gaillard, J.-L., et al.
(2013). Impact of carbon source and variable nitrogen conditions on
bacterial biosynthesis of polyhydroxyalkanoates: evidence of an atypical
metabolism in Bacillus megaterium DSM 509. Journal of Bioscience and
Bioengineering, 116(3), 302-308.
Shim, H., & Yang, S.-T. (1999). Biodegradation of benzene, toluene, ethylbenzene,
and o-xylene by a coculture of Pseudomonas putida and Pseudomonas
fluorescens immobilized in a fibrous-bed bioreactor. Journal of
Biotechnology, 67(2–3), 99-112.
Shin, H.-S., & Kwon, O.-S. (2000). The simultaneous analysis of benzene, toluene,
ethylbenzene, o, m, p-xylenes and total petroleum hydrocarbons in soil by
GC-FID after ultra-sonication. Bulletin-Korean Chemical Society, 21(11),
1101-1105.
Silva, C. C., Hayden, H., Sawbridge, T., Mele, P., Kruger, R. H., Rodrigues, M. V.,
et al. (2012). Phylogenetic and functional diversity of metagenomic libraries
of phenol degrading sludge from petroleum refinery wastewater treatment
system. AMB Express, 2(1), 1-13.
Singh, P., & Parmar, N. (2013). Isolation and characterization of two novel
polyhydroxybutyrate (PHB)-producing bacteria. African Journal of
Biotechnology, 10(24), 4907-4919.
Slepecky, R. A., & Law, J. H. (1960). A rapid spectrophotometric assay of alpha,
beta-unsaturated acids and beta-hydroxy acids. Analytical Chemistry, 32(12),
1697-1699.
Solaiman, D. K., & Ashby, R. D. (2005). Rapid genetic characterization of
poly(hydroxyalkanoate) synthase and its applications. Biomacromolecules,
6(2), 532-537.
Spiekermann, P., Rehm, B. H., Kalscheuer, R., Baumeister, D., & Steinbüchel, A.
(1999). A sensitive, viable-colony staining method using Nile red for direct
200
screening of bacteria that accumulate polyhydroxyalkanoic acids and other
lipid storage compounds. Archives of Microbiology, 171(2), 73-80.
Steinbüchel, A., & Hein, S. (2001). Biochemical and molecular basis of microbial
synthesis of polyhydroxyalkanoates in microorganisms. In W. Babel & A.
Steinbüchel (Eds.), Biopolyesters (Vol. 71, pp. 81-123). Berlin Heidelberg,
Germany: Springer
Sun, H., Terhonen, E., Koskinen, K., Paulin, L., Kasanen, R., & Asiegbu, F. O.
(2014). Bacterial diversity and community structure along different peat
soils in boreal forest. Applied Soil Ecology, 74(0), 37-45.
Sun, J., Dai, Z., Zhao, Y., & Chen, G.-Q. (2007). In vitro effect of oligo-
hydroxyalkanoates on the growth of mouse fibroblast cell line L929.
Biomaterials, 28(27), 3896-3903.
Sun, Z., Ramsay, J. A., Guay, M., & Ramsay, B. A. (2007). Carbon-limited fed-
batch production of medium-chain-length polyhydroxyalkanoates from
nonanoic acid by Pseudomonas putida KT2440. Applied microbiology and
biotechnology, 74(1), 69-77.
Sun, Z., Ramsay, J. A., Guay, M., & Ramsay, B. A. (2009). Fed-batch production of
unsaturated medium-chain-length polyhydroxyalkanoates with controlled
composition by Pseudomonas putida KT2440. Applied Microbiology and
Biotechnology, 82(4), 657-662.
Tamura, K., Peterson, D., Peterson, N., Stecher, G., Nei, M., & Kumar, S. (2011).
MEGA5: molecular evolutionary genetics analysis using maximum
likelihood, evolutionary distance, and maximum parsimony methods.
Molecular Biology and Evolution, 28(10), 2731-2739.
Tan, G.-Y. A., Chen, C.-L., Ge, L., Li, L., Wang, L., Zhao, L., et al. (2014a).
Enhanced gas chromatography-mass spectrometry method for bacterial
polyhydroxyalkanoates analysis. Journal of Bioscience and Bioengineering,
117(3), 379–382.
Tan, G.-Y. A., Chen, C.-L., Li, L., Ge, L., Wang, L., Razaad, I. M. N., et al.
(2014b). Start a research on biopolymer polyhydroxyalkanoate (PHA): a
review. Polymers, 6(3), 706-754.
201
Tan, G.-Y. A., Chen, C.-L., Zhao, L., Mo, Y., Chang, V. W. C., & Wang, J.-Y.
(2012). An HPLC-DAD method for rapid and high resolution analysis of
concentrated BTEX and styrene aqueous samples. Analytical Methods, 4(11),
3545-3550.
Tawfik, M., & Huyghebaert, A. (1998). Polystyrene cups and containers: styrene
migration. Food Additives & Contaminants, 15(5), 592-599.
Thermo Scientific Dionex, Acclaim Phenyl-1: a unique reversed-phase column with
high aromatic selectivity. (2010).
Thibodeaux, L. J. (1974). A test method for volatile component stripping of waste
water (Vol. 1). Washington, D.C.: U.S. Environmental Protection Agency.
Thompson, I. P., Van Der Gast, C. J., Ciric, L., & Singer, A. C. (2005).
Bioaugmentation for bioremediation: the challenge of strain selection.
Environmental Microbiology, 7(7), 909-915.
Tijssen, R., Katz, E., Eksteen, R., & Schoenmakers, P. (1998). The mechanisms and
importance of zone-spreading. In Danilo Corradini, Elena Katz, Roy
Eksteen, Peter Schoenmakers & N. Miller (Eds.), Handbook of HPLC (Vol.
78, pp. 55-142). New York, USA: CRC Press.
Tischler, D., Eulberg, D., Lakner, S., Kaschabek, S. R., van Berkel, W. J., &
Schlömann, M. (2009). Identification of a novel self-sufficient styrene
monooxygenase from Rhodococcus opacus 1CP. Journal of Bacteriology,
191(15), 4996-5009.
Tischler, D., & Kaschabek, S. R. (2012). Microbial styrene degradation: from basics
to biotechnology. In S. N. Singh (Ed.), Microbial Degradation of
Xenobiotics (pp. 67-99). Berlin, Heidelberg, Germany: Springer.
Tobin, K. M., & O'Connor, K. E. (2005). Polyhydroxyalkanoate accumulating
diversity of Pseudomonas species utilising aromatic hydrocarbons. FEMS
Microbiology Letters, 253(1), 111-118.
Tong, H. Y., Thompson, T. S., & Karasek, F. W. (1985). Quantitative responses of
normal alkanes in gas chromatographic-mass spectrometric analysis.
Journal of Chromatography A, 350(0), 27-35.
Tønnesen, H. H., & Karlsen, J. (1986). Studies on curcumin and curcuminoids VII.
Chromatographic separation and quantitative analysis of curcumin and
202
related compounds. Zeitschrift für Lebensmitteluntersuchung und -
Forschung A, 182(3), 215-218.
Tossavainen, A. (1978). Styrene use and occupational exposure in the plastics
industry. Scandinavian Journal of Work, Environment & Health, 7-13.
Tresse, O. T., Lorrain, M. J. L., & Rho, D. R. (2002). Population dynamics of free-
floating and attached bacteria in a styrene-degrading biotrickling filter
analyzed by denaturing gradient gel electrophoresis. Applied Microbiology
and Biotechnology, 59(4), 585-590.
US EPA Drinking Water Contaminants. (2012). Retrieved 25 Mar, 2012, from
http://water.epa.gov/drink/contaminants/
US EPA. (1974). Development document for effluent limitations guidelines and new
source performance standards for the synthetic resins - segment of the
plastics and synthetic materials manufacturing: U.S. Environmental
Protection Agency.
US EPA. (1994). Pollution Prevention and Toxics, Styrene Fact Sheet: Support
Document , EPA 749-F-95-019a, Case No. 100-42-5.
US EPA. (2010). Technical Factsheet on: Styrene: U.S. Environmental Protection
Agency.
Valappil, S. P., Boccaccini, A. R., Bucke, C., & Roy, I. (2007).
Polyhydroxyalkanoates in Gram-positive bacteria: Insights from the genera
Bacillus and Streptomyces. Antonie van Leeuwenhoek, 91(1), 1-17.
Valentin, H. E., Lee, E. Y., Choi, C. Y., & Steinbüchel, A. (1994). Identification of
4-hydroxyhexanoic acid as a new constituent of biosynthetic
polyhydroxyalkanoic acids from bacteria. Applied Microbiology and
Biotechnology, 40(5), 710-716.
van der Walle, G., de Koning, G., Weusthuis, R., & Eggink, G. (2001). Properties,
Modifications and Applications of Biopolyesters
Biopolyesters. In W. Babel & A. Steinbüchel (Eds.), (Vol. 71, pp. 263-291):
Springer Berlin / Heidelberg.
van Hellemond, E. W., Janssen, D. B., & Fraaije, M. W. (2007). Discovery of a
novel styrene monooxygenase originating from the metagenome. Applied
and Environmental Microbiology, 73(18), 5832-5839.
203
Velasco, A., Alonso, S., García, J. L., Perera, J., & Díaz, E. (1998). Genetic and
functional analysis of the styrene catabolic cluster of Pseudomonas sp. strain
Y2. Journal of Bacteriology, 180(5), 1063-1071.
Verlinden, R. A. J., Hill, D. J., Kenward, M. A., Williams, C. D., & Radecka, I.
(2007). Bacterial synthesis of biodegradable polyhydroxyalkanoates.
Journal of Applied Microbiology, 102(6), 1437-1449.
Verma, S., Bhatia, Y., Valappil, S., & Roy, I. (2002). A possible role of poly-3-
hydroxybuiyric acid in antibiotic production in Streptomyces. Archives of
Microbiology, 179(1), 66-69.
Vidali, M. (2001). Bioremediation. An overview. Pure and Applied Chemistry,
73(7), 1163-1172.
Vitha, M., & Carr, P. W. (2006). The chemical interpretation and practice of linear
solvation energy relationships in chromatography. Journal of
Chromatography A, 1126(1–2), 143-194.
Volova, T. G. (2004). Polyhydroxyalkanoates- Plastic Materials of the 21st Century:
production, properties, applications. New York, USA: Nova Science
Publishers.
Wang, Q., Garrity, G. M., Tiedje, J. M., & Cole, J. R. (2007). Naive Bayesian
classifier for rapid assignment of rRNA sequences into the new bacterial
taxonomy. Applied and environmental microbiology, 73(16), 5261-5267.
Wang, Q., & Nomura, C. T. (2010). Monitoring differences in gene expression
levels and polyhydroxyalkanoate (PHA) production in Pseudomonas putida
KT2440 grown on different carbon sources. Journal of Bioscience and
Bioengineering, 110(6), 653-659.
Wang, Q., Zhang, H., Chen, Q., Chen, X., Zhang, Y., & Qi, Q. (2010). A marine
bacterium accumulates polyhydroxyalkanoate consisting of mainly 3-
hydroxydodecanoate and 3-hydroxydecanoate. World Journal of
Microbiology and Biotechnology, 26(6), 1149-1153.
Wang, Y., Ruan, L., Chua, H., & Yu, P. H. (2006). Cloning and expression of the
PHA synthase genes phaC1 and phaC1AB into Bacillus subtilis. World
Journal of Microbiology and Biotechnology, 22(6), 559-563.
204
Ward, A. C., & Dawes, E. A. (1973). A disk assay for poly-β-hydroxybutyrate.
Analytical Biochemistry, 52(2), 607-613.
Ward, P. G., De Roo, G., & O‟Connor, K. E. (2005). Accumulation of
polyhydroxyalkanoate from styrene and phenylacetic acid by Pseudomonas
putida CA-3. Applied and Environmental Microbiology, 71(4), 2046-2052.
Ward, P. G., Goff, M., Donner, M., Kaminsky, W., & O'Connor, K. E. (2006). A
two step chemo-biotechnological conversion of polystyrene to a
biodegradable thermoplastic. Environmental Science & Technology, 40(7),
2433-2437.
Warhurst, A. M., Clarke, K. F., Hill, R. A., Holt, R. A., & Fewson, C. A. (1994).
Metabolism of styrene by Rhodococcus rhodochrous NCIMB 13259.
Applied and Rnvironmental Microbiology, 60(4), 1137-1145.
Warhurst, A. M., & Fewson, C. A. (1994). Microbial metabolism and
biotransformations of styrene. Journal of Applied Microbiology, 77(6), 597-
606.
Warmink, J. A., Nazir, R., & Van Elsas, J. D. (2009). Universal and species-specific
bacterial „fungiphiles‟ in the mycospheres of different basidiomycetous
fungi. Environmental Microbiology, 11(2), 300-312.
Watanabe, K., Futamata, H., & Harayama, S. (2002). Understanding the diversity in
catabolic potential of microorganisms for the development of
bioremediation strategies. Antonie Van Leeuwenhoek, 81(1-4), 655-663.
Wei, Y., Van Houten, R. T., Borger, A. R., Eikelboom, D. H., & Fan, Y. (2003).
Minimization of excess sludge production for biological wastewater
treatment. Water Research, 37(18), 4453-4467.
Weisburg, W. G., Barns, S. M., Pelletier, D. A., & Lane, D. J. (1991). 16S
ribosomal DNA amplification for phylogenetic study. Journal of
Bacteriology, 173(2), 697-703.
Werker, A., Lind, P., Bengtsson, S., & Nordström, F. (2008). Chlorinated-solvent-
free gas chromatographic analysis of biomass containing
polyhydroxyalkanoates. Water Research, 42(10–11), 2517-2526.
WHO. (2000). WHO air quality guidelines for Europe (2nd ed.). Copenhagen,
Denmark: WHO Press, World Health Organization.
205
WHO. (2011). Guidelines for drinking-water quality (4th ed.). Geneva: WHO Press,
World Health Organization.
Winderl, C., Anneser, B., Griebler, C., Meckenstock, R. U., & Lueders, T. (2008).
Depth-resolved quantification of anaerobic toluene degraders and aquifer
microbial community patterns in distinct redox zones of a tar oil
contaminant plume. Applied and Environmental Microbiology, 74(3), 792-
801.
Witholt, B., & Kessler, B. (1999). Perspectives of medium chain length poly
(hydroxyalkanoates), a versatile set of bacterial bioplastics. Current Opinion
in Biotechnology, 10(3), 279-285.
Wu, B., & Zhou, M. (2009). Sorption of styrene from aqueous solutions with oil
absorptive resin. Journal of Environmental Management, 90(1), 217-221.
Wu, H. A., Sheu, D. S., & Lee, C. Y. (2003). Rapid differentiation between short-
chain-length and medium-chain-length polyhydroxyalkanoate-accumulating
bacteria with spectrofluorometry. Journal of Microbiological Methods,
53(1), 131-135.
Yu, H., Kim, B., & Rittmann, B. (2001). The roles of intermediates in
biodegradation of benzene, toluene, and p-xylene by Pseudomonas putida
F1. Biodegradation, 12(6), 455-463.
Zheng, L. Z., Li, Z., Tian, H.-L., Li, M., & Chen, G.-Q. (2005). Molecular cloning
and functional analysis of (R)-3-hydroxyacyl-acyl carrier protein:coenzyme
A transacylase from Pseudomonas mendocina LZ. FEMS Microbiology
Letters, 252(2), 299-307.
Zilli, M., Converti, A., & Di Felice, R. (2003). Macrokinetic and quantitative
microbial investigation on a bench-scale biofilter treating styrene-polluted
gaseous streams. Biotechnology and Bioengineering, 83(1), 29-38.
Zinn, M. (2010). Biosynthesis of medium-chain-length poly[(R)-3-
hydroxyalkanoates]. In G. G.-Q. Chen (Ed.), Plastics from Bacteria (Vol. 14,
pp. 213-236). Berlin, Heidelberg, Germany: Springer.
Zinn, M., & Hany, R. (2005). Tailored material properties of
polyhydroxyalkanoates through biosynthesis and chemical modification.
Advanced Engineering Materials, 7(5), 408-411.
206
Zinn, M., Witholt, B., & Egli, T. (2001). Occurrence, synthesis and medical
application of bacterial polyhydroxyalkanoate. Advanced Drug Delivery
Reviews, 53(1), 5-21.
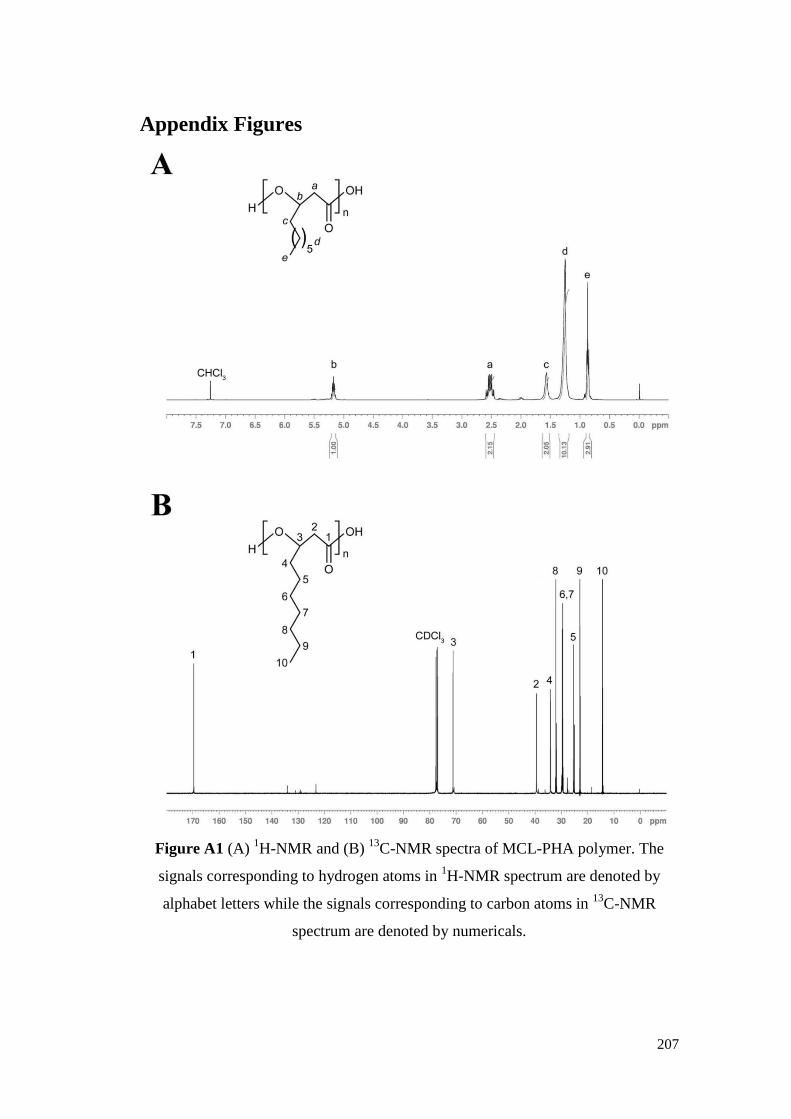
207
Appendix Figures
Figure A1 (A) 1H-NMR and (B)
13C-NMR spectra of MCL-PHA polymer. The
signals corresponding to hydrogen atoms in 1H-NMR spectrum are denoted by
alphabet letters while the signals corresponding to carbon atoms in 13
C-NMR
spectrum are denoted by numericals.
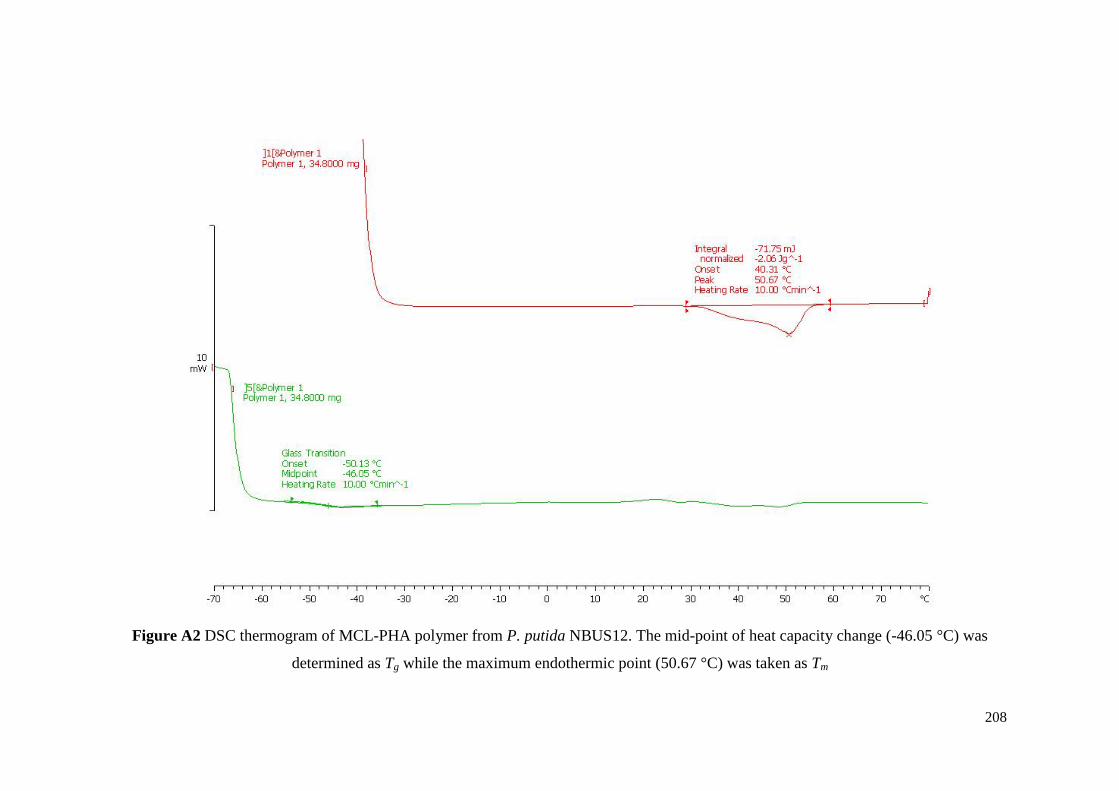
208
Figure A2 DSC thermogram of MCL-PHA polymer from P. putida NBUS12. The mid-point of heat capacity change (-46.05 °C) was
determined as Tg while the maximum endothermic point (50.67 °C) was taken as Tm
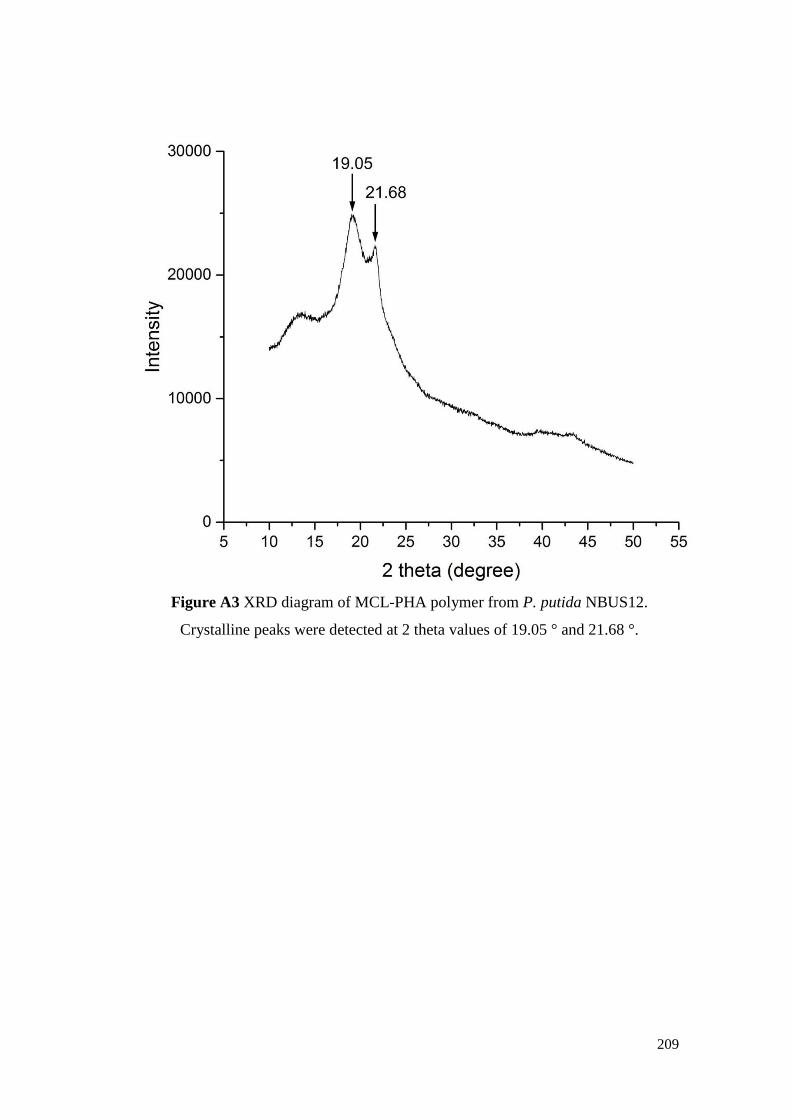
209
Figure A3 XRD diagram of MCL-PHA polymer from P. putida NBUS12.
Crystalline peaks were detected at 2 theta values of 19.05 ° and 21.68 °.
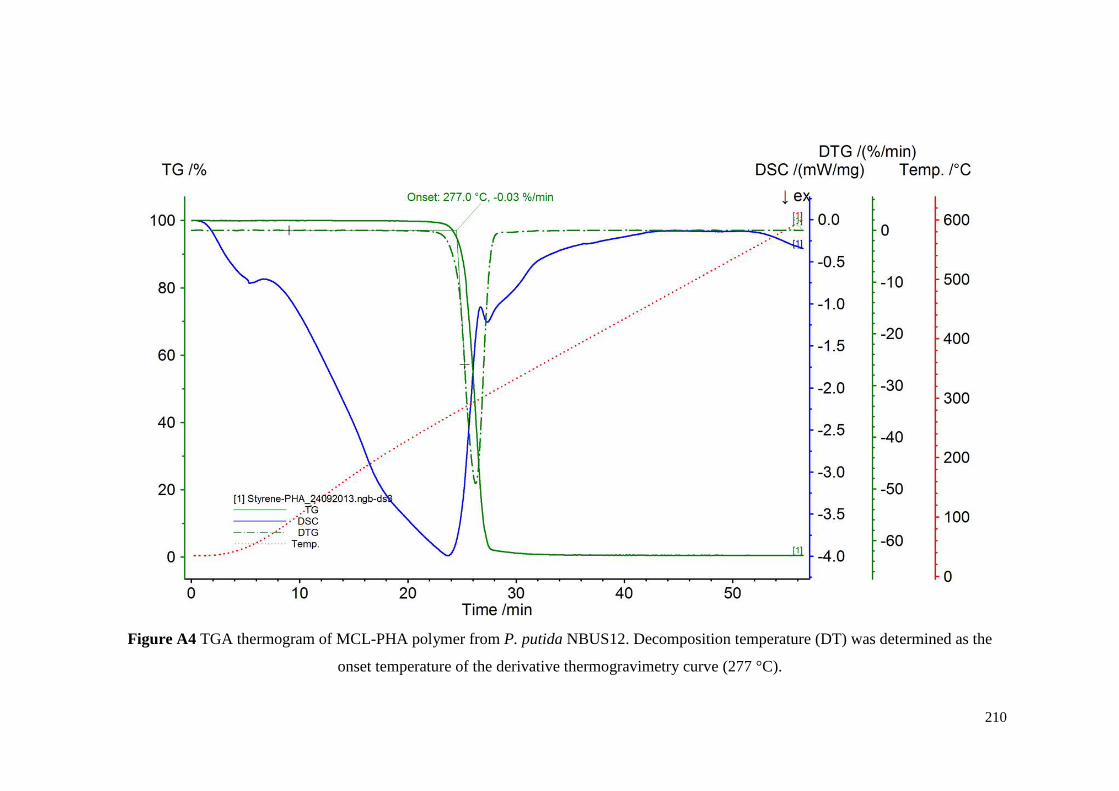
210
Figure A4 TGA thermogram of MCL-PHA polymer from P. putida NBUS12. Decomposition temperature (DT) was determined as the
onset temperature of the derivative thermogravimetry curve (277 °C).


![Weak Temperature Dependence of Structure in Hydrophobic … · 2016. 7. 20. · styrene and sodium styrene sulfonate [poly-(sodium styrene sulfonate) f-(styrene) 1 f] (PSSNa) whose](https://img.pdfslide.us/doc/110x75/6121e88d85512935481dfaad/weak-temperature-dependence-of-structure-in-hydrophobic-2016-7-20-styrene-and.jpg)