Embed Size (px)
Citation preview

STYLITIS-POWER…designed for in coming and out coming power/energy analysis‐ ‐
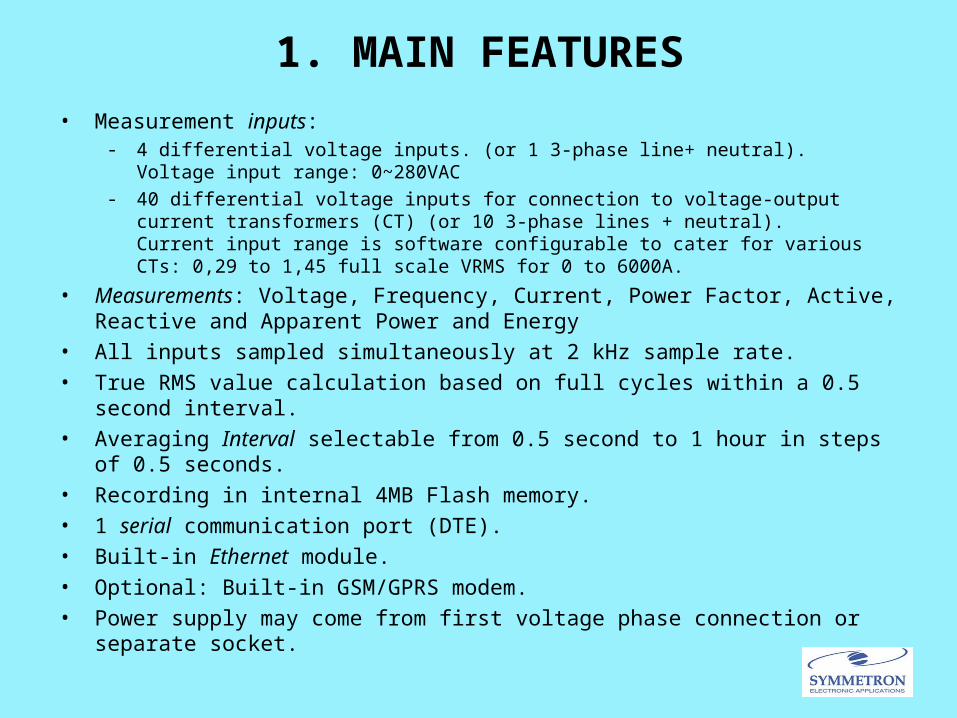
1. MAIN FEATURES• Measurement inputs:
- 4 differential voltage inputs. (or 1 3-phase line+ neutral). Voltage input range: 0~280VAC
- 40 differential voltage inputs for connection to voltage output current transformers (CT) (or 10 3-‐phase lines + neutral). Current input range is software configurable to cater for various CTs: 0,29 to 1,45 full scale VRMS for 0 to 6000A.
• Measurements: Voltage, Frequency, Current, Power Factor, Active, Reactive and Apparent Power and Energy
• All inputs sampled simultaneously at 2 kHz sample rate. • True RMS value calculation based on full cycles within a 0.5 second interval. • Averaging Interval selectable from 0.5 second to 1 hour in steps of 0.5 seconds. • Recording in internal 4MB Flash memory. • 1 serial communication port (DTE).• Built-in Ethernet module.• Optional: Built-in GSM/GPRS modem.• Power supply may come from first voltage phase connection or separate socket.
2. PHYSICAL FORM
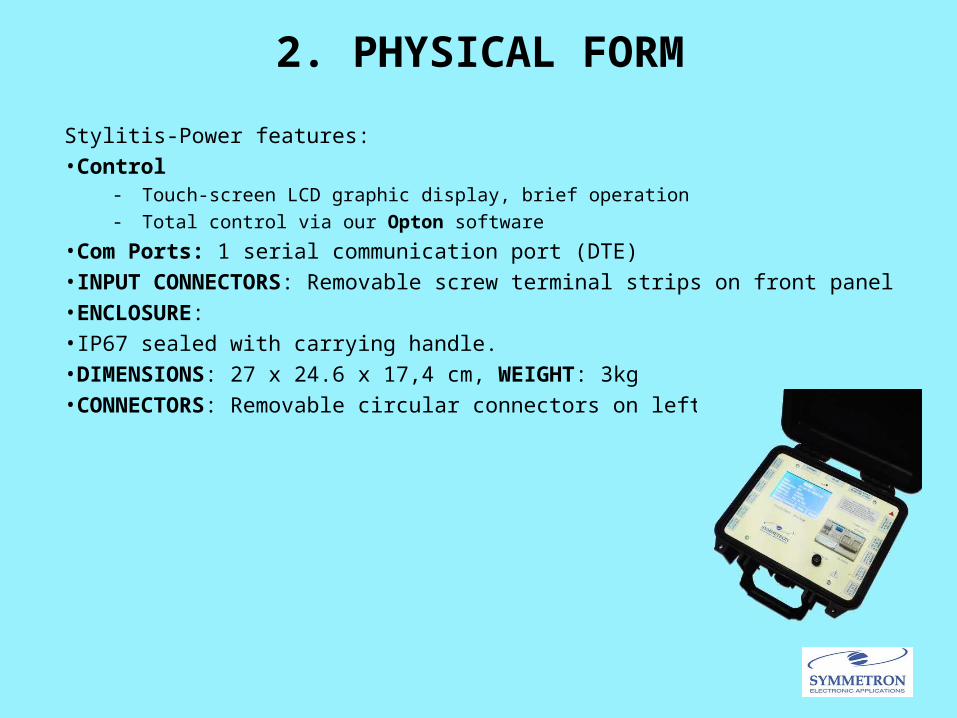
Stylitis-Power features:•Control
- Touch-screen LCD graphic display, brief operation- Total control via our Opton software
•Com Ports: 1 serial communication port (DTE) •INPUT CONNECTORS: Removable screw terminal strips on front panel•ENCLOSURE: •ΙΡ67 sealed with carrying handle. •DIMENSIONS: 27 x 24.6 x 17,4 cm, WEIGHT: 3kg •CONNECTORS: Removable circular connectors on left and right side
3. SCREEN AND KEYBOARD
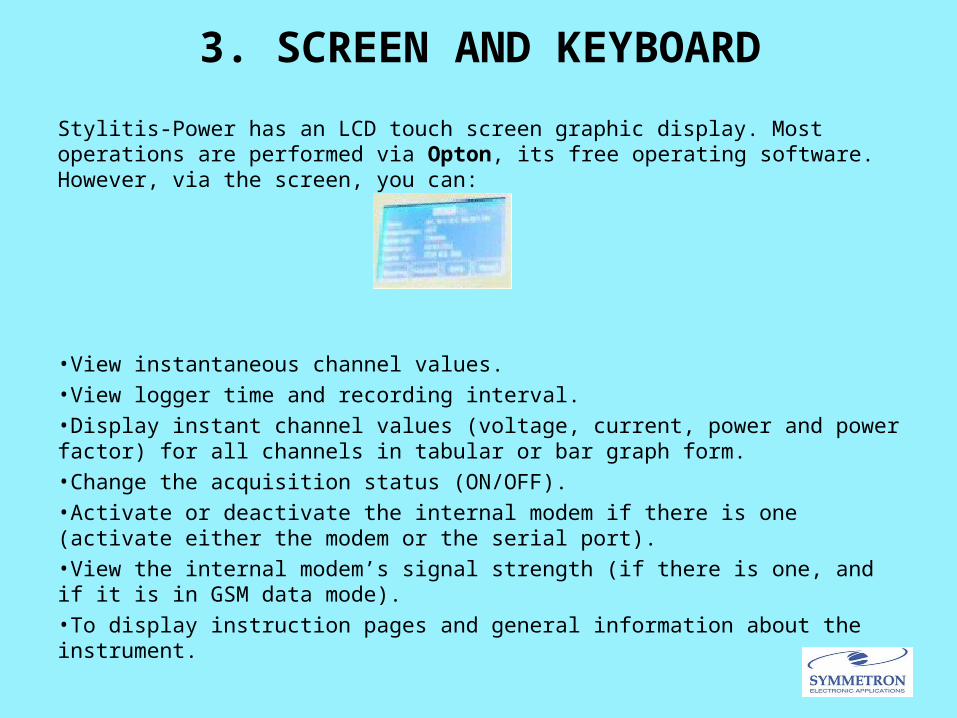
Stylitis-Power has an LCD touch screen graphic display. Most operations are performed via Opton, its free operating software. However, via the screen, you can:
•View instantaneous channel values.•View logger time and recording interval.•Display instant channel values (voltage, current, power and power factor) for all channels in tabular or bar graph form. •Change the acquisition status (ON/OFF).•Activate or deactivate the internal modem if there is one (activate either the modem or the serial port).•View the internal modem’s signal strength (if there is one, and if it is in GSM data mode).•To display instruction pages and general information about the instrument.
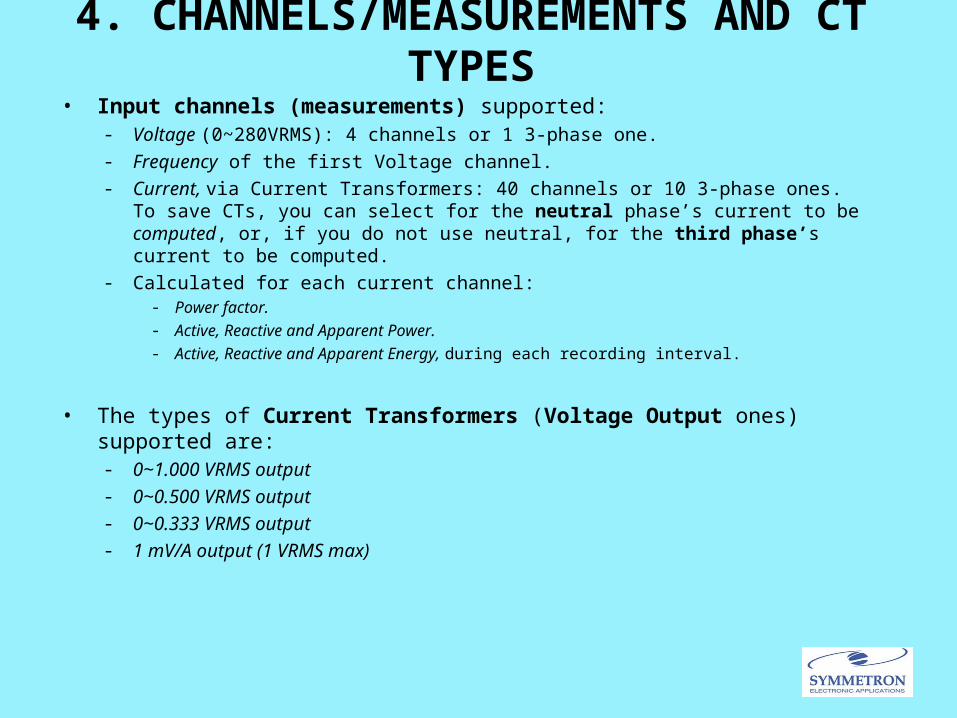
4. CHANNELS/MEASUREMENTS AND CT TYPES• Input channels (measurements) supported:
- Voltage (0~280VRMS): 4 channels or 1 3-phase one.- Frequency of the first Voltage channel.- Current, via Current Transformers: 40 channels or 10 3-phase ones.
To save CTs, you can select for the neutral phase’s current to be computed, or, if you do not use neutral, for the third phase’s current to be computed.
- Calculated for each current channel:- Power factor.- Active, Reactive and Apparent Power.- Active, Reactive and Apparent Energy, during each recording interval.
• The types of Current Transformers (Voltage Output ones) supported are:- 0~1.000 VRMS output- 0~0.500 VRMS output- 0~0.333 VRMS output- 1 mV/A output (1 VRMS max)
5. STYLITIS-POWER MODELS (VERSIONS)
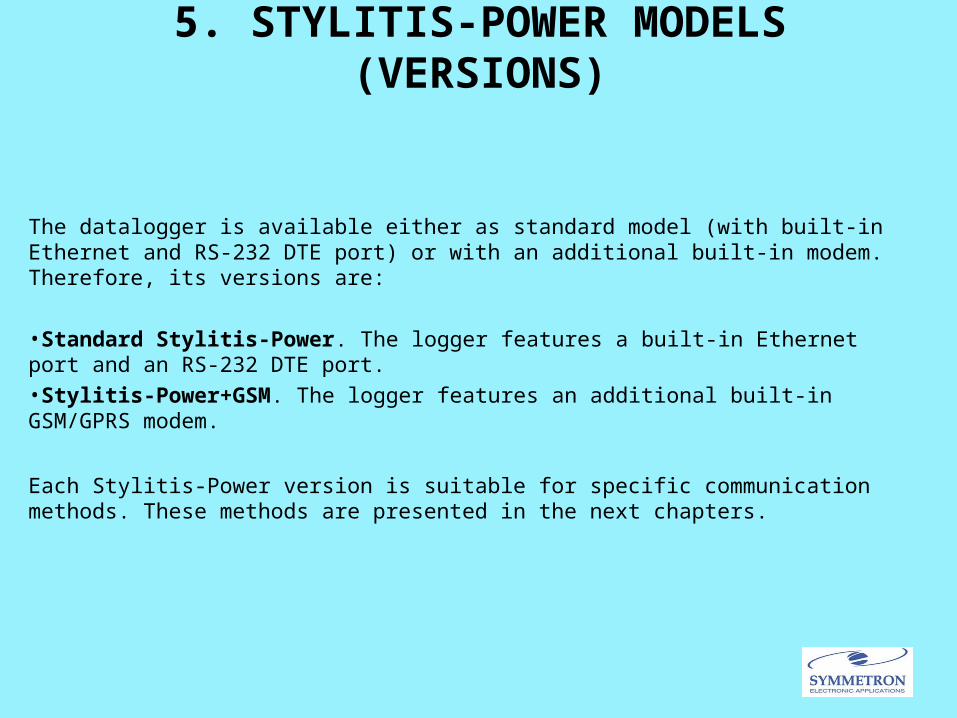
The datalogger is available either as standard model (with built-in Ethernet and RS-232 DTE port) or with an additional built-in modem. Therefore, its versions are:
•Standard Stylitis-Power. The logger features a built-in Ethernet port and an RS-232 DTE port.•Stylitis-Power+GSM. The logger features an additional built-in GSM/GPRS modem.
Each Stylitis-Power version is suitable for specific communication methods. These methods are presented in the next chapters.
6. COMMUNICATION METHODS
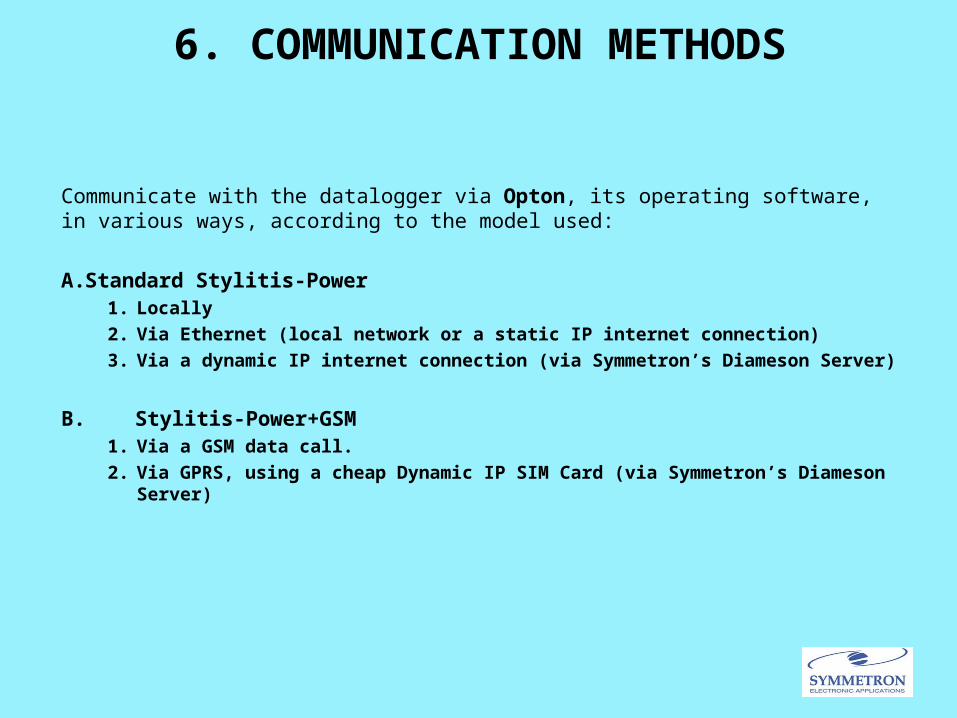
Communicate with the datalogger via Opton, its operating software, in various ways, according to the model used:
A.Standard Stylitis-Power1. Locally2. Via Ethernet (local network or a static IP internet connection)3. Via a dynamic IP internet connection (via Symmetron’s Diameson Server)
B. Stylitis-Power+GSM1. Via a GSM data call.2. Via GPRS, using a cheap Dynamic IP SIM Card (via Symmetron’s Diameson Server)
7. LOCAL COMMUNICATION
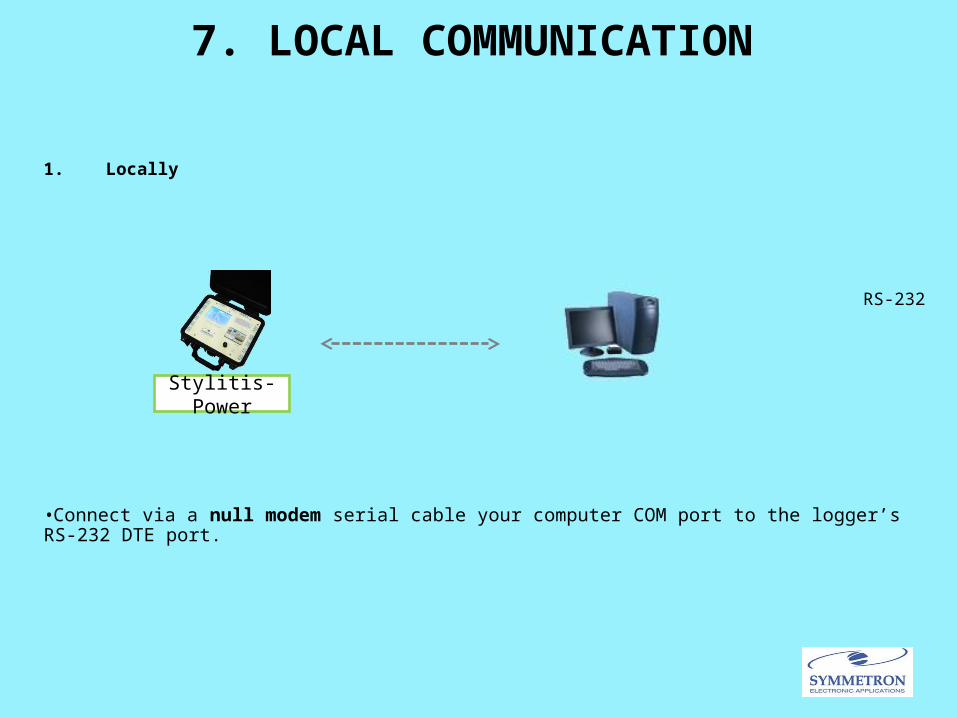
1. Locally
RS-232
•Connect via a null modem serial cable your computer COM port to the logger’s RS-232 DTE port.
Stylitis-Power
8. STATIC IP ETHERNET COMMUNICATION
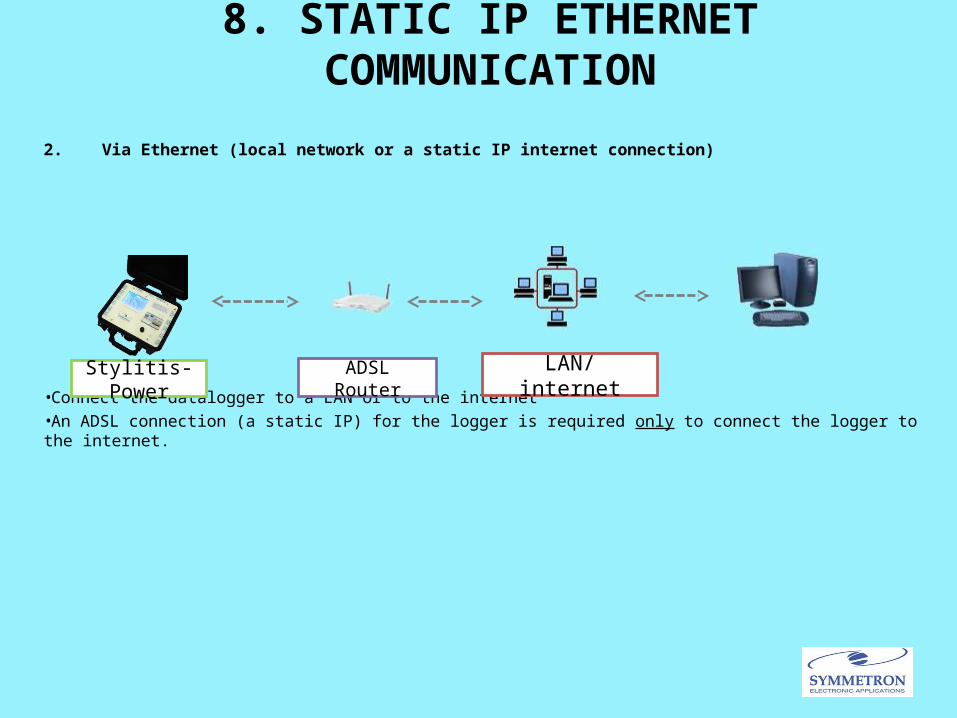
2. Via Ethernet (local network or a static IP internet connection)
•Connect the datalogger to a LAN or to the internet•An ADSL connection (a static IP) for the logger is required only to connect the logger to the internet.
LAN/ internetADSL RouterStylitis-Power
9. DYNAMIC IP ETHERNET COMMUNICATION
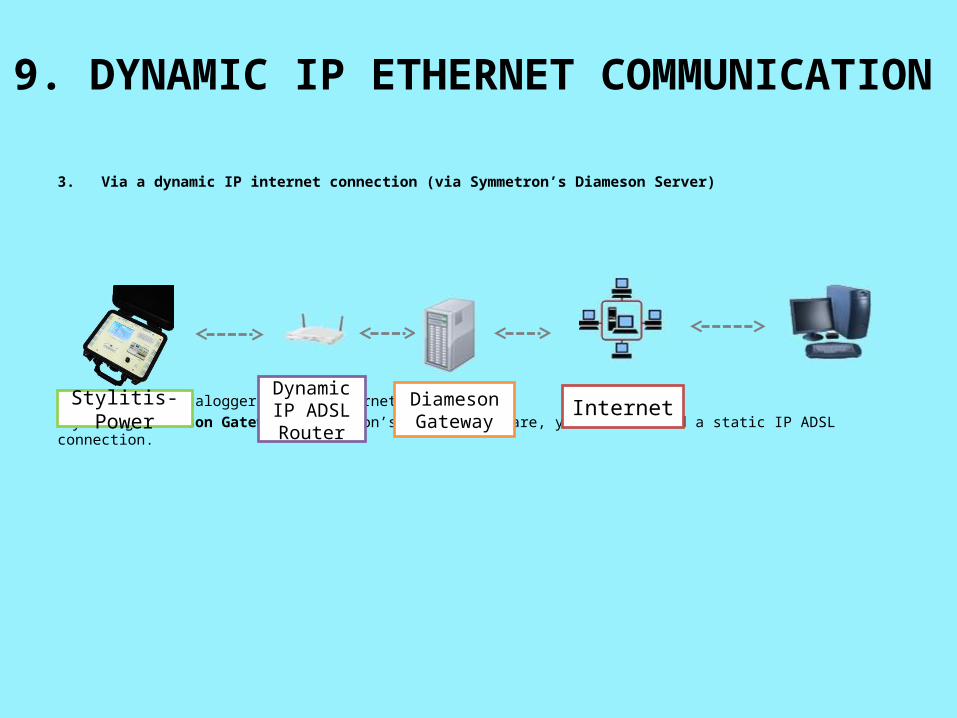
3. Via a dynamic IP internet connection (via Symmetron’s Diameson Server)
•Connect the datalogger to the internet.•By using Diameson Gateway, Symmetron’s server software, you do not need a static IP ADSL connection.
InternetDynamic IP
ADSL Router
Diameson Gateway
Stylitis-Power
10. GSM COMMUNICATION
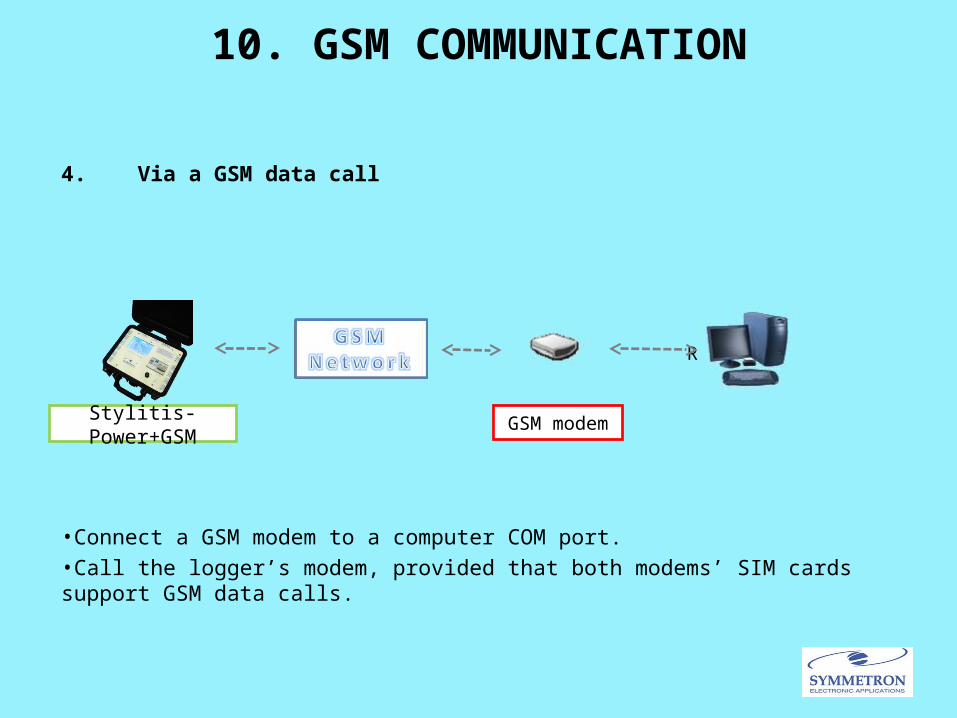
4. Via a GSM data call
RS-232
•Connect a GSM modem to a computer COM port.•Call the logger’s modem, provided that both modems’ SIM cards support GSM data calls.
GSM modemStylitis-Power+GSM
11. GPRS COMMUNICATION (VIA DYNAMIC IP SIM)
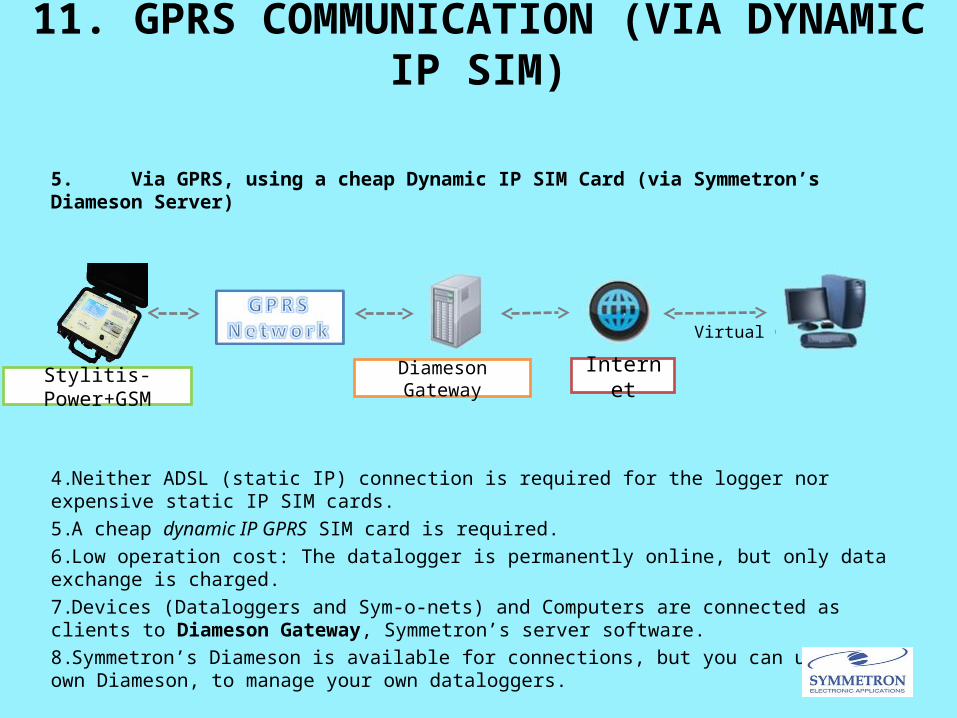
5. Via GPRS, using a cheap Dynamic IP SIM Card (via Symmetron’s Diameson Server)
Virtual COM
4.Neither ADSL (static IP) connection is required for the logger nor expensive static IP SIM cards.5.A cheap dynamic IP GPRS SIM card is required.6.Low operation cost: The datalogger is permanently online, but only data exchange is charged.7.Devices (Dataloggers and Sym-o-nets) and Computers are connected as clients to Diameson Gateway, Symmetron’s server software.8.Symmetron’s Diameson is available for connections, but you can use your own Diameson, to manage your own dataloggers.
InternetDiameson GatewayStylitis-Power+GSM
Opton is Stylitis-Power’s free operating software.
•Start up with Opton, by creating Site folders and Connections. - Create one unique site folder for each datalogger.- In each site folder, multiple (different types of) connections can be created for the logger. The different
connection types correspond to the communication methods, discussed before.- The connections created are saved as windows files, which are recognized by Opton in a folder interface,
along with the compressed and decompressed data files (see Chapter 14), and setup files, ie logger settings (see next Chapter) saved in a file.
Refer to the corresponding screen shot in Chapter 16.
•After achieving a connection, you can communicate with the logger. Besides changing its settings and download data, you can view some features, and specifically:
- View the logger’s status: Instant parameters, such as the date and time, the current data file being recorded, the recording time remaining, etc.Refer to the corresponding screen shot in Chapter 16.
- View the instant channel values. Refer to the corresponding screen shot in Chapter 16.
- View an Online plot of the selected channels’ values. Samples are plotted every second. Besides the channel, you can also select the measurement (current, power factor, active energy, etc).Refer to the corresponding screen shot in Chapter 17.
12. OPTON: STARTING UP AND VIEW
13. OPTON: SETUP• Connect to the datalogger, via Opton, via one of the connections you created and modify its setup.
The main settings to be adjusted are the channel settings. VOLTAGE CHANNEL SETTINGS
• The Voltage Channel refers either to one 3-phase line (+neutral) or to 4 independent 1-phase lines.• The only parameter to be set is each line’s slope. There is a default one, but you can also type a
more exact calibrated one.CURRENT CHANNEL SETTINGS
• The Current Channels refer either to 10 3-phase lines (+neutral) or to 40 independent 1-phase lines. The settings of a current channels can be changed in two ways:
- Change each phase’s Slope manually. There are default Slopes, but you can also type a more exact calibrated one.
- Select a specific Current Transformer Type, along with its full scale current. This way, the Slopes will be calculated automatically. The CT types (correspond to their full scale output voltage) are:1.000VRMS, 0.500VRMS, 0.333VRMS, 1mV/A RMS (1VRMS max).
• In 3-phase measurements, you can also save CTs, by selecting for the neutral current to be computed, or if you do not use neutral, by selecting for the 3rd phase current to be computed.
Refer to the corresponding screen shots in Chapter 16.REMAINING SETTINGS
• Other settings to be adjusted are:– The averaging recording interval (selectable from 0.5 sec to 1 hour).– The logger’s site name. – The GPRS settings of Symmetron’s Diameson server (IP and remote port).– Only for the GSM version: the GPRS settings of the SIM card (APN, User Name, Password).
• After writing the desired setup in the datalogger, enable/ disable data acquisition to create data files, stored in the 4MB memory. When enabling acquisition, a new file begins.
• Files are stored in the logger’s memory in compressed form.• When downloaded, a compressed file is decompressed into two data files:
– One file containing each current channel’s energy (Active, Reactive and Apparent) within the interval. The sum of a column results in the corresponding energy of the entire file.
– One file containing all the remaining measurements: Voltage, Frequency, Current, Power Factor, Active, Reactive and Apparent Power.
• The data files can be viewed via a text editor. Data are displayed either in plain text form or in grid form (channel columns are apparent).
• Compressed and decompressed data files are stored in the logger’s site folder, as mentioned in Chapter 12.
• Data download can be achieved either manually or automatically via AutoConnect software (see Chapter 18).
MANUAL DOWNLOADThere are 2 types of manual download:• Download the most recent file. If Acquisition is ON, this is the current file. In this case, the current file is
firstly closed (the next file begins) and then downloaded. • Download one or more consecutive previous files, by typing their number.
14. OPTON: ACQUISITION AND DOWNLOAD
After downloading the data files in the site folder, you can manage them offline. Opton offers some useful tools for offline management and presentation:
•Plot. View the selected channels’ plot, in up to 3 graph groups. Also, select specific measurements (current, power factor, etc) for each channel. View values at a specific moment with the channel units.Refer to the corresponding screen shot in Chapter 17. •Data File Processing. Check the integrity of a folder’s files, ie check for missing or duplicate records or if the interval is the same for all files.•Statistics. Statistics of the file’s data can appear per hour, per day, per month and per year. Statistics include be the average values of the data (within the hour, day, month or year), the max, min or sdv values, or sum of all values. The sum of an energy channel results in the total energy of the entire file. Statistics are presented via a bar graph or a dot plot.Refer to the corresponding screen shot in Chapter 17.•Export to Excel/.CSV/.TAB file. Export a file’s data to an Excel, a comma delimited or a tab delimited file.
15. OPTON: OFFLINE DATA MANAGEMENT
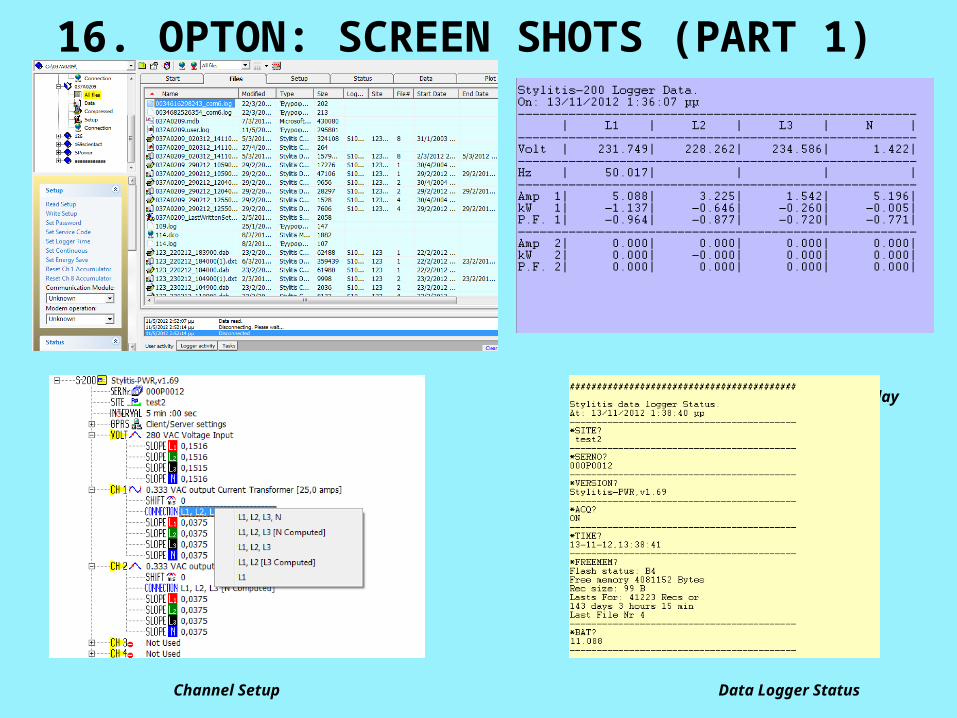
16. OPTON: SCREEN SHOTS (PART 1)
Site folders and files interface Instant data display
Channel Setup Data Logger Status
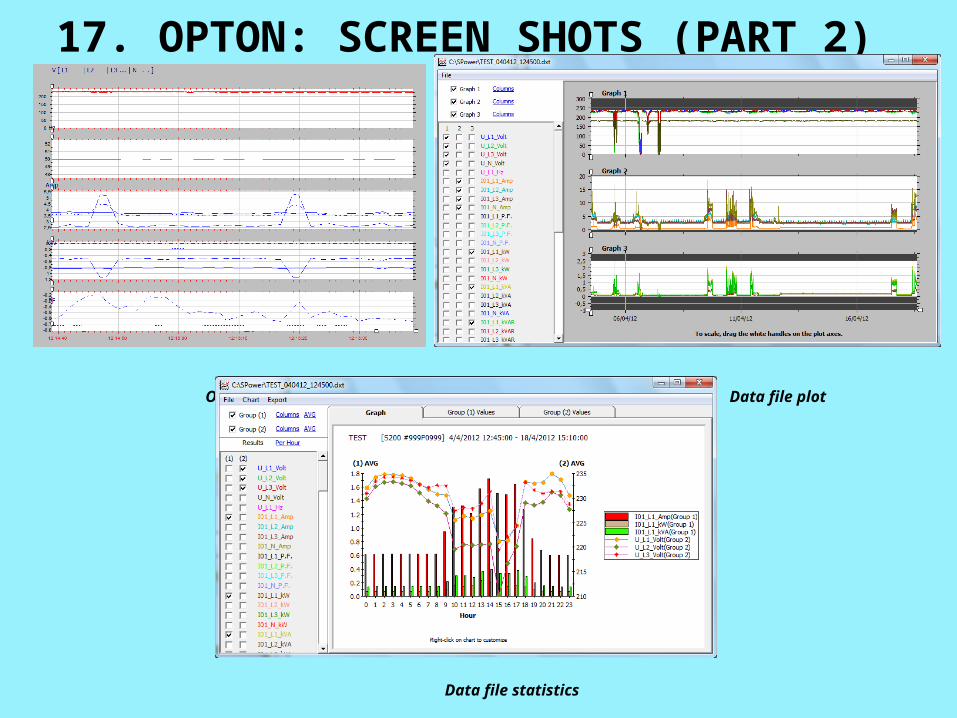
17. OPTON: SCREEN SHOTS (PART 2)
Online plot Data file plot
Data file statistics
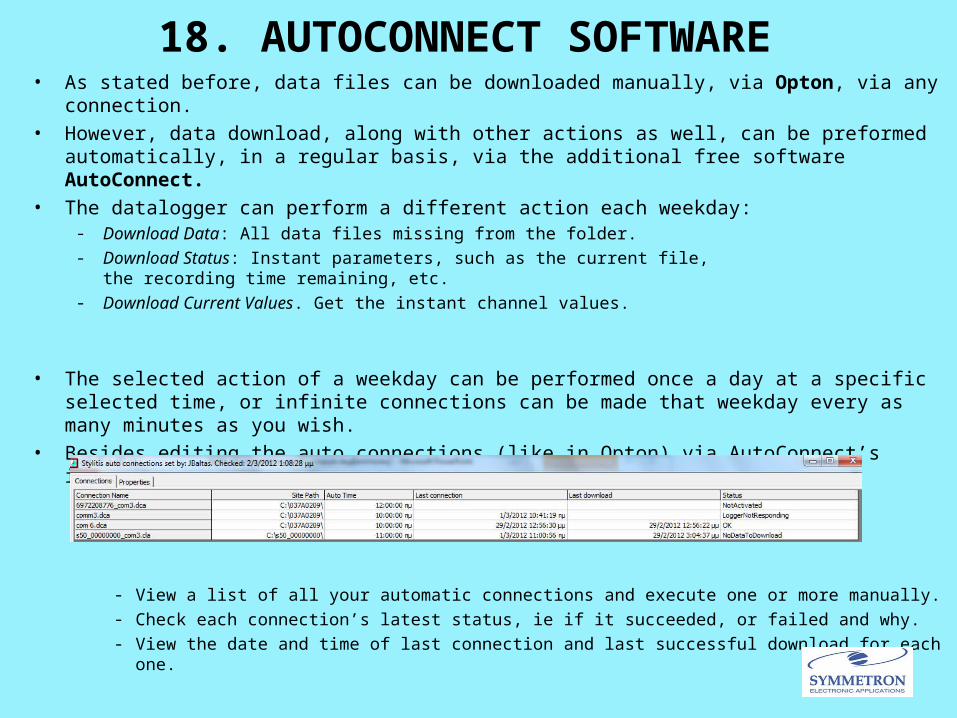
18. AUTOCONNECT SOFTWARE• As stated before, data files can be downloaded manually, via Opton, via any connection. • However, data download, along with other actions as well, can be preformed automatically, in a
regular basis, via the additional free software AutoConnect.• The datalogger can perform a different action each weekday:
- Download Data: All data files missing from the folder.- Download Status: Instant parameters, such as the current file,
the recording time remaining, etc.- Download Current Values. Get the instant channel values.
• The selected action of a weekday can be performed once a day at a specific selected time, or infinite connections can be made that weekday every as many minutes as you wish.
• Besides editing the auto connections (like in Opton) via AutoConnect’s interface, you can:
- View a list of all your automatic connections and execute one or more manually.- Check each connection’s latest status, ie if it succeeded, or failed and why.- View the date and time of last connection and last successful download for each one.

19. MAIN APPLICATIONS AND CONCLUSIONStylitis-Power could be used in:
•Electric bill cost management in hotels, factories, etc professional spaces. Isolate your consumptions and detect your intensive loads.•Green building certification. •Machine operation scheduling in factory. •Monitoring of substations network.
…and many more
Summing up, its main advantages are:
•Energy/ power analysis of 40 independent lines or 10 3-phase ones.•CTs are the only additional accessories needed. Save CTs by selecting the neutral’s or the 3rd phase’s current to be computed.•Variety of communication methods.•Standard Ethernet port included for remote communication and installation to your LAN.•Free operating and automatic connection software.•Portability.
about Symmetron
Our company was founded in 1989 by experienced engineers and evolved as a major manufacturer of dataloggers and supplier of measurement equipment. Symmetron is certified according to the ISO9001 quality system and we are proud to have deployed thousands of measurement systems worldwide.
Address 1, Antikythiron Street
153 44 Gerakas Greece
tel: +30-210-6034002fax: +30-210-6034003
email: [email protected]


![Bulwer-Lytton Vril, The Power of the Coming Race€¦ · CHAPTER I Sacred Texts Atlantis Index Next Vril, The Power of the Coming Race by Sir Edward Bulwer-Lytton [1871] CHAPTER I](https://img.pdfslide.us/doc/110x75/60ae175913b1bb6c1a59d1f7/bulwer-lytton-vril-the-power-of-the-coming-chapter-i-sacred-texts-atlantis-index.jpg)