Embed Size (px)
Citation preview

Advanced Automotive Fault Diagnosis

This page intentionally left blank
Advanced Automotive Fault Diagnosis
Second edition
Tom Denton BA, MSAE, MIRTE, Cert. Ed.Associate Lecturer, Open University, UK
AMSTERDAM • BOSTON • HEIDELBERG • LONDON • OXFORD • NEW YORK
PARIS • SAN DIEGO • SAN FRANCISCO • SINGAPORE • SYDNEY • TOKYO
Butterworth-Heinemann is an imprint of Elsevier

Elsevier Butterworth-HeinemannLinacre House, Jordan Hill, Oxford OX2 8DP, UK30 Corporate Drive, Suite 400, Burlington MA 01803, USA
First published 2000Reprinted 2002, 2003, 2004Second edition 2006
Copyright © 2006, Tom Denton. Published by Elsevier Ltd. All rights reserved.
The right of Tom Denton to be identified as the author of this work has been asserted in accordance with the Copyright, Designs and Patents Act 1988
No part of this publication may be reproduced, stored in a retrieval system or transmitted in any form or by any means electronic, mechanical, photocopying, recording or otherwise without the prior written permission of the publisher
Permission may be sought directly from Elsevier’s Science & Technology Rights Department in Oxford,UK: phone (44) (0) 1865 843830; fax (44) (0) 1865 853333; email: [email protected] you can submit your request online by visiting the Elsevier web site at http://elsevier.com/locate/permissions, and selecting Obtaining permission to use Elsevier material
NoticeNo responsibility is assumed by the publisher for any injury and/or damage to persons or property as a matter of products liability, negligence or otherwise, or from any use or operation of any methods,products, instructions or ideas contained in the material herein. Because of rapid advances in the medical sciences, in particular, independent verification of diagnoses and drug dosages should be made
British Library Cataloguing in Publication DataA catalogue record for this book is available from the British Library
Library of Congress Cataloging-in-Publication DataA catalog record for this book is available from the Library of Congress
ISBN-13: 978-0-75-066991-7ISBN-10: 0-75-066991-8
Typeset by Charon Tec Ltd, Chennai, Indiawww.charontec.comPrinted and bound in the United Kingdom
06 07 08 09 10 9 8 7 6 5 4 3 2 1
For information on all Butterworth-Heinemann publications visit our website at www.books.elsevier.com

Contents
Preface ix
Introduction to the second edition xi
Acknowledgments xiii
Glossary xv
1 Introduction 1
1.1 ‘If it ain’t broke, don’t fix it!’ 11.2 Safe working practices 11.3 Terminology 21.4 Report writing 3
2 Diagnostic techniques 6
2.1 Introduction 62.2 Diagnostic process 62.3 Diagnostics on paper 82.4 Mechanical diagnostic techniques 92.5 Electrical diagnostic techniques 122.6 Fault codes 172.7 Systems 182.8 On- and off-board diagnostics 202.9 Data sources 21
3 Tools and equipment 25
3.1 Basic equipment 253.2 Oscilloscopes 283.3 Scanners/fault code readers 303.4 Engine analysers 32
4 Oscilloscope diagnostics 40
4.1 Introduction 404.2 Sensors 404.3 Actuators 494.4 Ignition system 544.5 Other components 584.6 Summary 60
5 On-board diagnostics 61
5.1 On-board diagnostics – a first perspective 615.2 What is on-board diagnostics? 635.3 Petrol/gasoline on-board diagnostic monitors 665.4 On-board diagnostics – a second perspective 745.5 Summary 84
6 Sensors and actuators 86
6.1 Introduction 866.2 Sensors 866.3 Actuators 94

vi Contents
7 Engine systems 98
7.1 Introduction 987.2 Engine operation 987.3 Diagnostics – engines 1017.4 Fuel system 1037.5 Diagnostics – fuel system 1067.6 Introduction to engine management 1087.7 Ignition 1087.8 Diagnostic – ignition systems 1167.9 Emissions 1207.10 Diagnostics – emissions 1227.11 Fuel injection 1227.12 Diagnostics – fuel injection systems 1267.13 Diesel injection 1277.14 Diagnostics – diesel injection systems 1307.15 Engine management 1327.16 Diagnostics – combined injection and fuel control systems 1387.17 Engine management and faultfinding information 1437.18 Air supply and exhaust systems 1447.19 Diagnostics – exhaust and air supply 1477.20 Cooling 1487.21 Diagnostics – cooling 1507.22 Lubrication 1517.23 Diagnostics – lubrication 1537.24 Batteries 1557.25 Diagnosing battery faults 1567.26 Starting 1597.27 Diagnosing starting system faults 1637.28 Charging 1637.29 Diagnosing charging system faults 167
8 Chassis systems 169
8.1 Brakes 1698.2 Diagnostics – brakes 1728.3 Anti-lock brakes 1748.4 Diagnostics – anti-lock brakes 1778.5 Traction control 1788.6 Diagnostics – traction control 1808.7 Steering and tyres 1818.8 Diagnostics – steering and tyres 1868.9 Suspension 1908.10 Diagnostics – suspension 195
9 Electrical systems 197
9.1 Electronic components and circuits 1979.2 Multiplexing 2009.3 Lighting 2039.4 Diagnosing lighting system faults 2079.5 Auxiliaries 2099.6 Diagnosing auxiliary system faults 2149.7 In car entertainment (ICE) security and communications 2169.8 Diagnosing ICE, security and communication system faults 2199.9 Body electrical systems 2219.10 Diagnosing body electrical system faults 2259.11 Instrumentation 2269.12 Diagnosing instruments system faults 230

9.13 Heating, ventilation and air conditioning (HVAC) 2319.14 Diagnostics – HVAC 2379.15 Cruise control 2399.16 Diagnostics – cruise control 2409.17 Air bags and belt tensioners 2419.18 Diagnostics – air bags and belt tensioners 244
10 Transmission systems 247
10.1 Manual transmission 24710.2 Diagnostics – manual transmission 25110.3 Automatic transmission 25310.4 Diagnostics – automatic transmission 256
11 Conclusion, web resources and developments 260
11.1 Introduction 26011.2 Web contacts 26011.3 Future developments in diagnostic systems 26211.4 Software 26311.5 Summary 265
Index 267
Contents vii

This page intentionally left blank

Preface
The aspect I still enjoy most about working onvehicles is being able to diagnose a fault that hasbeaten others! This skill takes a few years todevelop but it is worth the effort. Diagnostic workis much like that of a detective solving a difficultcrime, all the clues are usually there – if you knowwhere to look. I think it was Sherlock Holmes (afictional detective if you have never heard ofhim!) who said:
When you have eliminated all which is
impossible, then whatever remains, however
improbable, must be the truth.
This is a great thought for a diagnostic technicianto keep in mind.
To help you learn ‘where to look’ for the cluesand to eliminate the impossible, this book com-bines some aspects of automotive technology cov-ered in my other books. However, it goes muchfurther with a new approach to the art of diag-nostics as a science.
The skills needed to be a good diagnostictechnician are many and varied. For one job you
may need to listen to a rumbling noise as the carcorners, for another you may need to interpret anoscilloscope waveform or a diagnostic troublecode.
Vehicles continue to become more complicated,particularly in the area of electronics. The needfor technicians with good diagnostic skills there-fore remains. This could be you and you shouldbe paid well!
Look on the bright side of having complicatedtechnology on vehicles – fewer ‘home mechanics’and more work for you and me!
Tom Denton2006
PS. Comments and contributions are welcome atmy web site: www.automotive-technology.co.uk.You will also find lots of useful information,updates, news and details about my other booksas well as automotive training software and weblinks.

This page intentionally left blank

Introduction to the second edition
The book has grown! But then it was always goingto, because the complexity of automotive systemshas grown and the associated diagnostic skillsmust follow.
The main change for this edition is that I haveincluded two completely new chapters. The firstis all about on-board diagnostics (OBD) and thesecond covers oscilloscope diagnostics in somedetail. Both of these subjects are very relevant toall aspects of the automotive repair trade, light orheavy vehicle.
I have tried wherever possible to make the con-tent relevant to all types of vehicle whether usedin the UK, USA or anywhere else in the world.After all, most vehicles have an engine that makesthe wheels go round – even if the steering wheelchanges sides…
There has been a significant rationalisation ofmotor vehicle qualifications in the UK since thefirst edition. The result is that this book hasbecome even more appropriate because of thehigher technical content. The order of the materialhas been changed a bit so that it lines up morewith current qualifications. For example, engine
management and all engine electrics (batteries,etc.) are now part of the Engines chapter.
The book is ideal for all MV qualifications, inparticular:
City & Guilds 4101 Technical Certificates andNVQs
IMI Technical Certificates and NVQs Level 4 diagnostic units BTEC/Edexcel National and Higher National
qualifications International MV qualifications such as C&G
3905 ASE certification in the US Supplementary reading for MV degree level
course.
Of course, you may already be qualified and justneed a few pointers!
You may also simply want to learn more abouthow your car works – and how to fix it when itdoesn’t!
I hope you enjoy this book, but most of all I hopeit helps you to become a better diagnostic techni-cian – something you should be very proud to be.

This page intentionally left blank

Acknowledgments
I am very grateful to the following companieswho have supplied information and/or permis-sion to reproduce photographs and/or diagrams:
AA Photo LibraryAutodataAutologic Data SystemsBMW UKBosch Press PhotosEberspaecher GmbHFord Motor CompanyGenRadHella UKInstitute of Road Transport EngineersJaguar CarsKavlico CorpLucas ServiceLucasVarityMazda Cars UKNGK Spark Plugs UKPioneer RadioRenault UKRicardo
Robert Bosch GmbHRobert Bosch UKRoverSaab UKScandmec UKSnap-on ToolsSun Electric UKSykes-PickavantValeo UKZF Servomatic
Many if not all the companies here have goodweb pages. You will find a link to them from mysite. Thanks again to the listed companies. If Ihave used any information or mentioned a com-pany name that is not noted here, please acceptmy apologies and acknowledgments.
An extra thanks to Dave Rogers (AVL) andAlan Malby (Ford Motor Company) for theirkind assistance with the OBD chapter.
Also, if I forget to mention my family: Vanda,Malcolm and Beth, I will be in trouble…

This page intentionally left blank
Glossary
Authors Note: To keep the glossary to a reason-able size, I decided to limit the entries to usefulacronyms that are specified by the society of automo-tive engineers (SAE) and on-board diagnostic versiontwo (OBD2) recommendations. I have provided freeaccess to online glossaries (UK, US and Spanish) thatinclude several thousand words.www.automotive-technology.co.uk
Two key words never to forget:
Symptom(s): What the user/operator/repairerof the system (vehicle or what-ever) notices
Fault: An error in the system thatcauses symptom(s)
OBD2/SAE acronyms
ABS: antilock brake systemA/C: air conditioningAC: air cleanerAIR: secondary air injectionA/T: automatic transmission or
transaxleAP: accelerator pedalB: battery positive voltageBARO: barometric pressureCAC: charge air coolerCFI: continuous fuel injectionCL: closed loopCKP: crankshaft position sensorCKP REF: crankshaft referenceCMP: camshaft position sensorCMP REF: camshaft referenceCO: carbon monoxideCO2: carbon dioxideCPP: clutch pedal positionCTOX: continuous trap oxidizerCTP: closed throttle positionDEPS: digital engine position sensorDFCO: deceleration fuel cut-off modeDFI: direct fuel injectionDLC: data link connectorDTC: diagnostic trouble codeDTM: diagnostic test modeEBCM: electronic brake control
moduleEBTCM: electronic brake traction
control module
EC: engine controlECL: engine coolant levelECM: engine control moduleECT: engine coolant temperatureEEPROM: electrically erasable program-
mable read only memoryEFE: early fuel evaporationEGR: exhaust gas recirculationEGRT: EGR temperatureEI: electronic ignitionEM: engine modificationEPROM: erasable programmable read
only memoryEVAP: evaporative emission systemFC: fan controlFEEPROM: flash electrically erasable pro-
grammable read only memoryFF: flexible fuelFP: fuel pumpFPROM: flash erasable programmable
read only memoryFT: fuel trimFTP: federal test procedureGCM: governor control moduleGEN: generatorGND: groundH2O: waterHC: hydrocarbonHO2S: heated oxygen sensorHO2S1: upstream heated oxygen sensorHO2S2: up or downstream heated
oxygen sensorHO2S3: downstream heated oxygen
sensorHVS: high voltage switchHVAC: heating ventilation and air con-
ditioning systemIA: intake airIAC: idle air controlIAT: intake air temperatureIC: ignition control circuitICM: ignition control moduleIFI: indirect fuel injectionIFS: inertia fuel shutoffI/M: inspection/maintenanceIPC: instrument panel clusterISC: idle speed control
KOEC: key on, engine crankingKOEO: key on, engine offKOER: key on, engine runningKS: knock sensorKSM: knock sensor moduleLT: long term fuel trimMAF: mass airflow sensorMAP: manifold absolute pressure
sensorMC: mixture controlMDP: manifold differential pressureMFI: multi-port fuel injectionMIL: malfunction indicator lampMPH: miles per hourMST: manifold surface temperatureMVZ: manifold vacuum zoneNOX: oxides of nitrogenNVRAM: non-volatile random access
memoryO2S: oxygen sensorOBD: on-board diagnosticsOBD I: on-board diagnostics generation
oneOBD II: on-board diagnostics, second
generationOC: oxidation catalystODM: output device monitorOL: open loopOSC: oxygen sensor storagePAIR: pulsed secondary air injectionPCM: powertrain control modulePCV: positive crankcase ventilationPNP: park/neutral switchPROM: program read only memoryPSA: pressure switch assembly
PSP: power steering pressurePTOX: periodic trap oxidizerRAM: random access memoryRM: relay moduleROM: read only memoryRPM: revolutions per minuteSC: superchargerSCB: supercharger bypassSDM: sensing diagnostic modeSFI: sequential fuel injectionSRI: service reminder indicatorSRT: system readiness testST: short term fuel trimTB: throttle bodyTBI: throttle body injectionTC: turbochargerTCC: torque converter clutchTCM: transmission or transaxle con-
trol moduleTFP: throttle fluid pressureTP: throttle positionTPS: throttle position sensorTVV: thermal vacuum valveTWC: three way catalystTWC OC: three way oxidation catalytic
converterVAF: volume airflowVCM: vehicle control moduleVR: voltage regulatorVS: vehicle sensorVSS: vehicle speed sensorWOT: wide open throttleWU-TWC: warm up three way catalytic
converter
xvi Glossary
1.1 ‘If it ain’t broke, don’tfix it!’
1.1.1 What is needed to find
faults?
Finding the problem when complex automotivesystems go wrong is easy, if you have the neces-sary knowledge. This knowledge is in two parts:
understanding of the system in which theproblem exists;
the ability to apply a logical diagnostic routine.
It is also important to be clear about two defini-tions:
symptom(s) what the user/operator/repairerof the system (vehicle or whatever) notices;
fault the error in the system that causes thesymptom(s).
‘If it is not broken then do not go to the troubleof repairing it,’ is the translation of this main sec-tion heading! It’s a fair comment but if a system isnot operating to its optimum then it should berepaired. This is where the skills come in to play.It is necessary to recognise that something is notoperating correctly by applying your knowledgeof the system, and then by applying this know-ledge further and combining it with the skills ofdiagnostics, to be able to find out why.
Each main chapter of this book includes abasic explanation of the vehicle system followedby diagnostic techniques that are particularlyappropriate for that area. Examples of fault-finding charts are also included. In the main, ref-erences will be to generic systems rather than tospecific vehicles or marques. For specific detailsabout a particular vehicle or system the manufac-turer’s information is the main source. Alterna-tively ‘Autodata’ produce a fine range of books;visit www.autodata.com for more details.
The knowledge requirement and the necessityfor diagnostic skills are further illustrated in thenext chapter.
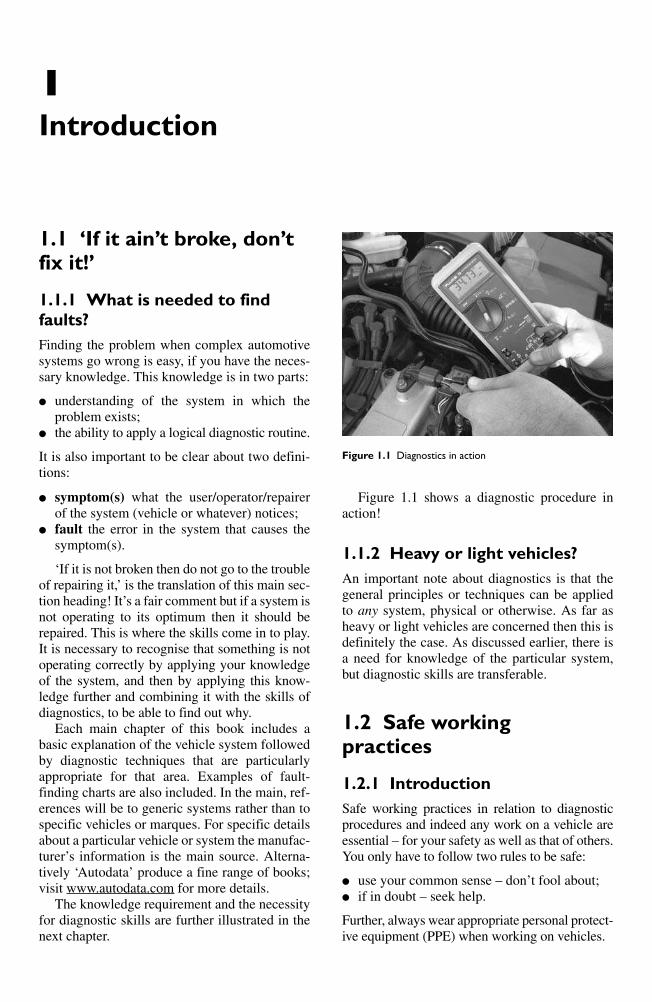
Figure 1.1 shows a diagnostic procedure inaction!
1.1.2 Heavy or light vehicles?
An important note about diagnostics is that thegeneral principles or techniques can be appliedto any system, physical or otherwise. As far asheavy or light vehicles are concerned then this isdefinitely the case. As discussed earlier, there isa need for knowledge of the particular system,but diagnostic skills are transferable.
1.2 Safe working practices
1.2.1 Introduction
Safe working practices in relation to diagnosticprocedures and indeed any work on a vehicle areessential – for your safety as well as that of others.You only have to follow two rules to be safe:
use your common sense – don’t fool about; if in doubt – seek help.
Further, always wear appropriate personal protect-ive equipment (PPE) when working on vehicles.
1
Introduction
Figure 1.1 Diagnostics in action
The following section lists some particularrisks when working with electricity or electricalsystems, together with suggestions for reducingthem. This is known as risk assessment.
1.2.2 Risk assessment and
reduction
The following table notes some identified risksinvolved with working on vehicles. It is by nomeans exhaustive but serves as a good guide.
Identified risk Reducing the risk
Battery acid Sulphuric acid is corrosive so always use good
PPE – in this case overalls and if necessary
rubber gloves. A rubber apron is ideal, as are
goggles if working with batteries a lot
Electric shock Ignition HT (high tension, which simply means
high voltage) is the most likely place to suffer a
shock, up to 25 000V is quite normal. Use
insulated tools if it is necessary to work on HT
circuits with the engine running. Note that high
voltages are also present on circuits containing
windings due to back emf (electromotive force)
as they are switched off; a few hundred volts is
common. Mains supplied power tools and their
leads should be in good condition and using an
earth leakage trip is highly recommended
Exhaust gases Suitable extraction must be used if the engine
is running indoors. Remember it is not just
the carbon monoxide (CO) that might make
you ill or even kill you, other exhaust compon-
ents could cause asthma or even cancer
Fire Do not smoke when working on a vehicle.
Fuel leaks must be attended to immediately.
Remember the triangle of fire – (heat/fuel/
oxygen) – don’t let the three sides come
together
Moving loads Only lift what is comfortable for you; ask for
help if necessary and/or use lifting equipment.
As a general guide, do not lift on your own if
it feels too heavy!
Raising or Apply brakes and/or chock the wheels and
lifting vehicles when raising a vehicle on a jack or drive on
lift. Only jack under substantial chassis and
suspension structures. Use axle stands in case
the jack fails
Running Do not wear loose clothing; good overalls
engines are ideal. Keep the keys in your possession
when working on an engine to prevent others
starting it. Take extra care if working near
running drive belts
Short circuits Use a jump lead with an in-line fuse to prevent
damage due to a short when testing.
Disconnect the battery (earth lead off first and
back on last) if any danger of a short exists. A
very high current can flow from a vehicle bat-
tery, it will burn you as well as the vehicle
Skin problems Use a good barrier cream and/or latex gloves.
Wash skin and clothes regularly
1.3 Terminology
1.3.1 Introduction
The terminology included in the following tablesis provided to ensure that we are talking the samelanguage. These tables are provided just as asimple reference source.
1.3.2 Diagnostic terminology
Symptom The effect of a fault noticed by the driver, user
or technician
Fault The root cause of a symptom/problem
Diagnostics The process of tracing a fault by means of its
symptoms, applying knowledge and analysing
test results
Knowledge The understanding of a system that is required
to diagnose faults
Logical A step by step method used to ensure nothing
procedure is missed
Report A standard format for the presentation of
results
1.3.3 General terminology
System A collection of components that carry out a
function
Efficiency This is a simple measure of any system. It can
be scientific for example if the power out
of a system is less then the power put in, its
percentage efficiency can be determined
(Pout/Pin 100%). This could, for example, be
given as 80%. In a less scientific example, a
vehicle using more fuel than normal is said to
be inefficient
Noise Emanation of sound from a system that is
either simply unwanted or is not the normal
sound that should be produced
Active Any system that is in operation all the time
(steering for example)
Passive A system that waits for an event before it is
activated (an air bag is a good example)
Short circuit An electrical conductor is touching something
that it should not be (usually another con-
ductor or the chassis)
Open circuit A circuit that is broken (a switched off switch
is an open circuit)
High In relation to electricity, this is part of a
resistance circuit that has become more difficult for the
electricity to get through. In a mechanical
system a partially blocked pipe would have
a resistance to the flow of fluid
Worn This word works better with further additions
such as: worn to excess, worn out of toler-
ance, or even, worn, but still within tolerance!
2 Advanced automotive fault diagnosis
Quote To make an estimate of or give exact informa-
tion on the price of a part or service. A quota-
tion may often be considered to be legally
binding
Estimate A statement of the expected cost of a certain
job (e.g. a service or repairs) An estimate is
normally a best guess and is not legally binding
Dodgy, Words often used to describe a system or
knackered or component, but they mean nothing! Get used
@#%&*! to describing things so that misunderstandings
are eliminated
1.4 Report writing
1.4.1 Introduction
As technicians you may be called on to producea report for a customer. Also, if you are involvedin research of some kind it is important to be ableto present results in a professional way. The fol-lowing sections describe the main headings that areport will often need to contain together with anexample report based on the performance testingof a vehicle alternator.
Laying out results in a standard format is thebest way to ensure that all the important andrequired aspects of the test have been covered.Keep in mind that the report should conveyclearly to another person what has been done.Further, a ‘qualified’ person should be able toextract enough information to be able to repeatthe test – and check your findings! Use clear sim-ple language remembering that in some cases theintended audience may not be as technicallycompetent as you are.
1.4.2 Main headings of a
report
The following suggestions for the headings of aprofessional report will cover most requirementsbut can of course be added to or subtracted fromif necessary. After each heading I have includedbrief notes on what should be included.
Contents
If the report is more than about five pages, a listof contents with page numbers will help thereader find his/her way through it.
Introduction
Explain the purpose of what has been done andset the general scene.
Test criteria
Define the limits within which the test was car-ried out. For example, temperature range or speedsettings.
Facilities/resources
State or describe what equipment was used. Forexample: ‘A “Revitup” engine dynamometer,model number C3PO was used for the consump-tion test’.
Test procedures
Explain here exactly what was done to gain theresults. In this part of the report it is very import-ant not to leave out any details.
Measured results
Present the results in a way that is easy to inter-pret. A simple table of figures may be appropriate.If the trend of the results or a comparison is import-ant, a graph may be better. Pictures of results oroscilloscope waveforms may be needed. If neces-sary a very complex table of results from whichyou draw out a few key figures, could be presentedas an appendix. You should also note the accuracyof any figures presented (0.5% for example).
Analysis of results
This is the part where you should comment onthe results obtained. For example, if say a fuelconsumption test was carried out on two vehicles,a graph comparing one result to the other may beappropriate. Comments should be added if nec-essary, such as any anomaly that could haveaffected the results (change of wind direction forexample).
Conclusions/comments/
observations
Note here any further tests that may be necessary.Conclude that device X does perform better thandevice Y – if it did! If appropriate, add observa-tions such as how device Y performed betterunder the set conditions, but under other circum-stances the results could have been different.Comment on the method used if necessary.
Forecast
If necessary comment on how the ‘item’ testedwill continue to perform based on the exist-ing data.
Introduction 3
Appendices
Detailed pages of results that would ‘clog up’ themain report or background material such asleaflets relating to the test equipment.
1.4.3 Example report
An example report is presented here relating to asimple alternator test where its actual output is tobe compared to the rated output. Minimal detailsare included so as to illustrate the main points.
Introduction
A ‘Rotato’ 12 V alternator was tested under nor-mal operating conditions to check its maximumoutput. The manufacturer’s specifications statedthat the alternator, when hot, should produce 95 Aat 6000 rev/min.
Test criteria
Start at room temperature. Run alternator at 3000 rev/min, 30 A output
for 10 minutes. Run alternator at 6000 rev/min, maximum
output. Check reading every 30 seconds for 10minutes.
Run alternator at 6000 rev/min, maximum out-put for a further 20 minutes to ensure that out-put reading is stable.
Facilities/resources
A ‘Krypton’ test bench model R2D2 was used todrive the alternator. The test bench revcounterwas used and a ‘Flake’ digital meter fitted with a200 A shunt was used to measure the output. Avariable resistance load was employed.
Test procedures
The alternator was run for 10 minutes at3000 rev/min and the load adjusted to cause anoutput of 30 A. This was to ensure that it was at anominal operating temperature. The normal fanwas kept in place during the test.
Speed was then increased to 6000 rev/min and the load adjusted to achieve the maximumpossible output. The load was further adjusted asrequired to keep the maximum possible output incase the load resistance changed due to tempera-ture. Measurements were taken every 30 secondsfor a period of 10 minutes.
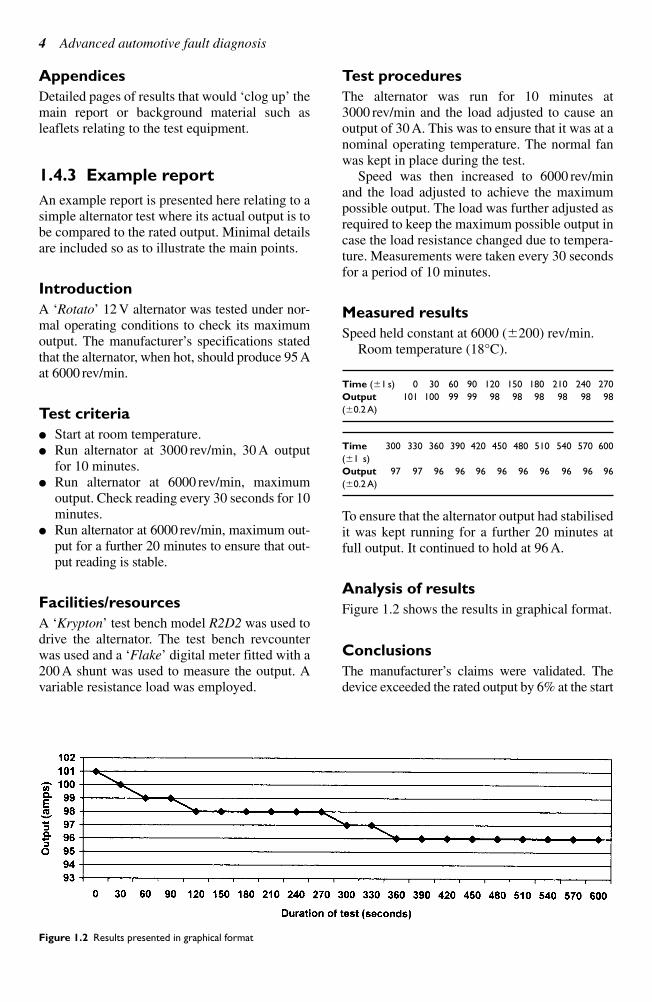
Measured results
Speed held constant at 6000 (200) rev/min.Room temperature (18°C).
Time (1 s) 0 30 60 90 120 150 180 210 240 270
Output 101 100 99 99 98 98 98 98 98 98
(0.2 A)
Time 300 330 360 390 420 450 480 510 540 570 600
(1 s)
Output 97 97 96 96 96 96 96 96 96 96 96
(0.2 A)
To ensure that the alternator output had stabilisedit was kept running for a further 20 minutes atfull output. It continued to hold at 96 A.
Analysis of results
Figure 1.2 shows the results in graphical format.
Conclusions
The manufacturer’s claims were validated. Thedevice exceeded the rated output by 6% at the start
4 Advanced automotive fault diagnosis
Figure 1.2 Results presented in graphical format

of the test and under continuous operation at fullload, continued to exceed the rated output by 1%.
The maximum duration of this test was 20 min-utes. It is possible, however, that the device wouldincrease in temperature and the output may fall
further after prolonged operation. Further tests arenecessary to check this. Overall the device per-formed in excess of its rated output.
(Sign and date the report)Tom Denton, Wednesday, 25th Jan. 2006
Introduction 5
Knowledge check questions
To use these questions, you should first try to answer them without help but if necessary, refer back to
the content of the chapter. Use notes, lists and sketches as appropriate to answer them. It is not neces-
sary to write pages and pages of text!
1. State the meaning of the terms ‘fault’ and ‘symptom’.
2. Explain how to reduce the risk of a short circuit when testing electrical systems.
3. List the main headings that could be used for a standard report.
4. State the two main pieces of knowledge necessary to diagnose faults.
5. Describe the potential dangers of running an engine in an enclosed space without exhaust extraction.
2.1 Introduction
2.1.1 Logic
Diagnostics or faultfinding is a fundamental partof an automotive technician’s work. The subjectof diagnostics does not relate to individual areas ofthe vehicle. If your knowledge of a vehicle sys-tem is at a suitable level, then you will use thesame logical process for diagnosing the fault,whatever the system.
2.1.2 Information
Information and data are available for carryingout many forms of diagnostic work. The datamay come as a book or on CD. This informationis vital and will ensure that you find the fault –particularly if you have developed the diagnosticskills to go with it. Faultfinding charts and spe-cific examples are presented in later chapters.
The general type of information available is asfollows:
engine diagnostics, testing and tuning; servicing, repairs and times; fuel and ignition systems and carburettor; auto electrics; ABS diagnostics; component location; body repairs, tracking and tyres.
2.1.3 Where to stop?
This is one of the most difficult skills to learn. Itis also one of the most important. The secret istwofold:
know your own limitations – it is not possibleto be good at everything;
leave systems alone where you could causemore damage or even injury – for example airbag circuits.
Often with the best of intentions, a person new to diagnostics will not only fail to find the fault
but introduce more faults into the system in theprocess.
I would suggest you learn your own strengthsand weaknesses; you may be confident and goodat dealing with mechanical system problems butless so when electronics is involved. Of courseyou may be just the opposite of this.
Remember that diagnostic skill is in two parts – the knowledge of the system and the abil-ity to apply diagnostics. If you do not yet fullyunderstand a system – leave it alone!
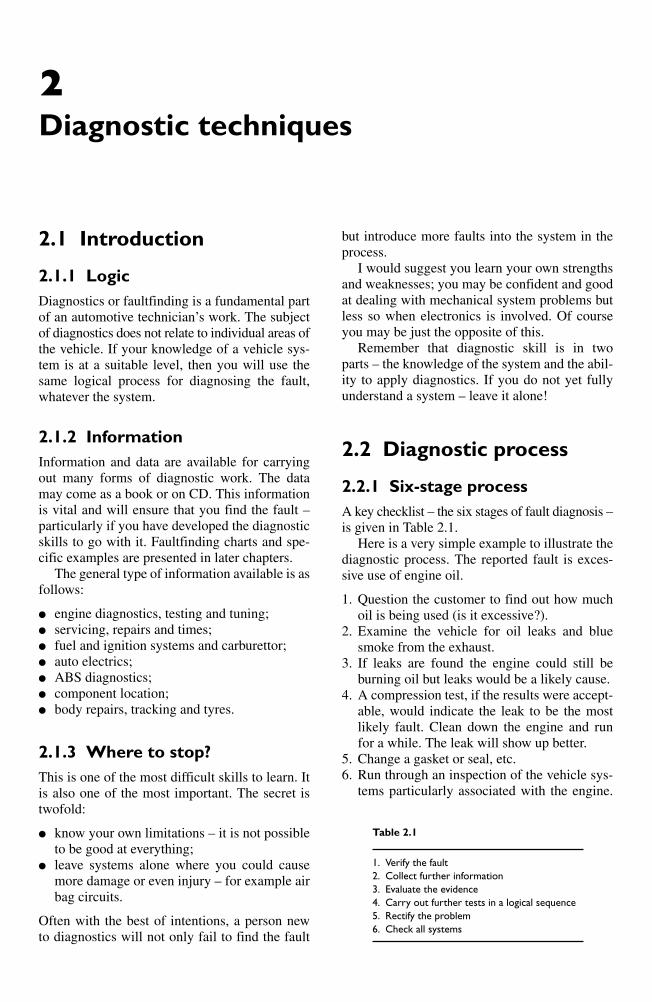
2.2 Diagnostic process
2.2.1 Six-stage process
A key checklist – the six stages of fault diagnosis –is given in Table 2.1.
Here is a very simple example to illustrate thediagnostic process. The reported fault is exces-sive use of engine oil.
1. Question the customer to find out how muchoil is being used (is it excessive?).
2. Examine the vehicle for oil leaks and bluesmoke from the exhaust.
3. If leaks are found the engine could still beburning oil but leaks would be a likely cause.
4. A compression test, if the results were accept-able, would indicate the leak to be the mostlikely fault. Clean down the engine and runfor a while. The leak will show up better.
5. Change a gasket or seal, etc.6. Run through an inspection of the vehicle sys-
tems particularly associated with the engine.
2
Diagnostic techniques
Table 2.1
1. Verify the fault
2. Collect further information
3. Evaluate the evidence
4. Carry out further tests in a logical sequence
5. Rectify the problem
6. Check all systems
Diagnostic techniques 7
Double check the fault has been rectified andthat you have not caused any further problems.
The stages of faultfinding will be used exten-sively to illustrate how a logical process can beapplied to any situation.
2.2.2 The art of diagnostics
The knowledge needed for accurate diagnosticsis in two parts:
1. understanding of the system in which theproblem exists;
2. having the ability to apply a logical diagnosticroutine.
The knowledge requirement and use of diagnosticskills can now be illustrated with a very simpleexample. After connecting a hose pipe and turningon the tap, no water comes out of the end! Yourknowledge of this system tells you that watershould come out providing the tap is on, becausethe pressure from a tap pushes water through thepipe, and so on. This is where your diagnosticskills become essential. The following stages arenow required.
1. Confirm that no water is coming out by look-ing down the end of the pipe!
2. Does water come out of the other taps, or didit come out of this tap before you connectedthe hose?
3. Consider what this information tells you; forexample, if the answer is ‘Yes’ the hose mustbe blocked or kinked.
4. Walk the length of the pipe looking for a kink.5. Straighten out the hose.6. Check that water now comes out and that no
other problems have been created.
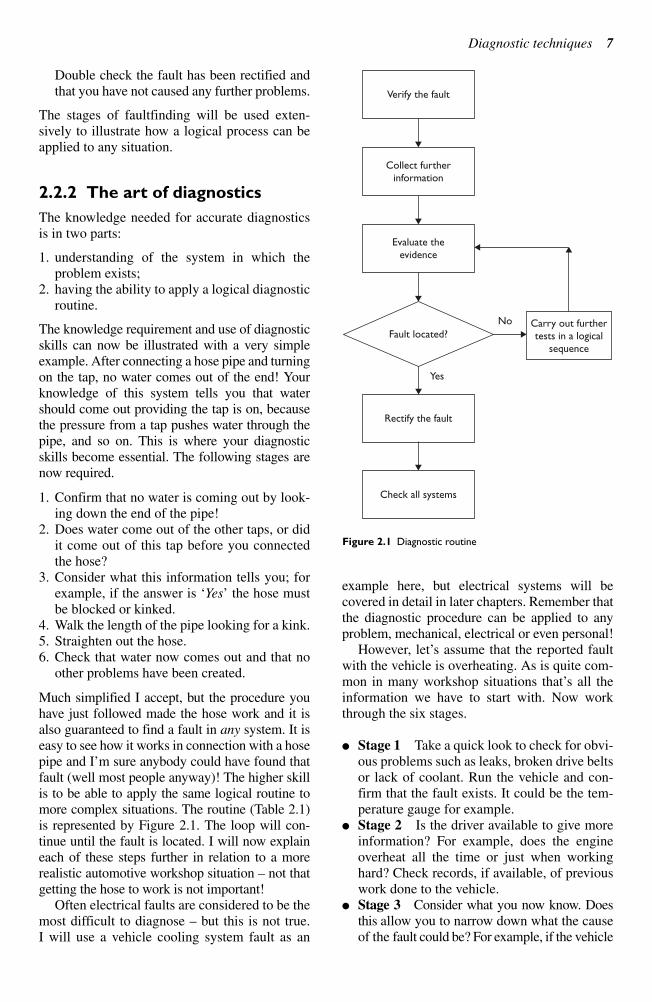
Much simplified I accept, but the procedure youhave just followed made the hose work and it isalso guaranteed to find a fault in any system. It iseasy to see how it works in connection with a hosepipe and I’m sure anybody could have found thatfault (well most people anyway)! The higher skillis to be able to apply the same logical routine tomore complex situations. The routine (Table 2.1)is represented by Figure 2.1. The loop will con-tinue until the fault is located. I will now explaineach of these steps further in relation to a morerealistic automotive workshop situation – not thatgetting the hose to work is not important!
Often electrical faults are considered to be themost difficult to diagnose – but this is not true. I will use a vehicle cooling system fault as an
example here, but electrical systems will be covered in detail in later chapters. Remember thatthe diagnostic procedure can be applied to anyproblem, mechanical, electrical or even personal!
However, let’s assume that the reported faultwith the vehicle is overheating. As is quite com-mon in many workshop situations that’s all theinformation we have to start with. Now workthrough the six stages.
Stage 1 Take a quick look to check for obvi-ous problems such as leaks, broken drive beltsor lack of coolant. Run the vehicle and con-firm that the fault exists. It could be the tem-perature gauge for example.
Stage 2 Is the driver available to give moreinformation? For example, does the engineoverheat all the time or just when workinghard? Check records, if available, of previouswork done to the vehicle.
Stage 3 Consider what you now know. Doesthis allow you to narrow down what the causeof the fault could be? For example, if the vehicle
Verify the fault
Collect furtherinformation
Evaluate theevidence
No Carry out furthertests in a logical
sequence
Yes
Rectify the fault
Check all systems
Fault located?
Figure 2.1 Diagnostic routine
8 Advanced automotive fault diagnosis
overheats all the time and it had recently had a new cylinder head gasket fitted, would yoube suspicious about this? Don’t let two andtwo make five, but do let it act as a pointer.Remember that in the science of logical diag-nostics, two and two always makes four!However, until you know this for certain thenplay the best odds to narrow down the fault.
Stage 4 The further tests carried out wouldnow be directed by your thinking at stage three.You don’t yet know if the fault is a leaking headgasket, the thermostat stuck closed or someother problem. Playing the odds, a cooling sys-tem pressure test would probably be the nexttest. If the pressure increases when the engineis running then it is likely to be a head gasket orsimilar problem. If no pressure increase thenmove on to the next test and so on. After eachtest go back to stage 3 and evaluate what youknow, not what you don’t know!
Stage 5 Let’s assume the problem was athermostat stuck closed – replace it and top upthe coolant, etc.
Stage 6 Check that the system is now work-ing. Also check that you have not caused anyfurther problems such as leaks or loose wires.This example is simplified a little, but like thehose pipe problem it is the sequence that mat-ters, particularly the ‘stop and think’ at stage 3.It is often possible to go directly to the cause ofthe fault at this stage, providing that you have anadequate knowledge of how the system works.
2.2.3 Summary
I have introduced the six-stage process of diag-nostics, not so it should necessarily be used as achecklist but to illustrate the process that must befollowed. Much more detail is required still, par-ticular in relation to stages 3 and 4. The purposeof this set process is to ensure that ‘we’ work in aparticular, logical way.
I would like to stress the need for a logicalprocess again – with a quotation! ‘Logic is the
beginning of wisdom not the end.’ (Spock toValeris, Star Trek II)
2.3 Diagnostics on paper
2.3.1 Introduction
This section is again a way of changing the wayyou approach problems on a vehicle. The keymessage is that if you stop and think before
‘pulling the car to pieces’, it will often save agreat deal of time. In other words, some of thediagnostic work can be done ‘on paper’ beforewe start on the vehicle. To illustrate this, the nextsection lists symptoms for three separate faultson a car and for each of these symptoms, threepossible faults. All the faults are possible but ineach case choose the ‘most likely’ option.
2.3.2 Examples
Symptoms Possible faults
A The brake/stop lights are 1. Two bulbs and 12 LEDs
reported not operating. On blown
checking it is confirmed 2. Auxiliary systems relay
that neither of the two open circuit
bulbs or the row of 3. Brake light switch not
high-mounted LEDs is closing
operating as the pedal is
pressed. All other systems
work correctly
B An engine fitted with full 1. Fuel pump output
management system tends to pressure low
stall when running slowly. 2. Idle control valve sticking
It runs well under all other 3. Engine speed sensor wire
conditions and the reported loose
symptom is found to be
intermittent
C The off side dip beam 1. Two bulbs blown
headlight not operating. This 2. Main lighting fusible link
is confirmed on examination blown
and also noted is that the 3. Short circuit between off
off side tail light does not side tail and dip beam
work lights
The most likely fault for example A, is number 3.It is possible that all the lights have blown butunlikely. It could not be the auxiliary relaybecause this would affect other systems.
For example B, the best answer would be num-ber 2. It is possible that the pump pressure is lowbut this would be more likely to affect operationunder other conditions. A loose wire on the enginespeed sensor could cause the engine to stall but itwould almost certainly cause misfire under otherconditions.
The symptoms in C would suggest answer 1.The short circuit suggested as answer 3 would bemore likely to cause lights and others to stay onrather that not work, equally the chance of a shortbetween these two circuits is remote if not impos-sible. If the lighting fusible link were blown thennone of the lights would operate.
The technique suggested here relates to stages1 to 3 of the ‘the six stages of fault diagnosis’process. By applying a little thought before even
Diagnostic techniques 9
taking a screwdriver to the car, a lot of time canbe saved. If the problems suggested in the previ-ous table were real we would at least now be ableto start looking in the right area for the fault.
2.3.3 How long is a piece of
string?
Yes I know, twice the distance from the middle to one end! What I am really getting at herethough is the issue about what is a valid reading/measurement and what is not – when comparedto data. For example if the ‘data book’ says theresistance of the component should be between60 and 90 , what do you do when the measuredvalue is 55 ? If the measured value was 0 or1000 then the answer is easy – the componentis faulty! However, when the value is very closeyou have to make a decision. In this case (55 ) itis very likely that the component is serviceable.
The decision over this type of issue is difficultand must in many cases be based on experience.As a general guide however, I would suggest thatif the reading is in the right ‘order of magnitude’,then the component has a good chance of beingOK. By this I mean that if the value falls withinthe correct range of 1s, 10s, 100s or 1000s etc. thenit is probably good.
Do notice that I have ensured that words orphrases such as ‘probably’, ‘good chance’ and‘very likely’ have been used here! This is not justto make sure I have a get out clause; it is also toillustrate that diagnostic work can involve ‘playingthe best odds’ – as long as this is within a logicalprocess.
2.4 Mechanical diagnostictechniques
2.4.1 Check the obvious first!
Start all hands on diagnostic routines with ‘handand eye checks’. In other words look over thevehicle for obvious faults. For example, if auto-matic transmission fluid is leaking on to the floorthen put this right before carrying out complicatedstall tests. Here are some further suggestions thatwill at some point save you a lot of time.
If the engine is blowing blue smoke out of theexhaust – consider the worth of tracing thecause of a tapping noise in the engine!
When an engine will not start – check thatthere is fuel in the tank!
2.4.2 Noise, vibration and
harshness
Noise, vibration and harshness (NVH) concernshave become more important as drivers havebecome more sensitive to these issues. Drivershave higher expectations of comfort levels. Noise,vibration and harshness issues are more noticeabledue to reduced engine noise and better insulationin general. The main areas of the vehicle that pro-duce NVH are:
tyres; engine accessories; suspension; driveline.
It is necessary to isolate the NVH into its specificarea(s) to allow more detailed diagnosis. A road test as outlined later is often the bestmethod.
The five most common sources of non-axlenoise are exhaust, tyres, roof racks, trim andmouldings, and transmission. Ensure that none ofthe following conditions is the cause of the noisebefore proceeding with a driveline strip down anddiagnosis.
1. In certain conditions, the pitch of the exhaustmay sound like gear noise or under other con-ditions like a wheel bearing rumble.
2. Tyres can produce a high pitched tread whineor roar, similar to gear noise. This is particu-larly the case for non-standard tyres.
3. Trim and mouldings can cause whistling orwhining noises.
4. Clunk may occur when the throttle is appliedor released due to backlash somewhere in thedriveline.
5. Bearing rumble sounds like marbles beingtumbled.
2.4.3 Noise conditions
Noise is very difficult to describe. However, thefollowing are useful terms and are accompaniedby suggestions as to when they are most likely tooccur.
Gear noise is typically a howling or whiningdue to gear damage or incorrect bearing pre-load. It can occur at various speeds and driv-ing conditions, or it can be continuous.
‘Chuckle’ is a rattling noise that sounds like astick held against the spokes of a spinning bicy-cle wheel. It usually occurs while decelerating.
Knock is very similar to chuckle though itmay be louder and occurs on acceleration ordeceleration.
Check and rule out tyres, exhaust and trim itemsbefore any disassembly to diagnose and correctgear noise.
2.4.4 Vibration conditions
Clicking, popping or grinding noises may benoticeable at low speeds and be caused by thefollowing:
inner or outer CV joints worn (often due tolack of lubrication so check for split gaiters);
loose drive shaft; another component contacting a drive shaft; damaged or incorrectly installed wheel bear-
ing, brake or suspension component.
The following may cause vibration at normalroad speeds:
out-of-balance wheels; out-of-round tyres.
The following may cause shudder or vibrationduring acceleration:
damaged power train/drive train mounts; excessively worn or damaged out-board or
in-board CV joints.
The cause of noise can often be traced by firstlooking for leaks. A dry bearing or joint will pro-duce significant noise.
1. Inspect the CV joint gaiters (boots) for cracks,tears or splits.
2. Inspect the underbody for any indication ofgrease splatter near the front wheel half shaftjoint boots.
3. Inspect the in-board CV joint stub shaft bear-ing housing seal for leakage at the bearinghousing.
4. Check the torque on the front axle wheel hubretainer.
2.4.5 Road test
A vehicle will produce a certain amount of noise!Some noise is acceptable and may be audible atcertain speeds or under various driving condi-tions such as on a new road.
Carry out a thorough visual inspection of thevehicle before carrying out the road test. Keep inmind anything that is unusual. A key point is tonot repair or adjust anything until the road test is
carried out. Of course this does not apply if thecondition could be dangerous or the vehicle willnot start!
Establish a route that will be used for all diag-nosis road tests. This allows you to get to knowwhat is normal and what is not! The roadsselected should have sections that are reasonablysmooth, level and free of undulations as well aslesser quality sections needed to diagnose faultsthat only occur under particular conditions. Aroad that allows driving over a range of speeds isbest. Gravel, dirt or bumpy roads are unsuitablebecause of the additional noise they produce.
If a customer complains of a noise or vibrationon a particular road and only on a particular road,the source of the concern may be the road surface.Test the vehicle on the same type of road.
Make a visual inspection as part of the prelim-inary diagnosis routine prior to the road test; noteanything that does not look right.
1. Tyre pressures, but do not adjust them yet.2. Leaking fluids.3. Loose nuts and bolts.4. Bright spots where components may be rub-
bing against each other.5. Check the luggage compartment for unusual
loads.
Road test the vehicle and define the condition by reproducing it several times during the roadtest. During the road test recreate the followingconditions.
1. Normal driving speeds of 20 to 80 km/h (15
to 50 mph) with light acceleration, a moan-ing noise may be heard and possibly a vibra-tion is felt in the front floor pan. It may getworse at a certain engine speed or load.
2. Acceleration/deceleration with slow accel-eration and deceleration, a shake is sometimesnoticed through the steering wheel seats, frontfloor pan, front door trim panels, etc.
3. High speed a vibration may be felt in thefront floor pan or seats with no visible shake,but with an accompanying sound or rumble,buzz, hum, drone or booming noise. Coast withthe clutch pedal down or gear lever in neutraland engine idling. If vibration is still evident, itmay be related to wheels, tyres, front brakediscs, wheel hubs or wheel bearings.
4. Engine rev/min sensitive a vibration maybe felt whenever the engine reaches a particu-lar speed. It may disappear in neutral coasts.Operating the engine at the problem speedwhile the vehicle is stationary can duplicate
10 Advanced automotive fault diagnosis
Diagnostic techniques 11
the vibration. It can be caused by any compon-ent, from the accessory drive belt to the clutchor torque converter, which turns at enginespeed when the vehicle is stopped.
5. Noise and vibration while turning clicking,popping or grinding noises may be due to thefollowing: damaged CV joint; loose front wheelhalf shaft joint boot clamps; another componentcontacting the half shaft; worn, damaged orincorrectly installed wheel bearing; damagedpower train/drive train mounts.
After a road test, it is often useful to do a simi-lar test on a lift. When carrying out the shake and vibration diagnosis or engine accessory vibra-tion diagnosis on a lift, observe the followingprecautions.
If only one drive wheel is allowed to rotate,speed must be limited to 55 km/h (35 mph)indicated on the speedometer. This is becausethe actual wheel speed will be twice that indi-cated on the speedometer.
The suspension should not be allowed to hangfree. If a CV joint were run at a high angle,extra vibration as well as damage to the sealsand joints could occur.
Support the front suspension lower arm as farout-board as possible. This will ensure that thevehicle is at its correct ride height. The pro-cedure is outlined by the following steps.
1. Raise and support the vehicle.2. Explore the speed range of interest using the
road test checks as previously discussed.3. Carry out a coast down (overrun) in neutral. If
the vehicle is free of vibration when operatingat a steady indicated speed and behaves verydifferently in drive and coast, a transmissionconcern is likely.
Note, however, that a test on the lift may pro-duce different vibrations and noises than a roadtest because of the effect of the lift. It is notunusual to find a vibration on the lift that was notnoticed during the road test. If the conditionfound on the road can be duplicated on the lift,carrying out experiments on the lift may save agreat deal of time.
2.4.6 Engine noises
How do you tell a constant tapping from a rattle?Worse still, how do you describe a noise in abook? I’ll do my best! Try the following table asa non-definitive guide to the source or cause ofengine or engine ancillary noises.
Noise description Possible source
Tap Valve clearances out of adjustment,
cam followers or cam lobes worn
Rattle A loose component, broken piston
ring or component
Light knock Small end bearings worn, cam or
cam follower
Deep knock or thud Big end bearings worn
Rumble Main bearings worn
Slap Worn pistons or bores
Vibration Loose or out of balance
components
Clatter Broken rocker shaft or broken
piston rings
Hiss Leak from inlet or exhaust
manifolds or connections
Roar Air intake noise, air filter missing,
exhaust blowing or a seized
viscous fan drive
Clunk Loose flywheel, worm thrust bear-
ings or a loose front pulley/damper
Whine Power steering pump or alternator
bearing
Shriek Dry bearing in an ancillary
component
Squeal Slipping drive belt
2.4.7 Sources of engine noise
The following table is a further guide to enginenoise. Possible causes are listed together with thenecessary repair or further diagnosis action asappropriate.
Sources of engine Possible cause Required action
noise
Misfiring/backfiring Fuel in tank has Determine
wrong octane/ which type of
cetane number, fuel was last put
or is wrong type in the tank
of fuel
Ignition system Check the
faulty ignition system
Engine temperature Check the
too high engine cooling
system
Carbon deposits Remove the
in the combustion carbon deposits
chamber start to by using fuel
glow and cause additives and
misfiring driving the
vehicle carefully
Timing incorrect, Check the
which causes timing
misfiring in the
intake/exhaust
system.
12 Advanced automotive fault diagnosis
Valve train faulty Valve clearance too Adjust valve
large due to faulty clearance if
bucket tappets or possible and
incorrect renew faulty
adjustment of valve bucket tappets –
clearance check cam
condition
Valve timing Check the valve
incorrectly adjusted, timing and
valves and pistons adjust if
are touching necessary
Timing belt broken Check timing belt
or damaged and check pistons
and valves for
damage – renew
any faulty parts
Engine Pistons Disassemble the
components Piston rings engine and
faulty Cylinder head gasket check
Big end and/or main components
bearing journals
Ancillary Engine Check that all
components components or components are
ancillary secure, tighten/
components loose adjust as required
or broken Renew if broken
2.5 Electrical diagnostictechniques
2.5.1 Check the obvious first!
Start all hands on diagnostic routines with ‘handand eye checks’. In other words look over thevehicle for obvious faults. For example, if the bat-tery terminals are loose or corroded then put thisright before carrying out complicated voltagereadings. Here are some further suggestions thatwill at some point save you a lot of time.
A misfire may be caused by a loose plug lead –it is easier to look for this than interpret theignition waveforms on a scope.
If the ABS warning light stays on – look to seeif the wheel speed sensor(s) are covered inmud or oil.
2.5.2 Test lights and analogue
meters – warning!
A test lamp is ideal for tracing faults in say alighting circuit because it will cause a current toflow which tests out high resistance connections.However, it is this same property that will dam-age delicate electronic circuits – so don’t use itfor any circuit that contains an electronic controlunit (ECU). Even an analogue voltmeter can
cause enough current to flow to at best give you afalse reading and at worst damage an ECU – sodon’t use it!
A digital multimeter is ideal for all forms oftesting. Most have an internal resistance in excessof 10 M. This means that the current they drawis almost insignificant. An LED test lamp or alogic probe is also acceptable.
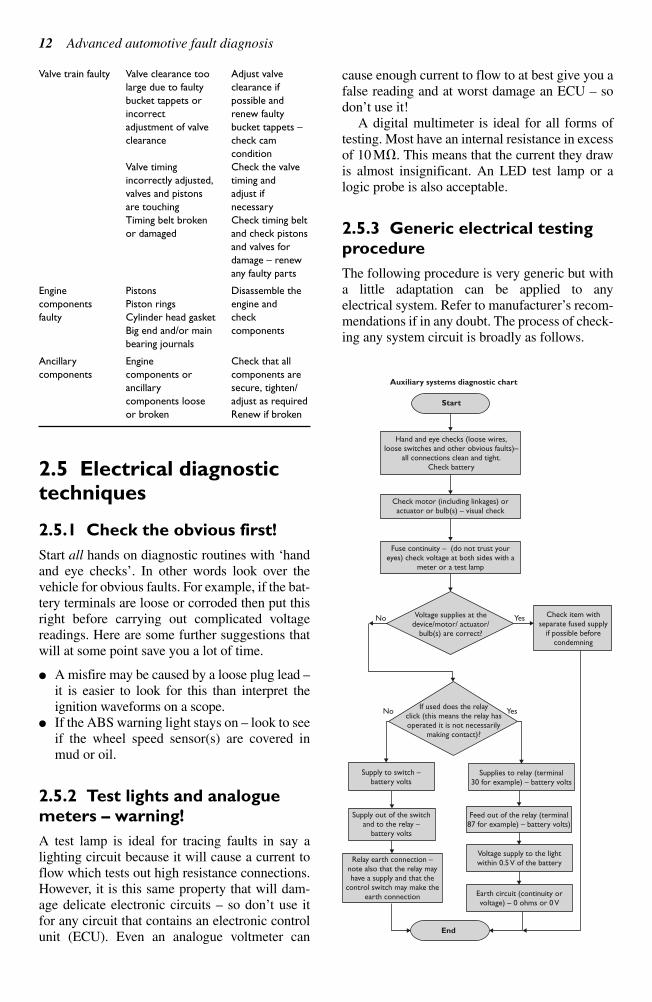
2.5.3 Generic electrical testing
procedure
The following procedure is very generic but witha little adaptation can be applied to any electrical system. Refer to manufacturer’s recom-mendations if in any doubt. The process of check-ing any system circuit is broadly as follows.
Start
Auxiliary systems diagnostic chart
Hand and eye checks (loose wires,loose switches and other obvious faults)–
all connections clean and tight.Check battery
Check motor (including linkages) oractuator or bulb(s) – visual check
Fuse continuity – (do not trust youreyes) check voltage at both sides with a
meter or a test lamp
Voltage supplies at thedevice/motor/ actuator/
bulb(s) are correct?
If used does the relayclick (this means the relay hasoperated it is not necessarily
making contact)?
Check item withseparate fused supply
if possible beforecondemning
Supply to switch –battery volts
No Yes
YesNo
Supply out of the switchand to the relay –
battery volts
Relay earth connection –note also that the relay mayhave a supply and that the
control switch may make theearth connection
End
Supplies to relay (terminal30 for example) – battery volts
Feed out of the relay (terminal87 for example) – battery volts)
Voltage supply to the lightwithin 0.5 V of the battery
Earth circuit (continuity orvoltage) – 0 ohms or 0 V
Diagnostic techniques 13
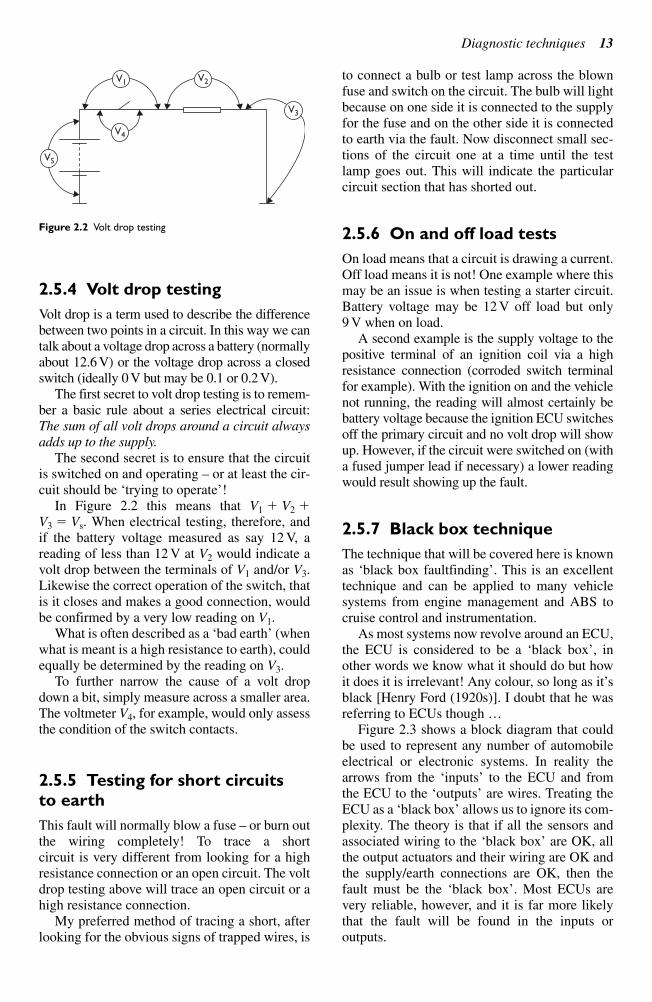
2.5.4 Volt drop testing
Volt drop is a term used to describe the differencebetween two points in a circuit. In this way we cantalk about a voltage drop across a battery (normallyabout 12.6 V) or the voltage drop across a closedswitch (ideally 0 V but may be 0.1 or 0.2 V).
The first secret to volt drop testing is to remem-ber a basic rule about a series electrical circuit:The sum of all volt drops around a circuit always
adds up to the supply.
The second secret is to ensure that the circuitis switched on and operating – or at least the cir-cuit should be ‘trying to operate’!
In Figure 2.2 this means that V1 V2 V3 Vs. When electrical testing, therefore, andif the battery voltage measured as say 12 V, areading of less than 12 V at V2 would indicate avolt drop between the terminals of V1 and/or V3.Likewise the correct operation of the switch, thatis it closes and makes a good connection, wouldbe confirmed by a very low reading on V1.
What is often described as a ‘bad earth’ (whenwhat is meant is a high resistance to earth), couldequally be determined by the reading on V3.
To further narrow the cause of a volt dropdown a bit, simply measure across a smaller area.The voltmeter V4, for example, would only assessthe condition of the switch contacts.
2.5.5 Testing for short circuits
to earth
This fault will normally blow a fuse – or burn outthe wiring completely! To trace a short circuit is very different from looking for a highresistance connection or an open circuit. The voltdrop testing above will trace an open circuit or ahigh resistance connection.
My preferred method of tracing a short, afterlooking for the obvious signs of trapped wires, is
to connect a bulb or test lamp across the blownfuse and switch on the circuit. The bulb will lightbecause on one side it is connected to the supplyfor the fuse and on the other side it is connectedto earth via the fault. Now disconnect small sec-tions of the circuit one at a time until the testlamp goes out. This will indicate the particularcircuit section that has shorted out.
2.5.6 On and off load tests
On load means that a circuit is drawing a current.Off load means it is not! One example where thismay be an issue is when testing a starter circuit.Battery voltage may be 12 V off load but only9 V when on load.
A second example is the supply voltage to thepositive terminal of an ignition coil via a highresistance connection (corroded switch terminalfor example). With the ignition on and the vehiclenot running, the reading will almost certainly bebattery voltage because the ignition ECU switchesoff the primary circuit and no volt drop will showup. However, if the circuit were switched on (witha fused jumper lead if necessary) a lower readingwould result showing up the fault.
2.5.7 Black box technique
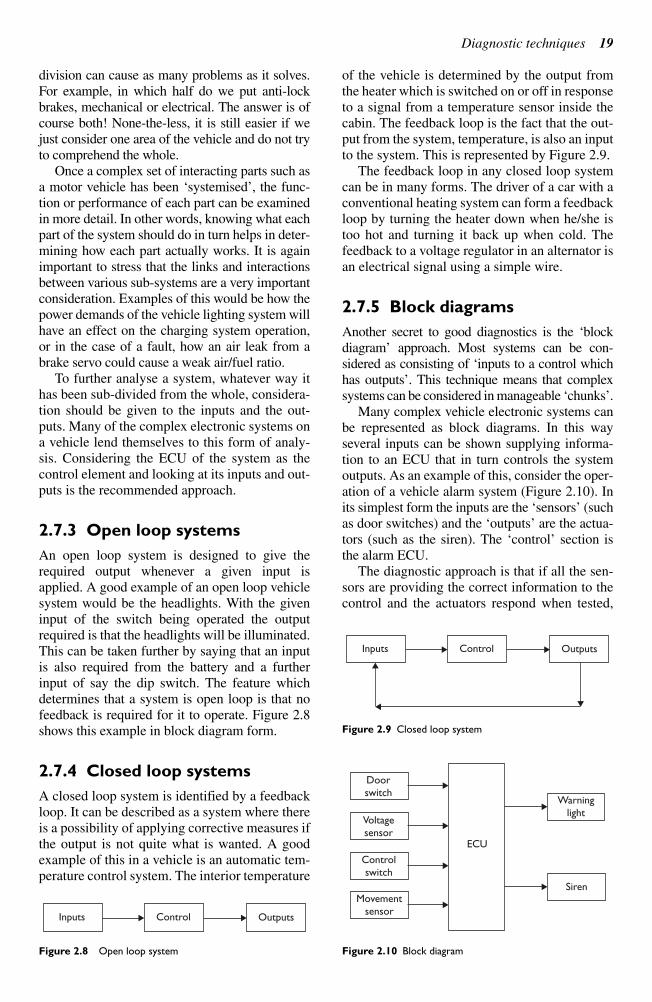
The technique that will be covered here is knownas ‘black box faultfinding’. This is an excellenttechnique and can be applied to many vehiclesystems from engine management and ABS tocruise control and instrumentation.
As most systems now revolve around an ECU,the ECU is considered to be a ‘black box’, inother words we know what it should do but howit does it is irrelevant! Any colour, so long as it’sblack [Henry Ford (1920s)]. I doubt that he wasreferring to ECUs though …
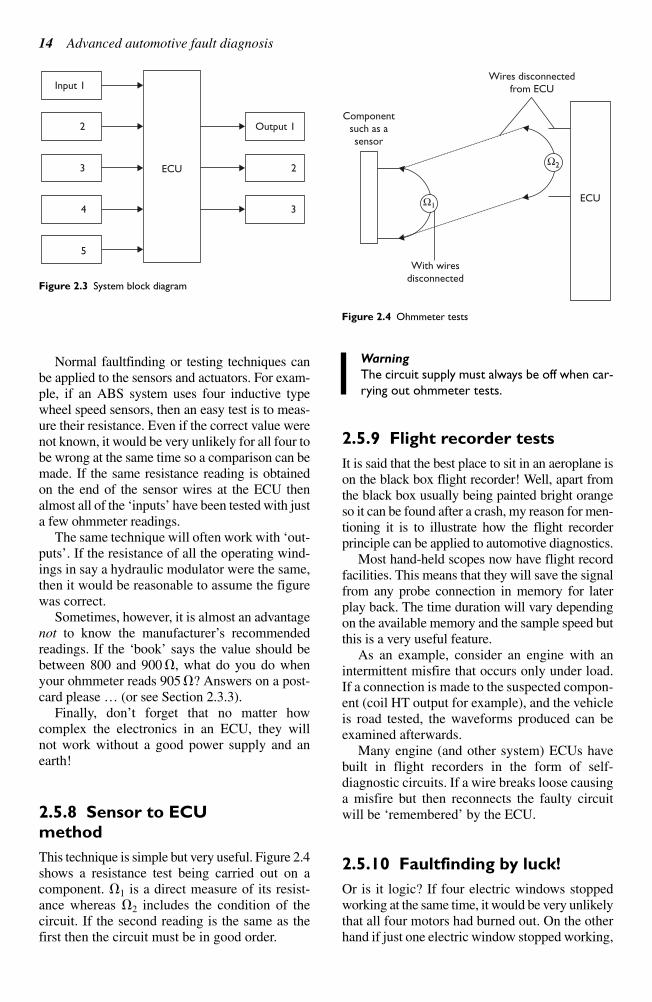
Figure 2.3 shows a block diagram that couldbe used to represent any number of automobileelectrical or electronic systems. In reality thearrows from the ‘inputs’ to the ECU and from the ECU to the ‘outputs’ are wires. Treating theECU as a ‘black box’ allows us to ignore its com-plexity. The theory is that if all the sensors andassociated wiring to the ‘black box’ are OK, allthe output actuators and their wiring are OK andthe supply/earth connections are OK, then thefault must be the ‘black box’. Most ECUs arevery reliable, however, and it is far more likelythat the fault will be found in the inputs or outputs.
V1
VS
V2
V3
V4
Figure 2.2 Volt drop testing
14 Advanced automotive fault diagnosis
Normal faultfinding or testing techniques canbe applied to the sensors and actuators. For exam-ple, if an ABS system uses four inductive typewheel speed sensors, then an easy test is to meas-ure their resistance. Even if the correct value werenot known, it would be very unlikely for all four tobe wrong at the same time so a comparison can bemade. If the same resistance reading is obtainedon the end of the sensor wires at the ECU thenalmost all of the ‘inputs’ have been tested with justa few ohmmeter readings.
The same technique will often work with ‘out-puts’. If the resistance of all the operating wind-ings in say a hydraulic modulator were the same,then it would be reasonable to assume the figurewas correct.
Sometimes, however, it is almost an advantagenot to know the manufacturer’s recommendedreadings. If the ‘book’ says the value should bebetween 800 and 900 , what do you do whenyour ohmmeter reads 905 ? Answers on a post-card please … (or see Section 2.3.3).
Finally, don’t forget that no matter how complex the electronics in an ECU, they will not work without a good power supply and anearth!
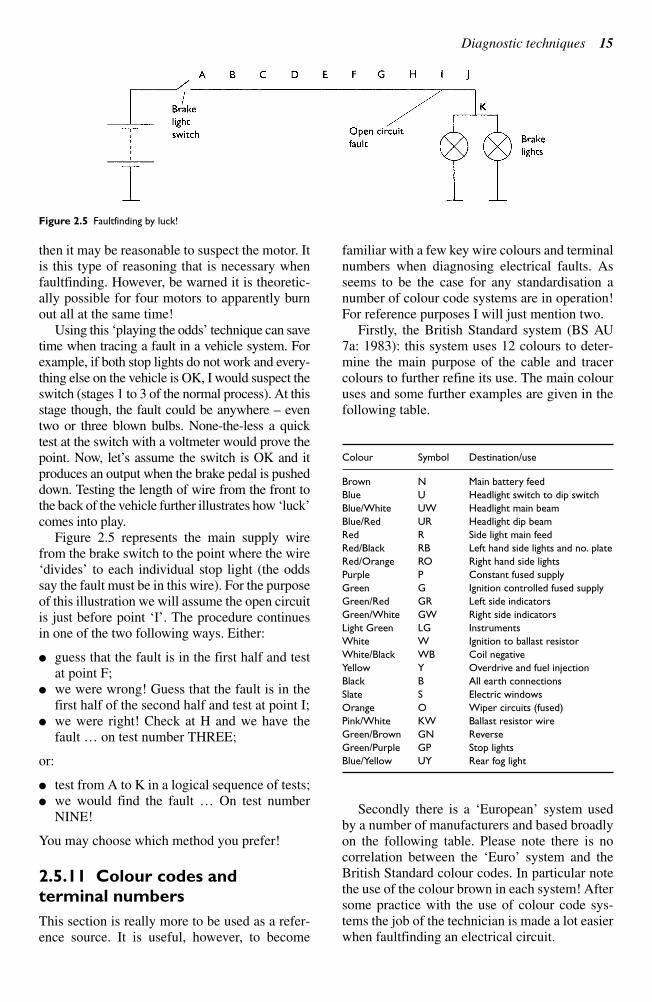
2.5.8 Sensor to ECU
method
This technique is simple but very useful. Figure 2.4shows a resistance test being carried out on acomponent. 1 is a direct measure of its resist-ance whereas 2 includes the condition of thecircuit. If the second reading is the same as thefirst then the circuit must be in good order.
Warning
The circuit supply must always be off when car-
rying out ohmmeter tests.
2.5.9 Flight recorder tests
It is said that the best place to sit in an aeroplane ison the black box flight recorder! Well, apart fromthe black box usually being painted bright orangeso it can be found after a crash, my reason for men-tioning it is to illustrate how the flight recorderprinciple can be applied to automotive diagnostics.
Most hand-held scopes now have flight recordfacilities. This means that they will save the signalfrom any probe connection in memory for laterplay back. The time duration will vary dependingon the available memory and the sample speed butthis is a very useful feature.
As an example, consider an engine with anintermittent misfire that occurs only under load.If a connection is made to the suspected compon-ent (coil HT output for example), and the vehicleis road tested, the waveforms produced can beexamined afterwards.
Many engine (and other system) ECUs havebuilt in flight recorders in the form of self-diagnostic circuits. If a wire breaks loose causinga misfire but then reconnects the faulty circuitwill be ‘remembered’ by the ECU.
2.5.10 Faultfinding by luck!
Or is it logic? If four electric windows stoppedworking at the same time, it would be very unlikelythat all four motors had burned out. On the otherhand if just one electric window stopped working,
Input 1
Output 12
2ECU3
34
5
Figure 2.3 System block diagram
Ω1
Ω2
Componentsuch as asensor
With wiresdisconnected
Wires disconnectedfrom ECU
ECU
Figure 2.4 Ohmmeter tests
Diagnostic techniques 15
then it may be reasonable to suspect the motor. Itis this type of reasoning that is necessary whenfaultfinding. However, be warned it is theoretic-ally possible for four motors to apparently burnout all at the same time!
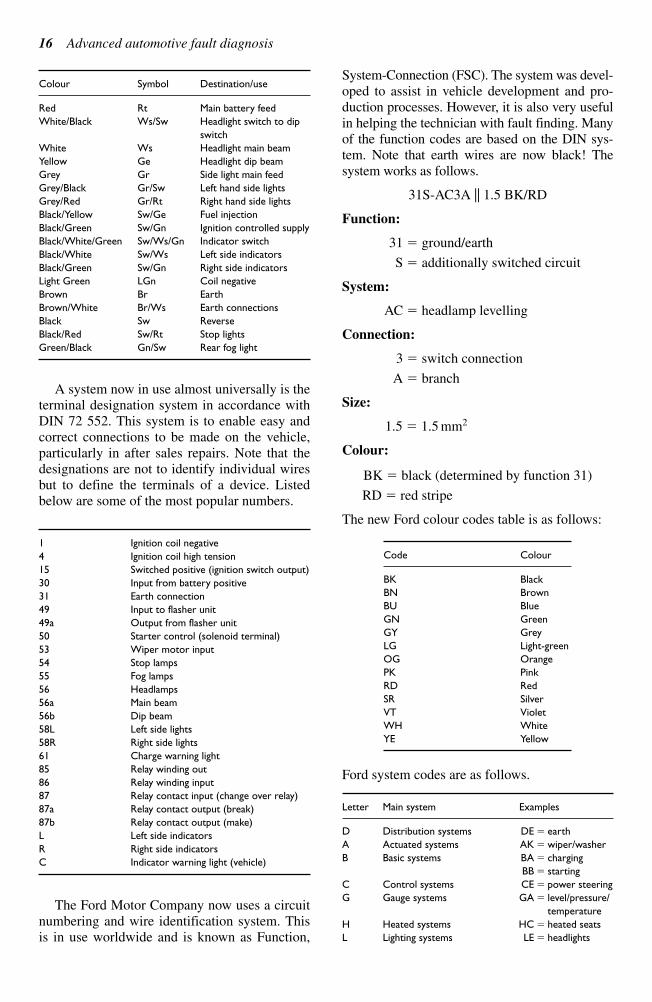
Using this ‘playing the odds’ technique can savetime when tracing a fault in a vehicle system. Forexample, if both stop lights do not work and every-thing else on the vehicle is OK, I would suspect theswitch (stages 1 to 3 of the normal process). At thisstage though, the fault could be anywhere – eventwo or three blown bulbs. None-the-less a quicktest at the switch with a voltmeter would prove thepoint. Now, let’s assume the switch is OK and itproduces an output when the brake pedal is pusheddown. Testing the length of wire from the front tothe back of the vehicle further illustrates how ‘luck’comes into play.
Figure 2.5 represents the main supply wirefrom the brake switch to the point where the wire‘divides’ to each individual stop light (the oddssay the fault must be in this wire). For the purposeof this illustration we will assume the open circuitis just before point ‘I’. The procedure continuesin one of the two following ways. Either:
guess that the fault is in the first half and testat point F;
we were wrong! Guess that the fault is in thefirst half of the second half and test at point I;
we were right! Check at H and we have thefault … on test number THREE;
or:
test from A to K in a logical sequence of tests; we would find the fault … On test number
NINE!
You may choose which method you prefer!
2.5.11 Colour codes and
terminal numbers
This section is really more to be used as a refer-ence source. It is useful, however, to become
familiar with a few key wire colours and terminalnumbers when diagnosing electrical faults. Asseems to be the case for any standardisation anumber of colour code systems are in operation!For reference purposes I will just mention two.
Firstly, the British Standard system (BS AU7a: 1983): this system uses 12 colours to deter-mine the main purpose of the cable and tracercolours to further refine its use. The main colouruses and some further examples are given in thefollowing table.
Colour Symbol Destination/use
Brown N Main battery feed
Blue U Headlight switch to dip switch
Blue/White UW Headlight main beam
Blue/Red UR Headlight dip beam
Red R Side light main feed
Red/Black RB Left hand side lights and no. plate
Red/Orange RO Right hand side lights
Purple P Constant fused supply
Green G Ignition controlled fused supply
Green/Red GR Left side indicators
Green/White GW Right side indicators
Light Green LG Instruments
White W Ignition to ballast resistor
White/Black WB Coil negative
Yellow Y Overdrive and fuel injection
Black B All earth connections
Slate S Electric windows
Orange O Wiper circuits (fused)
Pink/White KW Ballast resistor wire
Green/Brown GN Reverse
Green/Purple GP Stop lights
Blue/Yellow UY Rear fog light
Secondly there is a ‘European’ system usedby a number of manufacturers and based broadlyon the following table. Please note there is nocorrelation between the ‘Euro’ system and theBritish Standard colour codes. In particular notethe use of the colour brown in each system! Aftersome practice with the use of colour code sys-tems the job of the technician is made a lot easierwhen faultfinding an electrical circuit.
Figure 2.5 Faultfinding by luck!
Colour Symbol Destination/use
Red Rt Main battery feed
White/Black Ws/Sw Headlight switch to dip
switch
White Ws Headlight main beam
Yellow Ge Headlight dip beam
Grey Gr Side light main feed
Grey/Black Gr/Sw Left hand side lights
Grey/Red Gr/Rt Right hand side lights
Black/Yellow Sw/Ge Fuel injection
Black/Green Sw/Gn Ignition controlled supply
Black/White/Green Sw/Ws/Gn Indicator switch
Black/White Sw/Ws Left side indicators
Black/Green Sw/Gn Right side indicators
Light Green LGn Coil negative
Brown Br Earth
Brown/White Br/Ws Earth connections
Black Sw Reverse
Black/Red Sw/Rt Stop lights
Green/Black Gn/Sw Rear fog light
A system now in use almost universally is theterminal designation system in accordance withDIN 72 552. This system is to enable easy andcorrect connections to be made on the vehicle,particularly in after sales repairs. Note that thedesignations are not to identify individual wiresbut to define the terminals of a device. Listedbelow are some of the most popular numbers.
1 Ignition coil negative
4 Ignition coil high tension
15 Switched positive (ignition switch output)
30 Input from battery positive
31 Earth connection
49 Input to flasher unit
49a Output from flasher unit
50 Starter control (solenoid terminal)
53 Wiper motor input
54 Stop lamps
55 Fog lamps
56 Headlamps
56a Main beam
56b Dip beam
58L Left side lights
58R Right side lights
61 Charge warning light
85 Relay winding out
86 Relay winding input
87 Relay contact input (change over relay)
87a Relay contact output (break)
87b Relay contact output (make)
L Left side indicators
R Right side indicators
C Indicator warning light (vehicle)
The Ford Motor Company now uses a circuitnumbering and wire identification system. Thisis in use worldwide and is known as Function,
System-Connection (FSC). The system was devel-oped to assist in vehicle development and pro-duction processes. However, it is also very usefulin helping the technician with fault finding. Manyof the function codes are based on the DIN sys-tem. Note that earth wires are now black! The system works as follows.
31S-AC3A || 1.5 BK/RD
Function:
31 ground/earth
S additionally switched circuit
System:
AC headlamp levelling
Connection:
3 switch connection
A branch
Size:
1.5 1.5 mm2
Colour:
BK black (determined by function 31)
RD red stripe
The new Ford colour codes table is as follows:
Ford system codes are as follows.
Letter Main system Examples
D Distribution systems DE earth
A Actuated systems AK wiper/washer
B Basic systems BA charging
BB starting
C Control systems CE power steering
G Gauge systems GA level/pressure/
temperature
H Heated systems HC heated seats
L Lighting systems LE headlights
16 Advanced automotive fault diagnosis
Code Colour
BK Black
BN Brown
BU Blue
GN Green
GY Grey
LG Light-green
OG Orange
PK Pink
RD Red
SR Silver
VT Violet
WH White
YE Yellow
M Miscellaneous systems MA air bags
P Power train control systems PA engine control
W Indicator systems WC bulb failure
(‘indications’ not turn
signals)
X Temporary for future XS too much!
features
As a final point to this section it must be notedthat the colour codes and terminal designationsgiven are for illustration only. Further referenceshould be made for specific details to the manu-facturer’s information.
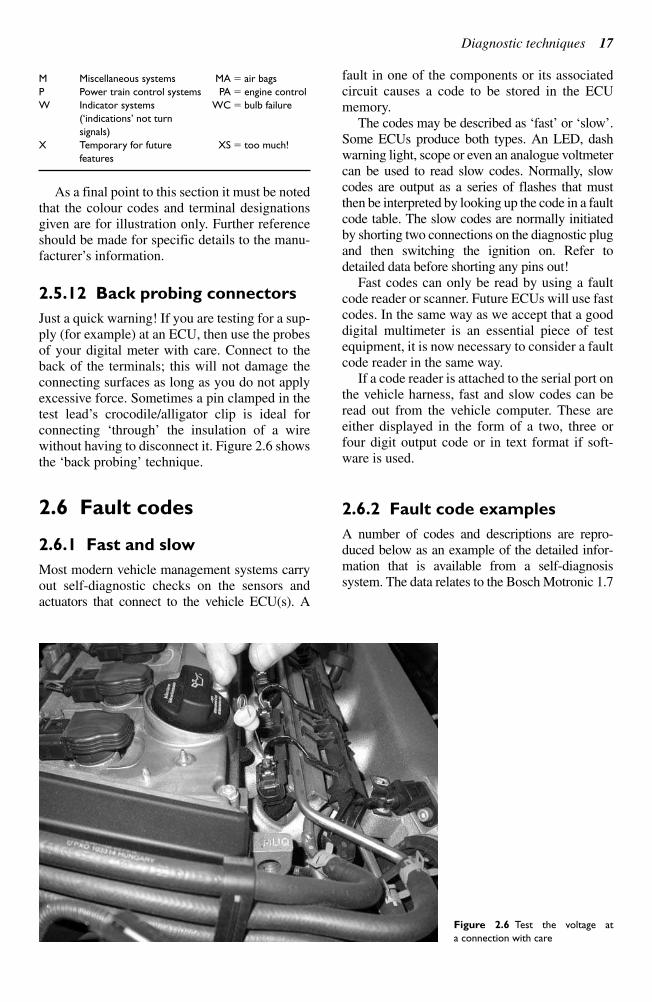
2.5.12 Back probing connectors
Just a quick warning! If you are testing for a sup-ply (for example) at an ECU, then use the probesof your digital meter with care. Connect to theback of the terminals; this will not damage theconnecting surfaces as long as you do not applyexcessive force. Sometimes a pin clamped in thetest lead’s crocodile/alligator clip is ideal forconnecting ‘through’ the insulation of a wirewithout having to disconnect it. Figure 2.6 showsthe ‘back probing’ technique.
2.6 Fault codes
2.6.1 Fast and slow
Most modern vehicle management systems carryout self-diagnostic checks on the sensors andactuators that connect to the vehicle ECU(s). A
fault in one of the components or its associatedcircuit causes a code to be stored in the ECUmemory.
The codes may be described as ‘fast’ or ‘slow’.Some ECUs produce both types. An LED, dashwarning light, scope or even an analogue voltmetercan be used to read slow codes. Normally, slowcodes are output as a series of flashes that mustthen be interpreted by looking up the code in a faultcode table. The slow codes are normally initiatedby shorting two connections on the diagnostic plugand then switching the ignition on. Refer todetailed data before shorting any pins out!
Fast codes can only be read by using a faultcode reader or scanner. Future ECUs will use fastcodes. In the same way as we accept that a gooddigital multimeter is an essential piece of testequipment, it is now necessary to consider a faultcode reader in the same way.
If a code reader is attached to the serial port onthe vehicle harness, fast and slow codes can beread out from the vehicle computer. These areeither displayed in the form of a two, three orfour digit output code or in text format if soft-ware is used.
2.6.2 Fault code examples
A number of codes and descriptions are repro-duced below as an example of the detailed infor-mation that is available from a self-diagnosissystem. The data relates to the Bosch Motronic 1.7
Diagnostic techniques 17
Figure 2.6 Test the voltage at
a connection with care
18 Advanced automotive fault diagnosis
and 3.1. Fault code lists are available in publica-tions such as those by ‘Autodata’ and ‘Autologic’.
FCR Description code
000 No faults found in the ECU
001 Fuel pump relay or fuel pump relay circuit
001 Crank angle sensor (CAS) or circuit (alternative code)
002 Idle speed control valve circuit
003 Injector number 1 or group one circuit
004 Injector number 3 or circuit
005 Injector number 2 or circuit
006 Injectors or injector circuit.
012 Throttle position switch or circuit
016 CAS or circuit
018 Amplifier to ECU amplifier circuit
019 ECU
023 Ignition amplifier number 2 cylinder or circuit
024 Ignition amplifier number 3 cylinder or circuit
025 Ignition amplifier number 1 cylinder or circuit
026 ECU supply
029 Idle speed control valve (ISCV) or circuit
031 Injector number 5 or circuit
032 Injector number 6 or injector group two circuit
033 Injector number 4 or circuit
036 Carbon filter solenoid valve (CFSV) or circuit
037 Oxygen sensor (OS) or circuit
041 Mass airflow (MAF) sensor or circuit
046 ECU
048 Air conditioning (AC) compressor or circuit
050 Ignition amplifier cylinder number 4 or circuit
051 Ignition amplifier cylinder number 6 or circuit
054 ECU
055 Ignition amplifier or circuit
062 Electronic throttle control or circuit
064 Ignition timing (electronic)
067 Vehicle speed sensor (VSS) or circuit
067 CAS or circuit
070 OS or circuit
073 Vehicle speed sensor (VSS) or circuit
076 CO potentiometer (non-cat)
077 Intake air temperature sensor (ATS) or circuit
078 Engine coolant temperature sensor (CTS) or circuit
081 Alarm system or circuit
082 Traction control or circuit
083 Suspension control or circuit
085 AC compressor or circuit
100 ECU
200 ECU
201 OS control or circuit
202 ECU
203 Ignition primary or circuit
204 Electronic throttle control signal or circuit
300 Engine
2.6.3 Clearing
Fault codes can be cleared from the ECU mem-ory in two ways:
using the facilities of a fault code reader (scan-ner) to clear the memory;
disconnecting the battery earth lead for abouttwo minutes (does not always work however).
The first method is clearly recommended becausedisconnecting the battery will also ‘reset’ manyother functions such as the radio code, the clockand even the learnt or adaptive functions in theECUs.
2.7 Systems
2.7.1 What is a system
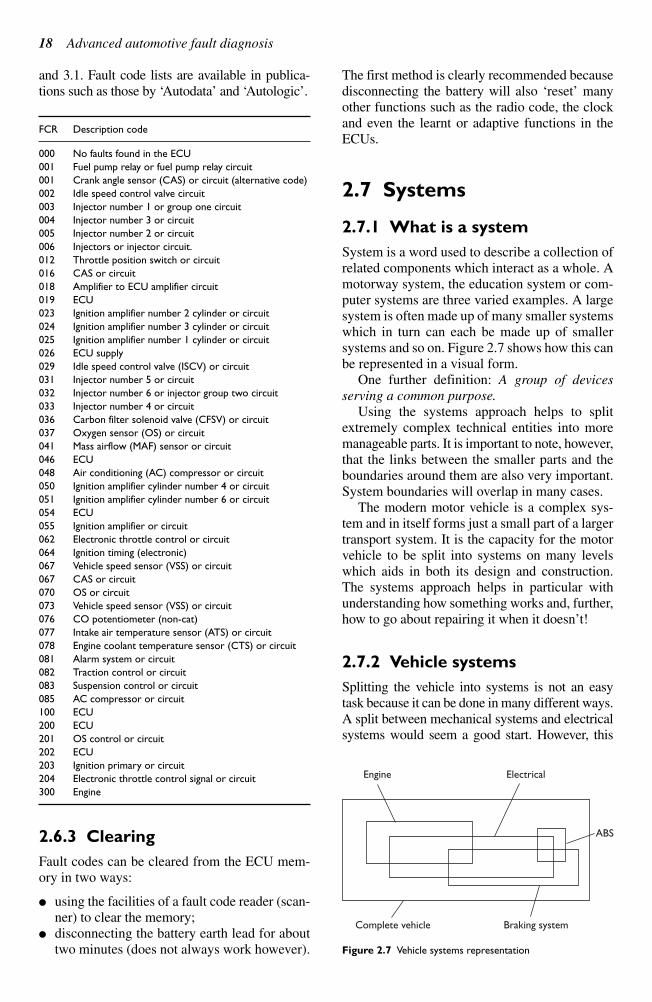
System is a word used to describe a collection ofrelated components which interact as a whole. Amotorway system, the education system or com-puter systems are three varied examples. A largesystem is often made up of many smaller systemswhich in turn can each be made up of smallersystems and so on. Figure 2.7 shows how this canbe represented in a visual form.
One further definition: A group of devices
serving a common purpose.
Using the systems approach helps to splitextremely complex technical entities into moremanageable parts. It is important to note, however,that the links between the smaller parts and theboundaries around them are also very important.System boundaries will overlap in many cases.
The modern motor vehicle is a complex sys-tem and in itself forms just a small part of a largertransport system. It is the capacity for the motorvehicle to be split into systems on many levelswhich aids in both its design and construction.The systems approach helps in particular withunderstanding how something works and, further,how to go about repairing it when it doesn’t!
2.7.2 Vehicle systems
Splitting the vehicle into systems is not an easytask because it can be done in many different ways.A split between mechanical systems and electricalsystems would seem a good start. However, this
Engine Electrical
ABS
Braking systemComplete vehicle
Figure 2.7 Vehicle systems representation
Diagnostic techniques 19
division can cause as many problems as it solves.For example, in which half do we put anti-lockbrakes, mechanical or electrical. The answer is ofcourse both! None-the-less, it is still easier if wejust consider one area of the vehicle and do not tryto comprehend the whole.
Once a complex set of interacting parts such asa motor vehicle has been ‘systemised’, the func-tion or performance of each part can be examinedin more detail. In other words, knowing what eachpart of the system should do in turn helps in deter-mining how each part actually works. It is againimportant to stress that the links and interactionsbetween various sub-systems are a very importantconsideration. Examples of this would be how thepower demands of the vehicle lighting system willhave an effect on the charging system operation,or in the case of a fault, how an air leak from abrake servo could cause a weak air/fuel ratio.
To further analyse a system, whatever way ithas been sub-divided from the whole, considera-tion should be given to the inputs and the out-puts. Many of the complex electronic systems ona vehicle lend themselves to this form of analy-sis. Considering the ECU of the system as thecontrol element and looking at its inputs and out-puts is the recommended approach.
2.7.3 Open loop systems
An open loop system is designed to give therequired output whenever a given input isapplied. A good example of an open loop vehiclesystem would be the headlights. With the giveninput of the switch being operated the outputrequired is that the headlights will be illuminated.This can be taken further by saying that an inputis also required from the battery and a furtherinput of say the dip switch. The feature whichdetermines that a system is open loop is that nofeedback is required for it to operate. Figure 2.8shows this example in block diagram form.
2.7.4 Closed loop systems
A closed loop system is identified by a feedbackloop. It can be described as a system where thereis a possibility of applying corrective measures ifthe output is not quite what is wanted. A goodexample of this in a vehicle is an automatic tem-perature control system. The interior temperature
of the vehicle is determined by the output fromthe heater which is switched on or off in responseto a signal from a temperature sensor inside thecabin. The feedback loop is the fact that the out-put from the system, temperature, is also an inputto the system. This is represented by Figure 2.9.
The feedback loop in any closed loop systemcan be in many forms. The driver of a car with aconventional heating system can form a feedbackloop by turning the heater down when he/she istoo hot and turning it back up when cold. Thefeedback to a voltage regulator in an alternator isan electrical signal using a simple wire.
2.7.5 Block diagrams
Another secret to good diagnostics is the ‘blockdiagram’ approach. Most systems can be con-sidered as consisting of ‘inputs to a control whichhas outputs’. This technique means that complexsystems can be considered in manageable ‘chunks’.
Many complex vehicle electronic systems canbe represented as block diagrams. In this wayseveral inputs can be shown supplying informa-tion to an ECU that in turn controls the systemoutputs. As an example of this, consider the oper-ation of a vehicle alarm system (Figure 2.10). Inits simplest form the inputs are the ‘sensors’ (suchas door switches) and the ‘outputs’ are the actua-tors (such as the siren). The ‘control’ section isthe alarm ECU.
The diagnostic approach is that if all the sen-sors are providing the correct information to thecontrol and the actuators respond when tested,
Inputs Control Outputs
Figure 2.8 Open loop system
Inputs Control Outputs
Figure 2.9 Closed loop system
Doorswitch
Voltagesensor
Controlswitch
Movementsensor
ECU
Warninglight
Siren
Figure 2.10 Block diagram
20 Advanced automotive fault diagnosis
then the fault must be the control unit. If a sensordoes not produce the required information thenthe fault is equally evident.
2.8 On- and off-boarddiagnostics
2.8.1 On-board diagnostics
On-board diagnostics refers to the systems on thevehicle carrying out some form of self-monitor-ing. The more complex automobiles become, thegreater the number of electronic systems and themore difficult it is to register the actual conditionin case of a defect.
Many connecting cables and adapters arerequired to achieve this. Data about the differentsystems and their working together is needed toallow a system specific diagnosis. Modern elec-tronics with self-diagnosis supports the techni-cian by registering actual values, comparing themwith the nominal values, and diagnosing faultsthat are stored for repair purposes.
Internal to an ECU, a checksum of the programmemory is calculated. Then a read and write test ofthe random access memory (RAM) is performed.Other elements such as A/D (analogue/digital)converters are also checked within this test cycle.
During the operating time of the vehicle, theECUs are constantly checking the sensors they areconnected to. The ECUs are then able to determinewhether a sensor has a short circuit to ground orbattery voltage, or if a cable to the sensor is opencircuit. By comparing the measured values and thestored data, an ECU is able to determine whetherthe measured values exceed or are still within thetolerance required. Combining information pro-vided by other sensors allows the ECU to monitorfor plausibility of the sensor signals.
Measuring the current normally taken by theircircuits is used to carry out a check on actuators.Powering the actuator and observing the reactionof the system can test the function of an actuatorin some cases.
If discrepancies to the nominal values are diag-nosed, the information is stored in an internal faultmemory together with other parameters, such asengine temperature or speed. In this way, defectsthat appear intermittent or only under certain con-ditions can be diagnosed. If a fault occurs onlyonce during a set period of time, it is deleted. Thefault memory can be read later in the workshop andprovides valuable information for the technician.
When a defective sensor is detected, the meas-ured values are replaced by a nominal value, oran alternative value is calculated using the infor-mation from other sensors to provide a limp-home function. With the help of an appropriatecode reader or scanner, a technician can commu-nicate with the ECUs, read the fault memory and the measured values, and send signals to theactuators.
Another task of self-diagnosis is to indicate adefect to the driver. A warning light on the dash-board is the most common method used to dothis. Regulations concerning exhaust emissionsmean an extension of self-diagnosis is desirable.The control units will soon have to be able tocontrol all exhaust gas functions and componentsand to clearly indicate a defective function or the exceeding of the permissible exhaust limits.Chapter 5 covers this subject in detail.
2.8.2 Off-board diagnostics
The continual increase in the use of electronicswithin vehicles represents a major challenge for customer service and workshop operations.Modern diagnosis and information systems mustcope with this challenge and manufacturers oftest equipment must provide instruments that areflexible and easy to handle. Quick and reliablefault diagnosis in modern vehicles requires exten-sive technical knowledge, detailed vehicle infor-mation, up-to-date testing systems and the skill tobe able to apply all of these.
The test equipment on the market can be sub-divided into two main categories:
hand-held or portable instruments; stationary equipment.
Hand-held instruments are commonly used forthe control of engine functions like ignition orfuel injection and the request of error codes fromthe ECUs.
Stationary test equipment may be able to coverthe whole range of function and performancechecks of the engine, gear, brakes, chassis, andexhaust monitoring. Most of the common testersare used for diagnosing engine faults.
For repair, service, and maintenance, many dif-ferent manuals and microfiches are used in work-shops. It is difficult to collect all the necessaryinformation, especially when vehicles of differentmakes have to be repaired. It is, however, becomingcommon to supply material on CD/DVD. Work-shops equipped with appropriate data systems willbe able to receive updates via telephone line or by
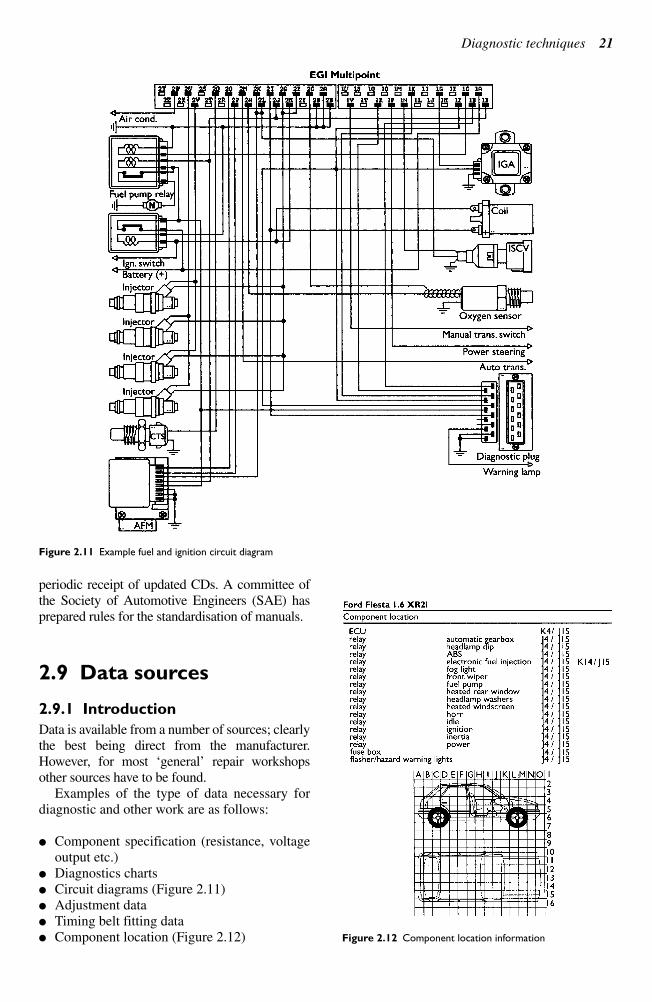
periodic receipt of updated CDs. A committee ofthe Society of Automotive Engineers (SAE) hasprepared rules for the standardisation of manuals.
2.9 Data sources
2.9.1 Introduction
Data is available from a number of sources; clearlythe best being direct from the manufacturer.However, for most ‘general’ repair workshopsother sources have to be found.
Examples of the type of data necessary fordiagnostic and other work are as follows:
Component specification (resistance, voltageoutput etc.)
Diagnostics charts Circuit diagrams (Figure 2.11) Adjustment data Timing belt fitting data Component location (Figure 2.12)
Diagnostic techniques 21
Figure 2.11 Example fuel and ignition circuit diagram
Figure 2.12 Component location information
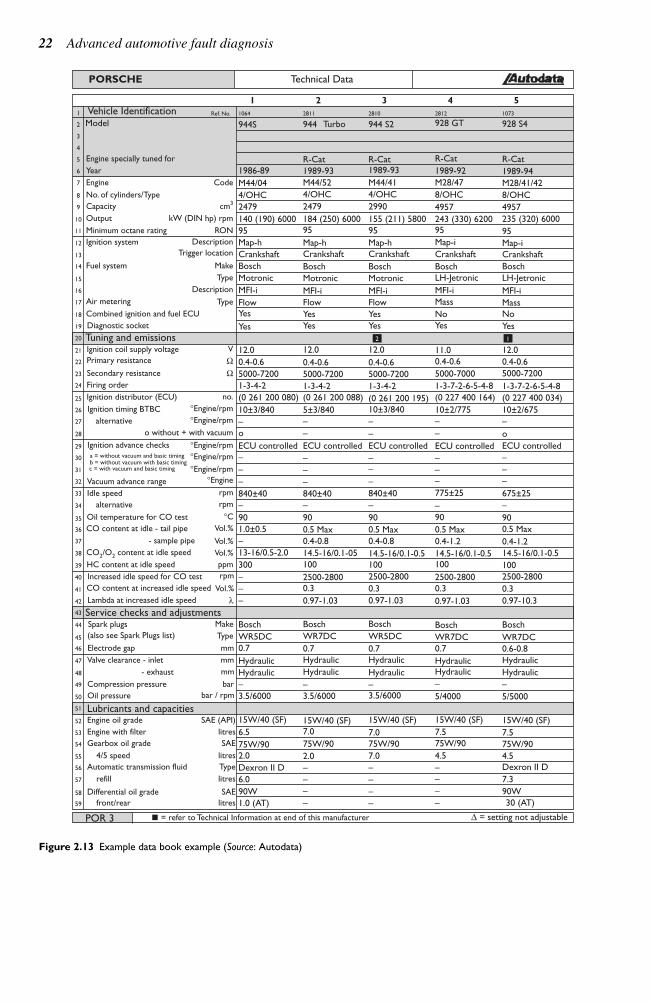
22 Advanced automotive fault diagnosis
PORSCHE Technical Data
Vehicle IdentificationModel 944S 944
R-Cat R-Cat
1989-93 1989-93
M44/52 M44/41
4/OHC 4/OHC
2479 2990
95 95
Map-h Map-h
Crankshaft Crankshaft
Bosch Bosch
Motronic Motronic
MFI-i MFI-i
Flow Flow
Yes Yes
Yes Yes
12.0 12.0
0.4-0.6 0.4-0.6
5000-7200 5000-7200
1-3-4-2 1-3-4-2
(0 261 200 088) (0 261 200 195)
5±3/840 10±3/840
184 (250) 6000 155 (211) 5800
Turbo 944 S2 928 GT 928 S4
R-Cat R-Cat
1989-92 1989-94
M28/41/42
8/OHC
4957
235 (320) 6000
95
Map-i
Crankshaft
Bosch
LH-Jetronic
MFI-i
Mass
No
Yes
12.0
0.4-0.6
5000-7200
1-3-7-2-6-5-4-8
(0 227 400 034)
10±2/675
M28/47
8/OHC
4957
95
Map-i
Crankshaft
Bosch
LH-Jetronic
MFI-i
Mass
No
Yes
11.0
0.4-0.6
5000-7000
1-3-7-2-6-5-4-8
(0 227 400 164)
10±2/775
243 (330) 6200
1986-89
M44/04
4/OHC
2479
140 (190) 6000
95
Map-h
Crankshaft
Bosch
Motronic
MFI-i
FlowYes
Yes
12.0
0.4-0.6
5000-7200
1-3-4-2
(0 261 200 080)
10±3/840
– – – – –
–
–
–
–
–––
– – –
–
–
–
–
–
–
–
– –
–
–
–
–
–
–
–
–
– – – – –
– –
–
–
–
–
–
–
–
–
–
–
o
ECU controlled ECU controlled ECU controlled ECU controlled ECU controlled
840±40 840±40 840±40 775±25 675±25
13-16/0.5-2.0
1.0±0.5
90 90 90 90 90
100
2500-2800
0.3
0.97-1.03
Bosch
0.7
Hydraulic
Hydraulic
3.5/6000 5/4000 5/5000
15W/40 (SF) 15W/40 (SF)
7.5 7.5
4.5 4.5
Dexron II D
7.3
90W
30 (AT)
∆ = setting not adjustable
75W/90 75W/90
15W/40 (SF)
7.0
7.0
75W/90
WR5DC
0.4-0.8 0.4-0.8 0.4-1.2 0.4-1.2
100
2500-2800
0.3
0.97-10.3
Bosch
WR7DC
0.6-0.8
Hydraulic
Hydraulic
100
2500-2800
0.3
0.97-1.03
Bosch
WR7DC
0.7
HydraulicHydraulic
14.5-16/0.1-0.5 14.5-16/0.1-0.514.5-16/0.1-0.514.5-16/0.1-05
100
2500-28000.3
0.97-1.03
0.5 Max 0.5 Max 0.5 Max 0.5 Max
300
Bosch Bosch
0.7 0.7
Hydraulic Hydraulic
Hydraulic
3.5/6000 3.5/6000
6.5 7.0
75W/90 75W/90
2.0 2.0
6.0
90W
1.0 (AT)
Dexron II D
15W/40 (SF) 15W/40 (SF)
Hydraulic
WR5DC WR7DC
Engine specially tuned for
Year
Engine
Capacity
Output
RONMinimum octane rating
Ignition system Description
Fuel system
Trigger location
Make
Type
Description
TypeAir metering
Combined ignition and fuel ECU
Diagnostic socket
Ignition coil supply voltage
Primary resistance
V
Ω
ΩSecondary resistance
Firing order
no.
°Engine/rpm
°Engine/rpm
°Engine/rpm
°Engine/rpm
°Engine
°Engine/rpm
o without + with vacuum
Ignition distributor (ECU)
Ignition timing BTBC
alternative
a = without vacuum and basic timing
c = with vacuum and basic timingb = without vacuum with basic timing
Ignition advance checks
Vacuum advance range
Idle speed rpm
rpm
ppm
rpm
λ
Vol.%
Vol.%
Vol.%
Vol.%
°C
alternative
Oil temperature for CO test
CO content at idle - tail pipe
- sample pipe
HC content at idle speed
Increased idle speed for CO test
CO content at increased idle speed
Lambda at increased idle speed
Spark plugs
Valve clearance - inlet
Engine oil grade
Engine with filter
Gearbox oil grade
4/5 speed
refill
front/rear
Differential oil grade
Automatic transmission fluid
SAE (API)
litres
SAE
SAE
litres
litres
litres
= refer to Technical Information at end of this manufacturer
Type
Make
Type
Electrode gap mm
mm
mm
barCompression pressure
- exhaust
bar / rpmOil pressure
(also see Spark Plugs list)
CO2/O2 content at idle speed
Tuning and emissions
Service checks and adjustments
Lubricants and capacities
POR 3
kW (DIN hp) rpm
cm3
No. of cylinders/Type
Code
1 2
1
2
3
4
5
Ref. No. 1064 2811 2810 2812 1073
6
7
8
9
10
11
12
13
14
15
16
17
18
19
20
21
22
23
24
25
26
27
28
29
30
31
32
33
34
35
36
37
38
39
40
41
42
43
44
45
46
47
48
49
50
51
52
53
54
55
56
57
58
59
3 4 5
o
2 1
Figure 2.13 Example data book example (Source: Autodata)
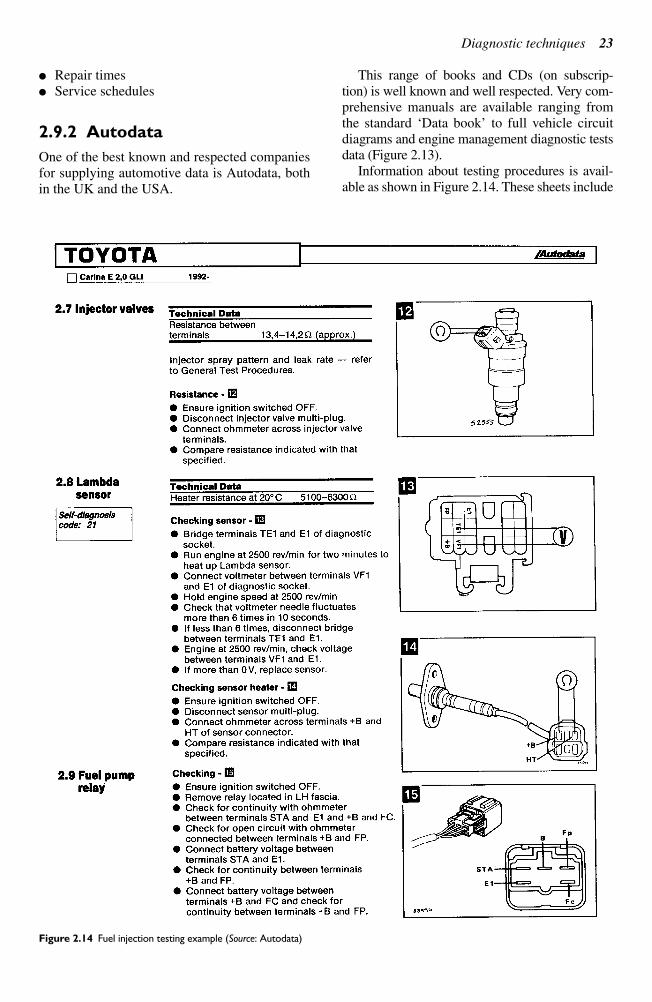
Diagnostic techniques 23
Repair times Service schedules
2.9.2 Autodata
One of the best known and respected companiesfor supplying automotive data is Autodata, bothin the UK and the USA.
This range of books and CDs (on subscrip-tion) is well known and well respected. Very com-prehensive manuals are available ranging fromthe standard ‘Data book’ to full vehicle circuitdiagrams and engine management diagnostic testsdata (Figure 2.13).
Information about testing procedures is avail-able as shown in Figure 2.14. These sheets include
Figure 2.14 Fuel injection testing example (Source: Autodata)
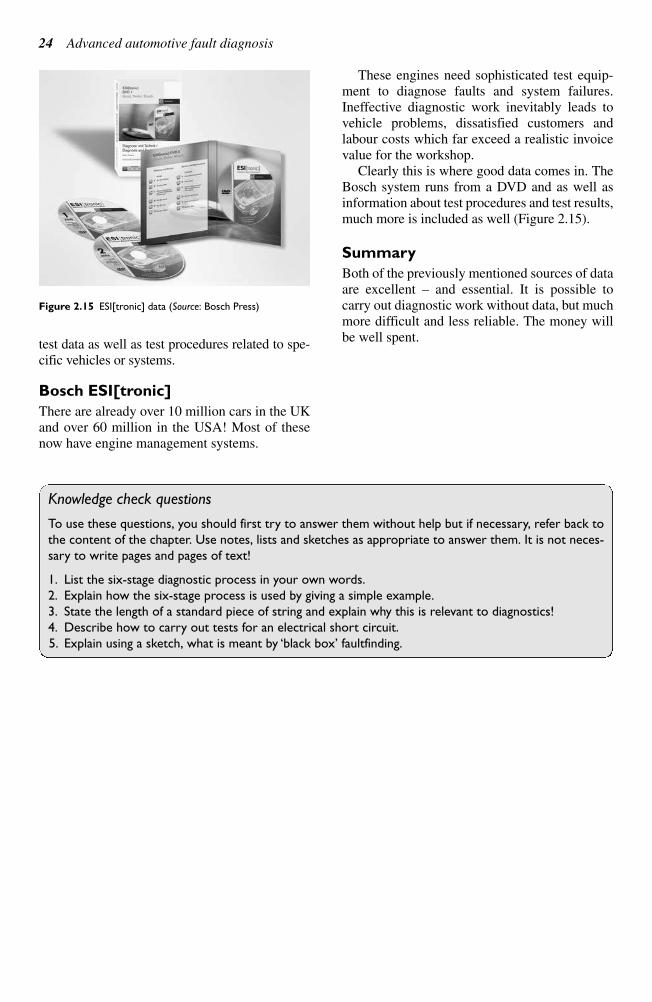
24 Advanced automotive fault diagnosis
test data as well as test procedures related to spe-cific vehicles or systems.
Bosch ESI[tronic]
There are already over 10 million cars in the UKand over 60 million in the USA! Most of thesenow have engine management systems.
These engines need sophisticated test equip-ment to diagnose faults and system failures.Ineffective diagnostic work inevitably leads tovehicle problems, dissatisfied customers andlabour costs which far exceed a realistic invoicevalue for the workshop.
Clearly this is where good data comes in. TheBosch system runs from a DVD and as well asinformation about test procedures and test results,much more is included as well (Figure 2.15).
Summary
Both of the previously mentioned sources of dataare excellent – and essential. It is possible tocarry out diagnostic work without data, but muchmore difficult and less reliable. The money willbe well spent.
Figure 2.15 ESI[tronic] data (Source: Bosch Press)
Knowledge check questions
To use these questions, you should first try to answer them without help but if necessary, refer back to
the content of the chapter. Use notes, lists and sketches as appropriate to answer them. It is not neces-
sary to write pages and pages of text!
1. List the six-stage diagnostic process in your own words.
2. Explain how the six-stage process is used by giving a simple example.
3. State the length of a standard piece of string and explain why this is relevant to diagnostics!
4. Describe how to carry out tests for an electrical short circuit.
5. Explain using a sketch, what is meant by ‘black box’ faultfinding.
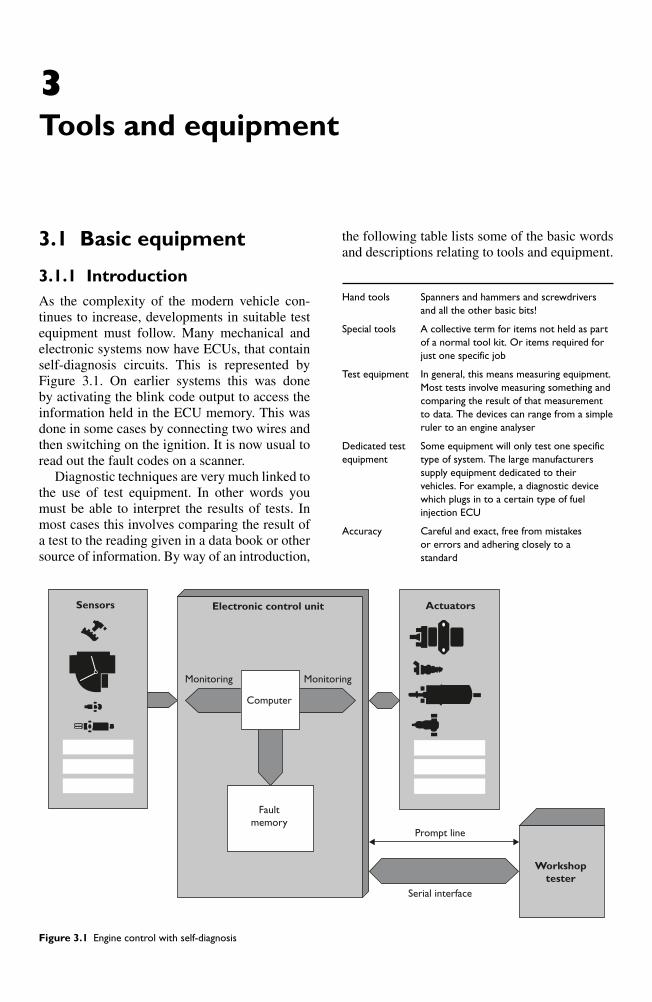
3.1 Basic equipment
3.1.1 Introduction
As the complexity of the modern vehicle con-tinues to increase, developments in suitable testequipment must follow. Many mechanical andelectronic systems now have ECUs, that containself-diagnosis circuits. This is represented byFigure 3.1. On earlier systems this was done by activating the blink code output to access theinformation held in the ECU memory. This wasdone in some cases by connecting two wires andthen switching on the ignition. It is now usual toread out the fault codes on a scanner.
Diagnostic techniques are very much linked tothe use of test equipment. In other words youmust be able to interpret the results of tests. Inmost cases this involves comparing the result ofa test to the reading given in a data book or othersource of information. By way of an introduction,
the following table lists some of the basic wordsand descriptions relating to tools and equipment.
Hand tools Spanners and hammers and screwdrivers
and all the other basic bits!
Special tools A collective term for items not held as part
of a normal tool kit. Or items required for
just one specific job
Test equipment In general, this means measuring equipment.
Most tests involve measuring something and
comparing the result of that measurement
to data. The devices can range from a simple
ruler to an engine analyser
Dedicated test Some equipment will only test one specific
equipment type of system. The large manufacturers
supply equipment dedicated to their
vehicles. For example, a diagnostic device
which plugs in to a certain type of fuel
injection ECU
Accuracy Careful and exact, free from mistakes
or errors and adhering closely to a
standard
3
Tools and equipment
Sensors
Monitoring Monitoring
Computer
Faultmemory
Serial interface
Prompt line
Electronic control unit
Workshop
tester
Actuators
Figure 3.1 Engine control with self-diagnosis
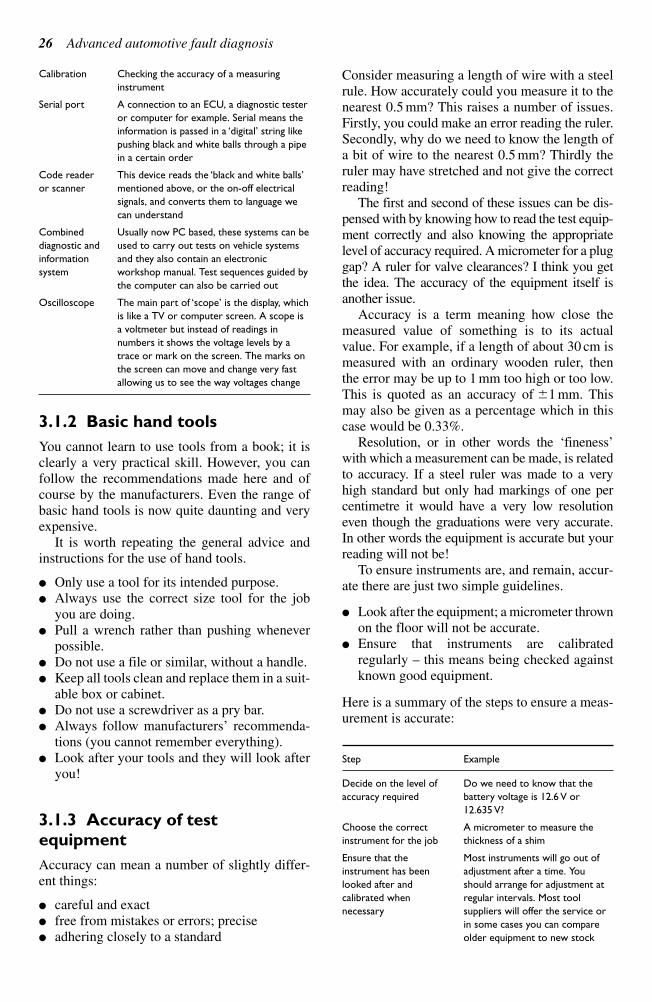
Calibration Checking the accuracy of a measuring
instrument
Serial port A connection to an ECU, a diagnostic tester
or computer for example. Serial means the
information is passed in a ‘digital’ string like
pushing black and white balls through a pipe
in a certain order
Code reader This device reads the ‘black and white balls’
or scanner mentioned above, or the on-off electrical
signals, and converts them to language we
can understand
Combined Usually now PC based, these systems can be
diagnostic and used to carry out tests on vehicle systems
information and they also contain an electronic
system workshop manual. Test sequences guided by
the computer can also be carried out
Oscilloscope The main part of ‘scope’ is the display, which
is like a TV or computer screen. A scope is
a voltmeter but instead of readings in
numbers it shows the voltage levels by a
trace or mark on the screen. The marks on
the screen can move and change very fast
allowing us to see the way voltages change
3.1.2 Basic hand tools
You cannot learn to use tools from a book; it isclearly a very practical skill. However, you canfollow the recommendations made here and ofcourse by the manufacturers. Even the range ofbasic hand tools is now quite daunting and veryexpensive.
It is worth repeating the general advice andinstructions for the use of hand tools.
Only use a tool for its intended purpose. Always use the correct size tool for the job
you are doing. Pull a wrench rather than pushing whenever
possible. Do not use a file or similar, without a handle. Keep all tools clean and replace them in a suit-
able box or cabinet. Do not use a screwdriver as a pry bar. Always follow manufacturers’ recommenda-
tions (you cannot remember everything). Look after your tools and they will look after
you!
3.1.3 Accuracy of test
equipment
Accuracy can mean a number of slightly differ-ent things:
careful and exact free from mistakes or errors; precise adhering closely to a standard
Consider measuring a length of wire with a steelrule. How accurately could you measure it to thenearest 0.5 mm? This raises a number of issues.Firstly, you could make an error reading the ruler.Secondly, why do we need to know the length ofa bit of wire to the nearest 0.5 mm? Thirdly theruler may have stretched and not give the correctreading!
The first and second of these issues can be dis-pensed with by knowing how to read the test equip-ment correctly and also knowing the appropriatelevel of accuracy required. A micrometer for a pluggap? A ruler for valve clearances? I think you getthe idea. The accuracy of the equipment itself isanother issue.
Accuracy is a term meaning how close themeasured value of something is to its actualvalue. For example, if a length of about 30 cm ismeasured with an ordinary wooden ruler, thenthe error may be up to 1 mm too high or too low.This is quoted as an accuracy of 1 mm. Thismay also be given as a percentage which in thiscase would be 0.33%.
Resolution, or in other words the ‘fineness’with which a measurement can be made, is relatedto accuracy. If a steel ruler was made to a veryhigh standard but only had markings of one percentimetre it would have a very low resolutioneven though the graduations were very accurate.In other words the equipment is accurate but yourreading will not be!
To ensure instruments are, and remain, accur-ate there are just two simple guidelines.
Look after the equipment; a micrometer thrownon the floor will not be accurate.
Ensure that instruments are calibrated regularly – this means being checked againstknown good equipment.
Here is a summary of the steps to ensure a meas-urement is accurate:
Step Example
Decide on the level of Do we need to know that the
accuracy required battery voltage is 12.6 V or
12.635 V?
Choose the correct A micrometer to measure the
instrument for the job thickness of a shim
Ensure that the Most instruments will go out of
instrument has been adjustment after a time. You
looked after and should arrange for adjustment at
calibrated when regular intervals. Most tool
necessary suppliers will offer the service or
in some cases you can compare
older equipment to new stock
26 Advanced automotive fault diagnosis
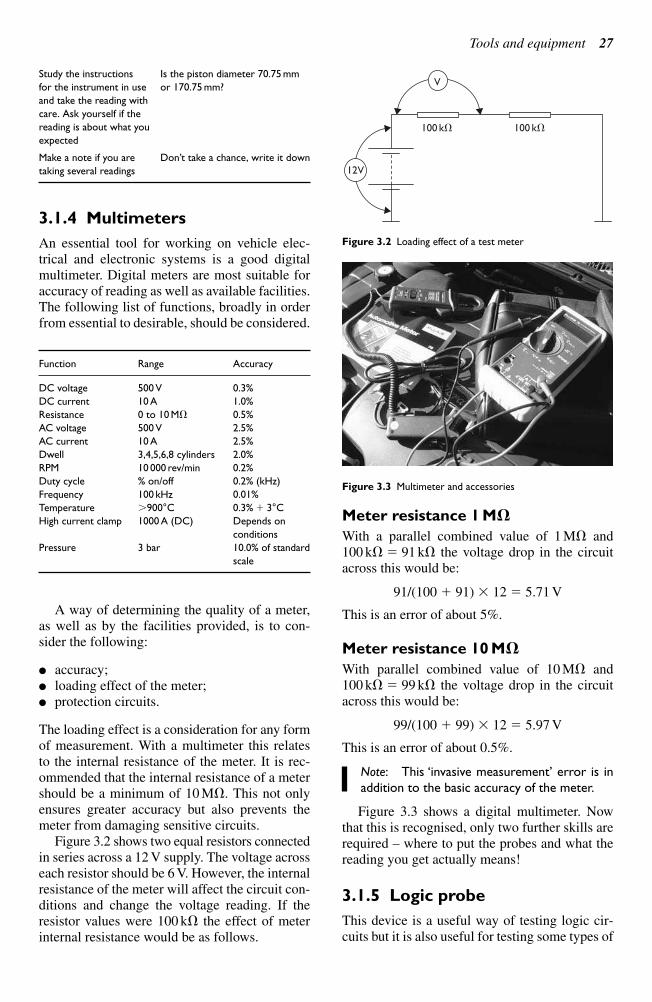
Study the instructions Is the piston diameter 70.75 mm
for the instrument in use or 170.75 mm?
and take the reading with
care. Ask yourself if the
reading is about what you
expected
Make a note if you are Don’t take a chance, write it down
taking several readings
3.1.4 Multimeters
An essential tool for working on vehicle elec-trical and electronic systems is a good digitalmultimeter. Digital meters are most suitable foraccuracy of reading as well as available facilities.The following list of functions, broadly in orderfrom essential to desirable, should be considered.
Function Range Accuracy
DC voltage 500 V 0.3%
DC current 10 A 1.0%
Resistance 0 to 10 M 0.5%
AC voltage 500 V 2.5%
AC current 10 A 2.5%
Dwell 3,4,5,6,8 cylinders 2.0%
RPM 10 000 rev/min 0.2%
Duty cycle % on/off 0.2% (kHz)
Frequency 100 kHz 0.01%
Temperature 900°C 0.3% 3°C
High current clamp 1000 A (DC) Depends on
conditions
Pressure 3 bar 10.0% of standard
scale
A way of determining the quality of a meter,as well as by the facilities provided, is to con-sider the following:
accuracy; loading effect of the meter; protection circuits.
The loading effect is a consideration for any formof measurement. With a multimeter this relatesto the internal resistance of the meter. It is rec-ommended that the internal resistance of a metershould be a minimum of 10 M. This not onlyensures greater accuracy but also prevents themeter from damaging sensitive circuits.
Figure 3.2 shows two equal resistors connectedin series across a 12 V supply. The voltage acrosseach resistor should be 6 V. However, the internalresistance of the meter will affect the circuit con-ditions and change the voltage reading. If theresistor values were 100 k the effect of meterinternal resistance would be as follows.
Meter resistance 1 M
With a parallel combined value of 1 M and100 k 91 k the voltage drop in the circuitacross this would be:
91/(100 91) 12 5.71 V
This is an error of about 5%.
Meter resistance 10 M
With parallel combined value of 10 M and100 k 99 k the voltage drop in the circuitacross this would be:
99/(100 99) 12 5.97 V
This is an error of about 0.5%.
Note: This ‘invasive measurement’ error is in
addition to the basic accuracy of the meter.
Figure 3.3 shows a digital multimeter. Nowthat this is recognised, only two further skills arerequired – where to put the probes and what thereading you get actually means!
3.1.5 Logic probe
This device is a useful way of testing logic cir-cuits but it is also useful for testing some types of
Tools and equipment 27
V
100 k 100 k
12V
Figure 3.2 Loading effect of a test meter
Figure 3.3 Multimeter and accessories
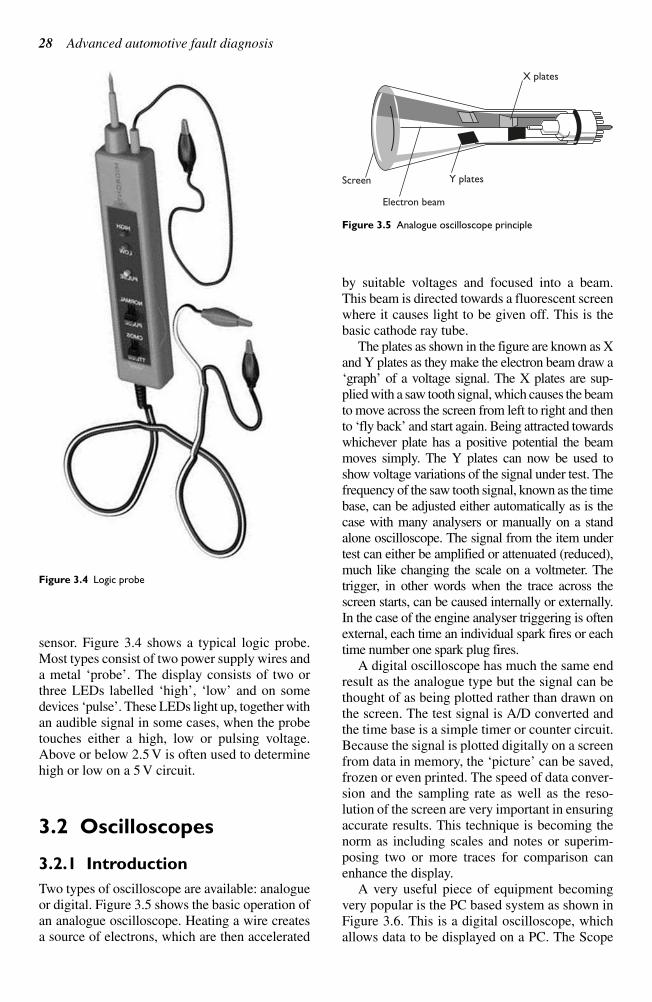
sensor. Figure 3.4 shows a typical logic probe.Most types consist of two power supply wires anda metal ‘probe’. The display consists of two orthree LEDs labelled ‘high’, ‘low’ and on somedevices ‘pulse’. These LEDs light up, together withan audible signal in some cases, when the probetouches either a high, low or pulsing voltage.Above or below 2.5 V is often used to determinehigh or low on a 5 V circuit.
3.2 Oscilloscopes
3.2.1 Introduction
Two types of oscilloscope are available: analogueor digital. Figure 3.5 shows the basic operation ofan analogue oscilloscope. Heating a wire createsa source of electrons, which are then accelerated
by suitable voltages and focused into a beam.This beam is directed towards a fluorescent screenwhere it causes light to be given off. This is thebasic cathode ray tube.
The plates as shown in the figure are known as Xand Y plates as they make the electron beam draw a‘graph’ of a voltage signal. The X plates are sup-plied with a saw tooth signal, which causes the beamto move across the screen from left to right and thento ‘fly back’ and start again. Being attracted towardswhichever plate has a positive potential the beammoves simply. The Y plates can now be used toshow voltage variations of the signal under test. Thefrequency of the saw tooth signal, known as the timebase, can be adjusted either automatically as is thecase with many analysers or manually on a standalone oscilloscope. The signal from the item undertest can either be amplified or attenuated (reduced),much like changing the scale on a voltmeter. Thetrigger, in other words when the trace across thescreen starts, can be caused internally or externally.In the case of the engine analyser triggering is oftenexternal, each time an individual spark fires or eachtime number one spark plug fires.
A digital oscilloscope has much the same endresult as the analogue type but the signal can bethought of as being plotted rather than drawn onthe screen. The test signal is A/D converted andthe time base is a simple timer or counter circuit.Because the signal is plotted digitally on a screenfrom data in memory, the ‘picture’ can be saved,frozen or even printed. The speed of data conver-sion and the sampling rate as well as the reso-lution of the screen are very important in ensuringaccurate results. This technique is becoming thenorm as including scales and notes or superim-posing two or more traces for comparison canenhance the display.
A very useful piece of equipment becomingvery popular is the PC based system as shown inFigure 3.6. This is a digital oscilloscope, whichallows data to be displayed on a PC. The Scope
28 Advanced automotive fault diagnosis
Figure 3.4 Logic probe
Y plates
X plates
Electron beam
Screen
Figure 3.5 Analogue oscilloscope principle
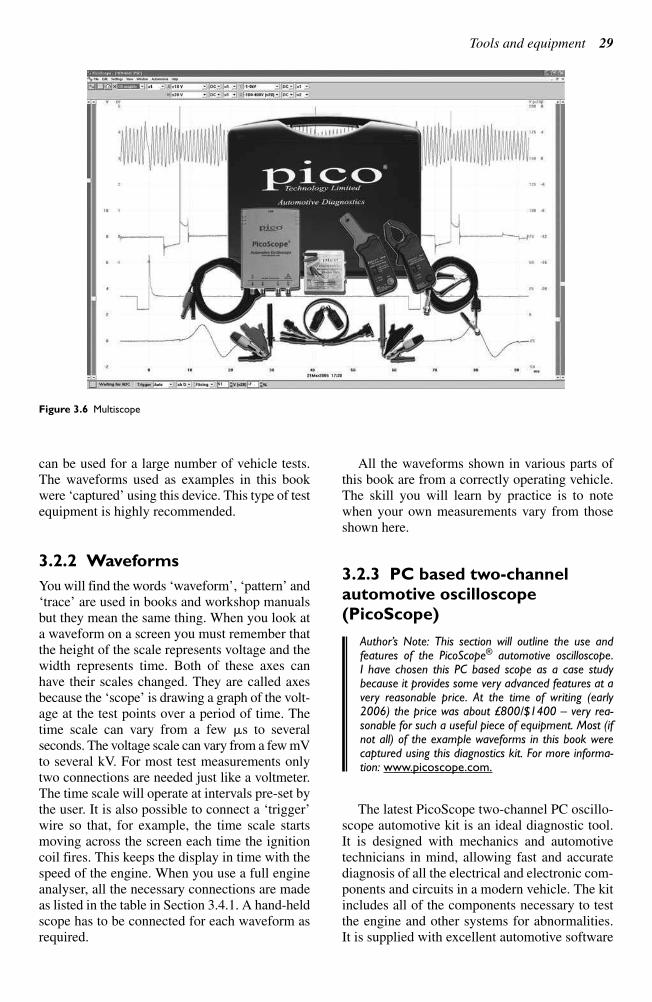
can be used for a large number of vehicle tests.The waveforms used as examples in this bookwere ‘captured’ using this device. This type of testequipment is highly recommended.
3.2.2 Waveforms
You will find the words ‘waveform’, ‘pattern’ and‘trace’ are used in books and workshop manualsbut they mean the same thing. When you look ata waveform on a screen you must remember thatthe height of the scale represents voltage and thewidth represents time. Both of these axes canhave their scales changed. They are called axesbecause the ‘scope’ is drawing a graph of the volt-age at the test points over a period of time. Thetime scale can vary from a few s to several seconds. The voltage scale can vary from a few mVto several kV. For most test measurements onlytwo connections are needed just like a voltmeter.The time scale will operate at intervals pre-set bythe user. It is also possible to connect a ‘trigger’wire so that, for example, the time scale startsmoving across the screen each time the ignitioncoil fires. This keeps the display in time with thespeed of the engine. When you use a full engineanalyser, all the necessary connections are madeas listed in the table in Section 3.4.1. A hand-heldscope has to be connected for each waveform asrequired.
All the waveforms shown in various parts ofthis book are from a correctly operating vehicle.The skill you will learn by practice is to notewhen your own measurements vary from thoseshown here.
3.2.3 PC based two-channel
automotive oscilloscope
(PicoScope)
Author’s Note: This section will outline the use andfeatures of the PicoScope® automotive oscilloscope.I have chosen this PC based scope as a case studybecause it provides some very advanced features at avery reasonable price. At the time of writing (early2006) the price was about £800/$1400 – very rea-sonable for such a useful piece of equipment. Most (ifnot all) of the example waveforms in this book werecaptured using this diagnostics kit. For more informa-tion: www.picoscope.com.
The latest PicoScope two-channel PC oscillo-scope automotive kit is an ideal diagnostic tool.It is designed with mechanics and automotivetechnicians in mind, allowing fast and accuratediagnosis of all the electrical and electronic com-ponents and circuits in a modern vehicle. The kitincludes all of the components necessary to testthe engine and other systems for abnormalities. It is supplied with excellent automotive software
Tools and equipment 29
Figure 3.6 Multiscope
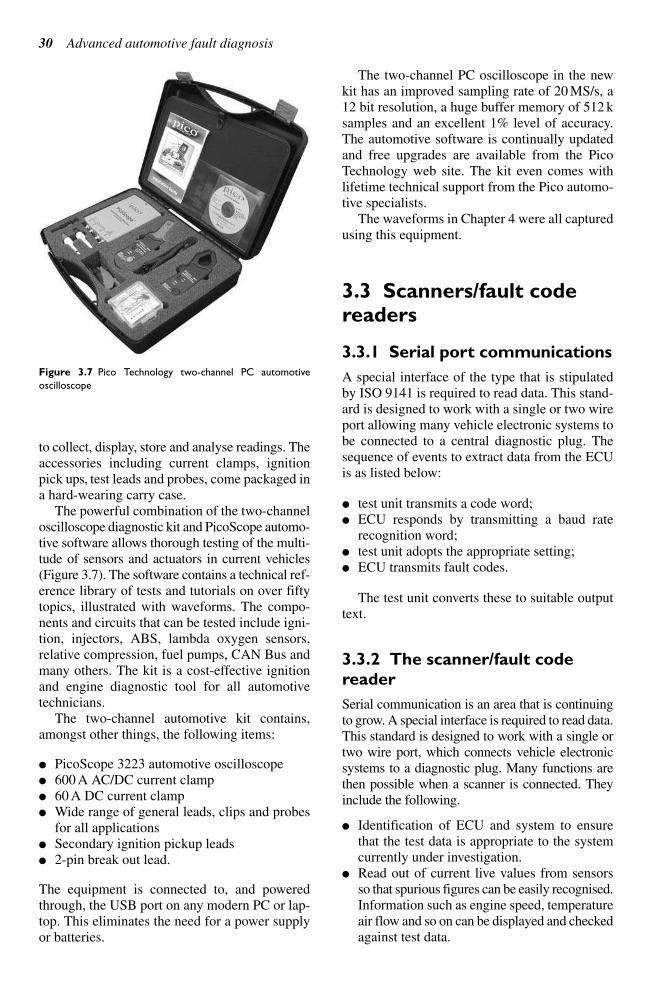
to collect, display, store and analyse readings. Theaccessories including current clamps, ignitionpick ups, test leads and probes, come packaged ina hard-wearing carry case.
The powerful combination of the two-channeloscilloscope diagnostic kit and PicoScope automo-tive software allows thorough testing of the multi-tude of sensors and actuators in current vehicles(Figure 3.7). The software contains a technical ref-erence library of tests and tutorials on over fiftytopics, illustrated with waveforms. The compo-nents and circuits that can be tested include igni-tion, injectors, ABS, lambda oxygen sensors,relative compression, fuel pumps, CAN Bus andmany others. The kit is a cost-effective ignitionand engine diagnostic tool for all automotivetechnicians.
The two-channel automotive kit contains,amongst other things, the following items:
PicoScope 3223 automotive oscilloscope 600 A AC/DC current clamp 60 A DC current clamp Wide range of general leads, clips and probes
for all applications Secondary ignition pickup leads 2-pin break out lead.
The equipment is connected to, and poweredthrough, the USB port on any modern PC or lap-top. This eliminates the need for a power supplyor batteries.
The two-channel PC oscilloscope in the newkit has an improved sampling rate of 20 MS/s, a12 bit resolution, a huge buffer memory of 512 ksamples and an excellent 1% level of accuracy.The automotive software is continually updatedand free upgrades are available from the PicoTechnology web site. The kit even comes withlifetime technical support from the Pico automo-tive specialists.
The waveforms in Chapter 4 were all capturedusing this equipment.
3.3 Scanners/fault codereaders
3.3.1 Serial port communications
A special interface of the type that is stipulatedby ISO 9141 is required to read data. This stand-ard is designed to work with a single or two wireport allowing many vehicle electronic systems tobe connected to a central diagnostic plug. Thesequence of events to extract data from the ECUis as listed below:
test unit transmits a code word; ECU responds by transmitting a baud rate
recognition word; test unit adopts the appropriate setting; ECU transmits fault codes.
The test unit converts these to suitable outputtext.
3.3.2 The scanner/fault code
reader
Serial communication is an area that is continuingto grow. A special interface is required to read data.This standard is designed to work with a single ortwo wire port, which connects vehicle electronicsystems to a diagnostic plug. Many functions arethen possible when a scanner is connected. Theyinclude the following.
Identification of ECU and system to ensurethat the test data is appropriate to the systemcurrently under investigation.
Read out of current live values from sensorsso that spurious figures can be easily recognised.Information such as engine speed, temperatureair flow and so on can be displayed and checkedagainst test data.
30 Advanced automotive fault diagnosis
Figure 3.7 Pico Technology two-channel PC automotive
oscilloscope
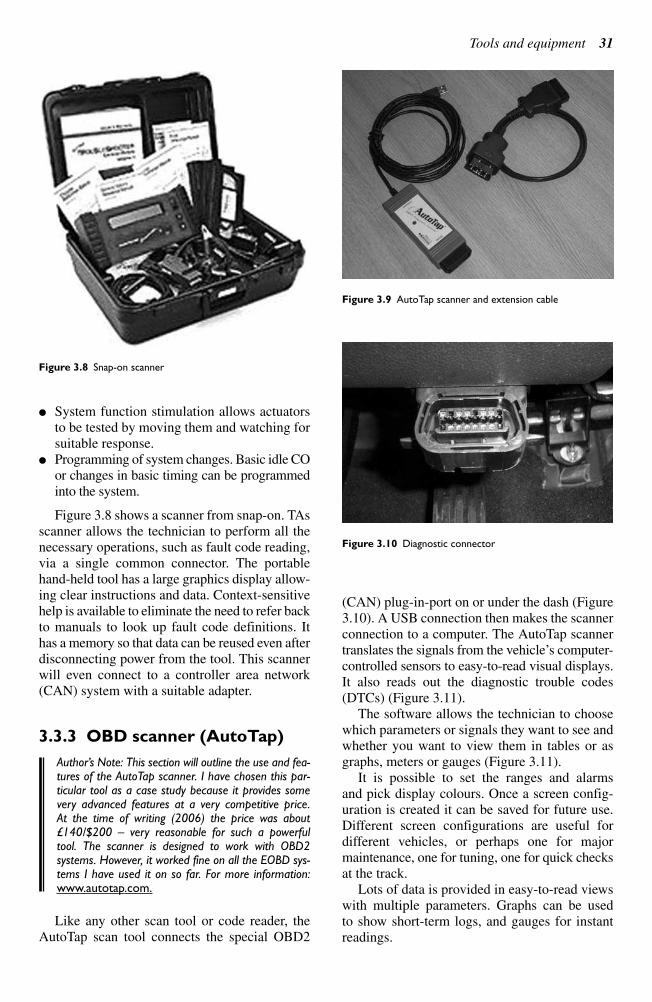
System function stimulation allows actuatorsto be tested by moving them and watching forsuitable response.
Programming of system changes. Basic idle COor changes in basic timing can be programmedinto the system.
Figure 3.8 shows a scanner from snap-on. TAsscanner allows the technician to perform all thenecessary operations, such as fault code reading,via a single common connector. The portablehand-held tool has a large graphics display allow-ing clear instructions and data. Context-sensitivehelp is available to eliminate the need to refer backto manuals to look up fault code definitions. Ithas a memory so that data can be reused even afterdisconnecting power from the tool. This scannerwill even connect to a controller area network(CAN) system with a suitable adapter.
3.3.3 OBD scanner (AutoTap)
Author’s Note: This section will outline the use and fea-tures of the AutoTap scanner. I have chosen this par-ticular tool as a case study because it provides somevery advanced features at a very competitive price.At the time of writing (2006) the price was about£140/$200 – very reasonable for such a powerfultool. The scanner is designed to work with OBD2 systems. However, it worked fine on all the EOBD sys-tems I have used it on so far. For more information:www.autotap.com.
Like any other scan tool or code reader, theAutoTap scan tool connects the special OBD2
(CAN) plug-in-port on or under the dash (Figure3.10). A USB connection then makes the scannerconnection to a computer. The AutoTap scannertranslates the signals from the vehicle’s computer-controlled sensors to easy-to-read visual displays.It also reads out the diagnostic trouble codes(DTCs) (Figure 3.11).
The software allows the technician to choosewhich parameters or signals they want to see andwhether you want to view them in tables or asgraphs, meters or gauges (Figure 3.11).
It is possible to set the ranges and alarms and pick display colours. Once a screen config-uration is created it can be saved for future use.Different screen configurations are useful for different vehicles, or perhaps one for majormaintenance, one for tuning, one for quick checksat the track.
Lots of data is provided in easy-to-read viewswith multiple parameters. Graphs can be used to show short-term logs, and gauges for instantreadings.
Tools and equipment 31
Figure 3.8 Snap-on scanner
Figure 3.9 AutoTap scanner and extension cable
Figure 3.10 Diagnostic connector
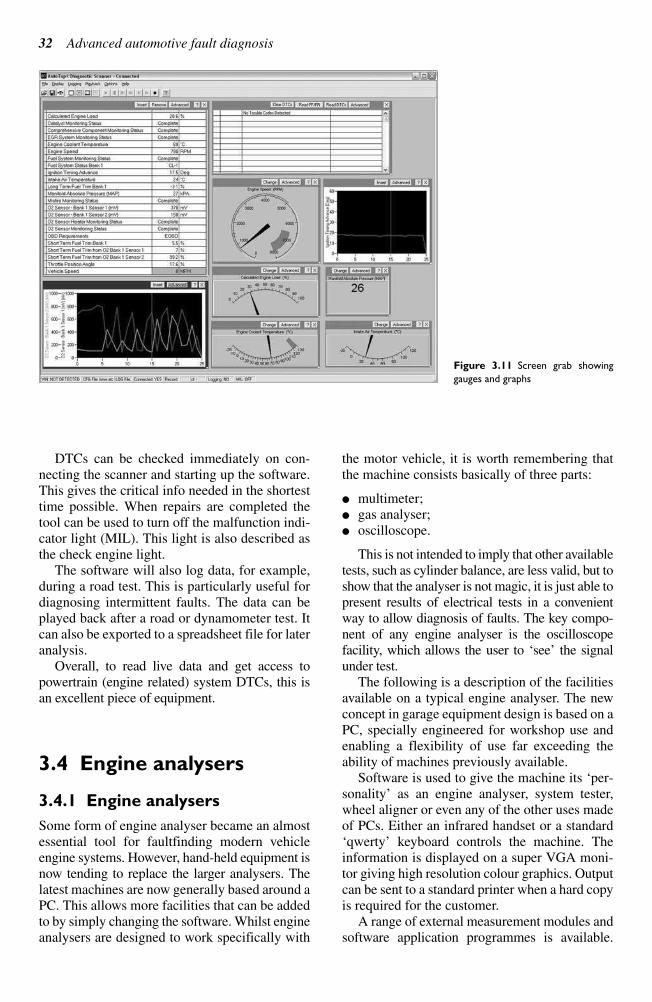
DTCs can be checked immediately on con-necting the scanner and starting up the software.This gives the critical info needed in the shortesttime possible. When repairs are completed thetool can be used to turn off the malfunction indi-cator light (MIL). This light is also described asthe check engine light.
The software will also log data, for example,during a road test. This is particularly useful fordiagnosing intermittent faults. The data can beplayed back after a road or dynamometer test. Itcan also be exported to a spreadsheet file for lateranalysis.
Overall, to read live data and get access to powertrain (engine related) system DTCs, this isan excellent piece of equipment.
3.4 Engine analysers
3.4.1 Engine analysers
Some form of engine analyser became an almostessential tool for faultfinding modern vehicleengine systems. However, hand-held equipment isnow tending to replace the larger analysers. Thelatest machines are now generally based around aPC. This allows more facilities that can be addedto by simply changing the software. Whilst engineanalysers are designed to work specifically with
the motor vehicle, it is worth remembering thatthe machine consists basically of three parts:
multimeter; gas analyser; oscilloscope.
This is not intended to imply that other availabletests, such as cylinder balance, are less valid, but toshow that the analyser is not magic, it is just able topresent results of electrical tests in a convenientway to allow diagnosis of faults. The key compo-nent of any engine analyser is the oscilloscopefacility, which allows the user to ‘see’ the signalunder test.
The following is a description of the facilitiesavailable on a typical engine analyser. The newconcept in garage equipment design is based on aPC, specially engineered for workshop use andenabling a flexibility of use far exceeding theability of machines previously available.
Software is used to give the machine its ‘per-sonality’ as an engine analyser, system tester,wheel aligner or even any of the other uses madeof PCs. Either an infrared handset or a standard‘qwerty’ keyboard controls the machine. Theinformation is displayed on a super VGA moni-tor giving high resolution colour graphics. Outputcan be sent to a standard printer when a hard copyis required for the customer.
A range of external measurement modules andsoftware application programmes is available.
32 Advanced automotive fault diagnosis
Figure 3.11 Screen grab showing
gauges and graphs
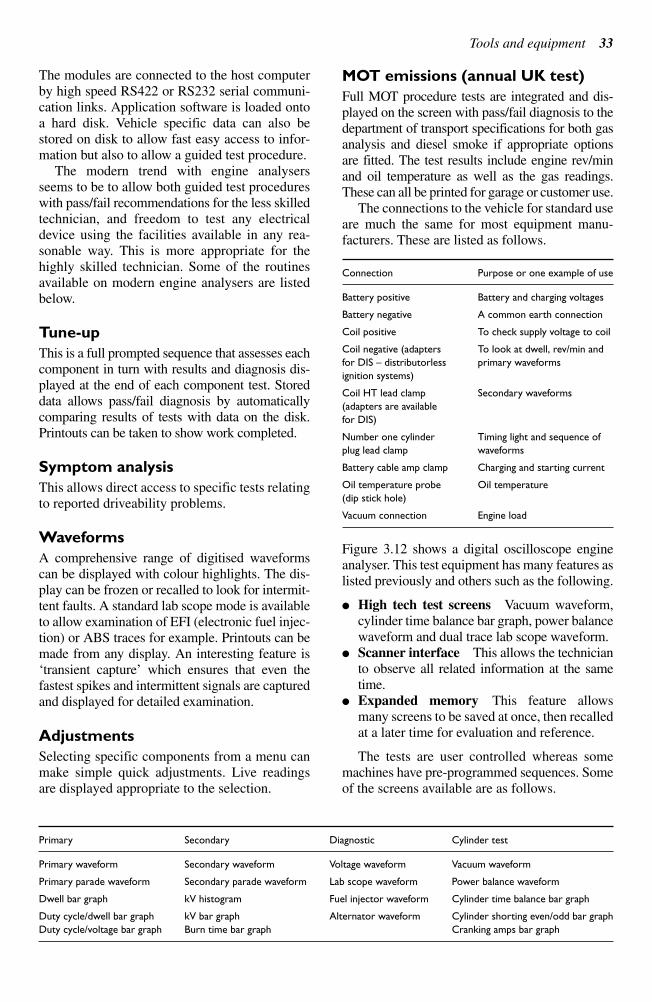
The modules are connected to the host computerby high speed RS422 or RS232 serial communi-cation links. Application software is loaded ontoa hard disk. Vehicle specific data can also bestored on disk to allow fast easy access to infor-mation but also to allow a guided test procedure.
The modern trend with engine analysersseems to be to allow both guided test procedureswith pass/fail recommendations for the less skilledtechnician, and freedom to test any electricaldevice using the facilities available in any rea-sonable way. This is more appropriate for thehighly skilled technician. Some of the routinesavailable on modern engine analysers are listedbelow.
Tune-up
This is a full prompted sequence that assesses eachcomponent in turn with results and diagnosis dis-played at the end of each component test. Storeddata allows pass/fail diagnosis by automaticallycomparing results of tests with data on the disk.Printouts can be taken to show work completed.
Symptom analysis
This allows direct access to specific tests relatingto reported driveability problems.
Waveforms
A comprehensive range of digitised waveformscan be displayed with colour highlights. The dis-play can be frozen or recalled to look for intermit-tent faults. A standard lab scope mode is availableto allow examination of EFI (electronic fuel injec-tion) or ABS traces for example. Printouts can bemade from any display. An interesting feature is‘transient capture’ which ensures that even thefastest spikes and intermittent signals are capturedand displayed for detailed examination.
Adjustments
Selecting specific components from a menu canmake simple quick adjustments. Live readingsare displayed appropriate to the selection.
MOT emissions (annual UK test)
Full MOT procedure tests are integrated and dis-played on the screen with pass/fail diagnosis to thedepartment of transport specifications for both gasanalysis and diesel smoke if appropriate optionsare fitted. The test results include engine rev/minand oil temperature as well as the gas readings.These can all be printed for garage or customer use.
The connections to the vehicle for standard useare much the same for most equipment manu-facturers. These are listed as follows.
Connection Purpose or one example of use
Battery positive Battery and charging voltages
Battery negative A common earth connection
Coil positive To check supply voltage to coil
Coil negative (adapters To look at dwell, rev/min and
for DIS – distributorless primary waveforms
ignition systems)
Coil HT lead clamp Secondary waveforms
(adapters are available
for DIS)
Number one cylinder Timing light and sequence of
plug lead clamp waveforms
Battery cable amp clamp Charging and starting current
Oil temperature probe Oil temperature
(dip stick hole)
Vacuum connection Engine load
Figure 3.12 shows a digital oscilloscope engineanalyser. This test equipment has many features aslisted previously and others such as the following.
High tech test screens Vacuum waveform,cylinder time balance bar graph, power balancewaveform and dual trace lab scope waveform.
Scanner interface This allows the technicianto observe all related information at the sametime.
Expanded memory This feature allowsmany screens to be saved at once, then recalledat a later time for evaluation and reference.
The tests are user controlled whereas somemachines have pre-programmed sequences. Someof the screens available are as follows.
Tools and equipment 33
Primary Secondary Diagnostic Cylinder test
Primary waveform Secondary waveform Voltage waveform Vacuum waveform
Primary parade waveform Secondary parade waveform Lab scope waveform Power balance waveform
Dwell bar graph kV histogram Fuel injector waveform Cylinder time balance bar graph
Duty cycle/dwell bar graph kV bar graph Alternator waveform Cylinder shorting even/odd bar graph
Duty cycle/voltage bar graph Burn time bar graph Cranking amps bar graph
3.4.2 Exhaust gas measurement
It has now become standard to measure four ofthe main exhaust gases namely:
carbon monoxide (CO); carbon dioxide (CO2); hydrocarbons (HC); oxygen (O2).
The emission test module is often self-containedwith its own display but can be linked to the mainanalyser display. Often lambda value and the airfuel ratio are displayed in addition to the fourgasses. The Greek symbol lambda () is used torepresent the ideal air fuel ratio (AFR) of 14.7:1by mass. In other words just the right amount ofair to burn up all the fuel. Typical gas, lambdaand AFR readings are given in Table 3.1 for aclosed loop lambda control system, before (orwithout) and after the catalytic converter. Theseare for a modern engine in excellent condition(examples only – always check current data).
The composition of exhaust gas is now a crit-ical measurement and hence a certain degree ofaccuracy is required. To this end the infraredmeasurement technique has become the mostsuitable for CO, CO2 and HC. Each individualgas absorbs infrared radiation at a specific rate.
Oxygen is measured by electro-chemicalmeans in much the same way as the on vehiclelambda sensor. CO is measured using a beam ofinfrared light. A similar technique is used for the
measurement of CO2 and HC. At present it is notpossible to measure NOx without more sophisti-cated laboratory equipment.
Good four-gas emission analysers often havethe following features.
Stand alone unit not dependent on otherequipment.
Graph screen simultaneously displays up tofour values as graphs and the graph displayorder is user selectable. Select from HC, CO,CO2, O2 and rev/min for graph display.
User can create personalised letterhead forscreen printouts.
Uses the non-dispersive infrared (NDIR)method of detection (each individual gasabsorbs infrared light at a specific rate).
Display screens may be frozen or stored inmemory for future retrieval.
Recalibrate at the touch of a button (if calibra-tion gas and a regulator are used).
Display exhaust gas concentrations in realtime numerics or create live exhaust gas datagraphs in selectable ranges.
Calculate and display lambda () (the ideal airfuel ratio of about 14.7:1).
Display engine rev/min in numeric or graphform and display oil temperature along withcurrent time and date.
Display engine diagnostic data from a scanner. Operate from mains supply or a 12 V battery.
Accurate measurement of exhaust gas is notonly required for annual tests but is essential toensure an engine is correctly tuned. Table 3.1 liststypical values measured from a typical exhaust.Note the toxic emissions are small, but none-the-less dangerous.
3.4.3 Pressure testing
Measuring the fuel pressure on a fuel injectionengine is of great value when faultfinding. Manytypes of pressure testers are available and they
34 Advanced automotive fault diagnosis
Figure 3.12 Engine analyser
Table 3.1
Reading CO% Hc (ppm) CO2% O2% Lambda () AFR
Before 0.6 120 14.7 0.7 1.0 14.7
catalyst
After 0.2 12 15.3 0.1 1.0 14.7
catalyst
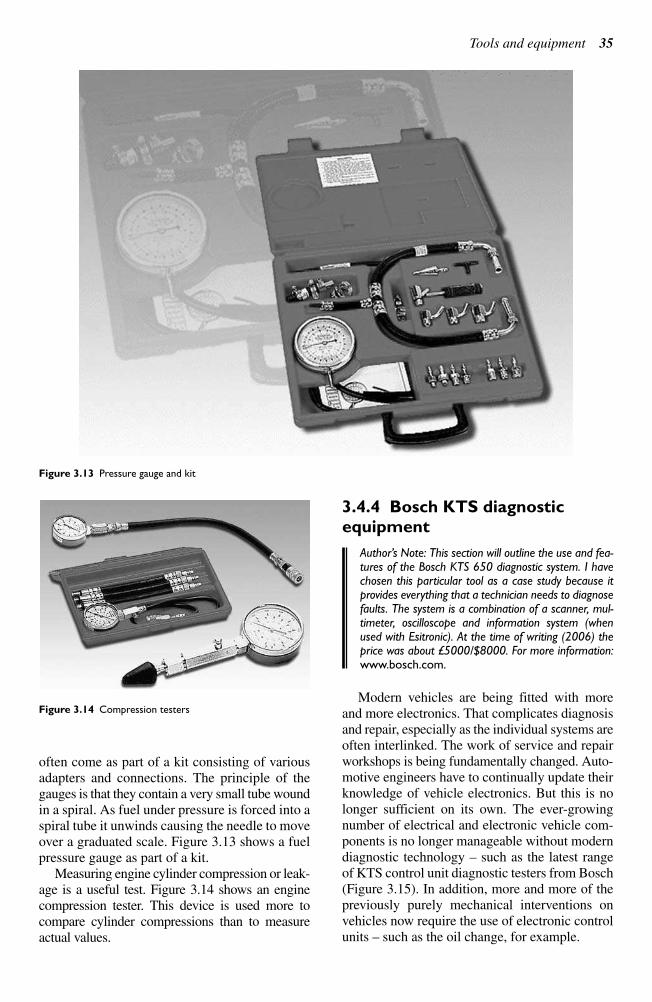
often come as part of a kit consisting of variousadapters and connections. The principle of thegauges is that they contain a very small tube woundin a spiral. As fuel under pressure is forced into aspiral tube it unwinds causing the needle to moveover a graduated scale. Figure 3.13 shows a fuelpressure gauge as part of a kit.
Measuring engine cylinder compression or leak-age is a useful test. Figure 3.14 shows an enginecompression tester. This device is used more tocompare cylinder compressions than to measureactual values.
3.4.4 Bosch KTS diagnostic
equipment
Author’s Note: This section will outline the use and fea-tures of the Bosch KTS 650 diagnostic system. I havechosen this particular tool as a case study because itprovides everything that a technician needs to diagnosefaults. The system is a combination of a scanner, mul-timeter, oscilloscope and information system (whenused with Esitronic). At the time of writing (2006) theprice was about £5000/$8000. For more information:www.bosch.com.
Modern vehicles are being fitted with moreand more electronics. That complicates diagnosisand repair, especially as the individual systems areoften interlinked. The work of service and repairworkshops is being fundamentally changed. Auto-motive engineers have to continually update theirknowledge of vehicle electronics. But this is nolonger sufficient on its own. The ever-growingnumber of electrical and electronic vehicle com-ponents is no longer manageable without moderndiagnostic technology – such as the latest rangeof KTS control unit diagnostic testers from Bosch(Figure 3.15). In addition, more and more of thepreviously purely mechanical interventions onvehicles now require the use of electronic controlunits – such as the oil change, for example.
Tools and equipment 35
Figure 3.13 Pressure gauge and kit
Figure 3.14 Compression testers
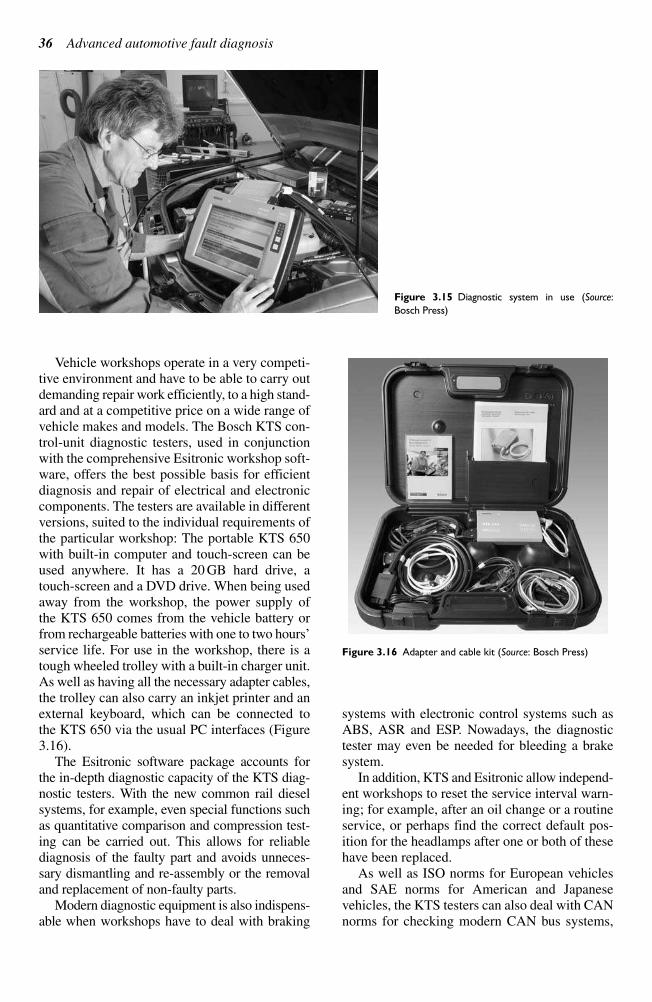
Vehicle workshops operate in a very competi-tive environment and have to be able to carry outdemanding repair work efficiently, to a high stand-ard and at a competitive price on a wide range ofvehicle makes and models. The Bosch KTS con-trol-unit diagnostic testers, used in conjunctionwith the comprehensive Esitronic workshop soft-ware, offers the best possible basis for efficientdiagnosis and repair of electrical and electroniccomponents. The testers are available in differentversions, suited to the individual requirements ofthe particular workshop: The portable KTS 650with built-in computer and touch-screen can beused anywhere. It has a 20 GB hard drive, atouch-screen and a DVD drive. When being usedaway from the workshop, the power supply ofthe KTS 650 comes from the vehicle battery orfrom rechargeable batteries with one to two hours’service life. For use in the workshop, there is atough wheeled trolley with a built-in charger unit.As well as having all the necessary adapter cables,the trolley can also carry an inkjet printer and anexternal keyboard, which can be connected to the KTS 650 via the usual PC interfaces (Figure3.16).
The Esitronic software package accounts forthe in-depth diagnostic capacity of the KTS diag-nostic testers. With the new common rail dieselsystems, for example, even special functions suchas quantitative comparison and compression test-ing can be carried out. This allows for reliablediagnosis of the faulty part and avoids unneces-sary dismantling and re-assembly or the removaland replacement of non-faulty parts.
Modern diagnostic equipment is also indispens-able when workshops have to deal with braking
systems with electronic control systems such asABS, ASR and ESP. Nowadays, the diagnostictester may even be needed for bleeding a brakesystem.
In addition, KTS and Esitronic allow independ-ent workshops to reset the service interval warn-ing; for example, after an oil change or a routineservice, or perhaps find the correct default pos-ition for the headlamps after one or both of thesehave been replaced.
As well as ISO norms for European vehiclesand SAE norms for American and Japanese vehicles, the KTS testers can also deal with CANnorms for checking modern CAN bus systems,
36 Advanced automotive fault diagnosis
Figure 3.15 Diagnostic system in use (Source:
Bosch Press)
Figure 3.16 Adapter and cable kit (Source: Bosch Press)
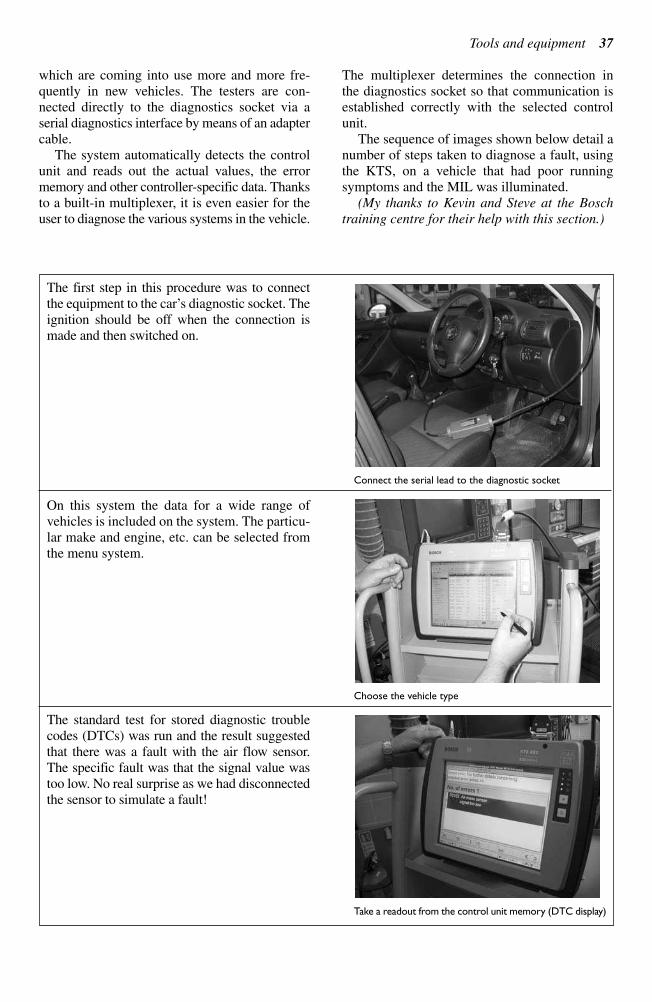
which are coming into use more and more fre-quently in new vehicles. The testers are con-nected directly to the diagnostics socket via aserial diagnostics interface by means of an adaptercable.
The system automatically detects the controlunit and reads out the actual values, the errormemory and other controller-specific data. Thanksto a built-in multiplexer, it is even easier for theuser to diagnose the various systems in the vehicle.
The multiplexer determines the connection in the diagnostics socket so that communication isestablished correctly with the selected controlunit.
The sequence of images shown below detail anumber of steps taken to diagnose a fault, usingthe KTS, on a vehicle that had poor runningsymptoms and the MIL was illuminated.
(My thanks to Kevin and Steve at the Bosch
training centre for their help with this section.)
Tools and equipment 37
The first step in this procedure was to connectthe equipment to the car’s diagnostic socket. Theignition should be off when the connection ismade and then switched on.
On this system the data for a wide range ofvehicles is included on the system. The particu-lar make and engine, etc. can be selected fromthe menu system.
The standard test for stored diagnostic troublecodes (DTCs) was run and the result suggestedthat there was a fault with the air flow sensor.The specific fault was that the signal value wastoo low. No real surprise as we had disconnectedthe sensor to simulate a fault!
Connect the serial lead to the diagnostic socket
Choose the vehicle type
Take a readout from the control unit memory (DTC display)
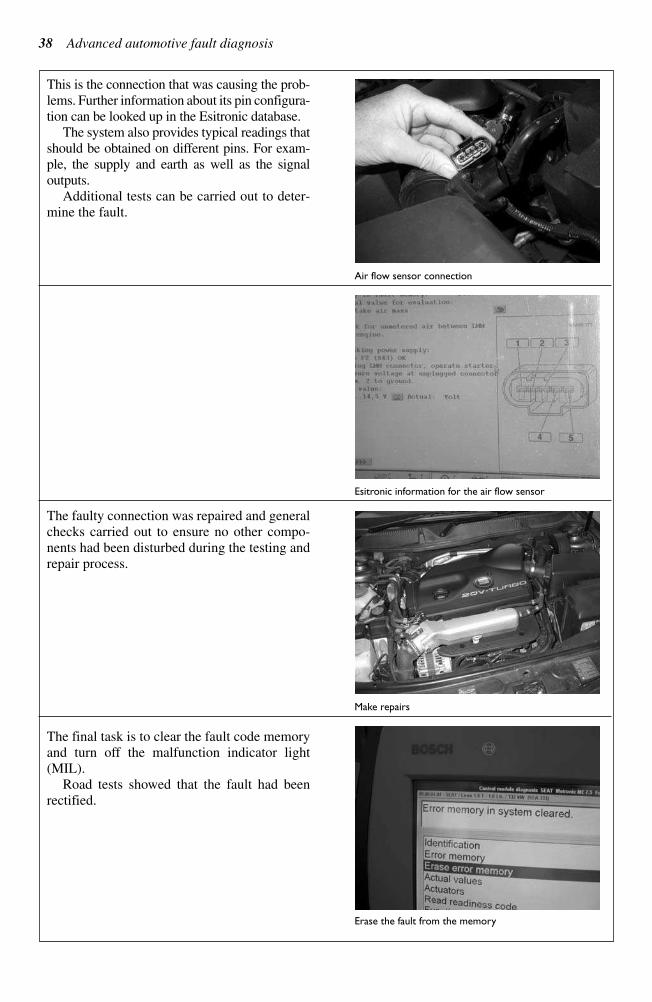
38 Advanced automotive fault diagnosis
This is the connection that was causing the prob-lems. Further information about its pin configura-tion can be looked up in the Esitronic database.
The system also provides typical readings thatshould be obtained on different pins. For exam-ple, the supply and earth as well as the signal outputs.
Additional tests can be carried out to deter-mine the fault.
The faulty connection was repaired and generalchecks carried out to ensure no other compo-nents had been disturbed during the testing andrepair process.
Air flow sensor connection
Esitronic information for the air flow sensor
Make repairs
The final task is to clear the fault code memoryand turn off the malfunction indicator light(MIL).
Road tests showed that the fault had beenrectified.
Erase the fault from the memory

Tools and equipment 39
Knowledge check questions
To use these questions, you should first try to answer them without help but if necessary, refer back to
the content of the chapter. Use notes, lists and sketches to answer them. It is not necessary to write
pages and pages of text!
1. Explain why a good multimeter has a high internal resistance.
2. List three advantages of using an oscilloscope for testing signals.
3. Describe how a scanner is connected to a vehicle and what information it can provide.
4. State what is meant by the term ‘accuracy’.
5. List five tests carried out on a vehicle using a pressure gauge.
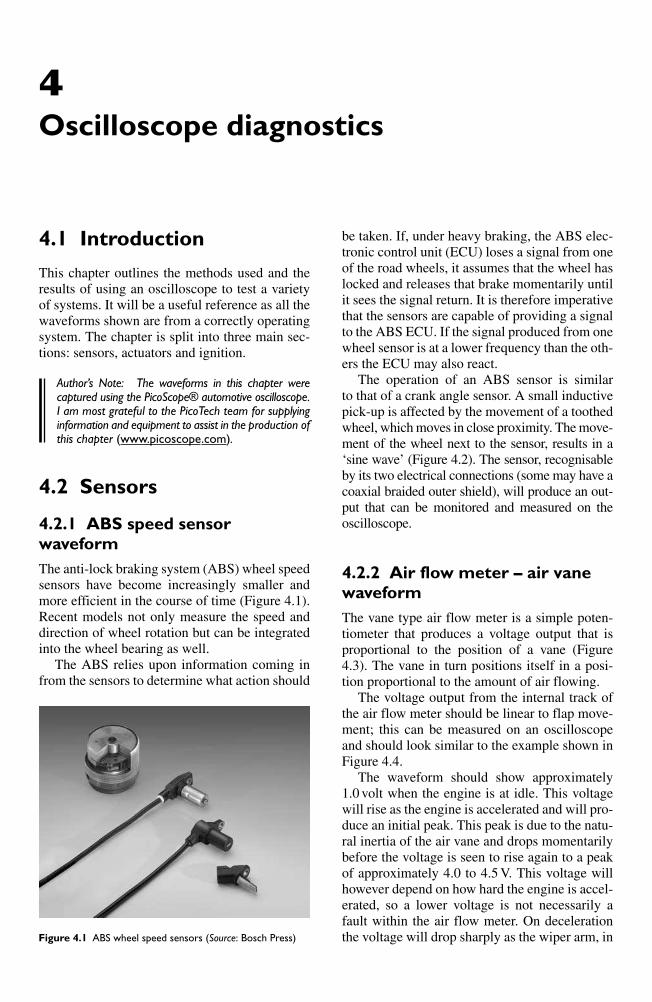
4.1 Introduction
This chapter outlines the methods used and theresults of using an oscilloscope to test a varietyof systems. It will be a useful reference as all thewaveforms shown are from a correctly operatingsystem. The chapter is split into three main sec-tions: sensors, actuators and ignition.
Author’s Note: The waveforms in this chapter werecaptured using the PicoScope® automotive oscilloscope.I am most grateful to the PicoTech team for supplyinginformation and equipment to assist in the production ofthis chapter (www.picoscope.com).
4.2 Sensors
4.2.1 ABS speed sensor
waveform
The anti-lock braking system (ABS) wheel speedsensors have become increasingly smaller andmore efficient in the course of time (Figure 4.1).Recent models not only measure the speed anddirection of wheel rotation but can be integratedinto the wheel bearing as well.
The ABS relies upon information coming infrom the sensors to determine what action should
be taken. If, under heavy braking, the ABS elec-tronic control unit (ECU) loses a signal from oneof the road wheels, it assumes that the wheel haslocked and releases that brake momentarily untilit sees the signal return. It is therefore imperativethat the sensors are capable of providing a signalto the ABS ECU. If the signal produced from onewheel sensor is at a lower frequency than the oth-ers the ECU may also react.
The operation of an ABS sensor is similar to that of a crank angle sensor. A small inductivepick-up is affected by the movement of a toothedwheel, which moves in close proximity. The move-ment of the wheel next to the sensor, results in a‘sine wave’ (Figure 4.2). The sensor, recognisableby its two electrical connections (some may have acoaxial braided outer shield), will produce an out-put that can be monitored and measured on theoscilloscope.
4.2.2 Air flow meter – air vane
waveform
The vane type air flow meter is a simple poten-tiometer that produces a voltage output that isproportional to the position of a vane (Figure4.3). The vane in turn positions itself in a posi-tion proportional to the amount of air flowing.
The voltage output from the internal track ofthe air flow meter should be linear to flap move-ment; this can be measured on an oscilloscopeand should look similar to the example shown inFigure 4.4.
The waveform should show approximately1.0 volt when the engine is at idle. This voltagewill rise as the engine is accelerated and will pro-duce an initial peak. This peak is due to the natu-ral inertia of the air vane and drops momentarilybefore the voltage is seen to rise again to a peakof approximately 4.0 to 4.5 V. This voltage willhowever depend on how hard the engine is accel-erated, so a lower voltage is not necessarily afault within the air flow meter. On decelerationthe voltage will drop sharply as the wiper arm, in
4
Oscilloscope diagnostics
Figure 4.1 ABS wheel speed sensors (Source: Bosch Press)
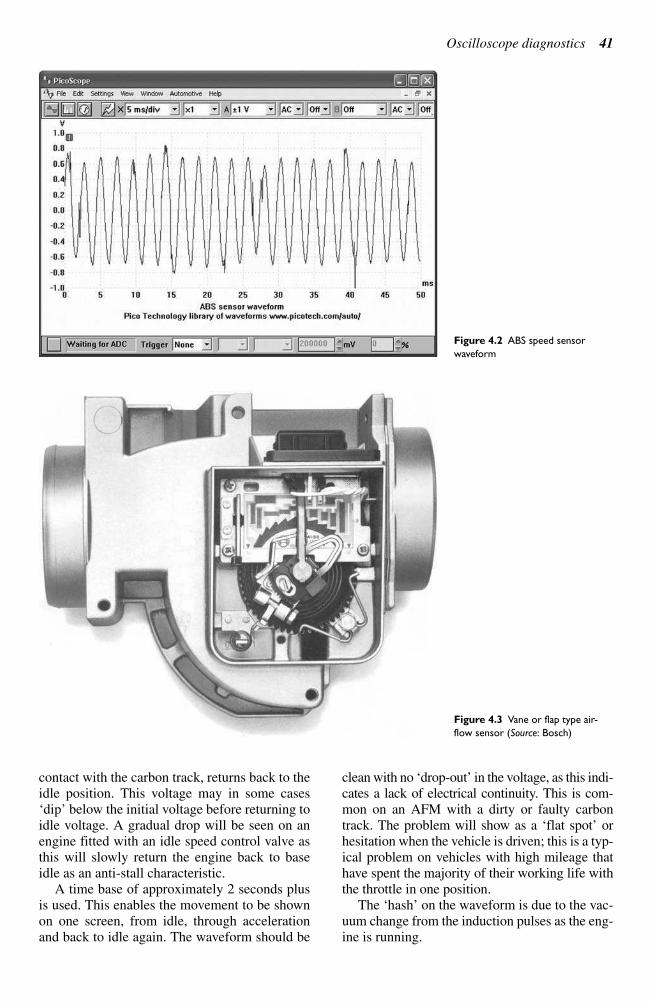
Oscilloscope diagnostics 41
contact with the carbon track, returns back to theidle position. This voltage may in some cases‘dip’ below the initial voltage before returning toidle voltage. A gradual drop will be seen on anengine fitted with an idle speed control valve asthis will slowly return the engine back to baseidle as an anti-stall characteristic.
A time base of approximately 2 seconds plusis used. This enables the movement to be shownon one screen, from idle, through accelerationand back to idle again. The waveform should be
clean with no ‘drop-out’ in the voltage, as this indi-cates a lack of electrical continuity. This is com-mon on an AFM with a dirty or faulty carbontrack. The problem will show as a ‘flat spot’ orhesitation when the vehicle is driven; this is a typ-ical problem on vehicles with high mileage thathave spent the majority of their working life withthe throttle in one position.
The ‘hash’ on the waveform is due to the vac-uum change from the induction pulses as the eng-ine is running.
Figure 4.2 ABS speed sensor
waveform
Figure 4.3 Vane or flap type air-
flow sensor (Source: Bosch)
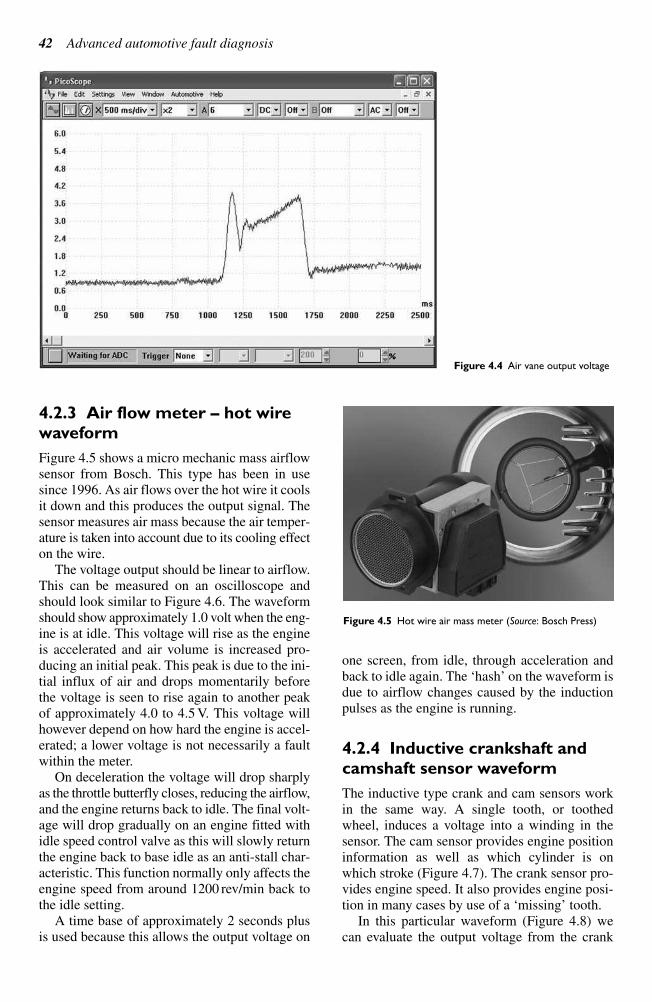
42 Advanced automotive fault diagnosis
4.2.3 Air flow meter – hot wire
waveform
Figure 4.5 shows a micro mechanic mass airflowsensor from Bosch. This type has been in usesince 1996. As air flows over the hot wire it coolsit down and this produces the output signal. Thesensor measures air mass because the air temper-ature is taken into account due to its cooling effecton the wire.
The voltage output should be linear to airflow.This can be measured on an oscilloscope andshould look similar to Figure 4.6. The waveformshould show approximately 1.0 volt when the eng-ine is at idle. This voltage will rise as the engineis accelerated and air volume is increased pro-ducing an initial peak. This peak is due to the ini-tial influx of air and drops momentarily beforethe voltage is seen to rise again to another peakof approximately 4.0 to 4.5 V. This voltage willhowever depend on how hard the engine is accel-erated; a lower voltage is not necessarily a faultwithin the meter.
On deceleration the voltage will drop sharplyas the throttle butterfly closes, reducing the airflow,and the engine returns back to idle. The final volt-age will drop gradually on an engine fitted withidle speed control valve as this will slowly returnthe engine back to base idle as an anti-stall char-acteristic. This function normally only affects theengine speed from around 1200 rev/min back tothe idle setting.
A time base of approximately 2 seconds plusis used because this allows the output voltage on
one screen, from idle, through acceleration andback to idle again. The ‘hash’ on the waveform isdue to airflow changes caused by the inductionpulses as the engine is running.
4.2.4 Inductive crankshaft and
camshaft sensor waveform
The inductive type crank and cam sensors workin the same way. A single tooth, or toothedwheel, induces a voltage into a winding in thesensor. The cam sensor provides engine positioninformation as well as which cylinder is onwhich stroke (Figure 4.7). The crank sensor pro-vides engine speed. It also provides engine posi-tion in many cases by use of a ‘missing’ tooth.
In this particular waveform (Figure 4.8) wecan evaluate the output voltage from the crank
Figure 4.4 Air vane output voltage
Figure 4.5 Hot wire air mass meter (Source: Bosch Press)
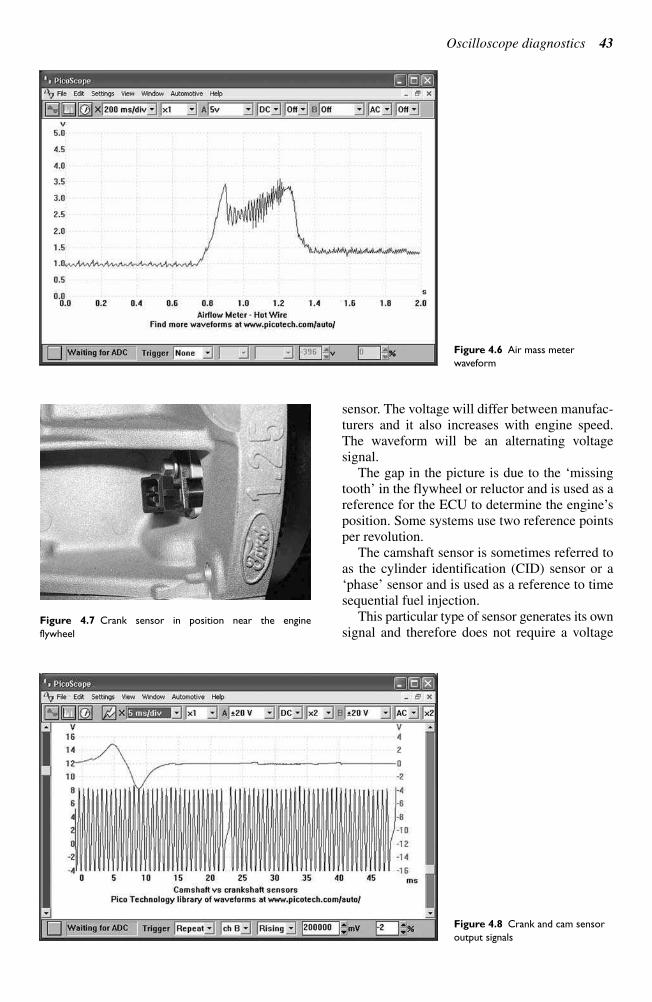
Oscilloscope diagnostics 43
sensor. The voltage will differ between manufac-turers and it also increases with engine speed.The waveform will be an alternating voltage signal.
The gap in the picture is due to the ‘missingtooth’ in the flywheel or reluctor and is used as areference for the ECU to determine the engine’sposition. Some systems use two reference pointsper revolution.
The camshaft sensor is sometimes referred toas the cylinder identification (CID) sensor or a‘phase’ sensor and is used as a reference to timesequential fuel injection.
This particular type of sensor generates its ownsignal and therefore does not require a voltage
Figure 4.6 Air mass meter
waveform
Figure 4.7 Crank sensor in position near the engine
flywheel
Figure 4.8 Crank and cam sensor
output signals
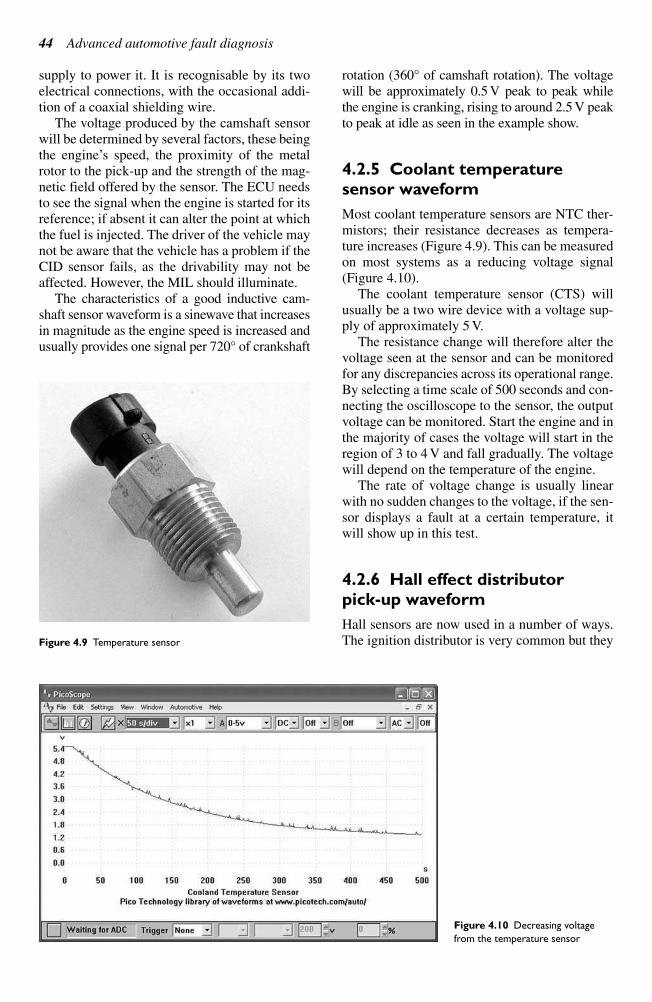
44 Advanced automotive fault diagnosis
Figure 4.10 Decreasing voltage
from the temperature sensor
supply to power it. It is recognisable by its twoelectrical connections, with the occasional addi-tion of a coaxial shielding wire.
The voltage produced by the camshaft sensorwill be determined by several factors, these beingthe engine’s speed, the proximity of the metalrotor to the pick-up and the strength of the mag-netic field offered by the sensor. The ECU needsto see the signal when the engine is started for itsreference; if absent it can alter the point at whichthe fuel is injected. The driver of the vehicle maynot be aware that the vehicle has a problem if theCID sensor fails, as the drivability may not beaffected. However, the MIL should illuminate.
The characteristics of a good inductive cam-shaft sensor waveform is a sinewave that increasesin magnitude as the engine speed is increased andusually provides one signal per 720° of crankshaft
rotation (360° of camshaft rotation). The voltagewill be approximately 0.5 V peak to peak whilethe engine is cranking, rising to around 2.5 V peakto peak at idle as seen in the example show.
4.2.5 Coolant temperature
sensor waveform
Most coolant temperature sensors are NTC ther-mistors; their resistance decreases as tempera-ture increases (Figure 4.9). This can be measuredon most systems as a reducing voltage signal(Figure 4.10).
The coolant temperature sensor (CTS) willusually be a two wire device with a voltage sup-ply of approximately 5 V.
The resistance change will therefore alter thevoltage seen at the sensor and can be monitoredfor any discrepancies across its operational range.By selecting a time scale of 500 seconds and con-necting the oscilloscope to the sensor, the outputvoltage can be monitored. Start the engine and inthe majority of cases the voltage will start in theregion of 3 to 4 V and fall gradually. The voltagewill depend on the temperature of the engine.
The rate of voltage change is usually linearwith no sudden changes to the voltage, if the sen-sor displays a fault at a certain temperature, itwill show up in this test.
4.2.6 Hall effect distributor
pick-up waveform
Hall sensors are now used in a number of ways.The ignition distributor is very common but theyFigure 4.9 Temperature sensor
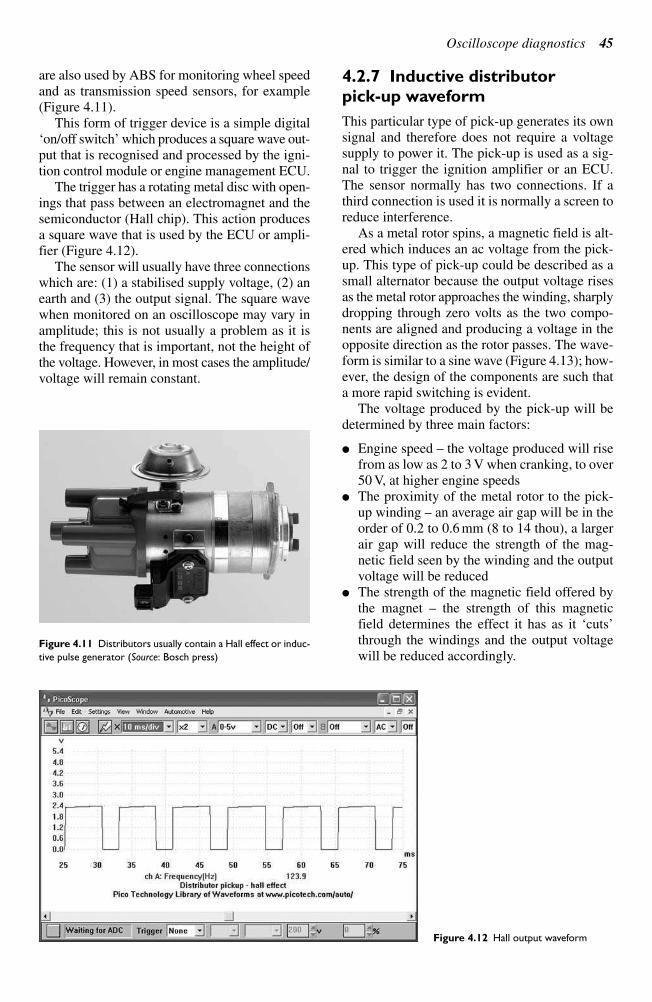
Oscilloscope diagnostics 45
are also used by ABS for monitoring wheel speedand as transmission speed sensors, for example(Figure 4.11).
This form of trigger device is a simple digital‘on/off switch’ which produces a square wave out-put that is recognised and processed by the igni-tion control module or engine management ECU.
The trigger has a rotating metal disc with open-ings that pass between an electromagnet and thesemiconductor (Hall chip). This action producesa square wave that is used by the ECU or ampli-fier (Figure 4.12).
The sensor will usually have three connectionswhich are: (1) a stabilised supply voltage, (2) anearth and (3) the output signal. The square wavewhen monitored on an oscilloscope may vary inamplitude; this is not usually a problem as it isthe frequency that is important, not the height ofthe voltage. However, in most cases the amplitude/voltage will remain constant.
4.2.7 Inductive distributor
pick-up waveform
This particular type of pick-up generates its ownsignal and therefore does not require a voltagesupply to power it. The pick-up is used as a sig-nal to trigger the ignition amplifier or an ECU.The sensor normally has two connections. If athird connection is used it is normally a screen toreduce interference.
As a metal rotor spins, a magnetic field is alt-ered which induces an ac voltage from the pick-up. This type of pick-up could be described as asmall alternator because the output voltage risesas the metal rotor approaches the winding, sharplydropping through zero volts as the two compo-nents are aligned and producing a voltage in theopposite direction as the rotor passes. The wave-form is similar to a sine wave (Figure 4.13); how-ever, the design of the components are such thata more rapid switching is evident.
The voltage produced by the pick-up will bedetermined by three main factors:
Engine speed – the voltage produced will risefrom as low as 2 to 3 V when cranking, to over50 V, at higher engine speeds
The proximity of the metal rotor to the pick-up winding – an average air gap will be in theorder of 0.2 to 0.6 mm (8 to 14 thou), a largerair gap will reduce the strength of the mag-netic field seen by the winding and the outputvoltage will be reduced
The strength of the magnetic field offered bythe magnet – the strength of this magneticfield determines the effect it has as it ‘cuts’through the windings and the output voltagewill be reduced accordingly.
Figure 4.11 Distributors usually contain a Hall effect or induc-
tive pulse generator (Source: Bosch press)
Figure 4.12 Hall output waveform
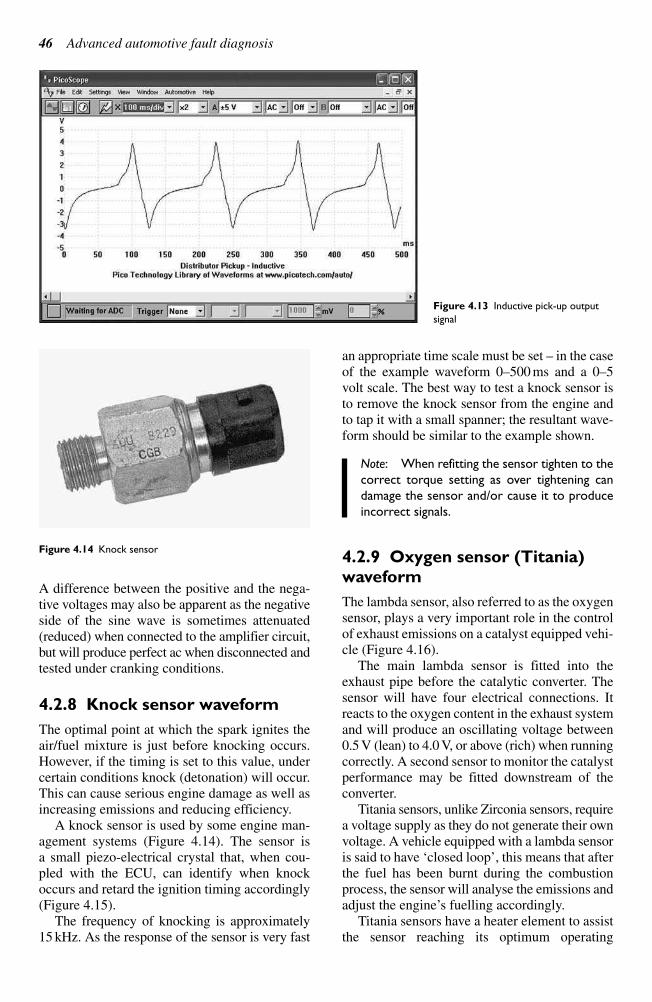
46 Advanced automotive fault diagnosis
A difference between the positive and the nega-tive voltages may also be apparent as the negativeside of the sine wave is sometimes attenuated(reduced) when connected to the amplifier circuit,but will produce perfect ac when disconnected andtested under cranking conditions.
4.2.8 Knock sensor waveform
The optimal point at which the spark ignites theair/fuel mixture is just before knocking occurs.However, if the timing is set to this value, undercertain conditions knock (detonation) will occur.This can cause serious engine damage as well asincreasing emissions and reducing efficiency.
A knock sensor is used by some engine man-agement systems (Figure 4.14). The sensor is a small piezo-electrical crystal that, when cou-pled with the ECU, can identify when knockoccurs and retard the ignition timing accordingly(Figure 4.15).
The frequency of knocking is approximately15 kHz. As the response of the sensor is very fast
an appropriate time scale must be set – in the caseof the example waveform 0–500 ms and a 0–5volt scale. The best way to test a knock sensor isto remove the knock sensor from the engine andto tap it with a small spanner; the resultant wave-form should be similar to the example shown.
Note: When refitting the sensor tighten to the
correct torque setting as over tightening can
damage the sensor and/or cause it to produce
incorrect signals.
4.2.9 Oxygen sensor (Titania)
waveform
The lambda sensor, also referred to as the oxygensensor, plays a very important role in the controlof exhaust emissions on a catalyst equipped vehi-cle (Figure 4.16).
The main lambda sensor is fitted into theexhaust pipe before the catalytic converter. Thesensor will have four electrical connections. Itreacts to the oxygen content in the exhaust systemand will produce an oscillating voltage between0.5 V (lean) to 4.0 V, or above (rich) when runningcorrectly. A second sensor to monitor the catalystperformance may be fitted downstream of theconverter.
Titania sensors, unlike Zirconia sensors, requirea voltage supply as they do not generate their ownvoltage. A vehicle equipped with a lambda sensoris said to have ‘closed loop’, this means that afterthe fuel has been burnt during the combustionprocess, the sensor will analyse the emissions andadjust the engine’s fuelling accordingly.
Titania sensors have a heater element to assistthe sensor reaching its optimum operating
Figure 4.13 Inductive pick-up output
signal
Figure 4.14 Knock sensor
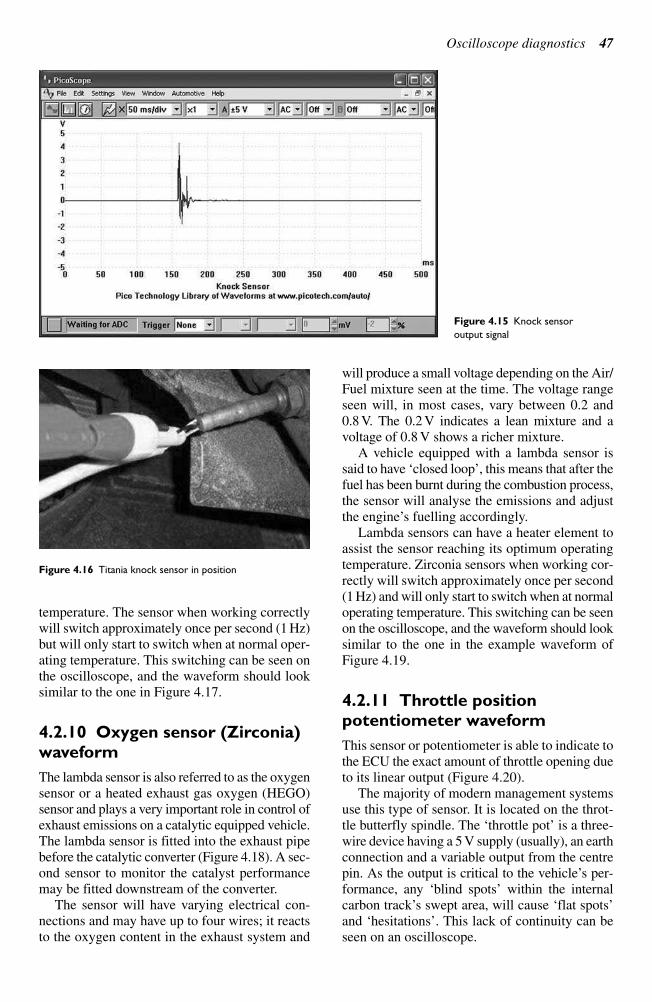
Oscilloscope diagnostics 47
temperature. The sensor when working correctlywill switch approximately once per second (1 Hz)but will only start to switch when at normal oper-ating temperature. This switching can be seen onthe oscilloscope, and the waveform should looksimilar to the one in Figure 4.17.
4.2.10 Oxygen sensor (Zirconia)
waveform
The lambda sensor is also referred to as the oxygensensor or a heated exhaust gas oxygen (HEGO)sensor and plays a very important role in control ofexhaust emissions on a catalytic equipped vehicle.The lambda sensor is fitted into the exhaust pipebefore the catalytic converter (Figure 4.18). A sec-ond sensor to monitor the catalyst performancemay be fitted downstream of the converter.
The sensor will have varying electrical con-nections and may have up to four wires; it reactsto the oxygen content in the exhaust system and
will produce a small voltage depending on the Air/Fuel mixture seen at the time. The voltage rangeseen will, in most cases, vary between 0.2 and0.8 V. The 0.2 V indicates a lean mixture and avoltage of 0.8 V shows a richer mixture.
A vehicle equipped with a lambda sensor issaid to have ‘closed loop’, this means that after thefuel has been burnt during the combustion process,the sensor will analyse the emissions and adjustthe engine’s fuelling accordingly.
Lambda sensors can have a heater element toassist the sensor reaching its optimum operatingtemperature. Zirconia sensors when working cor-rectly will switch approximately once per second(1 Hz) and will only start to switch when at normaloperating temperature. This switching can be seenon the oscilloscope, and the waveform should looksimilar to the one in the example waveform ofFigure 4.19.
4.2.11 Throttle position
potentiometer waveform
This sensor or potentiometer is able to indicate tothe ECU the exact amount of throttle opening dueto its linear output (Figure 4.20).
The majority of modern management systemsuse this type of sensor. It is located on the throt-tle butterfly spindle. The ‘throttle pot’ is a three-wire device having a 5 V supply (usually), an earthconnection and a variable output from the centrepin. As the output is critical to the vehicle’s per-formance, any ‘blind spots’ within the internalcarbon track’s swept area, will cause ‘flat spots’and ‘hesitations’. This lack of continuity can beseen on an oscilloscope.
Figure 4.15 Knock sensor
output signal
Figure 4.16 Titania knock sensor in position
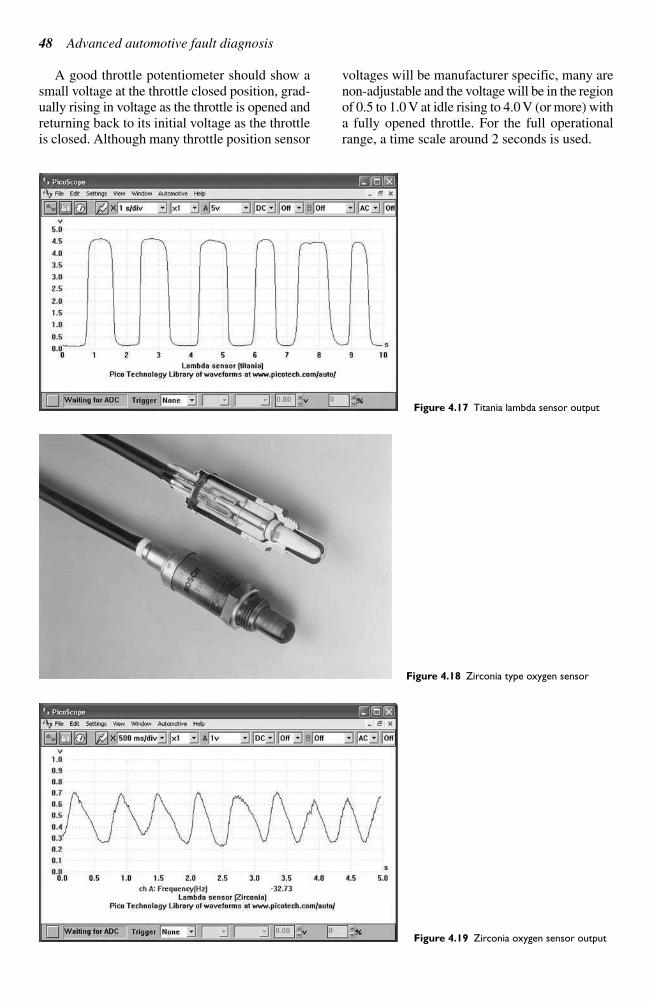
48 Advanced automotive fault diagnosis
Figure 4.19 Zirconia oxygen sensor output
A good throttle potentiometer should show asmall voltage at the throttle closed position, grad-ually rising in voltage as the throttle is opened andreturning back to its initial voltage as the throttleis closed. Although many throttle position sensor
voltages will be manufacturer specific, many arenon-adjustable and the voltage will be in the regionof 0.5 to 1.0 V at idle rising to 4.0 V (or more) witha fully opened throttle. For the full operationalrange, a time scale around 2 seconds is used.
Figure 4.17 Titania lambda sensor output
Figure 4.18 Zirconia type oxygen sensor
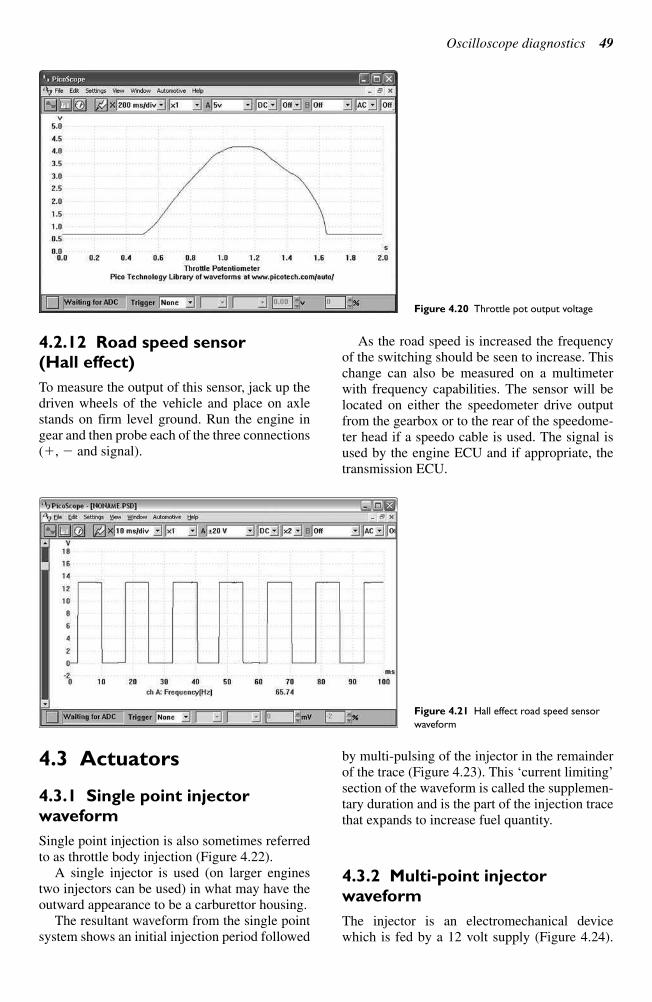
Oscilloscope diagnostics 49
Figure 4.20 Throttle pot output voltage
Figure 4.21 Hall effect road speed sensor
waveform
4.2.12 Road speed sensor
(Hall effect)
To measure the output of this sensor, jack up thedriven wheels of the vehicle and place on axlestands on firm level ground. Run the engine ingear and then probe each of the three connections(, and signal).
As the road speed is increased the frequencyof the switching should be seen to increase. Thischange can also be measured on a multimeterwith frequency capabilities. The sensor will belocated on either the speedometer drive outputfrom the gearbox or to the rear of the speedome-ter head if a speedo cable is used. The signal isused by the engine ECU and if appropriate, thetransmission ECU.
4.3 Actuators
4.3.1 Single point injector
waveform
Single point injection is also sometimes referredto as throttle body injection (Figure 4.22).
A single injector is used (on larger enginestwo injectors can be used) in what may have theoutward appearance to be a carburettor housing.
The resultant waveform from the single pointsystem shows an initial injection period followed
by multi-pulsing of the injector in the remainderof the trace (Figure 4.23). This ‘current limiting’section of the waveform is called the supplemen-tary duration and is the part of the injection tracethat expands to increase fuel quantity.
4.3.2 Multi-point injector
waveform
The injector is an electromechanical devicewhich is fed by a 12 volt supply (Figure 4.24).
50 Advanced automotive fault diagnosis
The voltage will only be present when the engineis cranking or running because it is controlled bya relay that operates only when a speed signal isavailable from the engine. Early systems had this
feature built into the relay; most modern systemscontrol the relay from the ECU.
The length of time the injector is held open willdepend on the input signals seen by the ECU from
Figure 4.23 Single point injector
waveform
Figure 4.22 Throttle body with a single injector
Figure 4.24 Multi-point injectors on the rail
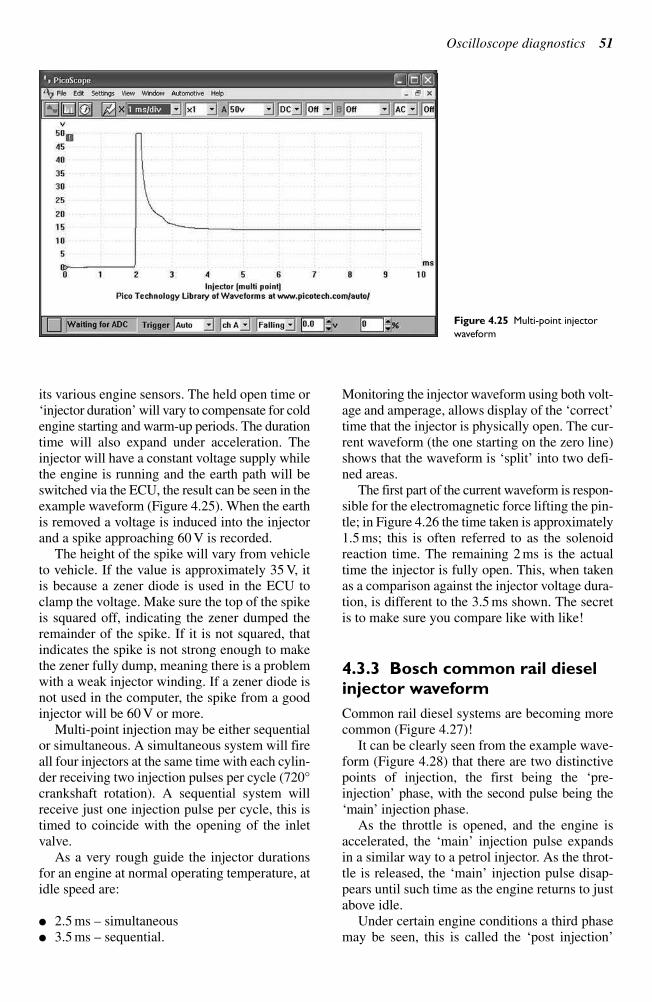
Oscilloscope diagnostics 51
its various engine sensors. The held open time or‘injector duration’ will vary to compensate for coldengine starting and warm-up periods. The durationtime will also expand under acceleration. Theinjector will have a constant voltage supply whilethe engine is running and the earth path will beswitched via the ECU, the result can be seen in theexample waveform (Figure 4.25). When the earthis removed a voltage is induced into the injectorand a spike approaching 60 V is recorded.
The height of the spike will vary from vehicleto vehicle. If the value is approximately 35 V, it is because a zener diode is used in the ECU toclamp the voltage. Make sure the top of the spikeis squared off, indicating the zener dumped theremainder of the spike. If it is not squared, thatindicates the spike is not strong enough to makethe zener fully dump, meaning there is a problemwith a weak injector winding. If a zener diode isnot used in the computer, the spike from a goodinjector will be 60 V or more.
Multi-point injection may be either sequentialor simultaneous. A simultaneous system will fireall four injectors at the same time with each cylin-der receiving two injection pulses per cycle (720°crankshaft rotation). A sequential system willreceive just one injection pulse per cycle, this istimed to coincide with the opening of the inletvalve.
As a very rough guide the injector durationsfor an engine at normal operating temperature, atidle speed are:
2.5 ms – simultaneous 3.5 ms – sequential.
Monitoring the injector waveform using both volt-age and amperage, allows display of the ‘correct’time that the injector is physically open. The cur-rent waveform (the one starting on the zero line)shows that the waveform is ‘split’ into two defi-ned areas.
The first part of the current waveform is respon-sible for the electromagnetic force lifting the pin-tle; in Figure 4.26 the time taken is approximately1.5 ms; this is often referred to as the solenoidreaction time. The remaining 2 ms is the actualtime the injector is fully open. This, when takenas a comparison against the injector voltage dura-tion, is different to the 3.5 ms shown. The secretis to make sure you compare like with like!
4.3.3 Bosch common rail diesel
injector waveform
Common rail diesel systems are becoming morecommon (Figure 4.27)!
It can be clearly seen from the example wave-form (Figure 4.28) that there are two distinctivepoints of injection, the first being the ‘pre-injection’ phase, with the second pulse being the‘main’ injection phase.
As the throttle is opened, and the engine isaccelerated, the ‘main’ injection pulse expandsin a similar way to a petrol injector. As the throt-tle is released, the ‘main’ injection pulse disap-pears until such time as the engine returns to justabove idle.
Under certain engine conditions a third phasemay be seen, this is called the ‘post injection’
Figure 4.25 Multi-point injector
waveform
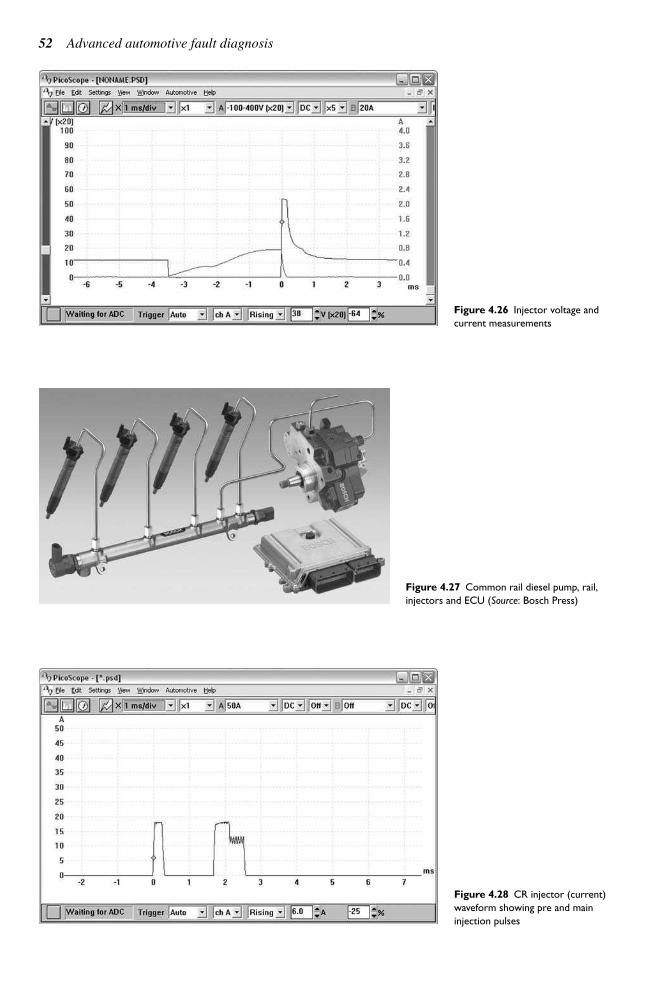
52 Advanced automotive fault diagnosis
Figure 4.26 Injector voltage and
current measurements
Figure 4.27 Common rail diesel pump, rail,
injectors and ECU (Source: Bosch Press)
Figure 4.28 CR injector (current)
waveform showing pre and main
injection pulses
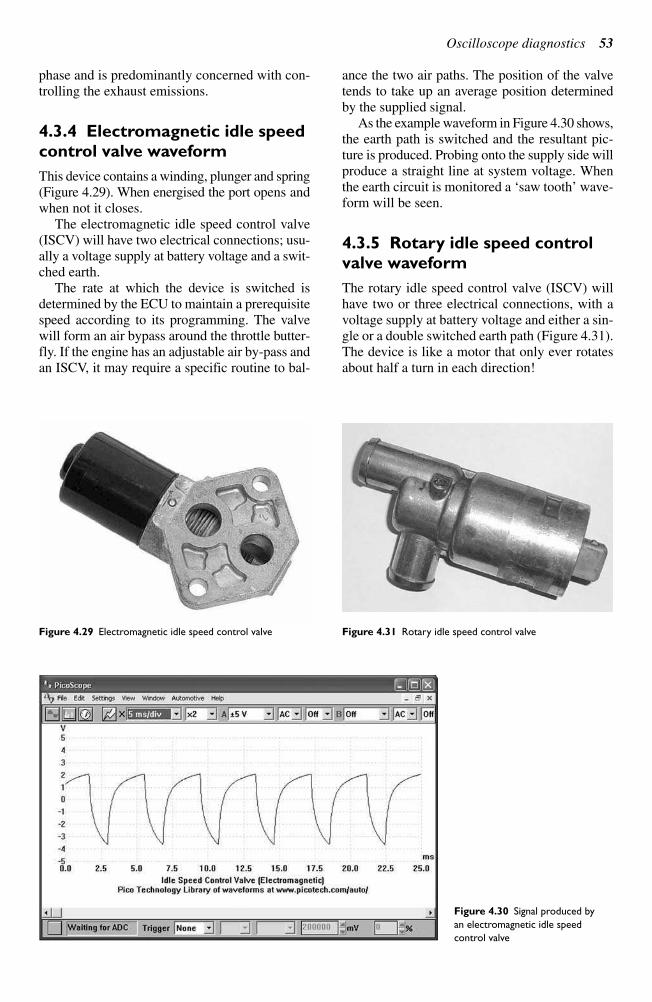
Oscilloscope diagnostics 53
phase and is predominantly concerned with con-trolling the exhaust emissions.
4.3.4 Electromagnetic idle speed
control valve waveform
This device contains a winding, plunger and spring(Figure 4.29). When energised the port opens andwhen not it closes.
The electromagnetic idle speed control valve(ISCV) will have two electrical connections; usu-ally a voltage supply at battery voltage and a swit-ched earth.
The rate at which the device is switched isdetermined by the ECU to maintain a prerequisitespeed according to its programming. The valvewill form an air bypass around the throttle butter-fly. If the engine has an adjustable air by-pass andan ISCV, it may require a specific routine to bal-
ance the two air paths. The position of the valvetends to take up an average position determinedby the supplied signal.
As the example waveform in Figure 4.30 shows,the earth path is switched and the resultant pic-ture is produced. Probing onto the supply side willproduce a straight line at system voltage. Whenthe earth circuit is monitored a ‘saw tooth’ wave-form will be seen.
4.3.5 Rotary idle speed control
valve waveform
The rotary idle speed control valve (ISCV) willhave two or three electrical connections, with avoltage supply at battery voltage and either a sin-gle or a double switched earth path (Figure 4.31).The device is like a motor that only ever rotatesabout half a turn in each direction!
Figure 4.29 Electromagnetic idle speed control valve
Figure 4.30 Signal produced by
an electromagnetic idle speed
control valve
Figure 4.31 Rotary idle speed control valve
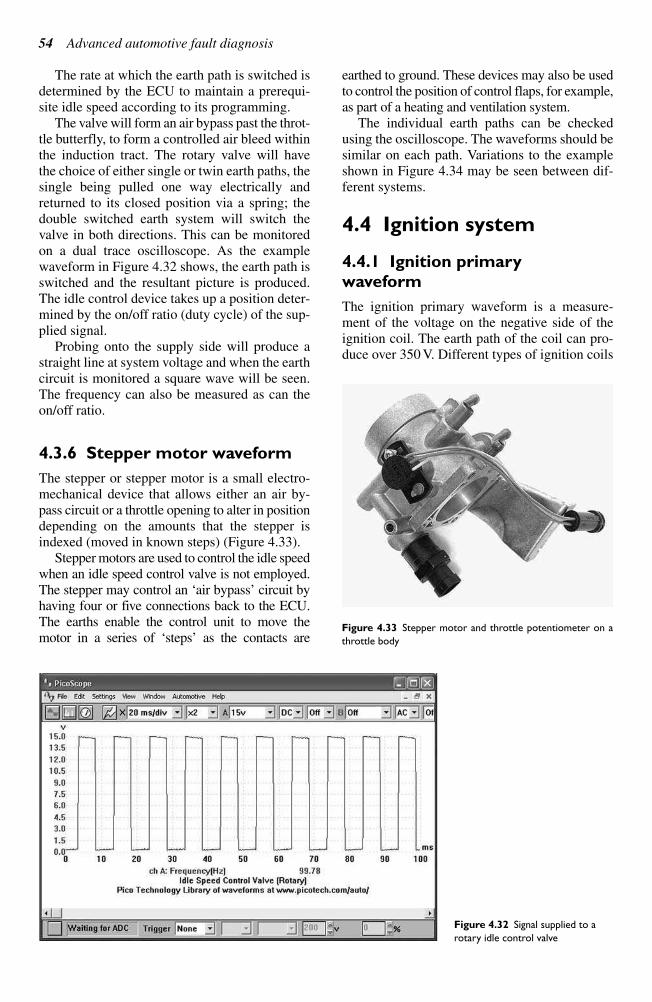
54 Advanced automotive fault diagnosis
The rate at which the earth path is switched isdetermined by the ECU to maintain a prerequi-site idle speed according to its programming.
The valve will form an air bypass past the throt-tle butterfly, to form a controlled air bleed withinthe induction tract. The rotary valve will have the choice of either single or twin earth paths, thesingle being pulled one way electrically andreturned to its closed position via a spring; thedouble switched earth system will switch thevalve in both directions. This can be monitoredon a dual trace oscilloscope. As the examplewaveform in Figure 4.32 shows, the earth path isswitched and the resultant picture is produced.The idle control device takes up a position deter-mined by the on/off ratio (duty cycle) of the sup-plied signal.
Probing onto the supply side will produce astraight line at system voltage and when the earthcircuit is monitored a square wave will be seen.The frequency can also be measured as can theon/off ratio.
4.3.6 Stepper motor waveform
The stepper or stepper motor is a small electro-mechanical device that allows either an air by-pass circuit or a throttle opening to alter in positiondepending on the amounts that the stepper isindexed (moved in known steps) (Figure 4.33).
Stepper motors are used to control the idle speedwhen an idle speed control valve is not employed.The stepper may control an ‘air bypass’ circuit byhaving four or five connections back to the ECU.The earths enable the control unit to move themotor in a series of ‘steps’ as the contacts are
earthed to ground. These devices may also be usedto control the position of control flaps, for example,as part of a heating and ventilation system.
The individual earth paths can be checkedusing the oscilloscope. The waveforms should besimilar on each path. Variations to the exampleshown in Figure 4.34 may be seen between dif-ferent systems.
4.4 Ignition system
4.4.1 Ignition primary
waveform
The ignition primary waveform is a measure-ment of the voltage on the negative side of theignition coil. The earth path of the coil can pro-duce over 350 V. Different types of ignition coils
Figure 4.33 Stepper motor and throttle potentiometer on a
throttle body
Figure 4.32 Signal supplied to a
rotary idle control valve
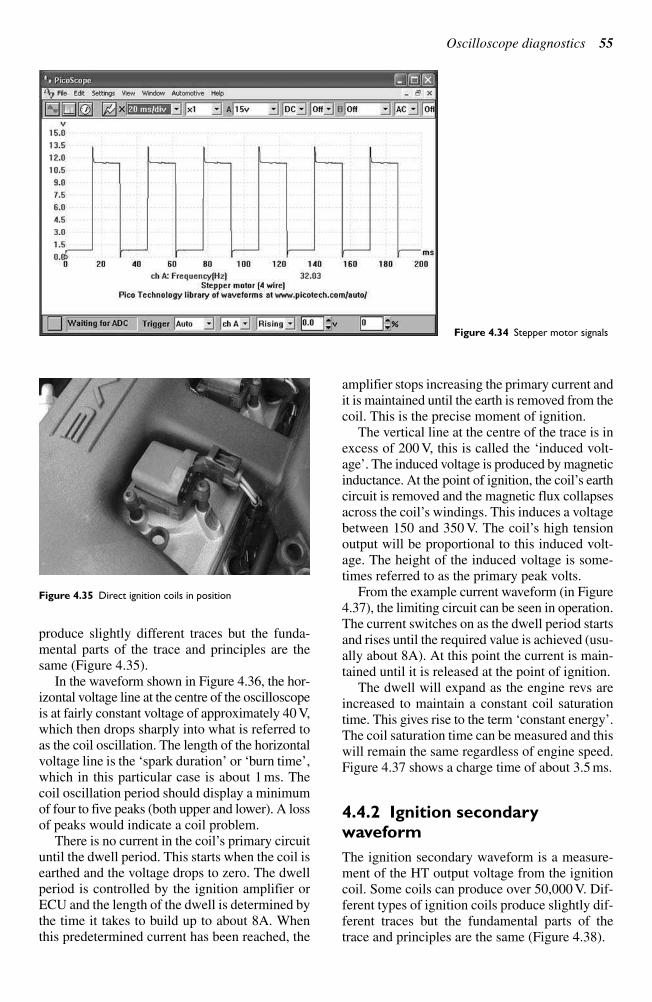
Oscilloscope diagnostics 55
produce slightly different traces but the funda-mental parts of the trace and principles are thesame (Figure 4.35).
In the waveform shown in Figure 4.36, the hor-izontal voltage line at the centre of the oscilloscopeis at fairly constant voltage of approximately 40 V,which then drops sharply into what is referred toas the coil oscillation. The length of the horizontalvoltage line is the ‘spark duration’ or ‘burn time’,which in this particular case is about 1 ms. Thecoil oscillation period should display a minimumof four to five peaks (both upper and lower). A lossof peaks would indicate a coil problem.
There is no current in the coil’s primary circuituntil the dwell period. This starts when the coil isearthed and the voltage drops to zero. The dwellperiod is controlled by the ignition amplifier orECU and the length of the dwell is determined bythe time it takes to build up to about 8A. Whenthis predetermined current has been reached, the
amplifier stops increasing the primary current andit is maintained until the earth is removed from thecoil. This is the precise moment of ignition.
The vertical line at the centre of the trace is inexcess of 200 V, this is called the ‘induced volt-age’. The induced voltage is produced by magneticinductance. At the point of ignition, the coil’s earthcircuit is removed and the magnetic flux collapsesacross the coil’s windings. This induces a voltagebetween 150 and 350 V. The coil’s high tensionoutput will be proportional to this induced volt-age. The height of the induced voltage is some-times referred to as the primary peak volts.
From the example current waveform (in Figure4.37), the limiting circuit can be seen in operation.The current switches on as the dwell period startsand rises until the required value is achieved (usu-ally about 8A). At this point the current is main-tained until it is released at the point of ignition.
The dwell will expand as the engine revs areincreased to maintain a constant coil saturationtime. This gives rise to the term ‘constant energy’.The coil saturation time can be measured and thiswill remain the same regardless of engine speed.Figure 4.37 shows a charge time of about 3.5 ms.
4.4.2 Ignition secondary
waveform
The ignition secondary waveform is a measure-ment of the HT output voltage from the ignitioncoil. Some coils can produce over 50,000 V. Dif-ferent types of ignition coils produce slightly dif-ferent traces but the fundamental parts of thetrace and principles are the same (Figure 4.38).
Figure 4.34 Stepper motor signals
Figure 4.35 Direct ignition coils in position
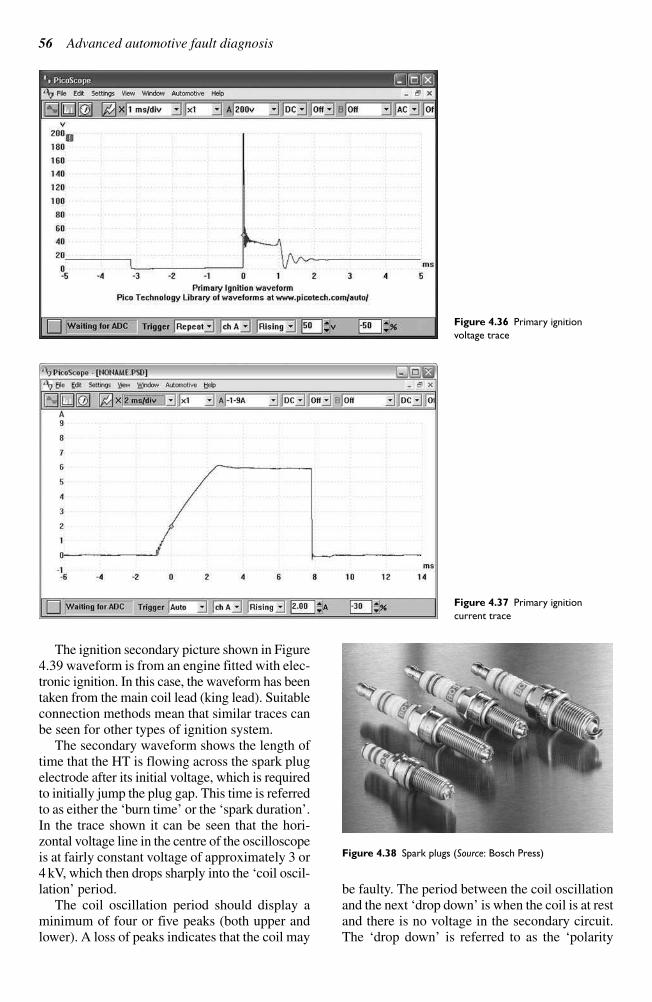
56 Advanced automotive fault diagnosis
The ignition secondary picture shown in Figure4.39 waveform is from an engine fitted with elec-tronic ignition. In this case, the waveform has beentaken from the main coil lead (king lead). Suitableconnection methods mean that similar traces canbe seen for other types of ignition system.
The secondary waveform shows the length oftime that the HT is flowing across the spark plugelectrode after its initial voltage, which is requiredto initially jump the plug gap. This time is referredto as either the ‘burn time’ or the ‘spark duration’.In the trace shown it can be seen that the hori-zontal voltage line in the centre of the oscilloscopeis at fairly constant voltage of approximately 3 or4 kV, which then drops sharply into the ‘coil oscil-lation’ period.
The coil oscillation period should display aminimum of four or five peaks (both upper andlower). A loss of peaks indicates that the coil may
be faulty. The period between the coil oscillationand the next ‘drop down’ is when the coil is at restand there is no voltage in the secondary circuit.The ‘drop down’ is referred to as the ‘polarity
Figure 4.36 Primary ignition
voltage trace
Figure 4.37 Primary ignition
current trace
Figure 4.38 Spark plugs (Source: Bosch Press)
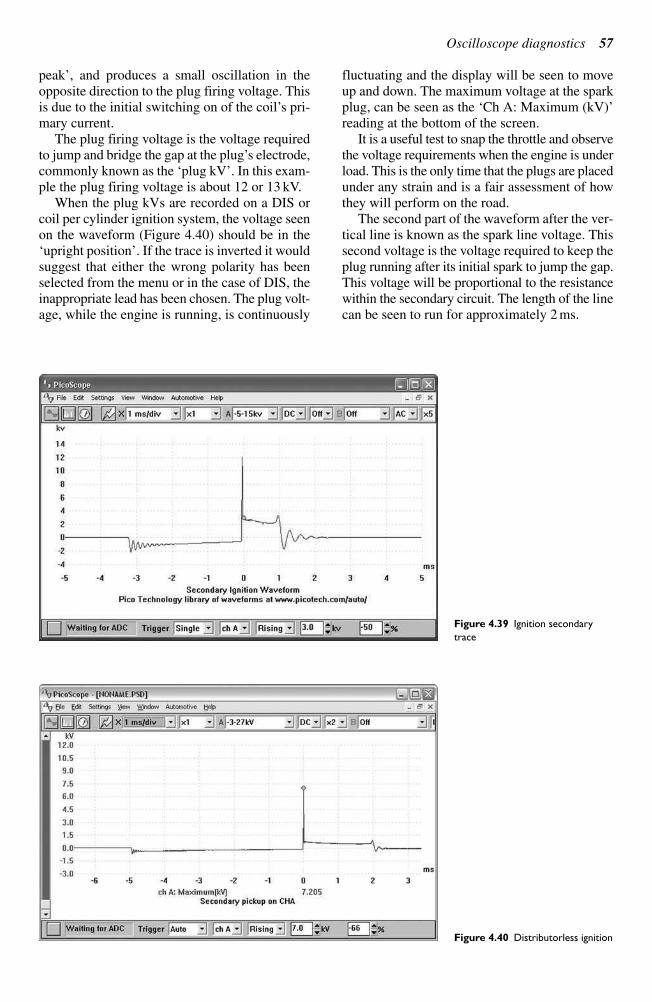
Oscilloscope diagnostics 57
peak’, and produces a small oscillation in theopposite direction to the plug firing voltage. Thisis due to the initial switching on of the coil’s pri-mary current.
The plug firing voltage is the voltage requiredto jump and bridge the gap at the plug’s electrode,commonly known as the ‘plug kV’. In this exam-ple the plug firing voltage is about 12 or 13 kV.
When the plug kVs are recorded on a DIS orcoil per cylinder ignition system, the voltage seenon the waveform (Figure 4.40) should be in the‘upright position’. If the trace is inverted it wouldsuggest that either the wrong polarity has beenselected from the menu or in the case of DIS, theinappropriate lead has been chosen. The plug volt-age, while the engine is running, is continuously
fluctuating and the display will be seen to moveup and down. The maximum voltage at the sparkplug, can be seen as the ‘Ch A: Maximum (kV)’reading at the bottom of the screen.
It is a useful test to snap the throttle and observethe voltage requirements when the engine is underload. This is the only time that the plugs are placedunder any strain and is a fair assessment of howthey will perform on the road.
The second part of the waveform after the ver-tical line is known as the spark line voltage. Thissecond voltage is the voltage required to keep theplug running after its initial spark to jump the gap.This voltage will be proportional to the resistancewithin the secondary circuit. The length of the linecan be seen to run for approximately 2 ms.
Figure 4.39 Ignition secondary
trace
Figure 4.40 Distributorless ignition
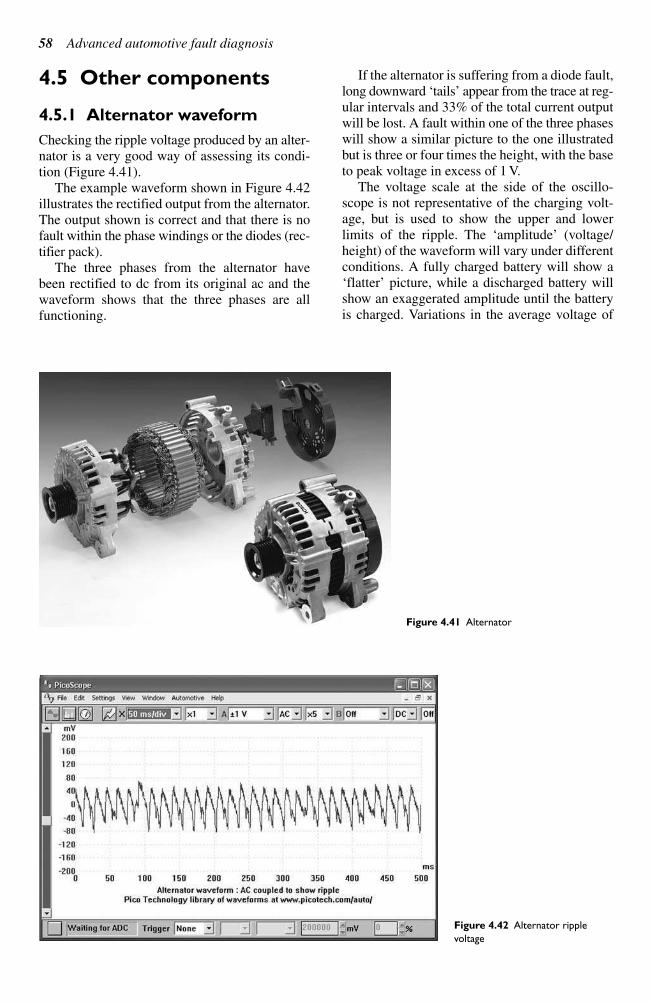
58 Advanced automotive fault diagnosis
4.5 Other components
4.5.1 Alternator waveform
Checking the ripple voltage produced by an alter-nator is a very good way of assessing its condi-tion (Figure 4.41).
The example waveform shown in Figure 4.42illustrates the rectified output from the alternator.The output shown is correct and that there is nofault within the phase windings or the diodes (rec-tifier pack).
The three phases from the alternator havebeen rectified to dc from its original ac and thewaveform shows that the three phases are allfunctioning.
If the alternator is suffering from a diode fault,long downward ‘tails’ appear from the trace at reg-ular intervals and 33% of the total current outputwill be lost. A fault within one of the three phaseswill show a similar picture to the one illustratedbut is three or four times the height, with the baseto peak voltage in excess of 1 V.
The voltage scale at the side of the oscillo-scope is not representative of the charging volt-age, but is used to show the upper and lowerlimits of the ripple. The ‘amplitude’ (voltage/height) of the waveform will vary under differentconditions. A fully charged battery will show a‘flatter’ picture, while a discharged battery willshow an exaggerated amplitude until the batteryis charged. Variations in the average voltage of
Figure 4.42 Alternator ripple
voltage
Figure 4.41 Alternator
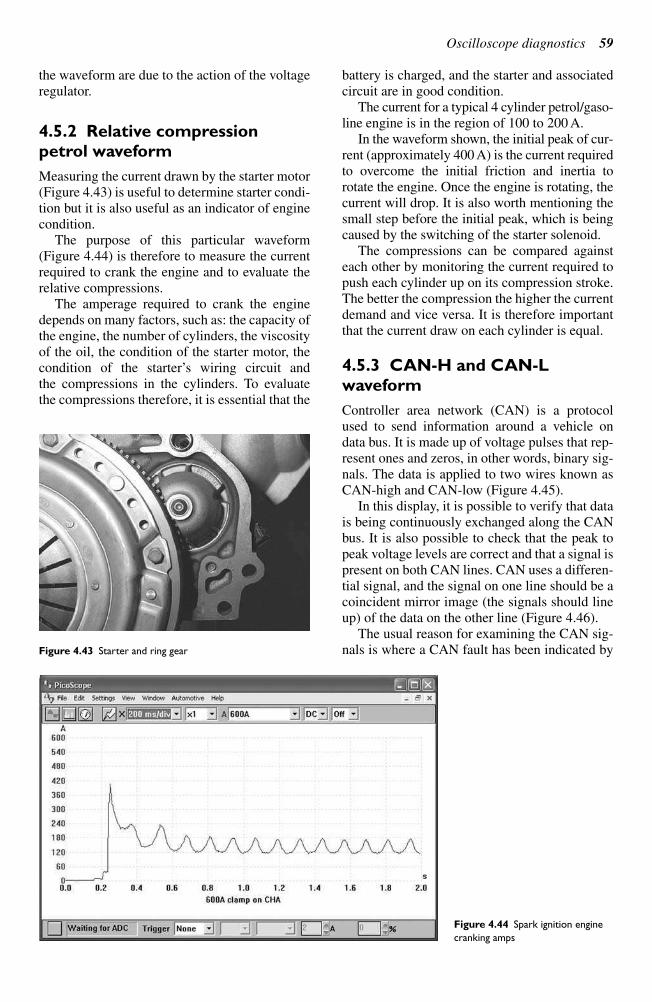
Oscilloscope diagnostics 59
the waveform are due to the action of the voltageregulator.
4.5.2 Relative compression
petrol waveform
Measuring the current drawn by the starter motor(Figure 4.43) is useful to determine starter condi-tion but it is also useful as an indicator of enginecondition.
The purpose of this particular waveform(Figure 4.44) is therefore to measure the currentrequired to crank the engine and to evaluate therelative compressions.
The amperage required to crank the enginedepends on many factors, such as: the capacity ofthe engine, the number of cylinders, the viscosityof the oil, the condition of the starter motor, thecondition of the starter’s wiring circuit and the compressions in the cylinders. To evaluatethe compressions therefore, it is essential that the
battery is charged, and the starter and associatedcircuit are in good condition.
The current for a typical 4 cylinder petrol/gaso-line engine is in the region of 100 to 200 A.
In the waveform shown, the initial peak of cur-rent (approximately 400 A) is the current requiredto overcome the initial friction and inertia torotate the engine. Once the engine is rotating, thecurrent will drop. It is also worth mentioning thesmall step before the initial peak, which is beingcaused by the switching of the starter solenoid.
The compressions can be compared againsteach other by monitoring the current required topush each cylinder up on its compression stroke.The better the compression the higher the currentdemand and vice versa. It is therefore importantthat the current draw on each cylinder is equal.
4.5.3 CAN-H and CAN-L
waveform
Controller area network (CAN) is a protocolused to send information around a vehicle ondata bus. It is made up of voltage pulses that rep-resent ones and zeros, in other words, binary sig-nals. The data is applied to two wires known asCAN-high and CAN-low (Figure 4.45).
In this display, it is possible to verify that datais being continuously exchanged along the CANbus. It is also possible to check that the peak topeak voltage levels are correct and that a signal ispresent on both CAN lines. CAN uses a differen-tial signal, and the signal on one line should be acoincident mirror image (the signals should lineup) of the data on the other line (Figure 4.46).
The usual reason for examining the CAN sig-nals is where a CAN fault has been indicated byFigure 4.43 Starter and ring gear
Figure 4.44 Spark ignition engine
cranking amps
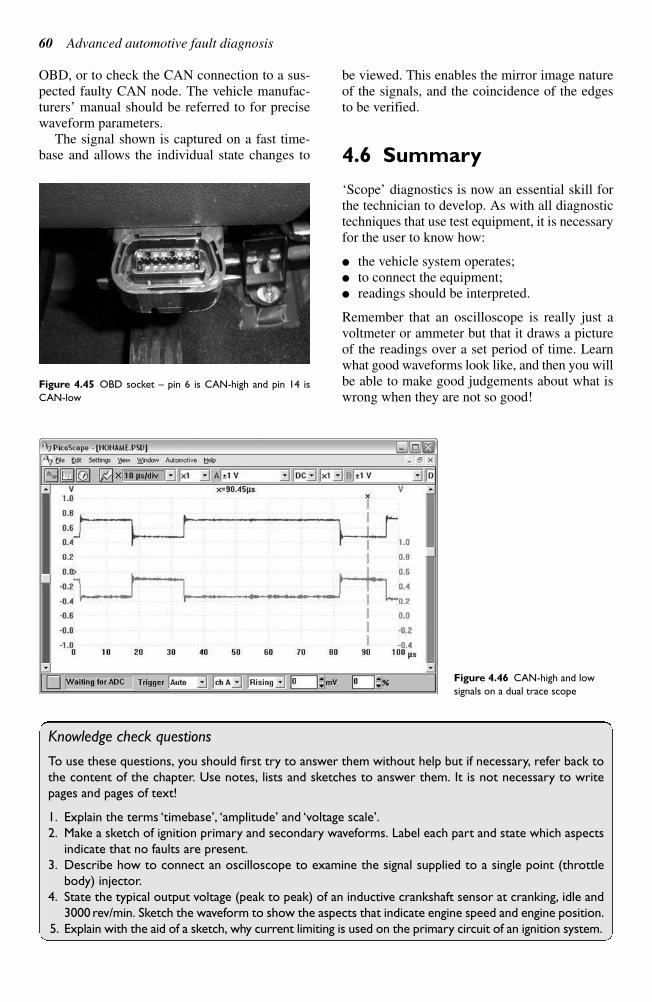
60 Advanced automotive fault diagnosis
OBD, or to check the CAN connection to a sus-pected faulty CAN node. The vehicle manufac-turers’ manual should be referred to for precisewaveform parameters.
The signal shown is captured on a fast time-base and allows the individual state changes to
be viewed. This enables the mirror image natureof the signals, and the coincidence of the edgesto be verified.
4.6 Summary
‘Scope’ diagnostics is now an essential skill forthe technician to develop. As with all diagnostictechniques that use test equipment, it is necessaryfor the user to know how:
the vehicle system operates; to connect the equipment; readings should be interpreted.
Remember that an oscilloscope is really just avoltmeter or ammeter but that it draws a pictureof the readings over a set period of time. Learnwhat good waveforms look like, and then you willbe able to make good judgements about what iswrong when they are not so good!
Figure 4.45 OBD socket – pin 6 is CAN-high and pin 14 is
CAN-low
Figure 4.46 CAN-high and low
signals on a dual trace scope
Knowledge check questions
To use these questions, you should first try to answer them without help but if necessary, refer back to
the content of the chapter. Use notes, lists and sketches to answer them. It is not necessary to write
pages and pages of text!
1. Explain the terms ‘timebase’, ‘amplitude’ and ‘voltage scale’.
2. Make a sketch of ignition primary and secondary waveforms. Label each part and state which aspects
indicate that no faults are present.
3. Describe how to connect an oscilloscope to examine the signal supplied to a single point (throttle
body) injector.
4. State the typical output voltage (peak to peak) of an inductive crankshaft sensor at cranking, idle and
3000 rev/min. Sketch the waveform to show the aspects that indicate engine speed and engine position.
5. Explain with the aid of a sketch, why current limiting is used on the primary circuit of an ignition system.
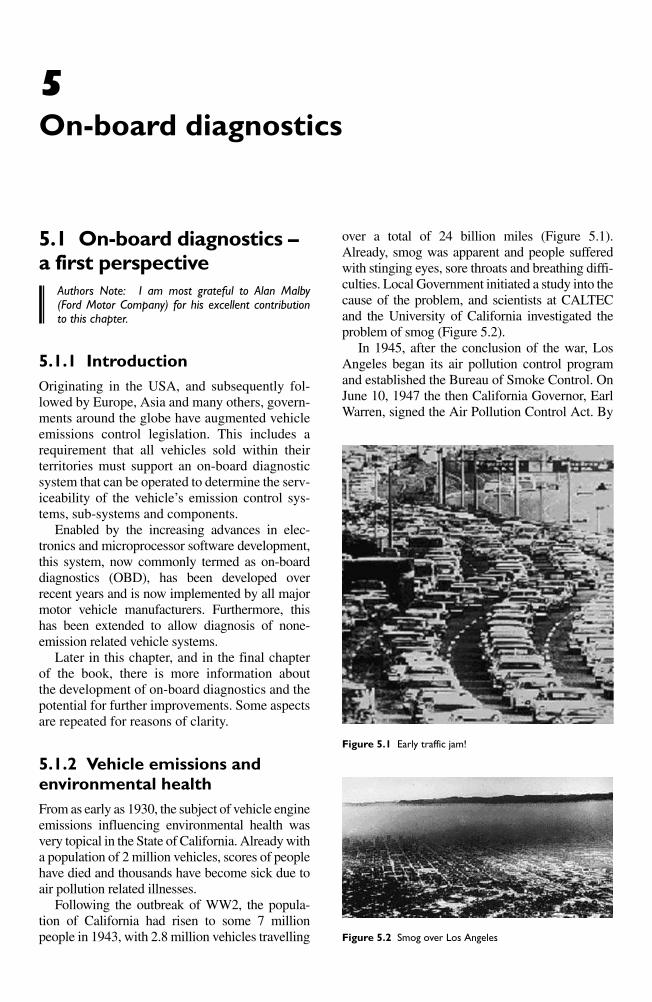
5.1 On-board diagnostics –a first perspective
Authors Note: I am most grateful to Alan Malby(Ford Motor Company) for his excellent contributionto this chapter.
5.1.1 Introduction
Originating in the USA, and subsequently fol-lowed by Europe, Asia and many others, govern-ments around the globe have augmented vehicleemissions control legislation. This includes arequirement that all vehicles sold within theirterritories must support an on-board diagnosticsystem that can be operated to determine the serv-iceability of the vehicle’s emission control sys-
tems, sub-systems and components.
Enabled by the increasing advances in elec-
tronics and microprocessor software development,
this system, now commonly termed as on-board
diagnostics (OBD), has been developed over
recent years and is now implemented by all major
motor vehicle manufacturers. Furthermore, this
has been extended to allow diagnosis of none-
emission related vehicle systems.
Later in this chapter, and in the final chapter
of the book, there is more information about
the development of on-board diagnostics and the
potential for further improvements. Some aspects
are repeated for reasons of clarity.
5.1.2 Vehicle emissions and
environmental health
From as early as 1930, the subject of vehicle engine
emissions influencing environmental health was
very topical in the State of California. Already with
a population of 2 million vehicles, scores of people
have died and thousands have become sick due to
air pollution related illnesses.
Following the outbreak of WW2, the popula-
tion of California had risen to some 7 million
people in 1943, with 2.8 million vehicles travelling
over a total of 24 billion miles (Figure 5.1).
Already, smog was apparent and people suffered
with stinging eyes, sore throats and breathing diffi-
culties. Local Government initiated a study into the
cause of the problem, and scientists at CALTEC
and the University of California investigated the
problem of smog (Figure 5.2).
In 1945, after the conclusion of the war, Los
Angeles began its air pollution control program
and established the Bureau of Smoke Control. On
June 10, 1947 the then California Governor, Earl
Warren, signed the Air Pollution Control Act. By
5
On-board diagnostics
Figure 5.1 Early traffic jam!
Figure 5.2 Smog over Los Angeles
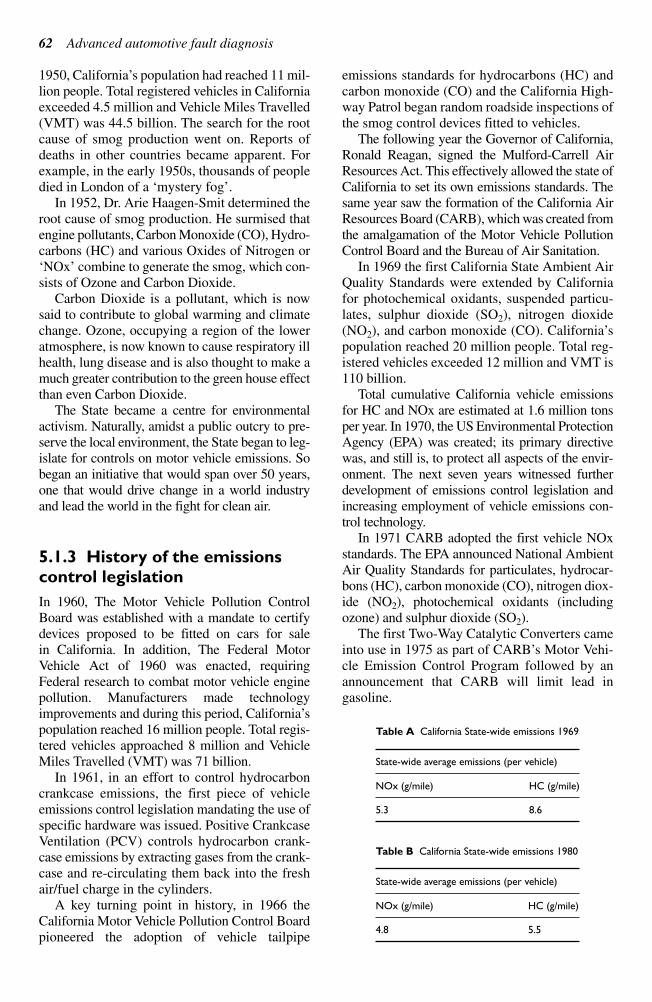
1950, California’s population had reached 11 mil-
lion people. Total registered vehicles in California
exceeded 4.5 million and Vehicle Miles Travelled
(VMT) was 44.5 billion. The search for the root
cause of smog production went on. Reports of
deaths in other countries became apparent. For
example, in the early 1950s, thousands of people
died in London of a ‘mystery fog’.
In 1952, Dr. Arie Haagen-Smit determined the
root cause of smog production. He surmised that
engine pollutants, Carbon Monoxide (CO), Hydro-
carbons (HC) and various Oxides of Nitrogen or
‘NOx’ combine to generate the smog, which con-
sists of Ozone and Carbon Dioxide.
Carbon Dioxide is a pollutant, which is now
said to contribute to global warming and climate
change. Ozone, occupying a region of the lower
atmosphere, is now known to cause respiratory ill
health, lung disease and is also thought to make a
much greater contribution to the green house effect
than even Carbon Dioxide.
The State became a centre for environmental
activism. Naturally, amidst a public outcry to pre-
serve the local environment, the State began to leg-
islate for controls on motor vehicle emissions. So
began an initiative that would span over 50 years,
one that would drive change in a world industry
and lead the world in the fight for clean air.
5.1.3 History of the emissions
control legislation
In 1960, The Motor Vehicle Pollution Control
Board was established with a mandate to certify
devices proposed to be fitted on cars for sale
in California. In addition, The Federal Motor
Vehicle Act of 1960 was enacted, requiring
Federal research to combat motor vehicle engine
pollution. Manufacturers made technology
improvements and during this period, California’s
population reached 16 million people. Total regis-
tered vehicles approached 8 million and Vehicle
Miles Travelled (VMT) was 71 billion.
In 1961, in an effort to control hydrocarbon
crankcase emissions, the first piece of vehicle
emissions control legislation mandating the use of
specific hardware was issued. Positive Crankcase
Ventilation (PCV) controls hydrocarbon crank-
case emissions by extracting gases from the crank-
case and re-circulating them back into the fresh
air/fuel charge in the cylinders.
A key turning point in history, in 1966 the
California Motor Vehicle Pollution Control Board
pioneered the adoption of vehicle tailpipe
emissions standards for hydrocarbons (HC) and
carbon monoxide (CO) and the California High-
way Patrol began random roadside inspections of
the smog control devices fitted to vehicles.
The following year the Governor of California,
Ronald Reagan, signed the Mulford-Carrell Air
Resources Act. This effectively allowed the state of
California to set its own emissions standards. The
same year saw the formation of the California Air
Resources Board (CARB), which was created from
the amalgamation of the Motor Vehicle Pollution
Control Board and the Bureau of Air Sanitation.
In 1969 the first California State Ambient Air
Quality Standards were extended by California
for photochemical oxidants, suspended particu-
lates, sulphur dioxide (SO2), nitrogen dioxide
(NO2), and carbon monoxide (CO). California’s
population reached 20 million people. Total reg-
istered vehicles exceeded 12 million and VMT is
110 billion.
Total cumulative California vehicle emissions
for HC and NOx are estimated at 1.6 million tons
per year. In 1970, the US Environmental Protection
Agency (EPA) was created; its primary directive
was, and still is, to protect all aspects of the envir-
onment. The next seven years witnessed further
development of emissions control legislation and
increasing employment of vehicle emissions con-
trol technology.
In 1971 CARB adopted the first vehicle NOx
standards. The EPA announced National Ambient
Air Quality Standards for particulates, hydrocar-
bons (HC), carbon monoxide (CO), nitrogen diox-
ide (NO2), photochemical oxidants (including
ozone) and sulphur dioxide (SO2).
The first Two-Way Catalytic Converters came
into use in 1975 as part of CARB’s Motor Vehi-
cle Emission Control Program followed by an
announcement that CARB will limit lead in
gasoline.
62 Advanced automotive fault diagnosis
Table B California State-wide emissions 1980
State-wide average emissions (per vehicle)
NOx (g/mile) HC (g/mile)
4.8 5.5
Table A California State-wide emissions 1969
State-wide average emissions (per vehicle)
NOx (g/mile) HC (g/mile)
5.3 8.6
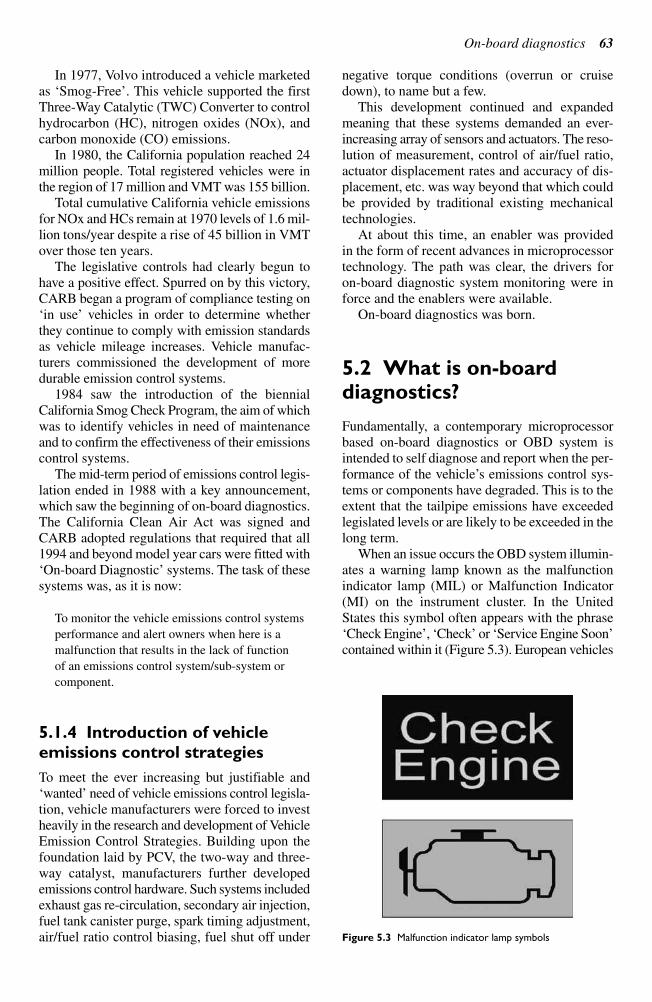
In 1977, Volvo introduced a vehicle marketed
as ‘Smog-Free’. This vehicle supported the first
Three-Way Catalytic (TWC) Converter to control
hydrocarbon (HC), nitrogen oxides (NOx), and
carbon monoxide (CO) emissions.
In 1980, the California population reached 24
million people. Total registered vehicles were in
the region of 17 million and VMT was 155 billion.
Total cumulative California vehicle emissions
for NOx and HCs remain at 1970 levels of 1.6 mil-
lion tons/year despite a rise of 45 billion in VMT
over those ten years.
The legislative controls had clearly begun to
have a positive effect. Spurred on by this victory,
CARB began a program of compliance testing on
‘in use’ vehicles in order to determine whether
they continue to comply with emission standards
as vehicle mileage increases. Vehicle manufac-
turers commissioned the development of more
durable emission control systems.
1984 saw the introduction of the biennial
California Smog Check Program, the aim of which
was to identify vehicles in need of maintenance
and to confirm the effectiveness of their emissions
control systems.
The mid-term period of emissions control legis-
lation ended in 1988 with a key announcement,
which saw the beginning of on-board diagnostics.
The California Clean Air Act was signed and
CARB adopted regulations that required that all
1994 and beyond model year cars were fitted with
‘On-board Diagnostic’ systems. The task of these
systems was, as it is now:
To monitor the vehicle emissions control systems
performance and alert owners when here is a
malfunction that results in the lack of function
of an emissions control system/sub-system or
component.
5.1.4 Introduction of vehicle
emissions control strategies
To meet the ever increasing but justifiable and
‘wanted’ need of vehicle emissions control legisla-
tion, vehicle manufacturers were forced to invest
heavily in the research and development of Vehicle
Emission Control Strategies. Building upon the
foundation laid by PCV, the two-way and three-
way catalyst, manufacturers further developed
emissions control hardware. Such systems included
exhaust gas re-circulation, secondary air injection,
fuel tank canister purge, spark timing adjustment,
air/fuel ratio control biasing, fuel shut off under
negative torque conditions (overrun or cruise
down), to name but a few.
This development continued and expanded
meaning that these systems demanded an ever-
increasing array of sensors and actuators. The reso-
lution of measurement, control of air/fuel ratio,
actuator displacement rates and accuracy of dis-
placement, etc. was way beyond that which could
be provided by traditional existing mechanical
technologies.
At about this time, an enabler was provided
in the form of recent advances in microprocessor
technology. The path was clear, the drivers for
on-board diagnostic system monitoring were in
force and the enablers were available.
On-board diagnostics was born.
5.2 What is on-board diagnostics?
Fundamentally, a contemporary microprocessor
based on-board diagnostics or OBD system is
intended to self diagnose and report when the per-
formance of the vehicle’s emissions control sys-
tems or components have degraded. This is to the
extent that the tailpipe emissions have exceeded
legislated levels or are likely to be exceeded in the
long term.
When an issue occurs the OBD system illumin-
ates a warning lamp known as the malfunction
indicator lamp (MIL) or Malfunction Indicator
(MI) on the instrument cluster. In the United
States this symbol often appears with the phrase
‘Check Engine’, ‘Check’ or ‘Service Engine Soon’
contained within it (Figure 5.3). European vehicles
On-board diagnostics 63
Figure 5.3 Malfunction indicator lamp symbols
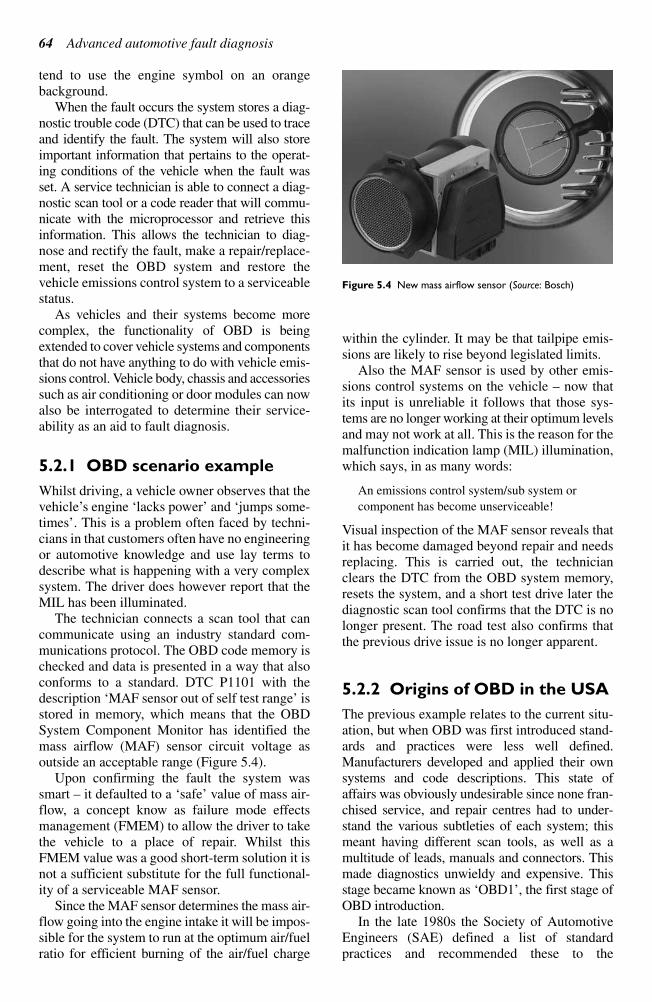
tend to use the engine symbol on an orange
background.
When the fault occurs the system stores a diag-
nostic trouble code (DTC) that can be used to trace
and identify the fault. The system will also store
important information that pertains to the operat-
ing conditions of the vehicle when the fault was
set. A service technician is able to connect a diag-
nostic scan tool or a code reader that will commu-
nicate with the microprocessor and retrieve this
information. This allows the technician to diag-
nose and rectify the fault, make a repair/replace-
ment, reset the OBD system and restore the
vehicle emissions control system to a serviceable
status.
As vehicles and their systems become more
complex, the functionality of OBD is being
extended to cover vehicle systems and components
that do not have anything to do with vehicle emis-
sions control. Vehicle body, chassis and accessories
such as air conditioning or door modules can now
also be interrogated to determine their service-
ability as an aid to fault diagnosis.
5.2.1 OBD scenario example
Whilst driving, a vehicle owner observes that the
vehicle’s engine ‘lacks power’ and ‘jumps some-
times’. This is a problem often faced by techni-
cians in that customers often have no engineering
or automotive knowledge and use lay terms to
describe what is happening with a very complex
system. The driver does however report that the
MIL has been illuminated.
The technician connects a scan tool that can
communicate using an industry standard com-
munications protocol. The OBD code memory is
checked and data is presented in a way that also
conforms to a standard. DTC P1101 with the
description ‘MAF sensor out of self test range’ is
stored in memory, which means that the OBD
System Component Monitor has identified the
mass airflow (MAF) sensor circuit voltage as
outside an acceptable range (Figure 5.4).
Upon confirming the fault the system was
smart – it defaulted to a ‘safe’ value of mass air-
flow, a concept know as failure mode effects
management (FMEM) to allow the driver to take
the vehicle to a place of repair. Whilst this
FMEM value was a good short-term solution it is
not a sufficient substitute for the full functional-
ity of a serviceable MAF sensor.
Since the MAF sensor determines the mass air-
flow going into the engine intake it will be impos-
sible for the system to run at the optimum air/fuel
ratio for efficient burning of the air/fuel charge
within the cylinder. It may be that tailpipe emis-
sions are likely to rise beyond legislated limits.
Also the MAF sensor is used by other emis-
sions control systems on the vehicle – now that
its input is unreliable it follows that those sys-
tems are no longer working at their optimum levels
and may not work at all. This is the reason for the
malfunction indication lamp (MIL) illumination,
which says, in as many words:
An emissions control system/sub system or
component has become unserviceable!
Visual inspection of the MAF sensor reveals that
it has become damaged beyond repair and needs
replacing. This is carried out, the technician
clears the DTC from the OBD system memory,
resets the system, and a short test drive later the
diagnostic scan tool confirms that the DTC is no
longer present. The road test also confirms that
the previous drive issue is no longer apparent.
5.2.2 Origins of OBD in the USA
The previous example relates to the current situ-
ation, but when OBD was first introduced stand-
ards and practices were less well defined.
Manufacturers developed and applied their own
systems and code descriptions. This state of
affairs was obviously undesirable since none fran-
chised service, and repair centres had to under-
stand the various subtleties of each system; this
meant having different scan tools, as well as a
multitude of leads, manuals and connectors. This
made diagnostics unwieldy and expensive. This
stage became known as ‘OBD1’, the first stage of
OBD introduction.
In the late 1980s the Society of Automotive
Engineers (SAE) defined a list of standard
practices and recommended these to the
64 Advanced automotive fault diagnosis
Figure 5.4 New mass airflow sensor (Source: Bosch)

On-board diagnostics 65
Environmental Protection Agency (EPA). The
EPA acknowledged the benefits of these stand-
ards and recommendations, and adopted them. In
combination, they changed the shape and applica-
tion of OBD. The recommendations included
having a standard diagnostic connector, a stand-
ard scan tool and a communications protocol that
the standard scan tool could use to interface with
the vehicle of any manufacturer.
The standard also included mandatory struc-
tures and descriptions for certain emission control
system/component defects. These were called ‘P0’
Codes. Manufacturers were still free to generate
their own ‘manufacturer specific code descriptions’
known as ‘P1’ Codes. This phase of implementa-
tion became known as OBD2, and was adopted for
implementation by 1st January 1996.
5.2.3 P Code composition
The diagnostic trouble code (DTC) is displayed
as a 5-character alphanumeric code. The first
character is a letter that defines which vehicle
system set the code be it Powertrain, Body, or
Chassis.
P – means Powertrain System set the code
B – means Body System set the code
C – means Chassis System set the code
U – is currently unused but has been ‘stolen’
to represent communication errors
P Codes are requested by the microprocessor
controlling the powertrain or transmission and
refer to the emissions control systems and their
components.
B Codes are requested by the microprocessor
controlling the body control systems. Collectively
these are grouped as lighting, air conditioning,
instrumentation, or even in-car entertainment or
telematics.
C Codes are requested by the microprocessor
controlling the chassis systems that control vehi-
cle dynamics such as ride height adjustment, trac-
tion control, etc.
The four numbers that follow the letter detail
information pertaining to what sub-system declared
the code. Using the example from before, see
Figure 5.5.
5.2.4 European on-board
diagnostics and global adoption
Europe was not immune to the environmental
issues associated with smog. As mentioned earlier,
a major smog episode occurred in London in late
1952; this lasted for five days and resulted in about
4000 deaths. In 1956, the UK government passed
its first Clean Air Act, which aimed to control
domestic sources of smoke pollution.
In 1970 the then European Community adopted
directive 70/220 EEC – ‘Measures to be taken
against Air Pollution by Emissions from Motor
Vehicles’. This basically set the foundation for
future legislation to curb motor vehicle pollution
in Europe. This Directive was amended over the
next three decades when in October 1998 the
amendment 98/69/EC ‘On-Board Diagnostics
(OBD) for Motor Vehicles’ was adopted, which
added Annex XI to the original 70/220 document.
Annex XI details the functional aspects of OBD
for motor vehicles in Europe and across the Globe.
This became known as EOBD.
5.2.5 Summary
A major contributing factor to environmental health
issues in the Unites States was found to be motor
P1101
System Designation
P – PowertrainB – BodyC – ChassisU – Undesignated
DTC Type
0 – Mandated description1– Manufacturer specific description
Indicated Sub System
1 – Fuel or Air/Fuel – MAF2 – Fuel control – injectors3 – Ignition or misfire4 – Emissions control – catalyst5 – Engine/Vehicle speed6 – Microprocessor7 – Transmission8 – Transmission9 – SAE designated0 – SAE designated
Fault Nature
01 – Numbers often viewed together, describe ‘what is wrong’
Figure 5.5 P Code composition
vehicle emissions pollution. Scientific studies by
government sponsored academic establishments
and vehicle manufacturers then took place over
several years. Legislative bodies were formed
which later developed and enacted the vehicle
emissions control legislation, which forced vehicle
manufacturers to develop control strategies and
incorporate them within their production vehicles.
As microprocessor technologies became more
advanced and commercially viable, the legisla-
tion was augmented to include a self-diagnosing
onboard diagnostic system, which would report
when the emissions control system was unser-
viceable. First attempts by manufacturers to use
such a system were applied unilaterally which
resulted in confusion, regenerative work and a
poor reception of the OBD (now termed OBD1)
concept. A revision of the legislation adopted
SAE recommended standards, which resulted in
the OBD (now termed OBD2) system becoming
largely generic and applicable across the whole
range of vehicle manufacturers.
As environmental activism spread across to
Europe, vehicle manufacturers realised they had
to support a philosophy of sustainable growth.
Similar legislation was adopted and European
OBD (EOBD) manifested itself in a form very
similar to that observed in the United States.
5.3 Petrol/gasoline on-board diagnostic monitors
5.3.1 Introduction
This section will cover the fundamentals of some
of the on-board diagnostic systems employed on
mainstream petrol/gasoline vehicles. The concept
of how the OBD system is divided into a series of
software based serviceability indicators known as
‘OBD monitors’, is also covered.
5.3.2 Legislative drivers
In Europe – The European Directive 70/220 EEC
was supplemented by European Directive 98/
69/EC (Year: 1998. OJ Series: L – OJ Number:
350/1). This introduced legislation mandating the
use of on-board diagnostic systems in passenger
vehicles manufactured and sold after January 1st
2001.
In the USA – Legislation was first introduced
in California by the California Air Requirements
Board (CARB) in 1988 and later federally by the
Clean Air Act Amendments of 1990. This meant
that the enforcing body, the environmental protec-
tion agency, requires that States have to develop
state implementation plans (SIPs) that explain how
each state will implement a plan to clean up pollu-
tion from sources including motor vehicles. One
aspect of the requirement is the performance of
on-board diagnostic (OBD) system checks as part
of the required periodic inspection.
In order to be compliant with legislation and
still sell vehicles, manufacturers needed to engin-
eer ‘early warning’ monitoring sub-systems that
would determine when emission control systems
had malfunctioned to the extent that tailpipe
emissions had (or were likely to in the long-term)
exceed a legislated level. On-board diagnostic
‘monitors’ were derived for this purpose.
5.3.3 Component monitoring
The emission control systems integral with the
vehicle employ many sensors and actuators. A
software program housed within a microproces-
sor defines their actions.
The ‘component monitor’ is responsible for
determining the serviceability of these sensors and
actuators. Intelligent component drivers linked to
the microprocessor have the ability to enable/dis-
able sensors/actuators, and to receive signals. The
analogue inputs from the sensors are converted to
digital values within the microprocessor.
In combination with these component drivers,
the microprocessor possesses the functionality to
detect circuit faults on the links between micro-
processor and component. In addition, rationality
tests can be performed to determine whether the
sensor is operating out of range of its specification.
5.3.4 Rationality testing
Rationality tests can be performed on such sensors
as the mass airflow (MAF) sensor and throttle
body. For example, the MAF is tested by observing
its output value in comparison to a ‘mapped’ value
normalised by throttle position and engine speed.
The map or table contains expected MAF output
values for the engine speed/throttle set point.
Should the MAF output lie outside of an accept-
able range (threshold) of values for that engine
speed/throttle set point, then a fault is reported.
5.3.5 Circuit testing
The component monitor is capable of monitoring
for circuit faults. Open circuits, short circuits to
66 Advanced automotive fault diagnosis
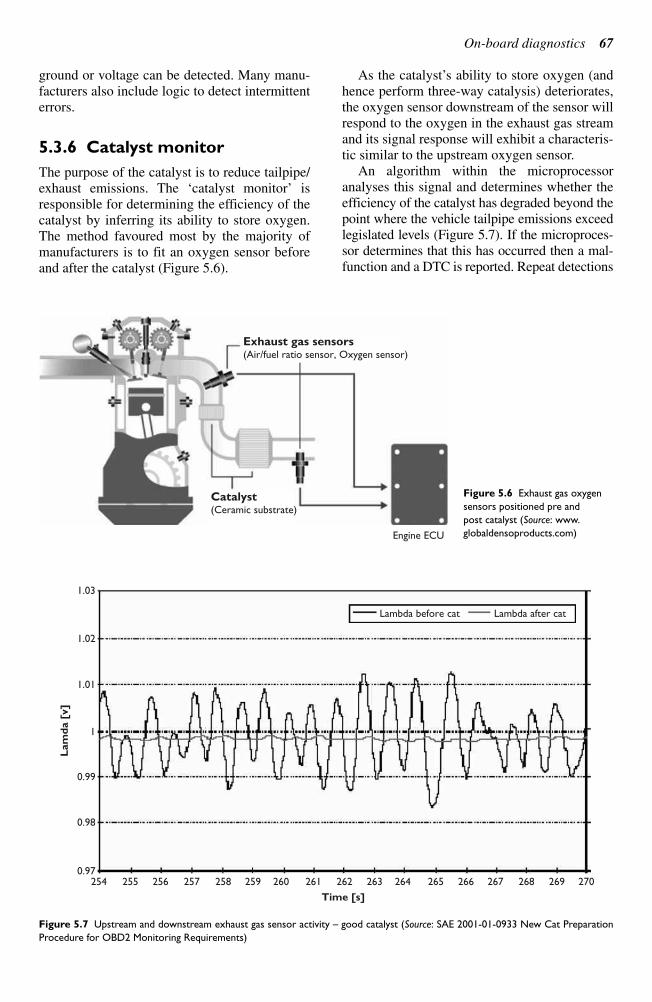
On-board diagnostics 67
ground or voltage can be detected. Many manu-
facturers also include logic to detect intermittent
errors.
5.3.6 Catalyst monitor
The purpose of the catalyst is to reduce tailpipe/
exhaust emissions. The ‘catalyst monitor’ is
responsible for determining the efficiency of the
catalyst by inferring its ability to store oxygen.
The method favoured most by the majority of
manufacturers is to fit an oxygen sensor before
and after the catalyst (Figure 5.6).
As the catalyst’s ability to store oxygen (and
hence perform three-way catalysis) deteriorates,
the oxygen sensor downstream of the sensor will
respond to the oxygen in the exhaust gas stream
and its signal response will exhibit a characteris-
tic similar to the upstream oxygen sensor.
An algorithm within the microprocessor
analyses this signal and determines whether the
efficiency of the catalyst has degraded beyond the
point where the vehicle tailpipe emissions exceed
legislated levels (Figure 5.7). If the microproces-
sor determines that this has occurred then a mal-
function and a DTC is reported. Repeat detections
Exhaust gas sensors(Air/fuel ratio sensor, Oxygen sensor)
Catalyst(Ceramic substrate)
Engine ECU
254 255 256 257 258 259 260 261 262
Time [s]
Lam
da [
v]
263 264 265 266 267 268 269 270
Lambda before cat Lambda after cat
1.03
1.02
1.01
1
0.99
0.98
0.97
Figure 5.6 Exhaust gas oxygen
sensors positioned pre and
post catalyst (Source: www.
globaldensoproducts.com)
Figure 5.7 Upstream and downstream exhaust gas sensor activity – good catalyst (Source: SAE 2001-01-0933 New Cat Preparation
Procedure for OBD2 Monitoring Requirements)
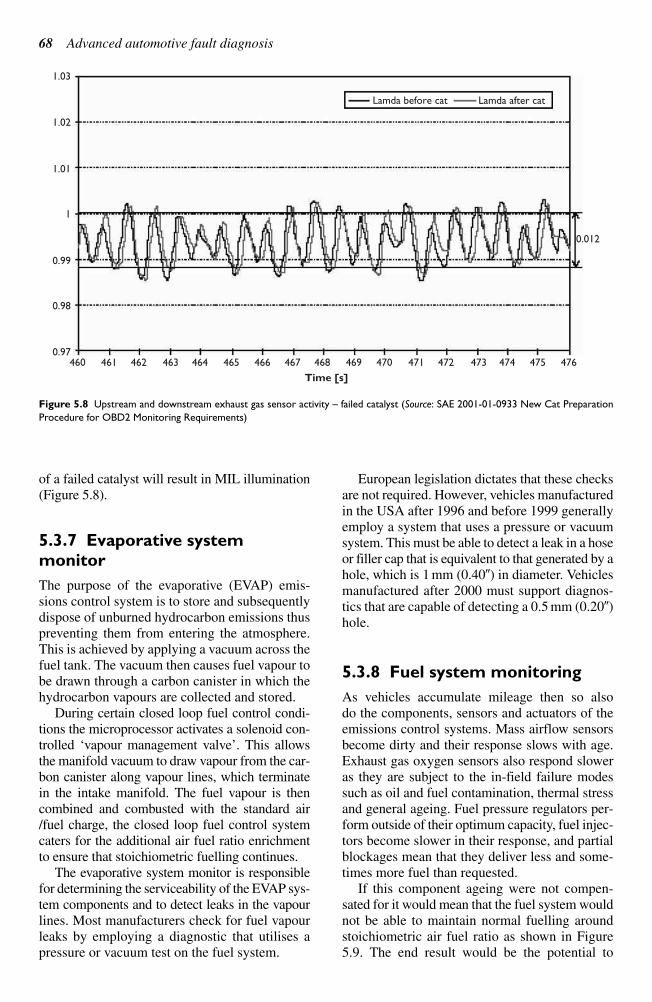
of a failed catalyst will result in MIL illumination
(Figure 5.8).
5.3.7 Evaporative system
monitor
The purpose of the evaporative (EVAP) emis-
sions control system is to store and subsequently
dispose of unburned hydrocarbon emissions thus
preventing them from entering the atmosphere.
This is achieved by applying a vacuum across the
fuel tank. The vacuum then causes fuel vapour to
be drawn through a carbon canister in which the
hydrocarbon vapours are collected and stored.
During certain closed loop fuel control condi-
tions the microprocessor activates a solenoid con-
trolled ‘vapour management valve’. This allows
the manifold vacuum to draw vapour from the car-
bon canister along vapour lines, which terminate
in the intake manifold. The fuel vapour is then
combined and combusted with the standard air
/fuel charge, the closed loop fuel control system
caters for the additional air fuel ratio enrichment
to ensure that stoichiometric fuelling continues.
The evaporative system monitor is responsible
for determining the serviceability of the EVAP sys-
tem components and to detect leaks in the vapour
lines. Most manufacturers check for fuel vapour
leaks by employing a diagnostic that utilises a
pressure or vacuum test on the fuel system.
European legislation dictates that these checks
are not required. However, vehicles manufactured
in the USA after 1996 and before 1999 generally
employ a system that uses a pressure or vacuum
system. This must be able to detect a leak in a hose
or filler cap that is equivalent to that generated by a
hole, which is 1 mm (0.40) in diameter. Vehicles
manufactured after 2000 must support diagnos-
tics that are capable of detecting a 0.5 mm (0.20)
hole.
5.3.8 Fuel system monitoring
As vehicles accumulate mileage then so also
do the components, sensors and actuators of the
emissions control systems. Mass airflow sensors
become dirty and their response slows with age.
Exhaust gas oxygen sensors also respond slower
as they are subject to the in-field failure modes
such as oil and fuel contamination, thermal stress
and general ageing. Fuel pressure regulators per-
form outside of their optimum capacity, fuel injec-
tors become slower in their response, and partial
blockages mean that they deliver less and some-
times more fuel than requested.
If this component ageing were not compen-
sated for it would mean that the fuel system would
not be able to maintain normal fuelling around
stoichiometric air fuel ratio as shown in Figure
5.9. The end result would be the potential to
68 Advanced automotive fault diagnosis
1.03
1.02
1.01
1
0.99
0.98
0.97460 461 462 463 464 465 466 467 468
Time [s]
469 470 471 472 473 474 475 476
0.012
Lamda before cat Lamda after cat
Figure 5.8 Upstream and downstream exhaust gas sensor activity – failed catalyst (Source: SAE 2001-01-0933 New Cat Preparation
Procedure for OBD2 Monitoring Requirements)
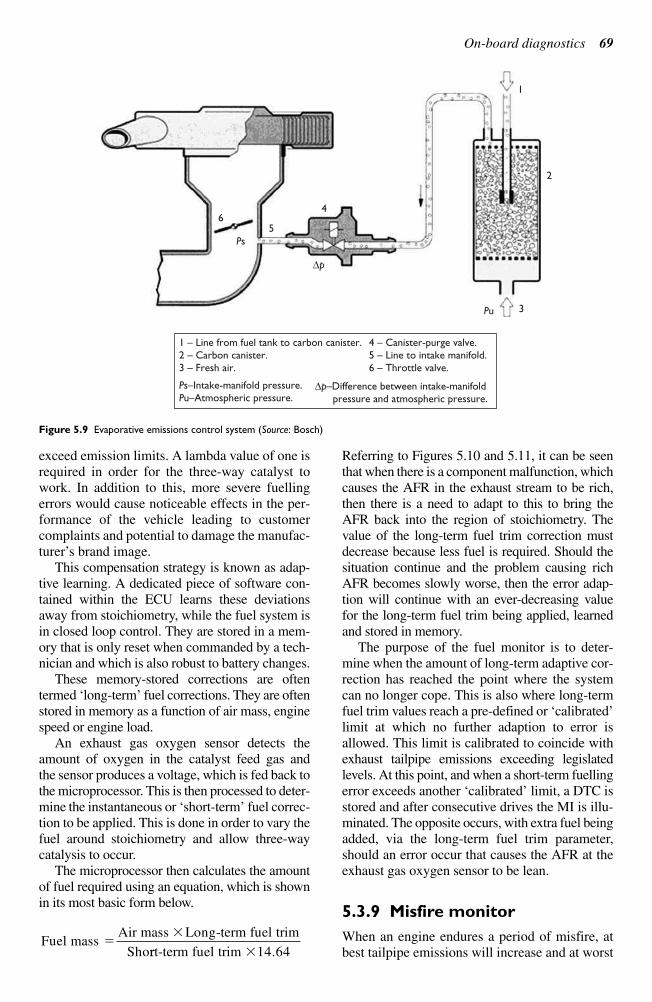
On-board diagnostics 69
exceed emission limits. A lambda value of one is
required in order for the three-way catalyst to
work. In addition to this, more severe fuelling
errors would cause noticeable effects in the per-
formance of the vehicle leading to customer
complaints and potential to damage the manufac-
turer’s brand image.
This compensation strategy is known as adap-
tive learning. A dedicated piece of software con-
tained within the ECU learns these deviations
away from stoichiometry, while the fuel system is
in closed loop control. They are stored in a mem-
ory that is only reset when commanded by a tech-
nician and which is also robust to battery changes.
These memory-stored corrections are often
termed ‘long-term’ fuel corrections. They are often
stored in memory as a function of air mass, engine
speed or engine load.
An exhaust gas oxygen sensor detects the
amount of oxygen in the catalyst feed gas and
the sensor produces a voltage, which is fed back to
the microprocessor. This is then processed to deter-
mine the instantaneous or ‘short-term’ fuel correc-
tion to be applied. This is done in order to vary the
fuel around stoichiometry and allow three-way
catalysis to occur.
The microprocessor then calculates the amount
of fuel required using an equation, which is shown
in its most basic form below.
Referring to Figures 5.10 and 5.11, it can be seen
that when there is a component malfunction, which
causes the AFR in the exhaust stream to be rich,
then there is a need to adapt to this to bring the
AFR back into the region of stoichiometry. The
value of the long-term fuel trim correction must
decrease because less fuel is required. Should the
situation continue and the problem causing rich
AFR becomes slowly worse, then the error adap-
tion will continue with an ever-decreasing value
for the long-term fuel trim being applied, learned
and stored in memory.
The purpose of the fuel monitor is to deter-
mine when the amount of long-term adaptive cor-
rection has reached the point where the system
can no longer cope. This is also where long-term
fuel trim values reach a pre-defined or ‘calibrated’
limit at which no further adaption to error is
allowed. This limit is calibrated to coincide with
exhaust tailpipe emissions exceeding legislated
levels. At this point, and when a short-term fuelling
error exceeds another ‘calibrated’ limit, a DTC is
stored and after consecutive drives the MI is illu-
minated. The opposite occurs, with extra fuel being
added, via the long-term fuel trim parameter,
should an error occur that causes the AFR at the
exhaust gas oxygen sensor to be lean.
5.3.9 Misfire monitor
When an engine endures a period of misfire, at
best tailpipe emissions will increase and at worstFuel mass
Air mass Long-term fuel trim
Sho
rrt-term fuel trim 14.64
1 – Line from fuel tank to carbon canister.2 – Carbon canister.3 – Fresh air.
65
4
Ps
Pu 3
2
1
∆p
Ps–Intake-manifold pressure.Pu–Atmospheric pressure.
4 – Canister-purge valve.5 – Line to intake manifold.6 – Throttle valve.
∆p–Difference between intake-manifold pressure and atmospheric pressure.
Figure 5.9 Evaporative emissions control system (Source: Bosch)
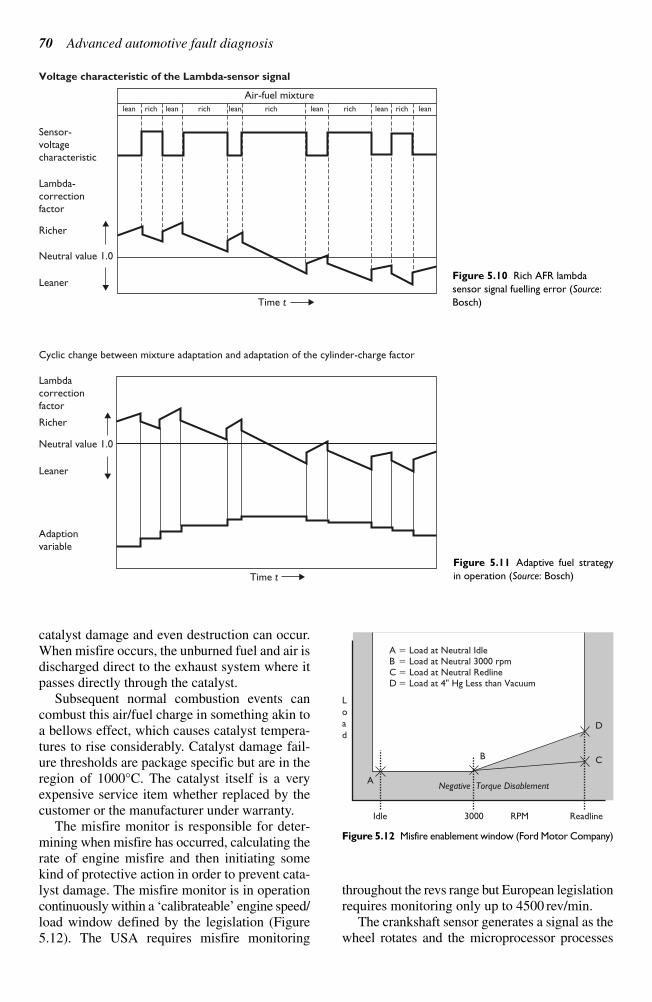
catalyst damage and even destruction can occur.
When misfire occurs, the unburned fuel and air is
discharged direct to the exhaust system where it
passes directly through the catalyst.
Subsequent normal combustion events can
combust this air/fuel charge in something akin to
a bellows effect, which causes catalyst tempera-
tures to rise considerably. Catalyst damage fail-
ure thresholds are package specific but are in the
region of 1000°C. The catalyst itself is a very
expensive service item whether replaced by the
customer or the manufacturer under warranty.
The misfire monitor is responsible for deter-
mining when misfire has occurred, calculating the
rate of engine misfire and then initiating some
kind of protective action in order to prevent cata-
lyst damage. The misfire monitor is in operation
continuously within a ‘calibrateable’ engine speed/
load window defined by the legislation (Figure
5.12). The USA requires misfire monitoring
throughout the revs range but European legislation
requires monitoring only up to 4500 rev/min.
The crankshaft sensor generates a signal as the
wheel rotates and the microprocessor processes
70 Advanced automotive fault diagnosis
Cyclic change between mixture adaptation and adaptation of the cylinder-charge factor
Lambdacorrectionfactor
Richer
Neutral value 1.0
Leaner
Adaptionvariable
Time t
Figure 5.11 Adaptive fuel strategy
in operation (Source: Bosch)
Idle
A Load at Neutral IdleB Load at Neutral 3000 rpmC Load at Neutral RedlineD Load at 4" Hg Less than Vacuum
3000 RPM Readline
D
CB
ANegative Torque Disablement
L
o
a
d
Figure 5.12 Misfire enablement window (Ford Motor Company)
Air-fuel mixture
lean rich rich rich rich richlean lean lean lean lean
Sensor-voltagecharacteristic
Lambda-correctionfactor
Richer
Neutral value 1.0
Leaner
Time t
Voltage characteristic of the Lambda-sensor signal
Figure 5.10 Rich AFR lambda
sensor signal fuelling error (Source:
Bosch)
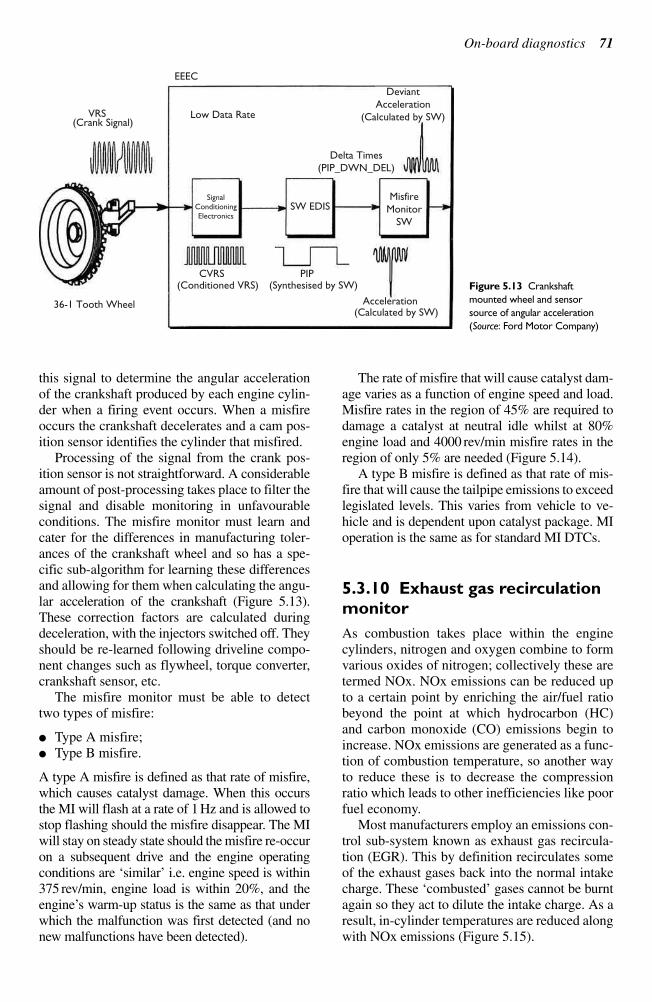
On-board diagnostics 71
this signal to determine the angular acceleration
of the crankshaft produced by each engine cylin-
der when a firing event occurs. When a misfire
occurs the crankshaft decelerates and a cam pos-
ition sensor identifies the cylinder that misfired.
Processing of the signal from the crank pos-
ition sensor is not straightforward. A considerable
amount of post-processing takes place to filter the
signal and disable monitoring in unfavourable
conditions. The misfire monitor must learn and
cater for the differences in manufacturing toler-
ances of the crankshaft wheel and so has a spe-
cific sub-algorithm for learning these differences
and allowing for them when calculating the angu-
lar acceleration of the crankshaft (Figure 5.13).
These correction factors are calculated during
deceleration, with the injectors switched off. They
should be re-learned following driveline compo-
nent changes such as flywheel, torque converter,
crankshaft sensor, etc.
The misfire monitor must be able to detect
two types of misfire:
Type A misfire;
Type B misfire.
A type A misfire is defined as that rate of misfire,
which causes catalyst damage. When this occurs
the MI will flash at a rate of 1 Hz and is allowed to
stop flashing should the misfire disappear. The MI
will stay on steady state should the misfire re-occur
on a subsequent drive and the engine operating
conditions are ‘similar’ i.e. engine speed is within
375 rev/min, engine load is within 20%, and the
engine’s warm-up status is the same as that under
which the malfunction was first detected (and no
new malfunctions have been detected).
The rate of misfire that will cause catalyst dam-
age varies as a function of engine speed and load.
Misfire rates in the region of 45% are required to
damage a catalyst at neutral idle whilst at 80%
engine load and 4000 rev/min misfire rates in the
region of only 5% are needed (Figure 5.14).
A type B misfire is defined as that rate of mis-
fire that will cause the tailpipe emissions to exceed
legislated levels. This varies from vehicle to ve-
hicle and is dependent upon catalyst package. MI
operation is the same as for standard MI DTCs.
5.3.10 Exhaust gas recirculation
monitor
As combustion takes place within the engine
cylinders, nitrogen and oxygen combine to form
various oxides of nitrogen; collectively these are
termed NOx. NOx emissions can be reduced up
to a certain point by enriching the air/fuel ratio
beyond the point at which hydrocarbon (HC)
and carbon monoxide (CO) emissions begin to
increase. NOx emissions are generated as a func-
tion of combustion temperature, so another way
to reduce these is to decrease the compression
ratio which leads to other inefficiencies like poor
fuel economy.
Most manufacturers employ an emissions con-
trol sub-system known as exhaust gas recircula-
tion (EGR). This by definition recirculates some
of the exhaust gases back into the normal intake
charge. These ‘combusted’ gases cannot be burnt
again so they act to dilute the intake charge. As a
result, in-cylinder temperatures are reduced along
with NOx emissions (Figure 5.15).
EEEC
VRS
36-1 Tooth Wheel
Low Data Rate
DeviantAcceleration
(Calculated by SW)
SW EDIS
(Conditioned VRS)CVRS
(Synthesised by SW)
(Crank Signal)
(Calculated by SW)
PIP
Acceleration
SignalConditioningElectronics
MisfireMonitor
SW
Delta Times(PIP_DWN_DEL)
Figure 5.13 Crankshaft
mounted wheel and sensor
source of angular acceleration
(Source: Ford Motor Company)
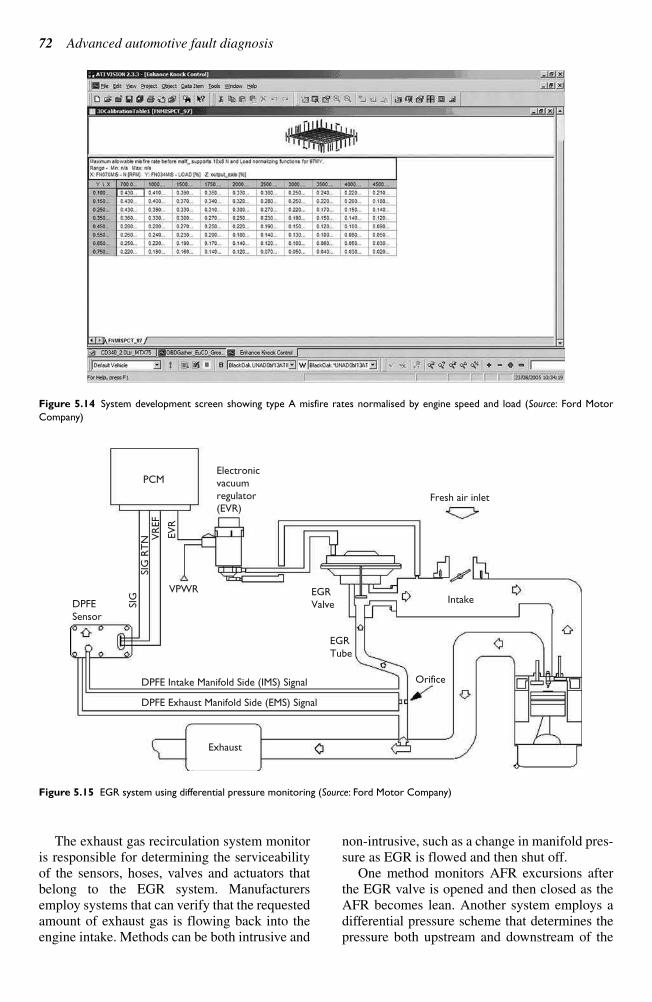
The exhaust gas recirculation system monitor
is responsible for determining the serviceability
of the sensors, hoses, valves and actuators that
belong to the EGR system. Manufacturers
employ systems that can verify that the requested
amount of exhaust gas is flowing back into the
engine intake. Methods can be both intrusive and
non-intrusive, such as a change in manifold pres-
sure as EGR is flowed and then shut off.
One method monitors AFR excursions after
the EGR valve is opened and then closed as the
AFR becomes lean. Another system employs a
differential pressure scheme that determines the
pressure both upstream and downstream of the
72 Advanced automotive fault diagnosis
Figure 5.14 System development screen showing type A misfire rates normalised by engine speed and load (Source: Ford Motor
Company)
PCM
VPWR EGRValve
EGRTube
Intake
Fresh air inlet
Orifice
Exhaust
DPFE Intake Manifold Side (IMS) Signal
DPFE Exhaust Manifold Side (EMS) Signal
DPFESensor
EV
R
VR
EF
SIG
RT
NSI
G
Electronicvacuumregulator(EVR)
Figure 5.15 EGR system using differential pressure monitoring (Source: Ford Motor Company)
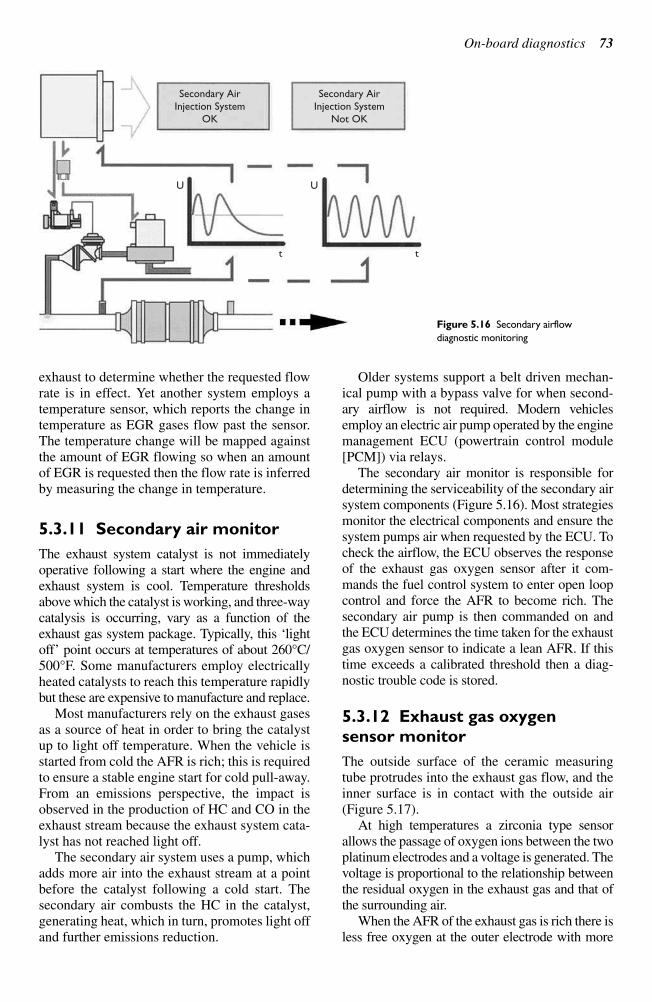
On-board diagnostics 73
exhaust to determine whether the requested flow
rate is in effect. Yet another system employs a
temperature sensor, which reports the change in
temperature as EGR gases flow past the sensor.
The temperature change will be mapped against
the amount of EGR flowing so when an amount
of EGR is requested then the flow rate is inferred
by measuring the change in temperature.
5.3.11 Secondary air monitor
The exhaust system catalyst is not immediately
operative following a start where the engine and
exhaust system is cool. Temperature thresholds
above which the catalyst is working, and three-way
catalysis is occurring, vary as a function of the
exhaust gas system package. Typically, this ‘light
off’ point occurs at temperatures of about 260°C/
500°F. Some manufacturers employ electrically
heated catalysts to reach this temperature rapidly
but these are expensive to manufacture and replace.
Most manufacturers rely on the exhaust gases
as a source of heat in order to bring the catalyst
up to light off temperature. When the vehicle is
started from cold the AFR is rich; this is required
to ensure a stable engine start for cold pull-away.
From an emissions perspective, the impact is
observed in the production of HC and CO in the
exhaust stream because the exhaust system cata-
lyst has not reached light off.
The secondary air system uses a pump, which
adds more air into the exhaust stream at a point
before the catalyst following a cold start. The
secondary air combusts the HC in the catalyst,
generating heat, which in turn, promotes light off
and further emissions reduction.
Older systems support a belt driven mechan-
ical pump with a bypass valve for when second-
ary airflow is not required. Modern vehicles
employ an electric air pump operated by the engine
management ECU (powertrain control module
[PCM]) via relays.
The secondary air monitor is responsible for
determining the serviceability of the secondary air
system components (Figure 5.16). Most strategies
monitor the electrical components and ensure the
system pumps air when requested by the ECU. To
check the airflow, the ECU observes the response
of the exhaust gas oxygen sensor after it com-
mands the fuel control system to enter open loop
control and force the AFR to become rich. The
secondary air pump is then commanded on and
the ECU determines the time taken for the exhaust
gas oxygen sensor to indicate a lean AFR. If this
time exceeds a calibrated threshold then a diag-
nostic trouble code is stored.
5.3.12 Exhaust gas oxygen
sensor monitor
The outside surface of the ceramic measuring
tube protrudes into the exhaust gas flow, and the
inner surface is in contact with the outside air
(Figure 5.17).
At high temperatures a zirconia type sensor
allows the passage of oxygen ions between the two
platinum electrodes and a voltage is generated. The
voltage is proportional to the relationship between
the residual oxygen in the exhaust gas and that of
the surrounding air.
When the AFR of the exhaust gas is rich there is
less free oxygen at the outer electrode with more
Secondary AirInjection System
OK
U U
t t
Secondary AirInjection System
Not OK
Figure 5.16 Secondary airflow
diagnostic monitoring
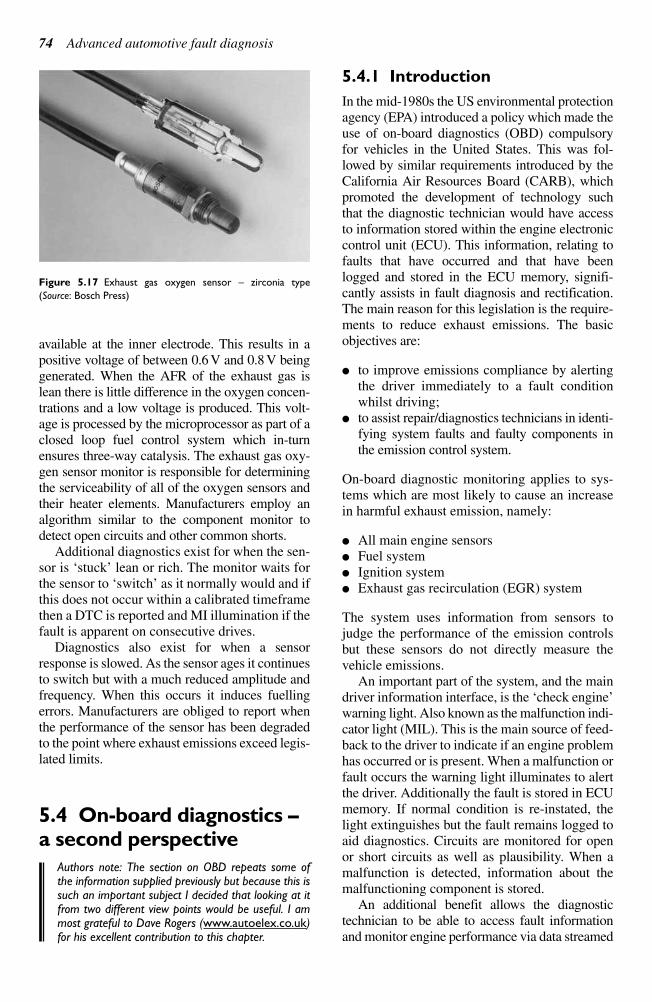
available at the inner electrode. This results in a
positive voltage of between 0.6 V and 0.8 V being
generated. When the AFR of the exhaust gas is
lean there is little difference in the oxygen concen-
trations and a low voltage is produced. This volt-
age is processed by the microprocessor as part of a
closed loop fuel control system which in-turn
ensures three-way catalysis. The exhaust gas oxy-
gen sensor monitor is responsible for determining
the serviceability of all of the oxygen sensors and
their heater elements. Manufacturers employ an
algorithm similar to the component monitor to
detect open circuits and other common shorts.
Additional diagnostics exist for when the sen-
sor is ‘stuck’ lean or rich. The monitor waits for
the sensor to ‘switch’ as it normally would and if
this does not occur within a calibrated timeframe
then a DTC is reported and MI illumination if the
fault is apparent on consecutive drives.
Diagnostics also exist for when a sensor
response is slowed. As the sensor ages it continues
to switch but with a much reduced amplitude and
frequency. When this occurs it induces fuelling
errors. Manufacturers are obliged to report when
the performance of the sensor has been degraded
to the point where exhaust emissions exceed legis-
lated limits.
5.4 On-board diagnostics –a second perspective
Authors note: The section on OBD repeats some ofthe information supplied previously but because this issuch an important subject I decided that looking at itfrom two different view points would be useful. I ammost grateful to Dave Rogers (www.autoelex.co.uk)for his excellent contribution to this chapter.
5.4.1 Introduction
In the mid-1980s the US environmental protection
agency (EPA) introduced a policy which made the
use of on-board diagnostics (OBD) compulsory
for vehicles in the United States. This was fol-
lowed by similar requirements introduced by the
California Air Resources Board (CARB), which
promoted the development of technology such
that the diagnostic technician would have access
to information stored within the engine electronic
control unit (ECU). This information, relating to
faults that have occurred and that have been
logged and stored in the ECU memory, signifi-
cantly assists in fault diagnosis and rectification.
The main reason for this legislation is the require-
ments to reduce exhaust emissions. The basic
objectives are:
to improve emissions compliance by alerting
the driver immediately to a fault condition
whilst driving;
to assist repair/diagnostics technicians in identi-
fying system faults and faulty components in
the emission control system.
On-board diagnostic monitoring applies to sys-
tems which are most likely to cause an increase
in harmful exhaust emission, namely:
All main engine sensors
Fuel system
Ignition system
Exhaust gas recirculation (EGR) system
The system uses information from sensors to
judge the performance of the emission controls
but these sensors do not directly measure the
vehicle emissions.
An important part of the system, and the main
driver information interface, is the ‘check engine’
warning light. Also known as the malfunction indi-
cator light (MIL). This is the main source of feed-
back to the driver to indicate if an engine problem
has occurred or is present. When a malfunction or
fault occurs the warning light illuminates to alert
the driver. Additionally the fault is stored in ECU
memory. If normal condition is re-instated, the
light extinguishes but the fault remains logged to
aid diagnostics. Circuits are monitored for open
or short circuits as well as plausibility. When a
malfunction is detected, information about the
malfunctioning component is stored.
An additional benefit allows the diagnostic
technician to be able to access fault information
and monitor engine performance via data streamed
74 Advanced automotive fault diagnosis
Figure 5.17 Exhaust gas oxygen sensor – zirconia type
(Source: Bosch Press)
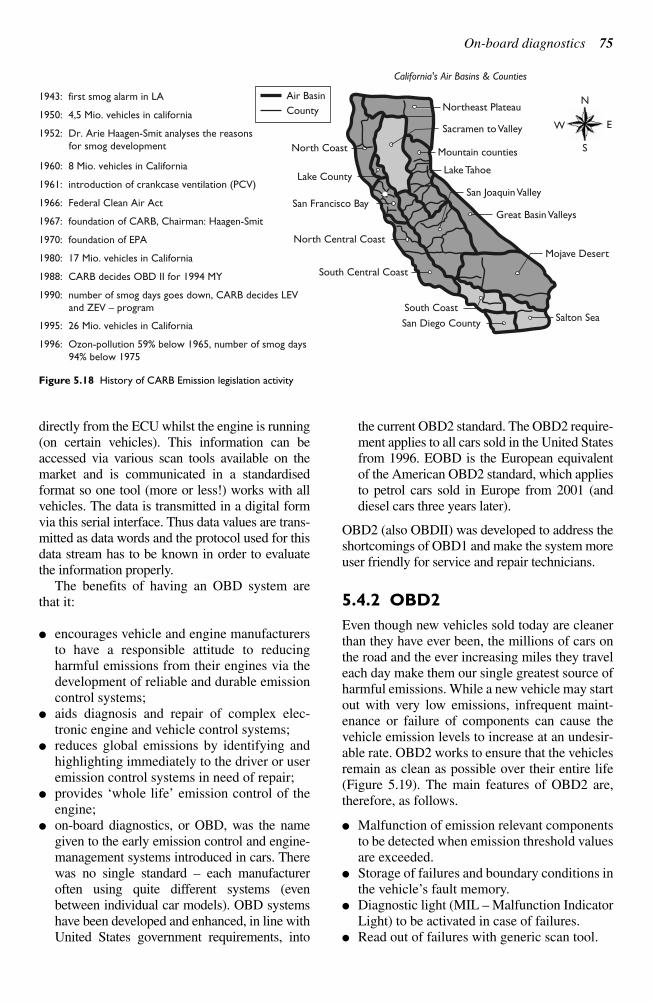
On-board diagnostics 75
directly from the ECU whilst the engine is running
(on certain vehicles). This information can be
accessed via various scan tools available on the
market and is communicated in a standardised
format so one tool (more or less!) works with all
vehicles. The data is transmitted in a digital form
via this serial interface. Thus data values are trans-
mitted as data words and the protocol used for this
data stream has to be known in order to evaluate
the information properly.
The benefits of having an OBD system are
that it:
encourages vehicle and engine manufacturers
to have a responsible attitude to reducing
harmful emissions from their engines via the
development of reliable and durable emission
control systems;
aids diagnosis and repair of complex elec-
tronic engine and vehicle control systems;
reduces global emissions by identifying and
highlighting immediately to the driver or user
emission control systems in need of repair;
provides ‘whole life’ emission control of the
engine;
on-board diagnostics, or OBD, was the name
given to the early emission control and engine-
management systems introduced in cars. There
was no single standard – each manufacturer
often using quite different systems (even
between individual car models). OBD systems
have been developed and enhanced, in line with
United States government requirements, into
the current OBD2 standard. The OBD2 require-
ment applies to all cars sold in the United States
from 1996. EOBD is the European equivalent
of the American OBD2 standard, which applies
to petrol cars sold in Europe from 2001 (and
diesel cars three years later).
OBD2 (also OBDII) was developed to address the
shortcomings of OBD1 and make the system more
user friendly for service and repair technicians.
5.4.2 OBD2
Even though new vehicles sold today are cleaner
than they have ever been, the millions of cars on
the road and the ever increasing miles they travel
each day make them our single greatest source of
harmful emissions. While a new vehicle may start
out with very low emissions, infrequent maint-
enance or failure of components can cause the
vehicle emission levels to increase at an undesir-
able rate. OBD2 works to ensure that the vehicles
remain as clean as possible over their entire life
(Figure 5.19). The main features of OBD2 are,
therefore, as follows.
Malfunction of emission relevant components
to be detected when emission threshold values
are exceeded.
Storage of failures and boundary conditions in
the vehicle’s fault memory.
Diagnostic light (MIL – Malfunction Indicator
Light) to be activated in case of failures.
Read out of failures with generic scan tool.
1943: first smog alarm in LA
California's Air Basins & Counties
1950: 4,5 Mio. vehicles in california
1952: Dr. Arie Haagen-Smit analyses the reasons for smog development
1960: 8 Mio. vehicles in California
1961: introduction of crankcase ventilation (PCV)
1966: Federal Clean Air Act
1967: foundation of CARB, Chairman: Haagen-Smit
1970: foundation of EPA
1980: 17 Mio. vehicles in California
1988: CARB decides OBD II for 1994 MY
1990: number of smog days goes down, CARB decides LEV and ZEV – program
1995: 26 Mio. vehicles in California
1996: Ozon-pollution 59% below 1965, number of smog days 94% below 1975
Northeast Plateau
Sacramen to Valley
N
E
S
W
Mountain counties
Lake Tahoe
San Joaquin Valley
Great Basin Valleys
Air Basin
County
Mojave Desert
Salton SeaSan Diego County
South Coast
South Central Coast
North Central Coast
San Francisco Bay
Lake County
North Coast
Figure 5.18 History of CARB Emission legislation activity
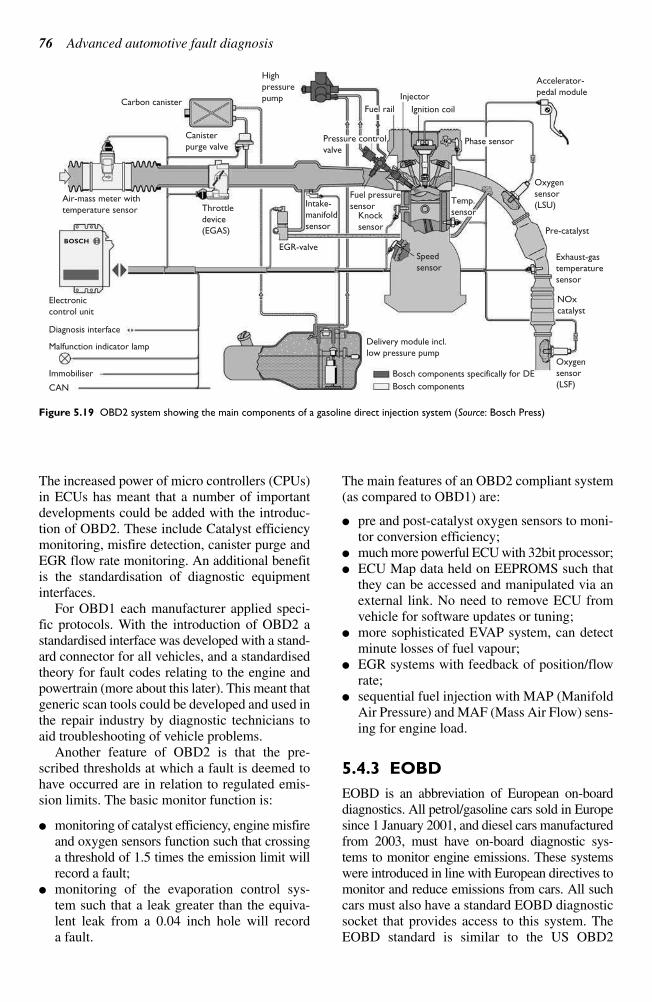
The increased power of micro controllers (CPUs)
in ECUs has meant that a number of important
developments could be added with the introduc-
tion of OBD2. These include Catalyst efficiency
monitoring, misfire detection, canister purge and
EGR flow rate monitoring. An additional benefit
is the standardisation of diagnostic equipment
interfaces.
For OBD1 each manufacturer applied speci-
fic protocols. With the introduction of OBD2 a
standardised interface was developed with a stand-
ard connector for all vehicles, and a standardised
theory for fault codes relating to the engine and
powertrain (more about this later). This meant that
generic scan tools could be developed and used in
the repair industry by diagnostic technicians to
aid troubleshooting of vehicle problems.
Another feature of OBD2 is that the pre-
scribed thresholds at which a fault is deemed to
have occurred are in relation to regulated emis-
sion limits. The basic monitor function is:
monitoring of catalyst efficiency, engine misfire
and oxygen sensors function such that crossing
a threshold of 1.5 times the emission limit will
record a fault;
monitoring of the evaporation control sys-
tem such that a leak greater than the equiva-
lent leak from a 0.04 inch hole will record
a fault.
The main features of an OBD2 compliant system
(as compared to OBD1) are:
pre and post-catalyst oxygen sensors to moni-
tor conversion efficiency;
much more powerful ECU with 32bit processor;
ECU Map data held on EEPROMS such that
they can be accessed and manipulated via an
external link. No need to remove ECU from
vehicle for software updates or tuning;
more sophisticated EVAP system, can detect
minute losses of fuel vapour;
EGR systems with feedback of position/flow
rate;
sequential fuel injection with MAP (Manifold
Air Pressure) and MAF (Mass Air Flow) sens-
ing for engine load.
5.4.3 EOBD
EOBD is an abbreviation of European on-board
diagnostics. All petrol/gasoline cars sold in Europe
since 1 January 2001, and diesel cars manufactured
from 2003, must have on-board diagnostic sys-
tems to monitor engine emissions. These systems
were introduced in line with European directives to
monitor and reduce emissions from cars. All such
cars must also have a standard EOBD diagnostic
socket that provides access to this system. The
EOBD standard is similar to the US OBD2
76 Advanced automotive fault diagnosis
Carbon canister
Air-mass meter with
temperature sensor
Electronic
control unit
BOSCH
Diagnosis interface
Malfunction indicator lamp
Immobiliser
CAN
High
pressure
pump
Canister
purge valve
Throttle
device
(EGAS)
EGR-valve
Intake-
manifold
sensor
Injector
Ignition coil
Phase sensor
Accelerator-
pedal module
Oxygen
sensor
(LSU)Temp.
sensor
Speed
sensor
Fuel pressure
sensorKnock
sensor Pre-catalyst
Exhaust-gas
temperature
sensor
NOx
catalyst
Oxygen
sensor
(LSF)Bosch components specifically for DE
Bosch components
Delivery module incl.
low pressure pump
Fuel rail
Pressure control
valve
Figure 5.19 OBD2 system showing the main components of a gasoline direct injection system (Source: Bosch Press)
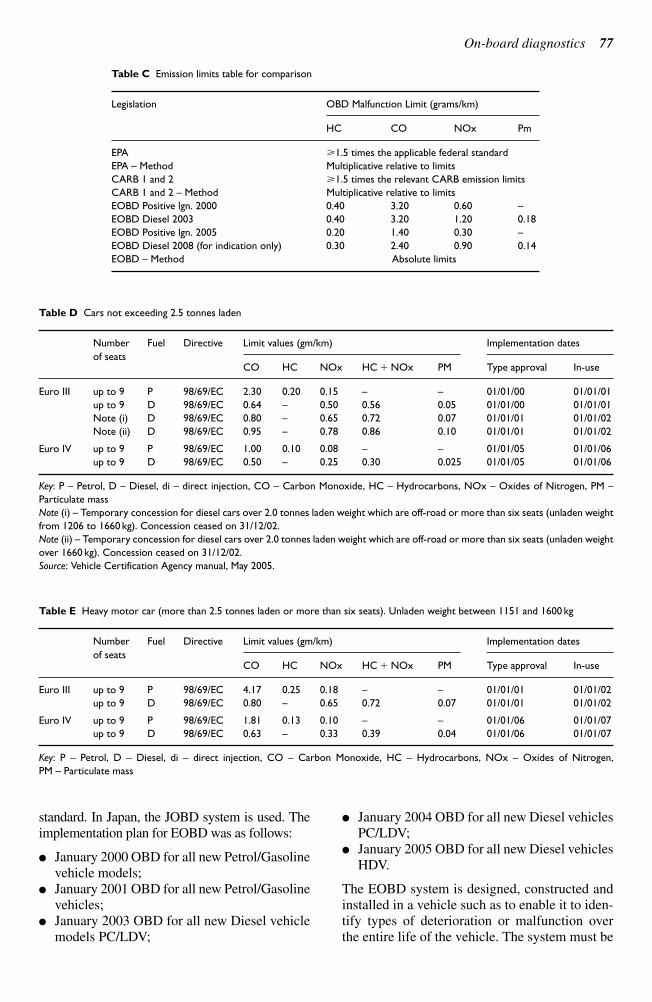
On-board diagnostics 77
standard. In Japan, the JOBD system is used. The
implementation plan for EOBD was as follows:
January 2000 OBD for all new Petrol/Gasoline
vehicle models;
January 2001 OBD for all new Petrol/Gasoline
vehicles;
January 2003 OBD for all new Diesel vehicle
models PC/LDV;
January 2004 OBD for all new Diesel vehicles
PC/LDV;
January 2005 OBD for all new Diesel vehicles
HDV.
The EOBD system is designed, constructed and
installed in a vehicle such as to enable it to iden-
tify types of deterioration or malfunction over
the entire life of the vehicle. The system must be
Table C Emission limits table for comparison
Legislation OBD Malfunction Limit (grams/km)
HC CO NOx Pm
EPA 1.5 times the applicable federal standard
EPA – Method Multiplicative relative to limits
CARB 1 and 2 1.5 times the relevant CARB emission limits
CARB 1 and 2 – Method Multiplicative relative to limits
EOBD Positive lgn. 2000 0.40 3.20 0.60 –
EOBD Diesel 2003 0.40 3.20 1.20 0.18
EOBD Positive lgn. 2005 0.20 1.40 0.30 –
EOBD Diesel 2008 (for indication only) 0.30 2.40 0.90 0.14
EOBD – Method Absolute limits
Table D Cars not exceeding 2.5 tonnes laden
Number Fuel Directive Limit values (gm/km) Implementation dates
of seatsCO HC NOx HC NOx PM Type approval In-use
Euro III up to 9 P 98/69/EC 2.30 0.20 0.15 – – 01/01/00 01/01/01
up to 9 D 98/69/EC 0.64 – 0.50 0.56 0.05 01/01/00 01/01/01
Note (i) D 98/69/EC 0.80 – 0.65 0.72 0.07 01/01/01 01/01/02
Note (ii) D 98/69/EC 0.95 – 0.78 0.86 0.10 01/01/01 01/01/02
Euro IV up to 9 P 98/69/EC 1.00 0.10 0.08 – – 01/01/05 01/01/06
up to 9 D 98/69/EC 0.50 – 0.25 0.30 0.025 01/01/05 01/01/06
Key: P – Petrol, D – Diesel, di – direct injection, CO – Carbon Monoxide, HC – Hydrocarbons, NOx – Oxides of Nitrogen, PM –
Particulate mass
Note (i) – Temporary concession for diesel cars over 2.0 tonnes laden weight which are off-road or more than six seats (unladen weight
from 1206 to 1660 kg). Concession ceased on 31/12/02.
Note (ii) – Temporary concession for diesel cars over 2.0 tonnes laden weight which are off-road or more than six seats (unladen weight
over 1660 kg). Concession ceased on 31/12/02.
Source: Vehicle Certification Agency manual, May 2005.
Table E Heavy motor car (more than 2.5 tonnes laden or more than six seats). Unladen weight between 1151 and 1600 kg
Number Fuel Directive Limit values (gm/km) Implementation dates
of seatsCO HC NOx HC NOx PM Type approval In-use
Euro III up to 9 P 98/69/EC 4.17 0.25 0.18 – – 01/01/01 01/01/02
up to 9 D 98/69/EC 0.80 – 0.65 0.72 0.07 01/01/01 01/01/02
Euro IV up to 9 P 98/69/EC 1.81 0.13 0.10 – – 01/01/06 01/01/07
up to 9 D 98/69/EC 0.63 – 0.33 0.39 0.04 01/01/06 01/01/07
Key: P – Petrol, D – Diesel, di – direct injection, CO – Carbon Monoxide, HC – Hydrocarbons, NOx – Oxides of Nitrogen,
PM – Particulate mass
designed, constructed and installed in a vehicle
to enable it to comply with the requirements dur-
ing conditions of normal use.
In addition, EOBD and OBD2 allow access
to manufacturer-specific features available on
some OBD2/EOBD compliant scan tools. This
allows additional parameters or information to be
extracted from the vehicle systems. These are in
addition to the normal parameters and information
available within the EOBD/OBD2 standard. These
enhanced functions are highly specific and vary
widely between manufacturers.
EOBD monitoring requirements on
the vehicle
The monitoring capabilities of the EOBD system
are defined for petrol/gasoline (spark ignition)
and diesel (compression ignition) engines. The
following is an outline.
Spark ignition engines
Detection of the reduction in the efficiency of
the catalytic converter with respect to emis-
sions of HC only.
The presence of engine misfires in the engine
operation region within the following bound-
ary conditions.
Oxygen sensor deterioration.
Other emission control system components or
systems, or emission-related powertrain com-
ponents or systems which are connected to a
computer, the failure of which may result in
tailpipe emission exceeding the specified limits.
Any other emission-related powertrain com-
ponent connected to a computer must be moni-
tored for circuit continuity.
The electronic evaporative emission purge
control must, at a minimum, be monitored for
circuit continuity.
Compression ignition engines
Where fitted, reduction in the efficiency of the
catalytic converter.
Where fitted, the functionality and integrity of
the particulate trap.
The fuel injection system electronic fuel quan-
tity and timing actuator(s) is/are monitored for
circuit continuity and total function failure.
Other emission control system components or
systems, or emission-related powertrain com-
ponents or systems which are connected to a
computer, the failure of which may result in
tailpipe emission exceeding the specified limits
given. Examples of such systems or compo-
nents are those for monitoring and control of air
massflow, air volumetric flow (and tempera-
ture), boost pressure and inlet manifold pressure
(and relevant sensors to enable these functions
to be carried out).
Any other emission-related powertrain com-
ponent connected to a computer must be moni-
tored for circuit continuity.
5.4.4 Features and technology of
current systems
To avoid false detection, the legislation allows
verification and healing strategies. These are out-
lined as follows.
MIL activation logic for detected
malfunctions
To avoid wrong detections the legislation allows
verification of the detected failure. The failure is
stored in the fault memory as a pending code
immediately after the first recognition but the
MIL is not activated. The MIL will be illuminated
in the third driving cycle, in which the failure has
been detected; the failure is then recognised as a
confirmed fault.
78 Advanced automotive fault diagnosis
Table F Heavy motor car (more than 2.5 tonnes fully laden or more than six seats). Unladen weight over 600 kg
Number Fuel Directive Limit values (gm/km) Implementation Dates
of seatsCO HC NOx HC NOx PM Type Approval In-use
Euro III up to 9 P 98/69/EC 5.22 0.29 0.21 – – 01/01/01 01/01/02
up to 9 D 98/69/EC 0.95 – 0.78 0.86 0.10 01/01/01 01/01/02
Euro IV up to 9 P 98/69/EC 2.27 0.16 0.11 – – 01/01/06 01/01/07
up to 9 D 98/69/EC 0.74 – 0.39 0.46 0.06 01/01/06 01/01/07
Key: P – Petrol, D – Diesel, di – direct injection, CO – Carbon Monoxide, HC – Hydrocarbons, NOx – Oxides of Nitrogen,
PM – Particulate mass
Note: The test procedure for Euro III and Euro IV is more severe than that for Euro I and Euro II. This results in some emission levels
having an apparent increase when in fact they are more tightly controlled.
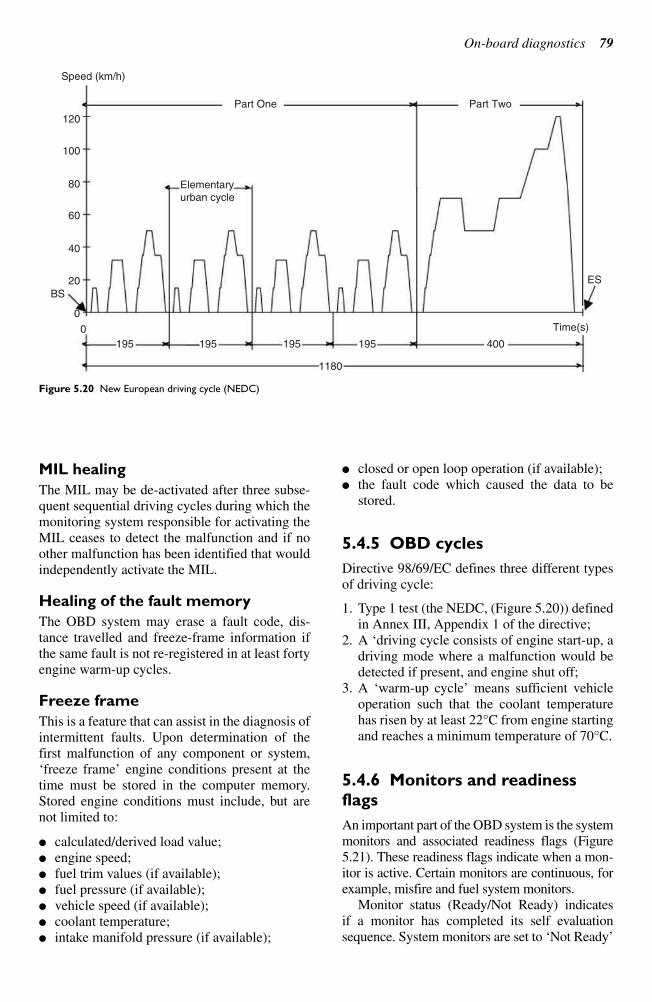
On-board diagnostics 79
MIL healing
The MIL may be de-activated after three subse-
quent sequential driving cycles during which the
monitoring system responsible for activating the
MIL ceases to detect the malfunction and if no
other malfunction has been identified that would
independently activate the MIL.
Healing of the fault memory
The OBD system may erase a fault code, dis-
tance travelled and freeze-frame information if
the same fault is not re-registered in at least forty
engine warm-up cycles.
Freeze frame
This is a feature that can assist in the diagnosis of
intermittent faults. Upon determination of the
first malfunction of any component or system,
‘freeze frame’ engine conditions present at the
time must be stored in the computer memory.
Stored engine conditions must include, but are
not limited to:
calculated/derived load value;
engine speed;
fuel trim values (if available);
fuel pressure (if available);
vehicle speed (if available);
coolant temperature;
intake manifold pressure (if available);
closed or open loop operation (if available);
the fault code which caused the data to be
stored.
5.4.5 OBD cycles
Directive 98/69/EC defines three different types
of driving cycle:
1. Type 1 test (the NEDC, (Figure 5.20)) defined
in Annex III, Appendix 1 of the directive;
2. A ‘driving cycle consists of engine start-up, a
driving mode where a malfunction would be
detected if present, and engine shut off;
3. A ‘warm-up cycle’ means sufficient vehicle
operation such that the coolant temperature
has risen by at least 22°C from engine starting
and reaches a minimum temperature of 70°C.
5.4.6 Monitors and readiness
flags
An important part of the OBD system is the system
monitors and associated readiness flags (Figure
5.21). These readiness flags indicate when a mon-
itor is active. Certain monitors are continuous, for
example, misfire and fuel system monitors.
Monitor status (Ready/Not Ready) indicates
if a monitor has completed its self evaluation
sequence. System monitors are set to ‘Not Ready’
Speed (km/h)
120
100
80
60
40
20
BS
0
0
195 195
Elementaryurban cycle
Time(s)
ES
195 195
1180
400
Part One Part Two
Figure 5.20 New European driving cycle (NEDC)

if cleared by scan tool and/or the battery is discon-
nected. Some of the monitors must test their com-
ponents under specific, appropriate preconditions.
The evaporative system monitor has tempera-
ture and fuel fill level constraints.
The misfire monitor may ignore input on
rough road surfaces to prevent false triggers.
The oxygen sensor heater must monitor from
a cold start.
Most other system monitors are not continuous
and are only active under certain conditions. If
these conditions are not fulfilled then the readi-
ness flag for that monitor is set to ‘not ready’.
Until the readiness flags are set appropriately. It
is not possible to perform a test of the OBD sys-
tem and its associated components.
There is no universal drive cycle that is guaran-
teed to set all the system monitors appropriately for
a test of the OBD system. Most manufacturers and
even cars have their own specific requirements and
irrespective of this, there are still some specific
vehicles that have known issues when trying to set
readiness flag status. As mentioned above, some
allowance has been made for vehicles of model
year 1996 to 2000 which can show two readiness
flags to be ‘not ready’. After this, 2001 onwards,
one readiness flag is allowed to be ‘not ready’ prior
to a test.
5.4.7 Fault codes
An integral feature of the OBD system is its abil-
ity to store fault codes relating to problems that
occur with the engine electronic control system;
particularly faults that could affect the emission
control system and this is one of its primary
functions. For the diagnostic technician this is a
powerful feature which can clearly assist in
locating and rectifying problems on the vehicle
when they occur.
The diagnostic socket used by systems con-
forming to EOBD/OBD2 standards (Figure 5.22)
should have the following pin configuration:
1. Ignition positive supply
2. Bus Line, SAE J1850 (PWM)
3. Manufacturer’s discretion
4. Chassis ground
5. Signal ground
6. CAN bus H
7. K Line
8. Manufacturer’s discretion
9. Manufacturer’s discretion
10. Bus – Line (PWM)
11. Manufacturer’s discretion
12. Manufacturer’s discretion
13. Manufacturer’s discretion
14. CAN bus L
15. L line or second K line
16. Vehicle battery positive.
With the introduction of OBD2 and EOBD this
feature was made even more powerful by making
it more accessible. Standardisation of the interface
connector known as the diagnostic link connector
(DLC) and communication protocol allowed the
development of generic scan tools, which could be
used on any OBD compliant vehicle.
Most systems in use involve two types of codes.
The generic codes associated with the OBD stand-
ard and manufacturer specific codes. The generic
codes have a specific structure that allows easy
identification and are common across all manufac-
turers (Figure 5.23). That is, a certain fault code
means the same thing on any vehicle, irrespective
of the manufacturer (Figure 5.24). All basic scan
tools are capable of reading these generic codes.
The second type of code available is a manu-
facturer specific code. These are enhanced codes
which can give additional information about
the engine, vehicle and powertrain electronic
80 Advanced automotive fault diagnosis
Figure 5.21 System monitors (marked as ‘Complete’) and live
data shown in scan tool
1 2 3 4 5 6 7 8
9 10 11 12 13 14 15 16
Figure 5.22 Sixteen Pin DLC OBD2/EOBD connector
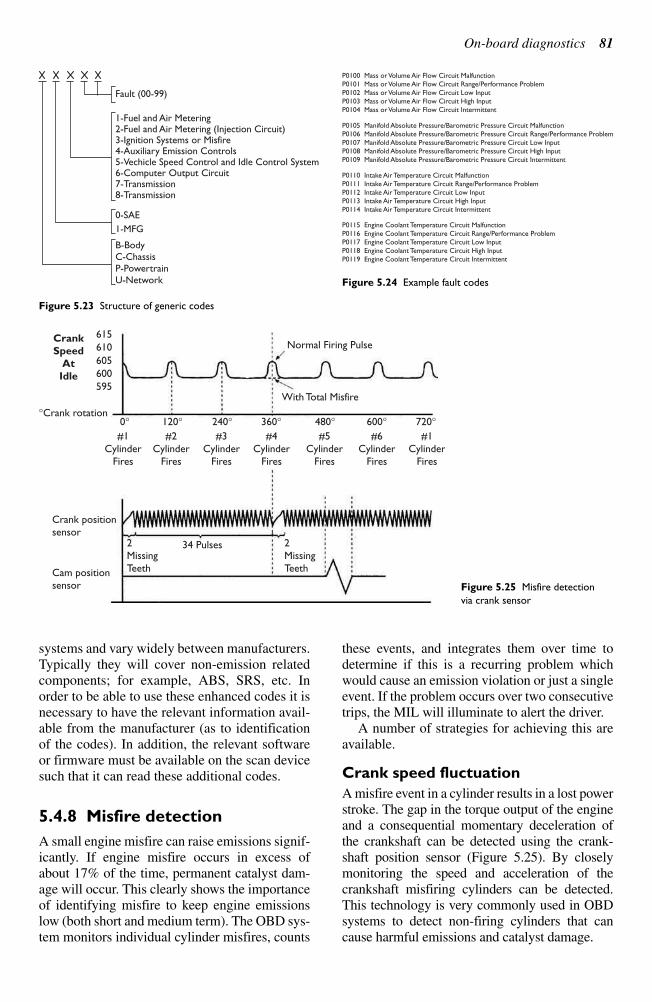
On-board diagnostics 81
Fault (00-99)
1-Fuel and Air Metering
3-Ignition Systems or Misfire4-Auxiliary Emission Controls
6-Computer Output Circuit7-Transmission8-Transmission
0-SAE
B-BodyC-ChassisP-PowertrainU-Network
1-MFG
5-Vechicle Speed Control and Idle Control System
2-Fuel and Air Metering (Injection Circuit)
Figure 5.23 Structure of generic codes
P0100 Mass or Volume Air Flow Circuit MalfunctionP0101 Mass or Volume Air Flow Circuit Range/Performance ProblemP0102 Mass or Volume Air Flow Circuit Low InputP0103 Mass or Volume Air Flow Circuit High InputP0104 Mass or Volume Air Flow Circuit Intermittent
P0105 Manifold Absolute Pressure/Barometric Pressure Circuit MalfunctionP0106 Manifold Absolute Pressure/Barometric Pressure Circuit Range/Performance ProblemP0107 Manifold Absolute Pressure/Barometric Pressure Circuit Low InputP0108 Manifold Absolute Pressure/Barometric Pressure Circuit High InputP0109 Manifold Absolute Pressure/Barometric Pressure Circuit Intermittent
P0110 Intake Air Temperature Circuit MalfunctionP0111 Intake Air Temperature Circuit Range/Performance ProblemP0112 Intake Air Temperature Circuit Low InputP0113 Intake Air Temperature Circuit High InputP0114 Intake Air Temperature Circuit Intermittent
P0115 Engine Coolant Temperature Circuit MalfunctionP0116 Engine Coolant Temperature Circuit Range/Performance ProblemP0117 Engine Coolant Temperature Circuit Low InputP0118 Engine Coolant Temperature Circuit High InputP0119 Engine Coolant Temperature Circuit Intermittent
Figure 5.24 Example fault codes
615Normal Firing Pulse
With Total Misfire
610
605
600
595
#1Cylinder
Fires
Crank positionsensor
Cam positionsensor
2MissingTeeth
2MissingTeeth
34 Pulses
#2Cylinder
Fires
#3Cylinder
Fires
#4Cylinder
Fires
#5Cylinder
Fires
#6Cylinder
Fires
#1Cylinder
Fires
°Crank rotation0° 120° 240° 360° 480° 600° 720°
Crank
Speed
At
Idle
Figure 5.25 Misfire detection
via crank sensor
systems and vary widely between manufacturers.
Typically they will cover non-emission related
components; for example, ABS, SRS, etc. In
order to be able to use these enhanced codes it is
necessary to have the relevant information avail-
able from the manufacturer (as to identification
of the codes). In addition, the relevant software
or firmware must be available on the scan device
such that it can read these additional codes.
5.4.8 Misfire detection
A small engine misfire can raise emissions signif-
icantly. If engine misfire occurs in excess of
about 17% of the time, permanent catalyst dam-
age will occur. This clearly shows the importance
of identifying misfire to keep engine emissions
low (both short and medium term). The OBD sys-
tem monitors individual cylinder misfires, counts
these events, and integrates them over time to
determine if this is a recurring problem which
would cause an emission violation or just a single
event. If the problem occurs over two consecutive
trips, the MIL will illuminate to alert the driver.
A number of strategies for achieving this are
available.
Crank speed fluctuation
A misfire event in a cylinder results in a lost power
stroke. The gap in the torque output of the engine
and a consequential momentary deceleration of
the crankshaft can be detected using the crank-
shaft position sensor (Figure 5.25). By closely
monitoring the speed and acceleration of the
crankshaft misfiring cylinders can be detected.
This technology is very commonly used in OBD
systems to detect non-firing cylinders that can
cause harmful emissions and catalyst damage.
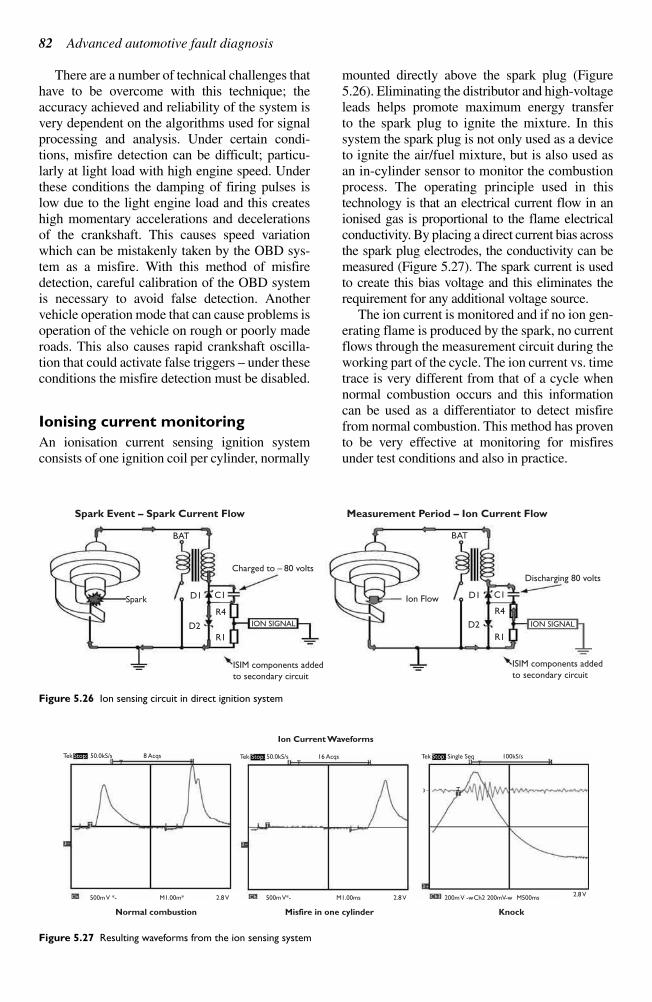
There are a number of technical challenges that
have to be overcome with this technique; the
accuracy achieved and reliability of the system is
very dependent on the algorithms used for signal
processing and analysis. Under certain condi-
tions, misfire detection can be difficult; particu-
larly at light load with high engine speed. Under
these conditions the damping of firing pulses is
low due to the light engine load and this creates
high momentary accelerations and decelerations
of the crankshaft. This causes speed variation
which can be mistakenly taken by the OBD sys-
tem as a misfire. With this method of misfire
detection, careful calibration of the OBD system
is necessary to avoid false detection. Another
vehicle operation mode that can cause problems is
operation of the vehicle on rough or poorly made
roads. This also causes rapid crankshaft oscilla-
tion that could activate false triggers – under these
conditions the misfire detection must be disabled.
Ionising current monitoring
An ionisation current sensing ignition system
consists of one ignition coil per cylinder, normally
mounted directly above the spark plug (Figure
5.26). Eliminating the distributor and high-voltage
leads helps promote maximum energy transfer
to the spark plug to ignite the mixture. In this
system the spark plug is not only used as a device
to ignite the air/fuel mixture, but is also used as
an in-cylinder sensor to monitor the combustion
process. The operating principle used in this
technology is that an electrical current flow in an
ionised gas is proportional to the flame electrical
conductivity. By placing a direct current bias across
the spark plug electrodes, the conductivity can be
measured (Figure 5.27). The spark current is used
to create this bias voltage and this eliminates the
requirement for any additional voltage source.
The ion current is monitored and if no ion gen-
erating flame is produced by the spark, no current
flows through the measurement circuit during the
working part of the cycle. The ion current vs. time
trace is very different from that of a cycle when
normal combustion occurs and this information
can be used as a differentiator to detect misfire
from normal combustion. This method has proven
to be very effective at monitoring for misfires
under test conditions and also in practice.
82 Advanced automotive fault diagnosis
Spark Event – Spark Current Flow Measurement Period – Ion Current Flow
Charged to – 80 volts
BAT
Spark D1
D2
C1
R4
R1
ION SIGNAL
ISIM components added
to secondary circuit
BAT
Ion Flow D1
D2
C1
Discharging 80 volts
ISIM components added
to secondary circuit
ION SIGNAL
R4
R1
Figure 5.26 Ion sensing circuit in direct ignition system
Ion Current Waveforms
Tek Stop: 50.0kS/s Tek Stop: 50.0kS/s Tek Stop: Single Seq 100kS/s16 Acqs8 Acqs
500m V *-Ch
3
T
M1.00m* 500m V*- M1.00ms 2.8 V
Normal combustion Misfire in one cylinder
2.8 V Ch Ch3 200m V -w M500ms2.8 V
Knock
Ch2 200mV-w
3
3
3
T
T T
TT
T
Figure 5.27 Resulting waveforms from the ion sensing system
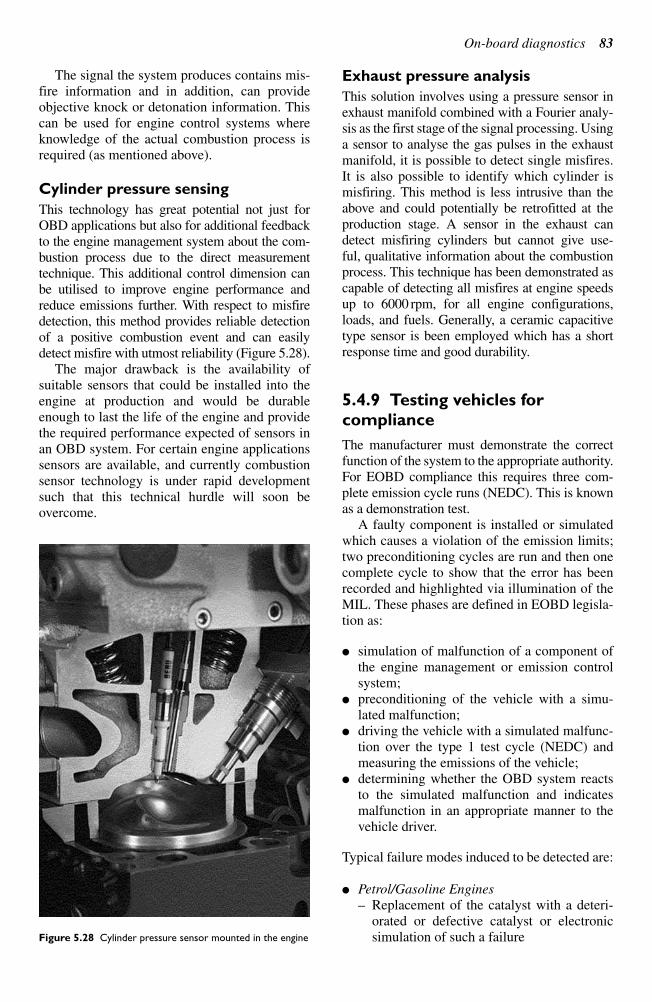
The signal the system produces contains mis-
fire information and in addition, can provide
objective knock or detonation information. This
can be used for engine control systems where
knowledge of the actual combustion process is
required (as mentioned above).
Cylinder pressure sensing
This technology has great potential not just for
OBD applications but also for additional feedback
to the engine management system about the com-
bustion process due to the direct measurement
technique. This additional control dimension can
be utilised to improve engine performance and
reduce emissions further. With respect to misfire
detection, this method provides reliable detection
of a positive combustion event and can easily
detect misfire with utmost reliability (Figure 5.28).
The major drawback is the availability of
suitable sensors that could be installed into the
engine at production and would be durable
enough to last the life of the engine and provide
the required performance expected of sensors in
an OBD system. For certain engine applications
sensors are available, and currently combustion
sensor technology is under rapid development
such that this technical hurdle will soon be
overcome.
Exhaust pressure analysis
This solution involves using a pressure sensor in
exhaust manifold combined with a Fourier analy-
sis as the first stage of the signal processing. Using
a sensor to analyse the gas pulses in the exhaust
manifold, it is possible to detect single misfires.
It is also possible to identify which cylinder is
misfiring. This method is less intrusive than the
above and could potentially be retrofitted at the
production stage. A sensor in the exhaust can
detect misfiring cylinders but cannot give use-
ful, qualitative information about the combustion
process. This technique has been demonstrated as
capable of detecting all misfires at engine speeds
up to 6000 rpm, for all engine configurations,
loads, and fuels. Generally, a ceramic capacitive
type sensor is been employed which has a short
response time and good durability.
5.4.9 Testing vehicles for
compliance
The manufacturer must demonstrate the correct
function of the system to the appropriate authority.
For EOBD compliance this requires three com-
plete emission cycle runs (NEDC). This is known
as a demonstration test.
A faulty component is installed or simulated
which causes a violation of the emission limits;
two preconditioning cycles are run and then one
complete cycle to show that the error has been
recorded and highlighted via illumination of the
MIL. These phases are defined in EOBD legisla-
tion as:
simulation of malfunction of a component of
the engine management or emission control
system;
preconditioning of the vehicle with a simu-
lated malfunction;
driving the vehicle with a simulated malfunc-
tion over the type 1 test cycle (NEDC) and
measuring the emissions of the vehicle;
determining whether the OBD system reacts
to the simulated malfunction and indicates
malfunction in an appropriate manner to the
vehicle driver.
Typical failure modes induced to be detected are:
Petrol/Gasoline Engines
– Replacement of the catalyst with a deteri-
orated or defective catalyst or electronic
simulation of such a failure
On-board diagnostics 83
Figure 5.28 Cylinder pressure sensor mounted in the engine
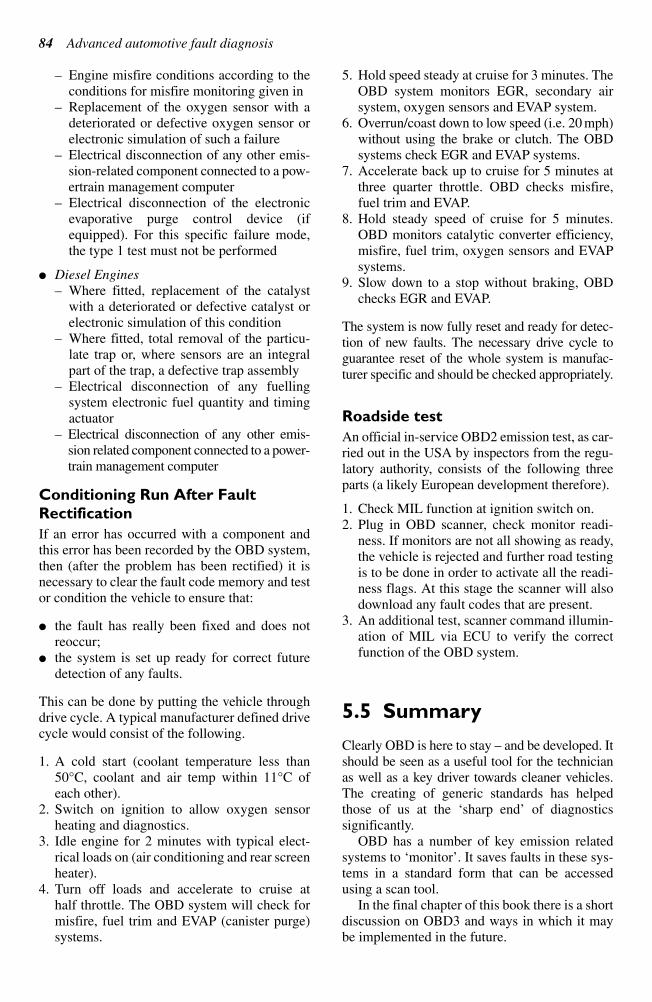
– Engine misfire conditions according to the
conditions for misfire monitoring given in
– Replacement of the oxygen sensor with a
deteriorated or defective oxygen sensor or
electronic simulation of such a failure
– Electrical disconnection of any other emis-
sion-related component connected to a pow-
ertrain management computer
– Electrical disconnection of the electronic
evaporative purge control device (if
equipped). For this specific failure mode,
the type 1 test must not be performed
Diesel Engines
– Where fitted, replacement of the catalyst
with a deteriorated or defective catalyst or
electronic simulation of this condition
– Where fitted, total removal of the particu-
late trap or, where sensors are an integral
part of the trap, a defective trap assembly
– Electrical disconnection of any fuelling
system electronic fuel quantity and timing
actuator
– Electrical disconnection of any other emis-
sion related component connected to a power-
train management computer
Conditioning Run After Fault
Rectification
If an error has occurred with a component and
this error has been recorded by the OBD system,
then (after the problem has been rectified) it is
necessary to clear the fault code memory and test
or condition the vehicle to ensure that:
the fault has really been fixed and does not
reoccur;
the system is set up ready for correct future
detection of any faults.
This can be done by putting the vehicle through
drive cycle. A typical manufacturer defined drive
cycle would consist of the following.
1. A cold start (coolant temperature less than
50°C, coolant and air temp within 11°C of
each other).
2. Switch on ignition to allow oxygen sensor
heating and diagnostics.
3. Idle engine for 2 minutes with typical elect-
rical loads on (air conditioning and rear screen
heater).
4. Turn off loads and accelerate to cruise at
half throttle. The OBD system will check for
misfire, fuel trim and EVAP (canister purge)
systems.
5. Hold speed steady at cruise for 3 minutes. The
OBD system monitors EGR, secondary air
system, oxygen sensors and EVAP system.
6. Overrun/coast down to low speed (i.e. 20 mph)
without using the brake or clutch. The OBD
systems check EGR and EVAP systems.
7. Accelerate back up to cruise for 5 minutes at
three quarter throttle. OBD checks misfire,
fuel trim and EVAP.
8. Hold steady speed of cruise for 5 minutes.
OBD monitors catalytic converter efficiency,
misfire, fuel trim, oxygen sensors and EVAP
systems.
9. Slow down to a stop without braking, OBD
checks EGR and EVAP.
The system is now fully reset and ready for detec-
tion of new faults. The necessary drive cycle to
guarantee reset of the whole system is manufac-
turer specific and should be checked appropriately.
Roadside test
An official in-service OBD2 emission test, as car-
ried out in the USA by inspectors from the regu-
latory authority, consists of the following three
parts (a likely European development therefore).
1. Check MIL function at ignition switch on.
2. Plug in OBD scanner, check monitor readi-
ness. If monitors are not all showing as ready,
the vehicle is rejected and further road testing
is to be done in order to activate all the readi-
ness flags. At this stage the scanner will also
download any fault codes that are present.
3. An additional test, scanner command illumin-
ation of MIL via ECU to verify the correct
function of the OBD system.
5.5 Summary
Clearly OBD is here to stay – and be developed. It
should be seen as a useful tool for the technician
as well as a key driver towards cleaner vehicles.
The creating of generic standards has helped
those of us at the ‘sharp end’ of diagnostics
significantly.
OBD has a number of key emission related
systems to ‘monitor’. It saves faults in these sys-
tems in a standard form that can be accessed
using a scan tool.
In the final chapter of this book there is a short
discussion on OBD3 and ways in which it may
be implemented in the future.
84 Advanced automotive fault diagnosis

On-board diagnostics 85
Knowledge check questions
To use these questions, you should first try to answer them without help but if necessary, refer back to
the content of the chapter. Use notes, lists and sketches to answer them. It is not necessary to write
pages and pages of text!
1. State the main reasons why OBD was developed.
2. Explain what is meant by OBD monitors and list the most common.
3. Describe how the P-codes are used to indicate faults.
4. Explain with the aid of a sketch, how the ‘before and after cat’ lambda sensor signals are used by the
OBD system to monitor catalyst operation.
5. Explain what is meant by ‘healing of the fault memory’.
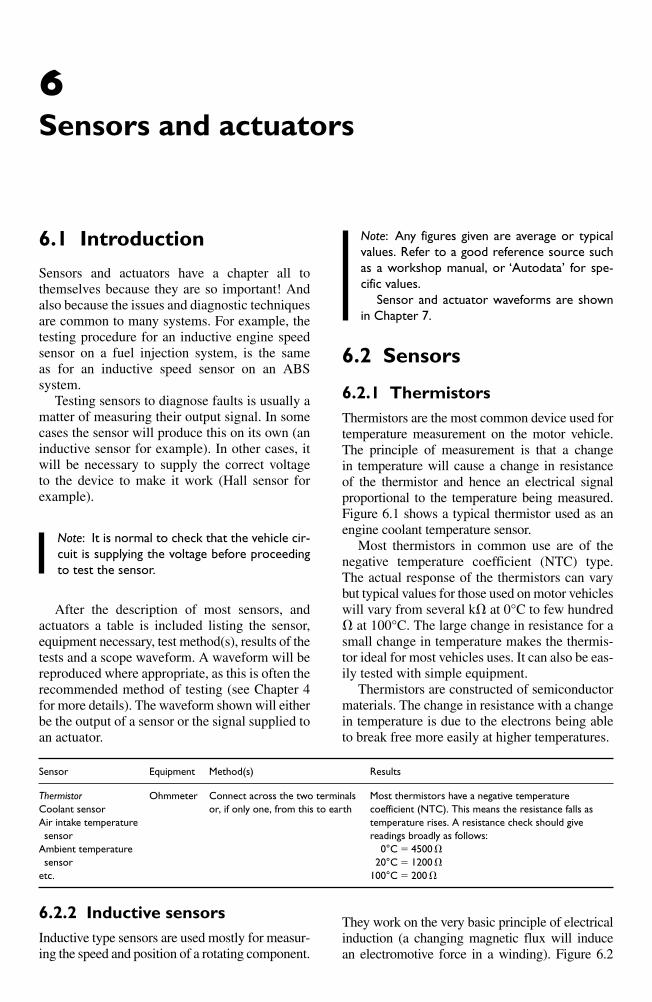
6.2.2 Inductive sensors
Inductive type sensors are used mostly for measur-
ing the speed and position of a rotating component.
They work on the very basic principle of electrical
induction (a changing magnetic flux will induce
an electromotive force in a winding). Figure 6.2
6.1 Introduction
Sensors and actuators have a chapter all to
themselves because they are so important! And
also because the issues and diagnostic techniques
are common to many systems. For example, the
testing procedure for an inductive engine speed
sensor on a fuel injection system, is the same
as for an inductive speed sensor on an ABS
system.
Testing sensors to diagnose faults is usually a
matter of measuring their output signal. In some
cases the sensor will produce this on its own (an
inductive sensor for example). In other cases, it
will be necessary to supply the correct voltage
to the device to make it work (Hall sensor for
example).
Note: It is normal to check that the vehicle cir-
cuit is supplying the voltage before proceeding
to test the sensor.
After the description of most sensors, and
actuators a table is included listing the sensor,
equipment necessary, test method(s), results of the
tests and a scope waveform. A waveform will be
reproduced where appropriate, as this is often the
recommended method of testing (see Chapter 4
for more details). The waveform shown will either
be the output of a sensor or the signal supplied to
an actuator.
Note: Any figures given are average or typical
values. Refer to a good reference source such
as a workshop manual, or ‘Autodata’ for spe-
cific values.
Sensor and actuator waveforms are shown
in Chapter 7.
6.2 Sensors
6.2.1 Thermistors
Thermistors are the most common device used for
temperature measurement on the motor vehicle.
The principle of measurement is that a change
in temperature will cause a change in resistance
of the thermistor and hence an electrical signal
proportional to the temperature being measured.
Figure 6.1 shows a typical thermistor used as an
engine coolant temperature sensor.
Most thermistors in common use are of the
negative temperature coefficient (NTC) type.
The actual response of the thermistors can vary
but typical values for those used on motor vehicles
will vary from several k at 0°C to few hundred
at 100°C. The large change in resistance for a
small change in temperature makes the thermis-
tor ideal for most vehicles uses. It can also be eas-
ily tested with simple equipment.
Thermistors are constructed of semiconductor
materials. The change in resistance with a change
in temperature is due to the electrons being able
to break free more easily at higher temperatures.
6
Sensors and actuators
Sensor Equipment Method(s) Results
Thermistor Ohmmeter Connect across the two terminals Most thermistors have a negative temperature
Coolant sensor or, if only one, from this to earth coefficient (NTC). This means the resistance falls as
Air intake temperature temperature rises. A resistance check should give
sensor readings broadly as follows:
Ambient temperature 0°C 4500
sensor 20°C 1200
etc. 100°C 200
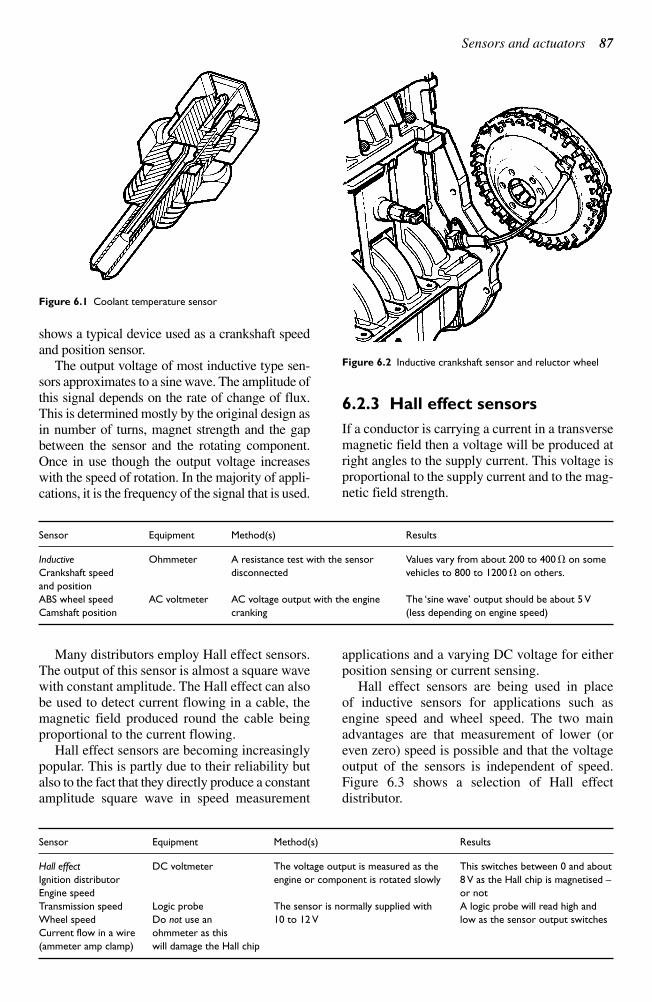
Sensors and actuators 87
Many distributors employ Hall effect sensors.
The output of this sensor is almost a square wave
with constant amplitude. The Hall effect can also
be used to detect current flowing in a cable, the
magnetic field produced round the cable being
proportional to the current flowing.
Hall effect sensors are becoming increasingly
popular. This is partly due to their reliability but
also to the fact that they directly produce a constant
amplitude square wave in speed measurement
applications and a varying DC voltage for either
position sensing or current sensing.
Hall effect sensors are being used in place
of inductive sensors for applications such as
engine speed and wheel speed. The two main
advantages are that measurement of lower (or
even zero) speed is possible and that the voltage
output of the sensors is independent of speed.
Figure 6.3 shows a selection of Hall effect
distributor.
shows a typical device used as a crankshaft speed
and position sensor.
The output voltage of most inductive type sen-
sors approximates to a sine wave. The amplitude of
this signal depends on the rate of change of flux.
This is determined mostly by the original design as
in number of turns, magnet strength and the gap
between the sensor and the rotating component.
Once in use though the output voltage increases
with the speed of rotation. In the majority of appli-
cations, it is the frequency of the signal that is used.
6.2.3 Hall effect sensors
If a conductor is carrying a current in a transverse
magnetic field then a voltage will be produced at
right angles to the supply current. This voltage is
proportional to the supply current and to the mag-
netic field strength.
Figure 6.2 Inductive crankshaft sensor and reluctor wheel
Sensor Equipment Method(s) Results
Inductive Ohmmeter A resistance test with the sensor Values vary from about 200 to 400 on some
Crankshaft speed disconnected vehicles to 800 to 1200 on others.
and position
ABS wheel speed AC voltmeter AC voltage output with the engine The ‘sine wave’ output should be about 5 V
Camshaft position cranking (less depending on engine speed)
Figure 6.1 Coolant temperature sensor
Sensor Equipment Method(s) Results
Hall effect DC voltmeter The voltage output is measured as the This switches between 0 and about
Ignition distributor engine or component is rotated slowly 8 V as the Hall chip is magnetised –
Engine speed or not
Transmission speed Logic probe The sensor is normally supplied with A logic probe will read high and
Wheel speed Do not use an 10 to 12 V low as the sensor output switches
Current flow in a wire ohmmeter as this
(ammeter amp clamp) will damage the Hall chip
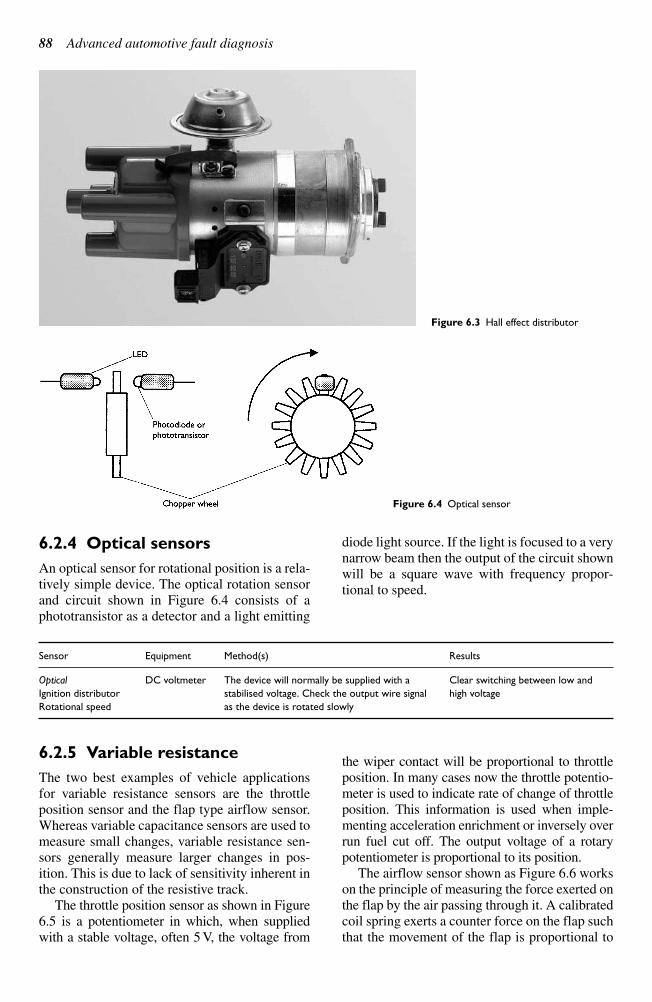
88 Advanced automotive fault diagnosis
6.2.4 Optical sensors
An optical sensor for rotational position is a rela-
tively simple device. The optical rotation sensor
and circuit shown in Figure 6.4 consists of a
phototransistor as a detector and a light emitting
diode light source. If the light is focused to a very
narrow beam then the output of the circuit shown
will be a square wave with frequency propor-
tional to speed.
6.2.5 Variable resistance
The two best examples of vehicle applications
for variable resistance sensors are the throttle
position sensor and the flap type airflow sensor.
Whereas variable capacitance sensors are used to
measure small changes, variable resistance sen-
sors generally measure larger changes in pos-
ition. This is due to lack of sensitivity inherent in
the construction of the resistive track.
The throttle position sensor as shown in Figure
6.5 is a potentiometer in which, when supplied
with a stable voltage, often 5 V, the voltage from
the wiper contact will be proportional to throttle
position. In many cases now the throttle potentio-
meter is used to indicate rate of change of throttle
position. This information is used when imple-
menting acceleration enrichment or inversely over
run fuel cut off. The output voltage of a rotary
potentiometer is proportional to its position.
The airflow sensor shown as Figure 6.6 works
on the principle of measuring the force exerted on
the flap by the air passing through it. A calibrated
coil spring exerts a counter force on the flap such
that the movement of the flap is proportional to
Figure 6.3 Hall effect distributor
Sensor Equipment Method(s) Results
Optical DC voltmeter The device will normally be supplied with a Clear switching between low and
Ignition distributor stabilised voltage. Check the output wire signal high voltage
Rotational speed as the device is rotated slowly
Figure 6.4 Optical sensor
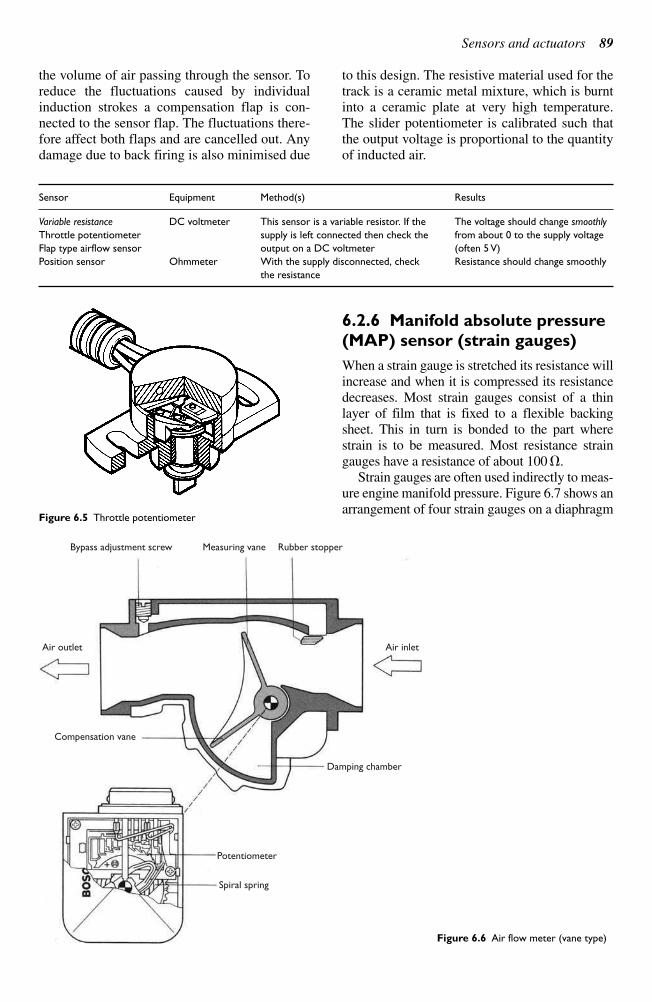
Sensors and actuators 89
the volume of air passing through the sensor. To
reduce the fluctuations caused by individual
induction strokes a compensation flap is con-
nected to the sensor flap. The fluctuations there-
fore affect both flaps and are cancelled out. Any
damage due to back firing is also minimised due
to this design. The resistive material used for the
track is a ceramic metal mixture, which is burnt
into a ceramic plate at very high temperature.
The slider potentiometer is calibrated such that
the output voltage is proportional to the quantity
of inducted air.
6.2.6 Manifold absolute pressure
(MAP) sensor (strain gauges)
When a strain gauge is stretched its resistance will
increase and when it is compressed its resistance
decreases. Most strain gauges consist of a thin
layer of film that is fixed to a flexible backing
sheet. This in turn is bonded to the part where
strain is to be measured. Most resistance strain
gauges have a resistance of about 100 .
Strain gauges are often used indirectly to meas-
ure engine manifold pressure. Figure 6.7 shows an
arrangement of four strain gauges on a diaphragm
Sensor Equipment Method(s) Results
Variable resistance DC voltmeter This sensor is a variable resistor. If the The voltage should change smoothly
Throttle potentiometer supply is left connected then check the from about 0 to the supply voltage
Flap type airflow sensor output on a DC voltmeter (often 5 V)
Position sensor Ohmmeter With the supply disconnected, check Resistance should change smoothly
the resistance
Figure 6.5 Throttle potentiometer
Bypass adjustment screw Measuring vane
Air inletAir outlet
Compensation vane
Damping chamber
Potentiometer
Spiral spring
Rubber stopper
Figure 6.6 Air flow meter (vane type)
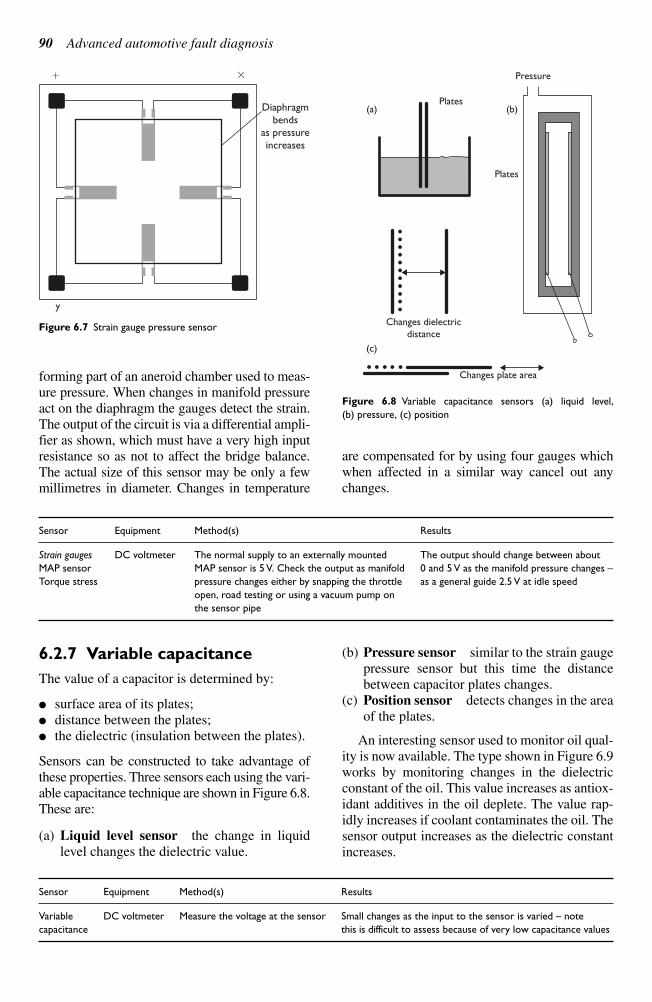
90 Advanced automotive fault diagnosis
Sensor Equipment Method(s) Results
Strain gauges DC voltmeter The normal supply to an externally mounted The output should change between about
MAP sensor MAP sensor is 5 V. Check the output as manifold 0 and 5 V as the manifold pressure changes –
Torque stress pressure changes either by snapping the throttle as a general guide 2.5 V at idle speed
open, road testing or using a vacuum pump on
the sensor pipe
forming part of an aneroid chamber used to meas-
ure pressure. When changes in manifold pressure
act on the diaphragm the gauges detect the strain.
The output of the circuit is via a differential ampli-
fier as shown, which must have a very high input
resistance so as not to affect the bridge balance.
The actual size of this sensor may be only a few
millimetres in diameter. Changes in temperature
are compensated for by using four gauges which
when affected in a similar way cancel out any
changes.
6.2.7 Variable capacitance
The value of a capacitor is determined by:
surface area of its plates;
distance between the plates;
the dielectric (insulation between the plates).
Sensors can be constructed to take advantage of
these properties. Three sensors each using the vari-
able capacitance technique are shown in Figure 6.8.
These are:
(a) Liquid level sensor the change in liquid
level changes the dielectric value.
(b) Pressure sensor similar to the strain gauge
pressure sensor but this time the distance
between capacitor plates changes.
(c) Position sensor detects changes in the area
of the plates.
An interesting sensor used to monitor oil qual-
ity is now available. The type shown in Figure 6.9
works by monitoring changes in the dielectric
constant of the oil. This value increases as antiox-
idant additives in the oil deplete. The value rap-
idly increases if coolant contaminates the oil. The
sensor output increases as the dielectric constant
increases.
Pressure
Plates
Plates
Changes dielectric
distance
Changes plate area
(c)
(a) (b)
Figure 6.8 Variable capacitance sensors (a) liquid level,
(b) pressure, (c) position
Diaphragmbends
as pressureincreases
y
Figure 6.7 Strain gauge pressure sensor
Sensor Equipment Method(s) Results
Variable DC voltmeter Measure the voltage at the sensor Small changes as the input to the sensor is varied – note
capacitance this is difficult to assess because of very low capacitance values
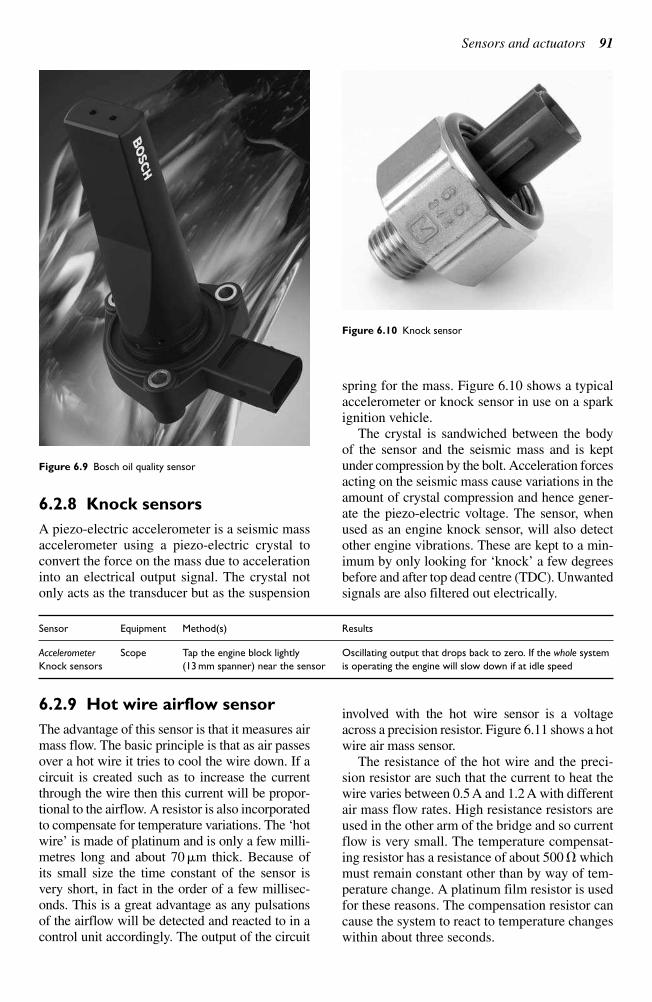
Sensors and actuators 91
6.2.8 Knock sensors
A piezo-electric accelerometer is a seismic mass
accelerometer using a piezo-electric crystal to
convert the force on the mass due to acceleration
into an electrical output signal. The crystal not
only acts as the transducer but as the suspension
spring for the mass. Figure 6.10 shows a typical
accelerometer or knock sensor in use on a spark
ignition vehicle.
The crystal is sandwiched between the body
of the sensor and the seismic mass and is kept
under compression by the bolt. Acceleration forces
acting on the seismic mass cause variations in the
amount of crystal compression and hence gener-
ate the piezo-electric voltage. The sensor, when
used as an engine knock sensor, will also detect
other engine vibrations. These are kept to a min-
imum by only looking for ‘knock’ a few degreesbefore and after top dead centre (TDC). Unwantedsignals are also filtered out electrically.
6.2.9 Hot wire airflow sensor
The advantage of this sensor is that it measures airmass flow. The basic principle is that as air passesover a hot wire it tries to cool the wire down. If acircuit is created such as to increase the currentthrough the wire then this current will be propor-tional to the airflow. A resistor is also incorporatedto compensate for temperature variations. The ‘hotwire’ is made of platinum and is only a few milli-metres long and about 70 m thick. Because of its small size the time constant of the sensor isvery short, in fact in the order of a few millisec-onds. This is a great advantage as any pulsationsof the airflow will be detected and reacted to in acontrol unit accordingly. The output of the circuit
involved with the hot wire sensor is a voltageacross a precision resistor. Figure 6.11 shows a hotwire air mass sensor.
The resistance of the hot wire and the preci-sion resistor are such that the current to heat thewire varies between 0.5 A and 1.2 A with differentair mass flow rates. High resistance resistors areused in the other arm of the bridge and so currentflow is very small. The temperature compensat-ing resistor has a resistance of about 500 whichmust remain constant other than by way of tem-perature change. A platinum film resistor is usedfor these reasons. The compensation resistor cancause the system to react to temperature changeswithin about three seconds.
Figure 6.9 Bosch oil quality sensor
Figure 6.10 Knock sensor
Sensor Equipment Method(s) Results
Accelerometer Scope Tap the engine block lightly Oscillating output that drops back to zero. If the whole system
Knock sensors (13 mm spanner) near the sensor is operating the engine will slow down if at idle speed
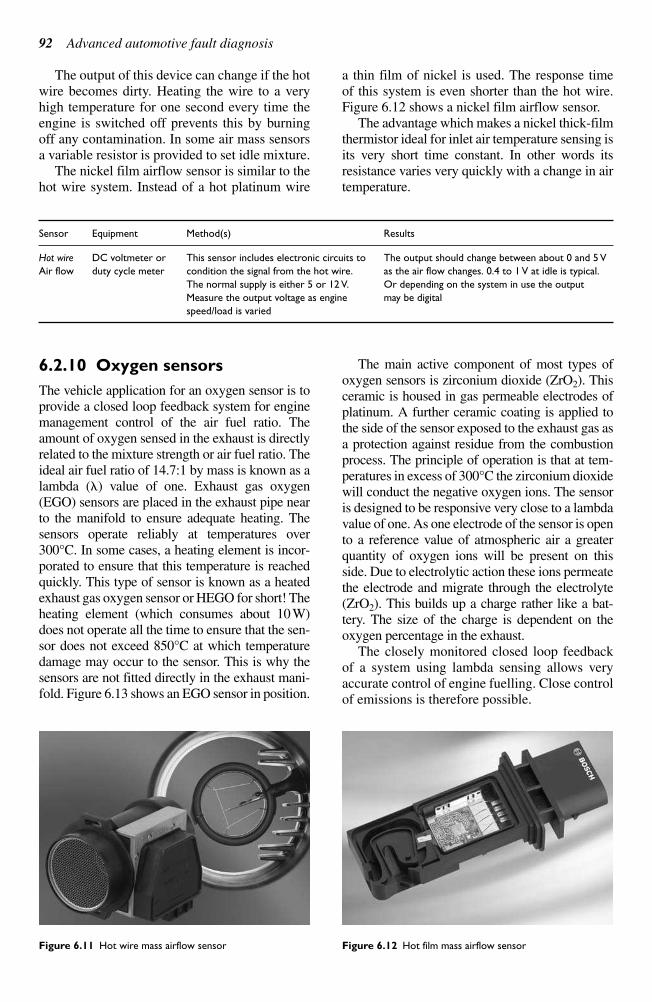
92 Advanced automotive fault diagnosis
Sensor Equipment Method(s) Results
Hot wire DC voltmeter or This sensor includes electronic circuits to The output should change between about 0 and 5 V
Air flow duty cycle meter condition the signal from the hot wire. as the air flow changes. 0.4 to 1 V at idle is typical.
The normal supply is either 5 or 12 V. Or depending on the system in use the output
Measure the output voltage as engine may be digital
speed/load is varied
The output of this device can change if the hot
wire becomes dirty. Heating the wire to a very
high temperature for one second every time the
engine is switched off prevents this by burning
off any contamination. In some air mass sensors
a variable resistor is provided to set idle mixture.
The nickel film airflow sensor is similar to the
hot wire system. Instead of a hot platinum wire
a thin film of nickel is used. The response time
of this system is even shorter than the hot wire.
Figure 6.12 shows a nickel film airflow sensor.
The advantage which makes a nickel thick-film
thermistor ideal for inlet air temperature sensing is
its very short time constant. In other words its
resistance varies very quickly with a change in air
temperature.
6.2.10 Oxygen sensors
The vehicle application for an oxygen sensor is to
provide a closed loop feedback system for engine
management control of the air fuel ratio. The
amount of oxygen sensed in the exhaust is directly
related to the mixture strength or air fuel ratio. The
ideal air fuel ratio of 14.7:1 by mass is known as a
lambda () value of one. Exhaust gas oxygen
(EGO) sensors are placed in the exhaust pipe near
to the manifold to ensure adequate heating. The
sensors operate reliably at temperatures over
300°C. In some cases, a heating element is incor-
porated to ensure that this temperature is reached
quickly. This type of sensor is known as a heated
exhaust gas oxygen sensor or HEGO for short! The
heating element (which consumes about 10 W)
does not operate all the time to ensure that the sen-
sor does not exceed 850°C at which temperature
damage may occur to the sensor. This is why the
sensors are not fitted directly in the exhaust mani-
fold. Figure 6.13 shows an EGO sensor in position.
The main active component of most types of
oxygen sensors is zirconium dioxide (ZrO2). This
ceramic is housed in gas permeable electrodes of
platinum. A further ceramic coating is applied to
the side of the sensor exposed to the exhaust gas as
a protection against residue from the combustion
process. The principle of operation is that at tem-
peratures in excess of 300°C the zirconium dioxide
will conduct the negative oxygen ions. The sensor
is designed to be responsive very close to a lambda
value of one. As one electrode of the sensor is open
to a reference value of atmospheric air a greater
quantity of oxygen ions will be present on this
side. Due to electrolytic action these ions permeate
the electrode and migrate through the electrolyte
(ZrO2). This builds up a charge rather like a bat-
tery. The size of the charge is dependent on the
oxygen percentage in the exhaust.
The closely monitored closed loop feedback
of a system using lambda sensing allows very
accurate control of engine fuelling. Close control
of emissions is therefore possible.
Figure 6.12 Hot film mass airflow sensorFigure 6.11 Hot wire mass airflow sensor
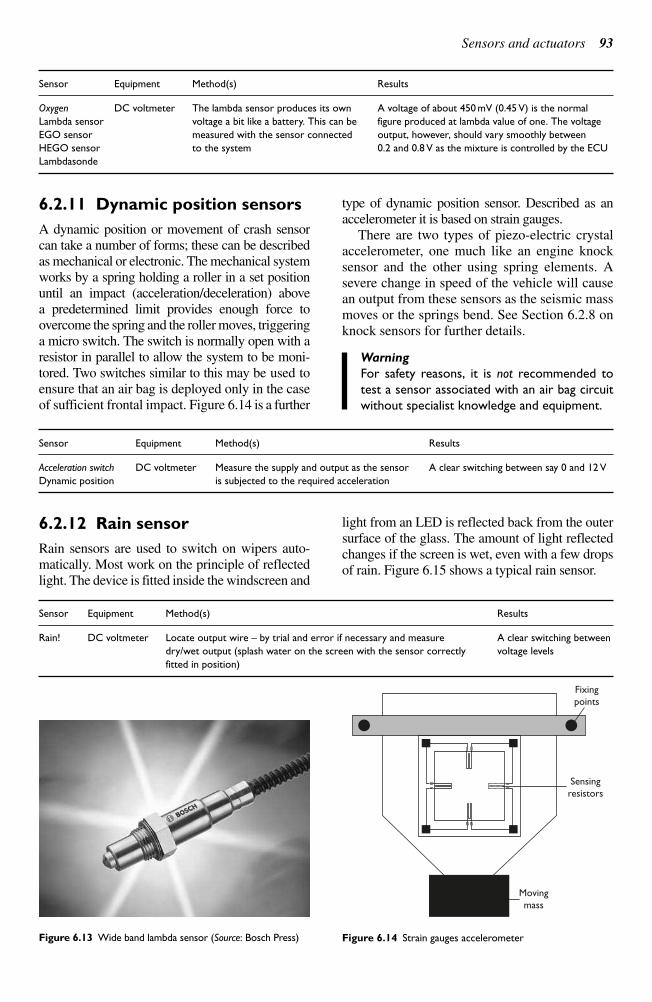
Sensors and actuators 93
6.2.11 Dynamic position sensors
A dynamic position or movement of crash sensor
can take a number of forms; these can be described
as mechanical or electronic. The mechanical system
works by a spring holding a roller in a set position
until an impact (acceleration/deceleration) above
a predetermined limit provides enough force to
overcome the spring and the roller moves, triggering
a micro switch. The switch is normally open with a
resistor in parallel to allow the system to be moni-
tored. Two switches similar to this may be used to
ensure that an air bag is deployed only in the case
of sufficient frontal impact. Figure 6.14 is a further
type of dynamic position sensor. Described as an
accelerometer it is based on strain gauges.
There are two types of piezo-electric crystal
accelerometer, one much like an engine knock
sensor and the other using spring elements. A
severe change in speed of the vehicle will cause
an output from these sensors as the seismic mass
moves or the springs bend. See Section 6.2.8 on
knock sensors for further details.
Warning
For safety reasons, it is not recommended to
test a sensor associated with an air bag circuit
without specialist knowledge and equipment.
6.2.12 Rain sensor
Rain sensors are used to switch on wipers auto-
matically. Most work on the principle of reflected
light. The device is fitted inside the windscreen and
light from an LED is reflected back from the outer
surface of the glass. The amount of light reflected
changes if the screen is wet, even with a few drops
of rain. Figure 6.15 shows a typical rain sensor.
Sensor Equipment Method(s) Results
Oxygen DC voltmeter The lambda sensor produces its own A voltage of about 450 mV (0.45 V) is the normal
Lambda sensor voltage a bit like a battery. This can be figure produced at lambda value of one. The voltage
EGO sensor measured with the sensor connected output, however, should vary smoothly between
HEGO sensor to the system 0.2 and 0.8 V as the mixture is controlled by the ECU
Lambdasonde
Figure 6.13 Wide band lambda sensor (Source: Bosch Press)
Fixing
points
Sensing
resistors
Moving
mass
Figure 6.14 Strain gauges accelerometer
Sensor Equipment Method(s) Results
Acceleration switch DC voltmeter Measure the supply and output as the sensor A clear switching between say 0 and 12 V
Dynamic position is subjected to the required acceleration
Sensor Equipment Method(s) Results
Rain! DC voltmeter Locate output wire – by trial and error if necessary and measure A clear switching between
dry/wet output (splash water on the screen with the sensor correctly voltage levels
fitted in position)
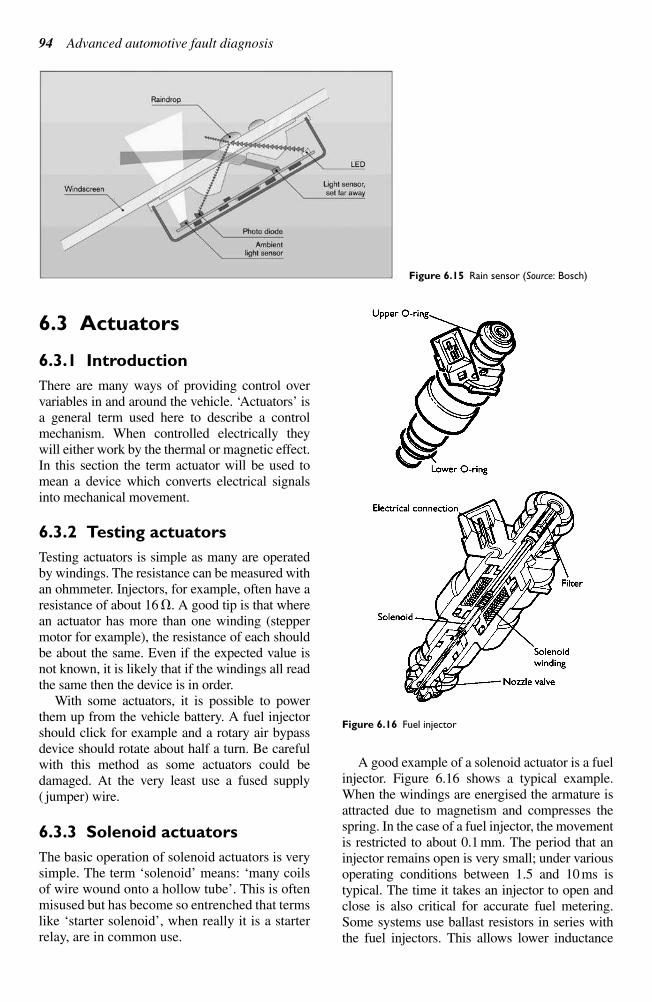
94 Advanced automotive fault diagnosis
6.3 Actuators
6.3.1 Introduction
There are many ways of providing control over
variables in and around the vehicle. ‘Actuators’ isa general term used here to describe a controlmechanism. When controlled electrically theywill either work by the thermal or magnetic effect.In this section the term actuator will be used tomean a device which converts electrical signalsinto mechanical movement.
6.3.2 Testing actuators
Testing actuators is simple as many are operatedby windings. The resistance can be measured withan ohmmeter. Injectors, for example, often have aresistance of about 16 . A good tip is that wherean actuator has more than one winding (steppermotor for example), the resistance of each shouldbe about the same. Even if the expected value isnot known, it is likely that if the windings all readthe same then the device is in order.
With some actuators, it is possible to powerthem up from the vehicle battery. A fuel injectorshould click for example and a rotary air bypassdevice should rotate about half a turn. Be carefulwith this method as some actuators could be damaged. At the very least use a fused supply( jumper) wire.
6.3.3 Solenoid actuators
The basic operation of solenoid actuators is verysimple. The term ‘solenoid’ means: ‘many coilsof wire wound onto a hollow tube’. This is oftenmisused but has become so entrenched that termslike ‘starter solenoid’, when really it is a starterrelay, are in common use.
A good example of a solenoid actuator is a fuelinjector. Figure 6.16 shows a typical example.When the windings are energised the armature isattracted due to magnetism and compresses thespring. In the case of a fuel injector, the movementis restricted to about 0.1 mm. The period that aninjector remains open is very small; under variousoperating conditions between 1.5 and 10 ms istypical. The time it takes an injector to open andclose is also critical for accurate fuel metering.Some systems use ballast resistors in series withthe fuel injectors. This allows lower inductance
Figure 6.15 Rain sensor (Source: Bosch)
Figure 6.16 Fuel injector
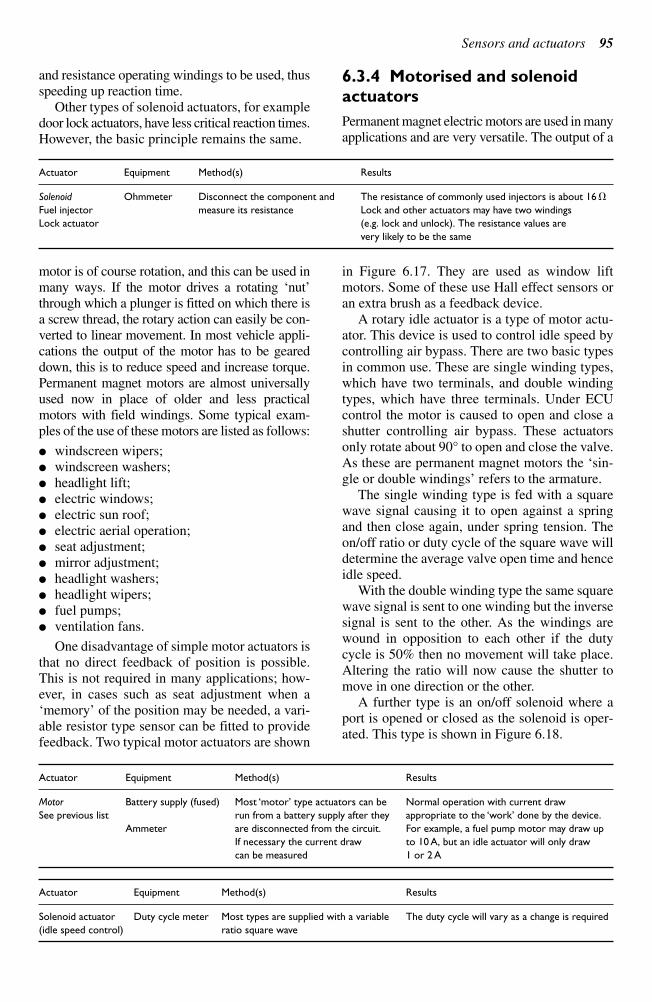
Sensors and actuators 95
motor is of course rotation, and this can be used in
many ways. If the motor drives a rotating ‘nut’through which a plunger is fitted on which there isa screw thread, the rotary action can easily be con-verted to linear movement. In most vehicle appli-cations the output of the motor has to be geareddown, this is to reduce speed and increase torque.Permanent magnet motors are almost universallyused now in place of older and less practicalmotors with field windings. Some typical exam-ples of the use of these motors are listed as follows:
windscreen wipers; windscreen washers; headlight lift; electric windows; electric sun roof; electric aerial operation; seat adjustment; mirror adjustment; headlight washers; headlight wipers; fuel pumps; ventilation fans.
One disadvantage of simple motor actuators isthat no direct feedback of position is possible.This is not required in many applications; how-ever, in cases such as seat adjustment when a‘memory’ of the position may be needed, a vari-able resistor type sensor can be fitted to providefeedback. Two typical motor actuators are shown
in Figure 6.17. They are used as window liftmotors. Some of these use Hall effect sensors oran extra brush as a feedback device.
A rotary idle actuator is a type of motor actu-ator. This device is used to control idle speed bycontrolling air bypass. There are two basic typesin common use. These are single winding types,which have two terminals, and double windingtypes, which have three terminals. Under ECUcontrol the motor is caused to open and close ashutter controlling air bypass. These actuatorsonly rotate about 90° to open and close the valve.As these are permanent magnet motors the ‘sin-gle or double windings’ refers to the armature.
The single winding type is fed with a squarewave signal causing it to open against a springand then close again, under spring tension. Theon/off ratio or duty cycle of the square wave willdetermine the average valve open time and henceidle speed.
With the double winding type the same squarewave signal is sent to one winding but the inversesignal is sent to the other. As the windings arewound in opposition to each other if the dutycycle is 50% then no movement will take place.Altering the ratio will now cause the shutter tomove in one direction or the other.
A further type is an on/off solenoid where aport is opened or closed as the solenoid is oper-ated. This type is shown in Figure 6.18.
and resistance operating windings to be used, thusspeeding up reaction time.
Other types of solenoid actuators, for exampledoor lock actuators, have less critical reaction times.However, the basic principle remains the same.
6.3.4 Motorised and solenoid
actuators
Permanent magnet electric motors are used in manyapplications and are very versatile. The output of a
Actuator Equipment Method(s) Results
Solenoid Ohmmeter Disconnect the component and The resistance of commonly used injectors is about 16
Fuel injector measure its resistance Lock and other actuators may have two windings
Lock actuator (e.g. lock and unlock). The resistance values are
very likely to be the same
Actuator Equipment Method(s) Results
Motor Battery supply (fused) Most ‘motor’ type actuators can be Normal operation with current draw
See previous list run from a battery supply after they appropriate to the ‘work’ done by the device.
Ammeter are disconnected from the circuit. For example, a fuel pump motor may draw up
If necessary the current draw to 10 A, but an idle actuator will only draw
can be measured 1 or 2 A
Actuator Equipment Method(s) Results
Solenoid actuator Duty cycle meter Most types are supplied with a variable The duty cycle will vary as a change is required
(idle speed control) ratio square wave
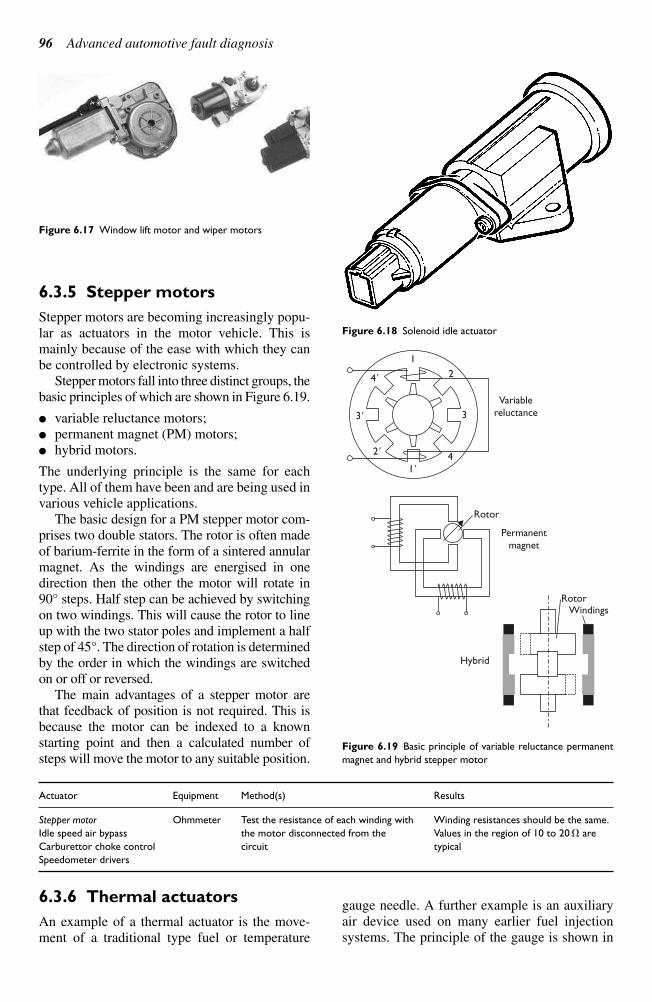
96 Advanced automotive fault diagnosis
6.3.5 Stepper motors
Stepper motors are becoming increasingly popu-
lar as actuators in the motor vehicle. This is
mainly because of the ease with which they can
be controlled by electronic systems.
Stepper motors fall into three distinct groups, the
basic principles of which are shown in Figure 6.19.
variable reluctance motors;
permanent magnet (PM) motors;
hybrid motors.
The underlying principle is the same for each
type. All of them have been and are being used in
various vehicle applications.
The basic design for a PM stepper motor com-
prises two double stators. The rotor is often made
of barium-ferrite in the form of a sintered annular
magnet. As the windings are energised in one
direction then the other the motor will rotate in
90° steps. Half step can be achieved by switching
on two windings. This will cause the rotor to line
up with the two stator poles and implement a half
step of 45°. The direction of rotation is determined
by the order in which the windings are switched
on or off or reversed.
The main advantages of a stepper motor are
that feedback of position is not required. This is
because the motor can be indexed to a known
starting point and then a calculated number of
steps will move the motor to any suitable position.
6.3.6 Thermal actuators
An example of a thermal actuator is the move-
ment of a traditional type fuel or temperature
gauge needle. A further example is an auxiliary
air device used on many earlier fuel injection
systems. The principle of the gauge is shown in
Figure 6.18 Solenoid idle actuator
3
Variablereluctance
Rotor
Permanentmagnet
RotorWindings
Hybrid
2
1
42
3
4
1
Figure 6.19 Basic principle of variable reluctance permanent
magnet and hybrid stepper motor
Actuator Equipment Method(s) Results
Stepper motor Ohmmeter Test the resistance of each winding with Winding resistances should be the same.
Idle speed air bypass the motor disconnected from the Values in the region of 10 to 20 are
Carburettor choke control circuit typical
Speedometer drivers
Figure 6.17 Window lift motor and wiper motors
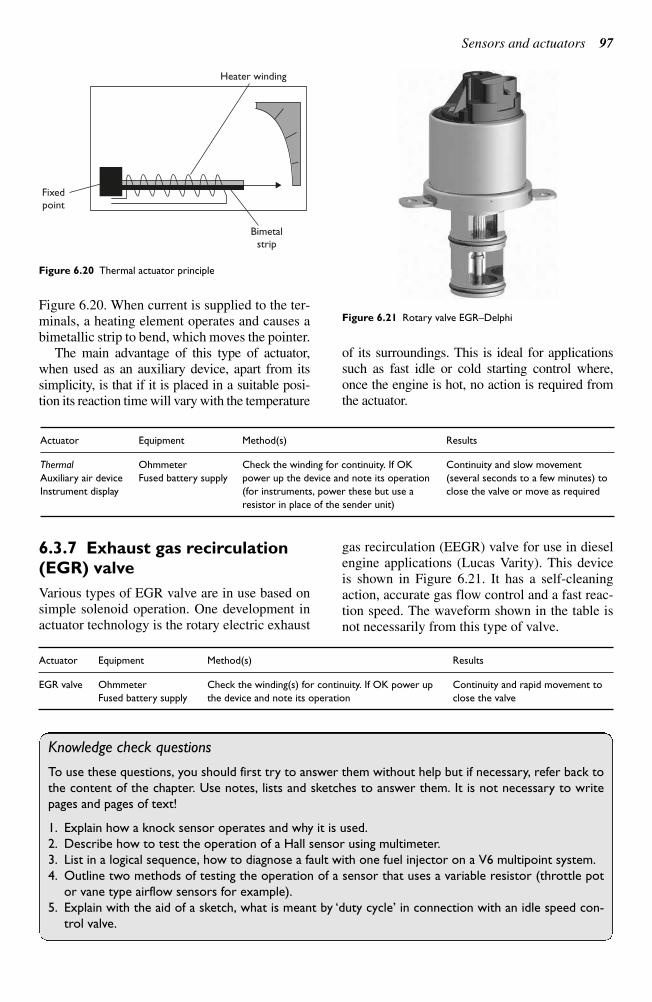
Sensors and actuators 97
Figure 6.20. When current is supplied to the ter-
minals, a heating element operates and causes a
bimetallic strip to bend, which moves the pointer.
The main advantage of this type of actuator,
when used as an auxiliary device, apart from its
simplicity, is that if it is placed in a suitable posi-
tion its reaction time will vary with the temperature
of its surroundings. This is ideal for applications
such as fast idle or cold starting control where,
once the engine is hot, no action is required from
the actuator.
6.3.7 Exhaust gas recirculation
(EGR) valve
Various types of EGR valve are in use based on
simple solenoid operation. One development in
actuator technology is the rotary electric exhaust
gas recirculation (EEGR) valve for use in diesel
engine applications (Lucas Varity). This device
is shown in Figure 6.21. It has a self-cleaning
action, accurate gas flow control and a fast reac-
tion speed. The waveform shown in the table is
not necessarily from this type of valve.
Heater winding
Bimetalstrip
Fixedpoint
Figure 6.20 Thermal actuator principle
Figure 6.21 Rotary valve EGR–Delphi
Actuator Equipment Method(s) Results
EGR valve Ohmmeter Check the winding(s) for continuity. If OK power up Continuity and rapid movement to
Fused battery supply the device and note its operation close the valve
Knowledge check questions
To use these questions, you should first try to answer them without help but if necessary, refer back to
the content of the chapter. Use notes, lists and sketches to answer them. It is not necessary to write
pages and pages of text!
1. Explain how a knock sensor operates and why it is used.
2. Describe how to test the operation of a Hall sensor using multimeter.
3. List in a logical sequence, how to diagnose a fault with one fuel injector on a V6 multipoint system.
4. Outline two methods of testing the operation of a sensor that uses a variable resistor (throttle pot
or vane type airflow sensors for example).
5. Explain with the aid of a sketch, what is meant by ‘duty cycle’ in connection with an idle speed con-
trol valve.
Actuator Equipment Method(s) Results
Thermal Ohmmeter Check the winding for continuity. If OK Continuity and slow movement
Auxiliary air device Fused battery supply power up the device and note its operation (several seconds to a few minutes) to
Instrument display (for instruments, power these but use a close the valve or move as required
resistor in place of the sender unit)
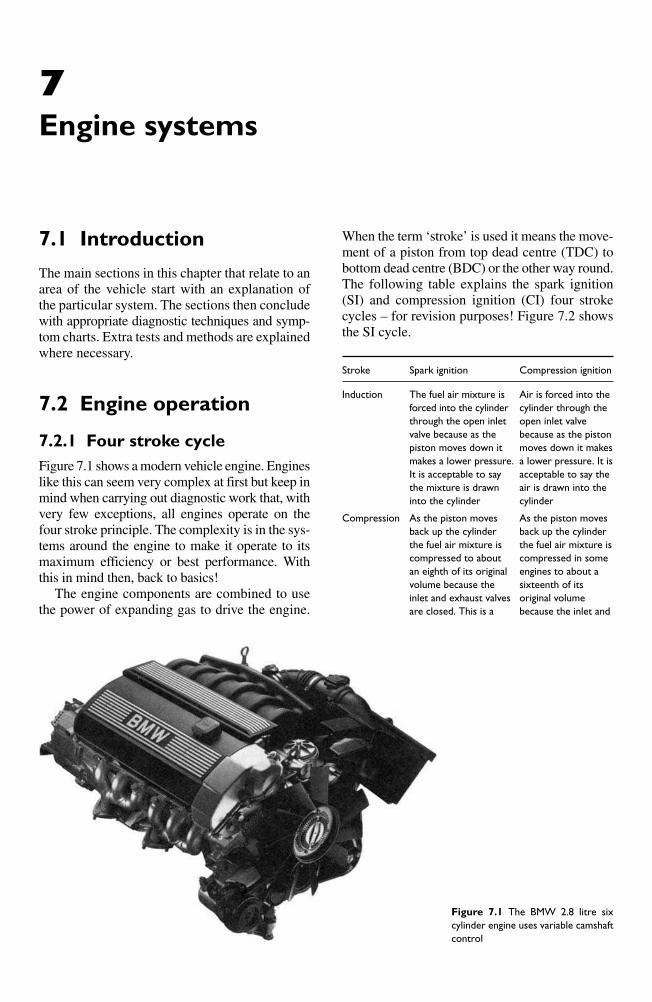
7.1 Introduction
The main sections in this chapter that relate to an
area of the vehicle start with an explanation of
the particular system. The sections then conclude
with appropriate diagnostic techniques and symp-
tom charts. Extra tests and methods are explained
where necessary.
7.2 Engine operation
7.2.1 Four stroke cycle
Figure 7.1 shows a modern vehicle engine. Engines
like this can seem very complex at first but keep in
mind when carrying out diagnostic work that, with
very few exceptions, all engines operate on the
four stroke principle. The complexity is in the sys-
tems around the engine to make it operate to its
maximum efficiency or best performance. With
this in mind then, back to basics!
The engine components are combined to use
the power of expanding gas to drive the engine.
When the term ‘stroke’ is used it means the move-ment of a piston from top dead centre (TDC) tobottom dead centre (BDC) or the other way round.The following table explains the spark ignition(SI) and compression ignition (CI) four strokecycles – for revision purposes! Figure 7.2 showsthe SI cycle.
Stroke Spark ignition Compression ignition
Induction The fuel air mixture is Air is forced into the
forced into the cylinder cylinder through the
through the open inlet open inlet valve
valve because as the because as the piston
piston moves down it moves down it makes
makes a lower pressure. a lower pressure. It is
It is acceptable to say acceptable to say the
the mixture is drawn air is drawn into the
into the cylinder cylinder
Compression As the piston moves As the piston moves
back up the cylinder back up the cylinder
the fuel air mixture is the fuel air mixture is
compressed to about compressed in some
an eighth of its original engines to about a
volume because the sixteenth of its
inlet and exhaust valves original volume
are closed. This is a because the inlet and
7
Engine systems
Figure 7.1 The BMW 2.8 litre six
cylinder engine uses variable camshaft
control
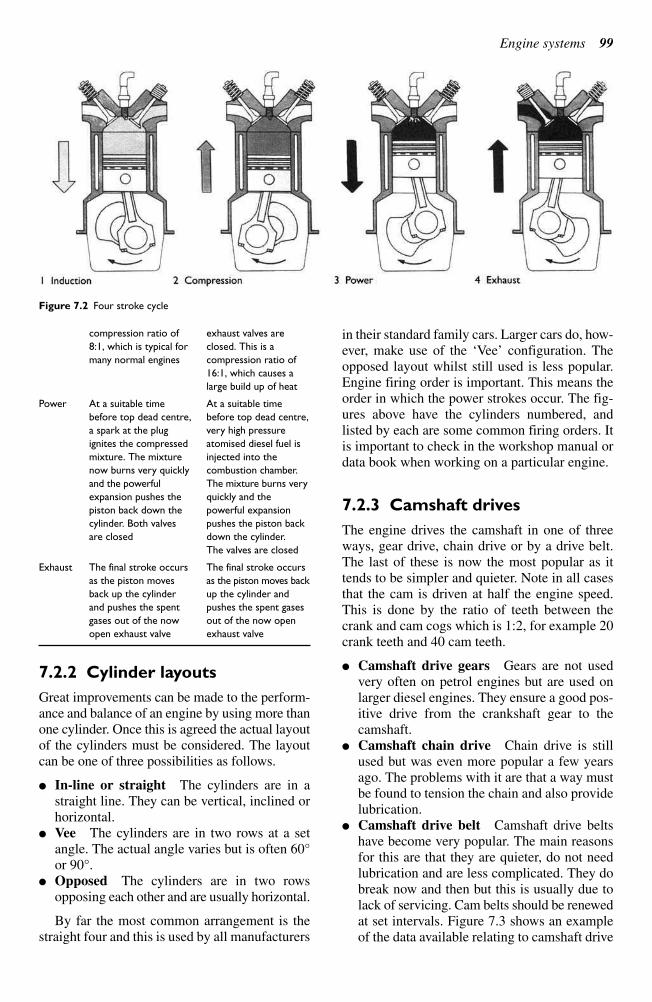
Engine systems 99
compression ratio of exhaust valves are
8:1, which is typical for closed. This is a
many normal engines compression ratio of
16:1, which causes a
large build up of heat
Power At a suitable time At a suitable time
before top dead centre, before top dead centre,
a spark at the plug very high pressure
ignites the compressed atomised diesel fuel is
mixture. The mixture injected into the
now burns very quickly combustion chamber.
and the powerful The mixture burns very
expansion pushes the quickly and the
piston back down the powerful expansion
cylinder. Both valves pushes the piston back
are closed down the cylinder.
The valves are closed
Exhaust The final stroke occurs The final stroke occurs
as the piston moves as the piston moves back
back up the cylinder up the cylinder and
and pushes the spent pushes the spent gases
gases out of the now out of the now open
open exhaust valve exhaust valve
7.2.2 Cylinder layouts
Great improvements can be made to the perform-
ance and balance of an engine by using more than
one cylinder. Once this is agreed the actual layout
of the cylinders must be considered. The layout
can be one of three possibilities as follows.
In-line or straight The cylinders are in a
straight line. They can be vertical, inclined or
horizontal.
Vee The cylinders are in two rows at a set
angle. The actual angle varies but is often 60°
or 90°.
Opposed The cylinders are in two rows
opposing each other and are usually horizontal.
By far the most common arrangement is the
straight four and this is used by all manufacturers
in their standard family cars. Larger cars do, how-
ever, make use of the ‘Vee’ configuration. Theopposed layout whilst still used is less popular.Engine firing order is important. This means theorder in which the power strokes occur. The fig-ures above have the cylinders numbered, andlisted by each are some common firing orders. Itis important to check in the workshop manual ordata book when working on a particular engine.
7.2.3 Camshaft drives
The engine drives the camshaft in one of threeways, gear drive, chain drive or by a drive belt.The last of these is now the most popular as ittends to be simpler and quieter. Note in all casesthat the cam is driven at half the engine speed.This is done by the ratio of teeth between thecrank and cam cogs which is 1:2, for example 20crank teeth and 40 cam teeth.
Camshaft drive gears Gears are not usedvery often on petrol engines but are used onlarger diesel engines. They ensure a good pos-itive drive from the crankshaft gear to thecamshaft.
Camshaft chain drive Chain drive is stillused but was even more popular a few yearsago. The problems with it are that a way mustbe found to tension the chain and also providelubrication.
Camshaft drive belt Camshaft drive beltshave become very popular. The main reasonsfor this are that they are quieter, do not needlubrication and are less complicated. They dobreak now and then but this is usually due tolack of servicing. Cam belts should be renewedat set intervals. Figure 7.3 shows an exampleof the data available relating to camshaft drive
Figure 7.2 Four stroke cycle
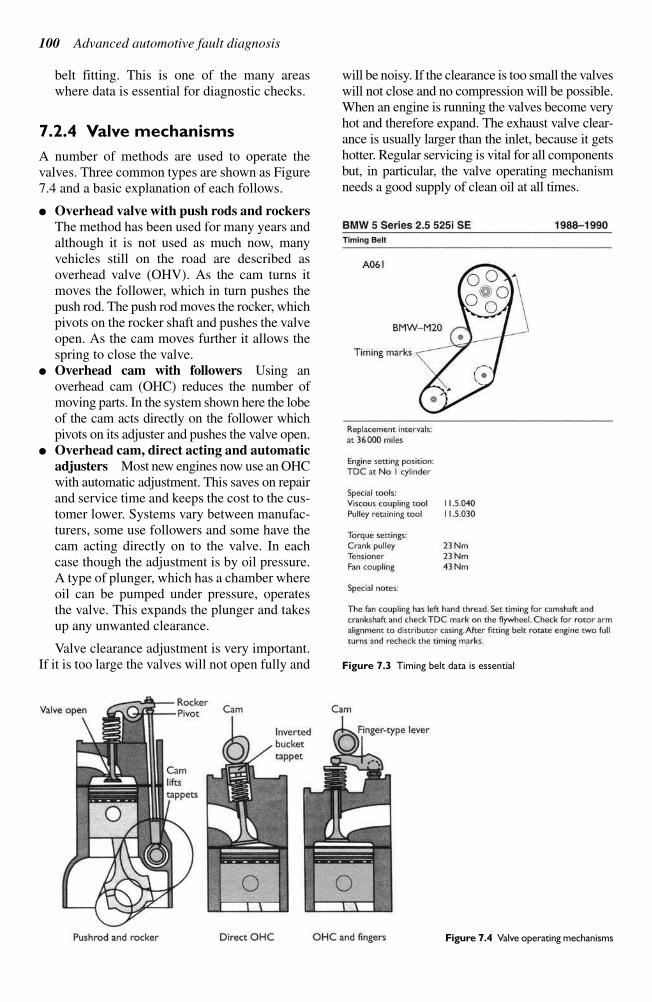
100 Advanced automotive fault diagnosis
belt fitting. This is one of the many areas
where data is essential for diagnostic checks.
7.2.4 Valve mechanisms
A number of methods are used to operate the
valves. Three common types are shown as Figure
7.4 and a basic explanation of each follows.
Overhead valve with push rods and rockers
The method has been used for many years and
although it is not used as much now, many
vehicles still on the road are described as
overhead valve (OHV). As the cam turns it
moves the follower, which in turn pushes the
push rod. The push rod moves the rocker, which
pivots on the rocker shaft and pushes the valve
open. As the cam moves further it allows the
spring to close the valve.
Overhead cam with followers Using an
overhead cam (OHC) reduces the number of
moving parts. In the system shown here the lobe
of the cam acts directly on the follower which
pivots on its adjuster and pushes the valve open.
Overhead cam, direct acting and automatic
adjusters Most new engines now use an OHC
with automatic adjustment. This saves on repair
and service time and keeps the cost to the cus-
tomer lower. Systems vary between manufac-
turers, some use followers and some have the
cam acting directly on to the valve. In each
case though the adjustment is by oil pressure.
A type of plunger, which has a chamber where
oil can be pumped under pressure, operates
the valve. This expands the plunger and takes
up any unwanted clearance.
Valve clearance adjustment is very important.
If it is too large the valves will not open fully and
will be noisy. If the clearance is too small the valves
will not close and no compression will be possible.
When an engine is running the valves become very
hot and therefore expand. The exhaust valve clear-
ance is usually larger than the inlet, because it gets
hotter. Regular servicing is vital for all components
but, in particular, the valve operating mechanism
needs a good supply of clean oil at all times.
Figure 7.3 Timing belt data is essential
Figure 7.4 Valve operating mechanisms
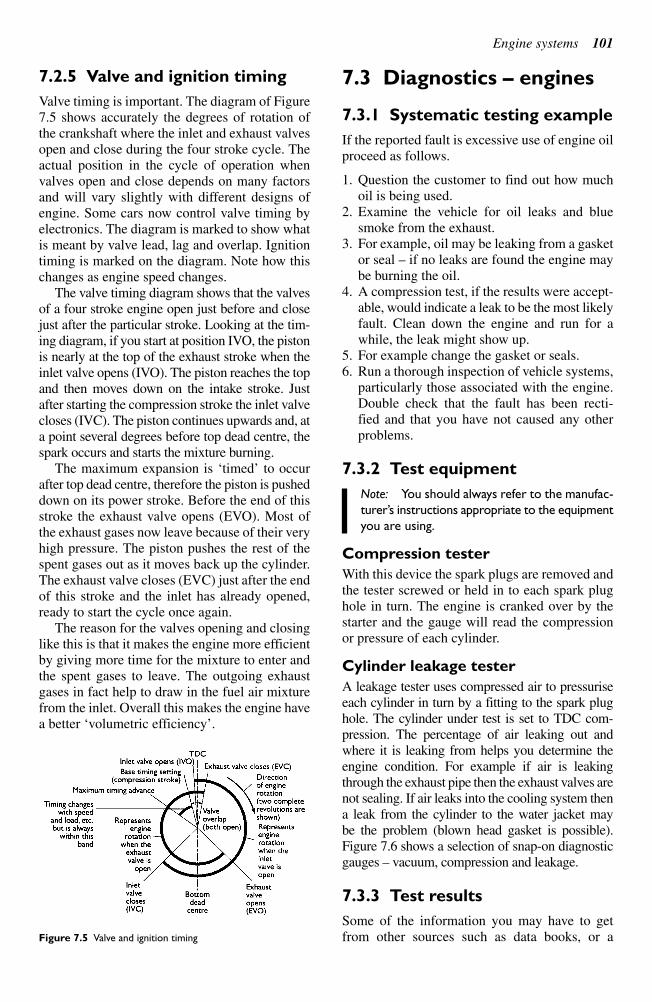
Engine systems 101
7.2.5 Valve and ignition timing
Valve timing is important. The diagram of Figure
7.5 shows accurately the degrees of rotation of
the crankshaft where the inlet and exhaust valves
open and close during the four stroke cycle. The
actual position in the cycle of operation when
valves open and close depends on many factors
and will vary slightly with different designs of
engine. Some cars now control valve timing by
electronics. The diagram is marked to show what
is meant by valve lead, lag and overlap. Ignition
timing is marked on the diagram. Note how this
changes as engine speed changes.
The valve timing diagram shows that the valves
of a four stroke engine open just before and close
just after the particular stroke. Looking at the tim-
ing diagram, if you start at position IVO, the piston
is nearly at the top of the exhaust stroke when the
inlet valve opens (IVO). The piston reaches the top
and then moves down on the intake stroke. Just
after starting the compression stroke the inlet valve
closes (IVC). The piston continues upwards and, at
a point several degrees before top dead centre, the
spark occurs and starts the mixture burning.
The maximum expansion is ‘timed’ to occurafter top dead centre, therefore the piston is pusheddown on its power stroke. Before the end of thisstroke the exhaust valve opens (EVO). Most ofthe exhaust gases now leave because of their veryhigh pressure. The piston pushes the rest of thespent gases out as it moves back up the cylinder.The exhaust valve closes (EVC) just after the endof this stroke and the inlet has already opened,ready to start the cycle once again.
The reason for the valves opening and closinglike this is that it makes the engine more efficientby giving more time for the mixture to enter andthe spent gases to leave. The outgoing exhaustgases in fact help to draw in the fuel air mixturefrom the inlet. Overall this makes the engine havea better ‘volumetric efficiency’.
7.3 Diagnostics – engines
7.3.1 Systematic testing example
If the reported fault is excessive use of engine oilproceed as follows.
1. Question the customer to find out how muchoil is being used.
2. Examine the vehicle for oil leaks and bluesmoke from the exhaust.
3. For example, oil may be leaking from a gasketor seal – if no leaks are found the engine maybe burning the oil.
4. A compression test, if the results were accept-able, would indicate a leak to be the most likelyfault. Clean down the engine and run for awhile, the leak might show up.
5. For example change the gasket or seals.6. Run a thorough inspection of vehicle systems,
particularly those associated with the engine.Double check that the fault has been recti-fied and that you have not caused any otherproblems.
7.3.2 Test equipment
Note: You should always refer to the manufac-
turer’s instructions appropriate to the equipment
you are using.
Compression tester
With this device the spark plugs are removed andthe tester screwed or held in to each spark plughole in turn. The engine is cranked over by thestarter and the gauge will read the compressionor pressure of each cylinder.
Cylinder leakage tester
A leakage tester uses compressed air to pressuriseeach cylinder in turn by a fitting to the spark plughole. The cylinder under test is set to TDC com-pression. The percentage of air leaking out andwhere it is leaking from helps you determine theengine condition. For example if air is leakingthrough the exhaust pipe then the exhaust valves arenot sealing. If air leaks into the cooling system thena leak from the cylinder to the water jacket may be the problem (blown head gasket is possible).Figure 7.6 shows a selection of snap-on diagnosticgauges – vacuum, compression and leakage.
7.3.3 Test results
Some of the information you may have to getfrom other sources such as data books, or a Figure 7.5 Valve and ignition timing
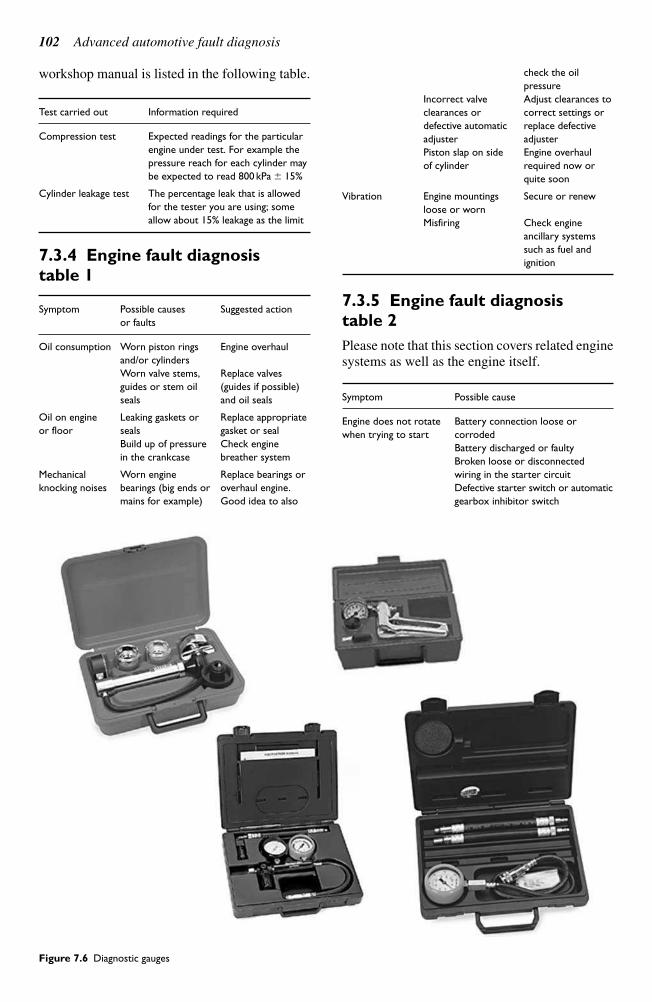
102 Advanced automotive fault diagnosis
workshop manual is listed in the following table.
Test carried out Information required
Compression test Expected readings for the particular
engine under test. For example the
pressure reach for each cylinder may
be expected to read 800 kPa 15%
Cylinder leakage test The percentage leak that is allowed
for the tester you are using; some
allow about 15% leakage as the limit
7.3.4 Engine fault diagnosis
table 1
Symptom Possible causes Suggested action
or faults
Oil consumption Worn piston rings Engine overhaul
and/or cylinders
Worn valve stems, Replace valves
guides or stem oil (guides if possible)
seals and oil seals
Oil on engine Leaking gaskets or Replace appropriate
or floor seals gasket or seal
Build up of pressure Check engine
in the crankcase breather system
Mechanical Worn engine Replace bearings or
knocking noises bearings (big ends or overhaul engine.
mains for example) Good idea to also
check the oil
pressure
Incorrect valve Adjust clearances to
clearances or correct settings or
defective automatic replace defective
adjuster adjuster
Piston slap on side Engine overhaul
of cylinder required now or
quite soon
Vibration Engine mountings Secure or renew
loose or worn
Misfiring Check engine
ancillary systems
such as fuel and
ignition
7.3.5 Engine fault diagnosis
table 2
Please note that this section covers related engine
systems as well as the engine itself.
Symptom Possible cause
Engine does not rotate Battery connection loose or
when trying to start corroded
Battery discharged or faulty
Broken loose or disconnected
wiring in the starter circuit
Defective starter switch or automatic
gearbox inhibitor switch
Figure 7.6 Diagnostic gauges

Starter pinion or flywheel ring gear
loose
Earth strap broken. Loose or
corroded
Engine rotates but No fuel in the tank!
does not start Discharged battery (slow rotation)
Battery terminals loose or corroded
Air filter dirty or blocked
Low cylinder compressions
Broken timing belt
Damp ignition components
Fuel system fault
Spark plugs worn to excess
Ignition system open circuit
Difficult to start when Discharged battery (slow rotation)
cold Battery terminals loose or corroded
Air filter dirty or blocked
Low cylinder compressions
Fuel system fault
Spark plugs worn to excess
Enrichment device not working
(choke or injection circuit)
Difficult to start when Discharged battery (slow rotation)
hot Battery terminals loose or corroded
Air filter dirty or blocked
Low cylinder compressions
Fuel system fault
Starter noisy Starter pinion or flywheel ring gear
loose
Starter mounting bolts loose
Starter worn (bearings, etc.)
Discharged battery (starter may
jump in and out)
Starter turns engine Discharged battery (slow rotation)
slowly Battery terminals loose or corroded
Earth strap or starter supply loose
or disconnected
Internal starter fault
Engine starts but then Ignition wiring connection
stops immediately intermittent
Fuel system contamination
Fuel pump or circuit fault (relay)
Intake system air leak
Ballast resistor open circuit
(older cars)
Erratic idle Air filter blocked
Incorrect plug gaps
Inlet system air leak
Incorrect CO setting
Uneven or low cylinder
compressions (maybe valves)
Fuel injector fault
Incorrect ignition timing
Incorrect valve timing
Misfire at idle speed Ignition coil or distributor cap
tracking
Poor cylinder compressions
Engine breather blocked
Inlet system air leak
Faulty plugs
Misfire through all Fuel filter blocked
speeds Fuel pump delivery low
Fuel tank ventilation system blocked
Poor cylinder compressions
Incorrect plugs or plug gaps
HT leads breaking down
Engine stalls Idle speed incorrect
CO setting incorrect
Fuel filter blocked
Air filter blocked
Intake air leak
Idle control system not working
Lack of power Fuel filter blocked
Air filter blocked
Ignition timing incorrect
Low fuel pump delivery
Uneven or low cylinder
compressions (maybe valves)
Fuel injectors blocked
Brakes binding or clutch slipping
Backfires Incorrect ignition timing
Incorrect valve timing (cam belt not
fitted correctly)
Fuel system fault (airflow sensor on
some cars)
Oil pressure gauge low Low engine oil level
or warning light on Faulty sensor or switch
Worn engine oil pump and/or engine
bearings
Engine overheating
Oil pickup filter blocked
Pressure relief valve not working
Runs on when Ignition timing incorrect
switched off Idle speed too high
Anti-run on device not working
Carbon build up in engine
Engine overheating
Pinking or knocking Ignition timing incorrect
under load Ignition system fault
Carbon build up in engine
Knock sensor not working
Sucking or whistling Leaking exhaust manifold gasket
noises Leaking inlet manifold gasket
Cylinder head gasket
Inlet air leak
Water pump or alternator
bearing
Rattling or tapping Incorrect valve clearances
Worn valve gear or camshaft
Loose component
Thumping or knocking Worn main bearings (deep
noises knocking/rumbling noise)
Worn big end bearings (heavy
knocking noise under load)
Piston slap (worse when cold)
Loose component
Rumbling noises Bearings on ancillary component
7.4 Fuel system
Authors Note: Even though carburettor fuel systemsare now very rare, they are still used on some specialistvehicles. For this reason, and because it serves as agood introduction to fuel systems, I decided to includethis section.
Engine systems 103
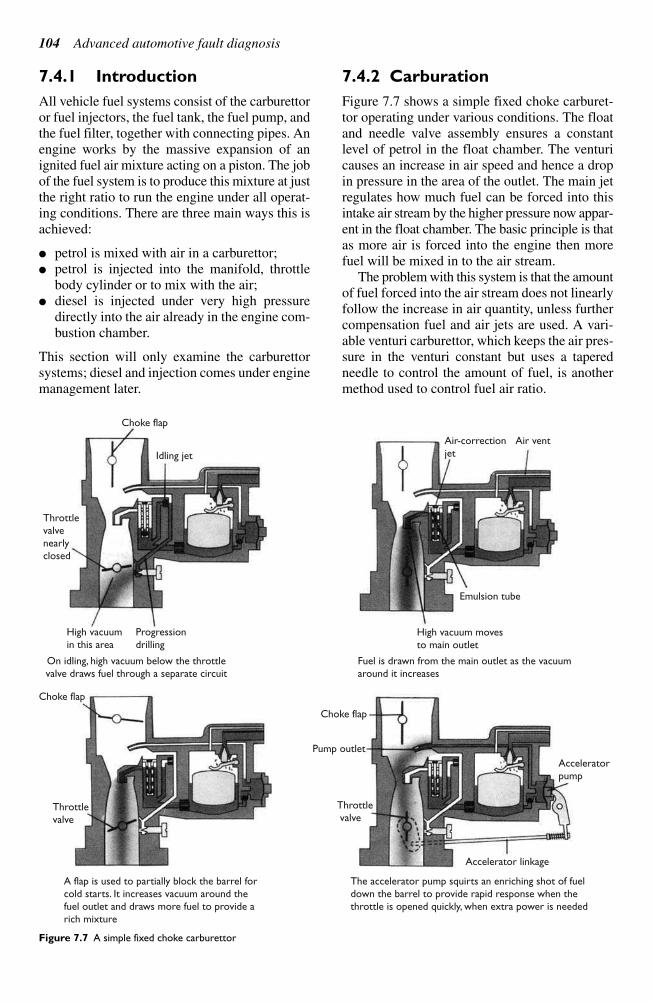
104 Advanced automotive fault diagnosis
7.4.1 Introduction
All vehicle fuel systems consist of the carburettor
or fuel injectors, the fuel tank, the fuel pump, and
the fuel filter, together with connecting pipes. An
engine works by the massive expansion of an
ignited fuel air mixture acting on a piston. The job
of the fuel system is to produce this mixture at just
the right ratio to run the engine under all operat-
ing conditions. There are three main ways this is
achieved:
petrol is mixed with air in a carburettor;
petrol is injected into the manifold, throttle
body cylinder or to mix with the air;
diesel is injected under very high pressure
directly into the air already in the engine com-
bustion chamber.
This section will only examine the carburettor
systems; diesel and injection comes under engine
management later.
7.4.2 Carburation
Figure 7.7 shows a simple fixed choke carburet-
tor operating under various conditions. The float
and needle valve assembly ensures a constant
level of petrol in the float chamber. The venturi
causes an increase in air speed and hence a drop
in pressure in the area of the outlet. The main jet
regulates how much fuel can be forced into this
intake air stream by the higher pressure now appar-
ent in the float chamber. The basic principle is that
as more air is forced into the engine then more
fuel will be mixed in to the air stream.
The problem with this system is that the amount
of fuel forced into the air stream does not linearly
follow the increase in air quantity, unless further
compensation fuel and air jets are used. A vari-
able venturi carburettor, which keeps the air pres-
sure in the venturi constant but uses a tapered
needle to control the amount of fuel, is another
method used to control fuel air ratio.
Choke flap
Idling jet
Throttlevalvenearlyclosed
High vacuumin this area
Choke flap
Throttlevalve
A flap is used to partially block the barrel forcold starts. It increases vacuum around thefuel outlet and draws more fuel to provide a rich mixture
The accelerator pump squirts an enriching shot of fueldown the barrel to provide rapid response when the throttle is opened quickly, when extra power is needed
Acceleratorpump
Accelerator linkage
Throttle valve
Pump outlet
Choke flap
Fuel is drawn from the main outlet as the vacuumaround it increases
High vacuum movesto main outlet
Emulsion tube
Air-correctionjet
Air vent
Progressiondrilling
On idling, high vacuum below the throttlevalve draws fuel through a separate circuit
Figure 7.7 A simple fixed choke carburettor
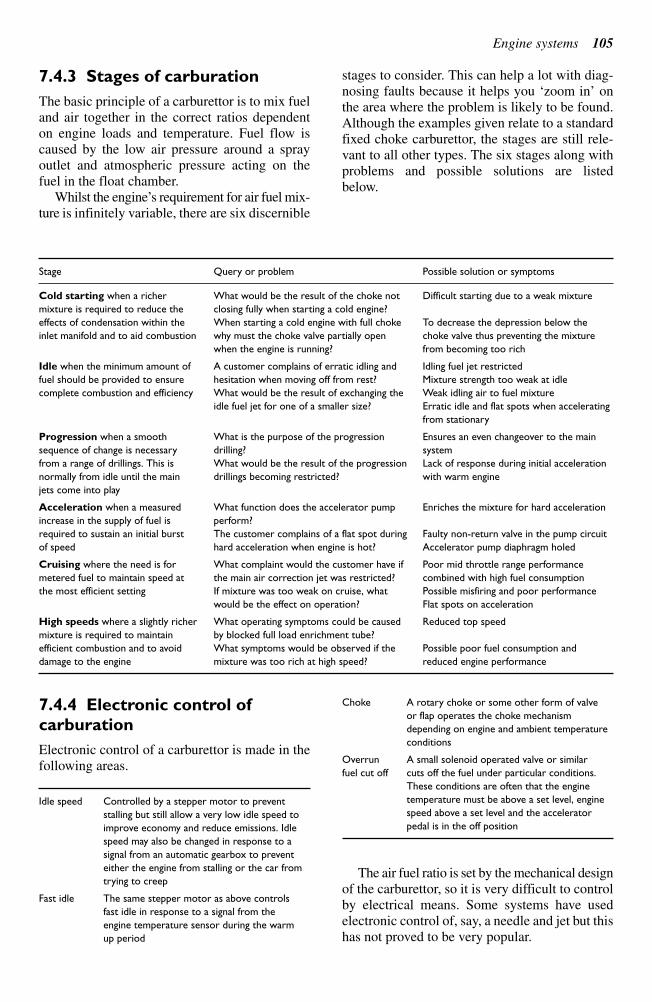
Engine systems 105
7.4.3 Stages of carburation
The basic principle of a carburettor is to mix fuel
and air together in the correct ratios dependent
on engine loads and temperature. Fuel flow is
caused by the low air pressure around a spray
outlet and atmospheric pressure acting on the
fuel in the float chamber.
Whilst the engine’s requirement for air fuel mix-ture is infinitely variable, there are six discernible
stages to consider. This can help a lot with diag-nosing faults because it helps you ‘zoom in’ onthe area where the problem is likely to be found.Although the examples given relate to a standardfixed choke carburettor, the stages are still rele-vant to all other types. The six stages along withproblems and possible solutions are listed below.
Stage Query or problem Possible solution or symptoms
Cold starting when a richer What would be the result of the choke not Difficult starting due to a weak mixture
mixture is required to reduce the closing fully when starting a cold engine?
effects of condensation within the When starting a cold engine with full choke To decrease the depression below the
inlet manifold and to aid combustion why must the choke valve partially open choke valve thus preventing the mixture
when the engine is running? from becoming too rich
Idle when the minimum amount of A customer complains of erratic idling and Idling fuel jet restricted
fuel should be provided to ensure hesitation when moving off from rest? Mixture strength too weak at idle
complete combustion and efficiency What would be the result of exchanging the Weak idling air to fuel mixture
idle fuel jet for one of a smaller size? Erratic idle and flat spots when accelerating
from stationary
Progression when a smooth What is the purpose of the progression Ensures an even changeover to the main
sequence of change is necessary drilling? system
from a range of drillings. This is What would be the result of the progression Lack of response during initial acceleration
normally from idle until the main drillings becoming restricted? with warm engine
jets come into play
Acceleration when a measured What function does the accelerator pump Enriches the mixture for hard acceleration
increase in the supply of fuel is perform?
required to sustain an initial burst The customer complains of a flat spot during Faulty non-return valve in the pump circuit
of speed hard acceleration when engine is hot? Accelerator pump diaphragm holed
Cruising where the need is for What complaint would the customer have if Poor mid throttle range performance
metered fuel to maintain speed at the main air correction jet was restricted? combined with high fuel consumption
the most efficient setting If mixture was too weak on cruise, what Possible misfiring and poor performance
would be the effect on operation? Flat spots on acceleration
High speeds where a slightly richer What operating symptoms could be caused Reduced top speed
mixture is required to maintain by blocked full load enrichment tube?
efficient combustion and to avoid What symptoms would be observed if the Possible poor fuel consumption and
damage to the engine mixture was too rich at high speed? reduced engine performance
7.4.4 Electronic control of
carburation
Electronic control of a carburettor is made in thefollowing areas.
Idle speed Controlled by a stepper motor to prevent
stalling but still allow a very low idle speed to
improve economy and reduce emissions. Idle
speed may also be changed in response to a
signal from an automatic gearbox to prevent
either the engine from stalling or the car from
trying to creep
Fast idle The same stepper motor as above controls
fast idle in response to a signal from the
engine temperature sensor during the warm
up period
Choke A rotary choke or some other form of valve
or flap operates the choke mechanism
depending on engine and ambient temperature
conditions
Overrun A small solenoid operated valve or similar
fuel cut off cuts off the fuel under particular conditions.
These conditions are often that the engine
temperature must be above a set level, engine
speed above a set level and the accelerator
pedal is in the off position
The air fuel ratio is set by the mechanical designof the carburettor, so it is very difficult to controlby electrical means. Some systems have usedelectronic control of, say, a needle and jet but thishas not proved to be very popular.
106 Advanced automotive fault diagnosis
Figure 7.8 shows the main components of the
system used on some vehicles. As with any con-
trol system it can be represented as a series of
inputs, a form of control and a number of out-
puts. The inputs to this system are as follows.
Engine speed From a signal wire to the negative side of the
ignition coil as is common with many systems
Engine This is taken from a thermistor located in the
coolant cylinder head waterways. The same sensor is
temperature used for the programmed ignition system if fitted
Ambient A thermistor sensor is placed such as to
temperature register the air temperature. A typical position
is at the rear of a headlight
Throttle This switch is placed under the actual pedal
switch and only operates when the pedal is fully off,
that is when the butterfly valve in the
carburettor is closed
The main controlling actuator of this system is
the stepper motor. This motor controls by reduc-
tion gears a rotary choke valve for cold starting
conditions. The same stepper motor controls idle
and fast idle with a rod that works on a snail type
cam. The system can operate this way because the
first part of the movement of the stepper motor does
not affect the choke valve; it only affects the idle
speed by opening the throttle butterfly slightly.
Further rotation then puts on the choke. The extent,
to which the choke is on is determined from engine
temperature and ambient temperature.
The ECU ‘knows’ the position of the steppermotor before setting the choke position by aprocess known as indexing. This involves thestepper motor being driven to say its least setting
on switching off the ignition. When the ignition isnext turned on the stepper will drive the idle andchoke mechanism by a certain number of stepsdetermined as at the end of the last paragraph.
The other main output is the overrun fuel cutoff solenoid. This controls the air pressure in thefloat chamber and when operated causes pres-sure in the float chamber and pressure in the ven-turi at the jet outlet to equalise. This prevents anyfuel from being ‘drawn’ into the air stream.
7.5 Diagnostics – fuel system
7.5.1 Systematic testing example
If the reported fault is excessive fuel consump-tion proceed as follows.
1. Check that the consumption is excessive for theparticular vehicle. Test it yourself if necessary.
2. Are there any other problems with the vehicle,misfiring for example or difficult starting?
3. For example if the vehicle is misfiring as wellthis may indicate that an ignition fault is thecause of the problem.
4. Remove and examine spark plugs, check HTlead resistance and ignition timing. Check COemissions.
5. Renew plugs and set fuel mixture.6. Road test vehicle for correct engine operation.
7.5.2 Test equipment
Note: You should always refer to the manufac-
turer’s instructions appropriate to the equip-
ment you are using.
Exhaust gas analyser (Figure 7.9)
This is a sophisticated piece of test equipmentused to measure the make up of the vehicle’sexhaust gas. The most common requirement isthe measuring of carbon monoxide (CO). A sam-ple probe is placed in the exhaust tail pipe or aspecial position before the catalytic converter iffitted, and the machine reads out the percentageof certain gases produced. A digital readout ismost common. The fuel mixture can then beadjusted until the required readings are obtained.
Fuel pressure gauge
The output pressure of the fuel pump can betested to ensure adequate delivery. The device isa simple pressure gauge but note the added pre-cautions necessary when dealing with petrol.
Figure 7.8 HIF variable venturi carburettor with electronic
control components
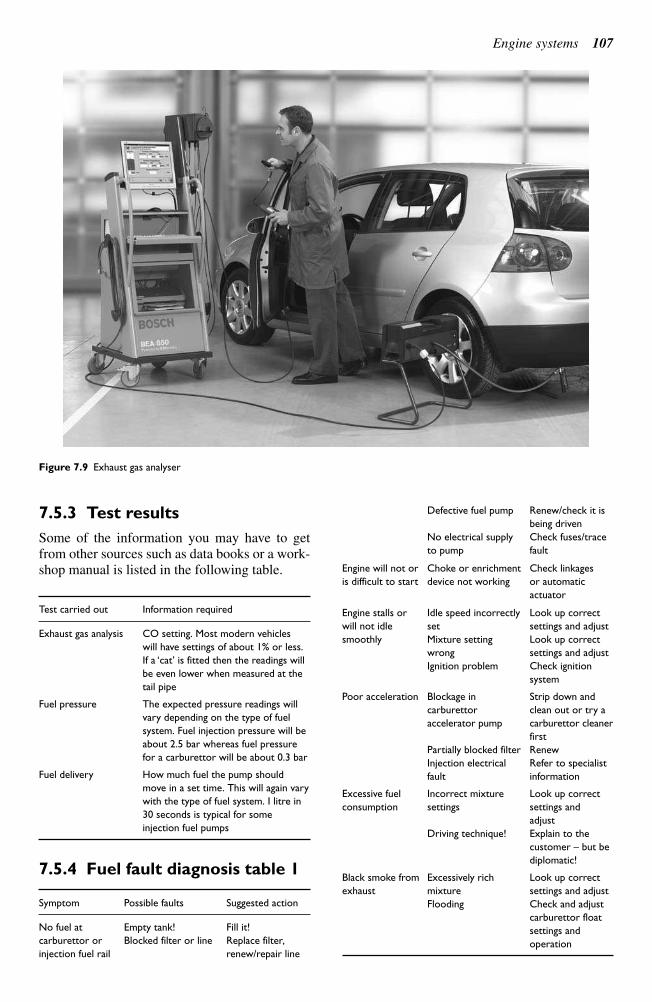
Engine systems 107
7.5.3 Test results
Some of the information you may have to get
from other sources such as data books or a work-
shop manual is listed in the following table.
Test carried out Information required
Exhaust gas analysis CO setting. Most modern vehicles
will have settings of about 1% or less.
If a ‘cat’ is fitted then the readings will
be even lower when measured at the
tail pipe
Fuel pressure The expected pressure readings will
vary depending on the type of fuel
system. Fuel injection pressure will be
about 2.5 bar whereas fuel pressure
for a carburettor will be about 0.3 bar
Fuel delivery How much fuel the pump should
move in a set time. This will again vary
with the type of fuel system. I litre in
30 seconds is typical for some
injection fuel pumps
7.5.4 Fuel fault diagnosis table 1
Symptom Possible faults Suggested action
No fuel at Empty tank! Fill it!
carburettor or Blocked filter or line Replace filter,
injection fuel rail renew/repair line
Defective fuel pump Renew/check it is
being driven
No electrical supply Check fuses/trace
to pump fault
Engine will not or Choke or enrichment Check linkages
is difficult to start device not working or automatic
actuator
Engine stalls or Idle speed incorrectly Look up correct
will not idle set settings and adjust
smoothly Mixture setting Look up correct
wrong settings and adjust
Ignition problem Check ignition
system
Poor acceleration Blockage in Strip down and
carburettor clean out or try a
accelerator pump carburettor cleaner
first
Partially blocked filter Renew
Injection electrical Refer to specialist
fault information
Excessive fuel Incorrect mixture Look up correct
consumption settings settings and
adjust
Driving technique! Explain to the
customer – but be
diplomatic!
Black smoke from Excessively rich Look up correct
exhaust mixture settings and adjust
Flooding Check and adjust
carburettor float
settings and
operation
Figure 7.9 Exhaust gas analyser
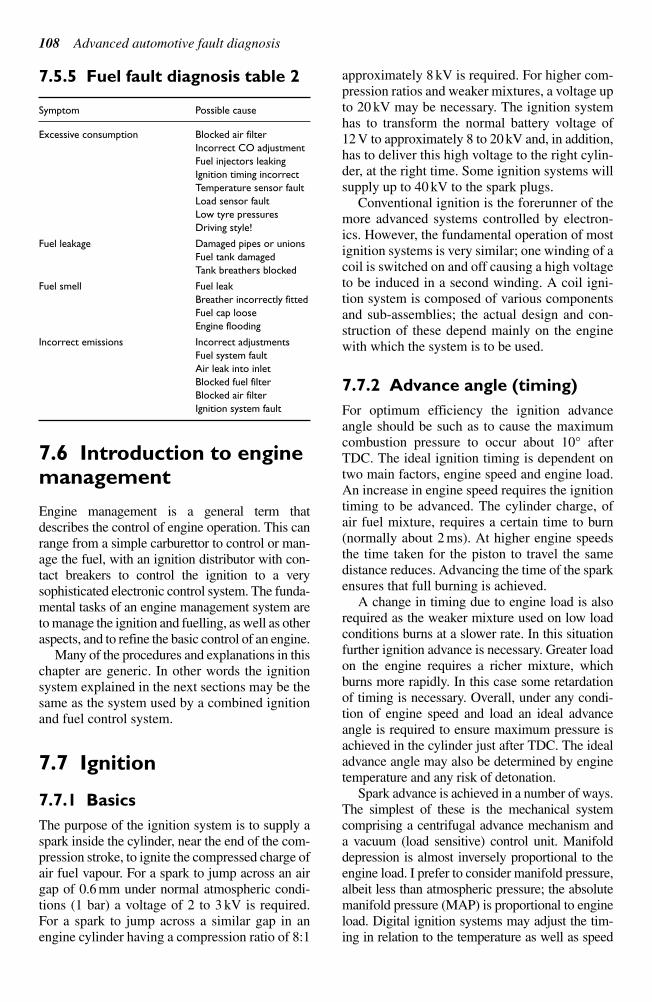
108 Advanced automotive fault diagnosis
7.5.5 Fuel fault diagnosis table 2
Symptom Possible cause
Excessive consumption Blocked air filter
Incorrect CO adjustment
Fuel injectors leaking
Ignition timing incorrect
Temperature sensor fault
Load sensor fault
Low tyre pressures
Driving style!
Fuel leakage Damaged pipes or unions
Fuel tank damaged
Tank breathers blocked
Fuel smell Fuel leak
Breather incorrectly fitted
Fuel cap loose
Engine flooding
Incorrect emissions Incorrect adjustments
Fuel system fault
Air leak into inlet
Blocked fuel filter
Blocked air filter
Ignition system fault
7.6 Introduction to enginemanagement
Engine management is a general term that
describes the control of engine operation. This can
range from a simple carburettor to control or man-
age the fuel, with an ignition distributor with con-
tact breakers to control the ignition to a very
sophisticated electronic control system. The funda-
mental tasks of an engine management system are
to manage the ignition and fuelling, as well as other
aspects, and to refine the basic control of an engine.
Many of the procedures and explanations in this
chapter are generic. In other words the ignition
system explained in the next sections may be the
same as the system used by a combined ignition
and fuel control system.
7.7 Ignition
7.7.1 Basics
The purpose of the ignition system is to supply a
spark inside the cylinder, near the end of the com-
pression stroke, to ignite the compressed charge of
air fuel vapour. For a spark to jump across an air
gap of 0.6 mm under normal atmospheric condi-
tions (1 bar) a voltage of 2 to 3 kV is required.
For a spark to jump across a similar gap in an
engine cylinder having a compression ratio of 8:1
approximately 8 kV is required. For higher com-
pression ratios and weaker mixtures, a voltage up
to 20 kV may be necessary. The ignition system
has to transform the normal battery voltage of
12 V to approximately 8 to 20 kV and, in addition,
has to deliver this high voltage to the right cylin-
der, at the right time. Some ignition systems will
supply up to 40 kV to the spark plugs.
Conventional ignition is the forerunner of the
more advanced systems controlled by electron-
ics. However, the fundamental operation of most
ignition systems is very similar; one winding of a
coil is switched on and off causing a high voltage
to be induced in a second winding. A coil igni-
tion system is composed of various components
and sub-assemblies; the actual design and con-
struction of these depend mainly on the engine
with which the system is to be used.
7.7.2 Advance angle (timing)
For optimum efficiency the ignition advance
angle should be such as to cause the maximum
combustion pressure to occur about 10° after
TDC. The ideal ignition timing is dependent on
two main factors, engine speed and engine load.
An increase in engine speed requires the ignition
timing to be advanced. The cylinder charge, of
air fuel mixture, requires a certain time to burn
(normally about 2 ms). At higher engine speeds
the time taken for the piston to travel the same
distance reduces. Advancing the time of the spark
ensures that full burning is achieved.
A change in timing due to engine load is also
required as the weaker mixture used on low load
conditions burns at a slower rate. In this situation
further ignition advance is necessary. Greater load
on the engine requires a richer mixture, which
burns more rapidly. In this case some retardation
of timing is necessary. Overall, under any condi-
tion of engine speed and load an ideal advance
angle is required to ensure maximum pressure is
achieved in the cylinder just after TDC. The ideal
advance angle may also be determined by engine
temperature and any risk of detonation.
Spark advance is achieved in a number of ways.
The simplest of these is the mechanical system
comprising a centrifugal advance mechanism and
a vacuum (load sensitive) control unit. Manifold
depression is almost inversely proportional to the
engine load. I prefer to consider manifold pressure,
albeit less than atmospheric pressure; the absolute
manifold pressure (MAP) is proportional to engine
load. Digital ignition systems may adjust the tim-
ing in relation to the temperature as well as speed
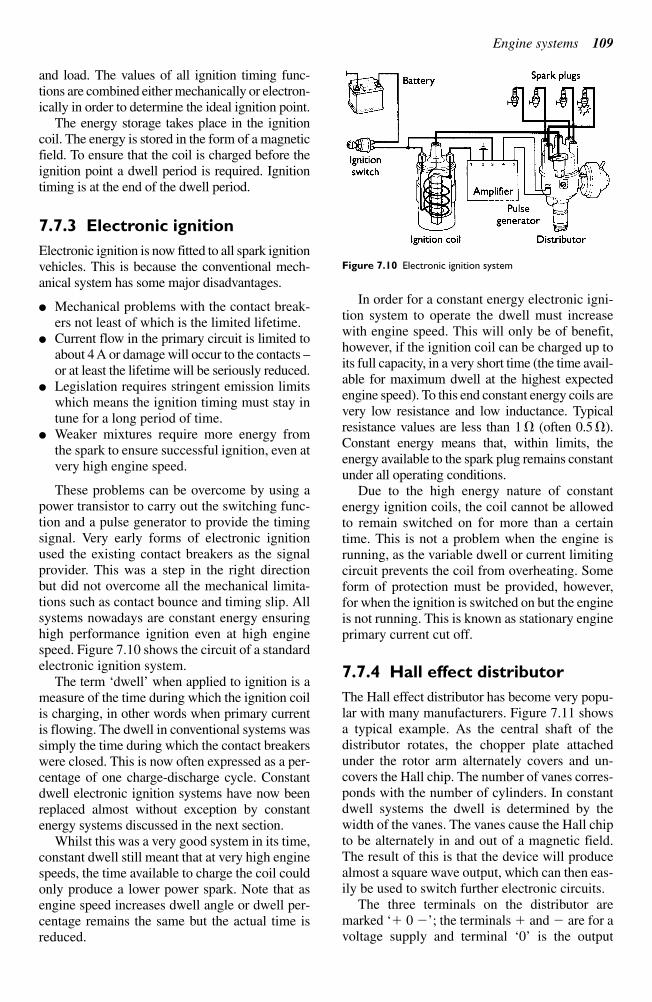
Engine systems 109
and load. The values of all ignition timing func-
tions are combined either mechanically or electron-
ically in order to determine the ideal ignition point.
The energy storage takes place in the ignition
coil. The energy is stored in the form of a magnetic
field. To ensure that the coil is charged before the
ignition point a dwell period is required. Ignition
timing is at the end of the dwell period.
7.7.3 Electronic ignition
Electronic ignition is now fitted to all spark ignition
vehicles. This is because the conventional mech-
anical system has some major disadvantages.
Mechanical problems with the contact break-
ers not least of which is the limited lifetime.
Current flow in the primary circuit is limited to
about 4 A or damage will occur to the contacts –or at least the lifetime will be seriously reduced.
Legislation requires stringent emission limitswhich means the ignition timing must stay intune for a long period of time.
Weaker mixtures require more energy fromthe spark to ensure successful ignition, even atvery high engine speed.
These problems can be overcome by using apower transistor to carry out the switching func-tion and a pulse generator to provide the timingsignal. Very early forms of electronic ignitionused the existing contact breakers as the signalprovider. This was a step in the right directionbut did not overcome all the mechanical limita-tions such as contact bounce and timing slip. Allsystems nowadays are constant energy ensuringhigh performance ignition even at high enginespeed. Figure 7.10 shows the circuit of a standardelectronic ignition system.
The term ‘dwell’ when applied to ignition is ameasure of the time during which the ignition coilis charging, in other words when primary currentis flowing. The dwell in conventional systems wassimply the time during which the contact breakerswere closed. This is now often expressed as a per-centage of one charge-discharge cycle. Constantdwell electronic ignition systems have now beenreplaced almost without exception by constantenergy systems discussed in the next section.
Whilst this was a very good system in its time,constant dwell still meant that at very high enginespeeds, the time available to charge the coil couldonly produce a lower power spark. Note that asengine speed increases dwell angle or dwell per-centage remains the same but the actual time isreduced.
In order for a constant energy electronic igni-tion system to operate the dwell must increasewith engine speed. This will only be of benefit,however, if the ignition coil can be charged up toits full capacity, in a very short time (the time avail-able for maximum dwell at the highest expectedengine speed). To this end constant energy coils arevery low resistance and low inductance. Typicalresistance values are less than 1 (often 0.5 ).Constant energy means that, within limits, theenergy available to the spark plug remains constantunder all operating conditions.
Due to the high energy nature of constantenergy ignition coils, the coil cannot be allowedto remain switched on for more than a certaintime. This is not a problem when the engine isrunning, as the variable dwell or current limitingcircuit prevents the coil from overheating. Someform of protection must be provided, however,for when the ignition is switched on but the engineis not running. This is known as stationary engineprimary current cut off.
7.7.4 Hall effect distributor
The Hall effect distributor has become very popu-lar with many manufacturers. Figure 7.11 showsa typical example. As the central shaft of the distributor rotates, the chopper plate attachedunder the rotor arm alternately covers and un-covers the Hall chip. The number of vanes corres-ponds with the number of cylinders. In constantdwell systems the dwell is determined by thewidth of the vanes. The vanes cause the Hall chipto be alternately in and out of a magnetic field.The result of this is that the device will producealmost a square wave output, which can then eas-ily be used to switch further electronic circuits.
The three terminals on the distributor aremarked ‘ 0 ’; the terminals and are for avoltage supply and terminal ‘0’ is the output
Figure 7.10 Electronic ignition system
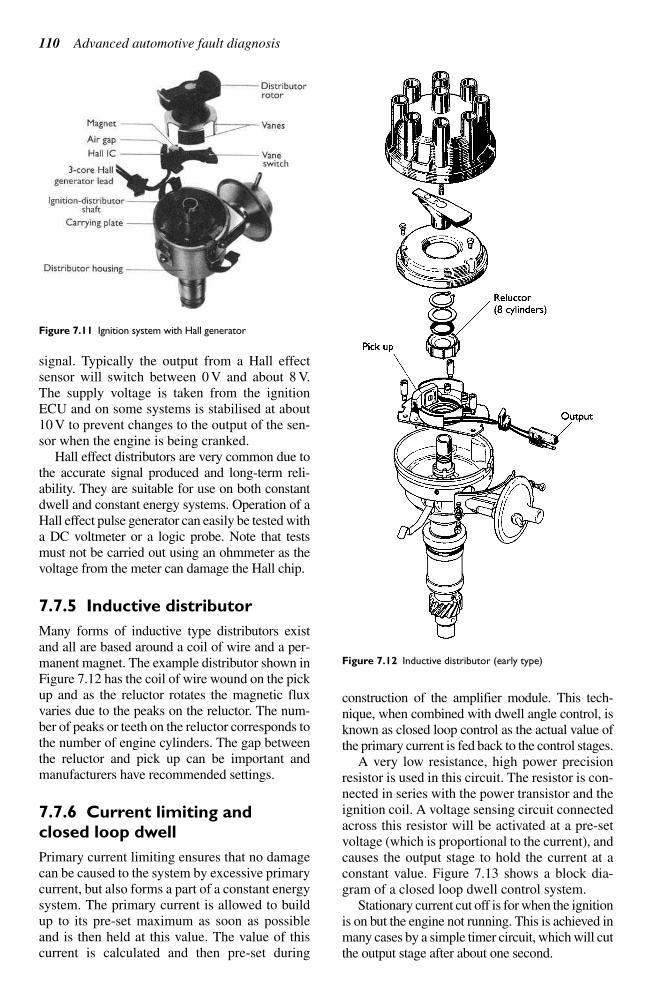
signal. Typically the output from a Hall effect
sensor will switch between 0 V and about 8 V.
The supply voltage is taken from the ignition
ECU and on some systems is stabilised at about
10 V to prevent changes to the output of the sen-
sor when the engine is being cranked.
Hall effect distributors are very common due to
the accurate signal produced and long-term reli-
ability. They are suitable for use on both constant
dwell and constant energy systems. Operation of a
Hall effect pulse generator can easily be tested with
a DC voltmeter or a logic probe. Note that tests
must not be carried out using an ohmmeter as the
voltage from the meter can damage the Hall chip.
7.7.5 Inductive distributor
Many forms of inductive type distributors exist
and all are based around a coil of wire and a per-
manent magnet. The example distributor shown in
Figure 7.12 has the coil of wire wound on the pick
up and as the reluctor rotates the magnetic flux
varies due to the peaks on the reluctor. The num-
ber of peaks or teeth on the reluctor corresponds to
the number of engine cylinders. The gap between
the reluctor and pick up can be important and
manufacturers have recommended settings.
7.7.6 Current limiting and
closed loop dwell
Primary current limiting ensures that no damage
can be caused to the system by excessive primary
current, but also forms a part of a constant energy
system. The primary current is allowed to build
up to its pre-set maximum as soon as possible
and is then held at this value. The value of this
current is calculated and then pre-set during
construction of the amplifier module. This tech-
nique, when combined with dwell angle control, is
known as closed loop control as the actual value of
the primary current is fed back to the control stages.
A very low resistance, high power precision
resistor is used in this circuit. The resistor is con-
nected in series with the power transistor and the
ignition coil. A voltage sensing circuit connected
across this resistor will be activated at a pre-set
voltage (which is proportional to the current), and
causes the output stage to hold the current at a
constant value. Figure 7.13 shows a block dia-
gram of a closed loop dwell control system.
Stationary current cut off is for when the ignition
is on but the engine not running. This is achieved in
many cases by a simple timer circuit, which will cut
the output stage after about one second.
110 Advanced automotive fault diagnosis
Figure 7.12 Inductive distributor (early type)
Figure 7.11 Ignition system with Hall generator
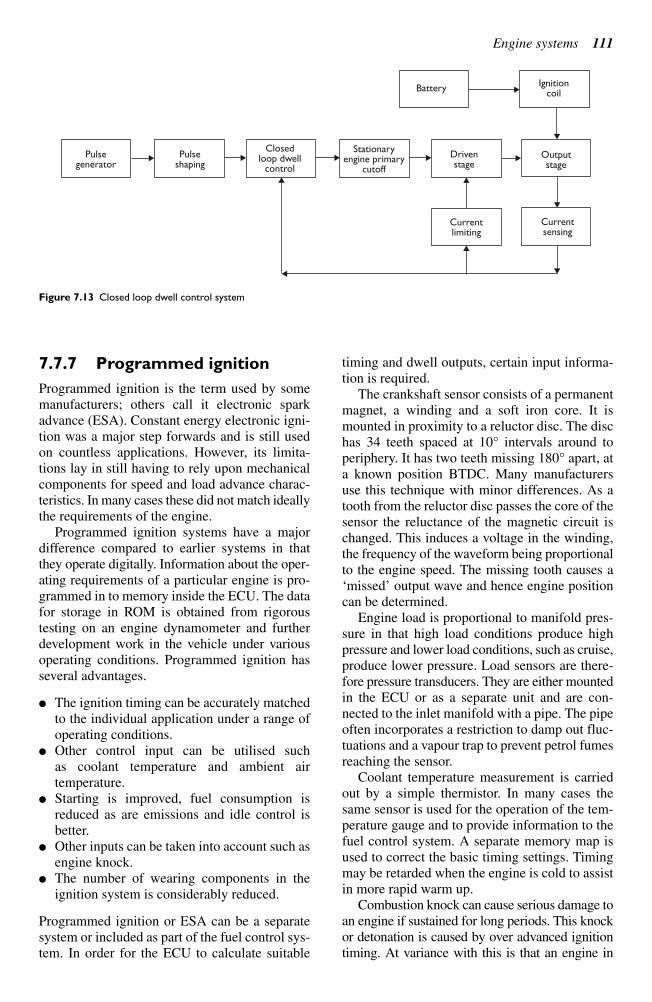
Engine systems 111
7.7.7 Programmed ignition
Programmed ignition is the term used by some
manufacturers; others call it electronic spark
advance (ESA). Constant energy electronic igni-
tion was a major step forwards and is still used
on countless applications. However, its limita-
tions lay in still having to rely upon mechanical
components for speed and load advance charac-
teristics. In many cases these did not match ideally
the requirements of the engine.
Programmed ignition systems have a major
difference compared to earlier systems in that
they operate digitally. Information about the oper-
ating requirements of a particular engine is pro-
grammed in to memory inside the ECU. The data
for storage in ROM is obtained from rigorous
testing on an engine dynamometer and further
development work in the vehicle under various
operating conditions. Programmed ignition has
several advantages.
The ignition timing can be accurately matched
to the individual application under a range of
operating conditions.
Other control input can be utilised such
as coolant temperature and ambient air
temperature.
Starting is improved, fuel consumption is
reduced as are emissions and idle control is
better.
Other inputs can be taken into account such as
engine knock.
The number of wearing components in the
ignition system is considerably reduced.
Programmed ignition or ESA can be a separate
system or included as part of the fuel control sys-
tem. In order for the ECU to calculate suitable
timing and dwell outputs, certain input informa-
tion is required.
The crankshaft sensor consists of a permanent
magnet, a winding and a soft iron core. It is
mounted in proximity to a reluctor disc. The disc
has 34 teeth spaced at 10° intervals around to
periphery. It has two teeth missing 180° apart, at
a known position BTDC. Many manufacturers
use this technique with minor differences. As a
tooth from the reluctor disc passes the core of the
sensor the reluctance of the magnetic circuit is
changed. This induces a voltage in the winding,
the frequency of the waveform being proportional
to the engine speed. The missing tooth causes a
‘missed’ output wave and hence engine positioncan be determined.
Engine load is proportional to manifold pres-sure in that high load conditions produce highpressure and lower load conditions, such as cruise,produce lower pressure. Load sensors are there-fore pressure transducers. They are either mountedin the ECU or as a separate unit and are con-nected to the inlet manifold with a pipe. The pipeoften incorporates a restriction to damp out fluc-tuations and a vapour trap to prevent petrol fumesreaching the sensor.
Coolant temperature measurement is carriedout by a simple thermistor. In many cases thesame sensor is used for the operation of the tem-perature gauge and to provide information to thefuel control system. A separate memory map isused to correct the basic timing settings. Timingmay be retarded when the engine is cold to assistin more rapid warm up.
Combustion knock can cause serious damage toan engine if sustained for long periods. This knockor detonation is caused by over advanced ignitiontiming. At variance with this is that an engine in
Pulsegenerator
Pulseshaping
Closedloop dwell
control
Stationaryengine primary
cutoff
Drivenstage
Battery
Currentlimiting
Currentsensing
Outputstage
Ignitioncoil
Figure 7.13 Closed loop dwell control system
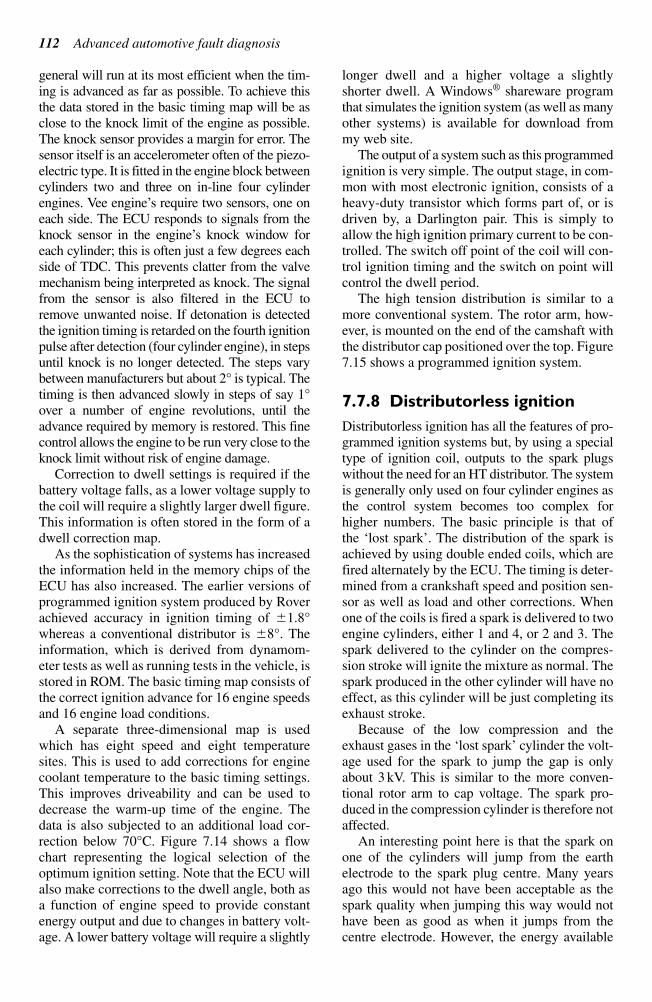
general will run at its most efficient when the tim-
ing is advanced as far as possible. To achieve this
the data stored in the basic timing map will be as
close to the knock limit of the engine as possible.
The knock sensor provides a margin for error. The
sensor itself is an accelerometer often of the piezo-
electric type. It is fitted in the engine block between
cylinders two and three on in-line four cylinder
engines. Vee engine’s require two sensors, one oneach side. The ECU responds to signals from theknock sensor in the engine’s knock window foreach cylinder; this is often just a few degrees eachside of TDC. This prevents clatter from the valvemechanism being interpreted as knock. The signalfrom the sensor is also filtered in the ECU toremove unwanted noise. If detonation is detectedthe ignition timing is retarded on the fourth ignitionpulse after detection (four cylinder engine), in stepsuntil knock is no longer detected. The steps varybetween manufacturers but about 2° is typical. Thetiming is then advanced slowly in steps of say 1°over a number of engine revolutions, until theadvance required by memory is restored. This finecontrol allows the engine to be run very close to theknock limit without risk of engine damage.
Correction to dwell settings is required if thebattery voltage falls, as a lower voltage supply tothe coil will require a slightly larger dwell figure.This information is often stored in the form of adwell correction map.
As the sophistication of systems has increasedthe information held in the memory chips of theECU has also increased. The earlier versions ofprogrammed ignition system produced by Roverachieved accuracy in ignition timing of 1.8°whereas a conventional distributor is 8°. Theinformation, which is derived from dynamom-eter tests as well as running tests in the vehicle, isstored in ROM. The basic timing map consists ofthe correct ignition advance for 16 engine speedsand 16 engine load conditions.
A separate three-dimensional map is usedwhich has eight speed and eight temperaturesites. This is used to add corrections for enginecoolant temperature to the basic timing settings.This improves driveability and can be used todecrease the warm-up time of the engine. Thedata is also subjected to an additional load cor-rection below 70°C. Figure 7.14 shows a flowchart representing the logical selection of theoptimum ignition setting. Note that the ECU willalso make corrections to the dwell angle, both asa function of engine speed to provide constantenergy output and due to changes in battery volt-age. A lower battery voltage will require a slightly
longer dwell and a higher voltage a slightlyshorter dwell. A Windows® shareware programthat simulates the ignition system (as well as manyother systems) is available for download frommy web site.
The output of a system such as this programmedignition is very simple. The output stage, in com-mon with most electronic ignition, consists of aheavy-duty transistor which forms part of, or isdriven by, a Darlington pair. This is simply toallow the high ignition primary current to be con-trolled. The switch off point of the coil will con-trol ignition timing and the switch on point willcontrol the dwell period.
The high tension distribution is similar to amore conventional system. The rotor arm, how-ever, is mounted on the end of the camshaft withthe distributor cap positioned over the top. Figure7.15 shows a programmed ignition system.
7.7.8 Distributorless ignition
Distributorless ignition has all the features of pro-grammed ignition systems but, by using a specialtype of ignition coil, outputs to the spark plugswithout the need for an HT distributor. The systemis generally only used on four cylinder engines asthe control system becomes too complex forhigher numbers. The basic principle is that of the ‘lost spark’. The distribution of the spark isachieved by using double ended coils, which arefired alternately by the ECU. The timing is deter-mined from a crankshaft speed and position sen-sor as well as load and other corrections. Whenone of the coils is fired a spark is delivered to twoengine cylinders, either 1 and 4, or 2 and 3. Thespark delivered to the cylinder on the compres-sion stroke will ignite the mixture as normal. Thespark produced in the other cylinder will have noeffect, as this cylinder will be just completing itsexhaust stroke.
Because of the low compression and theexhaust gases in the ‘lost spark’ cylinder the volt-age used for the spark to jump the gap is onlyabout 3 kV. This is similar to the more conven-tional rotor arm to cap voltage. The spark pro-duced in the compression cylinder is therefore notaffected.
An interesting point here is that the spark onone of the cylinders will jump from the earthelectrode to the spark plug centre. Many yearsago this would not have been acceptable as thespark quality when jumping this way would nothave been as good as when it jumps from thecentre electrode. However, the energy available
112 Advanced automotive fault diagnosis
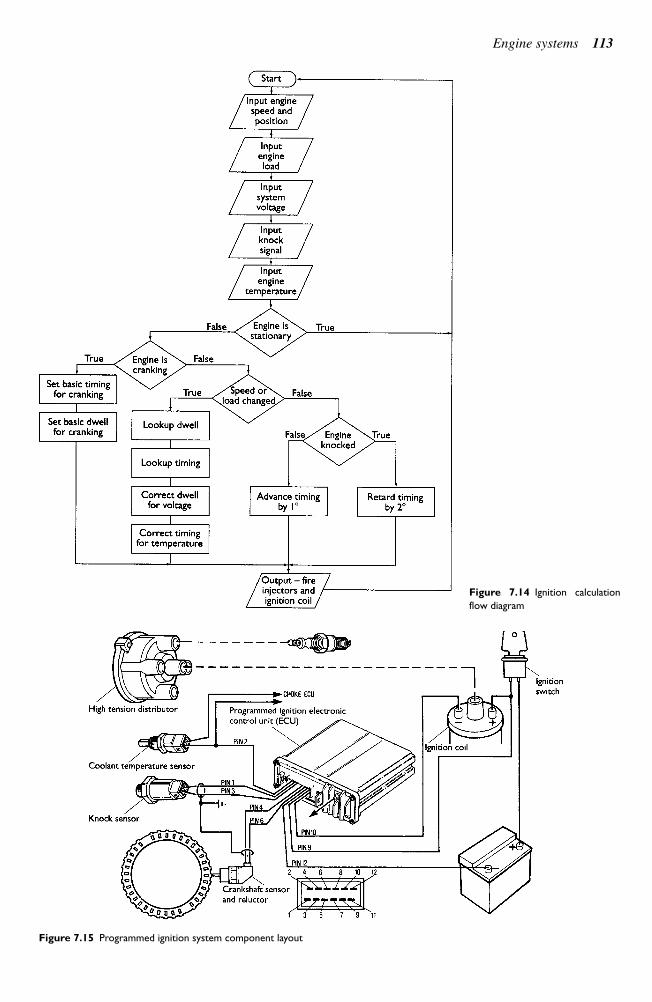
Engine systems 113
Figure 7.14 Ignition calculation
flow diagram
Figure 7.15 Programmed ignition system component layout
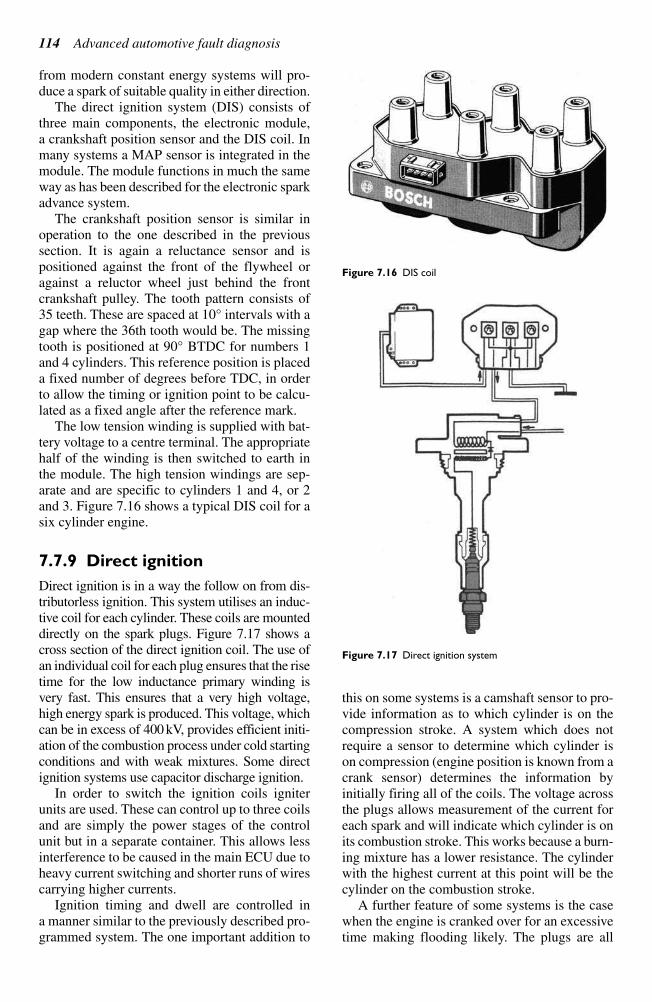
114 Advanced automotive fault diagnosis
from modern constant energy systems will pro-
duce a spark of suitable quality in either direction.
The direct ignition system (DIS) consists of
three main components, the electronic module,
a crankshaft position sensor and the DIS coil. In
many systems a MAP sensor is integrated in the
module. The module functions in much the same
way as has been described for the electronic spark
advance system.
The crankshaft position sensor is similar in
operation to the one described in the previous
section. It is again a reluctance sensor and is
positioned against the front of the flywheel or
against a reluctor wheel just behind the front
crankshaft pulley. The tooth pattern consists of
35 teeth. These are spaced at 10° intervals with a
gap where the 36th tooth would be. The missing
tooth is positioned at 90° BTDC for numbers 1
and 4 cylinders. This reference position is placed
a fixed number of degrees before TDC, in order
to allow the timing or ignition point to be calcu-
lated as a fixed angle after the reference mark.
The low tension winding is supplied with bat-
tery voltage to a centre terminal. The appropriate
half of the winding is then switched to earth in
the module. The high tension windings are sep-
arate and are specific to cylinders 1 and 4, or 2
and 3. Figure 7.16 shows a typical DIS coil for a
six cylinder engine.
7.7.9 Direct ignition
Direct ignition is in a way the follow on from dis-
tributorless ignition. This system utilises an induc-
tive coil for each cylinder. These coils are mounted
directly on the spark plugs. Figure 7.17 shows a
cross section of the direct ignition coil. The use of
an individual coil for each plug ensures that the rise
time for the low inductance primary winding is
very fast. This ensures that a very high voltage,
high energy spark is produced. This voltage, which
can be in excess of 400 kV, provides efficient initi-
ation of the combustion process under cold starting
conditions and with weak mixtures. Some direct
ignition systems use capacitor discharge ignition.
In order to switch the ignition coils igniter
units are used. These can control up to three coils
and are simply the power stages of the control
unit but in a separate container. This allows less
interference to be caused in the main ECU due to
heavy current switching and shorter runs of wires
carrying higher currents.
Ignition timing and dwell are controlled in
a manner similar to the previously described pro-
grammed system. The one important addition to
this on some systems is a camshaft sensor to pro-
vide information as to which cylinder is on the
compression stroke. A system which does not
require a sensor to determine which cylinder is
on compression (engine position is known from a
crank sensor) determines the information by
initially firing all of the coils. The voltage across
the plugs allows measurement of the current for
each spark and will indicate which cylinder is on
its combustion stroke. This works because a burn-
ing mixture has a lower resistance. The cylinder
with the highest current at this point will be the
cylinder on the combustion stroke.
A further feature of some systems is the case
when the engine is cranked over for an excessive
time making flooding likely. The plugs are all
Figure 7.16 DIS coil
Figure 7.17 Direct ignition system
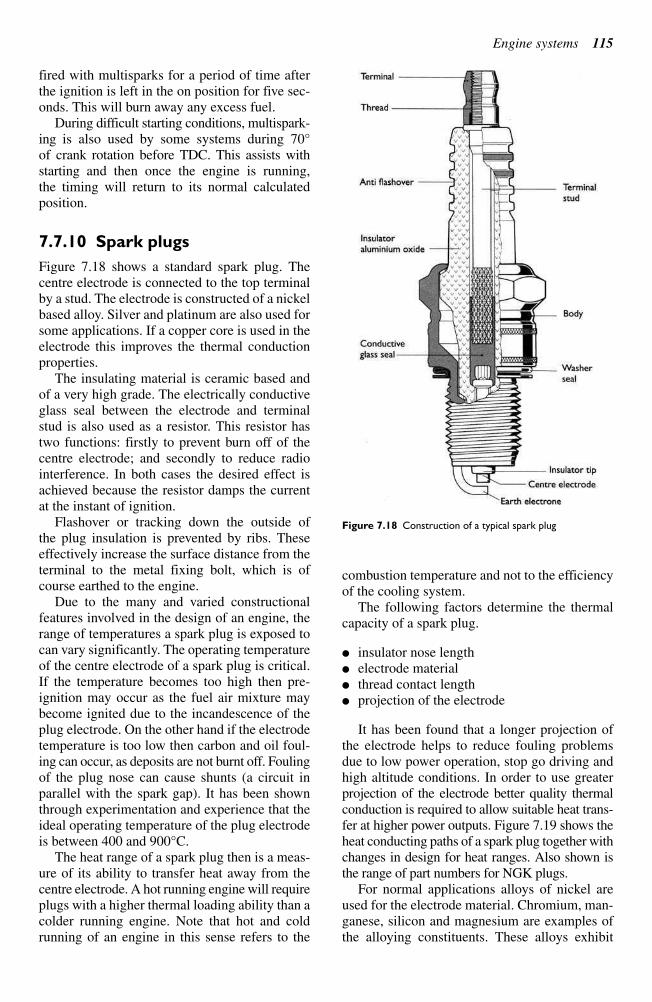
Engine systems 115
fired with multisparks for a period of time after
the ignition is left in the on position for five sec-
onds. This will burn away any excess fuel.
During difficult starting conditions, multispark-
ing is also used by some systems during 70°
of crank rotation before TDC. This assists with
starting and then once the engine is running,
the timing will return to its normal calculated
position.
7.7.10 Spark plugs
Figure 7.18 shows a standard spark plug. The
centre electrode is connected to the top terminal
by a stud. The electrode is constructed of a nickel
based alloy. Silver and platinum are also used for
some applications. If a copper core is used in the
electrode this improves the thermal conduction
properties.
The insulating material is ceramic based and
of a very high grade. The electrically conductive
glass seal between the electrode and terminal
stud is also used as a resistor. This resistor has
two functions: firstly to prevent burn off of the
centre electrode; and secondly to reduce radio
interference. In both cases the desired effect is
achieved because the resistor damps the current
at the instant of ignition.
Flashover or tracking down the outside of
the plug insulation is prevented by ribs. These
effectively increase the surface distance from the
terminal to the metal fixing bolt, which is of
course earthed to the engine.
Due to the many and varied constructional
features involved in the design of an engine, the
range of temperatures a spark plug is exposed to
can vary significantly. The operating temperature
of the centre electrode of a spark plug is critical.
If the temperature becomes too high then pre-
ignition may occur as the fuel air mixture may
become ignited due to the incandescence of the
plug electrode. On the other hand if the electrode
temperature is too low then carbon and oil foul-
ing can occur, as deposits are not burnt off. Fouling
of the plug nose can cause shunts (a circuit in
parallel with the spark gap). It has been shown
through experimentation and experience that the
ideal operating temperature of the plug electrode
is between 400 and 900°C.
The heat range of a spark plug then is a meas-
ure of its ability to transfer heat away from the
centre electrode. A hot running engine will require
plugs with a higher thermal loading ability than a
colder running engine. Note that hot and cold
running of an engine in this sense refers to the
combustion temperature and not to the efficiency
of the cooling system.
The following factors determine the thermal
capacity of a spark plug.
insulator nose length
electrode material
thread contact length
projection of the electrode
It has been found that a longer projection of
the electrode helps to reduce fouling problems
due to low power operation, stop go driving and
high altitude conditions. In order to use greater
projection of the electrode better quality thermal
conduction is required to allow suitable heat trans-
fer at higher power outputs. Figure 7.19 shows the
heat conducting paths of a spark plug together with
changes in design for heat ranges. Also shown is
the range of part numbers for NGK plugs.
For normal applications alloys of nickel are
used for the electrode material. Chromium, man-
ganese, silicon and magnesium are examples of
the alloying constituents. These alloys exhibit
Figure 7.18 Construction of a typical spark plug
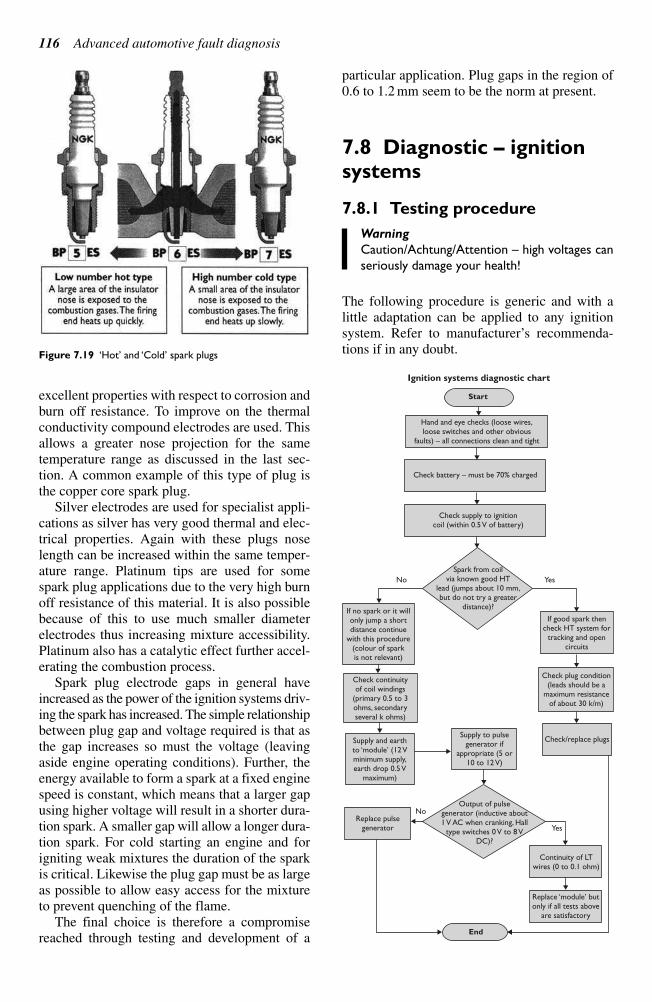
excellent properties with respect to corrosion and
burn off resistance. To improve on the thermal
conductivity compound electrodes are used. This
allows a greater nose projection for the same
temperature range as discussed in the last sec-
tion. A common example of this type of plug is
the copper core spark plug.
Silver electrodes are used for specialist appli-
cations as silver has very good thermal and elec-
trical properties. Again with these plugs nose
length can be increased within the same temper-
ature range. Platinum tips are used for some
spark plug applications due to the very high burn
off resistance of this material. It is also possible
because of this to use much smaller diameter
electrodes thus increasing mixture accessibility.
Platinum also has a catalytic effect further accel-
erating the combustion process.
Spark plug electrode gaps in general have
increased as the power of the ignition systems driv-
ing the spark has increased. The simple relationship
between plug gap and voltage required is that as
the gap increases so must the voltage (leaving
aside engine operating conditions). Further, the
energy available to form a spark at a fixed engine
speed is constant, which means that a larger gap
using higher voltage will result in a shorter dura-
tion spark. A smaller gap will allow a longer dura-
tion spark. For cold starting an engine and for
igniting weak mixtures the duration of the spark
is critical. Likewise the plug gap must be as large
as possible to allow easy access for the mixture
to prevent quenching of the flame.
The final choice is therefore a compromise
reached through testing and development of a
particular application. Plug gaps in the region of
0.6 to 1.2 mm seem to be the norm at present.
7.8 Diagnostic – ignitionsystems
7.8.1 Testing procedure
Warning
Caution/Achtung/Attention – high voltages can
seriously damage your health!
The following procedure is generic and with a
little adaptation can be applied to any ignition
system. Refer to manufacturer’s recommenda-tions if in any doubt.
116 Advanced automotive fault diagnosis
Figure 7.19 ‘Hot’ and ‘Cold’ spark plugs
Hand and eye checks (loose wires,loose switches and other obvious
faults) – all connections clean and tight
Check battery – must be 70% charged
No
No
Yes
Yes
Start
Ignition systems diagnostic chart
End
Check supply to ignitioncoil (within 0.5 V of battery)
If good spark thencheck HT system for
tracking and opencircuits
Spark from coilvia known good HT
lead (jumps about 10 mm,but do not try a greater
distance)?If no spark or it willonly jump a shortdistance continue
with this procedure(colour of sparkis not relevant)
Check plug condition(leads should be a
maximum resistanceof about 30 k/m)
Check continuityof coil windings
(primary 0.5 to 3ohms, secondaryseveral k ohms)
Supply and earthto ‘module’ (12 Vminimum supply,earth drop 0.5 V
maximum)
Check/replace plugsSupply to pulse
generator ifappropriate (5 or
10 to 12 V)
Replace pulsegenerator
Output of pulsegenerator (inductive about1 V AC when cranking, Hall
type switches 0 V to 8 VDC)?
Continuity of LTwires (0 to 0.1 ohm)
Replace ‘module’ butonly if all tests above
are satisfactory
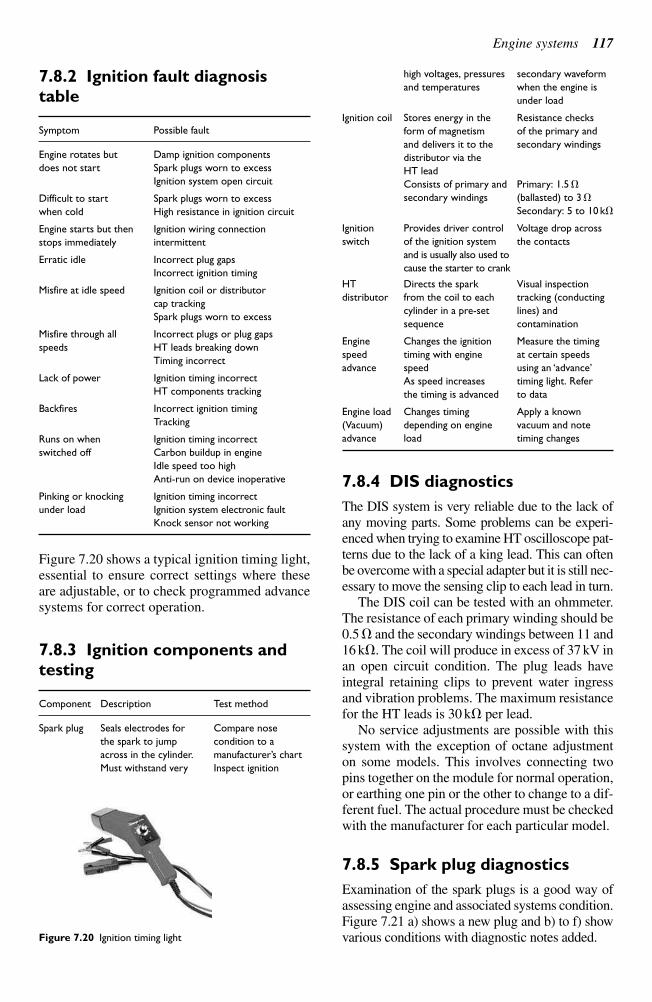
Engine systems 117
7.8.2 Ignition fault diagnosis
table
Symptom Possible fault
Engine rotates but Damp ignition components
does not start Spark plugs worn to excess
Ignition system open circuit
Difficult to start Spark plugs worn to excess
when cold High resistance in ignition circuit
Engine starts but then Ignition wiring connection
stops immediately intermittent
Erratic idle Incorrect plug gaps
Incorrect ignition timing
Misfire at idle speed Ignition coil or distributor
cap tracking
Spark plugs worn to excess
Misfire through all Incorrect plugs or plug gaps
speeds HT leads breaking down
Timing incorrect
Lack of power Ignition timing incorrect
HT components tracking
Backfires Incorrect ignition timing
Tracking
Runs on when Ignition timing incorrect
switched off Carbon buildup in engine
Idle speed too high
Anti-run on device inoperative
Pinking or knocking Ignition timing incorrect
under load Ignition system electronic fault
Knock sensor not working
Figure 7.20 shows a typical ignition timing light,
essential to ensure correct settings where these
are adjustable, or to check programmed advance
systems for correct operation.
7.8.3 Ignition components and
testing
Component Description Test method
Spark plug Seals electrodes for Compare nose
the spark to jump condition to a
across in the cylinder. manufacturer’s chart
Must withstand very Inspect ignition
high voltages, pressures secondary waveform
and temperatures when the engine is
under load
Ignition coil Stores energy in the Resistance checks
form of magnetism of the primary and
and delivers it to the secondary windings
distributor via the
HT lead
Consists of primary and Primary: 1.5
secondary windings (ballasted) to 3
Secondary: 5 to 10 k
Ignition Provides driver control Voltage drop across
switch of the ignition system the contacts
and is usually also used to
cause the starter to crank
HT Directs the spark Visual inspection
distributor from the coil to each tracking (conducting
cylinder in a pre-set lines) and
sequence contamination
Engine Changes the ignition Measure the timing
speed timing with engine at certain speeds
advance speed using an ‘advance’
As speed increases timing light. Refer
the timing is advanced to data
Engine load Changes timing Apply a known
(Vacuum) depending on engine vacuum and note
advance load timing changes
7.8.4 DIS diagnostics
The DIS system is very reliable due to the lack of
any moving parts. Some problems can be experi-
enced when trying to examine HT oscilloscope pat-
terns due to the lack of a king lead. This can often
be overcome with a special adapter but it is still nec-
essary to move the sensing clip to each lead in turn.
The DIS coil can be tested with an ohmmeter.
The resistance of each primary winding should be
0.5 and the secondary windings between 11 and
16 k. The coil will produce in excess of 37 kV in
an open circuit condition. The plug leads have
integral retaining clips to prevent water ingress
and vibration problems. The maximum resistance
for the HT leads is 30 k per lead.
No service adjustments are possible with this
system with the exception of octane adjustment
on some models. This involves connecting two
pins together on the module for normal operation,
or earthing one pin or the other to change to a dif-
ferent fuel. The actual procedure must be checked
with the manufacturer for each particular model.
7.8.5 Spark plug diagnostics
Examination of the spark plugs is a good way of
assessing engine and associated systems condition.
Figure 7.21 a) shows a new plug and b) to f) show
various conditions with diagnostic notes added.Figure 7.20 Ignition timing light
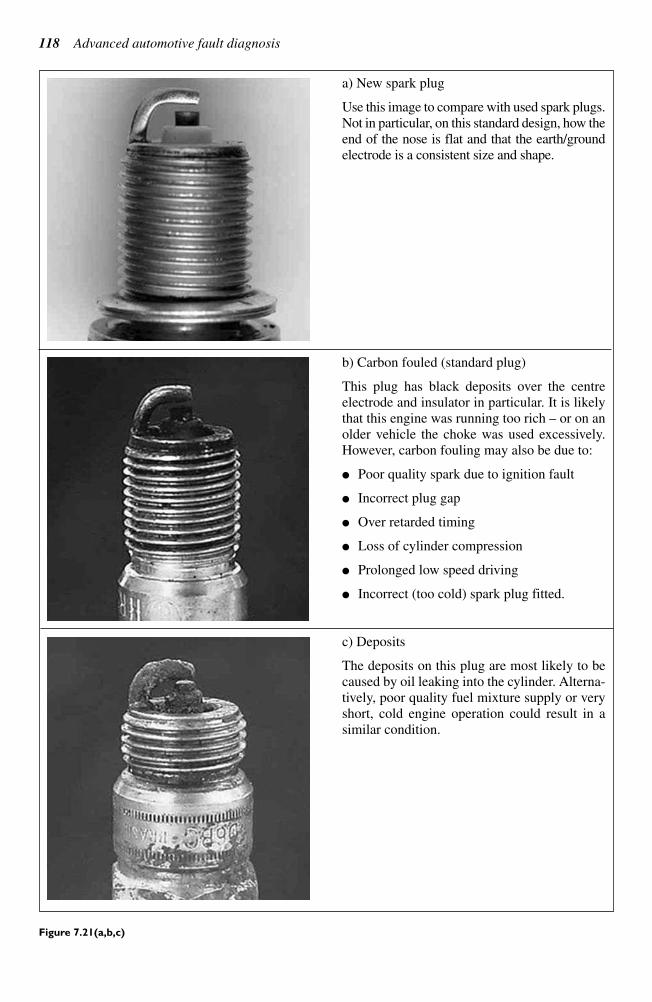
118 Advanced automotive fault diagnosis
a) New spark plug
Use this image to compare with used spark plugs.
Not in particular, on this standard design, how the
end of the nose is flat and that the earth/ground
electrode is a consistent size and shape.
b) Carbon fouled (standard plug)
This plug has black deposits over the centre
electrode and insulator in particular. It is likely
that this engine was running too rich – or on anolder vehicle the choke was used excessively.However, carbon fouling may also be due to:
Poor quality spark due to ignition fault
Incorrect plug gap
Over retarded timing
Loss of cylinder compression
Prolonged low speed driving
Incorrect (too cold) spark plug fitted.
c) Deposits
The deposits on this plug are most likely to becaused by oil leaking into the cylinder. Alterna-tively, poor quality fuel mixture supply or veryshort, cold engine operation could result in asimilar condition.
Figure 7.21(a,b,c)
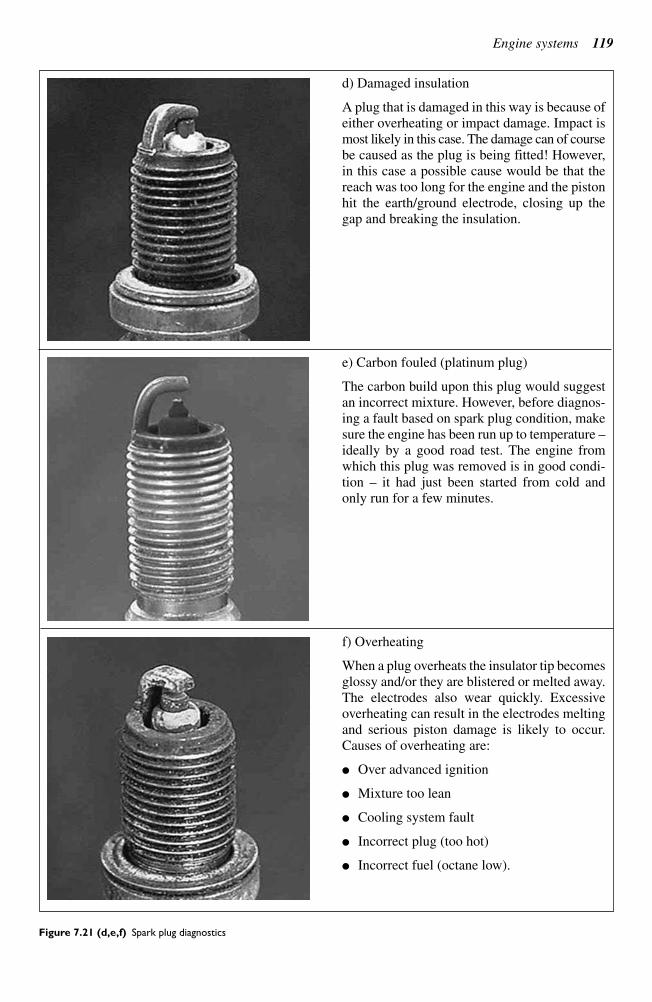
Engine systems 119
d) Damaged insulation
A plug that is damaged in this way is because of
either overheating or impact damage. Impact is
most likely in this case. The damage can of course
be caused as the plug is being fitted! However,
in this case a possible cause would be that the
reach was too long for the engine and the piston
hit the earth/ground electrode, closing up the
gap and breaking the insulation.
e) Carbon fouled (platinum plug)
The carbon build upon this plug would suggest
an incorrect mixture. However, before diagnos-
ing a fault based on spark plug condition, make
sure the engine has been run up to temperature –ideally by a good road test. The engine fromwhich this plug was removed is in good condi-tion – it had just been started from cold andonly run for a few minutes.
f) Overheating
When a plug overheats the insulator tip becomesglossy and/or they are blistered or melted away.The electrodes also wear quickly. Excessiveoverheating can result in the electrodes meltingand serious piston damage is likely to occur.Causes of overheating are:
Over advanced ignition
Mixture too lean
Cooling system fault
Incorrect plug (too hot)
Incorrect fuel (octane low).
Figure 7.21 (d,e,f) Spark plug diagnostics
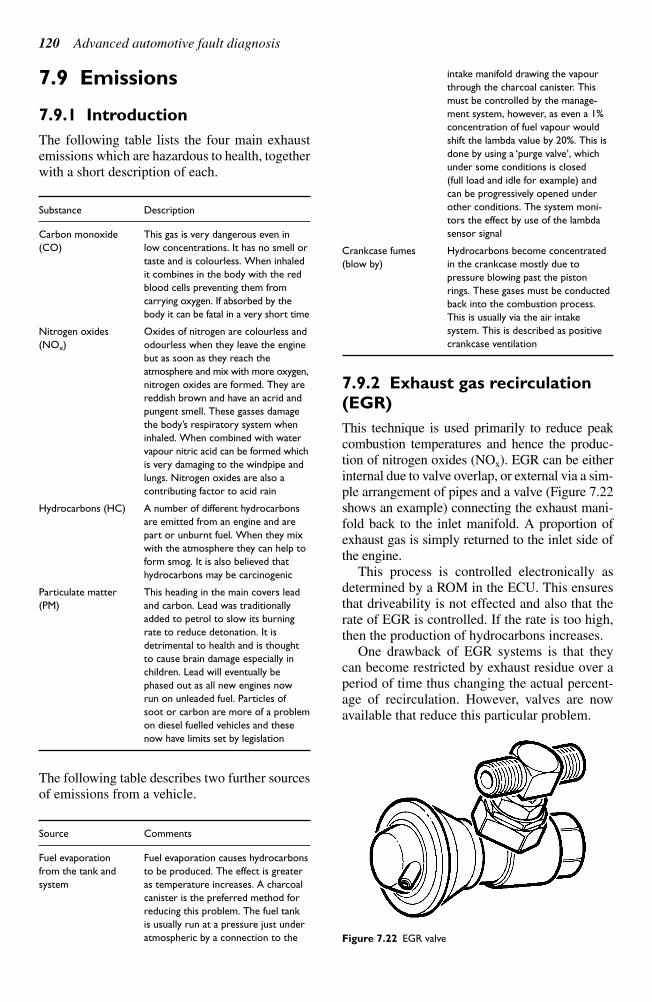
7.9 Emissions
7.9.1 Introduction
The following table lists the four main exhaust
emissions which are hazardous to health, together
with a short description of each.
Substance Description
Carbon monoxide This gas is very dangerous even in
(CO) low concentrations. It has no smell or
taste and is colourless. When inhaled
it combines in the body with the red
blood cells preventing them from
carrying oxygen. If absorbed by the
body it can be fatal in a very short time
Nitrogen oxides Oxides of nitrogen are colourless and
(NOx) odourless when they leave the engine
but as soon as they reach the
atmosphere and mix with more oxygen,
nitrogen oxides are formed. They are
reddish brown and have an acrid and
pungent smell. These gasses damage
the body’s respiratory system when
inhaled. When combined with water
vapour nitric acid can be formed which
is very damaging to the windpipe and
lungs. Nitrogen oxides are also a
contributing factor to acid rain
Hydrocarbons (HC) A number of different hydrocarbons
are emitted from an engine and are
part or unburnt fuel. When they mix
with the atmosphere they can help to
form smog. It is also believed that
hydrocarbons may be carcinogenic
Particulate matter This heading in the main covers lead
(PM) and carbon. Lead was traditionally
added to petrol to slow its burning
rate to reduce detonation. It is
detrimental to health and is thought
to cause brain damage especially in
children. Lead will eventually be
phased out as all new engines now
run on unleaded fuel. Particles of
soot or carbon are more of a problem
on diesel fuelled vehicles and these
now have limits set by legislation
The following table describes two further sources
of emissions from a vehicle.
Source Comments
Fuel evaporation Fuel evaporation causes hydrocarbons
from the tank and to be produced. The effect is greater
system as temperature increases. A charcoal
canister is the preferred method for
reducing this problem. The fuel tank
is usually run at a pressure just under
atmospheric by a connection to the
intake manifold drawing the vapour
through the charcoal canister. This
must be controlled by the manage-
ment system, however, as even a 1%
concentration of fuel vapour would
shift the lambda value by 20%. This is
done by using a ‘purge valve’, which
under some conditions is closed
(full load and idle for example) and
can be progressively opened under
other conditions. The system moni-
tors the effect by use of the lambda
sensor signal
Crankcase fumes Hydrocarbons become concentrated
(blow by) in the crankcase mostly due to
pressure blowing past the piston
rings. These gases must be conducted
back into the combustion process.
This is usually via the air intake
system. This is described as positive
crankcase ventilation
7.9.2 Exhaust gas recirculation
(EGR)
This technique is used primarily to reduce peak
combustion temperatures and hence the produc-
tion of nitrogen oxides (NOx). EGR can be either
internal due to valve overlap, or external via a sim-
ple arrangement of pipes and a valve (Figure 7.22
shows an example) connecting the exhaust mani-
fold back to the inlet manifold. A proportion of
exhaust gas is simply returned to the inlet side of
the engine.
This process is controlled electronically as
determined by a ROM in the ECU. This ensures
that driveability is not effected and also that the
rate of EGR is controlled. If the rate is too high,
then the production of hydrocarbons increases.
One drawback of EGR systems is that they
can become restricted by exhaust residue over a
period of time thus changing the actual percent-
age of recirculation. However, valves are now
available that reduce this particular problem.
120 Advanced automotive fault diagnosis
Figure 7.22 EGR valve
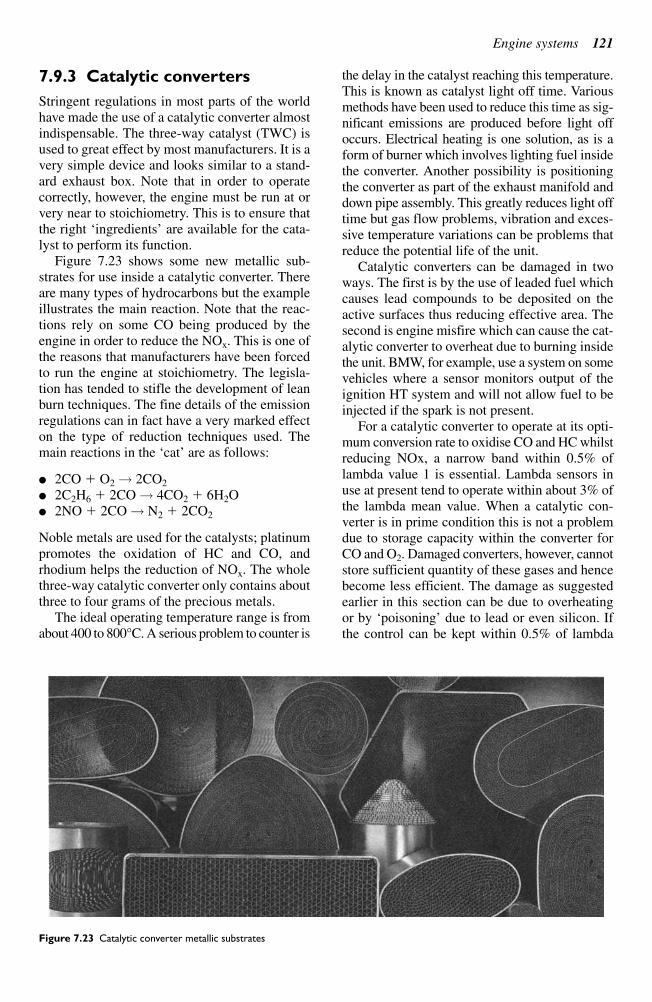
Engine systems 121
7.9.3 Catalytic converters
Stringent regulations in most parts of the world
have made the use of a catalytic converter almost
indispensable. The three-way catalyst (TWC) is
used to great effect by most manufacturers. It is a
very simple device and looks similar to a stand-
ard exhaust box. Note that in order to operate
correctly, however, the engine must be run at or
very near to stoichiometry. This is to ensure that
the right ‘ingredients’ are available for the cata-lyst to perform its function.
Figure 7.23 shows some new metallic sub-strates for use inside a catalytic converter. Thereare many types of hydrocarbons but the exampleillustrates the main reaction. Note that the reac-tions rely on some CO being produced by theengine in order to reduce the NOx. This is one ofthe reasons that manufacturers have been forcedto run the engine at stoichiometry. The legisla-tion has tended to stifle the development of leanburn techniques. The fine details of the emissionregulations can in fact have a very marked effecton the type of reduction techniques used. Themain reactions in the ‘cat’ are as follows:
2CO O2→ 2CO2
2C2H6 2CO→ 4CO2 6H2O 2NO 2CO→ N2 2CO2
Noble metals are used for the catalysts; platinumpromotes the oxidation of HC and CO, andrhodium helps the reduction of NOx. The wholethree-way catalytic converter only contains aboutthree to four grams of the precious metals.
The ideal operating temperature range is fromabout 400 to 800°C. A serious problem to counter is
the delay in the catalyst reaching this temperature.This is known as catalyst light off time. Variousmethods have been used to reduce this time as sig-nificant emissions are produced before light offoccurs. Electrical heating is one solution, as is aform of burner which involves lighting fuel insidethe converter. Another possibility is positioningthe converter as part of the exhaust manifold anddown pipe assembly. This greatly reduces light offtime but gas flow problems, vibration and exces-sive temperature variations can be problems thatreduce the potential life of the unit.
Catalytic converters can be damaged in twoways. The first is by the use of leaded fuel whichcauses lead compounds to be deposited on theactive surfaces thus reducing effective area. Thesecond is engine misfire which can cause the cat-alytic converter to overheat due to burning insidethe unit. BMW, for example, use a system on somevehicles where a sensor monitors output of theignition HT system and will not allow fuel to beinjected if the spark is not present.
For a catalytic converter to operate at its opti-mum conversion rate to oxidise CO and HC whilstreducing NOx, a narrow band within 0.5% oflambda value 1 is essential. Lambda sensors inuse at present tend to operate within about 3% ofthe lambda mean value. When a catalytic con-verter is in prime condition this is not a problemdue to storage capacity within the converter forCO and O2. Damaged converters, however, cannotstore sufficient quantity of these gases and hencebecome less efficient. The damage as suggestedearlier in this section can be due to overheatingor by ‘poisoning’ due to lead or even silicon. Ifthe control can be kept within 0.5% of lambda
Figure 7.23 Catalytic converter metallic substrates
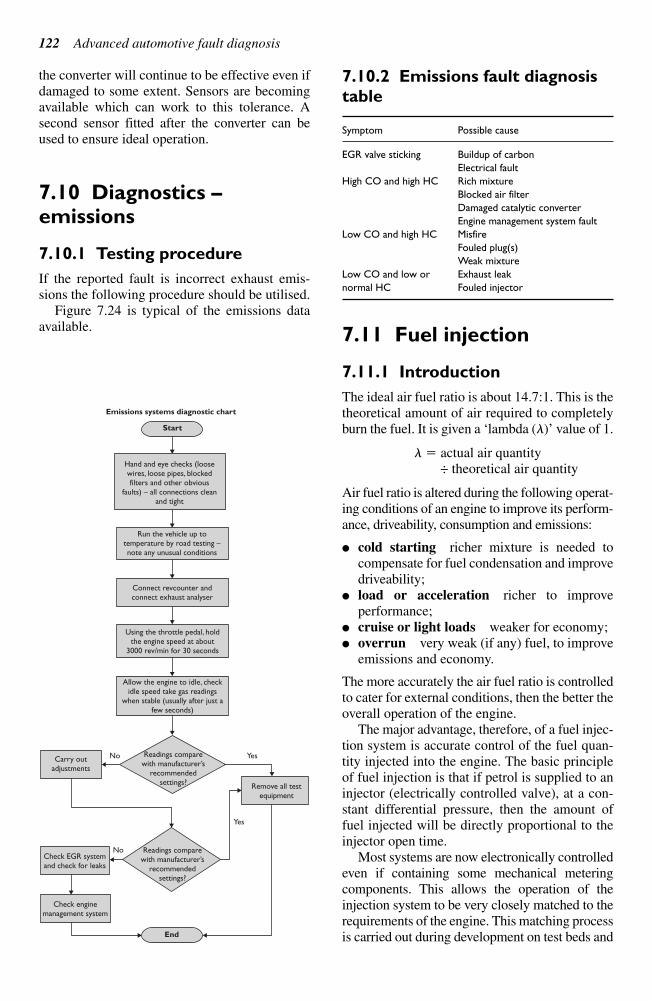
122 Advanced automotive fault diagnosis
the converter will continue to be effective even if
damaged to some extent. Sensors are becoming
available which can work to this tolerance. A
second sensor fitted after the converter can be
used to ensure ideal operation.
7.10 Diagnostics – emissions
7.10.1 Testing procedure
If the reported fault is incorrect exhaust emis-
sions the following procedure should be utilised.
Figure 7.24 is typical of the emissions data
available.
7.10.2 Emissions fault diagnosis
table
Symptom Possible cause
EGR valve sticking Buildup of carbon
Electrical fault
High CO and high HC Rich mixture
Blocked air filter
Damaged catalytic converter
Engine management system fault
Low CO and high HC Misfire
Fouled plug(s)
Weak mixture
Low CO and low or Exhaust leak
normal HC Fouled injector
7.11 Fuel injection
7.11.1 Introduction
The ideal air fuel ratio is about 14.7:1. This is the
theoretical amount of air required to completely
burn the fuel. It is given a ‘lambda (l)’ value of 1.
l actual air quantity÷ theoretical air quantity
Air fuel ratio is altered during the following operat-ing conditions of an engine to improve its perform-ance, driveability, consumption and emissions:
cold starting richer mixture is needed tocompensate for fuel condensation and improvedriveability;
load or acceleration richer to improve performance;
cruise or light loads weaker for economy; overrun very weak (if any) fuel, to improve
emissions and economy.
The more accurately the air fuel ratio is controlledto cater for external conditions, then the better theoverall operation of the engine.
The major advantage, therefore, of a fuel injec-tion system is accurate control of the fuel quan-tity injected into the engine. The basic principleof fuel injection is that if petrol is supplied to aninjector (electrically controlled valve), at a con-stant differential pressure, then the amount offuel injected will be directly proportional to theinjector open time.
Most systems are now electronically controlledeven if containing some mechanical meteringcomponents. This allows the operation of theinjection system to be very closely matched to therequirements of the engine. This matching processis carried out during development on test beds and
Hand and eye checks (loosewires, loose pipes, blockedfilters and other obvious
faults) – all connections cleanand tight
Run the vehicle up totemperature by road testing –note any unusual conditions
Connect revcounter andconnect exhaust analyser
Using the throttle pedal, holdthe engine speed at about
3000 rev/min for 30 seconds
Allow the engine to idle, checkidle speed take gas readings
when stable (usually after just afew seconds)
Readings comparewith manufacturer’s
recommendedsettings?
Carry outadjustments
No
No
Yes
Yes
End
Start
Emissions systems diagnostic chart
Remove all testequipment
Readings comparewith manufacturer’s
recommendedsettings?
Check EGR systemand check for leaks
Check enginemanagement system
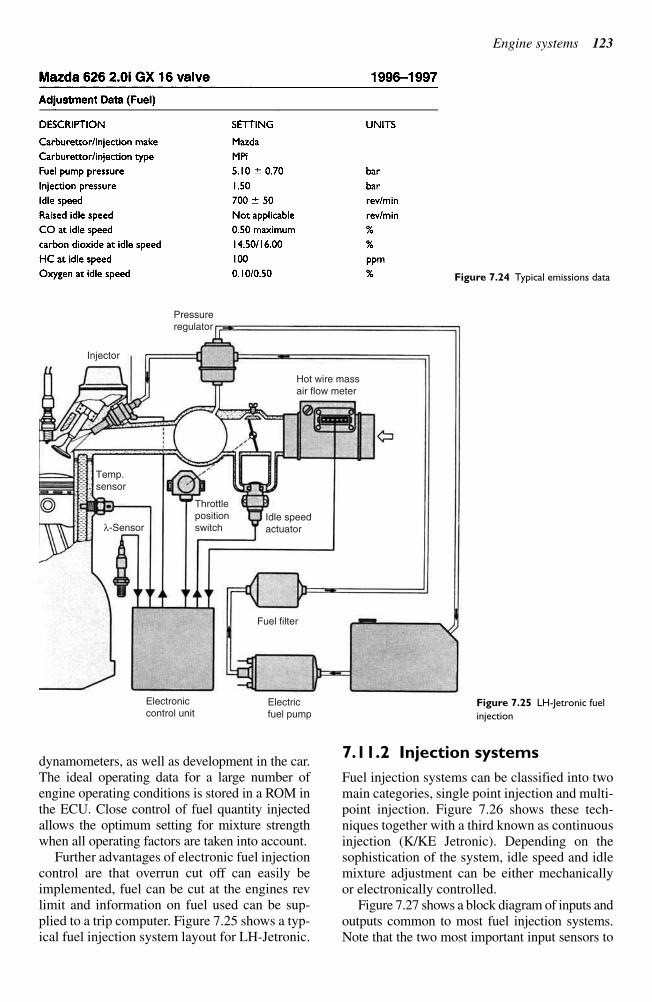
Engine systems 123
dynamometers, as well as development in the car.
The ideal operating data for a large number of
engine operating conditions is stored in a ROM in
the ECU. Close control of fuel quantity injected
allows the optimum setting for mixture strength
when all operating factors are taken into account.
Further advantages of electronic fuel injection
control are that overrun cut off can easily be
implemented, fuel can be cut at the engines rev
limit and information on fuel used can be sup-
plied to a trip computer. Figure 7.25 shows a typ-
ical fuel injection system layout for LH-Jetronic.
7.11.2 Injection systems
Fuel injection systems can be classified into two
main categories, single point injection and multi-
point injection. Figure 7.26 shows these tech-
niques together with a third known as continuous
injection (K/KE Jetronic). Depending on the
sophistication of the system, idle speed and idle
mixture adjustment can be either mechanically
or electronically controlled.
Figure 7.27 shows a block diagram of inputs and
outputs common to most fuel injection systems.
Note that the two most important input sensors to
Figure 7.24 Typical emissions data
Pressure
regulator
Injector
Hot wire mass
air flow meter
Idle speed
actuator
Fuel filter
Electric
fuel pump
Electronic
control unit
Throttle
position
switchλ-Sensor
Temp.
sensor
Figure 7.25 LH-Jetronic fuel
injection
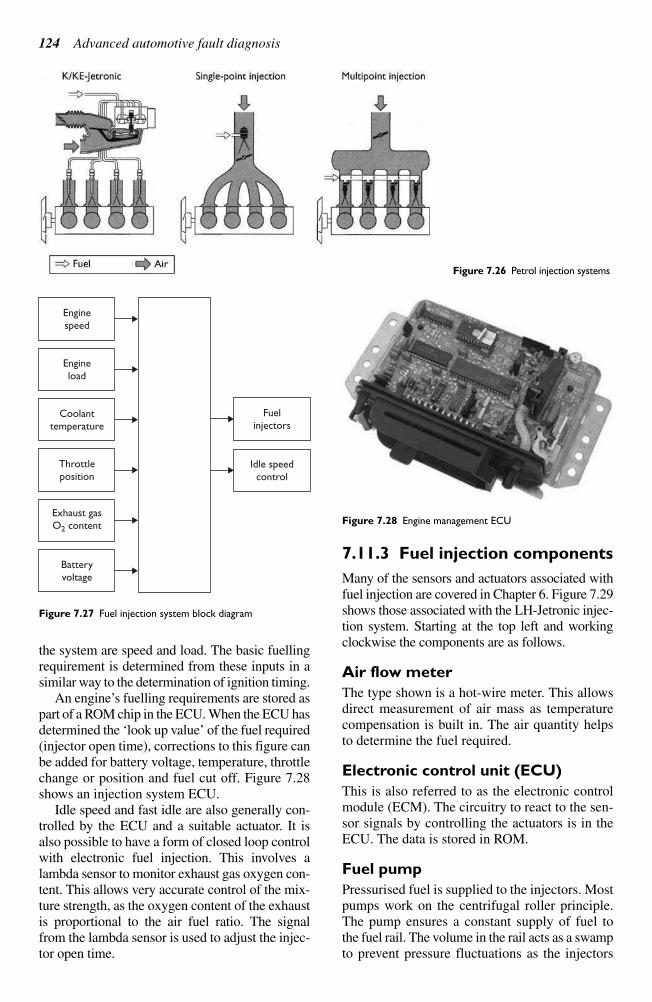
124 Advanced automotive fault diagnosis
the system are speed and load. The basic fuelling
requirement is determined from these inputs in a
similar way to the determination of ignition timing.
An engine’s fuelling requirements are stored aspart of a ROM chip in the ECU. When the ECU hasdetermined the ‘look up value’ of the fuel required(injector open time), corrections to this figure canbe added for battery voltage, temperature, throttlechange or position and fuel cut off. Figure 7.28shows an injection system ECU.
Idle speed and fast idle are also generally con-trolled by the ECU and a suitable actuator. It isalso possible to have a form of closed loop controlwith electronic fuel injection. This involves alambda sensor to monitor exhaust gas oxygen con-tent. This allows very accurate control of the mix-ture strength, as the oxygen content of the exhaustis proportional to the air fuel ratio. The signalfrom the lambda sensor is used to adjust the injec-tor open time.
7.11.3 Fuel injection components
Many of the sensors and actuators associated withfuel injection are covered in Chapter 6. Figure 7.29shows those associated with the LH-Jetronic injec-tion system. Starting at the top left and workingclockwise the components are as follows.
Air flow meter
The type shown is a hot-wire meter. This allowsdirect measurement of air mass as temperaturecompensation is built in. The air quantity helpsto determine the fuel required.
Electronic control unit (ECU)
This is also referred to as the electronic controlmodule (ECM). The circuitry to react to the sen-sor signals by controlling the actuators is in theECU. The data is stored in ROM.
Fuel pump
Pressurised fuel is supplied to the injectors. Mostpumps work on the centrifugal roller principle.The pump ensures a constant supply of fuel tothe fuel rail. The volume in the rail acts as a swampto prevent pressure fluctuations as the injectors
Figure 7.26 Petrol injection systems
Enginespeed
Engineload
Coolanttemperature
Fuelinjectors
Idle speedcontrol
Throttleposition
Batteryvoltage
Exhaust gasO2 content
Figure 7.27 Fuel injection system block diagram
Figure 7.28 Engine management ECU
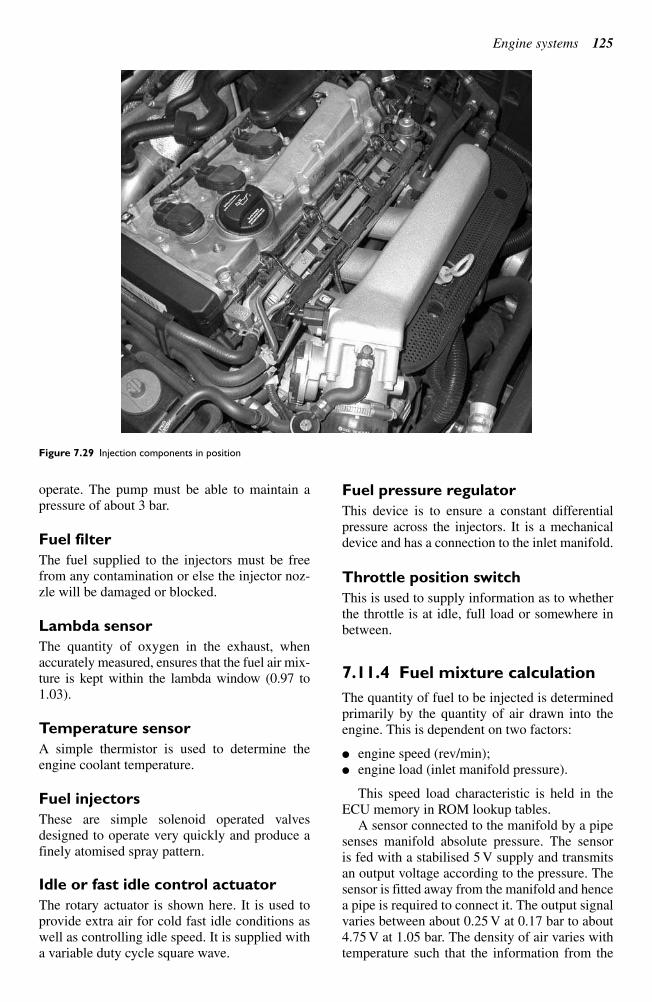
Engine systems 125
operate. The pump must be able to maintain a
pressure of about 3 bar.
Fuel filter
The fuel supplied to the injectors must be free
from any contamination or else the injector noz-
zle will be damaged or blocked.
Lambda sensor
The quantity of oxygen in the exhaust, when
accurately measured, ensures that the fuel air mix-
ture is kept within the lambda window (0.97 to
1.03).
Temperature sensor
A simple thermistor is used to determine the
engine coolant temperature.
Fuel injectors
These are simple solenoid operated valves
designed to operate very quickly and produce a
finely atomised spray pattern.
Idle or fast idle control actuator
The rotary actuator is shown here. It is used to
provide extra air for cold fast idle conditions as
well as controlling idle speed. It is supplied with
a variable duty cycle square wave.
Fuel pressure regulator
This device is to ensure a constant differential
pressure across the injectors. It is a mechanical
device and has a connection to the inlet manifold.
Throttle position switch
This is used to supply information as to whether
the throttle is at idle, full load or somewhere in
between.
7.11.4 Fuel mixture calculation
The quantity of fuel to be injected is determined
primarily by the quantity of air drawn into the
engine. This is dependent on two factors:
engine speed (rev/min);
engine load (inlet manifold pressure).
This speed load characteristic is held in the
ECU memory in ROM lookup tables.
A sensor connected to the manifold by a pipe
senses manifold absolute pressure. The sensor
is fed with a stabilised 5 V supply and transmits
an output voltage according to the pressure. The
sensor is fitted away from the manifold and hence
a pipe is required to connect it. The output signal
varies between about 0.25 V at 0.17 bar to about
4.75 V at 1.05 bar. The density of air varies with
temperature such that the information from the
Figure 7.29 Injection components in position
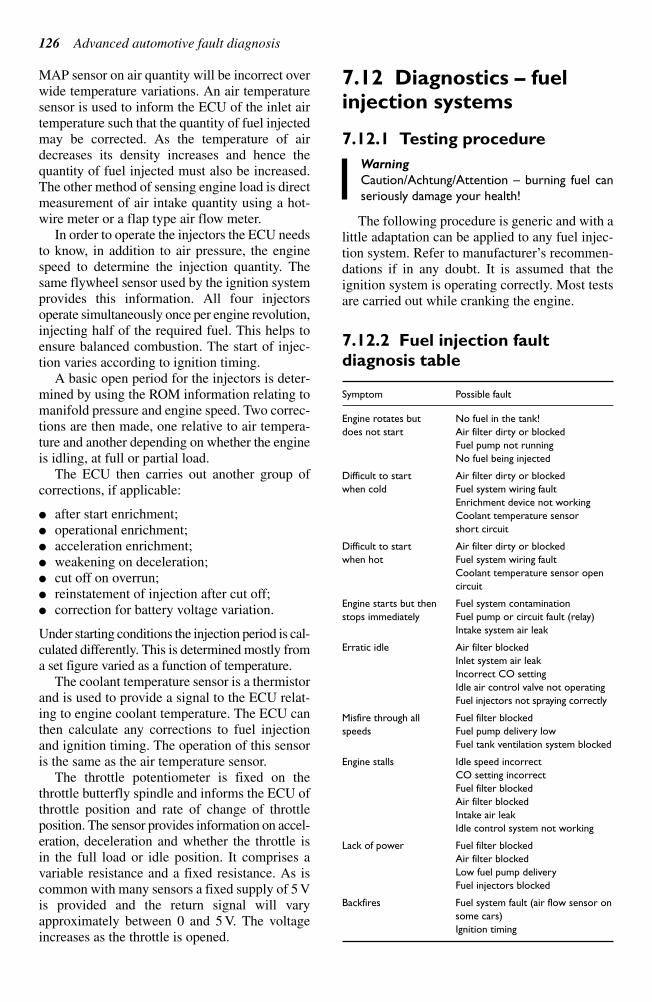
126 Advanced automotive fault diagnosis
MAP sensor on air quantity will be incorrect over
wide temperature variations. An air temperature
sensor is used to inform the ECU of the inlet air
temperature such that the quantity of fuel injected
may be corrected. As the temperature of air
decreases its density increases and hence the
quantity of fuel injected must also be increased.
The other method of sensing engine load is direct
measurement of air intake quantity using a hot-
wire meter or a flap type air flow meter.
In order to operate the injectors the ECU needs
to know, in addition to air pressure, the engine
speed to determine the injection quantity. The
same flywheel sensor used by the ignition system
provides this information. All four injectors
operate simultaneously once per engine revolution,
injecting half of the required fuel. This helps to
ensure balanced combustion. The start of injec-
tion varies according to ignition timing.
A basic open period for the injectors is deter-
mined by using the ROM information relating to
manifold pressure and engine speed. Two correc-
tions are then made, one relative to air tempera-
ture and another depending on whether the engine
is idling, at full or partial load.
The ECU then carries out another group of
corrections, if applicable:
after start enrichment;
operational enrichment;
acceleration enrichment;
weakening on deceleration;
cut off on overrun;
reinstatement of injection after cut off;
correction for battery voltage variation.
Under starting conditions the injection period is cal-
culated differently. This is determined mostly from
a set figure varied as a function of temperature.
The coolant temperature sensor is a thermistor
and is used to provide a signal to the ECU relat-
ing to engine coolant temperature. The ECU can
then calculate any corrections to fuel injection
and ignition timing. The operation of this sensor
is the same as the air temperature sensor.
The throttle potentiometer is fixed on the
throttle butterfly spindle and informs the ECU of
throttle position and rate of change of throttle
position. The sensor provides information on accel-
eration, deceleration and whether the throttle is
in the full load or idle position. It comprises a
variable resistance and a fixed resistance. As is
common with many sensors a fixed supply of 5 V
is provided and the return signal will vary
approximately between 0 and 5 V. The voltage
increases as the throttle is opened.
7.12 Diagnostics – fuelinjection systems
7.12.1 Testing procedure
Warning
Caution/Achtung/Attention – burning fuel can
seriously damage your health!
The following procedure is generic and with a
little adaptation can be applied to any fuel injec-
tion system. Refer to manufacturer’s recommen-dations if in any doubt. It is assumed that theignition system is operating correctly. Most testsare carried out while cranking the engine.
7.12.2 Fuel injection fault
diagnosis table
Symptom Possible fault
Engine rotates but No fuel in the tank!
does not start Air filter dirty or blocked
Fuel pump not running
No fuel being injected
Difficult to start Air filter dirty or blocked
when cold Fuel system wiring fault
Enrichment device not working
Coolant temperature sensor
short circuit
Difficult to start Air filter dirty or blocked
when hot Fuel system wiring fault
Coolant temperature sensor open
circuit
Engine starts but then Fuel system contamination
stops immediately Fuel pump or circuit fault (relay)
Intake system air leak
Erratic idle Air filter blocked
Inlet system air leak
Incorrect CO setting
Idle air control valve not operating
Fuel injectors not spraying correctly
Misfire through all Fuel filter blocked
speeds Fuel pump delivery low
Fuel tank ventilation system blocked
Engine stalls Idle speed incorrect
CO setting incorrect
Fuel filter blocked
Air filter blocked
Intake air leak
Idle control system not working
Lack of power Fuel filter blocked
Air filter blocked
Low fuel pump delivery
Fuel injectors blocked
Backfires Fuel system fault (air flow sensor on
some cars)
Ignition timing
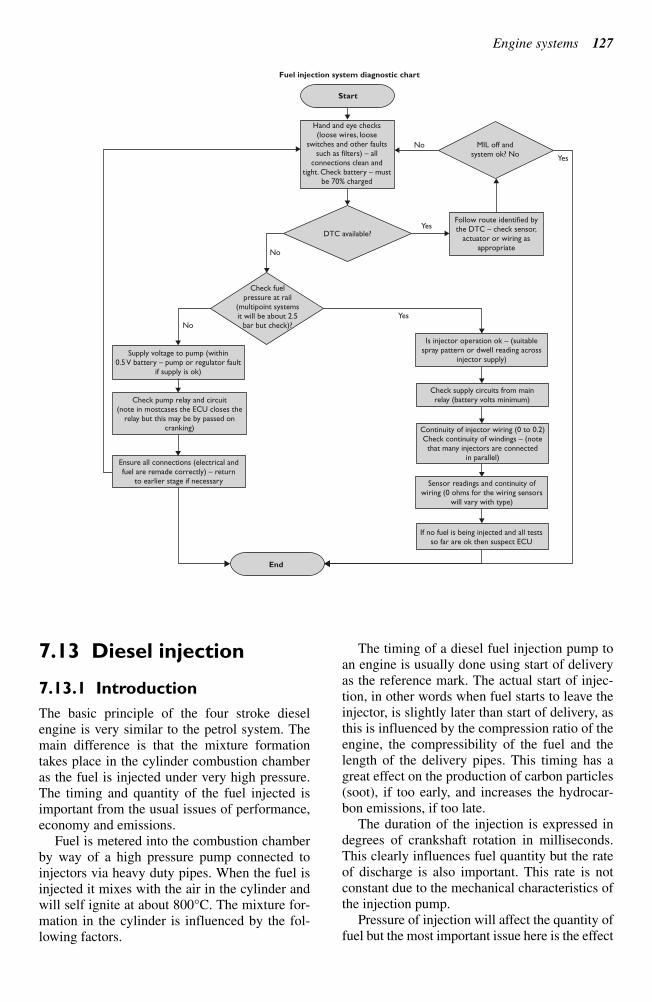
7.13 Diesel injection
7.13.1 Introduction
The basic principle of the four stroke diesel
engine is very similar to the petrol system. The
main difference is that the mixture formation
takes place in the cylinder combustion chamber
as the fuel is injected under very high pressure.
The timing and quantity of the fuel injected is
important from the usual issues of performance,
economy and emissions.
Fuel is metered into the combustion chamber
by way of a high pressure pump connected to
injectors via heavy duty pipes. When the fuel is
injected it mixes with the air in the cylinder and
will self ignite at about 800°C. The mixture for-
mation in the cylinder is influenced by the fol-
lowing factors.
The timing of a diesel fuel injection pump to
an engine is usually done using start of delivery
as the reference mark. The actual start of injec-
tion, in other words when fuel starts to leave the
injector, is slightly later than start of delivery, as
this is influenced by the compression ratio of the
engine, the compressibility of the fuel and the
length of the delivery pipes. This timing has a
great effect on the production of carbon particles
(soot), if too early, and increases the hydrocar-
bon emissions, if too late.
The duration of the injection is expressed in
degrees of crankshaft rotation in milliseconds.
This clearly influences fuel quantity but the rate
of discharge is also important. This rate is not
constant due to the mechanical characteristics of
the injection pump.
Pressure of injection will affect the quantity of
fuel but the most important issue here is the effect
Engine systems 127
Hand and eye checks(loose wires, loose
switches and other faultssuch as filters) – all
connections clean andtight. Check battery – must
be 70% charged
MIL off andsystem ok? No
DTC available?
Yes
Yes
Yes
No
No
No
Start
Fuel injection system diagnostic chart
End
Follow route identified bythe DTC – check sensor,
actuator or wiring asappropriate
Check fuelpressure at rail
(multipoint systemsit will be about 2.5
bar but check)?
Is injector operation ok – (suitablespray pattern or dwell reading across
injector supply)Supply voltage to pump (within
0.5 V battery – pump or regulator faultif supply is ok)
Check supply circuits from mainrelay (battery volts minimum)Check pump relay and circuit
(note in mostcases the ECU closes therelay but this may be by passed on
cranking)
Ensure all connections (electrical andfuel are remade correctly) – return
to earlier stage if necessary
Continuity of injector wiring (0 to 0.2)Check continuity of windings – (note
that many injectors are connectedin parallel)
Sensor readings and continuity ofwiring (0 ohms for the wiring sensors
will vary with type)
If no fuel is being injected and all testsso far are ok then suspect ECU
128 Advanced automotive fault diagnosis
on atomisation. At higher pressures the fuel will
atomise into smaller droplets with a correspon-
ding improvement in the burn quality. Indirect
injection systems use pressures up to about 350
bar and direct injection systems can be up to about
1000 bar. Emissions of soot are greatly reduced by
higher pressure injection.
The direction of injection must match very
closely the swirl and combustion chamber design.
Deviations of only 2° from the ideal can greatly
increase particulate emissions.
Diesel engines do not in general use a throttle
butterfly as the throttle acts directly on the injec-
tion pump to control fuel quantity. At low speeds
in particular the very high excess air factor ensures
complete burning and very low emissions. Diesel
engines operate where possible with an excess air
factor even at high speeds.
Figure 7.30 shows a typical diesel fuel injec-
tion pump. Detailed operation of the components
is beyond the scope of this book. The principles
and problems are the issues under consideration,
in particular the way electronics can be employed
to solve some of the problems.
7.13.2 Electronic control of
diesel injection
The advent of electronic control over the diesel
injection pump has allowed many advances over
the purely mechanical system. The production
of high pressure and injection is, however, still
mechanical with all current systems. The following
advantages are apparent over the non-electronic
control system:
more precise control of fuel quantity injected;
better control of start of injection;
idle speed control;
control of exhaust gas recirculation;
drive by wire system (potentiometer on throt-
tle pedal);
an anti-surge function;
output to data acquisition systems, etc.;
temperature compensation;
cruise control.
Because fuel must be injected at high pressure
the hydraulic head, pressure pump and drive elem-
ents are still used. An electromagnetic moving
iron actuator adjusts the position of the control
collar, which in turn controls the delivery stroke
and therefore the injected quantity of fuel. Fuel
pressure is applied to a roller ring and this con-
trols the start of injection. A solenoid operated
valve controls the supply to the roller ring. These
actuators together allow control of start of injec-
tion and injection quantity.
Ideal values for fuel quantity and timing are
stored in memory maps in the ECU. The injected
fuel quantity is calculated from the accelerator
position and the engine speed. Start of injection
is determined from the following:
fuel quantity;
engine speed;
Figure 7.30 Bosch VR Pump (Source: Bosch Press)
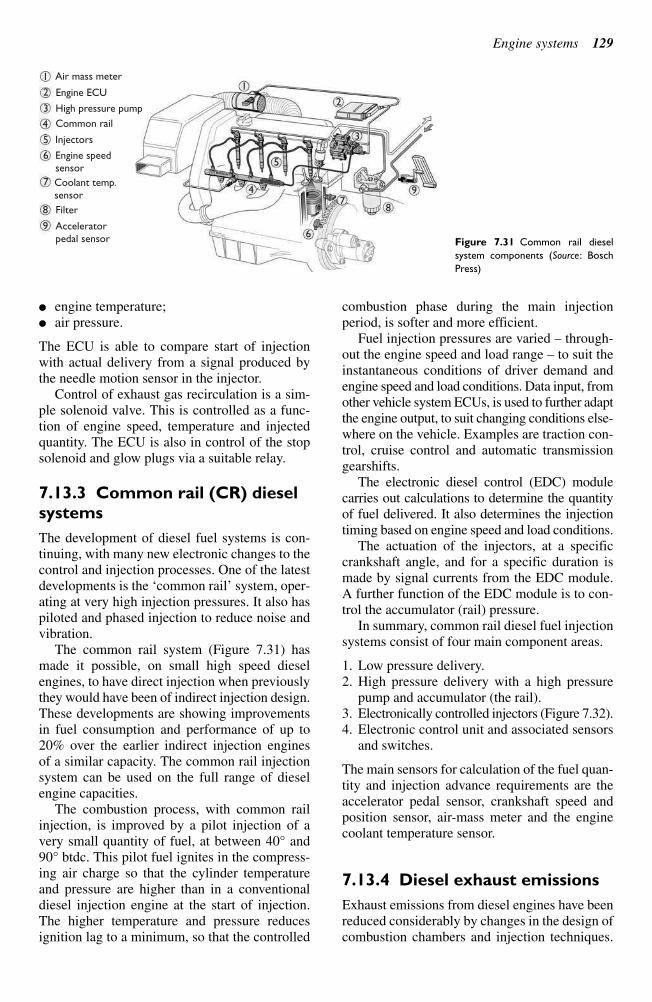
Engine systems 129
engine temperature;
air pressure.
The ECU is able to compare start of injection
with actual delivery from a signal produced by
the needle motion sensor in the injector.
Control of exhaust gas recirculation is a sim-
ple solenoid valve. This is controlled as a func-
tion of engine speed, temperature and injected
quantity. The ECU is also in control of the stop
solenoid and glow plugs via a suitable relay.
7.13.3 Common rail (CR) diesel
systems
The development of diesel fuel systems is con-
tinuing, with many new electronic changes to the
control and injection processes. One of the latest
developments is the ‘common rail’ system, oper-ating at very high injection pressures. It also haspiloted and phased injection to reduce noise andvibration.
The common rail system (Figure 7.31) hasmade it possible, on small high speed dieselengines, to have direct injection when previouslythey would have been of indirect injection design.These developments are showing improvementsin fuel consumption and performance of up to20% over the earlier indirect injection engines of a similar capacity. The common rail injectionsystem can be used on the full range of dieselengine capacities.
The combustion process, with common railinjection, is improved by a pilot injection of avery small quantity of fuel, at between 40° and90° btdc. This pilot fuel ignites in the compress-ing air charge so that the cylinder temperatureand pressure are higher than in a conventionaldiesel injection engine at the start of injection.The higher temperature and pressure reducesignition lag to a minimum, so that the controlled
combustion phase during the main injectionperiod, is softer and more efficient.
Fuel injection pressures are varied – through-out the engine speed and load range – to suit theinstantaneous conditions of driver demand andengine speed and load conditions. Data input, fromother vehicle system ECUs, is used to further adaptthe engine output, to suit changing conditions else-where on the vehicle. Examples are traction con-trol, cruise control and automatic transmissiongearshifts.
The electronic diesel control (EDC) modulecarries out calculations to determine the quantityof fuel delivered. It also determines the injectiontiming based on engine speed and load conditions.
The actuation of the injectors, at a specificcrankshaft angle, and for a specific duration ismade by signal currents from the EDC module.A further function of the EDC module is to con-trol the accumulator (rail) pressure.
In summary, common rail diesel fuel injectionsystems consist of four main component areas.
1. Low pressure delivery.2. High pressure delivery with a high pressure
pump and accumulator (the rail).3. Electronically controlled injectors (Figure 7.32).4. Electronic control unit and associated sensors
and switches.
The main sensors for calculation of the fuel quan-tity and injection advance requirements are theaccelerator pedal sensor, crankshaft speed andposition sensor, air-mass meter and the enginecoolant temperature sensor.
7.13.4 Diesel exhaust emissions
Exhaust emissions from diesel engines have beenreduced considerably by changes in the design ofcombustion chambers and injection techniques.
1 Air mass meter
Engine ECU
High pressure pump
Common rail
Injectors
Engine speedsensor
Coolant temp.sensor
Filter
Acceleratorpedal sensor
2
3
4
5
6
7
8
9
1
5
6
78
9
3
2BO
SCH
4
BOSCH
Figure 7.31 Common rail diesel
system components (Source: Bosch
Press)
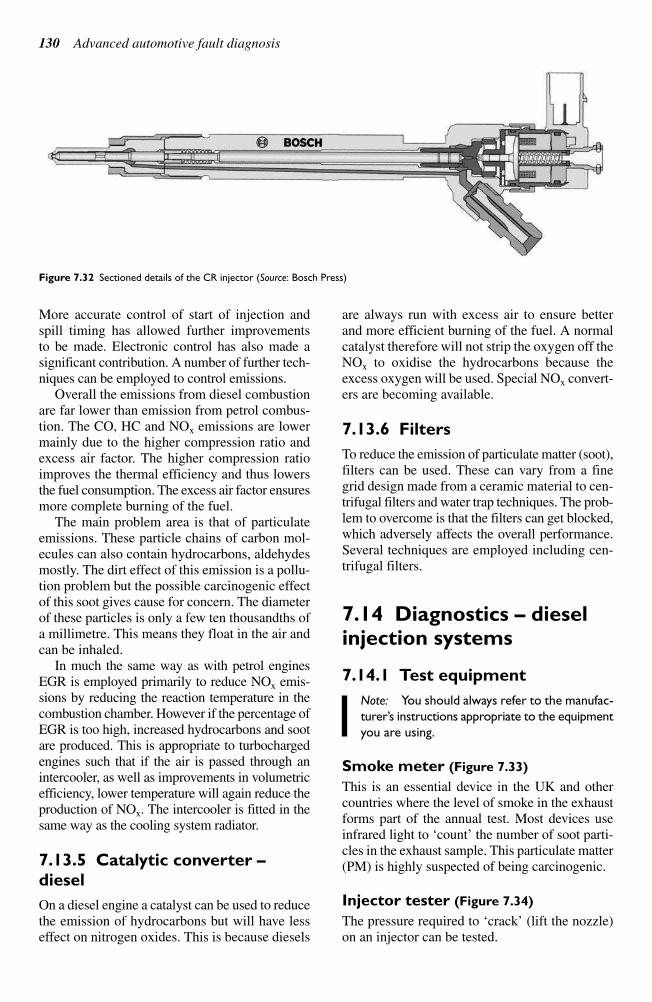
130 Advanced automotive fault diagnosis
More accurate control of start of injection and
spill timing has allowed further improvements
to be made. Electronic control has also made a
significant contribution. A number of further tech-
niques can be employed to control emissions.
Overall the emissions from diesel combustion
are far lower than emission from petrol combus-
tion. The CO, HC and NOx emissions are lower
mainly due to the higher compression ratio and
excess air factor. The higher compression ratio
improves the thermal efficiency and thus lowers
the fuel consumption. The excess air factor ensures
more complete burning of the fuel.
The main problem area is that of particulate
emissions. These particle chains of carbon mol-
ecules can also contain hydrocarbons, aldehydes
mostly. The dirt effect of this emission is a pollu-
tion problem but the possible carcinogenic effect
of this soot gives cause for concern. The diameter
of these particles is only a few ten thousandths of
a millimetre. This means they float in the air and
can be inhaled.
In much the same way as with petrol engines
EGR is employed primarily to reduce NOx emis-
sions by reducing the reaction temperature in the
combustion chamber. However if the percentage of
EGR is too high, increased hydrocarbons and soot
are produced. This is appropriate to turbocharged
engines such that if the air is passed through an
intercooler, as well as improvements in volumetric
efficiency, lower temperature will again reduce the
production of NOx. The intercooler is fitted in the
same way as the cooling system radiator.
7.13.5 Catalytic converter –
diesel
On a diesel engine a catalyst can be used to reduce
the emission of hydrocarbons but will have less
effect on nitrogen oxides. This is because diesels
are always run with excess air to ensure better
and more efficient burning of the fuel. A normal
catalyst therefore will not strip the oxygen off the
NOx to oxidise the hydrocarbons because the
excess oxygen will be used. Special NOx convert-
ers are becoming available.
7.13.6 Filters
To reduce the emission of particulate matter (soot),
filters can be used. These can vary from a fine
grid design made from a ceramic material to cen-
trifugal filters and water trap techniques. The prob-
lem to overcome is that the filters can get blocked,
which adversely affects the overall performance.
Several techniques are employed including cen-
trifugal filters.
7.14 Diagnostics – dieselinjection systems
7.14.1 Test equipment
Note: You should always refer to the manufac-
turer’s instructions appropriate to the equipment
you are using.
Smoke meter (Figure 7.33)
This is an essential device in the UK and other
countries where the level of smoke in the exhaust
forms part of the annual test. Most devices use
infrared light to ‘count’ the number of soot parti-cles in the exhaust sample. This particulate matter(PM) is highly suspected of being carcinogenic.
Injector tester (Figure 7.34)
The pressure required to ‘crack’ (lift the nozzle)on an injector can be tested.
Figure 7.32 Sectioned details of the CR injector (Source: Bosch Press)
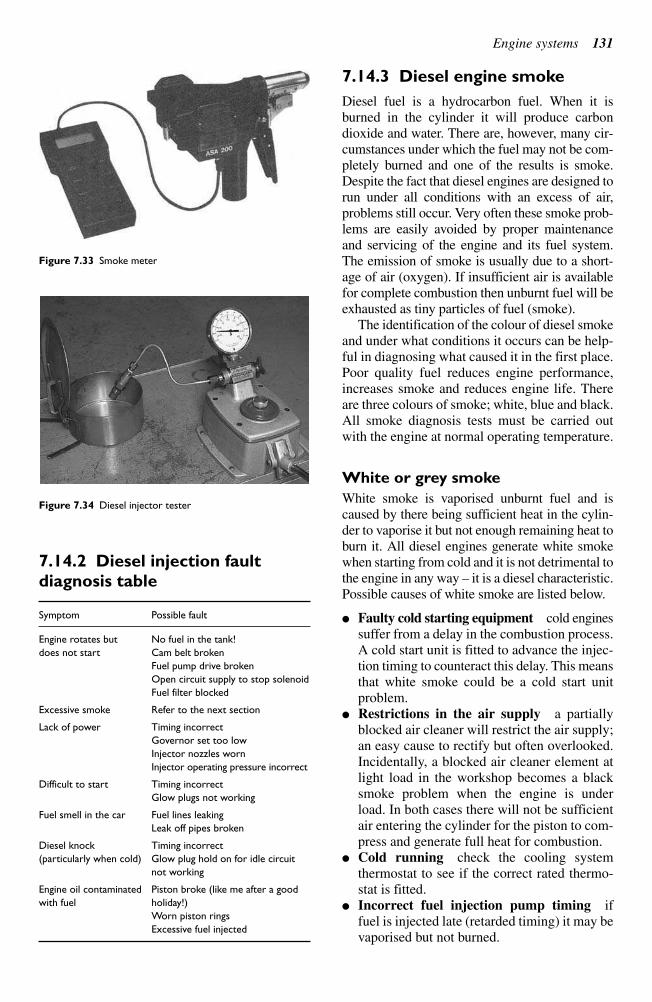
7.14.2 Diesel injection fault
diagnosis table
Symptom Possible fault
Engine rotates but No fuel in the tank!
does not start Cam belt broken
Fuel pump drive broken
Open circuit supply to stop solenoid
Fuel filter blocked
Excessive smoke Refer to the next section
Lack of power Timing incorrect
Governor set too low
Injector nozzles worn
Injector operating pressure incorrect
Difficult to start Timing incorrect
Glow plugs not working
Fuel smell in the car Fuel lines leaking
Leak off pipes broken
Diesel knock Timing incorrect
(particularly when cold) Glow plug hold on for idle circuit
not working
Engine oil contaminated Piston broke (like me after a good
with fuel holiday!)
Worn piston rings
Excessive fuel injected
7.14.3 Diesel engine smoke
Diesel fuel is a hydrocarbon fuel. When it is
burned in the cylinder it will produce carbon
dioxide and water. There are, however, many cir-
cumstances under which the fuel may not be com-
pletely burned and one of the results is smoke.
Despite the fact that diesel engines are designed to
run under all conditions with an excess of air,
problems still occur. Very often these smoke prob-
lems are easily avoided by proper maintenance
and servicing of the engine and its fuel system.
The emission of smoke is usually due to a short-
age of air (oxygen). If insufficient air is available
for complete combustion then unburnt fuel will be
exhausted as tiny particles of fuel (smoke).
The identification of the colour of diesel smoke
and under what conditions it occurs can be help-
ful in diagnosing what caused it in the first place.
Poor quality fuel reduces engine performance,
increases smoke and reduces engine life. There
are three colours of smoke; white, blue and black.
All smoke diagnosis tests must be carried out
with the engine at normal operating temperature.
White or grey smoke
White smoke is vaporised unburnt fuel and is
caused by there being sufficient heat in the cylin-
der to vaporise it but not enough remaining heat to
burn it. All diesel engines generate white smoke
when starting from cold and it is not detrimental to
the engine in any way – it is a diesel characteristic.Possible causes of white smoke are listed below.
Faulty cold starting equipment cold enginessuffer from a delay in the combustion process.A cold start unit is fitted to advance the injec-tion timing to counteract this delay. This meansthat white smoke could be a cold start unitproblem.
Restrictions in the air supply a partiallyblocked air cleaner will restrict the air supply;an easy cause to rectify but often overlooked.Incidentally, a blocked air cleaner element atlight load in the workshop becomes a blacksmoke problem when the engine is underload. In both cases there will not be sufficientair entering the cylinder for the piston to com-press and generate full heat for combustion.
Cold running check the cooling systemthermostat to see if the correct rated thermo-stat is fitted.
Incorrect fuel injection pump timing iffuel is injected late (retarded timing) it may bevaporised but not burned.
Engine systems 131
Figure 7.33 Smoke meter
Figure 7.34 Diesel injector tester
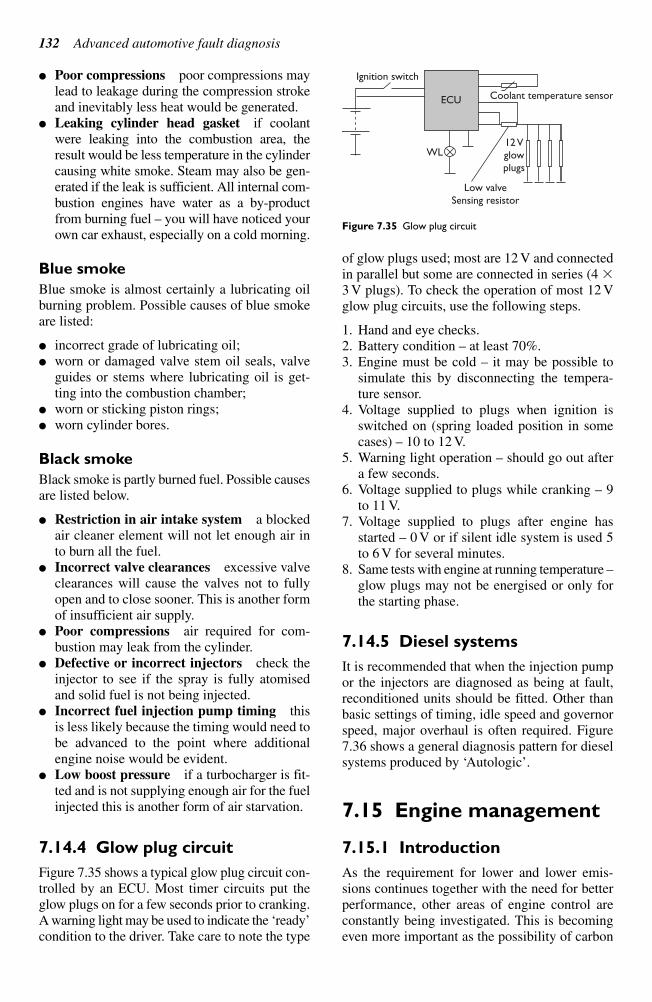
132 Advanced automotive fault diagnosis
Poor compressions poor compressions may
lead to leakage during the compression stroke
and inevitably less heat would be generated.
Leaking cylinder head gasket if coolant
were leaking into the combustion area, the
result would be less temperature in the cylinder
causing white smoke. Steam may also be gen-
erated if the leak is sufficient. All internal com-
bustion engines have water as a by-product
from burning fuel – you will have noticed yourown car exhaust, especially on a cold morning.
Blue smoke
Blue smoke is almost certainly a lubricating oilburning problem. Possible causes of blue smokeare listed:
incorrect grade of lubricating oil; worn or damaged valve stem oil seals, valve
guides or stems where lubricating oil is get-ting into the combustion chamber;
worn or sticking piston rings; worn cylinder bores.
Black smoke
Black smoke is partly burned fuel. Possible causesare listed below.
Restriction in air intake system a blockedair cleaner element will not let enough air into burn all the fuel.
Incorrect valve clearances excessive valveclearances will cause the valves not to fullyopen and to close sooner. This is another formof insufficient air supply.
Poor compressions air required for com-bustion may leak from the cylinder.
Defective or incorrect injectors check theinjector to see if the spray is fully atomisedand solid fuel is not being injected.
Incorrect fuel injection pump timing thisis less likely because the timing would need tobe advanced to the point where additionalengine noise would be evident.
Low boost pressure if a turbocharger is fit-ted and is not supplying enough air for the fuelinjected this is another form of air starvation.
7.14.4 Glow plug circuit
Figure 7.35 shows a typical glow plug circuit con-trolled by an ECU. Most timer circuits put theglow plugs on for a few seconds prior to cranking.A warning light may be used to indicate the ‘ready’condition to the driver. Take care to note the type
of glow plugs used; most are 12 V and connectedin parallel but some are connected in series (4
3 V plugs). To check the operation of most 12 Vglow plug circuits, use the following steps.
1. Hand and eye checks.2. Battery condition – at least 70%.3. Engine must be cold – it may be possible to
simulate this by disconnecting the tempera-ture sensor.
4. Voltage supplied to plugs when ignition isswitched on (spring loaded position in somecases) – 10 to 12 V.
5. Warning light operation – should go out aftera few seconds.
6. Voltage supplied to plugs while cranking – 9to 11 V.
7. Voltage supplied to plugs after engine hasstarted – 0 V or if silent idle system is used 5to 6 V for several minutes.
8. Same tests with engine at running temperature –glow plugs may not be energised or only forthe starting phase.
7.14.5 Diesel systems
It is recommended that when the injection pumpor the injectors are diagnosed as being at fault,reconditioned units should be fitted. Other thanbasic settings of timing, idle speed and governorspeed, major overhaul is often required. Figure7.36 shows a general diagnosis pattern for dieselsystems produced by ‘Autologic’.
7.15 Engine management
7.15.1 Introduction
As the requirement for lower and lower emis-sions continues together with the need for betterperformance, other areas of engine control areconstantly being investigated. This is becomingeven more important as the possibility of carbon
Coolant temperature sensor
Low valveSensing resistor
12 Vglowplugs
WL
ECU
Ignition switch
Figure 7.35 Glow plug circuit
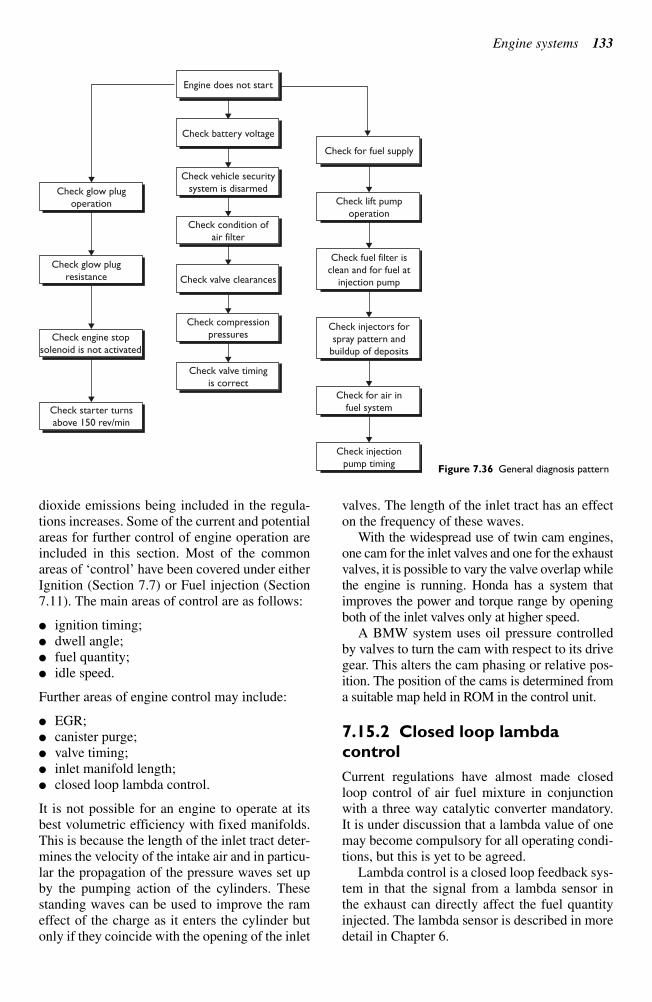
Engine systems 133
dioxide emissions being included in the regula-
tions increases. Some of the current and potential
areas for further control of engine operation are
included in this section. Most of the common
areas of ‘control’ have been covered under eitherIgnition (Section 7.7) or Fuel injection (Section7.11). The main areas of control are as follows:
ignition timing; dwell angle; fuel quantity; idle speed.
Further areas of engine control may include:
EGR; canister purge; valve timing; inlet manifold length; closed loop lambda control.
It is not possible for an engine to operate at itsbest volumetric efficiency with fixed manifolds.This is because the length of the inlet tract deter-mines the velocity of the intake air and in particu-lar the propagation of the pressure waves set upby the pumping action of the cylinders. Thesestanding waves can be used to improve the rameffect of the charge as it enters the cylinder butonly if they coincide with the opening of the inlet
valves. The length of the inlet tract has an effecton the frequency of these waves.
With the widespread use of twin cam engines,one cam for the inlet valves and one for the exhaustvalves, it is possible to vary the valve overlap whilethe engine is running. Honda has a system thatimproves the power and torque range by openingboth of the inlet valves only at higher speed.
A BMW system uses oil pressure controlledby valves to turn the cam with respect to its drivegear. This alters the cam phasing or relative pos-ition. The position of the cams is determined froma suitable map held in ROM in the control unit.
7.15.2 Closed loop lambda
control
Current regulations have almost made closedloop control of air fuel mixture in conjunctionwith a three way catalytic converter mandatory.It is under discussion that a lambda value of onemay become compulsory for all operating condi-tions, but this is yet to be agreed.
Lambda control is a closed loop feedback sys-tem in that the signal from a lambda sensor in the exhaust can directly affect the fuel quantityinjected. The lambda sensor is described in moredetail in Chapter 6.
Check glow plugoperation
Engine does not start
Check for fuel supply
Check lift pumpoperation
Check fuel filter isclean and for fuel at
injection pump
Check injectors forspray pattern and
buildup of deposits
Check for air infuel system
Check injectionpump timing
Check battery voltage
Check vehicle securitysystem is disarmed
Check condition ofair filter
Check valve clearances
Check compressionpressures
Check valve timingis correct
Check glow plugresistance
Check engine stopsolenoid is not activated
Check starter turnsabove 150 rev/min
Figure 7.36 General diagnosis pattern
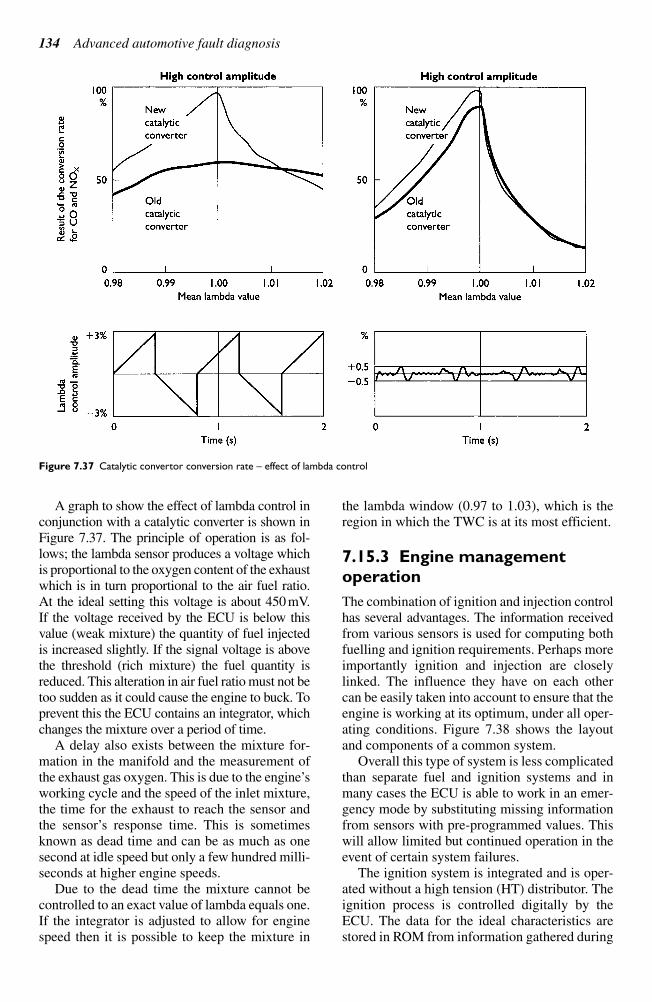
134 Advanced automotive fault diagnosis
A graph to show the effect of lambda control in
conjunction with a catalytic converter is shown in
Figure 7.37. The principle of operation is as fol-
lows; the lambda sensor produces a voltage which
is proportional to the oxygen content of the exhaust
which is in turn proportional to the air fuel ratio.
At the ideal setting this voltage is about 450 mV.
If the voltage received by the ECU is below this
value (weak mixture) the quantity of fuel injected
is increased slightly. If the signal voltage is above
the threshold (rich mixture) the fuel quantity is
reduced. This alteration in air fuel ratio must not be
too sudden as it could cause the engine to buck. To
prevent this the ECU contains an integrator, which
changes the mixture over a period of time.
A delay also exists between the mixture for-
mation in the manifold and the measurement of
the exhaust gas oxygen. This is due to the engine’sworking cycle and the speed of the inlet mixture,the time for the exhaust to reach the sensor andthe sensor’s response time. This is sometimesknown as dead time and can be as much as onesecond at idle speed but only a few hundred milli-seconds at higher engine speeds.
Due to the dead time the mixture cannot becontrolled to an exact value of lambda equals one.If the integrator is adjusted to allow for enginespeed then it is possible to keep the mixture in
the lambda window (0.97 to 1.03), which is theregion in which the TWC is at its most efficient.
7.15.3 Engine management
operation
The combination of ignition and injection controlhas several advantages. The information receivedfrom various sensors is used for computing bothfuelling and ignition requirements. Perhaps moreimportantly ignition and injection are closelylinked. The influence they have on each othercan be easily taken into account to ensure that theengine is working at its optimum, under all oper-ating conditions. Figure 7.38 shows the layoutand components of a common system.
Overall this type of system is less complicatedthan separate fuel and ignition systems and inmany cases the ECU is able to work in an emer-gency mode by substituting missing informationfrom sensors with pre-programmed values. Thiswill allow limited but continued operation in theevent of certain system failures.
The ignition system is integrated and is oper-ated without a high tension (HT) distributor. Theignition process is controlled digitally by theECU. The data for the ideal characteristics arestored in ROM from information gathered during
Figure 7.37 Catalytic convertor conversion rate – effect of lambda control
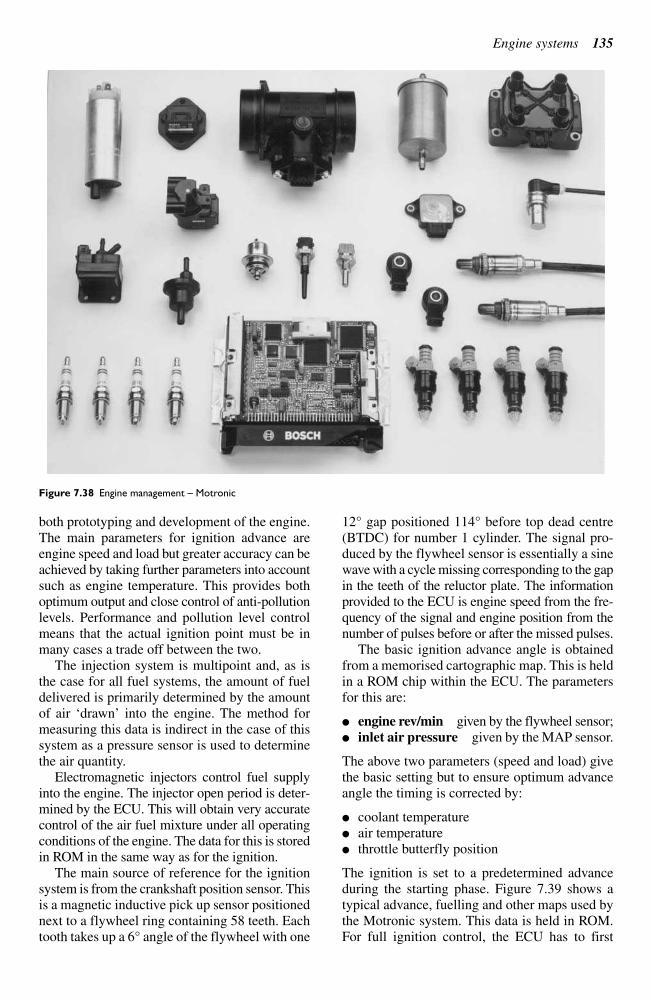
Engine systems 135
both prototyping and development of the engine.
The main parameters for ignition advance are
engine speed and load but greater accuracy can be
achieved by taking further parameters into account
such as engine temperature. This provides both
optimum output and close control of anti-pollution
levels. Performance and pollution level control
means that the actual ignition point must be in
many cases a trade off between the two.
The injection system is multipoint and, as is
the case for all fuel systems, the amount of fuel
delivered is primarily determined by the amount
of air ‘drawn’ into the engine. The method formeasuring this data is indirect in the case of thissystem as a pressure sensor is used to determinethe air quantity.
Electromagnetic injectors control fuel supplyinto the engine. The injector open period is deter-mined by the ECU. This will obtain very accuratecontrol of the air fuel mixture under all operatingconditions of the engine. The data for this is storedin ROM in the same way as for the ignition.
The main source of reference for the ignitionsystem is from the crankshaft position sensor. Thisis a magnetic inductive pick up sensor positionednext to a flywheel ring containing 58 teeth. Eachtooth takes up a 6° angle of the flywheel with one
12° gap positioned 114° before top dead centre(BTDC) for number 1 cylinder. The signal pro-duced by the flywheel sensor is essentially a sinewave with a cycle missing corresponding to the gapin the teeth of the reluctor plate. The informationprovided to the ECU is engine speed from the fre-quency of the signal and engine position from thenumber of pulses before or after the missed pulses.
The basic ignition advance angle is obtainedfrom a memorised cartographic map. This is heldin a ROM chip within the ECU. The parametersfor this are:
engine rev/min given by the flywheel sensor; inlet air pressure given by the MAP sensor.
The above two parameters (speed and load) givethe basic setting but to ensure optimum advanceangle the timing is corrected by:
coolant temperature air temperature throttle butterfly position
The ignition is set to a predetermined advanceduring the starting phase. Figure 7.39 shows atypical advance, fuelling and other maps used bythe Motronic system. This data is held in ROM.For full ignition control, the ECU has to first
Figure 7.38 Engine management – Motronic
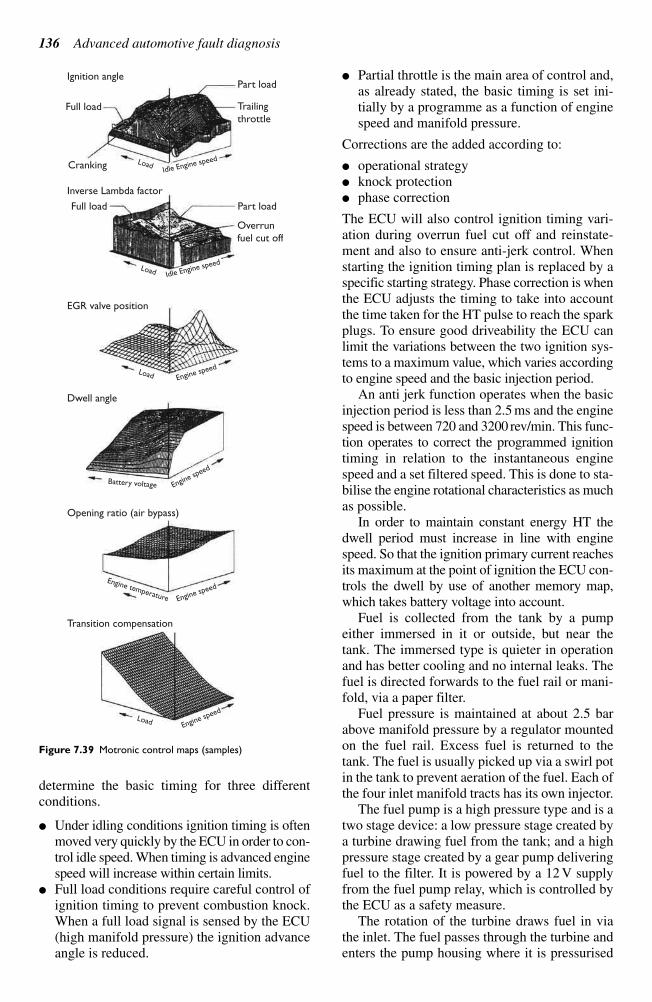
determine the basic timing for three different
conditions.
Under idling conditions ignition timing is often
moved very quickly by the ECU in order to con-
trol idle speed. When timing is advanced engine
speed will increase within certain limits.
Full load conditions require careful control of
ignition timing to prevent combustion knock.
When a full load signal is sensed by the ECU
(high manifold pressure) the ignition advance
angle is reduced.
Partial throttle is the main area of control and,
as already stated, the basic timing is set ini-
tially by a programme as a function of engine
speed and manifold pressure.
Corrections are the added according to:
operational strategy
knock protection
phase correction
The ECU will also control ignition timing vari-
ation during overrun fuel cut off and reinstate-
ment and also to ensure anti-jerk control. When
starting the ignition timing plan is replaced by a
specific starting strategy. Phase correction is when
the ECU adjusts the timing to take into account
the time taken for the HT pulse to reach the spark
plugs. To ensure good driveability the ECU can
limit the variations between the two ignition sys-
tems to a maximum value, which varies according
to engine speed and the basic injection period.
An anti jerk function operates when the basic
injection period is less than 2.5 ms and the engine
speed is between 720 and 3200 rev/min. This func-
tion operates to correct the programmed ignition
timing in relation to the instantaneous engine
speed and a set filtered speed. This is done to sta-
bilise the engine rotational characteristics as much
as possible.
In order to maintain constant energy HT the
dwell period must increase in line with engine
speed. So that the ignition primary current reaches
its maximum at the point of ignition the ECU con-
trols the dwell by use of another memory map,
which takes battery voltage into account.
Fuel is collected from the tank by a pump
either immersed in it or outside, but near the
tank. The immersed type is quieter in operation
and has better cooling and no internal leaks. The
fuel is directed forwards to the fuel rail or mani-
fold, via a paper filter.
Fuel pressure is maintained at about 2.5 bar
above manifold pressure by a regulator mounted
on the fuel rail. Excess fuel is returned to the
tank. The fuel is usually picked up via a swirl pot
in the tank to prevent aeration of the fuel. Each of
the four inlet manifold tracts has its own injector.
The fuel pump is a high pressure type and is a
two stage device: a low pressure stage created by
a turbine drawing fuel from the tank; and a high
pressure stage created by a gear pump delivering
fuel to the filter. It is powered by a 12 V supply
from the fuel pump relay, which is controlled by
the ECU as a safety measure.
The rotation of the turbine draws fuel in via
the inlet. The fuel passes through the turbine and
enters the pump housing where it is pressurised
136 Advanced automotive fault diagnosis
Ignition angle
Full load
Cranking
Inverse Lambda factor
Full load
EGR valve position
Dwell angle
Opening ratio (air bypass)
Transition compensation
Part load
Trailingthrottle
Part load
Overrunfuel cut off
Load
Load
Idle Engine speed
Load
Battery voltage
Engine temperature
Load
Engine speed
Engine speed
Engine sp
eed
Idle Engine speed
Engine speed
Figure 7.39 Motronic control maps (samples)
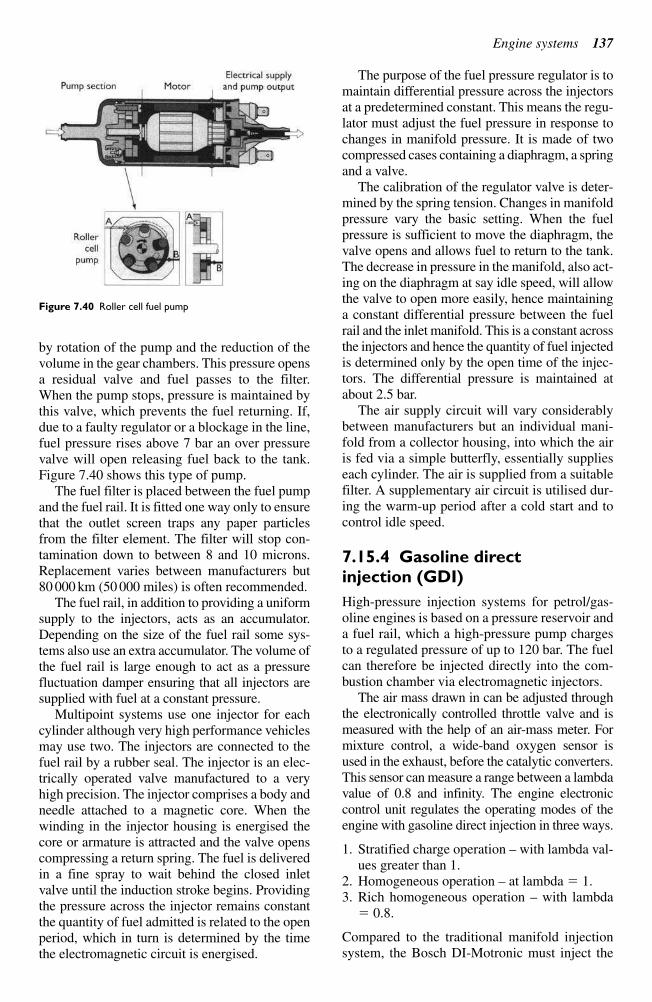
by rotation of the pump and the reduction of the
volume in the gear chambers. This pressure opens
a residual valve and fuel passes to the filter.
When the pump stops, pressure is maintained by
this valve, which prevents the fuel returning. If,
due to a faulty regulator or a blockage in the line,
fuel pressure rises above 7 bar an over pressure
valve will open releasing fuel back to the tank.
Figure 7.40 shows this type of pump.
The fuel filter is placed between the fuel pump
and the fuel rail. It is fitted one way only to ensure
that the outlet screen traps any paper particles
from the filter element. The filter will stop con-
tamination down to between 8 and 10 microns.
Replacement varies between manufacturers but
80 000 km (50 000 miles) is often recommended.
The fuel rail, in addition to providing a uniform
supply to the injectors, acts as an accumulator.
Depending on the size of the fuel rail some sys-
tems also use an extra accumulator. The volume of
the fuel rail is large enough to act as a pressure
fluctuation damper ensuring that all injectors are
supplied with fuel at a constant pressure.
Multipoint systems use one injector for each
cylinder although very high performance vehicles
may use two. The injectors are connected to the
fuel rail by a rubber seal. The injector is an elec-
trically operated valve manufactured to a very
high precision. The injector comprises a body and
needle attached to a magnetic core. When the
winding in the injector housing is energised the
core or armature is attracted and the valve opens
compressing a return spring. The fuel is delivered
in a fine spray to wait behind the closed inlet
valve until the induction stroke begins. Providing
the pressure across the injector remains constant
the quantity of fuel admitted is related to the open
period, which in turn is determined by the time
the electromagnetic circuit is energised.
The purpose of the fuel pressure regulator is to
maintain differential pressure across the injectors
at a predetermined constant. This means the regu-
lator must adjust the fuel pressure in response to
changes in manifold pressure. It is made of two
compressed cases containing a diaphragm, a spring
and a valve.
The calibration of the regulator valve is deter-
mined by the spring tension. Changes in manifold
pressure vary the basic setting. When the fuel
pressure is sufficient to move the diaphragm, the
valve opens and allows fuel to return to the tank.
The decrease in pressure in the manifold, also act-
ing on the diaphragm at say idle speed, will allow
the valve to open more easily, hence maintaining
a constant differential pressure between the fuel
rail and the inlet manifold. This is a constant across
the injectors and hence the quantity of fuel injected
is determined only by the open time of the injec-
tors. The differential pressure is maintained at
about 2.5 bar.
The air supply circuit will vary considerably
between manufacturers but an individual mani-
fold from a collector housing, into which the air
is fed via a simple butterfly, essentially supplies
each cylinder. The air is supplied from a suitable
filter. A supplementary air circuit is utilised dur-
ing the warm-up period after a cold start and to
control idle speed.
7.15.4 Gasoline direct
injection (GDI)
High-pressure injection systems for petrol/gas-
oline engines is based on a pressure reservoir and
a fuel rail, which a high-pressure pump charges
to a regulated pressure of up to 120 bar. The fuel
can therefore be injected directly into the com-
bustion chamber via electromagnetic injectors.
The air mass drawn in can be adjusted through
the electronically controlled throttle valve and is
measured with the help of an air-mass meter. For
mixture control, a wide-band oxygen sensor is
used in the exhaust, before the catalytic converters.
This sensor can measure a range between a lambda
value of 0.8 and infinity. The engine electronic
control unit regulates the operating modes of the
engine with gasoline direct injection in three ways.
1. Stratified charge operation – with lambda val-ues greater than 1.
2. Homogeneous operation – at lambda 1.3. Rich homogeneous operation – with lambda
0.8.
Compared to the traditional manifold injectionsystem, the Bosch DI-Motronic must inject the
Engine systems 137
Figure 7.40 Roller cell fuel pump
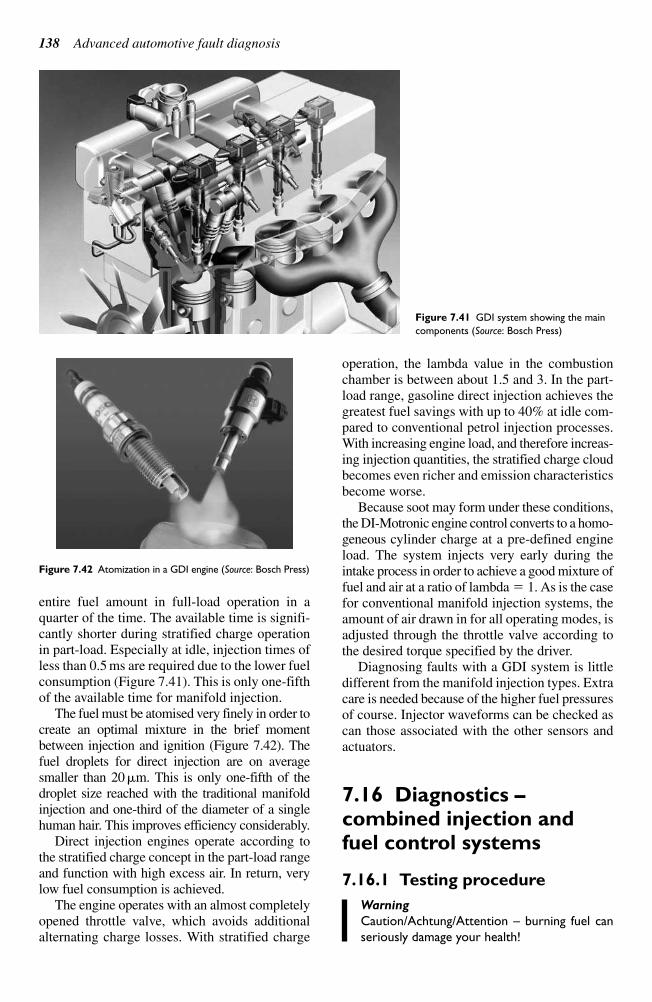
138 Advanced automotive fault diagnosis
entire fuel amount in full-load operation in a
quarter of the time. The available time is signifi-
cantly shorter during stratified charge operation
in part-load. Especially at idle, injection times of
less than 0.5 ms are required due to the lower fuel
consumption (Figure 7.41). This is only one-fifth
of the available time for manifold injection.
The fuel must be atomised very finely in order to
create an optimal mixture in the brief moment
between injection and ignition (Figure 7.42). The
fuel droplets for direct injection are on average
smaller than 20 m. This is only one-fifth of the
droplet size reached with the traditional manifold
injection and one-third of the diameter of a single
human hair. This improves efficiency considerably.
Direct injection engines operate according to
the stratified charge concept in the part-load range
and function with high excess air. In return, very
low fuel consumption is achieved.
The engine operates with an almost completely
opened throttle valve, which avoids additional
alternating charge losses. With stratified charge
operation, the lambda value in the combustion
chamber is between about 1.5 and 3. In the part-
load range, gasoline direct injection achieves the
greatest fuel savings with up to 40% at idle com-
pared to conventional petrol injection processes.
With increasing engine load, and therefore increas-
ing injection quantities, the stratified charge cloud
becomes even richer and emission characteristics
become worse.
Because soot may form under these conditions,
the DI-Motronic engine control converts to a homo-
geneous cylinder charge at a pre-defined engine
load. The system injects very early during the
intake process in order to achieve a good mixture of
fuel and air at a ratio of lambda 1. As is the case
for conventional manifold injection systems, the
amount of air drawn in for all operating modes, is
adjusted through the throttle valve according to
the desired torque specified by the driver.
Diagnosing faults with a GDI system is little
different from the manifold injection types. Extra
care is needed because of the higher fuel pressures
of course. Injector waveforms can be checked as
can those associated with the other sensors and
actuators.
7.16 Diagnostics – combined injection andfuel control systems
7.16.1 Testing procedure
Warning
Caution/Achtung/Attention – burning fuel can
seriously damage your health!
Figure 7.41 GDI system showing the main
components (Source: Bosch Press)
Figure 7.42 Atomization in a GDI engine (Source: Bosch Press)
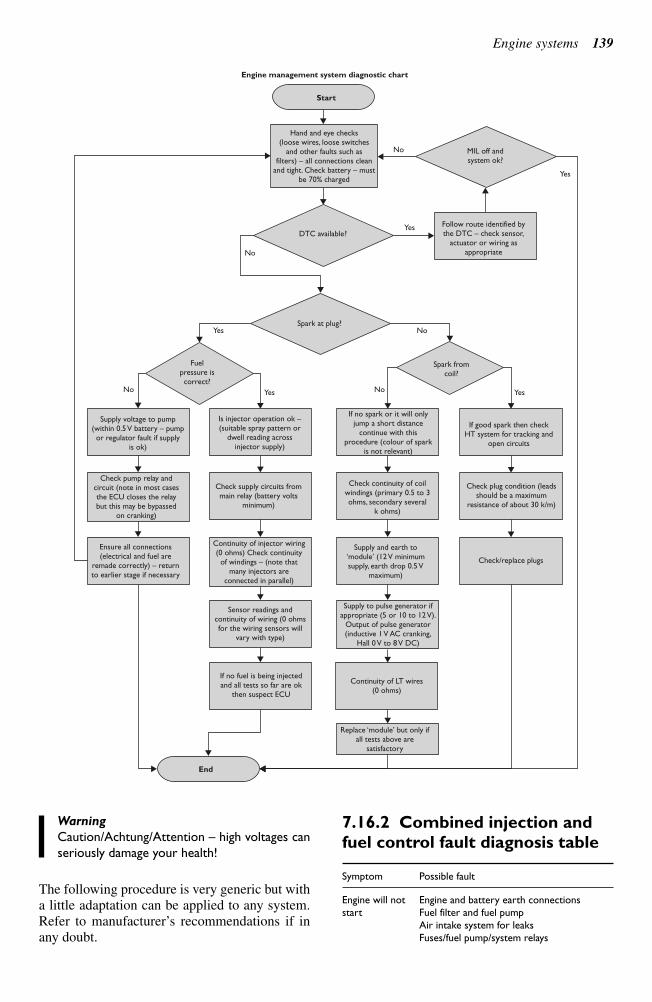
Engine systems 139
Warning
Caution/Achtung/Attention – high voltages can
seriously damage your health!
The following procedure is very generic but with
a little adaptation can be applied to any system.
Refer to manufacturer’s recommendations if inany doubt.
7.16.2 Combined injection and
fuel control fault diagnosis table
Symptom Possible fault
Engine will not Engine and battery earth connectionsstart Fuel filter and fuel pump
Air intake system for leaksFuses/fuel pump/system relays
Hand and eye checks(loose wires, loose switches
and other faults such asfilters) – all connections clean
and tight. Check battery – mustbe 70% charged
MIL off andsystem ok?
DTC available?
No
No
No
No No
Yes
Yes
Yes
Yes Yes
Follow route identified bythe DTC – check sensor,
actuator or wiring asappropriate
Spark at plug?
Spark fromcoil?
Fuelpressure iscorrect?
Supply voltage to pump(within 0.5 V battery – pumpor regulator fault if supply
is ok)
If good spark then checkHT system for tracking and
open circuits
If no spark or it will onlyjump a short distance
continue with thisprocedure (colour of spark
is not relevant)
Is injector operation ok –(suitable spray pattern or
dwell reading acrossinjector supply)
Check plug condition (leadsshould be a maximum
resistance of about 30 k/m)
Check pump relay andcircuit (note in most casesthe ECU closes the relaybut this may be bypassed
on cranking)
Check supply circuits frommain relay (battery volts
minimum)
Check continuity of coilwindings (primary 0.5 to 3ohms, secondary several
k ohms)
Supply and earth to‘module’ (12 V minimumsupply, earth drop 0.5 V
maximum)
Ensure all connections(electrical and fuel are
remade correctly) – returnto earlier stage if necessary
Check/replace plugs
Continuity of injector wiring(0 ohms) Check continuity
of windings – (note thatmany injectors are
connected in parallel)
Supply to pulse generator ifappropriate (5 or 10 to 12 V).
Output of pulse generator(inductive 1 V AC cranking,
Hall 0 V to 8 V DC)
Sensor readings andcontinuity of wiring (0 ohmsfor the wiring sensors will
vary with type)
Continuity of LT wires(0 ohms)
If no fuel is being injectedand all tests so far are ok
then suspect ECU
End
Start
Engine management system diagnostic chart
Replace ‘module’ but only ifall tests above are
satisfactory
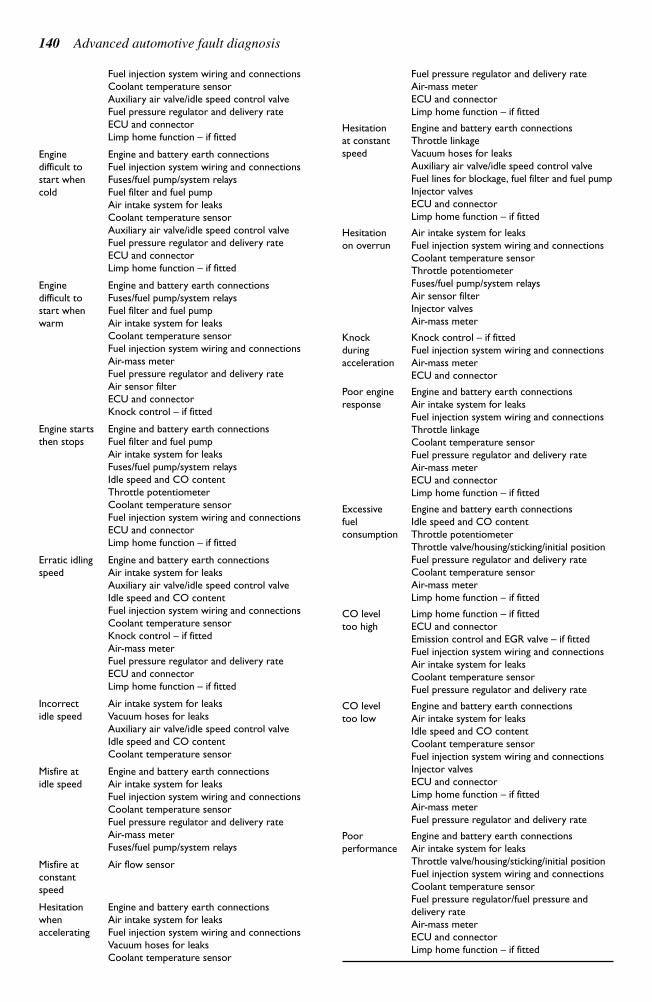
140 Advanced automotive fault diagnosis
Fuel injection system wiring and connectionsCoolant temperature sensorAuxiliary air valve/idle speed control valveFuel pressure regulator and delivery rateECU and connectorLimp home function – if fitted
Engine Engine and battery earth connectionsdifficult to Fuel injection system wiring and connectionsstart when Fuses/fuel pump/system relayscold Fuel filter and fuel pump
Air intake system for leaksCoolant temperature sensorAuxiliary air valve/idle speed control valveFuel pressure regulator and delivery rateECU and connectorLimp home function – if fitted
Engine Engine and battery earth connectionsdifficult to Fuses/fuel pump/system relaysstart when Fuel filter and fuel pumpwarm Air intake system for leaks
Coolant temperature sensorFuel injection system wiring and connectionsAir-mass meterFuel pressure regulator and delivery rateAir sensor filterECU and connectorKnock control – if fitted
Engine starts Engine and battery earth connectionsthen stops Fuel filter and fuel pump
Air intake system for leaksFuses/fuel pump/system relaysIdle speed and CO contentThrottle potentiometerCoolant temperature sensorFuel injection system wiring and connectionsECU and connectorLimp home function – if fitted
Erratic idling Engine and battery earth connectionsspeed Air intake system for leaks
Auxiliary air valve/idle speed control valveIdle speed and CO contentFuel injection system wiring and connectionsCoolant temperature sensorKnock control – if fittedAir-mass meterFuel pressure regulator and delivery rateECU and connectorLimp home function – if fitted
Incorrect Air intake system for leaksidle speed Vacuum hoses for leaks
Auxiliary air valve/idle speed control valveIdle speed and CO contentCoolant temperature sensor
Misfire at Engine and battery earth connectionsidle speed Air intake system for leaks
Fuel injection system wiring and connectionsCoolant temperature sensorFuel pressure regulator and delivery rateAir-mass meterFuses/fuel pump/system relays
Misfire at Air flow sensorconstant speed
Hesitation Engine and battery earth connectionswhen Air intake system for leaksaccelerating Fuel injection system wiring and connections
Vacuum hoses for leaksCoolant temperature sensor
Fuel pressure regulator and delivery rateAir-mass meterECU and connectorLimp home function – if fitted
Hesitation Engine and battery earth connectionsat constant Throttle linkagespeed Vacuum hoses for leaks
Auxiliary air valve/idle speed control valveFuel lines for blockage, fuel filter and fuel pumpInjector valvesECU and connectorLimp home function – if fitted
Hesitation Air intake system for leakson overrun Fuel injection system wiring and connections
Coolant temperature sensorThrottle potentiometerFuses/fuel pump/system relaysAir sensor filterInjector valvesAir-mass meter
Knock Knock control – if fittedduring Fuel injection system wiring and connectionsacceleration Air-mass meter
ECU and connector
Poor engine Engine and battery earth connectionsresponse Air intake system for leaks
Fuel injection system wiring and connectionsThrottle linkageCoolant temperature sensorFuel pressure regulator and delivery rateAir-mass meterECU and connectorLimp home function – if fitted
Excessive Engine and battery earth connectionsfuel Idle speed and CO contentconsumption Throttle potentiometer
Throttle valve/housing/sticking/initial positionFuel pressure regulator and delivery rateCoolant temperature sensorAir-mass meterLimp home function – if fitted
CO level Limp home function – if fittedtoo high ECU and connector
Emission control and EGR valve – if fittedFuel injection system wiring and connectionsAir intake system for leaksCoolant temperature sensorFuel pressure regulator and delivery rate
CO level Engine and battery earth connectionstoo low Air intake system for leaks
Idle speed and CO contentCoolant temperature sensorFuel injection system wiring and connectionsInjector valvesECU and connectorLimp home function – if fittedAir-mass meterFuel pressure regulator and delivery rate
Poor Engine and battery earth connectionsperformance Air intake system for leaks
Throttle valve/housing/sticking/initial positionFuel injection system wiring and connectionsCoolant temperature sensorFuel pressure regulator/fuel pressure anddelivery rateAir-mass meterECU and connectorLimp home function – if fitted
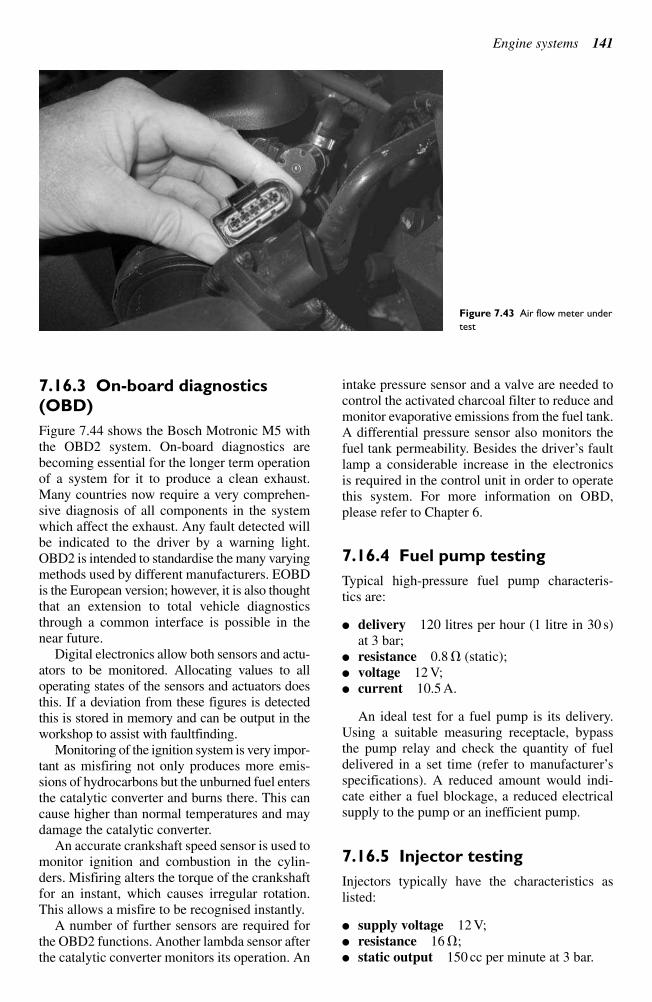
Engine systems 141
7.16.3 On-board diagnostics
(OBD)
Figure 7.44 shows the Bosch Motronic M5 with
the OBD2 system. On-board diagnostics are
becoming essential for the longer term operation
of a system for it to produce a clean exhaust.
Many countries now require a very comprehen-
sive diagnosis of all components in the system
which affect the exhaust. Any fault detected will
be indicated to the driver by a warning light.
OBD2 is intended to standardise the many varying
methods used by different manufacturers. EOBD
is the European version; however, it is also thought
that an extension to total vehicle diagnostics
through a common interface is possible in the
near future.
Digital electronics allow both sensors and actu-
ators to be monitored. Allocating values to all
operating states of the sensors and actuators does
this. If a deviation from these figures is detected
this is stored in memory and can be output in the
workshop to assist with faultfinding.
Monitoring of the ignition system is very impor-
tant as misfiring not only produces more emis-
sions of hydrocarbons but the unburned fuel enters
the catalytic converter and burns there. This can
cause higher than normal temperatures and may
damage the catalytic converter.
An accurate crankshaft speed sensor is used to
monitor ignition and combustion in the cylin-
ders. Misfiring alters the torque of the crankshaft
for an instant, which causes irregular rotation.
This allows a misfire to be recognised instantly.
A number of further sensors are required for
the OBD2 functions. Another lambda sensor after
the catalytic converter monitors its operation. An
intake pressure sensor and a valve are needed to
control the activated charcoal filter to reduce and
monitor evaporative emissions from the fuel tank.
A differential pressure sensor also monitors the
fuel tank permeability. Besides the driver’s faultlamp a considerable increase in the electronics is required in the control unit in order to operatethis system. For more information on OBD,please refer to Chapter 6.
7.16.4 Fuel pump testing
Typical high-pressure fuel pump characteris-tics are:
delivery 120 litres per hour (1 litre in 30 s)at 3 bar;
resistance 0.8 (static); voltage 12 V; current 10.5 A.
An ideal test for a fuel pump is its delivery.Using a suitable measuring receptacle, bypassthe pump relay and check the quantity of fueldelivered in a set time (refer to manufacturer’sspecifications). A reduced amount would indi-cate either a fuel blockage, a reduced electricalsupply to the pump or an inefficient pump.
7.16.5 Injector testing
Injectors typically have the characteristics aslisted:
supply voltage 12 V; resistance 16 ; static output 150 cc per minute at 3 bar.
Figure 7.43 Air flow meter under
test
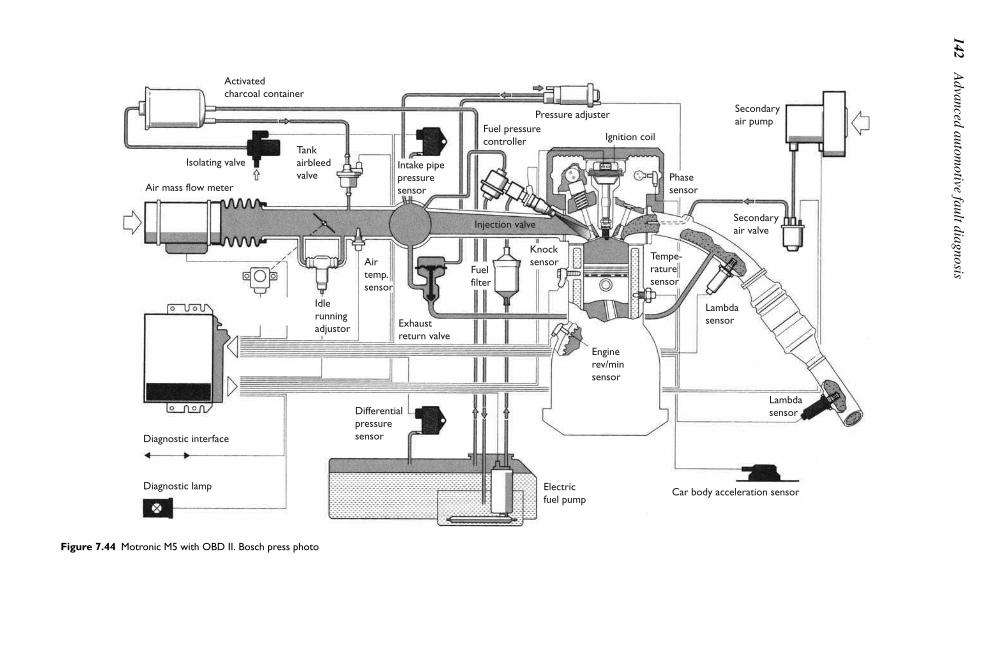
142
Adva
nced
auto
motive fa
ult d
iagnosis
Activatedcharcoal container
Isolating valve
Air mass flow meter
Tankairbleedvalve
Idlerunningadjustor
Exhaustreturn valve
Differentialpressuresensor
Diagnostic lamp
Diagnostic interface
Electricfuel pump
Lambdasensor
Lambdasensor
Tempe-raturesensor
Secondaryair valve
Secondaryair pump
Airtemp.sensor
Intake pipepressuresensor
Pressure adjuster
Fuel pressurecontroller Ignition coil
Phasesensor
Injection valve
Fuelfilter
Knocksensor
Enginerev/minsensor
Car body acceleration sensor
Figure 7.44 Motronic M5 with OBD II. Bosch press photo
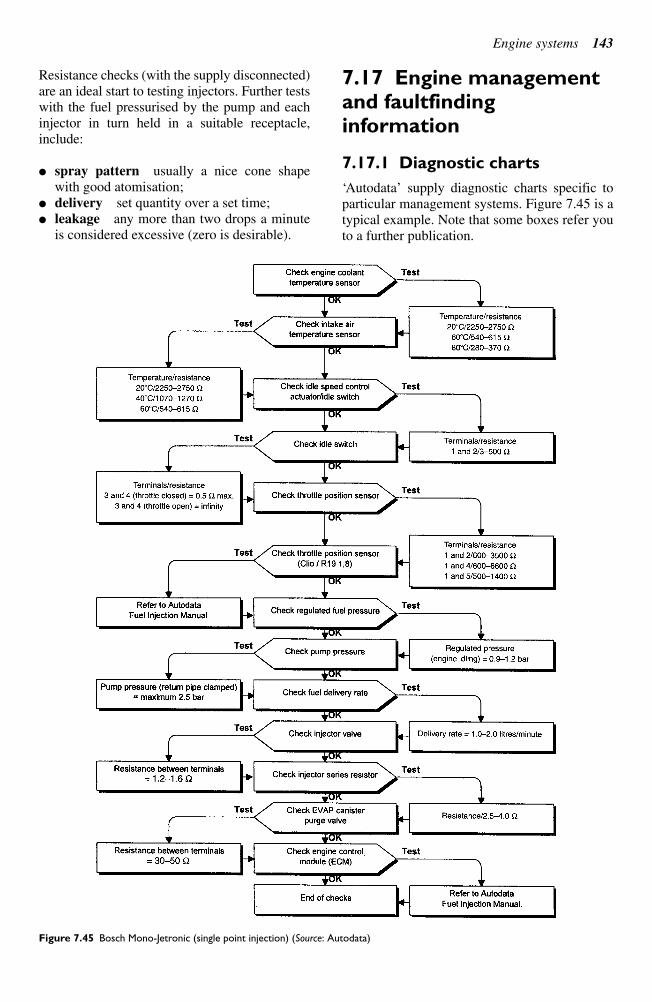
Engine systems 143
Resistance checks (with the supply disconnected)
are an ideal start to testing injectors. Further tests
with the fuel pressurised by the pump and each
injector in turn held in a suitable receptacle,
include:
spray pattern usually a nice cone shape
with good atomisation;
delivery set quantity over a set time;
leakage any more than two drops a minute
is considered excessive (zero is desirable).
7.17 Engine managementand faultfinding information
7.17.1 Diagnostic charts
‘Autodata’ supply diagnostic charts specific toparticular management systems. Figure 7.45 is atypical example. Note that some boxes refer youto a further publication.
Figure 7.45 Bosch Mono-Jetronic (single point injection) (Source: Autodata)
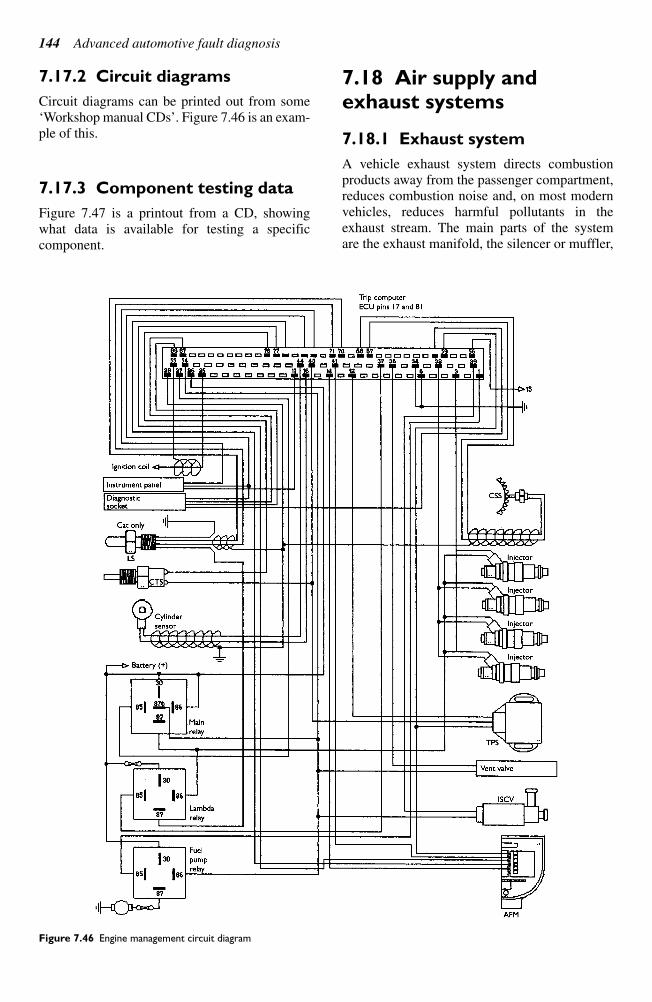
144 Advanced automotive fault diagnosis
7.17.2 Circuit diagrams
Circuit diagrams can be printed out from some
‘Workshop manual CDs’. Figure 7.46 is an exam-ple of this.
7.17.3 Component testing data
Figure 7.47 is a printout from a CD, showingwhat data is available for testing a specific component.
7.18 Air supply andexhaust systems
7.18.1 Exhaust system
A vehicle exhaust system directs combustionproducts away from the passenger compartment,reduces combustion noise and, on most modernvehicles, reduces harmful pollutants in theexhaust stream. The main parts of the system are the exhaust manifold, the silencer or muffler,
Figure 7.46 Engine management circuit diagram
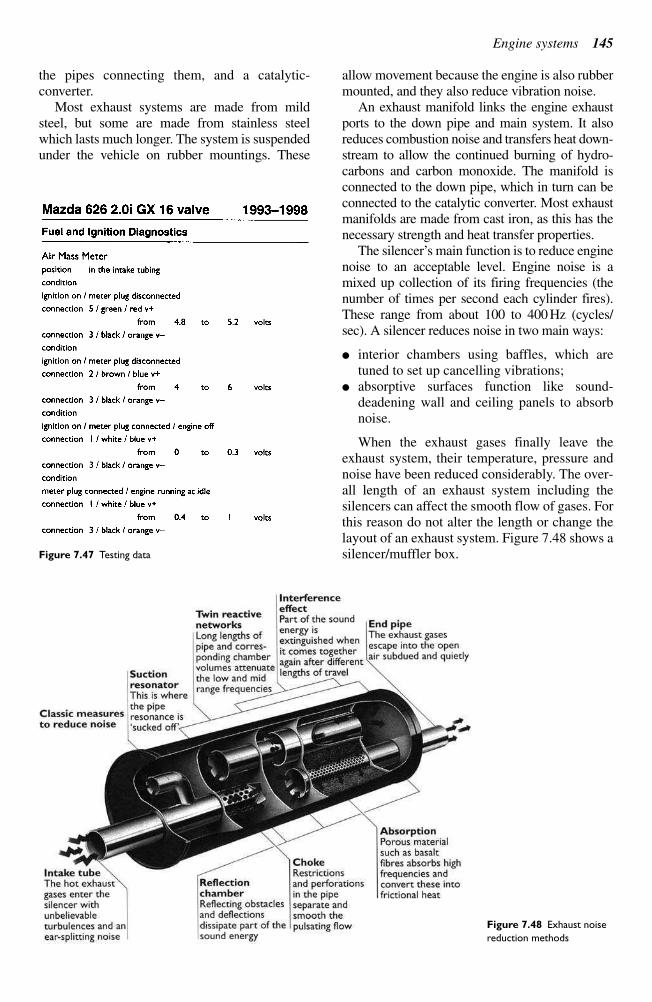
Engine systems 145
the pipes connecting them, and a catalytic-
converter.
Most exhaust systems are made from mild
steel, but some are made from stainless steel
which lasts much longer. The system is suspended
under the vehicle on rubber mountings. These
allow movement because the engine is also rubber
mounted, and they also reduce vibration noise.
An exhaust manifold links the engine exhaust
ports to the down pipe and main system. It also
reduces combustion noise and transfers heat down-
stream to allow the continued burning of hydro-
carbons and carbon monoxide. The manifold is
connected to the down pipe, which in turn can be
connected to the catalytic converter. Most exhaust
manifolds are made from cast iron, as this has the
necessary strength and heat transfer properties.
The silencer’s main function is to reduce enginenoise to an acceptable level. Engine noise is amixed up collection of its firing frequencies (thenumber of times per second each cylinder fires).These range from about 100 to 400 Hz (cycles/sec). A silencer reduces noise in two main ways:
interior chambers using baffles, which aretuned to set up cancelling vibrations;
absorptive surfaces function like sound-deadening wall and ceiling panels to absorbnoise.
When the exhaust gases finally leave theexhaust system, their temperature, pressure andnoise have been reduced considerably. The over-all length of an exhaust system including thesilencers can affect the smooth flow of gases. Forthis reason do not alter the length or change thelayout of an exhaust system. Figure 7.48 shows asilencer/muffler box.Figure 7.47 Testing data
Figure 7.48 Exhaust noise
reduction methods
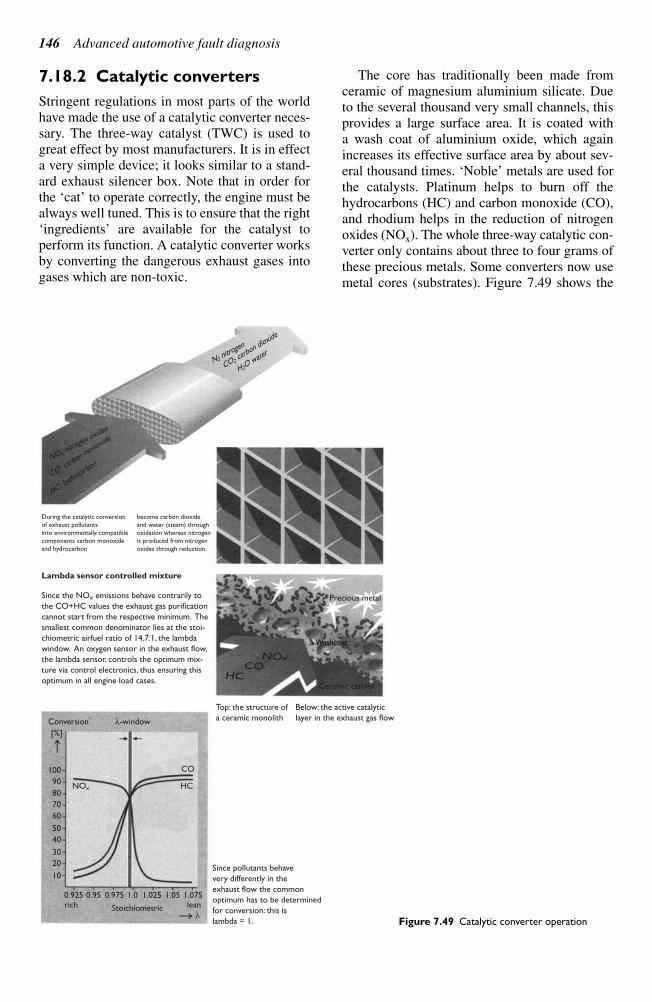
146 Advanced automotive fault diagnosis
7.18.2 Catalytic converters
Stringent regulations in most parts of the world
have made the use of a catalytic converter neces-
sary. The three-way catalyst (TWC) is used to
great effect by most manufacturers. It is in effect
a very simple device; it looks similar to a stand-
ard exhaust silencer box. Note that in order for
the ‘cat’ to operate correctly, the engine must bealways well tuned. This is to ensure that the right‘ingredients’ are available for the catalyst to perform its function. A catalytic converter works by converting the dangerous exhaust gases intogases which are non-toxic.
The core has traditionally been made fromceramic of magnesium aluminium silicate. Dueto the several thousand very small channels, thisprovides a large surface area. It is coated with a wash coat of aluminium oxide, which againincreases its effective surface area by about sev-eral thousand times. ‘Noble’ metals are used forthe catalysts. Platinum helps to burn off thehydrocarbons (HC) and carbon monoxide (CO),and rhodium helps in the reduction of nitrogenoxides (NOx). The whole three-way catalytic con-verter only contains about three to four grams ofthese precious metals. Some converters now usemetal cores (substrates). Figure 7.49 shows the
During the catalytic conversion
of exhaust pollutants
into environmentally compatible
components carbon monoxide
and hydrocarbon
Since the NOx emissions behave contrarily to
the CO+HC values the exhaust gas purification
cannot start from the respective minimum. The
smallest common denominator lies at the stoi-
chiometric airfuel ratio of 14.7:1, the lambda
window. An oxygen sensor in the exhaust flow,
the lambda sensor, controls the optimum mix-
ture via control electronics, thus ensuring this
optimum in all engine load cases.
Since pollutants behave
very differently in the
exhaust flow the common
optimum has to be determined
for conversion: this is
lambda = 1.
Below: the active catalytic
layer in the exhaust gas flow
Top: the structure of
a ceramic monolith
Lambda sensor controlled mixture
become carbon dioxide
and water (steam) through
oxidation whereas nitrogen
is produced from nitrogen
oxides through reduction.
Conversion
[%]
100
90NOx
CO
HC80
70
60
50
40
30
20
10
0.925 0.975 1.0 1.025 1.05 1.075
Stoichiometricrich lean0.95
λ-window
λ
N2 nitro
gen
NOx nitro
gen oxides
CO carbon m
onoxide
HC hydrocar
bon
HCCO
NOx
CO2 carb
on dioxide
H2O wate
r
Precious metal
Washcoat
Ceramic carrier
Figure 7.49 Catalytic converter operation
Engine systems 147
operation of a catalytic converter and how the
lambda window is important.
The engine can damage a catalytic converter
in one of two ways:
firstly by the use of leaded fuel which can
cause lead compounds to be deposited on the
active surfaces;
secondly by engine misfire which can cause
the catalytic converter to overheat due to
burning fuel inside the unit.
Some manufacturers use a system on some vehicles
where a sensor checks the output of the ignition
HT system and, if the spark is not present, will
not allow fuel to be injected. Misfire detection is
also part of current on-board diagnostic (OBD)
legislation in some countries and future legisla-
tion in others.
7.18.3 Air supply system
There are three purposes of the complete air sup-
ply system:
clean the air;
control air temperature;
reduce noise.
A filter does the air cleaning and drawing air
from around the exhaust manifold helps to control
air temperature. When large quantities of air are
drawn into the engine it causes the air to vibrate
and this makes it noisy. In the same way as with the
exhaust system, baffles are used to stop resonance.
Resonance means that when vibrations reach a nat-
ural level they tend to increase and keep going. A
good example of how much noise is reduced by the
air intake system is to compare the noise when an
engine is run with the air filter removed.
Two types of air filter are in use, the first of
these being by far the most popular:
paper element;
oil bath and mesh.
The paper element is made of resin-impregnated
paper. Air filters using this type of replaceable
element are used both for car and commercial
vehicles. They provide a very high filtering
efficiency and reasonable service life. They can
be mounted in any position available under the
bonnet. Service intervals vary so check recom-
mendations.
The oil bath and mesh type of air cleaner was
widely used on non-turbo charged commercial
vehicles. However, it is not very practical for
modern low styled bonnets. Because it can be
cleaned and fresh oil added, an oil bath air cleaner
might still be used for vehicles operating in dusty
conditions.
Air temperature control is used to help the
vehicle conform to emission control regulations
and for good driveability when the engine is cold.
Good vaporisation of the fuel is the key. An auto-
matic control is often fitted to make sure that the
air intake temperature is always correct. The air
cleaner has two intake pipes, one for cold air and
the other for hot air from the exhaust manifold or
hot box. The proportion of hot and cold air is con-
trolled by a flap, which is moved by a diaphragm
acted on by low pressure from the inlet manifold.
The flap rests in the hot air pick up position.
A thermo-valve in the air stream senses the
temperature of the air going into the engine.
When a temperature of about 25°C is reached, the
valve opens. This removes the connection to the
manifold, which in turn increases the pressure
acting on the diaphragm. The flap is now caused
to move and the pick up is now from the cool air
position. The flap is constantly moving ensuring
that the temperature of air entering the engine
remains constant. Picking up hot air when the
engine is still cold can also help to prevent icing
in a carburettor.
7.19 Diagnostics – exhaustand air supply
7.19.1 Systematic testing
If the reported fault is a noisy exhaust proceed as
follows.
1. Check if the noise is due to the exhaust knock-
ing or blowing.
2. Examine the vehicle on the lift.
3. Are further tests required or is it obvious?
4. Cover the end of the exhaust pipe with a rag
for a second or two to highlight where the
exhaust may be blowing.
5. Renew the exhaust section or complete sys-
tem as appropriate.
6. Run and test for leaks and knocking.
7.19.2 Test results
Some of the information you may have to get
from other sources such as data books or a work-
shop manual is listed in the following table.
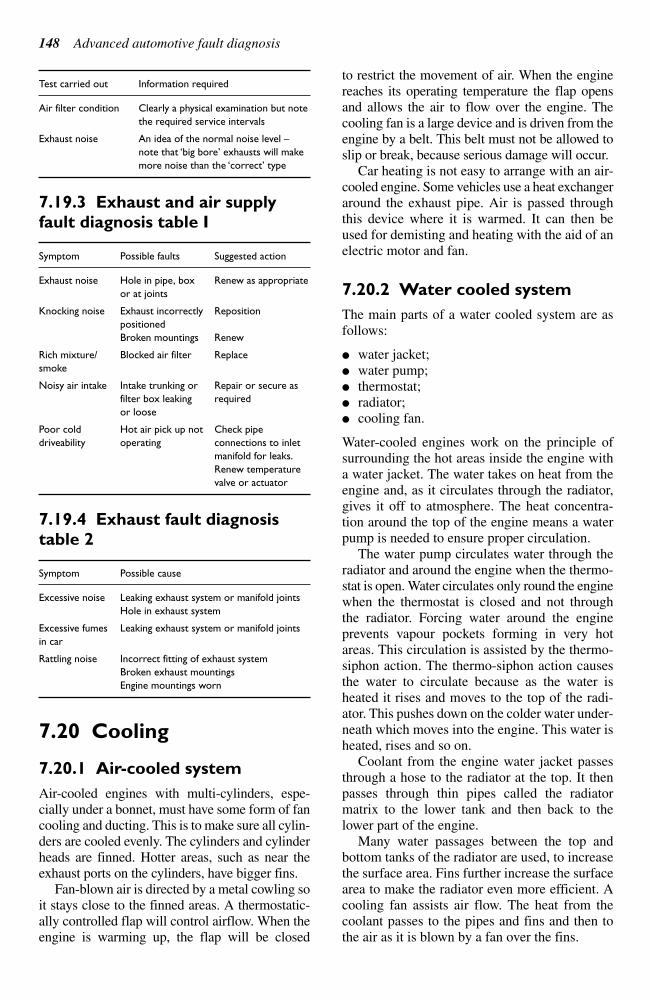
Test carried out Information required
Air filter condition Clearly a physical examination but note
the required service intervals
Exhaust noise An idea of the normal noise level –
note that ‘big bore’ exhausts will make
more noise than the ‘correct’ type
7.19.3 Exhaust and air supply
fault diagnosis table I
Symptom Possible faults Suggested action
Exhaust noise Hole in pipe, box Renew as appropriate
or at joints
Knocking noise Exhaust incorrectly Reposition
positioned
Broken mountings Renew
Rich mixture/ Blocked air filter Replace
smoke
Noisy air intake Intake trunking or Repair or secure as
filter box leaking required
or loose
Poor cold Hot air pick up not Check pipe
driveability operating connections to inlet
manifold for leaks.
Renew temperature
valve or actuator
7.19.4 Exhaust fault diagnosis
table 2
Symptom Possible cause
Excessive noise Leaking exhaust system or manifold joints
Hole in exhaust system
Excessive fumes Leaking exhaust system or manifold joints
in car
Rattling noise Incorrect fitting of exhaust system
Broken exhaust mountings
Engine mountings worn
7.20 Cooling
7.20.1 Air-cooled system
Air-cooled engines with multi-cylinders, espe-
cially under a bonnet, must have some form of fan
cooling and ducting. This is to make sure all cylin-
ders are cooled evenly. The cylinders and cylinder
heads are finned. Hotter areas, such as near the
exhaust ports on the cylinders, have bigger fins.
Fan-blown air is directed by a metal cowling so
it stays close to the finned areas. A thermostatic-
ally controlled flap will control airflow. When the
engine is warming up, the flap will be closed
to restrict the movement of air. When the engine
reaches its operating temperature the flap opens
and allows the air to flow over the engine. The
cooling fan is a large device and is driven from the
engine by a belt. This belt must not be allowed to
slip or break, because serious damage will occur.
Car heating is not easy to arrange with an air-
cooled engine. Some vehicles use a heat exchanger
around the exhaust pipe. Air is passed through
this device where it is warmed. It can then be
used for demisting and heating with the aid of an
electric motor and fan.
7.20.2 Water cooled system
The main parts of a water cooled system are as
follows:
water jacket;
water pump;
thermostat;
radiator;
cooling fan.
Water-cooled engines work on the principle of
surrounding the hot areas inside the engine with
a water jacket. The water takes on heat from the
engine and, as it circulates through the radiator,
gives it off to atmosphere. The heat concentra-
tion around the top of the engine means a water
pump is needed to ensure proper circulation.
The water pump circulates water through the
radiator and around the engine when the thermo-
stat is open. Water circulates only round the engine
when the thermostat is closed and not through
the radiator. Forcing water around the engine
prevents vapour pockets forming in very hot
areas. This circulation is assisted by the thermo-
siphon action. The thermo-siphon action causes
the water to circulate because as the water is
heated it rises and moves to the top of the radi-
ator. This pushes down on the colder water under-
neath which moves into the engine. This water is
heated, rises and so on.
Coolant from the engine water jacket passes
through a hose to the radiator at the top. It then
passes through thin pipes called the radiator
matrix to the lower tank and then back to the
lower part of the engine.
Many water passages between the top and
bottom tanks of the radiator are used, to increase
the surface area. Fins further increase the surface
area to make the radiator even more efficient. A
cooling fan assists air flow. The heat from the
coolant passes to the pipes and fins and then to
the air as it is blown by a fan over the fins.
148 Advanced automotive fault diagnosis
Engine systems 149
Many modern radiators are made from alu-
minium pipes and fins with plastic tanks top and
bottom (down flow), or at each end (cross flow).
The cross flow radiators with tanks at each end
are becoming the most popular. The more trad-
itional method was to use copper and brass.
A thermostat is a temperature controlled valve.
Its purpose is to allow coolant to heat up more
quickly and then be kept at a constant temperature.
The total coolant volume in an engine takes time to
heat up. Modern engines run more efficiently when
at the correct operating temperature. The action of
the thermostat is such as to prevent water circula-
tion from the engine to the radiator, until a set tem-
perature is reached. When the valve opens there is
a full circuit for the coolant and a good cooling
action occurs because of full flow through the radi-
ator. The constant action of the thermostat ensures
that the engine temperature remains at a constant
level. The thermostat used by almost all modern
engine is a wax capsule type. If the thermostat is
faulty ensure that the correct type for the engine is
fitted as some work at different temperatures.
The water pump is driven by a V-belt or multi
V-belt from the crankshaft pulley or by the cam
belt. The pump is a simple impeller type and is
usually fitted at the front of the engine (where the
pulleys are). It assists with the thermo-siphon
action of the cooling system, forcing water around
the engine block and radiator.
The engine fan, which maintains the flow of air
through the radiator, is mounted on the water-pump
pulley on older systems. Most cooling fans now are
electric. These are more efficient because they only
work when needed. The forward motion of the car
also helps the air movement through the radiator.
7.20.3 Sealed and semi-sealed
systems
Cooling systems on most vehicles today are sealed
or semi-sealed. This allows them to operate at
pressures as much as 100 N/m2 (100 Pascal) over
atmospheric pressure, raising the boiling point of
the coolant to as much as 126.6°C (remember
water boils at 100°C at atmospheric pressure). The
system can therefore operate at a higher tempera-
ture and with greater efficiency.
The pressure buildup is made possible by the
radiator pressure cap. The cap contains a pressure
valve which opens at a set pressure, and a vacuum
valve which opens at a set vacuum. On a semi-
sealed system, air is pushed out to atmosphere
through the pressure valve as the coolant expands.
Air is then drawn back into the radiator through
the vacuum valve as the coolant cools and con-
tracts. A sealed system has an expansion tank into
which coolant is forced as it expands, and when
the engine cools, coolant can flow from the tank
back into the cooling system. Figure 7.50 shows a
semi-sealed type cooling system.
Correct levels in the expansion tank or in an
unsealed radiator are very important. If too much
coolant is used it will be expelled on to the floor
when the engine gets hot. If not enough is used
then the level could become low and overheating
could take place.
Warning
If a pressure cap is removed from a hot sys-
tem, hot water under pressure will boil the
instant pressure is released. This can be very
dangerous.
Figure 7.50 Semi-sealed
cooling system
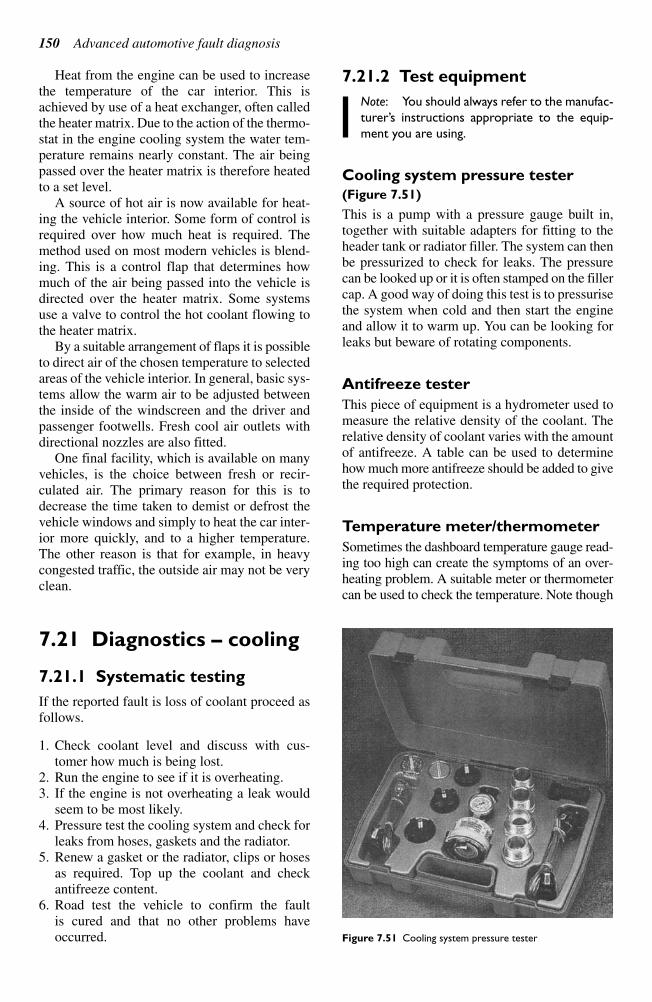
150 Advanced automotive fault diagnosis
Heat from the engine can be used to increase
the temperature of the car interior. This is
achieved by use of a heat exchanger, often called
the heater matrix. Due to the action of the thermo-
stat in the engine cooling system the water tem-
perature remains nearly constant. The air being
passed over the heater matrix is therefore heated
to a set level.
A source of hot air is now available for heat-
ing the vehicle interior. Some form of control is
required over how much heat is required. The
method used on most modern vehicles is blend-
ing. This is a control flap that determines how
much of the air being passed into the vehicle is
directed over the heater matrix. Some systems
use a valve to control the hot coolant flowing to
the heater matrix.
By a suitable arrangement of flaps it is possible
to direct air of the chosen temperature to selected
areas of the vehicle interior. In general, basic sys-
tems allow the warm air to be adjusted between
the inside of the windscreen and the driver and
passenger footwells. Fresh cool air outlets with
directional nozzles are also fitted.
One final facility, which is available on many
vehicles, is the choice between fresh or recir-
culated air. The primary reason for this is to
decrease the time taken to demist or defrost the
vehicle windows and simply to heat the car inter-
ior more quickly, and to a higher temperature.
The other reason is that for example, in heavy
congested traffic, the outside air may not be very
clean.
7.21 Diagnostics – cooling
7.21.1 Systematic testing
If the reported fault is loss of coolant proceed as
follows.
1. Check coolant level and discuss with cus-
tomer how much is being lost.
2. Run the engine to see if it is overheating.
3. If the engine is not overheating a leak would
seem to be most likely.
4. Pressure test the cooling system and check for
leaks from hoses, gaskets and the radiator.
5. Renew a gasket or the radiator, clips or hoses
as required. Top up the coolant and check
antifreeze content.
6. Road test the vehicle to confirm the fault
is cured and that no other problems have
occurred.
7.21.2 Test equipment
Note: You should always refer to the manufac-
turer’s instructions appropriate to the equip-
ment you are using.
Cooling system pressure tester
(Figure 7.51)
This is a pump with a pressure gauge built in,
together with suitable adapters for fitting to the
header tank or radiator filler. The system can then
be pressurized to check for leaks. The pressure
can be looked up or it is often stamped on the filler
cap. A good way of doing this test is to pressurise
the system when cold and then start the engine
and allow it to warm up. You can be looking for
leaks but beware of rotating components.
Antifreeze tester
This piece of equipment is a hydrometer used to
measure the relative density of the coolant. The
relative density of coolant varies with the amount
of antifreeze. A table can be used to determine
how much more antifreeze should be added to give
the required protection.
Temperature meter/thermometer
Sometimes the dashboard temperature gauge read-
ing too high can create the symptoms of an over-
heating problem. A suitable meter or thermometer
can be used to check the temperature. Note though
Figure 7.51 Cooling system pressure tester
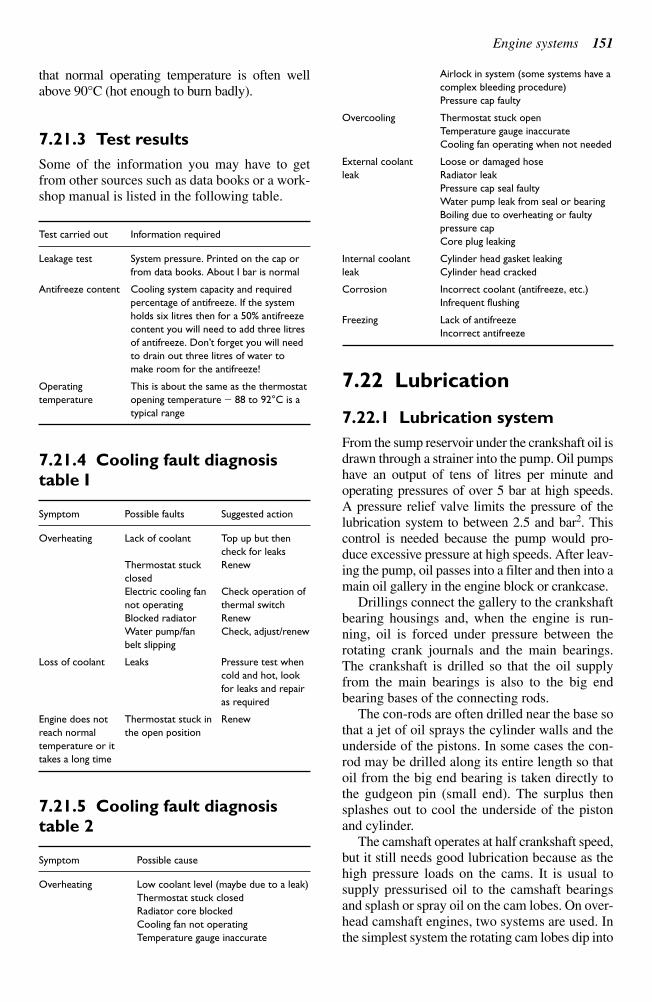
Engine systems 151
that normal operating temperature is often well
above 90°C (hot enough to burn badly).
7.21.3 Test results
Some of the information you may have to get
from other sources such as data books or a work-
shop manual is listed in the following table.
Test carried out Information required
Leakage test System pressure. Printed on the cap or
from data books. About I bar is normal
Antifreeze content Cooling system capacity and required
percentage of antifreeze. If the system
holds six litres then for a 50% antifreeze
content you will need to add three litres
of antifreeze. Don’t forget you will need
to drain out three litres of water to
make room for the antifreeze!
Operating This is about the same as the thermostat
temperature opening temperature 88 to 92°C is a
typical range
7.21.4 Cooling fault diagnosis
table I
Symptom Possible faults Suggested action
Overheating Lack of coolant Top up but then
check for leaks
Thermostat stuck Renew
closed
Electric cooling fan Check operation of
not operating thermal switch
Blocked radiator Renew
Water pump/fan Check, adjust/renew
belt slipping
Loss of coolant Leaks Pressure test when
cold and hot, look
for leaks and repair
as required
Engine does not Thermostat stuck in Renew
reach normal the open position
temperature or it
takes a long time
7.21.5 Cooling fault diagnosis
table 2
Symptom Possible cause
Overheating Low coolant level (maybe due to a leak)
Thermostat stuck closed
Radiator core blocked
Cooling fan not operating
Temperature gauge inaccurate
Airlock in system (some systems have a
complex bleeding procedure)
Pressure cap faulty
Overcooling Thermostat stuck open
Temperature gauge inaccurate
Cooling fan operating when not needed
External coolant Loose or damaged hose
leak Radiator leak
Pressure cap seal faulty
Water pump leak from seal or bearing
Boiling due to overheating or faulty
pressure cap
Core plug leaking
Internal coolant Cylinder head gasket leaking
leak Cylinder head cracked
Corrosion Incorrect coolant (antifreeze, etc.)
Infrequent flushing
Freezing Lack of antifreeze
Incorrect antifreeze
7.22 Lubrication
7.22.1 Lubrication system
From the sump reservoir under the crankshaft oil is
drawn through a strainer into the pump. Oil pumps
have an output of tens of litres per minute and
operating pressures of over 5 bar at high speeds.
A pressure relief valve limits the pressure of the
lubrication system to between 2.5 and bar2. This
control is needed because the pump would pro-
duce excessive pressure at high speeds. After leav-
ing the pump, oil passes into a filter and then into a
main oil gallery in the engine block or crankcase.
Drillings connect the gallery to the crankshaft
bearing housings and, when the engine is run-
ning, oil is forced under pressure between the
rotating crank journals and the main bearings.
The crankshaft is drilled so that the oil supply
from the main bearings is also to the big end
bearing bases of the connecting rods.
The con-rods are often drilled near the base so
that a jet of oil sprays the cylinder walls and the
underside of the pistons. In some cases the con-
rod may be drilled along its entire length so that
oil from the big end bearing is taken directly to
the gudgeon pin (small end). The surplus then
splashes out to cool the underside of the piston
and cylinder.
The camshaft operates at half crankshaft speed,
but it still needs good lubrication because as the
high pressure loads on the cams. It is usual to
supply pressurised oil to the camshaft bearings
and splash or spray oil on the cam lobes. On over-
head camshaft engines, two systems are used. In
the simplest system the rotating cam lobes dip into
152 Advanced automotive fault diagnosis
a trough of oil. Another method is to spray the
cam lobes with oil. This is usually done by an oil
pipe with small holes in it alongside the camshaft.
The small holes in the side of the pipe aim a jet of
oil at each rotating cam lobe. The surplus splashes
over the valve assembly and then falls back into
the sump.
On cars where a chain drives the cam, a small
tapping from the main oil gallery sprays oil on
the chain as it moves past or the chain may sim-
ply dip in the sump oil. Figure 7.52 shows a typ-
ical lubrication system.
7.22.2 Oil filters
Even new engines can contain very small par-
ticles of metal left over from the manufacturing
process or grains of sand which have not been
removed from the crankcase after casting. Old
engines continually deposit tiny bits of metal
worn from highly loaded components such as the
piston rings. To prevent any of these lodging in
bearings or blocking oil ways, the oil is filtered.
The primary filter is a wire mesh strainer that
stops particles of dirt or swarf from entering the
oil pump. This is normally on the end of the oil
pick-up pipe. An extra filter is also used that stops
very fine particles. The most common type has a
folded, resin impregnated paper element. Pumping
oil through it removes all but smallest solids
from the oil.
Most engines use a full-flow system to filter
all of the oil after it leaves the pump. The most
popular method is to pump the oil into a canister
containing a cylindrical filter. From the inner
walls of the canister, the oil flows through the fil-
ter and out from the centre to the main oil gallery.
Full-flow filtration works well provided the filter is
renewed at regular intervals. If it is left in service
too long it may become blocked. When this hap-
pens the buildup of pressure inside the filter forces
open a spring-loaded relief valve in the housing
and the oil bypasses the filter. This valve pre-
vents engine failure, but the engine will be lubri-
cated with dirty oil until the filter is renewed. This
is better than no oil!
A bypass filtration system was used on older
vehicles. This system only filters a proportion of
the oil pump output. The remainder is fed directly
to the oil gallery. At first view this seems a strange
Figure 7.52 Lubrication system
Engine systems 153
idea but all of the oil does eventually get filtered.
The smaller amount through the filter allows a
higher degree of filtration.
7.22.3 Oil pumps
In its simplest form an oil pump consists of two
gear wheels meshed together in a tight space so
that oil cannot escape past the sides. The engine
drives one wheel. As the gears rotate in opposite
directions, the gap between each tooth in each
wheel traps a small quantity of oil from an inlet
port. The trapped oil is carried round by each
wheel towards an outlet port on the opposite side
where it is forced out by the meshing teeth.
The principle of squeezing oil from an ever-
decreasing space is also used in the rotor type
pump. An inner and outer rotor are mounted on
different axes in the same cylinder. The inner
rotor, which commonly has four lobes, is driven
by the engine. It meshes with an outer rotor, which
has five lobes. As they rotate, the spaces between
them change size. The inlet port is at a point where
the space between the rotor lobes is increasing.
This draws the oil in to the pump. The oil is then
carried round the pump. As rotation continues, the
space between the lobes gets smaller. This com-
presses the oil out of the outlet port.
Oil pumps can produce more pressure than is
required. A valve is used to limit this pressure to
a set value. The pressure relief valve is a simple
device, which in most cases works on the ball
and spring principle. This means that when the
pressure on the ball is greater than the spring, the
ball moves. The pressure relief valve is placed in
the main gallery so that excess pressure is pre-
vented. When the ball moves oil is simply
returned to the sump.
7.22.4 Crankcase ventilation –
engine breather systems
Breathing is very important; without being able to
breathe, we would die! It is almost as important
for an engine breathing system to work correctly.
There are two main reasons for engine breathers.
Prevent pressure buildup inside the engine
crankcase due to combustion gases blowing
past the pistons. The buildup of pressure will
blow gaskets and seals but also there is a high
risk of explosion.
Prevent toxic emissions from the engine.
Emission limits are now very strict, for good
reason – our health!
Crankase breathing or ventilation of the enginewas first done by what is known as an open sys-tem, but this has now been completely replacedby the closed system. The gases escaping froman engine with open crankcase ventilation asdescribed above are very toxic. Legislation nowdemands a positive closed system of ventilation.This makes the pollution from cylinder blow-bygases negligible. Positive crankcase ventilationis the solution to this problem.
In early types of closed system crankcase ven-tilation, the lower pressure at the carburettor aircleaner was used to cause an airflow through theinside of the engine. The breather outlet was sim-ply connected by a pipe to the air cleaner. Thiscaused the crankcase gases to be circulated andthen burned in the engine cylinders. A flame trapwas included in the system, to prevent a crankcaseexplosion if the engine backfired.
In modern closed systems the much lower pres-sure within the inlet manifold is used to extractcrankcase gases. This has to be controlled in mostcases by a variable regulator valve or pressure con-scious valve (PCV). The valve is fitted between thebreather outlet and the inlet manifold. It consists ofa spring-loaded plunger, which opens as the inletmanifold pressure reduces. When the engine is sta-tionary the valve is closed. Under normal runningconditions the valve opens to allow crankcasegases to enter the inlet manifold with minimumrestriction. At low manifold pressures during idlingand overrun (pressure is less than atmospheric),further travel of the valve plunger against its springcloses it in the opposite direction. This reduces gasflow to the inlet manifold. This feature makes surethat the fuel control process is not interfered withunder these conditions. The valve also acts as asafety device in case of a backfire. Any high pres-sure created in the inlet manifold will close thevalve completely. This will isolate the crankcaseand prevent the risk of explosion.
7.23 Diagnostics – lubrication
7.23.1 Systematic testing
If the reported fault is that the oil pressure lightcomes on at low speed proceed as follows.
1. Run the engine and see when the light goes offor comes on.
2. Is the problem worse when the engine is hot?Check the oil level! When was it last serviced?
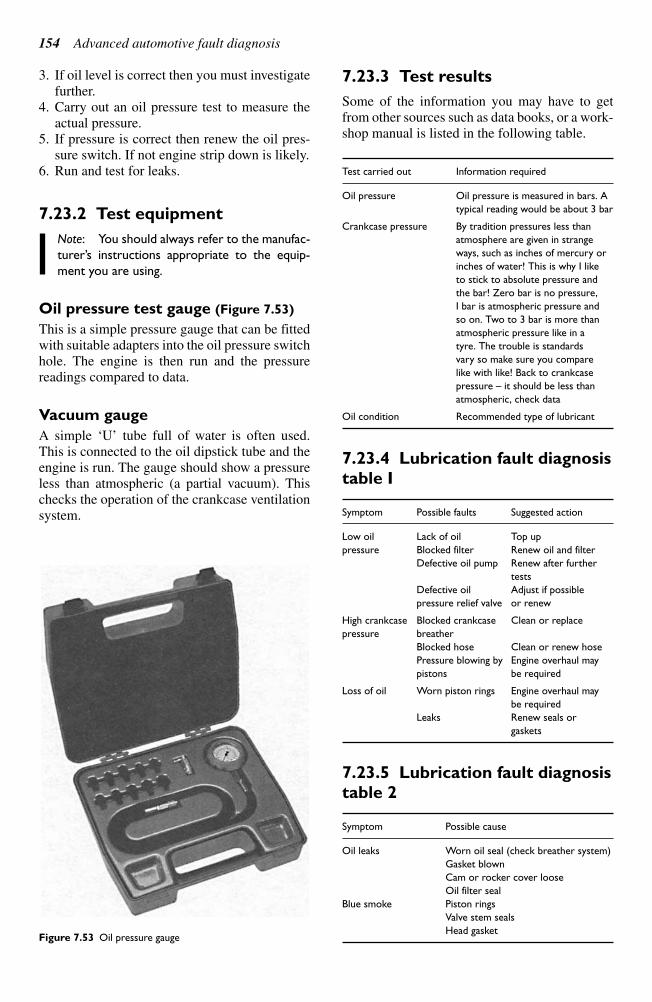
154 Advanced automotive fault diagnosis
3. If oil level is correct then you must investigate
further.
4. Carry out an oil pressure test to measure the
actual pressure.
5. If pressure is correct then renew the oil pres-
sure switch. If not engine strip down is likely.
6. Run and test for leaks.
7.23.2 Test equipment
Note: You should always refer to the manufac-
turer’s instructions appropriate to the equip-
ment you are using.
Oil pressure test gauge (Figure 7.53)
This is a simple pressure gauge that can be fitted
with suitable adapters into the oil pressure switch
hole. The engine is then run and the pressure
readings compared to data.
Vacuum gauge
A simple ‘U’ tube full of water is often used.This is connected to the oil dipstick tube and theengine is run. The gauge should show a pressureless than atmospheric (a partial vacuum). Thischecks the operation of the crankcase ventilationsystem.
7.23.3 Test results
Some of the information you may have to getfrom other sources such as data books, or a work-shop manual is listed in the following table.
Test carried out Information required
Oil pressure Oil pressure is measured in bars. A
typical reading would be about 3 bar
Crankcase pressure By tradition pressures less than
atmosphere are given in strange
ways, such as inches of mercury or
inches of water! This is why I like
to stick to absolute pressure and
the bar! Zero bar is no pressure,
I bar is atmospheric pressure and
so on. Two to 3 bar is more than
atmospheric pressure like in a
tyre. The trouble is standards
vary so make sure you compare
like with like! Back to crankcase
pressure – it should be less than
atmospheric, check data
Oil condition Recommended type of lubricant
7.23.4 Lubrication fault diagnosis
table I
Symptom Possible faults Suggested action
Low oil Lack of oil Top up
pressure Blocked filter Renew oil and filter
Defective oil pump Renew after further
tests
Defective oil Adjust if possible
pressure relief valve or renew
High crankcase Blocked crankcase Clean or replace
pressure breather
Blocked hose Clean or renew hose
Pressure blowing by Engine overhaul may
pistons be required
Loss of oil Worn piston rings Engine overhaul may
be required
Leaks Renew seals or
gaskets
7.23.5 Lubrication fault diagnosis
table 2
Symptom Possible cause
Oil leaks Worn oil seal (check breather system)
Gasket blown
Cam or rocker cover loose
Oil filter seal
Blue smoke Piston rings
Valve stem seals
Head gasketFigure 7.53 Oil pressure gauge
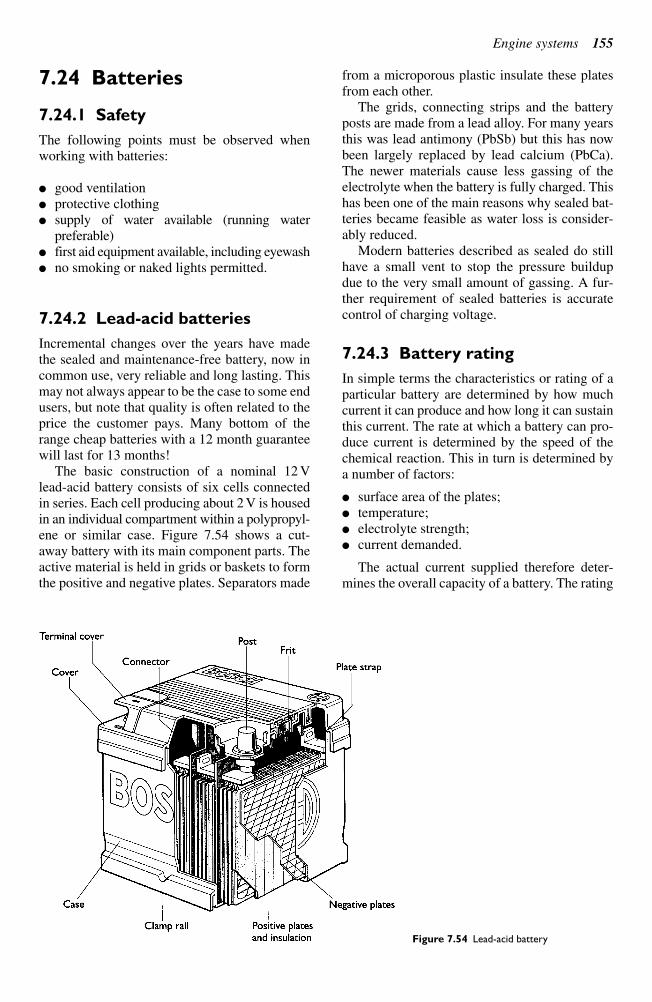
Engine systems 155
7.24 Batteries
7.24.1 Safety
The following points must be observed when
working with batteries:
good ventilation
protective clothing
supply of water available (running water
preferable)
first aid equipment available, including eyewash
no smoking or naked lights permitted.
7.24.2 Lead-acid batteries
Incremental changes over the years have made
the sealed and maintenance-free battery, now in
common use, very reliable and long lasting. This
may not always appear to be the case to some end
users, but note that quality is often related to the
price the customer pays. Many bottom of the
range cheap batteries with a 12 month guarantee
will last for 13 months!
The basic construction of a nominal 12 V
lead-acid battery consists of six cells connected
in series. Each cell producing about 2 V is housed
in an individual compartment within a polypropyl-
ene or similar case. Figure 7.54 shows a cut-
away battery with its main component parts. The
active material is held in grids or baskets to form
the positive and negative plates. Separators made
from a microporous plastic insulate these plates
from each other.
The grids, connecting strips and the battery
posts are made from a lead alloy. For many years
this was lead antimony (PbSb) but this has now
been largely replaced by lead calcium (PbCa).
The newer materials cause less gassing of the
electrolyte when the battery is fully charged. This
has been one of the main reasons why sealed bat-
teries became feasible as water loss is consider-
ably reduced.
Modern batteries described as sealed do still
have a small vent to stop the pressure buildup
due to the very small amount of gassing. A fur-
ther requirement of sealed batteries is accurate
control of charging voltage.
7.24.3 Battery rating
In simple terms the characteristics or rating of a
particular battery are determined by how much
current it can produce and how long it can sustain
this current. The rate at which a battery can pro-
duce current is determined by the speed of the
chemical reaction. This in turn is determined by
a number of factors:
surface area of the plates;
temperature;
electrolyte strength;
current demanded.
The actual current supplied therefore deter-
mines the overall capacity of a battery. The rating
Figure 7.54 Lead-acid battery
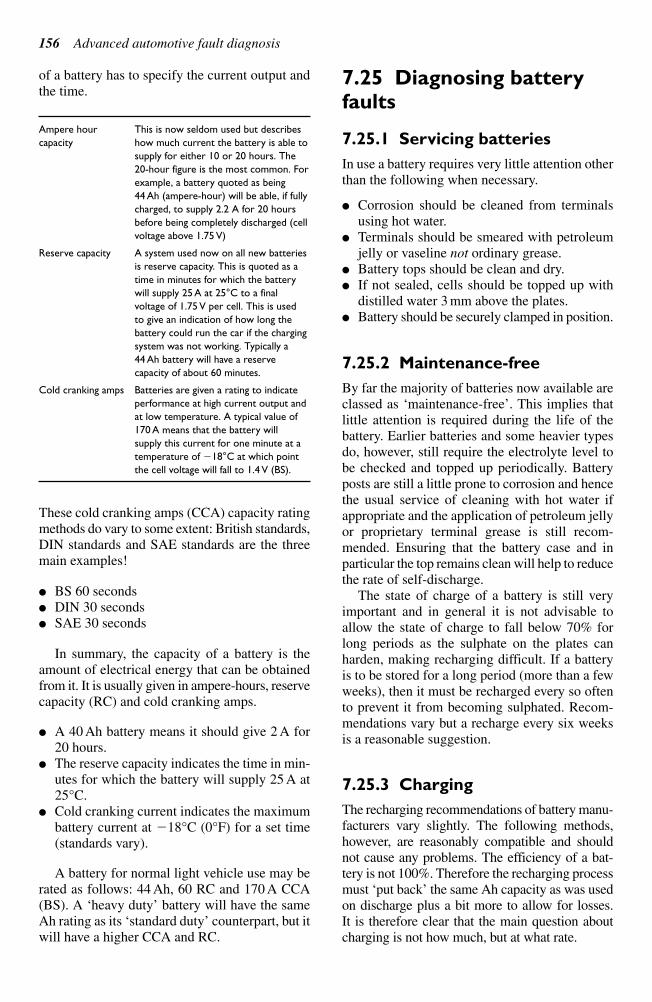
156 Advanced automotive fault diagnosis
of a battery has to specify the current output and
the time.
Ampere hour This is now seldom used but describes
capacity how much current the battery is able to
supply for either 10 or 20 hours. The
20-hour figure is the most common. For
example, a battery quoted as being
44 Ah (ampere-hour) will be able, if fully
charged, to supply 2.2 A for 20 hours
before being completely discharged (cell
voltage above 1.75 V)
Reserve capacity A system used now on all new batteries
is reserve capacity. This is quoted as a
time in minutes for which the battery
will supply 25 A at 25°C to a final
voltage of 1.75 V per cell. This is used
to give an indication of how long the
battery could run the car if the charging
system was not working. Typically a
44 Ah battery will have a reserve
capacity of about 60 minutes.
Cold cranking amps Batteries are given a rating to indicate
performance at high current output and
at low temperature. A typical value of
170 A means that the battery will
supply this current for one minute at a
temperature of 18°C at which point
the cell voltage will fall to 1.4 V (BS).
These cold cranking amps (CCA) capacity rating
methods do vary to some extent: British standards,
DIN standards and SAE standards are the three
main examples!
BS 60 seconds
DIN 30 seconds
SAE 30 seconds
In summary, the capacity of a battery is the
amount of electrical energy that can be obtained
from it. It is usually given in ampere-hours, reserve
capacity (RC) and cold cranking amps.
A 40 Ah battery means it should give 2 A for
20 hours.
The reserve capacity indicates the time in min-
utes for which the battery will supply 25 A at
25°C.
Cold cranking current indicates the maximum
battery current at 18°C (0°F) for a set time
(standards vary).
A battery for normal light vehicle use may be
rated as follows: 44 Ah, 60 RC and 170 A CCA
(BS). A ‘heavy duty’ battery will have the sameAh rating as its ‘standard duty’ counterpart, but itwill have a higher CCA and RC.
7.25 Diagnosing batteryfaults
7.25.1 Servicing batteries
In use a battery requires very little attention otherthan the following when necessary.
Corrosion should be cleaned from terminalsusing hot water.
Terminals should be smeared with petroleumjelly or vaseline not ordinary grease.
Battery tops should be clean and dry. If not sealed, cells should be topped up with
distilled water 3 mm above the plates. Battery should be securely clamped in position.
7.25.2 Maintenance-free
By far the majority of batteries now available areclassed as ‘maintenance-free’. This implies thatlittle attention is required during the life of thebattery. Earlier batteries and some heavier typesdo, however, still require the electrolyte level tobe checked and topped up periodically. Batteryposts are still a little prone to corrosion and hencethe usual service of cleaning with hot water ifappropriate and the application of petroleum jellyor proprietary terminal grease is still recom-mended. Ensuring that the battery case and inparticular the top remains clean will help to reducethe rate of self-discharge.
The state of charge of a battery is still veryimportant and in general it is not advisable toallow the state of charge to fall below 70% forlong periods as the sulphate on the plates canharden, making recharging difficult. If a batteryis to be stored for a long period (more than a fewweeks), then it must be recharged every so oftento prevent it from becoming sulphated. Recom-mendations vary but a recharge every six weeksis a reasonable suggestion.
7.25.3 Charging
The recharging recommendations of battery manu-facturers vary slightly. The following methods,however, are reasonably compatible and shouldnot cause any problems. The efficiency of a bat-tery is not 100%. Therefore the recharging processmust ‘put back’ the same Ah capacity as was usedon discharge plus a bit more to allow for losses. It is therefore clear that the main question aboutcharging is not how much, but at what rate.
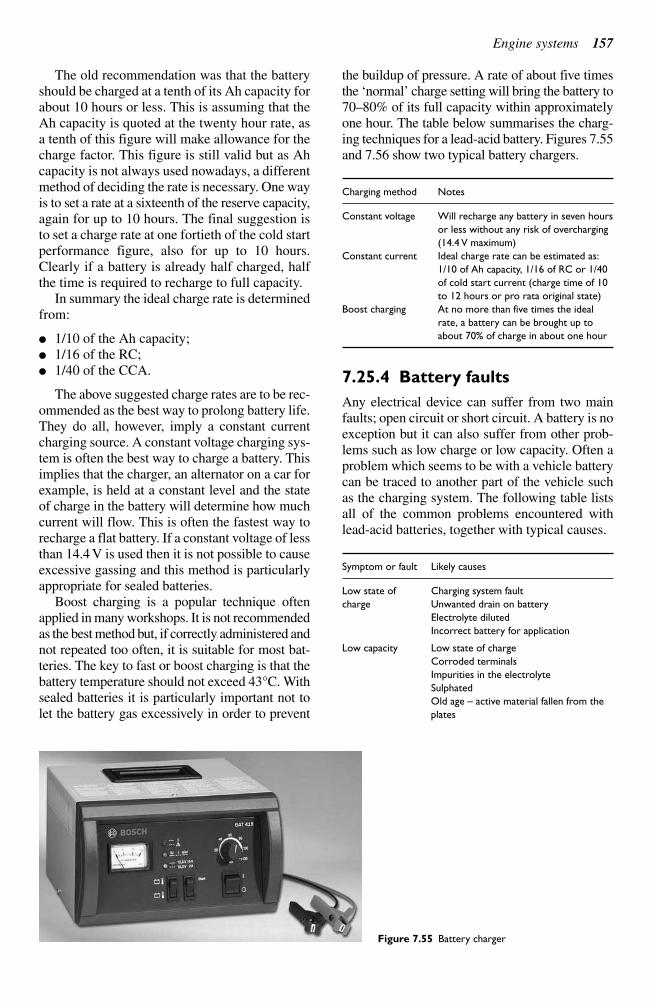
Engine systems 157
The old recommendation was that the battery
should be charged at a tenth of its Ah capacity for
about 10 hours or less. This is assuming that the
Ah capacity is quoted at the twenty hour rate, as
a tenth of this figure will make allowance for the
charge factor. This figure is still valid but as Ah
capacity is not always used nowadays, a different
method of deciding the rate is necessary. One way
is to set a rate at a sixteenth of the reserve capacity,
again for up to 10 hours. The final suggestion is
to set a charge rate at one fortieth of the cold start
performance figure, also for up to 10 hours.
Clearly if a battery is already half charged, half
the time is required to recharge to full capacity.
In summary the ideal charge rate is determined
from:
1/10 of the Ah capacity;
1/16 of the RC;
1/40 of the CCA.
The above suggested charge rates are to be rec-
ommended as the best way to prolong battery life.
They do all, however, imply a constant current
charging source. A constant voltage charging sys-
tem is often the best way to charge a battery. This
implies that the charger, an alternator on a car for
example, is held at a constant level and the state
of charge in the battery will determine how much
current will flow. This is often the fastest way to
recharge a flat battery. If a constant voltage of less
than 14.4 V is used then it is not possible to cause
excessive gassing and this method is particularly
appropriate for sealed batteries.
Boost charging is a popular technique often
applied in many workshops. It is not recommended
as the best method but, if correctly administered and
not repeated too often, it is suitable for most bat-
teries. The key to fast or boost charging is that the
battery temperature should not exceed 43°C. With
sealed batteries it is particularly important not to
let the battery gas excessively in order to prevent
the buildup of pressure. A rate of about five times
the ‘normal’ charge setting will bring the battery to70–80% of its full capacity within approximatelyone hour. The table below summarises the charg-ing techniques for a lead-acid battery. Figures 7.55and 7.56 show two typical battery chargers.
Charging method Notes
Constant voltage Will recharge any battery in seven hours
or less without any risk of overcharging
(14.4 V maximum)
Constant current Ideal charge rate can be estimated as:
1/10 of Ah capacity, 1/16 of RC or 1/40
of cold start current (charge time of 10
to 12 hours or pro rata original state)
Boost charging At no more than five times the ideal
rate, a battery can be brought up to
about 70% of charge in about one hour
7.25.4 Battery faults
Any electrical device can suffer from two mainfaults; open circuit or short circuit. A battery is noexception but it can also suffer from other prob-lems such as low charge or low capacity. Often aproblem which seems to be with a vehicle batterycan be traced to another part of the vehicle suchas the charging system. The following table listsall of the common problems encountered withlead-acid batteries, together with typical causes.
Symptom or fault Likely causes
Low state of Charging system fault
charge Unwanted drain on battery
Electrolyte diluted
Incorrect battery for application
Low capacity Low state of charge
Corroded terminals
Impurities in the electrolyte
Sulphated
Old age – active material fallen from the
plates
Figure 7.55 Battery charger
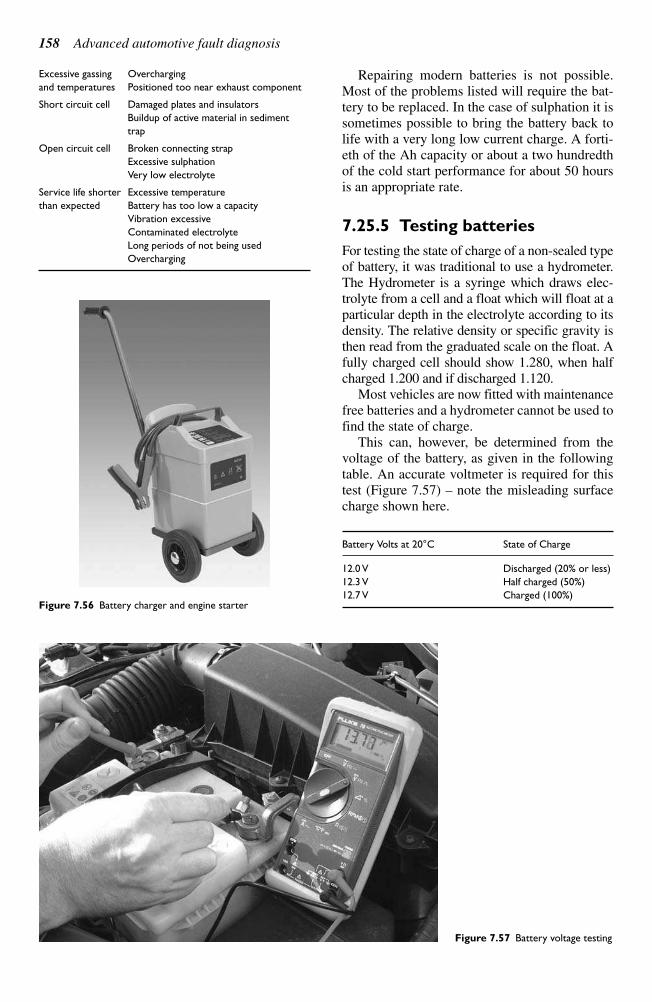
158 Advanced automotive fault diagnosis
Excessive gassing Overcharging
and temperatures Positioned too near exhaust component
Short circuit cell Damaged plates and insulators
Buildup of active material in sediment
trap
Open circuit cell Broken connecting strap
Excessive sulphation
Very low electrolyte
Service life shorter Excessive temperature
than expected Battery has too low a capacity
Vibration excessive
Contaminated electrolyte
Long periods of not being used
Overcharging
Repairing modern batteries is not possible.
Most of the problems listed will require the bat-
tery to be replaced. In the case of sulphation it is
sometimes possible to bring the battery back to
life with a very long low current charge. A forti-
eth of the Ah capacity or about a two hundredth
of the cold start performance for about 50 hours
is an appropriate rate.
7.25.5 Testing batteries
For testing the state of charge of a non-sealed type
of battery, it was traditional to use a hydrometer.
The Hydrometer is a syringe which draws elec-
trolyte from a cell and a float which will float at a
particular depth in the electrolyte according to its
density. The relative density or specific gravity is
then read from the graduated scale on the float. A
fully charged cell should show 1.280, when half
charged 1.200 and if discharged 1.120.
Most vehicles are now fitted with maintenance
free batteries and a hydrometer cannot be used to
find the state of charge.
This can, however, be determined from the
voltage of the battery, as given in the following
table. An accurate voltmeter is required for this
test (Figure 7.57) – note the misleading surfacecharge shown here.
Battery Volts at 20°C State of Charge
12.0 V Discharged (20% or less)
12.3 V Half charged (50%)
12.7 V Charged (100%)Figure 7.56 Battery charger and engine starter
Figure 7.57 Battery voltage testing
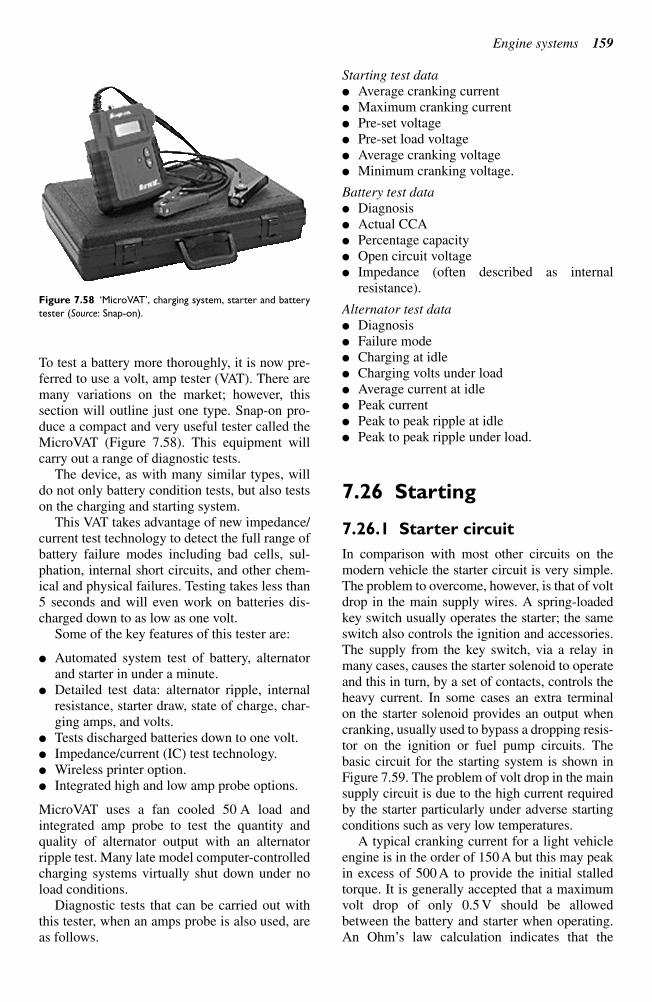
Engine systems 159
To test a battery more thoroughly, it is now pre-
ferred to use a volt, amp tester (VAT). There are
many variations on the market; however, this
section will outline just one type. Snap-on pro-
duce a compact and very useful tester called the
MicroVAT (Figure 7.58). This equipment will
carry out a range of diagnostic tests.
The device, as with many similar types, will
do not only battery condition tests, but also tests
on the charging and starting system.
This VAT takes advantage of new impedance/
current test technology to detect the full range of
battery failure modes including bad cells, sul-
phation, internal short circuits, and other chem-
ical and physical failures. Testing takes less than
5 seconds and will even work on batteries dis-
charged down to as low as one volt.
Some of the key features of this tester are:
Automated system test of battery, alternator
and starter in under a minute.
Detailed test data: alternator ripple, internal
resistance, starter draw, state of charge, char-
ging amps, and volts.
Tests discharged batteries down to one volt.
Impedance/current (IC) test technology.
Wireless printer option.
Integrated high and low amp probe options.
MicroVAT uses a fan cooled 50 A load and
integrated amp probe to test the quantity and
quality of alternator output with an alternator
ripple test. Many late model computer-controlled
charging systems virtually shut down under no
load conditions.
Diagnostic tests that can be carried out with
this tester, when an amps probe is also used, are
as follows.
Starting test data
Average cranking current
Maximum cranking current
Pre-set voltage
Pre-set load voltage
Average cranking voltage
Minimum cranking voltage.
Battery test data
Diagnosis
Actual CCA
Percentage capacity
Open circuit voltage
Impedance (often described as internal
resistance).
Alternator test data
Diagnosis
Failure mode
Charging at idle
Charging volts under load
Average current at idle
Peak current
Peak to peak ripple at idle
Peak to peak ripple under load.
7.26 Starting
7.26.1 Starter circuit
In comparison with most other circuits on the
modern vehicle the starter circuit is very simple.
The problem to overcome, however, is that of volt
drop in the main supply wires. A spring-loaded
key switch usually operates the starter; the same
switch also controls the ignition and accessories.
The supply from the key switch, via a relay in
many cases, causes the starter solenoid to operate
and this in turn, by a set of contacts, controls the
heavy current. In some cases an extra terminal
on the starter solenoid provides an output when
cranking, usually used to bypass a dropping resis-
tor on the ignition or fuel pump circuits. The
basic circuit for the starting system is shown in
Figure 7.59. The problem of volt drop in the main
supply circuit is due to the high current required
by the starter particularly under adverse starting
conditions such as very low temperatures.
A typical cranking current for a light vehicle
engine is in the order of 150 A but this may peak
in excess of 500 A to provide the initial stalled
torque. It is generally accepted that a maximum
volt drop of only 0.5 V should be allowed
between the battery and starter when operating.
An Ohm’s law calculation indicates that the
Figure 7.58 ‘MicroVAT’, charging system, starter and battery
tester (Source: Snap-on).
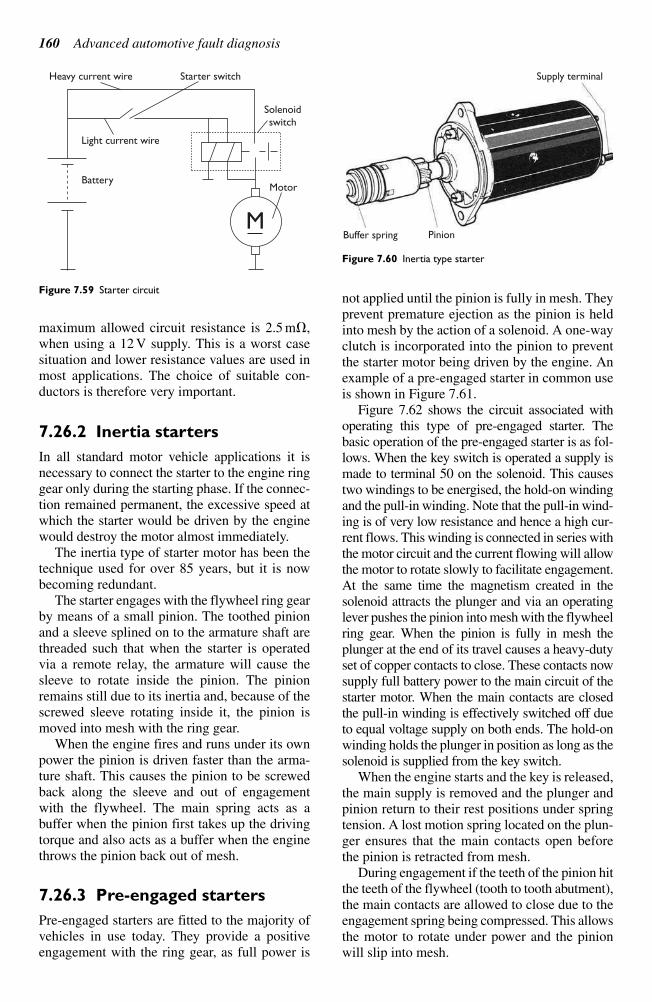
160 Advanced automotive fault diagnosis
maximum allowed circuit resistance is 2.5 m,
when using a 12 V supply. This is a worst case
situation and lower resistance values are used in
most applications. The choice of suitable con-
ductors is therefore very important.
7.26.2 Inertia starters
In all standard motor vehicle applications it is
necessary to connect the starter to the engine ring
gear only during the starting phase. If the connec-
tion remained permanent, the excessive speed at
which the starter would be driven by the engine
would destroy the motor almost immediately.
The inertia type of starter motor has been the
technique used for over 85 years, but it is now
becoming redundant.
The starter engages with the flywheel ring gear
by means of a small pinion. The toothed pinion
and a sleeve splined on to the armature shaft are
threaded such that when the starter is operated
via a remote relay, the armature will cause the
sleeve to rotate inside the pinion. The pinion
remains still due to its inertia and, because of the
screwed sleeve rotating inside it, the pinion is
moved into mesh with the ring gear.
When the engine fires and runs under its own
power the pinion is driven faster than the arma-
ture shaft. This causes the pinion to be screwed
back along the sleeve and out of engagement
with the flywheel. The main spring acts as a
buffer when the pinion first takes up the driving
torque and also acts as a buffer when the engine
throws the pinion back out of mesh.
7.26.3 Pre-engaged starters
Pre-engaged starters are fitted to the majority of
vehicles in use today. They provide a positive
engagement with the ring gear, as full power is
not applied until the pinion is fully in mesh. They
prevent premature ejection as the pinion is held
into mesh by the action of a solenoid. A one-way
clutch is incorporated into the pinion to prevent
the starter motor being driven by the engine. An
example of a pre-engaged starter in common use
is shown in Figure 7.61.
Figure 7.62 shows the circuit associated with
operating this type of pre-engaged starter. The
basic operation of the pre-engaged starter is as fol-
lows. When the key switch is operated a supply is
made to terminal 50 on the solenoid. This causes
two windings to be energised, the hold-on winding
and the pull-in winding. Note that the pull-in wind-
ing is of very low resistance and hence a high cur-
rent flows. This winding is connected in series with
the motor circuit and the current flowing will allow
the motor to rotate slowly to facilitate engagement.
At the same time the magnetism created in the
solenoid attracts the plunger and via an operating
lever pushes the pinion into mesh with the flywheel
ring gear. When the pinion is fully in mesh the
plunger at the end of its travel causes a heavy-duty
set of copper contacts to close. These contacts now
supply full battery power to the main circuit of the
starter motor. When the main contacts are closed
the pull-in winding is effectively switched off due
to equal voltage supply on both ends. The hold-on
winding holds the plunger in position as long as the
solenoid is supplied from the key switch.
When the engine starts and the key is released,
the main supply is removed and the plunger and
pinion return to their rest positions under spring
tension. A lost motion spring located on the plun-
ger ensures that the main contacts open before
the pinion is retracted from mesh.
During engagement if the teeth of the pinion hit
the teeth of the flywheel (tooth to tooth abutment),
the main contacts are allowed to close due to the
engagement spring being compressed. This allows
the motor to rotate under power and the pinion
will slip into mesh.
M
Heavy current wire Starter switch
Solenoidswitch
MotorBattery
Light current wire
Figure 7.59 Starter circuit
Supply terminal
PinionBuffer spring
Figure 7.60 Inertia type starter
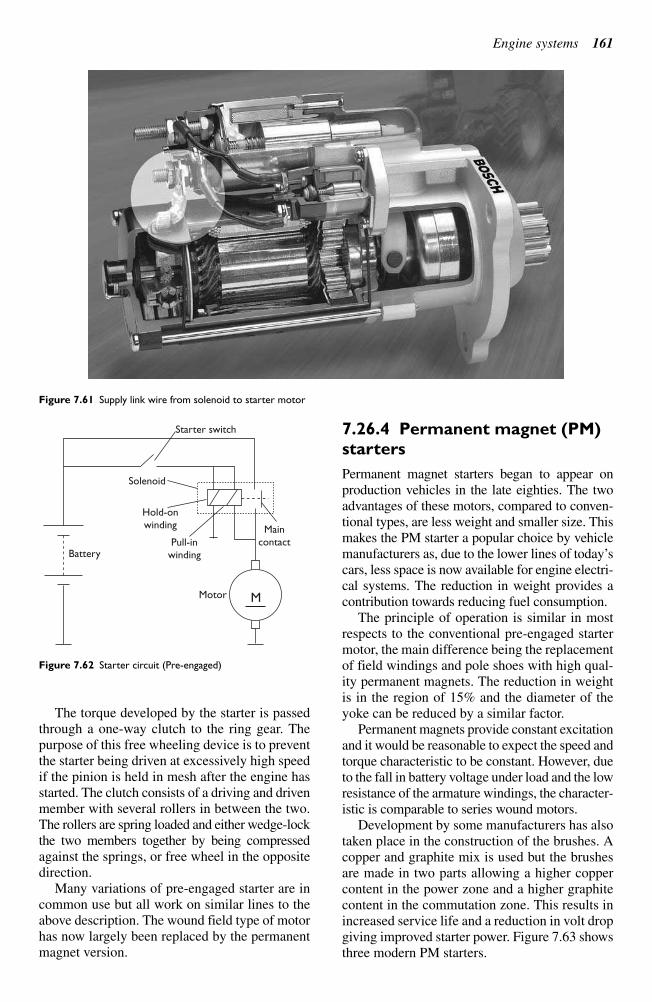
Engine systems 161
The torque developed by the starter is passed
through a one-way clutch to the ring gear. The
purpose of this free wheeling device is to prevent
the starter being driven at excessively high speed
if the pinion is held in mesh after the engine has
started. The clutch consists of a driving and driven
member with several rollers in between the two.
The rollers are spring loaded and either wedge-lock
the two members together by being compressed
against the springs, or free wheel in the opposite
direction.
Many variations of pre-engaged starter are in
common use but all work on similar lines to the
above description. The wound field type of motor
has now largely been replaced by the permanent
magnet version.
7.26.4 Permanent magnet (PM)
starters
Permanent magnet starters began to appear on
production vehicles in the late eighties. The two
advantages of these motors, compared to conven-
tional types, are less weight and smaller size. This
makes the PM starter a popular choice by vehicle
manufacturers as, due to the lower lines of today’scars, less space is now available for engine electri-cal systems. The reduction in weight provides acontribution towards reducing fuel consumption.
The principle of operation is similar in mostrespects to the conventional pre-engaged startermotor, the main difference being the replacementof field windings and pole shoes with high qual-ity permanent magnets. The reduction in weightis in the region of 15% and the diameter of theyoke can be reduced by a similar factor.
Permanent magnets provide constant excitationand it would be reasonable to expect the speed andtorque characteristic to be constant. However, dueto the fall in battery voltage under load and the lowresistance of the armature windings, the character-istic is comparable to series wound motors.
Development by some manufacturers has alsotaken place in the construction of the brushes. Acopper and graphite mix is used but the brushesare made in two parts allowing a higher coppercontent in the power zone and a higher graphitecontent in the commutation zone. This results inincreased service life and a reduction in volt dropgiving improved starter power. Figure 7.63 showsthree modern PM starters.
Figure 7.61 Supply link wire from solenoid to starter motor
M
Starter switch
Solenoid
Battery
Motor
MaincontactPull-in
winding
Hold-onwinding
Figure 7.62 Starter circuit (Pre-engaged)
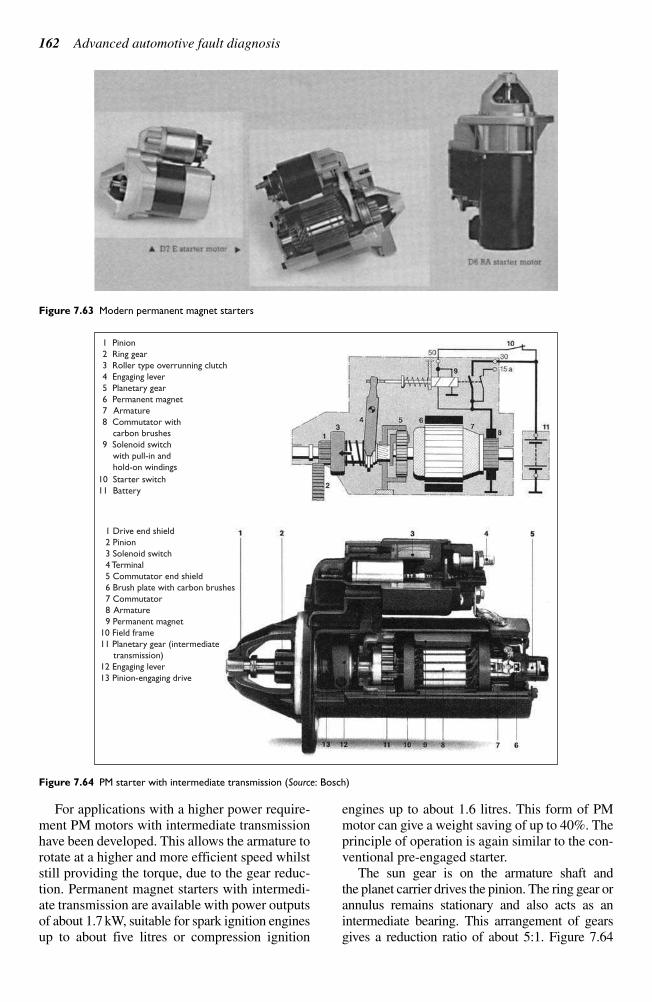
162 Advanced automotive fault diagnosis
1 Pinion
2 Ring gear
3 Roller type overrunning clutch
4 Engaging lever
5 Planetary gear
6 Permanent magnet
7 Armature
8 Commutator with
carbon brushes
9 Solenoid switch
with pull-in and
hold-on windings
10 Starter switch
11 Battery
1 Drive end shield
2 Pinion
3 Solenoid switch
4 Terminal
5 Commutator end shield
6 Brush plate with carbon brushes
7 Commutator
8 Armature
9 Permanent magnet
10 Field frame
11 Planetary gear (intermediate
transmission)
12 Engaging lever
13 Pinion-engaging drive
Figure 7.64 PM starter with intermediate transmission (Source: Bosch)
Figure 7.63 Modern permanent magnet starters
For applications with a higher power require-
ment PM motors with intermediate transmission
have been developed. This allows the armature to
rotate at a higher and more efficient speed whilst
still providing the torque, due to the gear reduc-
tion. Permanent magnet starters with intermedi-
ate transmission are available with power outputs
of about 1.7 kW, suitable for spark ignition engines
up to about five litres or compression ignition
engines up to about 1.6 litres. This form of PM
motor can give a weight saving of up to 40%. The
principle of operation is again similar to the con-
ventional pre-engaged starter.
The sun gear is on the armature shaft and
the planet carrier drives the pinion. The ring gear or
annulus remains stationary and also acts as an
intermediate bearing. This arrangement of gears
gives a reduction ratio of about 5:1. Figure 7.64
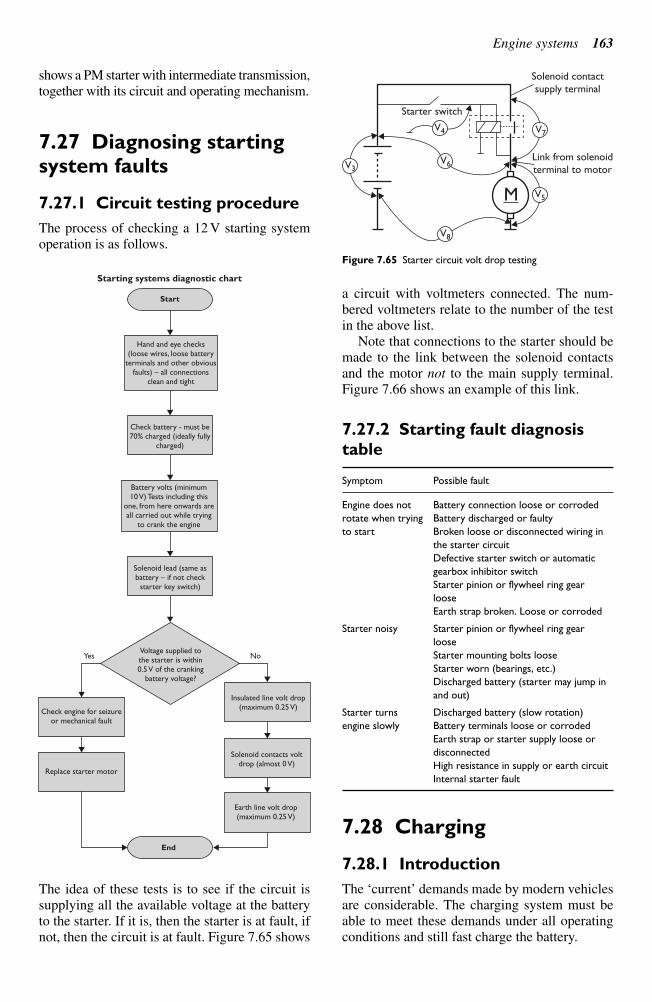
Engine systems 163
shows a PM starter with intermediate transmission,
together with its circuit and operating mechanism.
7.27 Diagnosing startingsystem faults
7.27.1 Circuit testing procedure
The process of checking a 12 V starting system
operation is as follows.
The idea of these tests is to see if the circuit is
supplying all the available voltage at the battery
to the starter. If it is, then the starter is at fault, if
not, then the circuit is at fault. Figure 7.65 shows
a circuit with voltmeters connected. The num-
bered voltmeters relate to the number of the test
in the above list.
Note that connections to the starter should be
made to the link between the solenoid contacts
and the motor not to the main supply terminal.
Figure 7.66 shows an example of this link.
7.27.2 Starting fault diagnosis
table
Symptom Possible fault
Engine does not Battery connection loose or corroded
rotate when trying Battery discharged or faulty
to start Broken loose or disconnected wiring in
the starter circuit
Defective starter switch or automatic
gearbox inhibitor switch
Starter pinion or flywheel ring gear
loose
Earth strap broken. Loose or corroded
Starter noisy Starter pinion or flywheel ring gear
loose
Starter mounting bolts loose
Starter worn (bearings, etc.)
Discharged battery (starter may jump in
and out)
Starter turns Discharged battery (slow rotation)
engine slowly Battery terminals loose or corroded
Earth strap or starter supply loose or
disconnected
High resistance in supply or earth circuit
Internal starter fault
7.28 Charging
7.28.1 Introduction
The ‘current’ demands made by modern vehiclesare considerable. The charging system must beable to meet these demands under all operatingconditions and still fast charge the battery.
Hand and eye checks(loose wires, loose battery
terminals and other obviousfaults) – all connections
clean and tight
Check battery - must be70% charged (ideally fully
charged)
Battery volts (minimum10 V) Tests including this
one, from here onwards areall carried out while trying
to crank the engine
Solenoid lead (same asbattery – if not check
starter key switch)
Voltage supplied tothe starter is within0.5 V of the cranking
battery voltage?
Start
Starting systems diagnostic chart
End
Insulated line volt drop(maximum 0.25 V)
Check engine for seizureor mechanical fault
Solenoid contacts voltdrop (almost 0 V)
NoYes
Replace starter motor
Earth line volt drop(maximum 0.25 V)
V7
V5
V8
V3V6
V4
M
Solenoid contactsupply terminal
Link from solenoidterminal to motor
Starter switch
Figure 7.65 Starter circuit volt drop testing
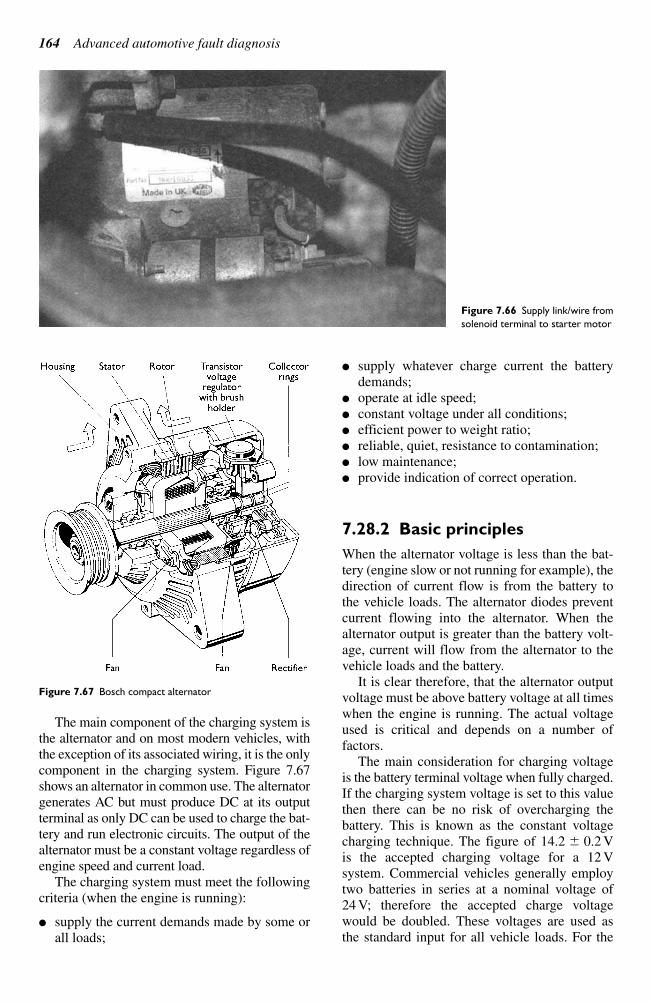
164 Advanced automotive fault diagnosis
The main component of the charging system is
the alternator and on most modern vehicles, with
the exception of its associated wiring, it is the only
component in the charging system. Figure 7.67
shows an alternator in common use. The alternator
generates AC but must produce DC at its output
terminal as only DC can be used to charge the bat-
tery and run electronic circuits. The output of the
alternator must be a constant voltage regardless of
engine speed and current load.
The charging system must meet the following
criteria (when the engine is running):
supply the current demands made by some or
all loads;
supply whatever charge current the battery
demands;
operate at idle speed;
constant voltage under all conditions;
efficient power to weight ratio;
reliable, quiet, resistance to contamination;
low maintenance;
provide indication of correct operation.
7.28.2 Basic principles
When the alternator voltage is less than the bat-
tery (engine slow or not running for example), the
direction of current flow is from the battery to
the vehicle loads. The alternator diodes prevent
current flowing into the alternator. When the
alternator output is greater than the battery volt-
age, current will flow from the alternator to the
vehicle loads and the battery.
It is clear therefore, that the alternator output
voltage must be above battery voltage at all times
when the engine is running. The actual voltage
used is critical and depends on a number of
factors.
The main consideration for charging voltage
is the battery terminal voltage when fully charged.
If the charging system voltage is set to this value
then there can be no risk of overcharging the
battery. This is known as the constant voltage
charging technique. The figure of 14.2 0.2 V
is the accepted charging voltage for a 12 V
system. Commercial vehicles generally employ
two batteries in series at a nominal voltage of
24 V; therefore the accepted charge voltage
would be doubled. These voltages are used as
the standard input for all vehicle loads. For the
Figure 7.66 Supply link/wire from
solenoid terminal to starter motor
Figure 7.67 Bosch compact alternator
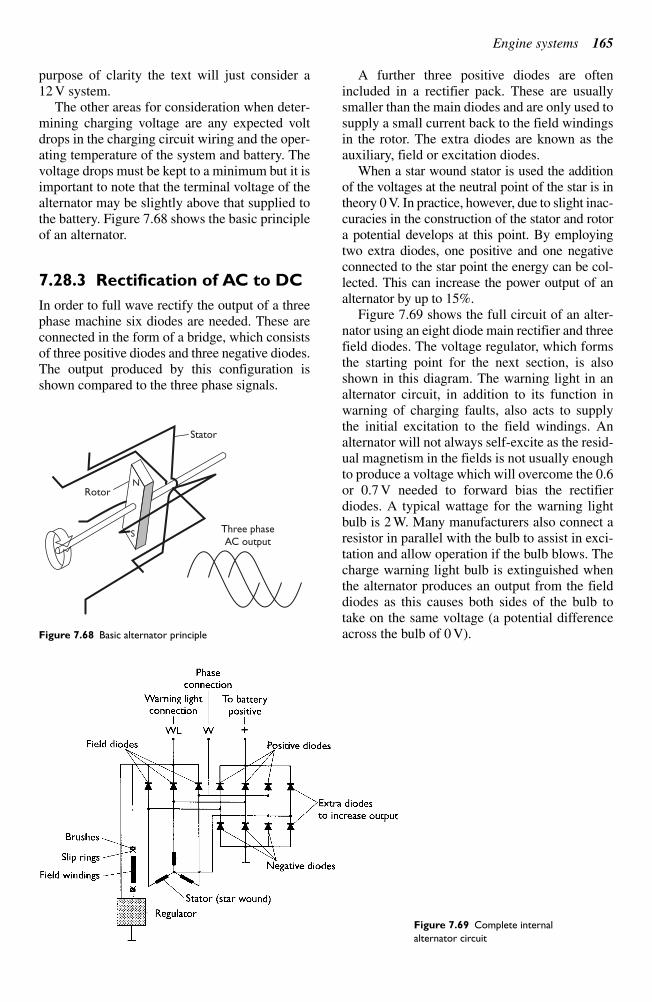
Engine systems 165
purpose of clarity the text will just consider a
12 V system.
The other areas for consideration when deter-
mining charging voltage are any expected volt
drops in the charging circuit wiring and the oper-
ating temperature of the system and battery. The
voltage drops must be kept to a minimum but it is
important to note that the terminal voltage of the
alternator may be slightly above that supplied to
the battery. Figure 7.68 shows the basic principle
of an alternator.
7.28.3 Rectification of AC to DC
In order to full wave rectify the output of a three
phase machine six diodes are needed. These are
connected in the form of a bridge, which consists
of three positive diodes and three negative diodes.
The output produced by this configuration is
shown compared to the three phase signals.
A further three positive diodes are often
included in a rectifier pack. These are usually
smaller than the main diodes and are only used to
supply a small current back to the field windings
in the rotor. The extra diodes are known as the
auxiliary, field or excitation diodes.
When a star wound stator is used the addition
of the voltages at the neutral point of the star is in
theory 0 V. In practice, however, due to slight inac-
curacies in the construction of the stator and rotor
a potential develops at this point. By employing
two extra diodes, one positive and one negative
connected to the star point the energy can be col-
lected. This can increase the power output of an
alternator by up to 15%.
Figure 7.69 shows the full circuit of an alter-
nator using an eight diode main rectifier and three
field diodes. The voltage regulator, which forms
the starting point for the next section, is also
shown in this diagram. The warning light in an
alternator circuit, in addition to its function in
warning of charging faults, also acts to supply
the initial excitation to the field windings. An
alternator will not always self-excite as the resid-
ual magnetism in the fields is not usually enough
to produce a voltage which will overcome the 0.6
or 0.7 V needed to forward bias the rectifier
diodes. A typical wattage for the warning light
bulb is 2 W. Many manufacturers also connect a
resistor in parallel with the bulb to assist in exci-
tation and allow operation if the bulb blows. The
charge warning light bulb is extinguished when
the alternator produces an output from the field
diodes as this causes both sides of the bulb to
take on the same voltage (a potential difference
across the bulb of 0 V).
Three phaseAC output
Stator
RotorN
S
Figure 7.68 Basic alternator principle
Figure 7.69 Complete internal
alternator circuit
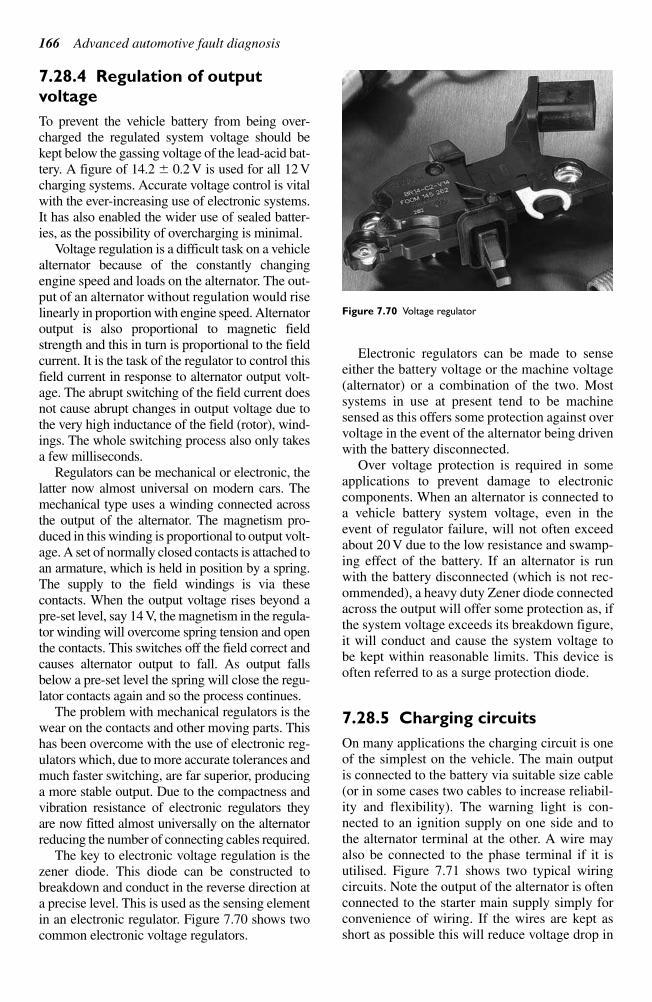
166 Advanced automotive fault diagnosis
7.28.4 Regulation of output
voltage
To prevent the vehicle battery from being over-
charged the regulated system voltage should be
kept below the gassing voltage of the lead-acid bat-
tery. A figure of 14.2 0.2 V is used for all 12 V
charging systems. Accurate voltage control is vital
with the ever-increasing use of electronic systems.
It has also enabled the wider use of sealed batter-
ies, as the possibility of overcharging is minimal.
Voltage regulation is a difficult task on a vehicle
alternator because of the constantly changing
engine speed and loads on the alternator. The out-
put of an alternator without regulation would rise
linearly in proportion with engine speed. Alternator
output is also proportional to magnetic field
strength and this in turn is proportional to the field
current. It is the task of the regulator to control this
field current in response to alternator output volt-
age. The abrupt switching of the field current does
not cause abrupt changes in output voltage due to
the very high inductance of the field (rotor), wind-
ings. The whole switching process also only takes
a few milliseconds.
Regulators can be mechanical or electronic, the
latter now almost universal on modern cars. The
mechanical type uses a winding connected across
the output of the alternator. The magnetism pro-
duced in this winding is proportional to output volt-
age. A set of normally closed contacts is attached to
an armature, which is held in position by a spring.
The supply to the field windings is via these
contacts. When the output voltage rises beyond a
pre-set level, say 14 V, the magnetism in the regula-
tor winding will overcome spring tension and open
the contacts. This switches off the field correct and
causes alternator output to fall. As output falls
below a pre-set level the spring will close the regu-
lator contacts again and so the process continues.
The problem with mechanical regulators is the
wear on the contacts and other moving parts. This
has been overcome with the use of electronic reg-
ulators which, due to more accurate tolerances and
much faster switching, are far superior, producing
a more stable output. Due to the compactness and
vibration resistance of electronic regulators they
are now fitted almost universally on the alternator
reducing the number of connecting cables required.
The key to electronic voltage regulation is the
zener diode. This diode can be constructed to
breakdown and conduct in the reverse direction at
a precise level. This is used as the sensing element
in an electronic regulator. Figure 7.70 shows two
common electronic voltage regulators.
Electronic regulators can be made to sense
either the battery voltage or the machine voltage
(alternator) or a combination of the two. Most
systems in use at present tend to be machine
sensed as this offers some protection against over
voltage in the event of the alternator being driven
with the battery disconnected.
Over voltage protection is required in some
applications to prevent damage to electronic
components. When an alternator is connected to
a vehicle battery system voltage, even in the
event of regulator failure, will not often exceed
about 20 V due to the low resistance and swamp-
ing effect of the battery. If an alternator is run
with the battery disconnected (which is not rec-
ommended), a heavy duty Zener diode connected
across the output will offer some protection as, if
the system voltage exceeds its breakdown figure,
it will conduct and cause the system voltage to
be kept within reasonable limits. This device is
often referred to as a surge protection diode.
7.28.5 Charging circuits
On many applications the charging circuit is one
of the simplest on the vehicle. The main output
is connected to the battery via suitable size cable
(or in some cases two cables to increase reliabil-
ity and flexibility). The warning light is con-
nected to an ignition supply on one side and to
the alternator terminal at the other. A wire may
also be connected to the phase terminal if it is
utilised. Figure 7.71 shows two typical wiring
circuits. Note the output of the alternator is often
connected to the starter main supply simply for
convenience of wiring. If the wires are kept as
short as possible this will reduce voltage drop in
Figure 7.70 Voltage regulator
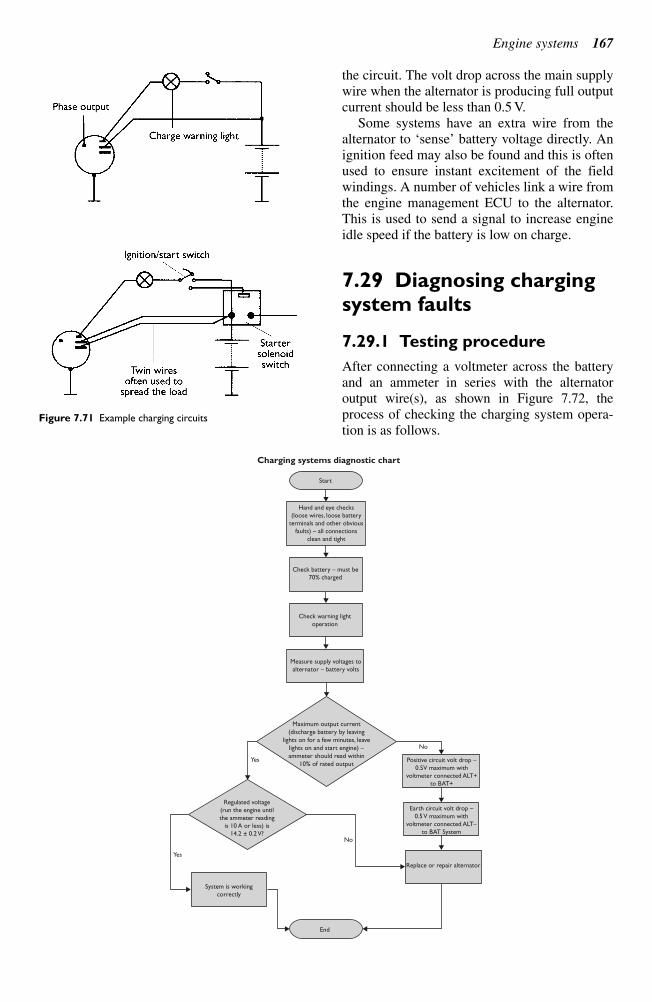
Engine systems 167
the circuit. The volt drop across the main supply
wire when the alternator is producing full output
current should be less than 0.5 V.
Some systems have an extra wire from the
alternator to ‘sense’ battery voltage directly. Anignition feed may also be found and this is oftenused to ensure instant excitement of the fieldwindings. A number of vehicles link a wire fromthe engine management ECU to the alternator.This is used to send a signal to increase engineidle speed if the battery is low on charge.
7.29 Diagnosing chargingsystem faults
7.29.1 Testing procedure
After connecting a voltmeter across the batteryand an ammeter in series with the alternator output wire(s), as shown in Figure 7.72, theprocess of checking the charging system opera-tion is as follows.
Figure 7.71 Example charging circuits
Hand and eye checks
(loose wires, loose battery
terminals and other obvious
faults) – all connections
clean and tight
Check battery – must be
70% charged
Check warning light
operation
Yes
Yes
No
No
Start
End
Measure supply voltages to
alternator – battery volts
Maximum output current
(discharge battery by leaving
lights on for a few minutes, leave
lights on and start engine) –
ammeter should read within
10% of rated outputPositive circuit volt drop –
0.5V maximum with
voltmeter connected ALT+
to BAT+
Earth circuit volt drop –
0.5 V maximum with
voltmeter connected ALT–
to BAT System
Replace or repair alternator
System is working
correctly
Regulated voltage
(run the engine until
the ammeter reading
is 10 A or less) is
14.2 ± 0.2 V?
Charging systems diagnostic chart
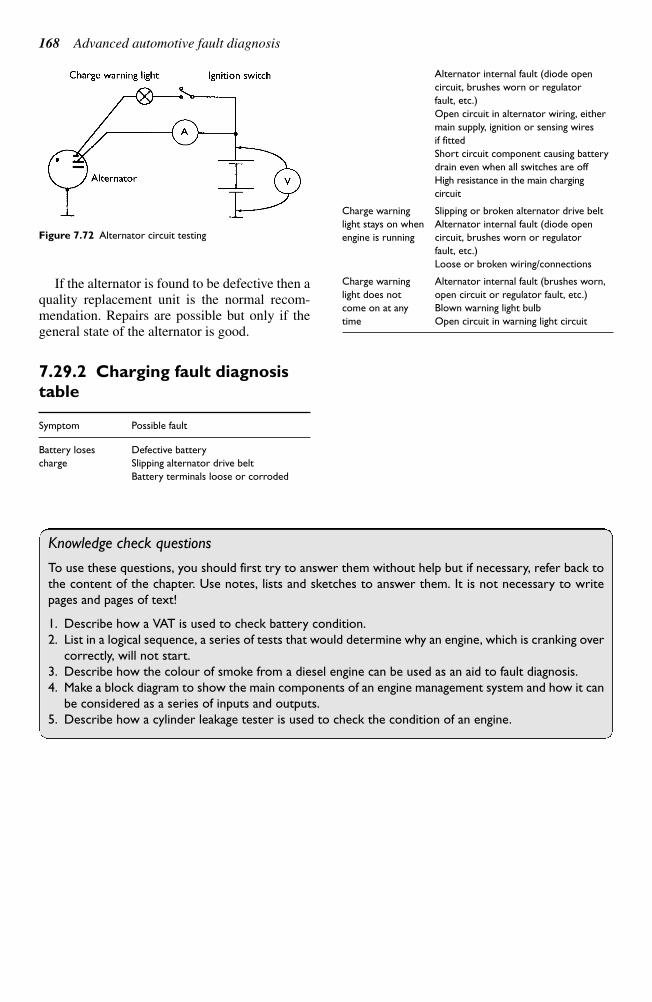
If the alternator is found to be defective then a
quality replacement unit is the normal recom-
mendation. Repairs are possible but only if the
general state of the alternator is good.
7.29.2 Charging fault diagnosis
table
Symptom Possible fault
Battery loses Defective battery
charge Slipping alternator drive belt
Battery terminals loose or corroded
Alternator internal fault (diode open
circuit, brushes worn or regulator
fault, etc.)
Open circuit in alternator wiring, either
main supply, ignition or sensing wires
if fitted
Short circuit component causing battery
drain even when all switches are off
High resistance in the main charging
circuit
Charge warning Slipping or broken alternator drive belt
light stays on when Alternator internal fault (diode open
engine is running circuit, brushes worn or regulator
fault, etc.)
Loose or broken wiring/connections
Charge warning Alternator internal fault (brushes worn,
light does not open circuit or regulator fault, etc.)
come on at any Blown warning light bulb
time Open circuit in warning light circuit
168 Advanced automotive fault diagnosis
Knowledge check questions
To use these questions, you should first try to answer them without help but if necessary, refer back to
the content of the chapter. Use notes, lists and sketches to answer them. It is not necessary to write
pages and pages of text!
1. Describe how a VAT is used to check battery condition.
2. List in a logical sequence, a series of tests that would determine why an engine, which is cranking over
correctly, will not start.
3. Describe how the colour of smoke from a diesel engine can be used as an aid to fault diagnosis.
4. Make a block diagram to show the main components of an engine management system and how it can
be considered as a series of inputs and outputs.
5. Describe how a cylinder leakage tester is used to check the condition of an engine.
Figure 7.72 Alternator circuit testing
8.1 Brakes
8.1.1 Introduction
The main braking system of a car works by
hydraulics. This means that when the driver presses
the brake pedal, liquid pressure forces pistons to
apply brakes on each wheel. A handbrake system,
usually operated by a lever and cables, is used for
parking. Most hand brakes operate on the rear
wheels.
Two types of light vehicle brakes are used.
Disc brakes are used on the front wheels of some
cars and on all wheels of sports and performance
cars. Braking pressure forces brake pads against
both sides of a steel disc. Drum brakes are fitted
on the rear wheels of some cars and on all wheels
of older vehicles. Braking pressure forces brake
shoes to expand outwards into contact with a
drum. The important part of brake pads and
shoes is a friction lining that grips well and with-
stands wear.
8.1.2 Principle of hydraulic
braking
A complete system includes a master cylinder
operating several wheel cylinders. The system is
designed to give the power amplification needed
for braking the particular vehicle. On any vehicle,
when braking, a lot of the weight is transferred to
the front wheels. Most braking effort is therefore
designed to work on the front brakes. Some cars
have special hydraulic valves to limit rear wheel
braking. This reduces the chance of the rear
wheels locking and skidding.
The main merits of hydraulic brakes are as
follows:
almost immediate reaction to pedal pressure
(no free play as with mechanical linkages);
automatic even pressure distribution (fluid
pressure effectively remains the same in all
parts of the system);
increase in force (liquid lever).
Caution and regular servicing is required to ensure
the following:
no air must be allowed in the hydraulic circuits
(air compresses and would not transfer the
force);
correct adjustment must be maintained between
shoe linings to drums and pads to discs (other-
wise the pedal movement would be too large);
lining materials must be free from contamin-
ation (such as oil, grease or brake fluid).
A separate mechanical system is a good safety
feature. Most vehicles have the mechanical hand
brake working on the rear wheels but a few have
it working on the front – take care.Note the importance of flexible connections
to allow for suspension and steering movement.These flexible pipes are made of high quality rub-ber and are covered in layers of strong mesh toprevent expansion when under pressure.
Extra safety is built into braking systems byusing a double acting master cylinder (Figure 8.1).This is often described as tandem and can bethought of as two cylinders in one housing. Thepressure from the pedal acts on both cylinders butfluid cannot pass from one to the other. Each cylin-der is then connected to a complete circuit. Thiscan be by a number of methods:
diagonal split; separate front and rear; duplicated front.
8.1.3 Disc and drum brake
systems
Figure 8.2 shows a typical disc brake, calliperpads and disc. The type shown is known as singleacting sliding calliper. This is because only onecylinder is used but pads are still pressed equallyon both sides of the disc by the sliding action.Disc brakes keep cooler because they are in theair stream and only part of the disc is heated as thebrakes are applied. They also throw off water bet-ter than drum brakes. In most cases servicing is
8
Chassis systems
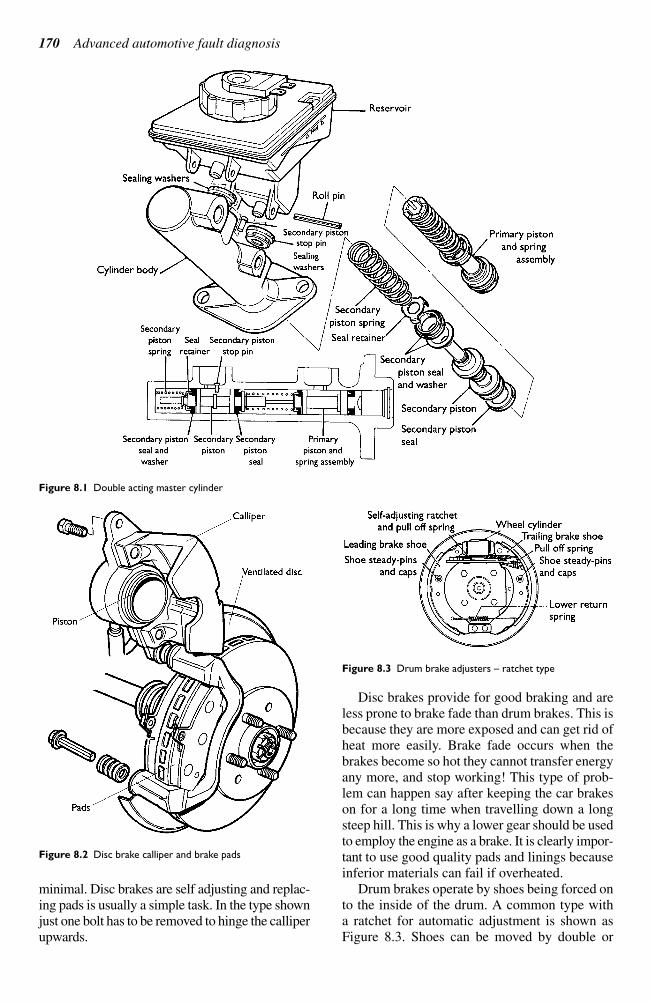
minimal. Disc brakes are self adjusting and replac-
ing pads is usually a simple task. In the type shown
just one bolt has to be removed to hinge the calliper
upwards.
Disc brakes provide for good braking and are
less prone to brake fade than drum brakes. This is
because they are more exposed and can get rid of
heat more easily. Brake fade occurs when the
brakes become so hot they cannot transfer energy
any more, and stop working! This type of prob-
lem can happen say after keeping the car brakes
on for a long time when travelling down a long
steep hill. This is why a lower gear should be used
to employ the engine as a brake. It is clearly impor-
tant to use good quality pads and linings because
inferior materials can fail if overheated.
Drum brakes operate by shoes being forced on
to the inside of the drum. A common type with
a ratchet for automatic adjustment is shown as
Figure 8.3. Shoes can be moved by double or
170 Advanced automotive fault diagnosis
Figure 8.1 Double acting master cylinder
Figure 8.2 Disc brake calliper and brake pads
Figure 8.3 Drum brake adjusters – ratchet type
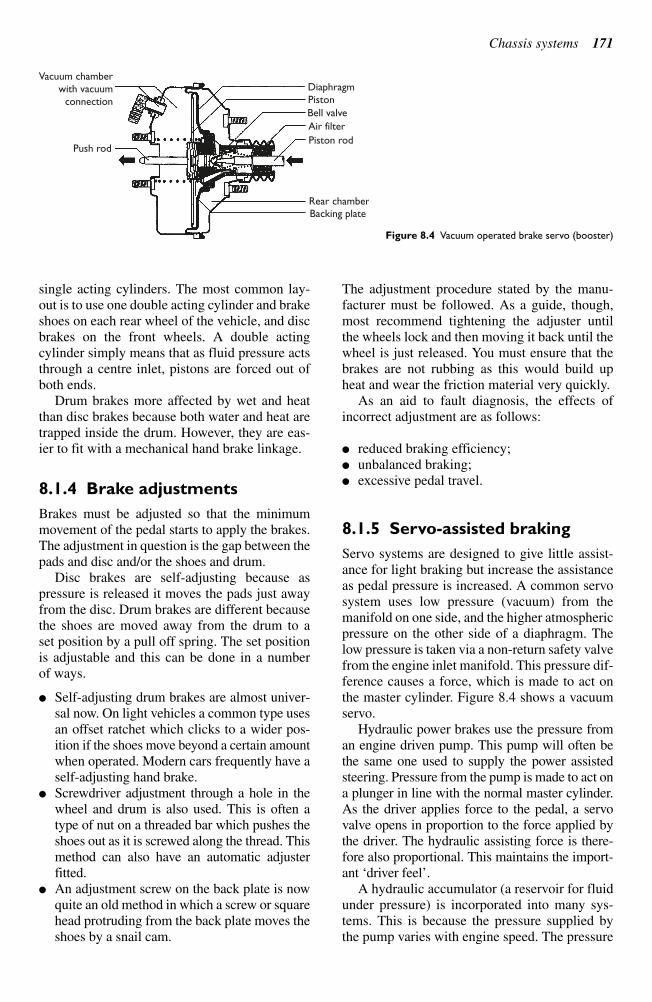
single acting cylinders. The most common lay-
out is to use one double acting cylinder and brake
shoes on each rear wheel of the vehicle, and disc
brakes on the front wheels. A double acting
cylinder simply means that as fluid pressure acts
through a centre inlet, pistons are forced out of
both ends.
Drum brakes more affected by wet and heat
than disc brakes because both water and heat are
trapped inside the drum. However, they are eas-
ier to fit with a mechanical hand brake linkage.
8.1.4 Brake adjustments
Brakes must be adjusted so that the minimum
movement of the pedal starts to apply the brakes.
The adjustment in question is the gap between the
pads and disc and/or the shoes and drum.
Disc brakes are self-adjusting because as
pressure is released it moves the pads just away
from the disc. Drum brakes are different because
the shoes are moved away from the drum to a
set position by a pull off spring. The set position
is adjustable and this can be done in a number
of ways.
Self-adjusting drum brakes are almost univer-
sal now. On light vehicles a common type uses
an offset ratchet which clicks to a wider pos-
ition if the shoes move beyond a certain amount
when operated. Modern cars frequently have a
self-adjusting hand brake.
Screwdriver adjustment through a hole in the
wheel and drum is also used. This is often a
type of nut on a threaded bar which pushes the
shoes out as it is screwed along the thread. This
method can also have an automatic adjuster
fitted.
An adjustment screw on the back plate is now
quite an old method in which a screw or square
head protruding from the back plate moves the
shoes by a snail cam.
The adjustment procedure stated by the manu-
facturer must be followed. As a guide, though,
most recommend tightening the adjuster until
the wheels lock and then moving it back until the
wheel is just released. You must ensure that the
brakes are not rubbing as this would build up
heat and wear the friction material very quickly.
As an aid to fault diagnosis, the effects of
incorrect adjustment are as follows:
reduced braking efficiency;
unbalanced braking;
excessive pedal travel.
8.1.5 Servo-assisted braking
Servo systems are designed to give little assist-
ance for light braking but increase the assistance
as pedal pressure is increased. A common servo
system uses low pressure (vacuum) from the
manifold on one side, and the higher atmospheric
pressure on the other side of a diaphragm. The
low pressure is taken via a non-return safety valve
from the engine inlet manifold. This pressure dif-
ference causes a force, which is made to act on
the master cylinder. Figure 8.4 shows a vacuum
servo.
Hydraulic power brakes use the pressure from
an engine driven pump. This pump will often be
the same one used to supply the power assisted
steering. Pressure from the pump is made to act on
a plunger in line with the normal master cylinder.
As the driver applies force to the pedal, a servo
valve opens in proportion to the force applied by
the driver. The hydraulic assisting force is there-
fore also proportional. This maintains the import-
ant ‘driver feel’.A hydraulic accumulator (a reservoir for fluid
under pressure) is incorporated into many sys-tems. This is because the pressure supplied bythe pump varies with engine speed. The pressure
Chassis systems 171
DiaphragmVacuum chamber
with vacuumconnection
Push rod
Piston
Bell valve
Air filter
Piston rod
Rear chamberBacking plate
Figure 8.4 Vacuum operated brake servo (booster)
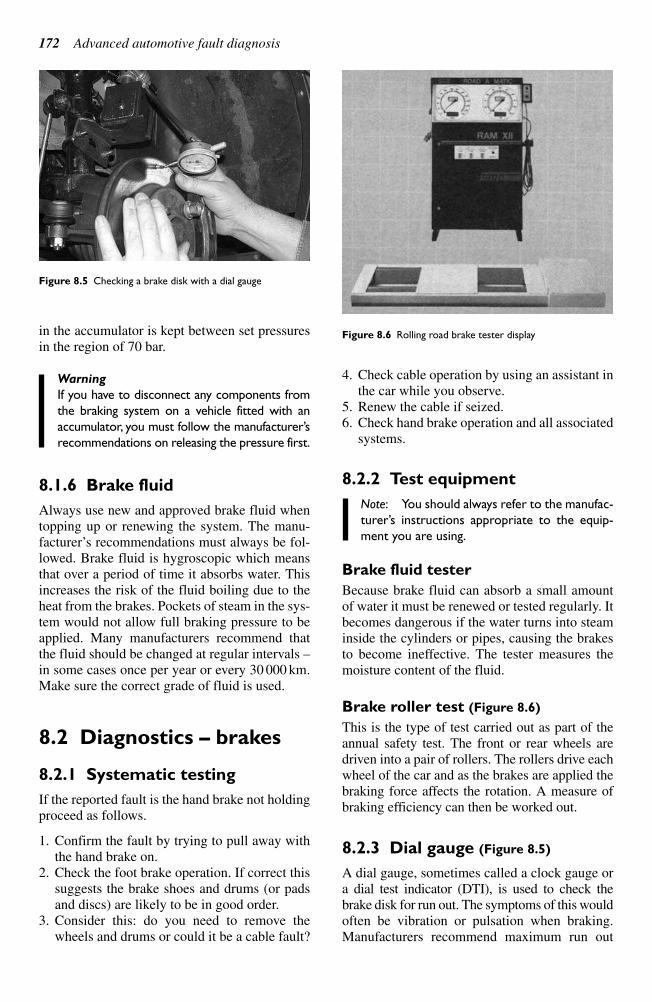
in the accumulator is kept between set pressures
in the region of 70 bar.
Warning
If you have to disconnect any components from
the braking system on a vehicle fitted with an
accumulator, you must follow the manufacturer’s
recommendations on releasing the pressure first.
8.1.6 Brake fluid
Always use new and approved brake fluid when
topping up or renewing the system. The manu-
facturer’s recommendations must always be fol-lowed. Brake fluid is hygroscopic which meansthat over a period of time it absorbs water. Thisincreases the risk of the fluid boiling due to theheat from the brakes. Pockets of steam in the sys-tem would not allow full braking pressure to beapplied. Many manufacturers recommend thatthe fluid should be changed at regular intervals –in some cases once per year or every 30 000 km.Make sure the correct grade of fluid is used.
8.2 Diagnostics – brakes
8.2.1 Systematic testing
If the reported fault is the hand brake not holdingproceed as follows.
1. Confirm the fault by trying to pull away withthe hand brake on.
2. Check the foot brake operation. If correct thissuggests the brake shoes and drums (or padsand discs) are likely to be in good order.
3. Consider this: do you need to remove thewheels and drums or could it be a cable fault?
4. Check cable operation by using an assistant inthe car while you observe.
5. Renew the cable if seized.6. Check hand brake operation and all associated
systems.
8.2.2 Test equipment
Note: You should always refer to the manufac-
turer’s instructions appropriate to the equip-
ment you are using.
Brake fluid tester
Because brake fluid can absorb a small amountof water it must be renewed or tested regularly. Itbecomes dangerous if the water turns into steaminside the cylinders or pipes, causing the brakesto become ineffective. The tester measures themoisture content of the fluid.
Brake roller test (Figure 8.6)
This is the type of test carried out as part of theannual safety test. The front or rear wheels aredriven into a pair of rollers. The rollers drive eachwheel of the car and as the brakes are applied thebraking force affects the rotation. A measure ofbraking efficiency can then be worked out.
8.2.3 Dial gauge (Figure 8.5)
A dial gauge, sometimes called a clock gauge ora dial test indicator (DTI), is used to check thebrake disk for run out. The symptoms of this wouldoften be vibration or pulsation when braking.Manufacturers recommend maximum run out
172 Advanced automotive fault diagnosis
Figure 8.5 Checking a brake disk with a dial gauge
Figure 8.6 Rolling road brake tester display
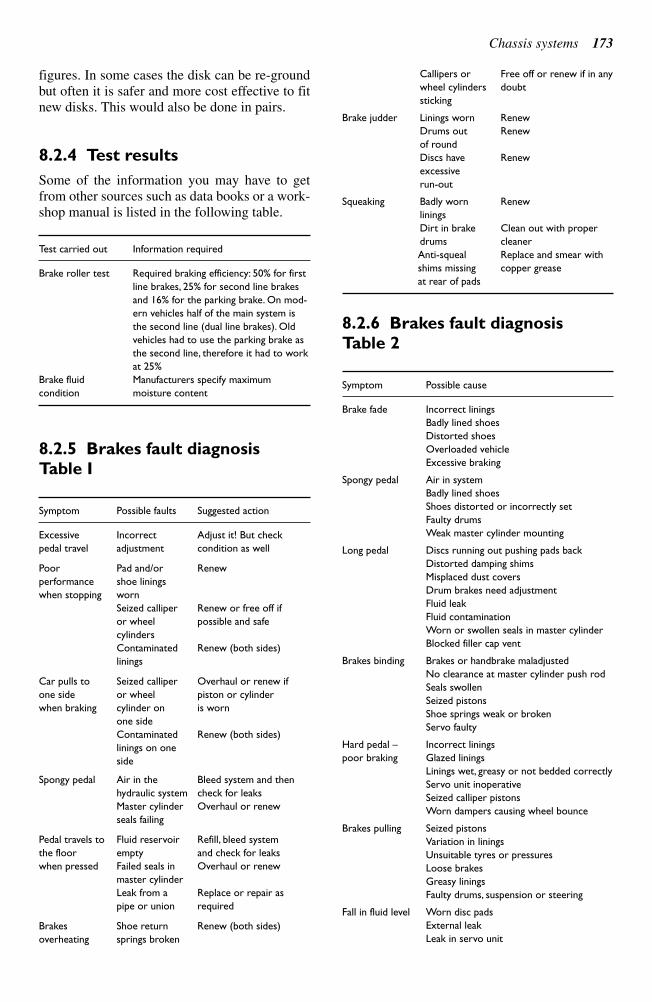
figures. In some cases the disk can be re-ground
but often it is safer and more cost effective to fit
new disks. This would also be done in pairs.
8.2.4 Test results
Some of the information you may have to get
from other sources such as data books or a work-
shop manual is listed in the following table.
Test carried out Information required
Brake roller test Required braking efficiency: 50% for first
line brakes, 25% for second line brakes
and 16% for the parking brake. On mod-
ern vehicles half of the main system is
the second line (dual line brakes). Old
vehicles had to use the parking brake as
the second line, therefore it had to work
at 25%
Brake fluid Manufacturers specify maximum
condition moisture content
8.2.5 Brakes fault diagnosis
Table I
Symptom Possible faults Suggested action
Excessive Incorrect Adjust it! But check
pedal travel adjustment condition as well
Poor Pad and/or Renew
performance shoe linings
when stopping worn
Seized calliper Renew or free off if
or wheel possible and safe
cylinders
Contaminated Renew (both sides)
linings
Car pulls to Seized calliper Overhaul or renew if
one side or wheel piston or cylinder
when braking cylinder on is worn
one side
Contaminated Renew (both sides)
linings on one
side
Spongy pedal Air in the Bleed system and then
hydraulic system check for leaks
Master cylinder Overhaul or renew
seals failing
Pedal travels to Fluid reservoir Refill, bleed system
the floor empty and check for leaks
when pressed Failed seals in Overhaul or renew
master cylinder
Leak from a Replace or repair as
pipe or union required
Brakes Shoe return Renew (both sides)
overheating springs broken
Callipers or Free off or renew if in any
wheel cylinders doubt
sticking
Brake judder Linings worn Renew
Drums out Renew
of round
Discs have Renew
excessive
run-out
Squeaking Badly worn Renew
linings
Dirt in brake Clean out with proper
drums cleaner
Anti-squeal Replace and smear with
shims missing copper grease
at rear of pads
8.2.6 Brakes fault diagnosis
Table 2
Symptom Possible cause
Brake fade Incorrect linings
Badly lined shoes
Distorted shoes
Overloaded vehicle
Excessive braking
Spongy pedal Air in system
Badly lined shoes
Shoes distorted or incorrectly set
Faulty drums
Weak master cylinder mounting
Long pedal Discs running out pushing pads back
Distorted damping shims
Misplaced dust covers
Drum brakes need adjustment
Fluid leak
Fluid contamination
Worn or swollen seals in master cylinder
Blocked filler cap vent
Brakes binding Brakes or handbrake maladjusted
No clearance at master cylinder push rod
Seals swollen
Seized pistons
Shoe springs weak or broken
Servo faulty
Hard pedal – Incorrect linings
poor braking Glazed linings
Linings wet, greasy or not bedded correctly
Servo unit inoperative
Seized calliper pistons
Worn dampers causing wheel bounce
Brakes pulling Seized pistons
Variation in linings
Unsuitable tyres or pressures
Loose brakes
Greasy linings
Faulty drums, suspension or steering
Fall in fluid level Worn disc pads
External leak
Leak in servo unit
Chassis systems 173
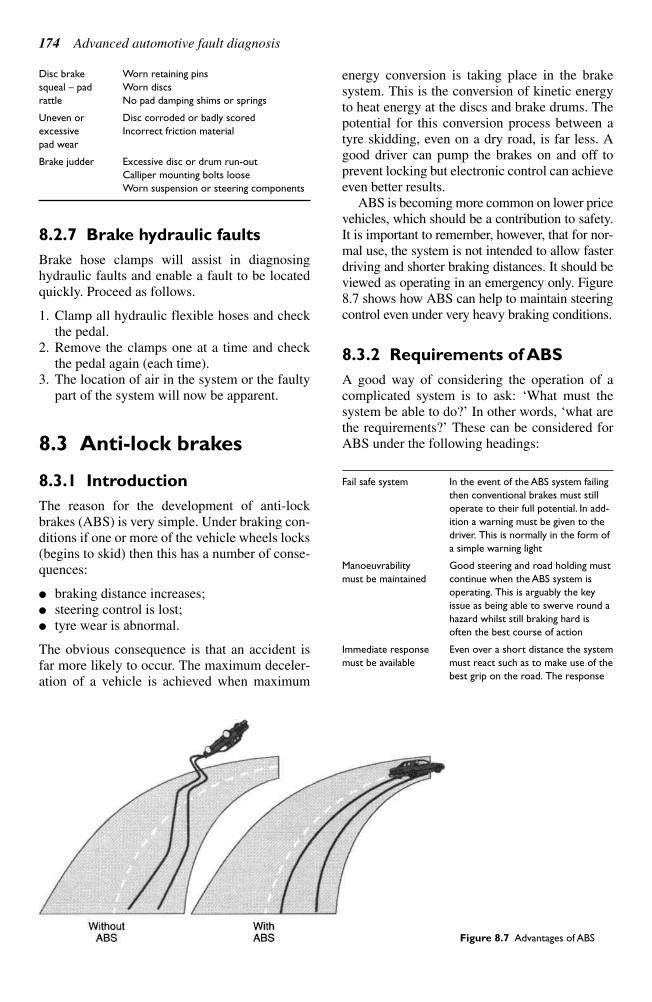
Disc brake Worn retaining pins
squeal – pad Worn discs
rattle No pad damping shims or springs
Uneven or Disc corroded or badly scored
excessive Incorrect friction material
pad wear
Brake judder Excessive disc or drum run-out
Calliper mounting bolts loose
Worn suspension or steering components
8.2.7 Brake hydraulic faults
Brake hose clamps will assist in diagnosing
hydraulic faults and enable a fault to be located
quickly. Proceed as follows.
1. Clamp all hydraulic flexible hoses and check
the pedal.
2. Remove the clamps one at a time and check
the pedal again (each time).
3. The location of air in the system or the faulty
part of the system will now be apparent.
8.3 Anti-lock brakes
8.3.1 Introduction
The reason for the development of anti-lock
brakes (ABS) is very simple. Under braking con-
ditions if one or more of the vehicle wheels locks
(begins to skid) then this has a number of conse-
quences:
braking distance increases;
steering control is lost;
tyre wear is abnormal.
The obvious consequence is that an accident is
far more likely to occur. The maximum deceler-
ation of a vehicle is achieved when maximum
energy conversion is taking place in the brake
system. This is the conversion of kinetic energy
to heat energy at the discs and brake drums. The
potential for this conversion process between a
tyre skidding, even on a dry road, is far less. A
good driver can pump the brakes on and off to
prevent locking but electronic control can achieve
even better results.
ABS is becoming more common on lower price
vehicles, which should be a contribution to safety.
It is important to remember, however, that for nor-
mal use, the system is not intended to allow faster
driving and shorter braking distances. It should be
viewed as operating in an emergency only. Figure
8.7 shows how ABS can help to maintain steering
control even under very heavy braking conditions.
8.3.2 Requirements of ABS
A good way of considering the operation of a
complicated system is to ask: ‘What must thesystem be able to do?’ In other words, ‘what arethe requirements?’ These can be considered forABS under the following headings:
Fail safe system In the event of the ABS system failing
then conventional brakes must still
operate to their full potential. In add-
ition a warning must be given to the
driver. This is normally in the form of
a simple warning light
Manoeuvrability Good steering and road holding must
must be maintained continue when the ABS system is
operating. This is arguably the key
issue as being able to swerve round a
hazard whilst still braking hard is
often the best course of action
Immediate response Even over a short distance the system
must be available must react such as to make use of the
best grip on the road. The response
174 Advanced automotive fault diagnosis
Figure 8.7 Advantages of ABS
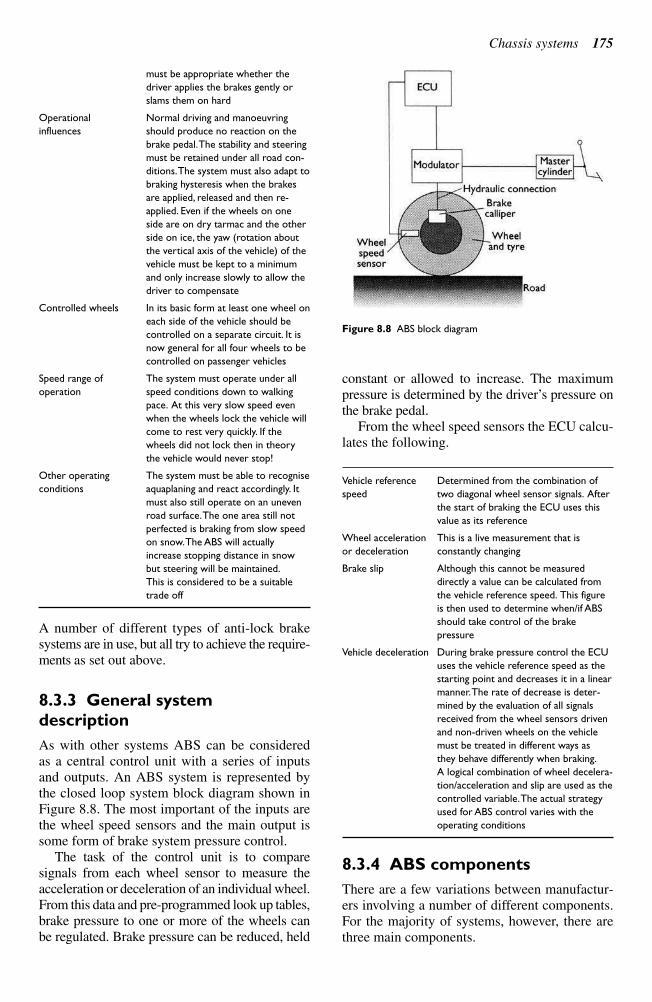
must be appropriate whether the
driver applies the brakes gently or
slams them on hard
Operational Normal driving and manoeuvring
influences should produce no reaction on the
brake pedal.The stability and steering
must be retained under all road con-
ditions.The system must also adapt to
braking hysteresis when the brakes
are applied, released and then re-
applied. Even if the wheels on one
side are on dry tarmac and the other
side on ice, the yaw (rotation about
the vertical axis of the vehicle) of the
vehicle must be kept to a minimum
and only increase slowly to allow the
driver to compensate
Controlled wheels In its basic form at least one wheel on
each side of the vehicle should be
controlled on a separate circuit. It is
now general for all four wheels to be
controlled on passenger vehicles
Speed range of The system must operate under all
operation speed conditions down to walking
pace. At this very slow speed even
when the wheels lock the vehicle will
come to rest very quickly. If the
wheels did not lock then in theory
the vehicle would never stop!
Other operating The system must be able to recognise
conditions aquaplaning and react accordingly. It
must also still operate on an uneven
road surface.The one area still not
perfected is braking from slow speed
on snow.The ABS will actually
increase stopping distance in snow
but steering will be maintained.
This is considered to be a suitable
trade off
A number of different types of anti-lock brake
systems are in use, but all try to achieve the require-
ments as set out above.
8.3.3 General system
description
As with other systems ABS can be considered
as a central control unit with a series of inputs
and outputs. An ABS system is represented by
the closed loop system block diagram shown in
Figure 8.8. The most important of the inputs are
the wheel speed sensors and the main output is
some form of brake system pressure control.
The task of the control unit is to compare
signals from each wheel sensor to measure the
acceleration or deceleration of an individual wheel.
From this data and pre-programmed look up tables,
brake pressure to one or more of the wheels can
be regulated. Brake pressure can be reduced, held
constant or allowed to increase. The maximum
pressure is determined by the driver’s pressure onthe brake pedal.
From the wheel speed sensors the ECU calcu-lates the following.
Vehicle reference Determined from the combination of
speed two diagonal wheel sensor signals. After
the start of braking the ECU uses this
value as its reference
Wheel acceleration This is a live measurement that is
or deceleration constantly changing
Brake slip Although this cannot be measured
directly a value can be calculated from
the vehicle reference speed. This figure
is then used to determine when/if ABS
should take control of the brake
pressure
Vehicle deceleration During brake pressure control the ECU
uses the vehicle reference speed as the
starting point and decreases it in a linear
manner.The rate of decrease is deter-
mined by the evaluation of all signals
received from the wheel sensors driven
and non-driven wheels on the vehicle
must be treated in different ways as
they behave differently when braking.
A logical combination of wheel decelera-
tion/acceleration and slip are used as the
controlled variable.The actual strategy
used for ABS control varies with the
operating conditions
8.3.4 ABS components
There are a few variations between manufactur-ers involving a number of different components.For the majority of systems, however, there arethree main components.
Chassis systems 175
Figure 8.8 ABS block diagram
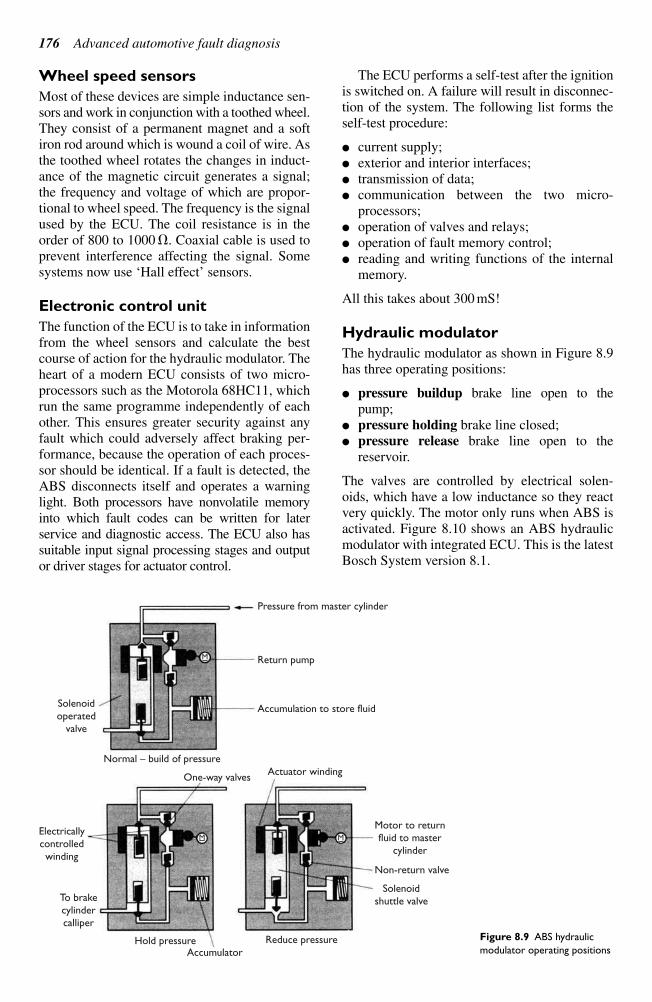
Wheel speed sensors
Most of these devices are simple inductance sen-
sors and work in conjunction with a toothed wheel.
They consist of a permanent magnet and a soft
iron rod around which is wound a coil of wire. As
the toothed wheel rotates the changes in induct-
ance of the magnetic circuit generates a signal;
the frequency and voltage of which are propor-
tional to wheel speed. The frequency is the signal
used by the ECU. The coil resistance is in the
order of 800 to 1000 . Coaxial cable is used to
prevent interference affecting the signal. Some
systems now use ‘Hall effect’ sensors.
Electronic control unit
The function of the ECU is to take in informationfrom the wheel sensors and calculate the bestcourse of action for the hydraulic modulator. Theheart of a modern ECU consists of two micro-processors such as the Motorola 68HC11, whichrun the same programme independently of eachother. This ensures greater security against anyfault which could adversely affect braking per-formance, because the operation of each proces-sor should be identical. If a fault is detected, theABS disconnects itself and operates a warninglight. Both processors have nonvolatile memoryinto which fault codes can be written for later service and diagnostic access. The ECU also hassuitable input signal processing stages and outputor driver stages for actuator control.
The ECU performs a self-test after the ignitionis switched on. A failure will result in disconnec-tion of the system. The following list forms theself-test procedure:
current supply; exterior and interior interfaces; transmission of data; communication between the two micro-
processors; operation of valves and relays; operation of fault memory control; reading and writing functions of the internal
memory.
All this takes about 300 mS!
Hydraulic modulator
The hydraulic modulator as shown in Figure 8.9has three operating positions:
pressure buildup brake line open to the pump;
pressure holding brake line closed; pressure release brake line open to the
reservoir.
The valves are controlled by electrical solen-oids, which have a low inductance so they react very quickly. The motor only runs when ABS isactivated. Figure 8.10 shows an ABS hydraulicmodulator with integrated ECU. This is the latestBosch System version 8.1.
176 Advanced automotive fault diagnosis
Pressure from master cylinder
Return pump
Accumulation to store fluid
Actuator winding
Normal – build of pressure
Hold pressure
One-way valves
Solenoidoperated
valve
Electricallycontrolledwinding
To brakecylindercalliper
Accumulator
Reduce pressure
Solenoidshuttle valve
Non-return valve
Motor to returnfluid to master
cylinder
M
M M
Figure 8.9 ABS hydraulic
modulator operating positions
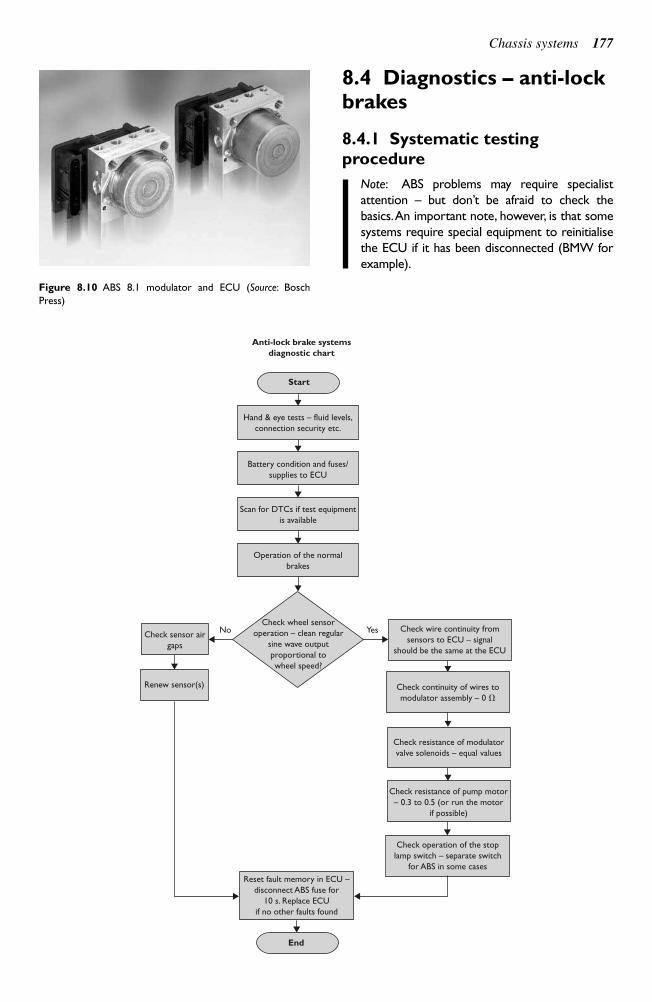
8.4 Diagnostics – anti-lockbrakes
8.4.1 Systematic testing
procedure
Note: ABS problems may require specialist
attention – but don’t be afraid to check the
basics.An important note, however, is that some
systems require special equipment to reinitialise
the ECU if it has been disconnected (BMW for
example).
Chassis systems 177
Figure 8.10 ABS 8.1 modulator and ECU (Source: Bosch
Press)
Start
Anti-lock brake systems
diagnostic chart
End
Hand & eye tests – fluid levels,
connection security etc.
Scan for DTCs if test equipment
is available
Operation of the normal
brakes
Check sensor air
gaps
Renew sensor(s)
No Yes
Battery condition and fuses/
supplies to ECU
Check wire continuity from
sensors to ECU – signal
should be the same at the ECU
Check wheel sensor
operation – clean regular
sine wave output
proportional to
wheel speed?
Check continuity of wires to
modulator assembly – 0
Check resistance of pump motor
– 0.3 to 0.5 (or run the motor
if possible)
Check resistance of modulator
valve solenoids – equal values
Check operation of the stop
lamp switch – separate switch
for ABS in some cases
Reset fault memory in ECU –
disconnect ABS fuse for
10 s. Replace ECU
if no other faults found
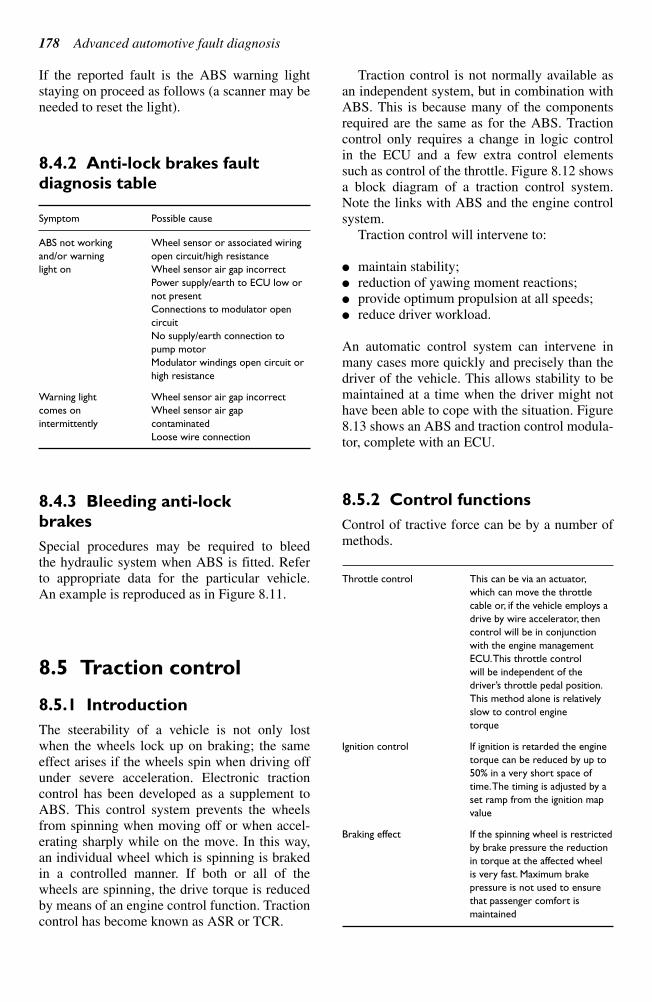
If the reported fault is the ABS warning light
staying on proceed as follows (a scanner may be
needed to reset the light).
8.4.2 Anti-lock brakes fault
diagnosis table
Symptom Possible cause
ABS not working Wheel sensor or associated wiring
and/or warning open circuit/high resistance
light on Wheel sensor air gap incorrect
Power supply/earth to ECU low or
not present
Connections to modulator open
circuit
No supply/earth connection to
pump motor
Modulator windings open circuit or
high resistance
Warning light Wheel sensor air gap incorrect
comes on Wheel sensor air gap
intermittently contaminated
Loose wire connection
8.4.3 Bleeding anti-lock
brakes
Special procedures may be required to bleed
the hydraulic system when ABS is fitted. Refer
to appropriate data for the particular vehicle.
An example is reproduced as in Figure 8.11.
8.5 Traction control
8.5.1 Introduction
The steerability of a vehicle is not only lost
when the wheels lock up on braking; the same
effect arises if the wheels spin when driving off
under severe acceleration. Electronic traction
control has been developed as a supplement to
ABS. This control system prevents the wheels
from spinning when moving off or when accel-
erating sharply while on the move. In this way,
an individual wheel which is spinning is braked
in a controlled manner. If both or all of the
wheels are spinning, the drive torque is reduced
by means of an engine control function. Traction
control has become known as ASR or TCR.
Traction control is not normally available as
an independent system, but in combination with
ABS. This is because many of the components
required are the same as for the ABS. Traction
control only requires a change in logic control
in the ECU and a few extra control elements
such as control of the throttle. Figure 8.12 shows
a block diagram of a traction control system.
Note the links with ABS and the engine control
system.
Traction control will intervene to:
maintain stability;
reduction of yawing moment reactions;
provide optimum propulsion at all speeds;
reduce driver workload.
An automatic control system can intervene in
many cases more quickly and precisely than the
driver of the vehicle. This allows stability to be
maintained at a time when the driver might not
have been able to cope with the situation. Figure
8.13 shows an ABS and traction control modula-
tor, complete with an ECU.
8.5.2 Control functions
Control of tractive force can be by a number of
methods.
Throttle control This can be via an actuator,
which can move the throttle
cable or, if the vehicle employs a
drive by wire accelerator, then
control will be in conjunction
with the engine management
ECU.This throttle control
will be independent of the
driver’s throttle pedal position.
This method alone is relatively
slow to control engine
torque
Ignition control If ignition is retarded the engine
torque can be reduced by up to
50% in a very short space of
time.The timing is adjusted by a
set ramp from the ignition map
value
Braking effect If the spinning wheel is restricted
by brake pressure the reduction
in torque at the affected wheel
is very fast. Maximum brake
pressure is not used to ensure
that passenger comfort is
maintained
178 Advanced automotive fault diagnosis
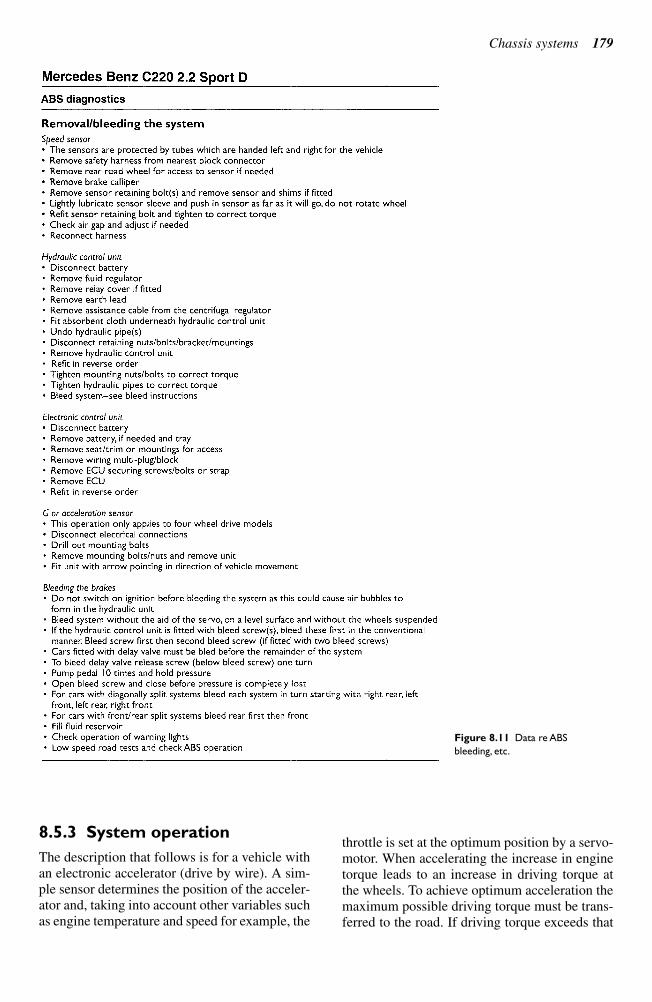
8.5.3 System operation
The description that follows is for a vehicle with
an electronic accelerator (drive by wire). A sim-
ple sensor determines the position of the acceler-
ator and, taking into account other variables such
as engine temperature and speed for example, the
throttle is set at the optimum position by a servo-
motor. When accelerating the increase in engine
torque leads to an increase in driving torque at
the wheels. To achieve optimum acceleration the
maximum possible driving torque must be trans-
ferred to the road. If driving torque exceeds that
Chassis systems 179
Figure 8.11 Data re ABS
bleeding, etc.
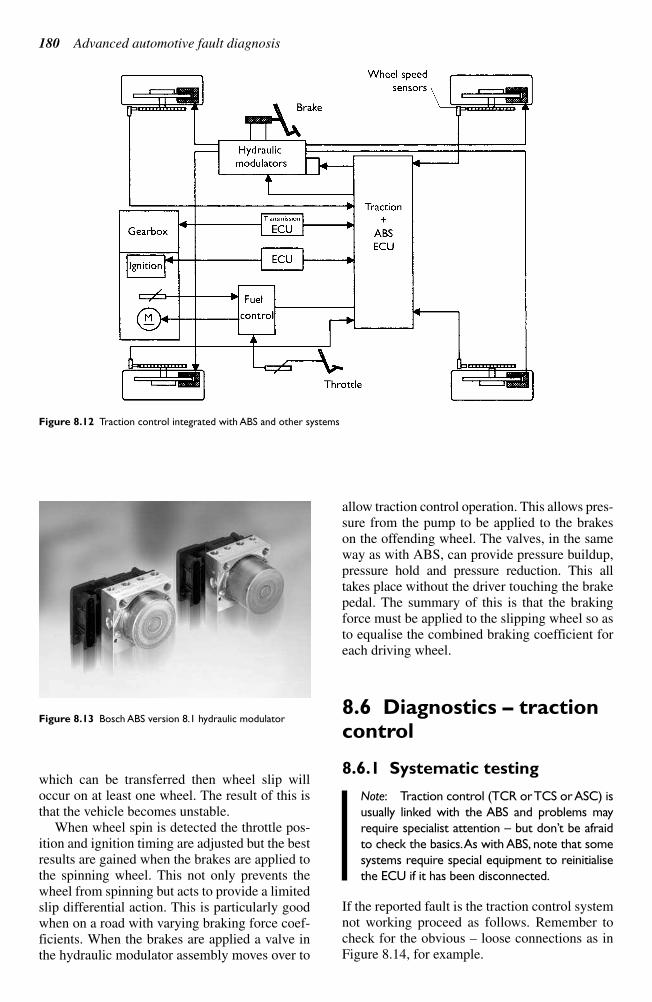
which can be transferred then wheel slip will
occur on at least one wheel. The result of this is
that the vehicle becomes unstable.
When wheel spin is detected the throttle pos-
ition and ignition timing are adjusted but the best
results are gained when the brakes are applied to
the spinning wheel. This not only prevents the
wheel from spinning but acts to provide a limited
slip differential action. This is particularly good
when on a road with varying braking force coef-
ficients. When the brakes are applied a valve in
the hydraulic modulator assembly moves over to
allow traction control operation. This allows pres-
sure from the pump to be applied to the brakes
on the offending wheel. The valves, in the same
way as with ABS, can provide pressure buildup,
pressure hold and pressure reduction. This all
takes place without the driver touching the brake
pedal. The summary of this is that the braking
force must be applied to the slipping wheel so as
to equalise the combined braking coefficient for
each driving wheel.
8.6 Diagnostics – tractioncontrol
8.6.1 Systematic testing
Note: Traction control (TCR or TCS or ASC) is
usually linked with the ABS and problems may
require specialist attention – but don’t be afraid
to check the basics.As with ABS, note that some
systems require special equipment to reinitialise
the ECU if it has been disconnected.
If the reported fault is the traction control system
not working proceed as follows. Remember to
check for the obvious – loose connections as inFigure 8.14, for example.
180 Advanced automotive fault diagnosis
Figure 8.13 Bosch ABS version 8.1 hydraulic modulator
Figure 8.12 Traction control integrated with ABS and other systems
8.6.2 Traction control fault
diagnosis table
Symptom Possible cause
Traction Wheel sensor or associated wiring open
control circuit/high resistance
inoperative Wheel sensor air gap incorrect
Power supply/earth to ECU low or not present
Switch open circuit
ABS system fault
Throttle actuator inoperative or open circuit
connections
Communication link between ECUs open circuit
ECU needs to be initialised
8.7 Steering and tyres
8.7.1 Tyres
The tyre performs two basic functions.
Chassis systems 181
Start
Traction control systems diagnostic chart
End
Hand & eye tests –
fluid levels, connection
security etc.
Scan for DTCs if test
equipment is available
Normal operation of
the throttle
Check sensor air
gaps
Renew sensor(s)
Check wire continuity from
sensors to ECU – signal
should be the same at the
ECU
Check wheel sensor
operation – clean
regular sine wave
output proportional to
wheel speed?
Reset fault memory in
ECU
Battery condition and
fuses/supplies to ECU.
Traction control switch
operation – 0 V drop
across or 0 ohms
YesNo
Check continuity of wires to
modulator and/or throttle
control assembly – 0
Check resistance of
controller/modulator valve
solenoids – equal values
Replace ECU if no other
faults found
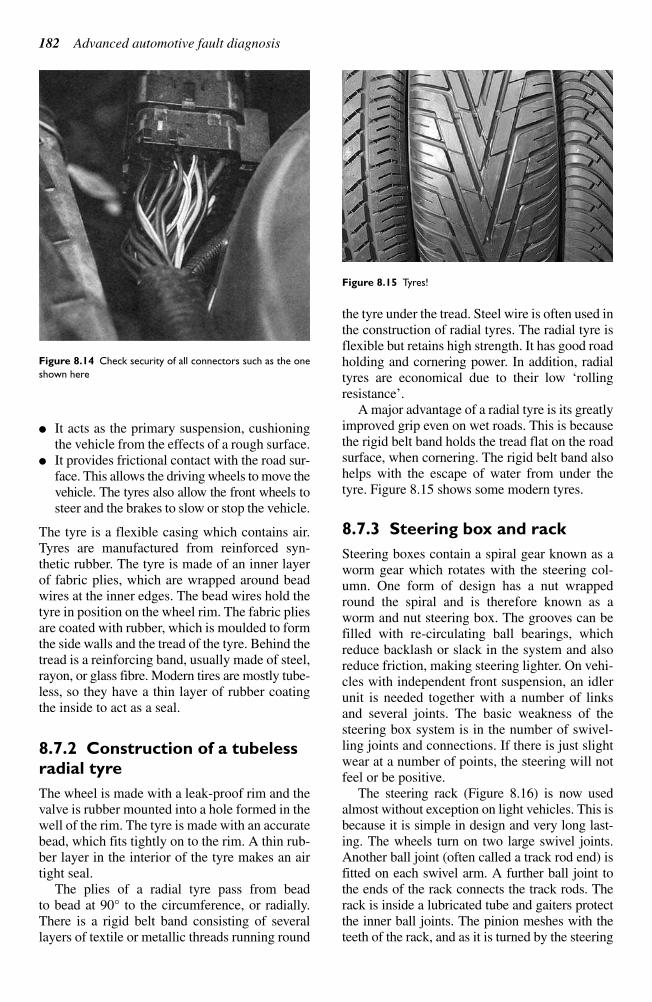
It acts as the primary suspension, cushioning
the vehicle from the effects of a rough surface.
It provides frictional contact with the road sur-
face. This allows the driving wheels to move the
vehicle. The tyres also allow the front wheels to
steer and the brakes to slow or stop the vehicle.
The tyre is a flexible casing which contains air.
Tyres are manufactured from reinforced syn-
thetic rubber. The tyre is made of an inner layer
of fabric plies, which are wrapped around bead
wires at the inner edges. The bead wires hold the
tyre in position on the wheel rim. The fabric plies
are coated with rubber, which is moulded to form
the side walls and the tread of the tyre. Behind the
tread is a reinforcing band, usually made of steel,
rayon, or glass fibre. Modern tires are mostly tube-
less, so they have a thin layer of rubber coating
the inside to act as a seal.
8.7.2 Construction of a tubeless
radial tyre
The wheel is made with a leak-proof rim and the
valve is rubber mounted into a hole formed in the
well of the rim. The tyre is made with an accurate
bead, which fits tightly on to the rim. A thin rub-
ber layer in the interior of the tyre makes an air
tight seal.
The plies of a radial tyre pass from bead
to bead at 90° to the circumference, or radially.
There is a rigid belt band consisting of several
layers of textile or metallic threads running round
the tyre under the tread. Steel wire is often used in
the construction of radial tyres. The radial tyre is
flexible but retains high strength. It has good road
holding and cornering power. In addition, radial
tyres are economical due to their low ‘rollingresistance’.
A major advantage of a radial tyre is its greatlyimproved grip even on wet roads. This is becausethe rigid belt band holds the tread flat on the roadsurface, when cornering. The rigid belt band alsohelps with the escape of water from under thetyre. Figure 8.15 shows some modern tyres.
8.7.3 Steering box and rack
Steering boxes contain a spiral gear known as aworm gear which rotates with the steering col-umn. One form of design has a nut wrappedround the spiral and is therefore known as aworm and nut steering box. The grooves can befilled with re-circulating ball bearings, whichreduce backlash or slack in the system and alsoreduce friction, making steering lighter. On vehi-cles with independent front suspension, an idlerunit is needed together with a number of linksand several joints. The basic weakness of thesteering box system is in the number of swivel-ling joints and connections. If there is just slightwear at a number of points, the steering will notfeel or be positive.
The steering rack (Figure 8.16) is now usedalmost without exception on light vehicles. This isbecause it is simple in design and very long last-ing. The wheels turn on two large swivel joints.Another ball joint (often called a track rod end) isfitted on each swivel arm. A further ball joint tothe ends of the rack connects the track rods. Therack is inside a lubricated tube and gaiters protectthe inner ball joints. The pinion meshes with theteeth of the rack, and as it is turned by the steering
182 Advanced automotive fault diagnosis
Figure 8.14 Check security of all connectors such as the one
shown here
Figure 8.15 Tyres!
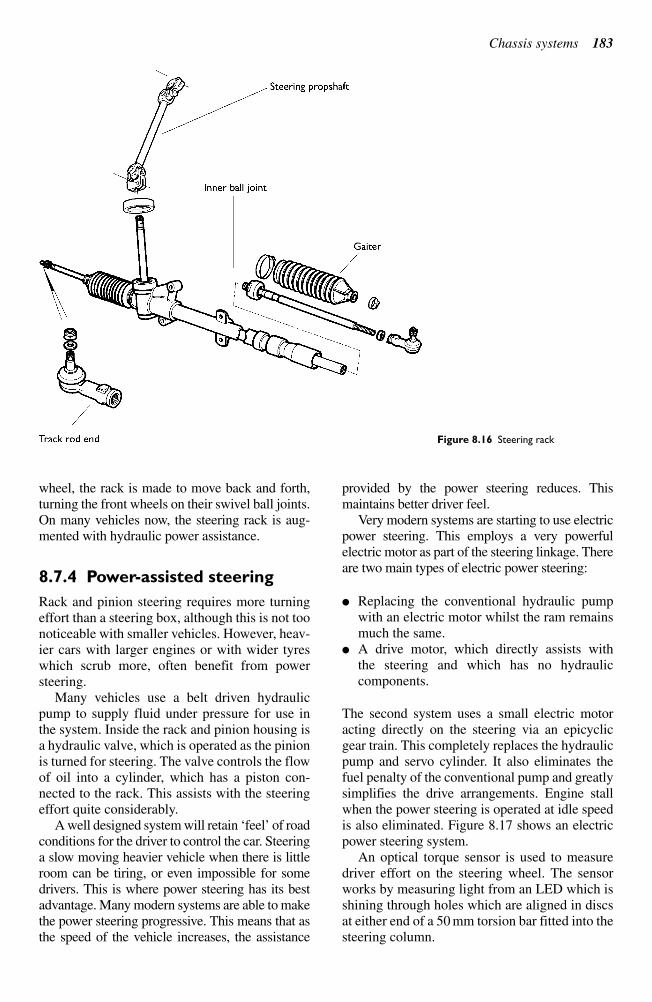
wheel, the rack is made to move back and forth,
turning the front wheels on their swivel ball joints.
On many vehicles now, the steering rack is aug-
mented with hydraulic power assistance.
8.7.4 Power-assisted steering
Rack and pinion steering requires more turning
effort than a steering box, although this is not too
noticeable with smaller vehicles. However, heav-
ier cars with larger engines or with wider tyres
which scrub more, often benefit from power
steering.
Many vehicles use a belt driven hydraulic
pump to supply fluid under pressure for use in
the system. Inside the rack and pinion housing is
a hydraulic valve, which is operated as the pinion
is turned for steering. The valve controls the flow
of oil into a cylinder, which has a piston con-
nected to the rack. This assists with the steering
effort quite considerably.
A well designed system will retain ‘feel’ of roadconditions for the driver to control the car. Steeringa slow moving heavier vehicle when there is littleroom can be tiring, or even impossible for somedrivers. This is where power steering has its bestadvantage. Many modern systems are able to makethe power steering progressive. This means that asthe speed of the vehicle increases, the assistance
provided by the power steering reduces. Thismaintains better driver feel.
Very modern systems are starting to use electricpower steering. This employs a very powerfulelectric motor as part of the steering linkage. Thereare two main types of electric power steering:
Replacing the conventional hydraulic pumpwith an electric motor whilst the ram remainsmuch the same.
A drive motor, which directly assists with the steering and which has no hydraulic components.
The second system uses a small electric motoracting directly on the steering via an epicyclicgear train. This completely replaces the hydraulicpump and servo cylinder. It also eliminates thefuel penalty of the conventional pump and greatlysimplifies the drive arrangements. Engine stallwhen the power steering is operated at idle speedis also eliminated. Figure 8.17 shows an electricpower steering system.
An optical torque sensor is used to measuredriver effort on the steering wheel. The sensorworks by measuring light from an LED which isshining through holes which are aligned in discsat either end of a 50 mm torsion bar fitted into thesteering column.
Chassis systems 183
Figure 8.16 Steering rack
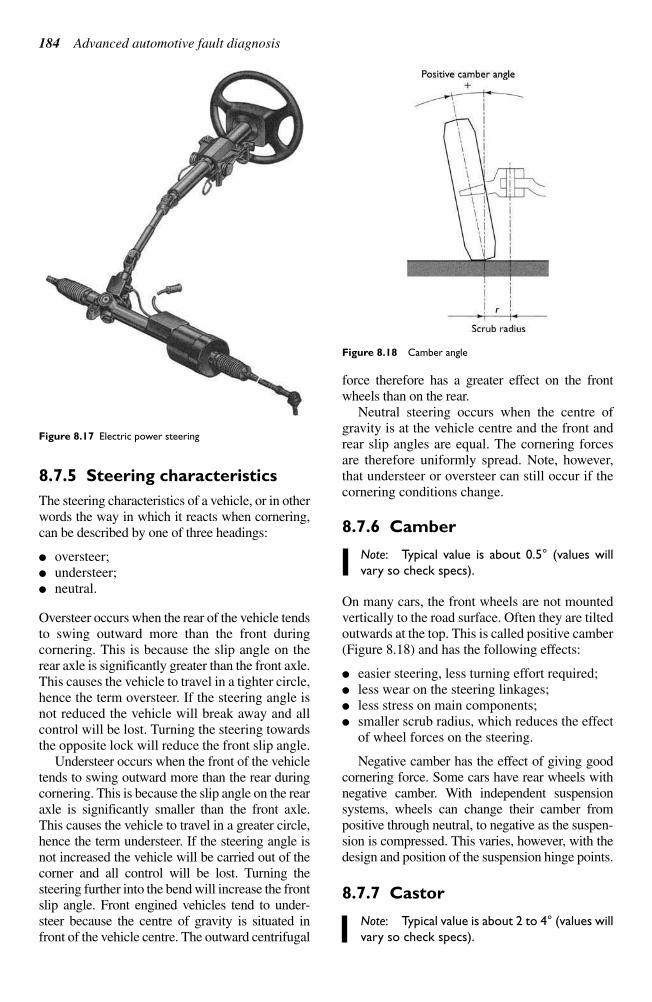
8.7.5 Steering characteristics
The steering characteristics of a vehicle, or in other
words the way in which it reacts when cornering,
can be described by one of three headings:
oversteer;
understeer;
neutral.
Oversteer occurs when the rear of the vehicle tends
to swing outward more than the front during
cornering. This is because the slip angle on the
rear axle is significantly greater than the front axle.
This causes the vehicle to travel in a tighter circle,
hence the term oversteer. If the steering angle is
not reduced the vehicle will break away and all
control will be lost. Turning the steering towards
the opposite lock will reduce the front slip angle.
Understeer occurs when the front of the vehicle
tends to swing outward more than the rear during
cornering. This is because the slip angle on the rear
axle is significantly smaller than the front axle.
This causes the vehicle to travel in a greater circle,
hence the term understeer. If the steering angle is
not increased the vehicle will be carried out of the
corner and all control will be lost. Turning the
steering further into the bend will increase the front
slip angle. Front engined vehicles tend to under-
steer because the centre of gravity is situated in
front of the vehicle centre. The outward centrifugal
force therefore has a greater effect on the front
wheels than on the rear.
Neutral steering occurs when the centre of
gravity is at the vehicle centre and the front and
rear slip angles are equal. The cornering forces
are therefore uniformly spread. Note, however,
that understeer or oversteer can still occur if the
cornering conditions change.
8.7.6 Camber
Note: Typical value is about 0.5° (values will
vary so check specs).
On many cars, the front wheels are not mounted
vertically to the road surface. Often they are tilted
outwards at the top. This is called positive camber
(Figure 8.18) and has the following effects:
easier steering, less turning effort required;
less wear on the steering linkages;
less stress on main components;
smaller scrub radius, which reduces the effect
of wheel forces on the steering.
Negative camber has the effect of giving good
cornering force. Some cars have rear wheels with
negative camber. With independent suspension
systems, wheels can change their camber from
positive through neutral, to negative as the suspen-
sion is compressed. This varies, however, with the
design and position of the suspension hinge points.
8.7.7 Castor
Note: Typical value is about 2 to 4° (values will
vary so check specs).
184 Advanced automotive fault diagnosis
Figure 8.17 Electric power steering
Figure 8.18 Camber angle
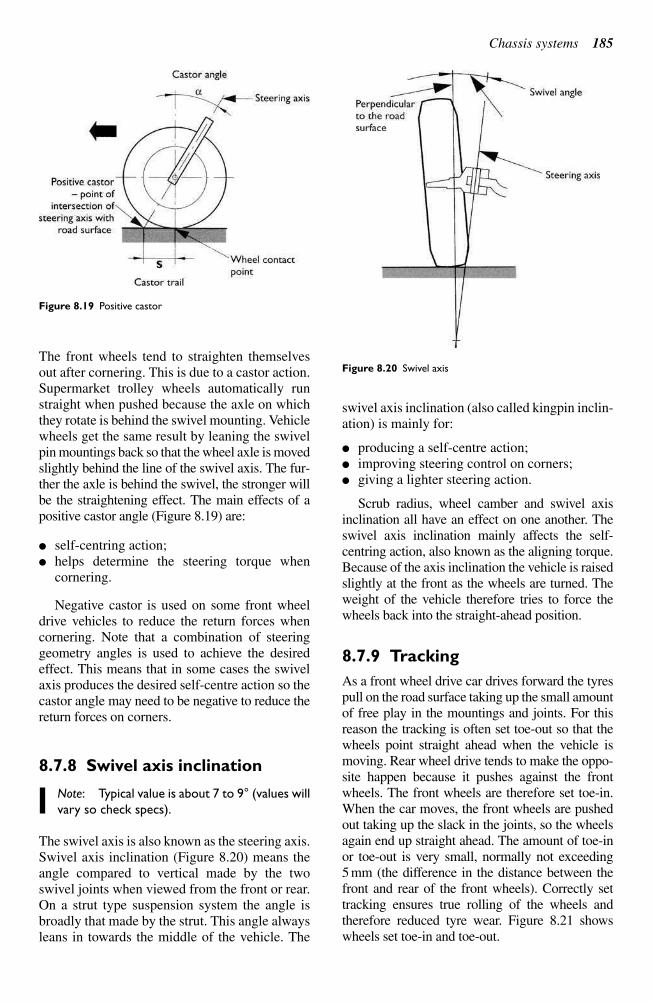
The front wheels tend to straighten themselves
out after cornering. This is due to a castor action.
Supermarket trolley wheels automatically run
straight when pushed because the axle on which
they rotate is behind the swivel mounting. Vehicle
wheels get the same result by leaning the swivel
pin mountings back so that the wheel axle is moved
slightly behind the line of the swivel axis. The fur-
ther the axle is behind the swivel, the stronger will
be the straightening effect. The main effects of a
positive castor angle (Figure 8.19) are:
self-centring action;
helps determine the steering torque when
cornering.
Negative castor is used on some front wheel
drive vehicles to reduce the return forces when
cornering. Note that a combination of steering
geometry angles is used to achieve the desired
effect. This means that in some cases the swivel
axis produces the desired self-centre action so the
castor angle may need to be negative to reduce the
return forces on corners.
8.7.8 Swivel axis inclination
Note: Typical value is about 7 to 9° (values will
vary so check specs).
The swivel axis is also known as the steering axis.
Swivel axis inclination (Figure 8.20) means the
angle compared to vertical made by the two
swivel joints when viewed from the front or rear.
On a strut type suspension system the angle is
broadly that made by the strut. This angle always
leans in towards the middle of the vehicle. The
swivel axis inclination (also called kingpin inclin-
ation) is mainly for:
producing a self-centre action;
improving steering control on corners;
giving a lighter steering action.
Scrub radius, wheel camber and swivel axis
inclination all have an effect on one another. The
swivel axis inclination mainly affects the self-
centring action, also known as the aligning torque.
Because of the axis inclination the vehicle is raised
slightly at the front as the wheels are turned. The
weight of the vehicle therefore tries to force the
wheels back into the straight-ahead position.
8.7.9 Tracking
As a front wheel drive car drives forward the tyres
pull on the road surface taking up the small amount
of free play in the mountings and joints. For this
reason the tracking is often set toe-out so that the
wheels point straight ahead when the vehicle is
moving. Rear wheel drive tends to make the oppo-
site happen because it pushes against the front
wheels. The front wheels are therefore set toe-in.
When the car moves, the front wheels are pushed
out taking up the slack in the joints, so the wheels
again end up straight ahead. The amount of toe-in
or toe-out is very small, normally not exceeding
5 mm (the difference in the distance between the
front and rear of the front wheels). Correctly set
tracking ensures true rolling of the wheels and
therefore reduced tyre wear. Figure 8.21 shows
wheels set toe-in and toe-out.
Chassis systems 185
Figure 8.19 Positive castor
Figure 8.20 Swivel axis
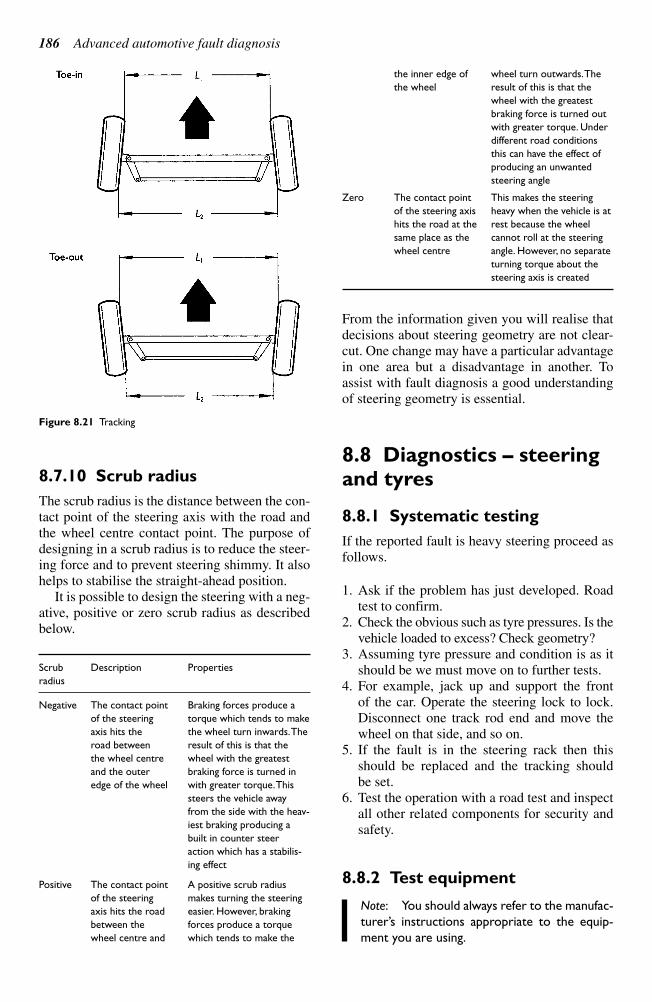
8.7.10 Scrub radius
The scrub radius is the distance between the con-
tact point of the steering axis with the road and
the wheel centre contact point. The purpose of
designing in a scrub radius is to reduce the steer-
ing force and to prevent steering shimmy. It also
helps to stabilise the straight-ahead position.
It is possible to design the steering with a neg-
ative, positive or zero scrub radius as described
below.
Scrub Description Properties
radius
Negative The contact point Braking forces produce a
of the steering torque which tends to make
axis hits the the wheel turn inwards.The
road between result of this is that the
the wheel centre wheel with the greatest
and the outer braking force is turned in
edge of the wheel with greater torque.This
steers the vehicle away
from the side with the heav-
iest braking producing a
built in counter steer
action which has a stabilis-
ing effect
Positive The contact point A positive scrub radius
of the steering makes turning the steering
axis hits the road easier. However, braking
between the forces produce a torque
wheel centre and which tends to make the
the inner edge of wheel turn outwards.The
the wheel result of this is that the
wheel with the greatest
braking force is turned out
with greater torque. Under
different road conditions
this can have the effect of
producing an unwanted
steering angle
Zero The contact point This makes the steering
of the steering axis heavy when the vehicle is at
hits the road at the rest because the wheel
same place as the cannot roll at the steering
wheel centre angle. However, no separate
turning torque about the
steering axis is created
From the information given you will realise that
decisions about steering geometry are not clear-
cut. One change may have a particular advantage
in one area but a disadvantage in another. To
assist with fault diagnosis a good understanding
of steering geometry is essential.
8.8 Diagnostics – steeringand tyres
8.8.1 Systematic testing
If the reported fault is heavy steering proceed as
follows.
1. Ask if the problem has just developed. Road
test to confirm.
2. Check the obvious such as tyre pressures. Is the
vehicle loaded to excess? Check geometry?
3. Assuming tyre pressure and condition is as it
should be we must move on to further tests.
4. For example, jack up and support the front
of the car. Operate the steering lock to lock.
Disconnect one track rod end and move the
wheel on that side, and so on.
5. If the fault is in the steering rack then this
should be replaced and the tracking should
be set.
6. Test the operation with a road test and inspect
all other related components for security and
safety.
8.8.2 Test equipment
Note: You should always refer to the manufac-
turer’s instructions appropriate to the equip-
ment you are using.
186 Advanced automotive fault diagnosis
Figure 8.21 Tracking
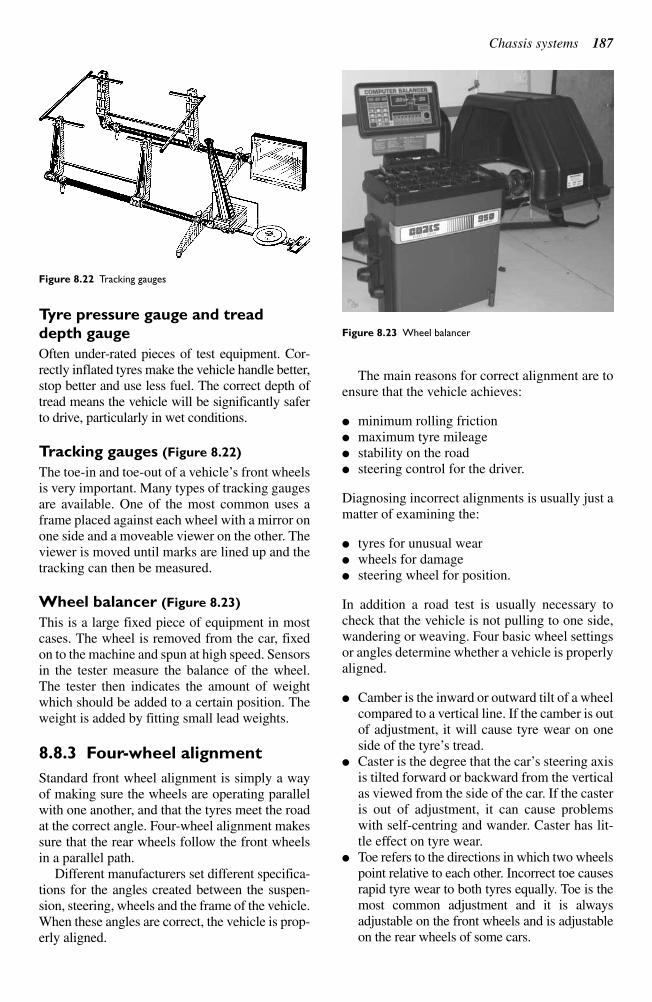
Tyre pressure gauge and tread
depth gauge
Often under-rated pieces of test equipment. Cor-
rectly inflated tyres make the vehicle handle better,
stop better and use less fuel. The correct depth of
tread means the vehicle will be significantly safer
to drive, particularly in wet conditions.
Tracking gauges (Figure 8.22)
The toe-in and toe-out of a vehicle’s front wheelsis very important. Many types of tracking gaugesare available. One of the most common uses aframe placed against each wheel with a mirror onone side and a moveable viewer on the other. Theviewer is moved until marks are lined up and thetracking can then be measured.
Wheel balancer (Figure 8.23)
This is a large fixed piece of equipment in mostcases. The wheel is removed from the car, fixedon to the machine and spun at high speed. Sensorsin the tester measure the balance of the wheel.The tester then indicates the amount of weightwhich should be added to a certain position. Theweight is added by fitting small lead weights.
8.8.3 Four-wheel alignment
Standard front wheel alignment is simply a wayof making sure the wheels are operating parallelwith one another, and that the tyres meet the roadat the correct angle. Four-wheel alignment makessure that the rear wheels follow the front wheelsin a parallel path.
Different manufacturers set different specifica-tions for the angles created between the suspen-sion, steering, wheels and the frame of the vehicle.When these angles are correct, the vehicle is prop-erly aligned.
The main reasons for correct alignment are toensure that the vehicle achieves:
minimum rolling friction maximum tyre mileage stability on the road steering control for the driver.
Diagnosing incorrect alignments is usually just amatter of examining the:
tyres for unusual wear wheels for damage steering wheel for position.
In addition a road test is usually necessary tocheck that the vehicle is not pulling to one side,wandering or weaving. Four basic wheel settingsor angles determine whether a vehicle is properlyaligned.
Camber is the inward or outward tilt of a wheelcompared to a vertical line. If the camber is outof adjustment, it will cause tyre wear on oneside of the tyre’s tread.
Caster is the degree that the car’s steering axisis tilted forward or backward from the verticalas viewed from the side of the car. If the casteris out of adjustment, it can cause problemswith self-centring and wander. Caster has lit-tle effect on tyre wear.
Toe refers to the directions in which two wheelspoint relative to each other. Incorrect toe causesrapid tyre wear to both tyres equally. Toe is themost common adjustment and it is alwaysadjustable on the front wheels and is adjustableon the rear wheels of some cars.
Chassis systems 187
Figure 8.22 Tracking gauges
Figure 8.23 Wheel balancer
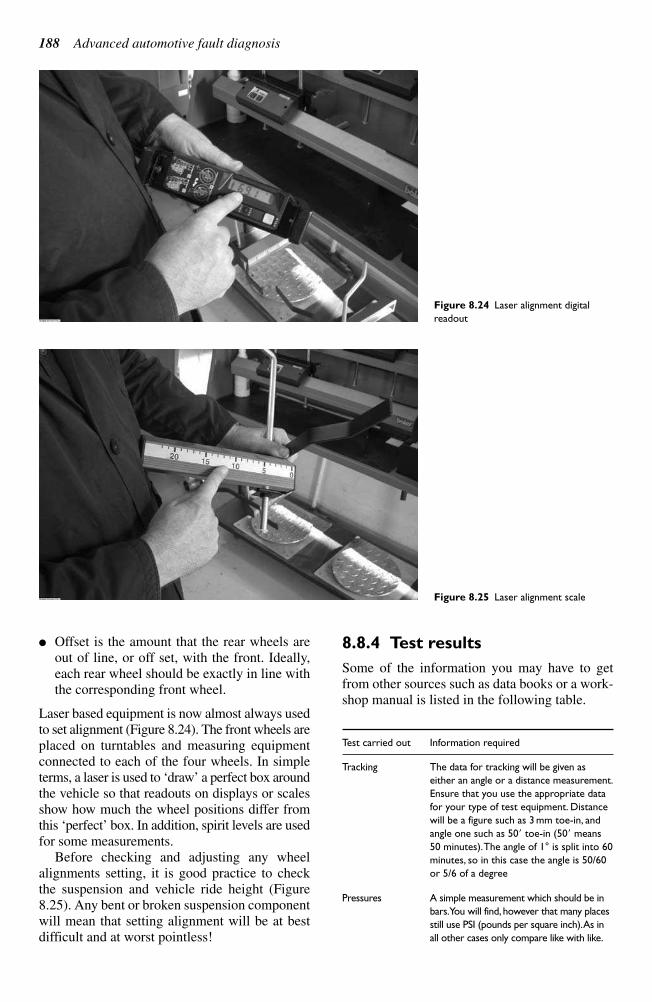
Offset is the amount that the rear wheels are
out of line, or off set, with the front. Ideally,
each rear wheel should be exactly in line with
the corresponding front wheel.
Laser based equipment is now almost always used
to set alignment (Figure 8.24). The front wheels are
placed on turntables and measuring equipment
connected to each of the four wheels. In simple
terms, a laser is used to ‘draw’ a perfect box aroundthe vehicle so that readouts on displays or scalesshow how much the wheel positions differ fromthis ‘perfect’ box. In addition, spirit levels are usedfor some measurements.
Before checking and adjusting any wheelalignments setting, it is good practice to checkthe suspension and vehicle ride height (Figure8.25). Any bent or broken suspension componentwill mean that setting alignment will be at bestdifficult and at worst pointless!
8.8.4 Test results
Some of the information you may have to getfrom other sources such as data books or a work-shop manual is listed in the following table.
Test carried out Information required
Tracking The data for tracking will be given as
either an angle or a distance measurement.
Ensure that you use the appropriate data
for your type of test equipment. Distance
will be a figure such as 3 mm toe-in, and
angle one such as 50 toe-in (50 means
50 minutes).The angle of 1° is split into 60
minutes, so in this case the angle is 50/60
or 5/6 of a degree
Pressures A simple measurement which should be in
bars.You will find, however that many places
still use PSI (pounds per square inch).As in
all other cases only compare like with like.
188 Advanced automotive fault diagnosis
Figure 8.24 Laser alignment digital
readout
Figure 8.25 Laser alignment scale
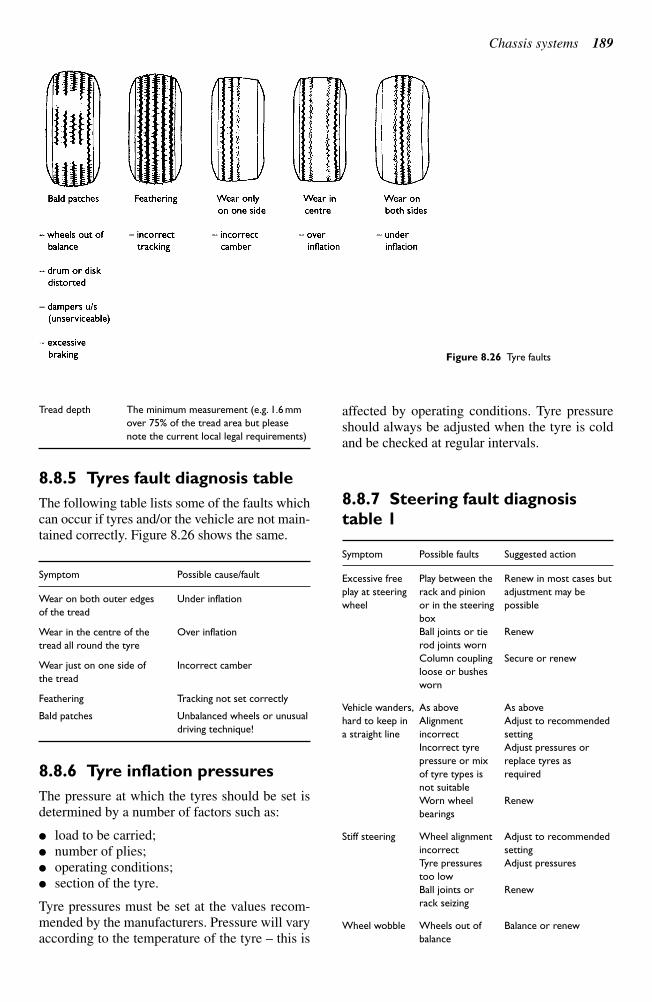
Tread depth The minimum measurement (e.g. 1.6 mm
over 75% of the tread area but please
note the current local legal requirements)
8.8.5 Tyres fault diagnosis table
The following table lists some of the faults which
can occur if tyres and/or the vehicle are not main-
tained correctly. Figure 8.26 shows the same.
Symptom Possible cause/fault
Wear on both outer edges Under inflation
of the tread
Wear in the centre of the Over inflation
tread all round the tyre
Wear just on one side of Incorrect camber
the tread
Feathering Tracking not set correctly
Bald patches Unbalanced wheels or unusual
driving technique!
8.8.6 Tyre inflation pressures
The pressure at which the tyres should be set is
determined by a number of factors such as:
load to be carried;
number of plies;
operating conditions;
section of the tyre.
Tyre pressures must be set at the values recom-
mended by the manufacturers. Pressure will vary
according to the temperature of the tyre – this is
affected by operating conditions. Tyre pressureshould always be adjusted when the tyre is coldand be checked at regular intervals.
8.8.7 Steering fault diagnosis
table 1
Symptom Possible faults Suggested action
Excessive free Play between the Renew in most cases but
play at steering rack and pinion adjustment may be
wheel or in the steering possible
box
Ball joints or tie Renew
rod joints worn
Column coupling Secure or renew
loose or bushes
worn
Vehicle wanders, As above As above
hard to keep in Alignment Adjust to recommended
a straight line incorrect setting
Incorrect tyre Adjust pressures or
pressure or mix replace tyres as
of tyre types is required
not suitable
Worn wheel Renew
bearings
Stiff steering Wheel alignment Adjust to recommended
incorrect setting
Tyre pressures Adjust pressures
too low
Ball joints or Renew
rack seizing
Wheel wobble Wheels out of Balance or renew
balance
Chassis systems 189
Figure 8.26 Tyre faults
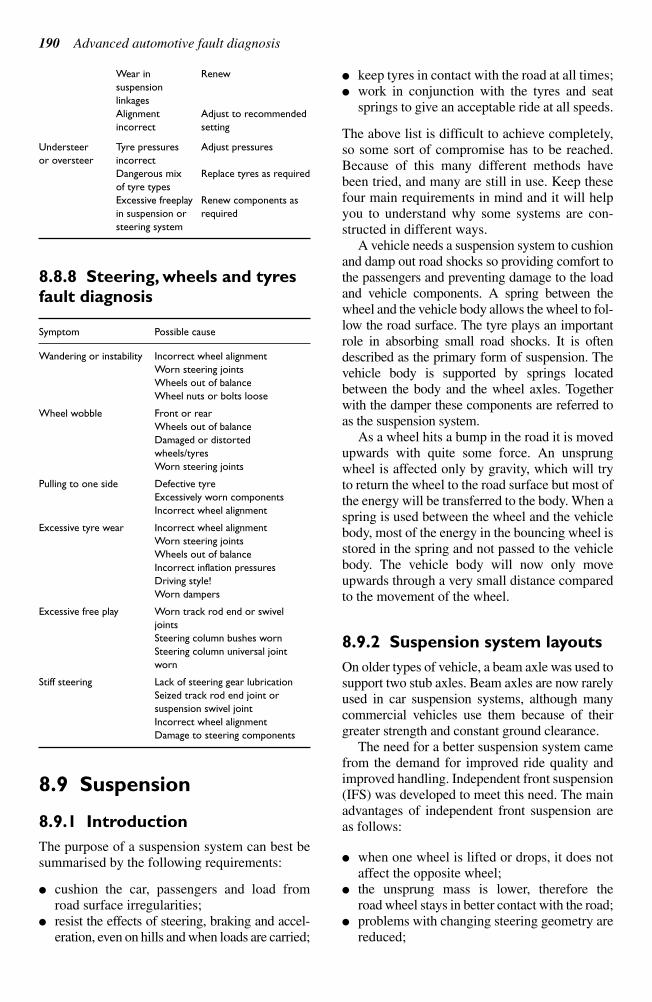
Wear in Renew
suspension
linkages
Alignment Adjust to recommended
incorrect setting
Understeer Tyre pressures Adjust pressures
or oversteer incorrect
Dangerous mix Replace tyres as required
of tyre types
Excessive freeplay Renew components as
in suspension or required
steering system
8.8.8 Steering, wheels and tyres
fault diagnosis
Symptom Possible cause
Wandering or instability Incorrect wheel alignment
Worn steering joints
Wheels out of balance
Wheel nuts or bolts loose
Wheel wobble Front or rear
Wheels out of balance
Damaged or distorted
wheels/tyres
Worn steering joints
Pulling to one side Defective tyre
Excessively worn components
Incorrect wheel alignment
Excessive tyre wear Incorrect wheel alignment
Worn steering joints
Wheels out of balance
Incorrect inflation pressures
Driving style!
Worn dampers
Excessive free play Worn track rod end or swivel
joints
Steering column bushes worn
Steering column universal joint
worn
Stiff steering Lack of steering gear lubrication
Seized track rod end joint or
suspension swivel joint
Incorrect wheel alignment
Damage to steering components
8.9 Suspension
8.9.1 Introduction
The purpose of a suspension system can best be
summarised by the following requirements:
cushion the car, passengers and load from
road surface irregularities;
resist the effects of steering, braking and accel-
eration, even on hills and when loads are carried;
keep tyres in contact with the road at all times;
work in conjunction with the tyres and seat
springs to give an acceptable ride at all speeds.
The above list is difficult to achieve completely,
so some sort of compromise has to be reached.
Because of this many different methods have
been tried, and many are still in use. Keep these
four main requirements in mind and it will help
you to understand why some systems are con-
structed in different ways.
A vehicle needs a suspension system to cushion
and damp out road shocks so providing comfort to
the passengers and preventing damage to the load
and vehicle components. A spring between the
wheel and the vehicle body allows the wheel to fol-
low the road surface. The tyre plays an important
role in absorbing small road shocks. It is often
described as the primary form of suspension. The
vehicle body is supported by springs located
between the body and the wheel axles. Together
with the damper these components are referred to
as the suspension system.
As a wheel hits a bump in the road it is moved
upwards with quite some force. An unsprung
wheel is affected only by gravity, which will try
to return the wheel to the road surface but most of
the energy will be transferred to the body. When a
spring is used between the wheel and the vehicle
body, most of the energy in the bouncing wheel is
stored in the spring and not passed to the vehicle
body. The vehicle body will now only move
upwards through a very small distance compared
to the movement of the wheel.
8.9.2 Suspension system layouts
On older types of vehicle, a beam axle was used to
support two stub axles. Beam axles are now rarely
used in car suspension systems, although many
commercial vehicles use them because of their
greater strength and constant ground clearance.
The need for a better suspension system came
from the demand for improved ride quality and
improved handling. Independent front suspension
(IFS) was developed to meet this need. The main
advantages of independent front suspension are
as follows:
when one wheel is lifted or drops, it does not
affect the opposite wheel;
the unsprung mass is lower, therefore the
road wheel stays in better contact with the road;
problems with changing steering geometry are
reduced;
190 Advanced automotive fault diagnosis
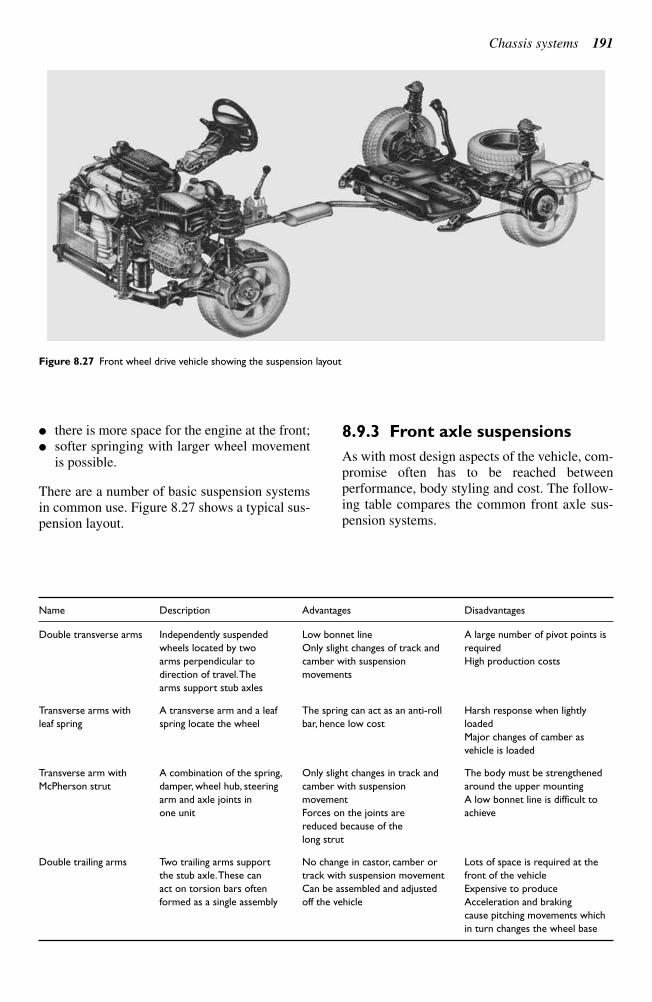
there is more space for the engine at the front;
softer springing with larger wheel movement
is possible.
There are a number of basic suspension systems
in common use. Figure 8.27 shows a typical sus-
pension layout.
8.9.3 Front axle suspensions
As with most design aspects of the vehicle, com-
promise often has to be reached between
performance, body styling and cost. The follow-
ing table compares the common front axle sus-
pension systems.
Chassis systems 191
Figure 8.27 Front wheel drive vehicle showing the suspension layout
Name Description Advantages Disadvantages
Double transverse arms Independently suspended Low bonnet line A large number of pivot points is
wheels located by two Only slight changes of track and required
arms perpendicular to camber with suspension High production costs
direction of travel.The movements
arms support stub axles
Transverse arms with A transverse arm and a leaf The spring can act as an anti-roll Harsh response when lightly
leaf spring spring locate the wheel bar, hence low cost loaded
Major changes of camber as
vehicle is loaded
Transverse arm with A combination of the spring, Only slight changes in track and The body must be strengthened
McPherson strut damper, wheel hub, steering camber with suspension around the upper mounting
arm and axle joints in movement A low bonnet line is difficult to
one unit Forces on the joints are achieve
reduced because of the
long strut
Double trailing arms Two trailing arms support No change in castor, camber or Lots of space is required at the
the stub axle.These can track with suspension movement front of the vehicle
act on torsion bars often Can be assembled and adjusted Expensive to produce
formed as a single assembly off the vehicle Acceleration and braking
cause pitching movements which
in turn changes the wheel base
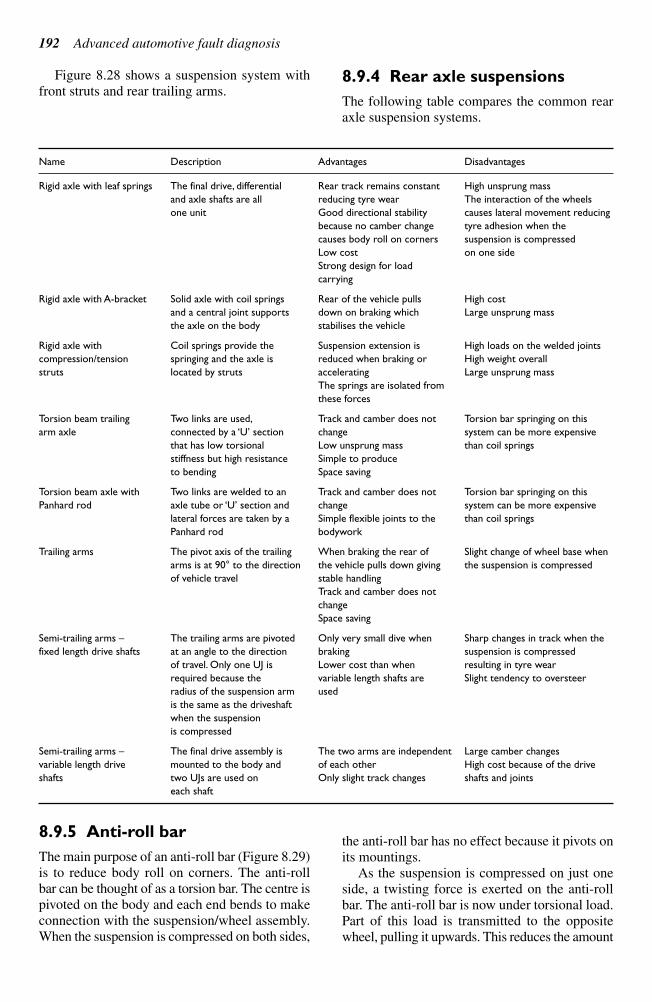
Figure 8.28 shows a suspension system with
front struts and rear trailing arms.8.9.4 Rear axle suspensions
The following table compares the common rear
axle suspension systems.
192 Advanced automotive fault diagnosis
Name Description Advantages Disadvantages
Rigid axle with leaf springs The final drive, differential Rear track remains constant High unsprung mass
and axle shafts are all reducing tyre wear The interaction of the wheels
one unit Good directional stability causes lateral movement reducing
because no camber change tyre adhesion when the
causes body roll on corners suspension is compressed
Low cost on one side
Strong design for load
carrying
Rigid axle with A-bracket Solid axle with coil springs Rear of the vehicle pulls High cost
and a central joint supports down on braking which Large unsprung mass
the axle on the body stabilises the vehicle
Rigid axle with Coil springs provide the Suspension extension is High loads on the welded joints
compression/tension springing and the axle is reduced when braking or High weight overall
struts located by struts accelerating Large unsprung mass
The springs are isolated from
these forces
Torsion beam trailing Two links are used, Track and camber does not Torsion bar springing on this
arm axle connected by a ‘U’ section change system can be more expensive
that has low torsional Low unsprung mass than coil springs
stiffness but high resistance Simple to produce
to bending Space saving
Torsion beam axle with Two links are welded to an Track and camber does not Torsion bar springing on this
Panhard rod axle tube or ‘U’ section and change system can be more expensive
lateral forces are taken by a Simple flexible joints to the than coil springs
Panhard rod bodywork
Trailing arms The pivot axis of the trailing When braking the rear of Slight change of wheel base when
arms is at 90° to the direction the vehicle pulls down giving the suspension is compressed
of vehicle travel stable handling
Track and camber does not
change
Space saving
Semi-trailing arms – The trailing arms are pivoted Only very small dive when Sharp changes in track when the
fixed length drive shafts at an angle to the direction braking suspension is compressed
of travel. Only one UJ is Lower cost than when resulting in tyre wear
required because the variable length shafts are Slight tendency to oversteer
radius of the suspension arm used
is the same as the driveshaft
when the suspension
is compressed
Semi-trailing arms – The final drive assembly is The two arms are independent Large camber changes
variable length drive mounted to the body and of each other High cost because of the drive
shafts two UJs are used on Only slight track changes shafts and joints
each shaft
8.9.5 Anti-roll bar
The main purpose of an anti-roll bar (Figure 8.29)
is to reduce body roll on corners. The anti-roll
bar can be thought of as a torsion bar. The centre is
pivoted on the body and each end bends to make
connection with the suspension/wheel assembly.
When the suspension is compressed on both sides,
the anti-roll bar has no effect because it pivots on
its mountings.
As the suspension is compressed on just one
side, a twisting force is exerted on the anti-roll
bar. The anti-roll bar is now under torsional load.
Part of this load is transmitted to the opposite
wheel, pulling it upwards. This reduces the amount
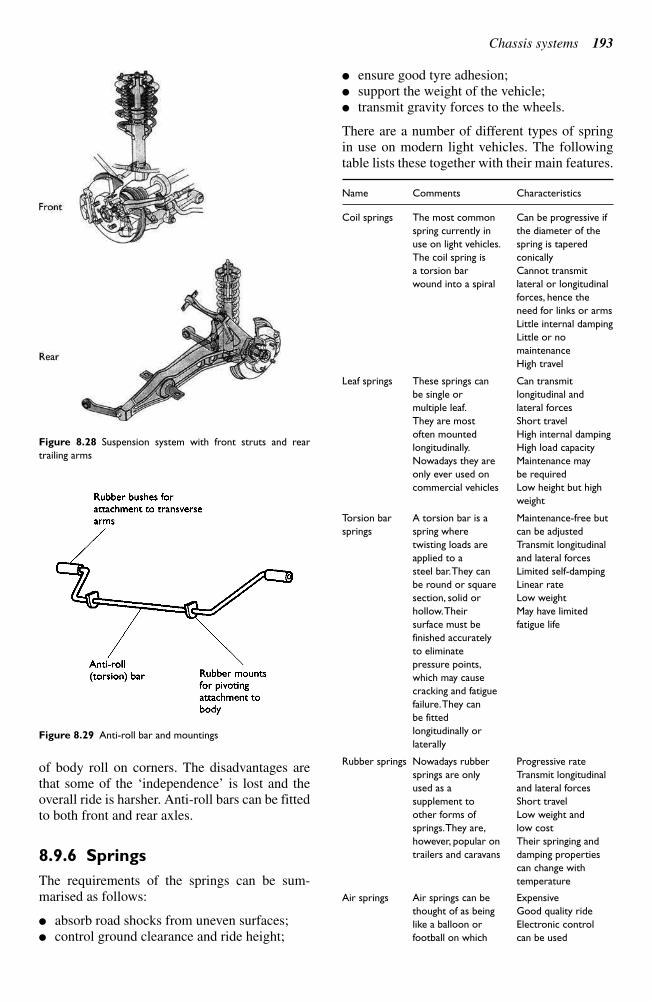
of body roll on corners. The disadvantages are
that some of the ‘independence’ is lost and theoverall ride is harsher. Anti-roll bars can be fittedto both front and rear axles.
8.9.6 Springs
The requirements of the springs can be sum-marised as follows:
absorb road shocks from uneven surfaces; control ground clearance and ride height;
ensure good tyre adhesion; support the weight of the vehicle; transmit gravity forces to the wheels.
There are a number of different types of spring in use on modern light vehicles. The followingtable lists these together with their main features.
Name Comments Characteristics
Coil springs The most common Can be progressive if
spring currently in the diameter of the
use on light vehicles. spring is tapered
The coil spring is conically
a torsion bar Cannot transmit
wound into a spiral lateral or longitudinal
forces, hence the
need for links or arms
Little internal damping
Little or no
maintenance
High travel
Leaf springs These springs can Can transmit
be single or longitudinal and
multiple leaf. lateral forces
They are most Short travel
often mounted High internal damping
longitudinally. High load capacity
Nowadays they are Maintenance may
only ever used on be required
commercial vehicles Low height but high
weight
Torsion bar A torsion bar is a Maintenance-free but
springs spring where can be adjusted
twisting loads are Transmit longitudinal
applied to a and lateral forces
steel bar.They can Limited self-damping
be round or square Linear rate
section, solid or Low weight
hollow.Their May have limited
surface must be fatigue life
finished accurately
to eliminate
pressure points,
which may cause
cracking and fatigue
failure.They can
be fitted
longitudinally or
laterally
Rubber springs Nowadays rubber Progressive rate
springs are only Transmit longitudinal
used as a and lateral forces
supplement to Short travel
other forms of Low weight and
springs.They are, low cost
however, popular on Their springing and
trailers and caravans damping properties
can change with
temperature
Air springs Air springs can be Expensive
thought of as being Good quality ride
like a balloon or Electronic control
football on which can be used
Chassis systems 193
Figure 8.28 Suspension system with front struts and rear
trailing arms
Figure 8.29 Anti-roll bar and mountings
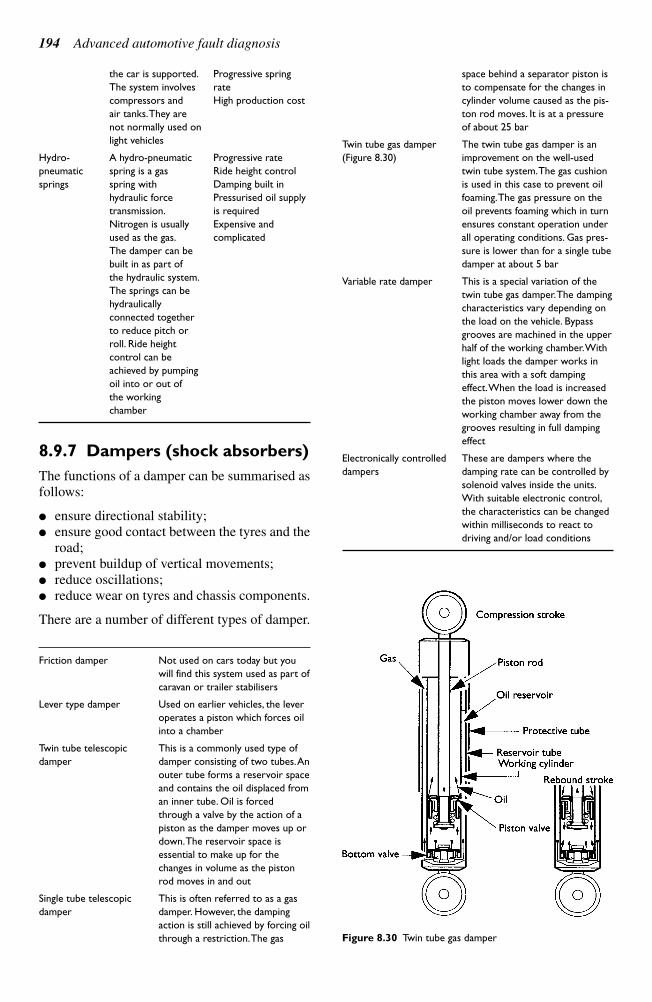
the car is supported. Progressive spring
The system involves rate
compressors and High production cost
air tanks.They are
not normally used on
light vehicles
Hydro- A hydro-pneumatic Progressive rate
pneumatic spring is a gas Ride height control
springs spring with Damping built in
hydraulic force Pressurised oil supply
transmission. is required
Nitrogen is usually Expensive and
used as the gas. complicated
The damper can be
built in as part of
the hydraulic system.
The springs can be
hydraulically
connected together
to reduce pitch or
roll. Ride height
control can be
achieved by pumping
oil into or out of
the working
chamber
8.9.7 Dampers (shock absorbers)
The functions of a damper can be summarised as
follows:
ensure directional stability;
ensure good contact between the tyres and the
road;
prevent buildup of vertical movements;
reduce oscillations;
reduce wear on tyres and chassis components.
There are a number of different types of damper.
Friction damper Not used on cars today but you
will find this system used as part of
caravan or trailer stabilisers
Lever type damper Used on earlier vehicles, the lever
operates a piston which forces oil
into a chamber
Twin tube telescopic This is a commonly used type of
damper damper consisting of two tubes.An
outer tube forms a reservoir space
and contains the oil displaced from
an inner tube. Oil is forced
through a valve by the action of a
piston as the damper moves up or
down.The reservoir space is
essential to make up for the
changes in volume as the piston
rod moves in and out
Single tube telescopic This is often referred to as a gas
damper damper. However, the damping
action is still achieved by forcing oil
through a restriction.The gas
space behind a separator piston is
to compensate for the changes in
cylinder volume caused as the pis-
ton rod moves. It is at a pressure
of about 25 bar
Twin tube gas damper The twin tube gas damper is an
(Figure 8.30) improvement on the well-used
twin tube system.The gas cushion
is used in this case to prevent oil
foaming.The gas pressure on the
oil prevents foaming which in turn
ensures constant operation under
all operating conditions. Gas pres-
sure is lower than for a single tube
damper at about 5 bar
Variable rate damper This is a special variation of the
twin tube gas damper.The damping
characteristics vary depending on
the load on the vehicle. Bypass
grooves are machined in the upper
half of the working chamber.With
light loads the damper works in
this area with a soft damping
effect.When the load is increased
the piston moves lower down the
working chamber away from the
grooves resulting in full damping
effect
Electronically controlled These are dampers where the
dampers damping rate can be controlled by
solenoid valves inside the units.
With suitable electronic control,
the characteristics can be changed
within milliseconds to react to
driving and/or load conditions
194 Advanced automotive fault diagnosis
Figure 8.30 Twin tube gas damper
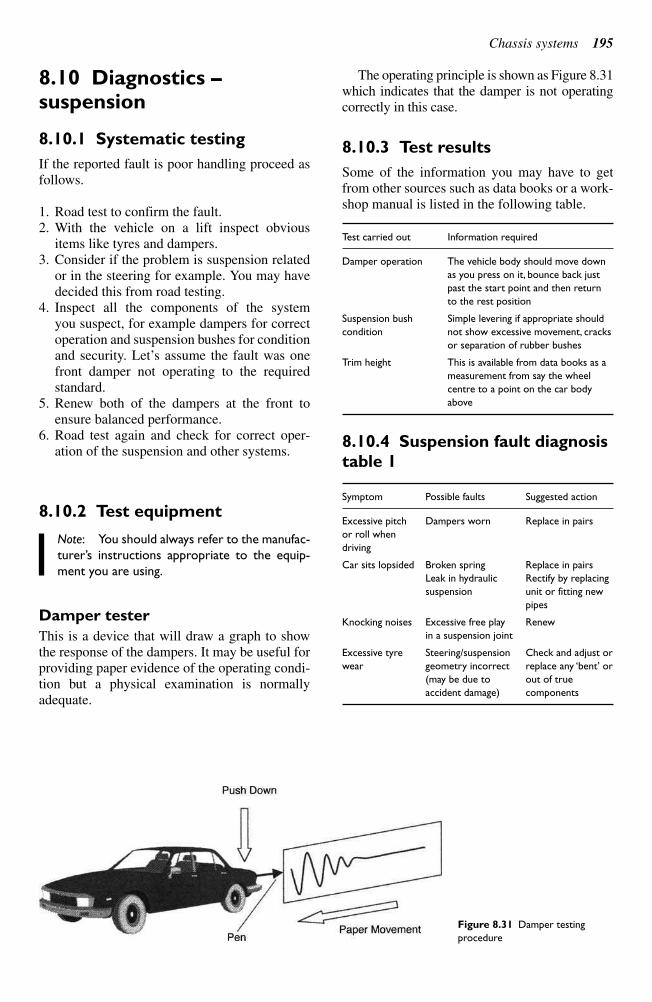
8.10 Diagnostics – suspension
8.10.1 Systematic testing
If the reported fault is poor handling proceed as
follows.
1. Road test to confirm the fault.
2. With the vehicle on a lift inspect obvious
items like tyres and dampers.
3. Consider if the problem is suspension related
or in the steering for example. You may have
decided this from road testing.
4. Inspect all the components of the system
you suspect, for example dampers for correct
operation and suspension bushes for condition
and security. Let’s assume the fault was onefront damper not operating to the requiredstandard.
5. Renew both of the dampers at the front toensure balanced performance.
6. Road test again and check for correct oper-ation of the suspension and other systems.
8.10.2 Test equipment
Note: You should always refer to the manufac-
turer’s instructions appropriate to the equip-
ment you are using.
Damper tester
This is a device that will draw a graph to showthe response of the dampers. It may be useful forproviding paper evidence of the operating condi-tion but a physical examination is normally adequate.
The operating principle is shown as Figure 8.31which indicates that the damper is not operatingcorrectly in this case.
8.10.3 Test results
Some of the information you may have to getfrom other sources such as data books or a work-shop manual is listed in the following table.
Test carried out Information required
Damper operation The vehicle body should move down
as you press on it, bounce back just
past the start point and then return
to the rest position
Suspension bush Simple levering if appropriate should
condition not show excessive movement, cracks
or separation of rubber bushes
Trim height This is available from data books as a
measurement from say the wheel
centre to a point on the car body
above
8.10.4 Suspension fault diagnosis
table 1
Symptom Possible faults Suggested action
Excessive pitch Dampers worn Replace in pairs
or roll when
driving
Car sits lopsided Broken spring Replace in pairs
Leak in hydraulic Rectify by replacing
suspension unit or fitting new
pipes
Knocking noises Excessive free play Renew
in a suspension joint
Excessive tyre Steering/suspension Check and adjust or
wear geometry incorrect replace any ‘bent’ or
(may be due to out of true
accident damage) components
Chassis systems 195
Figure 8.31 Damper testing
procedure
8.10.5 Suspension fault
diagnosis table 2
Symptom Possible cause
Excessive pitching Defective dampers
Broken or weak spring
Worn or damaged anti-roll bar mountings
Wandering or Broken or weak spring
instability Worn suspension joints
Defective dampers
Wheel wobble Worn suspension joints
Pulling to one side Worn suspension joints
Accident damage to suspension alignment
Excessive tyre wear Worn suspension joints
Accident damage to suspension alignment
Incorrect trim height (particularly
hydro-elastic systems)
196 Advanced automotive fault diagnosis
Knowledge check questions
To use these questions, you should first try to answer them without help but if necessary, refer back to
the content of the chapter. Use notes, lists and sketches to answer them. It is not necessary to write
pages and pages of text!
1. Describe how to test the operation of an ABS wheel speed sensor.
2. List in a logical sequence, a series of tests to determine the cause of steering pulling to one side when
braking.
3. Describe a method of testing a damper (shock absorber).
4. Make a sketch to show three different types of tyre wear and state for each a possible cause.
5. Explain why it may be necessary to check the run-out on a brake disk (rotor) and describe how this
is done.
9.1 Electronic componentsand circuits
9.1.1 Introduction
This section describing the principles and applica-
tions of various electronic components and circuits
is not intended to explain their detailed operation.
Overall, an understanding of basic electronic prin-
ciples will help to show how electronic systems
operate. These can range from a simple interior
light delay unit to the most complicated engine
management system. Testing individual electronic
components is a useful diagnostic procedure.
9.1.2 Components
The symbols for the following electronic compon-
ents are shown in Figure 9.1.
Resistors are probably the most widely used
component in electronic circuits. Two factors
must be considered when choosing a suitable
resistor, the ohms value and the power rating.
Resistors are used to limit current flow and pro-
vide fixed voltage drops. Most resistors used in
electronic circuits are made from small carbon
rods; the size of the rod determines the resistance.
Carbon resistors have a negative temperature
coefficient (NTC) and this must be considered for
some applications. Thin-film resistors have more
stable temperature properties and are constructed
by depositing a layer of carbon on to an insulated
former such as glass. The resistance value can be
manufactured very accurately by spiral grooves
cut into the carbon film. For higher power appli-
cations resistors are usually wire wound. Variable
forms of most resistors are available. The resist-
ance of a circuit is its opposition to current flow.
A capacitor is a device for storing an electric
charge. In its simple form it consists of two
plates separated by an insulating material. One
plate can have excess electrons compared to the
other. On vehicles its main uses are for reducing
arcing across contracts and for radio interference
suppression circuits as well as in ECUs. Capacitors
are described as two plates separated by a dielec-
tric. The area of the plates, the distance between
them and the nature of the dielectric determine the
value of capacitance. Metal foil sheets insulated by
a type of paper are often used to construct capaci-
tors. The sheets are rolled up together inside a tin
can. To achieve higher values of capacitance it is
necessary to reduce the distance between the plates
in order to keep the overall size of the device man-
ageable. This is achieved by immersing one plate
in an electrolyte to deposit a layer of oxide typic-
ally 104mm thick thus ensuring a higher capaci-
tance value. The problem, however, is that this now
makes the device polarity conscious and only able
to withstand low voltages.
Diodes are often described as one-way valves
and for most applications this is an acceptable
description. A diode is a PN junction allowing
electron flow from the N type material to the P type
material. The materials are usually constructed
from doped silicon. Diodes are not perfect devices
and a voltage of about 0.6 V is required to switch
the diode on in its forward biased direction.
Zener diodes are very similar in operation with
the exception that they are designed to breakdown
and conduct in the reverse direction at a prede-
termined voltage. They can be thought of as a
type of pressure relief valve.
Transistors are the devices that have allowed
the development of today’s complex and smallelectronic systems. The transistor is used aseither a solid state switch or as an amplifier. Theyare constructed from the same P and N typesemiconductor materials as the diodes and can bemade in either NPN or PNP format. The threeterminals are known as the base, collector andemitter. When the base is supplied with the cor-rect bias the circuit between the collector andemitter will conduct. The base current can be inthe order of 50 to 200 times less than the emittercurrent. The ratio of the current flowing throughthe base compared to the current through theemitter is an indication of the amplification fac-tor of the device.
9
Electrical systems
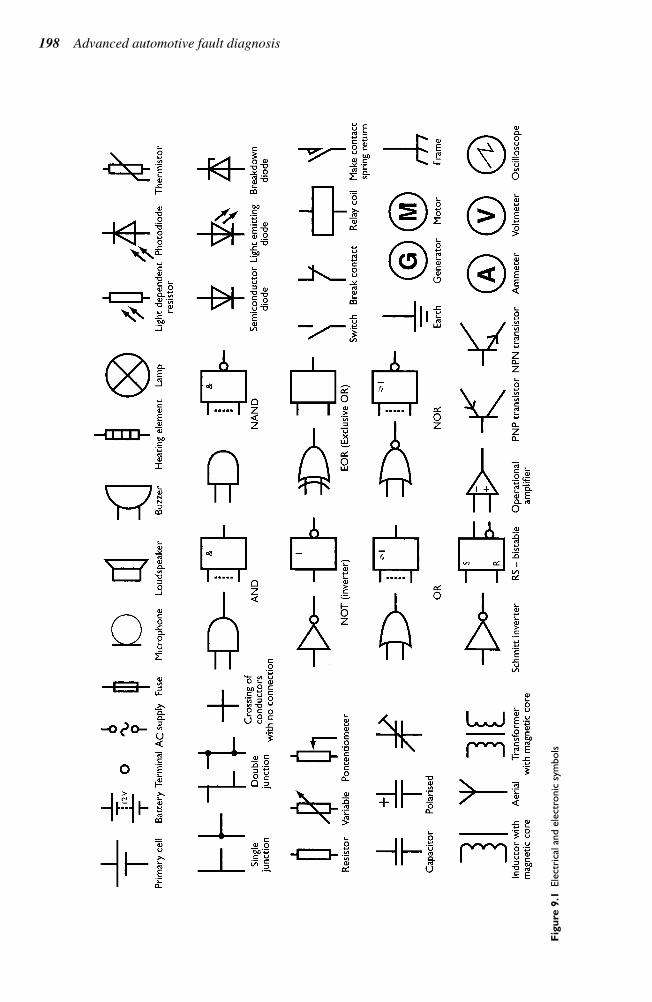
198 Advanced automotive fault diagnosis
Fig
ure
9.1
Ele
ctri
cal an
d e
lect
ronic
sym
bols
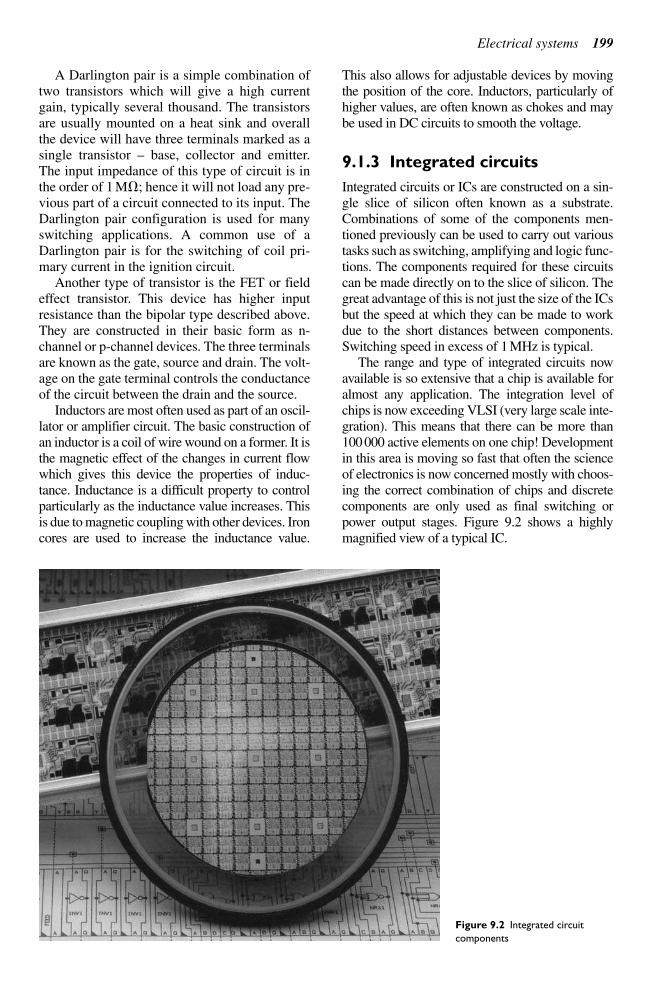
A Darlington pair is a simple combination of
two transistors which will give a high current
gain, typically several thousand. The transistors
are usually mounted on a heat sink and overall
the device will have three terminals marked as a
single transistor – base, collector and emitter.The input impedance of this type of circuit is inthe order of 1 M; hence it will not load any pre-vious part of a circuit connected to its input. TheDarlington pair configuration is used for manyswitching applications. A common use of aDarlington pair is for the switching of coil pri-mary current in the ignition circuit.
Another type of transistor is the FET or fieldeffect transistor. This device has higher inputresistance than the bipolar type described above.They are constructed in their basic form as n-channel or p-channel devices. The three terminalsare known as the gate, source and drain. The volt-age on the gate terminal controls the conductanceof the circuit between the drain and the source.
Inductors are most often used as part of an oscil-lator or amplifier circuit. The basic construction ofan inductor is a coil of wire wound on a former. It isthe magnetic effect of the changes in current flowwhich gives this device the properties of induc-tance. Inductance is a difficult property to controlparticularly as the inductance value increases. Thisis due to magnetic coupling with other devices. Ironcores are used to increase the inductance value.
This also allows for adjustable devices by movingthe position of the core. Inductors, particularly ofhigher values, are often known as chokes and maybe used in DC circuits to smooth the voltage.
9.1.3 Integrated circuits
Integrated circuits or ICs are constructed on a sin-gle slice of silicon often known as a substrate.Combinations of some of the components men-tioned previously can be used to carry out varioustasks such as switching, amplifying and logic func-tions. The components required for these circuitscan be made directly on to the slice of silicon. Thegreat advantage of this is not just the size of the ICsbut the speed at which they can be made to workdue to the short distances between components.Switching speed in excess of 1 MHz is typical.
The range and type of integrated circuits nowavailable is so extensive that a chip is available foralmost any application. The integration level ofchips is now exceeding VLSI (very large scale inte-gration). This means that there can be more than100 000 active elements on one chip! Developmentin this area is moving so fast that often the scienceof electronics is now concerned mostly with choos-ing the correct combination of chips and discretecomponents are only used as final switching orpower output stages. Figure 9.2 shows a highlymagnified view of a typical IC.
Electrical systems 199
Figure 9.2 Integrated circuit
components
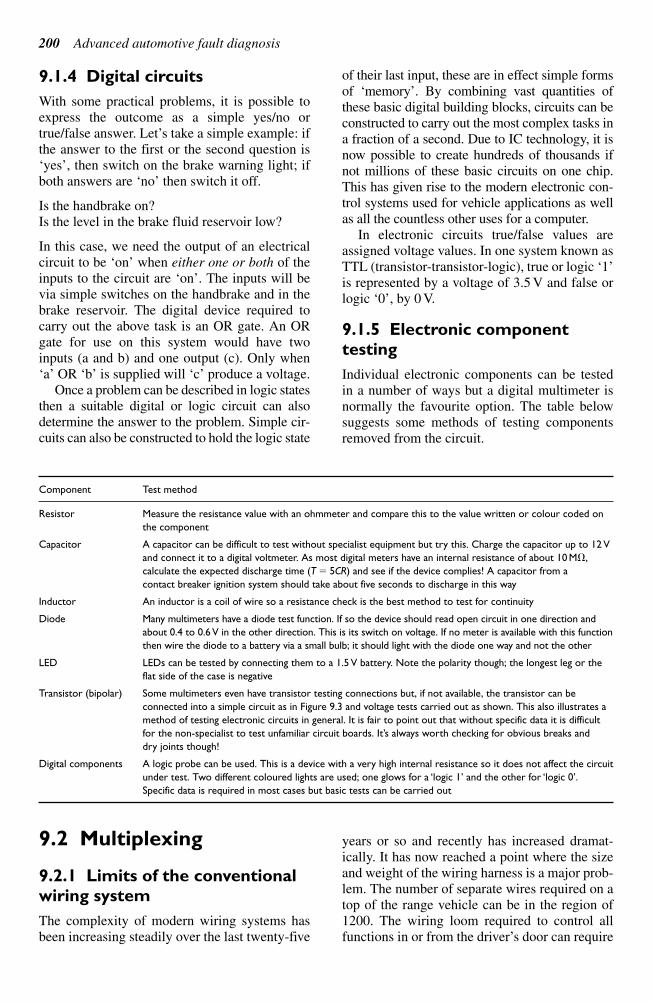
200 Advanced automotive fault diagnosis
Component Test method
Resistor Measure the resistance value with an ohmmeter and compare this to the value written or colour coded on
the component
Capacitor A capacitor can be difficult to test without specialist equipment but try this. Charge the capacitor up to 12 V
and connect it to a digital voltmeter. As most digital meters have an internal resistance of about 10 M,
calculate the expected discharge time (T 5CR) and see if the device complies! A capacitor from a
contact breaker ignition system should take about five seconds to discharge in this way
Inductor An inductor is a coil of wire so a resistance check is the best method to test for continuity
Diode Many multimeters have a diode test function. If so the device should read open circuit in one direction and
about 0.4 to 0.6 V in the other direction. This is its switch on voltage. If no meter is available with this function
then wire the diode to a battery via a small bulb; it should light with the diode one way and not the other
LED LEDs can be tested by connecting them to a 1.5 V battery. Note the polarity though; the longest leg or the
flat side of the case is negative
Transistor (bipolar) Some multimeters even have transistor testing connections but, if not available, the transistor can be
connected into a simple circuit as in Figure 9.3 and voltage tests carried out as shown. This also illustrates a
method of testing electronic circuits in general. It is fair to point out that without specific data it is difficult
for the non-specialist to test unfamiliar circuit boards. It’s always worth checking for obvious breaks and
dry joints though!
Digital components A logic probe can be used. This is a device with a very high internal resistance so it does not affect the circuit
under test. Two different coloured lights are used; one glows for a ‘logic 1’ and the other for ‘logic 0’.
Specific data is required in most cases but basic tests can be carried out
9.2 Multiplexing
9.2.1 Limits of the conventional
wiring system
The complexity of modern wiring systems has
been increasing steadily over the last twenty-five
years or so and recently has increased dramat-
ically. It has now reached a point where the size
and weight of the wiring harness is a major prob-
lem. The number of separate wires required on a
top of the range vehicle can be in the region of
1200. The wiring loom required to control all
functions in or from the driver’s door can require
9.1.4 Digital circuits
With some practical problems, it is possible toexpress the outcome as a simple yes/no ortrue/false answer. Let’s take a simple example: ifthe answer to the first or the second question is‘yes’, then switch on the brake warning light; ifboth answers are ‘no’ then switch it off.
Is the handbrake on?Is the level in the brake fluid reservoir low?
In this case, we need the output of an electricalcircuit to be ‘on’ when either one or both of theinputs to the circuit are ‘on’. The inputs will bevia simple switches on the handbrake and in thebrake reservoir. The digital device required tocarry out the above task is an OR gate. An ORgate for use on this system would have twoinputs (a and b) and one output (c). Only when‘a’ OR ‘b’ is supplied will ‘c’ produce a voltage.
Once a problem can be described in logic statesthen a suitable digital or logic circuit can alsodetermine the answer to the problem. Simple cir-cuits can also be constructed to hold the logic state
of their last input, these are in effect simple formsof ‘memory’. By combining vast quantities ofthese basic digital building blocks, circuits can beconstructed to carry out the most complex tasks ina fraction of a second. Due to IC technology, it isnow possible to create hundreds of thousands ifnot millions of these basic circuits on one chip.This has given rise to the modern electronic con-trol systems used for vehicle applications as wellas all the countless other uses for a computer.
In electronic circuits true/false values areassigned voltage values. In one system known asTTL (transistor-transistor-logic), true or logic ‘1’is represented by a voltage of 3.5 V and false orlogic ‘0’, by 0 V.
9.1.5 Electronic component
testing
Individual electronic components can be testedin a number of ways but a digital multimeter isnormally the favourite option. The table belowsuggests some methods of testing componentsremoved from the circuit.
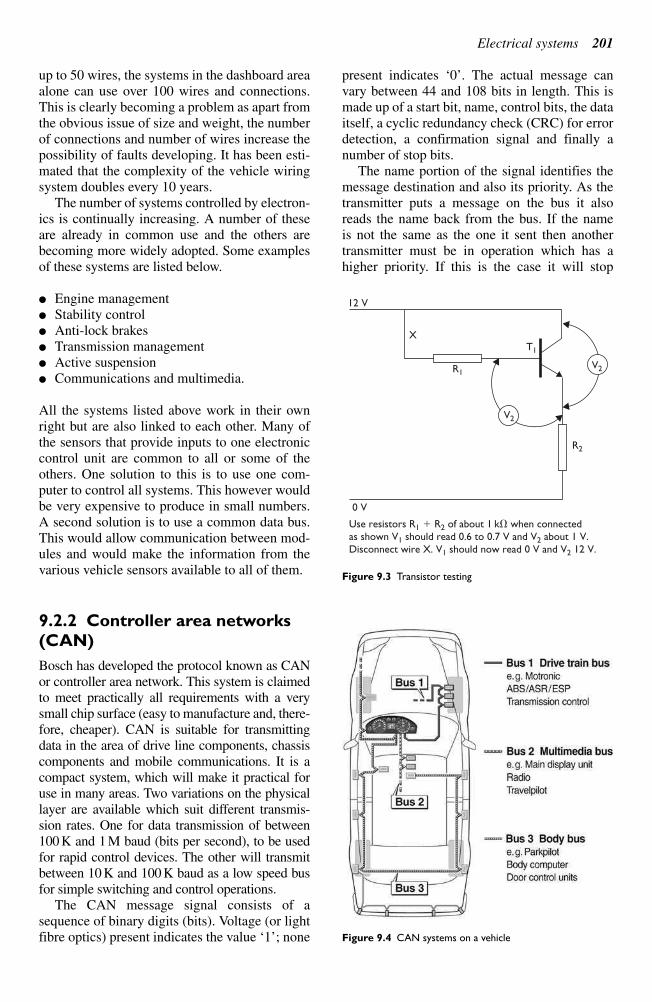
up to 50 wires, the systems in the dashboard area
alone can use over 100 wires and connections.
This is clearly becoming a problem as apart from
the obvious issue of size and weight, the number
of connections and number of wires increase the
possibility of faults developing. It has been esti-
mated that the complexity of the vehicle wiring
system doubles every 10 years.
The number of systems controlled by electron-
ics is continually increasing. A number of these
are already in common use and the others are
becoming more widely adopted. Some examples
of these systems are listed below.
Engine management
Stability control
Anti-lock brakes
Transmission management
Active suspension
Communications and multimedia.
All the systems listed above work in their own
right but are also linked to each other. Many of
the sensors that provide inputs to one electronic
control unit are common to all or some of the
others. One solution to this is to use one com-
puter to control all systems. This however would
be very expensive to produce in small numbers.
A second solution is to use a common data bus.
This would allow communication between mod-
ules and would make the information from the
various vehicle sensors available to all of them.
9.2.2 Controller area networks
(CAN)
Bosch has developed the protocol known as CAN
or controller area network. This system is claimed
to meet practically all requirements with a very
small chip surface (easy to manufacture and, there-
fore, cheaper). CAN is suitable for transmitting
data in the area of drive line components, chassis
components and mobile communications. It is a
compact system, which will make it practical for
use in many areas. Two variations on the physical
layer are available which suit different transmis-
sion rates. One for data transmission of between
100 K and 1 M baud (bits per second), to be used
for rapid control devices. The other will transmit
between 10 K and 100 K baud as a low speed bus
for simple switching and control operations.
The CAN message signal consists of a
sequence of binary digits (bits). Voltage (or light
fibre optics) present indicates the value ‘1’; none
present indicates ‘0’. The actual message canvary between 44 and 108 bits in length. This ismade up of a start bit, name, control bits, the dataitself, a cyclic redundancy check (CRC) for errordetection, a confirmation signal and finally anumber of stop bits.
The name portion of the signal identifies themessage destination and also its priority. As thetransmitter puts a message on the bus it alsoreads the name back from the bus. If the name is not the same as the one it sent then anothertransmitter must be in operation which has ahigher priority. If this is the case it will stop
Electrical systems 201
Use resistors R1 R2 of about 1 k when connectedas shown V1 should read 0.6 to 0.7 V and V2 about 1 V.Disconnect wire X. V1 should now read 0 V and V2 12 V.
0 V
12 V
X
R1
R2
T1
V2
V2
Figure 9.3 Transistor testing
Figure 9.4 CAN systems on a vehicle
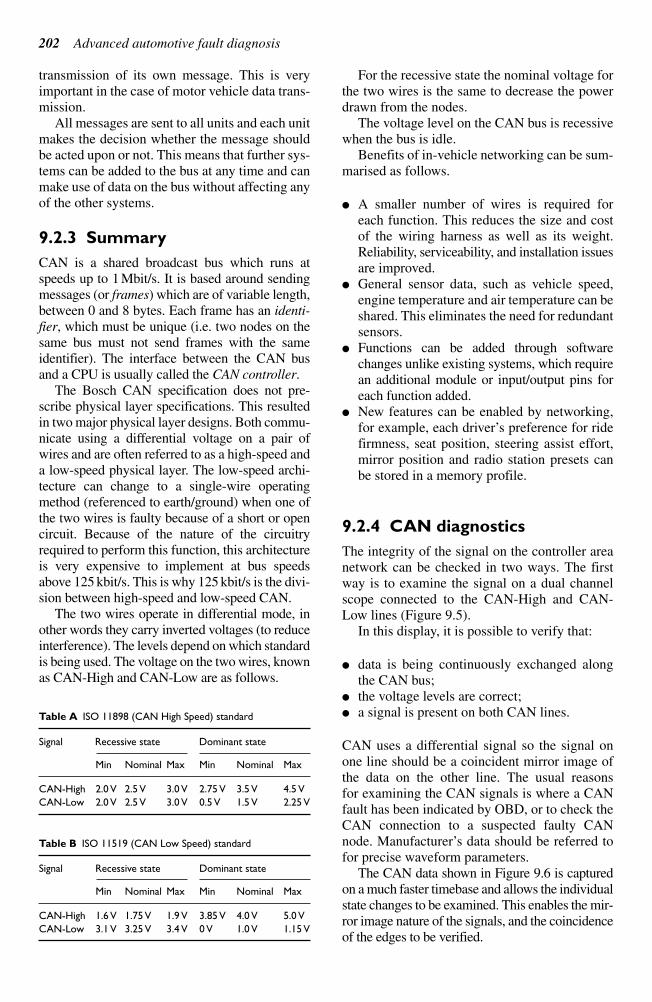
transmission of its own message. This is very
important in the case of motor vehicle data trans-
mission.
All messages are sent to all units and each unit
makes the decision whether the message should
be acted upon or not. This means that further sys-
tems can be added to the bus at any time and can
make use of data on the bus without affecting any
of the other systems.
9.2.3 Summary
CAN is a shared broadcast bus which runs at
speeds up to 1 Mbit/s. It is based around sending
messages (or frames) which are of variable length,
between 0 and 8 bytes. Each frame has an identi-
fier, which must be unique (i.e. two nodes on the
same bus must not send frames with the same
identifier). The interface between the CAN bus
and a CPU is usually called the CAN controller.
The Bosch CAN specification does not pre-
scribe physical layer specifications. This resulted
in two major physical layer designs. Both commu-
nicate using a differential voltage on a pair of
wires and are often referred to as a high-speed and
a low-speed physical layer. The low-speed archi-
tecture can change to a single-wire operating
method (referenced to earth/ground) when one of
the two wires is faulty because of a short or open
circuit. Because of the nature of the circuitry
required to perform this function, this architecture
is very expensive to implement at bus speeds
above 125 kbit/s. This is why 125 kbit/s is the divi-
sion between high-speed and low-speed CAN.
The two wires operate in differential mode, in
other words they carry inverted voltages (to reduce
interference). The levels depend on which standard
is being used. The voltage on the two wires, known
as CAN-High and CAN-Low are as follows.
Table A ISO 11898 (CAN High Speed) standard
Signal Recessive state Dominant state
Min Nominal Max Min Nominal Max
CAN-High 2.0 V 2.5 V 3.0 V 2.75 V 3.5 V 4.5 V
CAN-Low 2.0 V 2.5 V 3.0 V 0.5 V 1.5 V 2.25 V
Table B ISO 11519 (CAN Low Speed) standard
Signal Recessive state Dominant state
Min Nominal Max Min Nominal Max
CAN-High 1.6 V 1.75 V 1.9 V 3.85 V 4.0 V 5.0 V
CAN-Low 3.1 V 3.25 V 3.4 V 0 V 1.0 V 1.15 V
For the recessive state the nominal voltage for
the two wires is the same to decrease the power
drawn from the nodes.
The voltage level on the CAN bus is recessive
when the bus is idle.
Benefits of in-vehicle networking can be sum-
marised as follows.
A smaller number of wires is required for
each function. This reduces the size and cost
of the wiring harness as well as its weight.
Reliability, serviceability, and installation issues
are improved.
General sensor data, such as vehicle speed,
engine temperature and air temperature can be
shared. This eliminates the need for redundant
sensors.
Functions can be added through software
changes unlike existing systems, which require
an additional module or input/output pins for
each function added.
New features can be enabled by networking,
for example, each driver’s preference for ridefirmness, seat position, steering assist effort,mirror position and radio station presets canbe stored in a memory profile.
9.2.4 CAN diagnostics
The integrity of the signal on the controller areanetwork can be checked in two ways. The firstway is to examine the signal on a dual channelscope connected to the CAN-High and CAN-Low lines (Figure 9.5).
In this display, it is possible to verify that:
data is being continuously exchanged alongthe CAN bus;
the voltage levels are correct; a signal is present on both CAN lines.
CAN uses a differential signal so the signal onone line should be a coincident mirror image ofthe data on the other line. The usual reasons for examining the CAN signals is where a CANfault has been indicated by OBD, or to check theCAN connection to a suspected faulty CANnode. Manufacturer’s data should be referred tofor precise waveform parameters.
The CAN data shown in Figure 9.6 is capturedon a much faster timebase and allows the individualstate changes to be examined. This enables the mir-ror image nature of the signals, and the coincidenceof the edges to be verified.
202 Advanced automotive fault diagnosis
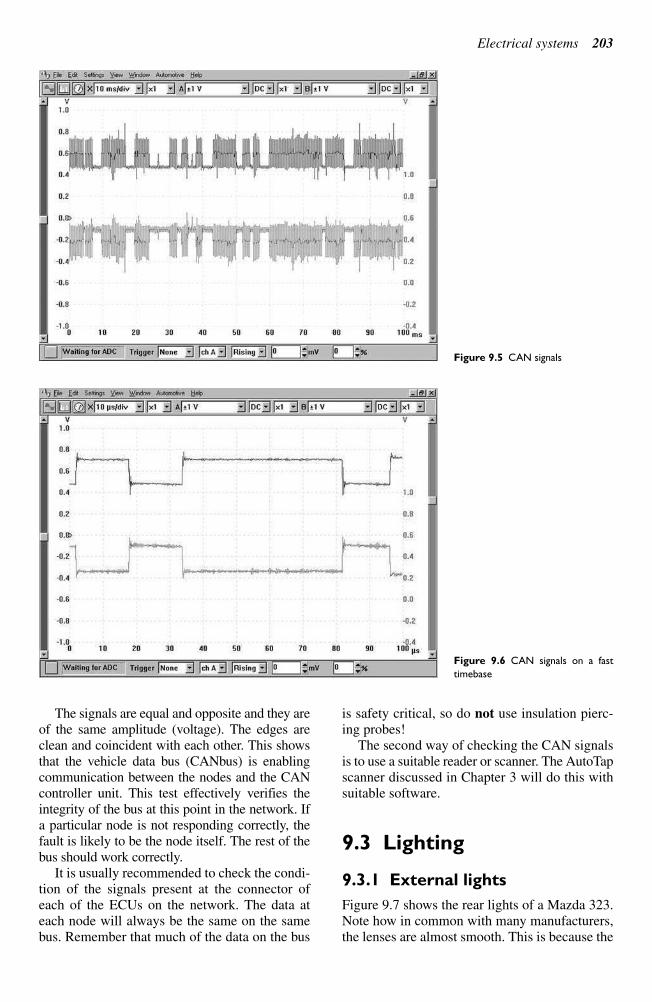
The signals are equal and opposite and they are
of the same amplitude (voltage). The edges are
clean and coincident with each other. This shows
that the vehicle data bus (CANbus) is enabling
communication between the nodes and the CAN
controller unit. This test effectively verifies the
integrity of the bus at this point in the network. If
a particular node is not responding correctly, the
fault is likely to be the node itself. The rest of the
bus should work correctly.
It is usually recommended to check the condi-
tion of the signals present at the connector of
each of the ECUs on the network. The data at
each node will always be the same on the same
bus. Remember that much of the data on the bus
is safety critical, so do not use insulation pierc-
ing probes!
The second way of checking the CAN signals
is to use a suitable reader or scanner. The AutoTap
scanner discussed in Chapter 3 will do this with
suitable software.
9.3 Lighting
9.3.1 External lights
Figure 9.7 shows the rear lights of a Mazda 323.
Note how in common with many manufacturers,
the lenses are almost smooth. This is because the
Electrical systems 203
Figure 9.5 CAN signals
Figure 9.6 CAN signals on a fast
timebase
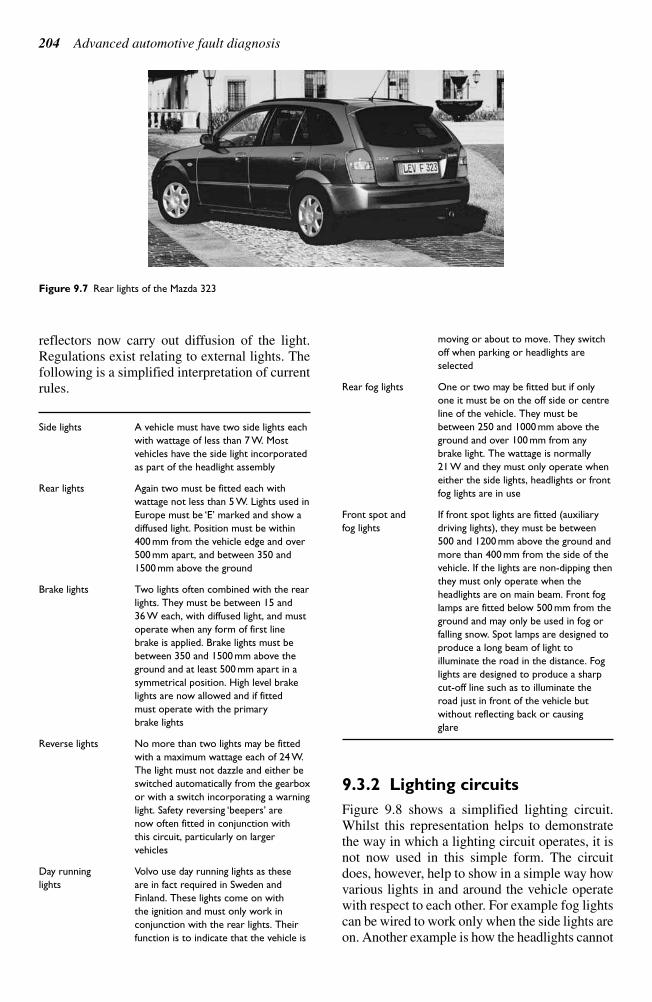
reflectors now carry out diffusion of the light.
Regulations exist relating to external lights. The
following is a simplified interpretation of current
rules.
Side lights A vehicle must have two side lights each
with wattage of less than 7 W. Most
vehicles have the side light incorporated
as part of the headlight assembly
Rear lights Again two must be fitted each with
wattage not less than 5 W. Lights used in
Europe must be ‘E’ marked and show a
diffused light. Position must be within
400 mm from the vehicle edge and over
500 mm apart, and between 350 and
1500 mm above the ground
Brake lights Two lights often combined with the rear
lights. They must be between 15 and
36 W each, with diffused light, and must
operate when any form of first line
brake is applied. Brake lights must be
between 350 and 1500 mm above the
ground and at least 500 mm apart in a
symmetrical position. High level brake
lights are now allowed and if fitted
must operate with the primary
brake lights
Reverse lights No more than two lights may be fitted
with a maximum wattage each of 24 W.
The light must not dazzle and either be
switched automatically from the gearbox
or with a switch incorporating a warning
light. Safety reversing ‘beepers’ are
now often fitted in conjunction with
this circuit, particularly on larger
vehicles
Day running Volvo use day running lights as these
lights are in fact required in Sweden and
Finland. These lights come on with
the ignition and must only work in
conjunction with the rear lights. Their
function is to indicate that the vehicle is
moving or about to move. They switch
off when parking or headlights are
selected
Rear fog lights One or two may be fitted but if only
one it must be on the off side or centre
line of the vehicle. They must be
between 250 and 1000 mm above the
ground and over 100 mm from any
brake light. The wattage is normally
21 W and they must only operate when
either the side lights, headlights or front
fog lights are in use
Front spot and If front spot lights are fitted (auxiliary
fog lights driving lights), they must be between
500 and 1200 mm above the ground and
more than 400 mm from the side of the
vehicle. If the lights are non-dipping then
they must only operate when the
headlights are on main beam. Front fog
lamps are fitted below 500 mm from the
ground and may only be used in fog or
falling snow. Spot lamps are designed to
produce a long beam of light to
illuminate the road in the distance. Fog
lights are designed to produce a sharp
cut-off line such as to illuminate the
road just in front of the vehicle but
without reflecting back or causing
glare
9.3.2 Lighting circuits
Figure 9.8 shows a simplified lighting circuit.
Whilst this representation helps to demonstrate
the way in which a lighting circuit operates, it is
not now used in this simple form. The circuit
does, however, help to show in a simple way how
various lights in and around the vehicle operate
with respect to each other. For example fog lights
can be wired to work only when the side lights are
on. Another example is how the headlights cannot
204 Advanced automotive fault diagnosis
Figure 9.7 Rear lights of the Mazda 323
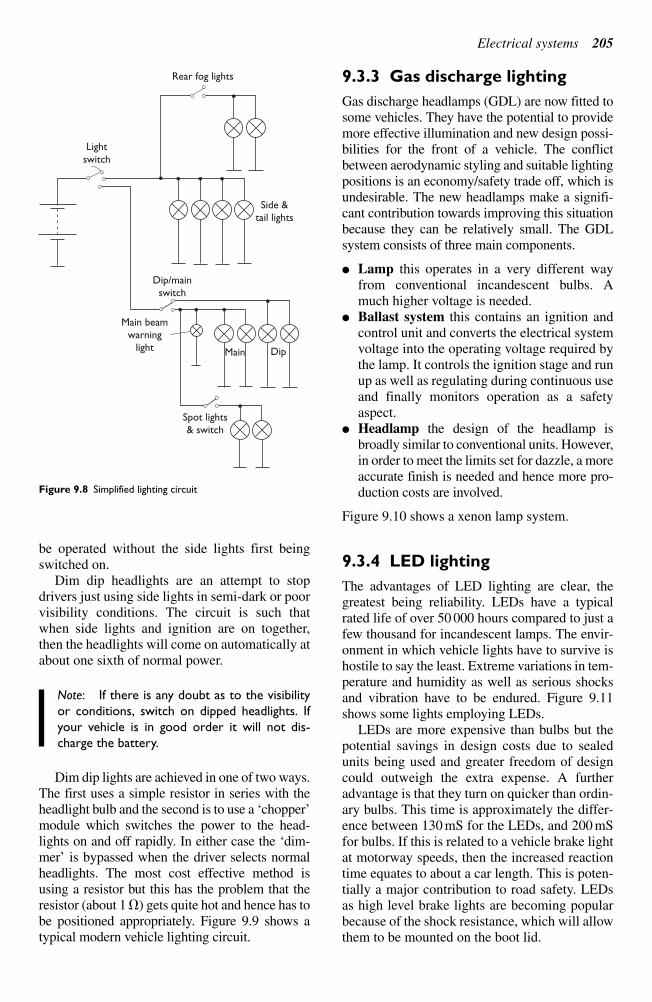
be operated without the side lights first being
switched on.
Dim dip headlights are an attempt to stop
drivers just using side lights in semi-dark or poor
visibility conditions. The circuit is such that
when side lights and ignition are on together,
then the headlights will come on automatically at
about one sixth of normal power.
Note: If there is any doubt as to the visibility
or conditions, switch on dipped headlights. If
your vehicle is in good order it will not dis-
charge the battery.
Dim dip lights are achieved in one of two ways.
The first uses a simple resistor in series with the
headlight bulb and the second is to use a ‘chopper’module which switches the power to the head-lights on and off rapidly. In either case the ‘dim-mer’ is bypassed when the driver selects normalheadlights. The most cost effective method isusing a resistor but this has the problem that theresistor (about 1 ) gets quite hot and hence has tobe positioned appropriately. Figure 9.9 shows atypical modern vehicle lighting circuit.
9.3.3 Gas discharge lighting
Gas discharge headlamps (GDL) are now fitted tosome vehicles. They have the potential to providemore effective illumination and new design possi-bilities for the front of a vehicle. The conflictbetween aerodynamic styling and suitable lightingpositions is an economy/safety trade off, which isundesirable. The new headlamps make a signifi-cant contribution towards improving this situationbecause they can be relatively small. The GDLsystem consists of three main components.
Lamp this operates in a very different wayfrom conventional incandescent bulbs. Amuch higher voltage is needed.
Ballast system this contains an ignition andcontrol unit and converts the electrical systemvoltage into the operating voltage required bythe lamp. It controls the ignition stage and runup as well as regulating during continuous useand finally monitors operation as a safetyaspect.
Headlamp the design of the headlamp isbroadly similar to conventional units. However,in order to meet the limits set for dazzle, a moreaccurate finish is needed and hence more pro-duction costs are involved.
Figure 9.10 shows a xenon lamp system.
9.3.4 LED lighting
The advantages of LED lighting are clear, thegreatest being reliability. LEDs have a typicalrated life of over 50 000 hours compared to just afew thousand for incandescent lamps. The envir-onment in which vehicle lights have to survive ishostile to say the least. Extreme variations in tem-perature and humidity as well as serious shocksand vibration have to be endured. Figure 9.11shows some lights employing LEDs.
LEDs are more expensive than bulbs but thepotential savings in design costs due to sealedunits being used and greater freedom of designcould outweigh the extra expense. A furtheradvantage is that they turn on quicker than ordin-ary bulbs. This time is approximately the differ-ence between 130 mS for the LEDs, and 200 mSfor bulbs. If this is related to a vehicle brake lightat motorway speeds, then the increased reactiontime equates to about a car length. This is poten-tially a major contribution to road safety. LEDsas high level brake lights are becoming popularbecause of the shock resistance, which will allowthem to be mounted on the boot lid.
Electrical systems 205
Rear fog lights
Lightswitch
Side &tail lights
Dip/mainswitch
Main Dip
Spot lights& switch
Main beamwarning
light
Figure 9.8 Simplified lighting circuit
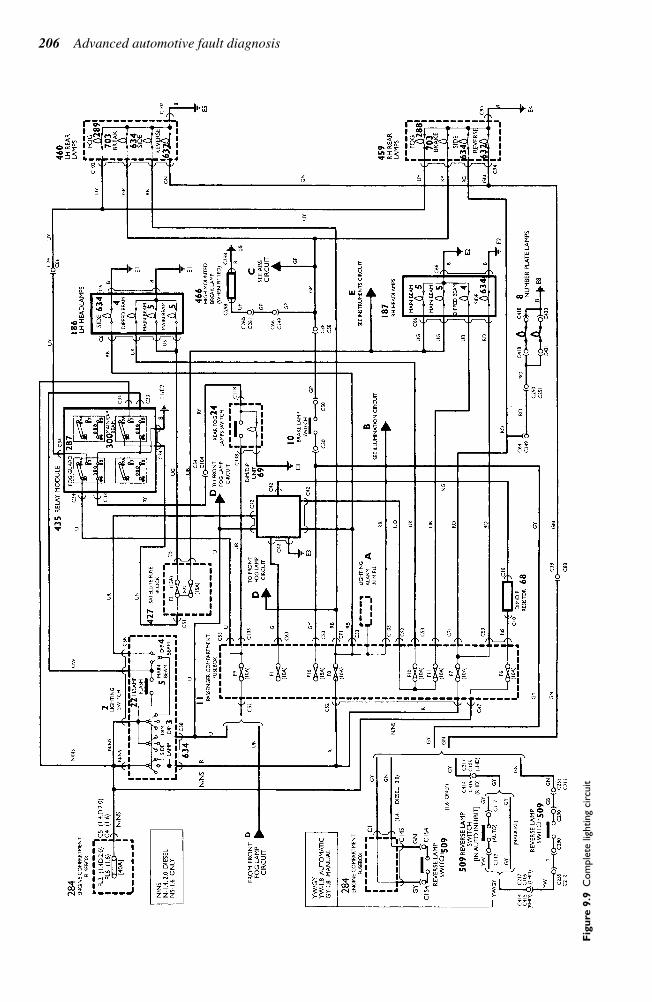
206 Advanced automotive fault diagnosis
Fig
ure
9.9
Com
ple
te lig
hting
circ
uit
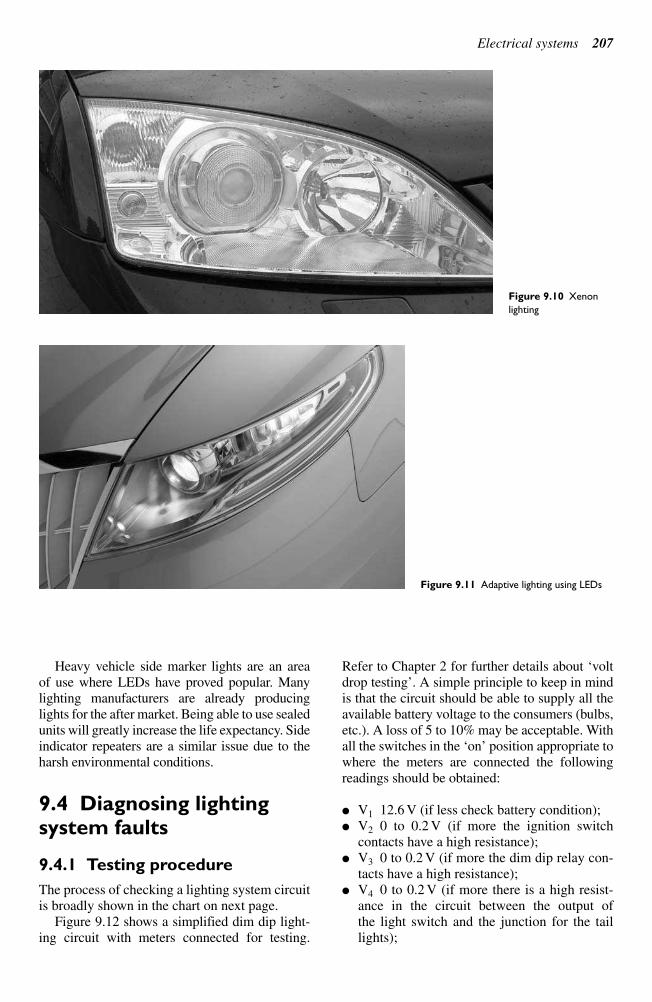
Heavy vehicle side marker lights are an area
of use where LEDs have proved popular. Many
lighting manufacturers are already producing
lights for the after market. Being able to use sealed
units will greatly increase the life expectancy. Side
indicator repeaters are a similar issue due to the
harsh environmental conditions.
9.4 Diagnosing lightingsystem faults
9.4.1 Testing procedure
The process of checking a lighting system circuit
is broadly shown in the chart on next page.
Figure 9.12 shows a simplified dim dip light-
ing circuit with meters connected for testing.
Refer to Chapter 2 for further details about ‘voltdrop testing’. A simple principle to keep in mindis that the circuit should be able to supply all theavailable battery voltage to the consumers (bulbs,etc.). A loss of 5 to 10% may be acceptable. Withall the switches in the ‘on’ position appropriate towhere the meters are connected the followingreadings should be obtained:
V1 12.6 V (if less check battery condition); V2 0 to 0.2 V (if more the ignition switch
contacts have a high resistance); V3 0 to 0.2 V (if more the dim dip relay con-
tacts have a high resistance); V4 0 to 0.2 V (if more there is a high resist-
ance in the circuit between the output of the light switch and the junction for the taillights);
Electrical systems 207
Figure 9.10 Xenon
lighting
Figure 9.11 Adaptive lighting using LEDs
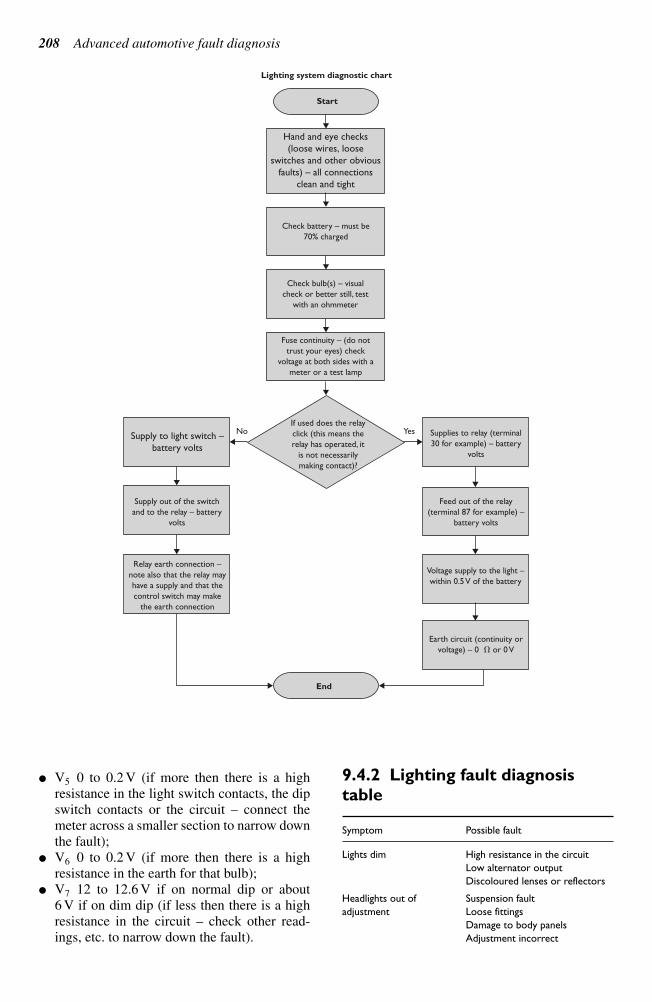
V5 0 to 0.2 V (if more then there is a high
resistance in the light switch contacts, the dip
switch contacts or the circuit – connect themeter across a smaller section to narrow downthe fault);
V6 0 to 0.2 V (if more then there is a highresistance in the earth for that bulb);
V7 12 to 12.6 V if on normal dip or about 6 V if on dim dip (if less then there is a highresistance in the circuit – check other read-ings, etc. to narrow down the fault).
9.4.2 Lighting fault diagnosis
table
Symptom Possible fault
Lights dim High resistance in the circuit
Low alternator output
Discoloured lenses or reflectors
Headlights out of Suspension fault
adjustment Loose fittings
Damage to body panels
Adjustment incorrect
208 Advanced automotive fault diagnosis
Start
Lighting system diagnostic chart
End
Check battery – must be
70% charged
Check bulb(s) – visual
check or better still, test
with an ohmmeter
Fuse continuity – (do not
trust your eyes) check
voltage at both sides with a
meter or a test lamp
If used does the relay
click (this means the
relay has operated, it
is not necessarily
making contact)?
Supplies to relay (terminal
30 for example) – battery
volts
Feed out of the relay
(terminal 87 for example) –
battery volts
YesNo
Supply out of the switch
and to the relay – battery
volts
Relay earth connection –
note also that the relay may
have a supply and that the
control switch may make
the earth connection
Voltage supply to the light –
within 0.5 V of the battery
Earth circuit (continuity or
voltage) – 0 or 0 V
Hand and eye checks
(loose wires, loose
switches and other obvious
faults) – all connections
clean and tight
Supply to light switch –
battery volts
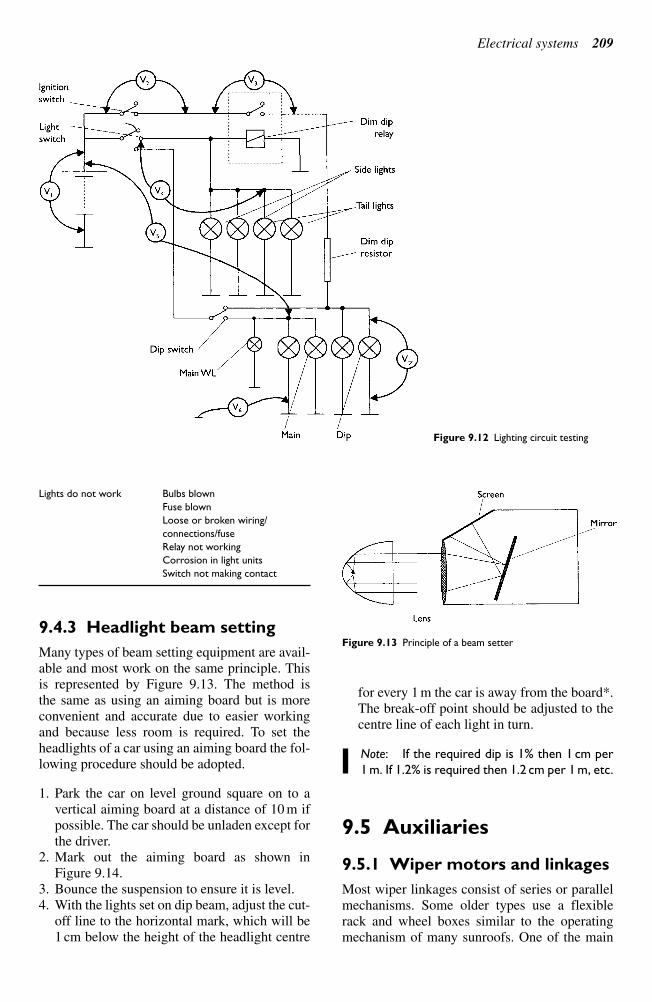
Lights do not work Bulbs blown
Fuse blown
Loose or broken wiring/
connections/fuse
Relay not working
Corrosion in light units
Switch not making contact
9.4.3 Headlight beam setting
Many types of beam setting equipment are avail-
able and most work on the same principle. This
is represented by Figure 9.13. The method is
the same as using an aiming board but is more
convenient and accurate due to easier working
and because less room is required. To set the
headlights of a car using an aiming board the fol-
lowing procedure should be adopted.
1. Park the car on level ground square on to a
vertical aiming board at a distance of 10 m if
possible. The car should be unladen except for
the driver.
2. Mark out the aiming board as shown in
Figure 9.14.
3. Bounce the suspension to ensure it is level.
4. With the lights set on dip beam, adjust the cut-
off line to the horizontal mark, which will be
1 cm below the height of the headlight centre
for every 1 m the car is away from the board*.
The break-off point should be adjusted to the
centre line of each light in turn.
Note: If the required dip is 1% then 1 cm per
1 m. If 1.2% is required then 1.2 cm per 1 m, etc.
9.5 Auxiliaries
9.5.1 Wiper motors and linkages
Most wiper linkages consist of series or parallel
mechanisms. Some older types use a flexible
rack and wheel boxes similar to the operating
mechanism of many sunroofs. One of the main
Electrical systems 209
Figure 9.12 Lighting circuit testing
Figure 9.13 Principle of a beam setter
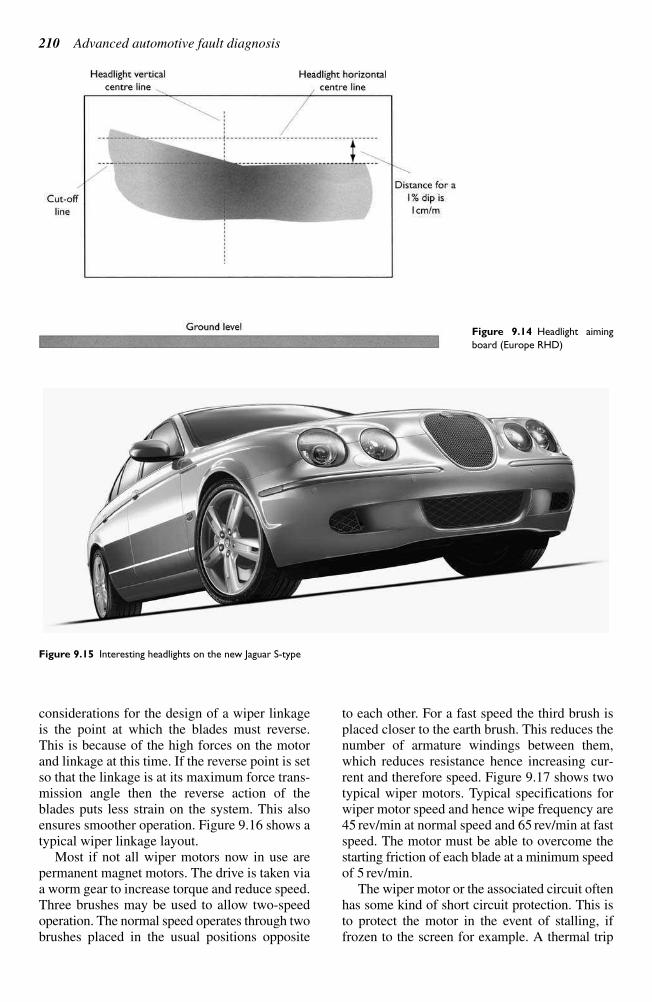
considerations for the design of a wiper linkage
is the point at which the blades must reverse.
This is because of the high forces on the motor
and linkage at this time. If the reverse point is set
so that the linkage is at its maximum force trans-
mission angle then the reverse action of the
blades puts less strain on the system. This also
ensures smoother operation. Figure 9.16 shows a
typical wiper linkage layout.
Most if not all wiper motors now in use are
permanent magnet motors. The drive is taken via
a worm gear to increase torque and reduce speed.
Three brushes may be used to allow two-speed
operation. The normal speed operates through two
brushes placed in the usual positions opposite
to each other. For a fast speed the third brush is
placed closer to the earth brush. This reduces the
number of armature windings between them,
which reduces resistance hence increasing cur-
rent and therefore speed. Figure 9.17 shows two
typical wiper motors. Typical specifications for
wiper motor speed and hence wipe frequency are
45 rev/min at normal speed and 65 rev/min at fast
speed. The motor must be able to overcome the
starting friction of each blade at a minimum speed
of 5 rev/min.
The wiper motor or the associated circuit often
has some kind of short circuit protection. This is
to protect the motor in the event of stalling, if
frozen to the screen for example. A thermal trip
210 Advanced automotive fault diagnosis
Figure 9.15 Interesting headlights on the new Jaguar S-type
Figure 9.14 Headlight aiming
board (Europe RHD)
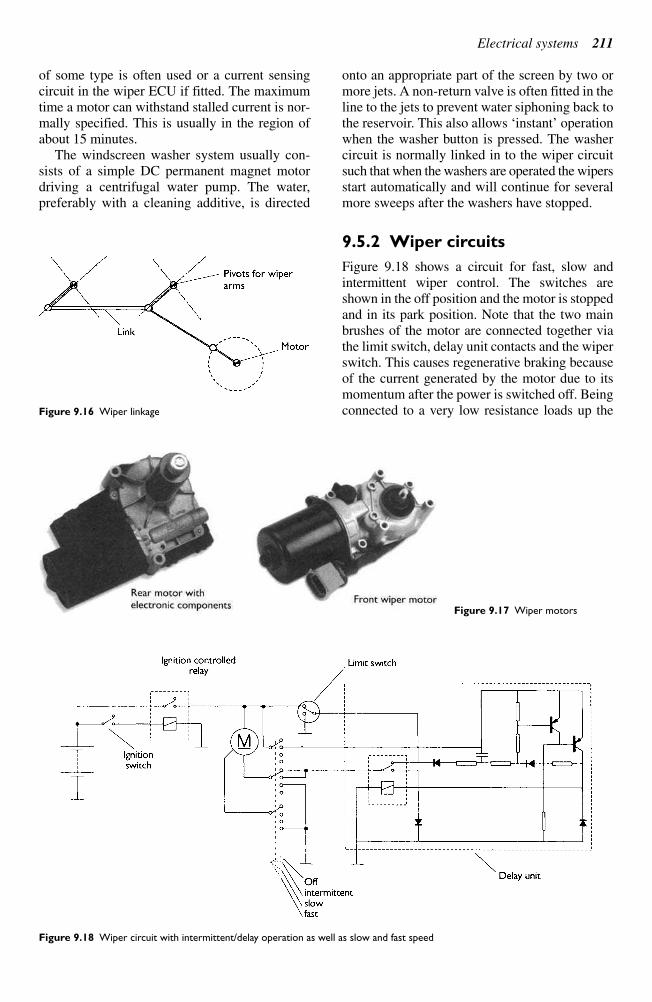
of some type is often used or a current sensing
circuit in the wiper ECU if fitted. The maximum
time a motor can withstand stalled current is nor-
mally specified. This is usually in the region of
about 15 minutes.
The windscreen washer system usually con-
sists of a simple DC permanent magnet motor
driving a centrifugal water pump. The water,
preferably with a cleaning additive, is directed
onto an appropriate part of the screen by two or
more jets. A non-return valve is often fitted in the
line to the jets to prevent water siphoning back to
the reservoir. This also allows ‘instant’ operationwhen the washer button is pressed. The washercircuit is normally linked in to the wiper circuitsuch that when the washers are operated the wipersstart automatically and will continue for severalmore sweeps after the washers have stopped.
9.5.2 Wiper circuits
Figure 9.18 shows a circuit for fast, slow andintermittent wiper control. The switches areshown in the off position and the motor is stoppedand in its park position. Note that the two mainbrushes of the motor are connected together viathe limit switch, delay unit contacts and the wiperswitch. This causes regenerative braking becauseof the current generated by the motor due to itsmomentum after the power is switched off. Beingconnected to a very low resistance loads up the
Electrical systems 211
Figure 9.16 Wiper linkage
Figure 9.17 Wiper motors
Figure 9.18 Wiper circuit with intermittent/delay operation as well as slow and fast speed
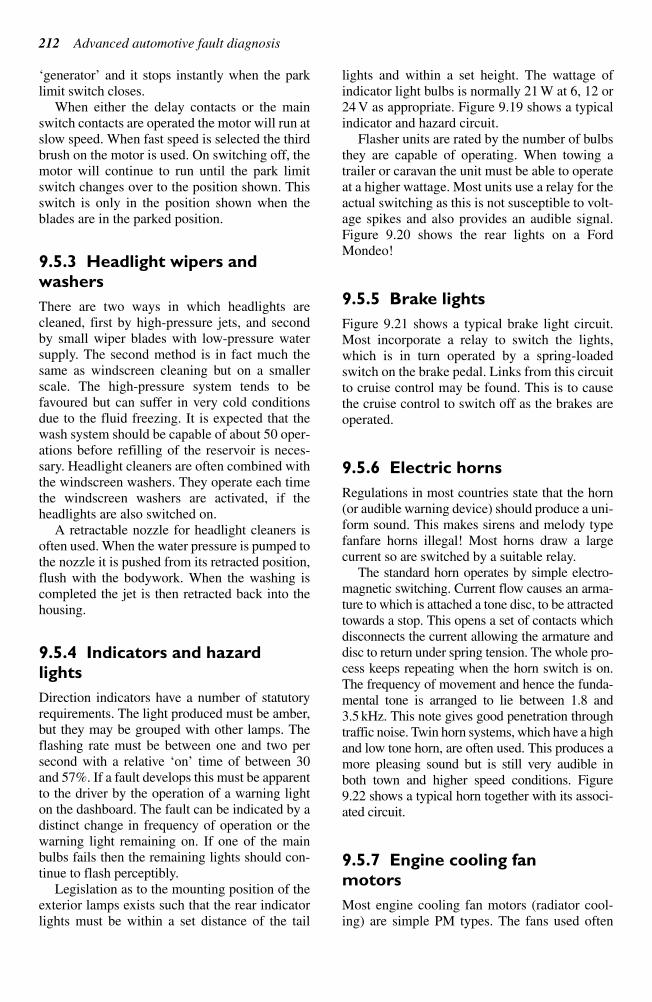
‘generator’ and it stops instantly when the parklimit switch closes.
When either the delay contacts or the mainswitch contacts are operated the motor will run atslow speed. When fast speed is selected the thirdbrush on the motor is used. On switching off, themotor will continue to run until the park limitswitch changes over to the position shown. Thisswitch is only in the position shown when theblades are in the parked position.
9.5.3 Headlight wipers and
washers
There are two ways in which headlights arecleaned, first by high-pressure jets, and secondby small wiper blades with low-pressure watersupply. The second method is in fact much thesame as windscreen cleaning but on a smallerscale. The high-pressure system tends to befavoured but can suffer in very cold conditionsdue to the fluid freezing. It is expected that thewash system should be capable of about 50 oper-ations before refilling of the reservoir is neces-sary. Headlight cleaners are often combined withthe windscreen washers. They operate each timethe windscreen washers are activated, if theheadlights are also switched on.
A retractable nozzle for headlight cleaners isoften used. When the water pressure is pumped tothe nozzle it is pushed from its retracted position,flush with the bodywork. When the washing iscompleted the jet is then retracted back into thehousing.
9.5.4 Indicators and hazard
lights
Direction indicators have a number of statutoryrequirements. The light produced must be amber,but they may be grouped with other lamps. Theflashing rate must be between one and two persecond with a relative ‘on’ time of between 30and 57%. If a fault develops this must be apparentto the driver by the operation of a warning lighton the dashboard. The fault can be indicated by adistinct change in frequency of operation or thewarning light remaining on. If one of the mainbulbs fails then the remaining lights should con-tinue to flash perceptibly.
Legislation as to the mounting position of theexterior lamps exists such that the rear indicatorlights must be within a set distance of the tail
lights and within a set height. The wattage ofindicator light bulbs is normally 21 W at 6, 12 or24 V as appropriate. Figure 9.19 shows a typicalindicator and hazard circuit.
Flasher units are rated by the number of bulbsthey are capable of operating. When towing atrailer or caravan the unit must be able to operateat a higher wattage. Most units use a relay for theactual switching as this is not susceptible to volt-age spikes and also provides an audible signal.Figure 9.20 shows the rear lights on a FordMondeo!
9.5.5 Brake lights
Figure 9.21 shows a typical brake light circuit.Most incorporate a relay to switch the lights,which is in turn operated by a spring-loadedswitch on the brake pedal. Links from this circuitto cruise control may be found. This is to causethe cruise control to switch off as the brakes areoperated.
9.5.6 Electric horns
Regulations in most countries state that the horn(or audible warning device) should produce a uni-form sound. This makes sirens and melody typefanfare horns illegal! Most horns draw a largecurrent so are switched by a suitable relay.
The standard horn operates by simple electro-magnetic switching. Current flow causes an arma-ture to which is attached a tone disc, to be attractedtowards a stop. This opens a set of contacts whichdisconnects the current allowing the armature anddisc to return under spring tension. The whole pro-cess keeps repeating when the horn switch is on.The frequency of movement and hence the funda-mental tone is arranged to lie between 1.8 and3.5 kHz. This note gives good penetration throughtraffic noise. Twin horn systems, which have a highand low tone horn, are often used. This produces amore pleasing sound but is still very audible inboth town and higher speed conditions. Figure9.22 shows a typical horn together with its associ-ated circuit.
9.5.7 Engine cooling fan
motors
Most engine cooling fan motors (radiator cool-ing) are simple PM types. The fans used often
212 Advanced automotive fault diagnosis
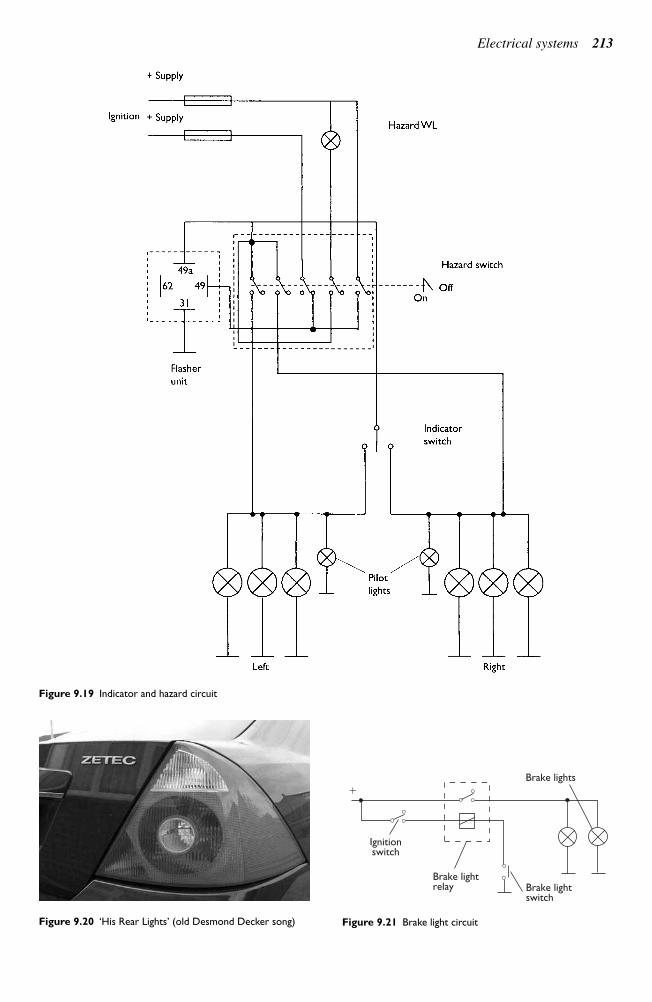
Electrical systems 213
Figure 9.20 ‘His Rear Lights’ (old Desmond Decker song)
Brake lights
Brake lightswitch
Brake lightrelay
Ignitionswitch
Figure 9.21 Brake light circuit
Figure 9.19 Indicator and hazard circuit
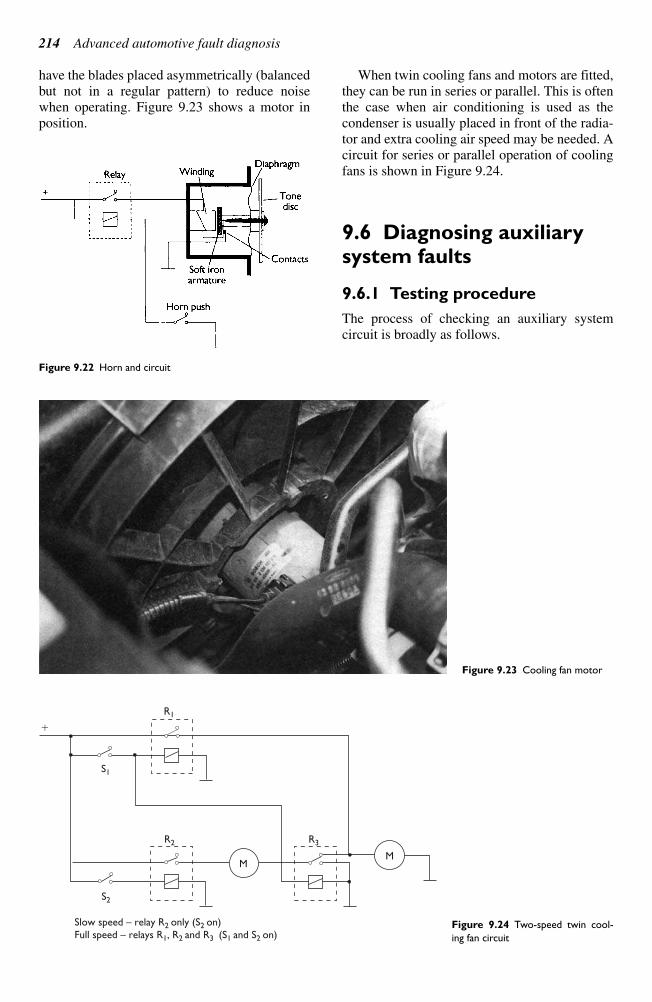
have the blades placed asymmetrically (balanced
but not in a regular pattern) to reduce noise
when operating. Figure 9.23 shows a motor in
position.
When twin cooling fans and motors are fitted,
they can be run in series or parallel. This is often
the case when air conditioning is used as the
condenser is usually placed in front of the radia-
tor and extra cooling air speed may be needed. A
circuit for series or parallel operation of cooling
fans is shown in Figure 9.24.
9.6 Diagnosing auxiliarysystem faults
9.6.1 Testing procedure
The process of checking an auxiliary system
circuit is broadly as follows.
214 Advanced automotive fault diagnosis
R1
R2
Slow speed – relay R2 only (S2 on)Full speed – relays R1, R2 and R3 (S1 and S2 on)
S2
S1
MM
R3
Figure 9.24 Two-speed twin cool-
ing fan circuit
Figure 9.23 Cooling fan motor
Figure 9.22 Horn and circuit
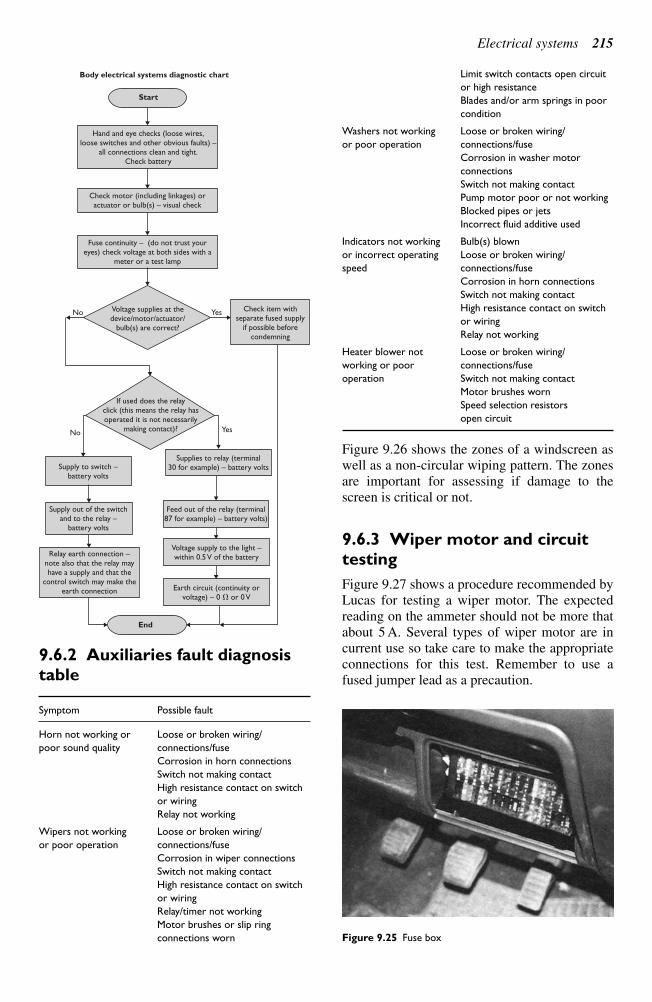
9.6.2 Auxiliaries fault diagnosis
table
Symptom Possible fault
Horn not working or Loose or broken wiring/
poor sound quality connections/fuse
Corrosion in horn connections
Switch not making contact
High resistance contact on switch
or wiring
Relay not working
Wipers not working Loose or broken wiring/
or poor operation connections/fuse
Corrosion in wiper connections
Switch not making contact
High resistance contact on switch
or wiring
Relay/timer not working
Motor brushes or slip ring
connections worn
Limit switch contacts open circuit
or high resistance
Blades and/or arm springs in poor
condition
Washers not working Loose or broken wiring/
or poor operation connections/fuse
Corrosion in washer motor
connections
Switch not making contact
Pump motor poor or not working
Blocked pipes or jets
Incorrect fluid additive used
Indicators not working Bulb(s) blown
or incorrect operating Loose or broken wiring/
speed connections/fuse
Corrosion in horn connections
Switch not making contact
High resistance contact on switch
or wiring
Relay not working
Heater blower not Loose or broken wiring/
working or poor connections/fuse
operation Switch not making contact
Motor brushes worn
Speed selection resistors
open circuit
Figure 9.26 shows the zones of a windscreen as
well as a non-circular wiping pattern. The zones
are important for assessing if damage to the
screen is critical or not.
9.6.3 Wiper motor and circuit
testing
Figure 9.27 shows a procedure recommended by
Lucas for testing a wiper motor. The expected
reading on the ammeter should not be more that
about 5 A. Several types of wiper motor are in
current use so take care to make the appropriate
connections for this test. Remember to use a
fused jumper lead as a precaution.
Electrical systems 215
Start
Body electrical systems diagnostic chart
Hand and eye checks (loose wires,loose switches and other obvious faults) –
all connections clean and tight.Check battery
Check motor (including linkages) oractuator or bulb(s) – visual check
Fuse continuity – (do not trust youreyes) check voltage at both sides with a
meter or a test lamp
Voltage supplies at thedevice/motor/actuator/
bulb(s) are correct?
If used does the relayclick (this means the relay hasoperated it is not necessarily
making contact)?
Check item withseparate fused supply
if possible beforecondemning
Supply to switch –battery volts
No Yes
YesNo
Supply out of the switchand to the relay –
battery volts
Relay earth connection –note also that the relay mayhave a supply and that the
control switch may make theearth connection
End
Supplies to relay (terminal30 for example) – battery volts
Feed out of the relay (terminal87 for example) – battery volts)
Voltage supply to the light –within 0.5 V of the battery
Earth circuit (continuity orvoltage) – 0 or 0 V
Figure 9.25 Fuse box
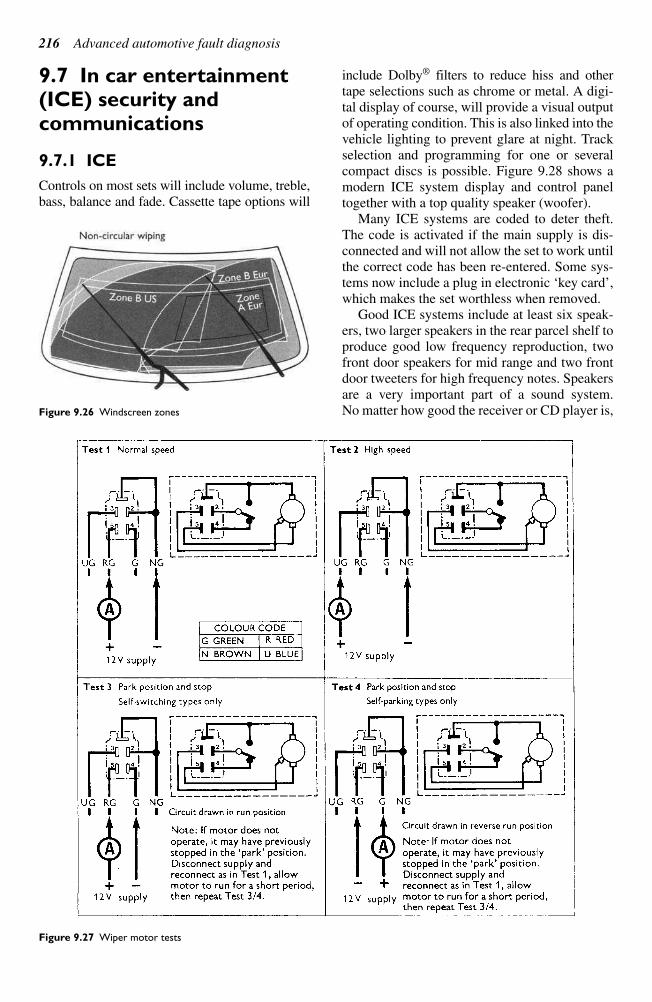
9.7 In car entertainment(ICE) security andcommunications
9.7.1 ICE
Controls on most sets will include volume, treble,
bass, balance and fade. Cassette tape options will
include Dolby® filters to reduce hiss and other
tape selections such as chrome or metal. A digi-
tal display of course, will provide a visual output
of operating condition. This is also linked into the
vehicle lighting to prevent glare at night. Track
selection and programming for one or several
compact discs is possible. Figure 9.28 shows a
modern ICE system display and control panel
together with a top quality speaker (woofer).
Many ICE systems are coded to deter theft.
The code is activated if the main supply is dis-
connected and will not allow the set to work until
the correct code has been re-entered. Some sys-
tems now include a plug in electronic ‘key card’,which makes the set worthless when removed.
Good ICE systems include at least six speak-ers, two larger speakers in the rear parcel shelf toproduce good low frequency reproduction, twofront door speakers for mid range and two frontdoor tweeters for high frequency notes. Speakersare a very important part of a sound system. No matter how good the receiver or CD player is,
216 Advanced automotive fault diagnosis
Figure 9.27 Wiper motor tests
Figure 9.26 Windscreen zones
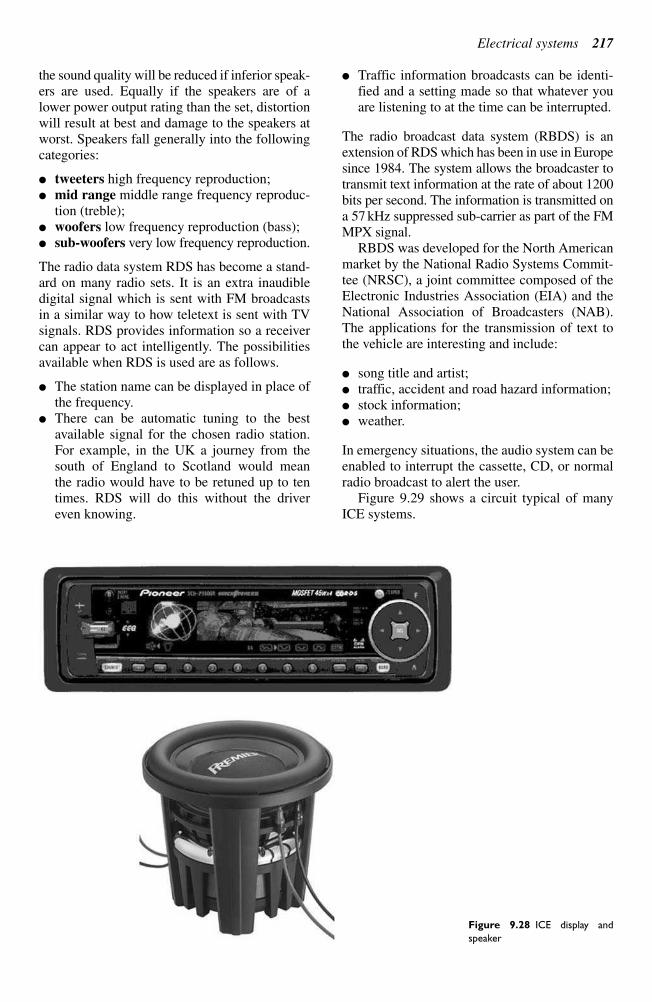
the sound quality will be reduced if inferior speak-
ers are used. Equally if the speakers are of a
lower power output rating than the set, distortion
will result at best and damage to the speakers at
worst. Speakers fall generally into the following
categories:
tweeters high frequency reproduction;
mid range middle range frequency reproduc-
tion (treble);
woofers low frequency reproduction (bass);
sub-woofers very low frequency reproduction.
The radio data system RDS has become a stand-
ard on many radio sets. It is an extra inaudible
digital signal which is sent with FM broadcasts
in a similar way to how teletext is sent with TV
signals. RDS provides information so a receiver
can appear to act intelligently. The possibilities
available when RDS is used are as follows.
The station name can be displayed in place of
the frequency.
There can be automatic tuning to the best
available signal for the chosen radio station.
For example, in the UK a journey from the
south of England to Scotland would mean
the radio would have to be retuned up to ten
times. RDS will do this without the driver
even knowing.
Traffic information broadcasts can be identi-
fied and a setting made so that whatever you
are listening to at the time can be interrupted.
The radio broadcast data system (RBDS) is an
extension of RDS which has been in use in Europe
since 1984. The system allows the broadcaster to
transmit text information at the rate of about 1200
bits per second. The information is transmitted on
a 57 kHz suppressed sub-carrier as part of the FM
MPX signal.
RBDS was developed for the North American
market by the National Radio Systems Commit-
tee (NRSC), a joint committee composed of the
Electronic Industries Association (EIA) and the
National Association of Broadcasters (NAB).
The applications for the transmission of text to
the vehicle are interesting and include:
song title and artist;
traffic, accident and road hazard information;
stock information;
weather.
In emergency situations, the audio system can be
enabled to interrupt the cassette, CD, or normal
radio broadcast to alert the user.
Figure 9.29 shows a circuit typical of many
ICE systems.
Electrical systems 217
Figure 9.28 ICE display and
speaker

9.7.2 Security systems
Car and alarm manufacturers are constantly
fighting to improve security. Building the alarm
system as an integral part of the vehicle electron-
ics has made significant improvements. Even so,
retro fit systems can still be very effective. Three
main types of intruder alarm are used:
switch operated on all entry points;
battery voltage sensed;
volumetric sensing.
There are three main ways to disable the
vehicle:
ignition circuit cut off;
starter circuit cut off;
engine ECU code lock.
Most alarm systems are made for 12 V, nega-
tive earth vehicles. They have electronic sirens
and give an audible signal when arming and dis-
arming. They are all triggered when the car door
opens and will automatically reset after a period
of time, often one or two minutes. The alarms are
triggered instantly when entry point is breached.
Most systems are two pieces, with separate con-
trol unit and siren; most will have the control unit
in the passenger compartment and the siren under
the bonnet.
Most systems now come with two infrared
(IR) remote ‘keys’ that use small button type batteries and have an LED that shows when the
signal is being sent. They operate with one vehi-cle only. Intrusion sensors such as car movementand volumetric sensing can be adjusted for sensitivity.
When operating with flashing lights most sys-tems draw about 5 A. Without flashing lights(siren only) the current draw is less than 1 A. Thesirens produce a sound level of about 95 dB,when measured 2 m in front of the vehicle.
Figure 9.30 shows a block diagram of a com-plex alarm system. The system, as is usual, can beconsidered as a series of inputs and outputs. Thisis particularly useful for diagnosing faults. Mostfactory fitted alarms are combined with the centraldoor locking system. This allows the facility men-tioned in a previous section known as lazy lock.Pressing the button on the remote unit, as well assetting the alarm, closes the windows and sunroofand locks the doors.
A security code in the engine ECU is a power-ful deterrent. This can only be ‘unlocked’ toallow the engine to start when it receives a codedsignal. Ford and other manufacturers use a spe-cial ignition key which is programmed with therequired information. Even the correct ‘cut’ keywill not start the engine. Citroen, for example,have used a similar idea but the code has to beentered via a numerical keypad.
Of course nothing will stop the car beinglifted on to a lorry and driven away, but this technique will mean a new engine control ECUwill be needed. The cost will be high and also
218 Advanced automotive fault diagnosis
Figure 9.29 ICE circuit
Siren
ECU
Door switches
Movementvolumetric
sensorultra sonic
Tremblerswitch
Controlswitch
IR keysensor
Ignitionswitch
Crankingsignal
Bonnet switches
System LED
Hazard lights
Ignitionimmobiliser
Loop circuit
Volumetrictransmitter
Door locking,windowclosing,sunroofclosing
Figure 9.30 Block diagram of a complex alarm system

questions may be asked as to why a new ECU is
required.
9.7.3 Mobile communications
If the success of the cellular industry is any indi-
cation of how much use we can make of the tele-
phone, the future promises an even greater
expansion. Cellular technology started to become
useful in the 1980s and has continued to develop
from then – very quickly.The need and desire we perceive to keep in
touch with each other is so great that an increas-ing number of business people now have up to five phone numbers: home, office, pager, faxand cellular. But within the foreseeable future,high tech digital radio technology and sophisti-cated telecommunications systems will enableall communications to be processed through asingle number.
With personal numbering, a person carrying a pocket-sized phone will need only one phonenumber. Instead of people calling places, peoplewill call people; we will not be tied to any particu-lar place. Personal numbering will make businesspeople more productive because they will be ableto reach and be reached by colleagues and clients,anywhere and anytime, indoors or outdoors. Whentravelling from home to office or from one meetingto the next, it will be possible to communicate withanyone, whenever the need arises.
But where does this leave communication sys-tems relating to the vehicle? It is my opinion that‘in vehicle’ communication equipment for nor-mal business and personal use will be by the sim-ple pocket-sized mobile phone and that there isno further market for the car telephone. Handsfree conversions will still be important.
CB radios and short range two-way systemssuch as used by taxi firms and service industrieswill still have a place for the time being. Eventhese may decline as the cellular network becomescheaper and more convenient to use.
9.8 Diagnosing ICE, securityand communication systemfaults
9.8.1 Testing procedure
The process of checking an ICE system circuit isbroadly as follows.
ICE, security and communication
system fault diagnosis table
Symptom Possible fault
Alarm does Fuse blown
not operate Not set correctly
Remote key battery discharged
Open circuit connection to alarm unit
ECU fault
Receiver/transmitter fault
Volumetric transmitter/receiver fault
Alarm goes Drain on battery
off for no Loose connection
apparent Vibration/trembler/movement
reason detection circuit set too sensitive
Self-discharge in the battery
Window left open allowing wind or even a
bird or insect to cause interior movement
Somebody really is trying to steal the car …
Electrical systems 219
Start
ICE systems diagnostic chart
End
Hand and eye checks(loose wires, loose switchesand other obvious faults) –all connections clean and
tight. Check battery
Fuse continuity – andsupply to the set. Check
earth connection to the set
Check code is correct forthe set (if appropriate)
Aerial earth connectionat the set – 0
No
No
Yes
Yes
Yes
No
Check connections toexternal devices like
multichangers or amps
Set haspower but is
sound produced?
Does the setsuffer from
interference?
Speaker resistancechecks (refer tospecifications but4 or 8 are themost common).
Check speaker cables
Aerial earth connectionto the vehiclebody – 0
Clean tape heads ifappropriate
Ensure aerial is goodquality
Check ignition andcharging system for
faults or missingsuppression devices
Do all tuningand CD or tapeplayback featureswork correctly?
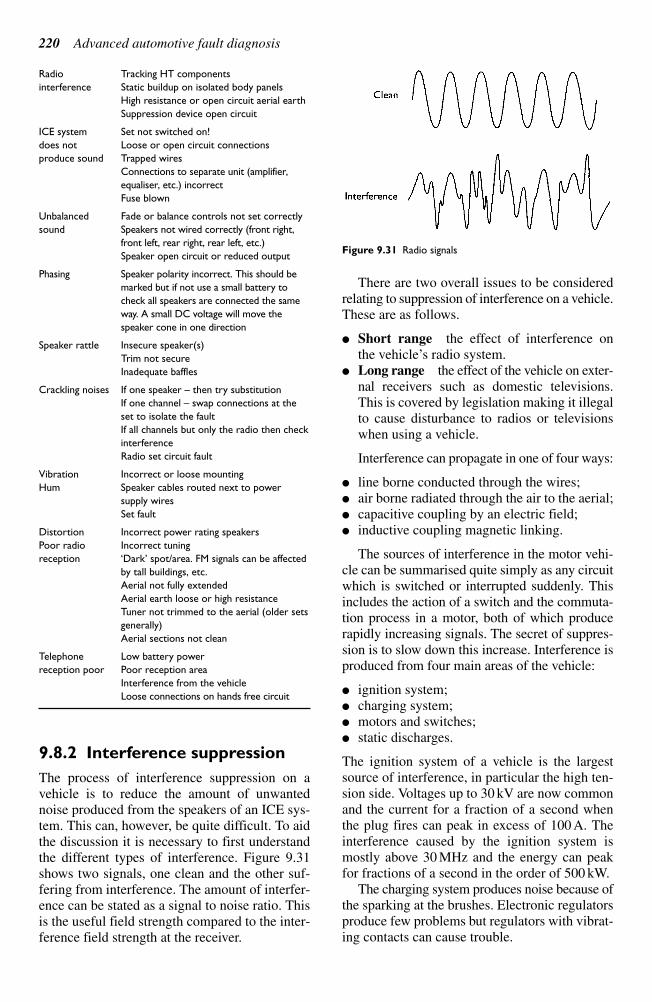
Radio Tracking HT components
interference Static buildup on isolated body panels
High resistance or open circuit aerial earth
Suppression device open circuit
ICE system Set not switched on!
does not Loose or open circuit connections
produce sound Trapped wires
Connections to separate unit (amplifier,
equaliser, etc.) incorrect
Fuse blown
Unbalanced Fade or balance controls not set correctly
sound Speakers not wired correctly (front right,
front left, rear right, rear left, etc.)
Speaker open circuit or reduced output
Phasing Speaker polarity incorrect. This should be
marked but if not use a small battery to
check all speakers are connected the same
way. A small DC voltage will move the
speaker cone in one direction
Speaker rattle Insecure speaker(s)
Trim not secure
Inadequate baffles
Crackling noises If one speaker – then try substitution
If one channel – swap connections at the
set to isolate the fault
If all channels but only the radio then check
interference
Radio set circuit fault
Vibration Incorrect or loose mounting
Hum Speaker cables routed next to power
supply wires
Set fault
Distortion Incorrect power rating speakers
Poor radio Incorrect tuning
reception ‘Dark’ spot/area. FM signals can be affected
by tall buildings, etc.
Aerial not fully extended
Aerial earth loose or high resistance
Tuner not trimmed to the aerial (older sets
generally)
Aerial sections not clean
Telephone Low battery power
reception poor Poor reception area
Interference from the vehicle
Loose connections on hands free circuit
9.8.2 Interference suppression
The process of interference suppression on a
vehicle is to reduce the amount of unwanted
noise produced from the speakers of an ICE sys-
tem. This can, however, be quite difficult. To aid
the discussion it is necessary to first understand
the different types of interference. Figure 9.31
shows two signals, one clean and the other suf-
fering from interference. The amount of interfer-
ence can be stated as a signal to noise ratio. This
is the useful field strength compared to the inter-
ference field strength at the receiver.
There are two overall issues to be considered
relating to suppression of interference on a vehicle.
These are as follows.
Short range the effect of interference on
the vehicle’s radio system. Long range the effect of the vehicle on exter-
nal receivers such as domestic televisions.This is covered by legislation making it illegalto cause disturbance to radios or televisionswhen using a vehicle.
Interference can propagate in one of four ways:
line borne conducted through the wires; air borne radiated through the air to the aerial; capacitive coupling by an electric field; inductive coupling magnetic linking.
The sources of interference in the motor vehi-cle can be summarised quite simply as any circuitwhich is switched or interrupted suddenly. Thisincludes the action of a switch and the commuta-tion process in a motor, both of which producerapidly increasing signals. The secret of suppres-sion is to slow down this increase. Interference isproduced from four main areas of the vehicle:
ignition system; charging system; motors and switches; static discharges.
The ignition system of a vehicle is the largestsource of interference, in particular the high ten-sion side. Voltages up to 30 kV are now commonand the current for a fraction of a second whenthe plug fires can peak in excess of 100 A. Theinterference caused by the ignition system ismostly above 30 MHz and the energy can peakfor fractions of a second in the order of 500 kW.
The charging system produces noise because ofthe sparking at the brushes. Electronic regulatorsproduce few problems but regulators with vibrat-ing contacts can cause trouble.
220 Advanced automotive fault diagnosis
Figure 9.31 Radio signals
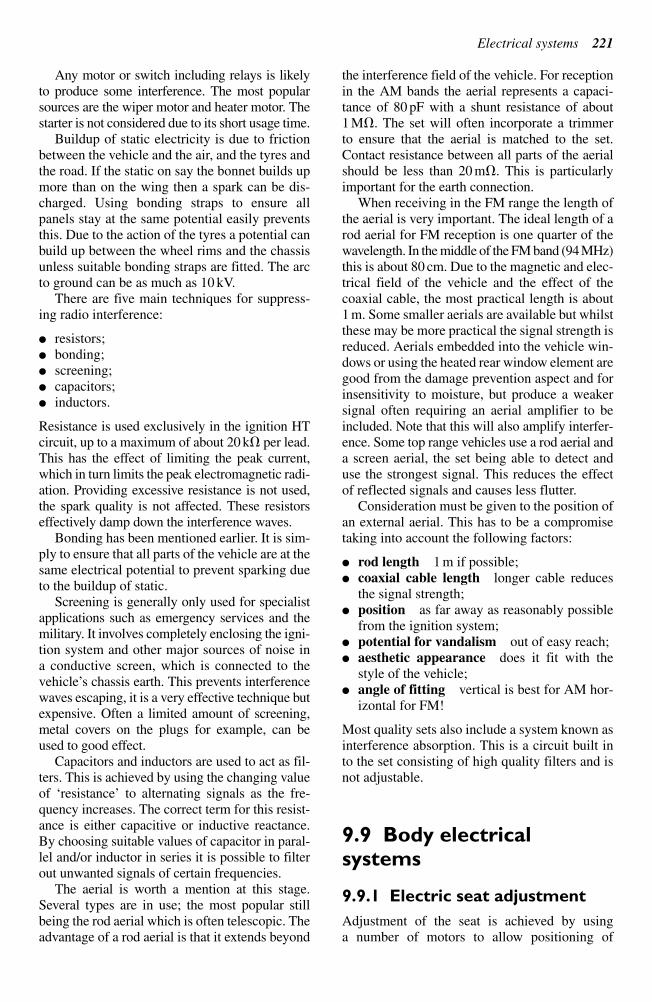
Any motor or switch including relays is likely
to produce some interference. The most popular
sources are the wiper motor and heater motor. The
starter is not considered due to its short usage time.
Buildup of static electricity is due to friction
between the vehicle and the air, and the tyres and
the road. If the static on say the bonnet builds up
more than on the wing then a spark can be dis-
charged. Using bonding straps to ensure all
panels stay at the same potential easily prevents
this. Due to the action of the tyres a potential can
build up between the wheel rims and the chassis
unless suitable bonding straps are fitted. The arc
to ground can be as much as 10 kV.
There are five main techniques for suppress-
ing radio interference:
resistors;
bonding;
screening;
capacitors;
inductors.
Resistance is used exclusively in the ignition HT
circuit, up to a maximum of about 20 k per lead.
This has the effect of limiting the peak current,
which in turn limits the peak electromagnetic radi-
ation. Providing excessive resistance is not used,
the spark quality is not affected. These resistors
effectively damp down the interference waves.
Bonding has been mentioned earlier. It is sim-
ply to ensure that all parts of the vehicle are at the
same electrical potential to prevent sparking due
to the buildup of static.
Screening is generally only used for specialist
applications such as emergency services and the
military. It involves completely enclosing the igni-
tion system and other major sources of noise in
a conductive screen, which is connected to the
vehicle’s chassis earth. This prevents interferencewaves escaping, it is a very effective technique butexpensive. Often a limited amount of screening,metal covers on the plugs for example, can beused to good effect.
Capacitors and inductors are used to act as fil-ters. This is achieved by using the changing valueof ‘resistance’ to alternating signals as the fre-quency increases. The correct term for this resist-ance is either capacitive or inductive reactance.By choosing suitable values of capacitor in paral-lel and/or inductor in series it is possible to filterout unwanted signals of certain frequencies.
The aerial is worth a mention at this stage.Several types are in use; the most popular stillbeing the rod aerial which is often telescopic. Theadvantage of a rod aerial is that it extends beyond
the interference field of the vehicle. For receptionin the AM bands the aerial represents a capaci-tance of 80 pF with a shunt resistance of about1 M. The set will often incorporate a trimmer to ensure that the aerial is matched to the set.Contact resistance between all parts of the aerialshould be less than 20 m. This is particularlyimportant for the earth connection.
When receiving in the FM range the length ofthe aerial is very important. The ideal length of arod aerial for FM reception is one quarter of thewavelength. In the middle of the FM band (94MHz)this is about 80 cm. Due to the magnetic and elec-trical field of the vehicle and the effect of thecoaxial cable, the most practical length is about1 m. Some smaller aerials are available but whilstthese may be more practical the signal strength isreduced. Aerials embedded into the vehicle win-dows or using the heated rear window element aregood from the damage prevention aspect and forinsensitivity to moisture, but produce a weakersignal often requiring an aerial amplifier to beincluded. Note that this will also amplify interfer-ence. Some top range vehicles use a rod aerial anda screen aerial, the set being able to detect anduse the strongest signal. This reduces the effectof reflected signals and causes less flutter.
Consideration must be given to the position ofan external aerial. This has to be a compromisetaking into account the following factors:
rod length 1 m if possible; coaxial cable length longer cable reduces
the signal strength; position as far away as reasonably possible
from the ignition system; potential for vandalism out of easy reach; aesthetic appearance does it fit with the
style of the vehicle; angle of fitting vertical is best for AM hor-
izontal for FM!
Most quality sets also include a system known asinterference absorption. This is a circuit built into the set consisting of high quality filters and isnot adjustable.
9.9 Body electricalsystems
9.9.1 Electric seat adjustment
Adjustment of the seat is achieved by using a number of motors to allow positioning of
Electrical systems 221
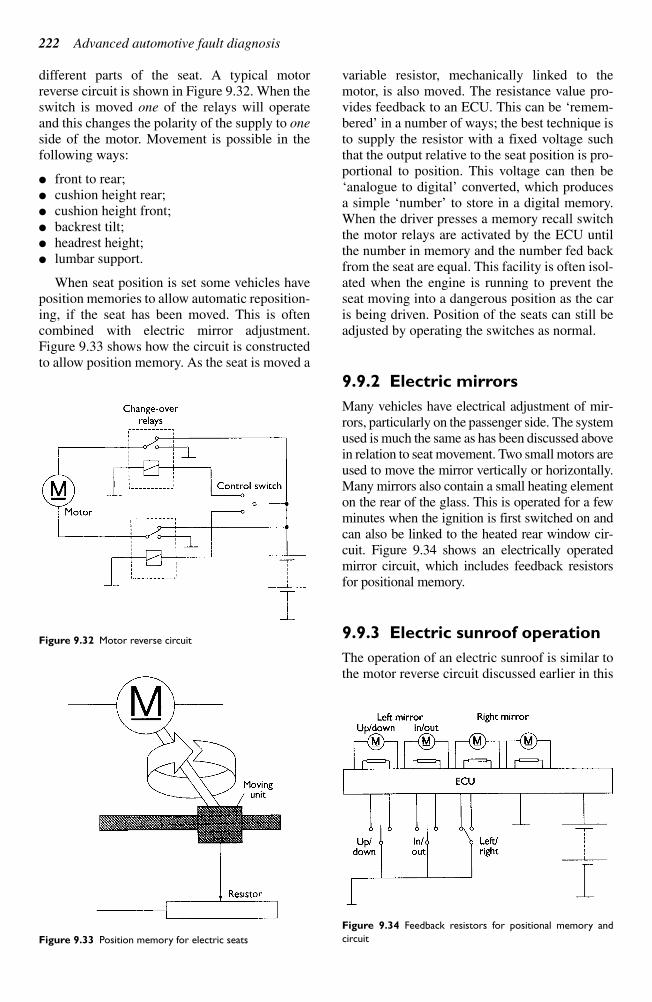
different parts of the seat. A typical motor
reverse circuit is shown in Figure 9.32. When the
switch is moved one of the relays will operate
and this changes the polarity of the supply to one
side of the motor. Movement is possible in the
following ways:
front to rear;
cushion height rear;
cushion height front;
backrest tilt;
headrest height;
lumbar support.
When seat position is set some vehicles have
position memories to allow automatic reposition-
ing, if the seat has been moved. This is often
combined with electric mirror adjustment.
Figure 9.33 shows how the circuit is constructed
to allow position memory. As the seat is moved a
variable resistor, mechanically linked to the
motor, is also moved. The resistance value pro-
vides feedback to an ECU. This can be ‘remem-bered’ in a number of ways; the best technique isto supply the resistor with a fixed voltage suchthat the output relative to the seat position is pro-portional to position. This voltage can then be‘analogue to digital’ converted, which producesa simple ‘number’ to store in a digital memory.When the driver presses a memory recall switchthe motor relays are activated by the ECU untilthe number in memory and the number fed backfrom the seat are equal. This facility is often isol-ated when the engine is running to prevent theseat moving into a dangerous position as the caris being driven. Position of the seats can still beadjusted by operating the switches as normal.
9.9.2 Electric mirrors
Many vehicles have electrical adjustment of mir-rors, particularly on the passenger side. The systemused is much the same as has been discussed abovein relation to seat movement. Two small motors areused to move the mirror vertically or horizontally.Many mirrors also contain a small heating elementon the rear of the glass. This is operated for a fewminutes when the ignition is first switched on andcan also be linked to the heated rear window cir-cuit. Figure 9.34 shows an electrically operatedmirror circuit, which includes feedback resistorsfor positional memory.
9.9.3 Electric sunroof operation
The operation of an electric sunroof is similar tothe motor reverse circuit discussed earlier in this
222 Advanced automotive fault diagnosis
Figure 9.32 Motor reverse circuit
Figure 9.33 Position memory for electric seats
Figure 9.34 Feedback resistors for positional memory and
circuit
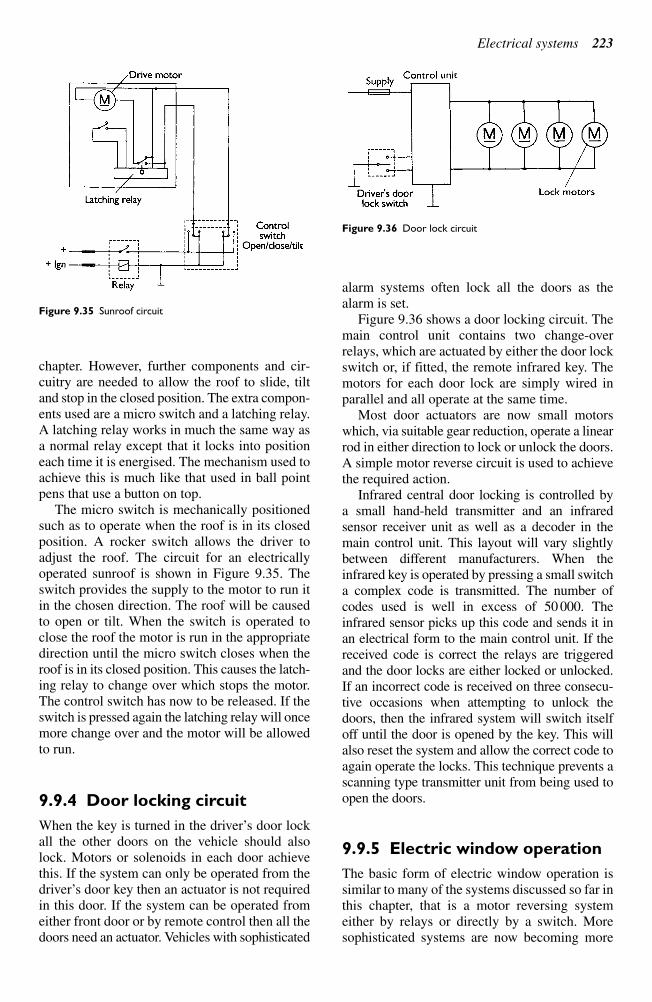
chapter. However, further components and cir-
cuitry are needed to allow the roof to slide, tilt
and stop in the closed position. The extra compon-
ents used are a micro switch and a latching relay.
A latching relay works in much the same way as
a normal relay except that it locks into position
each time it is energised. The mechanism used to
achieve this is much like that used in ball point
pens that use a button on top.
The micro switch is mechanically positioned
such as to operate when the roof is in its closed
position. A rocker switch allows the driver to
adjust the roof. The circuit for an electrically
operated sunroof is shown in Figure 9.35. The
switch provides the supply to the motor to run it
in the chosen direction. The roof will be caused
to open or tilt. When the switch is operated to
close the roof the motor is run in the appropriate
direction until the micro switch closes when the
roof is in its closed position. This causes the latch-
ing relay to change over which stops the motor.
The control switch has now to be released. If the
switch is pressed again the latching relay will once
more change over and the motor will be allowed
to run.
9.9.4 Door locking circuit
When the key is turned in the driver’s door lockall the other doors on the vehicle should alsolock. Motors or solenoids in each door achievethis. If the system can only be operated from thedriver’s door key then an actuator is not requiredin this door. If the system can be operated fromeither front door or by remote control then all thedoors need an actuator. Vehicles with sophisticated
alarm systems often lock all the doors as thealarm is set.
Figure 9.36 shows a door locking circuit. Themain control unit contains two change-overrelays, which are actuated by either the door lockswitch or, if fitted, the remote infrared key. Themotors for each door lock are simply wired inparallel and all operate at the same time.
Most door actuators are now small motorswhich, via suitable gear reduction, operate a linearrod in either direction to lock or unlock the doors.A simple motor reverse circuit is used to achievethe required action.
Infrared central door locking is controlled by a small hand-held transmitter and an infrared sensor receiver unit as well as a decoder in themain control unit. This layout will vary slightlybetween different manufacturers. When theinfrared key is operated by pressing a small switcha complex code is transmitted. The number ofcodes used is well in excess of 50 000. Theinfrared sensor picks up this code and sends it inan electrical form to the main control unit. If thereceived code is correct the relays are triggeredand the door locks are either locked or unlocked.If an incorrect code is received on three consecu-tive occasions when attempting to unlock thedoors, then the infrared system will switch itselfoff until the door is opened by the key. This willalso reset the system and allow the correct code toagain operate the locks. This technique prevents ascanning type transmitter unit from being used toopen the doors.
9.9.5 Electric window operation
The basic form of electric window operation issimilar to many of the systems discussed so far inthis chapter, that is a motor reversing systemeither by relays or directly by a switch. Moresophisticated systems are now becoming more
Electrical systems 223
Figure 9.35 Sunroof circuit
Figure 9.36 Door lock circuit
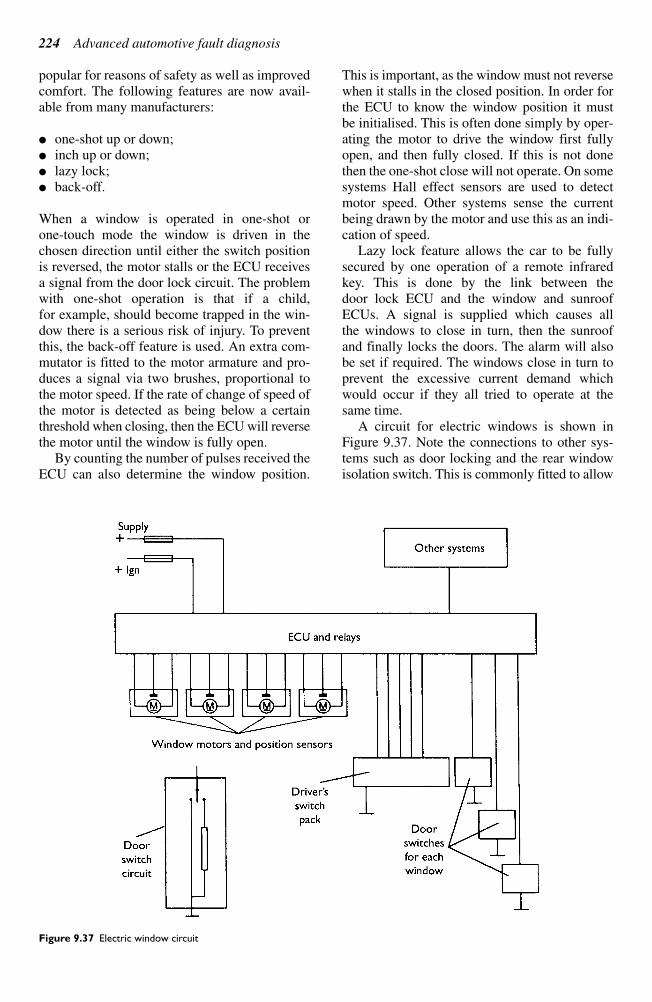
popular for reasons of safety as well as improved
comfort. The following features are now avail-
able from many manufacturers:
one-shot up or down;
inch up or down;
lazy lock;
back-off.
When a window is operated in one-shot or
one-touch mode the window is driven in the
chosen direction until either the switch position
is reversed, the motor stalls or the ECU receives
a signal from the door lock circuit. The problem
with one-shot operation is that if a child,
for example, should become trapped in the win-
dow there is a serious risk of injury. To prevent
this, the back-off feature is used. An extra com-
mutator is fitted to the motor armature and pro-
duces a signal via two brushes, proportional to
the motor speed. If the rate of change of speed of
the motor is detected as being below a certain
threshold when closing, then the ECU will reverse
the motor until the window is fully open.
By counting the number of pulses received the
ECU can also determine the window position.
This is important, as the window must not reverse
when it stalls in the closed position. In order for
the ECU to know the window position it must
be initialised. This is often done simply by oper-
ating the motor to drive the window first fully
open, and then fully closed. If this is not done
then the one-shot close will not operate. On some
systems Hall effect sensors are used to detect
motor speed. Other systems sense the current
being drawn by the motor and use this as an indi-
cation of speed.
Lazy lock feature allows the car to be fully
secured by one operation of a remote infrared
key. This is done by the link between the
door lock ECU and the window and sunroof
ECUs. A signal is supplied which causes all
the windows to close in turn, then the sunroof
and finally locks the doors. The alarm will also
be set if required. The windows close in turn to
prevent the excessive current demand which
would occur if they all tried to operate at the
same time.
A circuit for electric windows is shown in
Figure 9.37. Note the connections to other sys-
tems such as door locking and the rear window
isolation switch. This is commonly fitted to allow
224 Advanced automotive fault diagnosis
Figure 9.37 Electric window circuit
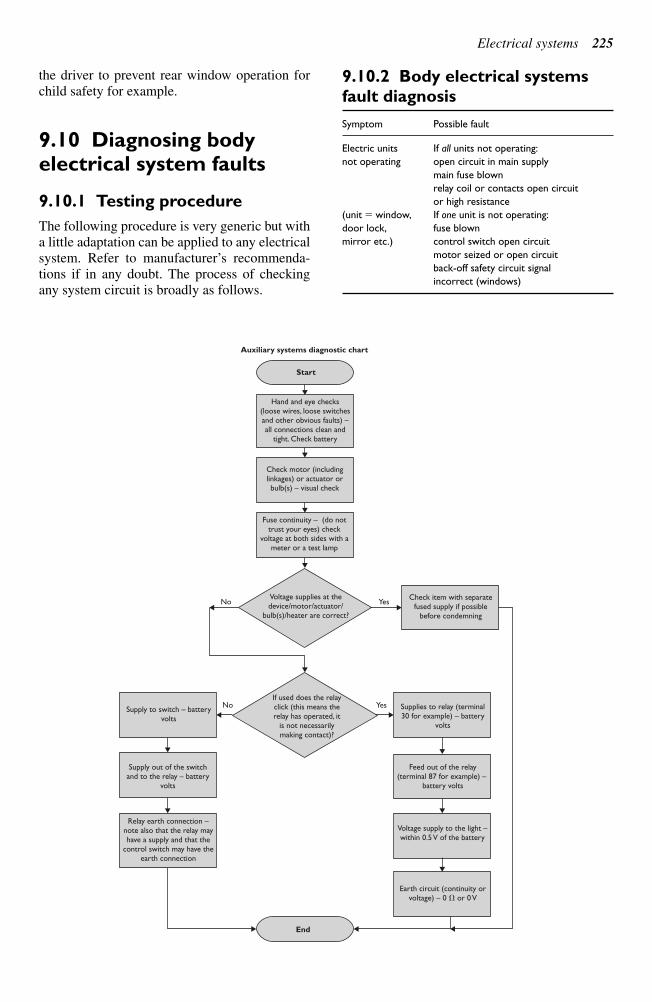
the driver to prevent rear window operation for
child safety for example.
9.10 Diagnosing bodyelectrical system faults
9.10.1 Testing procedure
The following procedure is very generic but with
a little adaptation can be applied to any electrical
system. Refer to manufacturer’s recommenda-tions if in any doubt. The process of checkingany system circuit is broadly as follows.
9.10.2 Body electrical systems
fault diagnosis
Symptom Possible fault
Electric units If all units not operating:
not operating open circuit in main supply
main fuse blown
relay coil or contacts open circuit
or high resistance
(unit window, If one unit is not operating:
door lock, fuse blown
mirror etc.) control switch open circuit
motor seized or open circuit
back-off safety circuit signal
incorrect (windows)
Electrical systems 225
Start
Auxiliary systems diagnostic chart
End
Hand and eye checks(loose wires, loose switchesand other obvious faults) –all connections clean and
tight. Check battery
Check motor (includinglinkages) or actuator orbulb(s) – visual check
Fuse continuity – (do nottrust your eyes) check
voltage at both sides with ameter or a test lamp
Voltage supplies at thedevice/motor/actuator/
bulb(s)/heater are correct?
If used does the relayclick (this means therelay has operated, it
is not necessarilymaking contact)?
Check item with separatefused supply if possible
before condemning
Supplies to relay (terminal30 for example) – battery
volts
Feed out of the relay(terminal 87 for example) –
battery volts
Supply to switch – batteryvolts
No Yes
YesNo
Supply out of the switchand to the relay – battery
volts
Relay earth connection –note also that the relay mayhave a supply and that the
control switch may have theearth connection
Voltage supply to the light –within 0.5 V of the battery
Earth circuit (continuity orvoltage) – 0 or 0 V
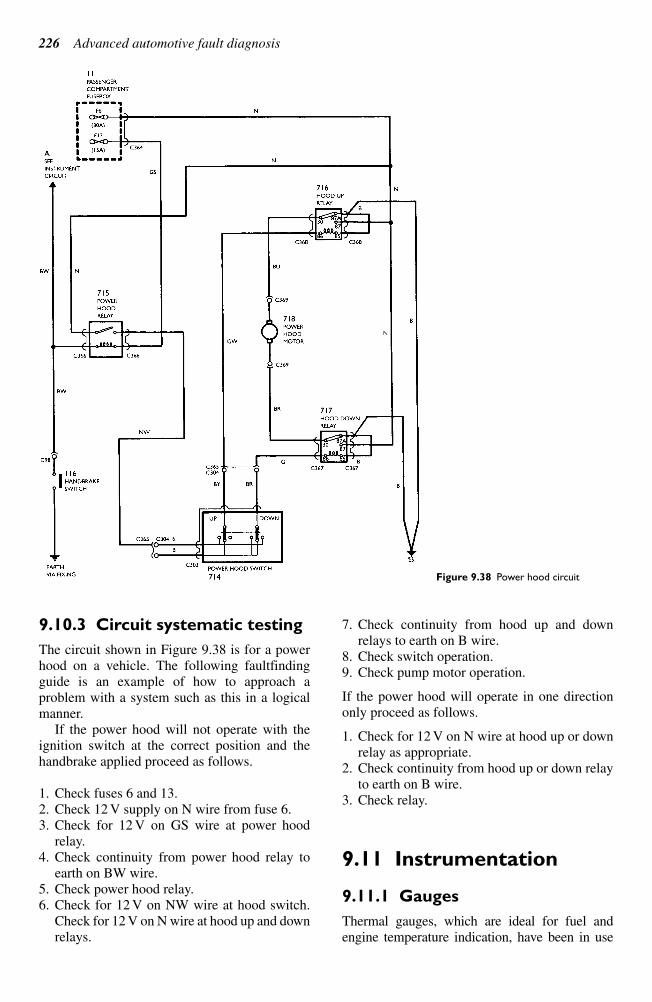
9.10.3 Circuit systematic testing
The circuit shown in Figure 9.38 is for a power
hood on a vehicle. The following faultfinding
guide is an example of how to approach a
problem with a system such as this in a logical
manner.
If the power hood will not operate with the
ignition switch at the correct position and the
handbrake applied proceed as follows.
1. Check fuses 6 and 13.
2. Check 12 V supply on N wire from fuse 6.
3. Check for 12 V on GS wire at power hood
relay.
4. Check continuity from power hood relay to
earth on BW wire.
5. Check power hood relay.
6. Check for 12 V on NW wire at hood switch.
Check for 12 V on N wire at hood up and down
relays.
7. Check continuity from hood up and down
relays to earth on B wire.
8. Check switch operation.
9. Check pump motor operation.
If the power hood will operate in one direction
only proceed as follows.
1. Check for 12 V on N wire at hood up or down
relay as appropriate.
2. Check continuity from hood up or down relay
to earth on B wire.
3. Check relay.
9.11 Instrumentation
9.11.1 Gauges
Thermal gauges, which are ideal for fuel and
engine temperature indication, have been in use
226 Advanced automotive fault diagnosis
Figure 9.38 Power hood circuit
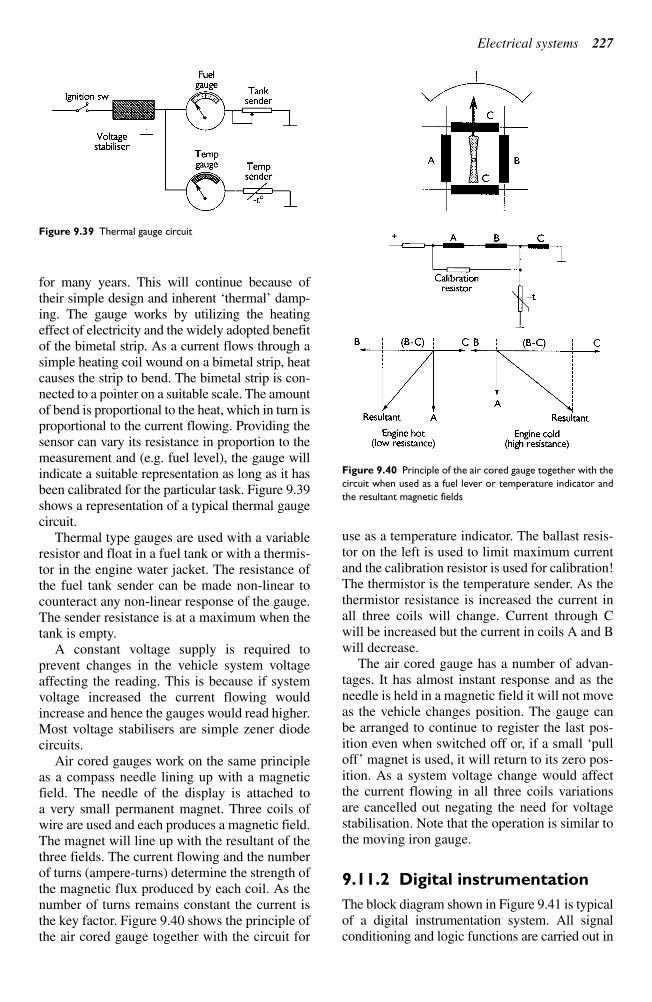
for many years. This will continue because of
their simple design and inherent ‘thermal’ damp-ing. The gauge works by utilizing the heatingeffect of electricity and the widely adopted benefitof the bimetal strip. As a current flows through asimple heating coil wound on a bimetal strip, heatcauses the strip to bend. The bimetal strip is con-nected to a pointer on a suitable scale. The amountof bend is proportional to the heat, which in turn isproportional to the current flowing. Providing thesensor can vary its resistance in proportion to themeasurement and (e.g. fuel level), the gauge willindicate a suitable representation as long as it hasbeen calibrated for the particular task. Figure 9.39shows a representation of a typical thermal gaugecircuit.
Thermal type gauges are used with a variableresistor and float in a fuel tank or with a thermis-tor in the engine water jacket. The resistance ofthe fuel tank sender can be made non-linear tocounteract any non-linear response of the gauge.The sender resistance is at a maximum when thetank is empty.
A constant voltage supply is required to prevent changes in the vehicle system voltageaffecting the reading. This is because if systemvoltage increased the current flowing wouldincrease and hence the gauges would read higher.Most voltage stabilisers are simple zener diodecircuits.
Air cored gauges work on the same principleas a compass needle lining up with a magneticfield. The needle of the display is attached to a very small permanent magnet. Three coils ofwire are used and each produces a magnetic field.The magnet will line up with the resultant of thethree fields. The current flowing and the numberof turns (ampere-turns) determine the strength ofthe magnetic flux produced by each coil. As thenumber of turns remains constant the current isthe key factor. Figure 9.40 shows the principle ofthe air cored gauge together with the circuit for
use as a temperature indicator. The ballast resis-tor on the left is used to limit maximum currentand the calibration resistor is used for calibration!The thermistor is the temperature sender. As thethermistor resistance is increased the current inall three coils will change. Current through Cwill be increased but the current in coils A and Bwill decrease.
The air cored gauge has a number of advan-tages. It has almost instant response and as theneedle is held in a magnetic field it will not moveas the vehicle changes position. The gauge canbe arranged to continue to register the last pos-ition even when switched off or, if a small ‘pulloff’ magnet is used, it will return to its zero pos-ition. As a system voltage change would affectthe current flowing in all three coils variationsare cancelled out negating the need for voltagestabilisation. Note that the operation is similar tothe moving iron gauge.
9.11.2 Digital instrumentation
The block diagram shown in Figure 9.41 is typicalof a digital instrumentation system. All signalconditioning and logic functions are carried out in
Electrical systems 227
Figure 9.39 Thermal gauge circuit
Figure 9.40 Principle of the air cored gauge together with the
circuit when used as a fuel lever or temperature indicator and
the resultant magnetic fields
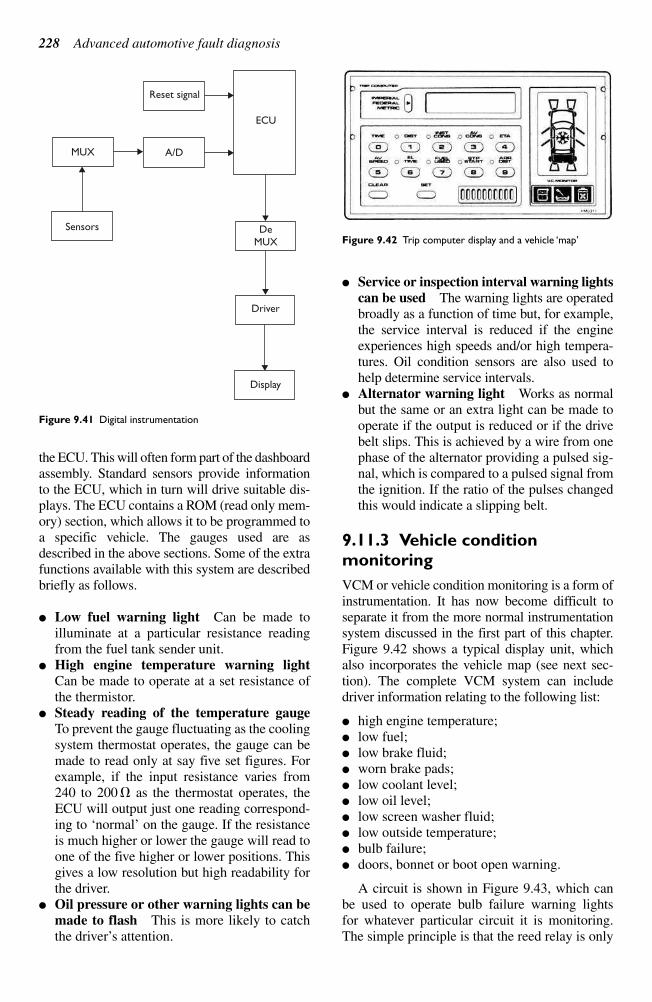
the ECU. This will often form part of the dashboard
assembly. Standard sensors provide information
to the ECU, which in turn will drive suitable dis-
plays. The ECU contains a ROM (read only mem-
ory) section, which allows it to be programmed to
a specific vehicle. The gauges used are as
described in the above sections. Some of the extra
functions available with this system are described
briefly as follows.
Low fuel warning light Can be made to
illuminate at a particular resistance reading
from the fuel tank sender unit.
High engine temperature warning light
Can be made to operate at a set resistance of
the thermistor.
Steady reading of the temperature gauge
To prevent the gauge fluctuating as the cooling
system thermostat operates, the gauge can be
made to read only at say five set figures. For
example, if the input resistance varies from
240 to 200 as the thermostat operates, the
ECU will output just one reading correspond-
ing to ‘normal’ on the gauge. If the resistanceis much higher or lower the gauge will read toone of the five higher or lower positions. Thisgives a low resolution but high readability forthe driver.
Oil pressure or other warning lights can be
made to flash This is more likely to catchthe driver’s attention.
Service or inspection interval warning lights
can be used The warning lights are operatedbroadly as a function of time but, for example,the service interval is reduced if the engineexperiences high speeds and/or high tempera-tures. Oil condition sensors are also used tohelp determine service intervals.
Alternator warning light Works as normalbut the same or an extra light can be made tooperate if the output is reduced or if the drivebelt slips. This is achieved by a wire from onephase of the alternator providing a pulsed sig-nal, which is compared to a pulsed signal fromthe ignition. If the ratio of the pulses changedthis would indicate a slipping belt.
9.11.3 Vehicle condition
monitoring
VCM or vehicle condition monitoring is a form ofinstrumentation. It has now become difficult toseparate it from the more normal instrumentationsystem discussed in the first part of this chapter.Figure 9.42 shows a typical display unit, whichalso incorporates the vehicle map (see next sec-tion). The complete VCM system can includedriver information relating to the following list:
high engine temperature; low fuel; low brake fluid; worn brake pads; low coolant level; low oil level; low screen washer fluid; low outside temperature; bulb failure; doors, bonnet or boot open warning.
A circuit is shown in Figure 9.43, which can be used to operate bulb failure warning lights for whatever particular circuit it is monitoring.The simple principle is that the reed relay is only
228 Advanced automotive fault diagnosis
Reset signal
A/D
ECU
MUX
Sensors DeMUX
Driver
Display
Figure 9.41 Digital instrumentation
Figure 9.42 Trip computer display and a vehicle ‘map’
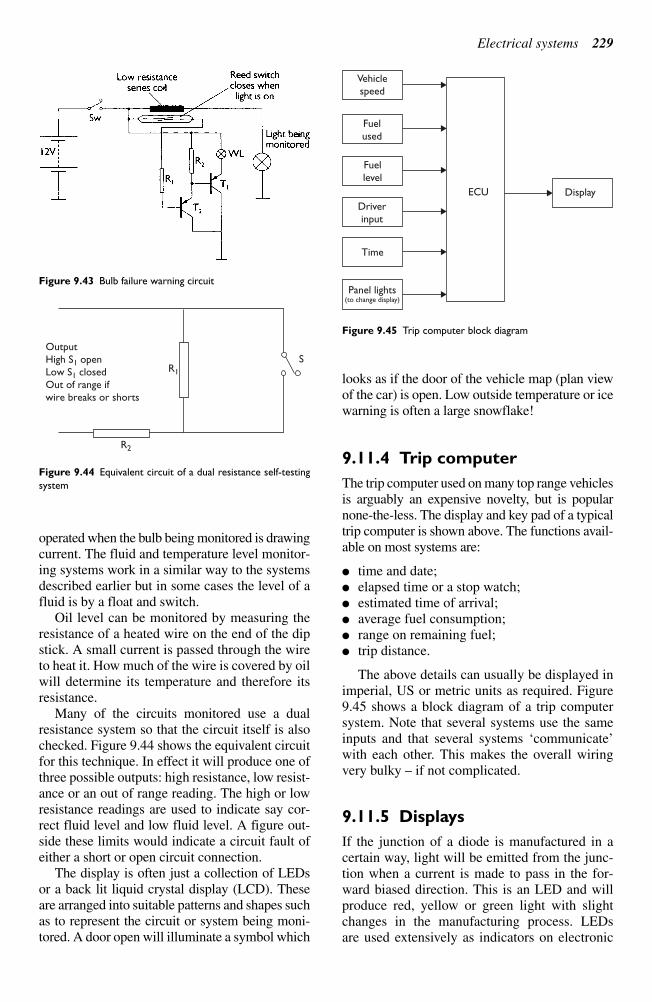
operated when the bulb being monitored is drawing
current. The fluid and temperature level monitor-
ing systems work in a similar way to the systems
described earlier but in some cases the level of a
fluid is by a float and switch.
Oil level can be monitored by measuring the
resistance of a heated wire on the end of the dip
stick. A small current is passed through the wire
to heat it. How much of the wire is covered by oil
will determine its temperature and therefore its
resistance.
Many of the circuits monitored use a dual
resistance system so that the circuit itself is also
checked. Figure 9.44 shows the equivalent circuit
for this technique. In effect it will produce one of
three possible outputs: high resistance, low resist-
ance or an out of range reading. The high or low
resistance readings are used to indicate say cor-
rect fluid level and low fluid level. A figure out-
side these limits would indicate a circuit fault of
either a short or open circuit connection.
The display is often just a collection of LEDs
or a back lit liquid crystal display (LCD). These
are arranged into suitable patterns and shapes such
as to represent the circuit or system being moni-
tored. A door open will illuminate a symbol which
looks as if the door of the vehicle map (plan view
of the car) is open. Low outside temperature or ice
warning is often a large snowflake!
9.11.4 Trip computer
The trip computer used on many top range vehicles
is arguably an expensive novelty, but is popular
none-the-less. The display and key pad of a typical
trip computer is shown above. The functions avail-
able on most systems are:
time and date;
elapsed time or a stop watch;
estimated time of arrival;
average fuel consumption;
range on remaining fuel;
trip distance.
The above details can usually be displayed in
imperial, US or metric units as required. Figure
9.45 shows a block diagram of a trip computer
system. Note that several systems use the same
inputs and that several systems ‘communicate’with each other. This makes the overall wiringvery bulky – if not complicated.
9.11.5 Displays
If the junction of a diode is manufactured in acertain way, light will be emitted from the junc-tion when a current is made to pass in the for-ward biased direction. This is an LED and willproduce red, yellow or green light with slightchanges in the manufacturing process. LEDs are used extensively as indicators on electronic
Electrical systems 229
Figure 9.43 Bulb failure warning circuit
R1
OutputHigh S1 openLow S1 closedOut of range ifwire breaks or shorts
S
R2
Figure 9.44 Equivalent circuit of a dual resistance self-testing
system
ECU
Vehiclespeed
Fuelused
Fuellevel
Driverinput
Panel lights(to change display)
Time
Display
Figure 9.45 Trip computer block diagram
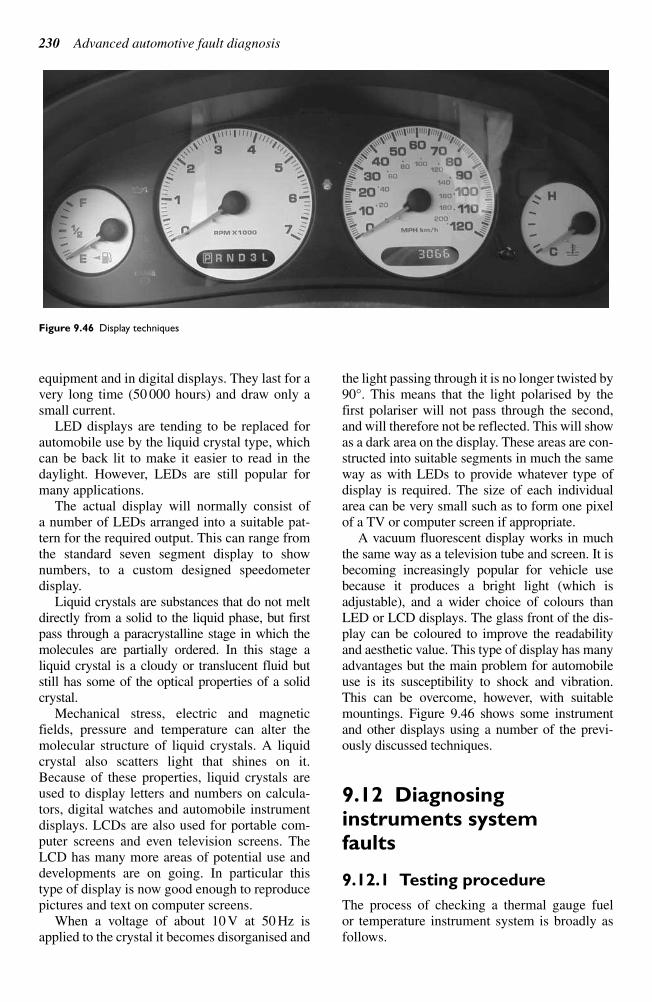
equipment and in digital displays. They last for a
very long time (50 000 hours) and draw only a
small current.
LED displays are tending to be replaced for
automobile use by the liquid crystal type, which
can be back lit to make it easier to read in the
daylight. However, LEDs are still popular for
many applications.
The actual display will normally consist of
a number of LEDs arranged into a suitable pat-
tern for the required output. This can range from
the standard seven segment display to show
numbers, to a custom designed speedometer
display.
Liquid crystals are substances that do not melt
directly from a solid to the liquid phase, but first
pass through a paracrystalline stage in which the
molecules are partially ordered. In this stage a
liquid crystal is a cloudy or translucent fluid but
still has some of the optical properties of a solid
crystal.
Mechanical stress, electric and magnetic
fields, pressure and temperature can alter the
molecular structure of liquid crystals. A liquid
crystal also scatters light that shines on it.
Because of these properties, liquid crystals are
used to display letters and numbers on calcula-
tors, digital watches and automobile instrument
displays. LCDs are also used for portable com-
puter screens and even television screens. The
LCD has many more areas of potential use and
developments are on going. In particular this
type of display is now good enough to reproduce
pictures and text on computer screens.
When a voltage of about 10 V at 50 Hz is
applied to the crystal it becomes disorganised and
the light passing through it is no longer twisted by
90°. This means that the light polarised by the
first polariser will not pass through the second,
and will therefore not be reflected. This will show
as a dark area on the display. These areas are con-
structed into suitable segments in much the same
way as with LEDs to provide whatever type of
display is required. The size of each individual
area can be very small such as to form one pixel
of a TV or computer screen if appropriate.
A vacuum fluorescent display works in much
the same way as a television tube and screen. It is
becoming increasingly popular for vehicle use
because it produces a bright light (which is
adjustable), and a wider choice of colours than
LED or LCD displays. The glass front of the dis-
play can be coloured to improve the readability
and aesthetic value. This type of display has many
advantages but the main problem for automobile
use is its susceptibility to shock and vibration.
This can be overcome, however, with suitable
mountings. Figure 9.46 shows some instrument
and other displays using a number of the previ-
ously discussed techniques.
9.12 Diagnosinginstruments system faults
9.12.1 Testing procedure
The process of checking a thermal gauge fuel
or temperature instrument system is broadly as
follows.
230 Advanced automotive fault diagnosis
Figure 9.46 Display techniques
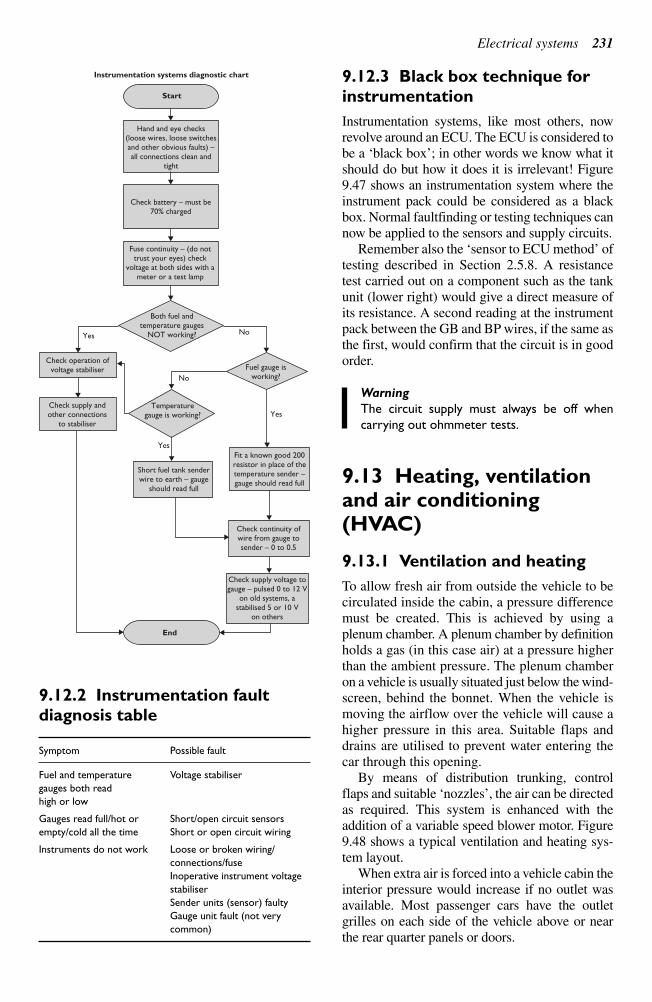
9.12.2 Instrumentation fault
diagnosis table
Symptom Possible fault
Fuel and temperature Voltage stabiliser
gauges both read
high or low
Gauges read full/hot or Short/open circuit sensors
empty/cold all the time Short or open circuit wiring
Instruments do not work Loose or broken wiring/
connections/fuse
Inoperative instrument voltage
stabiliser
Sender units (sensor) faulty
Gauge unit fault (not very
common)
9.12.3 Black box technique for
instrumentation
Instrumentation systems, like most others, now
revolve around an ECU. The ECU is considered to
be a ‘black box’; in other words we know what itshould do but how it does it is irrelevant! Figure9.47 shows an instrumentation system where theinstrument pack could be considered as a blackbox. Normal faultfinding or testing techniques cannow be applied to the sensors and supply circuits.
Remember also the ‘sensor to ECU method’ oftesting described in Section 2.5.8. A resistancetest carried out on a component such as the tankunit (lower right) would give a direct measure ofits resistance. A second reading at the instrumentpack between the GB and BP wires, if the same asthe first, would confirm that the circuit is in goodorder.
Warning
The circuit supply must always be off when
carrying out ohmmeter tests.
9.13 Heating, ventilationand air conditioning(HVAC)
9.13.1 Ventilation and heating
To allow fresh air from outside the vehicle to becirculated inside the cabin, a pressure differencemust be created. This is achieved by using aplenum chamber. A plenum chamber by definitionholds a gas (in this case air) at a pressure higherthan the ambient pressure. The plenum chamberon a vehicle is usually situated just below the wind-screen, behind the bonnet. When the vehicle ismoving the airflow over the vehicle will cause ahigher pressure in this area. Suitable flaps anddrains are utilised to prevent water entering thecar through this opening.
By means of distribution trunking, controlflaps and suitable ‘nozzles’, the air can be directedas required. This system is enhanced with theaddition of a variable speed blower motor. Figure9.48 shows a typical ventilation and heating sys-tem layout.
When extra air is forced into a vehicle cabin theinterior pressure would increase if no outlet wasavailable. Most passenger cars have the outletgrilles on each side of the vehicle above or nearthe rear quarter panels or doors.
Electrical systems 231
Start
Instrumentation systems diagnostic chart
End
Hand and eye checks(loose wires, loose switchesand other obvious faults) –all connections clean and
tight
Check battery – must be70% charged
Fuse continuity – (do nottrust your eyes) check
voltage at both sides with ameter or a test lamp
No
No
Yes
Yes
Yes
Check supply voltage togauge – pulsed 0 to 12 V
on old systems, astabilised 5 or 10 V
on others
Both fuel andtemperature gauges
NOT working?
Check supply andother connections
to stabiliser
Check continuity ofwire from gauge tosender – 0 to 0.5
Fuel gauge isworking?
Temperaturegauge is working?
Check operation ofvoltage stabiliser
Fit a known good 200resistor in place of thetemperature sender –gauge should read full
Short fuel tank senderwire to earth – gauge
should read full
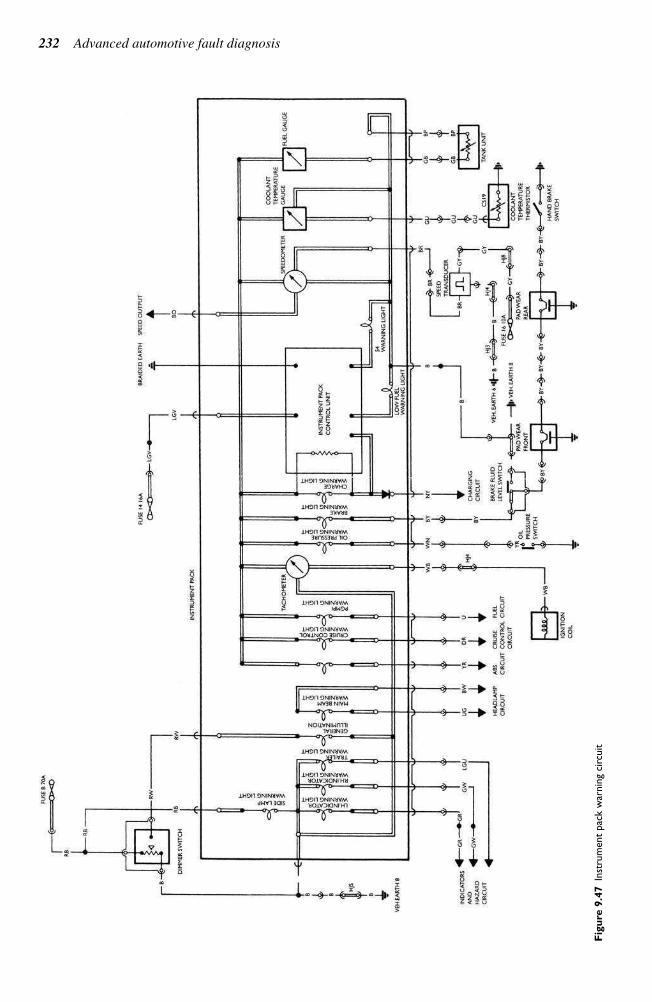
232 Advanced automotive fault diagnosis
Fig
ure
9.4
7In
stru
men
t pac
k w
arnin
g ci
rcuit
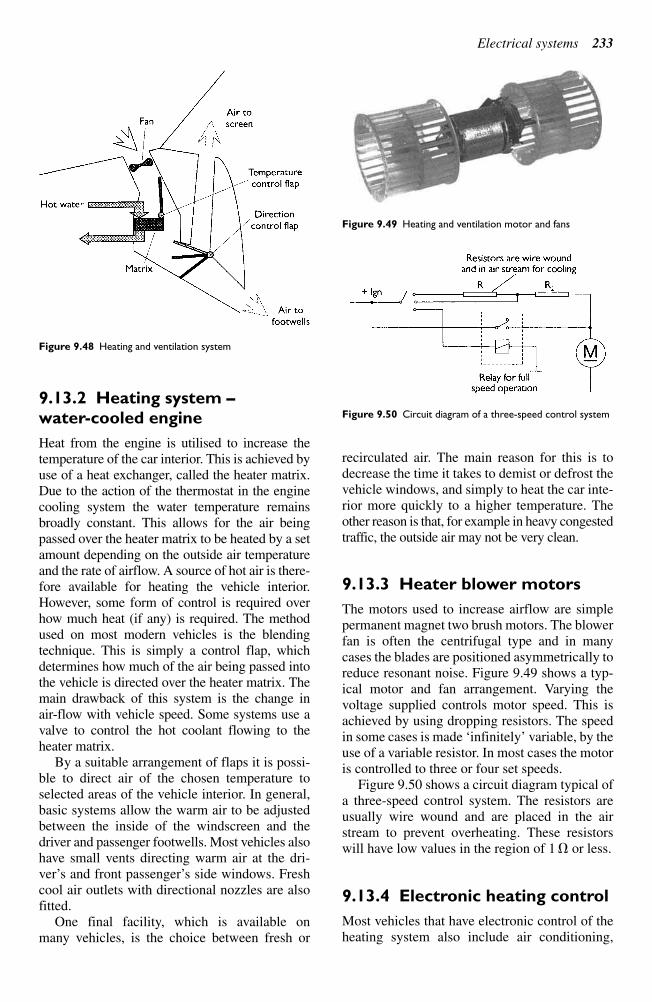
9.13.2 Heating system –
water-cooled engine
Heat from the engine is utilised to increase the
temperature of the car interior. This is achieved by
use of a heat exchanger, called the heater matrix.
Due to the action of the thermostat in the engine
cooling system the water temperature remains
broadly constant. This allows for the air being
passed over the heater matrix to be heated by a set
amount depending on the outside air temperature
and the rate of airflow. A source of hot air is there-
fore available for heating the vehicle interior.
However, some form of control is required over
how much heat (if any) is required. The method
used on most modern vehicles is the blending
technique. This is simply a control flap, which
determines how much of the air being passed into
the vehicle is directed over the heater matrix. The
main drawback of this system is the change in
air-flow with vehicle speed. Some systems use a
valve to control the hot coolant flowing to the
heater matrix.
By a suitable arrangement of flaps it is possi-
ble to direct air of the chosen temperature to
selected areas of the vehicle interior. In general,
basic systems allow the warm air to be adjusted
between the inside of the windscreen and the
driver and passenger footwells. Most vehicles also
have small vents directing warm air at the dri-
ver’s and front passenger’s side windows. Freshcool air outlets with directional nozzles are alsofitted.
One final facility, which is available on many vehicles, is the choice between fresh or
recirculated air. The main reason for this is todecrease the time it takes to demist or defrost thevehicle windows, and simply to heat the car inte-rior more quickly to a higher temperature. Theother reason is that, for example in heavy congestedtraffic, the outside air may not be very clean.
9.13.3 Heater blower motors
The motors used to increase airflow are simplepermanent magnet two brush motors. The blowerfan is often the centrifugal type and in manycases the blades are positioned asymmetrically toreduce resonant noise. Figure 9.49 shows a typ-ical motor and fan arrangement. Varying thevoltage supplied controls motor speed. This isachieved by using dropping resistors. The speedin some cases is made ‘infinitely’ variable, by theuse of a variable resistor. In most cases the motoris controlled to three or four set speeds.
Figure 9.50 shows a circuit diagram typical ofa three-speed control system. The resistors areusually wire wound and are placed in the airstream to prevent overheating. These resistorswill have low values in the region of 1 or less.
9.13.4 Electronic heating control
Most vehicles that have electronic control of theheating system also include air conditioning,
Electrical systems 233
Figure 9.48 Heating and ventilation system
Figure 9.49 Heating and ventilation motor and fans
Figure 9.50 Circuit diagram of a three-speed control system
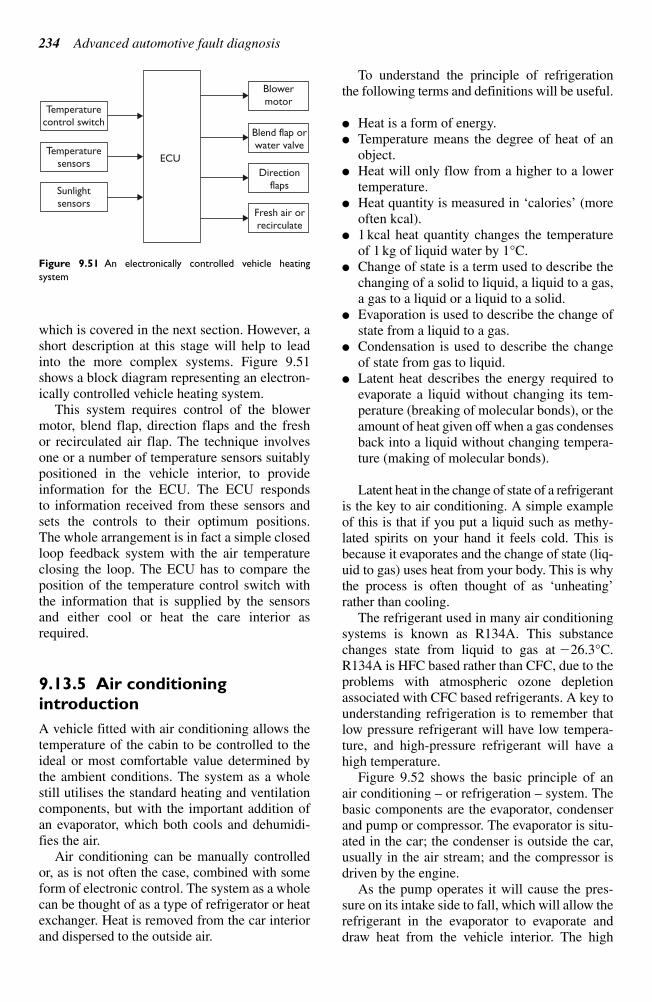
which is covered in the next section. However, a
short description at this stage will help to lead
into the more complex systems. Figure 9.51
shows a block diagram representing an electron-
ically controlled vehicle heating system.
This system requires control of the blower
motor, blend flap, direction flaps and the fresh
or recirculated air flap. The technique involves
one or a number of temperature sensors suitably
positioned in the vehicle interior, to provide
information for the ECU. The ECU responds
to information received from these sensors and
sets the controls to their optimum positions.
The whole arrangement is in fact a simple closed
loop feedback system with the air temperature
closing the loop. The ECU has to compare the
position of the temperature control switch with
the information that is supplied by the sensors
and either cool or heat the care interior as
required.
9.13.5 Air conditioning
introduction
A vehicle fitted with air conditioning allows the
temperature of the cabin to be controlled to the
ideal or most comfortable value determined by
the ambient conditions. The system as a whole
still utilises the standard heating and ventilation
components, but with the important addition of
an evaporator, which both cools and dehumidi-
fies the air.
Air conditioning can be manually controlled
or, as is not often the case, combined with some
form of electronic control. The system as a whole
can be thought of as a type of refrigerator or heat
exchanger. Heat is removed from the car interior
and dispersed to the outside air.
To understand the principle of refrigeration
the following terms and definitions will be useful.
Heat is a form of energy.
Temperature means the degree of heat of an
object.
Heat will only flow from a higher to a lower
temperature.
Heat quantity is measured in ‘calories’ (moreoften kcal).
1 kcal heat quantity changes the temperatureof 1 kg of liquid water by 1°C.
Change of state is a term used to describe thechanging of a solid to liquid, a liquid to a gas,a gas to a liquid or a liquid to a solid.
Evaporation is used to describe the change ofstate from a liquid to a gas.
Condensation is used to describe the changeof state from gas to liquid.
Latent heat describes the energy required toevaporate a liquid without changing its tem-perature (breaking of molecular bonds), or theamount of heat given off when a gas condensesback into a liquid without changing tempera-ture (making of molecular bonds).
Latent heat in the change of state of a refrigerantis the key to air conditioning. A simple exampleof this is that if you put a liquid such as methy-lated spirits on your hand it feels cold. This isbecause it evaporates and the change of state (liq-uid to gas) uses heat from your body. This is whythe process is often thought of as ‘unheating’rather than cooling.
The refrigerant used in many air conditioningsystems is known as R134A. This substancechanges state from liquid to gas at 26.3°C.R134A is HFC based rather than CFC, due to theproblems with atmospheric ozone depletionassociated with CFC based refrigerants. A key tounderstanding refrigeration is to remember thatlow pressure refrigerant will have low tempera-ture, and high-pressure refrigerant will have ahigh temperature.
Figure 9.52 shows the basic principle of an air conditioning – or refrigeration – system. Thebasic components are the evaporator, condenserand pump or compressor. The evaporator is situ-ated in the car; the condenser is outside the car,usually in the air stream; and the compressor isdriven by the engine.
As the pump operates it will cause the pres-sure on its intake side to fall, which will allow therefrigerant in the evaporator to evaporate anddraw heat from the vehicle interior. The high
234 Advanced automotive fault diagnosis
Blowermotor
Blend flap orwater valve
Directionflaps
ECU
Temperaturecontrol switch
Temperaturesensors
Sunlightsensors
Fresh air orrecirculate
Figure 9.51 An electronically controlled vehicle heating
system
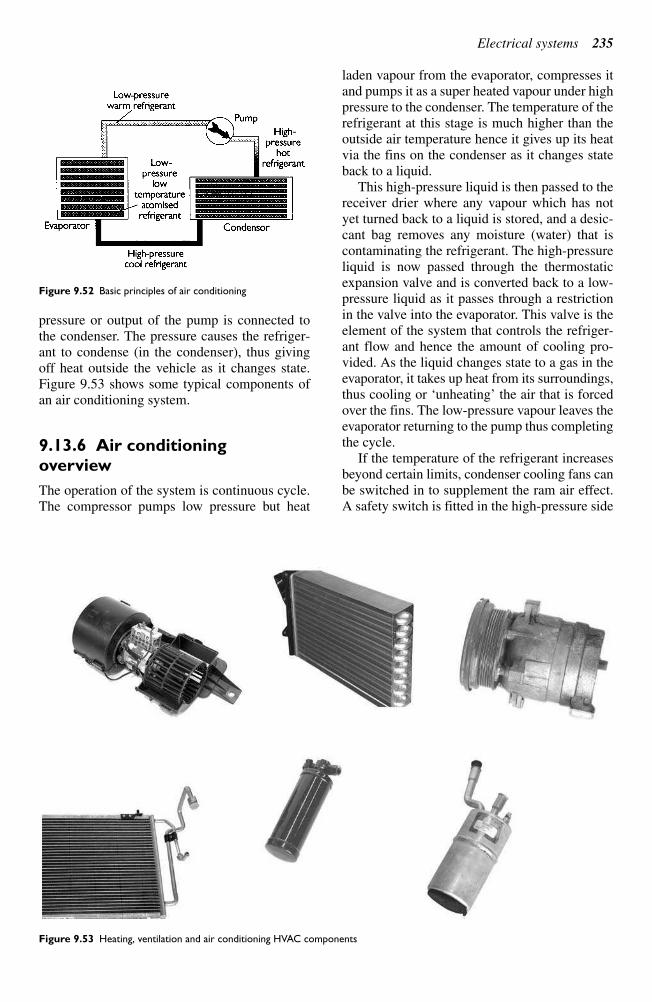
pressure or output of the pump is connected to
the condenser. The pressure causes the refriger-
ant to condense (in the condenser), thus giving
off heat outside the vehicle as it changes state.
Figure 9.53 shows some typical components of
an air conditioning system.
9.13.6 Air conditioning
overview
The operation of the system is continuous cycle.
The compressor pumps low pressure but heat
laden vapour from the evaporator, compresses it
and pumps it as a super heated vapour under high
pressure to the condenser. The temperature of the
refrigerant at this stage is much higher than the
outside air temperature hence it gives up its heat
via the fins on the condenser as it changes state
back to a liquid.
This high-pressure liquid is then passed to the
receiver drier where any vapour which has not
yet turned back to a liquid is stored, and a desic-
cant bag removes any moisture (water) that is
contaminating the refrigerant. The high-pressure
liquid is now passed through the thermostatic
expansion valve and is converted back to a low-
pressure liquid as it passes through a restriction
in the valve into the evaporator. This valve is the
element of the system that controls the refriger-
ant flow and hence the amount of cooling pro-
vided. As the liquid changes state to a gas in the
evaporator, it takes up heat from its surroundings,
thus cooling or ‘unheating’ the air that is forcedover the fins. The low-pressure vapour leaves theevaporator returning to the pump thus completingthe cycle.
If the temperature of the refrigerant increasesbeyond certain limits, condenser cooling fans canbe switched in to supplement the ram air effect.A safety switch is fitted in the high-pressure side
Electrical systems 235
Figure 9.52 Basic principles of air conditioning
Figure 9.53 Heating, ventilation and air conditioning HVAC components
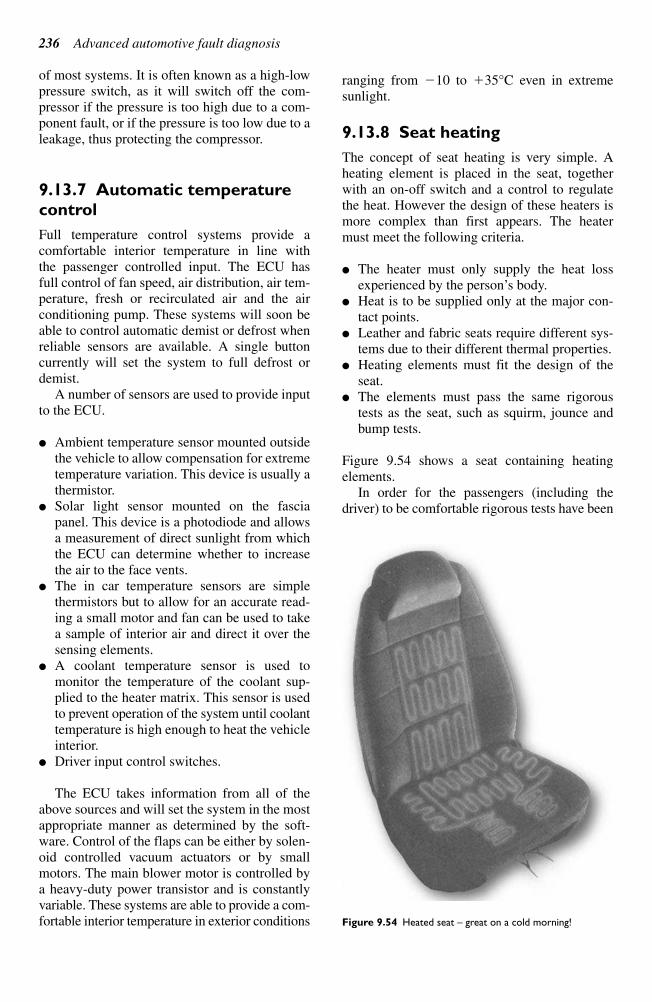
of most systems. It is often known as a high-low
pressure switch, as it will switch off the com-
pressor if the pressure is too high due to a com-
ponent fault, or if the pressure is too low due to a
leakage, thus protecting the compressor.
9.13.7 Automatic temperature
control
Full temperature control systems provide a
comfortable interior temperature in line with
the passenger controlled input. The ECU has
full control of fan speed, air distribution, air tem-
perature, fresh or recirculated air and the air
conditioning pump. These systems will soon be
able to control automatic demist or defrost when
reliable sensors are available. A single button
currently will set the system to full defrost or
demist.
A number of sensors are used to provide input
to the ECU.
Ambient temperature sensor mounted outside
the vehicle to allow compensation for extreme
temperature variation. This device is usually a
thermistor.
Solar light sensor mounted on the fascia
panel. This device is a photodiode and allows
a measurement of direct sunlight from which
the ECU can determine whether to increase
the air to the face vents.
The in car temperature sensors are simple
thermistors but to allow for an accurate read-
ing a small motor and fan can be used to take
a sample of interior air and direct it over the
sensing elements.
A coolant temperature sensor is used to
monitor the temperature of the coolant sup-
plied to the heater matrix. This sensor is used
to prevent operation of the system until coolant
temperature is high enough to heat the vehicle
interior.
Driver input control switches.
The ECU takes information from all of the
above sources and will set the system in the most
appropriate manner as determined by the soft-
ware. Control of the flaps can be either by solen-
oid controlled vacuum actuators or by small
motors. The main blower motor is controlled by
a heavy-duty power transistor and is constantly
variable. These systems are able to provide a com-
fortable interior temperature in exterior conditions
ranging from 10 to 35°C even in extreme
sunlight.
9.13.8 Seat heating
The concept of seat heating is very simple. A
heating element is placed in the seat, together
with an on-off switch and a control to regulate
the heat. However the design of these heaters is
more complex than first appears. The heater
must meet the following criteria.
The heater must only supply the heat loss
experienced by the person’s body. Heat is to be supplied only at the major con-
tact points. Leather and fabric seats require different sys-
tems due to their different thermal properties. Heating elements must fit the design of the
seat. The elements must pass the same rigorous
tests as the seat, such as squirm, jounce andbump tests.
Figure 9.54 shows a seat containing heatingelements.
In order for the passengers (including thedriver) to be comfortable rigorous tests have been
236 Advanced automotive fault diagnosis
Figure 9.54 Heated seat – great on a cold morning!
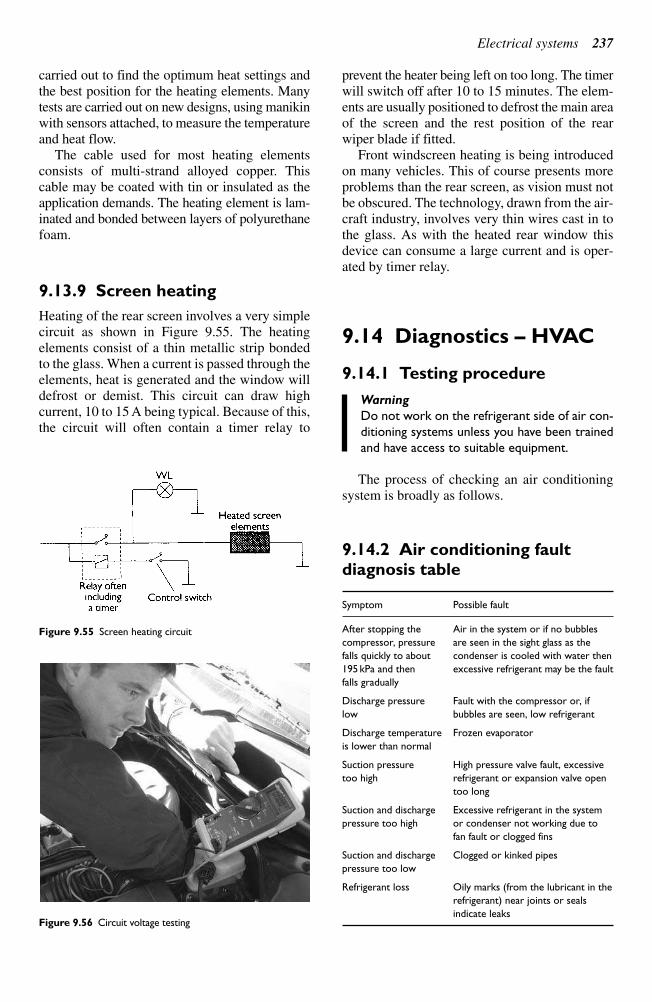
carried out to find the optimum heat settings and
the best position for the heating elements. Many
tests are carried out on new designs, using manikin
with sensors attached, to measure the temperature
and heat flow.
The cable used for most heating elements
consists of multi-strand alloyed copper. This
cable may be coated with tin or insulated as the
application demands. The heating element is lam-
inated and bonded between layers of polyurethane
foam.
9.13.9 Screen heating
Heating of the rear screen involves a very simple
circuit as shown in Figure 9.55. The heating
elements consist of a thin metallic strip bonded
to the glass. When a current is passed through the
elements, heat is generated and the window will
defrost or demist. This circuit can draw high
current, 10 to 15 A being typical. Because of this,
the circuit will often contain a timer relay to
prevent the heater being left on too long. The timer
will switch off after 10 to 15 minutes. The elem-
ents are usually positioned to defrost the main area
of the screen and the rest position of the rear
wiper blade if fitted.
Front windscreen heating is being introduced
on many vehicles. This of course presents more
problems than the rear screen, as vision must not
be obscured. The technology, drawn from the air-
craft industry, involves very thin wires cast in to
the glass. As with the heated rear window this
device can consume a large current and is oper-
ated by timer relay.
9.14 Diagnostics – HVAC
9.14.1 Testing procedure
Warning
Do not work on the refrigerant side of air con-
ditioning systems unless you have been trained
and have access to suitable equipment.
The process of checking an air conditioning
system is broadly as follows.
9.14.2 Air conditioning fault
diagnosis table
Symptom Possible fault
After stopping the Air in the system or if no bubbles
compressor, pressure are seen in the sight glass as the
falls quickly to about condenser is cooled with water then
195 kPa and then excessive refrigerant may be the fault
falls gradually
Discharge pressure Fault with the compressor or, if
low bubbles are seen, low refrigerant
Discharge temperature Frozen evaporator
is lower than normal
Suction pressure High pressure valve fault, excessive
too high refrigerant or expansion valve open
too long
Suction and discharge Excessive refrigerant in the system
pressure too high or condenser not working due to
fan fault or clogged fins
Suction and discharge Clogged or kinked pipes
pressure too low
Refrigerant loss Oily marks (from the lubricant in the
refrigerant) near joints or seals
indicate leaks
Electrical systems 237
Figure 9.55 Screen heating circuit
Figure 9.56 Circuit voltage testing
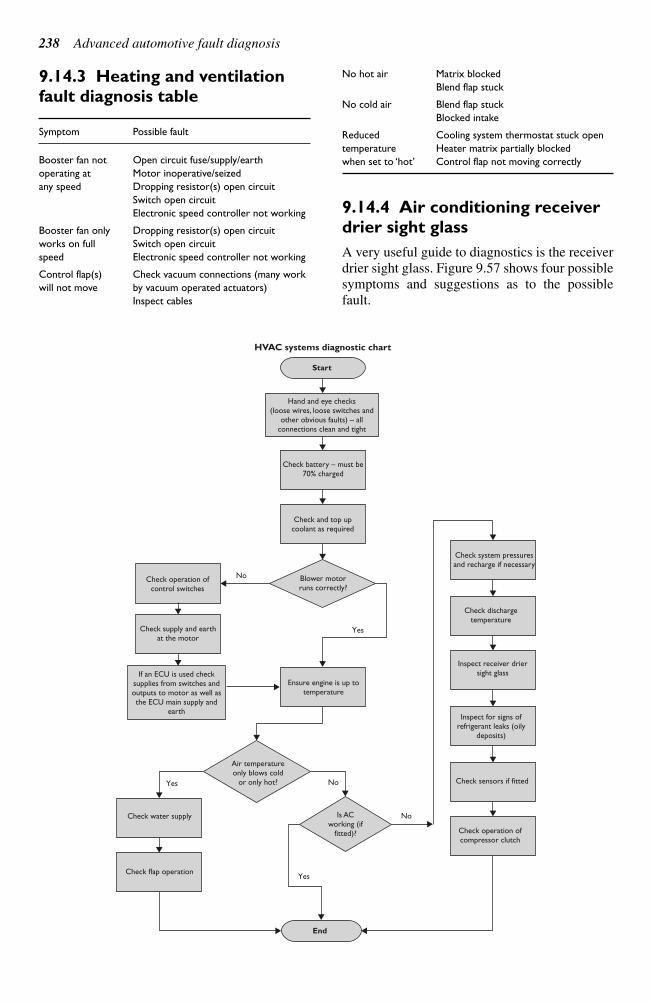
9.14.3 Heating and ventilation
fault diagnosis table
Symptom Possible fault
Booster fan not Open circuit fuse/supply/earth
operating at Motor inoperative/seized
any speed Dropping resistor(s) open circuit
Switch open circuit
Electronic speed controller not working
Booster fan only Dropping resistor(s) open circuit
works on full Switch open circuit
speed Electronic speed controller not working
Control flap(s) Check vacuum connections (many work
will not move by vacuum operated actuators)
Inspect cables
No hot air Matrix blocked
Blend flap stuck
No cold air Blend flap stuck
Blocked intake
Reduced Cooling system thermostat stuck open
temperature Heater matrix partially blocked
when set to ‘hot’ Control flap not moving correctly
9.14.4 Air conditioning receiver
drier sight glass
A very useful guide to diagnostics is the receiver
drier sight glass. Figure 9.57 shows four possible
symptoms and suggestions as to the possible
fault.
238 Advanced automotive fault diagnosis
Start
HVAC systems diagnostic chart
End
Hand and eye checks(loose wires, loose switches and
other obvious faults) – allconnections clean and tight
Check battery – must be70% charged
Check and top upcoolant as required
Blower motorruns correctly?
Ensure engine is up totemperature
Air temperatureonly blows cold
or only hot?
Is ACworking (if
fitted)?
Check water supply
Check flap operation
Check operation ofcontrol switches
Check supply and earthat the motor
If an ECU is used checksupplies from switches andoutputs to motor as well asthe ECU main supply and
earth
Check system pressuresand recharge if necessary
Check dischargetemperature
Inspect receiver driersight glass
Inspect for signs ofrefrigerant leaks (oily
deposits)
Check sensors if fitted
Check operation ofcompressor clutch
No
No
No
Yes
Yes
Yes
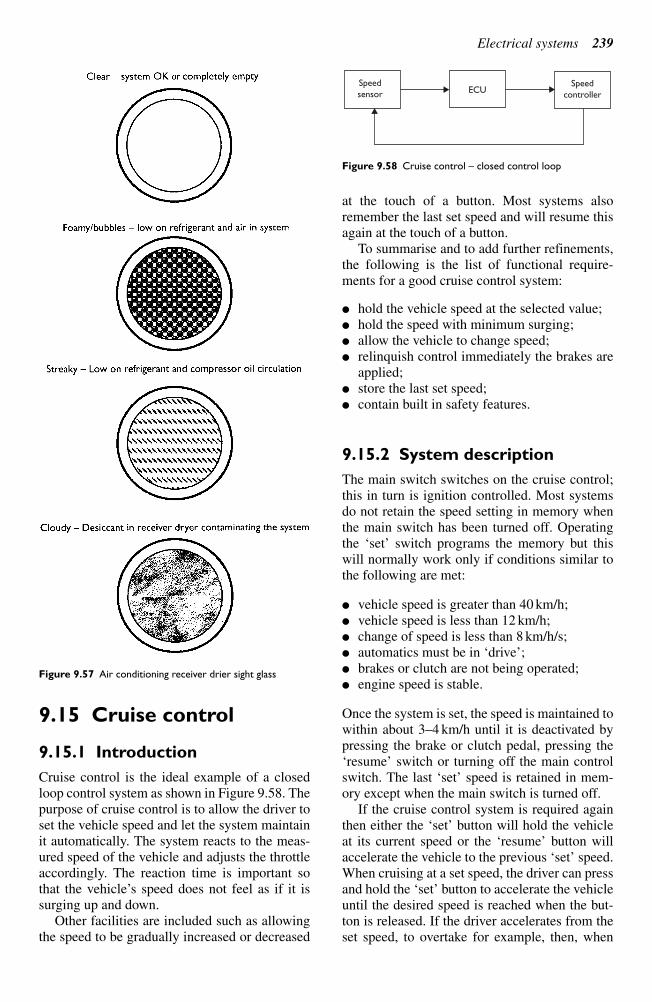
9.15 Cruise control
9.15.1 Introduction
Cruise control is the ideal example of a closed
loop control system as shown in Figure 9.58. The
purpose of cruise control is to allow the driver to
set the vehicle speed and let the system maintain
it automatically. The system reacts to the meas-
ured speed of the vehicle and adjusts the throttle
accordingly. The reaction time is important so
that the vehicle’s speed does not feel as if it issurging up and down.
Other facilities are included such as allowingthe speed to be gradually increased or decreased
at the touch of a button. Most systems alsoremember the last set speed and will resume thisagain at the touch of a button.
To summarise and to add further refinements,the following is the list of functional require-ments for a good cruise control system:
hold the vehicle speed at the selected value; hold the speed with minimum surging; allow the vehicle to change speed; relinquish control immediately the brakes are
applied; store the last set speed; contain built in safety features.
9.15.2 System description
The main switch switches on the cruise control;this in turn is ignition controlled. Most systemsdo not retain the speed setting in memory whenthe main switch has been turned off. Operatingthe ‘set’ switch programs the memory but thiswill normally work only if conditions similar tothe following are met:
vehicle speed is greater than 40 km/h; vehicle speed is less than 12 km/h; change of speed is less than 8 km/h/s; automatics must be in ‘drive’; brakes or clutch are not being operated; engine speed is stable.
Once the system is set, the speed is maintained towithin about 3–4 km/h until it is deactivated bypressing the brake or clutch pedal, pressing the‘resume’ switch or turning off the main controlswitch. The last ‘set’ speed is retained in mem-ory except when the main switch is turned off.
If the cruise control system is required againthen either the ‘set’ button will hold the vehicleat its current speed or the ‘resume’ button willaccelerate the vehicle to the previous ‘set’ speed.When cruising at a set speed, the driver can pressand hold the ‘set’ button to accelerate the vehicleuntil the desired speed is reached when the but-ton is released. If the driver accelerates from theset speed, to overtake for example, then, when
Electrical systems 239
Figure 9.57 Air conditioning receiver drier sight glass
Speed
sensorSpeed
controllerECU
Figure 9.58 Cruise control – closed control loop
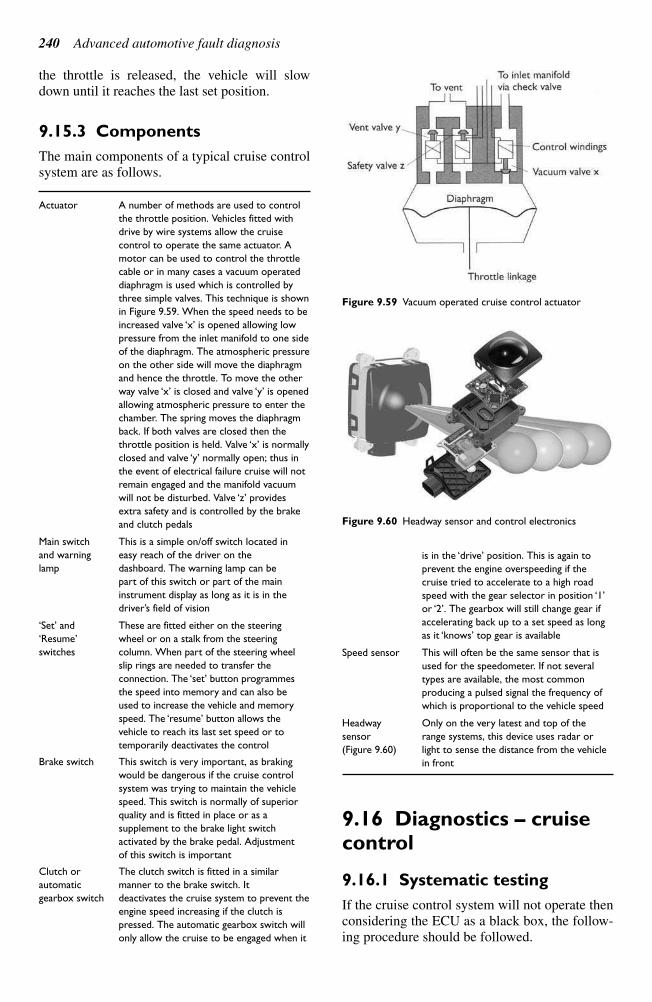
the throttle is released, the vehicle will slow
down until it reaches the last set position.
9.15.3 Components
The main components of a typical cruise control
system are as follows.
Actuator A number of methods are used to control
the throttle position. Vehicles fitted with
drive by wire systems allow the cruise
control to operate the same actuator. A
motor can be used to control the throttle
cable or in many cases a vacuum operated
diaphragm is used which is controlled by
three simple valves. This technique is shown
in Figure 9.59. When the speed needs to be
increased valve ‘x’ is opened allowing low
pressure from the inlet manifold to one side
of the diaphragm. The atmospheric pressure
on the other side will move the diaphragm
and hence the throttle. To move the other
way valve ‘x’ is closed and valve ‘y’ is opened
allowing atmospheric pressure to enter the
chamber. The spring moves the diaphragm
back. If both valves are closed then the
throttle position is held. Valve ‘x’ is normally
closed and valve ‘y’ normally open; thus in
the event of electrical failure cruise will not
remain engaged and the manifold vacuum
will not be disturbed. Valve ‘z’ provides
extra safety and is controlled by the brake
and clutch pedals
Main switch This is a simple on/off switch located in
and warning easy reach of the driver on the
lamp dashboard. The warning lamp can be
part of this switch or part of the main
instrument display as long as it is in the
driver’s field of vision
‘Set’ and These are fitted either on the steering
‘Resume’ wheel or on a stalk from the steering
switches column. When part of the steering wheel
slip rings are needed to transfer the
connection. The ‘set’ button programmes
the speed into memory and can also be
used to increase the vehicle and memory
speed. The ‘resume’ button allows the
vehicle to reach its last set speed or to
temporarily deactivates the control
Brake switch This switch is very important, as braking
would be dangerous if the cruise control
system was trying to maintain the vehicle
speed. This switch is normally of superior
quality and is fitted in place or as a
supplement to the brake light switch
activated by the brake pedal. Adjustment
of this switch is important
Clutch or The clutch switch is fitted in a similar
automatic manner to the brake switch. It
gearbox switch deactivates the cruise system to prevent the
engine speed increasing if the clutch is
pressed. The automatic gearbox switch will
only allow the cruise to be engaged when it
is in the ‘drive’ position. This is again to
prevent the engine overspeeding if the
cruise tried to accelerate to a high road
speed with the gear selector in position ‘1’
or ‘2’. The gearbox will still change gear if
accelerating back up to a set speed as long
as it ‘knows’ top gear is available
Speed sensor This will often be the same sensor that is
used for the speedometer. If not several
types are available, the most common
producing a pulsed signal the frequency of
which is proportional to the vehicle speed
Headway Only on the very latest and top of the
sensor range systems, this device uses radar or
(Figure 9.60) light to sense the distance from the vehicle
in front
9.16 Diagnostics – cruisecontrol
9.16.1 Systematic testing
If the cruise control system will not operate then
considering the ECU as a black box, the follow-
ing procedure should be followed.
240 Advanced automotive fault diagnosis
Figure 9.59 Vacuum operated cruise control actuator
Figure 9.60 Headway sensor and control electronics
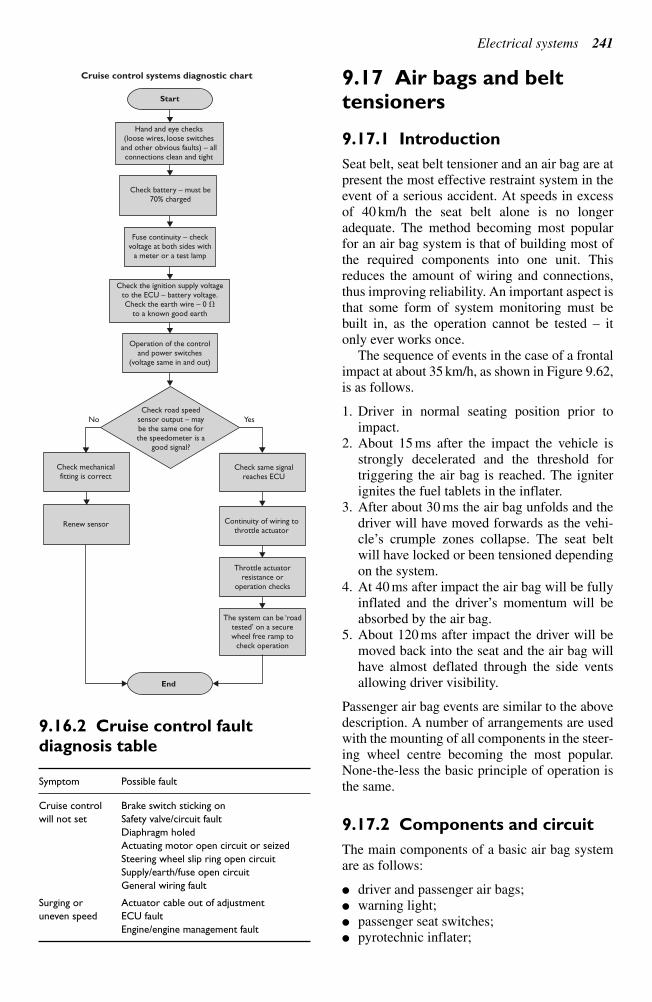
9.16.2 Cruise control fault
diagnosis table
Symptom Possible fault
Cruise control Brake switch sticking on
will not set Safety valve/circuit fault
Diaphragm holed
Actuating motor open circuit or seized
Steering wheel slip ring open circuit
Supply/earth/fuse open circuit
General wiring fault
Surging or Actuator cable out of adjustment
uneven speed ECU fault
Engine/engine management fault
9.17 Air bags and belttensioners
9.17.1 Introduction
Seat belt, seat belt tensioner and an air bag are at
present the most effective restraint system in the
event of a serious accident. At speeds in excess
of 40 km/h the seat belt alone is no longer
adequate. The method becoming most popular
for an air bag system is that of building most of
the required components into one unit. This
reduces the amount of wiring and connections,
thus improving reliability. An important aspect is
that some form of system monitoring must be
built in, as the operation cannot be tested – itonly ever works once.
The sequence of events in the case of a frontalimpact at about 35 km/h, as shown in Figure 9.62,is as follows.
1. Driver in normal seating position prior toimpact.
2. About 15 ms after the impact the vehicle isstrongly decelerated and the threshold fortriggering the air bag is reached. The igniterignites the fuel tablets in the inflater.
3. After about 30 ms the air bag unfolds and thedriver will have moved forwards as the vehi-cle’s crumple zones collapse. The seat beltwill have locked or been tensioned dependingon the system.
4. At 40 ms after impact the air bag will be fullyinflated and the driver’s momentum will beabsorbed by the air bag.
5. About 120 ms after impact the driver will bemoved back into the seat and the air bag willhave almost deflated through the side ventsallowing driver visibility.
Passenger air bag events are similar to the abovedescription. A number of arrangements are usedwith the mounting of all components in the steer-ing wheel centre becoming the most popular.None-the-less the basic principle of operation isthe same.
9.17.2 Components and circuit
The main components of a basic air bag systemare as follows:
driver and passenger air bags; warning light; passenger seat switches; pyrotechnic inflater;
Electrical systems 241
Hand and eye checks(loose wires, loose switches
and other obvious faults) – allconnections clean and tight
Check battery – must be70% charged
Start
End
Fuse continuity – checkvoltage at both sides with
a meter or a test lamp
Check the ignition supply voltageto the ECU – battery voltage.Check the earth wire – 0
to a known good earth
Operation of the controland power switches
(voltage same in and out)
Check road speedsensor output – maybe the same one forthe speedometer is a
good signal?
Check mechanicalfitting is correct
Check same signalreaches ECU
YesNo
Renew sensor Continuity of wiring tothrottle actuator
Throttle actuatorresistance or
operation checks
The system can be ‘roadtested’ on a securewheel free ramp to
check operation
Cruise control systems diagnostic chart
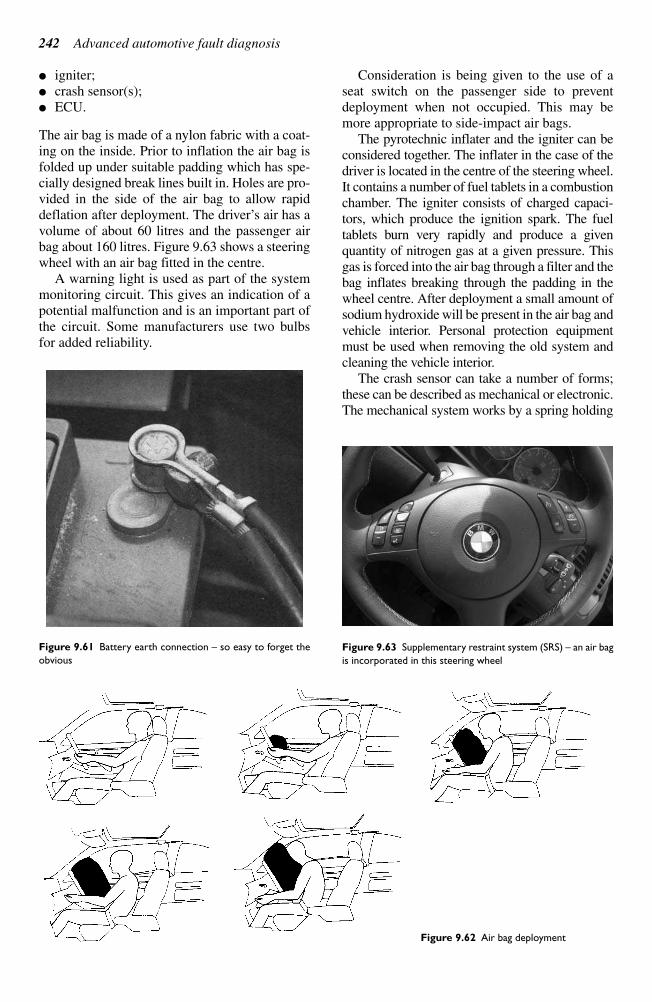
igniter;
crash sensor(s);
ECU.
The air bag is made of a nylon fabric with a coat-
ing on the inside. Prior to inflation the air bag is
folded up under suitable padding which has spe-
cially designed break lines built in. Holes are pro-
vided in the side of the air bag to allow rapid
deflation after deployment. The driver’s air has avolume of about 60 litres and the passenger airbag about 160 litres. Figure 9.63 shows a steeringwheel with an air bag fitted in the centre.
A warning light is used as part of the systemmonitoring circuit. This gives an indication of apotential malfunction and is an important part ofthe circuit. Some manufacturers use two bulbsfor added reliability.
Consideration is being given to the use of aseat switch on the passenger side to preventdeployment when not occupied. This may bemore appropriate to side-impact air bags.
The pyrotechnic inflater and the igniter can beconsidered together. The inflater in the case of thedriver is located in the centre of the steering wheel.It contains a number of fuel tablets in a combustionchamber. The igniter consists of charged capaci-tors, which produce the ignition spark. The fueltablets burn very rapidly and produce a givenquantity of nitrogen gas at a given pressure. Thisgas is forced into the air bag through a filter and thebag inflates breaking through the padding in thewheel centre. After deployment a small amount ofsodium hydroxide will be present in the air bag andvehicle interior. Personal protection equipmentmust be used when removing the old system andcleaning the vehicle interior.
The crash sensor can take a number of forms;these can be described as mechanical or electronic.The mechanical system works by a spring holding
242 Advanced automotive fault diagnosis
Figure 9.61 Battery earth connection – so easy to forget the
obvious
Figure 9.62 Air bag deployment
Figure 9.63 Supplementary restraint system (SRS) – an air bag
is incorporated in this steering wheel
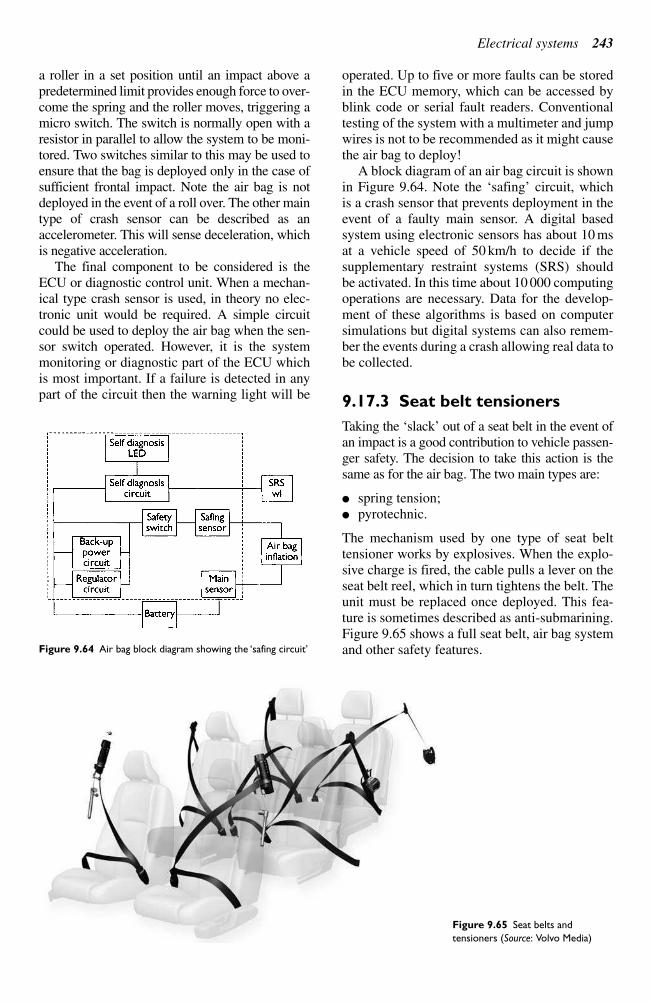
a roller in a set position until an impact above a
predetermined limit provides enough force to over-
come the spring and the roller moves, triggering a
micro switch. The switch is normally open with a
resistor in parallel to allow the system to be moni-
tored. Two switches similar to this may be used to
ensure that the bag is deployed only in the case of
sufficient frontal impact. Note the air bag is not
deployed in the event of a roll over. The other main
type of crash sensor can be described as an
accelerometer. This will sense deceleration, which
is negative acceleration.
The final component to be considered is the
ECU or diagnostic control unit. When a mechan-
ical type crash sensor is used, in theory no elec-
tronic unit would be required. A simple circuit
could be used to deploy the air bag when the sen-
sor switch operated. However, it is the system
monitoring or diagnostic part of the ECU which
is most important. If a failure is detected in any
part of the circuit then the warning light will be
operated. Up to five or more faults can be stored
in the ECU memory, which can be accessed by
blink code or serial fault readers. Conventional
testing of the system with a multimeter and jump
wires is not to be recommended as it might cause
the air bag to deploy!
A block diagram of an air bag circuit is shown
in Figure 9.64. Note the ‘safing’ circuit, which is a crash sensor that prevents deployment in theevent of a faulty main sensor. A digital based system using electronic sensors has about 10 msat a vehicle speed of 50 km/h to decide if the supplementary restraint systems (SRS) should be activated. In this time about 10 000 computingoperations are necessary. Data for the develop-ment of these algorithms is based on computersimulations but digital systems can also remem-ber the events during a crash allowing real data tobe collected.
9.17.3 Seat belt tensioners
Taking the ‘slack’ out of a seat belt in the event ofan impact is a good contribution to vehicle passen-ger safety. The decision to take this action is thesame as for the air bag. The two main types are:
spring tension; pyrotechnic.
The mechanism used by one type of seat belt tensioner works by explosives. When the explo-sive charge is fired, the cable pulls a lever on theseat belt reel, which in turn tightens the belt. Theunit must be replaced once deployed. This fea-ture is sometimes described as anti-submarining.Figure 9.65 shows a full seat belt, air bag systemand other safety features.
Electrical systems 243
Figure 9.64 Air bag block diagram showing the ‘safing circuit’
Figure 9.65 Seat belts and
tensioners (Source: Volvo Media)
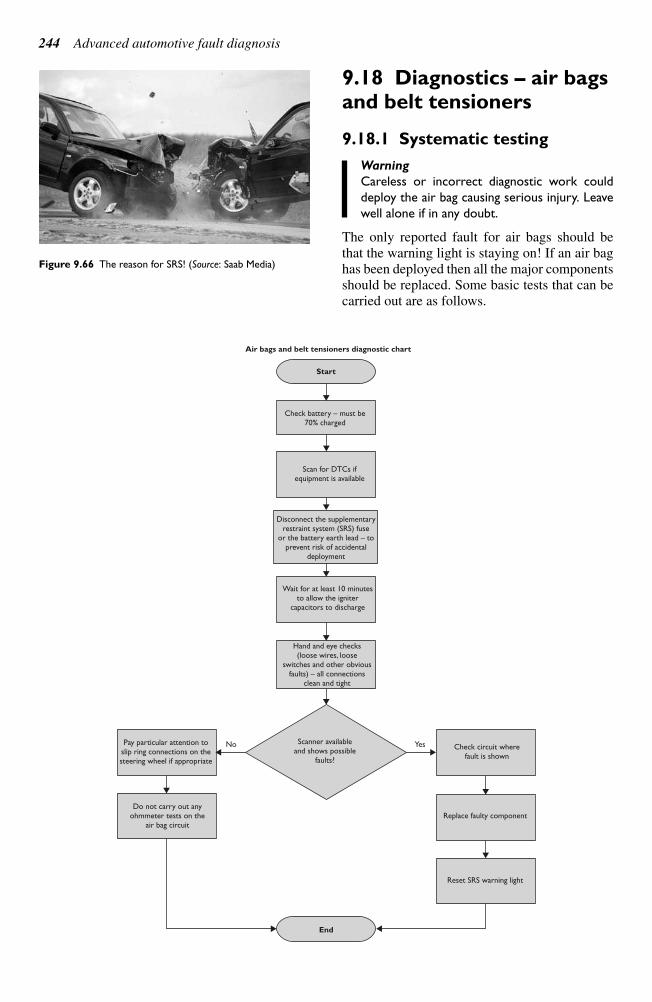
9.18 Diagnostics – air bagsand belt tensioners
9.18.1 Systematic testing
Warning
Careless or incorrect diagnostic work could
deploy the air bag causing serious injury. Leave
well alone if in any doubt.
The only reported fault for air bags should be
that the warning light is staying on! If an air bag
has been deployed then all the major components
should be replaced. Some basic tests that can be
carried out are as follows.
244 Advanced automotive fault diagnosis
Check battery – must be70% charged
Start
Air bags and belt tensioners diagnostic chart
End
Scan for DTCs ifequipment is available
Disconnect the supplementaryrestraint system (SRS) fuse
or the battery earth lead – toprevent risk of accidental
deployment
Wait for at least 10 minutesto allow the igniter
capacitors to discharge
Hand and eye checks(loose wires, loose
switches and other obviousfaults) – all connections
clean and tight
Scanner availableand shows possible
faults?
Check circuit wherefault is shown
YesNo
Replace faulty component
Reset SRS warning light
Pay particular attention toslip ring connections on thesteering wheel if appropriate
Do not carry out anyohmmeter tests on the
air bag circuit
Figure 9.66 The reason for SRS! (Source: Saab Media)
Warning
Do not carry out any electrical tests on the air
bag circuit.
9.18.2 Air bags and belt
tensioners fault diagnosis table
Symptom Possible cause
Warning light on Wiring fault
Fuse blown on removed
ECU fault
Crash sensor fault
Igniter fault
9.18.3 Deactivation and
activation procedures
Warning
Do not work on air bag circuits unless fully
trained.
Air bag simulators are required to carry out diag-
nosis and testing of the air bag system. For the
frontal air bag(s) this tool is a 2.5 resistor, used
to simulate an air bag module connection to the
system. Do not short-circuit the air bag module
connections with a jumper wire. If a jumper wire
is used to short-circuit the air bag module con-
nections, a lamp fault code will be displayed and
a diagnostic trouble code logged by the air bag
control module.
Ford recommend the following procedure for
the air bag system fitted to the Ford Focus.
Deactivation procedure
Warning
The backup power supply must be depleted,
before any work is carried out on the
supplementary restraint system. Wait at least
one minute after disconnecting the battery
ground cable. Failure to follow this instruction
could cause accidental air bag deployment and
may cause personal injury.
1. Disconnect the battery ground cable.
2. Wait one minute for the backup power supply
in the Air Bag Control Module to deplete its
stored energy.
Warning
Place the air bag module on a ground wired
bench, with the trim cover facing up to avoid
accidental deployment. Failure to follow this
instruction may result in personal injury.
3. Remove the driver air bag module from the
vehicle.
4. Connect the air bag simulator to the sub-
harness in place of the driver air bag module
at the top of the steering column.
5. Remove the passenger air bag module.
6. Connect the air bag simulator to the harness
in place of the passenger air bag module.
7. Disconnect the driver five-way under seat
connector.
8. Connect the air bag simulator to driver five-
way under seat floor harness in place of the
seat belt pretensioner and side air bag.
9. Disconnect the passenger five-way under
seat connector.
10. Connect the air bag simulator to the passen-
ger five-way under seat floor harness in place
of the seat belt pretensioner and side air bag.
11. Reconnect the battery ground cable.
Reactivation procedure
Warning
The air bag simulators must be removed and
the air bag modules reconnected when reacti-
vated to avoid non-deployment in a collision.
Failure to follow this instruction may result in
personal injury.
1. Disconnect the battery ground cable.
2. Wait one minute for the backup power sup-
ply in the Air Bag Control Module to deplete
its stored energy.
3. Remove the driver air bag simulator from the
sub-harness at the top of the steering column.
4. Reconnect and install the driver air bag module.
5. Remove the passenger air bag simulator
from the passenger air bag module harness.
6. Reconnect and install the passenger air bag
module.
7. Remove the air bag simulator from the driver
five-way under seat connector.
8. Reconnect the driver five-way under seat
connector.
9. Remove the air bag simulator from the pas-
senger five-way under seat connector.
10. Reconnect the passenger five-way under seat
connector.
11. Reconnect the battery ground cable.
12. Prove out the system, repeat the self test and
clear the fault codes.
Note: This section is included as general
guidance; however, do not assume it is relevant
to all vehicles.
Electrical systems 245

246 Advanced automotive fault diagnosis
Knowledge check questions
To use these questions, you should first try to answer them without help but if necessary, refer back to
the content of the chapter. Use notes, lists and sketches to answer them. It is not necessary to write
pages and pages of text!
1. Explain what is meant by ‘controller area network (CAN)’ and why it is used to connect ECUs or
nodes together.
2. List in a logical sequence, a series of steps to diagnose why a wiper motor operates on slow speed
but not on fast speed.
3. Describe how to check that an on/off relay is operating correctly.
4. Describe how to test the output of a road speed sensor used as part of a cruise control system.
5. Make a sketch of a fuel gauge circuit and describe how to check it for correct operation.
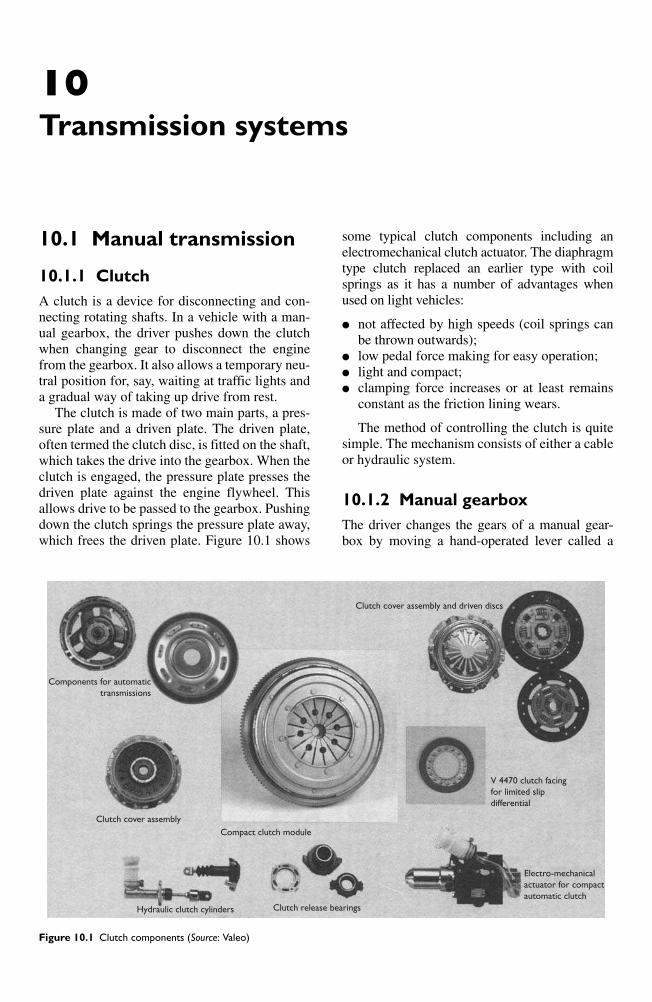
10.1 Manual transmission
10.1.1 Clutch
A clutch is a device for disconnecting and con-
necting rotating shafts. In a vehicle with a man-
ual gearbox, the driver pushes down the clutch
when changing gear to disconnect the engine
from the gearbox. It also allows a temporary neu-
tral position for, say, waiting at traffic lights and
a gradual way of taking up drive from rest.
The clutch is made of two main parts, a pres-
sure plate and a driven plate. The driven plate,
often termed the clutch disc, is fitted on the shaft,
which takes the drive into the gearbox. When the
clutch is engaged, the pressure plate presses the
driven plate against the engine flywheel. This
allows drive to be passed to the gearbox. Pushing
down the clutch springs the pressure plate away,
which frees the driven plate. Figure 10.1 shows
some typical clutch components including an
electromechanical clutch actuator. The diaphragm
type clutch replaced an earlier type with coil
springs as it has a number of advantages when
used on light vehicles:
not affected by high speeds (coil springs can
be thrown outwards);
low pedal force making for easy operation;
light and compact;
clamping force increases or at least remains
constant as the friction lining wears.
The method of controlling the clutch is quite
simple. The mechanism consists of either a cable
or hydraulic system.
10.1.2 Manual gearbox
The driver changes the gears of a manual gear-
box by moving a hand-operated lever called a
10
Transmission systems
Components for automatic
transmissions
Clutch cover assembly and driven discs
Electro-mechanical
actuator for compact
automatic clutch
V 4470 clutch facing
for limited slip
differential
Clutch cover assembly
Compact clutch module
Clutch release bearingsHydraulic clutch cylinders
Figure 10.1 Clutch components (Source: Valeo)
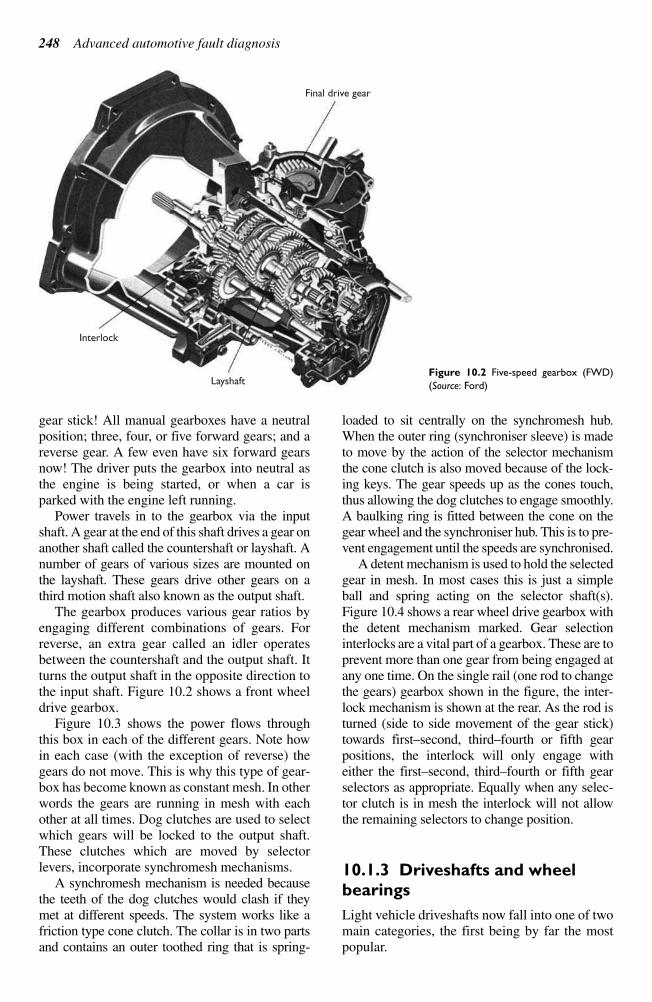
gear stick! All manual gearboxes have a neutral
position; three, four, or five forward gears; and a
reverse gear. A few even have six forward gears
now! The driver puts the gearbox into neutral as
the engine is being started, or when a car is
parked with the engine left running.
Power travels in to the gearbox via the input
shaft. A gear at the end of this shaft drives a gear on
another shaft called the countershaft or layshaft. A
number of gears of various sizes are mounted on
the layshaft. These gears drive other gears on a
third motion shaft also known as the output shaft.
The gearbox produces various gear ratios by
engaging different combinations of gears. For
reverse, an extra gear called an idler operates
between the countershaft and the output shaft. It
turns the output shaft in the opposite direction to
the input shaft. Figure 10.2 shows a front wheel
drive gearbox.
Figure 10.3 shows the power flows through
this box in each of the different gears. Note how
in each case (with the exception of reverse) the
gears do not move. This is why this type of gear-
box has become known as constant mesh. In other
words the gears are running in mesh with each
other at all times. Dog clutches are used to select
which gears will be locked to the output shaft.
These clutches which are moved by selector
levers, incorporate synchromesh mechanisms.
A synchromesh mechanism is needed because
the teeth of the dog clutches would clash if they
met at different speeds. The system works like a
friction type cone clutch. The collar is in two parts
and contains an outer toothed ring that is spring-
loaded to sit centrally on the synchromesh hub.
When the outer ring (synchroniser sleeve) is made
to move by the action of the selector mechanism
the cone clutch is also moved because of the lock-
ing keys. The gear speeds up as the cones touch,
thus allowing the dog clutches to engage smoothly.
A baulking ring is fitted between the cone on the
gear wheel and the synchroniser hub. This is to pre-
vent engagement until the speeds are synchronised.
A detent mechanism is used to hold the selected
gear in mesh. In most cases this is just a simple
ball and spring acting on the selector shaft(s).
Figure 10.4 shows a rear wheel drive gearbox with
the detent mechanism marked. Gear selection
interlocks are a vital part of a gearbox. These are to
prevent more than one gear from being engaged at
any one time. On the single rail (one rod to change
the gears) gearbox shown in the figure, the inter-
lock mechanism is shown at the rear. As the rod is
turned (side to side movement of the gear stick)
towards first–second, third–fourth or fifth gearpositions, the interlock will only engage witheither the first–second, third–fourth or fifth gearselectors as appropriate. Equally when any selec-tor clutch is in mesh the interlock will not allowthe remaining selectors to change position.
10.1.3 Driveshafts and wheel
bearings
Light vehicle driveshafts now fall into one of twomain categories, the first being by far the mostpopular.
248 Advanced automotive fault diagnosis
Final drive gear
Layshaft
Interlock
Figure 10.2 Five-speed gearbox (FWD)
(Source: Ford)
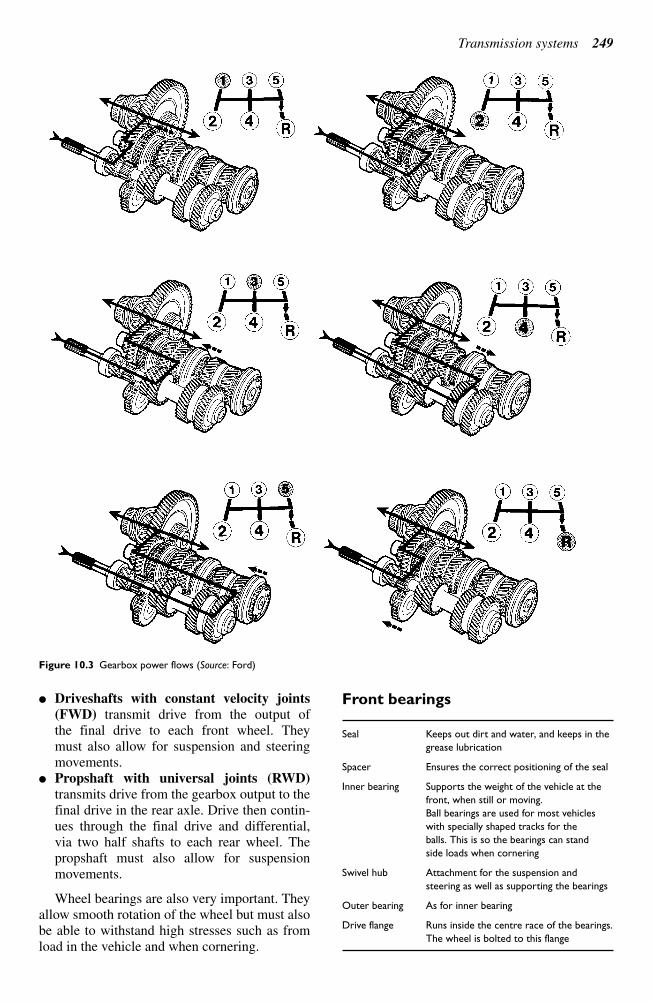
Driveshafts with constant velocity joints
(FWD) transmit drive from the output of
the final drive to each front wheel. They
must also allow for suspension and steering
movements.
Propshaft with universal joints (RWD)
transmits drive from the gearbox output to the
final drive in the rear axle. Drive then contin-
ues through the final drive and differential,
via two half shafts to each rear wheel. The
propshaft must also allow for suspension
movements.
Wheel bearings are also very important. They
allow smooth rotation of the wheel but must also
be able to withstand high stresses such as from
load in the vehicle and when cornering.
Front bearings
Seal Keeps out dirt and water, and keeps in the
grease lubrication
Spacer Ensures the correct positioning of the seal
Inner bearing Supports the weight of the vehicle at the
front, when still or moving.
Ball bearings are used for most vehicles
with specially shaped tracks for the
balls. This is so the bearings can stand
side loads when cornering
Swivel hub Attachment for the suspension and
steering as well as supporting the bearings
Outer bearing As for inner bearing
Drive flange Runs inside the centre race of the bearings.
The wheel is bolted to this flange
Transmission systems 249
Figure 10.3 Gearbox power flows (Source: Ford)
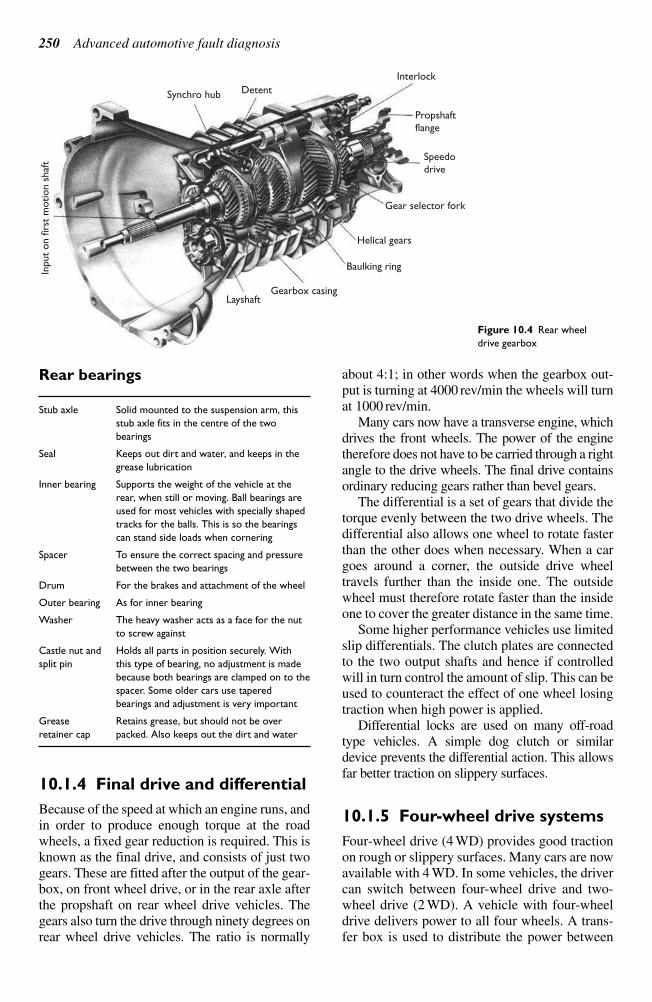
Rear bearings
Stub axle Solid mounted to the suspension arm, this
stub axle fits in the centre of the two
bearings
Seal Keeps out dirt and water, and keeps in the
grease lubrication
Inner bearing Supports the weight of the vehicle at the
rear, when still or moving. Ball bearings are
used for most vehicles with specially shaped
tracks for the balls. This is so the bearings
can stand side loads when cornering
Spacer To ensure the correct spacing and pressure
between the two bearings
Drum For the brakes and attachment of the wheel
Outer bearing As for inner bearing
Washer The heavy washer acts as a face for the nut
to screw against
Castle nut and Holds all parts in position securely. With
split pin this type of bearing, no adjustment is made
because both bearings are clamped on to the
spacer. Some older cars use tapered
bearings and adjustment is very important
Grease Retains grease, but should not be over
retainer cap packed. Also keeps out the dirt and water
10.1.4 Final drive and differential
Because of the speed at which an engine runs, and
in order to produce enough torque at the road
wheels, a fixed gear reduction is required. This is
known as the final drive, and consists of just two
gears. These are fitted after the output of the gear-
box, on front wheel drive, or in the rear axle after
the propshaft on rear wheel drive vehicles. The
gears also turn the drive through ninety degrees on
rear wheel drive vehicles. The ratio is normally
about 4:1; in other words when the gearbox out-
put is turning at 4000 rev/min the wheels will turn
at 1000 rev/min.
Many cars now have a transverse engine, which
drives the front wheels. The power of the engine
therefore does not have to be carried through a right
angle to the drive wheels. The final drive contains
ordinary reducing gears rather than bevel gears.
The differential is a set of gears that divide the
torque evenly between the two drive wheels. The
differential also allows one wheel to rotate faster
than the other does when necessary. When a car
goes around a corner, the outside drive wheel
travels further than the inside one. The outside
wheel must therefore rotate faster than the inside
one to cover the greater distance in the same time.
Some higher performance vehicles use limited
slip differentials. The clutch plates are connected
to the two output shafts and hence if controlled
will in turn control the amount of slip. This can be
used to counteract the effect of one wheel losing
traction when high power is applied.
Differential locks are used on many off-road
type vehicles. A simple dog clutch or similar
device prevents the differential action. This allows
far better traction on slippery surfaces.
10.1.5 Four-wheel drive systems
Four-wheel drive (4 WD) provides good traction
on rough or slippery surfaces. Many cars are now
available with 4 WD. In some vehicles, the driver
can switch between four-wheel drive and two-
wheel drive (2 WD). A vehicle with four-wheel
drive delivers power to all four wheels. A trans-
fer box is used to distribute the power between
250 Advanced automotive fault diagnosis
LayshaftGearbox casing
Baulking ring
Helical gears
Gear selector fork
Speedodrive
Propshaftflange
Interlock
DetentSynchro hub
Input
on fir
st m
otion s
haf
t
Figure 10.4 Rear wheel
drive gearbox
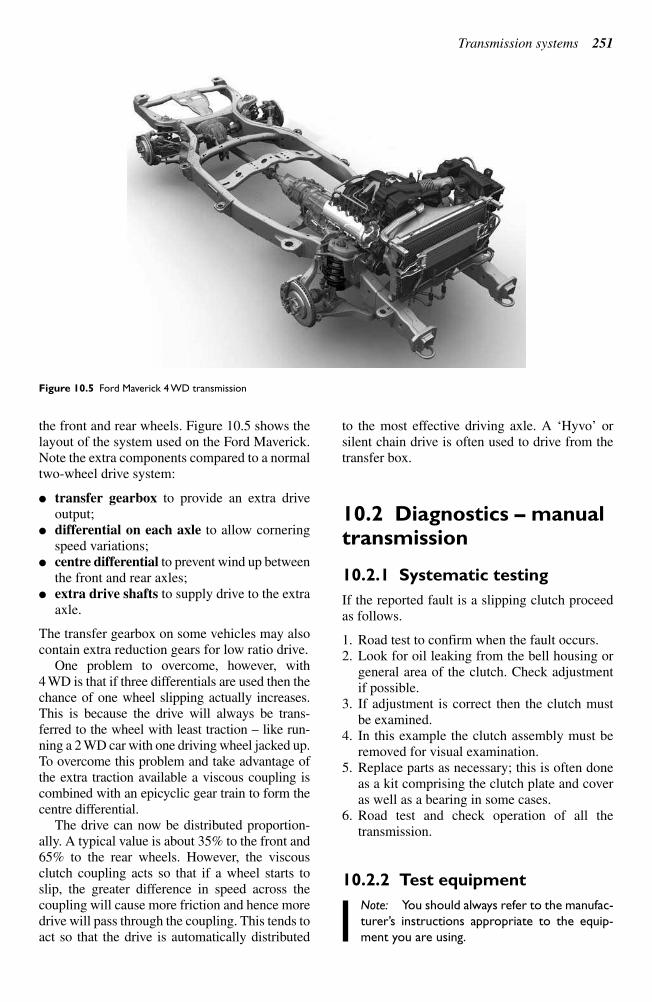
the front and rear wheels. Figure 10.5 shows the
layout of the system used on the Ford Maverick.
Note the extra components compared to a normal
two-wheel drive system:
transfer gearbox to provide an extra drive
output;
differential on each axle to allow cornering
speed variations;
centre differential to prevent wind up between
the front and rear axles;
extra drive shafts to supply drive to the extra
axle.
The transfer gearbox on some vehicles may also
contain extra reduction gears for low ratio drive.
One problem to overcome, however, with
4 WD is that if three differentials are used then the
chance of one wheel slipping actually increases.
This is because the drive will always be trans-
ferred to the wheel with least traction – like run-ning a 2 WD car with one driving wheel jacked up.To overcome this problem and take advantage ofthe extra traction available a viscous coupling iscombined with an epicyclic gear train to form thecentre differential.
The drive can now be distributed proportion-ally. A typical value is about 35% to the front and65% to the rear wheels. However, the viscousclutch coupling acts so that if a wheel starts toslip, the greater difference in speed across thecoupling will cause more friction and hence moredrive will pass through the coupling. This tends toact so that the drive is automatically distributed
to the most effective driving axle. A ‘Hyvo’ orsilent chain drive is often used to drive from thetransfer box.
10.2 Diagnostics – manualtransmission
10.2.1 Systematic testing
If the reported fault is a slipping clutch proceedas follows.
1. Road test to confirm when the fault occurs.2. Look for oil leaking from the bell housing or
general area of the clutch. Check adjustmentif possible.
3. If adjustment is correct then the clutch mustbe examined.
4. In this example the clutch assembly must beremoved for visual examination.
5. Replace parts as necessary; this is often doneas a kit comprising the clutch plate and coveras well as a bearing in some cases.
6. Road test and check operation of all the transmission.
10.2.2 Test equipment
Note: You should always refer to the manufac-
turer’s instructions appropriate to the equip-
ment you are using.
Transmission systems 251
Figure 10.5 Ford Maverick 4 WD transmission
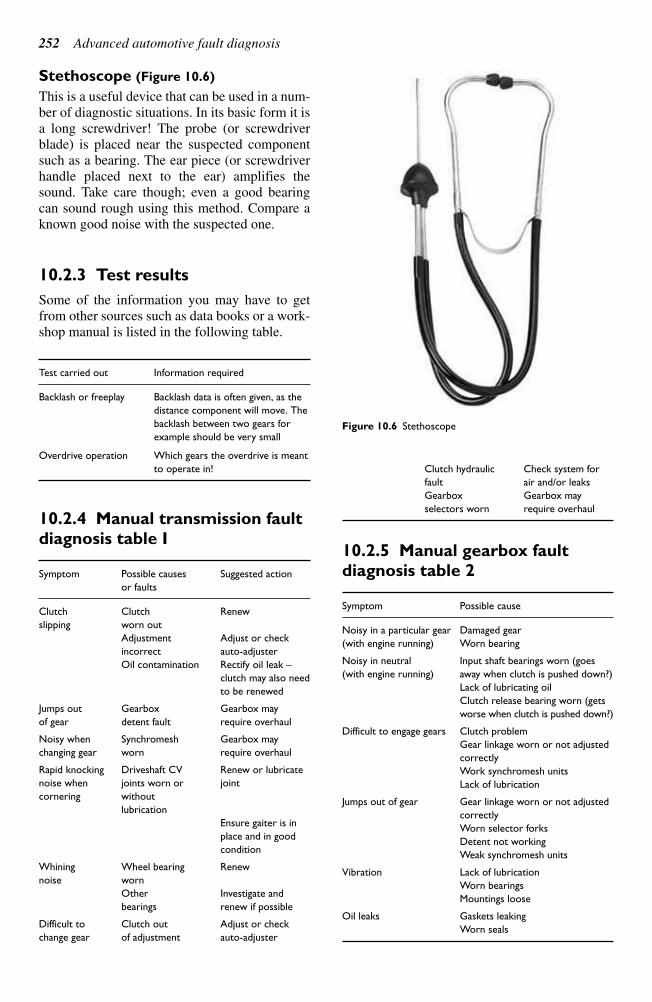
Stethoscope (Figure 10.6)
This is a useful device that can be used in a num-
ber of diagnostic situations. In its basic form it is
a long screwdriver! The probe (or screwdriver
blade) is placed near the suspected component
such as a bearing. The ear piece (or screwdriver
handle placed next to the ear) amplifies the
sound. Take care though; even a good bearing
can sound rough using this method. Compare a
known good noise with the suspected one.
10.2.3 Test results
Some of the information you may have to get
from other sources such as data books or a work-
shop manual is listed in the following table.
Test carried out Information required
Backlash or freeplay Backlash data is often given, as the
distance component will move. The
backlash between two gears for
example should be very small
Overdrive operation Which gears the overdrive is meant
to operate in!
10.2.4 Manual transmission fault
diagnosis table I
Symptom Possible causes Suggested action
or faults
Clutch Clutch Renew
slipping worn out
Adjustment Adjust or check
incorrect auto-adjuster
Oil contamination Rectify oil leak –
clutch may also need
to be renewed
Jumps out Gearbox Gearbox may
of gear detent fault require overhaul
Noisy when Synchromesh Gearbox may
changing gear worn require overhaul
Rapid knocking Driveshaft CV Renew or lubricate
noise when joints worn or joint
cornering without
lubrication
Ensure gaiter is in
place and in good
condition
Whining Wheel bearing Renew
noise worn
Other Investigate and
bearings renew if possible
Difficult to Clutch out Adjust or check
change gear of adjustment auto-adjuster
Clutch hydraulic Check system for
fault air and/or leaks
Gearbox Gearbox may
selectors worn require overhaul
10.2.5 Manual gearbox fault
diagnosis table 2
Symptom Possible cause
Noisy in a particular gear Damaged gear
(with engine running) Worn bearing
Noisy in neutral Input shaft bearings worn (goes
(with engine running) away when clutch is pushed down?)
Lack of lubricating oil
Clutch release bearing worn (gets
worse when clutch is pushed down?)
Difficult to engage gears Clutch problem
Gear linkage worn or not adjusted
correctly
Work synchromesh units
Lack of lubrication
Jumps out of gear Gear linkage worn or not adjusted
correctly
Worn selector forks
Detent not working
Weak synchromesh units
Vibration Lack of lubrication
Worn bearings
Mountings loose
Oil leaks Gaskets leaking
Worn seals
252 Advanced automotive fault diagnosis
Figure 10.6 Stethoscope
10.2.6 Clutch faults diagnosis
table
Symptom Possible cause
No pedal Broken cable
resistance Air in hydraulic system
Hydraulic seals worn
Release bearing or fork broken
Diaphragm spring broken
Clutch does As above
not disengage Disc sticking in gearbox splines
Disc sticking to flywheel
Faulty pressure plate
Clutch slip Incorrect adjustment
Worn disc linings
Contaminated linings (oil or grease)
Faulty pressure plate
Judder when Contaminated linings (oil or grease)
engaging Worn disc linings
Distorted or worn pressure plate
Engine mountings worn, loose or broken
Clutch disc hub splines worn
Noisy Broken components
operation Release bearing seized
Disc cushioning springs broken
Snatching Disc cushioning springs broken
Operating mechanism sticking (lubrication?)
10.2.7 Drive shafts fault
diagnosis table
Symptom Possible cause
Vibration Incorrect alignment of propshaft joints
Worn universal or CV joints
Bent shaft
Mountings worn
Grease leaking Gaiters split or clips loose
Knocking noises Dry joints
Worn CV joints (gets worse on tight
corners)
10.2.8 Final drive fault diagnosis
table
Symptom Possible cause
Oil leaks Gaskets split
Driveshaft oil seals
Final drive output bearings worn
(drive-shafts drop and cause leaks)
Noisy operation Low oil level
Incorrect preload adjustment
Bearings worn
Whining noise Low oil level
Worn differential gears
10.3 Automatic transmission
10.3.1 Introduction
An automatic gearbox contains special devices
that automatically provide various gear ratios, as
they are needed. Most automatic gearboxes have
three or four forward gears and reverse. Instead
of a gearstick, the driver moves a lever called a
selector. Most automatic gearboxes now have
selector positions for park, neutral, reverse, drive, 2
and 1 (or 3, 2 and 1 in some cases). The engine will
only start if the selector is in either the park or neu-
tral position. In park, the drive shaft is locked so
that the drive wheels cannot move. It is now quite
common when the engine is running to be able to
move the selector out of park only if you are press-
ing the brake pedal. This is a very good safety fea-
ture as it prevents sudden movement of the vehicle.
For ordinary driving, the driver moves the
selector to the drive position. The transmission
starts out in the lowest gear and automatically
shifts into higher gears as the car picks up speed.
The driver can use the lower positions of the gear-
box for going up or down steep hills or driving
through mud or snow. When in position 3, 2, or 1,
the gearbox will not change above the lowest gear
specified.
10.3.2 Torque converter
operation
The torque converter is a device that almost all
automatic transmissions now use. It delivers power
from the engine to the gearbox like a basic fluid
flywheel but also increases the torque when the car
begins to move. The torque converter resembles a
large doughnut sliced in half. One half, called the
pump impeller, is bolted to the drive plate or fly-
wheel. The other half, called the turbine, is con-
nected to the gearbox-input shaft. Each half is
lined with vanes or blades. The pump and the tur-
bine face each other in a case filled with oil. A
bladed wheel called a stator is fitted between them.
The engine causes the pump to rotate and
throw oil against the vanes of the turbine. The
force of the oil makes the turbine rotate and send
power to the transmission. After striking the tur-
bine vanes, the oil passes through the stator and
returns to the pump. When the pump reaches a
specific rate of rotation, a reaction between the oil
and the stator increases the torque. In a fluid fly-
wheel oil returning to the impeller tends to slow it
Transmission systems 253
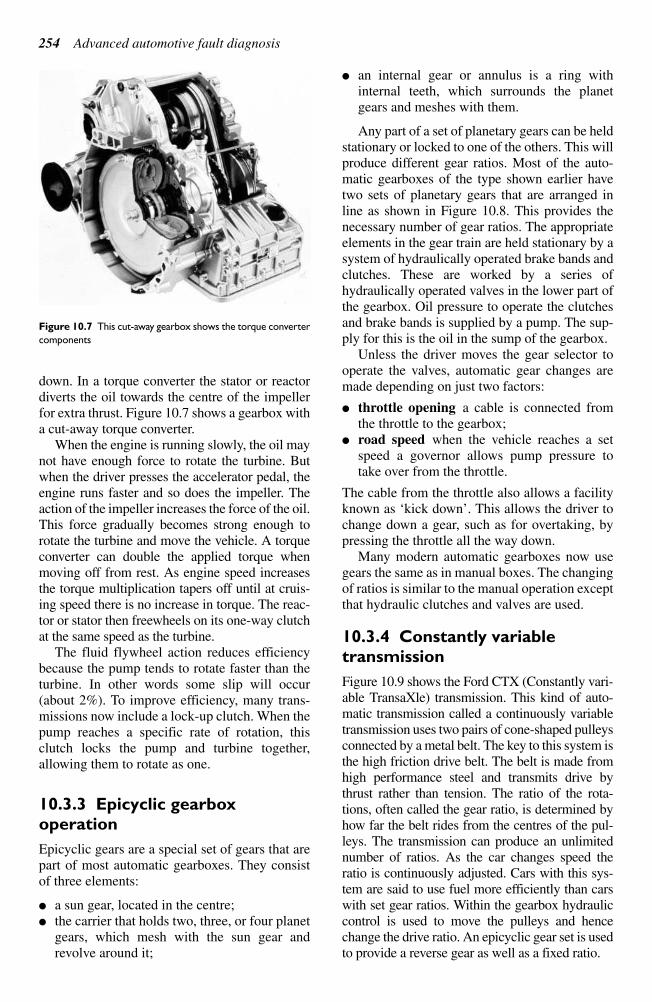
down. In a torque converter the stator or reactor
diverts the oil towards the centre of the impeller
for extra thrust. Figure 10.7 shows a gearbox with
a cut-away torque converter.
When the engine is running slowly, the oil may
not have enough force to rotate the turbine. But
when the driver presses the accelerator pedal, the
engine runs faster and so does the impeller. The
action of the impeller increases the force of the oil.
This force gradually becomes strong enough to
rotate the turbine and move the vehicle. A torque
converter can double the applied torque when
moving off from rest. As engine speed increases
the torque multiplication tapers off until at cruis-
ing speed there is no increase in torque. The reac-
tor or stator then freewheels on its one-way clutch
at the same speed as the turbine.
The fluid flywheel action reduces efficiency
because the pump tends to rotate faster than the
turbine. In other words some slip will occur
(about 2%). To improve efficiency, many trans-
missions now include a lock-up clutch. When the
pump reaches a specific rate of rotation, this
clutch locks the pump and turbine together,
allowing them to rotate as one.
10.3.3 Epicyclic gearbox
operation
Epicyclic gears are a special set of gears that are
part of most automatic gearboxes. They consist
of three elements:
a sun gear, located in the centre;
the carrier that holds two, three, or four planet
gears, which mesh with the sun gear and
revolve around it;
an internal gear or annulus is a ring with
internal teeth, which surrounds the planet
gears and meshes with them.
Any part of a set of planetary gears can be held
stationary or locked to one of the others. This will
produce different gear ratios. Most of the auto-
matic gearboxes of the type shown earlier have
two sets of planetary gears that are arranged in
line as shown in Figure 10.8. This provides the
necessary number of gear ratios. The appropriate
elements in the gear train are held stationary by a
system of hydraulically operated brake bands and
clutches. These are worked by a series of
hydraulically operated valves in the lower part of
the gearbox. Oil pressure to operate the clutches
and brake bands is supplied by a pump. The sup-
ply for this is the oil in the sump of the gearbox.
Unless the driver moves the gear selector to
operate the valves, automatic gear changes are
made depending on just two factors:
throttle opening a cable is connected from
the throttle to the gearbox;
road speed when the vehicle reaches a set
speed a governor allows pump pressure to
take over from the throttle.
The cable from the throttle also allows a facility
known as ‘kick down’. This allows the driver tochange down a gear, such as for overtaking, bypressing the throttle all the way down.
Many modern automatic gearboxes now usegears the same as in manual boxes. The changingof ratios is similar to the manual operation exceptthat hydraulic clutches and valves are used.
10.3.4 Constantly variable
transmission
Figure 10.9 shows the Ford CTX (Constantly vari-able TransaXle) transmission. This kind of auto-matic transmission called a continuously variabletransmission uses two pairs of cone-shaped pulleysconnected by a metal belt. The key to this system isthe high friction drive belt. The belt is made fromhigh performance steel and transmits drive bythrust rather than tension. The ratio of the rota-tions, often called the gear ratio, is determined byhow far the belt rides from the centres of the pul-leys. The transmission can produce an unlimitednumber of ratios. As the car changes speed theratio is continuously adjusted. Cars with this sys-tem are said to use fuel more efficiently than carswith set gear ratios. Within the gearbox hydrauliccontrol is used to move the pulleys and hencechange the drive ratio. An epicyclic gear set is usedto provide a reverse gear as well as a fixed ratio.
254 Advanced automotive fault diagnosis
Figure 10.7 This cut-away gearbox shows the torque converter
components
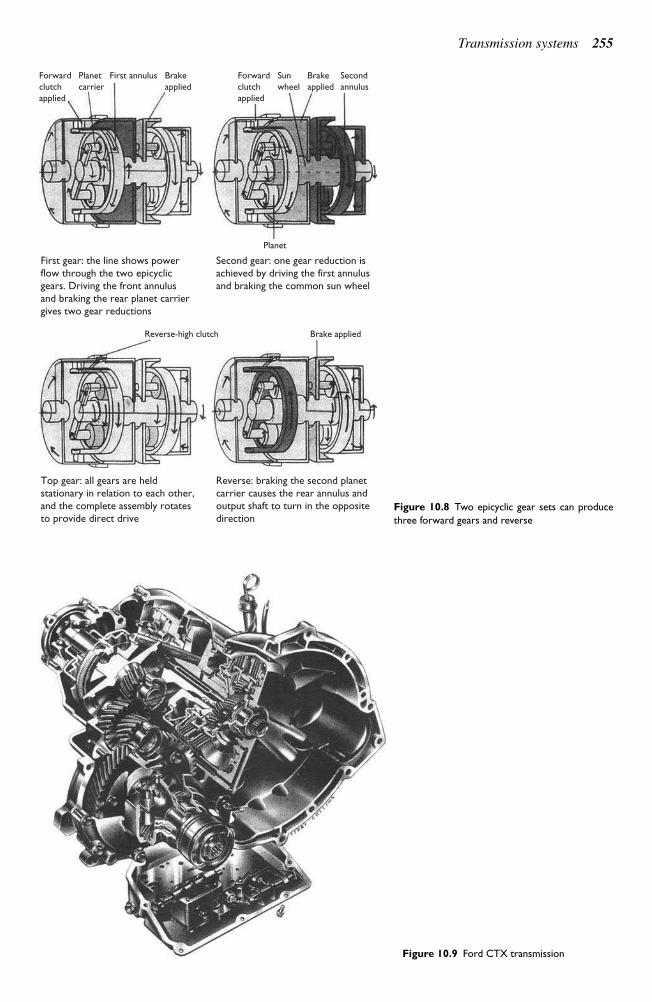
Transmission systems 255
First gear: the line shows powerflow through the two epicyclic gears. Driving the front annulusand braking the rear planet carriergives two gear reductions
Second gear: one gear reduction isachieved by driving the first annulusand braking the common sun wheel
Planet
Reverse-high clutch Brake applied
Top gear: all gears are heldstationary in relation to each other,and the complete assembly rotatesto provide direct drive
Reverse: braking the second planetcarrier causes the rear annulus andoutput shaft to turn in the oppositedirection
Forward
clutch
applied
Planet
carrier
First annulus Brake
applied
Forward
clutch
applied
Sun
wheel
Second
annulus
Brake
applied
Figure 10.8 Two epicyclic gear sets can produce
three forward gears and reverse
Figure 10.9 Ford CTX transmission
10.3.5 Electronic control of
transmission
The main aim of electronically controlled auto-
matic transmission (ECAT) is to improve on con-
ventional automatic transmission in the following
ways:
gear changes should be smoother and quieter;
improved performance;
reduced fuel consumption;
reduction of characteristic changes over sys-
tem life;
increased reliability.
The important points to remember are that
gear changes and lock-up of the torque converter
are controlled by hydraulic pressure. In an ECAT
system electrically controlled solenoid valves can
influence this hydraulic pressure. Most ECAT
systems now have a transmission ECU that is in
communication with the engine control ECU.
With an ECAT system the actual point of
gearshift is determined from pre-programmed
memory within the ECU. Data from other sen-
sors is also taken into consideration. Actual
gearshifts are initiated by changes in hydraulic
pressure, which is controlled by solenoid valves.
The two main control functions of this system
are hydraulic pressure and engine torque. A tem-
porary reduction in engine torque during gear
shifting allows smooth operation. This is because
the peak of gearbox output torque which causes
the characteristic surge during gear changes on
conventional automatics is suppressed. Because
of these control functions smooth gearshifts are
possible and, due to the learning ability of some
ECUs, the characteristics remain throughout the
life of the system.
The ability to lock-up the torque converter has
been used for some time even on vehicles with
more conventional automatic transmission. This
gives better fuel economy, quietness and improved
driveability. Lock-up is carried out using a
hydraulic valve, which can be operated gradually
to produce a smooth transition. The timing of lock-
up is determined from ECU memory in terms of
the vehicle speed and acceleration.
10.3.6 Semi-automatic
transmission
A number of different types of semi-automatic
transmission are either in use or under develop-
ment. An interesting system is the electronically
controlled clutch. This technology is a spin off
from formula 1 and top rally cars. The electronic
clutch was developed for these racing vehicles to
improve the get away performance and speed of
gear changes.
For production vehicles a system has been
developed which can interpret the driver’s inten-tion. With greater throttle openings the clutchoperation changes to prevent abuse and drivelinedamage. Electrical control of the clutch releasebearing position is by a solenoid actuator or elec-tric motor with worm gear reduction. This allowsthe time to reach the ideal take off position to bereduced and the ability of the clutch to transmittorque to be improved.
This technique has now been developed to thestage where it will operate the clutch automat-ically as the stick is moved to change gear. Sensorsare fitted to monitor engine and road speed as wellas gear position. The Ferrari Mondiale uses a sys-tem similar to the one described here.
10.4 Diagnostics – automatic transmission
10.4.1 Systematic testing
If the reported fault is that the kick down doesnot operate proceed as follows.
1. Road test to confirm the problem.2. Is the problem worse when the engine is hot?
Check the transmission fluid level! Has workbeen done to the engine?
3. If fluid level is correct then you must investi-gate further. Work on the engine may havedisturbed the kick down cable.
4. Check the adjustment/fitting of the kick downcable.
5. Adjust if incorrect.6. Run and repeat road test.
10.4.2 Test equipment
Note: You should always refer to the manufac-
turer’s instructions appropriate to the equip-
ment you are using.
Revcounter
A revcounter may be used during a stall test tocheck the operation of the torque converter andthe automatic gearbox.
256 Advanced automotive fault diagnosis
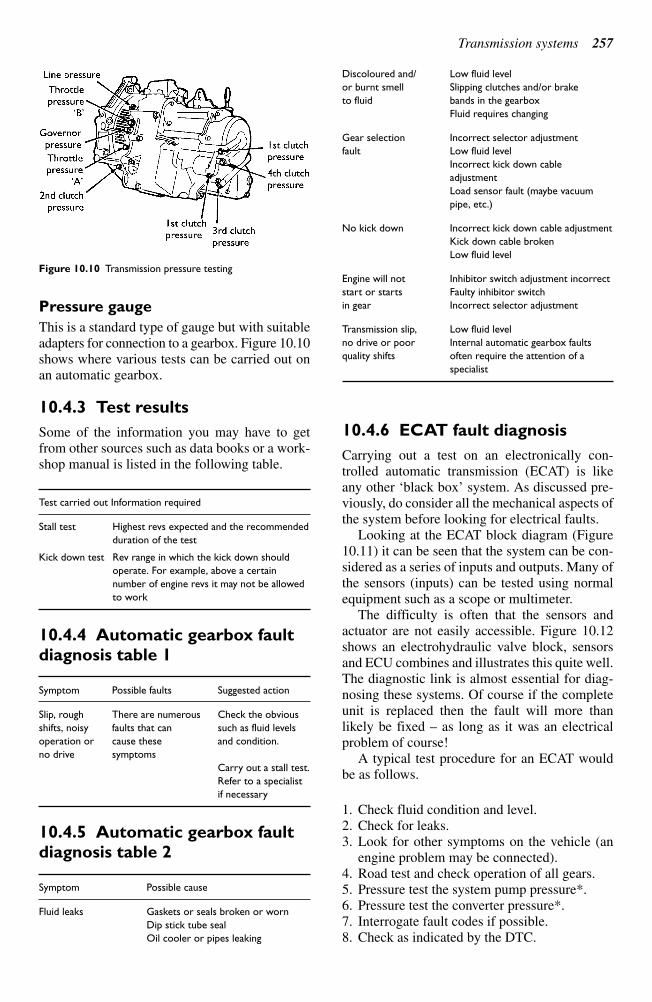
Pressure gauge
This is a standard type of gauge but with suitable
adapters for connection to a gearbox. Figure 10.10
shows where various tests can be carried out on
an automatic gearbox.
10.4.3 Test results
Some of the information you may have to get
from other sources such as data books or a work-
shop manual is listed in the following table.
Test carried out Information required
Stall test Highest revs expected and the recommended
duration of the test
Kick down test Rev range in which the kick down should
operate. For example, above a certain
number of engine revs it may not be allowed
to work
10.4.4 Automatic gearbox fault
diagnosis table 1
Symptom Possible faults Suggested action
Slip, rough There are numerous Check the obvious
shifts, noisy faults that can such as fluid levels
operation or cause these and condition.
no drive symptoms
Carry out a stall test.
Refer to a specialist
if necessary
10.4.5 Automatic gearbox fault
diagnosis table 2
Symptom Possible cause
Fluid leaks Gaskets or seals broken or worn
Dip stick tube seal
Oil cooler or pipes leaking
Discoloured and/ Low fluid level
or burnt smell Slipping clutches and/or brake
to fluid bands in the gearbox
Fluid requires changing
Gear selection Incorrect selector adjustment
fault Low fluid level
Incorrect kick down cable
adjustment
Load sensor fault (maybe vacuum
pipe, etc.)
No kick down Incorrect kick down cable adjustment
Kick down cable broken
Low fluid level
Engine will not Inhibitor switch adjustment incorrect
start or starts Faulty inhibitor switch
in gear Incorrect selector adjustment
Transmission slip, Low fluid level
no drive or poor Internal automatic gearbox faults
quality shifts often require the attention of a
specialist
10.4.6 ECAT fault diagnosis
Carrying out a test on an electronically con-
trolled automatic transmission (ECAT) is like
any other ‘black box’ system. As discussed pre-viously, do consider all the mechanical aspects ofthe system before looking for electrical faults.
Looking at the ECAT block diagram (Figure10.11) it can be seen that the system can be con-sidered as a series of inputs and outputs. Many ofthe sensors (inputs) can be tested using normalequipment such as a scope or multimeter.
The difficulty is often that the sensors andactuator are not easily accessible. Figure 10.12shows an electrohydraulic valve block, sensorsand ECU combines and illustrates this quite well.The diagnostic link is almost essential for diag-nosing these systems. Of course if the completeunit is replaced then the fault will more thanlikely be fixed – as long as it was an electricalproblem of course!
A typical test procedure for an ECAT wouldbe as follows.
1. Check fluid condition and level.2. Check for leaks.3. Look for other symptoms on the vehicle (an
engine problem may be connected).4. Road test and check operation of all gears.5. Pressure test the system pump pressure*.6. Pressure test the converter pressure*.7. Interrogate fault codes if possible.8. Check as indicated by the DTC.
Transmission systems 257
Figure 10.10 Transmission pressure testing
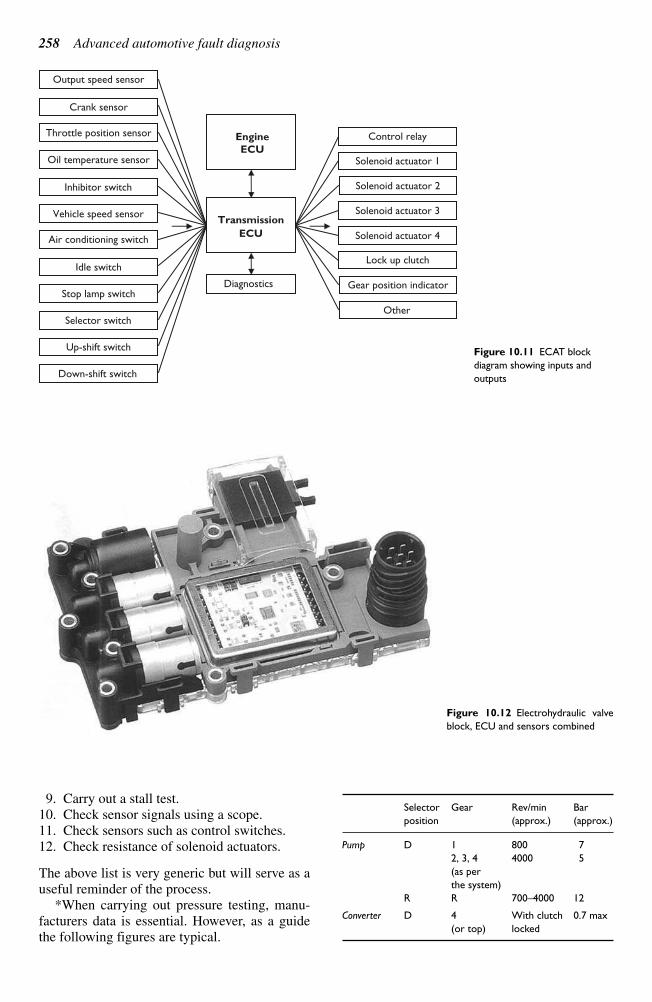
9. Carry out a stall test.
10. Check sensor signals using a scope.
11. Check sensors such as control switches.
12. Check resistance of solenoid actuators.
The above list is very generic but will serve as a
useful reminder of the process.
*When carrying out pressure testing, manu-
facturers data is essential. However, as a guide
the following figures are typical.
Selector Gear Rev/min Bar
position (approx.) (approx.)
Pump D 1 800 7
2, 3, 4 4000 5
(as per
the system)
R R 700–4000 12
Converter D 4 With clutch 0.7 max
(or top) locked
258 Advanced automotive fault diagnosis
Control relay
Transmission
ECU
Output speed sensor
Crank sensor
Throttle position sensor
Oil temperature sensor
Inhibitor switch
Vehicle speed sensor
Solenoid actuator 1
Solenoid actuator 2
Solenoid actuator 3
Solenoid actuator 4
Lock up clutch
Air conditioning switch
Idle switch
Stop lamp switch
Selector switch
Up-shift switch
Down-shift switch
Gear position indicator
Other
Engine
ECU
Diagnostics
Figure 10.11 ECAT block
diagram showing inputs and
outputs
Figure 10.12 Electrohydraulic valve
block, ECU and sensors combined
10.4.7 Automatic transmission –
stall test
To assist with the diagnosis of automatic trans-
mission faults a stall test is often used. The dur-
ation of a stall test must not be more than about
seven seconds. You should also allow at least two
minutes before repeating the test. Refer to manu-
facturer’s recommendations if necessary.
Warning
If the precautions mentioned are not observed,
the gearbox will overheat.
The function of this test is to determine the cor-rect operation of the torque converter and that
there is no transmission clutch slip. Proceed asfollows.
1. Run engine up to normal operating tempera-ture by road test if possible.
2. Check transmission fluid level and adjust ifnecessary.
3. Connect a revcounter to the engine.4. Apply handbrake and chock the wheels.5. Apply foot brake, select ‘D’ and fully press
down the throttle for about seven seconds.6. Note the highest rev/min obtained (2500 to
2750 is a typically acceptable range).7. Allow two minutes for cooling and then
repeat the test in ‘2’ and ‘R’.
Transmission systems 259
Knowledge check questions
To use these questions, you should first try to answer them without help but if necessary, refer back to
the content of the chapter. Use notes, lists and sketches to answer them. It is not necessary to write
pages and pages of text!
1. Describe how to use a road test to diagnose a suspected CV joint fault.
2. Explain why a stall test may be used to diagnose automatic transmission faults.
3. List in a logical sequence, a procedure for checking the operation of an electronically controlled auto-
matic transmission.
4. Describe a procedure used to test for a slipping clutch.
5. Describe a series of steps that could be used to diagnose the source of a ‘rumbling’ noise from a trans-
mission system.
11.1 Introduction
11.1.1 Overview
If like me you continue to be fascinated by the
technology of the automobile, then you will also
be interested in the future technology. Figure 11.1
is an illustration of how technology has developed
and perhaps how it will continue to do so.
To keep up to date you will have to keep learn-
ing! But remember, the way in which you apply
your knowledge is just as important as the know-
ledge itself. Logic is the key to diagnostics.
This final chapter includes some general infor-
mation about web resources and software but also
gives an overview of diagnostics to date – andpossible future developments.
11.1.2 The future of diagnostics
What does the pace of technology change meanfor the diagnostic technician?
On-board diagnostics will continue to developbut there will always be a need for the highlyskilled diagnostic technician. In the recent past,due to the cost and complexity of some equip-ment, only the large main dealers could afford it.However, it is now possible to buy excellent scan-ning or code reading equipment for just a fewhundred pounds/dollars. If you continue to keep
up to date with the technology, learn how to usegood quality basic test and scanning equipment,and apply the diagnostic processes highlighted inthis book, you will never be short of work!
11.2 Web contacts
11.2.1 Introduction
Like almost everybody, you are no doubt alreadyinterested in the Internet and the World WideWeb. In this short section I have highlightedsome of the resources available to you on the net.
All the major vehicle manufacturers have webpages as do most of the parts suppliers. There areuser groups, forums for discussions and manyother sources of information, or lets admit it –sites that are just good fun! So go ahead and surfthe net. I would be most pleased to meet you atmy site where you will find up to date informa-tion about my books, new technologies and linksto just about everywhere (Figure 11.3). Just pointyour browser to: www.automotive-technology.co.uk
All the links in the next section can be accessedfrom here as well as many more. It will also be keptup-to-date as I find more interesting places to visit.Please let me know if you have any suggestions foruseful links – I am mostly interested in sites that
11
Conclusion, web resources and developments
Figure 11.1 Technological
developments
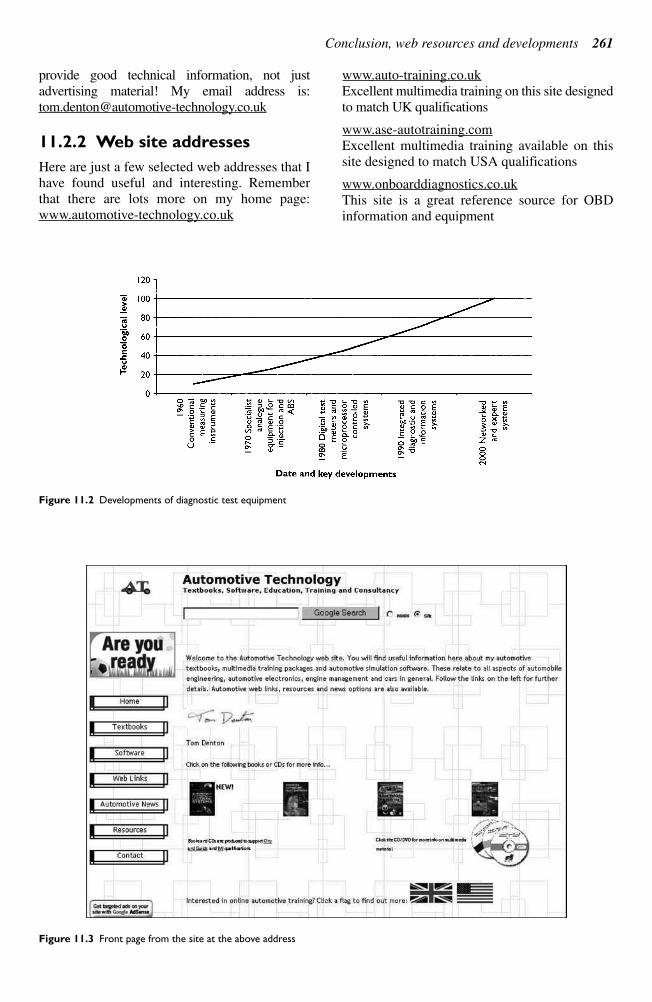
Conclusion, web resources and developments 261
provide good technical information, not just
advertising material! My email address is:
11.2.2 Web site addresses
Here are just a few selected web addresses that I
have found useful and interesting. Remember
that there are lots more on my home page:
www.automotive-technology.co.uk
www.auto-training.co.uk
Excellent multimedia training on this site designed
to match UK qualifications
www.ase-autotraining.com
Excellent multimedia training available on this
site designed to match USA qualifications
www.onboarddiagnostics.co.uk
This site is a great reference source for OBD
information and equipment
Figure 11.2 Developments of diagnostic test equipment
Figure 11.3 Front page from the site at the above address
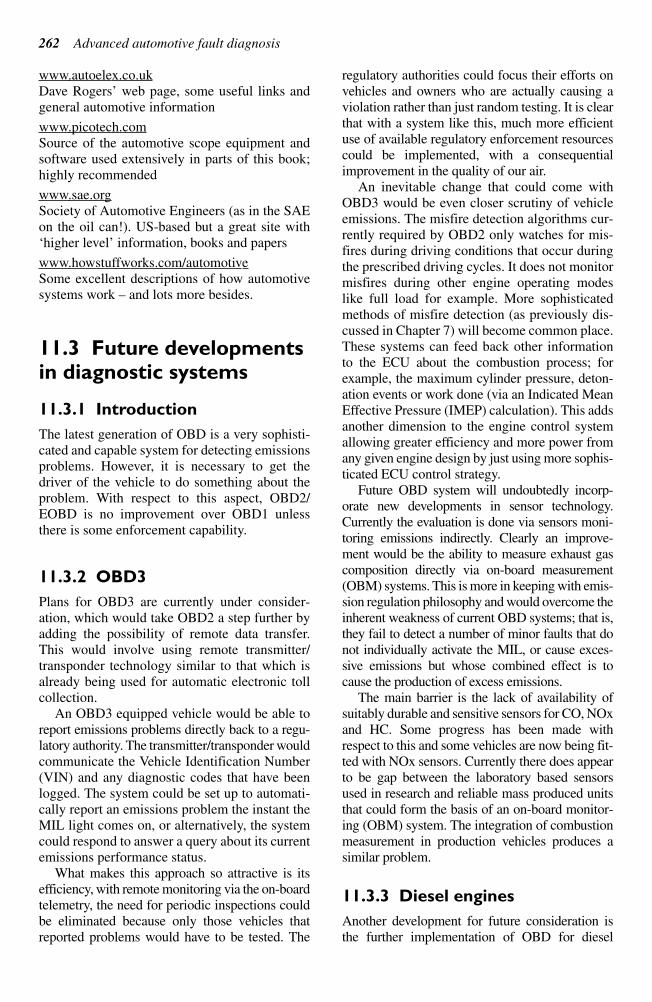
www.autoelex.co.uk
Dave Rogers’ web page, some useful links andgeneral automotive information
www.picotech.comSource of the automotive scope equipment andsoftware used extensively in parts of this book;highly recommended
www.sae.orgSociety of Automotive Engineers (as in the SAEon the oil can!). US-based but a great site with‘higher level’ information, books and papers
www.howstuffworks.com/automotiveSome excellent descriptions of how automotivesystems work – and lots more besides.
11.3 Future developmentsin diagnostic systems
11.3.1 Introduction
The latest generation of OBD is a very sophisti-cated and capable system for detecting emissionsproblems. However, it is necessary to get thedriver of the vehicle to do something about theproblem. With respect to this aspect, OBD2/EOBD is no improvement over OBD1 unlessthere is some enforcement capability.
11.3.2 OBD3
Plans for OBD3 are currently under consider-ation, which would take OBD2 a step further byadding the possibility of remote data transfer.This would involve using remote transmitter/transponder technology similar to that which isalready being used for automatic electronic tollcollection.
An OBD3 equipped vehicle would be able toreport emissions problems directly back to a regu-latory authority. The transmitter/transponder wouldcommunicate the Vehicle Identification Number(VIN) and any diagnostic codes that have beenlogged. The system could be set up to automati-cally report an emissions problem the instant theMIL light comes on, or alternatively, the systemcould respond to answer a query about its currentemissions performance status.
What makes this approach so attractive is itsefficiency, with remote monitoring via the on-boardtelemetry, the need for periodic inspections couldbe eliminated because only those vehicles thatreported problems would have to be tested. The
regulatory authorities could focus their efforts onvehicles and owners who are actually causing aviolation rather than just random testing. It is clearthat with a system like this, much more efficientuse of available regulatory enforcement resourcescould be implemented, with a consequentialimprovement in the quality of our air.
An inevitable change that could come withOBD3 would be even closer scrutiny of vehicleemissions. The misfire detection algorithms cur-rently required by OBD2 only watches for mis-fires during driving conditions that occur duringthe prescribed driving cycles. It does not monitormisfires during other engine operating modeslike full load for example. More sophisticatedmethods of misfire detection (as previously dis-cussed in Chapter 7) will become common place.These systems can feed back other informationto the ECU about the combustion process; forexample, the maximum cylinder pressure, deton-ation events or work done (via an Indicated MeanEffective Pressure (IMEP) calculation). This addsanother dimension to the engine control systemallowing greater efficiency and more power fromany given engine design by just using more sophis-ticated ECU control strategy.
Future OBD system will undoubtedly incorp-orate new developments in sensor technology.Currently the evaluation is done via sensors moni-toring emissions indirectly. Clearly an improve-ment would be the ability to measure exhaust gascomposition directly via on-board measurement(OBM) systems. This is more in keeping with emis-sion regulation philosophy and would overcome theinherent weakness of current OBD systems; that is,they fail to detect a number of minor faults that donot individually activate the MIL, or cause exces-sive emissions but whose combined effect is tocause the production of excess emissions.
The main barrier is the lack of availability ofsuitably durable and sensitive sensors for CO, NOxand HC. Some progress has been made withrespect to this and some vehicles are now being fit-ted with NOx sensors. Currently there does appearto be gap between the laboratory based sensorsused in research and reliable mass produced unitsthat could form the basis of an on-board monitor-ing (OBM) system. The integration of combustionmeasurement in production vehicles produces asimilar problem.
11.3.3 Diesel engines
Another development for future consideration isthe further implementation of OBD for diesel
262 Advanced automotive fault diagnosis
engines. As diesel engine technology becomes
more sophisticated, so does the requirement for
OBD. In addition, emission legislation is driving
more sophisticated requirements for after treat-
ment of exhaust gas. All of these sub-systems are to
be subjected to checking via the OBD system and
present their own specific challenges. For example,
the monitoring of exhaust after treatment systems
(particulate filters and catalysts) in addition to
more complex EGR and air management systems.
11.3.4 Rate based monitoring
Rate based monitoring will be more significant for
future systems which allows in-use performance
ratio information to be logged. It is a standardised
method of measuring monitoring frequency and
filters out the affect of short trips, infrequent jour-
neys etc. as factors which could affect the OBD
logging and reactions. It is an essential part of the
evaluation where driving habits or patterns are not
known and it ensures that monitors run efficiently
in use and detect faults in a timely and appropriate
manner. It is defined as:
Minimum frequency N/D
Where N number of times a monitor has run,
D number of times vehicle has been operated.
11.3.5 Model based development
A significant factor in the development of any
future system will be the implementation of the
latest technologies with respect to hardware and
software development. Model based development
and calibration of the system will dramatically
reduce the testing time by reducing the number of
test iterations required. This technique is quite
common for developing engine specific calibra-
tions for ECUs during the engine development
phase (Figure 11.4).
Hardware-in-loop (HIL) simulation plays a part
in rapid development of any hardware. New hard-
ware can be tested and validated under a number
of simulated conditions and its performance veri-
fied before it even goes near any prototype vehicle.
The following tasks can be performed with this
technology.
Full automation of testing for OBD
functionality.
Testing parameter extremes.
Testing of experimental designs.
Regression testing of new designs of software
and hardware.
Automatic documentation of results.
11.3.6 Comment
What with the possibility of navigation systems
reporting where we are, speed and traffic light
cameras everywhere and monitoring systems
informing the authorities about the condition of
our vehicles, whatever will be next?!
11.4 Software
11.4.1 Introduction
Many web sites have information you can down-
load. Some also include simulation programs,
demonstration programs and/or electronic books.
This section outlines a small selection of those
available.
11.4.2 Automotive technology –
Electronics
This simulation program is created by the author
of this book. It is a great teaching aid and covers
some complex topics in an easy to understand
Conclusion, web resources and developments 263
Figure 11.4 Model based calibration
of an OBD system
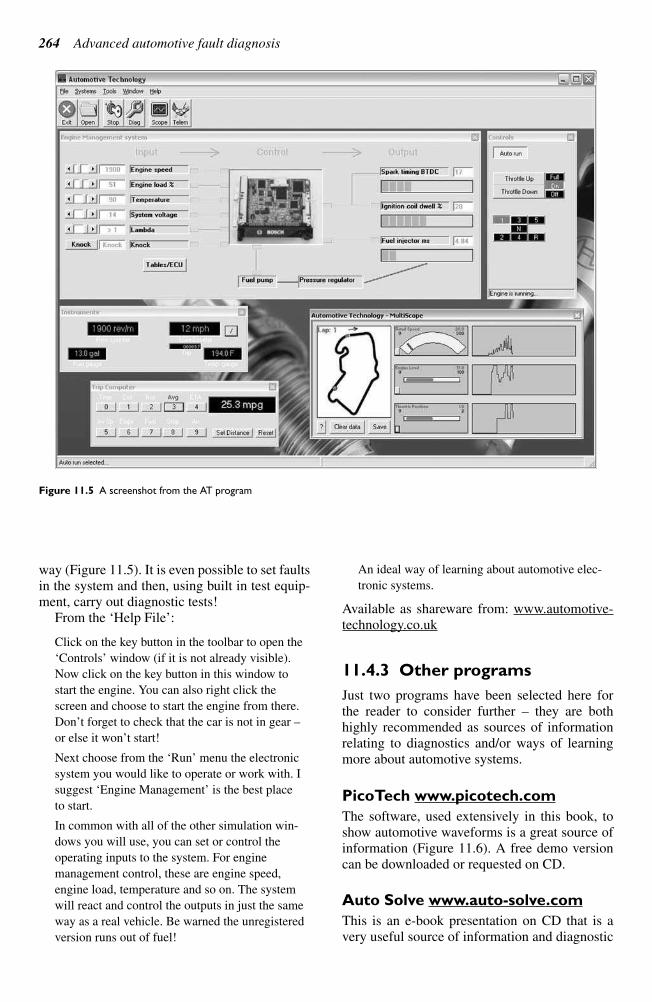
264 Advanced automotive fault diagnosis
way (Figure 11.5). It is even possible to set faults
in the system and then, using built in test equip-
ment, carry out diagnostic tests!
From the ‘Help File’:
Click on the key button in the toolbar to open the
‘Controls’ window (if it is not already visible).
Now click on the key button in this window to
start the engine. You can also right click the
screen and choose to start the engine from there.
Don’t forget to check that the car is not in gear –
or else it won’t start!
Next choose from the ‘Run’ menu the electronic
system you would like to operate or work with. I
suggest ‘Engine Management’ is the best place
to start.
In common with all of the other simulation win-
dows you will use, you can set or control the
operating inputs to the system. For engine
management control, these are engine speed,
engine load, temperature and so on. The system
will react and control the outputs in just the same
way as a real vehicle. Be warned the unregistered
version runs out of fuel!
An ideal way of learning about automotive elec-
tronic systems.
Available as shareware from: www.automotive-technology.co.uk
11.4.3 Other programs
Just two programs have been selected here forthe reader to consider further – they are bothhighly recommended as sources of informationrelating to diagnostics and/or ways of learningmore about automotive systems.
PicoTech www.picotech.com
The software, used extensively in this book, toshow automotive waveforms is a great source ofinformation (Figure 11.6). A free demo versioncan be downloaded or requested on CD.
Auto Solve www.auto-solve.com
This is an e-book presentation on CD that is avery useful source of information and diagnostic
Figure 11.5 A screenshot from the AT program
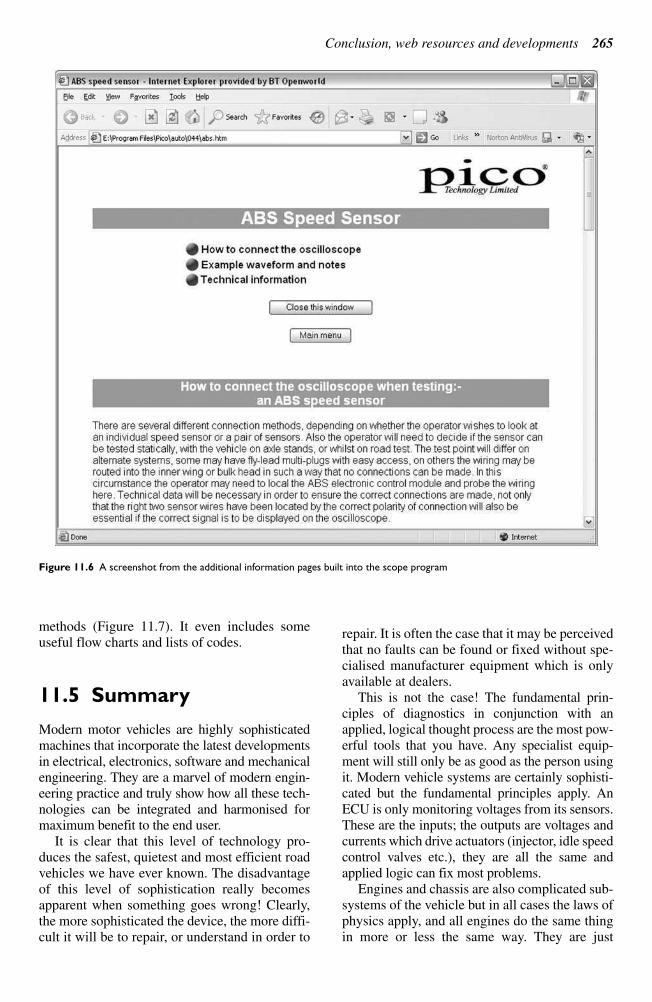
Conclusion, web resources and developments 265
methods (Figure 11.7). It even includes some
useful flow charts and lists of codes.
11.5 Summary
Modern motor vehicles are highly sophisticated
machines that incorporate the latest developments
in electrical, electronics, software and mechanical
engineering. They are a marvel of modern engin-
eering practice and truly show how all these tech-
nologies can be integrated and harmonised for
maximum benefit to the end user.
It is clear that this level of technology pro-
duces the safest, quietest and most efficient road
vehicles we have ever known. The disadvantage
of this level of sophistication really becomes
apparent when something goes wrong! Clearly,
the more sophisticated the device, the more diffi-
cult it will be to repair, or understand in order to
repair. It is often the case that it may be perceived
that no faults can be found or fixed without spe-
cialised manufacturer equipment which is only
available at dealers.
This is not the case! The fundamental prin-
ciples of diagnostics in conjunction with an
applied, logical thought process are the most pow-
erful tools that you have. Any specialist equip-
ment will still only be as good as the person using
it. Modern vehicle systems are certainly sophisti-
cated but the fundamental principles apply. An
ECU is only monitoring voltages from its sensors.
These are the inputs; the outputs are voltages and
currents which drive actuators (injector, idle speed
control valves etc.), they are all the same and
applied logic can fix most problems.
Engines and chassis are also complicated sub-
systems of the vehicle but in all cases the laws of
physics apply, and all engines do the same thing
in more or less the same way. They are just
Figure 11.6 A screenshot from the additional information pages built into the scope program
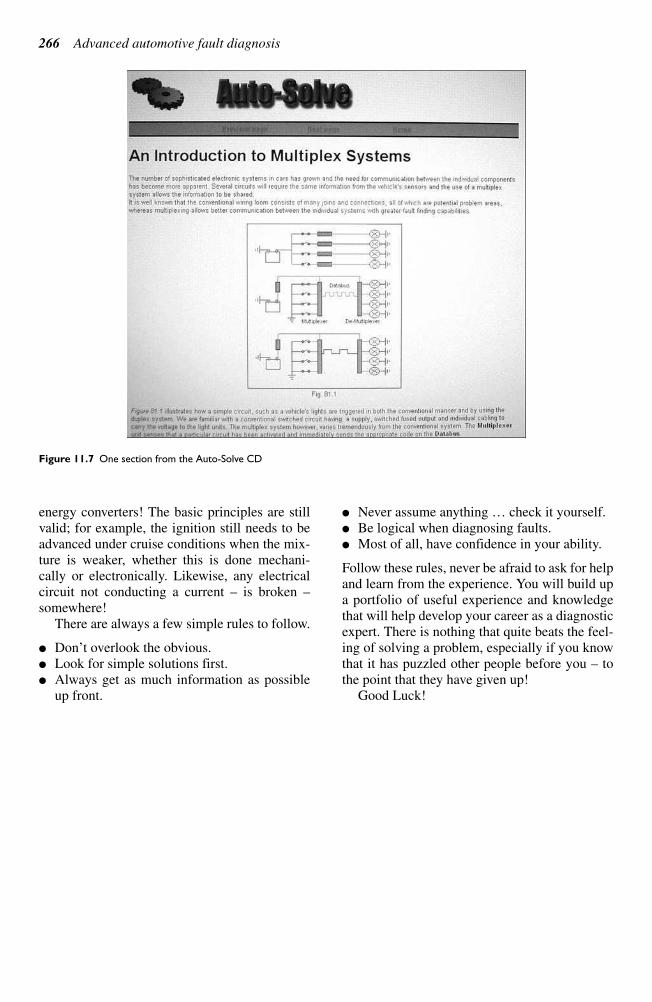
266 Advanced automotive fault diagnosis
energy converters! The basic principles are still
valid; for example, the ignition still needs to be
advanced under cruise conditions when the mix-
ture is weaker, whether this is done mechani-
cally or electronically. Likewise, any electrical
circuit not conducting a current – is broken –somewhere!
There are always a few simple rules to follow.
Don’t overlook the obvious. Look for simple solutions first. Always get as much information as possible
up front.
Never assume anything … check it yourself. Be logical when diagnosing faults. Most of all, have confidence in your ability.
Follow these rules, never be afraid to ask for helpand learn from the experience. You will build upa portfolio of useful experience and knowledgethat will help develop your career as a diagnosticexpert. There is nothing that quite beats the feel-ing of solving a problem, especially if you knowthat it has puzzled other people before you – tothe point that they have given up!
Good Luck!
Figure 11.7 One section from the Auto-Solve CD
ABS, 174, 175, 180
ABS speed sensor, 40, 41
AC, 164, 165
Accuracy, 25, 26
Actuator, 49, 94, 240
Advance angle, 108, 135
Aerial, 221
Air bag, 241, 242, 243, 244, 245
Air conditioning, 214, 231, 234, 235, 237, 238,
239
Air-cooled system, 148
Air cored gauge, 227
Air flow meter, 40, 42, 89, 92, 124, 141
Air flow sensor, 38, 91
Air supply, 131, 137, 144, 147, 148
Air temperature, 135, 147
Alternator, 4, 58, 159, 164, 165, 166, 167, 168, 228
Ampere hour capacity, 156
Antifreeze, 150, 151
Anti-lock brakes see ABS
Anti-roll bar, 192, 193
Automatic gearbox, 253, 254, 257
Automatic temperature control, 236
Auxiliaries, 209, 215
Auxiliary systems, 12, 214, 225
Back probing, 17
Battery, 58, 112, 155, 156, 157, 158, 159, 242
Battery charger, 157, 158
Battery rating, 155
Beam axles, 190
Beam setting, 209
Before top dead centre (BTDC), 101, 111, 114, 135
Belt tensioners, 241, 243, 244, 245
Bimetal, 227
Black box, 13, 14, 231, 240
Block diagram, 13, 19, 124, 175, 229, 243,
257, 258
Blower motors, 233
Bonding, 221
Boost charging, 157
(Booster) brake servo, 171
Brake, 169, 171, 172, 177
Brake adjusters, 170
Brake disk, 172
Brake fluid, 172
Brake lights, 202, 212, 213
Brake roller, 172, 173
Braking efficiency, 171, 172
Bypass filtration, 152
California Air Resources Board see CARB
Calliper, 170
Camber, 184, 187
Camshaft drives, 99
Camshaft sensor, 42, 114
CAN, 31, 36, 37, 59, 60, 201, 202
CAN controller, 202
CAN diagnostics, 202
CAN-High, 59, 60, 202
CAN-Low, 59, 60, 202
CAN signals, 59, 202, 203
Capacitors, 197, 221
CARB, 62, 63, 74, 75
Carbon dioxide (CO2), 34, 62
Carbon monoxide see CO
Carburation, 104, 105
Carburettor, 103, 104, 106
Castor, 184, 185
Catalytic converter, 62, 121, 130, 146
Charging, 156, 157, 159, 163, 166, 167, 168, 220
Charging circuits, 166, 167
Chip, 199, 200
Choke, 104, 105, 106, 199
Circuit, 14, 166, 197, 199, 200, 204, 211, 229
Circuit testing, 66, 163, 168, 209, 215
Closed loop, 19, 46, 68, 92, 110, 111, 133
Closed loop control, 110, 133, 239
Clutch, 161, 247
CO, 34, 62, 73, 120, 130, 146, 262
Coil, 55, 56, 108, 114, 117
Cold cranking amps (CCA), 156
Colour codes, 15
Common rail (CR) diesel, 36, 51, 52, 129
Common rail, 51, 52, 129
Compression, 35, 59, 78, 98, 101, 132
Compression tester, 35, 101
Condensation, 234
Condenser, 234, 235
Constant current, 157
Constant energy, 55, 109, 111, 136
Constant velocity joints, 249
Constant voltage, 157, 165, 227
Constant voltage charging, 157, 164
Constantly variable TransaXle see CTX
Constantly variable transmission, 254
Control maps, 136
Controller area network see CAN
Coolant, 148, 149, 150
Coolant temperature, 44, 87, 111, 126, 135, 236
Cooling, 115, 148, 149, 150, 151
Index

Cooling fan, 149, 212, 214
CR injector, 52, 130
Crank sensor, 42, 43, 81
Crankcase ventilation, 153
Crankshaft, 42, 71, 129, 151
Crankshaft position sensor, 114
Crankshaft sensor, 70, 87, 111
Crash sensor, 93, 242, 243
Cruise control, 239, 240, 241
CTX, 254, 255
Cylinder layouts, 99
Cylinder leakage tester, 101
Cylinder pressure sensor, 83
Dampers, 194
Darlington pair, 199
Data sources, 21
DC, 164, 165
Diagnostic, 1, 2, 6, 7, 8, 20, 40, 61, 101, 106,
117, 119, 126, 130, 138, 147, 150, 153, 172,
177, 180, 186, 195, 202, 237, 240, 244, 251,
256, 260
Diagnostic-expert, 266
Diagnostic link connector see DLC
Diagnostic routine, 7
Diagnostic trouble code see DTC
Dial gauge, 172
Diesel engines, 128, 131, 263
Diesel fuel injection pump, 127
Diesel injection, 127, 129
Differential, 250, 251
Differential locks, 250
Digital instrumentation, 227
Digital multimeter, 12, 17
Diode, 197, 200, 229
Direct ignition, 55, 114
Direct ignition system see DIS
DIS, 57, 82, 114, 117
DIS coil, 114, 117
Disc brakes, 169, 170, 171
Display techniques, 230
Distributorless ignition, 57, 112
DLC, 80
Door locking, 223
Driveshafts, 248, 249
Drum brake disc, 169
Drum brakes, 169, 170, 171
DTC, 32, 64, 65, 67, 74
Duty cycle, 54, 95
Dwell angle, 109, 132
Dynamic position sensors, 93
ECU, 25, 40, 49, 51, 52, 53, 54, 69, 111, 123, 124,
126, 128, 135, 136, 176, 211, 222, 224, 227, 234,
236, 242, 256, 265
EGR, 71, 72, 73, 84, 120, 130, 133
EGR valve, 97, 120
Electric horns, 212
Electric seat, 221, 222
Electric window, 223, 224
Electrical and electronic symbols, 198
Electrode, 115, 116
Electrohydraulic, 258
Electronic components, 197, 200
Electronic control unit see ECU
Electronic diesel control (EDC), 129
Electronic ignition, 109, 111, 112
Electronic spark advance (ESA), 111
Electronically controlled automatic transmission
(ECAT), 256, 257, 258
Emission, 33, 34, 61, 62, 63, 66, 120, 122, 127, 128,
129, 130, 263
Engine, 11, 14, 32, 34, 78, 83, 84, 98, 99, 101, 102,
108, 111, 124, 132, 135, 138, 143, 152, 153, 160,
233, 253, 262, 265
Engine analysers, 32
Engine control, 25, 133, 256
Engine management, 108, 124, 132, 134, 135,
143, 144
Engine noise, 11, 145
Environmental Protection Agency (EPA), 62, 65, 74
EOBD, 65, 75, 76, 78, 80, 83, 141
Epicyclic gear sets, 255
Epicyclic gearbox, 254
European on-board diagnostics see EOBD
EVAP, 68, 84
Evaporation, 234
Evaporative system, 68, 80
Evaporator, 234, 235
Exhaust, 9, 99, 144, 147, 148
Exhaust emissions, 20, 74, 120, 122, 129
Exhaust gas measurement, 34
Exhaust gas recirculation (EGR), 71, 72, 97, 120,
128, 129, 130
Exhaust systems, 144
Fast idle, 105, 124, 125
Fault, 1, 7, 17, 20, 30, 58, 64, 79, 84, 102, 107, 108,
117, 122, 126, 131, 138, 139, 148, 151, 154, 156,
157, 163, 167, 168, 173, 174, 178, 181, 189, 190,
195, 209, 212, 215, 219, 225, 230, 231, 237, 238,
241, 252, 253, 257
Fault code, 17, 30, 80
Feedback resistors, 222
Field effect transistor (FET), 199
Filter, 147
Final drive, 250, 253
Fixed choke carburettor, 104
Four stroke cycle, 98
Four-wheel drive (4 WD), 250, 251
Front axle, 191
Fuel filter, 125, 137
Fuel injection, 23, 122, 123, 124, 125, 126, 129
Fuel injector, 94
Fuel pressure gauge, 106
Fuel pressure regulator, 125, 137
Fuel pump, 106, 124, 136, 141
Fuel rail, 137
Full-flow filtration, 152
Future of diagnostics, 260
268 Index

Gas analyser 32, 106, 107
Gas discharge headlamps (GDL), 205
Gasoline direct injection (GDI), 76, 137, 138
Gauges, 32, 89, 93, 102, 182, 226
Gearbox, 247, 250, 252, 253, 254, 257
Glow plug, 132
Hall effect, 44, 45, 49, 87, 88, 109, 110, 224
Hall effect distributor, 44, 109, 110
Hand tools, 26
Hazard lights, 212
HC, 34, 62, 73, 120, 130, 146, 262
Headlight aiming, 210
Headway sensor, 240
Healing, 79
Heating, 28, 92, 148, 231, 233, 235, 236
Homogeneous cylinder charge, 138
Hot wire, 42, 91, 92
HT, 55, 56, 134, 136
HVAC, 231, 235, 237,
Hydraulic, 169, 171, 174, 176, 183, 256
Hydraulic accumulator, 171
Hydraulic modulator, 14, 176
Hydrocarbons see HC
ICE, 216, 218, 219
Idle control actuator, 125
Idle speed, 105, 106, 124
Idle speed control, 53
Igniter, 241, 242
Ignition, 21, 54, 55, 59, 78, 82, 101, 108, 109, 110,
111, 112, 114, 116, 134, 141, 220
Ignition coil, 54, 55, 114, 117
Ignition secondary, 55, 57
Ignition timing, 101, 108, 109, 111, 114, 117, 133,
136
In car entertainment see ICE
Independent front suspension (IFS), 182, 190
Indicators, 212
Inductance, 199
Induction, 98
Inductive, 42, 45, 86, 87, 110
Inductive distributor, 45, 110
Inductive pick-up, 40, 46
Inductors, 199, 221
Inertia starters, 160
Infrared (IR), 130, 218, 223
Injector, 49, 51, 94, 125, 126, 130, 131, 135, 137, 141
Injector tester, 130
Instrumentation, 226, 231
Integrated circuits, 199
Interference suppression, 220
Ionising current, 82
Knock protection, 136
Knock sensor, 46, 47, 91
Laser alignment, 188
LCD, 229, 230
Lead-acid batteries, 155
LED, 28, 200, 205, 207, 218, 229, 230
LED lighting, 205
LH-Jetronic fuel injection, 123
Lighting, 203, 204, 205, 206, 207
Lighting circuit, 204, 205, 206, 209
Limited slip differentials, 250
Liquid crystal display see LCD
Loading effect, 27
Logic, 6, 8
Logic probe, 27, 28
Lubrication, 151, 153
Malfunction-indicator lamp see MIL
Malfunction indicator light see MIL
Manifold, 108, 111, 137, 145
Manifold absolute pressure (MAP), 89, 108, 114
Manual gearbox, 247, 252
Mass airflow sensor, 64
Master cylinder, 169, 170
McPherson strut, 191
Metallic substrates, 121
Meter, 12, 27, 40, 42, 43, 89, 92, 124, 130, 141, 150
MIL, 32, 37, 38, 63, 74, 78, 84
Mirrors, 222
Misfire, 12, 69, 70, 71, 80, 81, 147, 262
Misfire detection, 81, 83, 147, 262
Misfire monitor, 69, 80
Mobile communications, 219
Motorised actuators, 95
Motors, 54, 95, 96, 209, 211, 212, 222, 233
Multi-point injector, 49, 50, 51
Multimeter , 17, 27, 32
Multiplexing, 200
Multipoint, 50, 137
Multipoint injection, 51, 124
Negative temperature coefficient (NTC), 44, 86, 197
Nitrogen oxides see NOx
Noise, vibration and harshness (NVH), 9
NOx, 62, 71, 120, 130, 146, 262
OBD, 20, 60, 61, 63, 64, 65, 74, 82, 84, 141
OBD cycles, 79
OBD scanner, 31
OBD1, 64, 76, 262
OBD2, 65, 68, 75, 76
OBD2/EOBD, 80, 262
OBD3, 262
Off-board diagnostics, 20
Oil filters, 152
Oil pressure, 154, 228
Oil pump, 151, 153
On-board diagnostics see OBD
On-board monitoring (OBM), 262
Open circuit, 2
Open loop, 19
Operational strategy, 136
Optical sensor, 88
Oscilloscope, 26, 28, 29, 30, 32, 40
Overrun, 105
Index 269

Oxides of nitrogen see NOx
Oxygen (O2), 34
Oxygen sensor, 46, 47, 48, 92
Particulate matter (PM), 120, 130
Pattern, 29, 114, 133, 143
PCV, 62, 63, 153
Permanent magnet starters, 161, 162
Phase correction, 136
PicoScope, 29, 30
Piezo-electric, 91, 93
Position memory, 222
Power, 99
Power-assisted steering, 183
Powertrain control module (PCM), 73
Pre-engaged starter, 160, 161
Pressure conscious valve see PCV
Pressure gauge, 35, 106, 154, 187, 257
Pressure relief valve, 151, 153
Pressure sensing, 83
Pressure test gauge, 154
Pressure tester, 35, 150
Pressure testing, 34, 257
Primary, 54, 56, 110, 150, 152
Programmed ignition, 111, 112, 113, 136
Propshaft, 249
Pulse generator, 109, 110
Pump, 124, 149, 150, 234, 253
Pyrotechnic inflater, 240, 241
Rack and pinion steering, 183
Rack Steering box, 182
Radial tyre, 182
Radio broadcast data system (RBDS), 217
Radio data system (RDS), 217
Radio interference, 221
Rain sensor, 93, 94
Rate based monitoring, 263
Receiver drier, 238, 239
Rectification, 84, 165
Refrigerant, 234, 235
Relative compression, 59
Report writing, 3
Reserve capacity, 156
Resistors, 91, 197, 221, 222, 233
Resolution, 26, 63
Revcounter, 256
Ripple, 58
Road speed (Hall effect), 49
Road test, 10, 64, 150, 187
ROM, 111, 123, 126, 133, 135, 228
Rotary idle actuator, 95
SAE, 21, 36, 64, 66, 156
Scanner/fault code-reader, 30
Scope, 14, 29, 33, 60, 265
Screening, 221
Scrub radius, 186
Seat belt tensioners, 243
Seat heating, 236
Security, 176, 182, 216, 218, 219
Security and communications, 216
Semi-trailing arms, 192
Sensors, 13, 19, 31, 40, 44, 46, 47, 68, 74, 86, 111,
121, 176, 218, 224, 228, 236, 257, 265
Sensors and actuators, 86, 124, 141, 257
Serial communication, 30
Shock absorbers see Dampers
Short circuit, 2, 8, 13
Sight glass, 238, 239
Silencers, 145
Single-point injection, 49, 123, 143
Single point injector, 49, 50
Six-stage process, 6
Smog, 61, 65
Smoke, 131
Smoke meter, 130, 131
Society of Automotive Engineers see SAE
Software, 30, 31, 32, 36, 263
Solenoid, 94, 96, 160
Solenoid actuators, 94
Spark ignition, 59, 78
Spark plug, 56, 115, 116, 117, 119
Spark plug heat range, 115
Speakers, 216, 217
Speed sensor, 40, 49, 141, 176, 240
Springs, 193
Starter, 59, 158, 159, 160
Starter circuit, 159, 160, 161, 163
Starting, 159, 163
Stationary current cut off, 110
Stator, 253
Steering rack, 182, 183
Stepper motor, 54, 55, 96, 106
Stethoscope, 252
Strain gauge pressure sensor, 90
Stratified charge, 138
Sunroof, 222, 223
Supplementary restraint system (SRS), 243, 244
Suspension, 11, 190, 193, 195
Swivel axis, 185
Symbols, 63, 197, 198
Symptom(s), 1, 2, 8, 33
Synchromesh, 248
System, 2, 14, 18, 19, 54, 68, 72, 78, 80, 98, 169,
197, 247, 262
Temperature sensor, 44, 45, 87, 125, 236
Terminal designation, 16
Terminal numbers, 15
Test lights, 12
Thermal actuator, 96, 97
Thermal gauge, 226, 227, 230
Thermistor, 86, 125, 126
Thermo-valve, 147
Thermostat, 148, 149
Thermostatic expansion valve, 235
Throttle butterfly position, 135
Throttle position, 47, 88, 126, 180
Throttle position sensor, 48, 88
270 Index

Throttle position switch, 125
Timing belt, 100
Tires, 182
Titania, 46, 47, 48
Torque converter, 253, 254, 256
Trace, 29
Tracking, 185, 186, 188
Tracking gauges, 187
Traction control, 178, 180
Traction control modulator, 180
Trailing arms, 191, 192, 193
Transfer gearbox, 251
Transistors, 197, 199, 200, 201
Transmission, 88, 217, 247
Trip computer, 228, 229
Turbine, 136, 253
Vacuum gauge, 154
Valve and ignition timing, 101
Valve mechanisms, 100, 112
Variable capacitance, 90
Variable resistance, 88
Variable venturi carburettor, 104, 106
Vehicle condition monitoring, 228
Vehicle systems, 18
Ventilation, 153, 231, 233, 235
Volt, amp tester (VAT), 159
Volt drop, 13, 159, 167
Volt drop testing, 13, 163
Voltage regulator, 165, 166
VR Pump, 128
Water cooled system, 148
Water pump, 148, 149
Waveform, 29, 33, 40, 42, 49, 58, 82, 86
Web, 260
Wheel alignment, 187
Wheel balancer, 187
Wheel speed sensors, 40, 176
Wide band lambda sensor, 93
Window lift motor, 96
Wiper circuits, 211
Wiper motor, 209, 210, 211, 215, 216
Xenon lighting, 207
Zener diode, 51, 166, 197
Zirconia, 47, 48, 73, 74
Zirconium dioxide, 92
Index 271