Embed Size (px)
Citation preview

DRAFT- Not for citation without prior permission from the authors
Studying websites as vehicles for research dissemination
Hilary Edelstein, OISE/University of Toronto
Ben Levin, OISE/University of Toronto
and
Marija Glisic, OISE/University of Toronto
Paper presented at the Annual Meeting of the Canadian Society for the Study of Education
May 27-30, Waterloo, Ontario.
Studying websites as vehicles for research dissemination
CSSE – May 29, 2012
DRAFT- Not for citation without prior permission from the authors
2
Abstract
In this paper we focus on the process of determining how best to organize and analyze data on
website use from Google Analytics and the challenges involved in building this research project
leading to a framework to evaluate the use of online research. Our findings suggest that the
majority of visitors access web pages through search engines as opposed to through
homepages. This has strong implications to the organization of an effective webpage. Linking
websites together and increasing their profile on search engines, rather than building new
webpages, may be a more impactful strategy to increase research use in practice.
Studying websites as vehicles for research dissemination
CSSE – May 29, 2012
DRAFT- Not for citation without prior permission from the authors
3
Introduction
“Despite the volumes of research evidence available, relatively little of it is disseminated and
taken up or applied in practice” (Waddell, 2002, p.38).
In education, as in other fields such as health, there is a rich research base for what
works in practice but no mechanisms for transferring this research into practice (Levin, 2004;
Lavis et al., 2003; Nutley, et al., 2007; Hattie, 2009). This results in a “knowledge-doing gap”
(Bayliss et al., 2012, p.38) where little research is actively used by policy makers, by teachers in
their classrooms, or by the education system even when there is strong evidence for effective
practices (Cooper, et al., 2009; Levin, 2010). Many times, decisions are made based on personal
experiences, opinions, and beliefs rather than what is known to work (Bayliss, et al, 2012; Levin
2011; Nutley, et al., 2007). In light of the knowledge-doing gap, there have been various efforts
to strengthen mechanisms to connect research to practice (Cordingley, 2008; Sebba, 2007;
Walter, et al., 2003). One such effort is the use of the Internet as a dissemination mechanism
(Thelwall, 2002; Jadad et al., 2000; Duffy, 2000). It is the latter dissemination phenomenon that
this paper will explore.
The Internet has changed the availability of research evidence and how research is
accessed. Arguably the Internet is now the single most important means of sharing research
findings and implications, but little is known about the uptake of research online (Chavkin &
Chavkin, 2008; Waddell, 2002; Hartley & Bendixen, 2001). What is known is that information
that is more easily accessible and visible will more likely be taken up and used (Bayliss et al.,
2012). The Use of Online Research project explores the use of research from the websites of
educational organizations. The project’s background and initial results have been explicated in
Studying websites as vehicles for research dissemination
CSSE – May 29, 2012
DRAFT- Not for citation without prior permission from the authors
4
other papers (see Cooper et al., 2010; Edelstein & Levin, 2011; Edelstein, et al., 2012). To date,
we have found that most research pages on websites have few visitors and that visitors are
more likely to share the research they find online through informal, mechanisms (Cooper et al.,
2010; Edelstein, et al., 2012). In this paper we focus on the process of determining how best to
organize and analyze data on website use from Google Analytics and the challenges involved in
building this research project leading to a framework to evaluate the use of online research. We
include website usage data to illustrate how we can compare different websites using similar
indicators given the wide variability across websites in terms of the centrality and use of
research. We will also touch on how many products, both research and non-research-based,
visitors to these websites download and what that might mean for how organizations
disseminate research.
Literature review
Other researchers (Cooper, 2012; Edelstein, et al., 2012; Levin, 2008; Cooper, et al.,
2009; Nutley, et al., 2007; Davies, et al., 2000) have extensively reviewed the literature on
knowledge mobilization. Here we will review the literature on the use of research online,
specifically looking at the use of products as a dissemination strategy.
Using the Internet to evaluate research use
With over two billion users (http://www.internetworldstats.com/stats.htm), the
Internet enables us to disseminate research in ways that were not possible even ten years ago.
Organizations use websites as a means to communicate to users what they do, but navigating
the Internet often means sifting through vast amounts of information before finding reliable
sources (Qi & Levin, 2010; Morhahn-Martin, 2004; Waddell, 2002). To find relevant, timely, and
Studying websites as vehicles for research dissemination
CSSE – May 29, 2012
DRAFT- Not for citation without prior permission from the authors
5
practical research online, Jadad (1999) argues that websites need to be organized in a way that
allows users to easily navigate the site so that they can integrate the information they find
online with their work environments. Despite Jadad’s (1999) call for making websites easy to
use and find, most users never look at much of what is posted online due to the over
abundance of information (Morhahan-Martin, 2004). Bayliss and colleagues (2012) suggest
that the Internet is the new library, and therefore questions need to be raised about the
accuracy of information posted online before research should incorporated into decision-
making (p.50). Despite these limitations, the Internet is still an important tool for driving users
towards research related materials, particularly as an open-source outlet (Bayliss, et al, 2012;
Bennet & Bennet, 2006; Dede, 2003; Jadad, et al., 2000; Duffy, 2000).
Most research on websites is shared in the form of products such as research reports,
research summaries, and multimedia (i. e., video). These resources, although they may be good,
are passive modes of dissemination (Cooper, 2012; Chavkin & Chavikin, 2008; Cordingley, 2008;
Belhodja, et al., 2007). Active modes of online dissemination are where research producers and
users can interact through the Internet – such as through events and networks. Online spaces,
such as chat rooms and social media where conversations and communities are being built, are
considered to be more effective mechanisms for sharing research (Sà, et al., 2011; Proctor, et
al., 2010; Peterson & Merino, 2003), as active modes of dissemination are known to have a
greater impact on use (i.e. Nutley et al., 2007; Qi & Levin, 2011; Cooper, 2012). However, the
Internet has been built on passive modes of dissemination and websites can often be difficult to
navigate. As Waddell (2002) put it, “despite the volumes of research evidence available,
relatively little of it is disseminated and taken up or applied in practice”.

Studying websites as vehicles for research dissemination
CSSE – May 29, 2012
DRAFT- Not for citation without prior permission from the authors
6
Many different techniques, according to the research question being asked, are
available for understanding how users navigate the Internet. Among these methods are
cybermetrics – the study of “mathematical and statistical techniques to quantify websites”
(Jana & Chatterjee, 2004); web links and server access logs (Thelwall, 2002); and Google
Analytics, which uses web metrics as a means of analysis (Clifton, 2008; Ledford & Tyler, 2007;
Phippen, et al., 2004). These modes of analysis can begin to tell us about how users navigate
the Internet by providing data on how often visitors come to a website, how long they stay on
that site for, and how they navigate through the site (Clifton, 2008; Google Analytics, 2012).
The limitations of these methods have to do with how the data are collected– there are often
uncertainties around accuracy and the validity of the data, and there are few benchmarks by
which to gauge what constitutes a successful website (Stanton & Rogelberg, 2001). Despite the
methodological limitations, using tools such as Google Analytics to evaluate how users navigate
websites and whether they download the research products found on the site is useful as a first
step.
Conceptual framework
Our conceptual framework is based on three intertwined facets: Research evidence, the
user, and use over time (see also: Cooper, et al., 2010; Edelstein, et al., 2012). For this study:
Research evidence refers to “bodies of consistent evidence” (Levin, 2008) that come
from “methodologically diverse studies” (Davies & Nutley, 2008) which are more
appropriate than single studies. Here we look at research-based products (pdf, Word
documents, etc) found online.
Studying websites as vehicles for research dissemination
CSSE – May 29, 2012
DRAFT- Not for citation without prior permission from the authors
7
User is defined as a person who comes to the website and the role that person identifies
while searching for research online (i.e., Does the user come to the site as a parent, a
teacher, a researcher, or some other type of stakeholder).
Use over time is intended to convey the difference between finding research and using
that research that in some way. Here we explore whether or not the user actually used
the information or product found, such as whether that knowledge was shared, and if
the information was used directly in practice, to inform practice indirectly
This paper focuses on the first of the facets – research evidence available on websites.
Our approach involves working with partner organizations that have an interest in sharing
research via their websites. Using Google Analytics and information from our 13 partner
organizations’ websites, we examine the type of research that organizations post online and
how many visitors view and click on these research-based resources. The other two facets of
the framework are explored through a user survey, which we do not report on in this paper
(See Edelstein, et al., 2012 and Cooper et al., 2010).
Methodology
User traffic data from Google Analytics were collected from 13 partner sites from May 1,
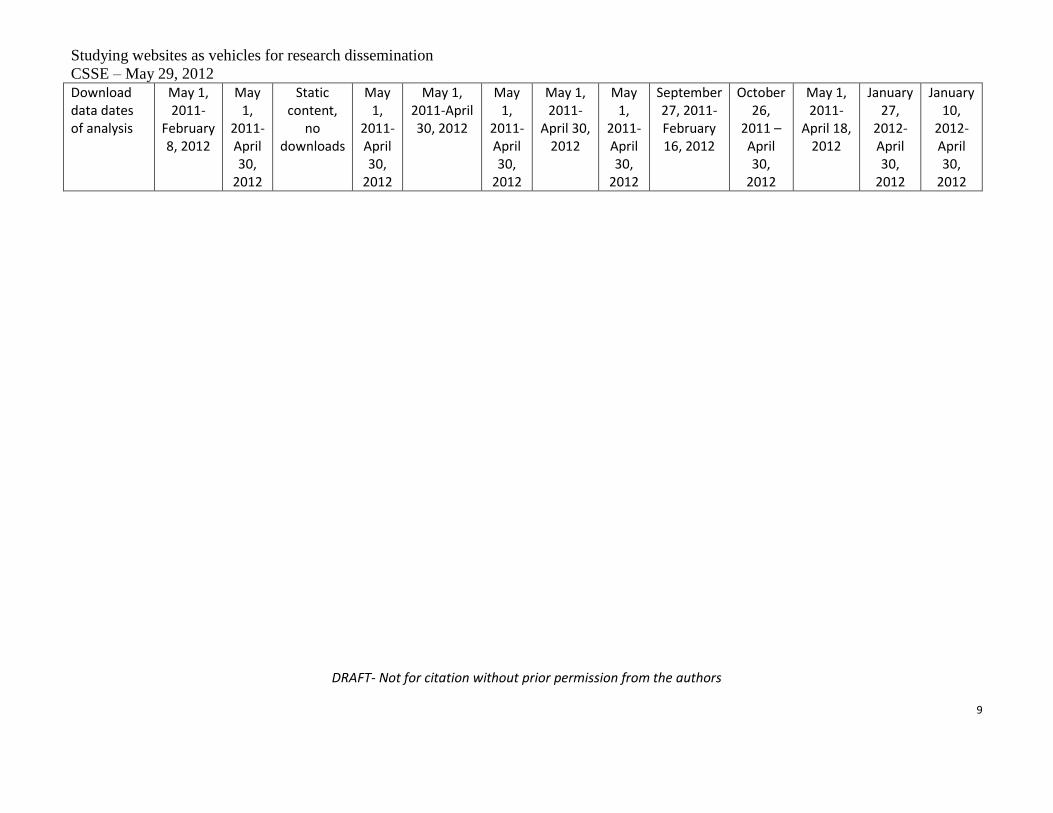
2011-April 30, 2012.Timelines for the product download data (reported later) varies due to the
fact that partner sites added the Google Analytics code that tracks visitors to their websites at
different points in time. Additionally, a few sites do not have any downloadable research
products; therefore we have used static web pages as opposed to for these sites. These
exceptions have been identified in the website and download usage reports below (Table 2).

DRAFT- Not for citation without prior permission from the authors
Table 1 Methods chart
Research Facet Data sources Sample Method Data analysis & outputs
Actual use of research over time from websites.
Website usage data
131 organizational websites from 5 countries (6 Canadian, 1 New Zealand, 3 UK, 2 US)
Google Analytics for website usage: page views, bounce rate, new and repeat visitors, landing, entrances, % exits, keywords, traffic referrals, outbound links, and time spent on page.
Cross-case analysis of data using Excel.
Actual use of research over time from web-based materials.
Product download data
112 organizational websites from 5 countries (4 Canadian, 1 New Zealand, 3 UK, 2 US)
Google Analytics for downloads: page view, unique page view, time on page, % of exit. Product typology chart to understand the range of products available online. Identifying product types for research use.
Analysis framework based on the typology chart and the products specified for research use (adapted from Cooper, 2012) Cross-case analysis using Google Analytics data to understand use over time (comparing use over time)
Table 2 Download analysis data collection
Organization 1 2 3 4 5 6 7 8 9 10 11 12 13
1 1 of the partners has 2 sites that we are tracking – so there are 12 partners with 13 websites being tracked
2 2 of the partners do not have specific downloadable material on their website
Studying websites as vehicles for research dissemination
CSSE – May 29, 2012
DRAFT- Not for citation without prior permission from the authors
9
Download data dates of analysis
May 1, 2011-
February 8, 2012
May 1,
2011-April 30,
2012
Static content,
no downloads
May 1,
2011-April 30,
2012
May 1, 2011-April 30, 2012
May 1,
2011-April 30,
2012
May 1, 2011-
April 30, 2012
May 1,
2011-April 30,
2012
September 27, 2011-February 16, 2012
October 26,
2011 – April 30,
2012
May 1, 2011-
April 18, 2012
January 27,
2012-April 30,
2012
January 10,
2012-April 30,
2012

DRAFT- Not for citation without prior permission from the authors
A process of working towards understanding how research is taken up online
In this section we compare across organizations using the GA data including the centrality of
research to the website, the variability between organizations on the use of their websites (especially
their research pages), and download data. Then we address the challenges and limitations of Google
Analytics, and finally we look at the data from our analysis.
Comparing across organizations and websites
Our purpose here is to illustrate some of the ways that GA data can increase our understanding
of the way research is used on websites, and to show how our analysis has been evolving as we work
with various data elements.
We are tracking 13 organizational websites, across 12 partners. The organizations are different
from each other in many and these differences are reflected in both the structure and nature of each
website. For instance, some of our partners are publically funded, while others are non-profit or
privately owned organizations. Some are more academic and focused on sharing research while others
are more focused on practitioners making use of research. Partners range from small organizations
(n=5 staff) to very large organizations (n=over 200 staff). The websites vary in size – some consist of
less than hundred pages, while others have thousands of pages. Unlike some ‘producer’ websites,
none of these sites is restricted to research done in or by that organization. Despite the discrepancies
in type, size and structure of website, we categorize our partners by the type of organization and focus
of the website (Table 3).
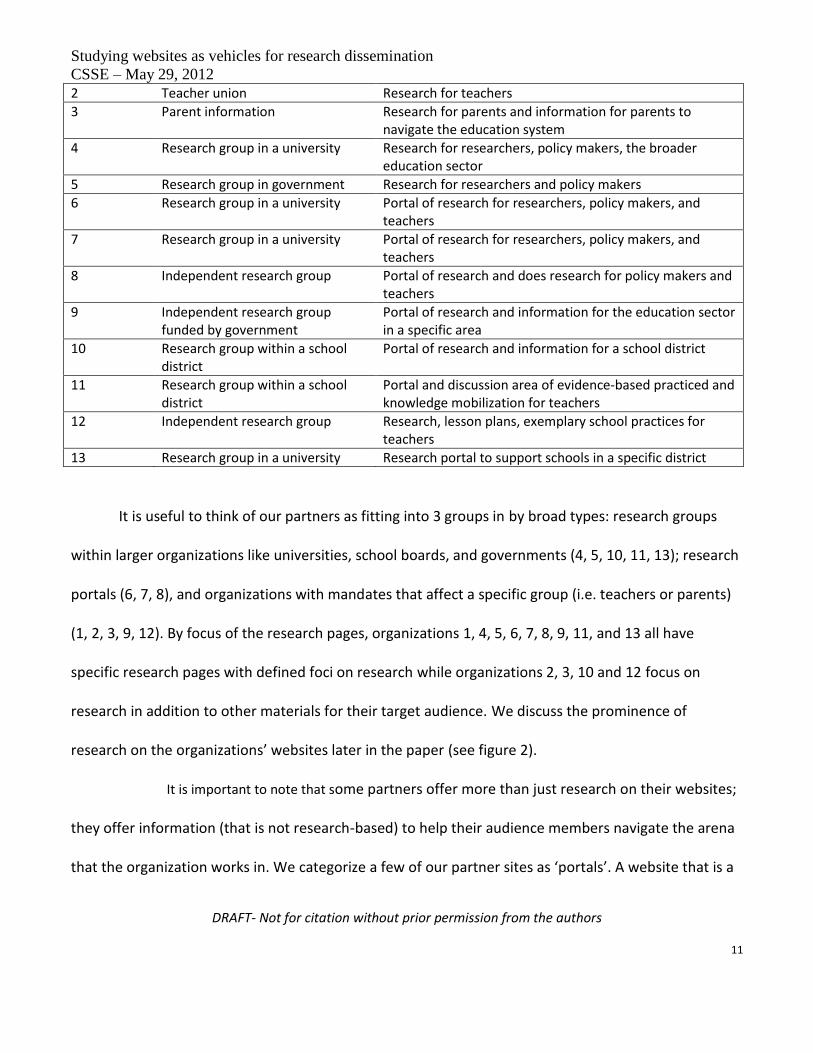
Table 3. Partners - Type of organization and website focus
Organization Type Focus of the research pages of the website
1 Education advocacy group Research for teachers, parents, policy makers and information for parents
Studying websites as vehicles for research dissemination
CSSE – May 29, 2012
DRAFT- Not for citation without prior permission from the authors
11
2 Teacher union Research for teachers
3 Parent information Research for parents and information for parents to navigate the education system
4 Research group in a university Research for researchers, policy makers, the broader education sector
5 Research group in government Research for researchers and policy makers
6 Research group in a university Portal of research for researchers, policy makers, and teachers
7 Research group in a university Portal of research for researchers, policy makers, and teachers
8 Independent research group Portal of research and does research for policy makers and teachers
9 Independent research group funded by government
Portal of research and information for the education sector in a specific area
10 Research group within a school district
Portal of research and information for a school district
11 Research group within a school district
Portal and discussion area of evidence-based practiced and knowledge mobilization for teachers
12 Independent research group Research, lesson plans, exemplary school practices for teachers
13 Research group in a university Research portal to support schools in a specific district
It is useful to think of our partners as fitting into 3 groups in by broad types: research groups
within larger organizations like universities, school boards, and governments (4, 5, 10, 11, 13); research
portals (6, 7, 8), and organizations with mandates that affect a specific group (i.e. teachers or parents)
(1, 2, 3, 9, 12). By focus of the research pages, organizations 1, 4, 5, 6, 7, 8, 9, 11, and 13 all have
specific research pages with defined foci on research while organizations 2, 3, 10 and 12 focus on
research in addition to other materials for their target audience. We discuss the prominence of
research on the organizations’ websites later in the paper (see figure 2).
It is important to note that some partners offer more than just research on their websites;
they offer information (that is not research-based) to help their audience members navigate the arena
that the organization works in. We categorize a few of our partner sites as ‘portals’. A website that is a
Studying websites as vehicles for research dissemination
CSSE – May 29, 2012
DRAFT- Not for citation without prior permission from the authors
12
portal is one that houses research on a variety of topics, there is not discussion, like on some of the
other websites of this research. Inevitably there is some overlapping in these categories.
When thinking about the categorization of organizations by type and website focus (Table 3) it
does not seem to matter which category the organization falls under to understand the variability of
use across the websites. However, when looking at downloads, type does seem to matter.
Organizations 12 and 2, categorized as organizations with a specific mandate, have the most
downloads (See Table 8). However, organizations 4 and 8, organizations who have specific mandates
to do knowledge mobilization have the most visits that result in a download. At this point of time, we
do not know if most of these downloads are research or non-research-based, but we will be moving
forward with this as part of our next steps as well as investigating further if our breakdown by type and
website focus hold.
Centrality of research in the website (downloads and content).
This section looks at the centrality of research on the websites in terms of content and
downloads. As shown in table 3, which categorized the organizations by type and by focus of website,
for some organizations research is more central than for others. For example, organizations 4, 6, 7, 8,
11, and 13 are primarily about research. Organizations 1, 2, 3, 5, 9, 10, and 12 have research on their
sites, but disseminating research is not the only purpose of the website. In other cases, for example
organization 10, the website has research on it but it also has methodological tools and tips for doing
research. Similarly, organization 1 has a lot of research on the website but also has information that is
not research based.

Studying websites as vehicles for research dissemination
CSSE – May 29, 2012
DRAFT- Not for citation without prior permission from the authors
13
Figure 2. The prominence of research on partner organizational websites
It is not a matter of the organization’s not having research at all on their websites; it is a matter
of whether or not is visible and accessible by the user. On organization 11’s website, it is not
immediately evident where on the website the research is situated. Therefore this site requires more
searching in order to find research than other partner websites. In this case we see organization 11
with the least amount of visible research and organizations 8, 4, 6, and 7 with the most visible research
on their websites. Organization 2 has research that is visible, but research is only a small part of the
site. Organizations 3, 1, 12, 9, 10, 5, and 13 have research on their websites but to varying degrees. It
would be reasonable to think that these differences may affect how often research is viewed or
downloaded, although we cannot verify that based on our findings so far.
A discussion of metrics and analysis.
Studying websites as vehicles for research dissemination
CSSE – May 29, 2012
DRAFT- Not for citation without prior permission from the authors
14
When we began, we were unable to find any research that used GA data to assess websites
other than from the standpoint of commercial enterprises looking at sales of various kinds. This type of
data is not relevant to what we are trying to accomplish – trying to understand how users use
educational organizations’ websites to use research because KM is not about the marketing of
products, it is about their usability. When we first started analyzing data for this project in 2010, we
took the metrics that Google Analytics recommends. For example average time on page tells us how
long on average visitors spent on an organization’s web page. This tells us, especially when compared
to other pages within the same website or similar pages from other websites, whether visitors are
staying on the pages long enough to be reading the information, or if they are just coming to the page,
skimming material and moving on. Therefore, our first effort (see Cooper et al., 2010) was a simple
analysis of how many people view certain pages and how much time they spend on a page. However,
gradually, through a process of trial and error, and through discussion with our partners, we have
expanded the range of metrics we look at including, numbers of visits and visitors; average time;
number of views of pages; the percentage of entrances to a site on certain pages; how many visitors
exit the website from specific pages; where visitors land; and if they come directly into the site or use a
search engine to find the site. We are looking at these data for sites overall and for particular pages
within sites that are identified by us, or our partners, as having a strong emphasis on research findings.
We also sought advice from both Google and several developers of analytics software who
helped us expand our choices. Newer metrics that that we are looking at are referring sources to the
websites, top 20 keywords that are used to find the websites, and landing pages.
Studying websites as vehicles for research dissemination
CSSE – May 29, 2012
DRAFT- Not for citation without prior permission from the authors
15
From looking at the individual metrics and comparing across metrics, we have learned how to
create our own calculations to understand use. Several calculations that we have created are
presented in this and our other papers, including how often users visit the homepage while on a
website; and what proportion of all visitors to a site visit specific research-based pages that our
partners identified. These percentages allow us to make comparisons within the site and across
partners so that we can start to create benchmarks around use. For example, the percentage of visitors
who view the homepage (Table 7) was created by dividing the number of visits to the homepage by
visits to the overall site. From that calculation we can see that the percentage of visitors who view the
homepage is low compared with overall site visits. Apparently most visitors never get to the homepage
and do not need it to navigate around the site even though most websites are organized on the
assumption that visitors will start at the home page (see Table 6).
Suffice it to say, learning to use these metrics and finding appropriate ways to analyze the data
they yield has been an iterative process of trial and error. We began working through the data on our
own to understand how websites are used and how we might compare them. Through this process we
recognized that we needed better tools. We have since worked with two consulting companies to
expand our capacities. These consultants have helped us to develop software codes that that allow us
to track usage and download data on our partners’ sites more accurately. These consultants have also
provided tools to help automate our collection and analysis of data, as well as insights into how we can
better use GA to get the data we want and the types of analysis we might do with the data we are
gathering. Currently we are using a tool called NextAnalytics that exports data directly from GA into an
Excel spreadsheet to allow for easy analysis.

Studying websites as vehicles for research dissemination
CSSE – May 29, 2012
DRAFT- Not for citation without prior permission from the authors
16
However, although the consultants have helped us to significantly improve our data collection
and analysis, working with the consulting companies required a lot of patience by our partners and us.
We have learned that when working with consultants it is necessary to be very clear about what exactly
we need; particularly when - as is often the case in Information Technology projects - we do not
necessarily have the expertise to explain what we need in terms that are meaningful to the developers,
or to understand the limitations of GA. We have to be careful to track both web pages and downloads
separately and which in turn required ongoing conversations with software developers and GA experts
in order to figure out what to track.
Further complications arose due to an update in the code GA uses to track websites. The code
our developers initially created to track downloads (pdf, Word documents, etc) on our partners’ sites
was for the traditional version of GA, while some of our partners use the newer Async code on their
sites which is not compatible with the older version. Therefore we had to work with both the
developers and our partners to ensure our project is compatible with all of our partners’ websites. We
have since discovered that Google Analytics constantly updates and changes features, leaving us
constantly struggling to keep up with the changes and their implications for our study.
High variability across websites in type and use
There is a wide gap among the websites on every indicator, including how many visitors come
to the site each month; the percentage of new visits; whether users enter the site directly or through a
search engine, and the use of homepage as a navigation point.
DRAFT- Not for citation without prior permission from the authors
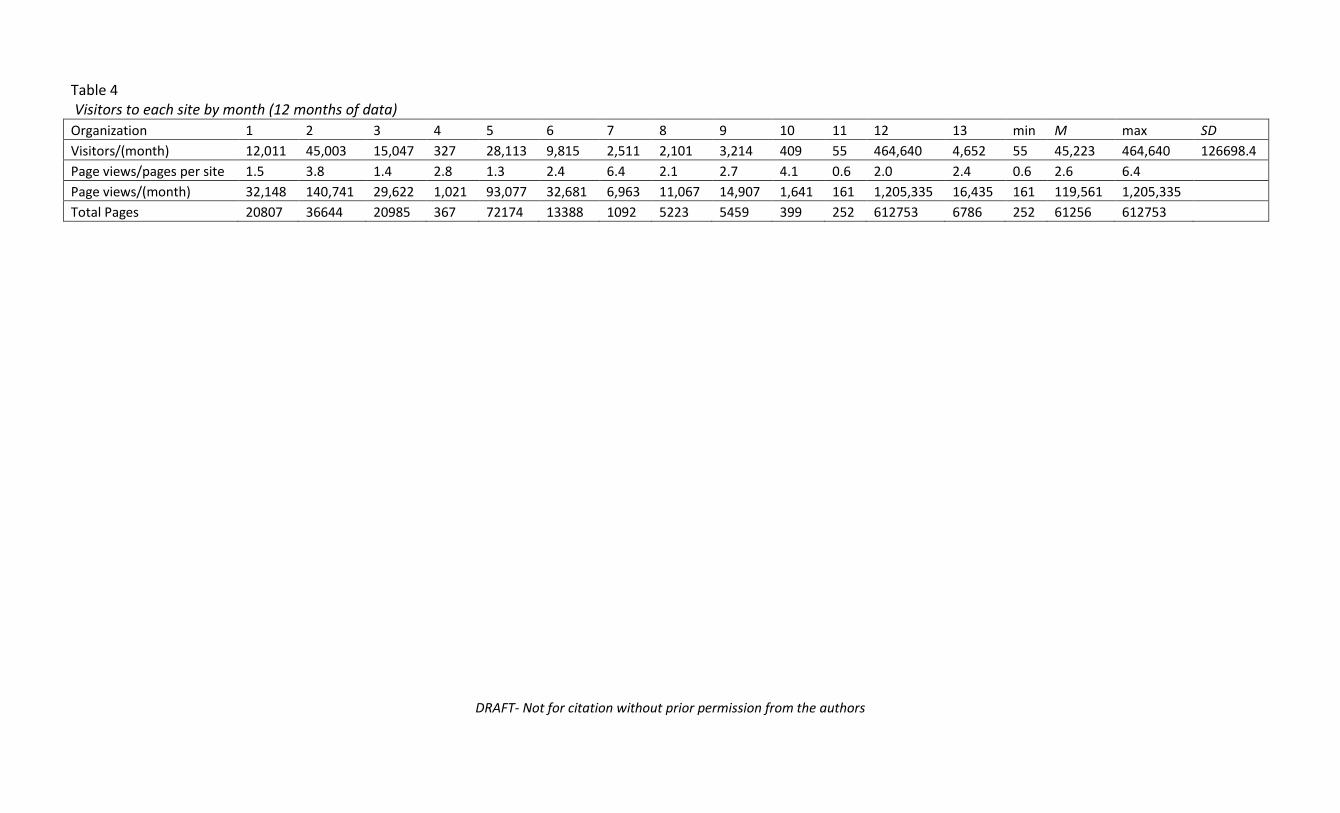
Table 4 Visitors to each site by month (12 months of data)
Organization 1 2 3 4 5 6 7 8 9 10 11 12 13 min M max SD
Visitors/(month) 12,011 45,003 15,047 327 28,113 9,815 2,511 2,101 3,214 409 55 464,640 4,652 55 45,223 464,640 126698.4
Page views/pages per site 1.5 3.8 1.4 2.8 1.3 2.4 6.4 2.1 2.7 4.1 0.6 2.0 2.4 0.6 2.6 6.4 Page views/(month) 32,148 140,741 29,622 1,021 93,077 32,681 6,963 11,067 14,907 1,641 161 1,205,335 16,435 161 119,561 1,205,335
Total Pages 20807 36644 20985 367 72174 13388 1092 5223 5459 399 252 612753 6786 252 61256 612753
DRAFT- Not for citation without prior permission from the authors
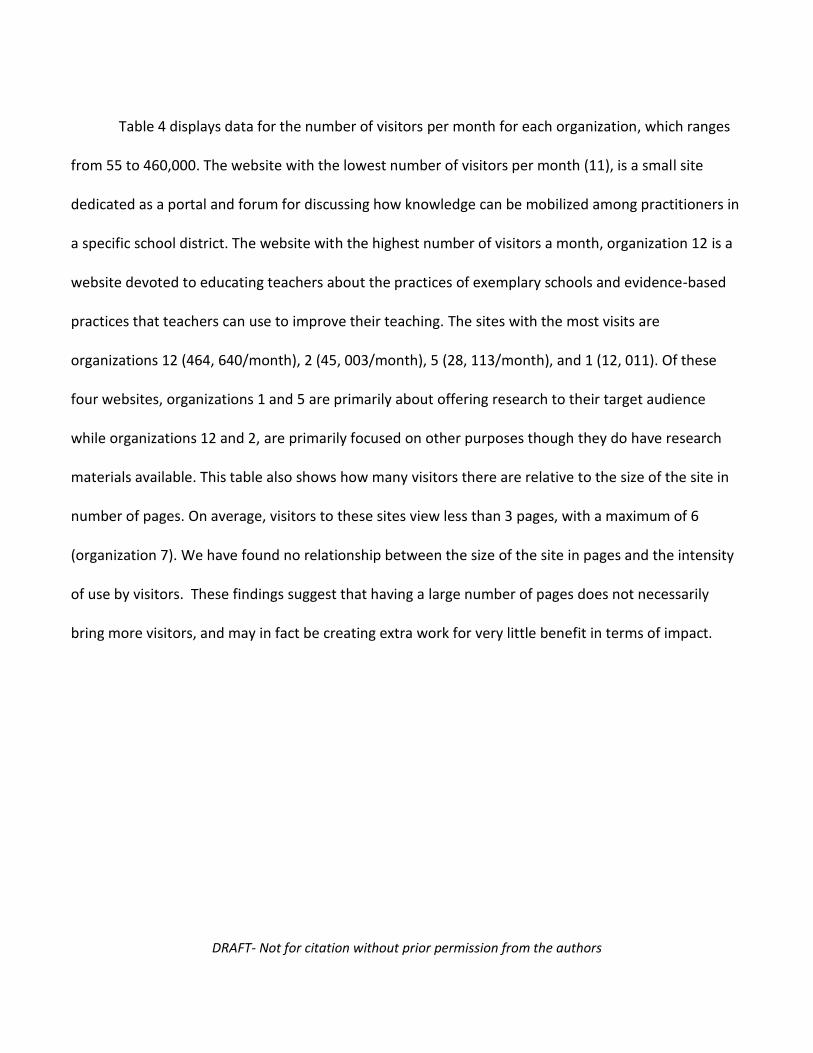
Table 4 displays data for the number of visitors per month for each organization, which ranges
from 55 to 460,000. The website with the lowest number of visitors per month (11), is a small site
dedicated as a portal and forum for discussing how knowledge can be mobilized among practitioners in
a specific school district. The website with the highest number of visitors a month, organization 12 is a
website devoted to educating teachers about the practices of exemplary schools and evidence-based
practices that teachers can use to improve their teaching. The sites with the most visits are
organizations 12 (464, 640/month), 2 (45, 003/month), 5 (28, 113/month), and 1 (12, 011). Of these
four websites, organizations 1 and 5 are primarily about offering research to their target audience
while organizations 12 and 2, are primarily focused on other purposes though they do have research
materials available. This table also shows how many visitors there are relative to the size of the site in
number of pages. On average, visitors to these sites view less than 3 pages, with a maximum of 6
(organization 7). We have found no relationship between the size of the site in pages and the intensity
of use by visitors. These findings suggest that having a large number of pages does not necessarily
bring more visitors, and may in fact be creating extra work for very little benefit in terms of impact.

DRAFT- Not for citation without prior permission from the authors
Table 5 Overall new visits to each website
Organization 1 2 3 4 5 6 7 8 9 10 11 12 13 min M max SD
Overall new visits (%) 74.39 58.49 78.53 58.51 59.22 71.02 6.29 65.37 51.22 30.11 41.36 61.89 65.56 6.29 55.54 78.53 19.8
DRAFT- Not for citation without prior permission from the authors
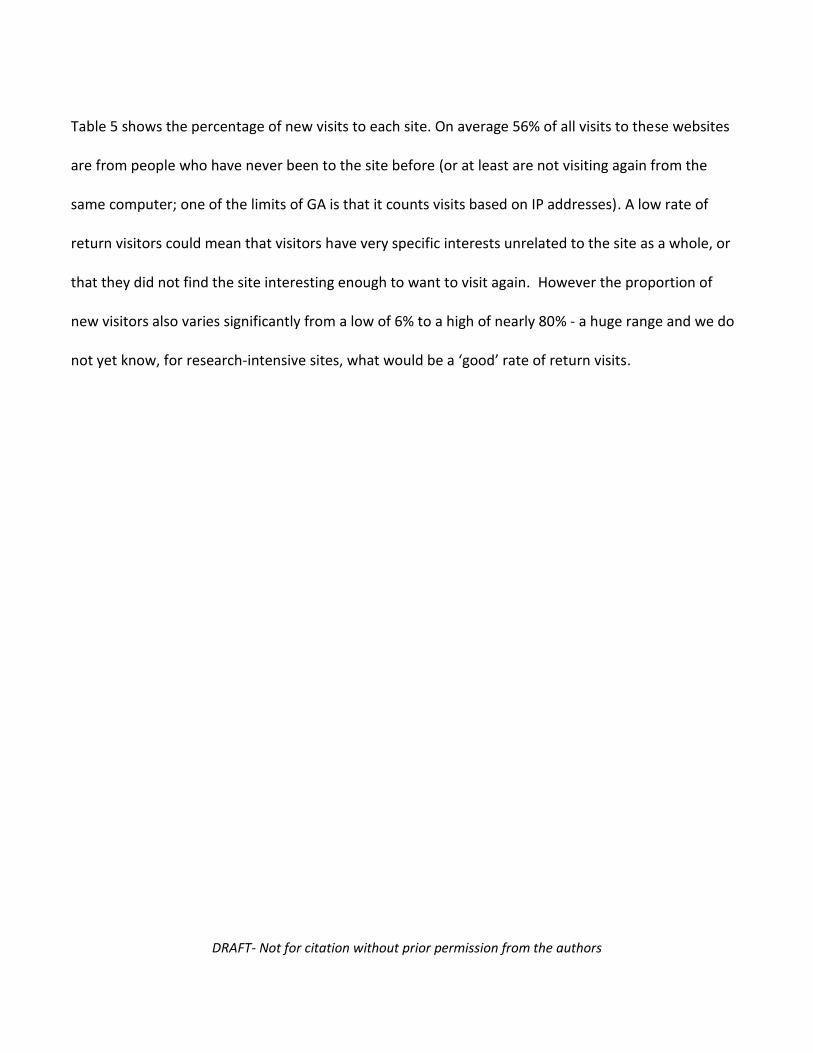
Table 5 shows the percentage of new visits to each site. On average 56% of all visits to these websites
are from people who have never been to the site before (or at least are not visiting again from the
same computer; one of the limits of GA is that it counts visits based on IP addresses). A low rate of
return visitors could mean that visitors have very specific interests unrelated to the site as a whole, or
that they did not find the site interesting enough to want to visit again. However the proportion of
new visitors also varies significantly from a low of 6% to a high of nearly 80% - a huge range and we do
not yet know, for research-intensive sites, what would be a ‘good’ rate of return visits.

DRAFT- Not for citation without prior permission from the authors
Table 6 % of visitors who view the homepage
Organization 1 2 3 4 5 6 7 8 9 10 11 12 13 Min M Max SD
Home page visits/Overall visits (%) 14.19 8.21 29.46 11.02 17.38 18.33 33.35 28.56 19.87 34.46 10.36 36.46 36.46 8.21 22.93 36.46 0.11

DRAFT- Not for citation without prior permission from the authors
These data show the wide range of use across a number of different websites that are all intended, at
least in part, to disseminate research. However these data are for the complete sites whereas our
interest is primarily in the use of research-based materials. We now turn to an analysis of how visitors
to these websites use research pages, based on specific pages with research content that were
identified for us by our partner organizations. It must be noted that because each organization
indicated which pages they wanted our team to track, some organizations have more research pages
that we are tracking.
Use of research pages.
Just as there is much variability in use of the total organizations’ websites, there is a wide range
of use on the web pages that the partners asked us to track. On some partner websites we are tracking
both general content pages and specific research pages. On each partner website we are tracking
between four and eleven pages, of which more than half are research pages. When calculating the
percentages for research pages (Table 7), we only count the pages that have been identified as
research pages (although we do report data on the home page for comparison purposes). For both the
research and non-research pages, partners have indicated that they think that the reason why some of
their pages might not get used very much is that the page is hidden behind other pages and many clicks
are needed to get to it. However that explanation would only be true if most visitors to research pages
arrived from elsewhere on the site, a point on which we provided data in Table 5. At this point, neither
we nor our partners can provide good explanations as to why some pages receive much more traffic
than others.
DRAFT- Not for citation without prior permission from the authors
Table 7 The overall use of research pages Organization 1 2 3 4 5 6 7 8 9 10 11 12 13 Min M Max SD
Visits to research page as a % of all visits (%)
1.5 0.2 1.3 4.2 1.4 0.8 1.5 12.1 2.0 0.4 5.9 1.2 13.6 0.2 3.7 13.6 0.044204
Avg time on page (minute)
01:20 01:42 01:04 03:51 03:20 02:08 02:16 00:58 00:32 01:17 02:07 01:47 00:58 00:58
01:02 03:51 0.024166
Bounce rate (%)
48.7 75.2 44.9 55.9 81.8 85.4 72.6 37.3 28.7 38.3 80.9 67.0 48.3 28.7 58.9 85.4 0.192683901
Repeat visitors as a % of all site visits (%)
0.8 0.08 0.3 1.7 0.3 0.1 0.2 2.6 3.1 0.3 24.1 0.3 2.9 0.08 2.1 24.1 6.668244
% visitors to the research page for whom this was their entry to the website (%)
32.6 37.5 35.5 22.8 32.5 27.9 41.4 19.1 0.0 10.7 16.9 28.4 26.8 0.0 21.9 41.4 0.115649
DRAFT- Not for citation without prior permission from the authors
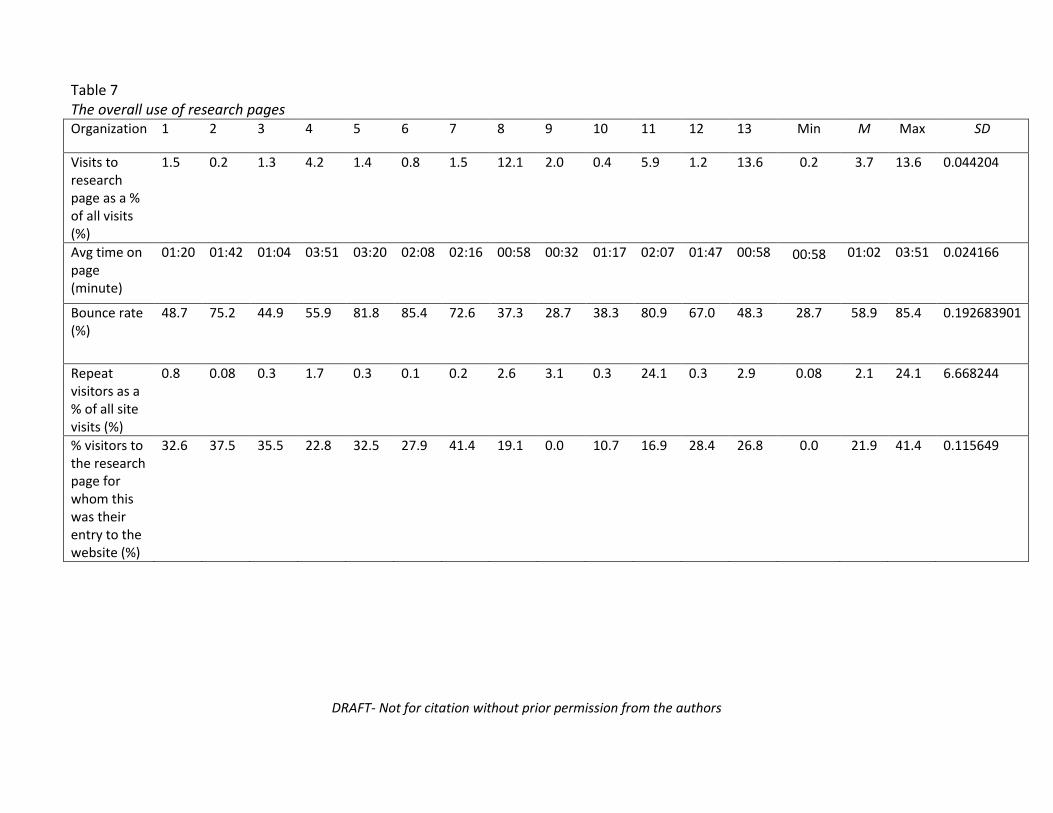
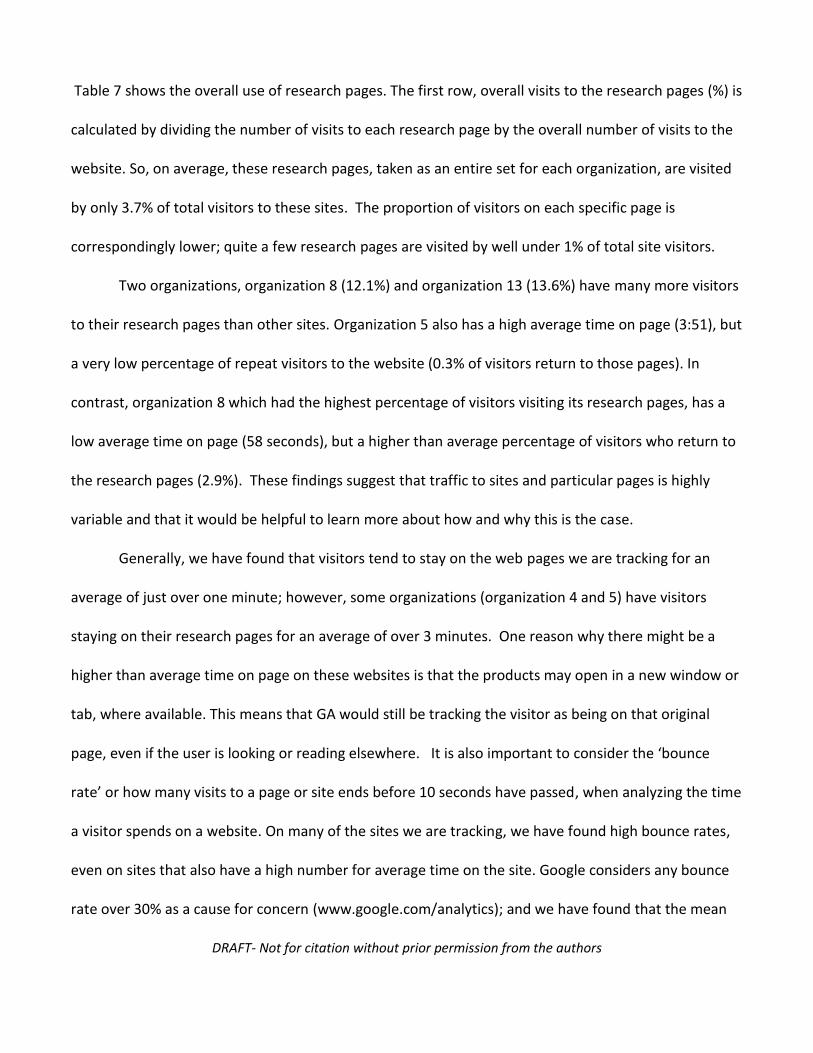
Table 7 shows the overall use of research pages. The first row, overall visits to the research pages (%) is
calculated by dividing the number of visits to each research page by the overall number of visits to the
website. So, on average, these research pages, taken as an entire set for each organization, are visited
by only 3.7% of total visitors to these sites. The proportion of visitors on each specific page is
correspondingly lower; quite a few research pages are visited by well under 1% of total site visitors.
Two organizations, organization 8 (12.1%) and organization 13 (13.6%) have many more visitors
to their research pages than other sites. Organization 5 also has a high average time on page (3:51), but
a very low percentage of repeat visitors to the website (0.3% of visitors return to those pages). In
contrast, organization 8 which had the highest percentage of visitors visiting its research pages, has a
low average time on page (58 seconds), but a higher than average percentage of visitors who return to
the research pages (2.9%). These findings suggest that traffic to sites and particular pages is highly
variable and that it would be helpful to learn more about how and why this is the case.
Generally, we have found that visitors tend to stay on the web pages we are tracking for an
average of just over one minute; however, some organizations (organization 4 and 5) have visitors
staying on their research pages for an average of over 3 minutes. One reason why there might be a
higher than average time on page on these websites is that the products may open in a new window or
tab, where available. This means that GA would still be tracking the visitor as being on that original
page, even if the user is looking or reading elsewhere. It is also important to consider the ‘bounce
rate’ or how many visits to a page or site ends before 10 seconds have passed, when analyzing the time
a visitor spends on a website. On many of the sites we are tracking, we have found high bounce rates,
even on sites that also have a high number for average time on the site. Google considers any bounce
rate over 30% as a cause for concern (www.google.com/analytics); and we have found that the mean
Studying websites as vehicles for research dissemination
CSSE – May 29, 2012
DRAFT- Not for citation without prior permission from the authors
25
bounce rate across our partner sites is 58.9%. However, most significantly time on site and bounce
rates has taught us that we should not look at an individual metric in isolation; we need to compare
and contrast them in order to get a better overview of what is happening on each website.
The second last row in Table 7, repeat visitors, shows the percentage of visitors who are making
a return visit to these pages. It is evident that visitors do not often return to research pages, with only
2% of the websites’ visitors returning to the identified research pages. This number is much lower than
the return visit rates for sites as a whole, shown in Table 5. A clear outlier is organization 11 whose
visitors return to the research pages 24% of the time. Organization 11 has a very small number of
visitors overall which suggests a small group of frequent users. Organization 11 is a research unit
placed within a school board and has research on its website that is specific for use by practitioners
within that board. Based on the data we have, we can surmise that these practitioners may be coming
back to the website to check for updates or added research posted on the website.
An interesting feature of the research pages is how seldom they are the first page visitors come
to when on the website. They would show as entry pages if visitors were coming from a search engine
that identified these pages. Although we know that most visitors do not enter websites through the
homepage (see Edelstein et al., 2012; Table 6), we presumed that the pages that the partners selected
would have been visited more often than the data show. On average visitors to the research pages are
entering the site there only 21.9% of the time with the maximum 41.1%. This maximum is in to
organization 7, a research portal.
As noted in table 2, we have data on downloads for different periods of time for each partner
organization. As these data are also quite recent for us, we are only now examining their implications

Studying websites as vehicles for research dissemination
CSSE – May 29, 2012
DRAFT- Not for citation without prior permission from the authors
26
and figuring out how best to analyze and present them. It is beyond the scope of this paper to discuss
specific downloads.

DRAFT- Not for citation without prior permission from the authors
Table 8 Download analysis
Organization 1 2 3 4 5 6 7 8 9 10 11 12 13 min M Max SD
Months of website data 12 12 12 12 12 12 12 12 12 12 12 12 12 12 12 12 0
Months of download data 9 12 12 12 12 12 12 12 5 6 12 3 3 0 8.46 12 4.44
Overall visits/(month) 13,416 3,181 16,143 373 32,770 11,112 2,655 2,433 3,789 474 59 519,706 5,259 59 50,875 519,706 141706.5
Overall page views/(month) 32,148 140,741 29,622 1,021 93,077 32,681 6,963 11,067 14,907 1,641 161 1,205,335 16,435 161 121,985 1,205,335 328063.2
Downloads/12 982 6,631 0 80 22 117 285 707 410 177 3 2,453 753 0 971 6,631 1827.2545
Downloads/(month) 1,309 6,631 0 80 22 117 285 707 983 353 3 9,810 3,011 0 1,793 9,810 3039.677
Downloads/overall visits (%) 7.32 12.47 0.00 21.56 0.07 1.06 10.73 29.08 10.81 37.27 5.37 0.47 14.31 0.00 11.58 37.27 0.116
Downloads/overall page views (%) 3.05 4.71 0.00 7.87 0.02 0.36 4.09 6.39 2.75 10.76 1.96 0.20 4.58 0.00 3.60 10.76 0.033
DRAFT- Not for citation without prior permission from the authors
Table 8 compares website visits with the total number of downloads (meaning all downloads
registered on GA, whether or not these were of research materials). The relationship between visits,
page views and downloads is complicated. We do not know what is the best indicator of intensity of
downloading because GA only tracks clicks on products, not whether or not the user has saved the
downloaded file or if they leave it open on their screen. Organization 12 has the most downloads per
month (9,810), while organization 11 has the least (3). We can see from the data that on most
websites, visitors are downloading relatively few products but the variability is very large. On some
sites, a large proportion of visitors are downloading material while on other sites virtually nobody is.
These differences could be a function of the kinds of material available, the needs of visitors, or the
organization of the site.
What we are learning and where we might go next
Based on our findings thus far we are recommending the following to our partners:
1. Consider the data on the use of the homepage. If less than a quarter of all the visits to all of the
websites result in a user visiting the homepage, and more visitors enter websites through
Google or other search engines, perhaps home pages should get less attention and not be seen
as crucial to site navigation, whereas tools for raising a site`s profile on search engines would be
more useful.
2. Although organizations see their websites as wholes that require coherence (for example
consistency in style and formatting), most visitors do not experience the site that way. Setting
up a website to highlight new research and/or new products that are available for download
might be better when users more often than not enter on pages that are specific to their search
rather than entering the website directly.
Studying websites as vehicles for research dissemination
CSSE – May 29, 2012
DRAFT- Not for citation without prior permission from the authors
29
3. Focus on raising the percentage of repeat visits. If less than 3% of visitors are return to the
identified research pages and less than 10% of visitors return to the overall website (see
Appendix A), than the organizations are not building a loyal following – if that is the goal.
4. Put effort into renewal of the current website and linking it to relate to other organizations
rather than expanding or building new websites. Having many pages and products may reduce
the impact of the information. Linking to other websites and tagging products with the right
keywords could help users who are searching the Internet for research on education find what
they are looking for. What is not needed on the Internet is yet another website, but rather for
organizations to share research and to promote use. As noted, the purpose of this paper is to
provide a snapshot of some of the data we have analyzed and to provide insights into the
process for analyzing the data. We recognize that our work is still quite preliminary and we are
challenged by the fact that this is a new area of research and there are very few studies from
which to build. Our next steps include looking deeper into the data we have, particularly the
data on downloads, and potentially adding more products and partners to allow us to develop
benchmarks for these kinds of organizations. We also intend to look at whether or not visitors
enter more often from a search engine (i.e. Google) as compared to direct entry (i.e. by typing
in a url). This would allow us to understand more fully why visitors are not using the homepage
as a navigation tool and what organizations can do to raise their profile in search engines. We
also want to work with the limitations of Google Analytics and to take advantage of its
capabilities of highlighting data on use.

Studying websites as vehicles for research dissemination
CSSE – May 29, 2012
DRAFT- Not for citation without prior permission from the authors
30
References
Banister, E., Leadbeater, E., & Marshall, E.A. (Eds). (2011). Knowledge translation in context:
Indigenous, policy, and community settings. University of Toronto Press, Toronto, ON.
Bayliss, H., Wilcox, A., Stewart, G., & Randall, N. (2012). Does research information meet the needs of stakeholders? Exploring evidence selection in the global management of invasive species. Policy Press, 8(2). 37-56. Belkhodja, O., Amara, N., Landry, R., & Ouimet, M. (2007). The extent and organizational
determinants of research utilization in Canadian health services organizations. Science
Communication, 28(3), 377-417.
Bennet, A., and Bennet, D., et al. (2007). Knowledge mobilization in the social sciences and humanities:
Moving from research to action. MQI PRESS: Virginia.
Berhstock,E., Drill, D., & Miller, S. (2009). Is the Supply in Demand? Exploring How, When, and Why Teachers Use Research. Napierville, IL: Learning Point Associates.
Chavkin, N., & Chavkin, A. (2008). Promising website practices for disseminating research on family-
school partnerships to the community. The School Community Journal, 18(1). 79-92.
Clifton, B. (2008). Advanced web metrics with Google analytics. Indianapolis: Wiley Publishing Inc.
Cooper, A., Levin, B., & Campbell, C. (2009). The growing (but still limited) importance of evidence in
education policy and practice. Journal of Educational Change, 10. 159-171.
Cooper, A. (2012), Knowledge mobilization intermediaries in education: A cross-case analysis of 44
Canadian organizations, Unpublished doctoral thesis: University of Toronto.
Cooper, A., Edelstein, H., Levin, B., & Leung, J. (May 2010). Use of web-based research materials in education: Is uptake occuring? Paper presented at the 39th Annual Canadian Society for the Study of Education Conference. Montreal, ON.
Studying websites as vehicles for research dissemination
CSSE – May 29, 2012
DRAFT- Not for citation without prior permission from the authors
31
Cordingley, P. (2008). Research and evidence-informed practice focusing on practice and practitioners.
Cambridge Journal of Education, 38 (1). 37-52.
Court, J., and Young, J. (2003, August) Bridging research and policy: Insights from 50 case studies. Retrieved October 2009, from Overseas Development Institute: http://www.odi.org.uk/resources/details.asp?id=148&title=bridging-research-policy-insights-50-case-studies
Davies, H.T.O., Nutley, S., Smith, P. (2000). What works: Evidence-based policy and practice in public
services. The Policy Press: University of Bristol.
Davies, H. T.O, & Nutley, S. (2008). Learning more about how research-based knowledge gets used:
Guidance in the development of new empirical research. William T. Grant Foundation, New York, NY.
Dede, C. (2000). The role of emerging technologies for knowledge mobilization, dissemination, and use
in education, paper commissioned by the Office of Educational Research and Improvement, US
Department of education. Retrieved February 2010 from
http://www.virtual.gmu.edu/ss_pdf/knowlmob.pdf
Dobbins, M., Ciliska, D., Cockerill, R., Barnsley, J., & DiCenso, A. (2002). A framework for the
dissemination and utilization of research for health-care policy and practice. The Online Journal of
Knowledge Synthesis for Nursing, 9(7). 1-12.
Duffy, M. (2000). The Internet as a research and dissemination resource. Health Promotion International, 15(4).
349-353.
Edelstein, H., Shah, S., & Levin, B. (2012). Mining for data: Empirical data from the Use of Online
Research project. IJHSS, 2(9). 1-12. Retrieved from
http://www.ijhssnet.com/journals/Vol_2_No_9_May_2012/1.pdf
Studying websites as vehicles for research dissemination
CSSE – May 29, 2012
DRAFT- Not for citation without prior permission from the authors
32
Edelstein, H., & Levin, B. (May 29, 2011). Conducting new research in knowledge mobilization. Paper
presented at the 40th Annual Canadian Society for the Study of Education Conference, Fredericton, NB.
Estabrooks, C. (1999). Modeling the individual determinants of research utilization. Western Journal of
Nursing Research, 21 (6). 758-771.
German, E., Urquhart, D., & Wilson, C. (2008). Best practices for knowledge mobilization. A report
prepared for the Social Planning Council of Ottawa. Ottawa, Ontario. 1-39.
Google Analytics. (2012). www.google.com/analytics
Graham, I., Logan, J., Harrison, M., Straus, S., Tetroe, J., Caswell, W., & Robinson, N. (2006). Lost in
knowledge translation: Time for a map? The Journal of Continuing Education in the Health Professions,
26 (1). 13-24.
Greenhalgh, T., & Wieringa, S. (2011). Is it time to drop the ‘knowledge translation’ metaphor? A critical
literature review. Journal of the Royal Society of Medicine, 104. 501-509.
Hartley, K. & Bendixen, L. (2001). Educational Research in the Internet Age: Examining the Role of Individual Characteristics. Educational Researcher, 30(9): 22 – 26 Hattie, J. (2009). Visible learning: A synthesis of over 800 meta-analyses relating to achievement.
Routledge: New York.
Hemsley-Brown, J., and Sharp, C. (2003). The use of research to improve professional practice: A
systematic review of the literature. Oxford Review of Education, 29 (4). 449-470.
Hora, M., & Millar, S. (2011). A guide to building education partnerships: Navigating diverse cultural
contexts to turn challenge into promise. Stylus Publishing: Virginia.
Jadad, A., Haynes, R., Hunt, D., & Browman, G. (2000). The Internet and evidence-based decision-
making: A needed synergy for efficient knowledge management in health care. Journal of Canadian
Medical Association, 162(3). 362-365.
Studying websites as vehicles for research dissemination
CSSE – May 29, 2012
DRAFT- Not for citation without prior permission from the authors
33
Jadad, A. (1999). Promoting partnerships: Challenges for the internet age, BMJ, 319, 761-764.
Jana, S., & Chatterjee, S. (2004). Quantifying web-site visits using web statistics: An extended
cybermetrics study. Online Information Review, 28(3). 191-199.
Kerner & Hall (2009). Research dissemination and diffusion: Translation within science and society.
Research on Social Work Practice, 19(5). 519-530.
Kuruvilla, S., Mays, N., Pleasant, A., Walt, G. (2006). Describing the impact of health research: A
research impact framework. BMC Health Services Research, 6. 1-18.
Lavis, J.N., Davies, H.T.O., Oxman, A.D., Denis, J.L., Golden-Biddle, K., & Ferlie, E. K. (2005). Towards Systematic Reviews That Inform Health Care Management and Policy-Making. Journal of Health Services Research and Policy 10 (Supplement 1). 35-48.
Lavis, J., Robertson, D., Woodside, J., McLeod, C., & Abelson, J. (2003). How can research organizations
more effectively transfer research knowledge to decision makers? The Millbank Quarterly, 81(2). 221-
248.
Ledford, J., and Tyler, M. (2007). Google analytics 2.0. Indianapolis: Wiley Publishing Inc.
Lencucha, R., Kothari, A., & Hamel, N. (2010). Extending collaborations for knowledge translation:
Lessons from the community-based participatory research literature. Evidence & Policy, 6(1). 61-75.
Levin, B. (2011). Mobilising research knowledge in education. London Review of Education, 9(1). 15-26.
Levin, B. and Edelstein, H. (2010). Research, policy and practice in education. Education Canada, 50 (2).
Canadian Education Association: Toronto. 29-30.

Studying websites as vehicles for research dissemination
CSSE – May 29, 2012
DRAFT- Not for citation without prior permission from the authors
34
Levin, B. (2008). Thinking about knowledge mobilization. A Paper prepared for an invitational
symposium sponsored by the Canadian Council on Learning and the Social Sciences and Humanities
research Council of Canada.
Levin, B. (2004). Making research matter more. Education Policy Analysis Archives, 12 (56). 1-20.
Lomas, J., Culyer, T., McCutcheon, C., McAuley, L., & Law, S. (2005). Conceptualizing and combining
evidence for health system guidance. Canadian Health Services Research Foundation. 1-43.
Martin, S. (2010). Co-production of social research: Strategies for engaged scholarship. Public Money &
Management, 30(4). 211-218.
Maynard, A. (2007). Translating evidence into practice: why is it so difficult? Public money and
management. 251-256.
Mitton, C., Adair, C., McKenzie, E., Patten, S., Perry, B. (2007). Knowledge transfer and exchange:
Review and synthesis of the literature. The Milbank Quarterly, 85(4). 729-768.
Morahan-Martin, J. (2004). How Internet users find, evaluate, and use online health information: A
cross-cultural review. CyberPsychology & Behavior, 7(5). 497-511.
Muttiah, N., Georges, K., Brackenbury, T. (2011). Clinical Research Perspectives on Nonspeech
Oral Motor Treatments and Evidence-Based Practice. American Journal of Speech-Language Pathology,
20. 47-59.
Nelson, S., Leffler, J., & Hansen, B. (2009). Toward a research agenda for understanding and improving the use of research evidence. Portland, OR: Northwest Regional Educational Laboratory.
Nutley, S., Walter, I., Davies, H.T.O. (2007). Using evidence: How research can inform public services.
The Policy Press: University of Bristol.
Studying websites as vehicles for research dissemination
CSSE – May 29, 2012
DRAFT- Not for citation without prior permission from the authors
35
Peterson, R., & Merino, M. (2003). Consumer information search behavior and the Internet. Psychology
& Marketing, 20(2). 99-121
Phippen, A., Sheppard, L., & Furnell. S. (2004). A practical evaluation of web analytics. Internet
Research, 14(4). 284-293.
Proctor, R., Williams, R., Stewart, J. (2010). If you build it, will they come? How researchers perceive and
use web 2.0. Report for the Research Information Network. 1-64.
Qi, J. & Levin, B. (2010). Strategies for mobilizing research knowledge: A conceptual model and its
application. Paper presented at the 39th Annual Canadian Society for the Study of Education
Conference, Montreal, Quebec.
Rajani, M. K., & Chandio, M. S. (2004). Use of Internet and its effects on our Society. In Proceedings of
the National Conference on Emerging Technologies (NCET), December 18-19, 2004, Karachi, Pakistan
(pp. 157-161). Retrieved January, 27, 2011, from
http://www.szabist.edu.pk/NCET2004/Docs/Session%20VIII%20Paper%20No%202%20(P%20157-
161).pdf
Sá, C., Li, S. and Faubert, B. (2011) ‘Faculties of education and institutional strategies for knowledge mobilization: An exploratory study’, Higher Education, vol 61, no 4, pp 501-512.
Sebba, J. (2007). Enhancing impact on policy-making through increasing user engagement in research.
In L. Sunders (Ed.), Educational research and policy-making. London: Routledge.
SSHRC–Social Science, Humanities Research Council. (2008) SSHRC’s knowledge mobilization strategy. Ottawa, Canada.
Stanton, J., & Rogelberg, S. (2001). Using Internet/intranet web pages to collect organizational research
data. Organizational Research Methods, 4(3). 200-217.
Thelwall, M. (2002). Conceptualizing documentation on the web: An evaluation of different heuristic-
based models for counting links between university web sites. Journal of the American Society for
Information Science and Technology, 53(12), 995-1005.
Titler, M. (2008). The evidence for evidence-based practice implementation. In Patient safety and
quality. An evidence-based handbook for nurses. Hughes, R.G. (Eds). Rockvill, MD. Agency for
Healthcare Research and Quality.
Studying websites as vehicles for research dissemination
CSSE – May 29, 2012
DRAFT- Not for citation without prior permission from the authors
36
Waddell, C. (2002). So much research evidence, so little dissemination and uptake: Mixing the useful
with the pleasing. Evidence Based Nursing, 38(5). 1-4.
Walter, I., Nutley, S., & Davies, H. (2003). Research impact: A cross sector review. Report written for the
Research Unit for Research Utilisation, University of St. Andrew’s. Scotland.
Weiss, C. (1980). Knowledge creep and decision accretion. Science Communication, 1 (3). 381-404.
Weiss, C. (1979). The many meanings of research utilization. Public Administration Review, 39 (5). 426-
431.