Embed Size (px)
Citation preview

1
Studying the Role of Surface Chemistry on
Polyelectrolyte Adsorption Using Gold-thiol Self-
assembled Monolayer with Optical Reflectivity
Plinio Maroni, Francisco Javier Montes Ruiz-Cabello and Alberto Tiraferri*
Department of Inorganic and Analytical Chemistry, University of Geneva, Sciences II,
Quai Ernest-Ansermet 30, 1205 Geneva, Switzerland
*Corresponding author e-mail address: [email protected], phone: +41 22 379 6421
Supporting Information
Electronic Supplementary Material (ESI) for Soft Matter.This journal is © The Royal Society of Chemistry 2014

2
Electrokinetic and sizing measurements of polymers. Electrokinetic and sizing
measurements were performed by light scattering with a ZetaNano ZS (Malvern Instruments,
Worcestershire, UK). A final polyelectrolyte concentration of 1 g/L was employed. The samples
were equilibrated for 90 s in the cell prior to the measurements. All experiments were conducted
in 10 mM NaCl. The electrophoretic mobility and the size of sodium poly(styrene sulfonate)
(PSS) were determined at pH 4.3, while those of poly(diallyldimethyl ammonium chloride)
(PDADMAC) were measured at pH 9.6. The measured values are reported in Table S1.
Table S1
polymer pH electrophoretic mobility
(×10−8, m2 V−1s−1)
hydrodynamic radius
(nm)
PSS 4.3 −3.51 ± 0.02 17.0 ± 3.5
PDADMAC 9.6 2.26 ± 0.54 3.3 ± 0.2

3
Surface potential measurements and calculations. Measurements were conducted with
a closed-loop atomic force microscope (AFM, MFP-3D, Asylum Research) mounted on an
inverted optical microscope (Olympus IX70), adapting the procedure described in detail
elsewhere.1,2
All force measurements were conducted in a fluid cell, which was separated with a
Teflon spacer into two compartments. The substrate carrying the SAM film was located on one
side of the spacer and this side was filled with pure electrolyte solution of the desired chemistry.
On the other side of the spacer, a suspension of sulfate latex particles with diameter of 3 μm
(Invitrogen) was injected and left to deposit on the substrate. The fluid cell was then flushed with
the same salt solution as the one used to prepare the latex suspension in order to exchange the
liquid and to remove the remaining particles that did not attach to the substrate. Prior to use, the
particles had been dialyzed for about one week against Milli-Q water, until the conductivity
reached the value of the pure water.
The surface potential of the particle was initially measured by conducting force
measurements between two individual sulfate latex particles. One particle was picked up with
the cantilever, and the particle was centered above another particle deposited on the substrate.
The forces were obtained from the cantilever deflection recorded in the approach part of the force
curves and the spring constant of the cantilever. The spring constant was measured with the
thermal noise method. The surface potential of the particle probe was thus calculated. Forces
between latex particles and the SAM film were subsequently measured by recording the
interaction forces between the surface and the cantilever modified with the latex particle of
known surface potential. In particular, a measurement sequence consisted in measuring the
symmetric system, then the asymmetric system, and finally the symmetric system again. All

4
experiments were conducted in 10 mM NaCl and the surface potential of the various SAM films
was measured at pH 4 and 10.
Forces between electric double layers were modeled with the Poisson-Boltzmann (PB)
theory.2,3
In particular, the Poisson-Boltzmann equation was solved for the case of two charged
plates and the Derjaguin approximation was applied to model the sphere-sphere and sphere-plate
geometries of our experiments. We consider two charged plates with an electrolyte solution in
between containing different types of ions i of number concentration ci and charge zi expressed in
units of the elementary charge q. The electric potential ψ(x) depends on the position x, whose
origin is fixed at the midplane and the two surfaces are located at x =± h/2, where h is the
separation distance between the plates. This potential profile can be obtained from the PB
equation:4,5
2
2
0
iz q
i ii
d qz c e
dx
, (S1)
where ε0 is the dielectric permittivity of vacuum, ε the dielectric constant with a value of 80 for
water at room temperature, β = 1/(kBT) is the inverse thermal energy, T is the absolute
temperature, and kB is the Boltzmann constant. The PB equation can be solved numerically
subject to the constant regulation (CR) boundary conditions:
0
/2
/ 2I D
x h
dC h
dx
, (S2)
where the subscript ± refers to the right (+) or left (−) surface, D
and
denote the diffuse-
layer potentials and surface charge density of the isolated surfaces, and
IC
their inner layer

5
capacitances. The diffuse-layer potential of an isolated surface is related to the surface charge
density by
1/2
02 1i Dz q
B iik T c e
, (S3)
where the ± signs on the right-hand side of the equality sign refer to positive and negative
potentials. Instead of the inner layer capacitance, we report the regulation parameter defined
as:4,6
D
D I
Cp
C C
, (S4)
where for either surface the diffuse-layer capacitance is given by
1/22
0
1/2
1
21
i D
i D
z q
i ii
Dz qBD
ii
z c eqC
k Tc e
. (S5)
The regulation parameter provides a more intuitive interpretation of the boundary
conditions, since 1p
refers to constant charge (CC) conditions, and
0p to constant
potential (CP) conditions. One should recall that the parameters D
,
,
C
, and p
refer
to the surfaces at infinite separation, and are thus properties of the single, isolated surface. When
two surfaces approach, the actual diffuse-layer potentials and the surface charge densities will
vary with the separation distance.2,5,6
Forces between particles are calculated from the disjoining pressure, using the following
equations:3,4
2
012
iz q
B ii
dk T c e
dx
. (S6)

6
Once the pressure is known as a function of the separation distance, free energy per unit
area can be calculated by its integration:
' 'h
W h h dh
. (S7)
Once this quantity is obtained, the forces between two particles can be found by invoking
the Derjaguin approximation:3
2 effF R W , (S8)
where the effective radius is given by:
1 2
1 2
eff
R RR
R R
, (S9)
where R1 and R2 are the radii of the two particles involved (sphere-sphere geometry). In the
symmetric sphere-sphere case R1 = R2 = R, and 2effR R , while in the particle-surface system,
effR R . This PB calculation of the forces was implemented in a least-squares fitting procedure,
and the modeled parameters were extracted from the experimental force curves. In the symmetric
situation, the diffuse-layer force depends on three parameters, namely, the salt concentration, c,
the diffuse-layer potential, ψD, and the regulation parameter, p. In the asymmetric situation, the
force depends on five parameters, namely the salt concentration, c, the diffuse-layer potentials
D
and D
for the right and left surfaces, and the corresponding regulation parameters p
and
p
. In our case, we shall omit the superscripts ±, since it will be clear from the context to
which surface one refers. More details about this theory and the respective calculations can be
found elsewhere.2 The charging parameters from this study are summarized in Table S1 below.

7
Table S2
surface
surface potential
(mV)
regulation parameter
pH 4 pH 10 pH 4 pH 10
sulfate latex probe
-83 ± 2 -111 ± 3 0.66 ± 0.05 0.66 ± 0.05
OH -11.4 ± 0.4 -40 ± 2 0.39 ± 0.02 0.45 ± 0.02
NH2 +30.5 ± 1.0 +0.8 ± 0.5 0.56 ± 0.02 0.30 ± 0.02
CH3 -13.5 ± 0.3 -45 ± 2 0.31 ± 0.02 0.49 ± 0.02
COOH -13 ± 0.5 -39 ± 2 0.47 ± 0.02 0.31 ± 0.02
8
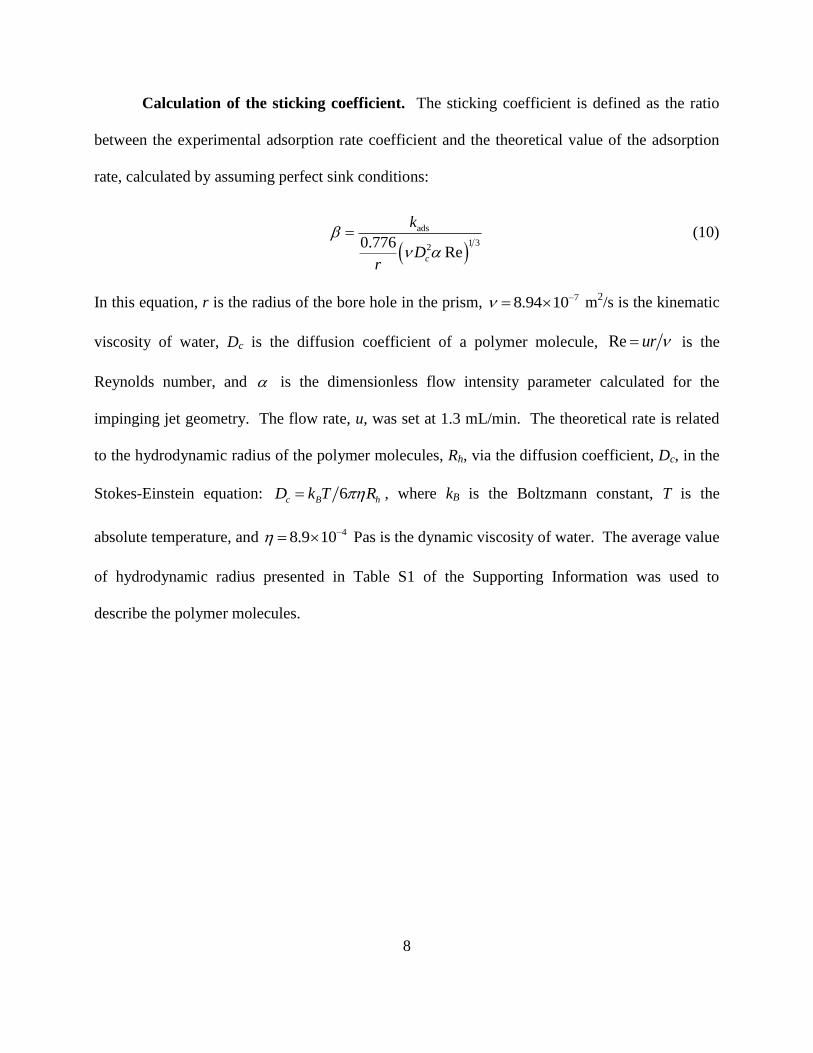
Calculation of the sticking coefficient. The sticking coefficient is defined as the ratio
between the experimental adsorption rate coefficient and the theoretical value of the adsorption
rate, calculated by assuming perfect sink conditions:
ads
1 320.776
Rec
k
Dr
(10)
In this equation, r is the radius of the bore hole in the prism, 78.94 10 m2/s is the kinematic
viscosity of water, Dc is the diffusion coefficient of a polymer molecule, Re ur is the
Reynolds number, and is the dimensionless flow intensity parameter calculated for the
impinging jet geometry. The flow rate, u, was set at 1.3 mL/min. The theoretical rate is related
to the hydrodynamic radius of the polymer molecules, Rh, via the diffusion coefficient, Dc, in the
Stokes-Einstein equation: 6c B hD k T R , where kB is the Boltzmann constant, T is the
absolute temperature, and 48.9 10 Pas is the dynamic viscosity of water. The average value
of hydrodynamic radius presented in Table S1 of the Supporting Information was used to
describe the polymer molecules.

9
Adsorbed mass at saturation as a function of pH on each individual surface type.

10
Adsorption rate coefficient as a function of pH on each individual surface type.

11
Adsorbed mass at saturation as a function of salt concentration on each individual surface
type.

12
Adsorption rate coefficient as a function of salt concentration on each individual surface
type.
13
References
(1) Popa, I.; Gillies, G.; Papastavrou, G.; Borkovec, M. Attractive electrostatic forces between
identical colloidal particles induced by adsorbed polyelectrolytes. J. Phys. Chem. B 2009, 113,
8458-8461.
(2) Montes Ruiz-Cabello, F. J.; Trefalt, G.; Maroni, P.; Borkovec, M. Electric double layer
potentials and surface regulation properties measured by colloidal probe atomic force microcopy.
Phys. Rev. E 2014, 90, 012301.
(3) Russel, W. B.; Saville, D. A.; Schowalter, W. R., Colloidal Dispersions. Cambridge
University Press: Cambridge, 1989.
(4) Trefalt, G.; Szilagyi, I.; Borkovec, M. Poisson-Boltzmann description of interaction forces
and aggregation rates involving charged colloidal particles in asymmetric electrolytes. J. Colloid
Interface Sci. 2013, 406, 111-120.
(5) Pericet-Camara, R.; Papastavrou, G.; Behrens, S. H.; Borkovec, M. Interaction between
charged surfaces on the Poisson-Boltzmann level: The constant regulation approximation. J.
Phys. Chem. B 2004, 108, 19467-19475.
(6) Behrens, S. H.; Borkovec, M. Exact Poisson-Boltzmann solution for the interaction of
dissimilar charge-regulating surfaces. Phys. Rev. E 1999, 60, 7040-7048.