Embed Size (px)
Citation preview
i
STUDYING THE PREVALENCE AND ETIOLOGY OF CLASS II SUBDIVISION
MALOCCLUSION UTILIZING CONE-BEAM COMPUTED TOMOGRAPHY
A THESIS
Presented to the Faculty of the
Uniform Services University of the Health Sciences
In Partial Fulfillment
Of the Requirements
For the Degree of
MASTER OF SCIENCE
By
William Michael Anderson, DMD
Lackland AFB, TX
April 24, 2013
The views expressed in this study are those of the authors and do not reflect the official policy of the United
States Air Force, the Department of Defense, or the United States Government. The authors do not have
any financial interest in the companies whose materials are discussed in this article

Uniformed Services University of the Health Sciences
Manuscript/Presentation Approval or Clearance
INITIATOR
1. USU Principal Author/Presenter: William M. Anderson, LCDR, USN, DMD
2. Academic Title: Masters of Science in Oral Biology
3. School/Department/Center: Air Force Postgraduate Dental School (AFPDS), TriService Orthodontic Dental School
4. Phone: (21 0) 292-9038
5. Type of clearance: .K_Paper _Article _Book _ Poster _Presentation _Other
6. Title: 'Studying the Prevalence and Etiology of Class II Subdivision Malocclusion Utilizing Cone-Beam Computed Tomography'
7. Intended publication/meeting: June 2013
8. "Required by" date: 1 July 2013
9. Date of submission for USU approval: 6 June 2013
CHAIR OR DEPARTMENT HEAD APPROVAL
1. Name: Curtis M. Marsh, Col, USAF, DMD
2. School/Dept. : AFPDS/Tri-Service Orthodontic Dental School
3. Date: 6 June 2013
*Note: It is DoD policy that clearance of information or material shall be granted if classified areas are not jeopardized, and the author accurately portrays official policy, even if the author takes issue with that policy. Material officially representing the view or position of the University, DoD, or the Government is subject to editing or modification
by the appropriate approving authority. ~-~., ......... _-
Chair/Department Head Approval: ~ Date cp .Jv.u 13 7
SERVICE DEAN APPROVAL
1. Name: Col Thomas Schneid
2. School (if applicable): AFPDS
3. Date: 7 Jun 2013
4. _ Higher approval clearance required (for University-, DoD- or US Gov't-level policy, communications systems or weapons issues review").
*Note: It is DoD policy that clearance of information or material shall be granted if classified areas are not jeopardized, and the author accurately portrays official policy, even if the author takes issue with that policy. Material officially representing the view or position of the University, DoD, or the Government is subject to editing or modification by the appropriate approving authority.
COMMANDER APPROVAL
1. Name:
2. School (if applicable):
3. Date:
4. _ Higher approval clearance required (for University-, DoD- or US Gov't-level policy, communications systems or weapons issues review").
*Note: It is DoD policy that clearance of information or material shall be granted if classified areas are not jeopardized, and the author accurately portrays official policy, even if the author takes issue with that policy. Material officially representing the view or position of the University, DoD, or the Government is subject to editing or modification by the appropriate approving authority.

PDC DEAN APPROVAL
1. Name:
2. School (if applicable):
3. Date:
4. _ Higher approval clearance required (for University-, DoD- or US Gov't-level policy, communications systems or weapons issues review") .
*Note: It is DoD policy that clearance of information or material shall be granted if classified areas are not jeopardized, and the author accurately portrays official policy, even if the author takes issue with that policy. Material officially representing the view or position of the University, DoD, or the Government is subject to editing or modification by the appropriate approving authority.
DeanNP Signature/Date
VICE PRESIDENT FOR EXTERNAL AFFAIRS ACTION
1. Name:
2. Date:
3. _ usu Approved or
_DoD Approval/Clearance required
4. _Submitted to DoD (Health Affairs) on (date):
Or _Submitted to DoD (Public Affairs) on (date):
5. _ DoD approved/cleared (as written) or _DoD approved/cleared (with changes)
6. DoD clearance/date:
7. DoD Disapproval/date:
External Affairs Approval Date
DEPARTMENT OF THE AIR FORCE AIR FORCE POST GRADUATE DENTAL SCHOOL
ORTHODONTIC FLIGHT 2133 PEPPERRELL STREET, BLDG 3352
JOINT BASE SAN ANTONIO- LACKLAND TEXAS 78236-5345
The author hereby certifies that the use of any copyrighted material in the thesis manuscript entitled :
'STUDYING THE PREVALENCE AND ETIOLOGY OF CLASS II SUBDIVISION MALOCCLUSION UTILIZING CONE-BEAM COMPUTED TOMOGRAPHY'
is appropriately acknowledged and , beyond brief excerpts, is with the permission of the copyright owner.
i:r?J .......... ___ _ William M. Anderson, LCDR, USN, DMD Tri-Service Orthodontic Residency Program Air Force Post Graduate Dental School Date: 06/06/13

iii
DEDICATION
This thesis is dedicated to my wife, Peychi. It may be cliché but it is with the
utmost sincerity that I say, “I could not have done it without you.” You’ve carried
more than your share of the load these past two years; all while working full time,
pursuing your own board certification and giving birth to our beautiful baby girl,
Jolie. Eight years ago, I asked you to join me on this great adventure. You said,
“Yes! This is going to be so much fun!” And you were right! We’ve been around
the world and now the next step in our adventure begins as we pack up two kids
and head to Naples, Italy. I can’t imagine being on this journey with anyone else.
To my kids, Reed and Jolie. I arrive painfully early to work each day, before
either of you are awake, so that I can accomplish my tasks and still make it home
to see you before you go to bed. All of my stress vanishes the minute I walk
through the door and see your beautiful smiling faces. I love you two more than
you can imagine.

iv
ACKNOWLEDGEMENTS
First, I must thank Dr. Curtis Marsh, my research mentor and program director.
Your mentorship over the past two years, not only with my research but with my
education in orthodontics, has been invaluable. I aim to incorporate lessons
learned from you and each of the other faculty members at TORP in my own
practice as an orthodontist. This study was born of your keen clinical
observations and intuition. Thank you for trusting in me, allowing me the
freedom to conduct this study and for being there when I did hit a wall.
Also, thank you to Dr. Brent Callegari, my research director and most valued
“shipmate.” A few years ago, when I was selected as an alternate for training,
you encouraged me to not relent in my pursuit of orthodontics residency training.
I hope to approach my career with the same enthusiasm and sense of humor that
you do each day. Regarding research, I know that keeping 12 residents on task
with each of their studies is no easy job. You applied pressure when it was
necessary but demonstrated patience and understanding when roadblocks were
encountered.
Finally, thank you to Dr. Ricardo Vendrell, my training officer and mentor. You’ve
taught me to pay attention to the details and “never trade speed for accuracy” –
invaluable lessons. Looking forward to sharing a beer as colleagues at a future
AAO meeting.
v
ABSTRACT
Introduction: Treatment of the Class II subdivision malocclusion has long been
a challenge for orthodontists. Asymmetric occlusal relationships can occur due
to any number of combinations of dentoalveolar or skeletal deviations.
Identifying the etiology of asymmetry allows the clinician to make the most
prudent treatment decisions and ultimately, achieve optimal treatment outcomes.
It was noted by Edward Angle that there seemed to be a higher occurrence of
asymmetric occlusion in the Class II Division 2 (II/2) malocclusion than the Class
II Division 1 (II/1) malocclusion. The Class II/2 phenotype is unique in its
presentation. Further, the morphologic features of the Class II/2 malocclusion
are so distinct and consistent, that it often has little in common with the Class II/1
malocclusion other than the Class II molar relationship. Despite these
differences, the literature is replete with Class II studies that fail to make the
distinction between Class II/1 and Class II/2 malocclusions. Grouping the two
Class II types together potentially leads to misleading results and conclusions.
Another potential source of error in traditional studies of asymmetry in Class II
malocclusions is the use of conventional radiographic techniques in the
determination of dentoalveolar and skeletal asymmetries. Cone-beam computed
tomography (CBCT) eliminates magnification error and many of the problems
associated with traditional imaging methods and is more ideally suited to the
study of asymmetry. The aim of this study was to 1) determine the prevalence of
subdivision malocclusion in Class II/1 and Class II/2 subtypes and 2) compare
bilateral dentoalveolar and skeletal linear measurements between patients with
vi
Class II/1 subdivision and Class II/2 subdivision malocclusions using
pretreatment CBCT slices. Methods: Pretreatment intraoral photographs of
patients screened for treatment at the Wilford Hall Ambulatory Surgical Center
Tri-Service Orthodontic Residency Program (TORP) were used to identify those
patients with Class II malocclusion. Likewise, photographs were used to
determine the existence of subdivision malocclusions. Pretreatment CBCT
images were then used to divide the subjects, Division 1 or Division 2, based on
predetermined cephalometric criteria. Utilizing CBCT images, bilateral linear
dentoalveolar and skeletal measurements were made on 20 patients with Class
II/1 subdivision malocclusion and 20 patients with Class II/2 subdivision
malocclusions. Measurements were compared between the two groups, aiming
to determine the etiology of the subdivision. Results: 256 patients in the
population at hand were determined to have Class II malocclusions. 22.9% (49
of 214) of those characterized as Class II/1, presented with a subdivision
malocclusion (defined by the molar relationship being at least one-half step Class
II on one side and Class I on the other) while 50% (21 of 42) of Class II/2 patients
presented with a subdivision malocclusion. Six of eight bilateral linear
measurements demonstrated greater asymmetry in the Class II/2 subdivision
population, including all measurements based on mandibular landmarks. These
differences were significant (p < 0.05) for two of the eight measures: condylion-
pogonion (Co-Po) and condylion-madibular first molar (Co-Mn6). Conclusions:
Subdivision malocclusions were more prevalent in the Class II/2 population than
in the Class II/1 population. The Class II/2 subdivision group demonstrated

vii
greater mandibular asymmetry suggesting a mandibular skeletal etiology to
subdivision malocclusion in Class II/2 patients.
viii
TABLE OF CONTENTS
Page
Title…………………………………………...………………………………………i Approval.............................................................................................................ii Dedication……………………………………………………………………..…….iii Acknowledgements…………………………………………………………..…….iv Abstract………………………………………………………………..……………..v Table of Contents…………………………………………………………....…....viii List of Figures…………………………………………………………………...…...x List of Tables…………………………………………………………….....……….xi
I. BACKGROUND AND LITERATURE REVIEW
A. Introduction ………………………………………………………1
B. Class II Malocclusion …………………………………….……..2
C. Division 1 vs. Division 2…………………………………….......3
D. Class II subdivision Malocclusion …………………………..…9
E. Asymmetry in Class II Malocclusion………………………….10
II. OBJECTIVES
A. Overall Objectives…………………………………………….…………1
ix
Page
B. Specific Hypothesis………………………………………….……….…12
III. MATERIALS AND METHODS
A. Experimental Design…………………………………………………….13
B. Statistical Management of Data…………………………………..……20
IV. RESULTS
A. Pilot Study…………………………………….. …………………….…..22
B. Measurement Data………………………………..…………...………..23
V. DISCUSSION.…………………………………………………………….….32
VI. CONCLUSION.………………………………………………………………39
VII. APPENDICES
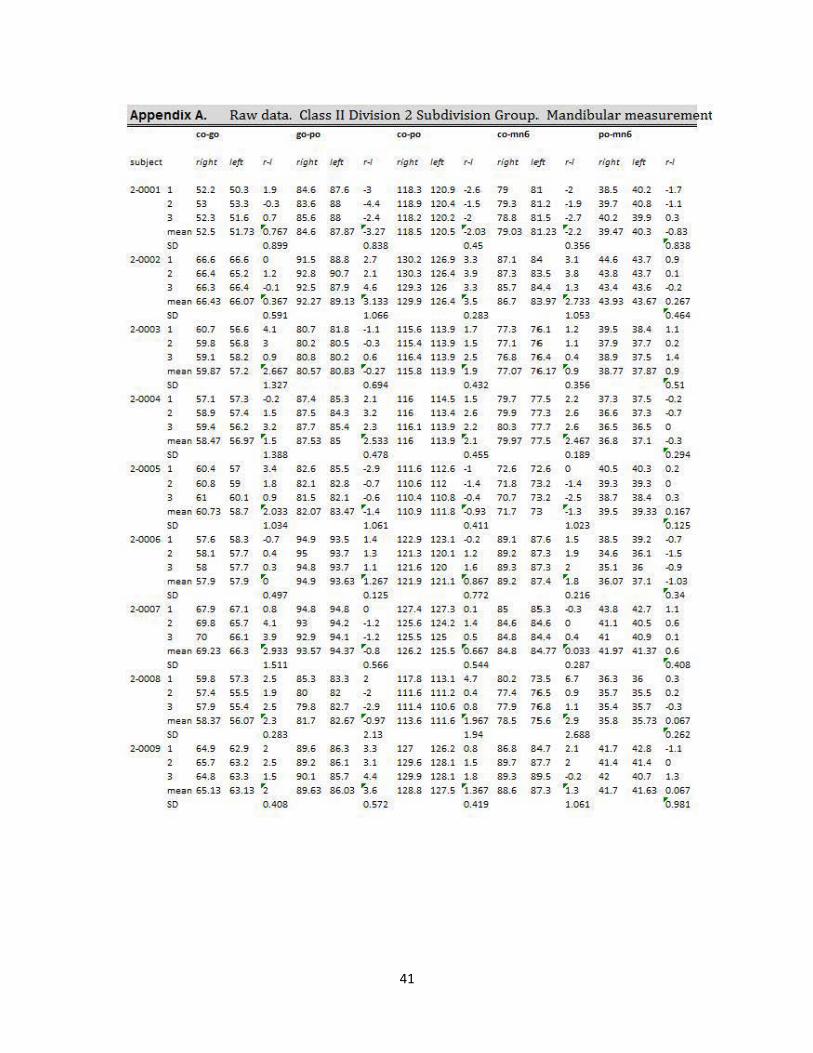
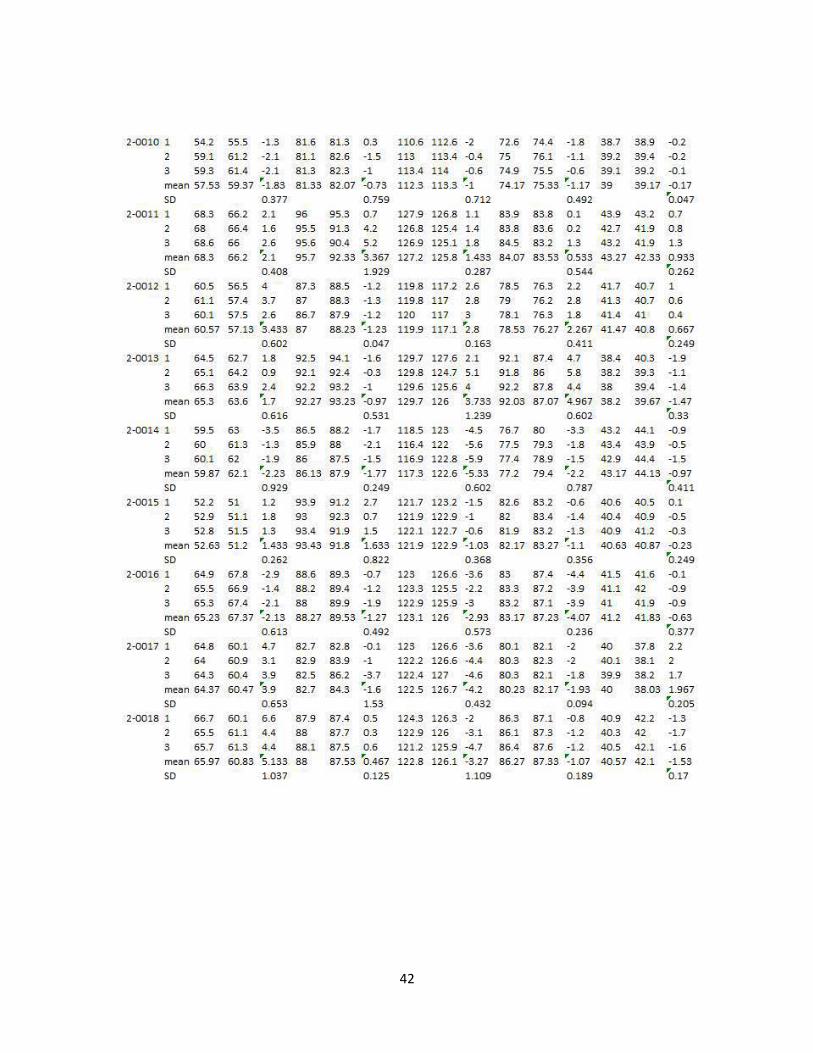
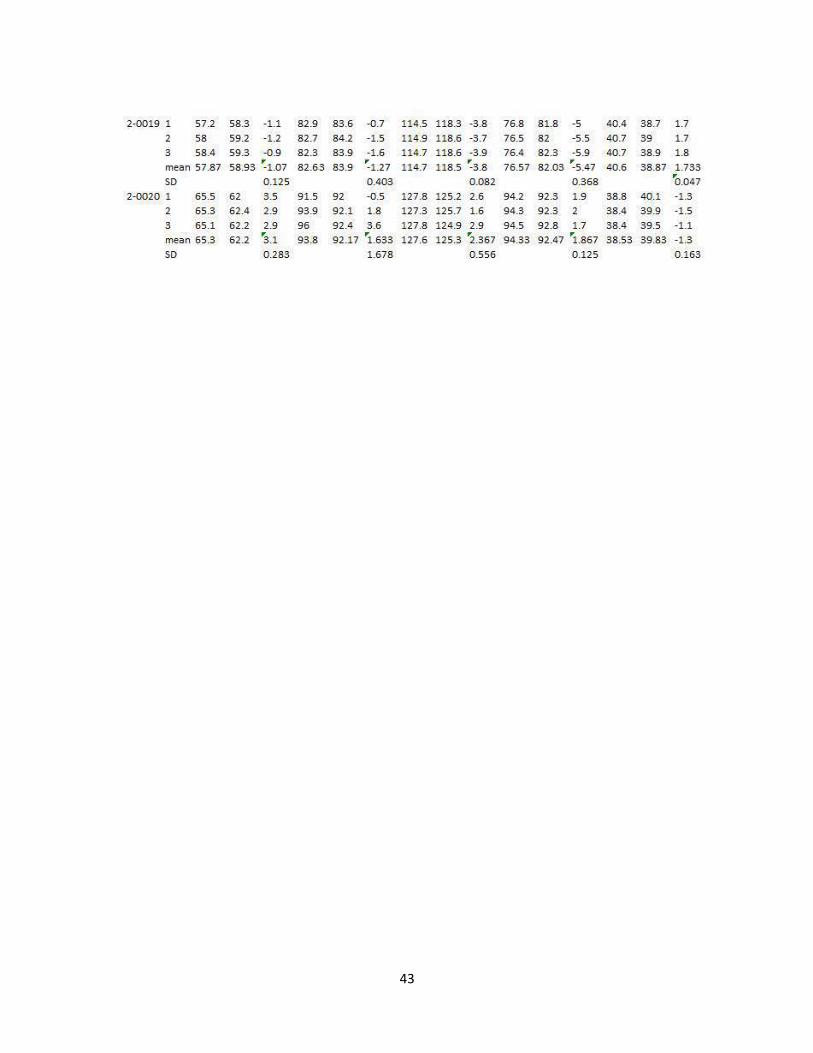
a. Raw Data: Class II Division 2 subdivision – mandibular measurements……………………………………………………………….41 b. Raw Data: Class II Division 2 subdivision – maxillary
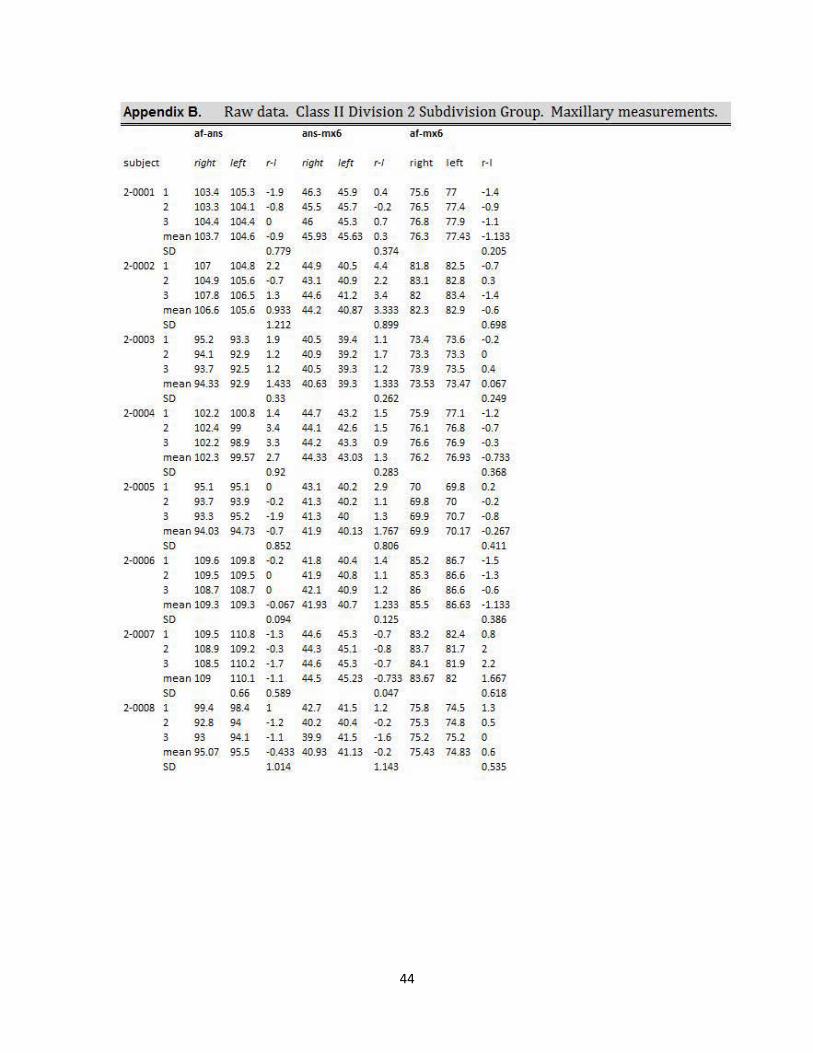
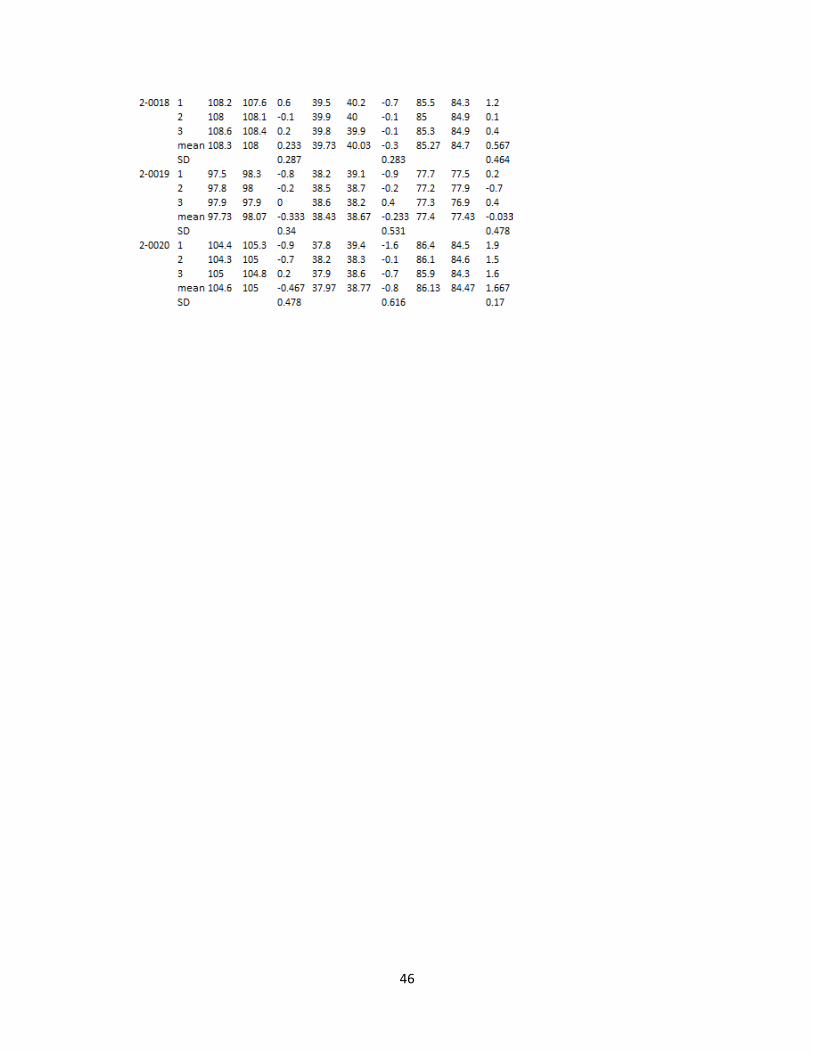
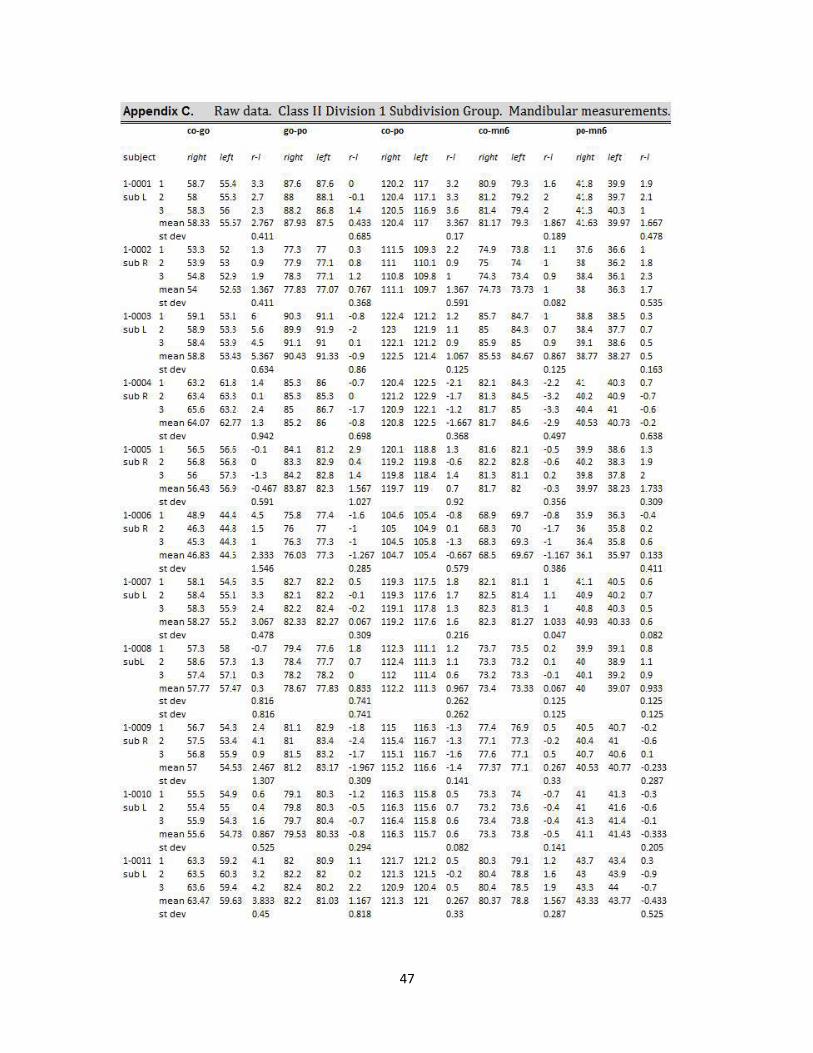
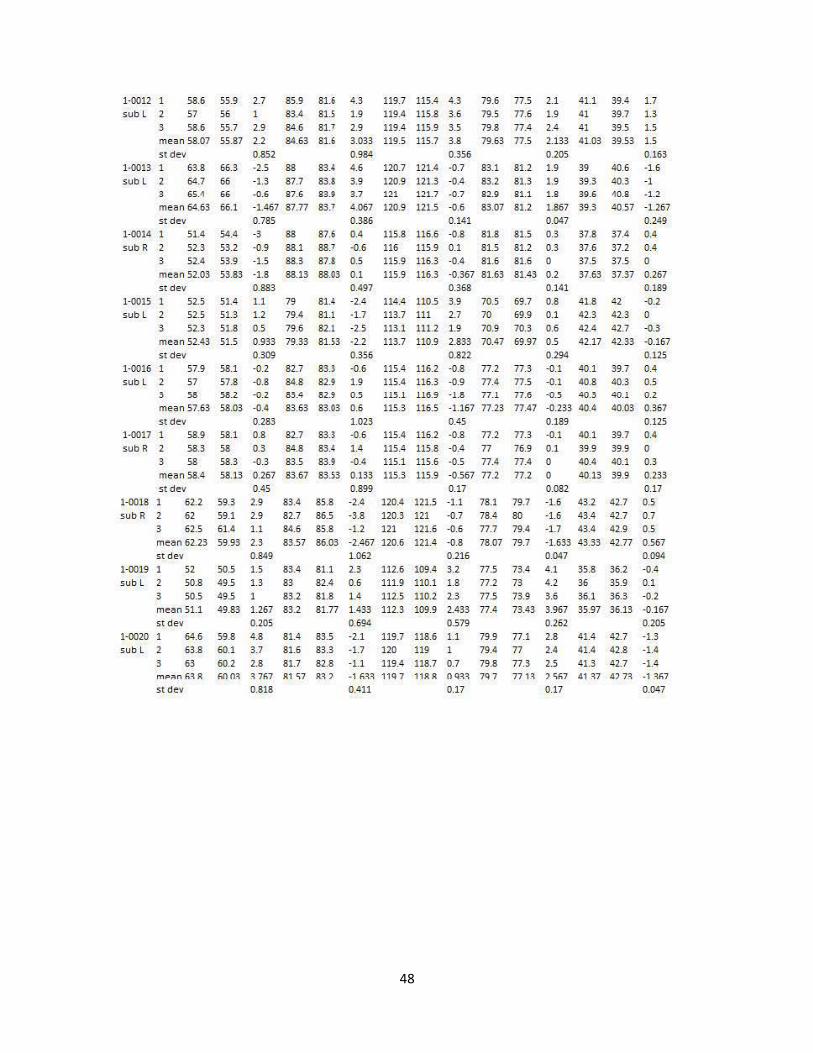
measurements……………………………………………………………….44 c. Raw Data: Class II Division 1 subdivision – mandibular measurements……………………………………………………………….47 d. Raw Data: Class II Division 2 subdivision – maxillary measurements………………………………………………………………..49
VIII. Literature Cited ……………………………………………….……………...52

x
LIST OF FIGURES
Page
Figure 1 Orientation and reference planes………….……………….……..16
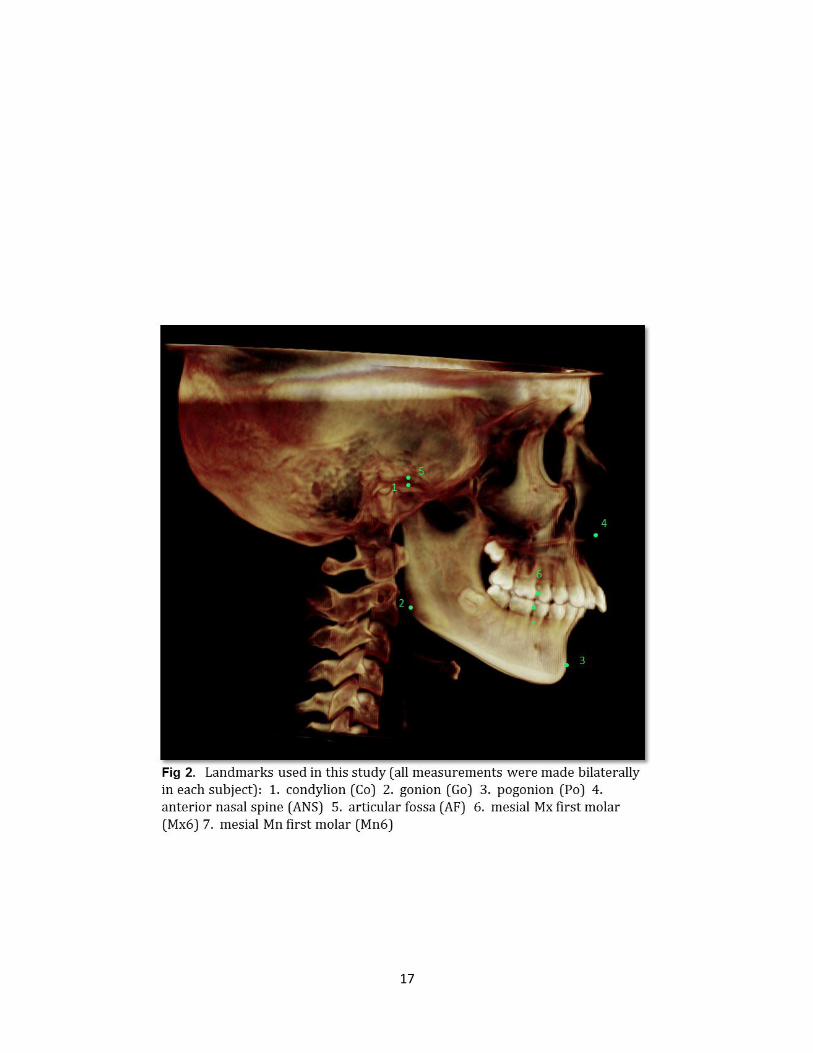
Figure 2 Landmarks selected for study of skeletal and dentoalveolar asymmetry…...…………..…………………………………….……17
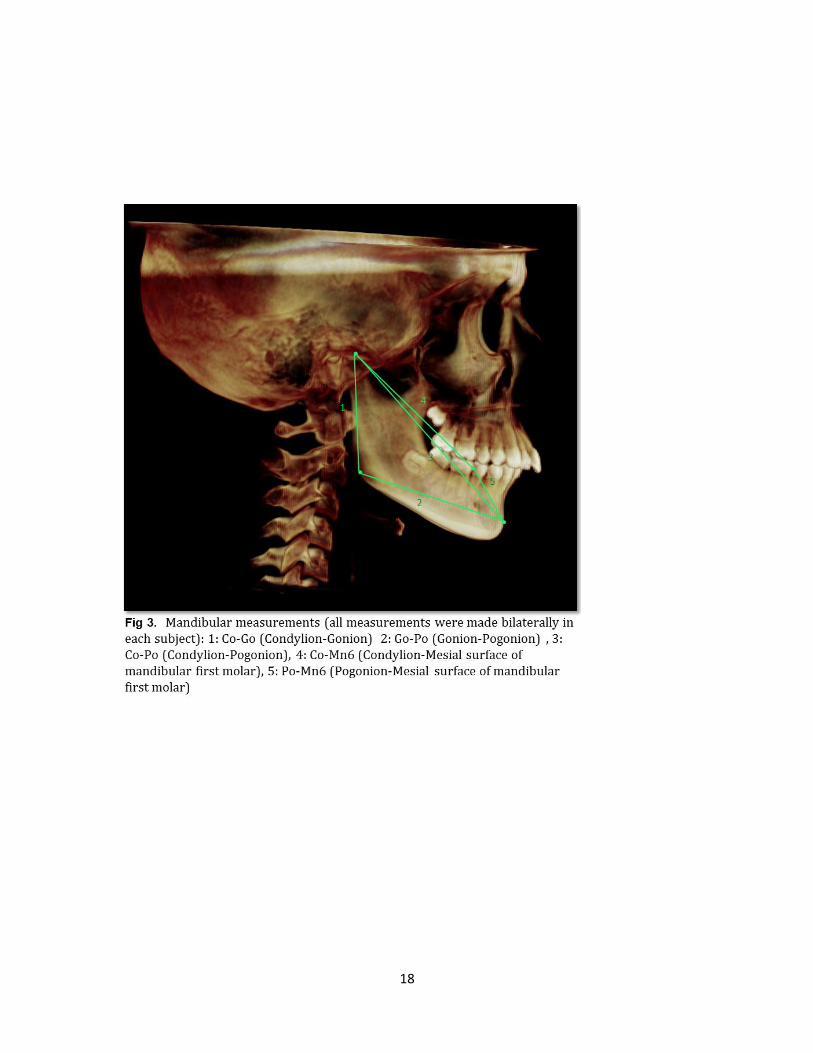
Figure 3 Linear measurements for the evaluation of
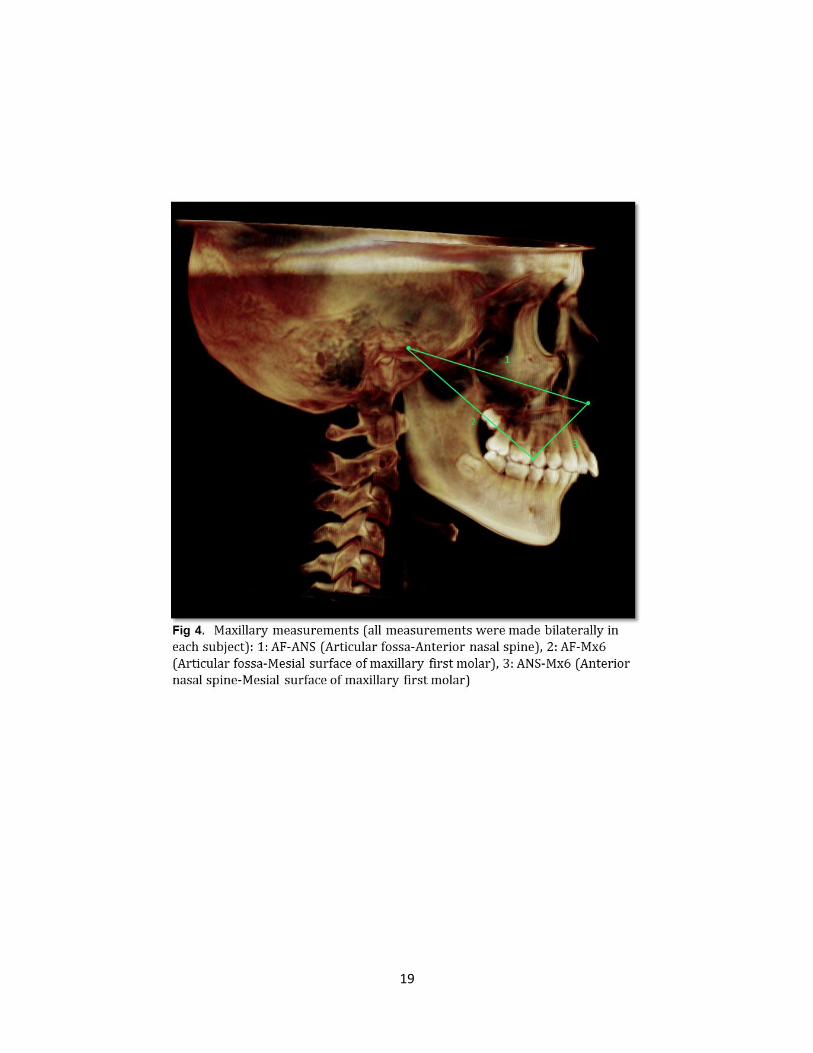
mandibular asymmetry…………………………….………….……18 Figure 4 Linear measurements for the evaluation of maxillary
asymmetry……………………………..……………………….……19 Figure 5 Prevalence of subdivision malocclusion in subjects with
Class II Division 1 and Class II Division 2 malocclusion………………………………………….……………..23
Figure 6 Comparison of absolute side-to-side differences in Class II
Division I subdivision subjects versus Class II Division II subdivision subjects………………………………………….… ….24
Figure 7 Comparison of side-to-side differences between Class I and Class II sides in Class II Division 1 subdivision subjects and
Class II Division 2 subdivision subjects…………………………..25
xi
LIST OF TABLES
Page
Table 1 iCat CBCT unit: technical parameters and settings……..………26
Table 2 Inclusion criteria for sample selection……………………….……27
Table 3 Description of landmarks……………………………………….…..28
Table 4 Pilot study: accuracy statistics of linear measurements…….…..29 Table 5 Descriptive statistics and statistical comparisons between Class II Division 1 subdivision and Class II Division 2 subdivision groups……………………………………………….…30
1
I. BACKGROUND AND LITERATURE REVIEW
A. Introduction
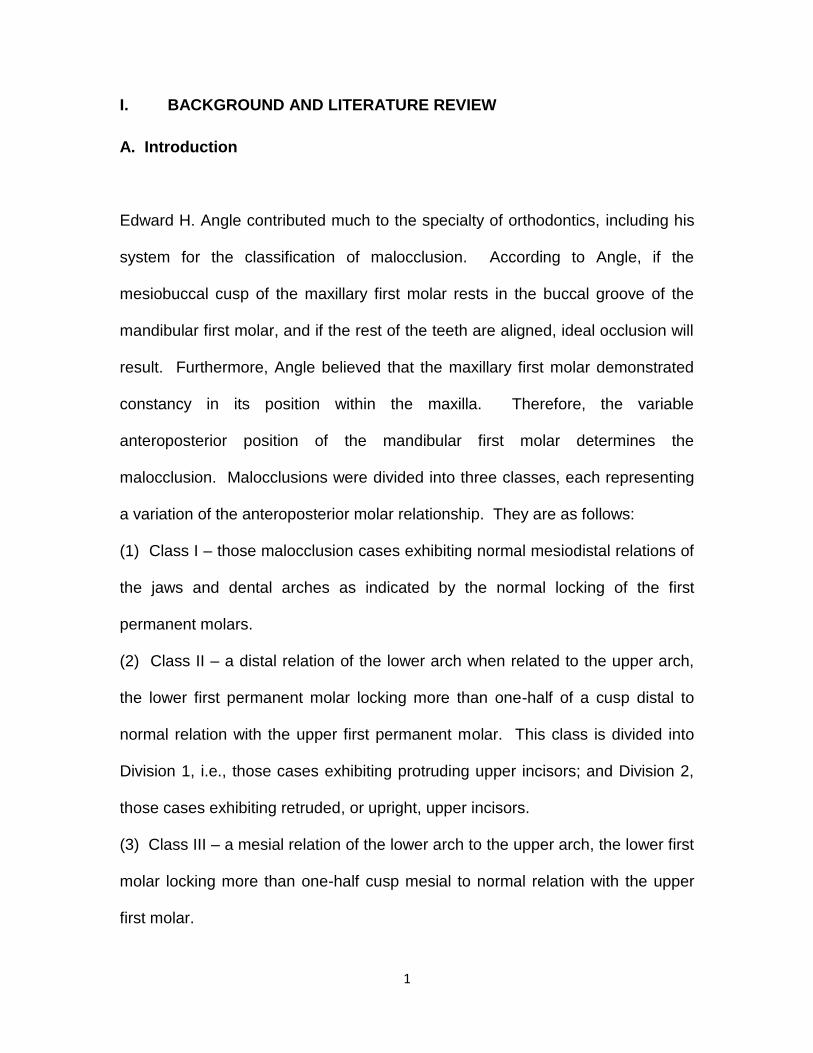
Edward H. Angle contributed much to the specialty of orthodontics, including his
system for the classification of malocclusion. According to Angle, if the
mesiobuccal cusp of the maxillary first molar rests in the buccal groove of the
mandibular first molar, and if the rest of the teeth are aligned, ideal occlusion will
result. Furthermore, Angle believed that the maxillary first molar demonstrated
constancy in its position within the maxilla. Therefore, the variable
anteroposterior position of the mandibular first molar determines the
malocclusion. Malocclusions were divided into three classes, each representing
a variation of the anteroposterior molar relationship. They are as follows:
(1) Class I – those malocclusion cases exhibiting normal mesiodistal relations of
the jaws and dental arches as indicated by the normal locking of the first
permanent molars.
(2) Class II – a distal relation of the lower arch when related to the upper arch,
the lower first permanent molar locking more than one-half of a cusp distal to
normal relation with the upper first permanent molar. This class is divided into
Division 1, i.e., those cases exhibiting protruding upper incisors; and Division 2,
those cases exhibiting retruded, or upright, upper incisors.
(3) Class III – a mesial relation of the lower arch to the upper arch, the lower first
molar locking more than one-half cusp mesial to normal relation with the upper
first molar.

2
Accurate diagnosis of skeletal and dental components of a given malocclusion is
paramount in making the most prudent orthodontic treatment decisions. The
presentation of Class II malocclusion is highly variable in its particular
components, and etiology, and must be evaluated on an individual case-by-case
basis. With limitless combinations of skeletal and dental components, and the
multifactorial nature of the developing malocclusion, it is helpful to identify
commonalities in various types of malocclusions. The Class II malocclusion, per
Edward H. Angle’s classification system, is broadly defined as one in which there
is a distal relationship of the mandibular teeth relative to the maxillary teeth of
more than one-half the width of the cusp (Angle 1899). Angle recognized that
there was a subset of Class II malocclusion, the Class II/2 type, which exhibits a
triad of features that make it distinctive in its presentation. They are, according to
Angle: Deep bite, retroclined maxillary incisors and a posteriorly positioned
mandibular dental arch. Characteristics of the II/2 malocclusion have been well-
documented, if not agreed upon, throughout the history of orthodontic literature.
In short, these can be summarized as follows: skeletal components include a
hypo-divergent pattern, decreased lower face height, low mandibular plane
angle, decreased gonial angle, and commonly, adequate mandibular body length
and width in comparison to Class II/1 type (Blair 2009, Renfroe 1948, Hellman
1944). Dental components include, as Angle discerned, retroclination of the
maxillary central incisors, minimal overjet and excessively deep bite. Angle
postulated that the unilateral malocclusion (or subdivision) is highly associated
3
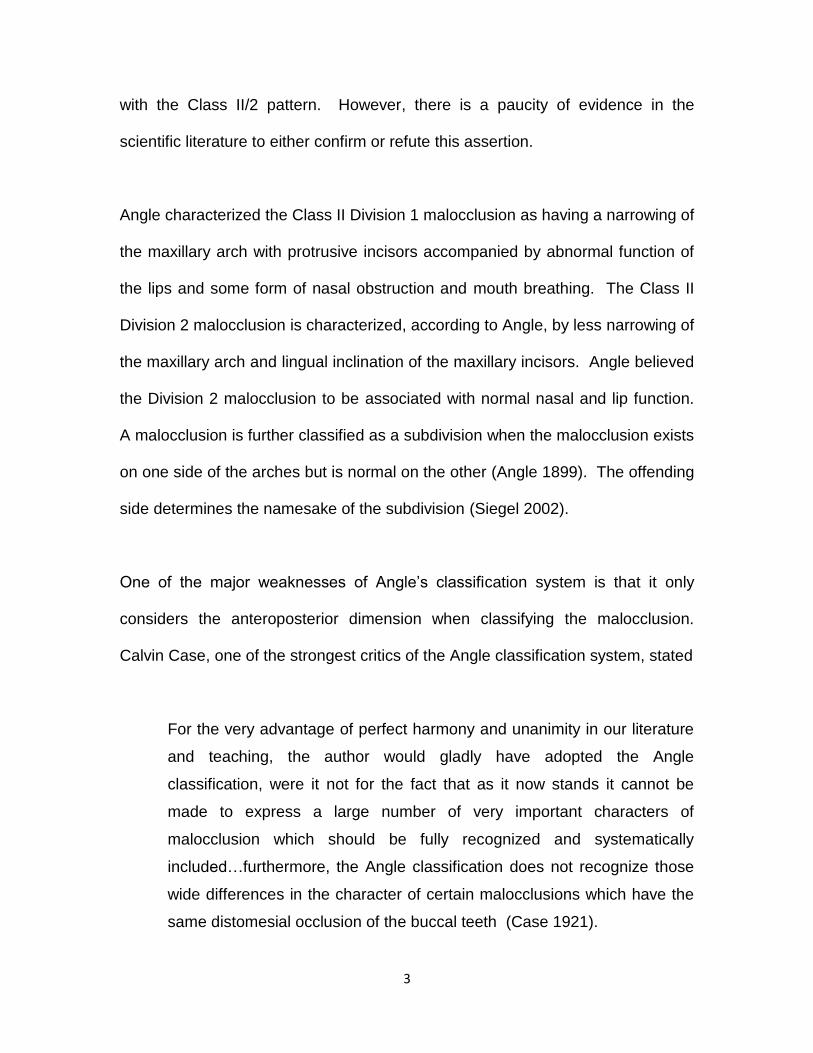
with the Class II/2 pattern. However, there is a paucity of evidence in the
scientific literature to either confirm or refute this assertion.
Angle characterized the Class II Division 1 malocclusion as having a narrowing of
the maxillary arch with protrusive incisors accompanied by abnormal function of
the lips and some form of nasal obstruction and mouth breathing. The Class II
Division 2 malocclusion is characterized, according to Angle, by less narrowing of
the maxillary arch and lingual inclination of the maxillary incisors. Angle believed
the Division 2 malocclusion to be associated with normal nasal and lip function.
A malocclusion is further classified as a subdivision when the malocclusion exists
on one side of the arches but is normal on the other (Angle 1899). The offending
side determines the namesake of the subdivision (Siegel 2002).
One of the major weaknesses of Angle’s classification system is that it only
considers the anteroposterior dimension when classifying the malocclusion.
Calvin Case, one of the strongest critics of the Angle classification system, stated
For the very advantage of perfect harmony and unanimity in our literature
and teaching, the author would gladly have adopted the Angle
classification, were it not for the fact that as it now stands it cannot be
made to express a large number of very important characters of
malocclusion which should be fully recognized and systematically
included…furthermore, the Angle classification does not recognize those
wide differences in the character of certain malocclusions which have the
same distomesial occlusion of the buccal teeth (Case 1921).
4
On a similar note, Ackerman and Proffit postulated that malocclusions having
the same Angle classification may be analogous (having the same occlusal
relationship), but may not be homologous (having all characteristics in common).
They assert their own diagnosis and classification scheme which corrects for the
deficiencies of the Angle system. In their view, there is a tendency to treat
analogous malocclusions in a similar fashion. As two analogous malocclusions
may require entirely different treatment plans, it would be ill-advised to treat them
in the same manner (Proffit, 1969).
Yet another major criticism of the Angle classification system is that it does not
differentiate between dentoalveolar and skeletal discrepancies. Angle assumed
a certain constancy of position of the maxillary first molar which led to his
conclusion that the molar relationship determines the relative anteroposterior
position of the maxilla and mandible. Angle writes,
“These classes are based on the mesio-distal relations of the teeth,
dental arches and jaws, which depend primarily upon the positions mesio-
distally assumed by the first permanent molars on their erupting and
locking. Hence in diagnosing cases of malocclusion we must consider,
first, the mesio-distal relations of the jaws and dental arches, as indicated
by the relation of the lower molars with the upper molars – the keys to
occlusion; and second, the positions of the individual teeth, carefully
noting their relations to the line of occlusion” (Angle 1899)
5
However, it has been demonstrated that the maxillary first molar can assume a
range of possible positions with relation to the facial skeleton (Sassouni, 1971).
In spite of what have become obvious fallacies with the Angle classification
system, it remains the predominant classification system utilized by orthodontists
and dentists alike when describing the occlusal relationship. With the benefit of
decades of research and, notably, the advent of cephalometric radiography, a
better and more thorough understanding of skeletal relationships of various
malocclusions has emerged. In spite of, or perhaps, because of the additional
information gained from the cephalometric film, the distinguishing features of the
Class II/2 malocclusion have been rigorously debated in the literature over the
past several decades. Despite the emerging details that make the Class II/2
malocclusion distinct, it is troubling that in the investigation of Class II
malocclusions, all too often, no distinction is made between Class II/1 and II/2
types. Furthermore, despite all that has been published on the subject of the
Class II/2 malocclusion, most oversimplify the definition of the Class II/2 by
focusing only on the distocclusion of the molars and canines and the
retroclination of the maxillary central incisors.
Early cephalometric investigations of the Class II/2 malocclusion were often
plagued by insufficient sample sizes and inconsistent definition of the condition
with a somewhat vague distinction between Class II/1 and Class II/2 populations.
Yet, it is worthwhile to recognize the conclusions from these early studies, as
6
they have influenced the evolving understanding and study of the Class II/2
malocclusion.
Some believe the features of the Class II/2 malocclusion to be pathognomonic
such that instead of being a considered a variation of the Class II malocclusion, it
should be considered an entirely separate entity (Brezniak 2002). Wallis
compared Class II/2 and Class II/1 subjects and found that the mandibular form
in a “typical” Class II/2 demonstrates more acute gonial and mandibular plane
angles, excessive overbite and decreased lower anterior face height (1963).
These findings agree with the previous work of Hellman, whom like Wallis, found
Class II/2 individuals to have more acute gonial and mandibular plane angles
(1944). Additionally, Hellman concluded that the effective cranial base length
(BaN) was significantly longer and the maxilla was more anteriorly positioned in
the typical Class II/2 individual. Robertson and Hilton noted in 1965 that, in
addition to the characteristic deep bite and increased interincisal angle, the
presentation of the Class II/2 malocclusion was fundamentally based on an
underlying Class I or mild Class II skeletal relationship. Peck drew similar
conclusions, stating that the mandibular body is sufficiently well-developed and
that the relative anterior-posterior relationship of the maxilla and the mandible
closely approximates the “normal” Class I relationship (1998).
Other studies have concluded that the Class II/2 presentation is more likely a
result of vertical dysplasia rather than a discrepancy in the anteroposterior plane
7
of space. Maj and Luchesse found that the mandible in the class II/2
malocclusion is characterized by remarkable development in the height of the
ramus which they claim is consistent with the typical decreased mandibular plane
angle and decreased lower anterior face height often observed in this group
(1982). This validates the findings of Strang, who years earlier postulated that
the development of the Class II/2 malocclusion is the result of insufficient vertical
growth of the face below the nasal area (1958).
Despite conflicting conclusions about the consistency of features of the Class II/2
malocclusion, it is safe to say that grouping all Class II malocclusions together is
a diagnostic oversimplification. Though Angle clearly distinguished the two
divisions of Class II malocclusion over a century ago, many authors continue to
group the two together. The reality is that the skeletal pattern in the Class II/2
population is distinct in its presentation and more closely resembles the Class I
malocclusion pattern than II/1 pattern. In addition to distinguishing the two
Divisions of Class II malocclusion, Angle astutely recognized a higher prevalence
of subdivision malocclusion in the Class II/2 population. By his own estimation,
up to 70% of Class II/2 malocclusions may have a subdivision component with
over 50% of all Class II malocclusions having a subdivision component (Angle,
1899) . To date, there is little evidence to confirm Angle’s assertions regarding
the occurrence of subdivision malocclusion.
8
Subdivision malocclusions present a unique challenge to orthodontists.
Determining the etiology of the malocclusion can be of critical importance in
determining the best course of treatment for the patient. Failure to recognize the
source of the asymmetry can lead to prolonged treatment time in addition to
failure to correct the original problem. The etiology of the subdivision may be an
underlying skeletal asymmetry or dentoalveolar deviation, or a combination of the
two. During development, any number of issues may result in dentoalveolar
asymmetry. These include differences in the timing of primary tooth exfoliation
(or extraction) on one side of the dental arch versus the other, position and
orientation of the developing tooth buds, variations in the timing and direction of
permanent tooth eruption, congenitally missing teeth, differences in tooth
emergence and sequence, tooth-size asymmetries, position of antagonists and
others. Further, skeletal asymmetry may occur for a variety of reasons as well,
to include trauma to the condyle and other developing structures, functional shifts
secondary to dental interferences and chewing side preference, among others
(Sato 2005) (Proffit 1980, 1985). Often times, however, there is no discernible
etiology for the existence of skeletal asymmetry (Gato 1966).
Numerous studies have attempted to determine the etiology of the asymmetric
occlusal relationships. The majority of studies which used 2-dimensional imaging
to investigate Class II subdivision malocclusions have failed to discern a skeletal
etiology for the asymmetric occlusal relationship. Alavi et al (1988), using
posteroanterior and lateral cephalometric radiographs in addition to models,
9
reported that the primary contributor to subdivision malocclusion is unilateral
distal positioning of the mandibular molar. Further, although asymmetry of both
the skeletal bases and dentoalveolar segments was found to be present in both
normal occlusion groups and subdivision malocclusions, it was not determined
whether the unilateral distal positioning of the mandibular molar occurred due to
an asymmetric molar positioning within the alveolus or due to an asymmetric
positioning of the mandible itself. Likewise, Rose et al (1994), with the use of
submentovertex radiographs, found no significant difference in mandibular
asymmetry in those with a subdivision malocclusion, again, reporting that the
subdivision malocclusion occurs primarily due to dentoalveolar asymmetry.
These studies are supported by the findings of Azevedo et al (2006), who found
subdivision malocclusion to be primarily dentoalveolar in nature. More
specifically, distal position of the mandibular molar on the Class II side of the
malocclusion was the most common etiology of the subdivision and, less
commonly, mesial positioning of the maxillary molar on the Class II side. Like
Alavi, Rose and numerous others, Azevedo used 2-dimensional radiographs to
ascertain dentoalveolar and skeletal asymmetry. 2-dimenstional images
traditionally used for the study of asymmetry include lateral and posteroanterior
cephalograms in addition to submentovertex radiographs. Due to the fact that 3-
dimensional structures are being projected onto flat 2-dimensional films,
distortion and magnification errors are introduced to the images. With the lateral
cephalogram, an object’s closer proximity to the film (i.e. on the left side) will be
less magnified than its contralateral counterpart located further from the film.
10
Similarly, with panoramic radiography, various amounts of vertical and horizontal
magnification will occur dependent upon the position of structures relative to the
focal trough (Larson, 2012). In addition to magnification issues, other reported
problems include difficult landmark identification, poor reproducibility of landmark
identification and positioning/orientation errors.
Cone-beam computed tomography (CBCT) offers a distinct advantage over 2-
dimensional methods for studying asymmetry and other morphological features
of the craniofacial skeleton. True anatomic form, without magnification, can be
visualized in 3-dimensions (3D), offering a more reliable method for the study of
morphology and allowing direct comparison of paired and midline structures
(Kwon, 2006). Because of the advantage of 1:1 geometry afforded by CBCT,
more accurate and reliable measurements are possible (Berco, 2009). Berco et
al also demonstrated that skull orientation does not affect the accuracy and
reliability of measurements made using CBCT, thus eliminating
positioning/orientation errors frequently seen with conventional two-dimensional
imaging methods.
Sanders et al (2010) evaluated dentoalveolar and skeletal asymmetry in patients
with Class II subdivision malocclusions using CBCT and found that the primary
factor contributing to the subdivision malocclusion is mandibular asymmetry, with
a shorter and more posteriorly positioned mandible on the Class II side. This
was the first published literature, to date, examining asymmetry in Class II
11
subdivision malocclusions utilizing CBCT. However, it failed to distinguish or
contrast between Class II/1 and Class II/2 types.
In the current study, the hypothesis is that the prevalence of subdivision
malocclusions is higher in Class II/2 than in Class II/1 malocclusions and that this
can be attributed to greater skeletal asymmetry in the former. Secondarily, if
there is a difference, a number of mandibular measurements will be made to
ascertain where the most common asymmetries occur.
12
II. OBJECTIVES
A. Overall Objective
The overall objective of this study was to determine if there is a difference
in skeletal and/or dentoalveolar asymmetry between patients with Class II
Division 1 subdivision and Class II Division 2 subdivision malocclusions.
The first goal of the study was to determine the prevalence of subdivision
malocclusions within each Division of Class II malocclusion. The second
goal of the study was compare asymmetry between Class II/1 and Class
II/2 groups, aiming to determine if one group demonstrates more
asymmetry than the other. Further, insight regarding the etiology of the
subdivision malocclusion between groups will be sought.
B. Specific Hypothesis
There is a higher prevalence of subdivision malocclusion in Class II
Division 2 subjects than Class II Division 1 subjects. Furthermore, that
there exists a higher occurrence of skeletal (i.e. mandibular) asymmetry in
subjects with Class II Division 2 malocclusions.
13
III. MATERIALS AND METHODS
A. Experimental Design
In accordance with an institution review board (IRB) protocol (retrospective,
human-exempt) approved by the Wilford Hall Ambulatory Surgical Center, patient
records were obtained from the Tri-Service Orthodontic Residency Program (Air
Force Postgraduate Dental School, JBSA-Lackland AFB, San Antonio, TX) that
often uses CBCT imaging for diagnostic purposes, particularly when
asymmetries are noted. Over 1500 patient records (intraoral photos, clinical
examination records, and CBCT scans) were reviewed to select the study
sample based on the pre-determined inclusion criteria. The Cone-Beam CT
images were taken using the iCat Platinum unit (Imaging Sciences International,
Hatfield, PA) with a 17 cm (height) x 23 cm (diameter) field of view at a resolution
of 0.3 voxels. All images were collected at 120 kVp and 5mA based on the
manufacturer’s specifications and recorded as DICOM (digital imaging and
communications in medicine) files. The DICOM files were subsequently
imported into Dolphin 3D (version 11.5, Dolphin Imaging, Chatsworth, CA).
Intraoral photos, clinical examination records and CBCT scans were utilized to
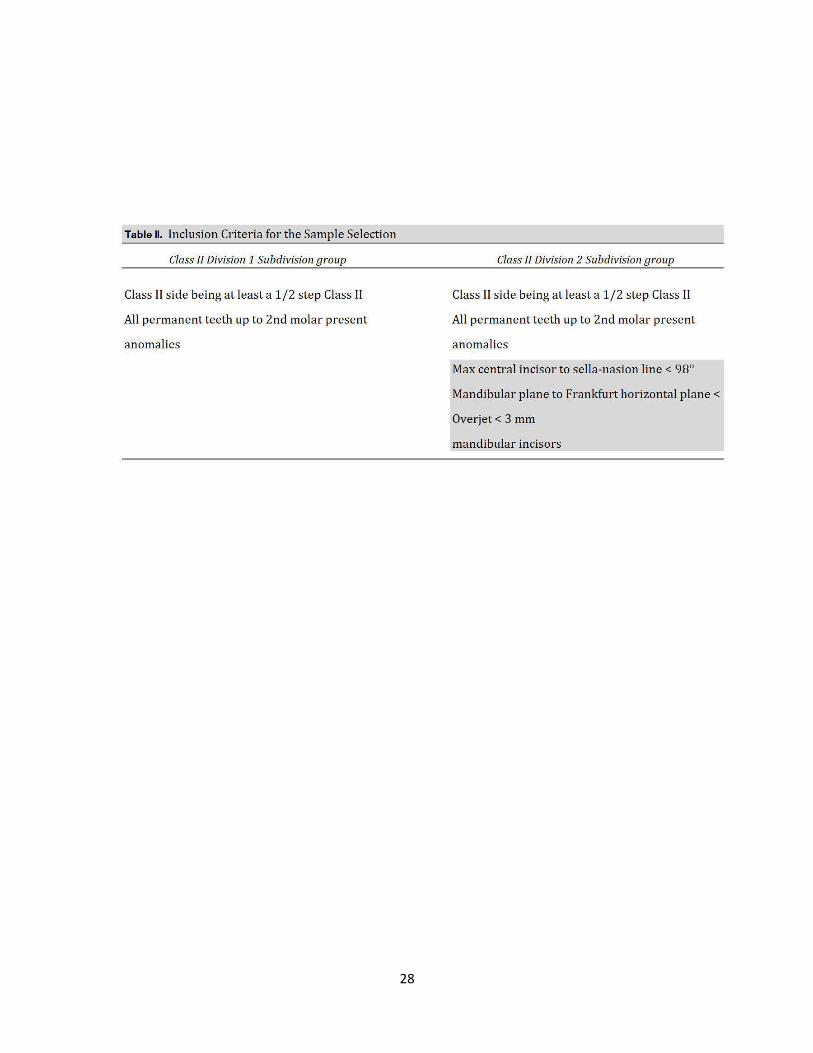
select the study sample. Inclusions criteria for the Class II Division 1 subdivision
group included: (1) Complete Class I molar relationship on one side of the dental
arch with at least a half-step Class II relationship on the other side; (2) all
permanent teeth erupted, including second molars; (3) no malformed or missing
teeth, or teeth with extensive restorations or gross decay. Inclusion criteria for
14
the Class II Division 2 subdivision group included: (1) All of the above criteria as
stated for the Class II/1 group; (2) maxillary central incisor to Sella-Nasion line <
98°; (3) mandibular plane to Frankfurt horizontal angle < 24°; (4) overjet < 3 mm;
(5) overbite > 4 mm. No exclusion criteria were established to control for age,
gender or race in either group. From the population screened for inclusion in the
study, 20 subjects with Class II/2 subdivision malocclusions were identified.
Likewise, 20 subjects with Class II/1 subdivision malocclusions were selected for
comparison (the first 20 identified that satisfied the inclusion criteria).
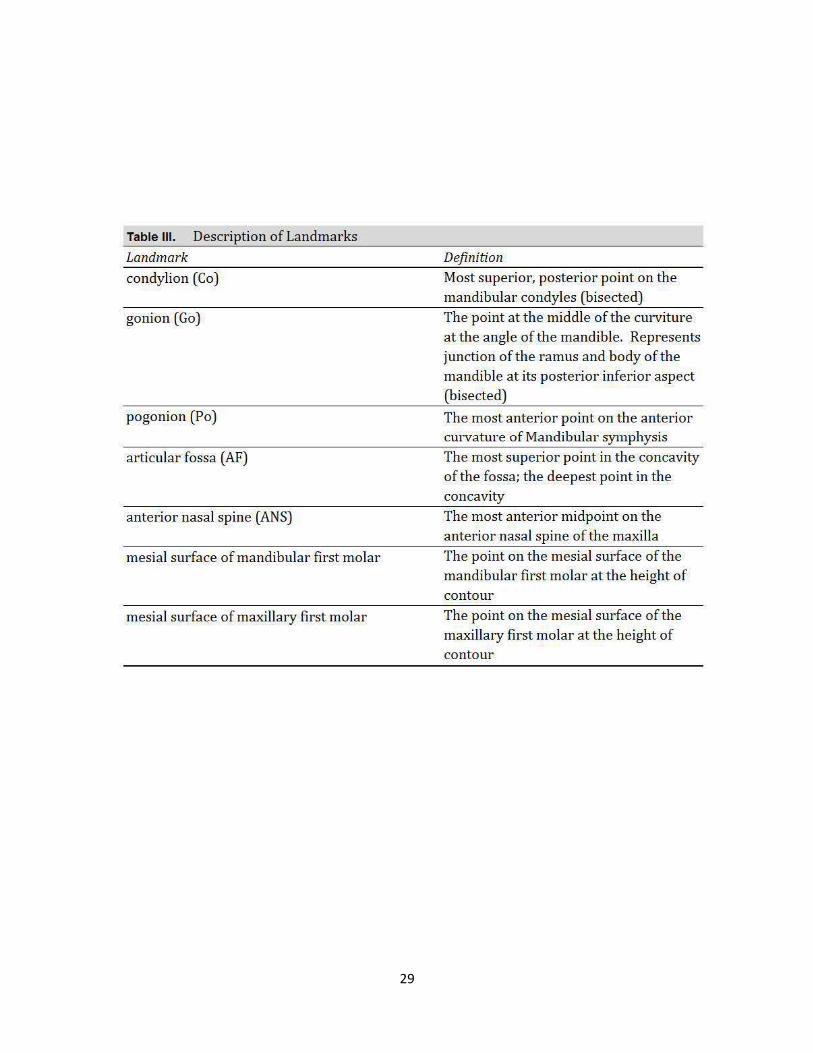
For this study, 7 landmarks (5 bilateral landmarks and 2 midline landmarks) were
chosen and used to make 8 bilateral linear measurements (16 total
measurements/subject). The five bilateral landmarks chosen were as follows: 1)
Condylion (Co), 2) gonion (Go), 3) articular fossa (AF), 4) mesial surface of the
maxillary first molar (Mx6), and 5) the mesial surface of the mandibular first molar
(Mn6). Midline landmarks were 1) pogonion (Po), and 2) anterior nasal spine
(ANS). The following linear measurements were made to determine mandibular
skeletal and dentoalveolar asymmetry: 1) Condylion to gonion (Co-Go), 2)
gonion to pogonion (Go-Po), 3) pogonion to condylion (Po-Co), 4) condylion to
mesial surface of mandibular first molar (Co-Mn6), and 5) mesial surface of
mandibular first molar to pogonion (Mn6-Po). The maxillary linear measurements
made were as follows: 1) Articular fossa to anterior nasal spine (AF-ANS), 2)
mesial of maxillary first molar to anterior nasal spine (Mx6-ANS), and 3) articular
fossa to mesial of the maxillary first molar (AF-Mx6). All landmarks were

15
identified and measurements made solely by the principal investigator using the
Dolphin Imaging 11.5 3D software application (Dolphin Imaging and
Management, Chatsworth, CA). All landmarks were marked and linear
measurements made directly from coronal, axial and sagittal slices taken from
the pre-treatment CBCT images for each subject in order to determine skeletal
and dentoalveolar asymmetry.
A pilot study was performed to determine intra-rater reliability. All right-sided
landmarks were selected and measurements made for the first ten subjects
within the Class II Division 1 subdivision group. Said measurements were made
three times at separate time intervals (separated by at least one week). Means
and standard deviations were calculated and compared using Student’s t-tests.
Additionally, the Dahlberg formula was applied to determine intra-rater reliability
for each measurement.
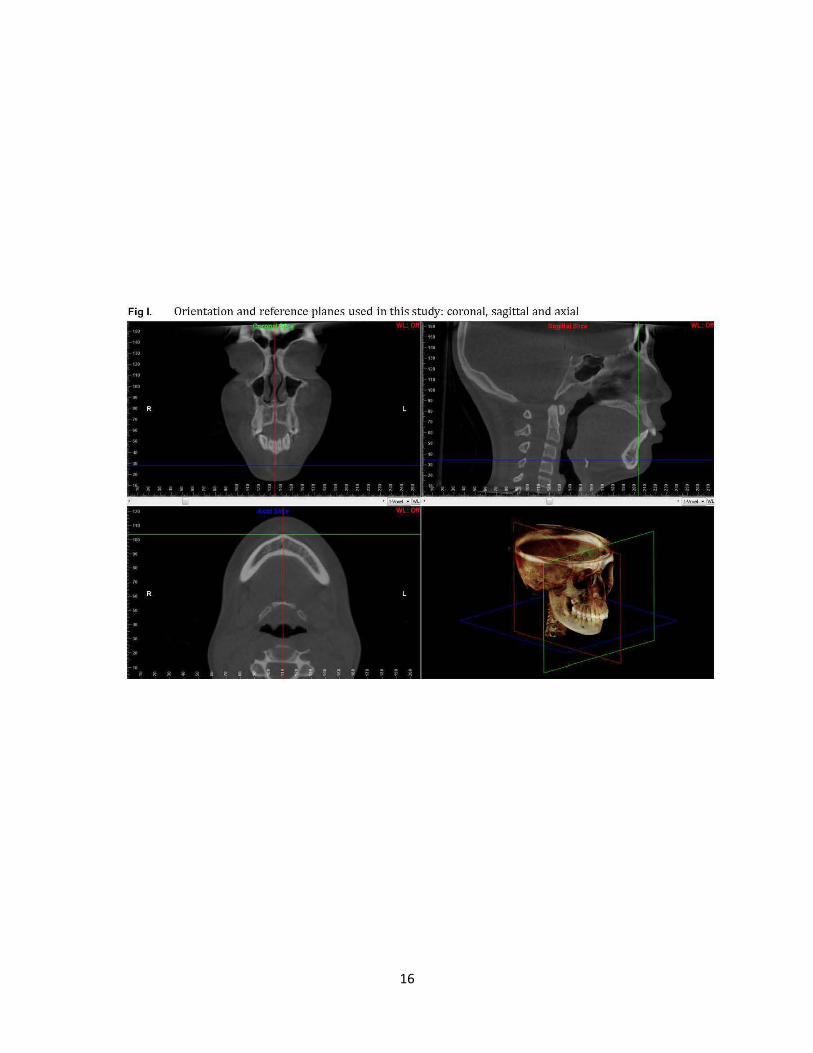
16
Fig I. Orientation and reference planes used in this study: coronal, sagittal and axial
17
18
19
20
B. Statistical Management of Data
A pilot study was conducted to determine intra-rater reliability; eight landmarks
(five in the mandible and three in the maxilla) were identified and eight linear
measurements were made between said landmarks at two different time points
using coronal, axial and sagittal slices from the CBCTs of the first ten subjects in
the Class II/1 subdivision group. Mean values and standard deviations were
determined from the measurements made on subjects’ right sides (chosen
arbitrarily). Intra-rater reliability was calculated using the Dahlberg’s formula.
Based on these results, all linear measures were accepted for inclusion in the
study.
After establishing intra-rater reliability of the primary investigator, linear
measurements, as described previously, were made bilaterally for each subject
at three time intervals. Average values and standard deviations were obtained
for each measure and the data were analyzed. Absolute differences between
right side and left side linear measurements were calculated for each subject in
each of the two groups, averaging the measurements from the three time points.
From this data, mean absolute differences between right side and left side
measurements were calculated for each of the eight linear measures. This
provided a measure of overall asymmetry for each linear measure. Right and left
side mean values were then compared using Student’s t tests. Values of p <
0.05 were considered statistically significant. The data was then organized to

21
allow comparison of linear measures taken from the Class I side of the
asymmetric malocclusion to the Class II side.
22
IV. RESULTS
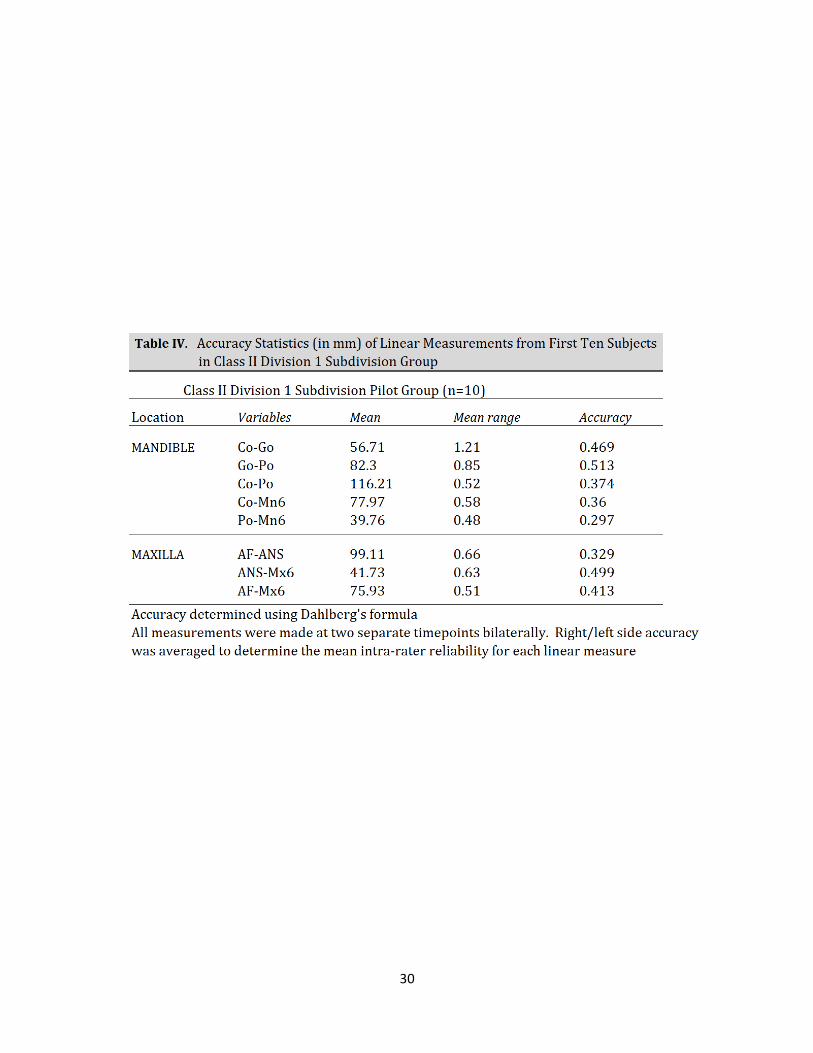
The pilot study, consisting of the first ten subjects in the Class II/1 subdivision
group and all eight bilateral linear measurements, showed that the intra-rater
reliability of all linear measurements was acceptable (Table IV). All
measurements were made at three separate time points by one examiner.
Condylion-Gonion (Co-Go) was determined to have an accuracy level of 0.513
mm by the Dahlberg formula, which was the lowest level of reliability of all of the
measurements. This is likely due to the difficulty in reliably identifying a point
gonion along the convex structure at the junction of the ramus and body of the
mandible. It was difficult to consistently identify where along this curvature the
ramus ended and the body began, made more difficult by the anatomic variation
common to this region. Still, the point Gonion was considered acceptably
accurate for the purposes of the study and all linear measurements proposed
initially were used for the remainder of the study.
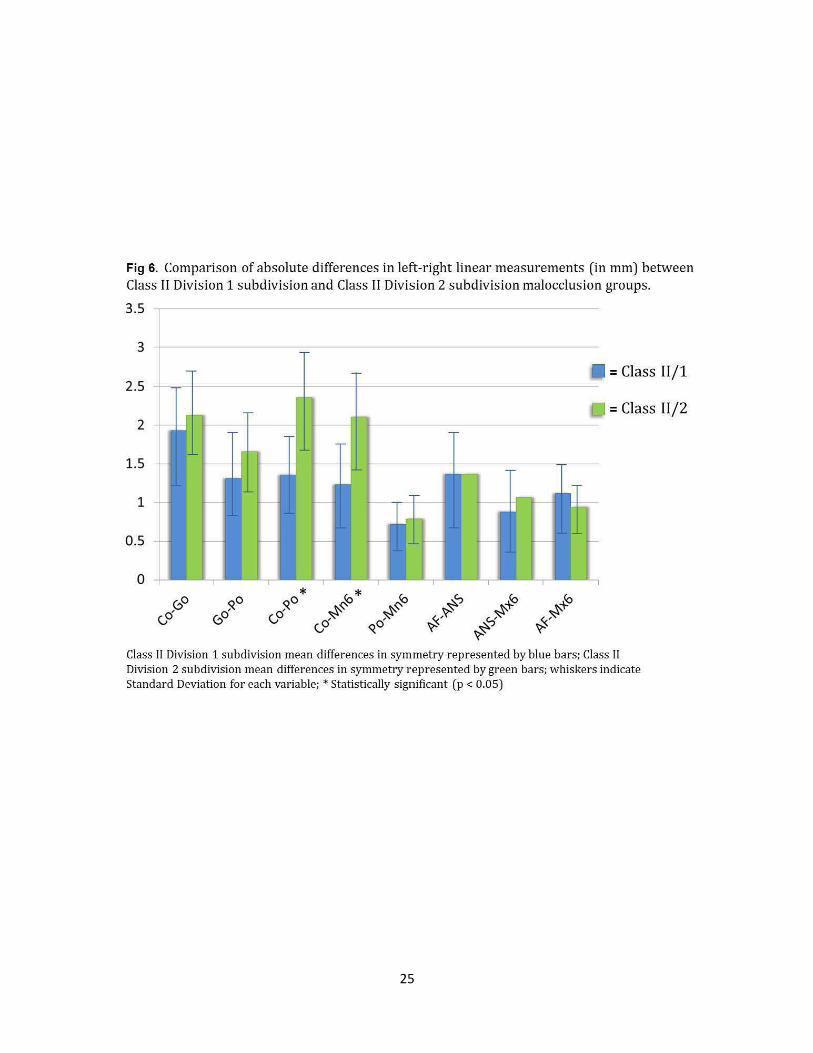
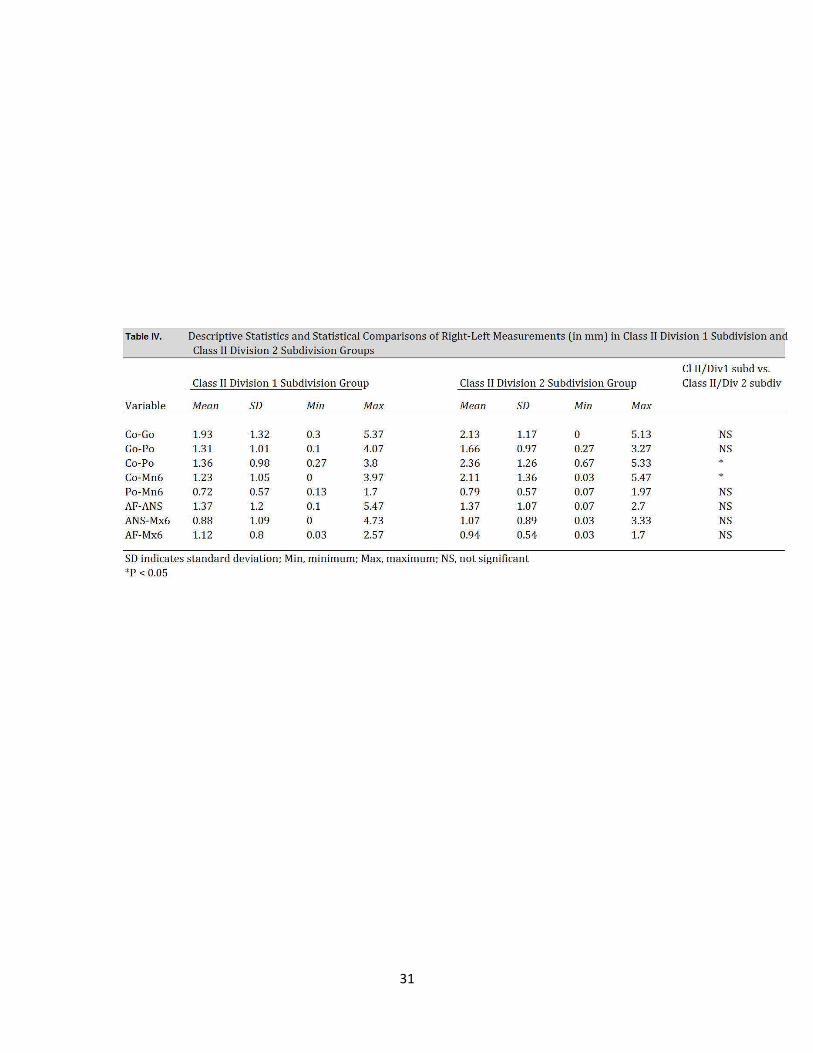
Statistically significant (p < .05) side-to-side differences existed between Class
II/1 subdivision subjects and Class II/2 subdivision subjects in two of the eight
measures (Table V). Additionally, all mandibular measures exhibited increased
side-to-side differences in the Class II/2 subdivision group versus the Class II/1
subdivision group. Measurements Co-Po and Co-Mn6 exhibited significantly
more asymmetry in the Class II/2 subdivision group than in Class II/1 subjects.
The mean difference in left-right measurements for Co-Po in the Cl II/2
subdivision group was 2.36 mm +/- 1.26 versus 1.36mm +/- 0.98 in the Cl II/1
subdivision group. For the measurement Co-Mn6, the mean left-right difference
23
was measured at 2.11 mm +/- 1.36 versus 1.23 mm +/- 1.05 for the Class II/1
group. Though both measures of asymmetry proved statistically significant, it
must be noted that standard deviations for these measurements and the others
made in this study, were high enough to call into question the strength of
statistical significance. There were no statistically significant differences in
maxillary left-right measures between the Cl II/1 subdivision group and the Cl II/2
subdivision group.
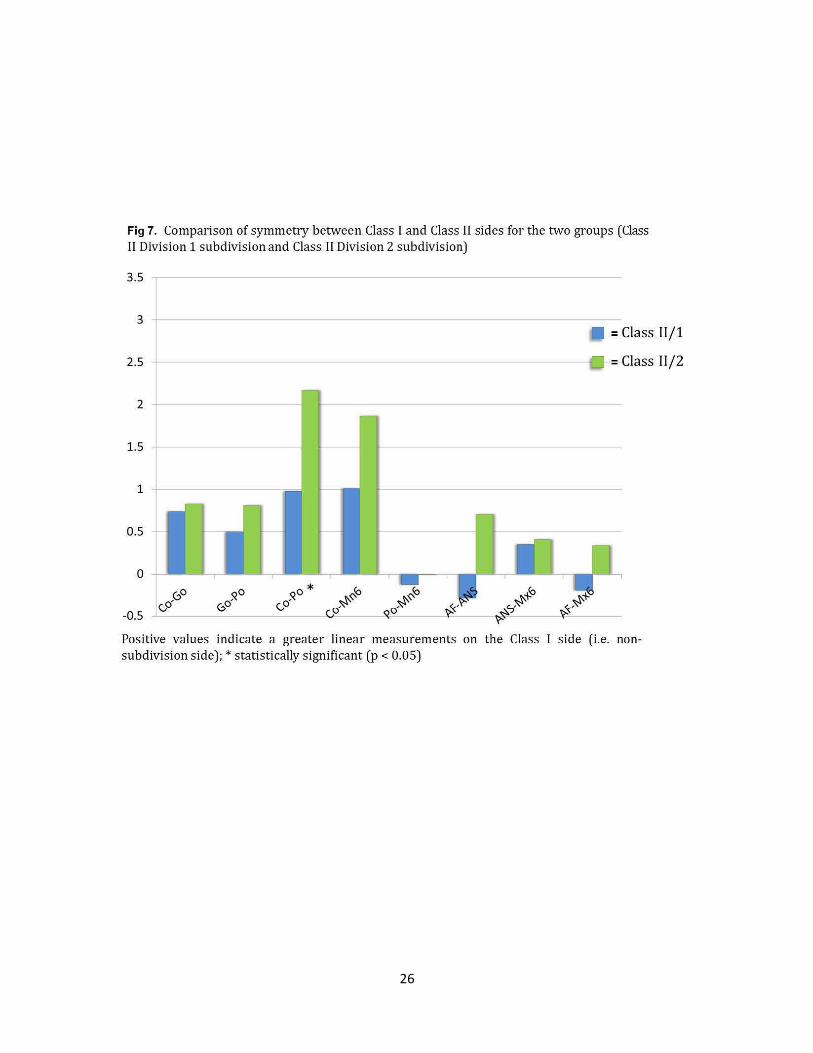
The data was then analyzed to compare differences in linear measurements
between the Class I and Class II sides for each of the two groups (Figure 7).
Means and standard deviations were collected for this data set. Paired Student’s
t tests were applied to compare each linear measure for the two groups. The
amount of Class I versus Class II side asymmetry was statistically significant (p
< .05) for the measurement Co-Po. The measurement Co-Po was 2.17 mm +/-
1.57 greater on the Class I side in the Class II/2 group versus 0.98 mm +/-1.36
for the Class II/1 group. Though no other measurements proved statistically
significant, there was an obvious trend identified, with each of the mandibular
measures showing greater Class I to Class II side asymmetry in the Class II/2
group. That is, in Class II/2 subdivision malocclusions, there were greater
differences in linear measures when comparing the Class I side of subjects to the
Class II side than in the Class II/1 group. Again, it must be mentioned that
standard deviations were high for all measures, thus diminishing the strength of
statistically significant findings.
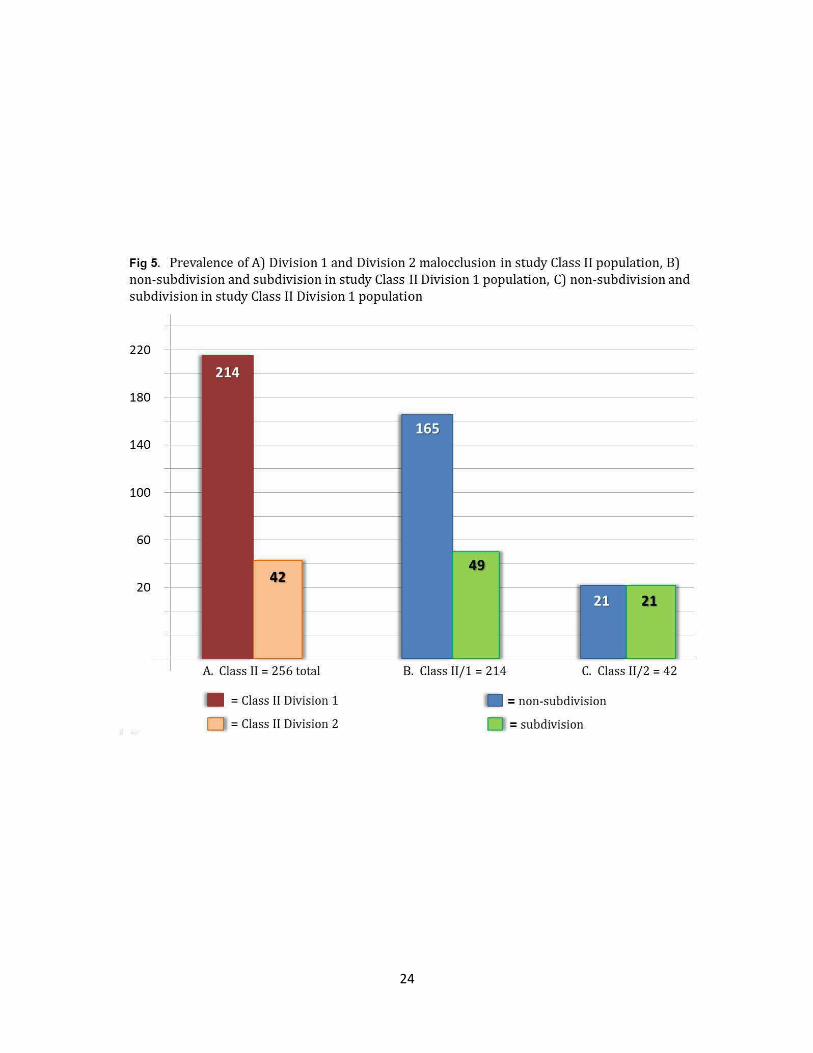
24
Fig 5. Prevalence of A) Division 1 and Division 2 malocclusion in study Class II population, B) non-subdivision and subdivision in study Class II Division 1 population, C) non-subdivision and subdivision in study Class II Division 1 population
220
180
140
100
60
20 42
A. Class II = 256 total
= Class II Division 1
D = Class II Division 2
49
21
B. Class II/1 = 214 C. Class II/2 = 42
= non-subdivision
D = subdivision
25
Fig 6. Comparison of absolute differences in left-right linear measurements (in mm) between Class II Division 1 subdivision and Class II Division 2 subdivision malocclusion groups.
3.5
3
-2.5
1-f-2
1.5
1
0.5 r-
0
~
-
-----,
I!
-
~
-
r--
* ~0 0 ()
= Class 11/ 1
- = Class 11/2 -
- -- - --f-
:- ;- - . .-- _ -L..
r~ ~
r----; r------: t-- :------ t-
Class II Division 1 subdivision mean differences in symmetry represented by blue bars; Class II Division 2 subdivision mean differences in symmetry represented by green bars; whiskers indicate Standard Deviation for each variable; *Statistically significant (p < 0.05)
26
Fig 7. Comparison of symmetry between Class I and Class II sides for the two groups (Class II Division 1 subdivision and Class II Division 2 subdivision)
3.5
3
2.5
2
1.5
1
0.5
0
-0.5
~0 o' (j
=Class 11/1
=Class 11/2
Positive values indicate a greater linear measurements on the Class I side (i.e. nonsubdivision side); * statistically significant (p < 0.05)

27
28
Table II. Inclusion Criteria for the Sample Selection
Class II Division 1 Subdivision group
Class II side being at least a 1/2 step Class II
All permanent teeth up to 2nd molar present
anomalies
Class II Division 2 Subdivision group
Class II side being at least a 1/2 step Class II
All permanent teeth up to 2nd molar present
anomalies
Max central incisor to sella-nasion line< 98°
Mandibular plane to Frankfurt horizontal plane <
Overjet < 3 mm
mandibular incisors
29
Table Ill. Description of Landmarks Landmark
condylion (Co)
gonion (Go)
pogonion (Po)
articular fossa (AF)
anterior nasal spine (ANS)
mesial surface of mandibular first molar
mesial surface of maxillary first molar
Definition
Most superior, posterior point on the mandibular condyles (bisected) The point at the middle of the curviture at the angle of the mandible. Represents junction of the ramus and body of the mandible at its posterior inferior aspect (bisected)
The most anterior point on the anterior curvature of Mandibular symphysis The most superior point in the concavity of the fossa; the deepest point in the concavity The most anterior midpoint on the anterior nasal spine of the maxilla The point on the mesial surface of the mandibular first molar at the height of contour The point on the mesial surface of the maxillary first molar at the height of contour
30
31
Table IV. Descriptive Statistics and Statistical Comparisons of Right-Left Measurements (in mm) in Class II Division 1 Subdivision a nd Class II Division 2 Subdivision Groups
Class II Division 1 Subdivision Group Class II Division 2 Subdivision Group
Variable Mean SD Min Max Mean SD
Co-Go 1.93 1.32 0.3 5.37 2.13 1.17 Go-Po 1.31 1.01 0.1 4.07 1.66 0.97 Co-Po 1.36 0.98 0.27 3.8 2.36 1.26 Co-Mn 6 1.23 1.05 0 3.97 2.11 1.36 Po-Mn6 0.72 0.57 0.13 1.7 0.79 0.57 AF-ANS 1.37 1.2 0.1 5.47 1.37 1.07 ANS-Mx6 0.88 1.09 0 4.73 1.07 0.89 AF-Mx6 1.12 0.8 0.03 2.57 0.94 0.54
SO indicates standard deviation; Min, minimum; Max, maximum; NS, not significan t *P < 0.05
Min Max
0 5.13 0.27 3.27 0.67 5.33 0.03 5.47 0.07 1.97 0.07 2.7 0.03 3.33 0.03 1.7
CIII/ Div1 subd vs. Class II/Div 2 subdiv
NS NS * *
NS NS NS NS
32
V. DISCUSSION
Given the often stark morphological differences between a Class II/1 and Class
II/2 malocclusion, it is a diagnostic oversimplification to group the two together as
one in the same under the heading ‘Class II malocclusion.’ Much has been
written about the development of a Class II subdivision malocclusion but this is
the first study, to the author’s knowledge, to compare skeletal morphological
differences between a Class II Division 1 subdivision malocclusion to that of a
Class II Division 2 subdivision malocclusion. In his study of subdivision
malocclusion, Sanders concluded that posteriorly positioned and shorter
mandibles on the Class II side are the primary etiological factors in the
occurrence of subdivision malocclusion. The results of this study indicate the
same, at least in regard to mandibular length, as there was an identifiable trend
of decreased mandibular length on the Class II side in both Division 1 and
Division 2 subdivision malocclusions. No comment could be made in regard to
the antero-posterior positioning of the mandible itself, as in this study’s design,
reference planes were not established.
The first objective of this study was to determine whether there is a higher
prevalence of subdivision malocclusion in the Class II/2 type. Based on the
population studied, the results indicate that, in fact there is. The results indicate
that a subdivision malocclusion was present in 50% of subjects with Class II/2
malocclusion (21 out of 42). In the Class II/1 group, on the other hand, 22.9%
(42/256) were found to have a subdivision malocclusion. These results suggest
that asymmetry may be one of the constellation of features that commonly
33
characterize the Class II/2 malocclusion, albeit less common than other features
which may be considered pathognomonic. More common morphological
features, as discussed previously, include upright maxillary central incisors,
deep bite, decreased mandibular plane angle, maxillomandibular hypodivergence
and decreased lower face height (Brezniak 2002, Peck 1998). The higher
prevalence of subdivision malocclusions found in Class II/2 subjects supports this
initial hypothesis, which was based on clinical observation. It is noteworthy that
Edward Angle, over a century ago, thought there to be a higher instance of
asymmetric occlusal relationships in Class II/2 malocclusion yet, to the authors’
knowledge, there was no prior or subsequent literature to support or refute his
claim. As stated previously, Angle estimated that up to 70% of Class II/2 patients
present with a subdivision malocclusion. Larger population studies would be
needed to better estimate the true prevalence of subdivision in Class II/1 and
Class II/2 populations.
Having found a higher prevalence of subdivision malocclusion in the Class II/2
group, the second objective was to determine if this may be due to greater
skeletal and/or dentoalveolar asymmetry. The results of this study indicate that
there is greater mandibular asymmetry in the Class II/2 malocclusion population
(versus Class II/1 malocclusion). Two of five measures of mandibular asymmetry
proved significantly greater (p< 0.05) in the Class II/2 malocclusion group. These
were Co-Po and Co-Mn6. The results from the remaining three mandibular
measures also indicate greater asymmetry in the Class II/2 malocclusion group,
though not to a statistically significant degree. Of the linear measurements
34
chosen for use in this study, Co-Po is most indicative of total mandibular length
and therefore, the most logical measurement to use when comparing mandibular
length between sides. The landmark Pogonion was chosen for its relative ease
in identification. Other authors have used various points to define mandibular
length, including McNamara, who used condylion-gnathion to measure “effective
mandibular length” in his widely-accepted cephalometric analysis (1984).
The development of a Class II subdivision malocclusion is multifactorial, as is the
development of Class II malocclusions in general. Although there is agreement
that a confluence of factors may lead to the development of subdivision
malocclusion, it remains difficult to pinpoint the precise cause of the asymmetric
occlusion in most cases (Fischer 1953). In regards to the development of the
Class II/2 malocclusion, Ricketts found that the condyles rest in a more posterior
and superior position. This may be due to the upright nature of the maxillary
incisors and in essence, a restricted forward positioning of the mandible.
Ricketts defined this scenario as a “posterior functional shift.” It is thought by
some that by proclining the maxillary incisors to a more normal inclination, you
may restore the ability for the condyles and the mandible to move forward closer
to a Class I relationship, sometimes referred to as “unlocking the mandible.” It is
generally accepted that functional shifts, lateral and otherwise, may affect
symmetric growth of the mandible. It is possible that a posterior functional shift, if
assumed to be occurring in the Class II/2 population, may have the same effect
therefore leading to greater mandibular asymmetry in this population. This is
merely speculation but merits further investigation on this subject.
35
Proper diagnosis and treatment planning in cases of asymmetric malocclusion,
be it of true skeletal or dental etiology, is one of the more challenging elements
that we deal with in orthodontic practice. The results of this study indicate that
mandibular asymmetry is a common feature of Class II/2 malocclusion. It cannot
be assumed that non-subdivision Class II/2 malocclusions would demonstrate
more asymmetry than their Division 1 counterparts since only subdivision
malocclusions were investigated in this study. Further, it is true that some
degree of skeletal asymmetry is considered normal. As normative data, the
differences in symmetry, even in those variables found to be statistically
significant in this study, may be small enough to be considered not clinically
significant. That said, it is prudent for the orthodontist to look closely for both
dental and skeletal asymmetry prior to initiating definitive treatment. This is
especially true given the fact that the deep bite, a feature common to the Class
II/2 phenotype, may mask dental midline discrepancies. Early recognition of
asymmetry, be it dental or skeletal in nature, will help the clinician to formulate
the most efficient treatment plan to correct the patient’s malocclusion. Special
treatment considerations in the correction of subdivision malocclusion may
include asymmetric extractions and/or surgery in addition to specific anchorage
concerns.
When comparing absolute differences in bilateral linear measurements between
groups, one other measurement proved statistically significant (p < 0.05); that
was, Co-Mn6. It is impossible to say whether this was due to an overall increase
in effective mandibular length (i.e. skeletal asymmetry) or due to distal
36
positioning of the mandibular molar on the Class II side. In other studies,
reference planes were established, thereby allowing mesio-distal position of the
molar to be better assessed. Since reference planes were not established in this
study, no definitive conclusions could be drawn regarding the mesiodistal
position of maxillary and mandibular molars. Furthermore, when the data was
studied to compare Class I versus Class II sides of subdivision malocclusion, the
differences between sides of Co-Mn6 did not prove significant. The only
significant finding when analyzing the data in this manner was, as previously
stated, Co-Po.
Although the methods described in this study were found to be sufficiently
accurate in the determining the existence of mandibular asymmetry, it would be
impractical to apply routinely in the diagnostic process. There are some inherent
weaknesses that must be recognized as well. Without the establishment of
reference planes, it is impossible to determine whether the molar is mesially or
distally positioned in craniofacial complex. For example, if it were determined
that there is significant differences in the measurement Co-Mn6 between sides, it
could be due to the asymmetry in the molar position itself or due to mandibular
asymmetry. Without reference planes, it is impossible to determine. Therefore,
this study could not draw conclusions about the mesio-distal position of the
maxillary or mandibular first molar. According to Sanders (2010), a mesially
positioned maxillary molar and a distally positioned mandibular molar on the
Class II side were minor contributing factors in the etiology of subdivision
malocclusions.
37
Another limitation of this study was that no second evaluator was used to verify
the linear measurements made, making the determination of inter-rater reliability
impossible. Previous studies, however, indicate that inter-rater reliability while
admittedly not as strong as intra-rater reliability is, in fact considered acceptable
(Goldenberg 2007, Lagrevere 2009). The intra-rater reliability reported here
showed good reproducibility of measurements and therefore it was concluded
that little information would be gained from an additional evaluator. That said,
CBCT imaging offers distinct advantage over conventional radiographic
techniques for making linear measurements in the assessment of skeletal
morphology. One of the main advantages of CBCT over conventional
radiography for the purposes of making linear measurements is that it is not
subject to magnification error. Ludlow et al showed that skull orientation did not
significantly affect accuracy of linear measurements the way that it potentially
does with cephalometric and panoramic techniques (2007).
It must be stated that with all measurements made in this study, there existed
high standard deviations thus diminishing the strength of statistical significance.
Each of the two groups of subdivision malocclusions included twenty subjects.
The occurrence of Class II/2 malocclusion has been found to be between 3-4% in
the United States with Class II/2 subdivision malocclusions occurring significantly
less (at one half the rate according to the result of this study) (Massler 1951).
The strength of this study would have been greater had there been more suitable
subjects. Another factor may be the broadness of the inclusion criteria utilized in
the selection of the study sample. The inclusion criteria for the subdivision

38
groups specified that there must be at least a half-step Class II molar relationship
on one side. If a more stringent inclusion criteria had been selected, perhaps the
asymmetry detected in this study (in mandibular length, condylion-pogonion)
would be more pronounced or demonstrate a higher degree of statistical
significance.
39
VI. CONCLUSION
1. In the population studied, 256 patients met the inclusion criteria determined
for Class II malocclusion. Of these, 83.6% (214 of 256) had Class II Division 1
malocclusion. The other 16.4% (42 of 256) had Class II Division 2 malocclusion.
2. The prevalence of unilateral Class II malocclusion (i.e. subdivision
malocclusions) was greater in Class II Division 2 patients than in Class II Division
1 patients by almost twofold.
3. Bilateral linear measurements using selected maxillary and mandibular
skeletal and dental landmarks reveal a trend of greater mandibular asymmetry in
patients with Class II Division 2 subdivision malocclusion. Every mandibular
variable measured indicated a greater degree if mandibular asymmetry in the
Class II Division 2 subdivision malocclusion group, with the measure Co-Po
proving statistically significant.
4. Linear measurements using the seven landmarks selected in this study can
be made accurately, with good intra-rater reliability and would be acceptable for
further studies. However, with recent advances in the use of 3D volumetric
analysis via CBCT, it is possible that newer methods may enable more accurate
assessment of skeletal morphology, including skeletal asymmetries.

40
41
Appendix A. Raw data. Class II Division 2 Subdivision Group. Mandibular measurement co-go go-po co-po
subj ect right left r-1 right left r-1 right left r-1
2.0001 1 52.2 50.3 1.9
53.3 .0.3
51.6 0 .7 51.73 '0.767
84.6 87.6 -3 118.3 120.9 -2.6 118.9 120 .4 -1.5
118.2 120 .2 -2 118.5 120 .5 -:2.0 3
2 53 83.6 S8 -4.4
3 52.3 85.6 88 -2.4
mean 52.5 84.6 87.87 ~3.27 SD
2.()()()2 1 0 .899
66.6 66.6 0
0 .838 91.5 88.8 2. 7
92.8 90 .7 2.1
92.5 87.9 4.6 92.27 89.13 '3.133
0 .45
130 .2 126.9 3.3
130 .3 126.4 3.9
129.3 126 3.3
129.9 126.4 '3.s
2 66.4 65.2 1.2
3 66.3 66.4 mean 66.43 66.0 7
SD
.0.1 '0.367
0 .591 1.0 66 0 .283
2.0003 1
2
60.7 56.6 4.1 80.7 81.8 -1.1 115.6 113.9 1.7
59.8 56.8 3 80.2 &0.5 .0.3 115.4 113.9 1.5
3 59.1 58.2 0 .9 80 .8 80 .2 mean 59.87 57.2 "2.667 80.57 80.83
so 1.327
2--0004 1 57.1 57.3 -0.2 87.4 85.3
2 58.9 57.4
3 59.4 56.2 mean 58 .47 56.97
SD 2.0005 1
2
3
60.4 57
60.8 59
61 60.1 mean 60.73 58.7
SD
1.5
3.2
"'i.s 1.388
87.5 84.3
87.7 85.4
87.53 85
3.4 82.6 85.5
1.8 82.1 82.8
0 .9 81.5 82.1 "2.0 33 82.0 7 83.47
1.0 34
0 .6 116.4 113.9 2.5 ':o.27 115.8 113.9 "1.9
0 .694 0.432
2.1 116 114.5 1.5
3.2 116 113.4 2.6
2.3 116.1 113.9 2.2
'2.533 116 113.9 '2.1 0.478 0.455
-2.9 111.6 112.6 -1
..0.7 110 .6 112 -1.4
..0.6 110 .4 110 .8 ..0.4
~1.4 110 .9 111.8 ':o.93
1.0 61 0 .411
c.o-mn6
right left r-1
79 81 -2
79.3 81.2 -1.9
78.8 81.5 -2.7
79.0 3 81.23 "=2.2
0 .356
87.1 84 3.1 87.3 83.5 3.8
85.7 84.4 1.3 86.7 83.97 '2.733
1.053 77.3 76.1 1.2
77.1 76 1.1
76.8 76.4 0 .4
77.0 7 76.17 '0.9
0 .356
79.7 77.5 2.2 79.9 77.3 2.6
&0.3 77.7 2.6
79.97 77.5 '2.467
0 .189 72.6 72.6 0
71.8 73.2 -1.4
70.7 73.2 -2.5
7 1.7 73 ':1.3
1.0 23
po-mn6
right left r-1
38.5 40.2 -1.7
39.7 40.8 -1.1
40.2 39.9 0 .3 39.47 40.3 ..0.83
'0.838 44.6 43.7 0 .9
43.8 43.7 0 .1
43.4 43.6 -0.2
43.93 43.67 0 .267
'0.464
39.5 38.4 1.1 37.9 37.7 0 .2
38.9 37.5 1.4
38.77 37.87 0 .9
'0.51 37.3 37.5 -0.2
36.6 37.3 -0.7
36.5 36.5 0 36.8 37.1 ..0.3
'0.294
40.5 40.3 0 .2
39.3 39.3 0
38.7 38.4 0 .3
39.5 39.33 0 .167
'0.125
2.0006 1
2
3
57.6 58.3
58.1 57.7
58 57.7
.0.7
0.4
0 .3
94 .9 93.5 1.4
95 93.7 1.3
94 .8 93.7 1.1
94.9 93.63 'i.267
122.9 123.1 .0.2 89.1 87.6 1.5 38.5 39.2 .0.7
-1.5
.0.9
-1.0 3 '0.34
1.1
0 .6
0 .1
0 .6
'0.408
0 .3
0 .2
.0.3
0 .0 67
'0.262
-1.1
mean 57.9 57.9
SD 2.0007 1
2
3
67.9 67.1
69.8 65.7
70 66.1
2.()008
mean 69.23 66.3
SD
2
59.8 57.3
57.4 55.5
3 57.9 55.4
mean 58.37 56.0 7
SD 2.()009 1 64.9 62.9
2 65.7 63.2
3 64.8 63.3
mean 65.13 63.13
SD
"o 0.497
0 .8
4.1
3.9
'2.933
1.511
2.5
1.9
2.5 "2.3
0 .283
2
2.5
1.5
'2 0 .408
0 .125
9 4.8 94 .8 0
93 94.2 -1.2
92.9 9 4.1 -1.2 93.57 94 .37 ':o.8
0 .566
85.3 83.3 2
80 82 -2 79.8 82.7
81.7 82.67
89.6 86.3
89.2 86.1 90 .1 85.7
89.63 86.0 3
-2.9 ':o.97
2.13
3.3
3.1
4.4
'3.6 0 .572
121.3 120 .1 1.2 89.2
121.6 120 1.6 89.3 121.9 121.1 '0.867 89.2
0 .772 127.4 127.3 0 .1 85
125.6 124.2 1.4 84.6
125.5 125 0 .5 84.8 126.2 125.5 '0.667 84.8
0 .544
117.8 113.1 4.7 80.2 111.6 111.2 0.4 77.4
111.4
113.6
127
110 .6 0 .8 111.6 "1.967
1.94
126.2 0 .8
129.6 128.1 1.5
129.9 128.1 1.8 128.8 127.5 '1.367
0 .419
77.9 78.5
86.8 89.7
89.3
88.6
87.3 1.9 34.6 36.1
87.3 2 35.1 36 87 A ' i.8 36.0 7 37.1
0 .216 85 .3 -0.3 43.8 42.7
84.6 0 41.1 40.5
84.4 0.4 41 40.9 84.77 '6.0 33 41.97 41.37
0 .287
73.5 6. 7 36.3 36
76.5 0 .9 35.7 35.5
76.8
75.6
84 .7
1.1
'2.9
2.688
2.1
35.4
35.8
35.7
35.73
42.8
87.7
89.5
87.3
2
.0.2
'1.3
1.0 61
41.7 41.4
42
41.7
41.4 0
40.7 1.3
41.63 0 .0 67
'0.981
42
2.0010 1 54.2
2 59.1
3 59.3
mean 57.53
so
2.0011 1 68.3
55.5 -1.3 8 1.6
6 1.2 -2.1 8 1.1
6 1.4 -2.1 8 1.3
59.37 ~1.83 8 1.33
0.377
66.2 2.1 96
2 68 66.4 1.6 95.5
3 68.6 66 2.6 95.6 mean 68.3 66.2 • 2.1
so
2.0012 1
2
3
0.408
60 .5 56.5 4
61.1 57.4 3.7
60.1 57.5 2.6
95.7
87.3
87
86.7 mean 60.57 57.13 '3.433 87
so 0.602 2-0013 1 64.5 62.7 1.8 92.5
8 1.3 0.3 82.6 -1.5
82.3 -1
82.07 ~.73 0.759
95.3 0.7
110.6 112.6 -2
113 113.4 .0.4
113.4 114 -0.6
112.3 113.3 ~ 1
0.712
127.9 126.8 1.1
72.6 74.4 -1.8 38.7
75 76.1 -1.1 39.2
74.9 75.5 -0.6 39.1
74.17 75.33 ~1. 17 39
0.492
83.9 83.8 0.1 43.9
38.9 -0.2
39.4 .0.2
39.2 -0.1
39.17 .0.17 '0.047
43.2 0.7 9 1.3 4.2 126.8 125.4 1.4 83.8 83.6 0 .2 42.7 41.9 0.8
90.4 5.2 126.9 125.1 1.8 84.5 83.2 1.3 43.2 41.9 1.3
92.33 '3.367 127.2 125.8 ' 1.433 84.07 83.53 0.533 43.27 42.33 0.933
1.929 0.287 0.544 0.262
88.5 -1.2 119.8 117.2 2.6 78.5 76.3 2.2 41.7 40.7 1
88.3 -1.3 119.8 117 2.8 79 76.2 2.8 41.3 40.7 0.6
87.9 -1.2 120 117 3
88.23 ':1.23 119.9 117. 1 ~2.8 78.1 76.3 1.8 41.4 41
78.53 76.27 '2.267 41.47 40.8
0 .047 0.163 0.411
94.1 -1.6 129.7 127.6 2.1 92.1 87.4 4.7 38.4 40.3
0.4
0.667
0 .249 -1.9
2 65.1 64.2
63.9
63.6
0.9
2.4
92.1 92.4 -o.3 129.8 124.7 5.1 9 1.8
92.2
92.03
86 5.8
87.8 4.4 87.07 '4.967
38.2
38
38.2
39.3 -1.1
3 66.3 92.2 93.2 -1 129.6 125.6 4 39.4 -1.4
39.67 -1.47
0 .33
-o.9
mean 65.3
so
• 1.7 92.27 93.23 ':o.97 129.7 126 ,.3. 733
0.6 16 -3.5
0.531 1.239 0.602 80 -3.3
79.3 -1.8
2.0014 1 59.5
2 60
63
61.3 -1.3
86.5 88.2 -1.7 118.5 123 -4.5
85.9 88 -2.1 116.4 122 -5.6 76.7
77.5
77.4
77.2
43.2
43.4
44.1
43.9 -o.s
3 60.1 62
mean 59.87 62.1
so
-1.9
~2.23 0.929
86 87.5
86.13 87.9
-1.5
~1.77 0.249
2.0015 1
2
52.2 5 1 1.2 93.9 9 1.2 2.7
52.9 5 1.1 1.8 93 92.3 0.7
3 52.8 5 1.5 mean 52.63 51.2
so
1.3 ' 1.433
0.262
93.4 9 1.9
93.43 9 1.8
1.5 ' 1.633
0.822
116.9
117.3
122.8 -5.9
122.6 ~5.33 0.602
78.9
79.4
-1.5
~2.2 0.787
42.9 44.4 -1.5
43.17 44.13 .0.97
0.411 121.7 123.2 -1.5 82.6 83.2 -o.6 40.6 40.5 0.1
121.9 122.9 -1 82 83.4 -1.4 40.4 40.9 -0.5
122.1 122.7 -o.6 8 1.9 83.2 -1.3 • • 121.9 122.9 -1.03 82.17 83.27 -1.1
0.368 0.356
40.9 41.2 -o.3
40.63 40.87 .0.23
0.249
2.0016 1 64.9 67.8 -2.9 88.6 89.3 -o.7 123 126.6 -3.6 83 87.4 -4.4 41.5 41.6 -o.l
2 65.5
3 65.3
mean 65.23
so
2.0017 1 64.8
2 64
3 64.3
66.9 -1.4
67.4 -2.1
67.37 ~2.13 0.6 13
60.1 4.7
60.9 3.1
60.4 3.9 • mean 64.37 60.47 3.9
so
2.0018 1
2
0.653
66.7 60.1 6.6
65.5 6 1.1 4.4
88.2
88
88.27
82.7
82.9
82.5
82.7
87.9
88
3 65.7 6 1.3 4.4 88.1
mean 65.97
so
60 .83 '5.133 88
1.037
89.4 -1.2
89.9 -1.9
89.53 ~1.27 0.492
82.8 -o.l 83.9 -1
86.2 -3.7
84.3
87.4
87.7
• -1.6
1.53
0.5
0.3
87.5 0.6
87.53 0 .467
0.125
123.3 125.5 -2.2
122.9 125.9 -3
123.1 126 ~2.93 0.573
123 126.6 -3.6
122.2 126.6 -4.4
122.4 127 -4.6 • 122.5 126.7 ·4.2
0.432 124.3 126.3 -2
122.9 126 -3.1
121.2
122.8
125.9 -4.7
126.1 ~3.27 1.109
83.3
83.2
83.17
80.1
80.3
80.3
87.2 -3.9
87.1 -3.9
87.23 ~4.07 0.236
82.1 -2
82.3 -2
82.1 -1.8
41.1 41
41.2
40
40.1
39.9 • 80.23 82.17 -1.93 40
0.094
86.3 87.1 -o.8 40.9 86.1 87.3 -1.2 40.3
42 -o.9 41.9 -0.9
41.83 .0.63
0.377
37.8 2.2
38.1 2
38.2 1.7
38.03 1.967 '0.205
42.2 -1.3
42 -1.7
86.4
86.27
87.6 -1.2
87.33 ~1.07 0.189
40.5 42.1
40.57 42.1
-1.6
-1.53
'0.17
43
2-0019 1 57.2 58.3 -1.1 82.9 83.6 .0.7 114.5 118.3 -3.8 76.8 8 1.8 -5 40.4 38.7 1.7
2 58 59.2 -1.2 82.7 84.2 -1.5 114.9 118.6 -3.7 76.5 82 -5.5 40.7 39 1.7
3 58.4 59.3 .0.9 82.3 83.9 -1.6 114.7 118.6 -3.9 76.4 82.3 -5.9 40.7 38.9 1.8
mean 57.87 58.93 ~1.07 82.63 83.9 • -1.27 114.7 118.5 • -3.8 76.57 82.03 • -5.47 40.6 38.87 1.733
so 0 .125 0.403 0.082 0.368 0 .047
2-0020 1 65.5 62 3.5 9 1.5 92 -o.s 127.8 125.2 2.6 94.2 92.3 1.9 38.8 40.1 -1.3
2 65.3 62.4 2.9 93.9 92.1 1.8 127.3 125.7 1.6 94.3 92.3 2 38.4 39.9 -1.5
3 65.1 62.2 2.9 96 92.4 3.6 127.8 124.9 2.9 94.5 92.8 1.7 38.4 39.5 -1.1
mean 65.3 62.2 • 3.1 93.8 92.17 ' 1.633 127.6 125.3 '2.367 94.33 92.47 ' 1.867 38.53 39.83 -1.3
so 0 .283 1.678 0.556 0.125 0.163
44
Appendix B. Raw data. Class II Division 2 Subdivision Group. Maxillary measurements.
subject right left r·l
2·0001 1 2
103.4 105.3 ·1.9 103.3 104.1 ·0.8
3 104.4 104.4 0 mean 103.7 104.6 ·0.9 so o.n9
2·0002 1 107 104.8 2.2 2 3
104.9 105.6 ·0.7
107.8 106.5 1.3
an.s-mx6
right left r·l
46.3 45.5
46
45.9 45.7 45.3
0.4 ·0.2 0.7
45.93 45.63 0.3
0.374 40.5 40.9
4.4 2.2
right left r-1
75.6 76.5 76.8 76.3
81.8 83.1
n ·1.4 n.4 .0.9 n.9 ·1.1 n.43 ·1.133
44.9 43.1
44.6 41.2 3.4 82 mean 106.6 105.6 0.933 44.2 40.87 3.333 82.3
0.205 82.5 .0.7
82.8 0.3 83.4 ·1.4 82.9 .0.6
so 1.212 2·0003 1
2 3
95.2 93.3 1.9 94.1 92.9 1.2 93.7 92.5 1.2
0.899 40.5 39.4 1.1 40.9 39.2 1. 7 40.5 39.3 1.2
0.698 73.4 73.6 .0.2 73.3 73.3 0 73.9 73.5 0.4
mean 94.33 92.9
so 1.433 40.63 39.3 0.33
1.333 73.53 73.47 0.067
0.262 0.249 2·0004 1 102.2 100.8 1.4
2 102.4 99 3.4 3 102.2 98.9 3.3 mean 102.3 99.57 2.7
so 0.92 2·0005 1
2 3
95.1 95.1 0 93.7 93.9 ·0.2
93.3 95.2 ·1.9
44.7 43.2 1.5 75.9 44.1 42.6 1.5 76.1 44.2 43.3 0.9 76.6 44.33 43.03 1.3 76.2
n.1 ·1.2 76.8 .0.7
76.9 .0.3 76.93 -o. 733
0.283 43.1 40.2 2.9
41.3 40.2 1.1 41.3 40 1.3
0.368 70 69.8 0.2
69.8 70 .0.2 69.9 70.7 .0.8
mean 94.03 94.73 ·0.7 41.9 40.13 1.767 59.9 70.17 .0.267
so 0.852 0.806 0.411 2·0006 1
2 3
109.6 109.8 ·0.2 41.8 40.4 1.4 85.2 86.7 ·1.5 85.3 86.6 ·1.3 86 86.6 .0.6
109.5 109.5 0 41.9 40.8 1.1 108.7 108.7 0 42.1 40.9 1.2
mean 109.3 109.3 ·0.067 41.93 40.7 1.233 85.5 86.63 ·1.133 so 0.094 0.125 0.386
2·0007 1 109.5 110.8 ·1.3 44.6 45.3 ·0.7 83.2 82.4 0.8 2 108.9 109.2 ·0.3 44.3 45.1 ·0.8 83.7 81.7 2 3 108.5 110.2 ·1.7
mean 109 110.1 ·1.1 so 0.66 0.589
2·0008 1 2 3
99.4 98.4 1 92.8 94 ·1.2 93 94.1 ·1.1
44.6
44.5
42.7 40.2 39.9
45.3 ·0.7 84.1 81.9 45.23 ·0.733 83.67 82
0.047 41.5 1.2 75.8 74.5 40.4 ·0.2 75.3 74.8 41.5 ·1.6 75.2 75.2
2.2 1.667 0.618 1.3 0.5 0
mean 95.07 95.5
so ·0.433 40.93 41.13 ·0.2 75.43 74.83 0.6
0.535 1.014 1.143

45
46
47
Appendix C. Raw data. Class II Division 1 Subdivision Group. Mandibular measurements. co. go go.po co-mn6 po.mn6
subject right left r· l right left r·l right left r·l right left r·l right left r· l
Hl001 sub L 2
3
58.7 55.4 3.3 58 553 2.7 58.3 56 2.3
87.6 87.6 0 120.2 117 3.2 80.9 79.3 1.6 4: .8 39.9 1.9 88 88.1 .0.1 120.4 117.1 3.3 81.2 79.2 2 88.2 86.8 1.4 120.5 116.9 3.6 81.4 79.4 2
4: .8 39.7 2.1 4:.3 40.3
mean >8.33 55.57 2.767 87.93 87.5 0.433 120.4 117 3.367 81.17 79.3 1.867 4:.63 39.97 1.667
st dev 0.411 0.685 0.17 0.189 0.478
1-0002 sub R 2
3
53.3 52 53.9 53
1.3 0.9
54.8 52.9 1.9
n.3 11
n.9 n.1 0.3 0.8
78.3 n.1 1.2
111.5 109.3 2.2 111 110.1 0.9 110.8 109.8
74.9 73.8 1.1 37.6 36.6 1 75 74 38 36.2 1.8 74.3 73.4 0.9 38.4 36.1 2.3
mean 54
st dev
52.·'>3 1.367 n.83 n.o1 o.767 111.1 109.7 1.367 74.73 73.73 38 36.3 1.7 0.411 0.368 0.591 0.082 0.535
1-0003 sub L 2
3
59.1 53.1 6 90.3 91.1 .0.8 122.4 121.2 1.2 85.7 84.7 38.8 38.5 0.3 38.4 37.7 0.7 39.1 38.6 0.5
>8.9 533 5.6 89.9 91.9 ·2 123 121.9 1.1 >8.4 53.9 4.5 91.1 91 0.1 122.1 121.2 0.9
85 84.3 0.7
85.9 85 0.9 mean >8.8 5H 3 5.367 90.43 91.33 .0.9
st dev 0.634 0.86
122.5 121.4 1.067 85.53 84.67 0.867 38.77 38.27 0.5
0.125 0.125 0.163 1·0004 63.2 6H 1.4 sub R 2 63.4 63.l 0.1
3 65.6 63.2 2.4 mean 64.07 62.77 1.3
85.3 86 .0.7 85.3 85.3 0 85 86.7 ·1.7
85.2 86 .0.8
120.4 122.5 ·2.1 82.1 84.3 ·2.2 121.2 122.9 ·1. 7 81.3 84.5 ·3.2 120.9 122.1 ·1.2 81.7 85 ·3.3 120.8 122.5 ·1.667 81.7 84.6 ·2.9
4: 40.3 0.7 40.2 40.9 ·0. 7 40.4 41 .0.6
40.53 40.73 ·0.2 st dev 0.942 0.698 0.368 0.497 0.638
1·0005 56.5 56.o .0.1 84.1 81.2 2.9 120.1 118.8 1.3 81.6 82.1 ·O.S 39.9 38.6 1.3 sub R 2 56.8 56..3 0 83.3 82.9 0.4 119.2 119.8 ·0.6 82.2 82.8 ·0.6 40.2 38.3 1.9
3 56 57.l mean 56.43 56:~
st dev
1·0006 1 48.9 sub R 2 46.3
44.4 44 .. 3
3 45.3 44.l mean 45.83 44.5 st dev
1·0007 1 58.1
sub L 2 58.4 545 55.1
3 58.3 55:~
mean 58.27 55.2 st dev
1·0008 1 57.3 58
·1.3 84.2 82.8 .0.467 83.87 82.3 0.591 4.5 75.8 77.4 1.5 76 77
1.4 119.8 118.4 1.4 1.567 119.7 119 0.7 1.027 0.92
·1.6 104.6 105.4 ·0.8 ·1 105 104.9 0.1
81.3 81.7
68.9 68.3
76.3 n.3 ·1 104.5 105.8 ·1.3 68.3 2.333 76.03 n.3 1.546
·1.267 104.7 105.4 ·0.667 68.5
0.285 0.579 3.5 3.3
82.7
82.1 82.2 82.2
0.5 .0.1
2.4 82.2 82.4 .0.2 3.067 82.33 82.27 0.067
0.478 0.309 .0. 7 79.4 n.6 1.8
119.3 117.5 1.8 119.3 117.6 1.7
119.1 117.8 1.3 119.2 117.6 1.6
0.216 112.3 111.1 1.2
82.1 82.5 82.3 82.3
73.7
subl 2 58.6 57.l 1.3 78.4 78.2 78.67
n.7 0.7 112.4 111.3 1.1 73.3
3 57.4 57.1 0.3 mean 57.77 57.47 0.3 st dev
st dev
1·0009 1 56.7 sub R 2 57.5
3 56.8
54.3 53.4 55.9
0.816 0.816 2.4 81.1 4.1 81 0.9 81.5
78.2 0 112 111.4 0.6 73.2 n.83 o.833 112.2 111.3 o.967 73.4
0.741 0.262 0.741 0.262
82.9 ·1.8 115 116.3 ·1.3 77.4 83.4 ·2.4 115.4 116.7 ·1.3 77.1 83.2 ·1.7 115.1 116.7 ·1.6 77.6
81.1 0.2 39.8 37.8 2 82 ·0.3 39.97 38.23 1.733
0.356 0.309 69.7 ·0.8 35.9 70 ·1.7 36
69.3 ·1 36.4 69.67 ·1.167 36.1
36.3 .0.4 35.8 0.2 35.8 0.6 35.97 0.133
0.386 0.411 81.1 1 4:.1 40.5 0.6 81.4 1.1 40.9 40.2 0.7
81.3 1 40.8 40.3 0.5 81.27 1.033 40.93 40.33 0.6
0.047 73.5 0.2
0.082 39.9 39.1 0.8
73.2 0.1 40 73.3 ·0.1 40.1 73.33 0.067 40
0.125 0.125
76.9 0.5 40.5 77.3 ·0.2 40.4 77.1 0.5 40.7
38.9 1.1 39.2 0.9 39.07 0.933
0.125 0.125
40.7 ·0.2 41 ·0.6
40.6 0.1 mean 57
st dev
54.53 2.467 81.2 1.307
83.17 ·1.967 115.2 116.6 ·1.4 77.37 77.1 0.267 40.53 40.77 ·0.233
1·0010 1 55.5 sub L 2 55.4
3 55.9 mean 55.6
st dev
1·0011 1 63.3 sub L 2 63.5
0.309 0.141 0.33 0.287
54.9 0.6 79.1 80.3 ·1.2 116.3 115.8 0.5 73.3 74 ·0.7 41 41.3 ·0.3 55 0.4 79.8 80.3 .0.5 116.3 115.6 0.7 73.2 54.3 1.6 79.7 80.4 .0.7 116.4 115.8 0.6 73.4 54.73 0.867 79.53 80.33 .0.8 116.3 115.7 0.6 73.3
0.525 0.294 0.082 59.2 4.1 82 80.9 1.1 121.7 121.2 0.5 80.3
60.3 3.2 82.2 82 0.2 121.3 121.5 ·0.2 80.4
73.6 ·0.4 41 73.8 ·0.4 41.3 73.8 ·0.5 41.1
0.141 79.1 1.2 43.7 78.8 1.6 43
41.6 ·0.6 41.4 ·0.1 41.43 ·0.333
0.205 43.4 0.3 43.9 ·0.9
3 63.6 59.4 4.2 82.4 mean 63.47 59.63 3.833 82.2
80.2 2.2 120.9 120.4 0.5 80.4 78.5 81.03 1.167 121.3 121 0.267 80.37 78.8
1.9 43.3 44 ·0. 7 1.567 43.33 43.77 ·0.433
0.287 0.525 st dev 0.45 0.818 0.33
48
1·0012 4.3 119.7 115.4 4.3 2.1 41.1 39.4 1.7 sub L 2
58.6 55.9 2. 7 57 56
85.9 81.& 83.4 81.5 84.6 81.7 84.63 81.&
1.9 119.4 115.8 3.6 79.5 n.5 79.5 n.6 79.8 nA 79.63 n.5
1.9 41 39.7 1.3 58.6 55.7 2.9
mean 58.07 55.87 2.2 st dev 0.852
2.9 119.4 115.9 3.5 2.4 41 39.5 1.5 3.033 119.5 115.7 3.8 2.133 41.03 39.53 1.5 0.984 0.356 0.205 0.163
1·0013 1 63.8 sub L 2 64.7
66.3 56
·2.5 88 ·1.3 87.7
8H 4.6 120.7 121.4 ·0.7 83.1 81.2 1.9 39 40.6 ·1.6 83.& 3.9 120.9 121.3 ·0.4 83.2 81.3 1.9 39.3 40.3 ·1
65.4 66
mean 64.63 56.1 st dev
-0 .6 87.6 83.9 3.7 121 121.7 4 0 .7 82.9 81.1 1.8 39.6
1.867 39.3 0.047
-10.8 ·1.2 -1.457 87.n 83.7 4.067 120.9 121.5 -o.5 83.07 81.2
0.785 0.386 0.141
1·0014 1 51.4 54.4 ·3 88 87.6 oA 115.8 115.5 -o.8 81.8 81.5 0.3 37.8
40.57 ·1.267
0.249 37.4 0.4
subR 2 3
52.3 53.2 ·0.9 52.4 53.9 ·1.5
88.1 88.7 ·0.6
88.3 87.& 0.5 88.13 88.03 0.1 mean 52.03 53.83 ·1.8
st dev 0.883 0.497
1·0015 1 52.5 51.4 1.1 79 8H ·2.4
sub L 2 3
52.5 51.3 52.3 51.8
mean 52.43 51.5 st dev
1·0016 1 57.9 58.1 sub L 2 57 57.8
1.2 79.4 81.1 ·1.7 0.5 79.6 82.1 ·2.5 0.933 79.33 81.53 ·2.2
0.309 0.356 ·0.2 82.7 83.3 ·0.6 ·0.8 84.8 82.9 1.9
116 115.9 0.1 81.5 81.2 0.3 115.9 116.3 -().4 81.6 81.6 0
115.9 116.3 -o.367 81.63 81.43 0.2 0.368 0.141
114.4 110.5 3.9 70.5 69.7 0.8 113.7 111 2.7
113.1 111.2 1.9 70 69.9 0.1 70.9 70.3 0.6
113.7 110.9 2.833 70.47 69.97 0.5
0.822 0.294 115.4 115.2 -o.8 n.2 n.3 -o.1 115.4 115.3 -o.9 nA n.s -o.1
37.6 37.2 0.4 37.5 37.5 0 37.63 37.37 0.267
0.189 41.8 42 ·0.2 42.3 42.4 42.17
40.1 40.8
42.3 0 42.7 ·0.3 42.33 ·0.167
0.125 39.7 0.4
40.3 0.5 s sa sa.2 -o.z 83.4 82.9 o.s 11.5.1 1!5.9 ·1.8 n .1 77.5 -o.s 40.3 40.1 o.z
mean 57.63 58.03 ·0.4 83.63 83.03 0.6 115.3 116.5 ·1.167 n.23 77.47 ·0.233 40.4 40.03 0.367 st dev 0.283 1.023 0.45 0.189 0.125
1·0017 1 58.9 58.1 0.8 82.7 83.3 ·0.6 115.4 116.2 ·0.8 n.2 77.3 ·0.1 40.1 39.7 0.4 subR 2 58.3 58 o.3 84.8 83.4 1.4 115.4 115.8 -0.4 n 75.9 0.1 39.9 39.9 0
40.4 40.1 0.3 40.13 39.9 0.233
3 58 58.3 ·0.3 83.5 83.9 ·0.4 115.1 115.6 ·0.5 n.4 77.4 0 mean 58.4 58.13 0.267 83.57 83.53 0.133 115.3 115.9 ·0.567 n.2 77.2 0 st dev 0.45
1·0018 1 62.2 59.3 2.9 sub R 2
3 52 59.1 2.9 62.5 61.4 1.1
mean 52.23 59.93 2.3 st dev
1·0019 1 52 0.849
50.5 1.5
0.899 0.17 83.4 85.8 ·2.4 120.4 121.5 ·1.1 82.7 86.5 ·3.8 120.3 121 ·0.7 84.6 85.8 ·1.2 121 121.6 ·0.6 83.57 86.03 ·2.467 120.6 121.4 ·0.8
1.062 0.216 83.4 81.1 2.3 83 82.4 0.6
78.1 79.7 78.4 80 77.7 79.4
78.07 79.7
77.5 73.4 77.2 73
0.082 0.17 ·1.6 43.2 42.7 0.5 ·1.6 43.4 42.7 0.7
·1. 7 43.4 42.9 0.5 -1.633 43.33 42.n o.557
0.047 0.094 4.1 35.8 36.2 ·0.4 4.2 36 35.9 0.1 sub L 2
3 50.8 49.5 1.3 50.5 49.5 83.2 81.8 1.4
112.6 109.4 3.2 111.9 110.1 1.8 112.5 110.2 2.3 77.5 73.9 3.6 36.1 36.3 ·0.2
mean 51.1 49.83 1.267 83.2 81.n 1.433 112.3 109.9 2.433 77.4 73.43 3.957 35.97 36.13 ·0.167 st dev 0.205
1·0020 1 64.6 59.8 4.8 81.4 sub L 2 63.8 60.1 3. 7 81.6
3 53 60.2 2.8 81.7
0.694 0.579 83.5 ·2.1 119.7 118.6 1.1 79.9 83.3 ·1.7 120 119 79.4 82.8 ·1.1 119.4 118.7 0.7 79.8
n.1 n n.3
0.262 0.205 2.8 41.4 42.7 ·1.3
2.4 41.4 42.8 ·1.4 2.5 41.3 42.7 ·1.4
mP?tnf;.~& fMl03 :\767 &1Ci7 &~' -16..~3 11Q7 11& & OQ33 7Q7 771:1 'Ci67 4137 471:1 -1~67
st dev 0.818 0.411 0.17 0.17 0.047
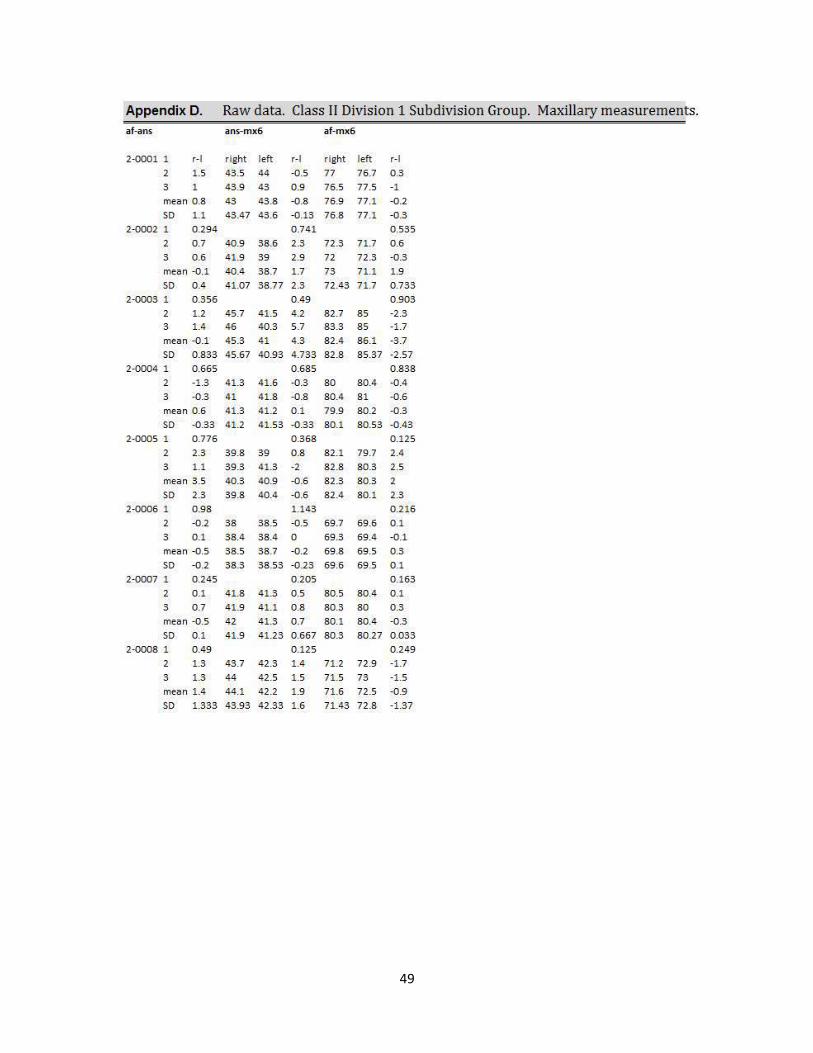
49
Appendix D. Raw data. Class II Division 1 Subdivision Group. Maxillary measurements. af-ans ans-mx6 af-mx6
2.0001 1
2
3
r·l 1.5
1
right left 43.5 44
43.9 43
r·l right left r·l -o.s 77 76.7 0.3
0.9 76.5 77.5 ·1 mean 0.8 43 43.8 .0.8 76.9 77.1 .0.2
so 1.1 43.47 43.6 .0.13 76.8 77.1 .0.3
2.0002 1 0.294 0.741 0.535
2 0.7 40.9 38.6 2.3 72.3 71.7 0.6
3 0.6 41.9 39 2.9 72 72.3 .0.3
mean .0.1 40.4 38.7 1. 7
so 0 .4 41.07 38.77 2.3
73 7 1.1 1.9
72.43 71.7 0 .733
0.903 2.0003 1
2 3
0.356 0.49
1.2 45.7 41.5 4.2 82.7 85 1.4 46 40.3 5. 7 83.3 85
·2.3 ·1.7
mean .0.1 45.3 41 4.3 82.4 86.1 ·3.7
so 0.833 45.67 40.93 4.733 82.8 85.37 ·2.57
2.0004 1 0.665
2 ·1.3
3 .0.3
mean 0 .6
0.685 0.838
41.3 41.6 .0.3 80 80.4 .0.4
41 41.8 .0.8 80.4 8 1 .0.6
41.3 41.2 0.1 79.9 80.2 .0.3
so .0.33 41.2 41.53 .0.33 80 .1 80 .53 .0.43
2.0005 1 0.776 0.368 0.125
2 2.3 39.8 39 0.8 82.1 79.7 2.4
3 1.1 39.3 41.3 ·2 82.8 80.3 2.5
mean 3.5 40.3 40.9 .0.6 82.3 80.3 2
so 2.3 39.8 40.4 .0.6 82.4 80.1 2.3
2.0006 1
2
0 .98
.0.2 38
1.143 0 .216
38.5 -o.s 69.7 69.6 0.1
3 0.1
mean ..0.5
38.4 38.4 0
38.5 38.7 .0.2
69.3 69.4 .0.1
69.8 69.5 0.3
so .0.2 38.3 38.53 .0.23 69.6 69.5 0.1
2.0007 1 0.245 0.205 0.163
2 0.1 41.8 41.3 0.5 80.5 80.4 0.1
3 0.7 41.9 41.1 0.8 80.3 80 0.3
mean .0.5 42 41.3 0 .7 80 .1 80.4 .0.3
so 0.1 41.9 41.23 0 .667 80.3 80.27 0 .033
2.0008 1
2
3
0.49 0.125 0.249
1.3 43.7 42.3 1.4 71.2 72.9 ·1. 7
1.3 44 42.5 1.5 7 1.5 73 ·1.5
mean 1.4 44.1 42.2 1.9 7 1.6 72.5 .0.9
so 1.333 43.93 42.33 1.6 71.43 72.8 ·1.37
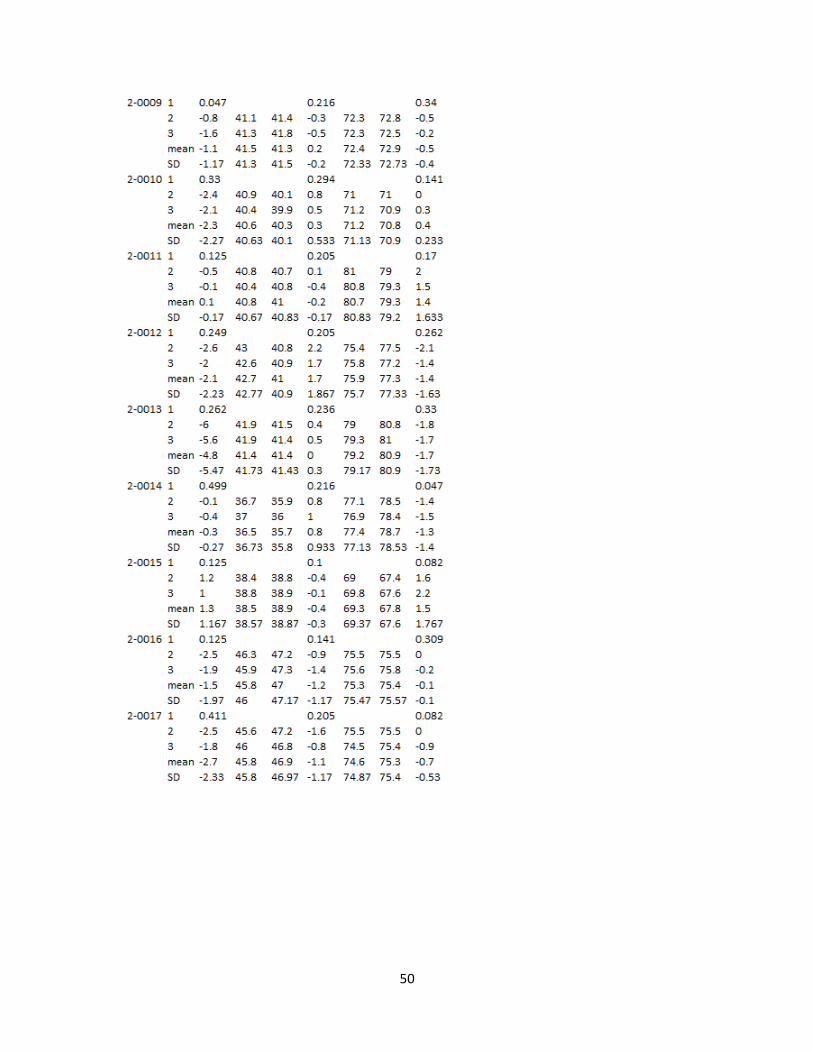
50
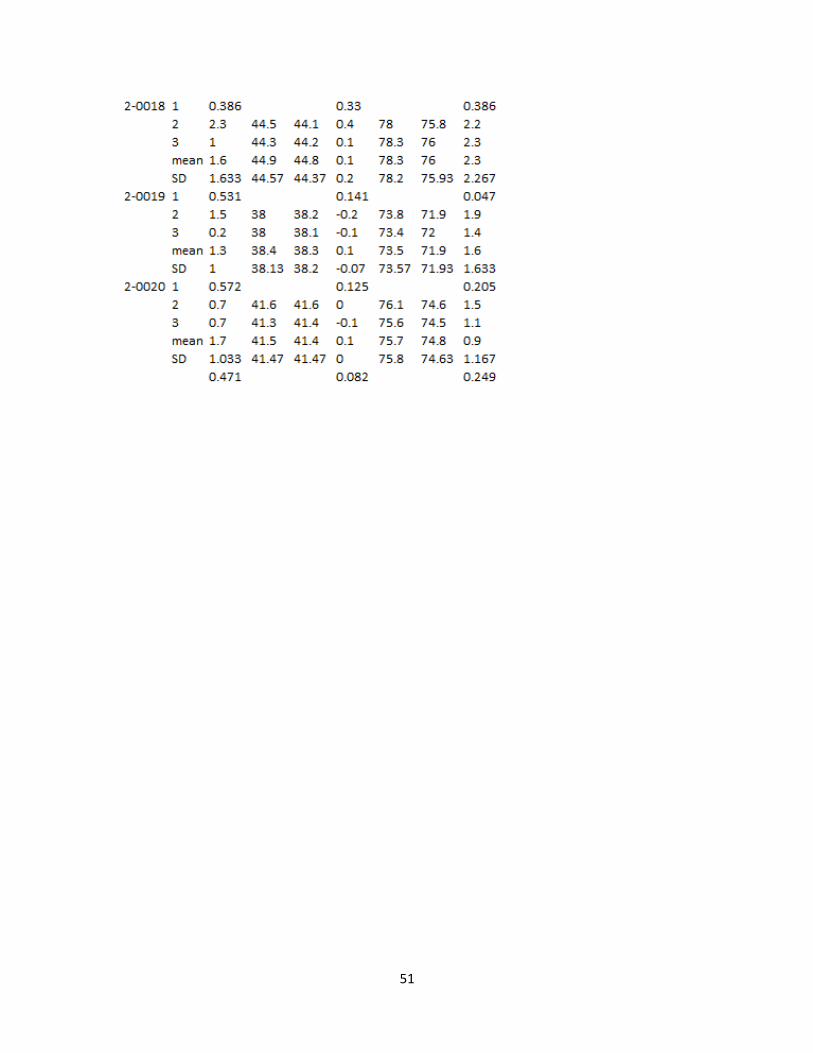
51
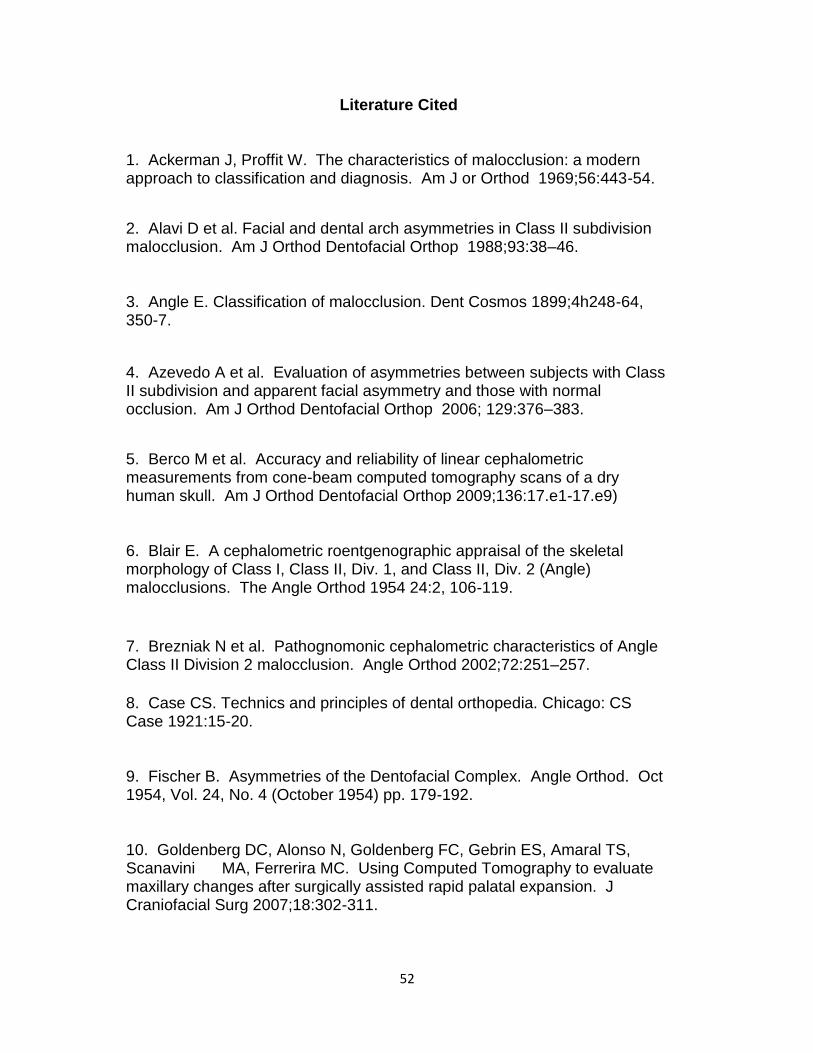
52
Literature Cited 1. Ackerman J, Proffit W. The characteristics of malocclusion: a modern approach to classification and diagnosis. Am J or Orthod 1969;56:443-54.
2. Alavi D et al. Facial and dental arch asymmetries in Class II subdivision malocclusion. Am J Orthod Dentofacial Orthop 1988;93:38–46. 3. Angle E. Classification of malocclusion. Dent Cosmos 1899;4h248-64, 350-7.
4. Azevedo A et al. Evaluation of asymmetries between subjects with Class II subdivision and apparent facial asymmetry and those with normal occlusion. Am J Orthod Dentofacial Orthop 2006; 129:376–383.
5. Berco M et al. Accuracy and reliability of linear cephalometric measurements from cone-beam computed tomography scans of a dry human skull. Am J Orthod Dentofacial Orthop 2009;136:17.e1-17.e9) 6. Blair E. A cephalometric roentgenographic appraisal of the skeletal morphology of Class I, Class II, Div. 1, and Class II, Div. 2 (Angle) malocclusions. The Angle Orthod 1954 24:2, 106-119.
7. Brezniak N et al. Pathognomonic cephalometric characteristics of Angle Class II Division 2 malocclusion. Angle Orthod 2002;72:251–257.
8. Case CS. Technics and principles of dental orthopedia. Chicago: CS Case 1921:15-20. 9. Fischer B. Asymmetries of the Dentofacial Complex. Angle Orthod. Oct 1954, Vol. 24, No. 4 (October 1954) pp. 179-192. 10. Goldenberg DC, Alonso N, Goldenberg FC, Gebrin ES, Amaral TS, Scanavini MA, Ferrerira MC. Using Computed Tomography to evaluate maxillary changes after surgically assisted rapid palatal expansion. J Craniofacial Surg 2007;18:302-311.
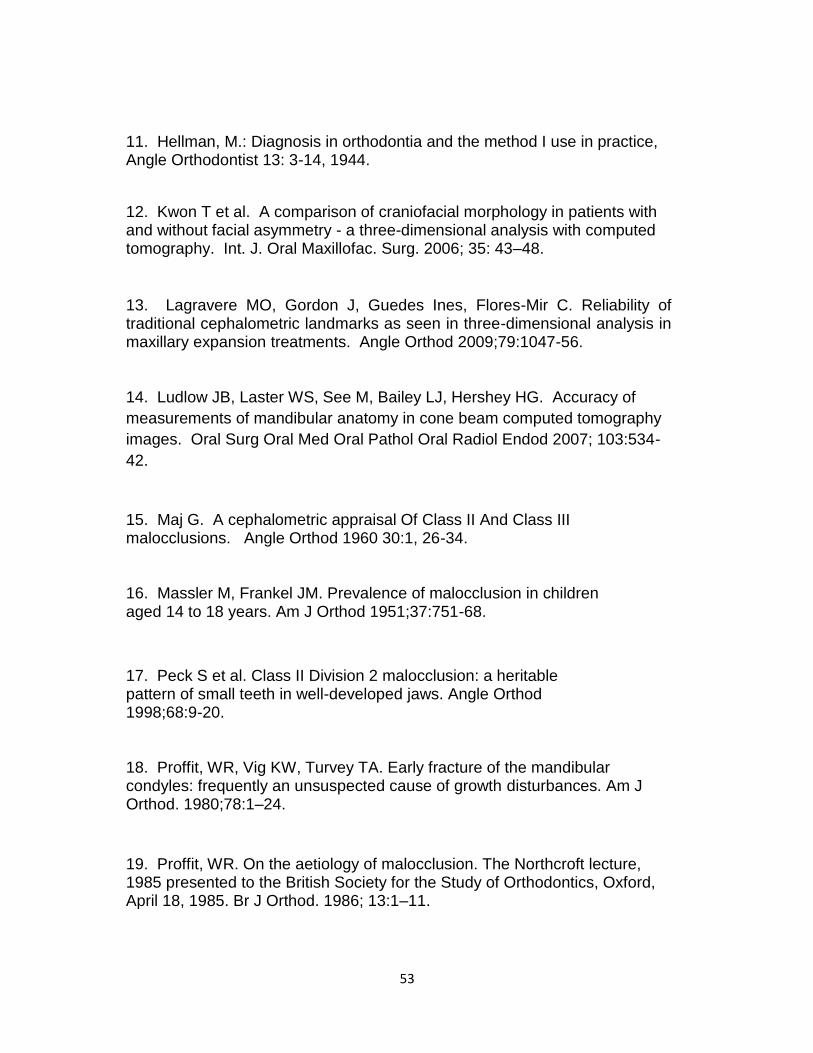
53
11. Hellman, M.: Diagnosis in orthodontia and the method I use in practice, Angle Orthodontist 13: 3-14, 1944.
12. Kwon T et al. A comparison of craniofacial morphology in patients with and without facial asymmetry - a three-dimensional analysis with computed tomography. Int. J. Oral Maxillofac. Surg. 2006; 35: 43–48.
13. Lagravere MO, Gordon J, Guedes Ines, Flores-Mir C. Reliability of traditional cephalometric landmarks as seen in three-dimensional analysis in maxillary expansion treatments. Angle Orthod 2009;79:1047-56. 14. Ludlow JB, Laster WS, See M, Bailey LJ, Hershey HG. Accuracy of
measurements of mandibular anatomy in cone beam computed tomography
images. Oral Surg Oral Med Oral Pathol Oral Radiol Endod 2007; 103:534-
42.
15. Maj G. A cephalometric appraisal Of Class II And Class III malocclusions. Angle Orthod 1960 30:1, 26-34. 16. Massler M, Frankel JM. Prevalence of malocclusion in children aged 14 to 18 years. Am J Orthod 1951;37:751-68.
17. Peck S et al. Class II Division 2 malocclusion: a heritable pattern of small teeth in well-developed jaws. Angle Orthod 1998;68:9-20. 18. Proffit, WR, Vig KW, Turvey TA. Early fracture of the mandibular condyles: frequently an unsuspected cause of growth disturbances. Am J Orthod. 1980;78:1–24.
19. Proffit, WR. On the aetiology of malocclusion. The Northcroft lecture, 1985 presented to the British Society for the Study of Orthodontics, Oxford, April 18, 1985. Br J Orthod. 1986; 13:1–11.
54
20. Renfroe E. A study of the facial patterns associated with class I, class II, div. 1, and class II, div. 2 malocclusion. Angle Orthod 18: 12-15, 1948. 21. Ricketts RM: A study of change in temporomandibular relations associated with the treatment of Class II malocclusion. Am J Orthod 38:918-933, 1952 22. Robertson NRW, Hilton R. Features of upper central incisors in Class II, Division 2. Angle Orthod. 1965;35:51–53
23. Rose JM, Sadowsky C, Begole EA, Moles R. Mandibular skeletal and dental asymmetry in Class II subdivision malocclusions. Am J Orthod Dentofacial Orthop. 1994;105: 489–495. 24. Sanders, DA, Rigali PH, Neace WP, Uribe F, Nanda R. Skeletal and dental asymmetries in Class II subdivision malocclusions using cone-beam computed tomography. Am J Orthod Dentofacial Orthop. 2010;138:542e1–542e20.
25. Sassouni, V., Forrest, E.J.: Orthodontics in Dental Practice. St. Louis: The C.V. Mosby Col, 1971.
26. Sato, H, Kawamura A, Yamaguchi M, Kasai K. Relationship between masticatory function and internal structure of the mandible based on computed tomography findings. Am J Orthod Dentofacial Orthop. 2005;128:766–773. 27. Siegel, M. A matter of Class: interpreting subdivision in a malocclusion. Am J Orthod Dentofacial Orthop. 2002; 122:582-6. 28. Strang R. Class II, Division 2 Malocclusion. Angle Orthod 1958 28:4, 210-214. 29. US Department of Health, Education, and Welfare. An assessment of the occlusion of the teeth of youths 12-17 years – National Center for Health Statistics, DHEW no (HRA) 77-1644, 1977: Rockville, Maryland: United States 30. Wallis SF. Integration of certain variants of the facial skeleton in Class II division 2 malocclusion. Angle Orthod. 1963;33:60–67.

55