Embed Size (px)
Citation preview
Studying the energy consumption of data transfers in
Clouds: the Ecofen approach
Bogdan Florin Cornea, Anne-Cecile Orgerie, Laurent Lefevre
To cite this version:
Bogdan Florin Cornea, Anne-Cecile Orgerie, Laurent Lefevre. Studying the energy consump-tion of data transfers in Clouds: the Ecofen approach. CloudNet: IEEE International Con-ference on Cloud Networking, Oct 2014, Luxembourg, Luxembourg. 2014, <http://www.ieee-cloudnet.org>. <hal-01088944>
HAL Id: hal-01088944
https://hal.inria.fr/hal-01088944
Submitted on 29 Nov 2014
HAL is a multi-disciplinary open accessarchive for the deposit and dissemination of sci-entific research documents, whether they are pub-lished or not. The documents may come fromteaching and research institutions in France orabroad, or from public or private research centers.
L’archive ouverte pluridisciplinaire HAL, estdestinee au depot et a la diffusion de documentsscientifiques de niveau recherche, publies ou non,emanant des etablissements d’enseignement et derecherche francais ou etrangers, des laboratoirespublics ou prives.
brought to you by COREView metadata, citation and similar papers at core.ac.uk
provided by HAL-ENS-LYON
Studying the energy consumption of data transfers inClouds: the Ecofen approach
Bogdan Florin Cornea∗, Anne-Cecile Orgerie†, Laurent Lefevre‡∗INRIA, IRISA, Rennes, France†CNRS, IRISA, Rennes, France
‡Inria, Avalon, LIP Lab., Ecole Normale Superieure de Lyon, University of Lyon, FranceE-mails: {bogdan-florin.cornea ; anne-cecile.orgerie ; laurent.lefevre}@inria.fr
Abstract—Energy consumption is one of the main limitingfactors for designing large scale Clouds. Evaluating the energyconsumption of Clouds networking architectures and providingmulti-level views required by providers and users, is a challengingissue. In this paper, we show how to evaluate and understandnetwork choices (protocols, topologies) in terms of contributionsto the energy consumption of the global Cloud infrastructures.By applying the ECOFEN model (Energy Consumption mOdelFor End-to-end Networks) and the corresponding simulationframework, we profile and analyze the energy consumption ofdata transfers in Clouds.
Keywords—energy consumption, Cloud data transfers, ethernetnetworks, simulation
I. INTRODUCTION
Cloud computing is increasingly becoming an essentialcomponent for Internet service provision, yet at the sametime its energy consumption has become a key environmentaland economic concern. While Cloud computing is relyingon numerous servers and storage facilities, it also intensivelyuses telecommunication networks. The ever-growing appetiteof new applications for network resources leads to an unprece-dented electricity bill for these resources [1]. Moreover, forthese bandwidth-hungry applications, networks can become asignificant bottleneck [2].
In this context, Cloud computing actors need tools inorder to design, to evaluate, and to improve their networkingarchitectures. On one side, Cloud providers want to know theoverall energy consumption of their networking infrastructuresover time, depending on the incoming traffic. On the otherend, Cloud users, like Platform-as-a-Service or Software-as-a-Service providers for instance, are interested in having a moredetailed view of the energy consumption on a given equipment,or for a traffic pattern coming from a known application.
Evaluating the energy consumption of Cloud’s networkingarchitectures and providing these multi-level views required byproviders and users, is a challenging issue. In particular, havingprecise evaluations to be able to compare different topologiesor different network protocols requires practically huge mon-itoring infrastructures and carefully controlled environments.To overcome these technical issues, one can rely on simulationtools. While networking research community has an extendedexperience on network simulators, only few of them considerthe energy dimension and the particular use-case of Cloudcomputing infrastructures. Moreover, the simulators includingthis energy dimension only consider it for wireless equipment,
which is currently not suitable in the context of Cloud datacenters.
In this paper, we propose to study the energy consumptionof data transfers in Clouds from a simulation point of view. Toachieve this goal, we use ECOFEN, an Energy ConsumptionmOdel For End-to-end Networks proposed in our previouspaper [3]. This model has been implemented in NS-3 [4],a discrete-event simulator for Internet systems, targeted pri-marily for research and educational use. This free software iswidely used in the community, like its predecessor NS-2 [5]which was used in our previous work [3].
The paper is organized as follows: Section II presents therelated works. Section III introduces the ECOFEN model andsimulator. Section IV provides preliminary results in orderto evaluate the energy consumption of Cloud networks, andSection V shows results exploiting green levers in order toreduce the energy consumption of networking infrastructures.Section VI concludes this work and presents future work.
II. RELATED WORK
Energy efficiency is currently at the focus of attentionof many research works in Cloud computing. Yet, telecom-munication networks, which are an integral part of thesesCloud infrastructures, are often not considered because of theircomplexity, their heterogeneity and their large-scale properties.However, it has been shown that networking infrastructuresplay a non-negligible role in the electricity’s consumption ofdata centers [1]. While the number of energy-aware compo-nents of large-scale architectures is increasing, the methodsfor evaluating the energy consumption are lagging behind. Inmany cases, direct measurements of the consumed energy arenot possible due to lack of monitoring equipment, large-scaleissues and the involvement of different providers.
In this context, simulation appears as an appealing solutionallowing large-scale and fine-grained experiments. However,the community is lacking of such energy-aware simulators forwired networks. ECOFEN, an Energy Consumption mOdel ForEnd-to-end Networks proposed in 2011 [3], has been imple-mented within the well-known network simulator NS-3 [4].The ECOFEN simulator provides energy-aware simulationsbased on packet-based and per-Byte energy consumption mod-els based on experimental results from the literature [6], [7],[8], [9], [10].
Contrary to other work like the GreenCloud simulatorbased on NS-2 [11], this simulator aims also at providing mod-
els for energy-efficient network devices, i.e. able to dynami-cally adapt their link rate depending on the actual traffic [12],to switch on and off ports and entire devices [13], and to putthem to sleep modes like in the 802.3az standard [14].
III. ECOFEN, AN ENERGY-MODULE FOR THE NS-3SIMULATOR
Proposed by Orgerie et al. [3], ECOFEN allows studyingthrough simulation the energy consumption of wired networkequipment. Initially, ECOFEN was developed as a module forNS-2 [5], and was later on re-written for NS-3 [4], which ismainly intended for scientists and academia. NS-3 is availableby default in certain GNU/Linux distributions such as Fedora,thus allowing a simplified access to its functions, and to theenergy module implicitly.
A. Characteristics of ECOFEN
The ECOFEN module brings to the NS-3 users communitythe possibility to analyze the energy profile of the network overtime. Users can observe the global consumption of networks ina Cloud or can isolate and analyze a single network equipment.
With a precision of the order of milliwatts for the powerand milliseconds for the time, ECOFEN provides severalenergy models and profiles for network interface cards (NIC),switches, routers, and interfaces (ports): basic, linear, andcomplete, all inspired by experiments from the literature.For calculating the NIC consumption, the basic energymodel is used, this allowing users to set the power (in watts)in On and in Off states. For calculating the interface con-sumption, any of the three models can be used. The linearmodel allows replacing the On setting with two states — Idleand ByteEnergy — for calculating the energy per processedbyte. For even more precision, the complete model allowsreplacing the ByteEnergy with four states indicating theenergy consumed (i) per received byte, (ii) per sent byte, (iii)per received packet, and (iv) per sent packet.
The basic model provides coarser-grain energy modeling,compared to the complete one, whereas the linear modelis in between. A different energy model may be used for eachnetwork equipment — NIC, switch, router, interface — thechoice of model depending only on the expected granularity ofthe result. In addition, green functions (levers) can be appliedto existing energy models. For instance, models are providedfor calculating energy consumption during state transitions,i.e., from On (or Idle) to Off and vice versa or whenswitching between available link rates. These models are usedwhen simulating power saving schemes, but they can also beused to simulate power failures.
B. Limitations
The energy consumption of complex infrastructures de-pends of several factors. Despite the complexity of theECOFEN module, most limitations are due to the NS-3 imple-mentation itself. For instance, simulation durations are drivenby the packet-based nature of the simulator. Consequently, thetime to simulate large scale systems with thousands of nodes,or millions of packets can be large. For some experiments (seeSection IV-C), more than 5 hours of simulation are requiredto capture one minute of simulated network activity for a
large topology (over 1000 nodes in 9 data-centers) as partof combined data transfers of 112GB. ECOFEN adds energydetails on top of the existing network models. ECOFEN isthus dependent on the NS-3 models for network protocols.The availability of measured power consumptions for networkdevices is required for configuring the simulator, but somevalues can be found in the literature or on manufacturer’sspecifications.
IV. EVALUATING THE ENERGY CONSUMPTION OF CLOUDNETWORKS THROUGH SIMULATION
In Cloud systems, the demand for computing and network-ing resources varies in time. The computing resources are outof the scope of this paper and, therefore, we focus on profilingthe energy consumption of network resources under variousscenarios.
The experimental work described in this paper uses energycharacteristics found in related work. These values are usedto configure the NS-3 simulator. The magnitude of the energyused during data transfers, compared to idle operating mode, isnot the focus of our experiments, but we present use cases andconsumption analyses available through the ECOFEN/NS-3energy module. Users are, however, given the freedom to inputthe power consumption for the devices of their choice, basedon measurements taken or found in the literature.
A. Point-to-point VM migration
For a first scenario, the focus is on a type of data transferwhich occurs frequently in Cloud systems: migrating VirtualMachines (VM). For this purpose, we have measured the size,duration and physical link conditions during a real migration,and compared the acquired information with results obtain bymeans of simulation (see Table I). A summary of consumptionvalues used for configuring the simulator during this scenariocan be found in Table II. Migrating VMs was done on twocomputing nodes from the Luxembourg site of the Grid’5000platform [15] (2 CPUs [email protected], 6 cores/CPU, 31GBRAM, 232GB disk). The measured size on disk for the VM
TABLE I. COMPARISON OF MEASURED VM MIGRATION DURATIONAND SIMULATED TIMES, AT DIFFERENT BAND WIDTHS.
Disk Bandwidth Measured Simulated time [s] Error2
size [Mbps] time1 Ecofen module Ecofen module [%][GB] [s] disabled enabled
1.5
54 221.7 249.8 249.8 12.680 161 168.6 168.6 4.7100 118 134.9 134.9 14.3112 123 120.4 120.4 2.1
1 Real measurements taken on Petitprince cluster of Grid’5000 site inLuxembourg. 2Error between measured and simulated time. *Equipment used:NetFPGA 1G rev. 2 (for the NICend host), Nortel Ethernet Routing Switch 5510-24T(for the switch), unknown model of edge LAN switch B at 100Mbps and at 1Gbpsport capacity (for idle port), 1 Gigabit Ethernet (for ByteEnergy).
is 1.5GB, with a virtual size of 10GB. The migration processrelies on libvirt with qemu and kvm. Although libvirtimposes 32MB/s maximum bandwidth, we overcame this byconfiguring Debian backports, and upgrading libvirtto ver. 1.2.1. However, our experiments revealed that thecommand for setting the maximum migration bandwidth onlyproved to be reliable between 54 and 112Mbps. For thisreason, we chose to take VM migration measurements, in turn,at 54, 80, 100, and 112 Mbps migration bandwidths. For
configuring the simulator, interfaces were set to the smallestlink rate that supports, in turn, each of these bandwidths.
TABLE II. VALUES USED IN SIMULATION; VM MIGRATION.
Device State Value Unit Energy Ref.1 Bw.2 Linkmodel rate
[Mbps]
NICend hostOn;Idle 6.936 W basic [6] - -
Off 0 W basic -
switch On;Idle 66 W basic - -Off 0 W basic -
port3
Idle 0.11 W linear [7]4 54
100
ByteEnergy 3.423 nJ linear [6]Idle 0.11 W linear [7]4 80
ByteEnergy 3.423 nJ linear [6]Idle 0.11 W linear [7]4 100
ByteEnergy 3.423 nJ linear [6]Idle 0.75 W linear [7]4 112 1000
ByteEnergy 3.423 nJ linear [6]1References. 2Set or negotiated bandwidth. 3A port on any of the followingequipments: NIC, switch, router. 4 Extracted from [7].
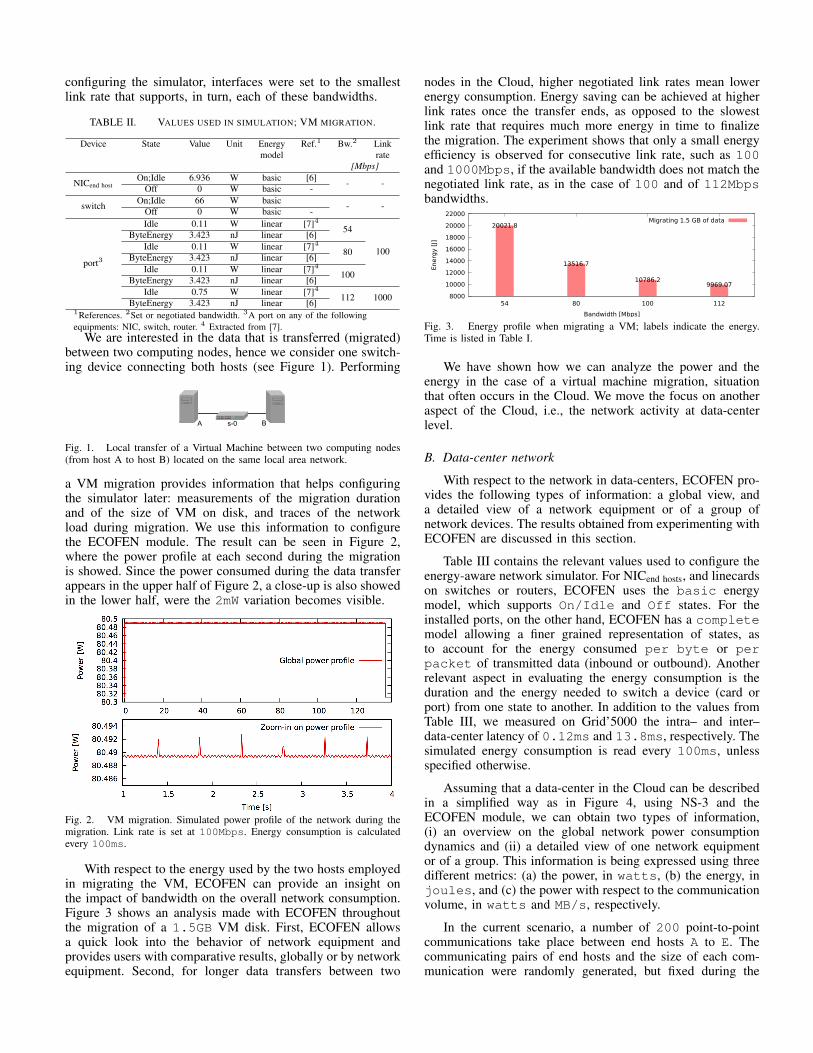
We are interested in the data that is transferred (migrated)between two computing nodes, hence we consider one switch-ing device connecting both hosts (see Figure 1). Performing
A s-0 B
Fig. 1. Local transfer of a Virtual Machine between two computing nodes(from host A to host B) located on the same local area network.
a VM migration provides information that helps configuringthe simulator later: measurements of the migration durationand of the size of VM on disk, and traces of the networkload during migration. We use this information to configurethe ECOFEN module. The result can be seen in Figure 2,where the power profile at each second during the migrationis showed. Since the power consumed during the data transferappears in the upper half of Figure 2, a close-up is also showedin the lower half, were the 2mW variation becomes visible.
Fig. 2. VM migration. Simulated power profile of the network during themigration. Link rate is set at 100Mbps. Energy consumption is calculatedevery 100ms.
With respect to the energy used by the two hosts employedin migrating the VM, ECOFEN can provide an insight onthe impact of bandwidth on the overall network consumption.Figure 3 shows an analysis made with ECOFEN throughoutthe migration of a 1.5GB VM disk. First, ECOFEN allowsa quick look into the behavior of network equipment andprovides users with comparative results, globally or by networkequipment. Second, for longer data transfers between two
nodes in the Cloud, higher negotiated link rates mean lowerenergy consumption. Energy saving can be achieved at higherlink rates once the transfer ends, as opposed to the slowestlink rate that requires much more energy in time to finalizethe migration. The experiment shows that only a small energyefficiency is observed for consecutive link rate, such as 100and 1000Mbps, if the available bandwidth does not match thenegotiated link rate, as in the case of 100 and of 112Mbpsbandwidths.
8000
10000
12000
14000
16000
18000
20000
22000
54 80 100 112
Energ
y [
J]
Bandwidth [Mbps]
Migrating 1.5 GB of data20021.8
13516.7
10786.29969.07
Fig. 3. Energy profile when migrating a VM; labels indicate the energy.Time is listed in Table I.
We have shown how we can analyze the power and theenergy in the case of a virtual machine migration, situationthat often occurs in the Cloud. We move the focus on anotheraspect of the Cloud, i.e., the network activity at data-centerlevel.
B. Data-center network
With respect to the network in data-centers, ECOFEN pro-vides the following types of information: a global view, anda detailed view of a network equipment or of a group ofnetwork devices. The results obtained from experimenting withECOFEN are discussed in this section.
Table III contains the relevant values used to configure theenergy-aware network simulator. For NICend hosts, and linecardson switches or routers, ECOFEN uses the basic energymodel, which supports On/Idle and Off states. For theinstalled ports, on the other hand, ECOFEN has a completemodel allowing a finer grained representation of states, asto account for the energy consumed per byte or perpacket of transmitted data (inbound or outbound). Anotherrelevant aspect in evaluating the energy consumption is theduration and the energy needed to switch a device (card orport) from one state to another. In addition to the values fromTable III, we measured on Grid’5000 the intra– and inter–data-center latency of 0.12ms and 13.8ms, respectively. Thesimulated energy consumption is read every 100ms, unlessspecified otherwise.
Assuming that a data-center in the Cloud can be describedin a simplified way as in Figure 4, using NS-3 and theECOFEN module, we can obtain two types of information,(i) an overview on the global network power consumptiondynamics and (ii) a detailed view of one network equipmentor of a group. This information is being expressed using threedifferent metrics: (a) the power, in watts, (b) the energy, injoules, and (c) the power with respect to the communicationvolume, in watts and MB/s, respectively.
In the current scenario, a number of 200 point-to-pointcommunications take place between end hosts A to E. Thecommunicating pairs of end hosts and the size of each com-munication were randomly generated, but fixed during the
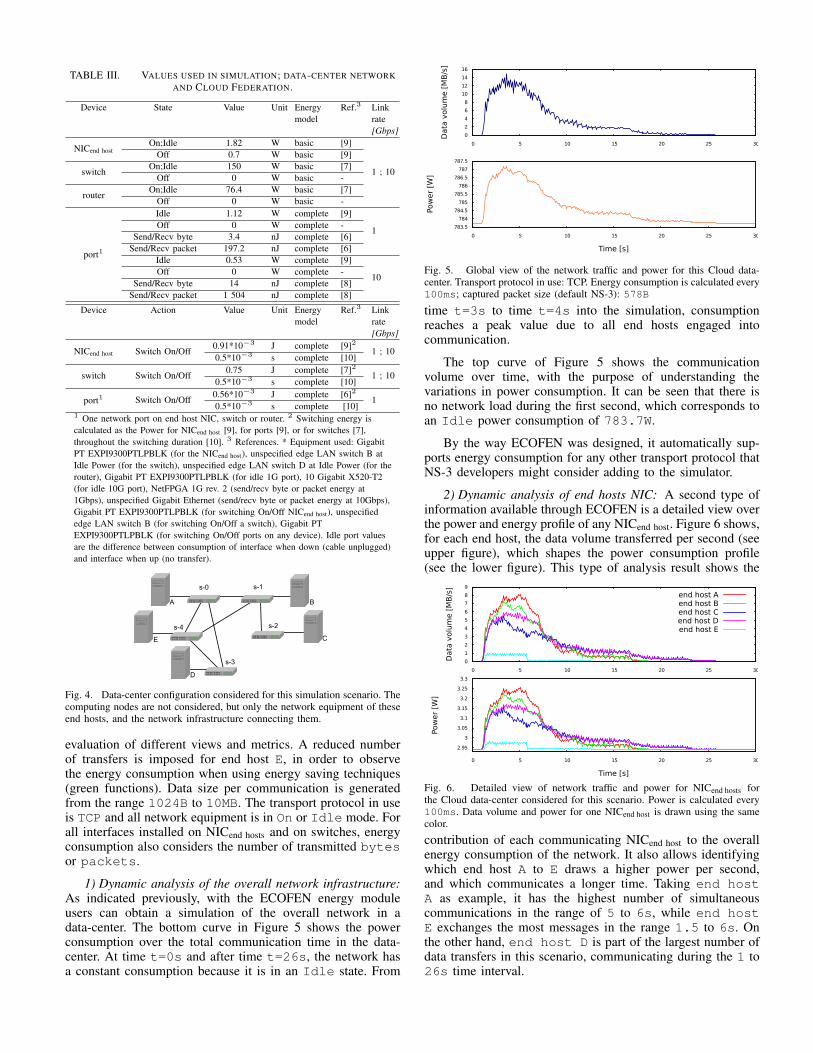
TABLE III. VALUES USED IN SIMULATION; DATA-CENTER NETWORKAND CLOUD FEDERATION.
Device State Value Unit Energy Ref.3 Linkmodel rate
[Gbps]
NICend hostOn;Idle 1.82 W basic [9]
1 ; 10
Off 0.7 W basic [9]
switchOn;Idle 150 W basic [7]
Off 0 W basic -
routerOn;Idle 76.4 W basic [7]
Off 0 W basic -
port1
Idle 1.12 W complete [9]
1Off 0 W complete -
Send/Recv byte 3.4 nJ complete [6]Send/Recv packet 197.2 nJ complete [6]
Idle 0.53 W complete [9]
10Off 0 W complete -
Send/Recv byte 14 nJ complete [8]Send/Recv packet 1 504 nJ complete [8]
Device Action Value Unit Energy Ref.3 Linkmodel rate
[Gbps]
NICend host Switch On/Off0.91*10−3 J complete [9]2
1 ; 100.5*10−3 s complete [10]
switch Switch On/Off0.75 J complete [7]2
1 ; 100.5*10−3 s complete [10]
port1 Switch On/Off0.56*10−3 J complete [6]2
10.5*10−3 s complete [10]
1 One network port on end host NIC, switch or router. 2 Switching energy iscalculated as the Power for NICend host [9], for ports [9], or for switches [7],throughout the switching duration [10]. 3 References. * Equipment used: GigabitPT EXPI9300PTLPBLK (for the NICend host), unspecified edge LAN switch B atIdle Power (for the switch), unspecified edge LAN switch D at Idle Power (for therouter), Gigabit PT EXPI9300PTLPBLK (for idle 1G port), 10 Gigabit X520-T2(for idle 10G port), NetFPGA 1G rev. 2 (send/recv byte or packet energy at1Gbps), unspecified Gigabit Ethernet (send/recv byte or packet energy at 10Gbps),Gigabit PT EXPI9300PTLPBLK (for switching On/Off NICend host), unspecifiededge LAN switch B (for switching On/Off a switch), Gigabit PTEXPI9300PTLPBLK (for switching On/Off ports on any device). Idle port valuesare the difference between consumption of interface when down (cable unplugged)and interface when up (no transfer).
B
D
s-0 s-1
s-2
s-3
s-4
A
E C
Fig. 4. Data-center configuration considered for this simulation scenario. Thecomputing nodes are not considered, but only the network equipment of theseend hosts, and the network infrastructure connecting them.
evaluation of different views and metrics. A reduced numberof transfers is imposed for end host E, in order to observethe energy consumption when using energy saving techniques(green functions). Data size per communication is generatedfrom the range 1024B to 10MB. The transport protocol in useis TCP and all network equipment is in On or Idle mode. Forall interfaces installed on NICend hosts and on switches, energyconsumption also considers the number of transmitted bytesor packets.
1) Dynamic analysis of the overall network infrastructure:As indicated previously, with the ECOFEN energy moduleusers can obtain a simulation of the overall network in adata-center. The bottom curve in Figure 5 shows the powerconsumption over the total communication time in the data-center. At time t=0s and after time t=26s, the network hasa constant consumption because it is in an Idle state. From
0
2
4
6
8
10
12
14
16
0 5 10 15 20 25 30
Data
volu
me [
MB
/s]
783.5
784
784.5
785
785.5
786
786.5
787
787.5
0 5 10 15 20 25 30
Pow
er
[W]
Time [s]
Fig. 5. Global view of the network traffic and power for this Cloud data-center. Transport protocol in use: TCP. Energy consumption is calculated every100ms; captured packet size (default NS-3): 578B
time t=3s to time t=4s into the simulation, consumptionreaches a peak value due to all end hosts engaged intocommunication.
The top curve of Figure 5 shows the communicationvolume over time, with the purpose of understanding thevariations in power consumption. It can be seen that there isno network load during the first second, which corresponds toan Idle power consumption of 783.7W.
By the way ECOFEN was designed, it automatically sup-ports energy consumption for any other transport protocol thatNS-3 developers might consider adding to the simulator.
2) Dynamic analysis of end hosts NIC: A second type ofinformation available through ECOFEN is a detailed view overthe power and energy profile of any NICend host. Figure 6 shows,for each end host, the data volume transferred per second (seeupper figure), which shapes the power consumption profile(see the lower figure). This type of analysis result shows the
0
1
2
3
4
5
6
7
8
9
0 5 10 15 20 25 30
Data
volu
me [
MB
/s]
end host Aend host Bend host Cend host Dend host E
2.95
3
3.05
3.1
3.15
3.2
3.25
3.3
0 5 10 15 20 25 30
Pow
er
[W]
Time [s]
Fig. 6. Detailed view of network traffic and power for NICend hosts forthe Cloud data-center considered for this scenario. Power is calculated every100ms. Data volume and power for one NICend host is drawn using the samecolor.
contribution of each communicating NICend host to the overallenergy consumption of the network. It also allows identifyingwhich end host A to E draws a higher power per second,and which communicates a longer time. Taking end hostA as example, it has the highest number of simultaneouscommunications in the range of 5 to 6s, while end hostE exchanges the most messages in the range 1.5 to 6s. Onthe other hand, end host D is part of the largest number ofdata transfers in this scenario, communicating during the 1 to26s time interval.
C. Cloud Federation
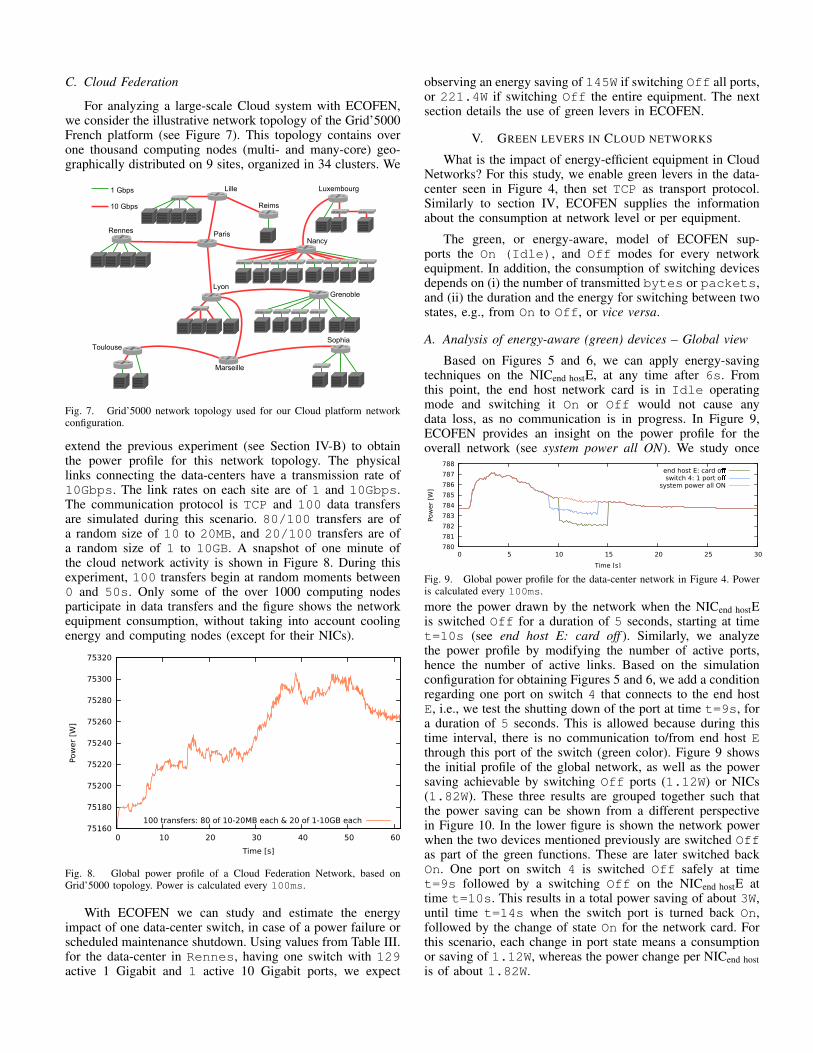
For analyzing a large-scale Cloud system with ECOFEN,we consider the illustrative network topology of the Grid’5000French platform (see Figure 7). This topology contains overone thousand computing nodes (multi- and many-core) geo-graphically distributed on 9 sites, organized in 34 clusters. We
Grenoble
Lille Luxembourg
Lyon
NancyParisRennes
Toulouse
Marseille
Sophia
Reims
1 Gbps
10 Gbps
Fig. 7. Grid’5000 network topology used for our Cloud platform networkconfiguration.
extend the previous experiment (see Section IV-B) to obtainthe power profile for this network topology. The physicallinks connecting the data-centers have a transmission rate of10Gbps. The link rates on each site are of 1 and 10Gbps.The communication protocol is TCP and 100 data transfersare simulated during this scenario. 80/100 transfers are ofa random size of 10 to 20MB, and 20/100 transfers are ofa random size of 1 to 10GB. A snapshot of one minute ofthe cloud network activity is shown in Figure 8. During thisexperiment, 100 transfers begin at random moments between0 and 50s. Only some of the over 1000 computing nodesparticipate in data transfers and the figure shows the networkequipment consumption, without taking into account coolingenergy and computing nodes (except for their NICs).
75160
75180
75200
75220
75240
75260
75280
75300
75320
0 10 20 30 40 50 60
Pow
er
[W]
Time [s]
100 transfers: 80 of 10-20MB each & 20 of 1-10GB each
Fig. 8. Global power profile of a Cloud Federation Network, based onGrid’5000 topology. Power is calculated every 100ms.
With ECOFEN we can study and estimate the energyimpact of one data-center switch, in case of a power failure orscheduled maintenance shutdown. Using values from Table III.for the data-center in Rennes, having one switch with 129active 1 Gigabit and 1 active 10 Gigabit ports, we expect
observing an energy saving of 145W if switching Off all ports,or 221.4W if switching Off the entire equipment. The nextsection details the use of green levers in ECOFEN.
V. GREEN LEVERS IN CLOUD NETWORKS
What is the impact of energy-efficient equipment in CloudNetworks? For this study, we enable green levers in the data-center seen in Figure 4, then set TCP as transport protocol.Similarly to section IV, ECOFEN supplies the informationabout the consumption at network level or per equipment.
The green, or energy-aware, model of ECOFEN sup-ports the On (Idle), and Off modes for every networkequipment. In addition, the consumption of switching devicesdepends on (i) the number of transmitted bytes or packets,and (ii) the duration and the energy for switching between twostates, e.g., from On to Off, or vice versa.
A. Analysis of energy-aware (green) devices – Global view
Based on Figures 5 and 6, we can apply energy-savingtechniques on the NICend hostE, at any time after 6s. Fromthis point, the end host network card is in Idle operatingmode and switching it On or Off would not cause anydata loss, as no communication is in progress. In Figure 9,ECOFEN provides an insight on the power profile for theoverall network (see system power all ON). We study once
780
781
782
783
784
785
786
787
788
0 5 10 15 20 25 30
Pow
er
[W]
Time [s]
end host E: card oswitch 4: 1 port o
system power all ON
Fig. 9. Global power profile for the data-center network in Figure 4. Poweris calculated every 100ms.
more the power drawn by the network when the NICend hostEis switched Off for a duration of 5 seconds, starting at timet=10s (see end host E: card off ). Similarly, we analyzethe power profile by modifying the number of active ports,hence the number of active links. Based on the simulationconfiguration for obtaining Figures 5 and 6, we add a conditionregarding one port on switch 4 that connects to the end hostE, i.e., we test the shutting down of the port at time t=9s, fora duration of 5 seconds. This is allowed because during thistime interval, there is no communication to/from end host Ethrough this port of the switch (green color). Figure 9 showsthe initial profile of the global network, as well as the powersaving achievable by switching Off ports (1.12W) or NICs(1.82W). These three results are grouped together such thatthe power saving can be shown from a different perspectivein Figure 10. In the lower figure is shown the network powerwhen the two devices mentioned previously are switched Offas part of the green functions. These are later switched backOn. One port on switch 4 is switched Off safely at timet=9s followed by a switching Off on the NICend hostE attime t=10s. This results in a total power saving of about 3W,until time t=14s when the switch port is turned back On,followed by the change of state On for the network card. Forthis scenario, each change in port state means a consumptionor saving of 1.12W, whereas the power change per NICend hostis of about 1.82W.
0
2
4
6
8
10
12
14
16
0 5 10 15 20 25 30
Data
volu
me [
MB
/s]
780
781
782
783
784
785
786
787
788
0 5 10 15 20 25 30
Pow
er
[W]
Time [s]
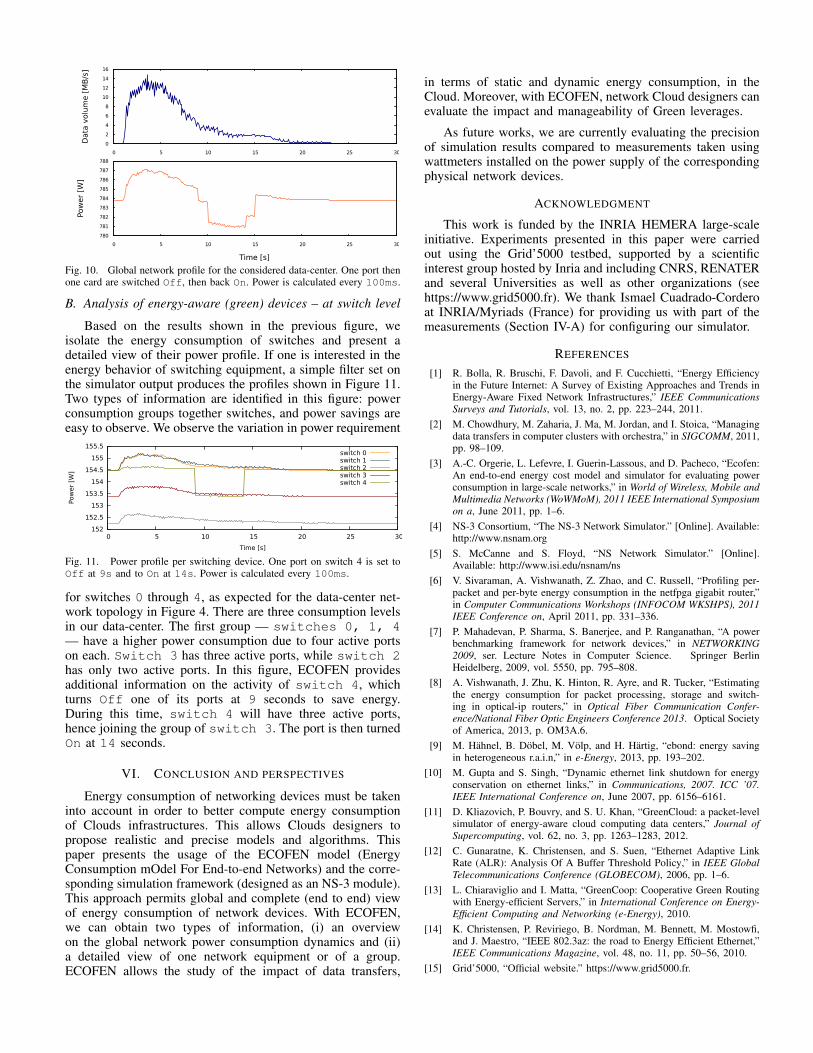
Fig. 10. Global network profile for the considered data-center. One port thenone card are switched Off, then back On. Power is calculated every 100ms.
B. Analysis of energy-aware (green) devices – at switch level
Based on the results shown in the previous figure, weisolate the energy consumption of switches and present adetailed view of their power profile. If one is interested in theenergy behavior of switching equipment, a simple filter set onthe simulator output produces the profiles shown in Figure 11.Two types of information are identified in this figure: powerconsumption groups together switches, and power savings areeasy to observe. We observe the variation in power requirement
152
152.5
153
153.5
154
154.5
155
155.5
0 5 10 15 20 25 30
Pow
er
[W]
Time [s]
switch 0switch 1switch 2switch 3switch 4
Fig. 11. Power profile per switching device. One port on switch 4 is set toOff at 9s and to On at 14s. Power is calculated every 100ms.
for switches 0 through 4, as expected for the data-center net-work topology in Figure 4. There are three consumption levelsin our data-center. The first group — switches 0, 1, 4— have a higher power consumption due to four active portson each. Switch 3 has three active ports, while switch 2has only two active ports. In this figure, ECOFEN providesadditional information on the activity of switch 4, whichturns Off one of its ports at 9 seconds to save energy.During this time, switch 4 will have three active ports,hence joining the group of switch 3. The port is then turnedOn at 14 seconds.
VI. CONCLUSION AND PERSPECTIVES
Energy consumption of networking devices must be takeninto account in order to better compute energy consumptionof Clouds infrastructures. This allows Clouds designers topropose realistic and precise models and algorithms. Thispaper presents the usage of the ECOFEN model (EnergyConsumption mOdel For End-to-end Networks) and the corre-sponding simulation framework (designed as an NS-3 module).This approach permits global and complete (end to end) viewof energy consumption of network devices. With ECOFEN,we can obtain two types of information, (i) an overviewon the global network power consumption dynamics and (ii)a detailed view of one network equipment or of a group.ECOFEN allows the study of the impact of data transfers,
in terms of static and dynamic energy consumption, in theCloud. Moreover, with ECOFEN, network Cloud designers canevaluate the impact and manageability of Green leverages.
As future works, we are currently evaluating the precisionof simulation results compared to measurements taken usingwattmeters installed on the power supply of the correspondingphysical network devices.
ACKNOWLEDGMENT
This work is funded by the INRIA HEMERA large-scaleinitiative. Experiments presented in this paper were carriedout using the Grid’5000 testbed, supported by a scientificinterest group hosted by Inria and including CNRS, RENATERand several Universities as well as other organizations (seehttps://www.grid5000.fr). We thank Ismael Cuadrado-Corderoat INRIA/Myriads (France) for providing us with part of themeasurements (Section IV-A) for configuring our simulator.
REFERENCES
[1] R. Bolla, R. Bruschi, F. Davoli, and F. Cucchietti, “Energy Efficiencyin the Future Internet: A Survey of Existing Approaches and Trends inEnergy-Aware Fixed Network Infrastructures,” IEEE CommunicationsSurveys and Tutorials, vol. 13, no. 2, pp. 223–244, 2011.
[2] M. Chowdhury, M. Zaharia, J. Ma, M. Jordan, and I. Stoica, “Managingdata transfers in computer clusters with orchestra,” in SIGCOMM, 2011,pp. 98–109.
[3] A.-C. Orgerie, L. Lefevre, I. Guerin-Lassous, and D. Pacheco, “Ecofen:An end-to-end energy cost model and simulator for evaluating powerconsumption in large-scale networks,” in World of Wireless, Mobile andMultimedia Networks (WoWMoM), 2011 IEEE International Symposiumon a, June 2011, pp. 1–6.
[4] NS-3 Consortium, “The NS-3 Network Simulator.” [Online]. Available:http://www.nsnam.org
[5] S. McCanne and S. Floyd, “NS Network Simulator.” [Online].Available: http://www.isi.edu/nsnam/ns
[6] V. Sivaraman, A. Vishwanath, Z. Zhao, and C. Russell, “Profiling per-packet and per-byte energy consumption in the netfpga gigabit router,”in Computer Communications Workshops (INFOCOM WKSHPS), 2011IEEE Conference on, April 2011, pp. 331–336.
[7] P. Mahadevan, P. Sharma, S. Banerjee, and P. Ranganathan, “A powerbenchmarking framework for network devices,” in NETWORKING2009, ser. Lecture Notes in Computer Science. Springer BerlinHeidelberg, 2009, vol. 5550, pp. 795–808.
[8] A. Vishwanath, J. Zhu, K. Hinton, R. Ayre, and R. Tucker, “Estimatingthe energy consumption for packet processing, storage and switch-ing in optical-ip routers,” in Optical Fiber Communication Confer-ence/National Fiber Optic Engineers Conference 2013. Optical Societyof America, 2013, p. OM3A.6.
[9] M. Hahnel, B. Dobel, M. Volp, and H. Hartig, “ebond: energy savingin heterogeneous r.a.i.n,” in e-Energy, 2013, pp. 193–202.
[10] M. Gupta and S. Singh, “Dynamic ethernet link shutdown for energyconservation on ethernet links,” in Communications, 2007. ICC ’07.IEEE International Conference on, June 2007, pp. 6156–6161.
[11] D. Kliazovich, P. Bouvry, and S. U. Khan, “GreenCloud: a packet-levelsimulator of energy-aware cloud computing data centers,” Journal ofSupercomputing, vol. 62, no. 3, pp. 1263–1283, 2012.
[12] C. Gunaratne, K. Christensen, and S. Suen, “Ethernet Adaptive LinkRate (ALR): Analysis Of A Buffer Threshold Policy,” in IEEE GlobalTelecommunications Conference (GLOBECOM), 2006, pp. 1–6.
[13] L. Chiaraviglio and I. Matta, “GreenCoop: Cooperative Green Routingwith Energy-efficient Servers,” in International Conference on Energy-Efficient Computing and Networking (e-Energy), 2010.
[14] K. Christensen, P. Reviriego, B. Nordman, M. Bennett, M. Mostowfi,and J. Maestro, “IEEE 802.3az: the road to Energy Efficient Ethernet,”IEEE Communications Magazine, vol. 48, no. 11, pp. 50–56, 2010.
[15] Grid’5000, “Official website.” https://www.grid5000.fr.