Embed Size (px)
Citation preview

STUDYING DEPRESSION USING LINGUISTIC FEATURES
FROM MULTIPLE SOCIAL MEDIA SOURCES
A DISSERTATION
SUBMITTED TO THE DEPARTMENT OF COMPUTER SCIENCE
AND THE COMMITTEE ON GRADUATE STUDIES
OF UNIVERSITY OF PENNSYLVANIA
IN PARTIAL FULFILLMENT OF THE REQUIREMENTS
FOR THE DEGREE OF
MASTERS IN COMPUTER AND INFORMATION SCIENCE
Agrima Seth
November 2018

c© Copyright by Agrima Seth 2019
All Rights Reserved
ii
I certify that I have read this dissertation and that, in my opinion, it is fully adequate
in scope and quality as a dissertation for the degree of Computer and Information
Science.
(Prof. Lyle Ungar) Principal Adviser
I certify that I have read this dissertation and that, in my opinion, it is fully adequate
in scope and quality as a dissertation for the degree of Computer and Information
Science.
(Prof. Chris Callison-Burch)
Approved for the University of Pennsylvania Committee on Graduate Studies
iii

Acknowledgement
At the outset, I wish to express my grateful thanks to Prof Lyle Ungar for supervising me throughout
the work on this project. I am deeply indebted for his valuable guidance, outstanding academic
support and the precious time that he spared to guide me during this work.
I am thankful to Prof Chris Callison -Burch for serving on the thesis committee, his valuable
observations and comments helped me immensely in preparing this document. I would like to
express my deep gratitude to Sharath Chandra Guntuku who was the source of constant guidance
and support for my thesis work. He always encouraged me to explore the unknown and instilled the
values of rigorous work in research.
I am indeed obliged to the Computer and Information Science Department of Penn Engineering
for not only providing me with all resources to carry out this work and but also a very conducive
academic environment.
I am grateful to my fellow Masters students and my family for their constant support during this
endeavour.
iv

Abstract
Depression is one of the major mental health problems of the world. Many cases of depression remain
undetected due to restrictive nature of clinical studies and personal or societal stigma associated
with this ailment. The scarcity of clinically validated data has made it difficult to achieve reliable
machine learning models for depression prediction.
The data of users on social media who self declare symptoms of depression but have not been
explicitly screened for depression using a reliable scale is considered to be weakly labelled data
(Self-Declared). Though neuroticism is a condition strongly associated with depression, neuroticism
data (N7) of users abstracted from generalised personality test surveys which are not specific to
depression (MyPersonality Test) is also considered to be a weakly labelled data. On the other hand,
the data from Centre for Epidemiological Studies Depression Scale (CES-D), a proven clinical scale
for depression, is considered strongly labelled data.
The objective of this thesis was to harness the potential of self-declared data on social media
(specifically Twitter) and neuroticism data (N7) from a generalised personality test (MyPersonality
Test) to build a model from large-scale weakly labelled data sources to predict depression scores as
measured by the clinically validated screening tool: Centre for Epidemiological Studies Depression
Scale (CES-D).
Using data from these data sources, two sets of experiments were carried out to evaluate the
performance of different datasets along with different linguistic features in predicting depression in
a set of Facebook users who also undertook the CES-D screening.
In the first set, machine learning models were trained on different data sources: CES-D, N7 and
Self-Declared using Random Forests on three sets of linguistic features, Linguistic Inquiry and Word
v
Count(LIWC), Latent Dirichlet Allocation(LDA) topic models and Usr2vec. The model was tested
against a held-out set of CES-D users. In the second set of experiments, we built unweighted linear
ensembles of models built on individual data sources to predict held-out CES-D scores.
A model trained on users from the N7 dataset predicted CES-D scores with an Area Under the
Receiver Operating Characteristic Curve (AUC) of 0.64, out-performing the model trained on 70%
of the CES-D dataset which predicted the 30% held-out test CES-D scores with an Area Under the
Receiver Operating Characteristic Curve (AUC) of 0.59. Improvement in predictions based on the
ensemble model was significant as measured by the Wilcoxon Signed Rank test.
This suggests that weakly labelled data which is present in abundance is useful in improving
machine learning models for diagnosis of depression.
vi

Contents
Acknowledgement iv
Abstract v
1 Introduction 1
1.1 Motivation . . . . . . . . . . . . . . . . . . . . . . . . . . . . . . . . . . . . . . . . . 1
1.2 Contributions of this Study . . . . . . . . . . . . . . . . . . . . . . . . . . . . . . . . 2
1.3 Document Structure . . . . . . . . . . . . . . . . . . . . . . . . . . . . . . . . . . . . 3
2 Literature Review 4
2.1 Depression: Clinical Perspective . . . . . . . . . . . . . . . . . . . . . . . . . . . . . . 4
2.2 Computational Assessment of Depression . . . . . . . . . . . . . . . . . . . . . . . . 7
2.2.1 Studies based on Surveys . . . . . . . . . . . . . . . . . . . . . . . . . . . . . 8
2.2.2 Studies based on self-declared mental health status . . . . . . . . . . . . . . . 9
2.2.3 Studies based on Forum Memberships . . . . . . . . . . . . . . . . . . . . . . 10
2.2.4 Studies based on Annotated Tweets . . . . . . . . . . . . . . . . . . . . . . . 11
2.3 Transfer Learning . . . . . . . . . . . . . . . . . . . . . . . . . . . . . . . . . . . . . . 11
3 Materials and Methods 14
3.1 Data Sources . . . . . . . . . . . . . . . . . . . . . . . . . . . . . . . . . . . . . . . . 14
3.2 Features Used . . . . . . . . . . . . . . . . . . . . . . . . . . . . . . . . . . . . . . . . 16
vii

4 Experiments 20
4.1 Cross Validation Predictions . . . . . . . . . . . . . . . . . . . . . . . . . . . . . . . . 21
4.1.1 Single Source . . . . . . . . . . . . . . . . . . . . . . . . . . . . . . . . . . . . 21
4.1.2 Combined Sources . . . . . . . . . . . . . . . . . . . . . . . . . . . . . . . . . 22
4.2 Out-of Sample Predictions . . . . . . . . . . . . . . . . . . . . . . . . . . . . . . . . . 23
4.2.1 Single Source . . . . . . . . . . . . . . . . . . . . . . . . . . . . . . . . . . . . 24
4.2.2 Combined Sources . . . . . . . . . . . . . . . . . . . . . . . . . . . . . . . . . 24
5 Results and Analysis 27
5.1 Cross Validation Results . . . . . . . . . . . . . . . . . . . . . . . . . . . . . . . . . . 27
5.2 Out of Sample Predictions . . . . . . . . . . . . . . . . . . . . . . . . . . . . . . . . . 31
5.3 Discussion . . . . . . . . . . . . . . . . . . . . . . . . . . . . . . . . . . . . . . . . . . 36
6 Conclusion And Future Work 37
Bibliography 39
viii

List of Tables
5.1 Area Under the Curve for Prediction on 718 CES-D users using 10 fold Cross Validation 27
5.2 Area Under Curve for Out of Sample Prediction on 218 CES-D users: . . . . . . . . 31
5.3 Word Clouds likely to be posted by Depressed users Vs Non-depressed users on dif-
ferent data sources . . . . . . . . . . . . . . . . . . . . . . . . . . . . . . . . . . . . . 35
ix

List of Figures
3.1 Sample Questions from CES-D Questionnaire . . . . . . . . . . . . . . . . . . . . . . 15
3.2 Sample Questions from MyPersonality Test . . . . . . . . . . . . . . . . . . . . . . . 16
3.3 Descriptive Statistics of users data from MyPersonality Test and CES-D test. Scores
were converted into Binary labels 0 and 1 based on Thresholds: CESD: 27, N7:
Median Split. For self-declared data from Twitter we collected tweets from 4538
depressed users only. . . . . . . . . . . . . . . . . . . . . . . . . . . . . . . . . . . . 18
5.1 ROC curve for 10-fold Cross Validated using Random Forest Classifier for depression
sample using LIWC . . . . . . . . . . . . . . . . . . . . . . . . . . . . . . . . . . . . 28
5.2 ROC curve for 10 fold Cross Validated using Random Forest Classifier for depression
sample using Topics . . . . . . . . . . . . . . . . . . . . . . . . . . . . . . . . . . . . 29
5.3 ROC curve for 10 fold Cross Validated using Random Forest Classifier for depression
sample using Usr2vec . . . . . . . . . . . . . . . . . . . . . . . . . . . . . . . . . . . . 30
5.4 ROC curve for held-out dataset using Random Forest Classifier for depression sample
using LIWC . . . . . . . . . . . . . . . . . . . . . . . . . . . . . . . . . . . . . . . . . 32
5.5 ROC curve for held-out dataset using Random Forest Classifier for depression sample
using Topics . . . . . . . . . . . . . . . . . . . . . . . . . . . . . . . . . . . . . . . . . 33
5.6 ROC curve for held-out dataset using Random Forest Classifier for depression sample
using Usr2vec . . . . . . . . . . . . . . . . . . . . . . . . . . . . . . . . . . . . . . . . 34
x

Chapter 1
Introduction
1.1 Motivation
Incidence
Depression is one of the major health problems of the world. According to the World Health
Organisation [1], depression is an important cause of disability when assessed by the Years Lived
with Disability (YLDs). This ailment is the fourth largest contributor to worldwide burden of
disease. By the end of this decade, it is estimated that depression would be the second leading cause
in Disability Adjusted Life Years (DALY) ranking calculated across all age groups. Middle aged
population and women more than men are vulnerable to be afflicted with depression. It is estimated
that globally, around 300 million people are suffering from depression. The life time prevalence of
depression has been estimated to vary from 3% to 17%.
Symptoms of Depression
According to a study “The Nature of Clinical Depression: Symptoms, Syndromes and Behavior
Analysis” by Kanter et al. [2], symptoms of depression can range from low mood, crying episodes,
irritability, frustration to anger outbursts etc. The patient tends to lose interest in all activities
1

CHAPTER 1. INTRODUCTION 2
which were earlier pleasurable. There can be insomnia and loss of appetite. The individual may
lack energy and get easily fatigued. These symptoms are generally accompanied by psychomotor
retardation i.e. decreased body movements.The affected person may not be able to concentrate and
may be forgetful. His confidence level decreases and will often have doubts on himself as to whether
he will be successfully accomplishing a simple task. This is generally accompanied by psychosomatic
complaints in the form of heaviness in the head, neck or shoulders. Patient may have depressive
cognitions in the form of hopelessness, worthlessness and helplessness. There could be frequent
thoughts about death ranging from passive death wishes i.e.it would be better that I am dead to
actively planning about it to escape from the illness. Neuroticism is a condition closely associated
with depression[3].
1.2 Contributions of this Study
Depression is a not only a widespread problem but also largely goes undetected. The various
techniques that have been used to diagnose depression include personal interview with healtcare
provider, analysis based on scores of CES-D scale(Centre for Epidemological Studies Depression
Scale) and computational analysis of data on social media. In the past, several studies (discussed
in Chapter 2) have focussed on symptoms associated with mental illness being observable on social
media like Twitter, Facebook, and web forums. Detection of depression computationally is a difficult
task since it is hard to get validated assessments of depression, and sample size available too is limited
due to ethical and privacy concerns. The data of users on social media who self declare symptoms of
depression but have not been explicitly screened for depression using a reliable scale is considered to
be weakly labelled data. Similarly data of users abstracted from generalised personality test surveys
which are not specific to depression (MyPersonality Test) is also considered to be a weakly labelled
data. CES-D is a validated scale and provides a reliable measure of depression.
The main contributions of this thesis are:
• Prior Studies have focussed on analysing the individual predictive powers of neuroticism data
from MyPersonality Test (N7) and data from social media sources (e.g. Facebook, Twitter
etc.) wherein the user explicitly mentions about having a depression condition (Self-Declared
CHAPTER 1. INTRODUCTION 3
data). Since this is a self declared data, this may not necessarily be a valid clinical diagnosis.
To address the challenges in detection of depression and limited sample size of clinically vali-
dated data on depression, we used self-declared data from social media sources and neuroticism
data (N7) from a general personality evaluation of an individual from MyPersonality Test since
the data from these two sources is more easily available. We demonstrated a novel approach of
using the predictive power of weak labelled data i.e, neuroticism data from MyPersonality Test
(N7) and Self-Declared Data from Twitter on clinically validated Centre for Epidemological
Studies Depression Scale (CES-D) using Transfer Learning Techniques.
In studying the predictive powers of the weak labelled data (N7 and Self-Declared) we also
analysed the predictive power of various linguistic features (LIWC, Topics and Usr2Vec em-
beddings).
1.3 Document Structure
The subsequent chapters of this thesis are structured as follows:
Chapter 2 comprises of literature review and goes over the related work in detecting depression and
mental illness on social media.
In Chapter 3, we discuss the various sources used to collect data, extraction and description of
different features used in our experiment.
Chapter 4 describes the different types of out-of-sample prediction experiments conducted, details
of data set combinations used and baseline model.
Chapter 5 evaluates the performance of LIWC, LDA topic models and Usr2vec features and data
sources and presents the AUC values ROC curve
Chapter 6 discusses the implication of this work and suggests future research directions.

Chapter 2
Literature Review
2.1 Depression: Clinical Perspective
Depression is known to affect all age groups from children to elderly. This chapter discusses age
specific symptoms, diagnostic tools and methodologies used by the clinical fraternity in diagnosis of
depression and a review of studies in computational assessment of depression.
Depression symptoms in children and teenagers
Though most of the symptoms of depression in children and teenagers are similar to those of adults,
there are certain additional features. These include clinginess, non specific aches and pains, sadness,
irritation and reluctance to attend school. There could be weight loss. In the teenagers, apart from
above symptoms, extreme sensitivity and features of being misunderstood can be present. Some
teenagers may be prone to use recreational drugs and may manifest defiant behaviour [4].
Depression symptoms in elderly
In the middle aged and elderly population, depression may very often remain undiagnosed because
of reluctance to report to medical professional. Depression is to be taken seriously in the elderly
and should never be dismissed as a part of aging. Symptoms of depression may be different or less
4

CHAPTER 2. LITERATURE REVIEW 5
obvious in older adults, such as, memory difficulties or personality changes, physical aches or pain,
fatigue, often wanting to stay at home rather than going out to socialize or doing new things and
suicidal ideation [5].
Cause of Depression
The exact reason why depression takes place is not known. It is integration of genetic causes,
environmental factors, life stressors etc. There is generally depletion of Neurotransmitter Serotonin
in the brain. Also there is dysregulation in the Hypothalamus-Pituitary-Adrenal axis, rise in the
serum cortisol, proinflammatory cytokines and Brain-derived neurotrophic factor (BDNF). Brain
areas primarily affected in depression are prefrontal cortex, amygdala and hippocampus [6, 7].
Diagnostic criteria
Major Depressive Disorder (MDD) diagnostic criteria require the occurrence of one or more major
depressive episodes. Symptoms of a major depressive episode include the following:
• Depressed mood.
• Anhedonia (diminished interest or pleasure in almost all activities).
• Significant weight or appetite disturbance.
• Sleep disturbance
• Psychomotor agitation or retardation (a speeding or slowing of muscle movement).
• Loss of energy or fatigue.
• Feelings of worthlessness (low self-esteem).
• Diminished thinking ability, concentration and decision making capability.
• Repeated thoughts of suicide or death.
• Longstanding interpersonal rejection ideation (i.e. “Others would be better off without me”;
specific suicide plan and suicide attempt [4].

CHAPTER 2. LITERATURE REVIEW 6
As per Diagnostic and Statistical Manual for mental disorders (DSM- V th Edn), at least five of
the above symptoms must be present on most days of the week and for most part of the day in the
preceding two weeks [8]. Total number of symptoms and their severity determines whether depression
is mild, moderate or severe. In International Statistical Classification of Diseases and Related Health
Problems, 10th Revision (ICD-10), the diagnosis is usually based on the ten symptoms of depression
and can be classified as:
• Not depressed (fewer than four symptoms)
• Mild depression (four symptoms)
• Moderate depression (five to six symptoms)
• Severe depression (seven or more symptoms, with or without psychotic symptoms)
The symptoms should be present for most of the day and on most days for the preceding two
weeks [9].
Management of Depression
The fundamental principles of managing a case of depression are as follows: First and foremost chal-
lenge in treating a case of depression is establishing the diagnosis with the help of detailed interview
and clinical examination [10]. The diagnosis is straight forward in only a minority of patients. It is
not uncommon for a General Physician (GP) to miss the diagnosis. Under the circumstances, certain
structured psychometric instruments can be extremely helpful [11]. These instruments are in the
form of either questionnaires or inventories. With the help of these instruments, all the symptoms
can not only be assessed but also quantified depending on their level of severity.
Centre for Epidemological Studies Depression Scale (CES-D) is one such instrument which has
acceptable reliability and validity [12](Figure 3.1). This instrument is helpful as a screening tool for
depression in the general population. There are other instruments like Beck Depression Inventory,
Hamilton Depression Scale etc. but these are not sensitive screening tools for the general population.
General Health Questionnaire (GHQ) can be used as a screening instrument for general population
but it lacks specificity for depression [13].
CHAPTER 2. LITERATURE REVIEW 7
Assessment of personality is also integral to holistic assessment of psychiatric patients for diag-
nostic as well as therapeutic purposes. Neuroticism has been found to correlate well with depression
and can be ascertained with the help of personality inventories like Million Clinical Multiaxial Inven-
tory (MCMI) [14]. However,since conduct and evaluation of these tests require specialised medical
training, such tests are best reserved for psychologists and psychiatrists.
It is noteworthy to mention here that depression can result due to a variety of medical disorders,
which need exclusion with the help of laboratory tests like blood counts, renal and liver function
tests, electro-cardiogram (ECG) and brain scanning with the help of either a CT-Scan or MRI
depending on clinician’s advice.
Once diagnosis is established, it is essential to assess whether the patient requires an in-patient or
an outpatient management depending on his condition and level of severity. If the depression is not
severe and functioning is well preserved, he may be treated on an out-patient basis with counselling,
antidepressants or combination of both. Psychological interventions involve strengthening of the
support system and also various forms of psychotherapies. Cognitive behavioural therapy (CBT) is
one such therapy where the patient is made aware of his cognitive distortions. The therapist and
the patient have to work together to correct these problems. Selective serotonin reuptake inhibitors
(SSRIs) are well established in the treatment of depression and are usually safe even in large doses.
Some patients may require hypnotic drugs like benzodiazepines for initial few days to improve sleep
and to reduce anxiety. Severe form of depression generally requires inpatient and intensive treatment
[15].
2.2 Computational Assessment of Depression
As elaborated above, depression is a not only a widespread problem but also largely goes undetected.
In the past, many studies conducted have focussed on symptoms associated with mental illness
being observable on social media like Twitter, Facebook, and web forums. Detection of depression
computationally is a difficult task since it’s hard to get validated assessments of depression, and
sample size available too is limited due to ethical and privacy concerns.
CHAPTER 2. LITERATURE REVIEW 8
2.2.1 Studies based on Surveys
The study by De Choudhury et al [16] explored the social media posting activities of depressed users.
The users were identified through participants self reporting depression incidents in combination with
results obtained for these users from clinically validated tools: Center for Epidemiologic Studies
Depression Scale Revised (CES-D) and Becks Depression Inventory (BDI) score. These scores are
obtained by scoring the answers chosen by the users in a multiple choice questionnaire which consists
of 20 questions, and based on the total score obtained the users are classified in the level of depression
they are suffering.
To ensure diversity (age, gender, demography) in the population whose behavioural data was
being collected for analysis, they implemented crowdsourcing. The volunteers who self identified
themselves as depressed were also required to take the CES-D and BDI test to asses their level of
depression and finally were asked to share their public Twitter profile. These profiles were mined
for a year and tested against the profiles of not depressed users.
Their social graph, lexicon used, emotions expressed and usage of words referring to popular
anti-depressants was taken into account as features to predict depression. This data collected over
time per user was then converted to feature vectors and used to train model to predict depression
state of a Twitter user. They reported an average accuracy of ∼ 70% and high precision of 0.74,
corresponding to the depression class.
Another study by Reece et al.[17] aimed at predicting both Depression and Post-Traumatic Stress
Disorder in Twitter users. They studied the text and Twitter meta-data that preceded the reported
first episode of depression to build predictive model for depression unlike the model described by De
Choudhury M et al [16] where users were included if they suffered at least two episodes of depression
within the year and hence the training data may have contained both types of tweets: (a) posted
during a previous depressive episode, (b) tweets posted after users had received a formal diagnosis.
The measured parameters were:
• Total tweets per user,per day, as a measure of user activity.
• Tweet metadata containing number of words in a given tweet was used to assess average word
count per tweet.
CHAPTER 2. LITERATURE REVIEW 9
• If it was a original tweet, re-tweet or a reply.
• Happiness factor was analysed using
– labMT: a word list of 10221 words, where each word has a happiness score associated
with them for sentiment analysis,
– LIWC 2007 : Linguistic Inquiry and Word Count (LIWC) is a text analysis program that
counts words in the text in psychologically meaningful categories and
– ANEW: Affective Norms for English Words,is a labelled word list, where each word has
been scored for valence. Each word in the post is scored based on the ANEW list to
obtain a net valence score for the post.
They reported Areas under the Receiver Operating Characteristic curve to be 0.87.
2.2.2 Studies based on self-declared mental health status
Many social media users explicitly mention about their depression episodes, their detection and
treatment using statements like “I was diagnosed with depression today”. The following studies
aimed at building predictive models to identify depression from self-declared data since it is available
in abundance and easy to stream.
The 2015 Computational Linguistics and Clinical Psychology(CLPsych) workshop [18] focused
on use of computational linguistic technologies which could be used to pick up signals related to
mental health in language data and related metadata.
The studies conducted during this workshop collected data according to the procedures of Cop-
persmith et al [19] where users with tweets such as “I was diagnosed with depression(or a mental
disease)” were taken into account. They used a human annotator to remove tweets which referred
to jokes, quotes etc. Only users with greater than 25 tweets were considered and for such users 3000
public tweets were mined.
In this workshop, University of Maryland treated tweets for 1 week as a single document and
performed supervised topic modelling [20]. The World Well Being Project (WWBP) from University
of Pennsylvania combined topic modelling with unigram analysis to find which words clustered
together and best separated depressed vs non-depressed behaviour[21]. The study from University of

CHAPTER 2. LITERATURE REVIEW 10
Minnesota, Duluth used N-grams present in Post Traumatic Stress Disorder (PTSD) and depression
statuses of all users [22]. The tweets were randomly sampled and the first eight million words of
Tweets for each condition were used as the training data. Multiple N-gram combinations were used
to create decision list and weigh the occurrence of words in a category. A word with the weight 0
occurred equally in both depressed and not depressed category whereas a word that occurred 400
times in depressed and 100 times in not depressed was weighted at 300. Hence, it’s occurrence was
indicative of depression. This model presented by University of Minnesota, Duluth outperformed
the other models.
The metrics used to evaluate the performance were:
• Average precision: number of correct answer( in this case the number of depressed users) have
been encountered up to this point (including current) divided by the total results seen up to
this point,
• Precision at 10% false alarms: proportion of retrieved top-10% results that are relevant,
• ROC curve for each method with the highest average precision and
• ROC curves, focused on the low false alarm range (0-10%).
For our study, we analysed the performance of our models by plotting the ROC curve since they
are unaffected by the baseline prior probability of positive class (i.e., depressed user).
2.2.3 Studies based on Forum Memberships
Studies by Bagroy et al. [23] used data mined from online forums like reddit to understand the
depression characteristics and trends in university students from the United States of America.
Data that was mined from groups aimed at mental health support discussions was taken as ground
truth. They mined another set of Reddit posts, made on generic subreddits unrelated to mental
health, to be a control dataset.
Inductive transfer learning approach was used to learn more about depressed users. It incorpo-
rated unigram,bigram and trigram and LIWC as linguistic features to identify depression.
Further the study aimed at rating the well being of various universities based on the depression
levels of users from these universities in the United States of America.

CHAPTER 2. LITERATURE REVIEW 11
2.2.4 Studies based on Annotated Tweets
For these studies, a group of annotators were provided with a set of rules to identify posts about
depression [24]. These rules are usually set by domain experts and are aimed at filtering out tweets
which merely have a mention of the disease and not actual reporting. Linguistic rules are also
provided so as to identify and label the tweet with a mood-type. Though these studies provide
a very reliable source of labelled data, they are very labour intensive and hence the size of data
available is restrictive in nature.
2.3 Transfer Learning
Transfer learning is the process of leveraging the information from other domains (called, source
domain) to train a better model for the target domain. In recent years it has found extensive
implementation in many learning tasks, such as natural language processing, sentiment prediction
and image classification.
Transfer Learning algorithms can be classified into the following:
1. Inductive Learning: This is applied in a setting where the number of samples in target
domain (M) is very less as compared to the number of samples in source domain (N) M << N .
The target and source task are different irrespective of whether the source and target domains
are similar or not.
2. Transductive Learning: This is applied in a setting where the source and target tasks are
the same, while the source and target domains are different. In this case no labelled data in
the target domain is available while a lot of labelled data is available in the source domain.
3. Unsupervised Transfer Learning: Implemented in tasks where both the source and target
domain have unlabelled data. This technique focusses on unsupervised learning tasks in the
target domain, such as clustering, dimensionality reduction and density estimation.

CHAPTER 2. LITERATURE REVIEW 12
Transfer Learning and Domain Adaptation for Adapting Personality Model
from Facebook to Twitter
Study conducted by Rieman et al.[25] explored adapting personality model from one social media
website to another namely Facebook as the source domain and Twitter as the target domain. Their
study states that since most of the Tweets can be streamed using APIs and can be accurately mapped
geographically a personality model based on Twitter would have proved to be majorly beneficial over
using personally identifiable data which is unavailable due to privacy and ethical reasons.
The study talks about vocabulary adaptations from Facebook to Twitter: There exists a vo-
cabulary difference between Twitter and Facebook since Twitter restricts usage to 140 characters
on a single post unlike Facebook and words like ‘rt’ are more common to Twitter than Facebook.
They present Target Side Domain Adaptation wherein over-represented words had their frequencies
adjusted by normalization. Usage pattern difference was accounted for by implementing the ratio of
a word’s mean frequency for Facebook users, to the word’s mean frequency for Twitter counties.
They reported an increase in the Pearson correlation between Education and Openness from 0.32
to 0.55.
Transfer Learning for Our Study
For our study, we had three different data sources: MyPersonality test, Self-Declared and Clinically
validated CES-D. The N7 data from MyPersonality test is from a domain different than CES-D and
is aimed at analysing various facets of a human personality, some of which are related to depression.
The Self-declared data is from Twitter, thus though from a different domain is present in abundance.
Based on the study of domain adaptation between different social media domains[25], we decided
to implement domain adaptation using N7 data from MyPersonality test and Self-declared data from
Twitter as the source domain and results from CES-D as target domain. However, we had labelled
source and target domain data and hence we decided to leverage the information from both the
domains to enhance the predictive power of our model. We implemented the following variations of
transfer learning as described by Hal Daume’III and Daniel Marcu [26] which demonstrated baselines
that were actually surprisingly difficult to beat:

CHAPTER 2. LITERATURE REVIEW 13
1. Single Source Models: For baseline analysis we trained models from the source domain (i.e.
N7, SD and CES-D) using the LIWC, Topics and Usr2Vec features and analysed the predictive
power of these models by predicting the CES-D score (i.e., the target domain).
2. Combined Models : The predicted CES-D scores from the single source models were used
as features to train a second model and the predictive power of these models was analysed by
predicting the CES-D score (i.e., the target domain).

Chapter 3
Materials and Methods
The focus of this study was to harness the predictive powers of weak labels (N7 and SD data) to
predict strong label (CES-D). Social media (Facebook) posts were mined for those who consented
to and volunteered either for the CES-D questionnaire or MyPersonality test (for N7data). Self
declared data (SD) was mined from Twitter using regex rules to identify tweets. Based on the
literature review of previous studies, LIWC, Topics and Usr2Vec features were used as language
features to identify depression.
3.1 Data Sources
1. CES-D (Center for Epidemiologic Studies Depression Scale) was created in 1977 by Laurie
Radloff [27] and revised in 2004 by William Eaton et al.[28]. It is used to measure self-
reported symptoms experienced with depression. The CES-D includes 20 items comprising
six scales that reflect the major dimensions of depression: depressed mood, feelings of guilt
and worthlessness, feelings of helplessness and hopelessness, psychomotor retardation, loss of
appetite and sleep disturbance[29, 30].
Response categories indicate the frequency of occurrence of each symptom and are scored on
a 4 point scale ranging from 0 (rarely or none of the time) to 3 (most or all of the time). This
provides a clinically reliable measure of depression.
14
CHAPTER 3. MATERIALS AND METHODS 15
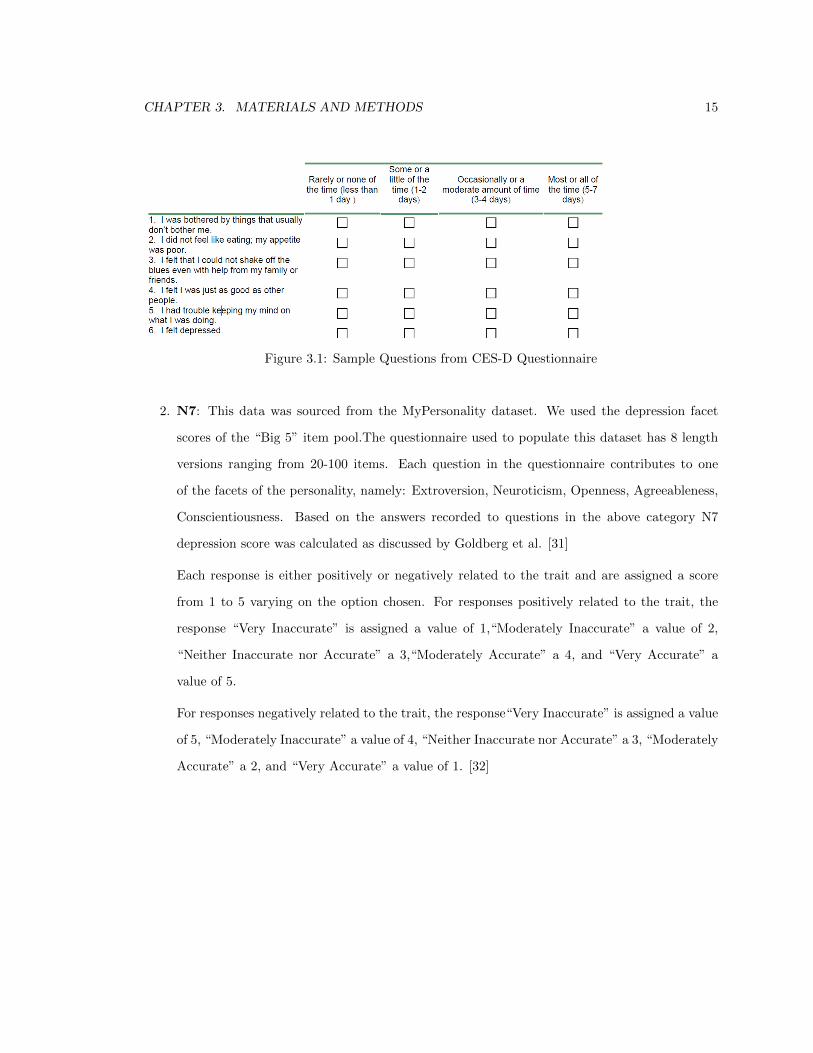
Figure 3.1: Sample Questions from CES-D Questionnaire
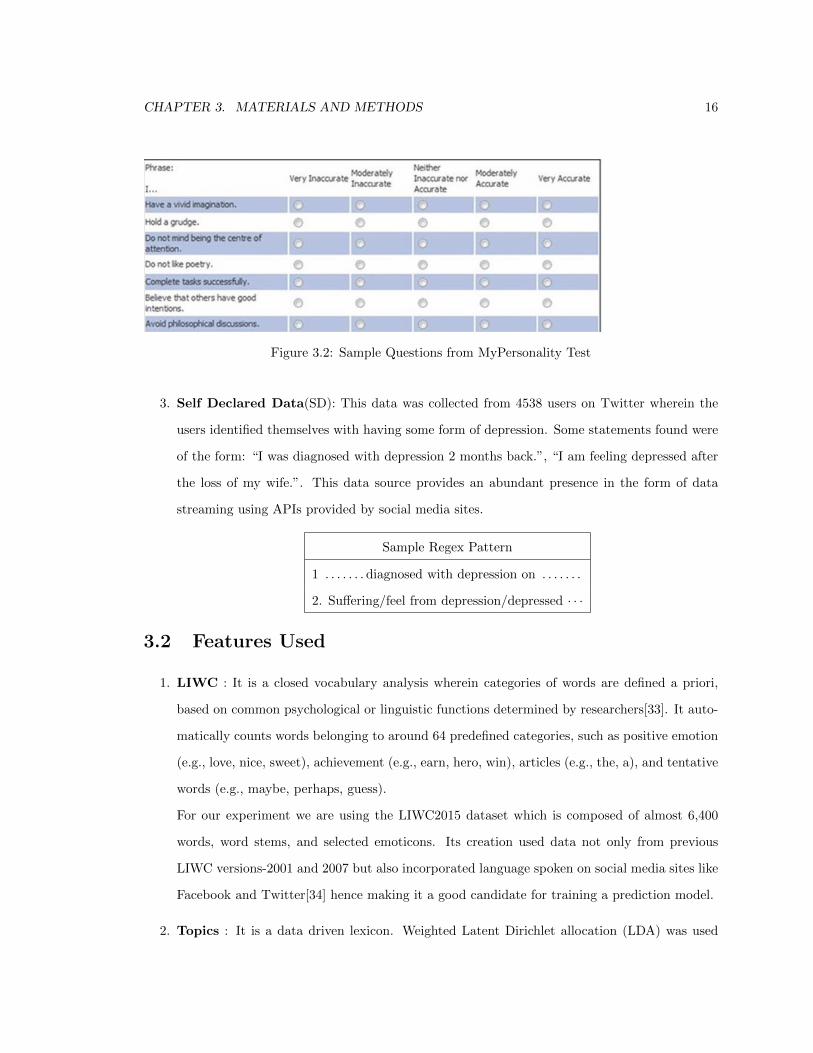
2. N7: This data was sourced from the MyPersonality dataset. We used the depression facet
scores of the “Big 5” item pool.The questionnaire used to populate this dataset has 8 length
versions ranging from 20-100 items. Each question in the questionnaire contributes to one
of the facets of the personality, namely: Extroversion, Neuroticism, Openness, Agreeableness,
Conscientiousness. Based on the answers recorded to questions in the above category N7
depression score was calculated as discussed by Goldberg et al. [31]
Each response is either positively or negatively related to the trait and are assigned a score
from 1 to 5 varying on the option chosen. For responses positively related to the trait, the
response “Very Inaccurate” is assigned a value of 1,“Moderately Inaccurate” a value of 2,
“Neither Inaccurate nor Accurate” a 3,“Moderately Accurate” a 4, and “Very Accurate” a
value of 5.
For responses negatively related to the trait, the response“Very Inaccurate” is assigned a value
of 5, “Moderately Inaccurate” a value of 4, “Neither Inaccurate nor Accurate” a 3, “Moderately
Accurate” a 2, and “Very Accurate” a value of 1. [32]
CHAPTER 3. MATERIALS AND METHODS 16
Figure 3.2: Sample Questions from MyPersonality Test
3. Self Declared Data(SD): This data was collected from 4538 users on Twitter wherein the
users identified themselves with having some form of depression. Some statements found were
of the form: “I was diagnosed with depression 2 months back.”, “I am feeling depressed after
the loss of my wife.”. This data source provides an abundant presence in the form of data
streaming using APIs provided by social media sites.
Sample Regex Pattern
1 . . . . . . . diagnosed with depression on . . . . . . .
2. Suffering/feel from depression/depressed · · ·
3.2 Features Used
1. LIWC : It is a closed vocabulary analysis wherein categories of words are defined a priori,
based on common psychological or linguistic functions determined by researchers[33]. It auto-
matically counts words belonging to around 64 predefined categories, such as positive emotion
(e.g., love, nice, sweet), achievement (e.g., earn, hero, win), articles (e.g., the, a), and tentative
words (e.g., maybe, perhaps, guess).
For our experiment we are using the LIWC2015 dataset which is composed of almost 6,400
words, word stems, and selected emoticons. Its creation used data not only from previous
LIWC versions-2001 and 2007 but also incorporated language spoken on social media sites like
Facebook and Twitter[34] hence making it a good candidate for training a prediction model.
2. Topics : It is a data driven lexicon. Weighted Latent Dirichlet allocation (LDA) was used
CHAPTER 3. MATERIALS AND METHODS 17
on around 14 million Facebook statuses to create this feature set. LDA basis itself on the
assumption that each document is a mix of various topics and that each word contributes to
one of the topics of the document.
Here the aim is to get probability of a topic given the document:
P (Topic/document) = Σword∈Topic(Topic/word) ∗ P (word/document) Here each term has a
weight of belonging to a category (which is unlabelled unlike LIWC).
3. usr2vec: It is a user embedding feature which aims at understanding the relation between the
users and the content that they generate. It aims to estimate the parameters of a user vector
uj , that maximize the conditional probability as described by Silvio et al.[36]:
P (Posts authored by user j/User j) =
Σpost∈Posts authored by user jΣwords that make up the post logP (word in post/user j)
The term logP (word in post/user j) was minimised using the hinge loss function:
= Σwk∈ V ocabularymax(0, 1 − (each word).user j + wk.user j)
where word wk (and associated embedding,wk) is a negative sample, i.e. a word not occurring
in the sentence under consideration, which was written by user j.
Creation of this feature was specific to the data source used. For each user there was 100
dimension usr2vec embedding. Hence there were different user embeddings based on survey
CESD, N7 and streamed data from social media SD.
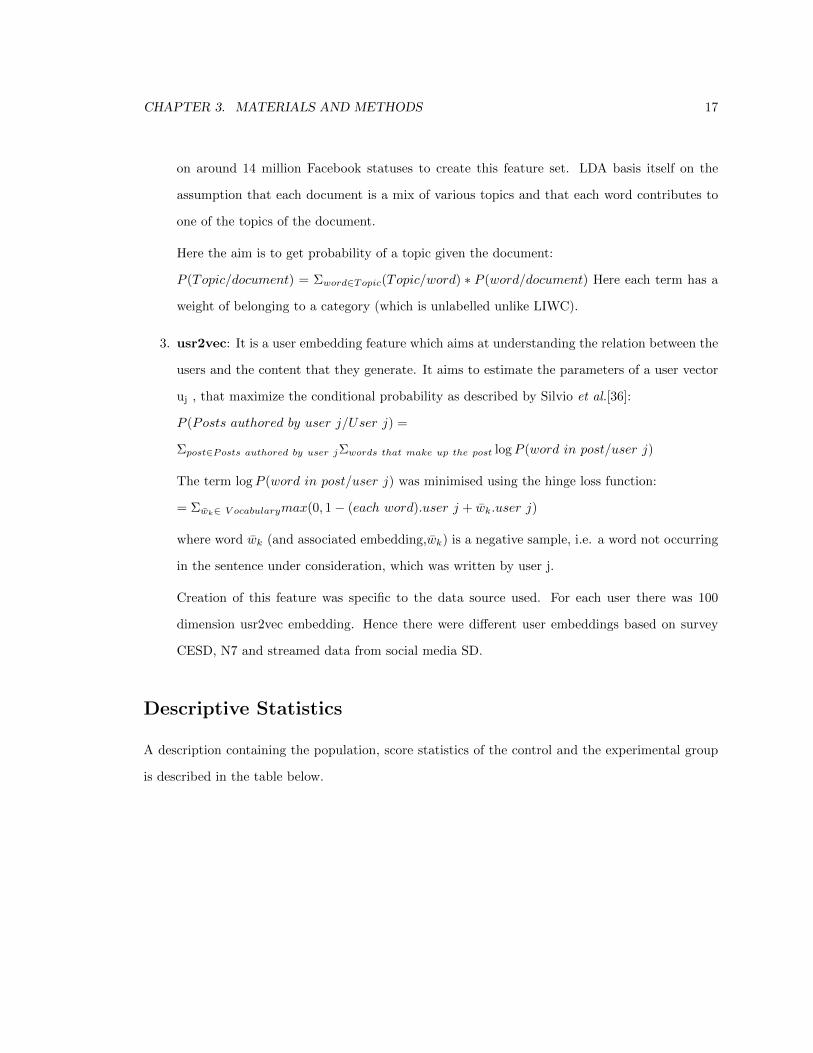
Descriptive Statistics
A description containing the population, score statistics of the control and the experimental group
is described in the table below.

CHAPTER 3. MATERIALS AND METHODS 18
Figure 3.3: Descriptive Statistics of users data from MyPersonality Test and CES-D test. Scoreswere converted into Binary labels 0 and 1 based on Thresholds: CESD: 27, N7: Median Split. Forself-declared data from Twitter we collected tweets from 4538 depressed users only.
• Sample of the Facebook posts collected for users who took the CES-D question-
naire:
1. Work flow all week and tired ...
2. missing my Girly :(
3. Mood: distraught, confused, uncomfortable, and worried
4. Stupid insomnia why don’t you let me sleep, if I could wrap my arms around you I’d hurt
you... O well Happy Morning.
• Sample of the Facebook posts collected for users who took MyPersonality Test:
1. I want the ablity to make it rain!( weather)
2. ” O’ what tangled webs we weave when we practice to decive”
3. Summer’s almost over, but I’m feeling oddly optimistic about senior year=D bet it’s going to
be a good one
4. summer was great; had the option of staying up all night just to watch the sun come up in the
morning...school ruined this for me...
• Sample of the Tweets mined using the regex rules are as follows:

CHAPTER 3. MATERIALS AND METHODS 19
1. When your mind is scattered with thoughts, it’s difficult to figure out where the beginning is.
#anxiety #depression
2. OK my depression (???) is making me rilly, rilly tired.
3. Sometimes, I just have the urge to curl up up in bed alone and cry for no reason at all.
Sometimes, for every reason. #depression
4. I was so excited, knew about it for three weeks, but every time I thought about asking you to
come with me, Id get anxious and depressed.

Chapter 4
Experiments
The availability of clinically validated score CES-D is limited due to privacy and ethical laws. Thus,
we aimed to explore the predictive power of weak labels such as Facebook data of users who had taken
MyPersonality Test (considering their neuroticism facet-N7) and self-declared data from Twitter
(users who identify themselves as depressed).
Alongside the aim of identifying the data source(s), with strong predictive powers we also aimed
at evaluating the predictive powers of various linguistic features (LIWC, Topics and Usr2Vec) in
combination to the data sources.
Hence, for each data source we evaluated the predictive powers of the three linguistic features. To
analyse the performance, we plotted the receiver operating characteristic curve, i.e. ROC curve and
studied the area under the curve i.e. AUC. The aim for using this was that the classes (depressed
vs non-depressed) were imbalanced and AUC-ROC measures the performance of a binary classifier
averaged across all possible decision thresholds.
In the first set of experiment (section 4.1), we first tested the predictive powers of each data
source along with the three linguistic features using 10 fold cross validation on CES-D (Single
Source Model), and then created various unweighted linear ensemble of the predicted results from
these data sources and evaluated that against the ground truth (Combined Source Model).
In the second set of experiment (section 4.2) we held-out 218 users as the testing data and then
tested the predictive powers of each data source and their unweighted linear ensembles along with
20

CHAPTER 4. EXPERIMENTS 21
the three linguistic features. The predicted results were evaluated against the 218 held-out users.
4.1 Cross Validation Predictions
CES-D survey data was assigned to 10 stratified-folds and 10 fold Cross validation was performed
to report scores.
4.1.1 Single Source
1. CES-D: 718 users who took the CES-D survey were divided into 10 stratified folds. Using cross
validation technique, the models based on LIWC, Topics and Usr2Vec features were trained
on 9 folds and predicted the 10th fold using a Random Forest Classifier wherein number of
trees was determined using gridsearchCV, all other hyper-parameters were kept as the default
values mentioned in sklearn library [37]. The final predicted vector was compared against the
ground truth to report the AUC values and draw ROC curve.
2. N7: Three models were trained on 16507 users using LIWC, Topics and Usr2Vec features
respectively. The classification algorithm used was Random Forest, wherein number of trees
was determined using gridsearchCV, all other hyper-parameters were kept as the default values
mentioned in sklearn library [37]..The predicted vector of 718 CES-D users was found on this
trained model. The predicted probabilities were tested against ground truth to get the AUC
values and ROC curves.
3. SD: Three models were trained on 4538 users using LIWC, Topics and Usr2Vec features re-
spectively. The classification algorithm used was Random Forest, wherein number of trees was
determined using gridsearchCV, all other hyper-parameters were kept as the default values
mentioned in sklearn library [37]..The predicted vector of 718 CES-D users was found on this
trained model.The predicted probabilities were tested against ground truth to get the AUC
values and ROC curves.

CHAPTER 4. EXPERIMENTS 22
4.1.2 Combined Sources
The following combination of data sources were used to determine the prediction performance on all
three features namely LIWC, Topics and Usr2Vec.
1. CES-D and N7: A new feature table was created using:
• the predicted class probabilities of the entire testing data(718 CES-D users) obtained
from the model trained on N7.
• the predicted class probabilities of 718 users from CES-D, wherein CES-D survey data
was assigned to 10 stratified-folds and 10 fold Cross validation was performed to avoid
overfitting.
In the next step a Random Forest Classifier wherein number of trees was determined using
gridsearchCV, all other hyper-parameters were kept as the default values mentioned in sklearn
library [37] was trained and tested using the same stratified division of outcomes on these new
features and the predicted values were tested against a ground truth to report the AUC values
and infer the ROC curve.
2. CES-D and SD: A new feature table was created using:
• the predicted class probabilities of the entire testing data(718 CES-D users) obtained
from the model trained on SD.
• the predicted class probabilities of 718 users from CES-D, wherein CES-D survey data
was assigned to 10 stratified-folds and 10 fold Cross validation was performed to avoid
overfitting.
In the next step a Random Forest Classifier wherein number of trees was determined using
gridsearchCV, all other hyper-parameters were kept as the default values mentioned in sklearn
library [37] was trained and tested using the same stratified division of outcomes on these new
features and the predicted values were tested against a ground truth to report the AUC values
and infer the ROC curve.
3. SD and N7: A new feature table was created using:
CHAPTER 4. EXPERIMENTS 23
• the predicted class probabilities of the entire testing data(718 CES-D users) obtained
from the model trained on N7.
• the predicted class probabilities of the entire testing data(718 CES-D users) obtained
from the model trained on SD.
In the next step a Random Forest Classifier wherein number of trees was determined using
gridsearchCV, all other hyper-parameters were kept as the default values mentioned in sklearn
library [37] was trained and tested using the same stratified division of outcomes on these new
features and the predicted values were tested against a ground truth to report the AUC values
and infer the ROC curve.
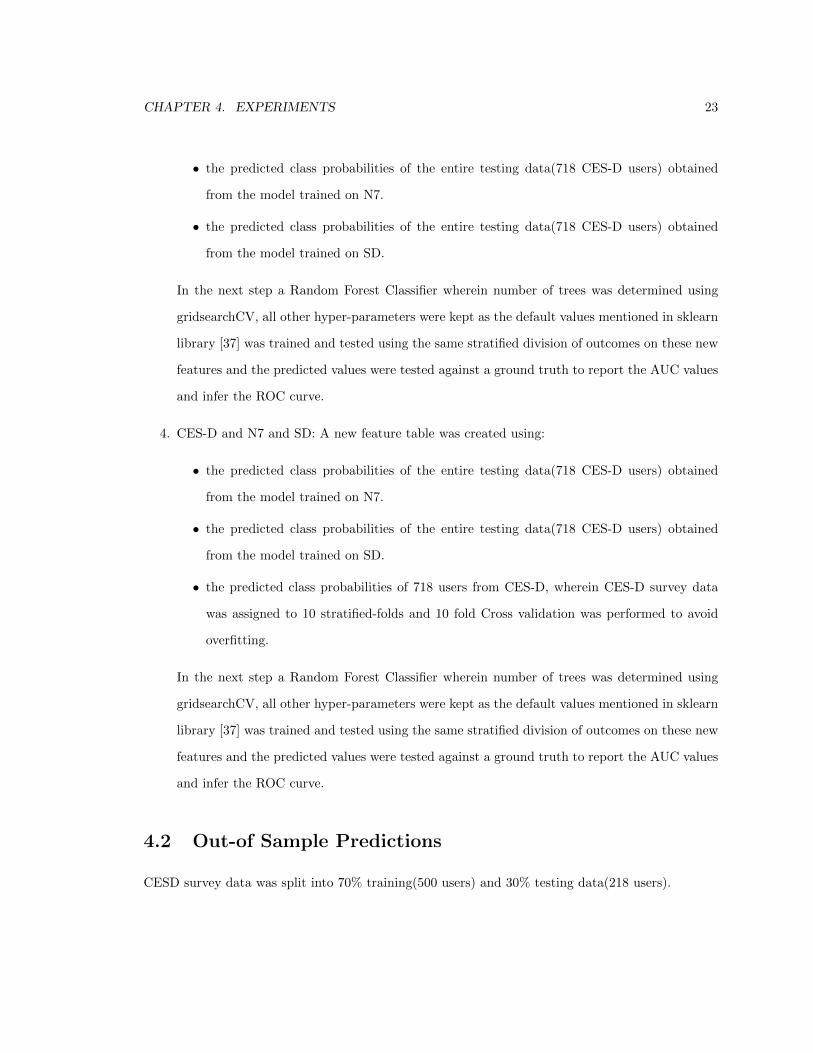
4. CES-D and N7 and SD: A new feature table was created using:
• the predicted class probabilities of the entire testing data(718 CES-D users) obtained
from the model trained on N7.
• the predicted class probabilities of the entire testing data(718 CES-D users) obtained
from the model trained on SD.
• the predicted class probabilities of 718 users from CES-D, wherein CES-D survey data
was assigned to 10 stratified-folds and 10 fold Cross validation was performed to avoid
overfitting.
In the next step a Random Forest Classifier wherein number of trees was determined using
gridsearchCV, all other hyper-parameters were kept as the default values mentioned in sklearn
library [37] was trained and tested using the same stratified division of outcomes on these new
features and the predicted values were tested against a ground truth to report the AUC values
and infer the ROC curve.
4.2 Out-of Sample Predictions
CESD survey data was split into 70% training(500 users) and 30% testing data(218 users).
CHAPTER 4. EXPERIMENTS 24
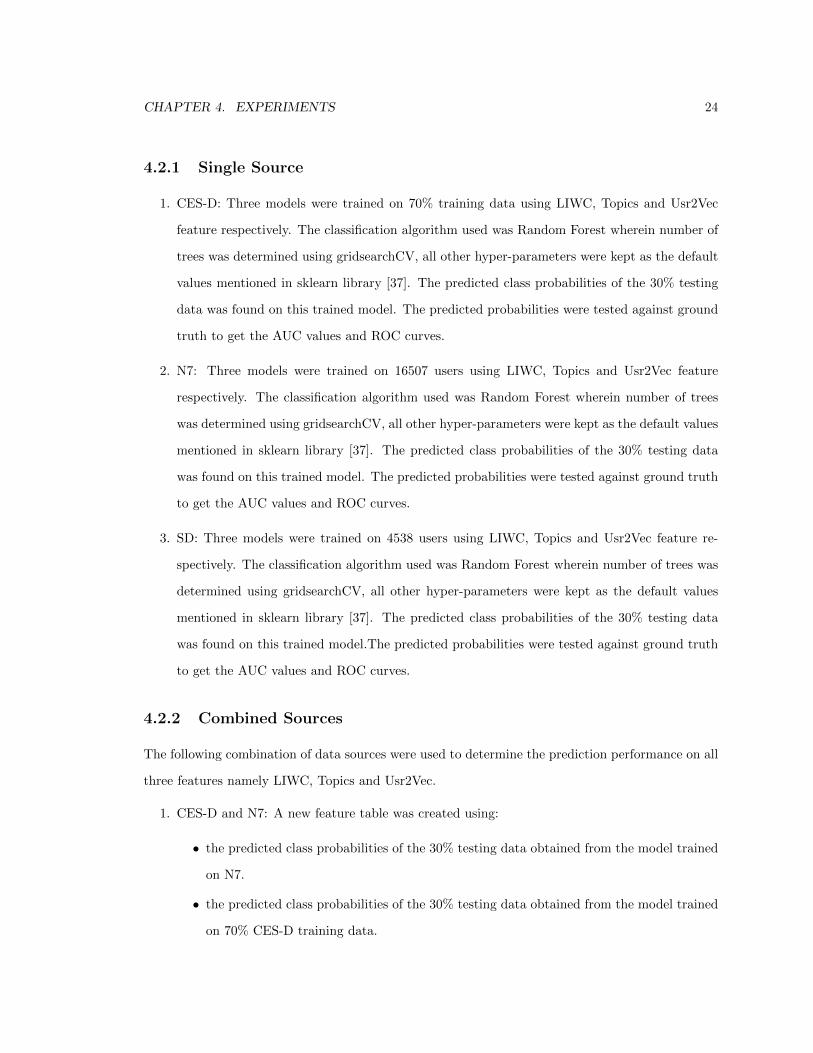
4.2.1 Single Source
1. CES-D: Three models were trained on 70% training data using LIWC, Topics and Usr2Vec
feature respectively. The classification algorithm used was Random Forest wherein number of
trees was determined using gridsearchCV, all other hyper-parameters were kept as the default
values mentioned in sklearn library [37]. The predicted class probabilities of the 30% testing
data was found on this trained model. The predicted probabilities were tested against ground
truth to get the AUC values and ROC curves.
2. N7: Three models were trained on 16507 users using LIWC, Topics and Usr2Vec feature
respectively. The classification algorithm used was Random Forest wherein number of trees
was determined using gridsearchCV, all other hyper-parameters were kept as the default values
mentioned in sklearn library [37]. The predicted class probabilities of the 30% testing data
was found on this trained model. The predicted probabilities were tested against ground truth
to get the AUC values and ROC curves.
3. SD: Three models were trained on 4538 users using LIWC, Topics and Usr2Vec feature re-
spectively. The classification algorithm used was Random Forest wherein number of trees was
determined using gridsearchCV, all other hyper-parameters were kept as the default values
mentioned in sklearn library [37]. The predicted class probabilities of the 30% testing data
was found on this trained model.The predicted probabilities were tested against ground truth
to get the AUC values and ROC curves.
4.2.2 Combined Sources
The following combination of data sources were used to determine the prediction performance on all
three features namely LIWC, Topics and Usr2Vec.
1. CES-D and N7: A new feature table was created using:
• the predicted class probabilities of the 30% testing data obtained from the model trained
on N7.
• the predicted class probabilities of the 30% testing data obtained from the model trained
on 70% CES-D training data.

CHAPTER 4. EXPERIMENTS 25
In the next step a Random Forest Classifier wherein number of trees was determined using
gridsearchCV, all other hyper-parameters were kept as the default values mentioned in sklearn
library [37] was trained on these new features, and the predicted values were tested against a
ground truth of the 30% testing data to report the AUC values and infer the ROC curve.
2. CES-D and SD: A new feature table was created using:
• the predicted class probabilities of the 30% testing data obtained from the model trained
on SD.
• the predicted class probabilities of the 30% testing data obtained from the model trained
on 70% CES-D training data.
In the next step a Random Forest Classifier wherein number of trees was determined using
gridsearchCV, all other hyper-parameters were kept as the default values mentioned in sklearn
library [37] was trained on these new features, and the predicted values were tested against a
ground truth of the 30% testing data to report the AUC values and infer the ROC curve.
3. SD and N7: A new feature table was created using:
• the predicted class probabilities of the 30% testing data obtained from the model trained
on SD.
• the predicted class probabilities of the 30% testing data obtained from the model trained
on N7.
In the next step a Random Forest Classifier wherein number of trees was determined using
gridsearchCV, all other hyper-parameters were kept as the default values mentioned in sklearn
library [37] was trained on these new features, and the predicted values were tested against a
ground truth of the 30% testing data to report the AUC values and infer the ROC curve.
4. CES-D and N7 and SD: A new feature table was created using:
• the predicted class probabilities of the 30% testing data obtained from the model trained
on N7.
CHAPTER 4. EXPERIMENTS 26
• the predicted class probabilities of the 30% testing data obtained from the model trained
on SD.
• the predicted class probabilities of the 30% testing data obtained from the model trained
on 70% CES-D training data.
In the next step a Random Forest Classifier wherein number of trees was determined using
gridsearchCV, all other hyper-parameters were kept as the default values mentioned in sklearn
library [37] was trained on these new features, and the predicted values were tested against a
ground truth of the 30% testing data to report the AUC values and infer the ROC curve.
The aim for the above set was to determine how do weak labels N7 and SD aid in predicting
strong label CES-D (since it is a clinical measure for understanding depression).

Chapter 5
Results and Analysis
5.1 Cross Validation Results
The 10 fold stratified data from CES-D users was predicted on multiple data sources and their linear
ensembles using the three linguistic features: LIWC, Topics and Usr2Vec and the AUC-ROC values
were recorded (Table 5.1).
Model Trained on LIWC Topic Usr2vecSD 0.55 0.56 0.57
CESD (718 users) 0.588 0.62 0.60N7 0.62 0.637 0.55
SD+N7 0.58 0.57 0.58CESD+SD 0.695 0.70 0.71
CESD+N7+SD 0.698 0.705 0.70CESD+N7 0.71 0.69 0.74
Table 5.1: Area Under the Curve for Prediction on 718 CES-D users using 10 fold Cross Validation
To establish the statistical significance of the models, Wilcoxon Signed Rank Test was used. The
combined model of CESD and N7 and source only model on N7 (which had the highest AUC value)
was established to be to be significantly more accurate than the other models. The ROC curves
obtained are reported below:
27

CHAPTER 5. RESULTS AND ANALYSIS 28
Figure 5.1: ROC curve for 10-fold Cross Validated using Random Forest Classifier for depressionsample using LIWC
The 10-fold Cross Validation experiment was conducted using LIWC feature(Figure 5.1). We
achieved an AUC of 0.63 with N7 data extracted from MyPersonality Test, CES-D and Self Declared
data reported an AUC of 0.59 and 0.55 respectively.

CHAPTER 5. RESULTS AND ANALYSIS 29
Figure 5.2: ROC curve for 10 fold Cross Validated using Random Forest Classifier for depressionsample using Topics
The 10-fold Cross Validation experiment was conducted using Topics feature (Figure 5.2). We
achieved an AUC of 0.64 with N7 data extracted from MyPersonality Test, CES-D and Self Declared
data reported an AUC of 0.63 and 0.56 respectively.

CHAPTER 5. RESULTS AND ANALYSIS 30
Figure 5.3: ROC curve for 10 fold Cross Validated using Random Forest Classifier for depressionsample using Usr2vec
The 10-fold Cross Validation experiment was conducted using Usr2Vec feature (Figure 5.3). We
achieved an AUC of 0.61 with models trained on CES-D data, Self Declared and N7 data reported
an AUC of 0.57 and 0.56 respectively.

CHAPTER 5. RESULTS AND ANALYSIS 31
5.2 Out of Sample Predictions
The held-out data from CES-D users (30% of the total data) was predicted on multiple data sources
and their linear ensembles using the three linguistic features: LIWC, Topics and Usr2Vec and the
AUC-ROC values were recorded (Table 5.2).
Model Trained on LIWC Topic Usr2vec
SD 0.526 0.553 0.562
CESD (500 users) 0.586 0.616 0.628
N7 0.635 0.608 0.509
CESD+SD 0.560 0.592 0.595
SD+N7 0.590 0.601 0.555
CESD+N7+SD 0.601 0.619 0.600
CESD+N7 0.628 0.634 0.603
Table 5.2: Area Under Curve for Out of Sample Prediction on 218 CES-D users:
To establish the statistical significance of the models, Wilcoxon Signed Rank Test was used. The
combined model of CESD and N7 and source only model on N7 which had the highest AUC value
was established to be significantly more accurate than the other models. The ROC curves obtained
are reported below:
CHAPTER 5. RESULTS AND ANALYSIS 32
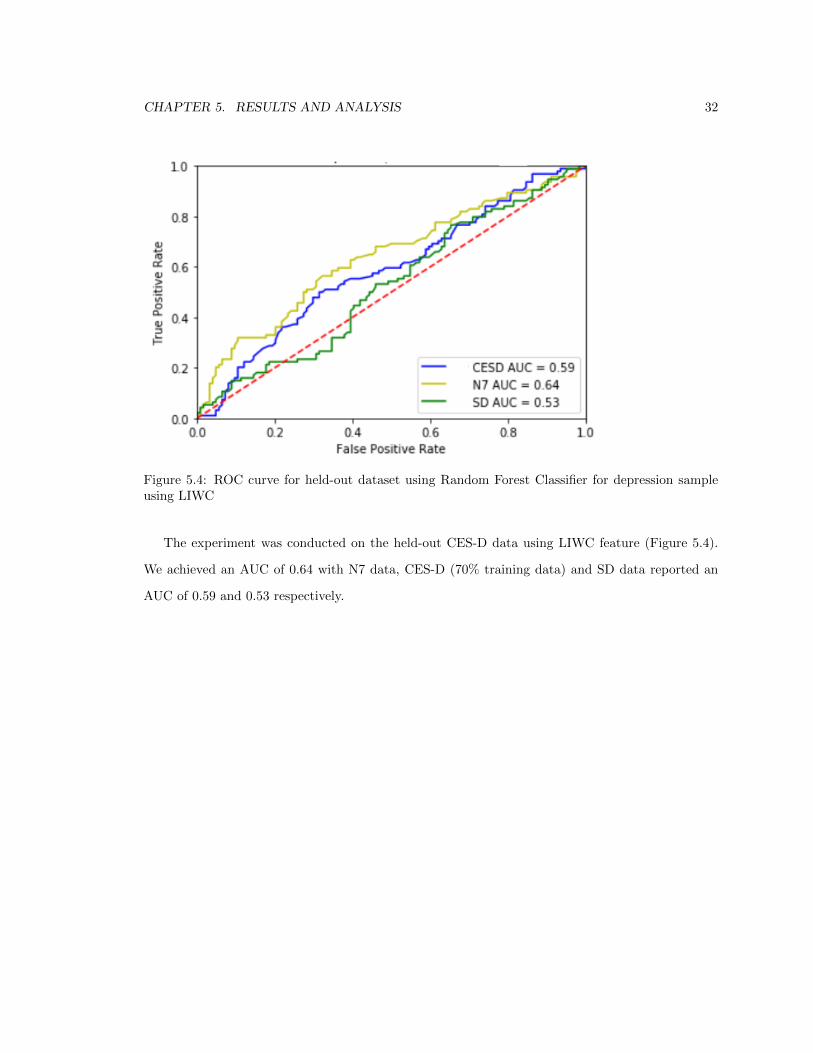
Figure 5.4: ROC curve for held-out dataset using Random Forest Classifier for depression sampleusing LIWC
The experiment was conducted on the held-out CES-D data using LIWC feature (Figure 5.4).
We achieved an AUC of 0.64 with N7 data, CES-D (70% training data) and SD data reported an
AUC of 0.59 and 0.53 respectively.

CHAPTER 5. RESULTS AND ANALYSIS 33
Figure 5.5: ROC curve for held-out dataset using Random Forest Classifier for depression sampleusing Topics
The experiment was conducted on the held-out CES-D data using Topics feature (Figure 5.5).
We achieved an AUC of 0.62 with models trained on CES-D (70% training data), N7 and SD data
reported an AUC of 0.61 and 0.55 respectively.

CHAPTER 5. RESULTS AND ANALYSIS 34
Figure 5.6: ROC curve for held-out dataset using Random Forest Classifier for depression sampleusing Usr2vec
The experiment was conducted on the held-out CES-D data using Usr2Vec feature (Figure 5.6).
We achieved an AUC of 0.63 with models trained on CES-D (70% training data), N7 and SD data
reported an AUC of 0.51 and 0.56 respectively.

CHAPTER 5. RESULTS AND ANALYSIS 35
Table 5.3: Word Clouds likely to be posted by Depressed users Vs Non-depressed users on differentdata sources
Data Source Depressed User Not-Depressed User
CES-D
SD
N7
Table 5.3 presents examples of Topic Wordclouds generated from different data sources to help
visualise words that correlated with Depressed and Non-Depressed Users. The wordclouds docu-
mented above are aimed at elucidating the different topics that each data source captures.

CHAPTER 5. RESULTS AND ANALYSIS 36
5.3 Discussion
We mined three forms of data: Self-Declared tweets from Twitter, Facebook Data of users who took
the MyPersonality test and Facebook data of users who took the CES-D test. We implemented the
transfer learning methods discussed by Hal Daume’III and Daniel Marcu in their study of Domain
Adaptation techniques[26] and trained two sets of models - one using the source domain only and
the other using the predictions from the source domain as an additional feature to train the data
from the target domain.
Two sets of experiments were conducted, one with 10 fold cross validation and the other with
the held-out dataset. The best cross validation model (CES-D+N7 using the LIWC feature and
CES-D+SD using the Usr2Vec feature) reported an AUC of ∼ 0.7 and the best held-out model (N7
using LIWC feature) reported an AUC of ∼ 0.63. On comparing these chosen models with the other
models using Wilcoxon Signed Rank Test, the p-value reported was < 0.05,thereby concluding the
statistical significance of the predictive models.
Chapter 6
Conclusion And Future Work
CES-D is a clinically validated measure of depression but the dataset is limited. N7 and self-declared
data are more easily procurable but are considered to be weak features. Hence, the focus of this
study was to adapt weak features to predict CES-D scores.
We observed the following:
1. On a held-out dataset, the model trained on data only from N7 to predict CES-D, i.e, with
no training data from CES-D shows equal accuracy as that of a model built on training data
from CES-D.
2. Wilcoxon Signed Rank Test between the model trained on CES-D and the model trained on
N7 reported p < 0.05 and hence the null hypothesis (i.e. the difference in AUC values is due
to random chance) was rejected, establishing the significant statistical difference between the
two models.
3. On comparing the 10 fold Cross Validation results, our model out-performs the current state
of art models based on surveys.
4. Due to the difference between the language on Twitter and Facebook, the model trained on
self-declared data does not generalize well on Facebook.
37

CHAPTER 6. CONCLUSION AND FUTURE WORK 38
For future work, we plan to obtain more clinically validated samples of depressed users from
CES-D survey and test the model performances with this increased target domain data. Techniques
to generalize language features from Twitter on Facebook should also be explored. We also plan
to explore predictive powers of other language features such as n-grams and LabMT to classify
depression.

Bibliography
[1] Murray CJ, Lopez AD., World Health Organization. The global burden of disease: a compre-
hensive assessment of mortality and disability from diseases, injuries, and risk factors in 1990
and projected to 2020: summary
[2] Kanter, J. W., Busch, A. M., Weeks, C. E., & Landes, S. J. (2008). The Nature of Clinical
Depression: Symptoms, Syndromes, and Behavior Analysis. The Behavior Analyst, 31(1), 1 - 21.
[3] Navrady LB, Ritchie SJ, Chan SWY, et al. Intelligence and neuroticism in relation to depression
and psychological distress: Evidence from two large population cohorts. European Psychiatry.
2017;43:58-65. doi:10.1016/j.eurpsy.2016.12.012.
[4] Lima, N. N. R., do Nascimento, V. B., de Carvalho, S. M. F., de Abreu, L. C., Neto, M. L. R.,
Brasil, A. Q., Reis, A. O. A. (2013). Childhood depression: a systematic review. Neuropsychiatric
Disease and Treatment, 9, 1417 - 1425.
[5] Sozeri-Varma, G. (2012). Depression in the Elderly: Clinical Features and Risk Factors. Aging
and Disease, 3(6), 465 - 471
[6] Beck AT, Alford BA. Depression: Causes and treatment. University of Pennsylvania Press; 2009
Feb 25
[7] Herman JP, Figueiredo H, Mueller NK, Ulrich-Lai Y, Ostrander MM, Choi DC, Cullinan WE.
Central mechanisms of stress integration: hierarchical circuitry controlling hypothalamopitu-
itaryadrenocortical responsiveness. Frontiers in neuroendocrinology. 2003 Jul 1;24(3):151-80
39

BIBLIOGRAPHY 40
[8] American Psychiatric Association. Diagnostic and statistical manual of mental disorders (DSM-
5) .American Psychiatric Pub; 2013 May 22.
[9] World Health Organization. International statistical classification of diseases and related health
problems. World Health Organization; 2004.
[10] van Rijswijk E, van Hout H, van de Lisdonk E, Zitman F, van Weel C. Barriers in recognising,
diagnosing and managing depressive and anxiety disorders as experienced by Family Physicians;
a focus group study. BMC Family Practice. 2009 Dec;10(1):52
[11] Maurer DM. Screening for Depression. Am Fam Physician. 2012 Jan 15;85(2): 139-44.
[12] Gemma Vilagut, Carlos G Forero, Gabriela Barbagaglia, Jordi Alonso. Screening for De-
pression in the General Population with the Center for Epidemiologic Studies Depression
(CES-D): A Systematic Review with Meta-Analysis. PLOS one : May 2016. Available at
https://doi.org/10.1371/journal.pone.0155431
[13] Hankins M. The reliability of the twelve-item general health questionnaire (GHQ-12) under
realistic assumptions. BMC Public Health. 2008;8:355. doi:10.1186/1471-2458-8-355.
[14] Robert J. Craig (2010) Overview and Current Status of the Millon Clinical Multiaxial Inventory,
Journal of Personality Assessment, 72:3, 390-406.
[15] Taylor D, Paton C, Kapur S. The Maudsley prescribing guidelines in psychiatry. John Wiley &
Sons; 2015 Feb 23.
[16] De Choudhury M, Gamon M, Counts S, Horvitz E: Predicting depression via social media. In
Proceedings of the 7th International AAAI Conference on Weblogs and Social Media. 2013
[17] Reece AG, Reagan AJ, Lix KLM, Dodds PS, Danforth CM, Langer EJ: Forecasting the Onset
and Course of Mental Illness with Twitter Data. 2016 arXiv:1608.07740.
[18] Coppersmith G, Dredze M, Harman C, Hollingshead K, Mitchell M: CLPsych 2015 shared
task: depression and PTSD on Twitter. In Proceedings of the 2nd Workshop on Computational
Linguistics and Clinical Psychology: From Linguistic Signal to Clinical Reality. 2015, June 5:31-
39.
BIBLIOGRAPHY 41
[19] Glen Coppersmith, Mark Dredze, and Craig Harman. 2014a. Quantifying mental health signals
in Twitter. In Proceedings of the ACL Workshop on Computational Linguistics and Clinical
Psychology
[20] Philip Resnik, William Armstrong, Leonardo Claudino, Thang Nguyen, Viet-An Nguyen, and
Jordan BoydGraber. 2015. The University of Maryland CLPsych 2015 shared task system. In
Proceedings of the Workshop on Computational Linguistics and Clinical Psychology: From Lin-
guistic Signal to Clinical Reality, Denver, Colorado, USA, June. North American Chapter of the
Association for Computational Linguistics
[21] Daniel Preotiuc-Pietro, Maarten Sap, H. Andrew Schwartz Schwartz, and Lyle Ungar. 2015.
Mental illness detection at the World Well-Being Project for the CLPsych 2015 shared task.
In Proceedings of the Workshop on Computational Linguistics and Clinical Psychology: From
Linguistic Signal to Clinical Reality, Denver, Colorado, USA, June. North American Chapter of
the Association for Computational Linguistics
[22] Pedersen T: Screening Twitter users for depression and PTSD with lexical decision lists. In
Proceedings of the Workshop on Computational Linguistics and Clinical Psychology: From Lin-
guistic Signal to Clinical Reality. 2015.
[23] Bagroy S, Kumaraguru P, De Choudhury M: A social media based index of mental well-being in
college campuses. In Proceedings of the 2017 CHI Conference on Human Factors in Computing
Systems. 2017.
[24] Mowery DL, Bryan C, Conway M: Towards developing an annotation scheme for depressive
disorder symptoms: a preliminary study using Twitter data. In Proceedings of 2nd Workshop
on Computational Linguistics and Clinical PsychologyFrom Linguistic Signal to Clinical Reality.
2015:89-99.
[25] Rieman, Daniel and Jaidka, Kokil and Schwartz, H. Andrew and Ungar, Lyle Domain
Adaptation from User-level Facebook Models to County-level Twitter Predictions Proceed-
ings of the Eighth International Joint Conference on Natural Language Processing (Vol-
ume 1: Long Papers) Asian Federation of Natural Language Processing Taipei, Taiwan

BIBLIOGRAPHY 42
http://aclweb.org/anthology/I17-1077 764–773, 2017.
[26] Hal Daume’III and Daniel Marcu. 2006. Domain adaptation for statistical classifiers. Journal
of Artificial Intelligence Research, 26
[27] Radloff LS. The CES-D scale: a self-report depression scale for research in the general popula-
tion. Applied Psychological Measurement. 1977;1:385-401
[28] Eaton WW, Muntaner C, Smith C, Tien A, Ybarra M. Center for Epidemiologic Studies De-
pression Scale: Review and revision (CESD and CESD-R). In: Maruish ME, ed. The Use of
Psychological Testing for Treatment Planning and Outcomes Assessment. 3rd ed. Mahwah, NJ:
Lawrence Erlbaum; 2004:363-377.
[29] Hunter, W. M., Cox, C. E., Teagle, S., Johnson, R. M., Mathew, R., Knight, E. D., &
Leeb, R.T. (2003). Measures for Assessment of Functioning and Outcomes in Longitudinal Re-
search on Child Abuse. Volume 1: Early Childhood. Accessible at the LONGSCAN web site
(http://www.iprc.unc.edu/longscan/)
[30] Hunter, W.M., Cox, C.E., Teagle, S., Johnson, R.M., Mathew, R., Knight, E.D., Leeb, R.T.,
& Smith, J.B. (2003). Measures for Assessment of Functioning and Outcomes in Longitudinal
Research on Child Abuse. Volume 2: Middle Childhood. Accessible at the LONGSCAN web site
(http://www.iprc.unc.edu/longscan/)
[31] Lewis R Goldberg. 1999. A broad-bandwidth, public domain, personality inventory measuring
the lowerlevel facets of several five-factor models. Personality psychology in Europe, 7:728
[32] http://ipip.ori.org/index.htm
[33] Pennebaker JW, Booth RJ, Francis ME: Linguistic Inquiry and Word Count: LIWC [Computer
Software]. Austin, TX: liwc. net; 2007.
[34] Pennebaker, J.W., Boyd, R.L., Jordan, K., & Blackburn, K. (2015). The development and
psychometric properties of LIWC2015. Austin, TX: University of Texas at Austin
[35] http://wiki.wwbp.org/pmwiki.php/Tutorials/DLA
BIBLIOGRAPHY 43
[36] Silvio Amir and Glen Coppersmith and Paula Carvalho and Mario J. Silva and Byron C.
Wallace Quantifying Mental Health from Social Media with Neural User Embeddings CoRR
abs/1705.00335, 2017
[37] Pedregosa, F. and Varoquaux, G. and Gramfort, A. and Michel, V. and Thirion, B. and Grisel,
O. and Blondel, M. and Prettenhofer, P. and Weiss, R. and Dubourg, V. and Vanderplas, J.
and Passos, A. and Cournapeau, D. and Brucher, M. and Perrot, M. and Duchesnay, E. ”Scikit-
learn: Machine Learning in Python”, Journal of Machine Learning Research volume 12, pages
2825–2830, 2011