Embed Size (px)
Citation preview
Water Footprint of Germany
Where does the water for our food come from?
2
Table of Content
SUMMARY............................................................................................................................................................ 3
1 INTRODUCTION .............................................................................................................................................. 6
1.1 VIRTUAL WATER AND THE WATER FOOTPRINT............................................................................................... 6 1.2 AIM OF THIS STUDY ....................................................................................................................................... 7
2 METHODS.......................................................................................................................................................... 9
3 GERMANYS WATER FOOTPRINT ............................................................................................................ 11
3.1 TOTAL WATER FOOTPRINT ........................................................................................................................... 11 3.1.1 Germanys external water footprint ..................................................................................................... 13
3.2 CRITICAL PRODUCTS .................................................................................................................................... 15 3.3. GLOBAL WAYS OF THE (VIRTUAL) WATER .................................................................................................. 18
3.3.1 Brazil................................................................................................................................................... 18 3.3.2 India .................................................................................................................................................... 19 3.3.3 Kenya .................................................................................................................................................. 20 3.3.4 Spain ................................................................................................................................................... 22 3.3.5 Turkey ................................................................................................................................................. 24
4. ENVIRONMENTAL RELEVANCE OF WATER RESOURCES PROTECTION ................................. 26
5. SOLUTIONS AND RECOMMENDATIONS............................................................................................... 29
5.1 RECOMMENDATIONS FOR GOVERNMENTS.................................................................................................... 29 5.2 RECOMMENDATIONS FOR COMPANIES ......................................................................................................... 30 5.3 RECOMMENDATIONS FOR CONSUMERS........................................................................................................ 31 5.4. OUTLOOK ................................................................................................................................................... 31
REFERENCES .................................................................................................................................................... 32

3
Summary Calculation of the water footprint
In the past years the water use in German households as well as in the industrial sector has
declined constantly. This trend is very welcome and has to be encouraged in the future. But
this amount of water only represents a small portion of the water we use on a daily basis. A
considerably higher portion is hidden in our food, clothes and other products that we use or
consume in our everyday life, namely as so called virtual water. In combination with the
information regarding the source of this water and the consequences of its extraction or
consumption, we simplified speak about the water footprint. Until now, only estimations
existed on the water footprint of Germany. WWF’s goal for this study was therefore to
analyse the water footprint of Germany, with an emphasis on agricultural products, their
origin and the producing countries. The analysis of the vast data set is in the context of this
study also the basis for recommendations for governments and companies to reduce the
ecological, social and economical consequences of the water footprint.
Based on international trade data for vegetable and livestock products per country and their
respective climatic conditions, the content of virtual water was calculated. The sum of all
products produced and consumed within Germany as well as those imported from other
countries makes the agricultural water footprint of Germany. Together with the use in
households, business and industry it results in a total water footprint of 159.5 cubic kilometres
of water per year. With a population of currently 82.2 million, each citizen consumes 5,288
litres of water each day, and only a small portion of it for drinking, cooking or other
household activities.
The biggest amount of this water is hidden in the food or products that are consumed each
day. About half of the German agricultural water footprint is made up by imported products
or food. That means that by importing those goods, water in virtual form was also imported
from the producing countries. Germany has thereby left its water footprint in those countries.
The imported goods with the highest water footprint are - in descending order - coffee, cocoa,
oilseeds, cotton, pork, soybeans, beef, milk, nuts and sunflowers. The biggest water footprint
of Germany is left in Brazil, Ivory Coast, France, the Netherlands, the USA, Indonesia, in
Ghana, India, Turkey and Denmark respectively, also in descending order.
The external water footprint of Germany worldwide
The impacts are depending on regional climatic conditions and production technologies,
especially in the still further expanding irrigation agriculture. Exemplary for the impacts
during the production of special goods, the cotton and rice production in different countries
around the world are discussed.
In the producing countries different production standards are applied under the respective
climatic, demographic and economic conditions. Exemplary, five countries are represented,
where the export of virtual water – at least in certain regions – has negative consequences for
the natural ecosystems as well as on the social and economic sectors:
• Brazil: Although Brazil is generally a water-rich country, it has nevertheless a huge problem regarding its water resources, especially water pollution and its consequences;
• India: The Indian agricultural sector is fundamentally influenced by cotton production,
which is irrigated in the northern states, and therefore has severe impact on the river
catchments and the environment. The enormous weaknesses in water management also
lead to extensive social and economical problems for a growing population in the country.

4
• Kenya: Similarly high population growth and intensifying agriculture together with a
weak or non-existing institutional structure for a sustainable water management determine
the situation in Kenya, which additionally has to cope with high deforestation. Especially
the threats for the Mau forest as the headwater region of the Mara River at the
downstream spreading irrigation agriculture pose a threat for the annual migration in the
Serengeti and the Masai Mara.
• Spain and Turkey: The situation of the EU member state Spain and the candidate
country Turkey are quite similar with regard to their cultivation conditions. While Spain
has shown a clear reversal of trend in irrigation agriculture towards more efficient
technologies, over 90 percent of the land under irrigation in Turkey are still flooded. The
connections to the European market, where Germany is one of the most important trading
partners, are present in both countries, for Spain as an EU member state and Turkey up to
now as candidate country. Especially serious damage derives in both countries from
illegal water abstraction, which is punished only insufficiently by the public authorities
and which is neither sanctioned nor punished.
Altogether, the climatic conditions as well as the soil characteristics define, which crops can
be cultivated and thereby also narrow the selection in Middle Europe to those crops adapted to
the climatic conditions there. Under these prerequisites, there is usually only one harvest
possible for crops, compared to often all year round possible cultivation cycles in climatic
more favourable regions in the tropics and subtropics. For the production of agricultural
goods in those countries are not the climatic conditions like seasons and temperature changes
restricting for cultivation like it is in Middle Europe, but the availability of and the secure
access to water. To eliminate these restrictions, the fields are more often irrigated – but at the
expense of the natural water household and nature, and it also raises the competition with
other water users.
Recommendations of WWF and outlook The German external water footprint is in absolute as well as in relative terms quite high.
Therefore stakeholders in Germany but also in the producing countries have a special global
responsibility, which we should meet. At the moment, this is directed firstly to the
governments and the companies, and only secondly the consumers, since until now only little
possibilities exist to reduce the personal water footprint by purposeful consumption.
In the most important production countries of the products imported to Germany with a high
water footprint, the governments should guarantee an efficient and legal irrigation of the
agricultural products by using incentives, but also sanctions and punishments. The allocation
of the water resources for agriculture and industry, especially the blue groundwater and
surface water, must not result in rivers, aquifers or freshwater ecosystems not getting
sufficient amounts or qualities of water any more.
The German government should raise the financial means in development co-operation where
improvements in the sustainable management of aquifers are aspired as well as in river
catchment areas, especially in water-scarce regions, where water mismanagement is practised.
At the European level, the consistent implementation of the EU Water Framework Directive
for rivers and aquifers should be demanded – especially in the Mediterranean countries of
Spain, Italy and Greece, but also in the EU candidate country Turkey as well as other riparian
countries. Agricultural subsidies of the EU should only be paid in the case of proven
responsible utilisation of the water resources.

5
Companies should measure and document their water footprint along their whole supply chain
in order to better understand the risks connected to it. They also must reduce the impacts
especially in current or future water-scarce regions and have to support together with other
companies a more efficient and more sustainable water resources management, which also
gives the local communities access to water and at the same time secures ecological flows.
Also, the companies should engage for the development of water standards for products,
which allow the consumers to choose between products with a high or low footprint in critical
regions.
WWF works in some of the most important transition and developing countries where many
of the products Germany imports come from (for example Brazil and India), as well as in
Europe (e.g. Spain, Turkey) and the USA on the development of a more efficient water use in
agriculture. Furthermore, WWF actively engages together with companies on the
development of global water standards for products, the development of business and risk
strategies for the use of the water footprint an also in the respective countries in the
implementation of these concepts by the suppliers and exporters.
The water consumption and the demands we have on groundwater bodies and river systems
will dramatically grow in the near future. Fundamental factors are the growing world
population and the guarantee of their food security as well as economic growth and therefore
a change in consumption patterns. In China for example more and more virtual water was
used in the last 50 years for the feeding of its population, because with growing wealth the
consumption of meat also rose [36]. Therefore it is more pressing that governments,
businesses and consumers accept their responsibility now and invest in a better and more
sustainable water management for the sake of the local population as well as the ecosystems
depending on the water and their future services valuable also for people.
Bild Fruit and vegetable market in Turkey. ©WWF

6
1 Introduction
The understanding that we have to economise the use of the resource water established itself
in the German households as well as in the industry. In both fields the water use has
continuously decreased in the last decades. While households used 144 litres of water per
capita each day in 1991, in 2007 about 124 litres were sufficient on average [1]. In the
industrial sector great amounts of water can also be saved thanks to technical innovations and
the operation of water cycles [2].
This trend is very welcome and has to be encouraged in the future. But unfortunately, this
amount of water only represents a very small portion of what we really use each day. The real
per capita water use worldwide ranges between 1.918 (China) and 6.795 (USA) litres per day,
the global average amounts to 3.397 litres [3]. Germany’s water use lies clearly in the upper
area of this margin. We are not aware of this enormous amount of water because the biggest
part of it is hidden in our food, clothes and other products that we use and consume in our
everyday live – as so called virtual water.
1.1 Virtual water and the water footprint
Virtual water is defined as the total amount of water that is used or polluted during the
manufacturing process of a product, or that evaporates along the way. For the calculation of
the virtual water content of a certain product, each step in the manufacturing process is
included.
A kilogram of beef for example stands for 15.500 litres of virtual water. This sum comes
about as follows: it usually takes three years till the cattle are ready for the slaughter and
provides about 200 kilogram of boneless meat. During this space of time, it consumes almost
1,300 kilogram of grain and 7,200 kilogram of roughages like hay or silage. Added to that are
24 cubic meters of drinking water and another 7 cubic meters of water for the cleaning of the
cots and others. Converted to a kilogram this means that each kilogram of beef contains 6.5
kilogram of grain, 36 kilogram of roughages and 155 litres of water. For the production of the
fodder alone already 15.300 litres of water are needed. And this calculation does not include
the water quantity that may be polluted during the upbringing of the cattle or during the
production of the fodder plants [4].
The concept of virtual water was developed by the British scientist John Anthony Allan, who
developed it in the 1990ies as a tool to find new solutions for water scarcity and impending
conflicts in the Middle East [4]. To acknowledge the significance of this concept for trade and
policy, Allan was honoured with the Stockholm Water Prize in 2008.
Virtual water consists of three components: green, blue and grey virtual water.
Green virtual water is the quantity of rainwater that is stored in the soil and will be taken up
by the plants during their growth.
Blue virtual water characterises for industrial products and domestic water supply the
amount of groundwater or water from lakes and rivers that is used for the production of a
certain good but cannot be reverted afterwards. In agriculture, those water quantities are
defined as blue water that are used for irrigation and are either taken up by the plants or
evaporate. But also the water that evaporates from the irrigation canals or artificial storage
reservoirs without reaching the fields are counted as blue water.
7
Grey virtual water is the water quantity that is directly polluted during the manufacturing
process of a product and therefor cannot be used any more, or which is theoretically necessary
to dilute polluted water to such an extend that agreed water quality standards are met again
[5].
From an ecological point of view it is usually preferable if products contain more green water
than blue one. Blue water is taken from surface or groundwater and therefore is no longer
available in the natural water cycle. We already use 40 to 50 percent of the available blue
water [6], with an upward trend. Especially in agriculture incentives are missing that would
lead to an economical use of blue water. Water prices are subsidised in many countries so that
the real costs are not passed on to the farmers. Often no water meters are installed at the water
extraction points so that the real amount of water used cannot be established or even
documented. Because of non-existent sanctions and appropriate punishment there is no
effective penalty of the culprits or an out of it resulting learning effect: to manage more water
efficient. “Water offences” are often regarded only as trifling offences by authorities and
institutions. Here exists great need for action for the political decision-makers to eliminate
such shortcomings on the one hand and establish effective controls on the other hand.
The water footprint (WF) is a further development of the virtual water concept by the Dutch
scientist Arjen Y. Hoekstra. It informs how much water is consumed by the use of a product
or service. By the estimation of the water footprint not only the level of the water
consumption can be calculated, but also in which country this water was invested to produce
these goods. So the water footprint has in contrast to the virtual water content also a
geographic component.
The water footprint can be calculated for single persons, companies or countries and even for
whole continents. It is an indicator, which considers the direct as well as the indirect water
consumption of a consumer or producer and gives information about the region from which
the virtual water contained in this product was taken.
To distinguish the virtual water content of a product from its water footprint, one has to notice
that the amount of virtual water states the quantity that is used during the production of this
good. The water footprint on the other hand shows how much water is lost by the
consumption of this good as well as the origin of this water.
1.2 Aim of this study
This study intends to present the concept of virtual water and the water footprint to broad
public attention. Since Germany imports a certain amount of the water consumed in everyday
life, it is important to know which countries are affected by this virtual water trade and which
products have the greatest water consumption. Conclusions of a number of studies show that
the impacts of global trade on regional water systems are at least as severe as the
consequences of climate change [7].
For WWF, the concept of the water footprint is an important instrument, which can promote
the awareness about our water consumption and also help to reduce the water consumption
and the connected negative consequences.
It is not the goal that companies or whole countries reduce their consumption per se. It is
rather important that the reduction takes place where high virtual water consumption has the

8
strongest negative consequences for people and nature. Therefore, this study does not only
want to inform about where Germany leaves its water footprint and which consequences
derive from that. Companies and governments should be addressed with this report to develop
measures that implement the virtual water concept in the field in order to effectively reduce
the water consumption and at the same time reduce the impacts of their actions in other
countries.

9
2 Methods Germany is a relative water-rich country and, in contrast to many developing and transition
countries, relatively exemplary in the European context regarding the law making and
implementation on the management of water catchment areas and aquifers. If nothing else,
this is thanks to the requirements to implement the European Water Framework Directive.
The focus of this study therefore was placed explicitly on imported goods, their virtual water
content and the connected possible consequences. The high water footprint values of goods
produced and consumed in Germany in contrast are not further analysed within this study.
Germany imports a variety of products like meat, grain, tea, cotton and sugar from all parts of
the world. To calculate the water footprint Germany leaves outside its borders, the water
requirements of all agricultural products imported to Germany were analysed, based on the
international trade data from PC-TAS of the International Trade Center for the years 2004-
2006. Altogether, 503 crop and 141 livestock products were taken into account. The water
footprint of a crop derives from the ratio of the water amount used for the production and the
yield of this product. The used water quantity includes the evaporated water as well as the
amount that was polluted during production and therefore cannot be used any longer.
The estimation of the water footprint of industrial goods is more difficult since a certain
product often contains different raw material and needs numerous manufacturing processes.
Based on the currently best available methods, a crude assessment of the industrial water
footprint of Germany was made (see table 1, cf. [3]). The industrial footprint also includes
products whose water footprint is based on their respective industrial value. The methods for
the calculation of the industrial component of the water footprint still need improvement to
better integrate them into the total water footprint. But this was not possible in the scope of
this study. Therefore, its focus lies on the agricultural sector.
Further information on the calculation of the water footprint can be found at [3] and [8].

10
Figure 1: Scheme of the components that are taken into account for the calculation of the water footprint.
Figure 1 shows schematically which components make up the water footprint of Germany. On
the one hand there is the direct water consumption that is used in households for cooking,
cleaning and washing. The indirect water consumption is calculated adding the water quantity
used during production that is taken from national water resources (internal water footprint,
IWF) to the water quantity that is used for the production of goods in other countries, which
then are exported to and consumed in Germany (external water footprint, EWF). Direct and
indirect water consumption together make the total water footprint of Germany.
It has to be stated that the calculation of the water footprint Germany leaves in other countries
couldn’t differentiate in which hydrological catchment area the respective products were
cultivated, which would be necessary for the detailed assessment of the actual ecological and
social consequences. The available data therefore only allow general information at first about
the amount of water taken from a certain country as agricultural good. Although it is not
possible to make statements on how for example an especially valuable ecosystem is damaged
by the cultivation of a certain product, the results allow important conclusions and forecasts.
In countries with acute water scarcity and countries with insufficient political and legal
framework concerning the management of water resources as well as insufficient application
of these guidelines, it certainly can be estimated that the virtual water trade has massive
impact on the water resources of this country as well as its ecosystems and population.
Bild Grain harvest in Middle Europe © WWF
Water use in households
(drinking, cooking cleaning,
washing, wastewater)
Water use in Germany to
produce goods consumed in
Germany (= internal WF)
Water use in other countries
to produce goods consumed
in Germany (= external WF).
Direct water use
Indirect water use
Water footrprint of
Germany

11
3 Germanys water footprint 3.1 Total water footprint
The total water footprint of Germany is 159.5 cubic kilometres (km³) or 159.5 billion cubic
meters (m³) per year, whereof almost equal amounts of water are invested within and outside
of Germany for the production of the goods consumed in Germany. That means that Germany
serves only half of its current water consumption from natural resources (see table 1).
As a total, 117.6 km³ are used each year in agriculture, 36.4 km³ for the production of
industrial products and only 5.5 km³ each year are used in households. Converted to the
population this makes a daily water consumption of 5,280 litres per capita – that equals
almost 27 filled bathtubs. Of this water amount, 3,900 litters are consumed as agricultural
goods, 1,200 litres are hidden in industrial products and only 180 litres1 can be related to
everyday life. With the exception of the water used in households, these numbers include the
water quantity consumed within Germany (internal water footprint) as well as the amount of
water that was used for the production of goods for the German market in other countries
(external water footprint).
As mentioned above is the German water footprint for agricultural products 117.6 km3. The
internal water footprint is with 55.7 km³ slightly lower than the external water footprint for
agricultural products of 61.9 km³ (table 1). These quantities are more than the volume of Lake
Constance, Europe’s second largest lake with about 48 km³.
The water for livestock and livestock products originates predominantly from Germany whilst
the water footprint of crop products is mostly left outside of Germany (figure 2).
Table 1: Total water footprint of Germany
Water footprint (km³/yr).
Internal External Total % of
total
Agricultural 55,7 61,9 117,6 73,7%
Industrial products 18,84 17,56 36,4 22,8%
Household water use 5,5 - 5,5 3,4%
Total (km³/yr) 80,0 79,5 159,5 100%
% of total 50% 50% 100%
As one can see in figure3, the water footprint of crop products is mostly shaped by products
that cannot be cultivated in Germany due to the climatic conditions, like cotton, coffee, cocoa
or oilseeds. National water resources are mostly used for the cultivation of wheat, barley and
fodder plants.
Crop products make up 71 percent of the agricultural water footprint of Germany. The
production of livestock products is responsible for 29 percent of the water footprint. The
water consumption in the agricultural sector therefore is clearly influenced by crop
production. But in total, the use of blue water resources in agriculture only make less than 0.1
percent of the direct water consumption in Germany (Quelle??).
1 These 180 litters are calculated from the 2.7 percent water use for public services (UBA ->Quelle) equalling
188 billion km³ divided by the total population of Germany, which is 81.17 million.

12
For one year, the consumption of coffee, tea, bread cotton clothes and other agricultural
products add up to a water quantity of 1.016 m³ per capita.
Only 41.3 percent of the water amount for the production of crop products derives from
national water resources, while the remaining 58.7 percent are imported. With the import of
these goods the national water resources are preserved, but for the sake of the producing
countries.
The consumption of livestock products in Germany mostly is at the expense of national water
resources (figure 4). For pig breeding and milk production, almost equal amounts of water are
used. Beef and poultry production also are important. But with a per capita consumption of
410 m³ each year in form of livestock products, this is 2.5 times less than the water
consumption via crop products.
34,61296794
21,06935313
55,6823210749,17731665
12,74941199
61,92672864
83,79028459
33,81876512
117,6090497
0
20
40
60
80
100
120
140
Crop Livestock Total
Wa
ter
foo
tpri
nt
(Gm
3/
yr)
Internal WF
External WF
Total agricultural WF
Figure 2: Sectioning of the agricultural water footprint Germany
157
0 0
28
89
0 0
54
0
2216
0
11
120 118
71
10
6658
0
25
17
22
0
20
40
60
80
100
120
140
160
Wh
ea
t
Co
ffe
e
Co
coa
be
an
s
Oils
ee
d
oth
ers
Ba
rle
y
Co
tto
n
So
yb
ea
ns
Fe
ed
oth
ers
Nu
ts
Su
ga
r cr
op
Ma
ize
Su
nfl
ow
er
Wa
ter
Fo
otp
rin
t
(m3
/pe
rso
n/y
r)

13
Figure 3: Contribution of crop products to the internal and external water footprint of Germany. Total water
footprint related to crop products = 1.016 m³/person/year.
95 94
46
117
1 1
62
30 32
95
2
15
0
20
40
60
80
100
120
Swine Milk Bovine Poultry Eggs Sheep Livestock
others
Wa
ter
foo
tpri
nt
(m3/p
ers
on
/yr)
Interna l External
Figure 4: Contribution of livestock products to the internal and external water footprint of Germany. Total water
footprint related to livestock products = 410 m³/person/year.
3.1.1 Germanys external water footprint
The calculation of the water footprint of agricultural goods shows that Germany imports a
considerable portion of these products from other countries, especially concerning crop
products (figures 2 and 5). In order to be able to make statements about possible negative
consequences of these virtual water imports for the production countries, the most important
import countries Germany leaves its water footprint in will be presented in the following, as
well as the crucial products.
Table 2 lists the 15 most important production countries whose products make up the greatest
part of the German water footprint of agricultural products. According to that, the greatest
amount of virtual water is imported from Brazil, especially in form of coffee and soy.
Therefore, chapter 3.3.1 gives an overview of the water situation on Brazil and the impacts of
coffee and soy production.
In Ivory Coast and Germanys neighbouring countries France and the Netherlands also great
amounts of water are used for the production of our food.
In table 3, the products are presented that have the greatest share on the external agricultural
water footprint of Germany. A complete overview of all products considered in this study
with their respective internal and external water footprint can be found in the Annex.
The strongest water footprint is made up by the import of coffee and cocoa. The import of
cotton and swine products also embosses the external water footprint of Germany very much.
In chapter 3.2 therefore the ecological consequences of cotton production in the world are
presented, and chapter 3.3.2 gives a short overview of the consequences of cotton production
in India.
Table 2: The 15 most important countries where Germany leaves its external water footprint Country EWF
(Mm³/yr)
% of
EWF
Most important import goods for Germany (EWF in
Mm³/yr)

14
(Mm³/yr)
BRAZIL 5.729 9.25 Coffee (2654) Soybeans (1927) Livestock others (392)
Bovine (310) Poultry (122) Cocoa beans (80) Oranges (56) Cotton (55)
COTE DIVOIRE 4.196 6.78 Cocoa beans (4064) Coffee (65) Bananas (36) Cotton (12) Nuts (9) Oilseed others (7) Coconuts (2) Fruit fresh others
(1)
FRANCE 3.516 5.68 Oilseed others (887) Wheat (422) Barley (407) Maize
(374) Milk (363) Bovine (226) Grapes (189) Swine (189)
NETHERLANDS 2.916 4.71 Swine (1332) Milk (546) Bovine (316) Layer (217)
Poultry (169) Livestock others (99) Oilseed others (92)
Vegetables fresh others (24)
USA 2.758 4.45 Soybeans (1923) Nuts (277) Sunflower (153) Oilseed
others (86) Rice (79) Cotton (76) Groundnuts (36)
Tobacco (23)
INDONESIA 2.634 4.25 Oilseed others (1222) Coffee (771) Coconuts (258) Cotton
(127) Cocoa beans (124) Spices others (58) Tea (31)
Pepper,White/Long/Black (22)
GHANA 2.253 3.64 Cocoa beans (2235) Oilseed others (6) Coffee (4) Cotton
(3) Nuts (2) Fruit fresh others (1) Groundnuts (1) Bananas
(1)
INDIA 2.181 3.52 Cotton (988) Oilseed others (716) Coffee (212) Nuts (106)
Rice (46) Tea (28) Spices others (22) Bovine (13)
TURKEY 1.874 3.03 Cotton (760) Nuts (704) Grapes (193) Tobacco (38)
Apricots (32) Spices others (28) Pulses (24) Apples (19)
DENMARK 1.850 2.99 Swine (1287) Milk (198) Barley (180) Wheat (53) Bovine
(44) Livestock others (22) Poultry (22) Oilseed others (20)
BELGIUM 1.842 2.97 Swine (1409) Milk (127) Bovine (106) Livestock others
(54) Layer (33) Poultry (24) Vegetables fresh others (22)
Wheat (12)
SPAIN 1.827 2.95 Nuts (378) Grapes (369) Swine (327) Bovine (92) Cotton (62) Oranges (56) Peaches and Nectarines (52) Oilseed
others (49)
ITALY 1.737 2.80 Grapes (388) Oilseed others (320) Bovine (248) Rice (120)
Swine (116) Milk (84) Apples (68) Peaches and Nectarines (66)
ARGENTINA 1.504 2.43 Soybeans (599) Sunflower (487) Bovine (165) Groundnuts
(118) Cotton (28) Apples (13) Pears (13) Tea (12)
NIGERIA 1.430 2.31 Cocoa beans (1386) Oilseed others (33) Cotton (4) Nuts
(2) Vegetables fresh others (2) Spices others (1) Coffee (1)
Rest 23,683 38.24
Total 61,930 100%
Table 3: External water footprint of the most important agricultural goods imported to
Germany
Product EWF (Mm³/yr) Share
Locations
Coffee 9913 16%
Brazil (2654) Colombia (1032) Indonesia (771) Peru
(551) Kenya (488) Viet Nam (486)
15
Cocoa beans 9748 16%
Cote Divoire (4064) Ghana (2235) Nigeria (1386)
Cameroon (646) Ecuador (502) Indonesia (124)
Oilseed others 5849 9%
Indonesia (1222) France (887) India (716) Malaysia
(450) Canada (355) Czech Rep (328)
Cotton 5464 9%
India (988) Turkey (760) Pakistan (365) Uzbekistan
(356) Bangladesh (348) China (262)
Swine 5098 8%
Belgium (1409) Netherlands (1332) Denmark (1287)
Spain (327) France (189) Germany (117)
Soybeans 4769 8%
Brazil (1927) USA (1923) Argentina (599) Paraguay
(198) Uruguay (51) Canada (19)
Bovine 2611 4%
Netherlands (316) Brazil (310) Austria (257) Italy
(248) France (226) Argentina (165)
Milk 2512 4%
Netherlands (546) France (363) Austria (199)
Denmark (198) Germany (174) Ireland (158)
Nuts 2077 3%
Turkey (704) Spain (378) Usa,Pr,Usvi (277) Iran (219)
India (106) Italy (60)
Sunflower 1806 3%
Argentina (487) Hungary (250) Ukraine (234) USA
(153) France (150) Russian Fed (132)
Grapes 1484 2%
Italy (388) Spain (369) Turkey (193) France (189)
Greece (58) South Africa (39)
Livestock others 1228 2%
Brazil (392) Togo (191) Hungary (113) Netherlands
(99) Italy (56) Belgium (54)
Coconuts 1094 2%
Philippines (689) Indonesia (258) Papua N.Guin (82)
Mozambique (13) Vanuatu (13) Malaysia (9)
Wheat 937 2%
France (422) Canada (70) Denmark (53) Czech Rep
(44) Russian Fed (43) Hungary (41)
Barley 807 1%
France (407) Denmark (180) Untd Kingdom (62)
Czech Rep (40) Germany (28) Sweden (26)
Poultry 751 1%
Netherlands (169) Brazil (122) France (106) Hungary
(79) Poland (57) Togo (55)
Maize 559 1%
France (374) Hungary (86) Brazil (26) Austria (12)
Italy (11) Belgium (10)
Rice 532 1%
Togo (151) Italy (120) USA (79) Spain (47) India (46)
Pakistan (28)
Others 4692 8%
Total 61930 100%
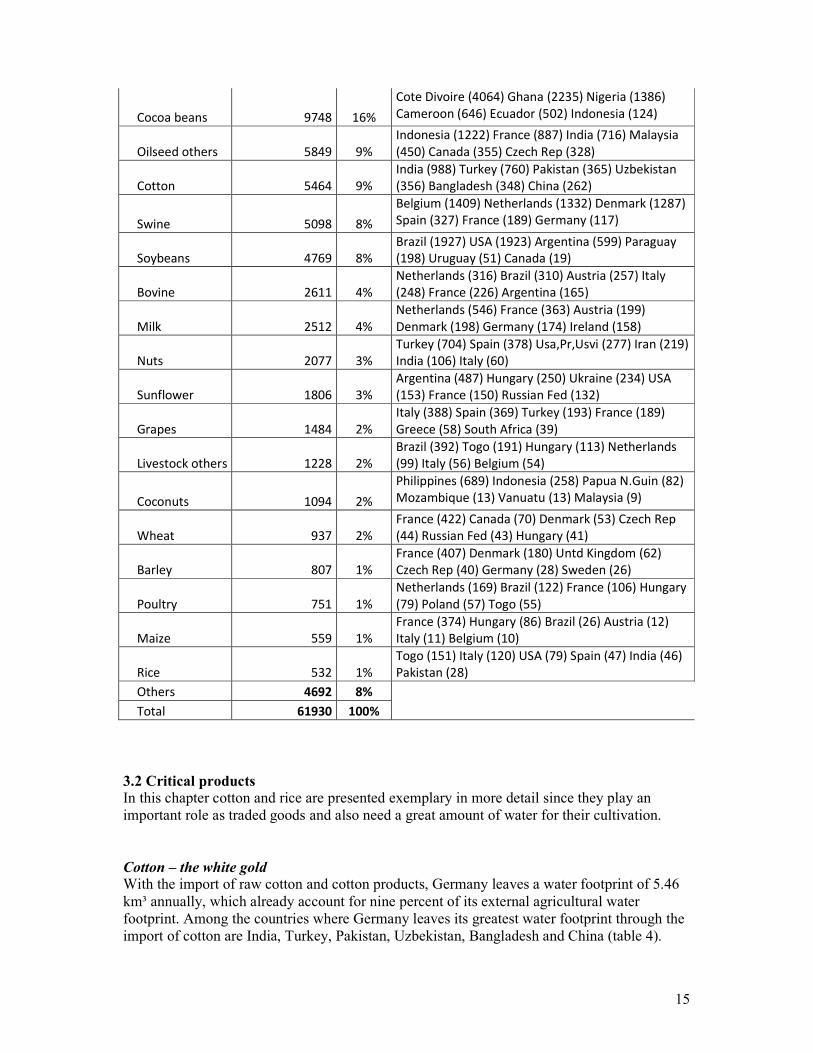
3.2 Critical products
In this chapter cotton and rice are presented exemplary in more detail since they play an
important role as traded goods and also need a great amount of water for their cultivation.
Cotton – the white gold
With the import of raw cotton and cotton products, Germany leaves a water footprint of 5.46
km³ annually, which already account for nine percent of its external agricultural water
footprint. Among the countries where Germany leaves its greatest water footprint through the
import of cotton are India, Turkey, Pakistan, Uzbekistan, Bangladesh and China (table 4).

16
Cotton belongs to the most water intensive cultivated plants. On average, globally about
11,000 litres of water are necessary to produce one kilogram of cotton material. Only 45
percent of this water amount is actually taken up by the plants. An extreme 41 percent are
losses because of irrigation water evaporating from the irrigation channels or from the fields.
On average, 1,540 litres are grey water – that means they are theoretically necessary to dilute
the wastewater polluted by pesticides, fertilizer or chemicals used in cotton processing.
Worldwide, each year about 256 km³ of water are used for cotton cultivation that split up into
42 percent of blue water, 30 percent of green water and 19 percent grey water. About 44
percent of these 256 km³ are used for the production of cotton destined for export. The EU 25
cover its cotton needs mainly (84 percent) outside of Europe, especially in India. Cotton
cultivation uses already 3.5 percent of the water used for crop production. China, USA, India,
Pakistan and Uzbekistan together supply already 70 percent of worldwide cotton production
[9].
Turkey is the seventh biggest cotton growing country in the world with a production volume
of 960,000 tons each year. In the last years production could be increased due to
intensification of cultivation. The areas under cotton cultivation are mostly in the Aegean and
in the south and southwest of Turkey. The biggest problems caused by cotton cultivation are
water pollution by excessive use of pesticides and insecticides. Water consumption is also
very high since the fields are mostly supplied by flood irrigation. Cultivation during the
summer months especially puts a severe strain on the water resources in the cultivation areas.
Pakistan has in the Indus basin alone almost three million hectares under cotton cultivation
that consume 51.43 km³ water each year. The irrigation technique used in Pakistan is very
inefficient so that already 90 to 97 percent of the water amount taken from the Indus is
destined for agriculture. But only on third of this water amount really reaches the fields, the
rest evaporates on the way or seep away because of maroden irrigation channels. For cotton
cultivation in Pakistan, also great amounts of pesticides and fertiliser are used, that severely
strain water quality. Now already 31 percent of the water destined for the irrigation of cotton
fields is taken from groundwater resources [9].
Uzbekistan is a good example to show how the extreme the consequences of cotton
cultivation can be. There, each year 14.6 km³ of water are used for cotton cultivation,
especially blue water. As a consequence of the over-abstraction of the Amu-Darja and the
Syr-Darja, the two tributaries to the Aral Sea, almost no water reached the sea any more.
Consequently, the Aral Sea decreased in the last 40 years about 85 percent, connected with
salinisation and other ecologically harmful processes. Uzbekistan uses about 3 km³ of water
for the production of cotton destined for the EU 25 each year. That means these countries
carry arithmetically a responsibility of 20 percent on the drying up of the Aral Sea [9].
Table 4: The most important import countries for cotton
Country India Turkey Pakistan Uzbekistan Banglades
h
China
EWF
(Mm³/year)
988 760 365 356 348 262
Abb. 5 Figure 5: Global map of the German water footprint for cotton production

17
More than a handful of rice
The import of rice to Germany equals one percent of the external agricultural water footprint
of Germany, but this still is an import of 532 million m³ of virtual water. A look at the
producing countries shows that they have significantly less water available and therefore
strain their natural and water household by the rice cultivation.
In the Indus basin, each year up to 70 million m3 of water are used in rice cultivation.
Worldwide, more than one fifth of the water quantities used for the cultivation for crop
products are used for rice production.
Almost half of the world’s population depends on rice cultivation for their food security
and/or as an important cash crop. Over 90 percent of the annual rice production are produced
and also consumed within Asia. Traditional cultivation techniques need between 3,000 and
5,000 litres in order to gain one kilogram of rice. Worldwide, rice is cultivated on about 154
million hectares. The most important exporting countries are Thailand, Vietnam, China, USA,
Pakistan and India.
On all cultivation areas in Europe, Australia and the USA, rice is produced with the traditional
methods, meaning that the fields are flooded. Therefore, the water need for the cultivation of
rice is worldwide up to five times higher than that for maize and wheat, which are also very
water intensive crops. Globally, rice cultivation consumes 85 percent of the water quantity
applied for irrigation. With a share of 63 percent of artificially irrigated rice fields worldwide,
rice cultivation already provides 37 percent of all irrigated area worldwide [10].
Two third of the rice produced in Europe are cultivated in Italy. Within the EU, Italy is
therefore the most important production country. The areas under rice cultivation are mostly
in the Po basin, the plain with the most intensive agricultural use in the country and therefore
with vast ecological problems ranging from drought events to intrusion of marine water.
Italy’s rice exports make about five percent of the rice quantity traded worldwide [11].
Table 5: Countries where Germany leaves the biggest water footprint due to rice imports
Country Togo Italy USA Spain India Pakistan
EWF
(Mm³/year)
151 120 79 47 46 28
Abb. 6 Figure 6: Global map of the German water footprint for the production of rice
The use of pesticides in rice cultivation has, based on insufficient knowledge and missing
controls, especially outside of Europe very negative consequences. Of all pesticides used
worldwide, 13 percent alone are applied in the Asian rice production.
Bild Rice cultivation in China, Province of Jünnern © WWF

18
3.3. Global ways of the (virtual) water
Germany leaves its water footprint in over 200 countries of this world (figure 7), which
differs in intensity according to the product and the climatic and natural conditions, but also
the technological standards implemented in agriculture, respectively. These values again can
have different impacts on the natural water and land resources, as well as the local and
national economy, depending on the location and situation.
In the following, some countries are presented exemplary where exports of virtual water have
negative consequences for the regions affected by the production of the traded goods. In the
selected countries, WWF is also actively engaged in the protection of the natural ecosystems
and resources and where he supports initiatives for a more sustainable development.
Abb. 7 Figure 7: Germany’s external agricultural water footprint
3.3.1 Brazil
With a country area of over 8.5 million square kilometres, Brazil already makes 47.3 percent
of the Latin-American continent. Brazil is a very water-rich country: the more than 6,400
kilometres long Amazon River alone contains one fifth of the global freshwater resources. In
all, Brazil has 12 to 14 percent of the freshwater quantities worldwide. But as paradox as it
may sound, the country experiences a water crisis. Main reason is the uncontrolled water
pollution, so that a large portion of the population cannot be supplied with clean drinking
water. This leads to a great number of illnesses caused by polluted water. Reasons for this
pollution are for one the fast population growth and also wastewater from agriculture and
fishery. Approximately one third of the drinking water is as well lost due to ailing pipe
systems, which leads to supply bottlenecks especially in the cities [12].
Brazil is on top of the countries where Germany leaves its water footprint for agricultural
goods (table 2). Annually, we import 5.73 km³ in form of agricultural products from Brazil.
The most important products are coffee (2.65 km³), soy (1.93 km³) and livestock (0.39 km³).
Soy production and meat consumption
In 2005, about 23 million hectares of soy were cultivated in Brazil, which is therefore the
second most important soy producer after the USA. Half of the soy production is destined for
export, whereas the EU is with 40 percent the most important buyer. Because of the growing
meat consumption, the production of soy as fodder has doubled worldwide in the last 20
years. The growing demand almost exclusively is at the expense of South America.
Soy production plays an important role in the destruction of the Amazon Rainforest. Since
land prices are higher for soy cultivation areas than that of extensive grazing land, cattle
breeders are driven from their pastures. But this forces them to slash and burn up to then
untouched rainforest areas and to convert them to pasture, which again will be taken over by
soy farmers after some time. Each year, about 1.4 million hectares of the Amazon are
destroyed for pasture by this vicious circle [13].
To get one kilogram of soy, globally about 1,800 litres of water are invested for cultivation on
average. Based on the importance of soy as fodder, it clearly influences the high virtual water
content of livestock products, like the 15,500 litres of water in one kilogram beef explained in
chapter 1.

19
Bild Intensive cultivation of soybeans in Brazil © WWF
Brazilian coffee
With a market share of almost 30 percent, Brazil is internationally the most important
producer of coffee beans. Depending on the climatic conditions, up to 1.8 million tons are
exported annually, and another 600,000 tons are produced for the national consumption,
which makes Brazil the country with the third largest coffee consumption [14].
On average, about 22,500 litres of water are needed globally to produce one kilogram of
coffee beans. That makes 140 litres of water for 125 millilitres of coffee.
3.3.2 India
India’s economy is very much depending on agriculture, which again increasingly favours
irrigation. Although large rivers like Ganges, Indus or Brahmaputra supply the country and
India has vast aquifers, the country already experiences water scarcity [15]. The Indian
farmers extract about 250 km³ of water each year for irrigation, but only 150 km³ are replaced
by precipitation [16]. One of the main problems of the future will therefore be to find enough
water resources for irrigation after supplying the population with drinking water [15] and also
leave enough water for ecological needs. At the moment, agricultural yields and efficiency of
irrigation in India are fare behind the technical possibilities [17]. But for the Indian
government, it is very important that India will remain food self-sufficient [18]. In view of the
great strain of the resources and the need for the growing population, it is questionable
whether this will be possible in the future. In all, India imports only 1.6 percent of its annually
needed water amounts (figure 8), mostly as agricultural products.
92,6%
1,9%
3,9%
1,6%
Agriculture
Industrial good
Households
External Resources
Figure 8: Share of water use in India [19]
Cotton as an important economic factor
Cotton is one of the most important economical products for India and is grown by almost
four million farmers. Approximately 60 million Indians altogether depend on the cotton sector
in one form. With about nine million hectares cultivation area (this is about one fourth of the
area of Germany) India alone has 27 percent of the cotton cultivation areas in the world. At
the same time, India also has the lowest yields worldwide. While in 2006 around 709

20
kilograms of cotton were produced on one hectare worldwide on average, it were only 400
kilograms in India [15]. Therefore, despite the largest areas under cotton cultivation, India
only produces 14 percent of the cotton worldwide.
Up to now, nearly one third of India’s cotton fields are irrigated. The irrigated areas are
mostly in the northern part of the country in the catchment area of the Ganges. Cotton
production in the central and southern regions on the other hand is mostly rain-fed [15].
There, cotton production stresses mostly the green water resources [9], whereas in northern
India “blue” water from groundwater resources or rivers is used.
Bild Wrongly planned irrigation channel in the Province Andhra Pradesh in India © WWF
Surface waters and aquifers are highly polluted by cotton production in India [9]. About 54
percent of pesticides are used in cotton production, although the cultivated areas only make up
five percent of the arable land in India. The use of about one kilogram of pesticides per
hectare and season stresses the water resources and also causes massive health problems for
the farmers and the local population. The high chemical pollution also reduces the quality of
the cotton, so that farmers sometimes have problems to sell it at the cotton mills [15].
WWF and the Better Cotton Initiative
To find practical possibilities to reduce the ecological impacts of cotton production worldwide
and also minimize the use of water and pesticides, WWF co-funded the “Better Cotton
Initiative” (BCI). In this initiative, non-governmental organisations work together with
important companies like Adidas, IKEA, Gap and H&M in order to develop a standard after
whose criteria cotton production can be implemented economically, ecologically and socially
more sustainable.
WWF and IKEA therefore have for example started pilot projects in India, where it can be
shown that with a change in cultivation techniques about three fourth of water and pesticides
can be saved while at the same time the net profit of the farmers was up to 70 percent higher.
One of these projects was started in 2006 in the province Andhra Pradesh with about 40
families. Now, it stretches over 18 villages with a total of about 600 cotton farmers.
In 2010, additional “Better Cotton” pilot projects will be started in India, but also in Pakistan,
parts of Africa and Brazil. These projects should produce enough cotton after the “Better
Cotton” standards to provide textile producers and buyers with larger amounts of sustainably
produced cotton.
3.3.3 Kenya
Agriculture is in Kenya an important economic factor and the most important employee,
which already provides 70 percent of the jobs and contributes already 16 percent to Kenya’s
GDP. With the export of agricultural goods Kenya gets 60 percent of its export earnings. The
horticultural sector is especially important. Flowers make up more than half of the
horticultural export products, followed by vegetables (35 percent) and fruits (12 percent). The
EU is the most important buyer of these products. But altogether, only 10 percent of the total
fruit and vegetable yields of Kenya are destined for export, mostly they are produced for the
national market. Other important export products are tea and coffee [20] (table 6).

21
On country-level, irrigation plays up to now only a subordinate role. Only about 19 percent of
the possible area is irrigated [21]. So the farmers are mainly depending on rainfall. Since
climate change led to a great variability and unreliability in rainfall in the last years, the
Kenyan government will increased support irrigation projects in the future to raise the
productivity in agriculture and also make it independent of precipitation regimes. Irrigation
also allows the cultivation of products with a higher profit margin, like for example French
beans or snow peas [20]. If these plans were implemented, the already severe water situation
will further aggravate.
Table 6: The most important products forming Germany’s EWF in Kenya
Product WF (m³/year)
Coffee 488.440.449
Tea 4.609.881
Beans 2.122.940
Nuts 1.676.056
Flowers 1.447.985
Tobacco 1.295.634
Sunflowers 1.008.030
Cotton 194.446
Sugar (or Citrus fruits?) 104.685
Bovine 80.366
Bananas 79.569
Total 502.133.072
At the moment, the water need of Kenya is at 2.7 km³ each year. But a doubling to 5.8 km³ is
expected until 2010. While in 1969, the Kenyan population had 1,853 m³ of water at their
availability every day, it was only 612 m³ in 2004. Since Kenya has one of the highest
population growth rates in the world, the available water amount therefore will still decrease
in the coming years. It will likely fall to 235 m³ per capita till 2025 [20]. According to WHO,
only 61 percent of the Kenyan population hat access to save drinking water in 2004. But this
was already an increase compared to 2000, where not even half of the population could be
supplied with clean drinking water [21].
WWF for water protection in the Mara River catchment area
One of the biggest environmental problems in Kenya with the greatest impact on the available
water resources is the degradation of the river catchment areas caused by land conversion and
the growing population. At the beginning of this destructive chain are high deforestation rates
that explain why only less than three percent of the 582,646 km² large country are still forest
areas. This has serious consequences for the water household since precipitation has no
storage capacity and has no chance to drain into the soil. Higher surface runoff means higher
evaporation. This water amount is then missing in the aquifers and surface water bodies.
WWF addresses these core problems with his project work at the Mara River. Especially the
headwater region of the Mara with its Mau rainforest is threatened by illegal logging. During
the last 30 years, one quarter of this Mau forest was converted into agricultural area. This has
dramatically changed the runoff as well as the water quality. The situation is worsened by
large irrigated plantations in the Mara plains, where especially green beans are cultivated.
Thanks to the climatic conditions, two yields of green beans are possible each year; the first
cultivation season is between March and June, the second between September and December

22
[21]. The cultivation area is between 500 and 700 hectares and produces beans destined only
for export. For the production of one ton of Kenyan beans, altogether 4,614 m³ of water are
needed, thereof 3,320 m³ blue water and 1,295 m³ green water [23]. The first harvest is
especially critical, since it begins during dry season or shortly before the beginning of the
rainy season, when the water supply in the region is already low and critical. This is
especially severe since the Mara is the only river in that region that still has water during dry
season. This water not only has to supply the population in the Mara catchment area, but also
two very important protected areas: the Serengeti National Park and the Masai Mara National
Reserve. Moreover, this is the time of the greatest mammal migration in the world: more than
one million wildebeest, 300,000 zebras and as much Thomson gazelles migrate to the
northern part of the Serengeti National Park and the Masai Mara Reserve in order to survive
the dry season there. This unique natural spectacle attracts numerous tourists each year, which
are a further stress for the already short water resources of the region [22].
With the support of WWF, the foundation of a water users’ organisation was formed that
includes all communities, land users, tourism companies and organisations concerned. In the
future, this organisation is supposed to regulate the management of the water resources. WWF
also engages in reforestation and restoration of destructed forest areas as well as the
protection of the remaining Mau forest. Another part of WWF’s engagement are measures for
the protection of springs, which are also the source of water supply for households and
livestock of the local population.
Bild Low water table in a tributary of the Mara River in the Mau Forest, Kenya © WWF, D. August
3.3.4 Spain
Spain is the most arid country in the EU [26]. Despite this unfavourable water situation, Spain
cultivates a great part of the fruit and vegetable production for the European market. About
3.3 million hectares of the agricultural area of Spain are irrigated, which consumes around 24
km³ of water each year. That’s almost three quarters of the total water consumption of Spain.
So the agricultural sector is by far the biggest water user. Although efficient and modern
irrigation techniques like drip irrigation gain in importance, the water needs of agriculture still
are clearly higher than the available water quantity. In the province of Andalusia alone each
year a water deficit of 270 million m³ occurs [25]. Countrywide, almost half (45.3 percent) of
the agricultural area is still flood-irrigated. This wasteful use of water is favoured by
extremely low, subsidised water prices which by far do not pass on the real costs to the
farmers. But more severe is the number of illegal boreholes. According to information of the
Spanish Environmental Ministry, there are about 500,000 illegal boreholes with an overall
annual extraction of at least 3.6 km³ of groundwater. The legal groundwater abstraction in
comparison is 4.5 km³. That means that at least 45 percent of the groundwater is illegally
used. This water amount could supply 58 million people in Spain, but is instead used to
irrigate about one sixth of the agricultural area as well as for the maintenance of numerous
golf courts. Many water infrastructure projects like dams, channels or water transfer projects
financed with public means help to mitigate the negative consequences of these illegal
machinations. The Júcar-Vinalopó transfer with a budget of about 231.5 million Euros for
example helps to refill an illegally overexploited aquifer. The Spanish water authorities have
neither working instruments for water management nor a sufficiently strict law enforcement
to effectively work against illegal actions.
23
The main reason for illegal water use lies in the huge profits that can be expected, especially
in agriculture, tourism and urban development.
The illegal overexploitation of surface water bodies and aquifers does not only threaten the
water supply of the population but has also severe consequences for nature. This is especially
true for the south of Spain where most of the fruit and vegetable plantations can be found.
Andalusia under water stress
About 24 percent of the economy in the Andalusian region of Almeria is based on agriculture.
This is extremely high compared to the national average of only 3.7 percent [28]. On an area
of 50.000 hectares, 35.000 of it under plastic, each year about 2.7 million tons of fruits and
vegetables are produced around Almeria. Almost half of this production is destined for export,
especially within Europe, but also to Canada and the USA. About 400.000 tons alone get to
the German market. Roughly half of the earnings are produced with intensive cultures like
tomatoes and paprika [29]. The rising water need of the region leads to overexploitation of
aquifers. This again leads to immense water deficits and the intrusion of saltwater into the
aquifers [28]. Partly, four to five times more water is abstracted than can be replaced by
rainfall.
Ecological consequences of strawberry production
Among the most important products of Andalusia are strawberries, which are mostly
cultivated in the region Huelva. Here, more than 60 percent of the Spanish strawberries are
cultivated on about 6,000 hectares. Huelva is the most important cultivation area for
strawberries worldwide and produces almost one quarter of the European strawberries.
Germany alone imported in 2008 about 57,600 tons of fresh and 5,500 tons of produced
strawberries [30]. Of the cultivation costs of about 24,500 Euros per hectare strawberry
plantation, only 3.42 percent are allotted to irrigation costs. Additionally to the low water
prices, this is due to the high amount of illegally abstracted water. Official estimates talk
about 1,000 illegal wells in the Huelva region. Each year, 20 million m³ of water are needed
for strawberry cultivation alone. This is one third of the water resources available in the
region.
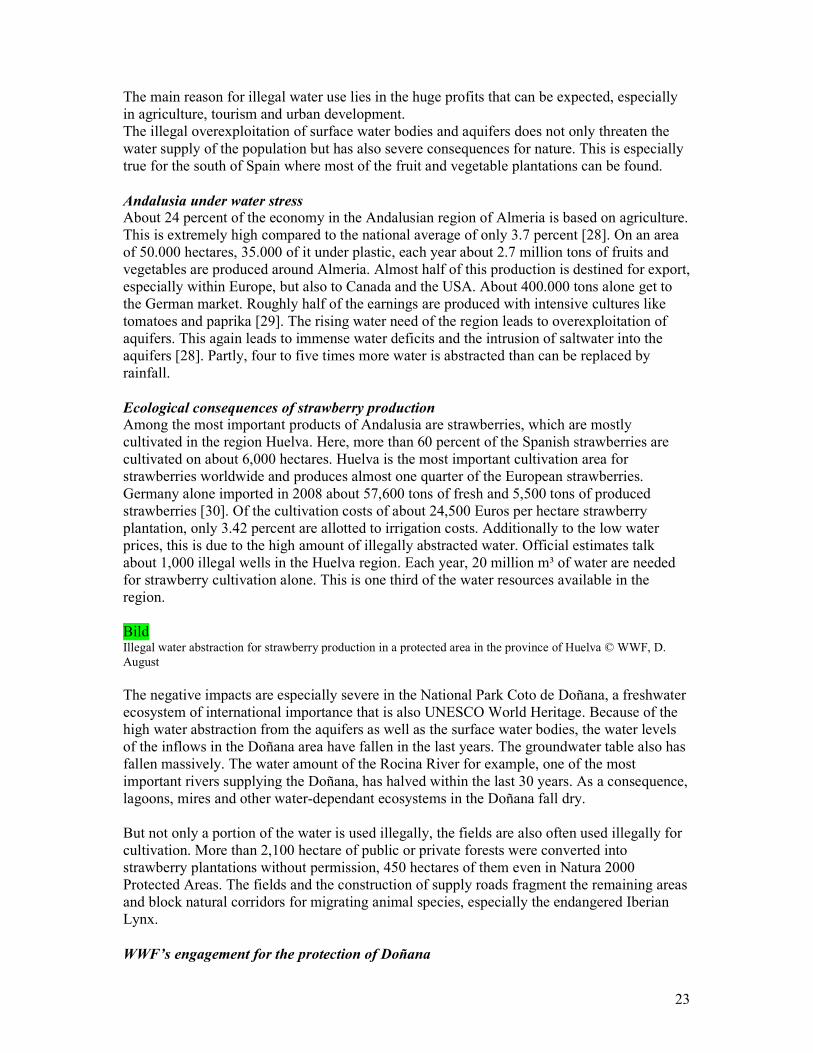
Bild Illegal water abstraction for strawberry production in a protected area in the province of Huelva © WWF, D.
August
The negative impacts are especially severe in the National Park Coto de Doñana, a freshwater
ecosystem of international importance that is also UNESCO World Heritage. Because of the
high water abstraction from the aquifers as well as the surface water bodies, the water levels
of the inflows in the Doñana area have fallen in the last years. The groundwater table also has
fallen massively. The water amount of the Rocina River for example, one of the most
important rivers supplying the Doñana, has halved within the last 30 years. As a consequence,
lagoons, mires and other water-dependant ecosystems in the Doñana fall dry.
But not only a portion of the water is used illegally, the fields are also often used illegally for
cultivation. More than 2,100 hectare of public or private forests were converted into
strawberry plantations without permission, 450 hectares of them even in Natura 2000
Protected Areas. The fields and the construction of supply roads fragment the remaining areas
and block natural corridors for migrating animal species, especially the endangered Iberian
Lynx.
WWF’s engagement for the protection of Doñana

24
Already since 1964, WWF is active for the protection of the Doñana. Thanks to its intense
engagement, in 1969 at least a part of the wetlands was classified as National Park. In order to
still be able to protect the Doñana against negative impacts of intensive agriculture in the
future, WWF pursues different approaches. Against the background of the severe
fragmentation of the areas, protection corridors were established for migrating animal species,
and their establishment was pursued together with farmers and communities. In close
cooperation with farmers in the region, water saving irrigation techniques and instruments are
supported in the field. In another project, WWF has formed a cooperation with farmers and
supermarkets. Since January 2008, WWF for example works together with the REWE Group.
Goal of this cooperation is the exclusion of illegal water and land use and the implementation
of more effective irrigation techniques at their strawberry suppliers in the Doñana region.
Also, the cultivation on protected areas and established forest areas will be stopped. Based on
this cooperation, also criteria for water and land use in fruit and vegetable production will be
worked out who will be included in the Global GAP standard as obligatory criteria for the
whole business sector.
3.3.5 Turkey
The agricultural sector is also a very important economic sector in Turkey. Of about 400,000
agricultural land, 59 percent are used for agriculture and 35 percent as pasture. Today,
agriculture already uses more than half of the area, and will very possibly further increase in
the coming years. About one tenth of the GDP is gained in agriculture. Almost three fourth of
them by grain production, but fruit, vegetables and livestock are also important products.
Another important product is cotton. Turkey was the sixth important cotton producer in 2007.
On an area of 700,000 hectares, 2.3 million tons of cotton are produced annually, half of it
alone in the region of Eastern Anatolia. For the cultivation, about 9,630 m³ of water per
hectare are needed – that are 3,100 litres per kilogram of cotton.
Agriculture consumes already 71 percent of Turkey’s water resources, mainly for irrigation.
Here exists a huge saving potential, since irrigation is in 94 percent flood-irrigation, only on
six percent of the area drip-irrigation or sprinklers are used [24].
Of roughly 4.9 million hectares of agricultural land suitable for irrigation in 2006, only 86
percent – that are 4.2 million hectares, could be irrigated because of a severe drought.
As a consequence of the high water need in agriculture, the groundwater resources are more
and more overexploited. In all, Turkey has more than 14.000 km³ of groundwater available
each year, but already 37 percent of this are already used by agriculture. Often, groundwater
is extracted illegally. According to assumptions of the Turkish government, in 2008 there
were 92,000 wells in the catchment area of the Konya River in Central Anatolia, one third
(66,000) of them illegal. Additionally, precipitation clearly decreased in the last years,
meaning that aquifers could not be refilled sufficiently. In 2007 alone, drought damages in
agriculture amounted to 2.5 billion Euros [24].
The Turkish government sees dam building as the solution of these problems. Within the
Southeast-Anatolia-Project (GAP) for example, a total of 22 large dams at Euphrat and Tigris
are planned. The largest dam is the already working Atatürk dam that should secure irritation
for 1.7 million hectares, among others for cotton cultivation. Since Turkey uses more cotton
than it produces at the moment, the Turkish governments aims to increase cotton production
significantly. Another 550 dams are said to follow in the coming years.

25
Beneath the overexploitation of water resources, the situation in Turkey is further worsened
by a decreasing water quality. Municipal wastewaters reach the rivers and lakes untreated, and
pesticide and fertilizer residues from agriculture further pollute the water resources.
The daily per capita water use in Turkey is at the moment at 111 litres, that are 40.5 m³ a year.
If the population will increase as expected up to 80 million in 2030, the annual water need
could rise up to 1,100 m³.
A part of the drinking water supply in Turkey is already privatized. Now the Turkish
government plans also to sell rivers and lakes to private corporations. To make this possible, a
change in the Constitution is necessary, since up to now private control of surface water
bodies and coastal areas is limited and the public interest put in first place. The government
hopes that these companies will invest in dam building projects and with that solve regional
water problems. But small farmers and communities fear that they will loose their access to
the water resources.
WWF in Turkey
With campaigns and pilot projects, WWF tries to build up an understanding for the necessity
of a sustainable and controlled water management and also help formulate environmental-
friendly water laws. In 2005, a WWF campaign on water use was reason for the Turkish
government to support 18 pilot projects on the establishment of modern irrigation techniques
and to teach 1,500 farmers in water saving methods [24]. WWF is also working to preserve
the protection status of important ecosystems like the Gediz delta. Thanks to the work of
WWF, in the last years two new Ramsar Sites in the Konya catchment area were established.
In another 21 pilot projects in the Konya catchment area and at the Bafa Lake, farmers will be
taught in the use of modern irrigation techniques, with which more than half of the water
quantities usually needed for the cultivation of sugar cane, cotton and maize could be saved.
Bild Illegal groundwater use for irrigation in the Konya area in Turkey © WWF

26
4. Environmental relevance of water resources protection The calculation of the water footprint for the agricultural goods and the more precise
contemplation of some agricultural products show that these results cannot be interpreted
without a detailed analysis of additional factors. A respective valuation needs a climatic and
geographic classification of the production area as well as information about the cultivation
methods, the recent use by the population, the future water distribution and the connection to
the respective water availability from groundwater and surface water resources.
Different climatic conditions define the water household and often seasonal differences in the
water availability. Interventions in the natural household and changes due to intensive
agricultural use could have critical impacts on quality and functionality of vegetation and
biodiversity in the affected ecological and hydrological systems, as already can be seen in
many regions.
Within the European Union, water legislation gives a good action and development
framework. The implementation on the other hand shows in the countries most affected by
water-climate restrictions like for example Greece the greatest deficits. On the international
level, usually a binding legal basis, guidelines and indicators for the estimation and
assessment of the water use are missing. In trade and business, especially in the more water-
intensive sectors, often lack the will to implement a regular examination of the legal use of
water and a water management in accordance with regulations. This tempts to overexploit the
water resources leading to the turn over of the water balance.
Worldwide, around 80 percent of the agricultural areas are rain-fed, so that the yields are
dependant on sufficient precipitation. Arid and semi-arid regions have at least in some phases
of the year a negative water balance, when evaporation is higher than precipitation and thus
soil moisture has the lowest values. This means a higher vulnerability of production, which is
not restricted by temperature but by water availability. To ease this disadvantage, agricultural
areas are more and more supplied with surface or groundwater by a variety of irrigation
mechanisms. Around 18 percent of the global arable land is irrigated. This allows not only the
cultivation and development in climatically relatively water-scarce regions, but also two to
three times higher yields compared to rain-fed production.
Among the arid and semi-arid regions in the world most affected by this in the tropics and
subtropics are for example the Mediterranean region, Australia and South America.
To further estimate the impacts of the external water footprint of Germany, the exporting
countries with the highest water exports were further analysed. Negative consequences on the
water resources were defined as “water stress” and the respective water stress indicator (WSI)
was calculated (figure 9). By taking into account the environmental requirements of natural
systems, water scarcity for human use was determined. Four groups of countries can be
formed after this method in relation to the German water footprint. The definition of these
groups is listed in table 7.
Table 7: Schematic of the impacts
Tabelle 7
Abb 9 Figure 9: Location of the agricultural water footprint of Germany and estimation of the water stress

27
The highest water stress occurs in group D because of high water abstraction per unit
available and high volumes of the external water footprint (figure 9). In this group are for
example Kenya, India, Spain and Turkey, but also China, Morocco, Pakistan, South Africa
and Uzbekistan. But the consequences for the ecoregions and their biodiversity can not only
be estimated based on the water quantity, but need further integration of ecological,
hydrological, social and climatic information for ecological units, which rarely can be defined
by national borders.
Stop negative impacts
For countries with high water abstraction for the production of agricultural goods, mostly
groups C and D, there is a distinct spatial overlapping with the location of the 238 ecosystems
WWF identified as most threatened because of their valuable biodiversity, called the Global
200.
But not only in those regions, intensive agriculture poses a threat for biodiversity and the
natural resources that are already negatively impaired. Wetlands, floodplains and mires are
still drained to be converted into agricultural areas or polluted by wastewaters. Despite
changing water levels during the seasons, rivers are overexploited over the whole year by dam
projects for irrigation schemes or water transfer projects in other regions and thereby
destroyed as functional river catchment unit.
Due to the all year round cultivation under irrigation, huge amounts are constantly extracted
from groundwater and surface waters that cannot even regenerate during rainy periods. The
ratio between groundwater renewal and groundwater abstraction therefore has to be regarded
very critically. Especially in regions where more than 50 percent of the newly generated
resources are abstracted, the risk of water scarcity, droughts and water stress rises. This is at
the moment the case in southern and northern Africa, Asia, parts of Europe and also in some
regions of China, India, Pakistan and the USA, where more than 20 to 50 percent of the
available water resources are used.
There is still unawareness regarding the long-term consequences of these management
methods in different parts of the world, especially in developing countries. Also the
understanding of changes in variability and how they influence water bodies is still
insufficient. This is also true for the connection between deforestation and erosion processes
on water quality and water availability. But it is already clear that many regions affected by
climate change urgently have to implement measures to adapt to these changes, even if they
have a good water management. A balanced water household is the basic prerequisite for this.
This trend of growing overexploitation of natural resources has to be stopped to avert the loss
of ecosystems, species and livelihood, but also to allow a sustainable agricultural
development. A look at the global map and the calculations of the regional distribution of the
external water footprint of Germany shows that the biggest water footprint is left in Western
Europe and North Africa, meaning the Mediterranean Region, followed by South America
and Southeast Asia (table 8, figure 10). An in-depth interpretation of the consequences caused
by the cultivation of certain agricultural products for the German market in the respective
countries is only possible with restrictions, for once because of the scale, but also because of
the missing context to distinct regions and river catchment areas (see also chapter 2).
Nevertheless, these results still allow numerous starting points for the development and
implementation of new guidelines and standards.

28
Table 8: External water footprint sorted by regions
Region
Sum EWF
(km³/year)
Southern Africa 486
Oceania 1,082
FSU 1,343
Central America 2,076
Middle East 2,331
Central Africa 2,342
Central and South Asia 3,218
North America 3,265
Eastern Europe 3,461
South East Asia 4,935
North Africa 9,523
South America 10,167
Western Europe 16,086
Grand Total 60,315
Figure 10: External water footprint of Germany after regions

29
5. Solutions and Recommendations There are as yet only few countries that conducted such a detailed analysis based on the same
in-depth methods and databases like this study. Already published is only a report in the UK,
and studies for Belgium, Switzerland and Sweden will be published within 2009. But
preliminary results from WWF Sweden are already available and could be used for
comparison with the German results. Although the German external water footprint only
makes up about half of the total water footprint while the British EWF is at 62 percent [32], it
is with 79.5 km³ in absolute terms roughly 25 percent higher than the British EWF.
The Swedish external water footprint is with 51 percent of the total WF comparable to the
German one, but in absolute terms only 9.7 km³ and therefore only a fraction of the German
one [28]. Thus Germany has a special global responsibility which we have to live up to.
This is currently first and foremost the responsibility of governments and companies and only
then that of consumers since up to now only little courses of action to reduce the personal
water footprint by purposeful consumption.
5.1 Recommendations for governments
The recommendations for governmental institutions can be divided into three groups: a) the
German government, b) the European Union and c) the governments of the production
countries of our goods.
We are calling the German Federal Government to:
• Show a considerably higher engagement and higher investments within the frame of
bilateral and multilateral development cooperation to establish the necessary basis for
a sustainable management of water resources, especially of river catchment areas, but
also from aquifers in such regions where water is getting scarcer and is at present also
badly managed, as well as in countries where Germany does import its products from;
• Support applied research dealing with the water footprint of Germany, the EU and on
a global scale and from which future trends, concrete recommendations and necessary
implementation steps can be deduced, especially in relation to the food supply of a
growing world population and the need for bio-energy. Based on these research
results, strategies have to be developed in cooperation with companies on how we can
counteract a global water crisis. Especially the methodology to analyse the water
footprint of industrial products must be further developed to get the basis for a
standardisation in this sector and to enable the survey of products with a uniform and
accepted evaluation method;
• Use the Mediterranean Union considerably more intense as platform to broach the
issue of the water footprint of Western European countries in southern Europe and
also to jointly develop, finance and implement concrete measures for the
Mediterranean countries and Northern Africa;
• Keener engage in the EU for a consequent implementation of the European Water
Framework Directive, especially in the Mediterranean and also to demand this in the
neighbouring countries in Europe as well as in the candidate and potential candidate
countries like Turkey, and to support with Twinning projects or technological advice.
The European Commission and the member states of the EU should:
• At the European level insist on the consequent implementation of the Water
Framework Directive for rivers and aquifers, especially in the Mediterranean countries
30
Spain, Italy and Greece, but also in the candidate country Turkey and other riparian
states, and to impose severe retributions for member states for non-compliance;
• Actively provide the experiences from the implementation of the Water Framework
Directive as a concrete example for a sustainable water management in other regions
of the world;
• Pay subsidies only in cases of verifiably sustainable use of water resources, meaning
to consequently couple subsidy payments on the compliance of environmental
standards (cross-compliance);
• Immediately stop the high subsidies for irrigated cotton production in Greece, Spain
and Portugal, since they are not only extremely water-intensive, but ruin small-scale
farmers in West Africa by indirect price dumping;
• Support the development of water efficiency standards in cooperation with companies
on an international level and carefully consider to which extend at least the legality of
water supply in the non-European agriculture could be established as a minimum
standard for the import of products into the EU. This is comparable to the compliance
of minimum standards regarding the import of biofuels into the EU from 2010 on.
The governments in the emerging and developing countries we obtain our water imports
from should:
• Legally establish and consequently implement a water policy that demands a
sustainable management of water resources and a quantity allotment of water
corresponding to the products under compliance of ecological discharges for
groundwater and surface water bodies, but also to punish in the case of inadequate
compliance;
• Assess if it would not be more sensible in the frame of their national development
strategies for agricultural or industrial products to import products with a high virtual
water content instead of produce those themselves or even to export them. Some
countries like Morocco, Jordan, Israel and Egypt (all virtual water importers) already
included the virtual water trade in their water policies and developed strategies to
reduce the export of water intensive products, especially crops. But the inclusion of
virtual water into policies requires the knowledge about consequences and interactions
of virtual water trade with the local social, economical, ecological and cultural
conditions [34].
5.2 Recommendations for companies
Companies should:
• Measure, document and better understand the water footprint of their products along
the whole supply chain and the risks connected to this;
• Reduce the impacts especially in already or future water scarce regions by concrete
specifications and cooperation with suppliers of the products or raw materials;
• Engage together with other companies on the political level in the respective water
catchment areas and countries for a more efficient and more sustainable management
of the water resources that also secures the access of the population as well as
ecological discharge;
• Engage actively for the development, application and broad implementation of water
standards and needed methodologies for products that allow the consumers to choose
between products with a high or low footprint in critically water scarce regions.
Comparable initiatives for standard development already exist, like the Alliance for Water
Stewardship or the CEO Water Mandate. But up to now, only few German companies
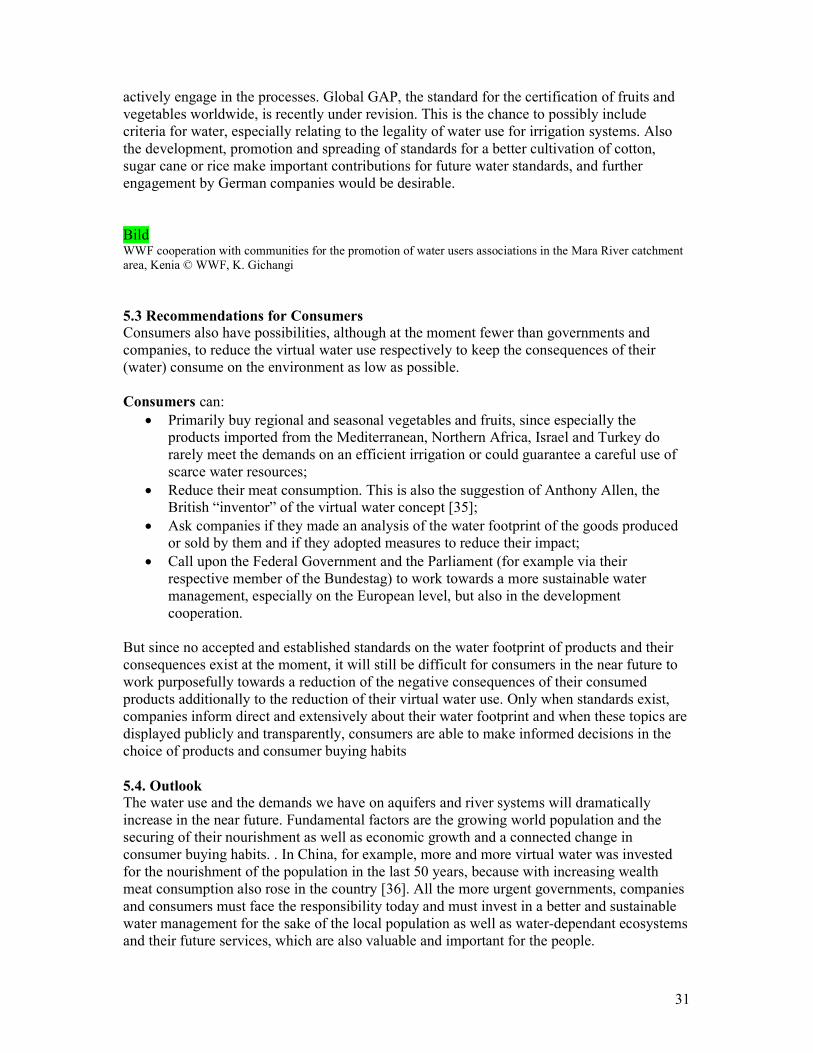
31
actively engage in the processes. Global GAP, the standard for the certification of fruits and
vegetables worldwide, is recently under revision. This is the chance to possibly include
criteria for water, especially relating to the legality of water use for irrigation systems. Also
the development, promotion and spreading of standards for a better cultivation of cotton,
sugar cane or rice make important contributions for future water standards, and further
engagement by German companies would be desirable.
Bild WWF cooperation with communities for the promotion of water users associations in the Mara River catchment
area, Kenia © WWF, K. Gichangi
5.3 Recommendations for Consumers
Consumers also have possibilities, although at the moment fewer than governments and
companies, to reduce the virtual water use respectively to keep the consequences of their
(water) consume on the environment as low as possible.
Consumers can:
• Primarily buy regional and seasonal vegetables and fruits, since especially the
products imported from the Mediterranean, Northern Africa, Israel and Turkey do
rarely meet the demands on an efficient irrigation or could guarantee a careful use of
scarce water resources;
• Reduce their meat consumption. This is also the suggestion of Anthony Allen, the
British “inventor” of the virtual water concept [35];
• Ask companies if they made an analysis of the water footprint of the goods produced
or sold by them and if they adopted measures to reduce their impact;
• Call upon the Federal Government and the Parliament (for example via their
respective member of the Bundestag) to work towards a more sustainable water
management, especially on the European level, but also in the development
cooperation.
But since no accepted and established standards on the water footprint of products and their
consequences exist at the moment, it will still be difficult for consumers in the near future to
work purposefully towards a reduction of the negative consequences of their consumed
products additionally to the reduction of their virtual water use. Only when standards exist,
companies inform direct and extensively about their water footprint and when these topics are
displayed publicly and transparently, consumers are able to make informed decisions in the
choice of products and consumer buying habits
5.4. Outlook
The water use and the demands we have on aquifers and river systems will dramatically
increase in the near future. Fundamental factors are the growing world population and the
securing of their nourishment as well as economic growth and a connected change in
consumer buying habits. . In China, for example, more and more virtual water was invested
for the nourishment of the population in the last 50 years, because with increasing wealth
meat consumption also rose in the country [36]. All the more urgent governments, companies
and consumers must face the responsibility today and must invest in a better and sustainable
water management for the sake of the local population as well as water-dependant ecosystems
and their future services, which are also valuable and important for the people.
32
References
[1] Chapagain, A. K., Hoekstra, A. (2004a): Water footprints of nations, Volume 1. Value of
Water Research Report Series No. 16. UNESCO-IHE Delft.
[2] Hoekstra, A. Y. (2008): The water footprint of food. In: Förare, J. (Ed.): Water for food.
The Swedish Research Council Formas.
[3] Zygmunt, J. (2007): Hidden waters. A Waterwise Briefing. Waterwise London.
[4] Hoekstra, A. Y. (2003): Virtual water trade between nations: a global mechanism affecting
regional water systems. Global Change Newsletter No. 54. International Geosphere-
Biosphere Programme.
[5] Chapagain, A. K., Hoekstra, A. (2004b): Water footprints of nations, Volume 2 -
Appendices. Value of Water Research Report Series No. 16. UNESCO-IHE Delft.
[6] Chapagain, A. K., Hoekstra, A., Savenije, H. H. G., Gautam, R. (2005): The Water
Footprint of Cotton Consumption. Value of Water Research Report Series No. 18.
UNESCO-IHE Delft.
[7] WWF (2007): More rice with less water.
[8] Russo, S. and Callegarin, A.M. (2007): Rice production and research potential in Italy.
Cahiers Options Méditerranéennes Vol. 24: 139-146
[9] FAO (2009): The impact of water scarcity on social and economic development in Brazil.
http://209.85.129.132/search?q=cache:aeSCGgbG5mAJ:iep.univ-
lille2.fr/lib/tele.php%3Fchemin%3D../enseignants/fichier/787-
Brazil.doc+%22impact+of+water+scarcity+on+social+and+economic+development+in+B
razil%22&cd=1&hl=de&ct=clnk&gl=de&client=firefox-a
[10] European Commission (2006): Brazil’ Agriculture: a Survey. Monitoring Agri-trade
Policy Newsletter No. 02-06. European Commission, Brussels.
[11] Coltro, L., Mourad, A.L., Liveira, P.A.P.L.V., Baddini, J.P.O.A., Kletecke, R.M. (2006):
Environmental Profile of Brazilian Green Coffee. The International Journal of Life Cycle
Assessment Vol. 11: pp. 16-21. Springer, Berlin.
[12] Araya, J.F (2007): Effects on resilience in Indian cotton production due to climate
change. An analysis of water availability and pesticide use in Punjab and Andhra Pradesh.
Master Thesis, University of Stockholm.
[13] Global Footprint Network (2008): India’s Ecological Footprint - A business perspective.
Global Footprint Network and Confederation of Indian Industry. Hyderabad.
[14] Kampman, D. (2007): The water footprint of India. A study on water use in relation to
the consumption of agricultural goods in the Indian states. Master thesis, University of
Twente.
[15] Neubert, S., Hesse, V., Iltgen, S., Peters, V., Seelaff, A., Taras, D. (2006): Poverty
reductin through irrigation: Sustainable strategies for Kenya? Deutsches Institut für
Entwicklungspolitik D.I.E, Bonn.
[16] Hoffman, C.M. (2007): Geospatial mapping and analyis of waer availability-demand-use
within the Mara River Basin. Master Thesis, Department of Environmental Studies, Florida
International University.
33
[17] Orr, S., Chapagain, A. (2006): Virtual water: a case study of green beans and flowers
exported to the UK from Africa. Fresh Insights Number 3. International Institute for
Environment and Development, London.
[18] WWF (2008): Drought in the Mediterranean. Recent Developments. WWF Deutschland,
Frankfurt.
[19] Martinez, M., Llamas, R.M. (2008): The water footprint knowledge as a framework to
water conflict resolution: Guadiana river basin case study (Spain). Geophysical Research
Abstracts Vol. 10.
[20] Downward, S.R. and Taylor, R. (2007): An assessment of Spain’s Programa AGUA and
its implications for sustainable water management in the province f Almeria, southeast
Spain. Journal of Environmental Management 82 (2): 277-289.
[21] AK Wasser (2006): „Virtuelles Wasser” – Wo kommt unser Wasser tatsächlich her?
Reader zur WASSER BERLIN 2006. Freiburger Arbeitskreis Wasser im Bundesverband
Bürgerinitiativen Umweltschutz e.V.
[22] BEL (2008): Gliederung der Jahreseinfuhrstatistik 2007 „Südfrüchte, Obst, Gemüse,
Schalenfrüchte, Kartoffeln sowie Mostobst“. Bundesanstalt für Landwirtschaft und
Ernährung, Berlin.
[23] UBA (2009): ?
[24] WWF (2008): UK Water Footprint: the impact of the UK’s food and fibre consumption
on global water resources. Volume one. WWF UK, Godalming.
[25] WWF (2009): ?? WWF Sweden (unpublished)
[26] Voices on Virtual Water (2003):
http://www.waterfootprint.org/Reports/Virtual_Water_voices.pdf
[27] Liu, J. und H.G. Savenije (2008): Food consumption patterns and their effect on water
requirement in China. Hydrol. Earth Syst. Sci. 12: 887–898.
Literature used for the calculation of the water footprint
Allan, J. A. (1998): "Virtual water: A strategic resource global solutions to regional deficits."
Ground Water 36 (4): 545-546.
Allan, J. A. (1999): "Productive efficiency and allocative efficiency: why better water
management may not solve the problem." Agricultural Water Management 40 (1): 71-75.
Allan, J. A. (2001): The Middle East water question: Hydropolitics and the global economy.
I.B. Tauris, London.
Allen, R. G., L. S. Pereira, D. Raes and M. Smith (1998): Crop evapotranspiration -
Guidelines for computing crop water requirements. FAO Irrigation and Drainage Paper 56,
Rome.
Chapagain, A. K. and A. Y. Hoekstra (2003): Virtual Water Flows Between Nations in
Relation to Trade in Livestock and Livestock Products. Value of Water Research Report
Series No. 13, UNESCO-IHE, Delft.
Chapagain, A. K. and A. Y. Hoekstra (2004): Water footprints of nations. Value of Water
Research Report Series No. 16. Delft, the Netherlands, UNESCO-IHE.
Chapagain, A. K., A. Y. Hoekstra, H. H. G. Savenije and R. Gautam (2006): "The water
footprint of cotton consumption: An assessment of the impact of worldwide consumption

34
of cotton products on the water resources in the cotton producing countries." Ecological
Economics 60 (1): 186.
Chapagain, A. K. and S. Orr (2008): An improved water footprint methodology linking global
consumption to local water resources: A case of Spanish tomatoes. Journal of
Environmental Management (Accepted).
Chapagain, A. K. and S. Orr (2008): UK Water Footprint Report: the impact of the UK’s food
and fibre consumption on global water resources. WWF UK, Godalming.
Falkenmark, M. and M. Lannerstad (2004): "Consumptive water use to feed humanity –
curing a blind spot." Hydrology and Earth System Sciences Discussions 1: 7-40.
FAO (1992): CROPWAT: A computer program for irrigation planning and management.
Irrigation and Drainage Paper 46. Food and Agriculture Organization of the United
Nations, Rome.Developed by Martin Smith.
FAO (1993): CLIMWAT for CROPWAT: A climatic database for irrigation planning and
management. Irrigation and Drainage Paper No. 49. Food and Agriculture Organization of
the United Nations, Rome. Developed by Martin Smith.
FAO (2001): FAOCLIM2: World-Wide Agroclimatic database. Food and Agriculture
Organization of the United Nations, Rome.
FAOSTAT (2008a): FAO Statistical Databases, Archives. Retrieved 15 Jan, 2008, from
http://faostat.fao.org/site/370/default.aspx
FAOSTAT (2008b): FAO Statistical Databases. Retrieved 10 Jan, 2008, from
http://faostat.fao.org/default.jsp
Fernandes, C., J. E. Cora and J. A. C. d. Araujo (2003): "Reference evapotranspiration
estimation inside greenhouses." Scientia Agricola 3 (60): 591-594.
Fernández, M. D. (2000): Necesidades hídricas y programación de riegos en los cultivos
hortícolas en invernadero ysuelo enarenado de Almería. Doctoral Thesis, Universidad de
Almería.
Friends of the Earth (2005): The Tyranny of Free Trade; wasted natural wealth and lost
livelihoods, Issue 109. Hong Kong.
Glantz, M. H. (1998): Creeping environmental problems in the Aral Sea basin. Central
Eurasian water crisis: Caspian, Aral and dead seas. I. Kobori and M. H. Glantz. United
Nations University Press, New York.
Hall, M., J. Dixon, A. Gulliver and D. Gibbon, Eds. (2001): Farming Systems and Poverty:
Improving farmer's livelihoods in a changing world. FAO and World Bank, Rome /
Washington.
Harmato, V. M. Saloke, M. S. Babel and H. J. Tantau (2004): "Water requirement of drip
irrigated tomatoes grown in greenhouse in tropical environment." Agricultural Water
Management (71): 225-242.
Hoekstra, A. Y. and A. K. Chapagain (2008): Globalization of Water: Sharing the Planet’s
Freshwater Resources. Blackwell Publishing Ltd., Oxford.
ITC (1999): PC-TAS version 1995-1999 in HS or SITC, CD-ROM. International Trade
Centre, Geneva.
ITC (2004): PC-TAS version 1997-2001 in HS or SITC, CD-ROM. International Trade
Centre, Geneva.
35
ITC (2006): PC-TAS version 2000-2004 in HS or SITC, CD-ROM. International Trade
Centre, Geneva.
IWMI (2006): Insights form the Comprehensive Assessment of water management in
agriculture.
IWMI (2007): Water for Food, Water for Life: A Comprehensive Assessment of Water in
Agriculture. Earthscan, London.
J. Pretty, T. Lang, J. Morison and A. S. Ball (2005): "Food miles and farm costs: The full cost
of the British food basket." Food Policy 30 (1): 1-20.
Jensen, M. E., R. D. Burman and R. G. Allen, Eds. (1990): Evapotranspiration and irrigation
water requirements. ASCE-manuals and Reports on Engineering Practice 70. Amer. Soc.
of Civil Engineers.
Jones, A. (2001): Eating Oil: Food supply in a changing climate, Sustain and the Elm Farm
Research Centre.
JP Morgan. (2008): "Watching water: A guide to evaluating corporate risks in a thirsty
world." 2008, from http://pdf.wri.org/jpmorgan_watching_water.pdf
Kent. (2002): "Groundwater Mining of the Souss Valley Alluvial Aquifer, Morocco." from
http://gsa.confex.com/gsa/2002AM/finalprogram/abstract_40263.htm.
Martínez-Fernández, J. and M. A. Selma (2004): Assessing the sustainability of
Mediterranean intensive agricultural systems through the combined use of dynamic system
models, environmental modelling and geographical information systems. Handbook of
sustainable development planning: studies in modelling and decision support. Cheltenham,
Edward Elgar Publishing.
Mitchel, T. (2003): TYN CY 1.1, Tyndall Centre for Climate Change Research, Climatic
Research Unit, University of East Anglia, UK.
Nash, E. (2008) "Spain's drought: a glimpse of our future?" The Independent, from
http://www.independent.co.uk/news/world/europe/spains-drought-a-glimpse-of-our-future-
833587.html
Orgaz, F., M. D. Fernandez, S. Bonachela, M. Gallardo and E. Fereres (2005):
"Evapotranspiration of horticultural crops in an unheated plastic greenhouse." Agricultural
Water Management 72 (2): 81-96.
Pereira, L. S., I. Cordery and I. Iacovides (2002): Coping with water scarcity. International
Hydrological Programme, UNESCO, Paris.
Pildat (2003): Issues of water resources in Pakistan. Briefing paper for Pakistani
parliamentarians No 7. Pakistani Institute of Legislative Development and Transparency.
Rosenthal, E. (2008) "In Spain, Water Is a New Battleground." The New York Times, from
http://www.nytimes.com/2008/06/03/world/europe/03dry.html?_r=2&hp&oref=slogin&or
ef=slogin
SAB-Miller. (2007): "Water - the challenge for the future." from
http://www.sabmiller.com/NR/rdonlyres/58E03323-B96C-46B1-A839-
60CA67A6AFDF/0/SABMiller_plc_waterreport_2007.pdf
Smakhtin, V., C. Revenga and P. Döll (2004): Taking into account environmental water
requirements in global-scale water resources assessments. Comprehensive Assessment
Research Report 2. Comprehensive Assessment Secretariat, Sri Lanka.

36
Soth, J., C. Grasser and R. Salerno (1999): The impact of cotton on fresh water resources and
ecosystems: A preliminary analysis. WWF International, Gland.
Tayaa (2007): Souss Massa Hydrological Study Report. WWF UK, Godalming.
UNEP (2002): Global environment outlook 3: past, present and future perspectives. Earthscan
Publications Ltd., London.
UNESCO-WWAP (2003): Water for people, water for life - United Nations World Water
Development Report. UNESCO Publishing, Paris.
UNESCO-WWAP (2006): Water, a shared responsibility. United Nations Educational,
Scientific and Cultural Organization (UNESCO), Paris.
USDA (2004): "Cotton: World markets and trade." Retrieved 4 August, 2004, from
http://www.fas.usda.gov/cotton/circular/2004/07/CottonWMT.pdf
Wackernagel, M. and W. Rees (1996): Our ecological footprint: Reducing human impact on
the earth. Gabriola Island, B.C., New Society Publishers, Canada.
Wackernagel, M. and L. Jonathan (2001): Measuring sustainable development: Ecological
footprints. Centre for Sustainability Studies, Universidad Anahuac de Xalapa, Mexico.
waterfootprint.org. (2004): "Water Footprint Calculator." from
http://www.waterfootprint.org/?page=files/WaterFootprintCalculator
WWF (2004): Living water planet report 2004.
WWF (2007): Waste Not Want Not, Sustainable water tarrifs. WWF UK, Godalming.
WWF (2008): Water at Risk. WWF UK, Godalming.