Embed Size (px)
Citation preview
1
STUDY UNIT 4
DEMAND AND SUPPLY
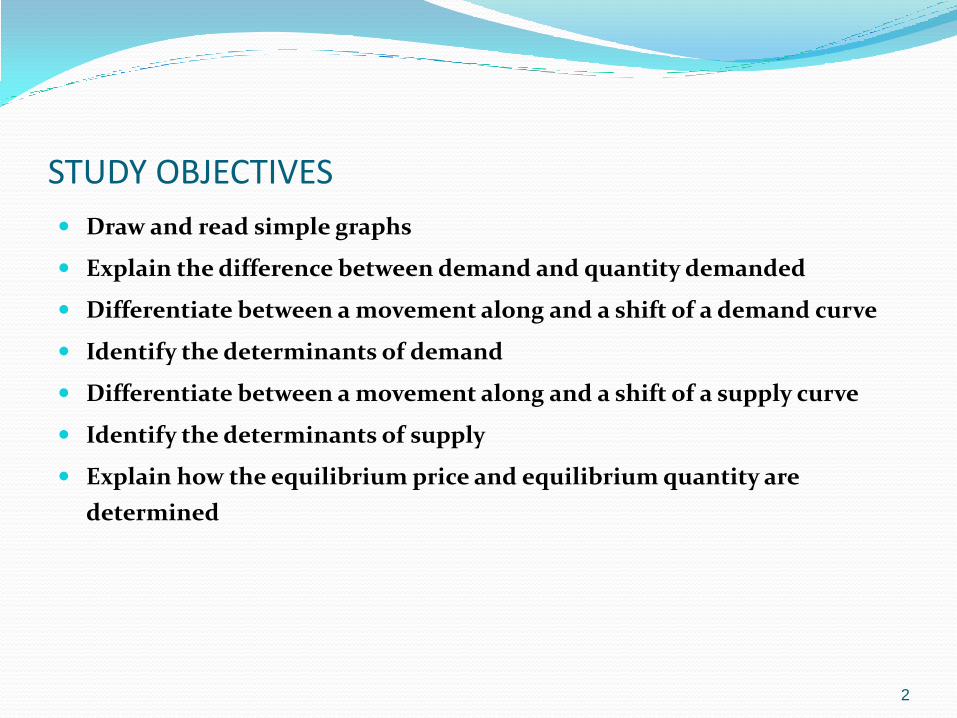
STUDY OBJECTIVES
Draw and read simple graphs
Explain the difference between demand and quantity demanded
Differentiate between a movement along and a shift of a demand curve
Identify the determinants of demand
Differentiate between a movement along and a shift of a supply curve
Identify the determinants of supply
Explain how the equilibrium price and equilibrium quantity are
determined
2
DEMAND – CONSUMERS side of the economy
Definition of demand
Individual demand vs market demand
Determinants of demand: (Pg, Px, Pf , T, Y, N)
LAW OF DEMAND
Illustrating the law of demand
o P → Qd
o P → Qd
Importance of ceteris paribus assumption
Demand schedule
Graphic derivation of a demand curve
3
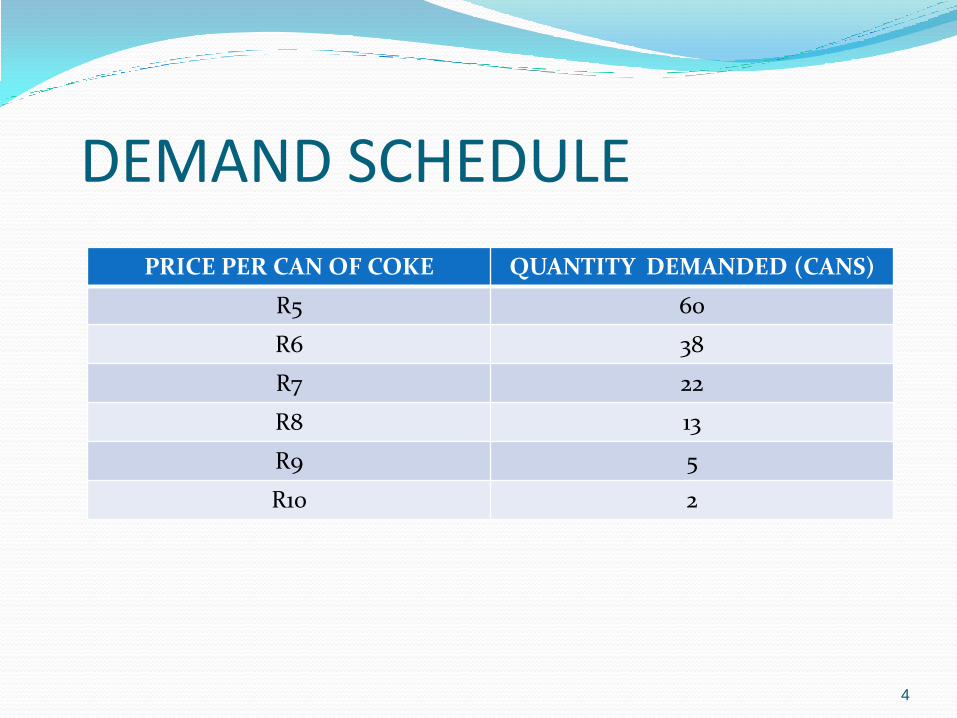
DEMAND SCHEDULE
PRICE PER CAN OF COKE QUANTITY DEMANDED (CANS)
R5 60
R6 38
R7 22
R8 13
R9 5
R10 2
4
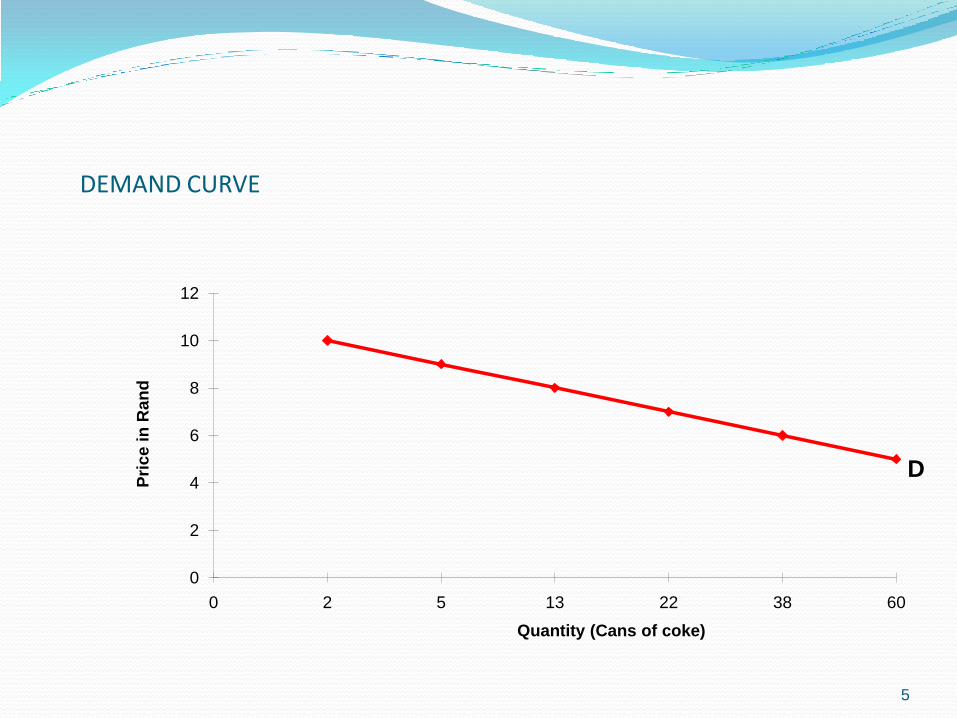
DEMAND CURVE
0
2
4
6
8
10
12
0 2 5 13 22 38 60
Pri
ce i
n R
an
d
Quantity (Cans of coke)
5
D
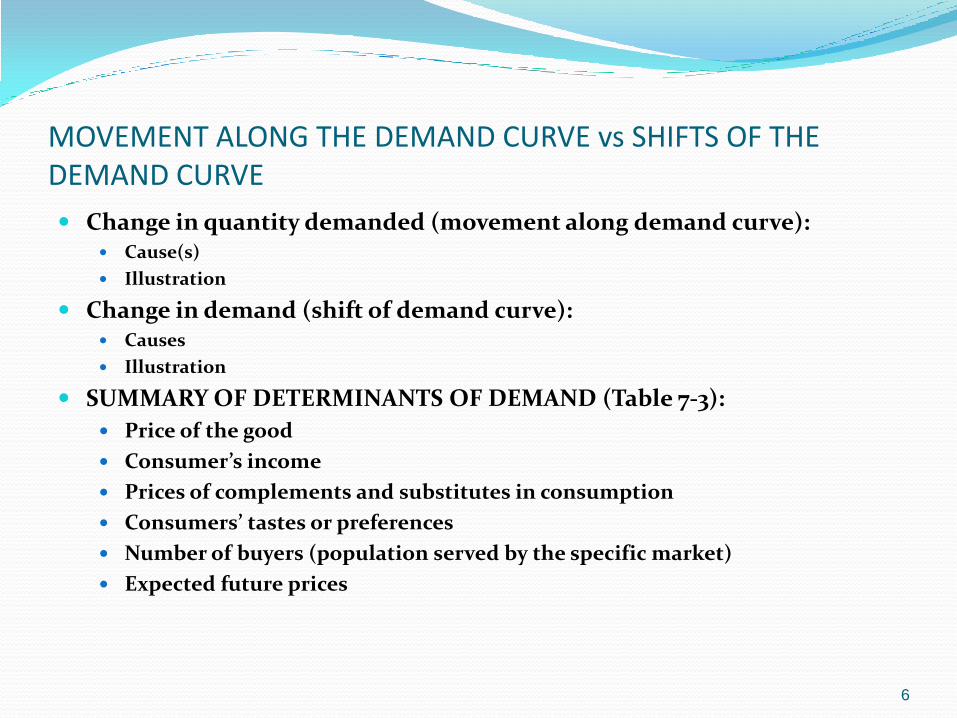
MOVEMENT ALONG THE DEMAND CURVE vs SHIFTS OF THE DEMAND CURVE
Change in quantity demanded (movement along demand curve): Cause(s)
Illustration
Change in demand (shift of demand curve): Causes
Illustration
SUMMARY OF DETERMINANTS OF DEMAND (Table 7-3):
Price of the good
Consumer’s income
Prices of complements and substitutes in consumption
Consumers’ tastes or preferences
Number of buyers (population served by the specific market)
Expected future prices
6
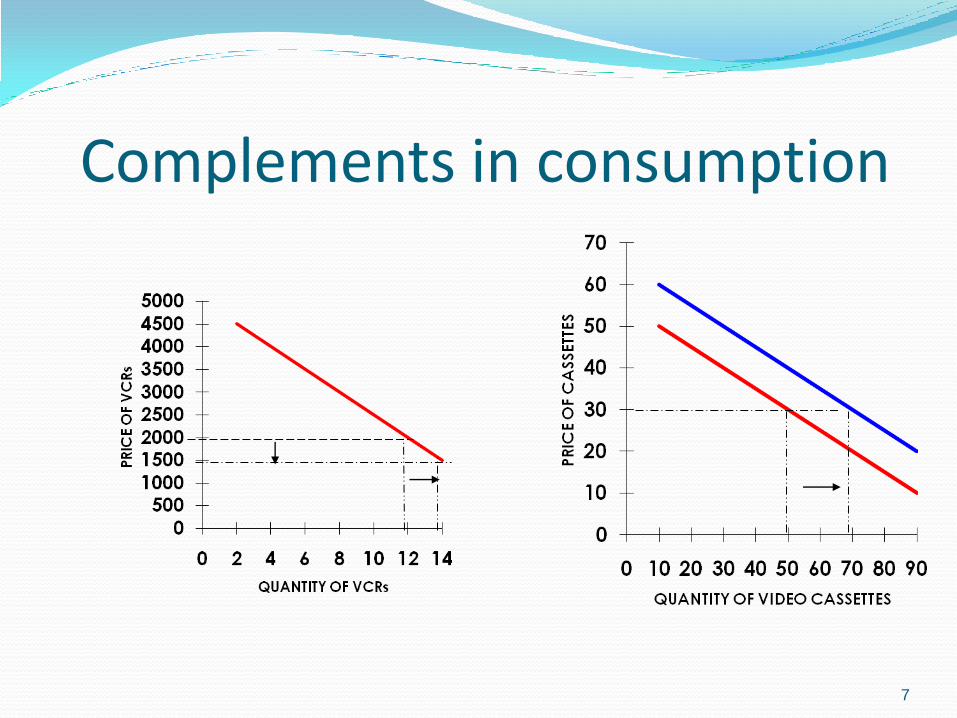
Complements in consumption
7
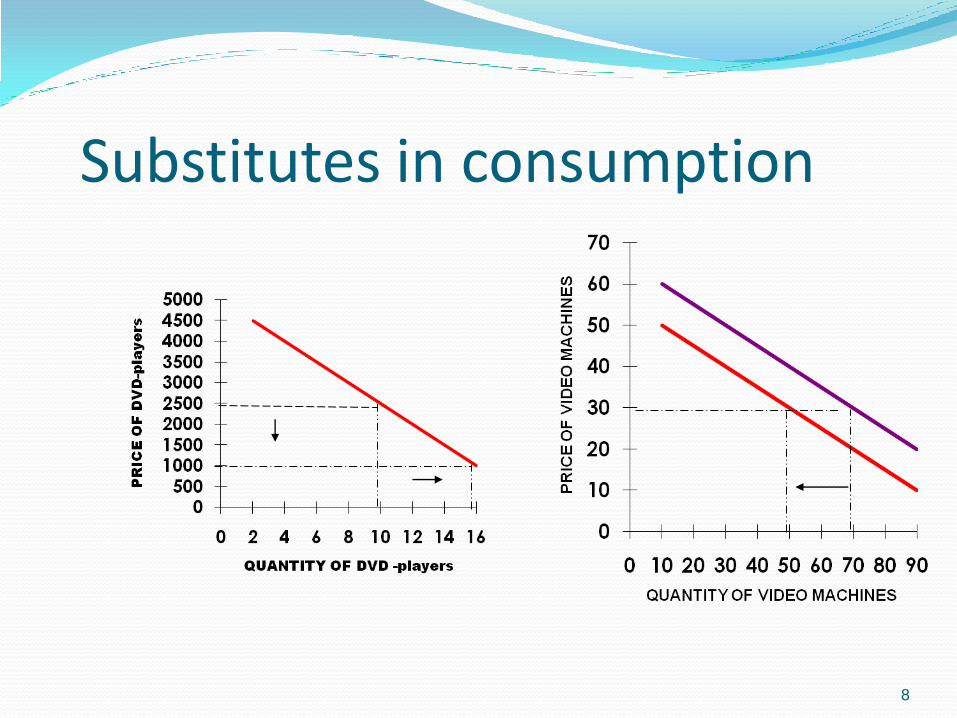
Substitutes in consumption
8
SUPPLY – (PRODUCERS)
Definition of supply
Determinants of supply
Individual supply vs market supply
LAW OF SUPPLY
Importance of ceteris paribus assumption
Illustrating the law of supply
o P → Qs
o P → Qs
SUPPLY SCHEDULE
GRAPHIC ILLUSTRATION
9
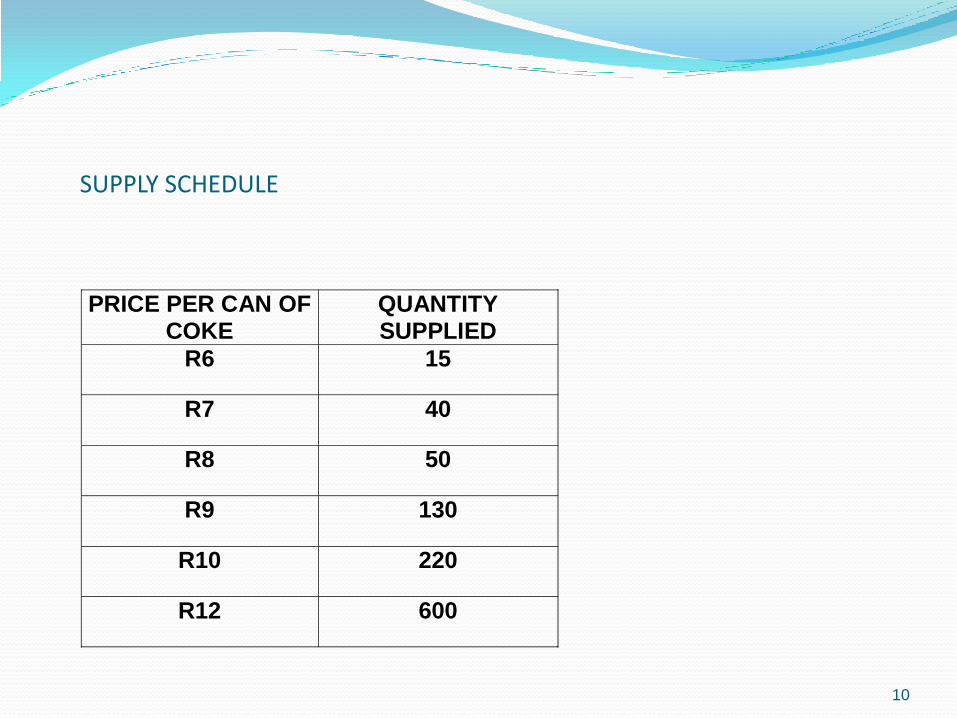
SUPPLY SCHEDULE
PRICE PER CAN OF COKE
QUANTITY SUPPLIED
R6 15
R7 40
R8 50
R9 130
R10 220
R12 600
10
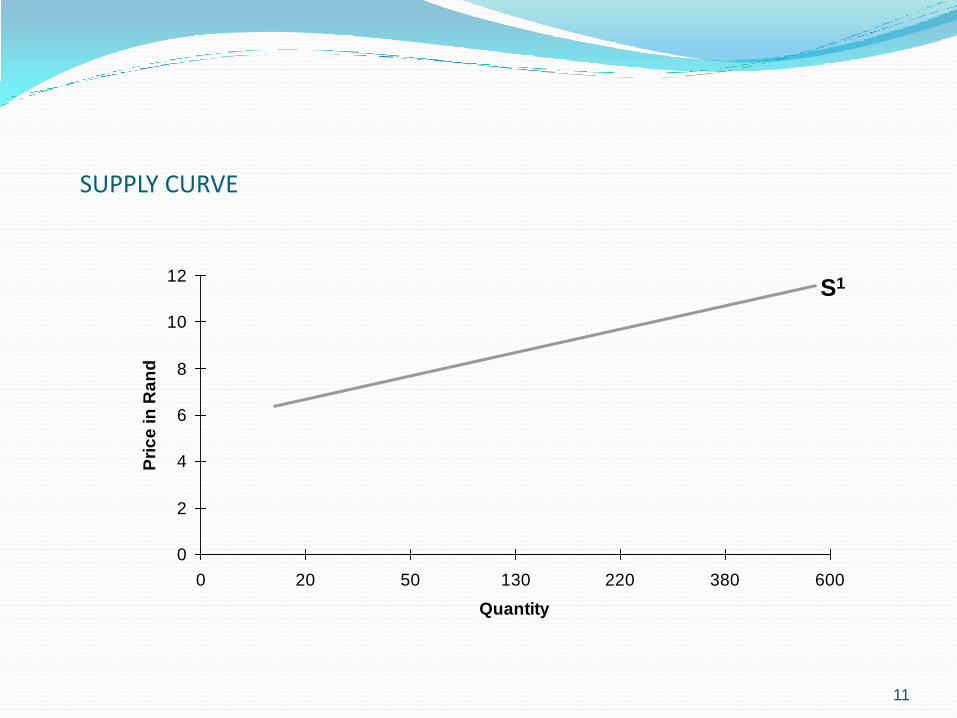
SUPPLY CURVE
0
2
4
6
8
10
12
0 20 50 130 220 380 600
Quantity
Pri
ce
in
Ra
nd
11
S1
Movement along the supply curve vs shifts of the supply curve
Change in quantity supplied (movement along supply curve): Cause(s)
Illustration
Change in supply (shift of supply curve): Causes
Illustration
SUMMARY OF DETERMINANTS OF SUPPLY (Table 7-5):
Price of the good
Prices of inputs (factors of production)
Prices of complements and substitutes in production
Technology
Number of firms
Expected future prices
12
MARKET EQUILIBRIUM Definition:
• Where Qd = Qs; NOT where demand = supply !!!!
• Shown by the point where DD and SS curves intersect.
• There is NO EXCESS demand nor EXCESS SUPPLY at equilibrium.
Disequilibrium: Definition
Implications in the market
How is equilibrium restored?
13
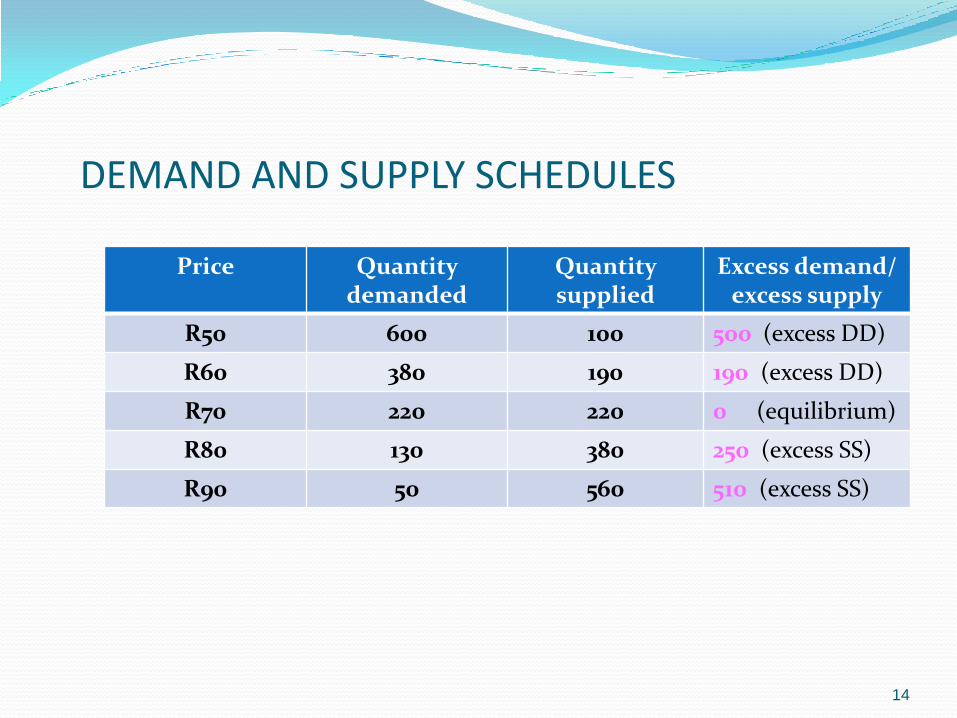
DEMAND AND SUPPLY SCHEDULES
Price Quantity demanded
Quantity supplied
Excess demand/excess supply
R50 600 100 500 (excess DD)
R60 380 190 190 (excess DD)
R70 220 220 0 (equilibrium)
R80 130 380 250 (excess SS)
R90 50 560 510 (excess SS)
14
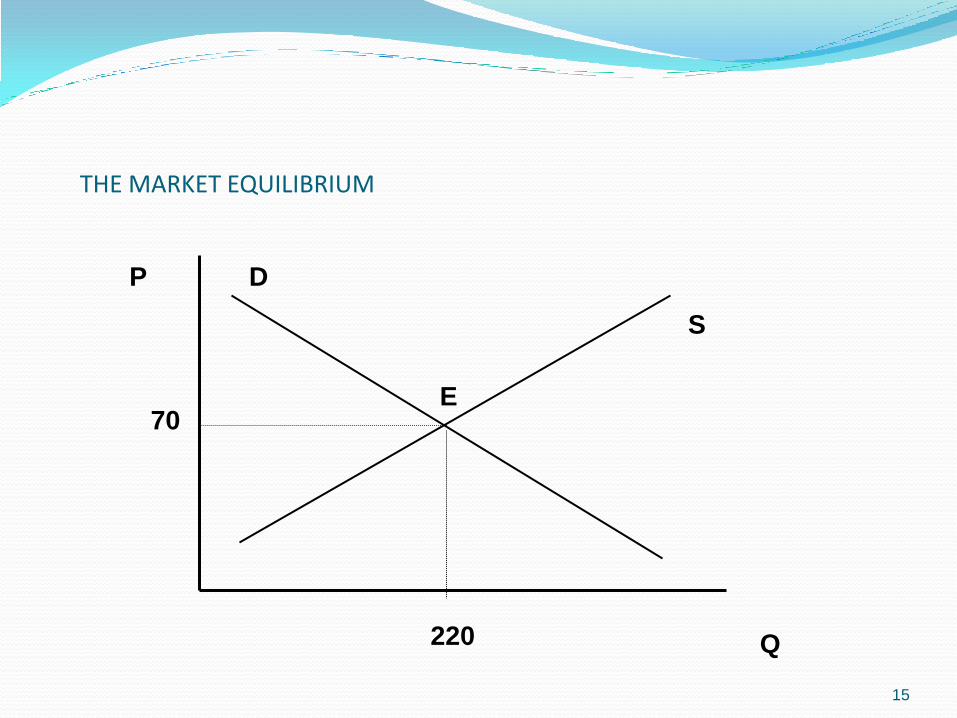
THE MARKET EQUILIBRIUM
15
Q
P
S
D
E
220
70
CLASS ACTIVITY –Demand and supply1. An increase in the price of a substitute product in consumption will
shift the ..................... curve to the ........................... [Hint: demand , supply, left, right]
2. An increase in the price of a substitute product in production shift the .............................curve to the .......................
16
ILLUSTRATE THE LAW OF DEMAND GRAPHICALLY
17
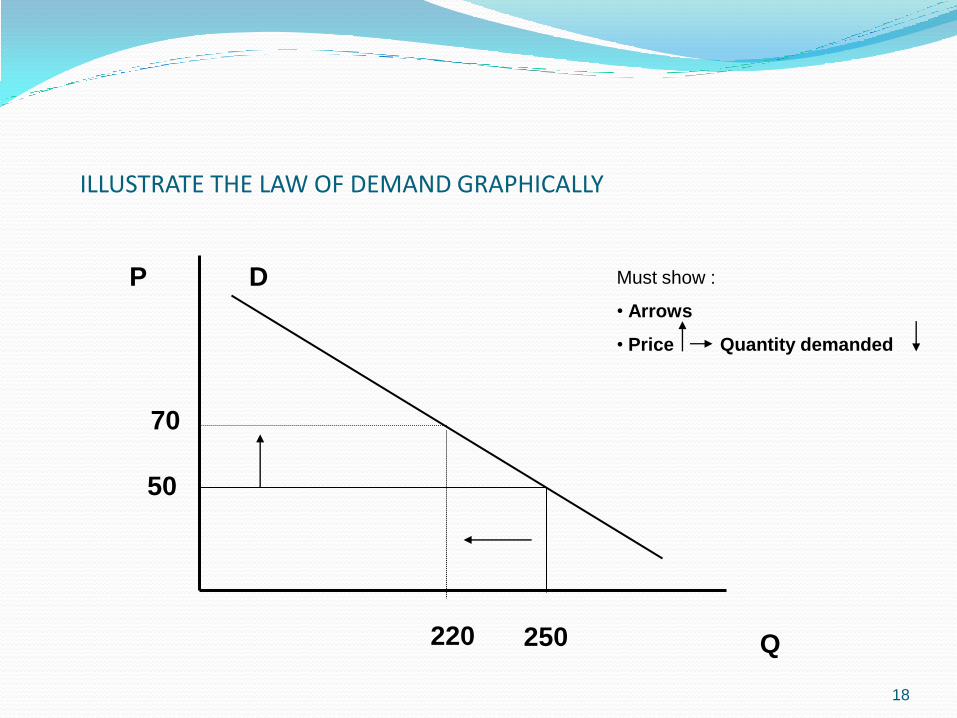
ILLUSTRATE THE LAW OF DEMAND GRAPHICALLY
18
Q
P D
220
70
250
50
Must show :
• Arrows
• Price Quantity demanded
ILLUSTRATE AN INCREASE IN THE PRICE OF BEEF DEMANDED
19
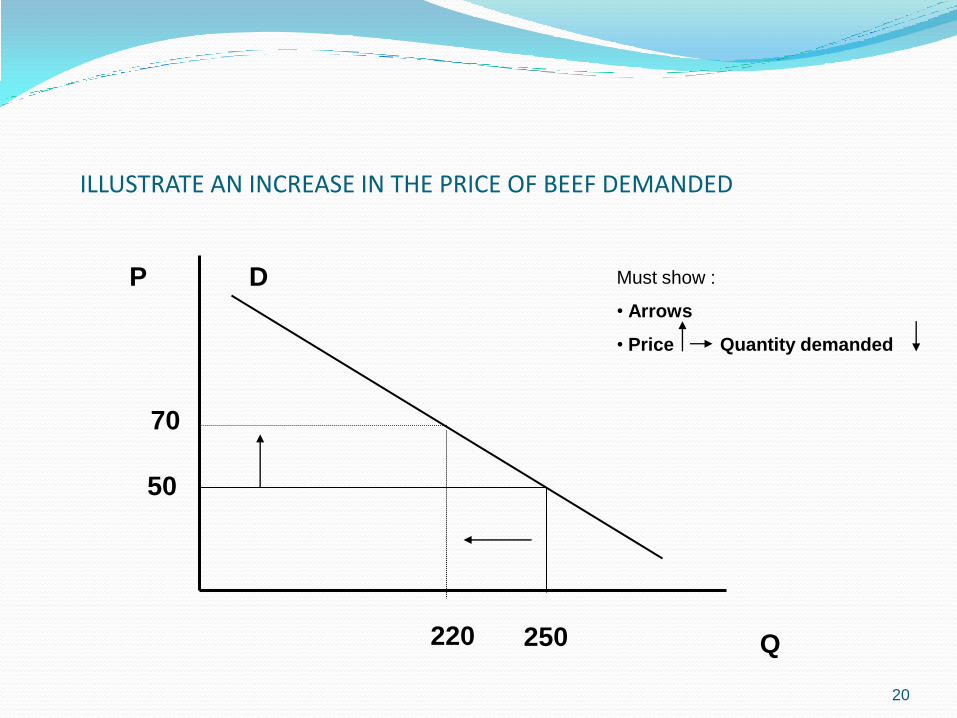
ILLUSTRATE AN INCREASE IN THE PRICE OF BEEF DEMANDED
20
Q
P D
220
70
250
50
Must show :
• Arrows
• Price Quantity demanded
ILLUSTRATE WHAT HAPPENS TO DEMAND OR SUPPLY IF THERE IS AN
INCREASE IN INCOME (CASE OF NORMAL GOOD)
21
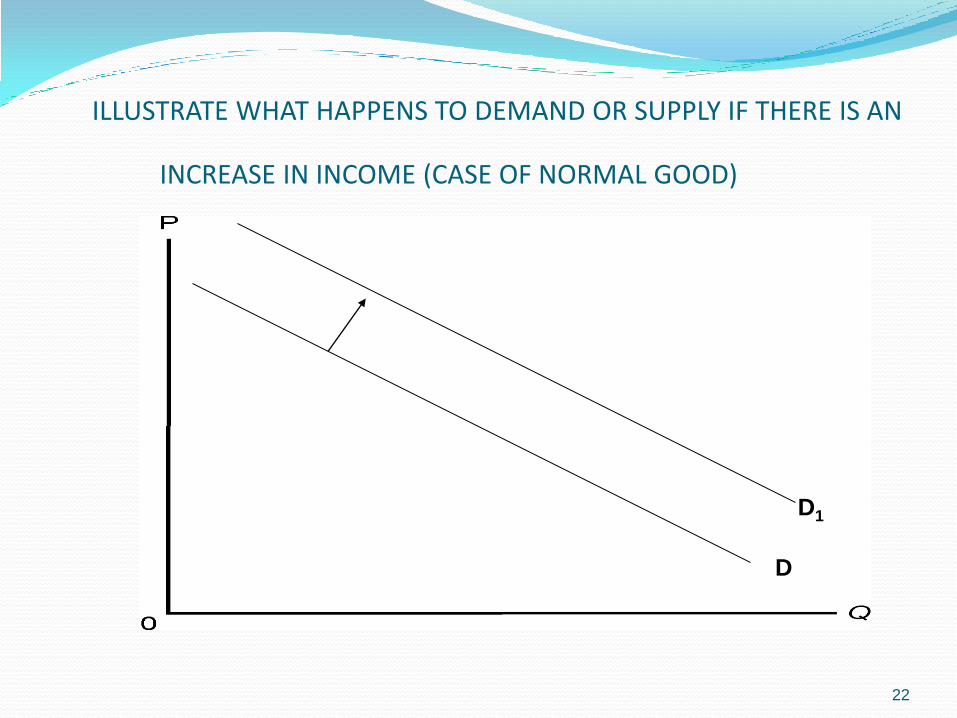
ILLUSTRATE WHAT HAPPENS TO DEMAND OR SUPPLY IF THERE IS AN
INCREASE IN INCOME (CASE OF NORMAL GOOD)
22
D
D1
ILLUSTRATE WHAT HAPPENS TO THE SUPPLY CURVE IF THE PRICE OF
THE PRODUCT SUPPLIED INCREASES
23
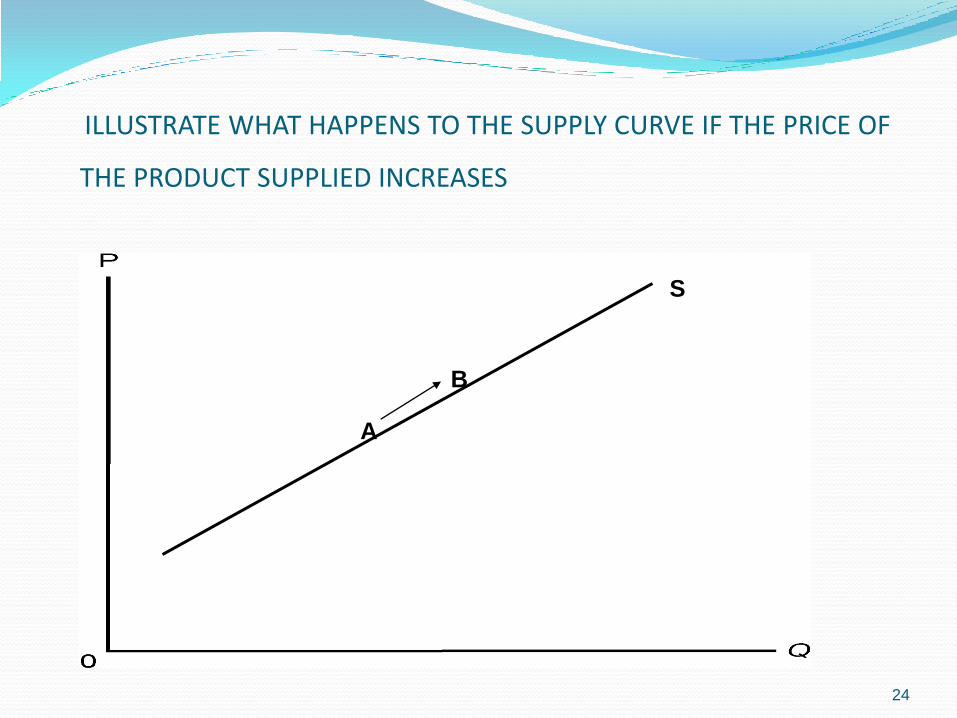
ILLUSTRATE WHAT HAPPENS TO THE SUPPLY CURVE IF THE PRICE OF
THE PRODUCT SUPPLIED INCREASES
24
S
A
B
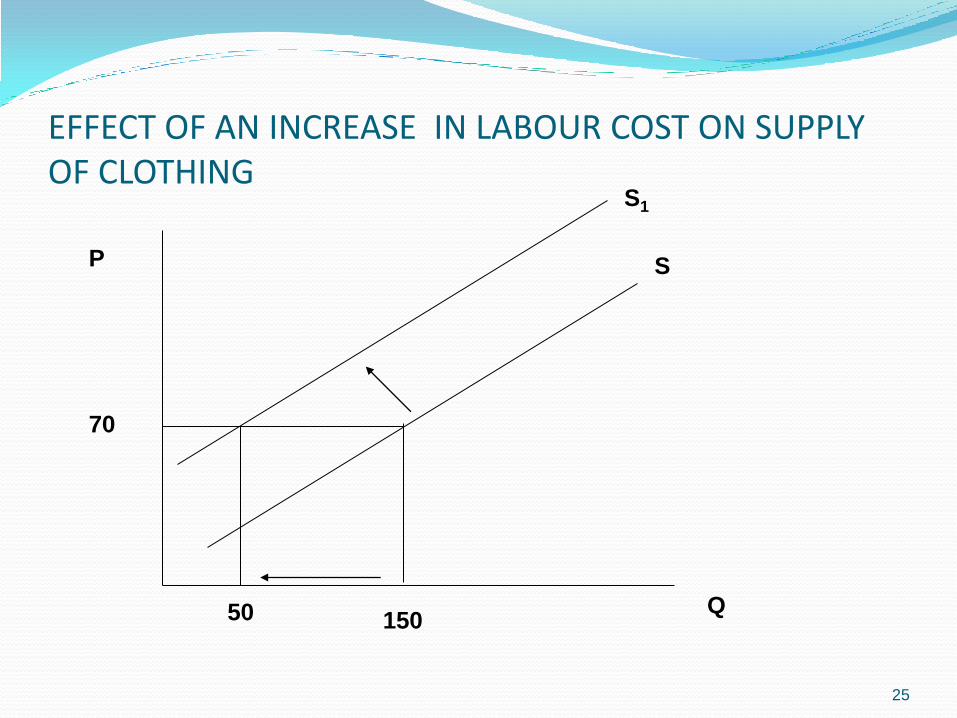
EFFECT OF AN INCREASE IN LABOUR COST ON SUPPLY OF CLOTHING
25
P
Q
S
S1
15050
70
ILLUSTRATE WHAT HAPPENS TO THE DEMAND OR SUPPLY CURVES IF A COST REDUCING TECHNOLOGY IS IMPLEMENTED
26
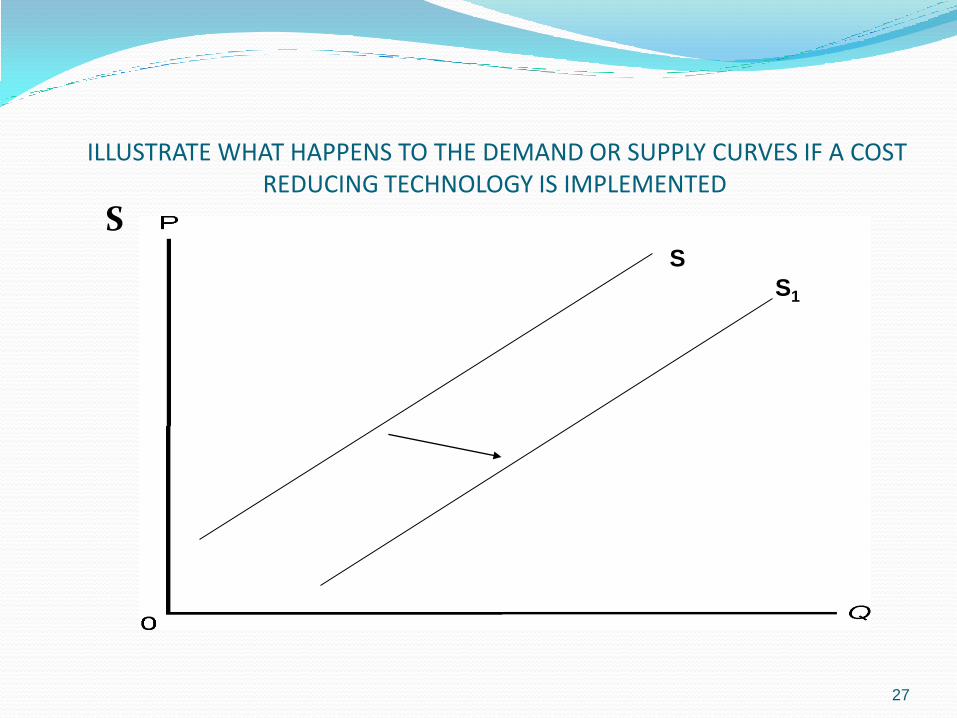
ILLUSTRATE WHAT HAPPENS TO THE DEMAND OR SUPPLY CURVES IF A COST REDUCING TECHNOLOGY IS IMPLEMENTED
27
SS
S1
28
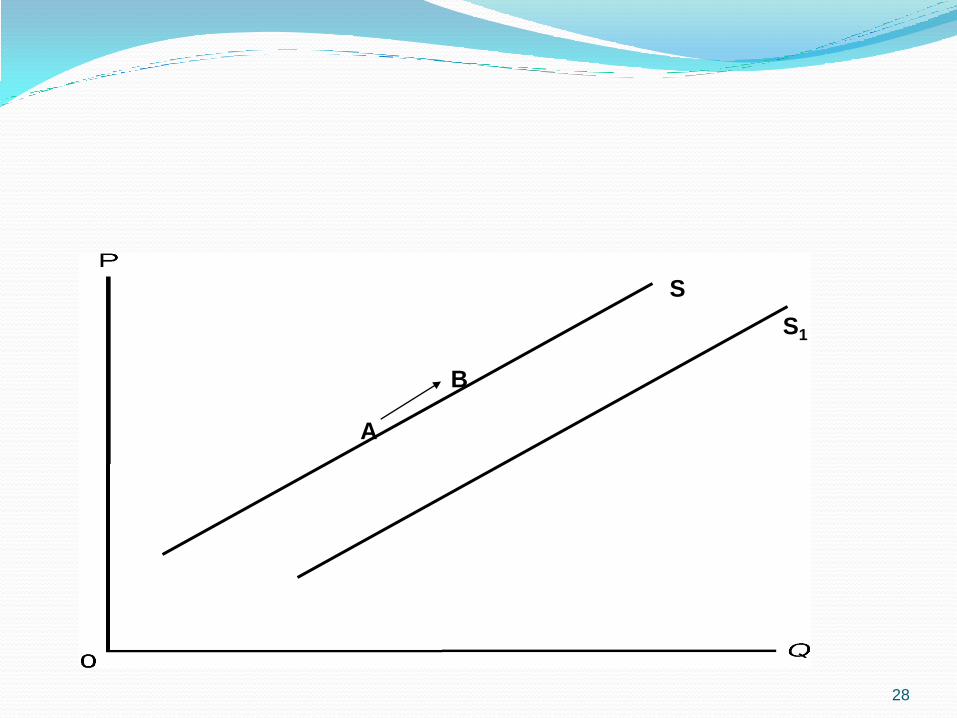
S
A
B
S1
QUESTIONS TO SLIDE 26
Name one factor which causes a movement from point A to Point B?
Name three reasons for a shift in the curve from S to S1. Indicate clearly direction of change in each case?
29
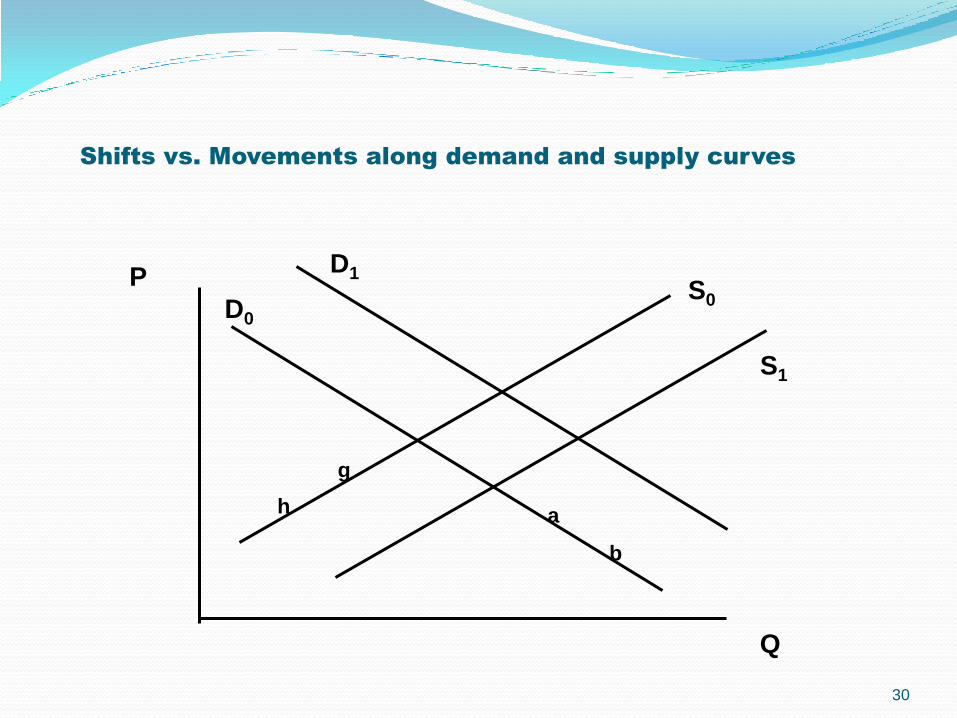
Shifts vs. Movements along demand and supply curves
30
Q
PS0D0
a
g
S1
D1
h
b
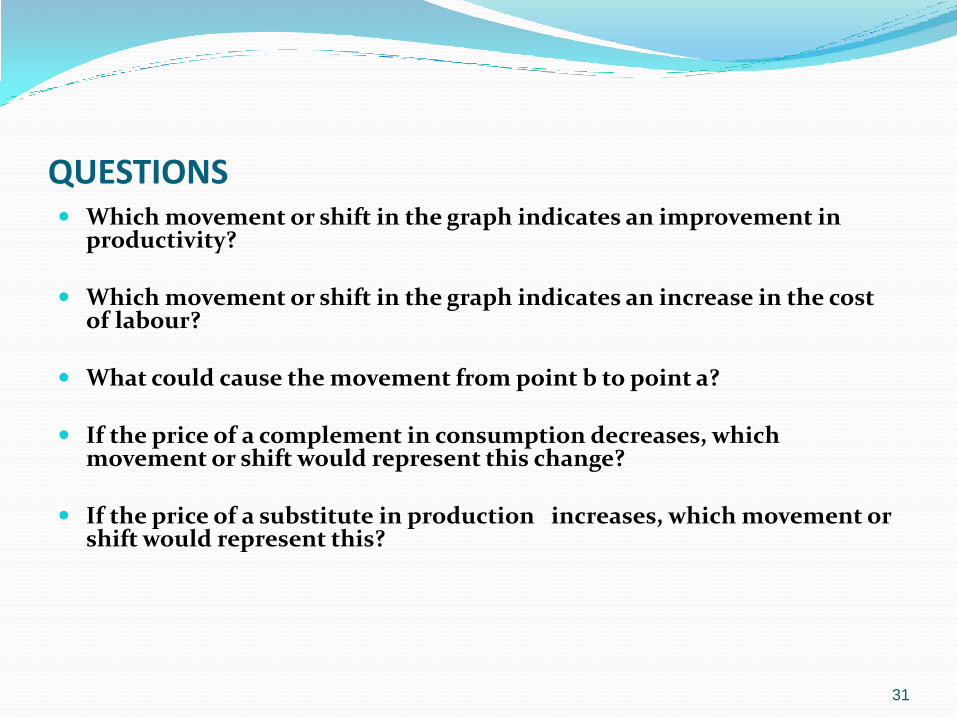
QUESTIONS Which movement or shift in the graph indicates an improvement in
productivity?
Which movement or shift in the graph indicates an increase in the cost of labour?
What could cause the movement from point b to point a?
If the price of a complement in consumption decreases, which movement or shift would represent this change?
If the price of a substitute in production increases, which movement or shift would represent this?
31
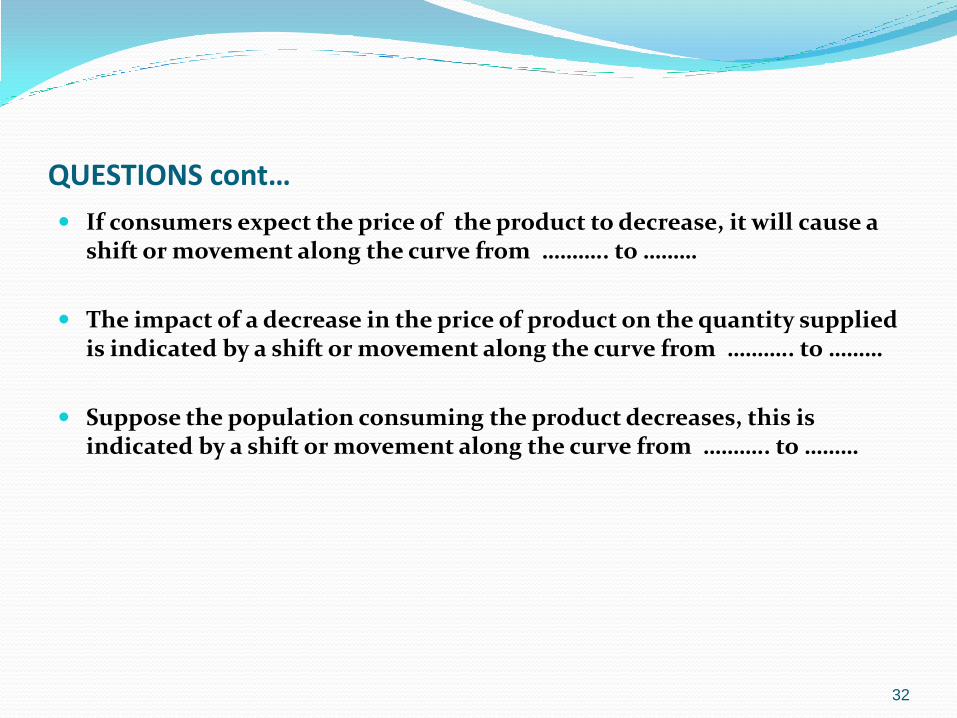
QUESTIONS cont…
If consumers expect the price of the product to decrease, it will cause a shift or movement along the curve from ……….. to ………
The impact of a decrease in the price of product on the quantity supplied is indicated by a shift or movement along the curve from ……….. to ………
Suppose the population consuming the product decreases, this is indicated by a shift or movement along the curve from ……….. to ………
32
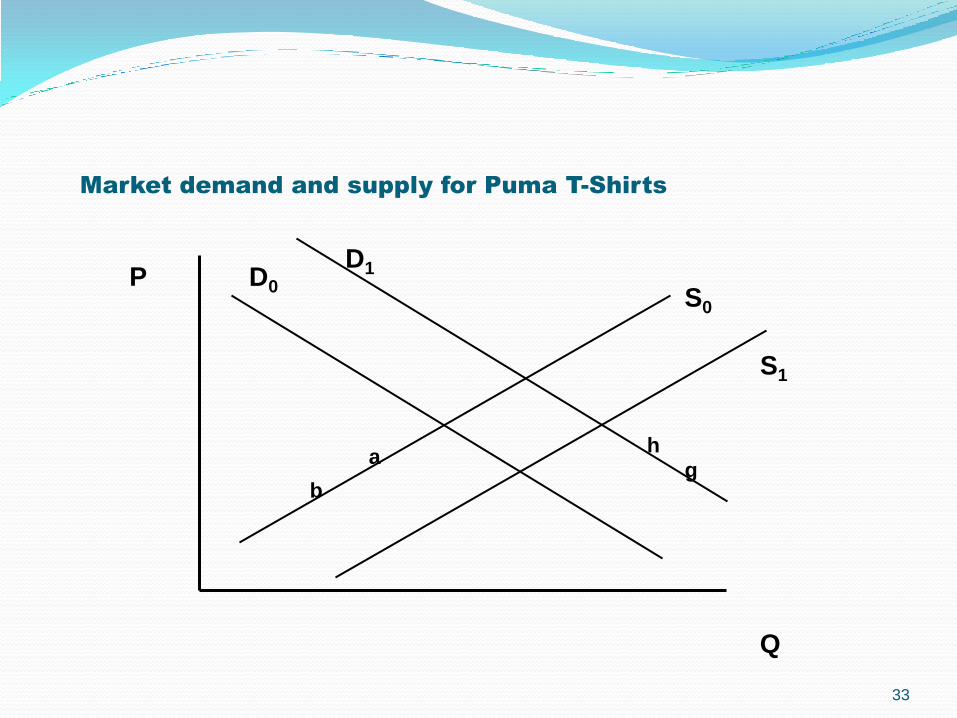
Market demand and supply for Puma T-Shirts
33
Q
PS0
D0
ag
S1
D1
h
b
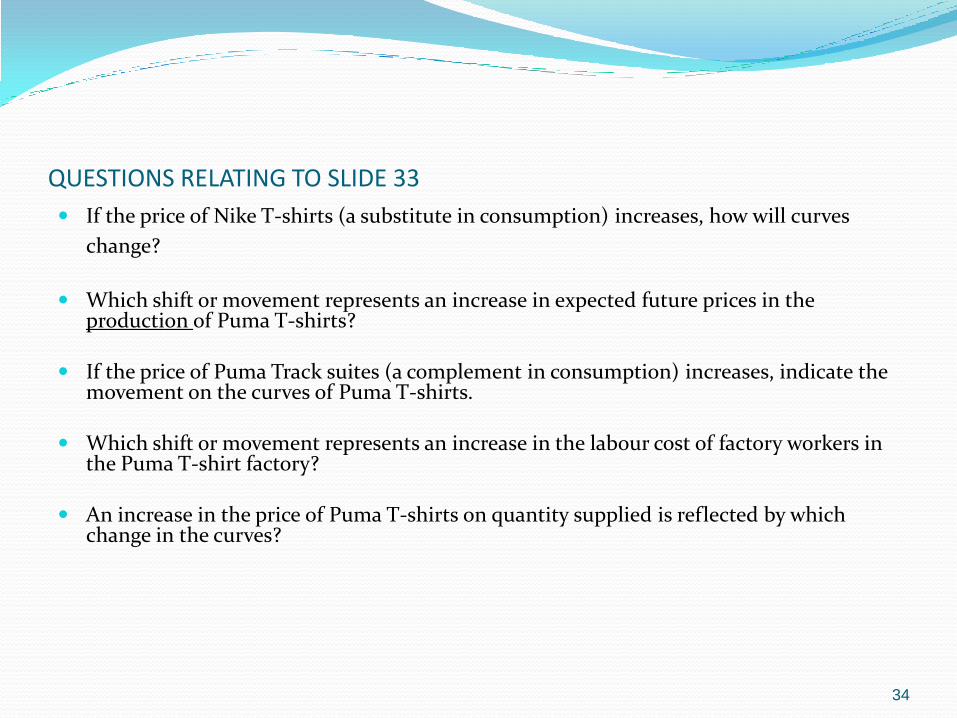
QUESTIONS RELATING TO SLIDE 33
If the price of Nike T-shirts (a substitute in consumption) increases, how will curves
change?
Which shift or movement represents an increase in expected future prices in the production of Puma T-shirts?
If the price of Puma Track suites (a complement in consumption) increases, indicate the movement on the curves of Puma T-shirts.
Which shift or movement represents an increase in the labour cost of factory workers in the Puma T-shirt factory?
An increase in the price of Puma T-shirts on quantity supplied is reflected by which change in the curves?
34
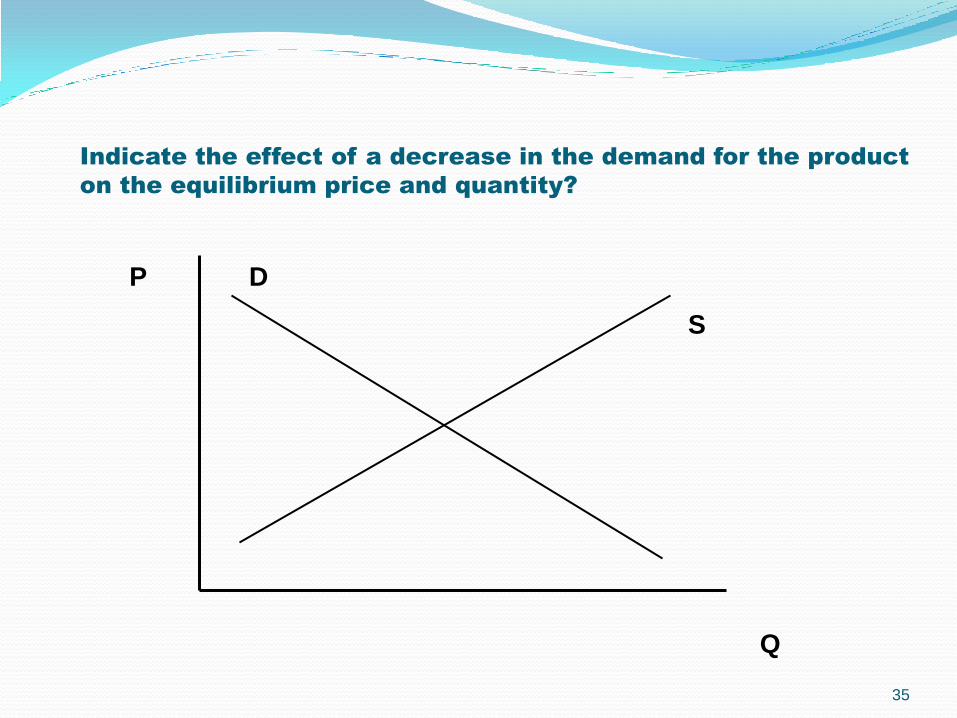
Indicate the effect of a decrease in the demand for the product
on the equilibrium price and quantity?
35
Q
P
S
D
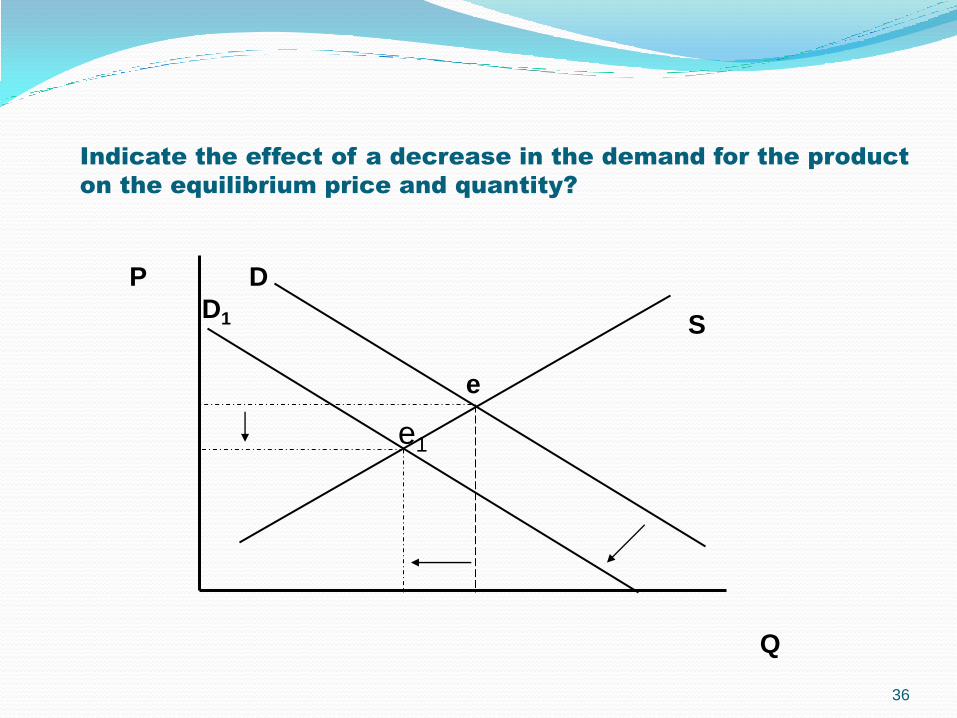
Indicate the effect of a decrease in the demand for the product
on the equilibrium price and quantity?
36
Q
P
S
D
D1
e
e1
Make use of the set of axes in the diagram below to illustrate what will happen to the demand
and/or supply curve of a good if the price of a complement in production increases.
37
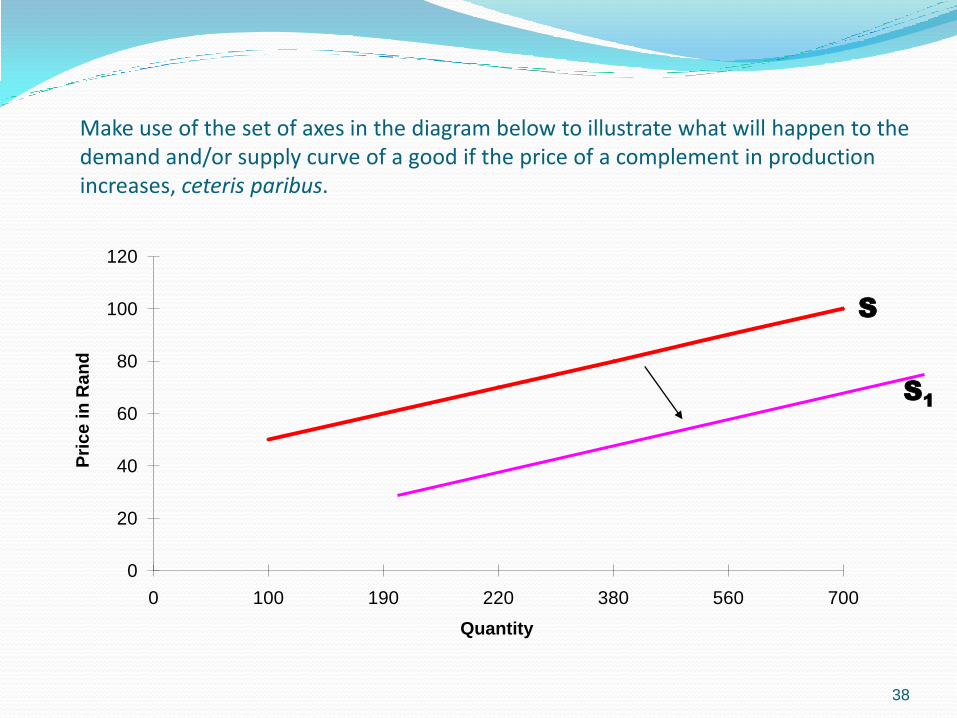
Make use of the set of axes in the diagram below to illustrate what will happen to the demand and/or supply curve of a good if the price of a complement in production increases, ceteris paribus.
0
20
40
60
80
100
120
0 100 190 220 380 560 700
Pri
ce
in
Ra
nd
Quantity
38
S
S1
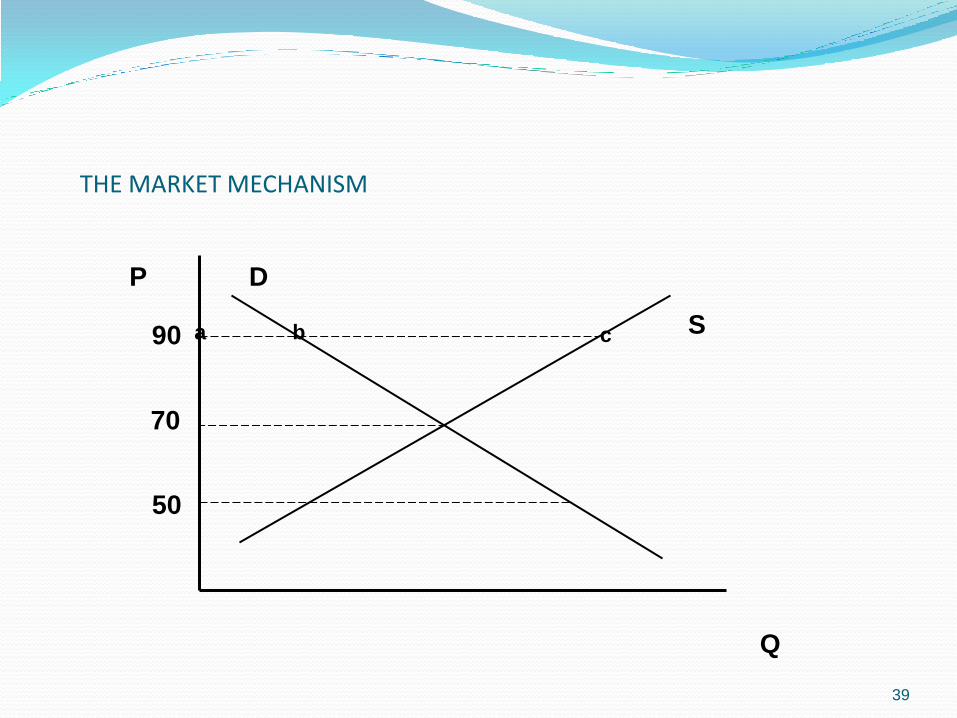
THE MARKET MECHANISM
39
Q
P
S
D
70
50
90 cba
QUESTIONS
At which price level will the market experience excess supply?
What happens at a price level of R50?
If excess supply is experienced in the market, what must happen to restore equilibrium?
If excess demand is experienced in the market, what must happen to restore equilibrium?
40
Illustrate market equilibrium and indicate the equilibrium price and quantity.
41
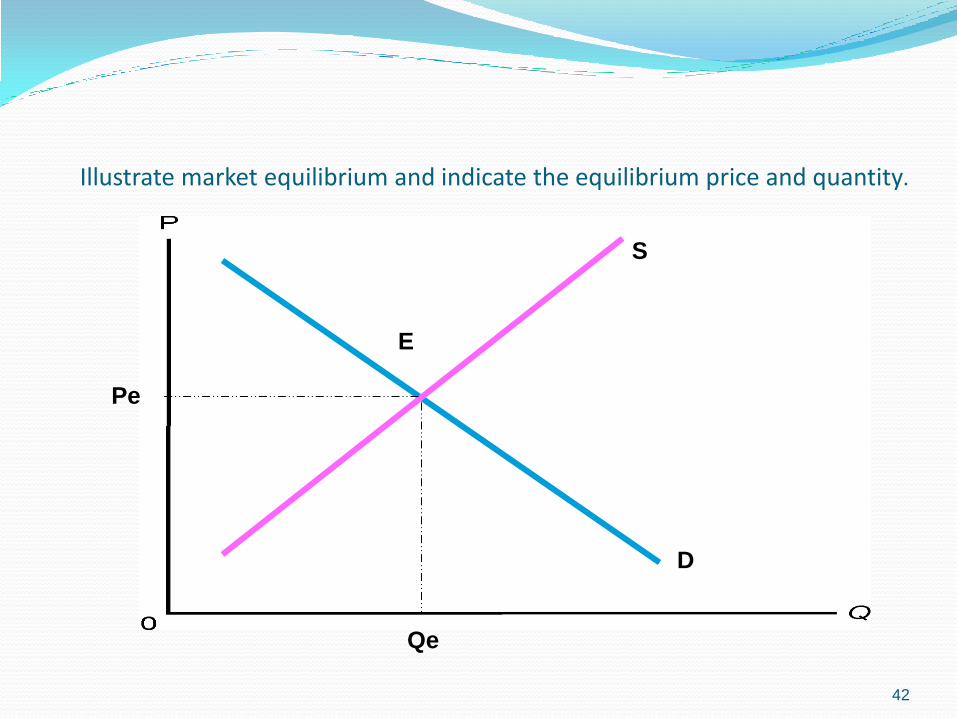
Illustrate market equilibrium and indicate the equilibrium price and quantity.
42
E
D
S
Qe
Pe
43
A decrease in the price of duvet covers. An increase in the demand for duvet inners.
44
An increase in the price of cotton, a
substitute in consumption.
Change in the demand for linen.
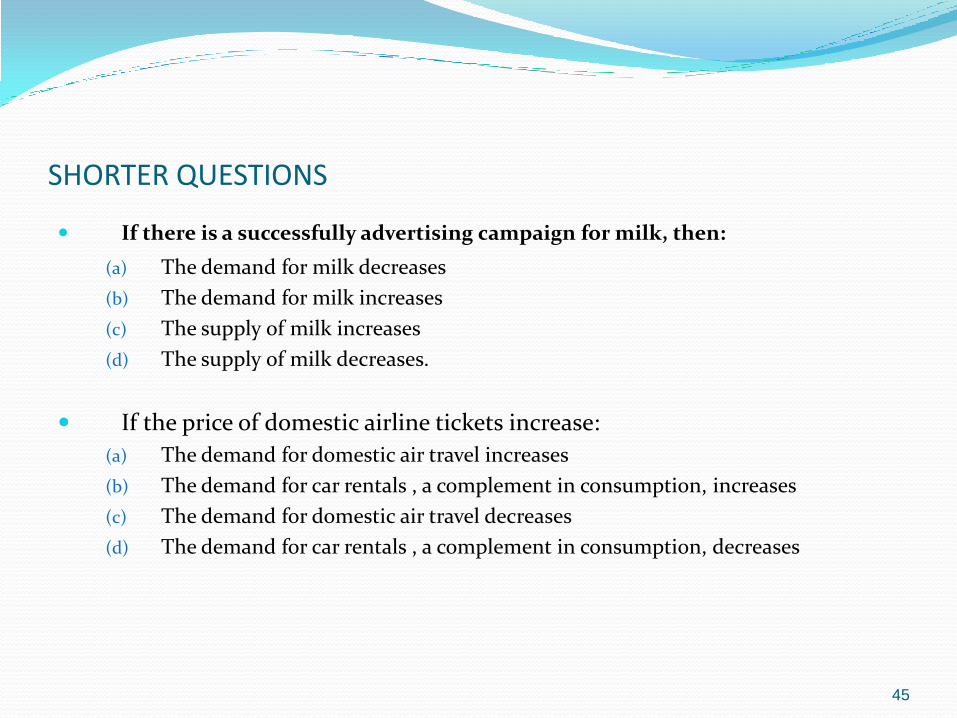
SHORTER QUESTIONS
If there is a successfully advertising campaign for milk, then:
(a) The demand for milk decreases
(b) The demand for milk increases
(c) The supply of milk increases
(d) The supply of milk decreases.
If the price of domestic airline tickets increase:
(a) The demand for domestic air travel increases
(b) The demand for car rentals , a complement in consumption, increases
(c) The demand for domestic air travel decreases
(d) The demand for car rentals , a complement in consumption, decreases
45
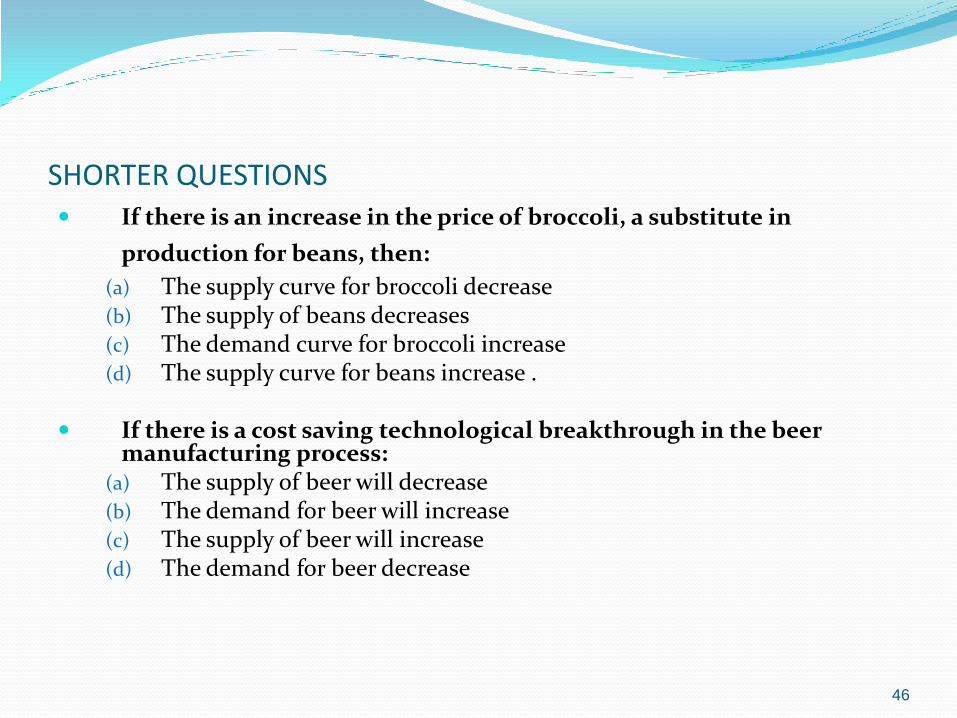
SHORTER QUESTIONS If there is an increase in the price of broccoli, a substitute in
production for beans, then:
(a) The supply curve for broccoli decrease(b) The supply of beans decreases(c) The demand curve for broccoli increase(d) The supply curve for beans increase .
If there is a cost saving technological breakthrough in the beer manufacturing process:
(a) The supply of beer will decrease(b) The demand for beer will increase(c) The supply of beer will increase(d) The demand for beer decrease
46