Embed Size (px)
Citation preview

4th Joint International Symposium on Deformation Monitoring (JISDM), 15-17 May 2019, Athens, Greece
1
Study the Deformation of Elevated Water Storage Tank
Sara Sameh1, Zaki Zeidan2, Ashraf A. Beshr 3
1B. Sc., Demonstrator, Civil Engineering department, Badr University in Cairo, ([email protected]) 2 Prof. of applied geodesy, Public Works department, Faculty of Engineering, Mansoura University, ([email protected]) 3
Ph.D., Assistant Prof., Public Works department, Faculty of Engineering, Mansoura University,
Keywords: Reflector-less total station; Monitoring, Setting out; Accuracy; Water tank; Structure deformation. ABSTRACT
Deformation of any engineering structure may cause damages and failure to structures itself and sometimes loss of life and injury to people. Structure deformation may occurred due to several reasons, such as the incomplete investigation of foundation soil properties, improper construction of the foundation system, insufficient knowledge of the operating conditions, earthquakes etc. So, continuous monitoring for deformation of the structure is important and vital because observations and recordings of deformation don’t present only scientific interest for the civil engineers, but they are also indications of the long-term behavior of the structure Water storage tanks are widely used in both residential and commercial areas. Based on the location of the tank, the tanks can be classified as elevated, on ground or underground. Water storage devices made from different materials. Water storage tanks are widely used in both residential and commercial areas. Based on the location of the tank, the tanks can be classified as elevated, on ground or underground. Water storage devices made from different materials. This paper investigates the deformation observations techniques and results analysis of monitoring elevated water storage tank. Monitoring of the water tank settlement and deformation has gradually gained greater importance in tank maintenance programs. As results of monitoring the water storage tank deformation, circular reinforced concrete beams and vertical inclination reinforced concrete columns at three monitoring epochs
A. Introduction
Any movements of the monitoring point locations on the monitored structure (and thus deformations of the structure) can be detected by maintaining the same point locations over time and by performing measurements to them at specified time intervals enabling direct point displacement comparisons. A common approach for this method is to place physical targets on each chosen discrete point to which measurements can be made. However, there are certain situations in which monitoring the deformations of a large structure using direct displacement measurements of targeted points is uneconomical, unsafe, inefficient, or simply impossible. Reasons for this limitation vary, but it may be as simple as placement of permanent target prisms on the structure is too difficult or costly.
To obtain the correct object point displacements (and thus its deformation), the stability of the reference stations and control points must be ensured. The main conclusion from the many papers written on this topic states that every measurement made to a monitored object must be connected to stable control points. This is accomplished by creating a reference
network of control points surrounding a particular structure
II. DESCRIPTION OF THE STUDIED WATER TANK AND SITE
The studied tank is located in the residential area of Meet EL Qureshy village at Meet Ghamer city , about 65 Km south west of the Mansoura city, Dakhlia , Egypt. The studied water storage tank was designed to serve many villages,Meet EL Qureshy village and other near villages, located in the local governmental area of Meet Ghamer ,Dakhlia, Egypt . The water storage tank which designed to delivery water to around 50000 people is part of water station Figure (1) .The water station, which includes the studied water storage tank, contains six wells also to supply for the water tank, and two small rooms one for the electrical generator and the other one contains an electrical transformer beside a small office with a bathroom and a room for a chloride and storeroom. The water station was located on an approximate area 1717 m2 and Bounded from the east direction with a residential area with a common brick wall its length was 49.65 m and from the west direction crowded population area without any wall, as in the north direction, there is an agricultural land and from the south side, the entrance of water station .
4th Joint International Symposium on Deformation Monitoring (JISDM), 15-17 May 2019, Athens, Greece
2
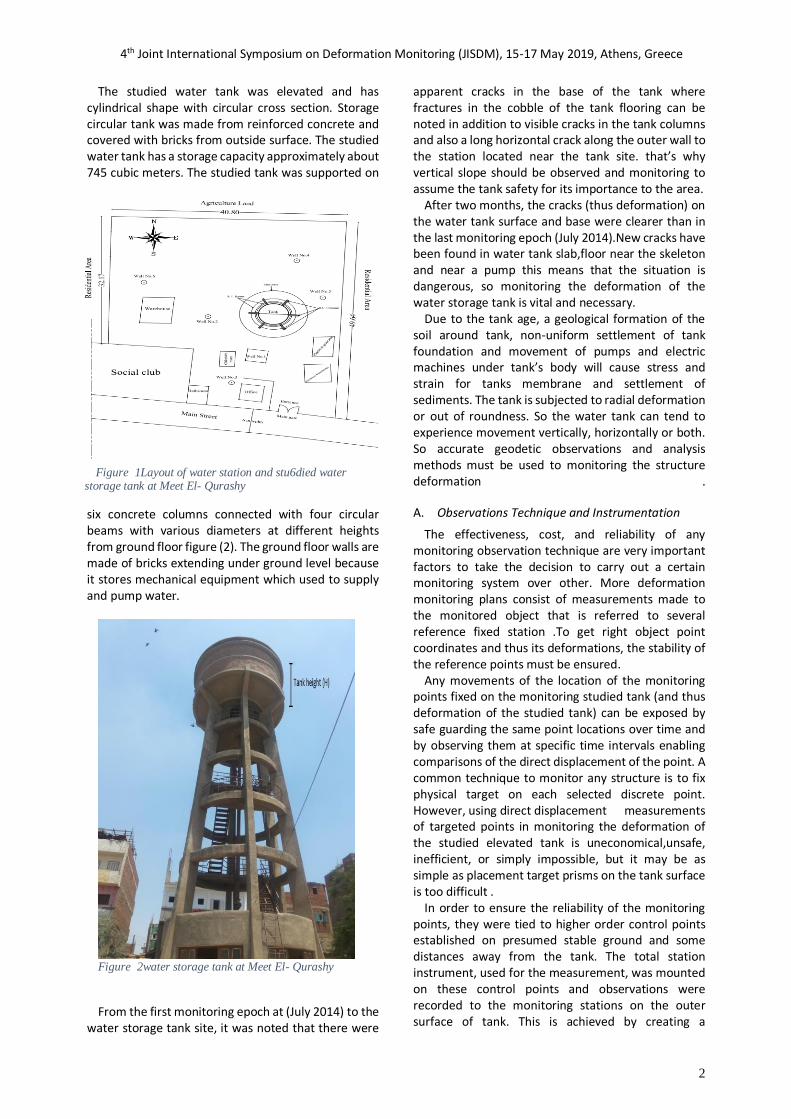
The studied water tank was elevated and has cylindrical shape with circular cross section. Storage circular tank was made from reinforced concrete and covered with bricks from outside surface. The studied water tank has a storage capacity approximately about 745 cubic meters. The studied tank was supported on
six concrete columns connected with four circular beams with various diameters at different heights from ground floor figure (2). The ground floor walls are made of bricks extending under ground level because it stores mechanical equipment which used to supply and pump water.
Figure 2water storage tank at Meet El- Qurashy
From the first monitoring epoch at (July 2014) to the
water storage tank site, it was noted that there were
apparent cracks in the base of the tank where fractures in the cobble of the tank flooring can be noted in addition to visible cracks in the tank columns and also a long horizontal crack along the outer wall to the station located near the tank site. that’s why vertical slope should be observed and monitoring to assume the tank safety for its importance to the area.
After two months, the cracks (thus deformation) on the water tank surface and base were clearer than in the last monitoring epoch (July 2014).New cracks have been found in water tank slab,floor near the skeleton and near a pump this means that the situation is dangerous, so monitoring the deformation of the water storage tank is vital and necessary.
Due to the tank age, a geological formation of the soil around tank, non-uniform settlement of tank foundation and movement of pumps and electric machines under tank’s body will cause stress and strain for tanks membrane and settlement of sediments. The tank is subjected to radial deformation or out of roundness. So the water tank can tend to experience movement vertically, horizontally or both. So accurate geodetic observations and analysis methods must be used to monitoring the structure deformation .
A. Observations Technique and Instrumentation
The effectiveness, cost, and reliability of any monitoring observation technique are very important factors to take the decision to carry out a certain monitoring system over other. More deformation monitoring plans consist of measurements made to the monitored object that is referred to several reference fixed station .To get right object point coordinates and thus its deformations, the stability of the reference points must be ensured.
Any movements of the location of the monitoring points fixed on the monitoring studied tank (and thus deformation of the studied tank) can be exposed by safe guarding the same point locations over time and by observing them at specific time intervals enabling comparisons of the direct displacement of the point. A common technique to monitor any structure is to fix physical target on each selected discrete point. However, using direct displacement measurements of targeted points in monitoring the deformation of the studied elevated tank is uneconomical,unsafe, inefficient, or simply impossible, but it may be as simple as placement target prisms on the tank surface is too difficult .
In order to ensure the reliability of the monitoring points, they were tied to higher order control points established on presumed stable ground and some distances away from the tank. The total station instrument, used for the measurement, was mounted on these control points and observations were recorded to the monitoring stations on the outer surface of tank. This is achieved by creating a
Figure 1Layout of water station and stu6died water storage tank at Meet El- Qurashy
4th Joint International Symposium on Deformation Monitoring (JISDM), 15-17 May 2019, Athens, Greece
3
reference network of control points surrounding a particular structure.
The suggested monitoring scheme of the studied tank consists of a small horizontal geodetic network around the tank and selected monitoring points distributed on the tank (beams,columns,tank body) to cover its full circular body. The main objective of the selected network is to provide a number of stations whose relative and absolute positions, are accurately established.
The equipment used were one reflectorless total station (Geomax) with accessories which its manufacturer quotes a standard devision 1” for angle measurements , ±( 2mm +2ppm ×D) for EDM measurements with reflector and ±( 3mm +3ppm ×D) for EDM measurements without reflector,two tripods + 2 plumb bobs and two-foot plates. The used instruments must be calibrated to confirm the specified accuracy for measuring angles and distance.
III. DETERMINING THE PLANE COORDINATES OF
MONITORING POINTS ON TANK SURFACE
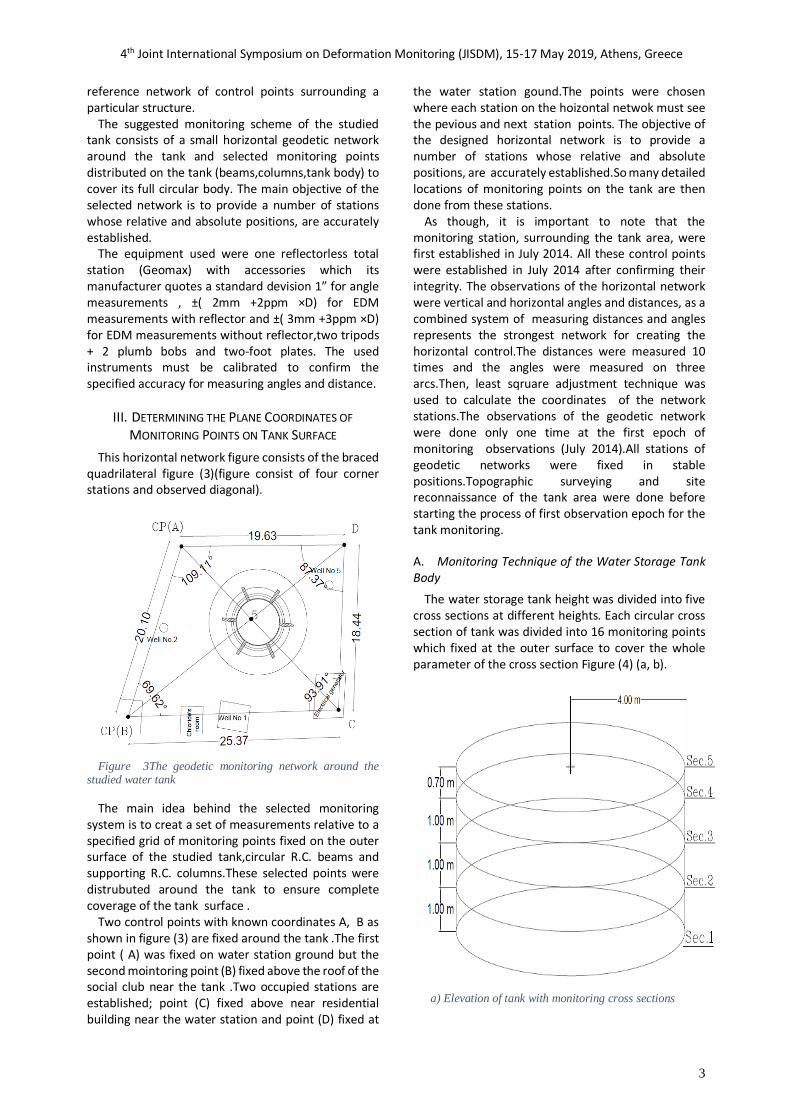
This horizontal network figure consists of the braced quadrilateral figure (3)(figure consist of four corner stations and observed diagonal).
Figure 3The geodetic monitoring network around the
studied water tank
The main idea behind the selected monitoring system is to creat a set of measurements relative to a specified grid of monitoring points fixed on the outer surface of the studied tank,circular R.C. beams and supporting R.C. columns.These selected points were distrubuted around the tank to ensure complete coverage of the tank surface .
Two control points with known coordinates A, B as shown in figure (3) are fixed around the tank .The first point ( A) was fixed on water station ground but the second mointoring point (B) fixed above the roof of the social club near the tank .Two occupied stations are established; point (C) fixed above near residential building near the water station and point (D) fixed at
the water station gound.The points were chosen where each station on the hoizontal netwok must see the pevious and next station points. The objective of the designed horizontal network is to provide a number of stations whose relative and absolute positions, are accurately established.So many detailed locations of monitoring points on the tank are then done from these stations.
As though, it is important to note that the monitoring station, surrounding the tank area, were first established in July 2014. All these control points were established in July 2014 after confirming their integrity. The observations of the horizontal network were vertical and horizontal angles and distances, as a combined system of measuring distances and angles represents the strongest network for creating the horizontal control.The distances were measured 10 times and the angles were measured on three arcs.Then, least sqruare adjustment technique was used to calculate the coordinates of the network stations.The observations of the geodetic network were done only one time at the first epoch of monitoring observations (July 2014).All stations of geodetic networks were fixed in stable positions.Topographic surveying and site reconnaissance of the tank area were done before starting the process of first observation epoch for the tank monitoring.
A. Monitoring Technique of the Water Storage Tank Body
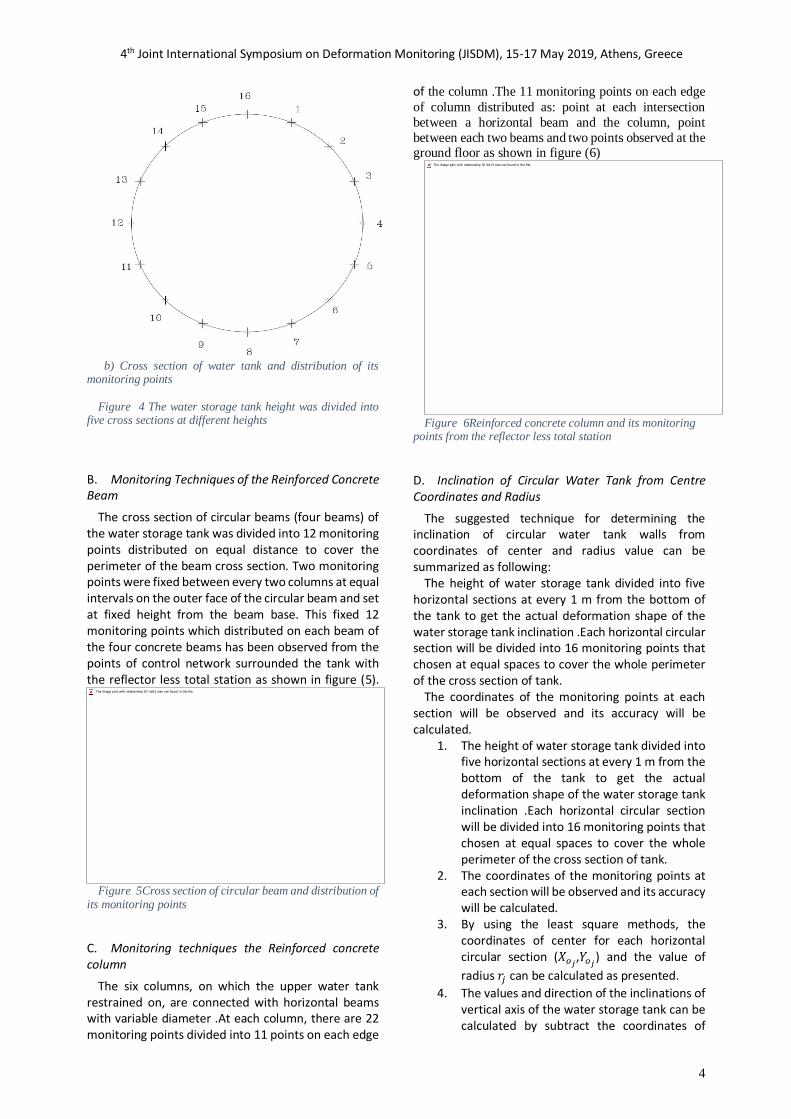
The water storage tank height was divided into five cross sections at different heights. Each circular cross section of tank was divided into 16 monitoring points which fixed at the outer surface to cover the whole parameter of the cross section Figure (4) (a, b).
a) Elevation of tank with monitoring cross sections
4th Joint International Symposium on Deformation Monitoring (JISDM), 15-17 May 2019, Athens, Greece
4
b) Cross section of water tank and distribution of its
monitoring points
Figure 4 The water storage tank height was divided into five cross sections at different heights
B. Monitoring Techniques of the Reinforced Concrete Beam
The cross section of circular beams (four beams) of the water storage tank was divided into 12 monitoring points distributed on equal distance to cover the perimeter of the beam cross section. Two monitoring points were fixed between every two columns at equal intervals on the outer face of the circular beam and set at fixed height from the beam base. This fixed 12 monitoring points which distributed on each beam of the four concrete beams has been observed from the points of control network surrounded the tank with the reflector less total station as shown in figure (5).
Figure 5Cross section of circular beam and distribution of
its monitoring points
C. Monitoring techniques the Reinforced concrete column
The six columns, on which the upper water tank restrained on, are connected with horizontal beams with variable diameter .At each column, there are 22 monitoring points divided into 11 points on each edge
of the column .The 11 monitoring points on each edge
of column distributed as: point at each intersection
between a horizontal beam and the column, point
between each two beams and two points observed at the ground floor as shown in figure (6)
Figure 6Reinforced concrete column and its monitoring
points from the reflector less total station
D. Inclination of Circular Water Tank from Centre Coordinates and Radius
The suggested technique for determining the inclination of circular water tank walls from coordinates of center and radius value can be summarized as following:
The height of water storage tank divided into five horizontal sections at every 1 m from the bottom of the tank to get the actual deformation shape of the water storage tank inclination .Each horizontal circular section will be divided into 16 monitoring points that chosen at equal spaces to cover the whole perimeter of the cross section of tank.
The coordinates of the monitoring points at each section will be observed and its accuracy will be calculated.
1. The height of water storage tank divided into five horizontal sections at every 1 m from the bottom of the tank to get the actual deformation shape of the water storage tank inclination .Each horizontal circular section will be divided into 16 monitoring points that chosen at equal spaces to cover the whole perimeter of the cross section of tank.
2. The coordinates of the monitoring points at each section will be observed and its accuracy will be calculated.
3. By using the least square methods, the coordinates of center for each horizontal circular section (𝑋𝑜𝑗
,𝑌𝑜𝑗) and the value of
radius 𝑟𝑗 can be calculated as presented.
4. The values and direction of the inclinations of vertical axis of the water storage tank can be calculated by subtract the coordinates of

4th Joint International Symposium on Deformation Monitoring (JISDM), 15-17 May 2019, Athens, Greece
5
section from coordinates of first section as follows:
∗𝑄𝑋𝐽=𝑋𝑐𝑗-𝑋𝑐𝑖
∗ 𝑄𝑌𝐽=𝑌𝑐𝑗
-𝑌𝑐𝑖 (1)
Where:
𝑋𝑐𝑗,𝑌𝑐𝑗
: coordinates of center of any section j
along the height of water tank 𝑋𝑐𝑖
,𝑌𝑐𝑖 : coordinates of center of first section of
water tank. 5. The value and direction of the tank wall
inclination can be calculated from
𝑞𝑋𝐽=𝑄𝑋𝐽
±(𝑟𝑗_𝑟𝑖)
𝑞𝑦𝐽=𝑄𝑦𝐽
±(𝑟𝑗_𝑟𝑖) (2)
6. Drawing the actual deformation shape of the
wall water tank.
E. Determine the Inclination of Reinforce Concrete Circular Beams
In Horizontal Direction
The radius and center coordinates for each circular beam was determined using the presented least square technique .Every point on the perimeter on cross section of each circular beam must fulfill the equation of circle. The distortion of each monitoring point can be determined using the resulted values of radius r and the center coordinates (Xc, Yc) by using the following equation:
Fi =√(𝑿𝒊 − 𝑿𝒄)𝟐 + (𝒀𝒊 − 𝒀𝒄)𝟐_ r (3) Where:
Xi , Yi : coordinates of any point of 12 points
distortion on the circular beam,
Xc, Yc: calculated coordinates of center of
circular beam,
r : computed radius of circular beam.
The actual deformed shape of each circular cross section of reinforced concrete beam can be drawn by calculating the distortion of each point on the circular cross section.
In Vertical Direction
For each beam, all 12 points have been observed by using reflector less total station at the same elevation .By comparing the vertical coordinates component (Z) of each point in the beam, the values of the settlement are determined because all the points on the same beam are supposed to be on the same level and height.
So the increase or decrease in height of any point (i)
is calculated by:
∆𝒁 =Zi-𝒁𝟏 (4) Where:
∆Z: the distortion
Zi : The elevation of any point (11
points) on the circular beam,
Z1: The elevation of first point on the
circular beam.
F. Determine the Inclination of Concrete Columns
The six columns that the elevated tank based on are connected with each other by horizontal reinforced concrete beams with variable diameters with the rise of the columns..From Figure (7) the concrete columns inclined with the beam’s axis at a vertical angle. Thus, structure system of the columns’ for the studied elevated water tank different from the other traditional elevated tanks. From other side, the definition of “structure monitoring” is observing a point has been fixed on the outer surface of monitoring structure over several time periods. The suggested monitoring system was used in monitoring and calculations.
All 22 monitoring points on the two outer edges of each column were observed from the four control points in designed network with reflector less total station.
Figure 7The distribution of monitoring points on each
reinforced concrete column
Due to the nature of the studied site, so the following technique has been used:
When studying the vertical inclination of any structure, the value of inclination and the horizontal displacement of each corner of the building must be defined in two directions. The first direction in the perpendicular direction on the building and the other is the parallel direction of the building.
For convenience, it was assumed that the perpendicular direction on the concrete column is the (U) axis (out of plane) and the parallel direction of the
column is the (Ⅴ) axis (in plane) .Therefore, it is necessary to determine the value and direction of the displacement for each monitoring point in both directions for each column.

4th Joint International Symposium on Deformation Monitoring (JISDM), 15-17 May 2019, Athens, Greece
6
Figure 8The projection of the 22 points on each column in
(V, U) axes
o DEFORMATION OF COLUMN OUT OF PLANE
Each point of the edge of the concrete column has coordinates (X, Y, and Z).To study the distortion of any point of observation of the edge of the column in (U) direction must study the coordinates of (X, Y) direction only.
The projection of each 11 points on the horizontal plane must be located at one straight line and thus projection fulfills the equation of straight line and the parameter (a and b) was determined using the presented least square technique. The distortion of each monitoring point can be determined using the resulted values of by using the following equation:
Δi |𝑎𝑥+𝑏𝑌|
√𝑎2+𝑏2 (5)
o Deformation of Column in Plane
Each edge of the six reinforced concrete column divided into 11 points, all the 11 monitoring points in each edge of the column must fulfill the straight line equation .As previously the distortion in plane was determined by using Equation .
IV. ANALYSIS OF OBSERVATIONS AND RESULTS
A. Calculating the Radius r of Water Tank from Coordinates of Surface Points
The values of radii and coordinates of center for all epochs of observations and for all sections can be calculated using MATLAB program, least square theory and presented in table (1)
Table 1 )Calculation of the tank radius and center of coordinates from surface points coordinates for water tank at all three epochs
a) First epoch july 2014
b)Second epoch September 2014
c)Third epoch December 2014
From Tables (1) a, b, c, the following remarks can be summarized:
The radius of elevated water tank cross sections is varied from 4.0126 m to 4.0143 m in July 2014 but from 4.0161m to 4.0187 m at September 2014 and from 4.0141 m to 4.0171 m at December 2014.
The accuracy of radius calculation is varied from 1.67 mm to 2.67 mm in July 2014 but from 1.22 mm to 2.09 mm at September 2014 and from 1.92 mm to 2.88 mm at December 2014.
The center coordinates of each circular sections were also calculated for all epochs and its accuracy .The results show that the maximum standard deviation for X direction is 2.49 mm and the minimum is 1.82 mm in July 2014 , the maximum standard deviation is 2.88 mm and the minimum is 1.89 mm in September 2014 , the maximum standard deviation is 3.45 mm and the minimum is 2.04 mm in December 2014 but in Y direction the maximum standard deviation is 2.15 mm and the minimum is 1.48 mm in July 2014 , the maximum standard deviation is 2.34 mm and the minimum is 1.87 mm in September 2014

4th Joint International Symposium on Deformation Monitoring (JISDM), 15-17 May 2019, Athens, Greece
7
, the maximum standard deviation is 2.34 mm and the minimum is 1.58 mm in December 2014 . B. Calculating the Radius (r) for the Four Reinforced Concrete Beams
By the same way using least square theory and Matlab programming, the radius and center coordinates for all four Reinforced circular concrete beams were calculated for all epochs as following in Table (2)
Table 2)Calculation of the radius and center of coordinates from surface points coordinates for all concrete renforced beams
a)Reinforced concrete beam no. 4
b)Reinforced concrete beam no. 3
c)Reinforced concrete beam no. 2
d)Reinforced concrete beam no. 1
From Tables (2) a, b, c, d, the following Remarks can
be summarized: The radius of each reinforced concrete circular
beams were also calculated for all epochs and its accuracy .The results show that the maximum value of radius is 2.5964 m and the minimum is 2.5919 m for R.C. beam no. 4, the maximum value of radius is 2.6648 m and the minimum is 2.6601 m R.C. beam no.3, the maximum value of radius is 2.9629 m and the
minimum is 2.9603 m in R.C. Beam no. 2. The maximum value of radius is 3.1984 m and the minimum is 3.1952 m in R.C. Beam no. 1. Also the maximum standard deviation is 2.85mm and the minimum is 1.96 mm for R.C. beam no. 4, the maximum standard deviation is 3.87 mm and the minimum is 1.33mm for R.C. beam no. 3, the maximum standard deviation is 5.11 mm and the minimum is 2.07 mm for R.C. beam no. 2 and the maximum standard deviation is 4.18 mm and the minimum is 1.24 mm for R.C. beam no. 1.
The center coordinates of each circular sections were also calculated for all R.C. beams at all epochs and its accuracy .The results show that the maximum standard deviation for X direction is 3.45 mm and the minimum is 1.11 mm for R.C. beam no. 4, the maximum standard deviation is 3.24 mm and the minimum is 1.41 mm for R.C. beam no. 3, the maximum standard deviation is 3.15 mm and the minimum is 1.89 mm for R.C. beam no. 2 and the maximum standard deviation is 4.38 mm and the minimum is 2.02 mm for R.C. beam no. 1, but in Y direction the maximum standard is 3.61 mm and the minimum is 2.43 mm for R.C. beam no. 4, the maximum standard deviation is 3.52 mm and the minimum is 2.31 mm for R.C. beam no. 3, the maximum standard deviation is 3.21 mm and the minimum is 2.61 mm for R.C. beam no. 2 and the maximum standard deviation is 3.88 mm and the minimum is 1.67 mm for R.C. beam no. 1.
C. Inclination of circular water tank from centre coordinates and radius of its cross sections
From reflector less total station observations of water storage tank and based on least square theory, the radius and coordinates of tank center are calculated at every 1 m from base .The results are collected in table (1) .By using presented method the values of inclination in X, Y axes direction and also in walls as following as in table (3):
. a) First epoch july 2014
. b)Second epoch September 2014

4th Joint International Symposium on Deformation Monitoring (JISDM), 15-17 May 2019, Athens, Greece
8
. c) c)Third epoch December 2014
.. 1) Inclination in X direction (July 2014)
.. 2) Inclination in Y direction (July 2014)
Determine the Inclination of Reinforce Concrete Circular Beams
According to Horizontal Direction (X,Y)
By determining the distortion of each point on the reinforced concrete beam circular cross section,the actual deformed shape of circular cross section can be determined as shown in table (4 ) , (5) ,(6) ,(7) and figure (4-13 ),(4-14),(4-15),(4-16) for each beam.
Table 3The deformation shape of the monitored cross section of beam no.4 at first epoch (July 2014)
Figure 9 The deformation shape of the monitored cross
section of beam no.4 at first epoch (July 2014)
From Tables (3) and Figure (9) the following
Remarks can be summarized:
1. The results show that for beam no. 1 the maximum distortion value of monitoring points is 40.26 mm and the minimum distortion value of monitoring points is 41.57 mm in July 2014 but the maximum distortion value of monitoring points is 42.35 mm and the minimum distortion value of monitoring points is 43.46 mm at September 2014 and the maximum distortion value of monitoring points is 43.75 mm and the minimum distortion value of monitoring points is 45.57 mm in at December 2014.
2. For beam no. 2 the maximum distortion value of monitoring points is 50.40 mm and the
July
2014
September
2014
December
2014
1 -6.90 -6.21 -6.42
2 5.42 5.80 5.43
3 -25.17 -23.61 -27.96
4 17.42 17.51 17.69
5 31.27 23.11 27.44
6 17.58 17.76 17.51
7 35.44 37.83 33.29
8 32.42 32.03 30.47
9 33.70 36.38 41.24
10 -27.64 -42.50 -27.80
11 -40.83 -30.64 -48.32
12 -1.59 -1.51 -1.59
Maximum
distortion value 35.44 37.83 41.24
Minimum
distortion value -40.83 -42.50 -48.32
Distortion ,mmMointoring points
on the beam no.4

4th Joint International Symposium on Deformation Monitoring (JISDM), 15-17 May 2019, Athens, Greece
9
minimum distortion value of monitoring points is 42.20 mm in July 2014 but the maximum distortion value of monitoring points is 51.92 mm and the minimum distortion value of monitoring points is 45.92 mm at September 2014 and the maximum distortion value of monitoring points is 53.06mm and the minimum distortion value of monitoring points is 49.76 mm in at December 2014.
3. For beam no. 3 the maximum distortion value of monitoring points is 44.51 mm and the minimum distortion value of monitoring points is 39.01 mm in July 2014 but the maximum distortion value of monitoring points is 46.47 mm and the minimum distortion value of monitoring points is 41.62 mm at September 2014 and the maximum distortion value of monitoring points is 50.91mm and the minimum distortion value of monitoring points is 45.57 mm in at December 2014.
4. For beam no. 4 the maximum distortion value of monitoring points is 35.44 mm and the minimum distortion value of monitoring points is 40.83 mm in July 2014 but the maximum distortion value of monitoring points is 37.83 mm and the minimum distortion value of monitoring points is 42.50 mm at September 2014 and the maximum distortion value of monitoring points is 41.24 mm and the minimum distortion value of monitoring points is 48.32 mm in at December 2014.
According to Vertical Direction (Z)
By determining the height and drop of each point on the reinforced concrete beam circular cross section,the actual settlement of circular cross section can be determined as shown in table (4 ) .
Table 4The different between the level of each monitoring point on the beam and the first one.
From Table (4) the following Remarks can be concluded:
1) The results show that the points no. (3, 4, 5, 6, 7) is higher than points no.(1) also the points no. (9, 10, 11, 12) is lower than point no. (1), for all beams, from this it can be concluded that the level of the western side is higher than the level of east side.
2) There was a settlement to the east direction and the value of the settlement for the four beams:
For beam no. 1: the average different in level between the west and the east side =2.05 cm.
For beam no. 2: the average different in level between the west and the east side =2.645cm.
For beam no. 1: the average different in level between the west and the east side =3.073 cm.
For beam no. 1: the average different in level between the west and the east side =3.71cm. D. Calculating the Inclination of Concrete Columns
The value of inclination and horizontal displacement of each corner of any monitoring structure must be defined by studying the vertical inclination of the structure.
Table 5Distortion in each edge of Reinforced concret columns (mm)
Monitoring
points on
the
circular
beam
Beam
no.1
Average
level
=16.82m
Beam
no.2
Average
level
=20.25 m
Beam
no.3
Average
level
=23.73 m
Beam
no.4
Average
level
=27.49m
2 -0.5 0.5 0.8 1.2
3 0.8 0.2 0.9 1.2
4 1.6 0.9 1.5 1.2
5 1.2 1.5 1.4 1.6
6 1.8 1.6 1.9 2.1
7 1.1 1.6 1.6 2.2
8 -1.1 -0.9 -0.2 -0.9
9 -0.2 -0.9 -1.3 -1.8
10 -0.3 -0.5 -1.2 -2.2
11 -1.2 -1.7 -2.1couldn't
observed
12 -1.1 -1.8couldn't
observed
couldn't
observed
Different in level value (Z coordinates) (cm)
Edge A1 Edge A2 Edge B1 Edge B2 Edge C1 Edge C2 Edge D1 Edge D2 Edge E1 Edge E2 EdgeF1 Edge F2
1 12.68 9.98 17.83 7.15 15.28 6.61 10.02 4.09 11.34 8.76 9.60 6.54
2 13.12 10.21 18.23 9.30 16.61 8.35 13.57 5.85 14.19 9.14 11.65 4.77
3 15.04 12.49 20.10 11.76 15.92 12.37 16.89 9.27 15.64 10.35 10.96 0.83
4 10.34 13.33 17.87 12.83 16.22 10.54 17.40 6.13 9.46 7.71 9.45 -4.55
5 8.00 9.20 10.19 8.76 11.23 8.87 10.26 7.16 3.85 4.18 5.12 -8.91
6 5.34 4.65 9.63 3.81 8.52 4.93 7.30 4.50 -2.47 -2.27 -1.48 -9.99
7 1.08 2.51 2.54 1.45 -3.93 0.25 -4.10 -2.45 -1.90 -8.22 -2.65 -11.86
8 -0.67 -1.54 -5.42 -2.54 -4.39 -2.36 -5.35 -4.43 -0.63 -7.27 -6.74 -20.72
9 -2.84 -5.98 -7.32 -6.45 -9.98 -7.03 -7.25 -9.69 2.54 -4.19 -5.63 -16.76
10
-7.58 -3.13 -9.87 -4.56 -11.55 -9.28 -8.11 -2.66 5.66 -3.78 -4.40 -6.56
11 -12.66 -8.39 -101.00 -9.77 -13.56 -10.25 -10.67 3.65 8.16 2.93 -1.12 7.54
column E column F
Dis
tortion in e
ach e
dge o
f R
.C.
colu
mns,m
m
column a column B column C column D

4th Joint International Symposium on Deformation Monitoring (JISDM), 15-17 May 2019, Athens, Greece
10
V. Figure 10The deformation shape of the monitored cross
section of column A
VI. CONCLUSIONS
As results of monitoring the water storage tank deformation, circular reinforced concrete beams and vertical inclination reinforced concrete columns at three monitoring epochs (July , September ,December 2014),
The body of water storage tank sloping to the east direction at average value 2.32 cm in July 2014 & 2.75 cm in Sep. 2014& 3.13 cm in Dec. 2014 and sloping to the south direction at average value 0.9 cm in July 2014 & 1.25 cm in Sep. 2014& 1.95 cm in Dec. 2014.
The circular reinforced concrete beams inclined to the east direction at average value 2.14 cm in July 2014 & 2.88 cm in Sep. 2014& 3.72 cm in Dec. 2014. And inclend to the south direction at average value 1.01 cm in July 2014 & 1.87 cm in Sep. 2014& 2.11cm in Dec. 2014.
The inclination reinforced concrete columns leaning to the east direction at average value 3.15 cm in July 2014& 3.56 cm in Sep. 2014& 3.91 cm in Dec. 2014 and leaning in south direction in 2.54 cm in July 2014 & 3.04 cm in Sep. 2014& 3.87 cm in Dec. 2014.
VII. RECOMMENDATIONS AND FUTURE WORKS
1) Find suitable structural engineering solution to the water tank deformation as it has been concluded that the value of distortion for monitoring the water tank at three different epochs (July, September, and December 2014) is almost large.
2) Monitor the inclination of water storage tank many other times at shorter epochs don’t exceed one month.
3) Observe the inclination of water tank after implementation of any structural engineering solution.
4) Monitor any other similar tanks by using terrestrial laser scanner which is easier than using Reflector less total station.
5) Monitor any other type of ground petroleum storage tank by using the same monitoring technique.
Use Reflector less Total station in setting out any structure at implementation stage as its accuracy is suitable.
VIII. REFERENCES
Allan, A.N., (1996), "Surveying Building Surface by Theodolite Intersection" Survey Review.
API Standard 653, (2003), "Tank Inspection, Repair, Alteration, and Reconstruction'', American Petroleum Institute, Third Edition September, 2003.
Badellas, A., P. Savvaidis, (1990). Monitoring of Deformation of Technical Works and Ground Landslides with Geodetic Methods. Papageorgiou Publ. Co., Thessaloniki, 257 p.
Gairns,C. 2008, "Development of Semi-Automated System for Structural Deformation Monitoring Using a Reflector less Total Station". M.Sc. Thesis, Department of Geodesy and Geometrics Engineering, University of New Brunswick, 118p.
Chen, Y.Q. G. Zhang. X. Ding and Z. Li (2000). "Monitoring Earth Surface Deformations with InSAR Technology: Principle and Some critical Issues." Journal of Geospatial Engineering, Vol. 2. No. 1, pp. 3-21.
Chrzanowki, A., (1981). A comparison of different approaches into the analysis of deformation measurements. Proc. of FIG XVI International Congress, Montreux, Paper No. 602.3, August 9-18.
Chrzanowski, A. (1986). Geotechnical and other non-geodetic methods in deformation measurements, Proceedings of the Deformation Measurements Workshop, Boston, Massachusetts, 31 October-1 November, Massachusetts Institute of Technology, Cambridge, M.A., pp. 112-153.
Kaushik, D. (2010). "Vehicle license plate tilt correction based on the straight line fitting method and minimizing variance of coordinates of projection points", International Journal of Control Automation and Systems, 10/2010.
Z. Zeidan, Beshr, A. A and H. Abou Halima, (2006). “Application of auto-correlation technique in monitoring the structural deformation” Mansoura Engineering, The Fifth International Engineering Conference

4th Joint International Symposium on Deformation Monitoring (JISDM), 15-17 May 2019, Athens, Greece
11
(IEC 2006), Mansoura – Sharm El-Sheikh 27-31 March.