Embed Size (px)
Citation preview
Study on Tourism in Overseas Market
of South Africa
Final Report – South Africa
For
Market Research Division Ministry of Tourism
Government of India
August, 2016
Final Report on Study of Tourism in the Overseas Markets of South Africa 2
ACKNOWLEDGEMENT
We are thankful to the Ministry of Tourism, Government of
India for assigning the Study on Tourism in Overseas Markets
of South Africa. We are grateful to Shri Vinod Zutshi, IAS,
Secretary (Tourism), and Shri Udai Pratap Singh IAS,
Additional Secretary (Tourism) for extending their support.
We are also grateful to Dr. R.K. Bhatnagar Additional Director
General (MR), Smt. Mini Prasanna Kumar, Joint Director (MR),
Ms. Neha Srivastava, Deputy Director (MR), Shri Shailesh
Kumar, Dy. Director (MR) for providing us the necessary
guidance and periodical support for conducting the study.
We would also like to thank Shri S.K. Mohanta, DPA
(Grade’B’) - MR for providing us the required support and
help from time to time. We are grateful to the officials at the
Indian Tourism office in Johannesburg for their help and
support during our visit.
Last but not the least we would like to thank our entire team
of research professionals as well as our field team for keeping
up the momentum and time schedule of the study.
Final Report on Study of Tourism in the Overseas Markets of South Africa 3
Table of Contents Executive Summary ......................................................................................................................... 11
Chapter One .................................................................................................................................... 15
About The Study .............................................................................................................................. 15
1.1 Introduction ......................................................................................................................... 15
1.2 Terms of Reference .............................................................................................................. 15
1.3 Research Approach & Methodology ..................................................................................... 16
1.4 Sample Size .......................................................................................................................... 18
1.5 Coverage.............................................................................................................................. 19
1.6 Method of Inquiry ................................................................................................................ 20
1.7 Conduct/ control of field operations in different location ..................................................... 20
1.8 Data analysis, quality control measures ............................................................................... 21
Chapter Two .................................................................................................................................... 22
About The Country .......................................................................................................................... 22
2.1 Background – South Africa ................................................................................................... 22
2.1.1 Introduction................................................................................................................. 22
2.1.2 Social Profile .............................................................................................................. 23
2.1.3 Urban/ Rural Population ............................................................................................ 23
2.1.4 Gender Statistics ....................................................................................................... 23
2.1.5 Prominent Religious Groups ..................................................................................... 24
2.1.6 Age Distribution.......................................................................................................... 24
2.1.7 Literacy ....................................................................................................................... 25
2.1.8 Economic Profile ........................................................................................................ 25
2.1.9 Gross Domestic Product (GDP) ............................................................................... 26
2.1.10 Per Capita Income/ Spending Power ....................................................................... 26
2.2 Tourism Overview ................................................................................................................ 26
2.2.1 General Statistics....................................................................................................... 27
2.2.2 Inbound Travel ........................................................................................................... 27
2.2.3 Seasonality of Tourism in the South Africa ............................................................. 29
2.2.4 Outbound South Africa Travellers ............................................................................ 29
2.2.5 Preferred Outbound Destinations ............................................................................. 29
2.2.6 Domestic Tourism in South Africa ............................................................................ 30
2.3 Travel & Trade ..................................................................................................................... 31
2.3.1 Introduction................................................................................................................. 31
2.3.2 Role and characteristics of tourism and travel trade in the country ...................... 32
Final Report on Study of Tourism in the Overseas Markets of South Africa 4
2.3.3 Flight connectivity (major airlines, flights from all major airports to India) ............ 33
2.3.4 Flight Prices (relative prices of travelling to India and other countries) ................ 34
2.3.5 Hotel Prices ................................................................................................................ 35
Chapter Three ................................................................................................................................. 36
Past Outbound Traveller Study Findings .......................................................................................... 36
3.1 Past Outbound Travel Behaviour .......................................................................................... 36
3.1.1 Profiling Information .................................................................................................. 36
3.1.1.1 Place of Residence ............................................................................................ 36
3.1.1.2 Age categories ................................................................................................... 36
3.1.1.3 Educational Qualification of Respondents ....................................................... 37
3.1.1.4 Employment status of Past Travellers to India ................................................ 38
3.1.1.5 Gender ................................................................................................................ 38
3.1.1.6 By Average Monthly Household Expenditure of Past Travellers to India ..... 38
3.1.2 General Travel Behaviour ......................................................................................... 39
3.1.2.1 Frequency of trips abroad ................................................................................. 39
3.1.2.2 Average expenditure on trips ............................................................................ 40
3.1.2.3 Preferred destinations ....................................................................................... 41
3.1.2.4 Types of trip ........................................................................................................ 41
3.1.3 Travel Behaviour of Past Visitors to India ............................................................... 42
3.1.3.1 Reason for Travelling to India ........................................................................... 42
3.1.3.2 Reason for Choosing India................................................................................ 43
3.1.3.3 Respondent’s Medical Tourism Details in India .............................................. 44
3.1.3.4 Cities Visited in India ......................................................................................... 45
3.1.3.5 Source of information regarding India .............................................................. 46
3.1.3.6 Month of India Travel ......................................................................................... 47
3.1.3.7 Duration of India Travel ..................................................................................... 48
3.1.3.8 Accommodation Availed in India ...................................................................... 49
3.1.3.9 Mode of local travel within India........................................................................ 49
3.1.3.10 Expenses for India Trip...................................................................................... 50
3.1.3.11 Payment Mode in India ...................................................................................... 51
3.1.3.12 Revisit India ........................................................................................................ 52
3.1.3.13 Attractions for re-visiting India .......................................................................... 52
3.1.3.14 Reason for not revisiting India .......................................................................... 53
3.1.3.15 Best and worst experiences in India................................................................. 53
3.1.3.16 Satisfaction from visiting India .......................................................................... 55
Final Report on Study of Tourism in the Overseas Markets of South Africa 5
3.1.3.17 Mode of booking................................................................................................. 55
3.1.3.18 Sources of Help While Self Booking................................................................. 56
3.1.3.19 Type of tour operator used ................................................................................ 57
3.1.3.20 Tour operators selection criteria ....................................................................... 57
3.1.3.21 Travel Arrangements for India .......................................................................... 58
3.1.4 Travel Behaviour of Past Visitors to Other Countries ............................................. 59
3.1.4.1 Countries Visited in past .................................................................................... 59
3.1.4.2 Reason for Travelling Abroad ........................................................................... 59
3.1.4.3 Sources of information on the destinations visited in past ............................. 60
3.1.4.4 Trip Satisfaction ................................................................................................. 61
3.1.4.5 Trip Expenditure ................................................................................................. 61
3.1.4.6 Value for money destinations visited ................................................................ 62
3.1.4.7 Type of accommodation used ........................................................................... 62
3.1.4.8 Package and Non-package Expenses Incurred .............................................. 63
3.1.4.9 Mode of Payment ............................................................................................... 64
3.1.4.10 Mode of Trip Booking ........................................................................................ 64
3.1.4.11 Help While Self Booking for Trip ....................................................................... 65
3.1.4.12 Travel Insurance Availed ................................................................................... 66
3.1.4.13 Reason for Taking Travel Insurance ................................................................ 66
3.1.4.14 Type of Travel Agent Used ............................................................................... 67
3.1.4.15 Selection Criteria of Tour Operators................................................................. 67
3.1.4.16 Travel Arrangements Availed from Tour Operators ........................................ 68
3.1.4.17 Months before Contacted Tour Operator ......................................................... 69
3.1.4.18 Awareness of India as a tourist destination ..................................................... 70
3.1.4.19 Intention of visiting India .................................................................................... 70
3.1.4.20 Primary attractions of India / motivation for visiting India ............................... 70
3.1.4.21 Intention and reason for choosing an intermediary for India travel ............... 71
3.1.4.22 Reasons for rejecting India as a tourist destination and intention of India visit
in distant future ...................................................................................................................... 72
3.1.4.23 Visit India Ever ................................................................................................... 73
3.1.5 India vis-à-vis Other Countries - Past Outbound Travel Behaviour ...................... 74
3.1.5.1 Accommodation Availed by Past Travellers .................................................... 74
3.1.5.2 Package Expenses of Past Travellers ............................................................. 74
3.1.5.3 Non-Package Expenses of Past Travellers ..................................................... 74
3.1.5.4 Preferred Mode of Payment of Past Travellers ............................................... 75
3.1.5.5 Trip Satisfaction of Past Travellers ................................................................... 75
Final Report on Study of Tourism in the Overseas Markets of South Africa 6
3.1.5.6 Mode of Trip Booking of Past Travellers .......................................................... 75
3.1.5.7 Source of Booking Information for Past Travellers ......................................... 76
3.1.5.8 Type of Travel Agent Used by Past Travellers ................................................ 76
3.1.5.9 Type of Travel Arrangements Used by Past Travellers .................................. 77
Chapter Four ................................................................................................................................... 78
Past Outbound Traveller Study Findings .......................................................................................... 78
4.1 Prospective Outbound Travel Behavior ................................................................................ 78
4.1.1 Profiling Information .................................................................................................. 78
4.1.1.1 Place of residence ............................................................................................. 78
4.1.1.2 Gender Distribution ............................................................................................ 78
4.1.1.3 Age categories ................................................................................................... 79
4.1.1.4 Employment status ............................................................................................ 79
4.1.1.5 Educational Qualifications ................................................................................. 80
4.1.1.6 Household Expenditure per month ................................................................... 80
4.1.2 General Travel Behaviour ......................................................................................... 81
4.1.2.1 Types of trip ........................................................................................................ 81
4.1.2.2 Mode of booking................................................................................................. 82
4.1.2.3 Sources of help for booking information .......................................................... 83
4.1.2.4 Type of tour operator used ................................................................................ 83
4.1.2.5 Tour operators selection criteria ....................................................................... 84
4.1.2.6 Number of tour operators contacted and number of months in advance
contacted 84
4.1.2.7 Mode of payment preferred ............................................................................... 86
4.1.2.8 Type of accommodation to be availed ............................................................. 86
4.1.2.9 Estimated Package and Non-Package Expenditure Per Head ...................... 87
4.1.2.10 Reason for availing travel insurance if any ...................................................... 88
4.1.3 Travel Behaviour of Prospective Visitors to India ................................................... 90
4.1.3.1 Reason for choosing India as a travel destination .......................................... 90
4.1.3.2 Intention of visiting only India or as part of a sub-regional trip ....................... 90
4.1.3.3 Countries Planning to Visit Along With India as part of a sub-regional trip... 90
4.1.3.4 Awareness and intention of visiting destinations in India ............................... 91
4.1.3.5 Source of information regarding India .............................................................. 92
4.1.3.6 Time of visit to India ........................................................................................... 93
4.1.3.7 Duration of stay .................................................................................................. 94
4.1.3.8 Reason for booking through a tour operator while visiting India .................... 94
4.1.4 Travel Behaviour of Prospective Visitors to Other Countries................................. 95
Final Report on Study of Tourism in the Overseas Markets of South Africa 7
4.1.4.1 Countries to visit................................................................................................. 95
4.1.4.2 Drivers / reasons for visiting foreign locales .................................................... 96
4.1.4.3 Sources of information on the destinations to visit.......................................... 97
4.1.4.4 Awareness of India as a tourist destination ..................................................... 97
4.1.4.5 Intention of visiting India .................................................................................... 97
4.1.4.6 Primary attractions of India / motivation for visiting India ............................... 98
4.1.4.7 Intention and reason for choosing an intermediary for India travel ............... 98
4.1.4.8 Reasons for rejecting India as a tourist destination and intention of India visit
in far future............................................................................................................................. 99
4.1.5 India vis-à-vis other Countries - Prospective Outbound Travel Behaviour ......... 101
4.1.5.1 Accommodation Availed by Intending Travellers .......................................... 101
4.1.5.2 Package Expenses of Intending Travellers ................................................... 101
4.1.5.3 Non-Package Expenses of Intending Travellers ........................................... 101
4.1.5.4 Preferred Mode of Payment of Intending Travellers ..................................... 102
4.1.5.5 Mode of Trip Booking of Intending Travellers ................................................ 102
4.1.5.6 Source of Booking Information for Intending Travellers ............................... 102
4.1.5.7 Type of Travel Agent Used by Intending Travellers ...................................... 103
Chapter Five .................................................................................................................................. 104
India Tourism Office Findings......................................................................................................... 104
5.1 India Tourism Office ........................................................................................................... 104
5.1.1 India Tourism Activity Response of Past Travellers ............................................. 104
5.1.1.1 Awareness of India tourism office promotions and advertisements ............ 104
5.1.1.2 Effectiveness of promotions and activities ..................................................... 105
5.1.1.3 Influencing ability of promotional campaigns by India tourism office........... 106
5.1.1.4 India tourism office as information source for all destinations in India ........ 106
5.1.2 India Tourism Activity Response of Prospective travellers .................................. 106
5.1.2.1 Awareness of India tourism office presence .................................................. 106
5.1.2.2 India tourism office approached or not ........................................................... 106
5.1.2.3 Role of India tourism office in helping tourists plan a trip to India ............... 107
5.1.2.4 Evaluation of role of India Tourism Office in promoting India as a tourist
destination 107
5.1.3 India Tourism Activity Qualitative Evaluation ........................................................ 107
Chapter Six .................................................................................................................................... 110
Future Outbound travel Projections .............................................................................................. 110
6.1 Projections for Future Outbound Travel ............................................................................. 110
6.1.1 Method of Forecasting ............................................................................................ 110
Final Report on Study of Tourism in the Overseas Markets of South Africa 8
6.1.2 Forecast of Outbound Tourists from South Africa ................................................ 110
Chapter Seven ............................................................................................................................... 113
Conclusion & Way Forward ........................................................................................................... 113
7.1 Conclusion ......................................................................................................................... 113
7.2 Way Forward – Long Term and Short Term Measures to Promote Indian Tourism ............. 117
Annexure - Questionnaires Used ................................................................................................... 118
Table 1: List of Stakeholder, Particulars and Roles ................................................................... 17
Table 2: Sample Size Distribution ............................................................................................... 18
Table 3: Sample and Geographical Coverage ........................................................................... 19
Table 4: Age Distribution of Population ...................................................................................... 25
Table 5: Estimated per capita GDP (purchasing power parity) ................................................ 26
Table 6: South Africa GDP (purchasing power parity) .............................................................. 26
Table 7: Foreign Tourist Arrivals (in thousands) ........................................................................ 28
Table 8: Departure (in thousands) .............................................................................................. 29
Table 9: Flight Prices .................................................................................................................... 34
Table 10: Hotel Prices .................................................................................................................. 35
Table 11: Age Distribution ............................................................................................................ 37
Table 12: Gender Distribution ...................................................................................................... 38
Table 13: State Visited For Medical Tourism ............................................................................. 44
Table 14: Institution in India Visited for Medical Tourism .......................................................... 45
Table 15: Satisfaction Level with Medical Tourism in India ...................................................... 45
Table 16: Accommodation Availed by past Travellers – India vs. Other Country ................... 74
Table 17: Package expenses of Past Travellers – India vs. Other Country ............................ 74
Table 18: Non-Package Expenses of Past Travellers – India vs. Other Country ................... 74
Table 19: Preferred Mode of Payment of Past Travellers – India vs. Other Country ............. 75
Table 20: Trip Satisfaction of past Travellers – India vs. Other Country ................................. 75
Table 21: Mode of Trip Booking of Past travellers – India vs. Other Country ......................... 76
Table 22: Source of Booking Information for Past Travellers – India vs. Other Country ........ 76
Table 23: Type of Travel Agent Used by Past Travellers – India vs. Other Country .............. 76
Table 24: Type of Travel Arrangements Used by Past Travellers – India vs. Other Country 77
Table 25 Respondents by gender ............................................................................................... 79
Table 26: Accommodation Availed by Intending Travellers – India vs. Other Country ........ 101
Table 27: Package expenses of Intending Travellers – India vs. Other Country .................. 101
Table 28: Non-Package Expenses of Intending Travellers – India vs. Other Country ......... 102
Table 29: Preferred Mode of Payment of Intending Travellers – India vs. Other Country ... 102
Table 30: Mode of Trip Booking of Intending travellers – India vs. Other Country ............... 102
Table 31: Source of Booking Information for Intending Travellers – India vs. Other Country
...................................................................................................................................................... 103
Table 32: Type of Travel Agent Used by Intending Travellers – India vs. Other Country .... 103
Table 33: Present & Forecasted FTAs from South Africa to India ......................................... 111
Final Report on Study of Tourism in the Overseas Markets of South Africa 9
Figure 1: Population distribution for South Africa by gender and age groups 24
Figure 2: Foreign Tourism Indicators 27
Figure 3: Domestic Tourism Indicators 30
Figure 4: Tourism Spending in South Africa in 2013 33
Figure 5: Distribution of Past Travellers by Place of Residence 36
Figure 6: Educational Qualification of Respondents 37
Figure 7: Employment Status of Respondents 38
Figure 8: Categorizing Past India Respondents by monthly household expenditure in US$ 39
Figure 9: Respondents categorized by frequency of trips abroad 39
Figure 10: Respondents by per capita trip budget category 40
Figure 11: Revealed preferences for foreign destinations 41
Figure 12: Respondents categorized by frequency of trips abroad 41
Figure 13: Reason for Travelling to India 42
Figure 14: Reason for choosing India 43
Figure 15: Cities Visited in India 45
Figure 16: Source of information about India 46
Figure 17: Month of India Travel 47
Figure 18: Duration of India travel 48
Figure 19: Accommodation Availed in India 49
Figure 20: Mode of Local Travel within India 50
Figure 21: Average per Person Expenses for India Trip 50
Figure 22: Payment Mode in India 51
Figure 23: Revisit India 52
Figure 24: Attractions for revisiting India 52
Figure 25: Top 15 Pleasant Experiences in India 53
Figure 26: Top 15 Unpleasant Experiences in India 54
Figure 27: Satisfaction with Visit to India 55
Figure 28: Mode of Booking for India Trip 55
Figure 29: Source of help while self-booking 56
Figure 30: Type of Travel Agent Used 57
Figure 31: Tour Operators Selection Criteria 57
Figure 32: Travel Arrangements for India 58
Figure 33: Countries Visited 59
Figure 34: Reason for Travelling Abroad 59
Figure 35: Sources of Information about Destinations Visited 61
Figure 36: Trip Satisfaction 61
Figure 37: Trip Expenditure 62
Figure 38: Value for Money Destination 62
Figure 39: Type of Accommodation Availed 63
Figure 40: Package and Non-package Expenses 63
Figure 41: Mode of Payment 64
Figure 42: Mode of Trip Booking 65
Figure 43: Source of Help for Self Booking 65
Figure 44: Reason for Taking Travel Insurance 66
Figure 45: Type of Travel Agent Used 67
Figure 46: Selection Criteria of Tour Operators 68
Figure 47: Travel Arrangements Availed from Tour Operators 68
Final Report on Study of Tourism in the Overseas Markets of South Africa 10
Figure 48: Months in Advance Tour Operators Contacted 69
Figure 49: Products of Interest in India 70
Figure 50: Reason for Approaching Tour Operators 71
Figure 51: Reasons for Not Visiting India in Future 72
Figure 52: Visit India Ever 73
Figure 53: Distribution of Past Travellers by Place of Residence 78
Figure 54: Age Categories 79
Figure 55: Educational Qualification 80
Figure 56: Monthly Household Expenditure 80
Figure 57: Respondents by purpose of travel 81
Figure 58: Mode of Booking 82
Figure 59: Sources of booking information 83
Figure 60: Type of Travel Agent Used 83
Figure 61: Tour Operator Selection Criteria 84
Figure 62: No. of tour operators the respondents intended to contact before coming to a
decision 85
Figure 63: Months in Advance Tour Operator Contacted 85
Figure 64: Mode of Payment Preferred 86
Figure 65: Respondents by type of accommodation 87
Figure 66: Expenditure across cost baskets 87
Figure 67: Reason for Opting of Travel Insurance 88
Figure 68: Reason for choosing India for next trip 90
Figure 69: Top 10 Countries to be Visited along with India 91
Figure 70: Awareness about a destination and its traction for the visitor 91
Figure 71: Sources of information about India 92
Figure 72: Preferred month for potential visit to India 93
Figure 73: Duration of Stay in India 94
Figure 74: Reason for Opting for a Tour Operator 94
Figure 75: Favored destinations for those intending to travel to countries other than India 95
Figure 76: Reason for travelling overseas 96
Figure 77: Sources of information about destination countries 97
Figure 78: Primary attractions in India 98
Figure 79: Reason for Choosing a Tour Operator for Travel Arrangements in India 99
Figure 80: Reasons for not intending to travel to India 99
Figure 81: Source of information about India tourism office 104
Figure 82: Opinion of Promotional Campaigns of India Tourism office 105
Figure 83: Role of India tourism office 107
Figure 84: Present & Forecasted FTAs from South Africa 110
Final Report on Study of Tourism in the Overseas Markets of South Africa 11
Executive Summary
E1. The foreign tourist arrival growth in India is little more than 10% per annum
(2014) & in terms of figures of FTA – Foreign tourist arrival, India received around
7.68 million foreign tourists in 2014. Though the share of FTAs from South Africa to
India is moderate (56,246 FTAs from South Africa to India in 2014) owing to the
historical relationship between the two countries, a vast opportunity lies untapped in
the form of outbound travellers in the South Africa market. Considering the
tremendous potential to attract foreign tourist, The Ministry of Tourism, Government
of India has taken lot of innovative steps in terms of promotion and market
development activity. To get a better understanding, Ministry of Tourism
commissioned a study to gauge the perception of tourists—past as well as
prospective—in selected foreign markets about tourism in India. This study-report
attempts to assess the impact of the ongoing overseas campaign launched by the
Ministry of Tourism, Government of India, to promote India as a high-value, up-
market tourist destination. The Ministry of Tourism also intends to use the insights
from this study as inputs in designing future overseas campaigns.
E2. The report covers an in-depth insight of the traveller’s demographic profile, level
of awareness about India & its different products & services, preference & attitude,
like & dislike & finally lead to arrive need-gap of the past travellers. The report has
dealt with the different promotional strategies adopted by the competitive countries &
what is the take away out of it & what best India tourism can offer to attract tourist
from the target market. Government of India has set up India Tourism offices in
different countries to facilitate intending travellers by way of providing required
information so that they can plan accordingly. The study also covers the traveller’s
perception as well as experience to deal with those establishment & suggestion for
improvement.
E3. The entire study has been carried out by way of extensive secondary research
followed by face to face interviews with the help of local office of The Nielsen
Company. The categories of respondents are pas and prospective outbound tourists,
travel houses, Indian tourism office in Johannesburg.
Final Report on Study of Tourism in the Overseas Markets of South Africa 12
India has for long been known for its rich culture and heritage beautiful and artistic
historical monuments, cuisine with traditional Indian spices and herbs, pocket
friendly rates, breath-taking natural beauty and a wide range of tropical beaches.
Given the fact that India is one of the commonwealth nations and South Africa being
another member of the Commonwealth, awareness among South Africa nationals
about India and it tourist destinations is very high.
E4. For holidaymakers from South Africa, India is a long haul destination. On virtue
of having friends and relatives in India, they have visited India in past and have seen
the destinations that are promoted frequently. South Africa past travellers to India on
a package tour has spent around INR 2.8 lakh per person on an average while past
travellers to India on a non-package tour has spent around INR 2.5 lakh per person
on an average . Most of the past travellers visited India to see and experience the
heritage and culture of the country. The most fascinating things to them were to
enjoy the rich heritage, cultural diversity, scenic beauty & religious places in India.
E5. All the past travellers are aware about India through websites / internet and
magazines/ books on travel, but the promotional /publicity material available at
various forums are not helping to plan their travel as their requirement of minute
details are often not addressed. India as a destination is known to the travellers in
South Africa due to the cultural connect it shares because of colonial past and also
due to Mahatma Gandhi’s link between both the countries, but, the awareness of
India is not getting converted to travels to India. Incredible India website needs to
be more focussed, product driven and clear so that travellers can decide their
destination and can compare the benefit to visit India vis-à-vis other competitive
countries. The Campaign should be focused more to lure the intending travellers to
“Visit India “rather than simply describing India.
E6. The ethnic difference that exists in South Africa also converts to choices and
Travellers are only aware of Golden Triangle, therefore, more destination specific
visuals/ campaigns defining the products and its unique features need to be devised
and promoted. Rather than marketing India or just one state to the trade, focus
should be on marketing a product /activity/ event. Under the umbrella of brand India
new tourist circuits need to be created to attract different type of travellers. Thus
there is need to focus separately for the 3 different stakeholders;
Final Report on Study of Tourism in the Overseas Markets of South Africa 13
E7. Trade/ Tour Operator:
Focussing on trade and forming a symbiotic relationship with trade will foster a
greater number of foreign tourist visits to India. It is also suggested to improve the
number of tour operators who sell India by providing free training and tutorials for
tourism in India by Ministry and motivate them to work for ‘India Tourism Office’.
There is a need for an integrated approach by India Tourism Office and tour
operators. India Tourism Office must participate in important fairs and festivals where
they can sponsor any event which will finally send a message to “Visit India” and not
just educate travellers about India. They are interested more in fun, beaches and not
in heritage or culture. Based on this the travel package need to be designed
especially for them. The Whites are more interested in heritage, luxury, history. More
communication with tour operators is required with regards to events that can be
organized to boost tourism to India.
E8. Media:
Media is a medium that can be used to make people aware about India. Media
reaches the masses and hence is a very important tool of promotion. Currently the
advertisements of Incredible India campaign are currently shown in channels that are
international and the same for the entire African Subcontinent. Local channels in
South Africa, which are most watched by the potential travellers are not showing
India Tourism advertisements. The same is happening in case of print
advertisements too. The media advertisements need to focus on the various
products that India has to offer assuring that India is a safe and secure country to
visit and can also showcase the unique blend of modern and traditional experiences
that India has to offer. Media can also take the help of celebrities and famous
personalities to promote the pleasant experiences that they had encountered during
their stay in India.
E9. Traveller:
More efforts need to be put in creating promotional campaigns which will increase
footfalls of travellers to India. In order to attract intending travellers as well as past
Final Report on Study of Tourism in the Overseas Markets of South Africa 14
travellers (for repeat visit) - a comprehensive travel guide or plan with lots of stimulus
is essential. Thus it is imperative to categorise the travellers from any particular
country on the basis of their travel pattern and habit/ behaviour. Promotional
campaigns need to highlight the Incredible India web-address more prominently to
increase the visibility of the website.
E10. Way Forward – Long Term and Short Term Measures to promote Indian
Tourism
Short Term Measures:
Feature Incredible India advertisements in popular local channels and
mainstream popular print media and more importantly on social media.
A social media campaign of India Tourism highlighting the most liked aspects
of tourism in the South African context.
Organize focused Familiarization tours for media persons and tour operators.
Impart training to front office executives who are in direct contact with
prospective travellers so as they can handle all types of queries.
Though enough publicity material is there, but it is all out-dated, there is no
mention about New India – new destinations, new products, new packages,
new circuits and new luxury properties need to be promoted alongside well
known destinations, so as to offer a large choice in front of prospective
travellers.
Frequent interaction with tour operators – to remain connected.
Long Term Measures:
More focus on product /destination campaigns required for different set of
travellers. Products for specific countries should be designed based on the
needs and requirements of travellers from that specific geography.
Rather than sending brochures etc., fortnight updates though e-newsletters on
what is happening NEW in India –event, launch, festival etc.
Design advertisements with celebrities of the target country to lend trust and
credibility to the promotional advertisement.
Final Report on Study of Tourism in the Overseas Markets of South Africa 15
Chapter One
About The Study
1.1 Introduction
In recent years the tourism sector in India has registered significant growth and has
tremendous potential in terms of its contribution to national income and employment.
The Ministry of Tourism, Government of India has been making sincere efforts to
promote and publicise India as a high value up market destinations.
In order to have an objective assessment of the overseas campaign and to know the
perception, level of knowledge and expectation /aspiration of foreign tourists about
India the Ministry of Tourism, Government of India has decided to conduct an Survey
/study in a few selected foreign markets to have an assessment of the impact of the
campaign on the foreign travellers in the overseas markets.
This study-report attempts to assess the impact of the ongoing overseas campaign
launched by the Ministry of Tourism, Government of India, to promote India as a
high-value, up-market tourist destination. The Ministry of Tourism also intends to use
the insights from this study as inputs in designing future overseas campaigns.
1.2 Terms of Reference
To conduct a study on tourism in the overseas markets of Germany, Japan, Russia,
South Africa, South Korea and Turkey. The study will include a primary survey of
past and prospective travellers besides compilation and analysis of information from
secondary sources. Based on the secondary research and primary survey of
respondents, separate report of each country should provide detailed information on
the following aspects:
Market/ country overview-Economic and social profile
Outbound travel pattern in past
Travellers’ profile
Preferred destinations
Expenditure pattern
Travellers to India
Final Report on Study of Tourism in the Overseas Markets of South Africa 16
Projections of future outbound travel
Role and characteristics of tourism and travel trade in these countries
Attractiveness of India for visitors from these countries
India tourism marketing and promotion in these countries
Suggestion of specific measures to promote India tourism in these countries.
The role of India Tourism Offices in these countries in such promotional
activities should also be elaborated.
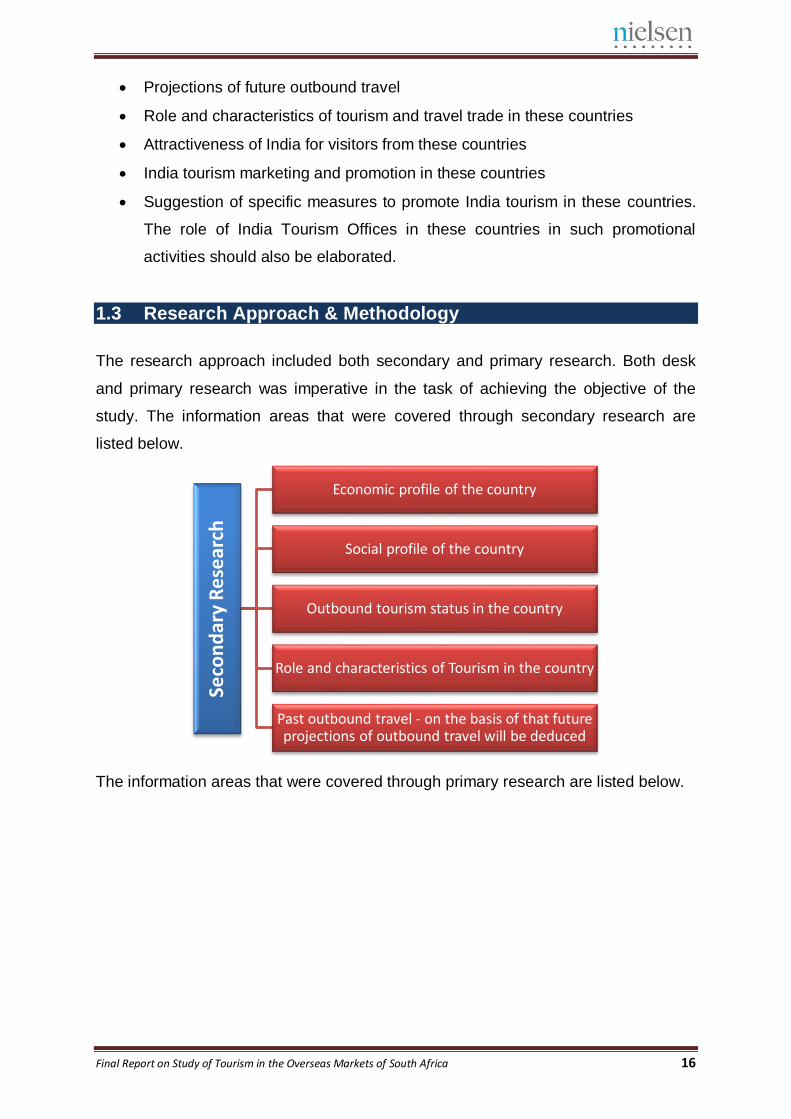
1.3 Research Approach & Methodology
The research approach included both secondary and primary research. Both desk
and primary research was imperative in the task of achieving the objective of the
study. The information areas that were covered through secondary research are
listed below.
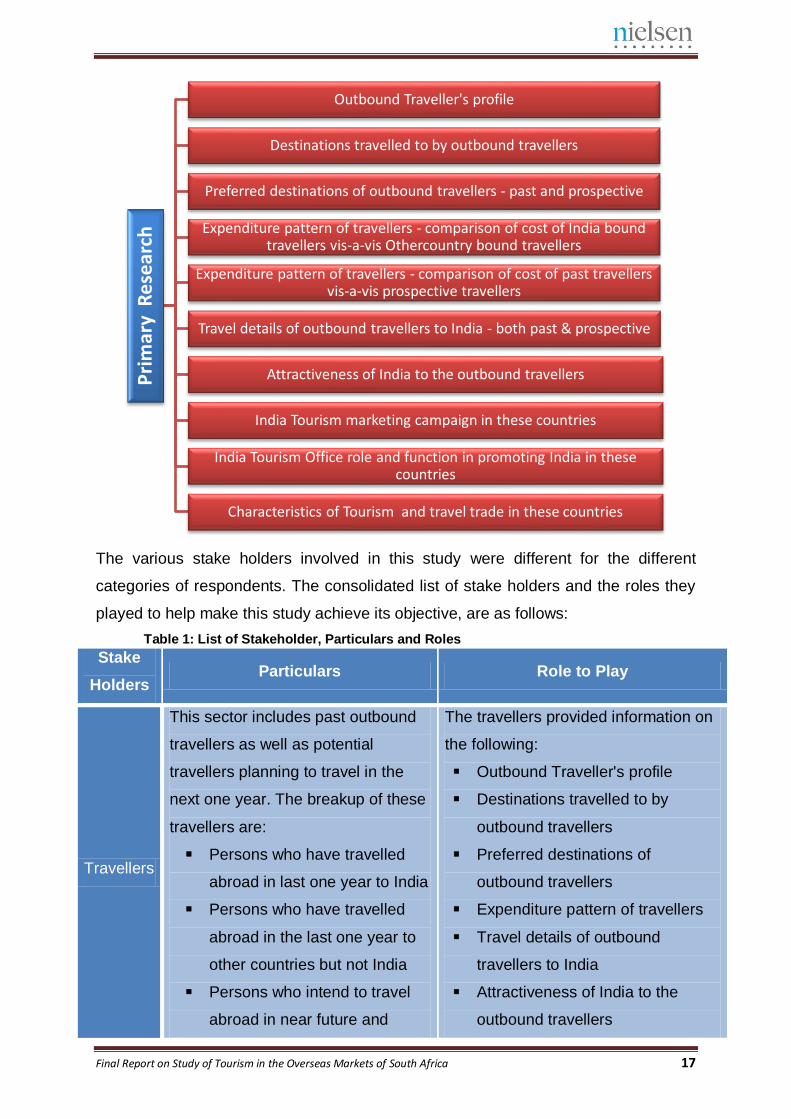
The information areas that were covered through primary research are listed below.
Seco
nd
ary
Re
sear
ch
Economic profile of the country
Social profile of the country
Outbound tourism status in the country
Role and characteristics of Tourism in the country
Past outbound travel - on the basis of that future projections of outbound travel will be deduced
Final Report on Study of Tourism in the Overseas Markets of South Africa 17
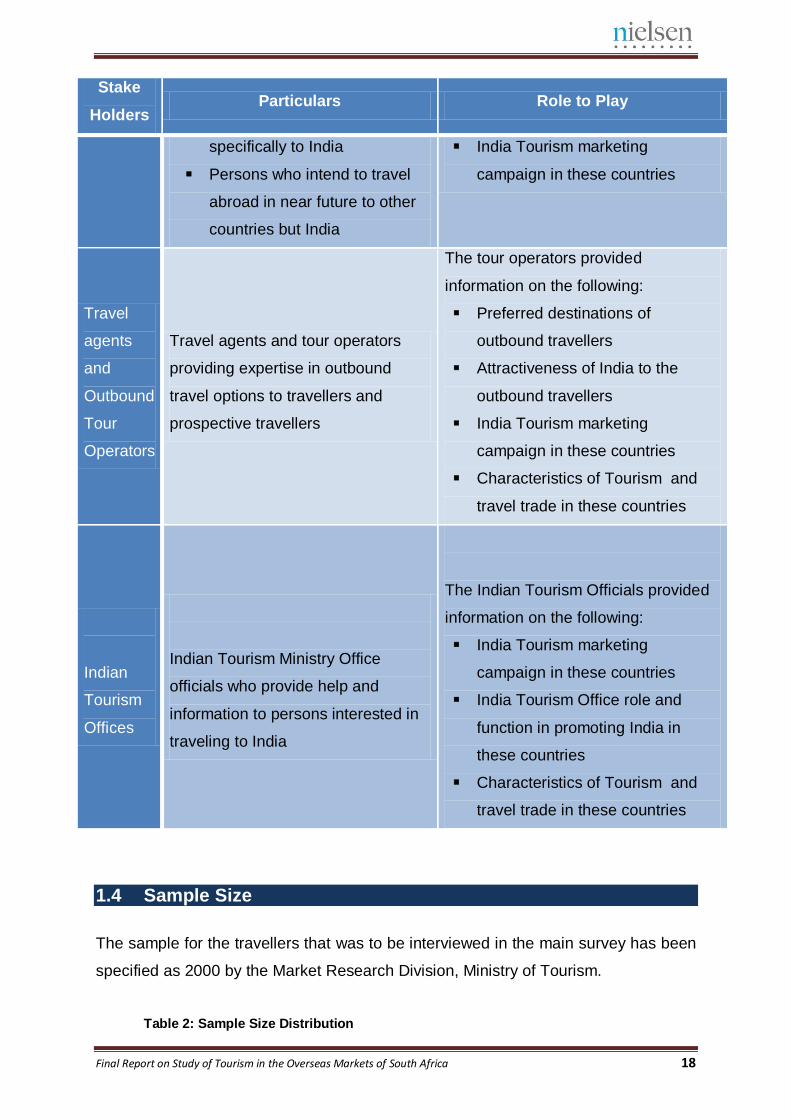
The various stake holders involved in this study were different for the different
categories of respondents. The consolidated list of stake holders and the roles they
played to help make this study achieve its objective, are as follows:
Table 1: List of Stakeholder, Particulars and Roles
Stake
Holders Particulars Role to Play
Travellers
This sector includes past outbound
travellers as well as potential
travellers planning to travel in the
next one year. The breakup of these
travellers are:
Persons who have travelled
abroad in last one year to India
Persons who have travelled
abroad in the last one year to
other countries but not India
Persons who intend to travel
abroad in near future and
The travellers provided information on
the following:
Outbound Traveller's profile
Destinations travelled to by
outbound travellers
Preferred destinations of
outbound travellers
Expenditure pattern of travellers
Travel details of outbound
travellers to India
Attractiveness of India to the
outbound travellers
Pri
mar
y R
ese
arch
Outbound Traveller's profile
Destinations travelled to by outbound travellers
Preferred destinations of outbound travellers - past and prospective
Expenditure pattern of travellers - comparison of cost of India bound travellers vis-a-vis Othercountry bound travellers
Expenditure pattern of travellers - comparison of cost of past travellers vis-a-vis prospective travellers
Travel details of outbound travellers to India - both past & prospective
Attractiveness of India to the outbound travellers
India Tourism marketing campaign in these countries
India Tourism Office role and function in promoting India in these countries
Characteristics of Tourism and travel trade in these countries
Final Report on Study of Tourism in the Overseas Markets of South Africa 18
Stake
Holders Particulars Role to Play
specifically to India
Persons who intend to travel
abroad in near future to other
countries but India
India Tourism marketing
campaign in these countries
Travel
agents
and
Outbound
Tour
Operators
Travel agents and tour operators
providing expertise in outbound
travel options to travellers and
prospective travellers
The tour operators provided
information on the following:
Preferred destinations of
outbound travellers
Attractiveness of India to the
outbound travellers
India Tourism marketing
campaign in these countries
Characteristics of Tourism and
travel trade in these countries
Indian
Tourism
Offices
Indian Tourism Ministry Office
officials who provide help and
information to persons interested in
traveling to India
The Indian Tourism Officials provided
information on the following:
India Tourism marketing
campaign in these countries
India Tourism Office role and
function in promoting India in
these countries
Characteristics of Tourism and
travel trade in these countries
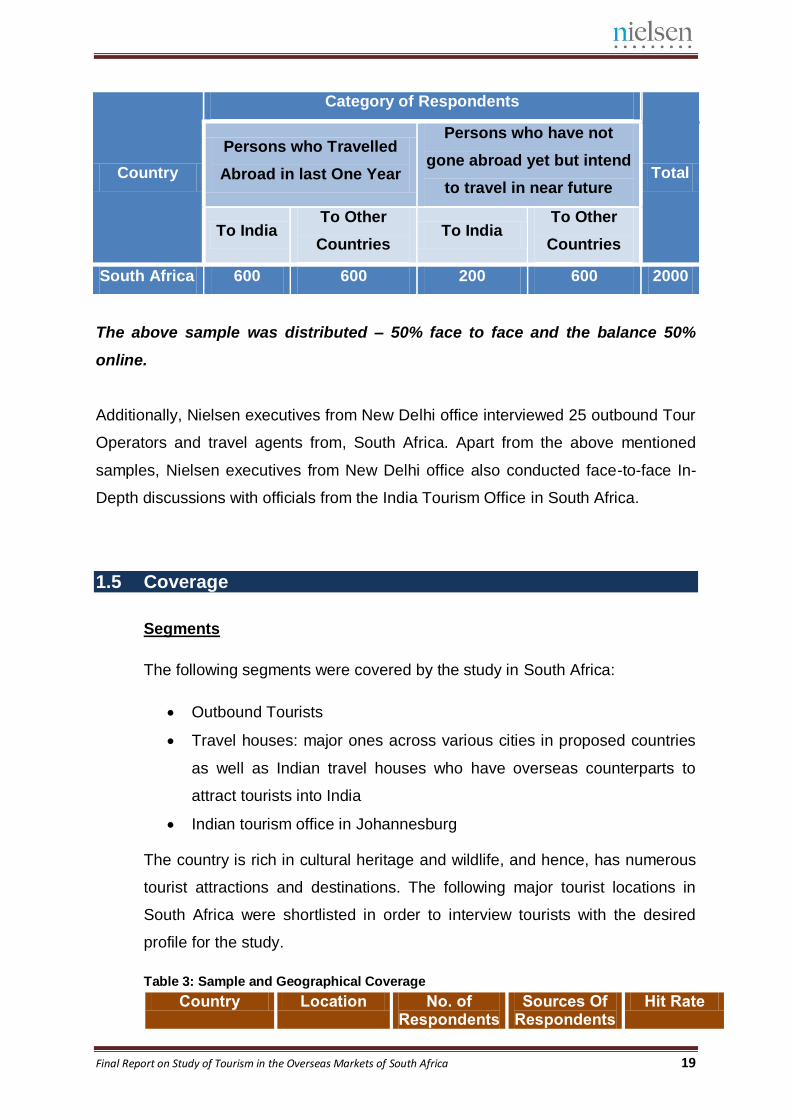
1.4 Sample Size
The sample for the travellers that was to be interviewed in the main survey has been
specified as 2000 by the Market Research Division, Ministry of Tourism.
Table 2: Sample Size Distribution
Final Report on Study of Tourism in the Overseas Markets of South Africa 19
The above sample was distributed – 50% face to face and the balance 50%
online.
Additionally, Nielsen executives from New Delhi office interviewed 25 outbound Tour
Operators and travel agents from, South Africa. Apart from the above mentioned
samples, Nielsen executives from New Delhi office also conducted face-to-face In-
Depth discussions with officials from the India Tourism Office in South Africa.
1.5 Coverage
Segments
The following segments were covered by the study in South Africa:
Outbound Tourists
Travel houses: major ones across various cities in proposed countries
as well as Indian travel houses who have overseas counterparts to
attract tourists into India
Indian tourism office in Johannesburg
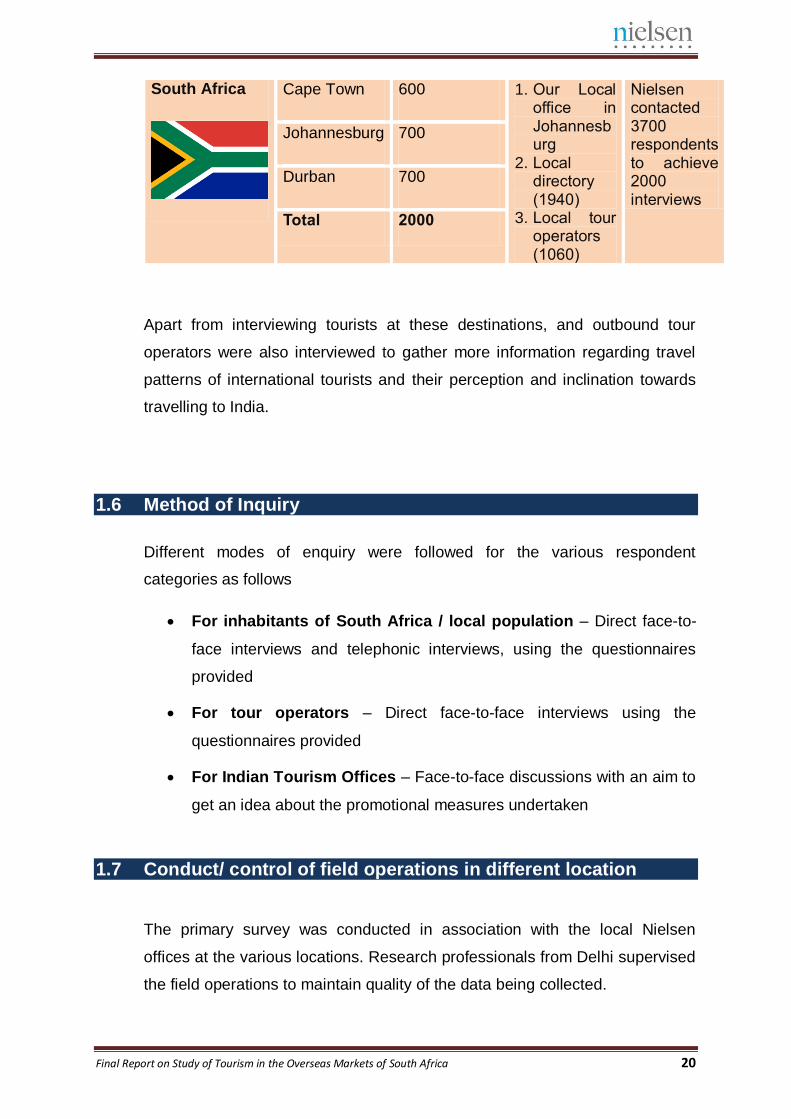
The country is rich in cultural heritage and wildlife, and hence, has numerous
tourist attractions and destinations. The following major tourist locations in
South Africa were shortlisted in order to interview tourists with the desired
profile for the study.
Table 3: Sample and Geographical Coverage
Country Location No. of Respondents
Sources Of Respondents
Hit Rate
Country
Category of Respondents
Total
Persons who Travelled
Abroad in last One Year
Persons who have not
gone abroad yet but intend
to travel in near future
To India To Other
Countries To India
To Other
Countries
South Africa 600 600 200 600 2000
Final Report on Study of Tourism in the Overseas Markets of South Africa 20
South Africa
Cape Town 600 1. Our Local office in Johannesburg
2. Local directory (1940)
3. Local tour operators (1060)
Nielsen contacted 3700 respondents to achieve 2000 interviews
Johannesburg 700
Durban 700
Total 2000
Apart from interviewing tourists at these destinations, and outbound tour
operators were also interviewed to gather more information regarding travel
patterns of international tourists and their perception and inclination towards
travelling to India.
1.6 Method of Inquiry
Different modes of enquiry were followed for the various respondent
categories as follows
For inhabitants of South Africa / local population – Direct face-to-
face interviews and telephonic interviews, using the questionnaires
provided
For tour operators – Direct face-to-face interviews using the
questionnaires provided
For Indian Tourism Offices – Face-to-face discussions with an aim to
get an idea about the promotional measures undertaken
1.7 Conduct/ control of field operations in different location
The primary survey was conducted in association with the local Nielsen
offices at the various locations. Research professionals from Delhi supervised
the field operations to maintain quality of the data being collected.
Final Report on Study of Tourism in the Overseas Markets of South Africa 21
1.8 Data analysis, quality control measures
Analysis of data was primarily conducted on SPSS (Statistical Package for
Social Sciences). Frequency and cross tabulation analysis were conducted as
required. Segmentation of the entire sample of travellers was carried out on
SPSS using parameters like traveller’s age, occupation, education, annual
income, last expenditure of abroad visit, etc. in order to give a detailed
description of the travellers’ profile.
Final Report on Study of Tourism in the Overseas Markets of South Africa 22
Chapter Two
About The Country
2.1 Background – South Africa
2.1.1 Introduction
Dutch traders landed at the southern tip of modern day South Africa in 1652
and established a stopover point on the spice route between the Netherlands
and the Far East, founding the city of Cape Town. After the British seized the
Cape of Good Hope area in 1806, many of the Dutch settlers (Afrikaners, called
"Boers" (farmers) by the British) trekked north to found their own republics in
lands taken from the indigenous black inhabitants.
South Africa, officially known as the Republic of South Africa, is the
southernmost sovereign state in the African continent. It is bounded on the
south by 2,798 kilometres of coastline of Southern Africa stretching along the
South Atlantic and Indian Oceans, on the north by the neighbouring countries of
Namibia, Botswana and Zimbabwe, and on the east by Mozambique and
Swaziland, and surrounding the kingdom of Lesotho. South Africa is the 25th-
largest country in the world by land area, and with close to 53 million people, is
the world's 26th-most populous nation. It is the southernmost country on the
mainland of the Old World or the Eastern Hemisphere.1
South Africa is often referred to as the "Rainbow Nation" to describe the
country's newly developing multi-cultural diversity in the wake of segregationist
apartheid ideology. South Africa is a multi-ethnic society encompassing a wide
variety of cultures, languages, and religions. Its pluralistic makeup is reflected in
the constitution's recognition of 11 official languages, which is among the
highest number of any country in the world. Two of these languages are of
European origin: Afrikaans developed from Dutch and serves as the first
language of most white and coloured South Africans; English reflects the legacy
of British colonialism, and is commonly used in public and commercial life,
though it is fourth-ranked as a spoken first language.
1 Source: CIA World Fact book
Final Report on Study of Tourism in the Overseas Markets of South Africa 23
South Africa has three capital cities which are Pretoria (Executive Capital),
Bloemfontein (Judicial Capital) and Cape Town (Legislative Capital).
Johannesburg is the largest city of the country of South Africa.
2.1.2 Social Profile
South Africa comprises of a rich history in terms of social upheavals and
reforms, the most popularly known social change being the anti-apartheid
struggle and Nelson Mandela’s leadership during the same.
During the 20th century, the black majority sought to recover its rights from the
dominant white minority, with this struggle playing a large role in the country's
recent history and politics. The National Party imposed apartheid in 1948,
institutionalizing previous racial segregation. After a long and violent struggle by
the African National Congress and other anti-apartheid activists, both inside and
outside the country, discriminatory laws began to be repealed or abolished from
1990 onwards.
About 80 percent of South Africans are of Sub-Saharan African ancestry,
divided among a variety of ethnic groups speaking different Bantu languages,
nine of which have official status. The remaining population consists of Africa's
largest communities of European (white), Asian (Indian), and multiracial
(coloured) ancestry. Since 1994, all ethnic and linguistic groups have had
political representation in the country's democracy, which comprises a
parliamentary republic and nine provinces.
2.1.3 Urban/ Rural Population
South Africa is a majorly urbanized population with 64.8% of the total population
(2015) living in urban areas. Major urban areas, with respect to population, are
Johannesburg, Cape Town, Durban, Pretoria, Port Elizabeth and Vereeniging
(2015). 2
2.1.4 Gender Statistics
2 Source: CIA World Factbook.
Final Report on Study of Tourism in the Overseas Markets of South Africa 24
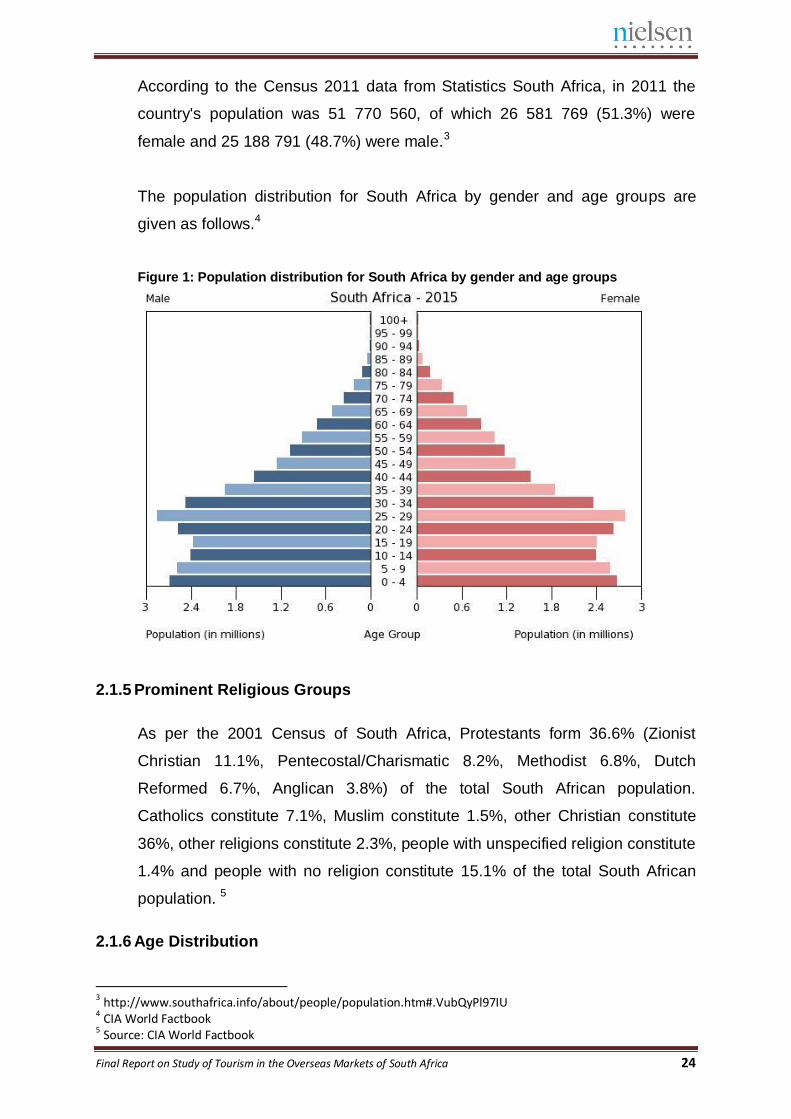
According to the Census 2011 data from Statistics South Africa, in 2011 the
country's population was 51 770 560, of which 26 581 769 (51.3%) were
female and 25 188 791 (48.7%) were male.3
The population distribution for South Africa by gender and age groups are
given as follows.4
Figure 1: Population distribution for South Africa by gender and age groups
2.1.5 Prominent Religious Groups
As per the 2001 Census of South Africa, Protestants form 36.6% (Zionist
Christian 11.1%, Pentecostal/Charismatic 8.2%, Methodist 6.8%, Dutch
Reformed 6.7%, Anglican 3.8%) of the total South African population.
Catholics constitute 7.1%, Muslim constitute 1.5%, other Christian constitute
36%, other religions constitute 2.3%, people with unspecified religion constitute
1.4% and people with no religion constitute 15.1% of the total South African
population. 5
2.1.6 Age Distribution
3 http://www.southafrica.info/about/people/population.htm#.VubQyPl97IU 4 CIA World Factbook 5 Source: CIA World Factbook
Final Report on Study of Tourism in the Overseas Markets of South Africa 25
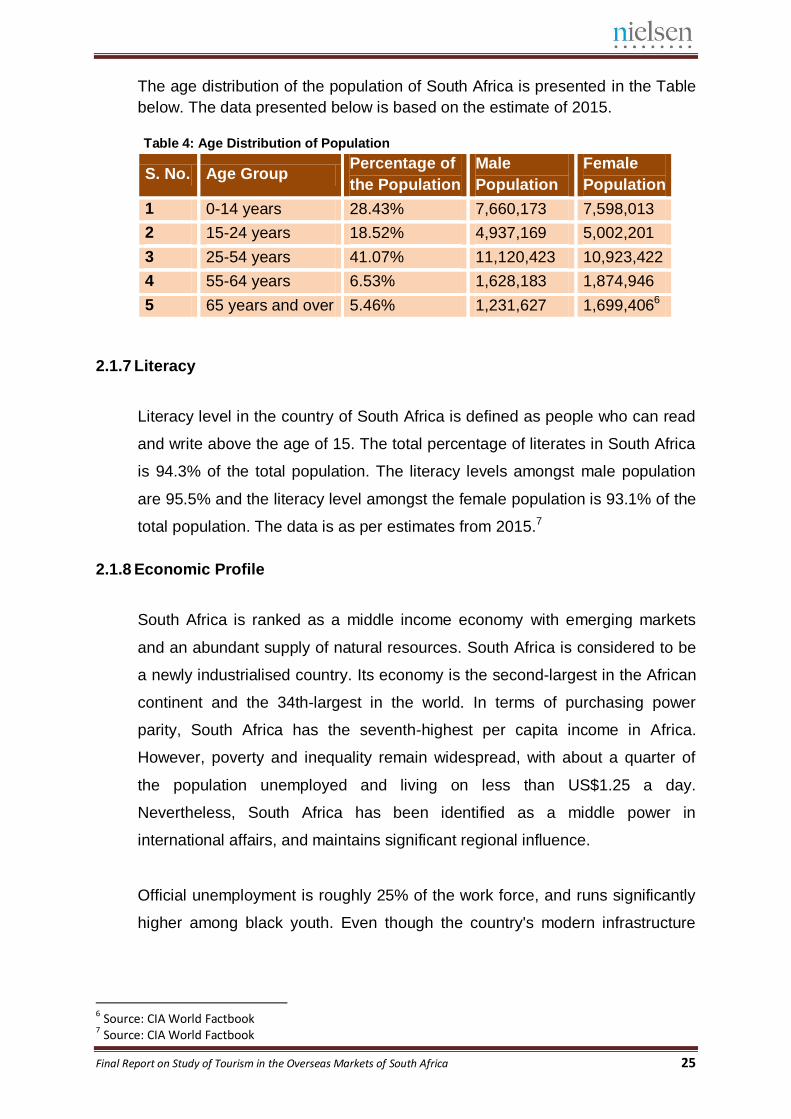
The age distribution of the population of South Africa is presented in the Table
below. The data presented below is based on the estimate of 2015.
Table 4: Age Distribution of Population
S. No. Age Group Percentage of
the Population
Male
Population
Female
Population
1 0-14 years 28.43% 7,660,173 7,598,013
2 15-24 years 18.52% 4,937,169 5,002,201
3 25-54 years 41.07% 11,120,423 10,923,422
4 55-64 years 6.53% 1,628,183 1,874,946
5 65 years and over 5.46% 1,231,627 1,699,4066
2.1.7 Literacy
Literacy level in the country of South Africa is defined as people who can read
and write above the age of 15. The total percentage of literates in South Africa
is 94.3% of the total population. The literacy levels amongst male population
are 95.5% and the literacy level amongst the female population is 93.1% of the
total population. The data is as per estimates from 2015.7
2.1.8 Economic Profile
South Africa is ranked as a middle income economy with emerging markets
and an abundant supply of natural resources. South Africa is considered to be
a newly industrialised country. Its economy is the second-largest in the African
continent and the 34th-largest in the world. In terms of purchasing power
parity, South Africa has the seventh-highest per capita income in Africa.
However, poverty and inequality remain widespread, with about a quarter of
the population unemployed and living on less than US$1.25 a day.
Nevertheless, South Africa has been identified as a middle power in
international affairs, and maintains significant regional influence.
Official unemployment is roughly 25% of the work force, and runs significantly
higher among black youth. Even though the country's modern infrastructure
6 Source: CIA World Factbook 7 Source: CIA World Factbook
Final Report on Study of Tourism in the Overseas Markets of South Africa 26
supports a relatively efficient distribution of goods to major urban centres
throughout the region, unstable electricity supplies retard growth.8
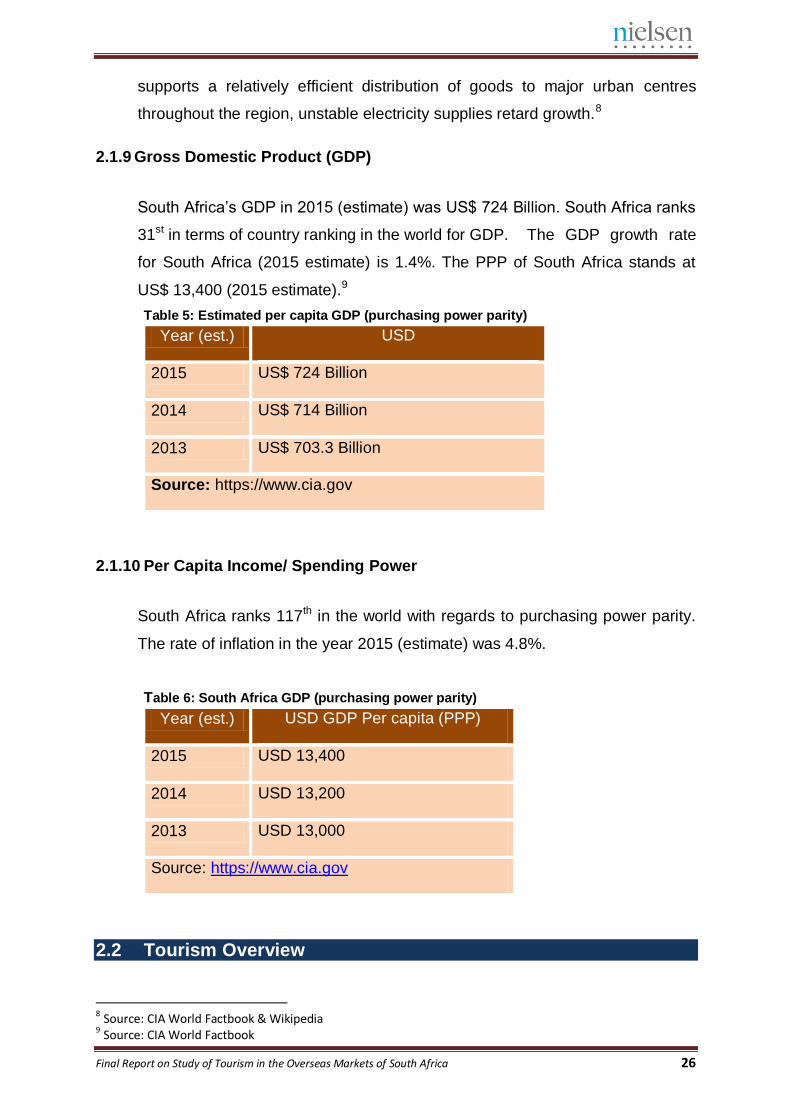
2.1.9 Gross Domestic Product (GDP)
South Africa’s GDP in 2015 (estimate) was US$ 724 Billion. South Africa ranks
31st in terms of country ranking in the world for GDP. The GDP growth rate
for South Africa (2015 estimate) is 1.4%. The PPP of South Africa stands at
US$ 13,400 (2015 estimate).9
Table 5: Estimated per capita GDP (purchasing power parity)
Year (est.) USD
2015 US$ 724 Billion
2014 US$ 714 Billion
2013 US$ 703.3 Billion
Source: https://www.cia.gov
2.1.10 Per Capita Income/ Spending Power
South Africa ranks 117th in the world with regards to purchasing power parity.
The rate of inflation in the year 2015 (estimate) was 4.8%.
Table 6: South Africa GDP (purchasing power parity)
Year (est.) USD GDP Per capita (PPP)
2015 USD 13,400
2014 USD 13,200
2013 USD 13,000
Source: https://www.cia.gov
2.2 Tourism Overview
8 Source: CIA World Factbook & Wikipedia 9 Source: CIA World Factbook
Final Report on Study of Tourism in the Overseas Markets of South Africa 27
2.2.1 General Statistics
South Africa is highly diverse in terms of its geography, climate, culture,
tourist activities and infrastructure, catering for every tourism niche, from
business, eco- and cultural tourism through to adventure, sport and paleo-
tourism. This diversity the country offers, along with South Africa’s scenic
beauty and reputation for delivering value for money has made it one of the
world’s fastest growing leisure and business travel destinations in the world.
The regional African tourist market is South Africa’s important tourist markets,
contributing more than 73% of total tourist arrivals and more than R50-billion
in revenue in 2011.
Domestic tourism is also an important source of revenue and employment,
contributing 52% of total tourism consumption.10
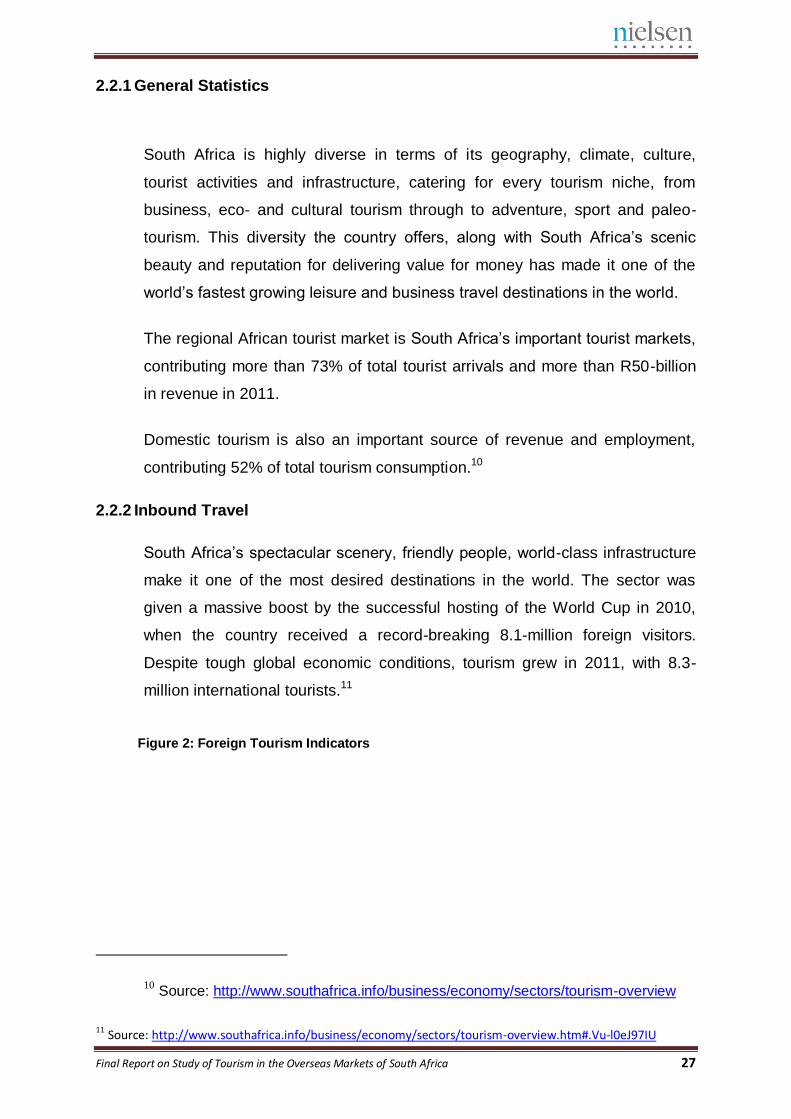
2.2.2 Inbound Travel
South Africa’s spectacular scenery, friendly people, world-class infrastructure
make it one of the most desired destinations in the world. The sector was
given a massive boost by the successful hosting of the World Cup in 2010,
when the country received a record-breaking 8.1-million foreign visitors.
Despite tough global economic conditions, tourism grew in 2011, with 8.3-
million international tourists.11
Figure 2: Foreign Tourism Indicators
10 Source: http://www.southafrica.info/business/economy/sectors/tourism-overview
11 Source: http://www.southafrica.info/business/economy/sectors/tourism-overview.htm#.Vu-l0eJ97IU
Final Report on Study of Tourism in the Overseas Markets of South Africa 28
12
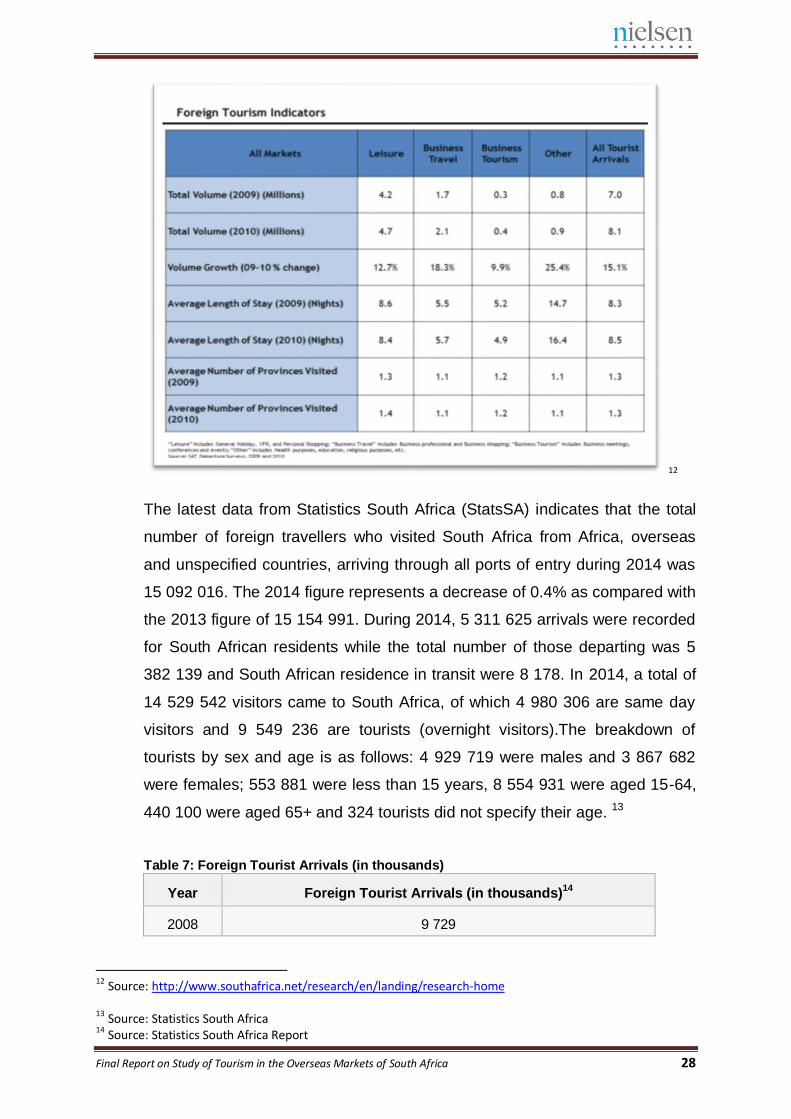
The latest data from Statistics South Africa (StatsSA) indicates that the total
number of foreign travellers who visited South Africa from Africa, overseas
and unspecified countries, arriving through all ports of entry during 2014 was
15 092 016. The 2014 figure represents a decrease of 0.4% as compared with
the 2013 figure of 15 154 991. During 2014, 5 311 625 arrivals were recorded
for South African residents while the total number of those departing was 5
382 139 and South African residence in transit were 8 178. In 2014, a total of
14 529 542 visitors came to South Africa, of which 4 980 306 are same day
visitors and 9 549 236 are tourists (overnight visitors).The breakdown of
tourists by sex and age is as follows: 4 929 719 were males and 3 867 682
were females; 553 881 were less than 15 years, 8 554 931 were aged 15-64,
440 100 were aged 65+ and 324 tourists did not specify their age. 13
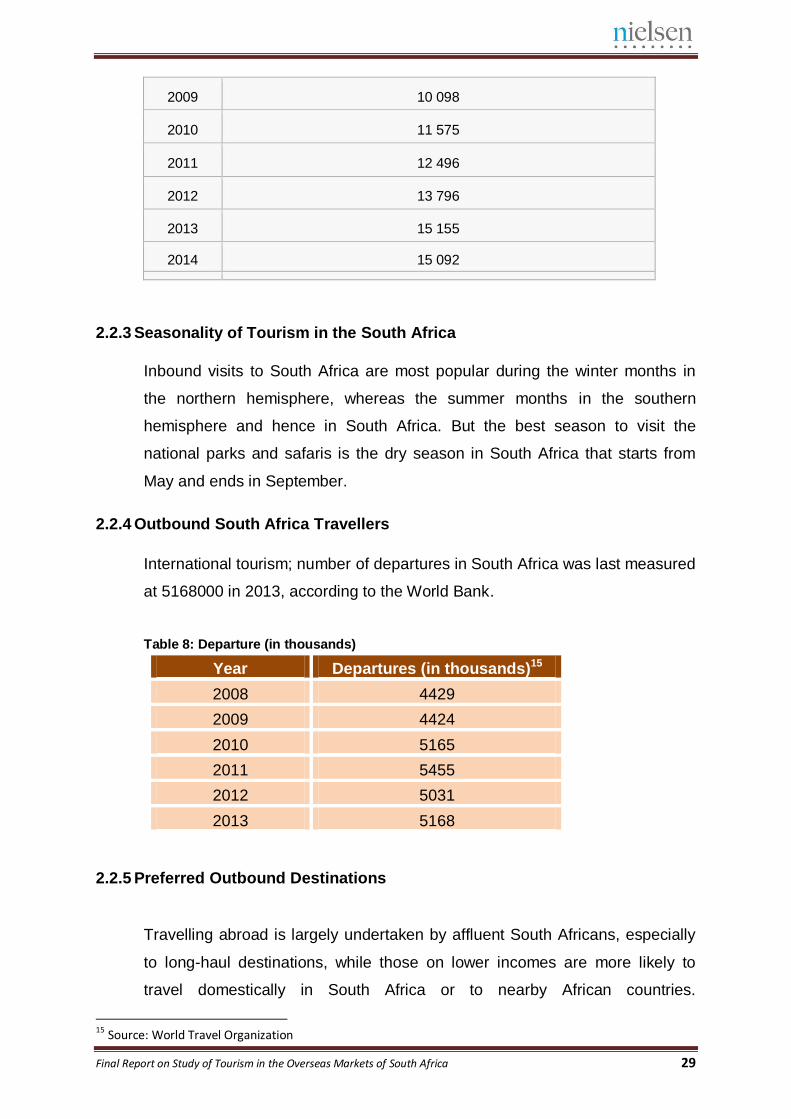
Table 7: Foreign Tourist Arrivals (in thousands)
Year Foreign Tourist Arrivals (in thousands)14
2008 9 729
12 Source: http://www.southafrica.net/research/en/landing/research-home 13 Source: Statistics South Africa 14 Source: Statistics South Africa Report
Final Report on Study of Tourism in the Overseas Markets of South Africa 29
2009 10 098
2010 11 575
2011 12 496
2012 13 796
2013 15 155
2014 15 092
2.2.3 Seasonality of Tourism in the South Africa
Inbound visits to South Africa are most popular during the winter months in
the northern hemisphere, whereas the summer months in the southern
hemisphere and hence in South Africa. But the best season to visit the
national parks and safaris is the dry season in South Africa that starts from
May and ends in September.
2.2.4 Outbound South Africa Travellers
International tourism; number of departures in South Africa was last measured
at 5168000 in 2013, according to the World Bank.
Table 8: Departure (in thousands)
Year Departures (in thousands)15
2008 4429
2009 4424
2010 5165
2011 5455
2012 5031
2013 5168
2.2.5 Preferred Outbound Destinations
Travelling abroad is largely undertaken by affluent South Africans, especially
to long-haul destinations, while those on lower incomes are more likely to
travel domestically in South Africa or to nearby African countries.
15 Source: World Travel Organization
Final Report on Study of Tourism in the Overseas Markets of South Africa 30
Approximately one in ten South Africans travel abroad each year, although
holiday and leisure travel is only one part of the market. Visiting friends and
relatives (VFR) and business travel are both important components of the
South African outbound market.
Preferred destinations for South Africans are Europe, Uk, Germany, and
Turkey amongst European countries. Preferred destinations of South Africans
amongst the long haul destinations are USA, Thailand, Hong Kong, Australia
and Singapore. Amongst the nations in the African continent, the preferred
destination of South Africans are Zimbabwe, Lesotho, Swaziland,
Mozambique, Botswana, Namibia, Mauritius and Zambia.
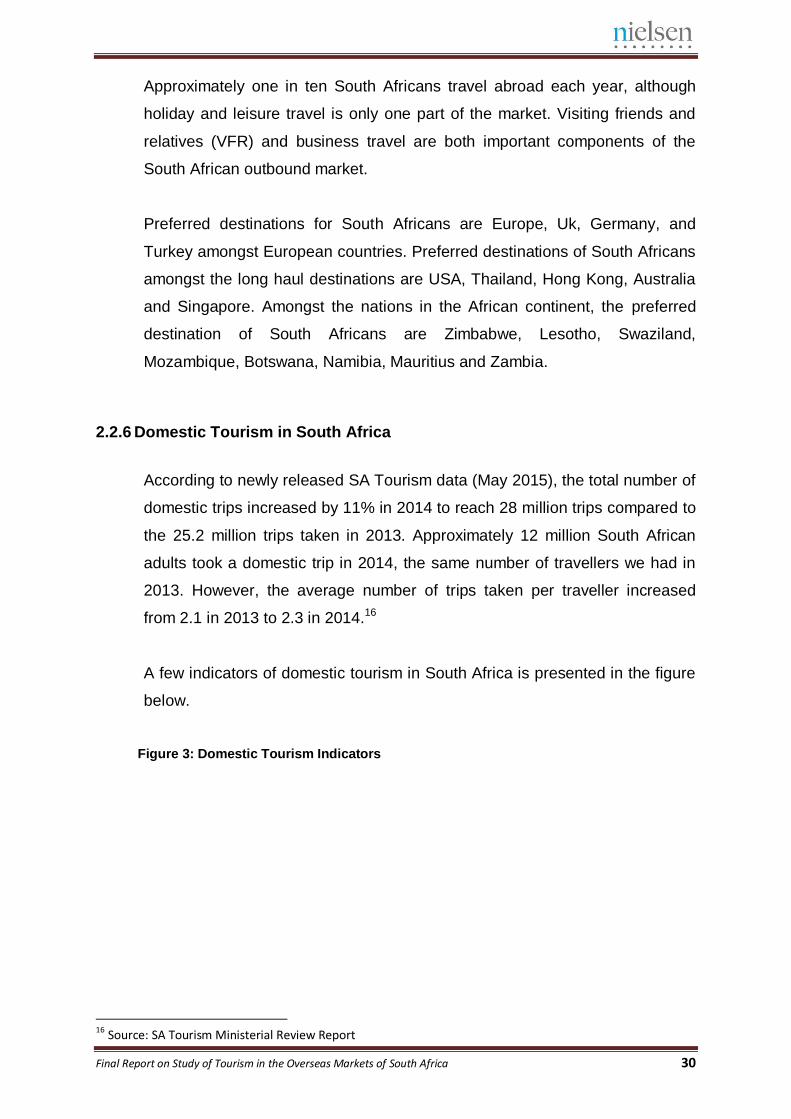
2.2.6 Domestic Tourism in South Africa
According to newly released SA Tourism data (May 2015), the total number of
domestic trips increased by 11% in 2014 to reach 28 million trips compared to
the 25.2 million trips taken in 2013. Approximately 12 million South African
adults took a domestic trip in 2014, the same number of travellers we had in
2013. However, the average number of trips taken per traveller increased
from 2.1 in 2013 to 2.3 in 2014.16
A few indicators of domestic tourism in South Africa is presented in the figure
below.
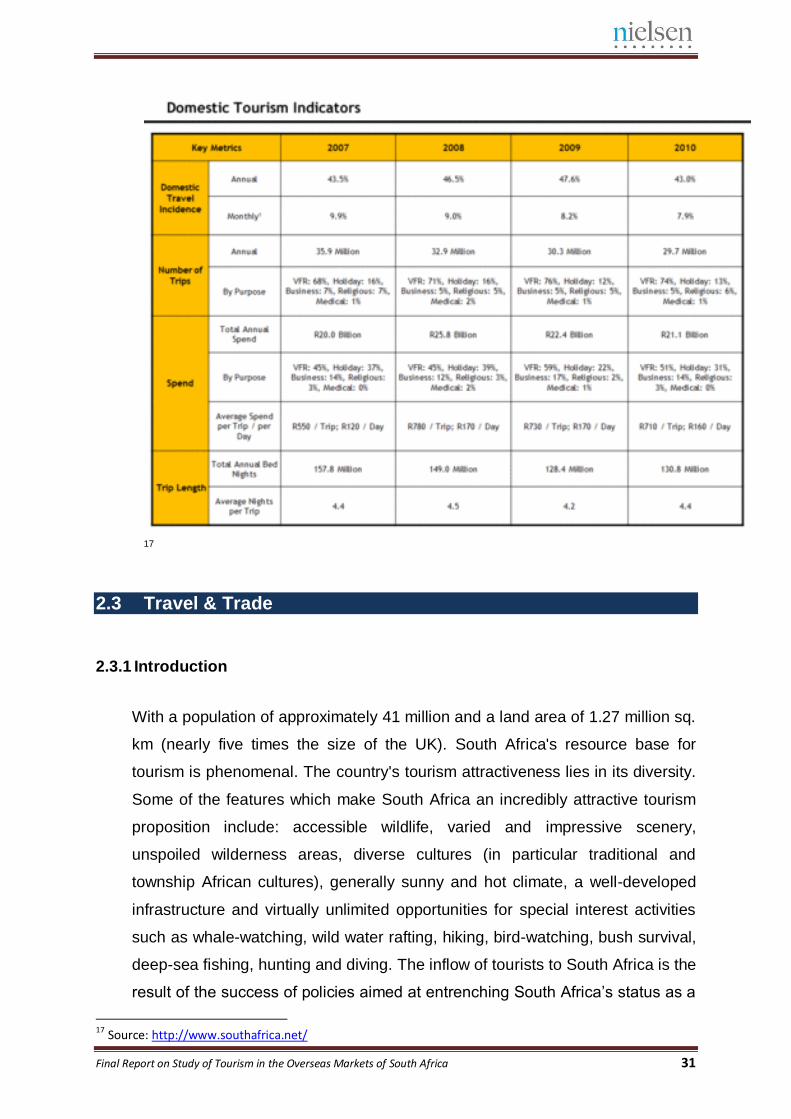
Figure 3: Domestic Tourism Indicators
16 Source: SA Tourism Ministerial Review Report
Final Report on Study of Tourism in the Overseas Markets of South Africa 31
17
2.3 Travel & Trade
2.3.1 Introduction
With a population of approximately 41 million and a land area of 1.27 million sq.
km (nearly five times the size of the UK). South Africa's resource base for
tourism is phenomenal. The country's tourism attractiveness lies in its diversity.
Some of the features which make South Africa an incredibly attractive tourism
proposition include: accessible wildlife, varied and impressive scenery,
unspoiled wilderness areas, diverse cultures (in particular traditional and
township African cultures), generally sunny and hot climate, a well-developed
infrastructure and virtually unlimited opportunities for special interest activities
such as whale-watching, wild water rafting, hiking, bird-watching, bush survival,
deep-sea fishing, hunting and diving. The inflow of tourists to South Africa is the
result of the success of policies aimed at entrenching South Africa’s status as a
17 Source: http://www.southafrica.net/
Final Report on Study of Tourism in the Overseas Markets of South Africa 32
major international tourism and business events destination. Tourism supports
one in every 12 jobs in South Africa.
Given the strong growth potential in Africa, South Africa Tourism (SAT) was
allocated R300 million to expand its marketing presence on the continent, which
will include the opening of another four offices in the next few years. Also, the
Tourism Business Council of South Africa is the umbrella organisation
representing organised business in the South African travel and tourism
industry.
2.3.2 Role and characteristics of tourism and travel trade in the country
South Africa has earmarked tourism as a key sector with excellent potential for
growth: the government aims to increase tourism’s contribution, both direct and
indirectly, to the economy. Tourism is a national priority and contributes
significantly to economic development. The national tourism sector strategy
provides a blueprint for the sector to meet the growth targets contained in the
new growth path.
The tourism industry continues to play an important role in the South African
economy. The latest Tourism Satellite Account for South Africa report provides
an overview of tourism’s contribution in terms of spending, employment and its
impact on the gross domestic product (GDP).
Tourism direct GDP was R103.6 billion in 2013, rising from R93.5 billion in
2012. The industry’s contribution to total GDP remained stable at 2.9% for both
years.
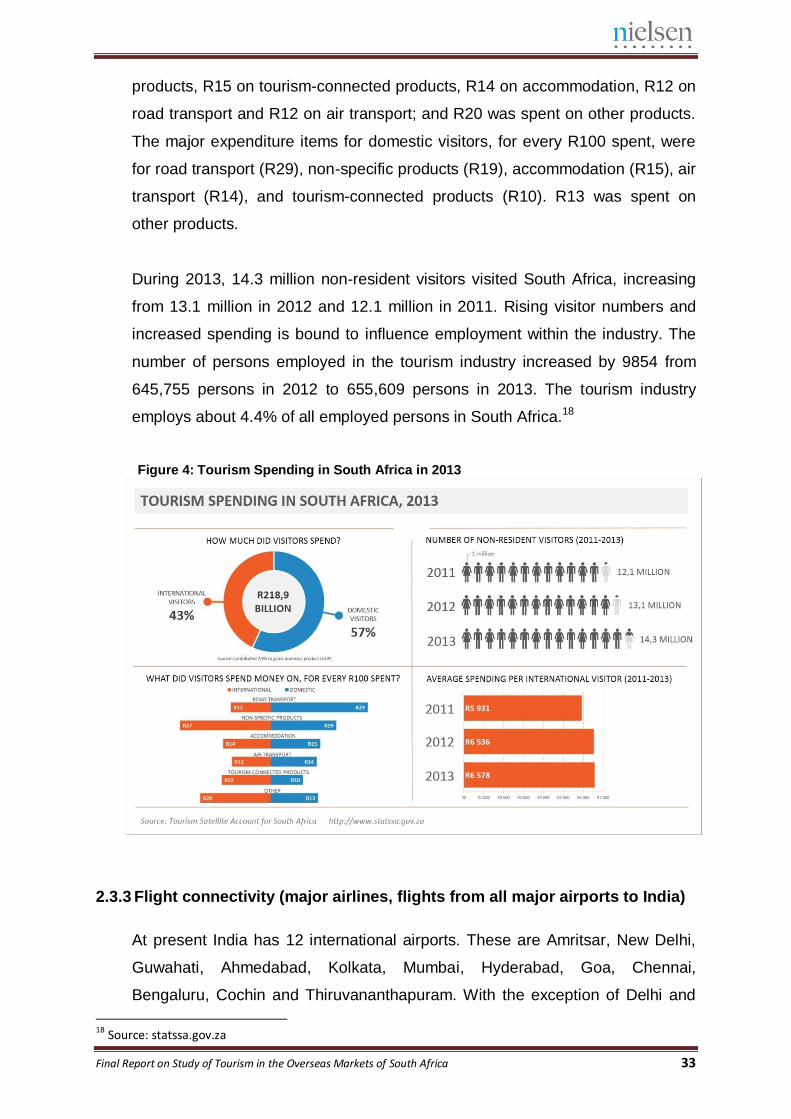
Domestic visitors contributed 57% (R124.7 billion) of total tourism spend in
2013, while international visitors contributed 43% (R94.2 billion). Total tourism
spend in 2013 was R218.9 billion, a rise of 9.7% from R199,4 billion in 2012.
International and domestic visitors have different spending habits. For every
R100 spent by an international visitor in 2013, R27 was spent on non-specific
Final Report on Study of Tourism in the Overseas Markets of South Africa 33
products, R15 on tourism-connected products, R14 on accommodation, R12 on
road transport and R12 on air transport; and R20 was spent on other products.
The major expenditure items for domestic visitors, for every R100 spent, were
for road transport (R29), non-specific products (R19), accommodation (R15), air
transport (R14), and tourism-connected products (R10). R13 was spent on
other products.
During 2013, 14.3 million non-resident visitors visited South Africa, increasing
from 13.1 million in 2012 and 12.1 million in 2011. Rising visitor numbers and
increased spending is bound to influence employment within the industry. The
number of persons employed in the tourism industry increased by 9854 from
645,755 persons in 2012 to 655,609 persons in 2013. The tourism industry
employs about 4.4% of all employed persons in South Africa.18
Figure 4: Tourism Spending in South Africa in 2013
2.3.3 Flight connectivity (major airlines, flights from all major airports to India)
At present India has 12 international airports. These are Amritsar, New Delhi,
Guwahati, Ahmedabad, Kolkata, Mumbai, Hyderabad, Goa, Chennai,
Bengaluru, Cochin and Thiruvananthapuram. With the exception of Delhi and
18 Source: statssa.gov.za
Final Report on Study of Tourism in the Overseas Markets of South Africa 34
Amritsar which get severely fog-bound from mid-December to February,
causing endless flight delays and cancellations; the remainder stay operational
through the year. The age-old fog problem can be resolved with the use of a
category III C instrument landing system (ILS), but Delhi as of now has only a
Category II ILS, and Amritsar is to be upgraded to a Category II ILS.
All leading international airlines including KLM, Lufthansa, British Airways,
Emirates, Cathay Pacific etc. operate into and out of India. Many of these
airlines have hired Indian nationals to serve on board as cabin crew, to cater to
passengers who may not even know any other language other than their own.
Most long-haul international flights leave India in the early hours of the morning,
so as to reach the destination airports during the daylight hours in those
countries.
There are 10 international airports in South Africa, namely, Cape Town,
Durban, Johannesburg (Lanseria airport and O.R. Tambo international airport),
Mmabatho, Nelspruit, Polokwane and Sun City.
There are no direct flights between India and South Africa but there are regular
flights connecting both the countries via transit points like Dubai.
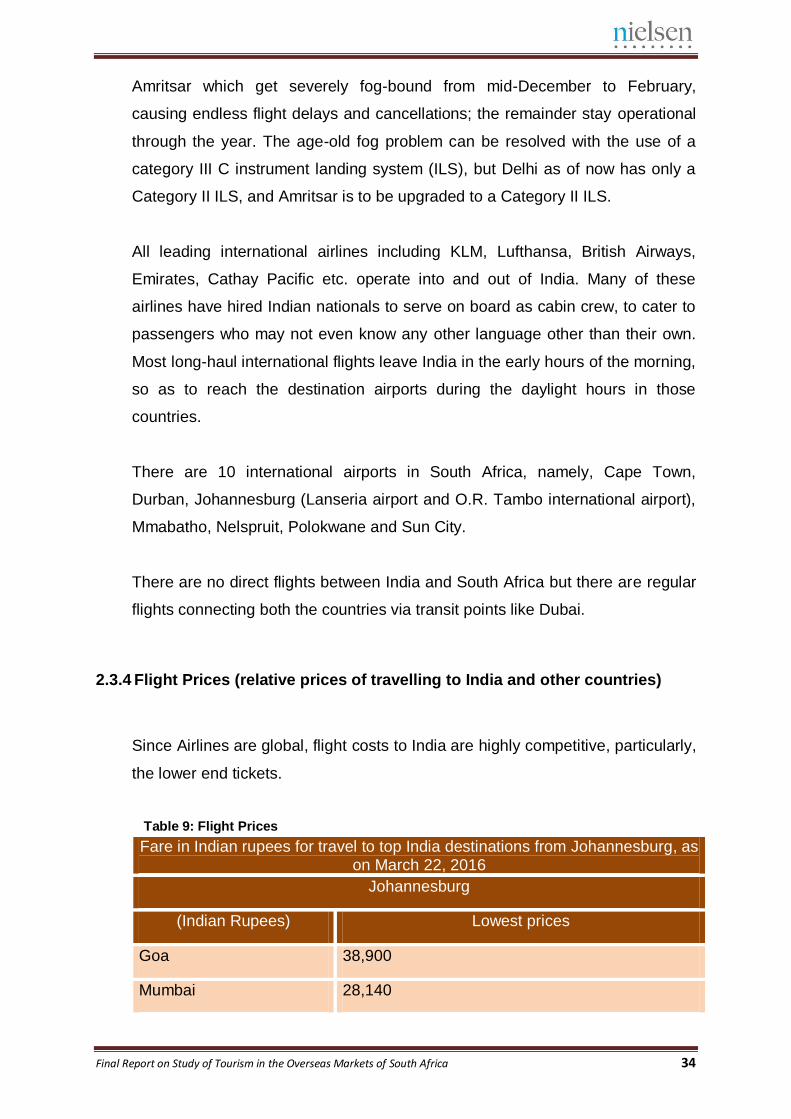
2.3.4 Flight Prices (relative prices of travelling to India and other countries)
Since Airlines are global, flight costs to India are highly competitive, particularly,
the lower end tickets.
Table 9: Flight Prices
Fare in Indian rupees for travel to top India destinations from Johannesburg, as on March 22, 2016
Johannesburg
(Indian Rupees) Lowest prices
Goa 38,900
Mumbai 28,140
Final Report on Study of Tourism in the Overseas Markets of South Africa 35
Bangalore 38,392
Delhi 42,250
Hyderabad 39,085
Chennai 36,909
Kolkata 46,451
Chandigarh 59,770
Jaipur 45,139
Source: http://www.skyscanner.in
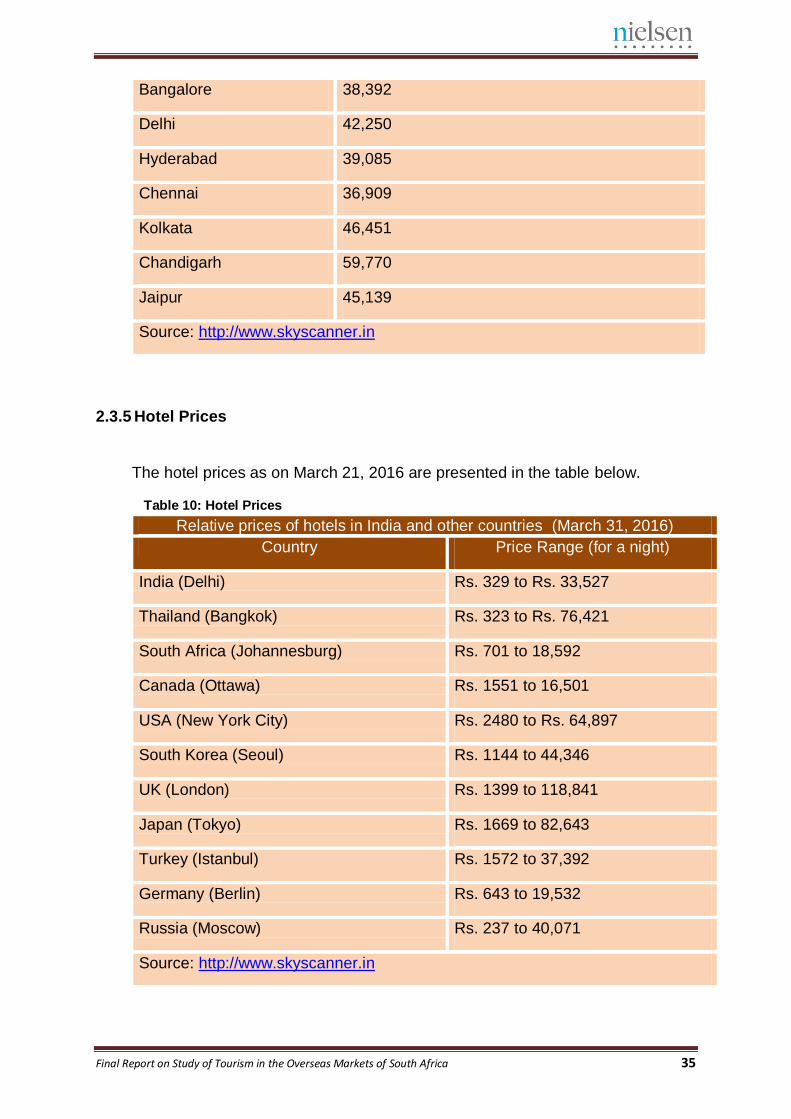
2.3.5 Hotel Prices
The hotel prices as on March 21, 2016 are presented in the table below.
Table 10: Hotel Prices
Relative prices of hotels in India and other countries (March 31, 2016)
Country Price Range (for a night)
India (Delhi) Rs. 329 to Rs. 33,527
Thailand (Bangkok) Rs. 323 to Rs. 76,421
South Africa (Johannesburg) Rs. 701 to 18,592
Canada (Ottawa) Rs. 1551 to 16,501
USA (New York City) Rs. 2480 to Rs. 64,897
South Korea (Seoul) Rs. 1144 to 44,346
UK (London) Rs. 1399 to 118,841
Japan (Tokyo) Rs. 1669 to 82,643
Turkey (Istanbul) Rs. 1572 to 37,392
Germany (Berlin) Rs. 643 to 19,532
Russia (Moscow) Rs. 237 to 40,071
Source: http://www.skyscanner.in
Final Report on Study of Tourism in the Overseas Markets of South Africa 36
Chapter Three
Past Outbound Traveller Study Findings
3.1 Past Outbound Travel Behaviour
3.1.1 Profiling Information
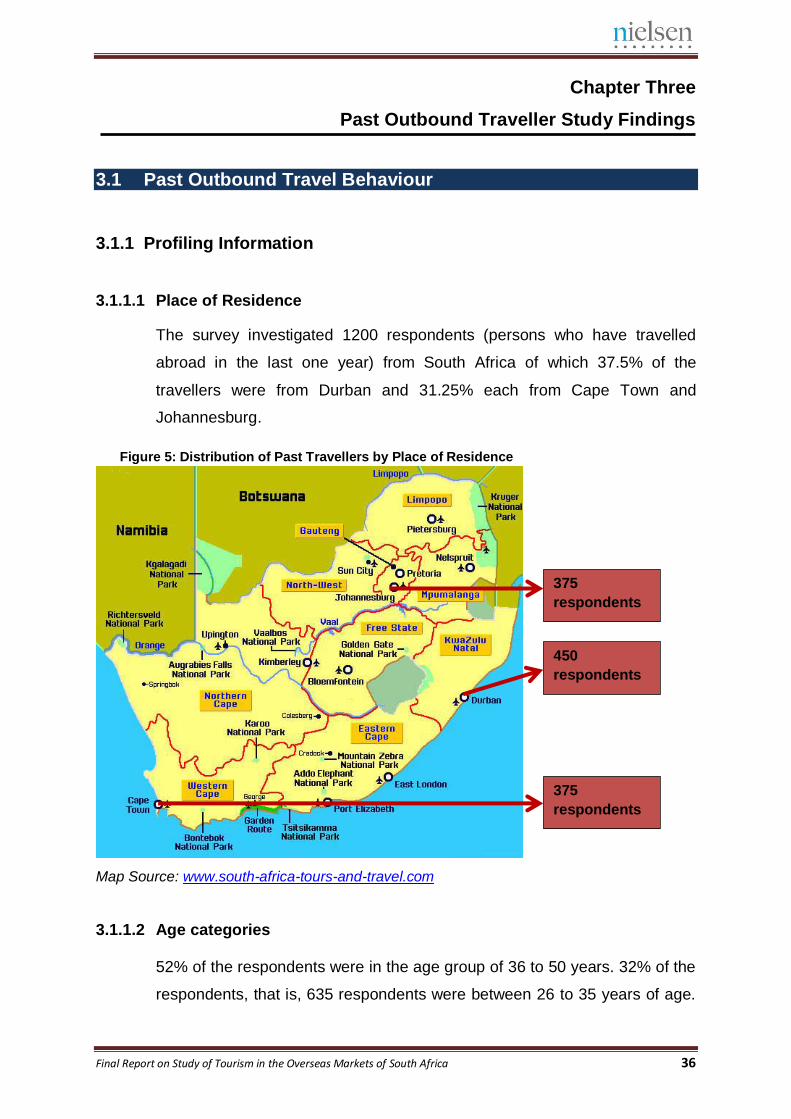
3.1.1.1 Place of Residence
The survey investigated 1200 respondents (persons who have travelled
abroad in the last one year) from South Africa of which 37.5% of the
travellers were from Durban and 31.25% each from Cape Town and
Johannesburg.
Figure 5: Distribution of Past Travellers by Place of Residence
Map Source: www.south-africa-tours-and-travel.com
3.1.1.2 Age categories
52% of the respondents were in the age group of 36 to 50 years. 32% of the
respondents, that is, 635 respondents were between 26 to 35 years of age.
375
respondents
375
respondents
450
respondents
Final Report on Study of Tourism in the Overseas Markets of South Africa 37
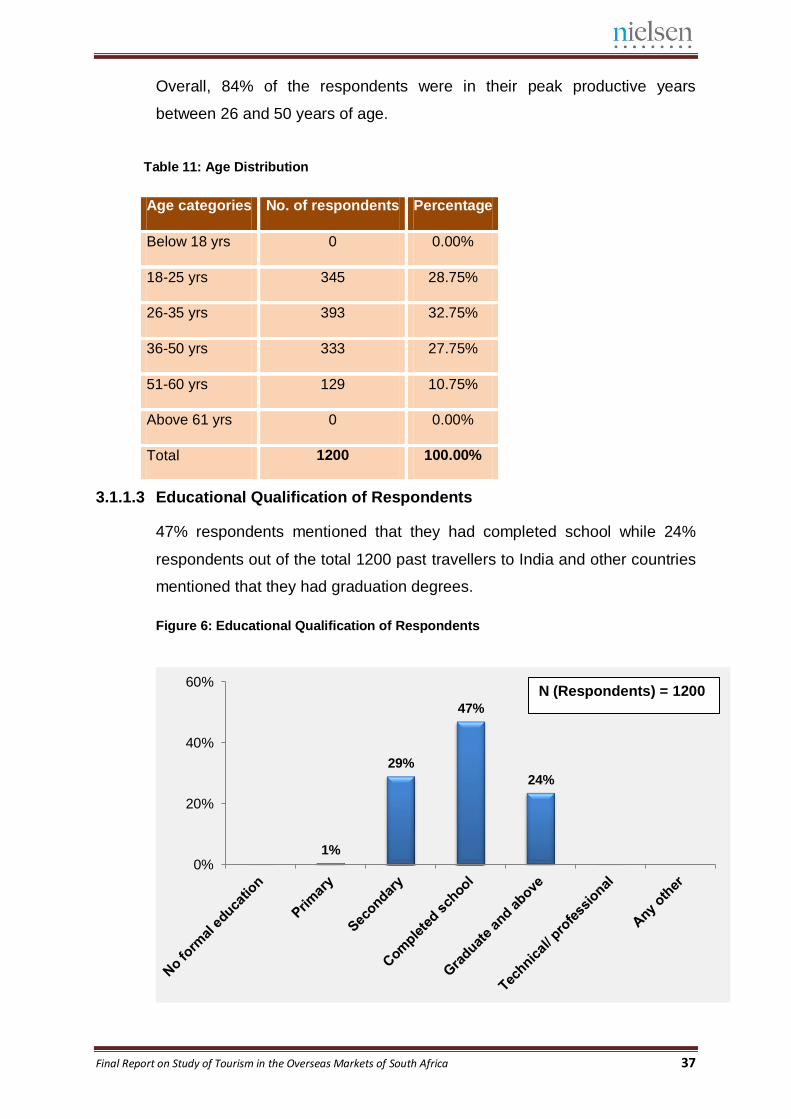
Overall, 84% of the respondents were in their peak productive years
between 26 and 50 years of age.
Table 11: Age Distribution
3.1.1.3 Educational Qualification of Respondents
47% respondents mentioned that they had completed school while 24%
respondents out of the total 1200 past travellers to India and other countries
mentioned that they had graduation degrees.
Figure 6: Educational Qualification of Respondents
1%
29%
47%
24%
0%
20%
40%
60%
Age categories No. of respondents Percentage
Below 18 yrs 0 0.00%
18-25 yrs 345 28.75%
26-35 yrs 393 32.75%
36-50 yrs 333 27.75%
51-60 yrs 129 10.75%
Above 61 yrs 0 0.00%
Total 1200 100.00%
N (Respondents) = 1200
Final Report on Study of Tourism in the Overseas Markets of South Africa 38
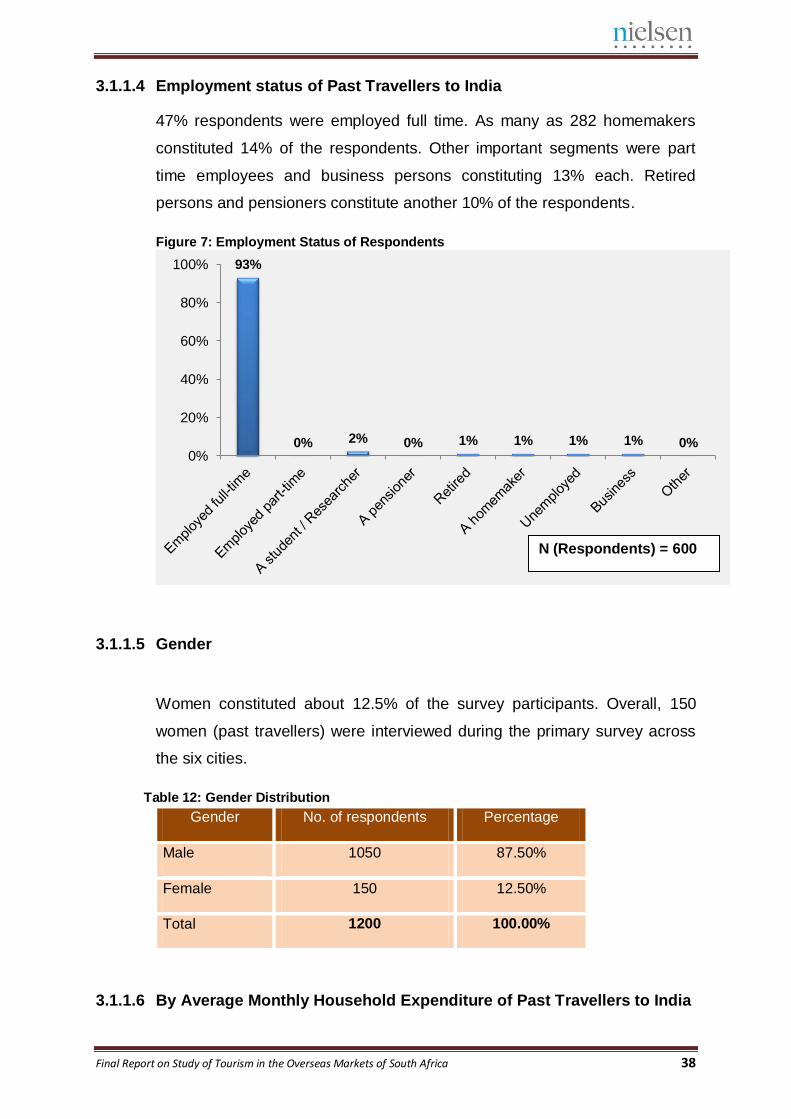
3.1.1.4 Employment status of Past Travellers to India
47% respondents were employed full time. As many as 282 homemakers
constituted 14% of the respondents. Other important segments were part
time employees and business persons constituting 13% each. Retired
persons and pensioners constitute another 10% of the respondents.
Figure 7: Employment Status of Respondents
3.1.1.5 Gender
Women constituted about 12.5% of the survey participants. Overall, 150
women (past travellers) were interviewed during the primary survey across
the six cities.
Table 12: Gender Distribution
Gender No. of respondents Percentage
Male 1050 87.50%
Female 150 12.50%
Total 1200 100.00%
3.1.1.6 By Average Monthly Household Expenditure of Past Travellers to India
93%
0% 2% 0% 1% 1% 1% 1% 0% 0%
20%
40%
60%
80%
100%
N (Respondents) = 600
Final Report on Study of Tourism in the Overseas Markets of South Africa 39
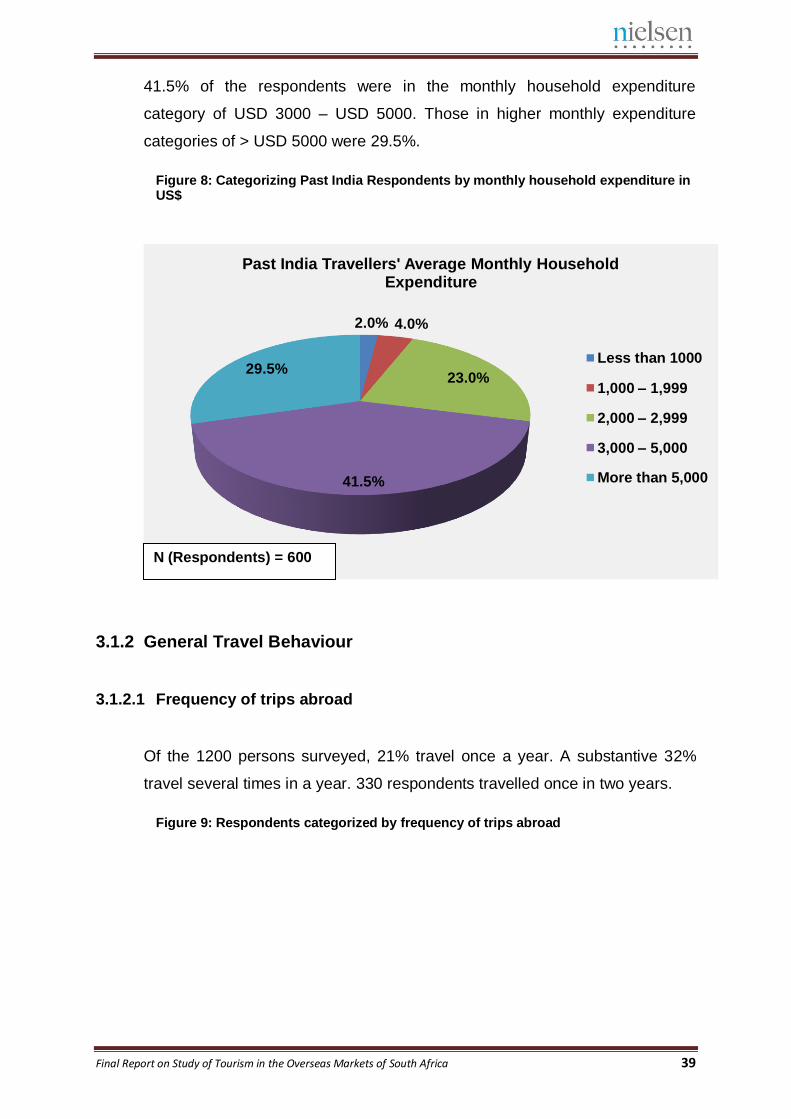
41.5% of the respondents were in the monthly household expenditure
category of USD 3000 – USD 5000. Those in higher monthly expenditure
categories of > USD 5000 were 29.5%.
Figure 8: Categorizing Past India Respondents by monthly household expenditure in US$
3.1.2 General Travel Behaviour
3.1.2.1 Frequency of trips abroad
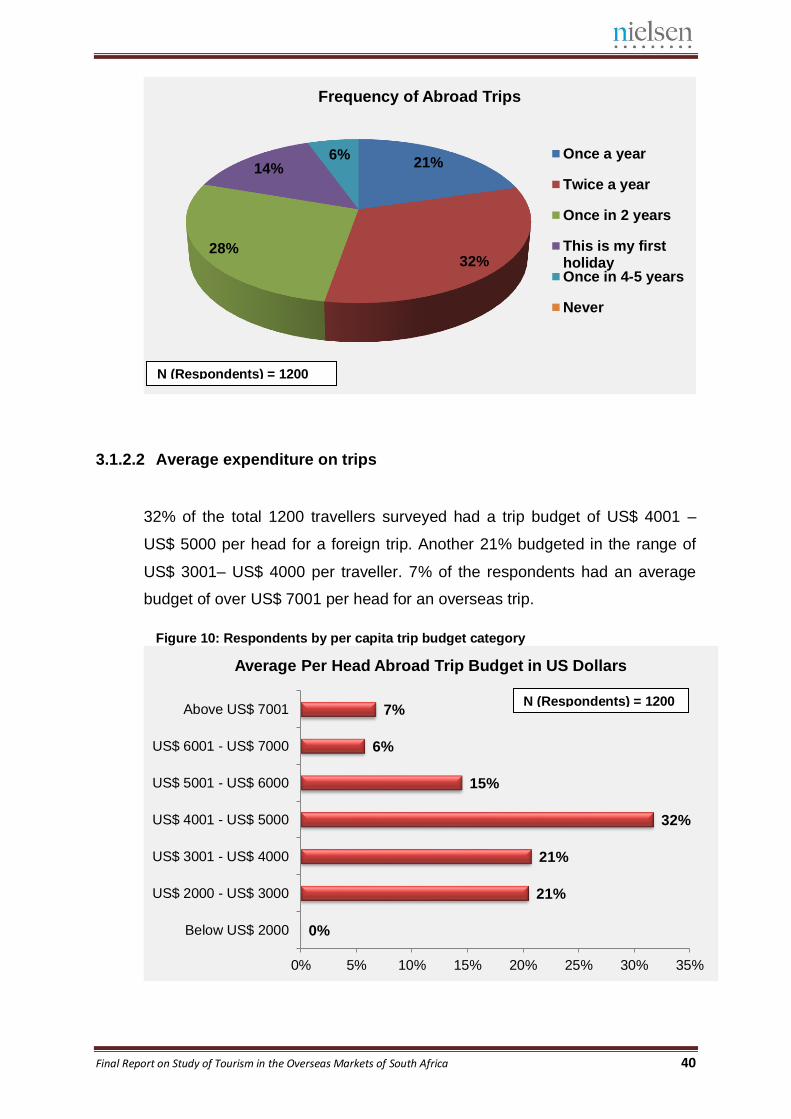
Of the 1200 persons surveyed, 21% travel once a year. A substantive 32%
travel several times in a year. 330 respondents travelled once in two years.
Figure 9: Respondents categorized by frequency of trips abroad
2.0% 4.0%
23.0%
41.5%
29.5%
Past India Travellers' Average Monthly Household Expenditure
Less than 1000
1,000 – 1,999
2,000 – 2,999
3,000 – 5,000
More than 5,000
N (Respondents) = 600
Final Report on Study of Tourism in the Overseas Markets of South Africa 40
3.1.2.2 Average expenditure on trips
32% of the total 1200 travellers surveyed had a trip budget of US$ 4001 –
US$ 5000 per head for a foreign trip. Another 21% budgeted in the range of
US$ 3001– US$ 4000 per traveller. 7% of the respondents had an average
budget of over US$ 7001 per head for an overseas trip.
Figure 10: Respondents by per capita trip budget category
21%
32% 28%
14% 6%
Frequency of Abroad Trips
Once a year
Twice a year
Once in 2 years
This is my firstholidayOnce in 4-5 years
Never
0%
21%
21%
32%
15%
6%
7%
0% 5% 10% 15% 20% 25% 30% 35%
Below US$ 2000
US$ 2000 - US$ 3000
US$ 3001 - US$ 4000
US$ 4001 - US$ 5000
US$ 5001 - US$ 6000
US$ 6001 - US$ 7000
Above US$ 7001
Average Per Head Abroad Trip Budget in US Dollars
N (Respondents) = 1200
N (Respondents) = 1200
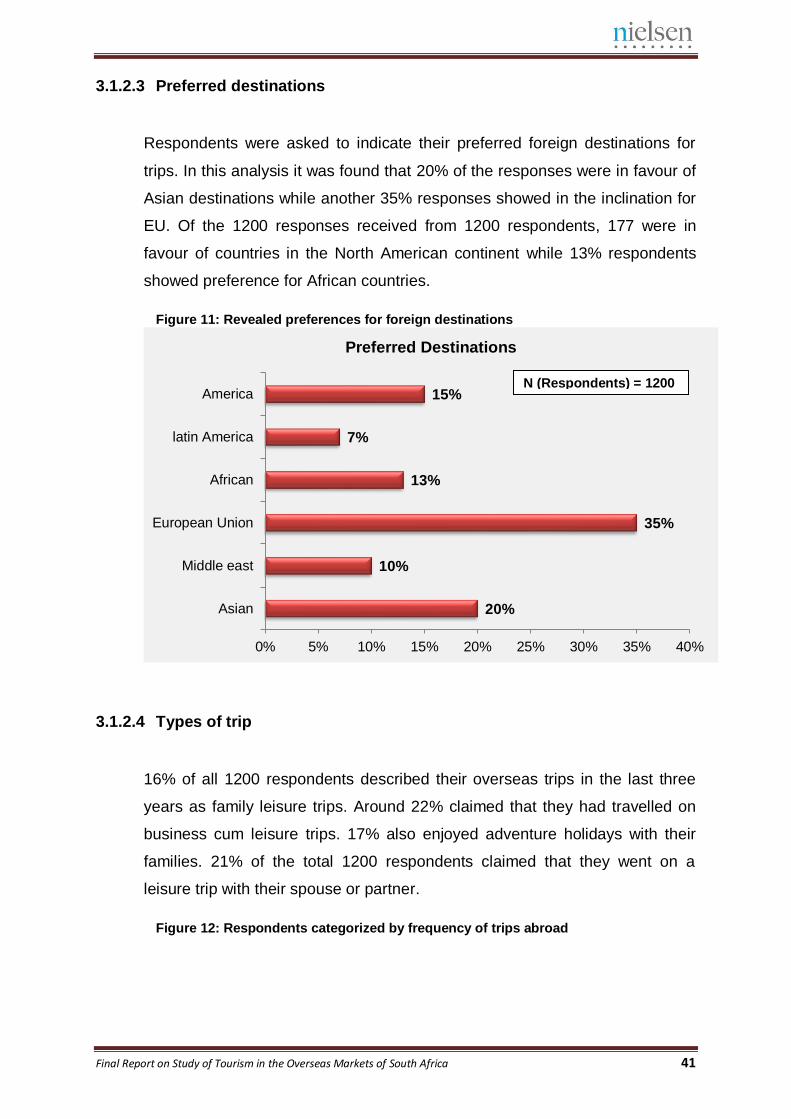
Final Report on Study of Tourism in the Overseas Markets of South Africa 41
3.1.2.3 Preferred destinations
Respondents were asked to indicate their preferred foreign destinations for
trips. In this analysis it was found that 20% of the responses were in favour of
Asian destinations while another 35% responses showed in the inclination for
EU. Of the 1200 responses received from 1200 respondents, 177 were in
favour of countries in the North American continent while 13% respondents
showed preference for African countries.
Figure 11: Revealed preferences for foreign destinations
3.1.2.4 Types of trip
16% of all 1200 respondents described their overseas trips in the last three
years as family leisure trips. Around 22% claimed that they had travelled on
business cum leisure trips. 17% also enjoyed adventure holidays with their
families. 21% of the total 1200 respondents claimed that they went on a
leisure trip with their spouse or partner.
Figure 12: Respondents categorized by frequency of trips abroad
20%
10%
35%
13%
7%
15%
0% 5% 10% 15% 20% 25% 30% 35% 40%
Asian
Middle east
European Union
African
latin America
America
Preferred Destinations
N (Respondents) = 1200
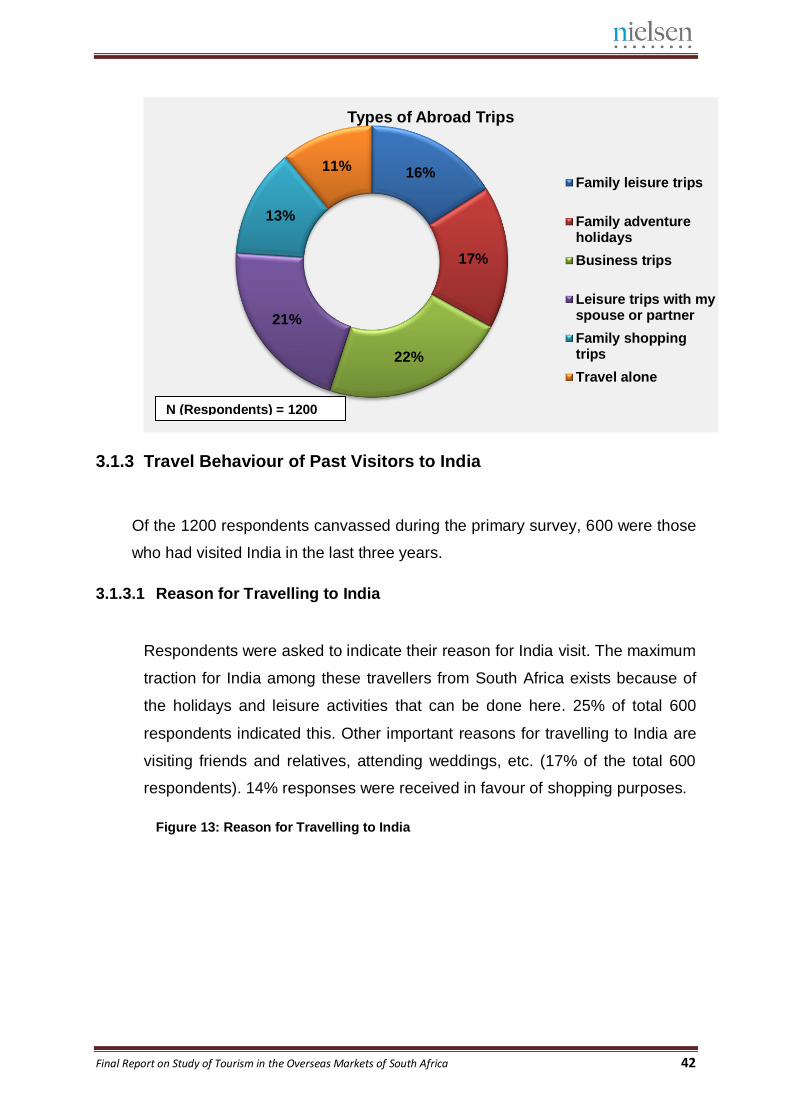
Final Report on Study of Tourism in the Overseas Markets of South Africa 42
3.1.3 Travel Behaviour of Past Visitors to India
Of the 1200 respondents canvassed during the primary survey, 600 were those
who had visited India in the last three years.
3.1.3.1 Reason for Travelling to India
Respondents were asked to indicate their reason for India visit. The maximum
traction for India among these travellers from South Africa exists because of
the holidays and leisure activities that can be done here. 25% of total 600
respondents indicated this. Other important reasons for travelling to India are
visiting friends and relatives, attending weddings, etc. (17% of the total 600
respondents). 14% responses were received in favour of shopping purposes.
Figure 13: Reason for Travelling to India
16%
17%
22%
21%
13%
11%
Types of Abroad Trips
Family leisure trips
Family adventureholidays
Business trips
Leisure trips with myspouse or partner
Family shoppingtrips
Travel alone
N (Respondents) = 1200
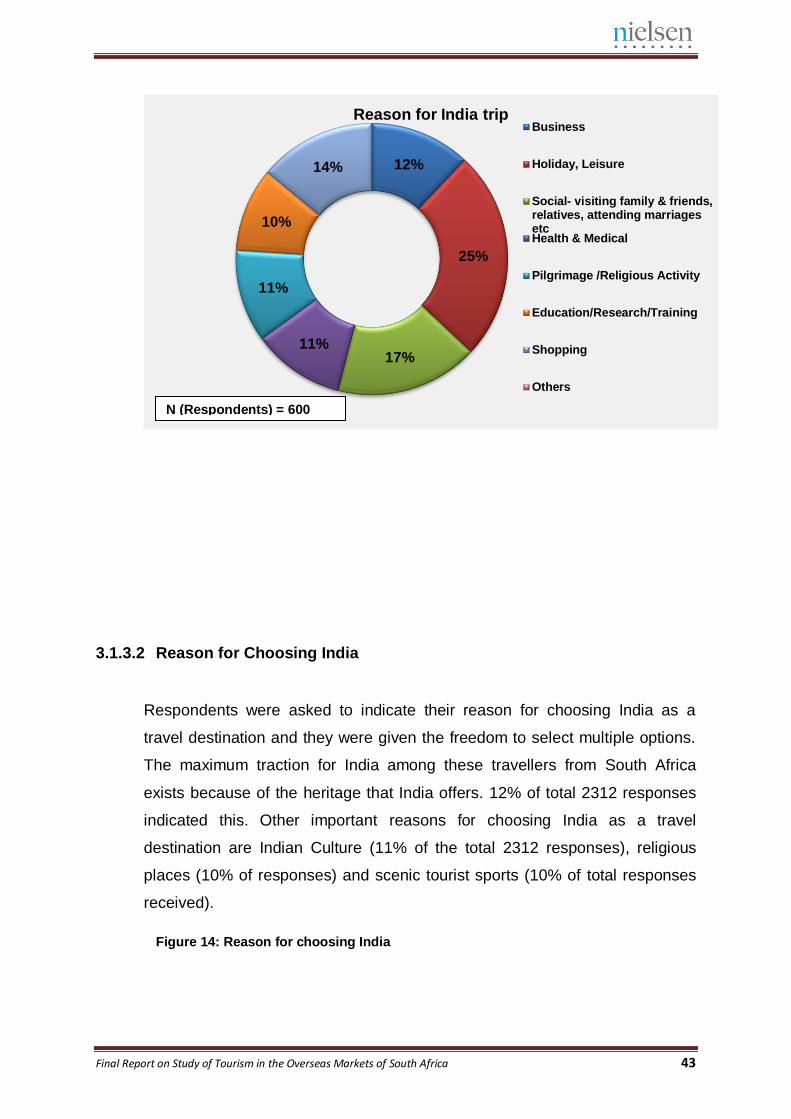
Final Report on Study of Tourism in the Overseas Markets of South Africa 43
3.1.3.2 Reason for Choosing India
Respondents were asked to indicate their reason for choosing India as a
travel destination and they were given the freedom to select multiple options.
The maximum traction for India among these travellers from South Africa
exists because of the heritage that India offers. 12% of total 2312 responses
indicated this. Other important reasons for choosing India as a travel
destination are Indian Culture (11% of the total 2312 responses), religious
places (10% of responses) and scenic tourist sports (10% of total responses
received).
Figure 14: Reason for choosing India
12%
25%
17% 11%
11%
10%
14%
Reason for India trip Business
Holiday, Leisure
Social- visiting family & friends,relatives, attending marriagesetcHealth & Medical
Pilgrimage /Religious Activity
Education/Research/Training
Shopping
Others
N (Respondents) = 600
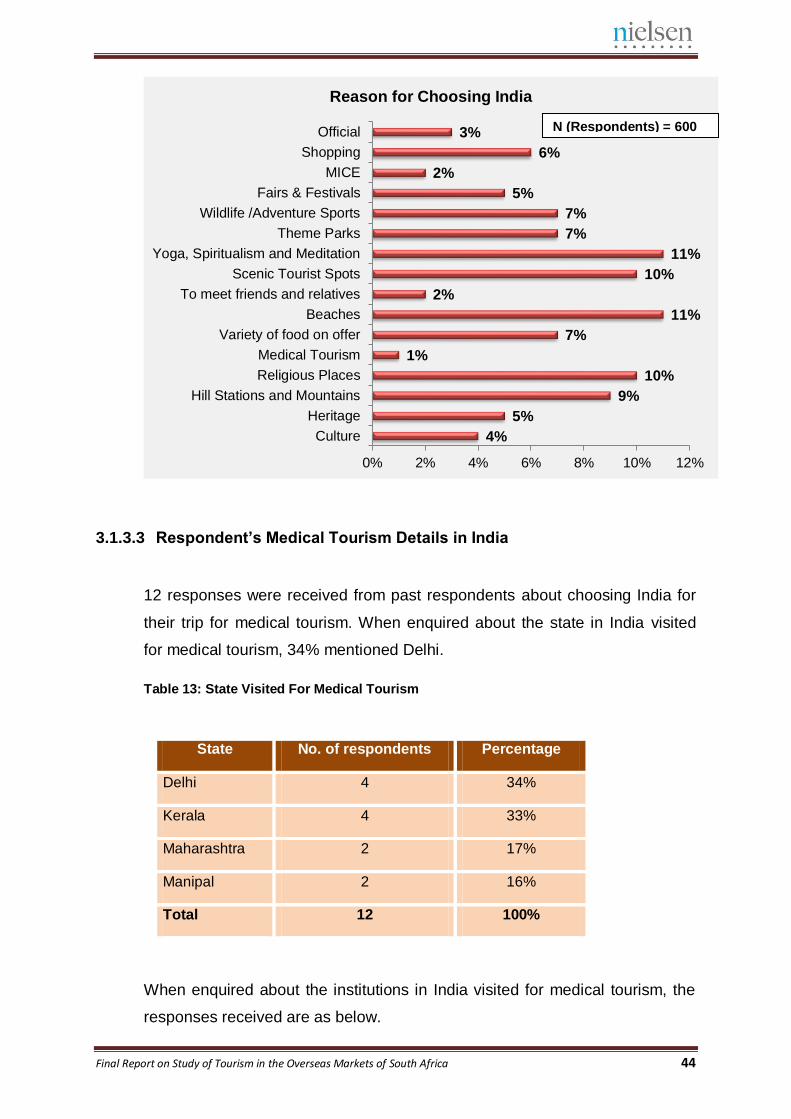
Final Report on Study of Tourism in the Overseas Markets of South Africa 44
3.1.3.3 Respondent’s Medical Tourism Details in India
12 responses were received from past respondents about choosing India for
their trip for medical tourism. When enquired about the state in India visited
for medical tourism, 34% mentioned Delhi.
Table 13: State Visited For Medical Tourism
State No. of respondents Percentage
Delhi 4 34%
Kerala 4 33%
Maharashtra 2 17%
Manipal 2 16%
Total 12 100%
When enquired about the institutions in India visited for medical tourism, the
responses received are as below.
4%
5%
9%
10%
1%
7%
11%
2%
10%
11%
7%
7%
5%
2%
6%
3%
0% 2% 4% 6% 8% 10% 12%
Culture
Heritage
Hill Stations and Mountains
Religious Places
Medical Tourism
Variety of food on offer
Beaches
To meet friends and relatives
Scenic Tourist Spots
Yoga, Spiritualism and Meditation
Theme Parks
Wildlife /Adventure Sports
Fairs & Festivals
MICE
Shopping
Official
Reason for Choosing India
N (Respondents) = 600
Final Report on Study of Tourism in the Overseas Markets of South Africa 45
Table 14: Institution in India Visited for Medical Tourism
Gender No. of respondents Percentage
AIIMS 4 34%
Ayurveda 4 33%
Columbia Asia 2 17%
Manipal Hospital 2 16%
Total 12 100.00%
Table 15: Satisfaction Level with Medical Tourism in India
Gender No. of respondents Percentage
Fully satisfied 10 83%
Partially satisfied 2 17%
Not satisfied 0 0%
Total 12 100%
3.1.3.4 Cities Visited in India
600 past India travellers to India mentioned the cities they visited in India
during their visit. 600 respondents provided 1748 responses regarding the
cities in India they visited during their India trip. 18% of the total responses
were received in favour of Delhi which came up as the most visited city in
India by past South African travellers to India. The next most visited city in
India emerged as Mumbai with 15% of total responses received.
Figure 15: Cities Visited in India
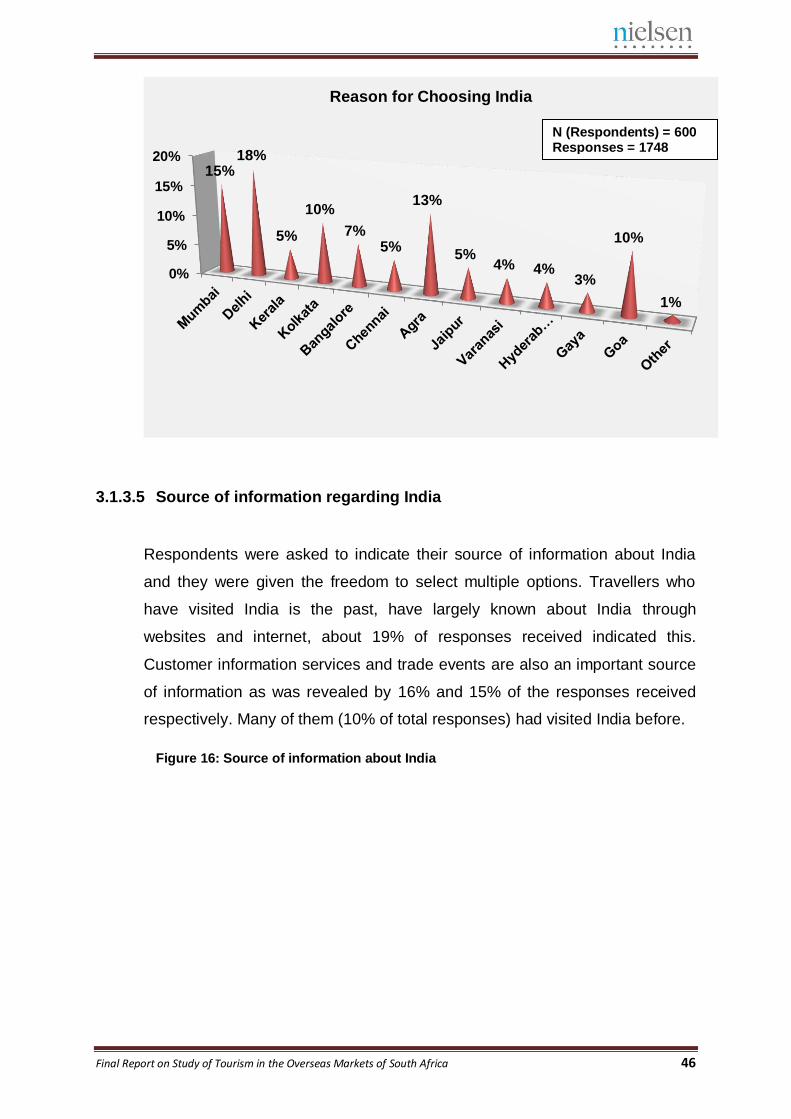
Final Report on Study of Tourism in the Overseas Markets of South Africa 46
3.1.3.5 Source of information regarding India
Respondents were asked to indicate their source of information about India
and they were given the freedom to select multiple options. Travellers who
have visited India is the past, have largely known about India through
websites and internet, about 19% of responses received indicated this.
Customer information services and trade events are also an important source
of information as was revealed by 16% and 15% of the responses received
respectively. Many of them (10% of total responses) had visited India before.
Figure 16: Source of information about India
0%
5%
10%
15%
20%15%
18%
5%
10%
7% 5%
13%
5% 4% 4%
3%
10%
1%
Reason for Choosing India
N (Respondents) = 600 Responses = 1748
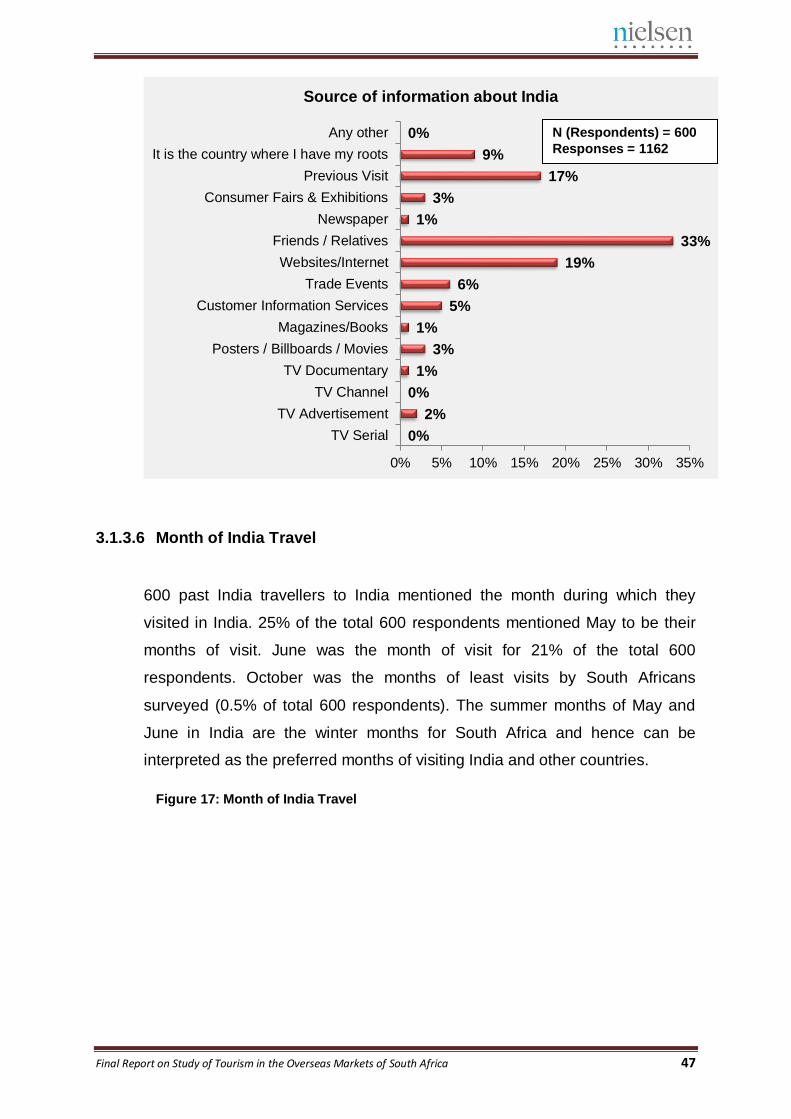
Final Report on Study of Tourism in the Overseas Markets of South Africa 47
3.1.3.6 Month of India Travel
600 past India travellers to India mentioned the month during which they
visited in India. 25% of the total 600 respondents mentioned May to be their
months of visit. June was the month of visit for 21% of the total 600
respondents. October was the months of least visits by South Africans
surveyed (0.5% of total 600 respondents). The summer months of May and
June in India are the winter months for South Africa and hence can be
interpreted as the preferred months of visiting India and other countries.
Figure 17: Month of India Travel
0%
2%
0%
1%
3%
1%
5%
6%
19%
33%
1%
3%
17%
9%
0%
0% 5% 10% 15% 20% 25% 30% 35%
TV Serial
TV Advertisement
TV Channel
TV Documentary
Posters / Billboards / Movies
Magazines/Books
Customer Information Services
Trade Events
Websites/Internet
Friends / Relatives
Newspaper
Consumer Fairs & Exhibitions
Previous Visit
It is the country where I have my roots
Any other
Source of information about India
N (Respondents) = 600
Responses = 1162
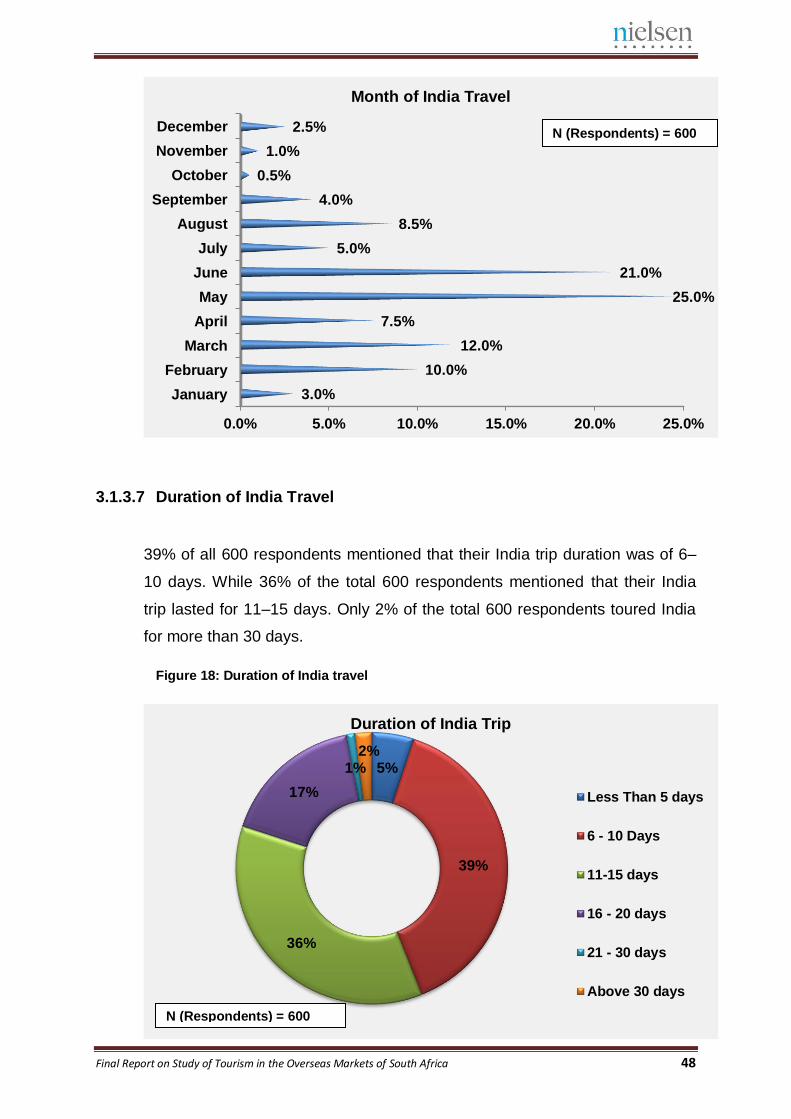
Final Report on Study of Tourism in the Overseas Markets of South Africa 48
3.1.3.7 Duration of India Travel
39% of all 600 respondents mentioned that their India trip duration was of 6–
10 days. While 36% of the total 600 respondents mentioned that their India
trip lasted for 11–15 days. Only 2% of the total 600 respondents toured India
for more than 30 days.
Figure 18: Duration of India travel
0.0% 5.0% 10.0% 15.0% 20.0% 25.0%
January
February
March
April
May
June
July
August
September
October
November
December
3.0%
10.0%
12.0%
7.5%
25.0%
21.0%
5.0%
8.5%
4.0%
0.5%
1.0%
2.5%
Month of India Travel
5%
39%
36%
17%
1% 2%
Duration of India Trip
Less Than 5 days
6 - 10 Days
11-15 days
16 - 20 days
21 - 30 days
Above 30 days
N (Respondents) = 600
N (Respondents) = 600
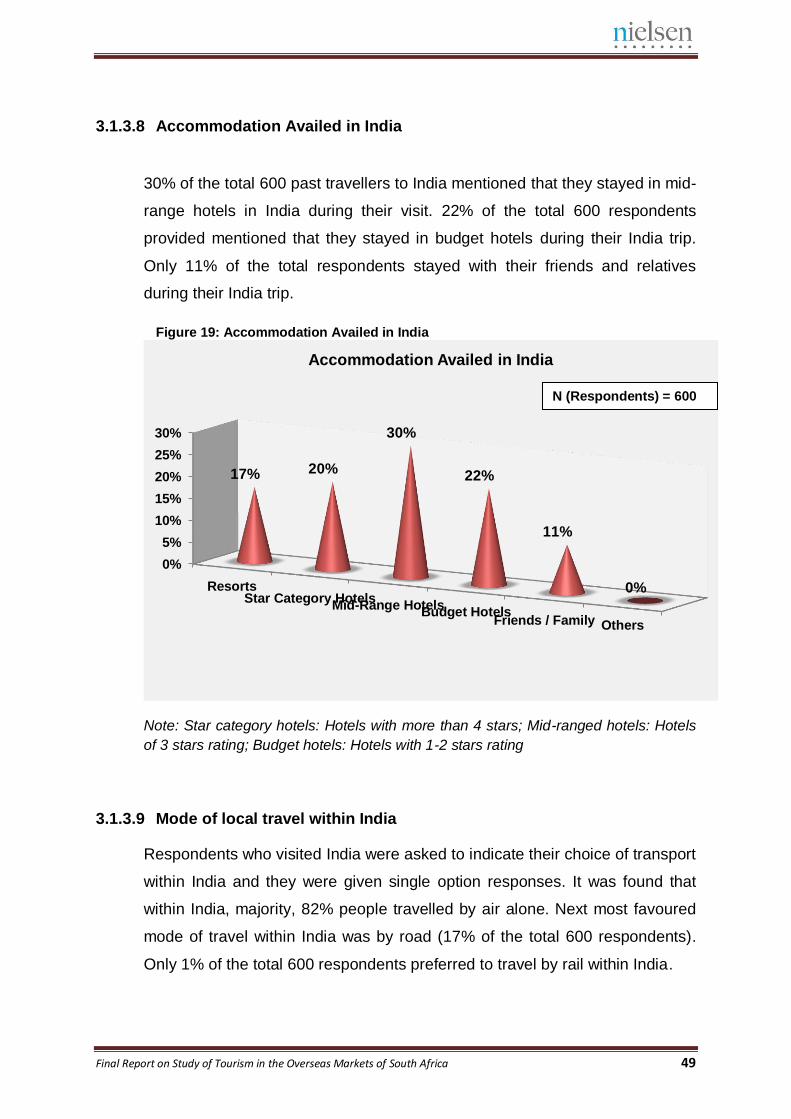
Final Report on Study of Tourism in the Overseas Markets of South Africa 49
3.1.3.8 Accommodation Availed in India
30% of the total 600 past travellers to India mentioned that they stayed in mid-
range hotels in India during their visit. 22% of the total 600 respondents
provided mentioned that they stayed in budget hotels during their India trip.
Only 11% of the total respondents stayed with their friends and relatives
during their India trip.
Figure 19: Accommodation Availed in India
Note: Star category hotels: Hotels with more than 4 stars; Mid-ranged hotels: Hotels
of 3 stars rating; Budget hotels: Hotels with 1-2 stars rating
3.1.3.9 Mode of local travel within India
Respondents who visited India were asked to indicate their choice of transport
within India and they were given single option responses. It was found that
within India, majority, 82% people travelled by air alone. Next most favoured
mode of travel within India was by road (17% of the total 600 respondents).
Only 1% of the total 600 respondents preferred to travel by rail within India.
0%
5%
10%
15%
20%
25%
30%
ResortsStar Category Hotels
Mid-Range HotelsBudget Hotels
Friends / Family Others
17% 20%
30%
22%
11%
0%
Accommodation Availed in India
N (Respondents) = 600
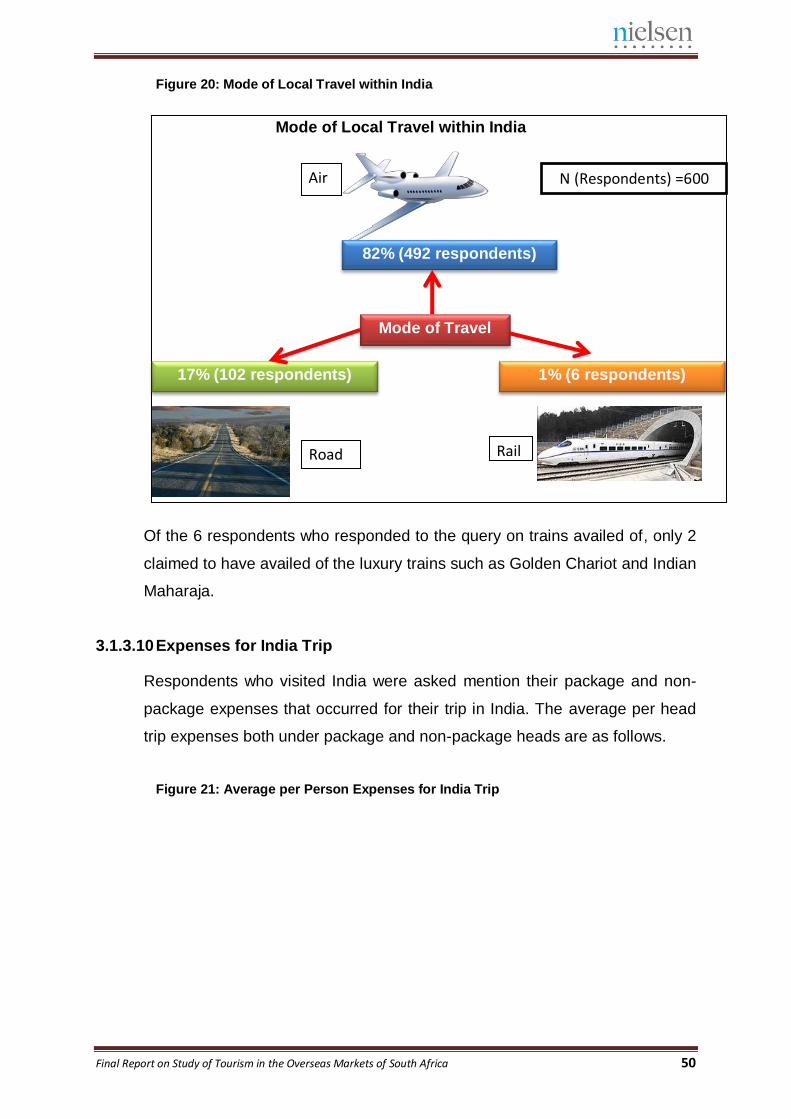
Final Report on Study of Tourism in the Overseas Markets of South Africa 50
Figure 20: Mode of Local Travel within India
Of the 6 respondents who responded to the query on trains availed of, only 2
claimed to have availed of the luxury trains such as Golden Chariot and Indian
Maharaja.
3.1.3.10 Expenses for India Trip
Respondents who visited India were asked mention their package and non-
package expenses that occurred for their trip in India. The average per head
trip expenses both under package and non-package heads are as follows.
Figure 21: Average per Person Expenses for India Trip
Rail
Air
Road
Mode of Local Travel within India
N (Respondents) =600
82% (492 respondents)
17% (102 respondents) 1% (6 respondents)
Mode of Travel
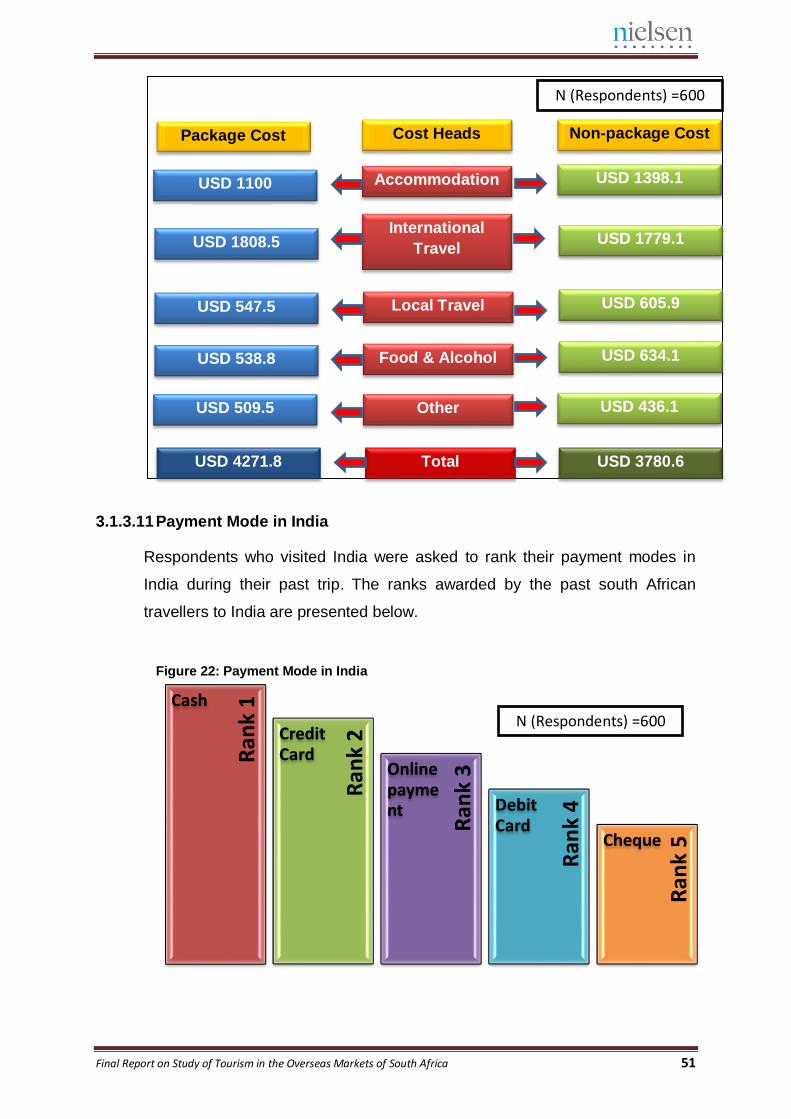
Final Report on Study of Tourism in the Overseas Markets of South Africa 51
3.1.3.11 Payment Mode in India
Respondents who visited India were asked to rank their payment modes in
India during their past trip. The ranks awarded by the past south African
travellers to India are presented below.
Figure 22: Payment Mode in India
Ran
k 3
Ran
k 2
Ran
k 4
Ran
k 1
Ran
k 5
Cash
Credit Card
Online payment Debit
Card Cheque
N (Respondents) =600
Package Cost Non-package Cost Cost Heads
Accommodation
International
Travel
Local Travel
Food & Alcohol
Other
USD 1398.1
USD 1779.1
USD 605.9
USD 634.1
USD 436.1
USD 1100
USD 1808.5
USD 547.5
USD 538.8
USD 509.5
Total USD 3780.6 USD 4271.8
N (Respondents) =600
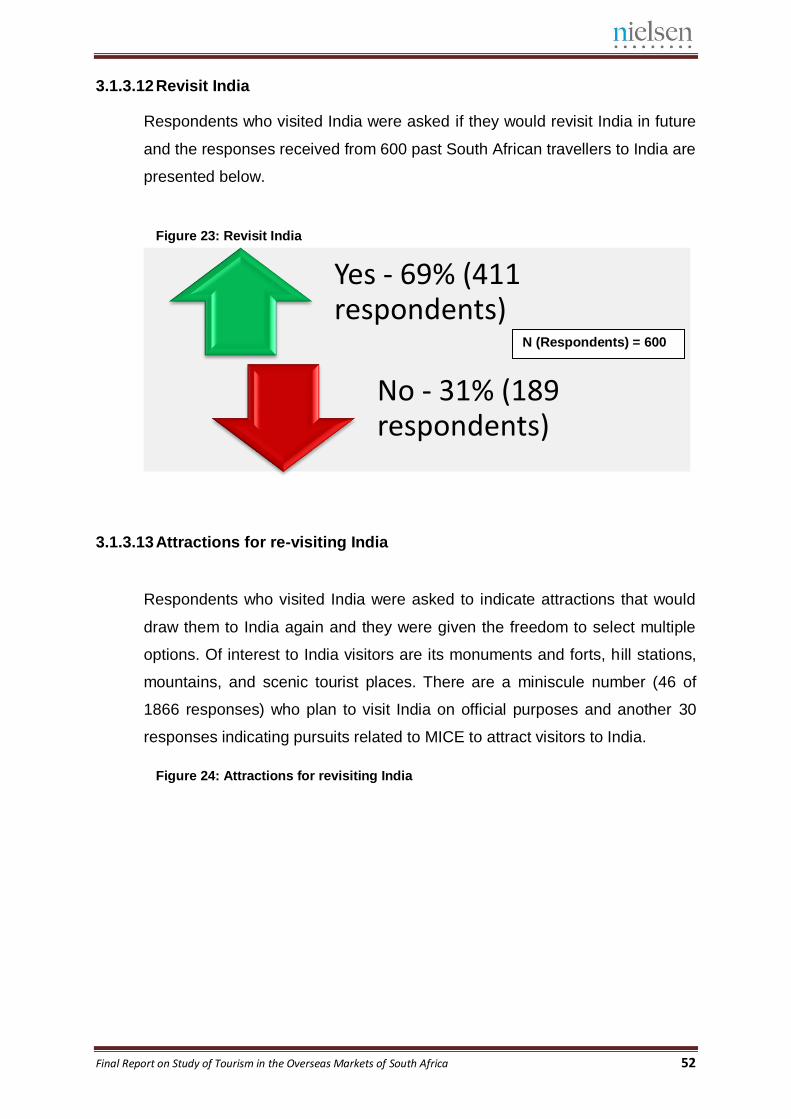
Final Report on Study of Tourism in the Overseas Markets of South Africa 52
3.1.3.12 Revisit India
Respondents who visited India were asked if they would revisit India in future
and the responses received from 600 past South African travellers to India are
presented below.
Figure 23: Revisit India
3.1.3.13 Attractions for re-visiting India
Respondents who visited India were asked to indicate attractions that would
draw them to India again and they were given the freedom to select multiple
options. Of interest to India visitors are its monuments and forts, hill stations,
mountains, and scenic tourist places. There are a miniscule number (46 of
1866 responses) who plan to visit India on official purposes and another 30
responses indicating pursuits related to MICE to attract visitors to India.
Figure 24: Attractions for revisiting India
Yes - 69% (411 respondents)
No - 31% (189 respondents)
N (Respondents) = 600
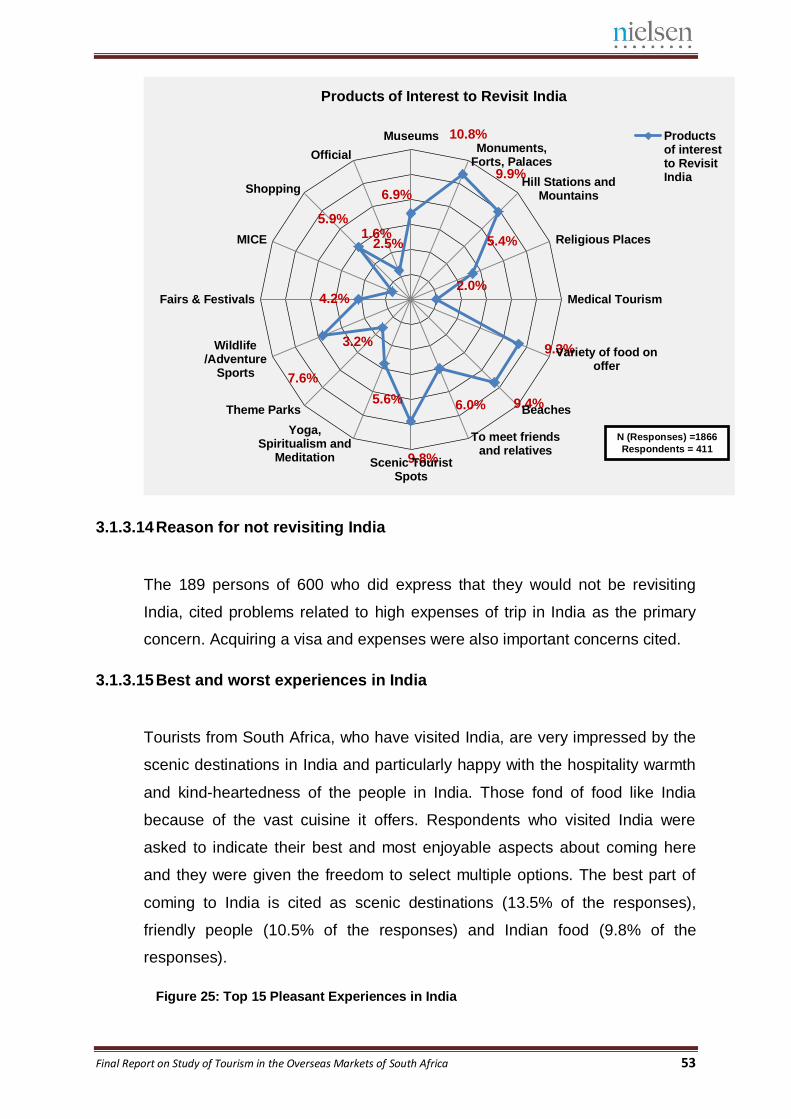
Final Report on Study of Tourism in the Overseas Markets of South Africa 53
3.1.3.14 Reason for not revisiting India
The 189 persons of 600 who did express that they would not be revisiting
India, cited problems related to high expenses of trip in India as the primary
concern. Acquiring a visa and expenses were also important concerns cited.
3.1.3.15 Best and worst experiences in India
Tourists from South Africa, who have visited India, are very impressed by the
scenic destinations in India and particularly happy with the hospitality warmth
and kind-heartedness of the people in India. Those fond of food like India
because of the vast cuisine it offers. Respondents who visited India were
asked to indicate their best and most enjoyable aspects about coming here
and they were given the freedom to select multiple options. The best part of
coming to India is cited as scenic destinations (13.5% of the responses),
friendly people (10.5% of the responses) and Indian food (9.8% of the
responses).
Figure 25: Top 15 Pleasant Experiences in India
6.9%
10.8%
9.9%
5.4%
2.0%
9.3%
9.4% 6.0%
9.8%
5.6%
3.2%
7.6%
4.2%
1.6% 5.9%
2.5%
MuseumsMonuments,
Forts, Palaces
Hill Stations andMountains
Religious Places
Medical Tourism
Variety of food onoffer
Beaches
To meet friendsand relatives
Scenic TouristSpots
Yoga,Spiritualism and
Meditation
Theme Parks
Wildlife/Adventure
Sports
Fairs & Festivals
MICE
Shopping
Official
Products of Interest to Revisit India
Productsof interestto RevisitIndia
N (Responses) =1866
Respondents = 411
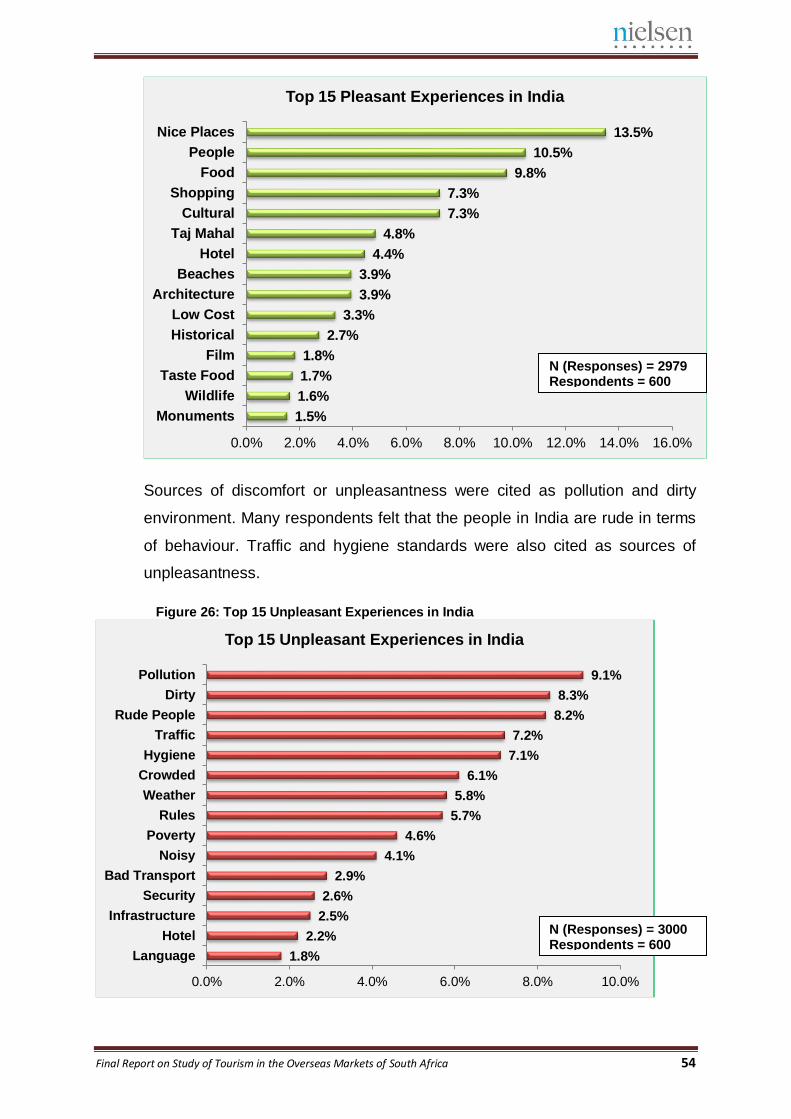
Final Report on Study of Tourism in the Overseas Markets of South Africa 54
Sources of discomfort or unpleasantness were cited as pollution and dirty
environment. Many respondents felt that the people in India are rude in terms
of behaviour. Traffic and hygiene standards were also cited as sources of
unpleasantness.
Figure 26: Top 15 Unpleasant Experiences in India
1.5%
1.6%
1.7%
1.8%
2.7%
3.3%
3.9%
3.9%
4.4%
4.8%
7.3%
7.3%
9.8%
10.5%
13.5%
0.0% 2.0% 4.0% 6.0% 8.0% 10.0% 12.0% 14.0% 16.0%
Monuments
Wildlife
Taste Food
Film
Historical
Low Cost
Architecture
Beaches
Hotel
Taj Mahal
Cultural
Shopping
Food
People
Nice Places
Top 15 Pleasant Experiences in India
1.8%
2.2%
2.5%
2.6%
2.9%
4.1%
4.6%
5.7%
5.8%
6.1%
7.1%
7.2%
8.2%
8.3%
9.1%
0.0% 2.0% 4.0% 6.0% 8.0% 10.0%
Language
Hotel
Infrastructure
Security
Bad Transport
Noisy
Poverty
Rules
Weather
Crowded
Hygiene
Traffic
Rude People
Dirty
Pollution
Top 15 Unpleasant Experiences in India
N (Responses) = 2979 Respondents = 600
N (Responses) = 3000 Respondents = 600
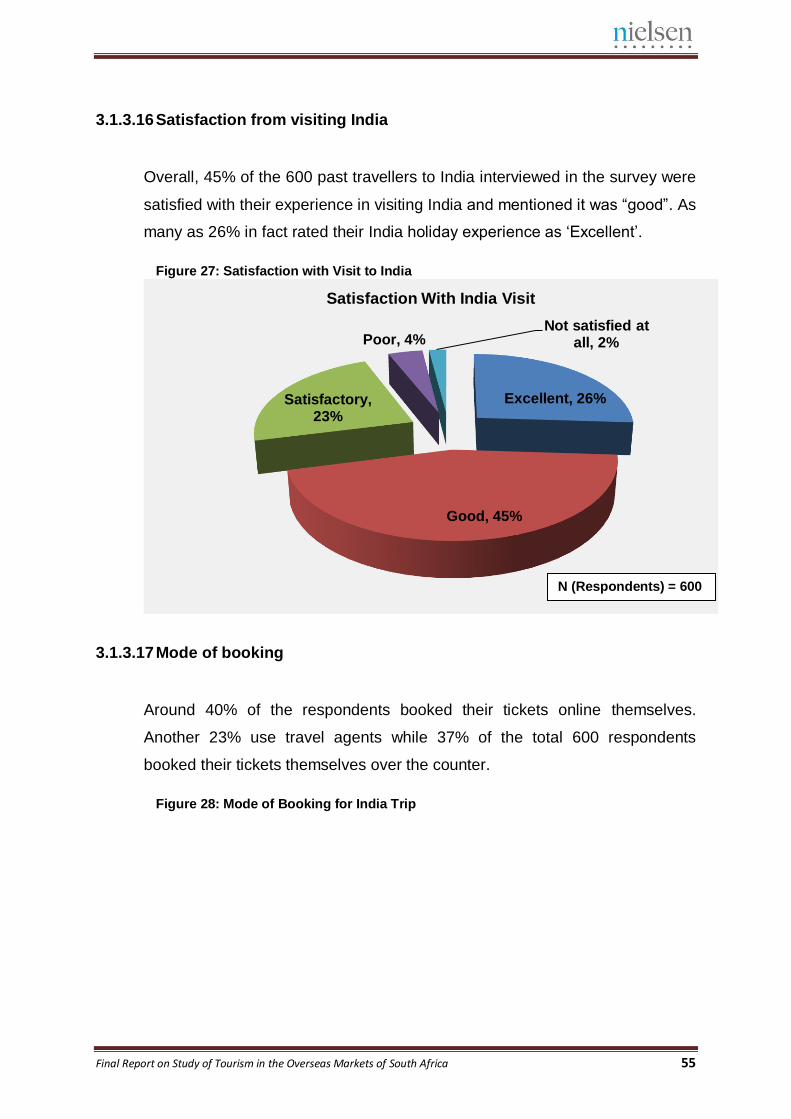
Final Report on Study of Tourism in the Overseas Markets of South Africa 55
3.1.3.16 Satisfaction from visiting India
Overall, 45% of the 600 past travellers to India interviewed in the survey were
satisfied with their experience in visiting India and mentioned it was “good”. As
many as 26% in fact rated their India holiday experience as ‘Excellent’.
Figure 27: Satisfaction with Visit to India
3.1.3.17 Mode of booking
Around 40% of the respondents booked their tickets online themselves.
Another 23% use travel agents while 37% of the total 600 respondents
booked their tickets themselves over the counter.
Figure 28: Mode of Booking for India Trip
Excellent, 26%
Good, 45%
Satisfactory, 23%
Poor, 4% Not satisfied at
all, 2%
Satisfaction With India Visit
N (Respondents) = 600
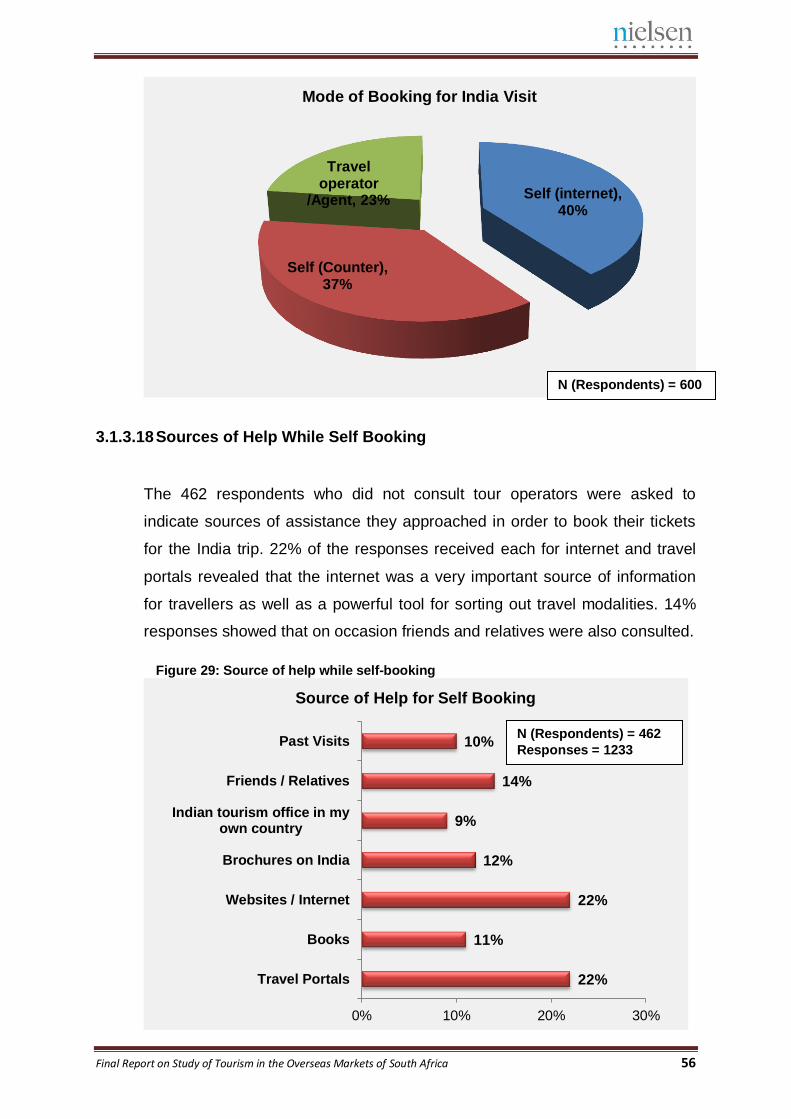
Final Report on Study of Tourism in the Overseas Markets of South Africa 56
3.1.3.18 Sources of Help While Self Booking
The 462 respondents who did not consult tour operators were asked to
indicate sources of assistance they approached in order to book their tickets
for the India trip. 22% of the responses received each for internet and travel
portals revealed that the internet was a very important source of information
for travellers as well as a powerful tool for sorting out travel modalities. 14%
responses showed that on occasion friends and relatives were also consulted.
Figure 29: Source of help while self-booking
Self (internet), 40%
Self (Counter), 37%
Travel operator
/Agent, 23%
Mode of Booking for India Visit
22%
11%
22%
12%
9%
14%
10%
0% 10% 20% 30%
Travel Portals
Books
Websites / Internet
Brochures on India
Indian tourism office in myown country
Friends / Relatives
Past Visits
Source of Help for Self Booking
N (Respondents) = 600
N (Respondents) = 462
Responses = 1233
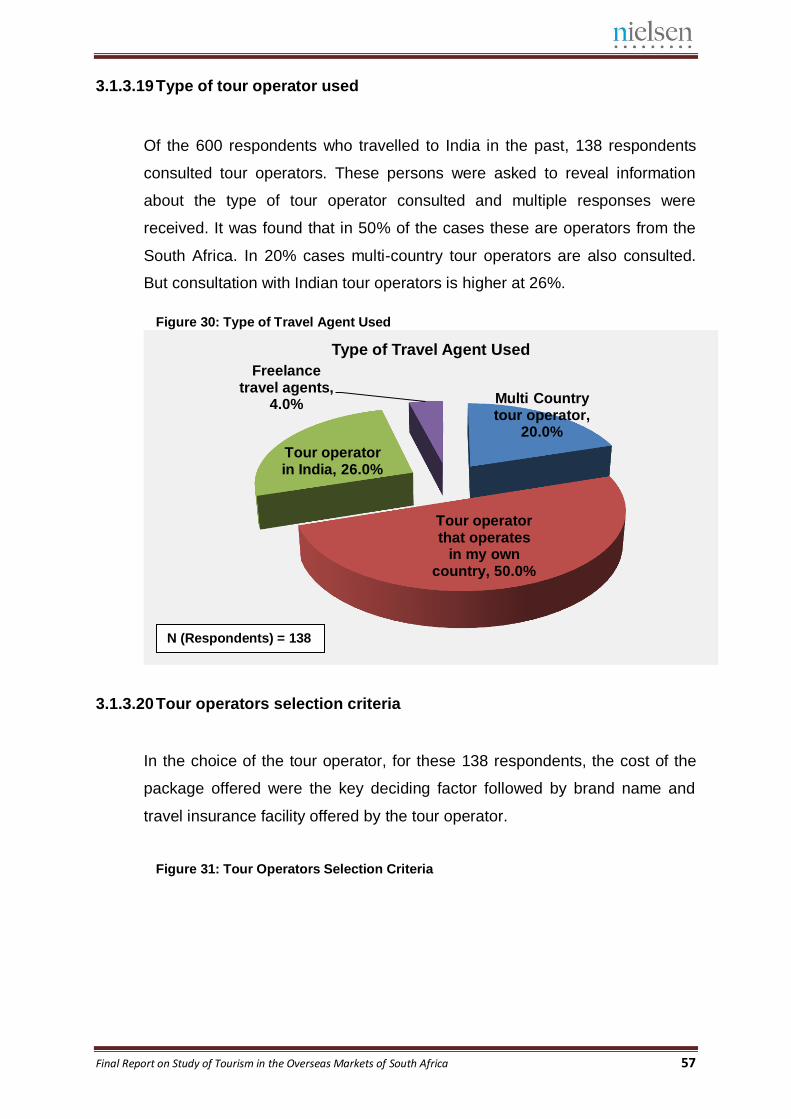
Final Report on Study of Tourism in the Overseas Markets of South Africa 57
3.1.3.19 Type of tour operator used
Of the 600 respondents who travelled to India in the past, 138 respondents
consulted tour operators. These persons were asked to reveal information
about the type of tour operator consulted and multiple responses were
received. It was found that in 50% of the cases these are operators from the
South Africa. In 20% cases multi-country tour operators are also consulted.
But consultation with Indian tour operators is higher at 26%.
Figure 30: Type of Travel Agent Used
3.1.3.20 Tour operators selection criteria
In the choice of the tour operator, for these 138 respondents, the cost of the
package offered were the key deciding factor followed by brand name and
travel insurance facility offered by the tour operator.
Figure 31: Tour Operators Selection Criteria
Multi Country tour operator,
20.0%
Tour operator that operates
in my own country, 50.0%
Tour operator in India, 26.0%
Freelance travel agents,
4.0%
Type of Travel Agent Used
N (Respondents) = 138
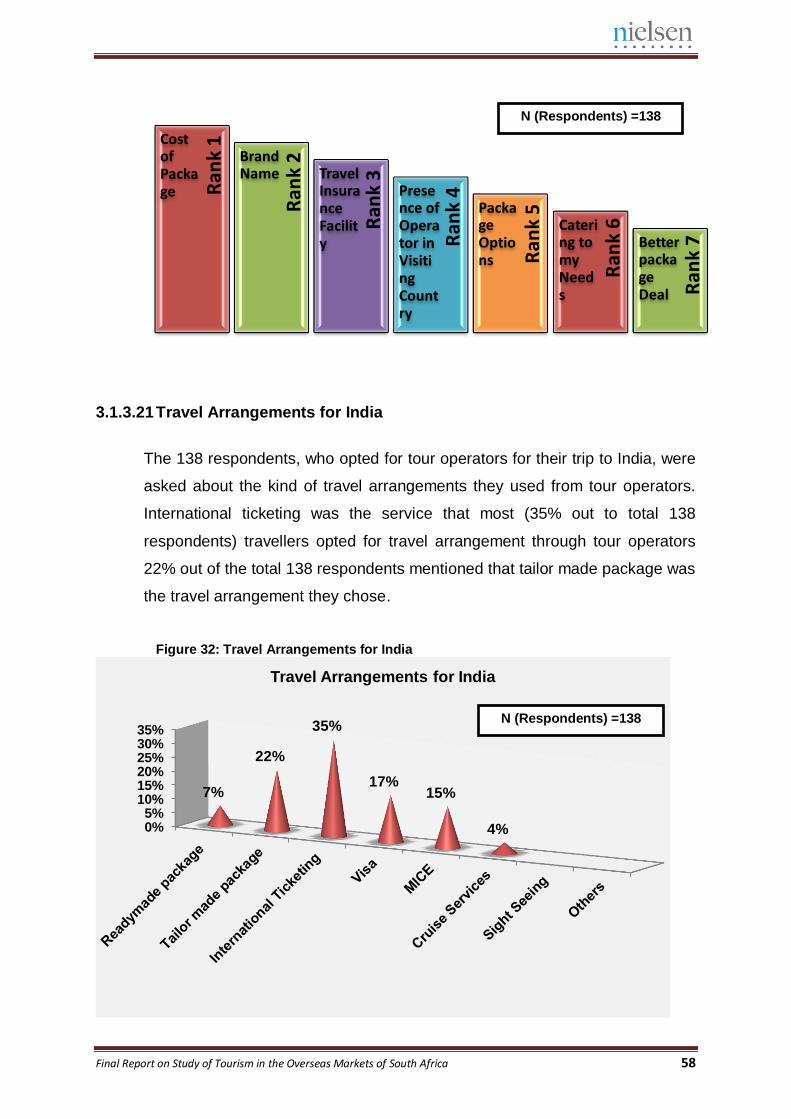
Final Report on Study of Tourism in the Overseas Markets of South Africa 58
3.1.3.21 Travel Arrangements for India
The 138 respondents, who opted for tour operators for their trip to India, were
asked about the kind of travel arrangements they used from tour operators.
International ticketing was the service that most (35% out to total 138
respondents) travellers opted for travel arrangement through tour operators
22% out of the total 138 respondents mentioned that tailor made package was
the travel arrangement they chose.
Figure 32: Travel Arrangements for India
Ran
k 3
Ran
k 2
Ran
k 4
Ran
k 1
Ran
k 5
Cost of Package
Ran
k 6
Brand Name
Ran
k 7
Travel Insurance Facility
Presence of Operator in Visiting Country
Package Options
Catering to my Needs
Better package Deal
0%5%
10%15%20%25%30%35%
7%
22%
35%
17% 15%
4%
Travel Arrangements for India
N (Respondents) =138
N (Respondents) =138
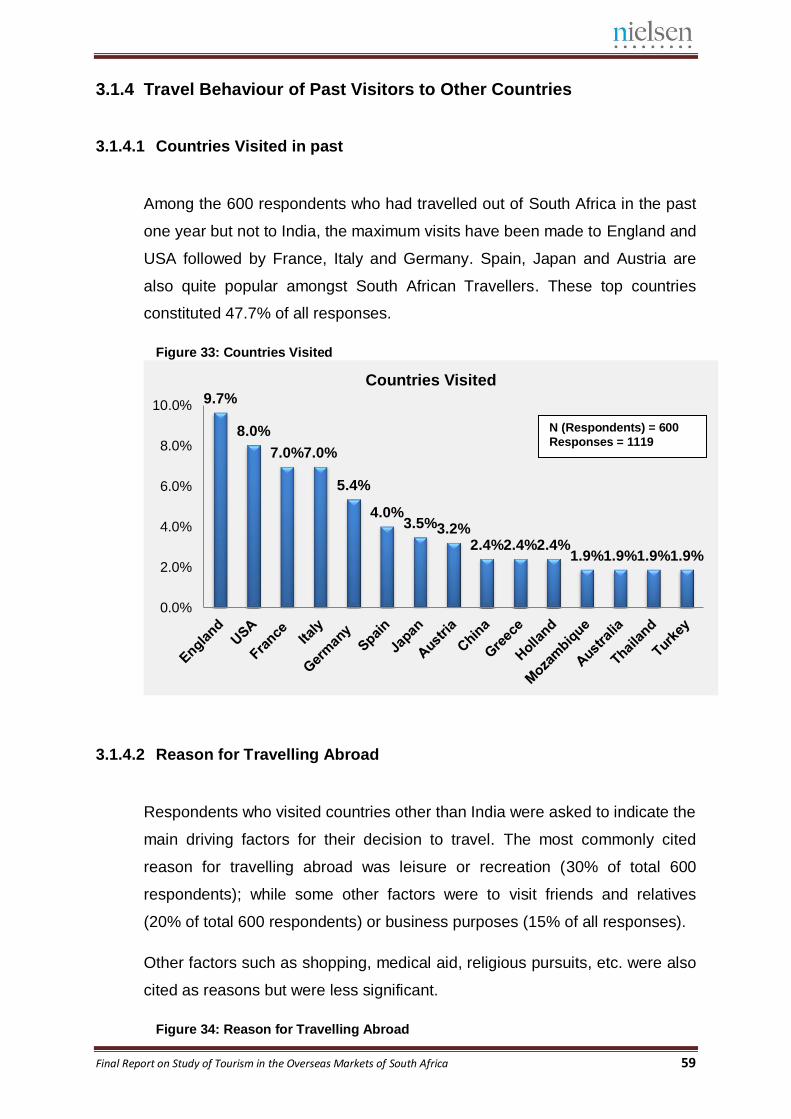
Final Report on Study of Tourism in the Overseas Markets of South Africa 59
3.1.4 Travel Behaviour of Past Visitors to Other Countries
3.1.4.1 Countries Visited in past
Among the 600 respondents who had travelled out of South Africa in the past
one year but not to India, the maximum visits have been made to England and
USA followed by France, Italy and Germany. Spain, Japan and Austria are
also quite popular amongst South African Travellers. These top countries
constituted 47.7% of all responses.
Figure 33: Countries Visited
3.1.4.2 Reason for Travelling Abroad
Respondents who visited countries other than India were asked to indicate the
main driving factors for their decision to travel. The most commonly cited
reason for travelling abroad was leisure or recreation (30% of total 600
respondents); while some other factors were to visit friends and relatives
(20% of total 600 respondents) or business purposes (15% of all responses).
Other factors such as shopping, medical aid, religious pursuits, etc. were also
cited as reasons but were less significant.
Figure 34: Reason for Travelling Abroad
9.7%
8.0%
7.0% 7.0%
5.4%
4.0% 3.5% 3.2%
2.4% 2.4% 2.4% 1.9% 1.9% 1.9% 1.9%
0.0%
2.0%
4.0%
6.0%
8.0%
10.0%
Countries Visited
N (Respondents) = 600
Responses = 1119
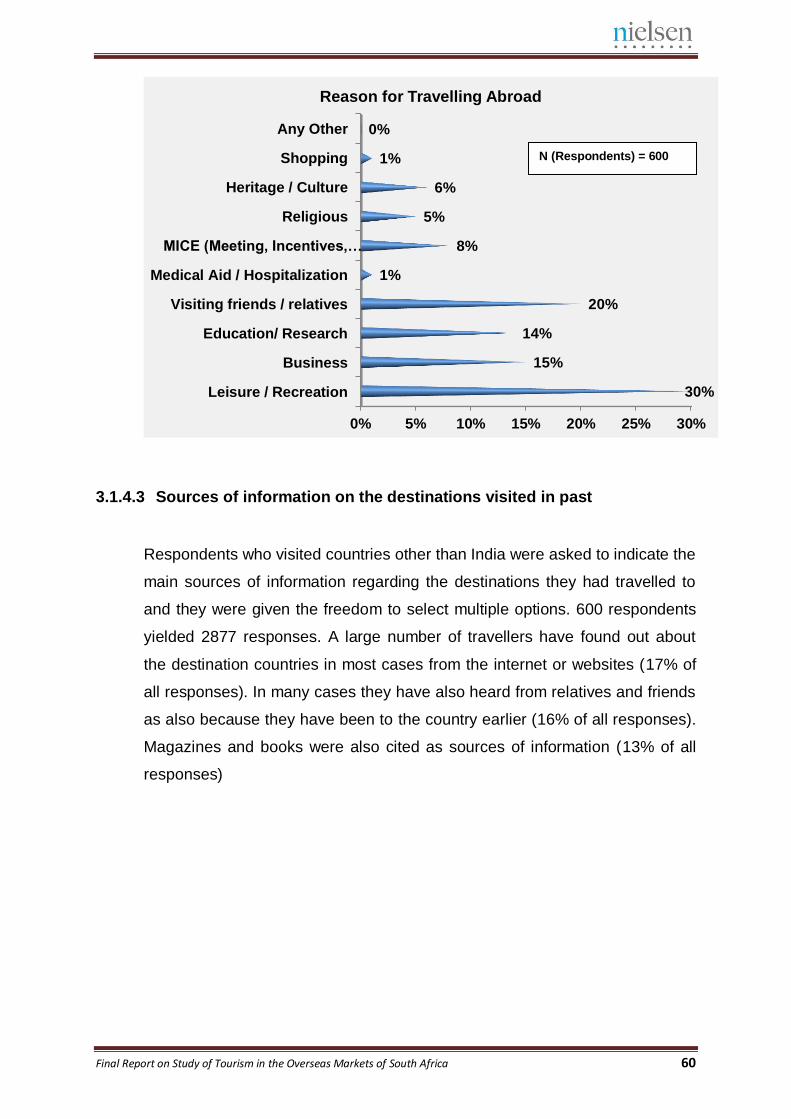
Final Report on Study of Tourism in the Overseas Markets of South Africa 60
3.1.4.3 Sources of information on the destinations visited in past
Respondents who visited countries other than India were asked to indicate the
main sources of information regarding the destinations they had travelled to
and they were given the freedom to select multiple options. 600 respondents
yielded 2877 responses. A large number of travellers have found out about
the destination countries in most cases from the internet or websites (17% of
all responses). In many cases they have also heard from relatives and friends
as also because they have been to the country earlier (16% of all responses).
Magazines and books were also cited as sources of information (13% of all
responses)
0% 5% 10% 15% 20% 25% 30%
Leisure / Recreation
Business
Education/ Research
Visiting friends / relatives
Medical Aid / Hospitalization
MICE (Meeting, Incentives,…
Religious
Heritage / Culture
Shopping
Any Other
30%
15%
14%
20%
1%
8%
5%
6%
1%
0%
Reason for Travelling Abroad
N (Respondents) = 600
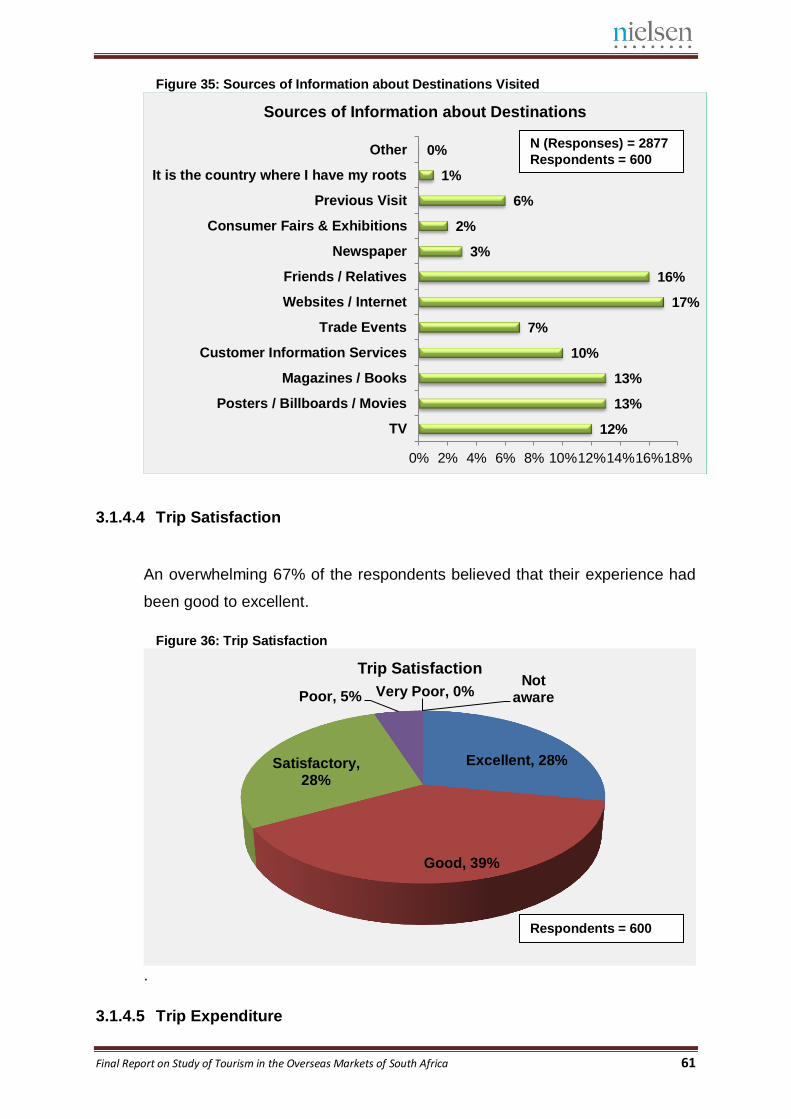
Final Report on Study of Tourism in the Overseas Markets of South Africa 61
Figure 35: Sources of Information about Destinations Visited
3.1.4.4 Trip Satisfaction
An overwhelming 67% of the respondents believed that their experience had
been good to excellent.
Figure 36: Trip Satisfaction
.
3.1.4.5 Trip Expenditure
12%
13%
13%
10%
7%
17%
16%
3%
2%
6%
1%
0%
0% 2% 4% 6% 8% 10%12%14%16%18%
TV
Posters / Billboards / Movies
Magazines / Books
Customer Information Services
Trade Events
Websites / Internet
Friends / Relatives
Newspaper
Consumer Fairs & Exhibitions
Previous Visit
It is the country where I have my roots
Other
Sources of Information about Destinations
Excellent, 28%
Good, 39%
Satisfactory, 28%
Poor, 5% Very Poor, 0% Not
aware
Trip Satisfaction
N (Responses) = 2877
Respondents = 600
Respondents = 600
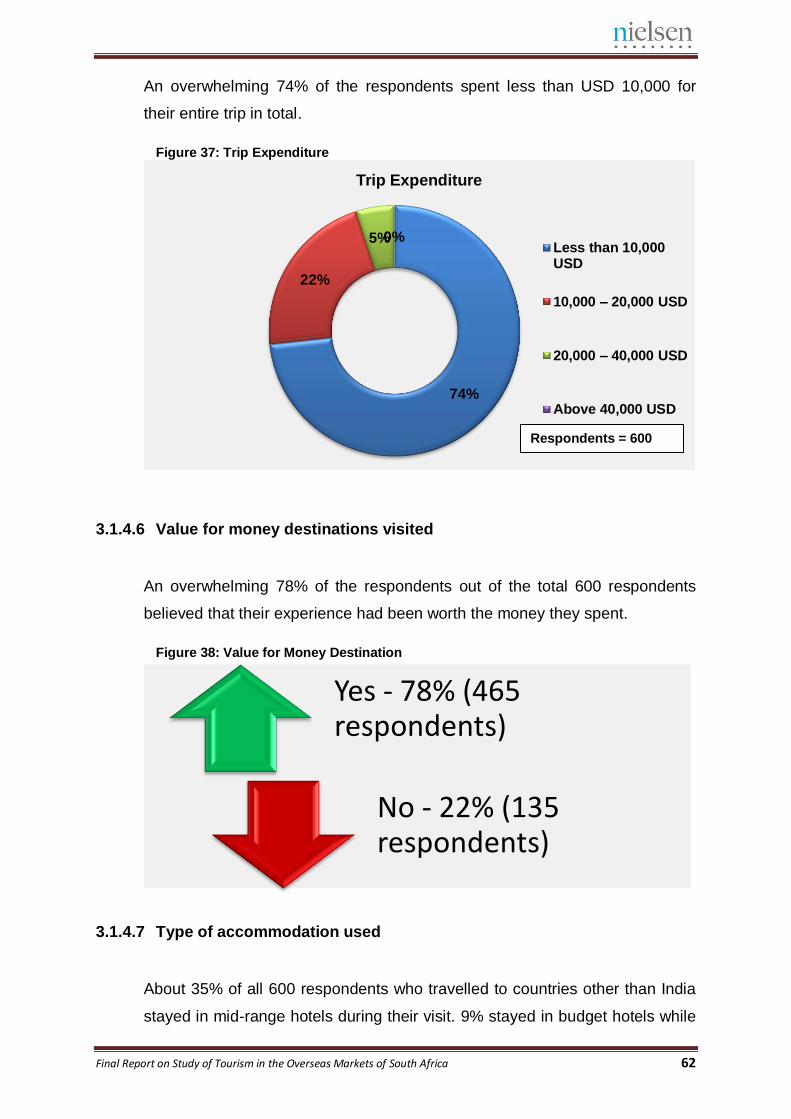
Final Report on Study of Tourism in the Overseas Markets of South Africa 62
An overwhelming 74% of the respondents spent less than USD 10,000 for
their entire trip in total.
Figure 37: Trip Expenditure
3.1.4.6 Value for money destinations visited
An overwhelming 78% of the respondents out of the total 600 respondents
believed that their experience had been worth the money they spent.
Figure 38: Value for Money Destination
3.1.4.7 Type of accommodation used
About 35% of all 600 respondents who travelled to countries other than India
stayed in mid-range hotels during their visit. 9% stayed in budget hotels while
74%
22%
5% 0%
Trip Expenditure
Less than 10,000USD
10,000 – 20,000 USD
20,000 – 40,000 USD
Above 40,000 USD
Yes - 78% (465 respondents)
No - 22% (135 respondents)
Respondents = 600
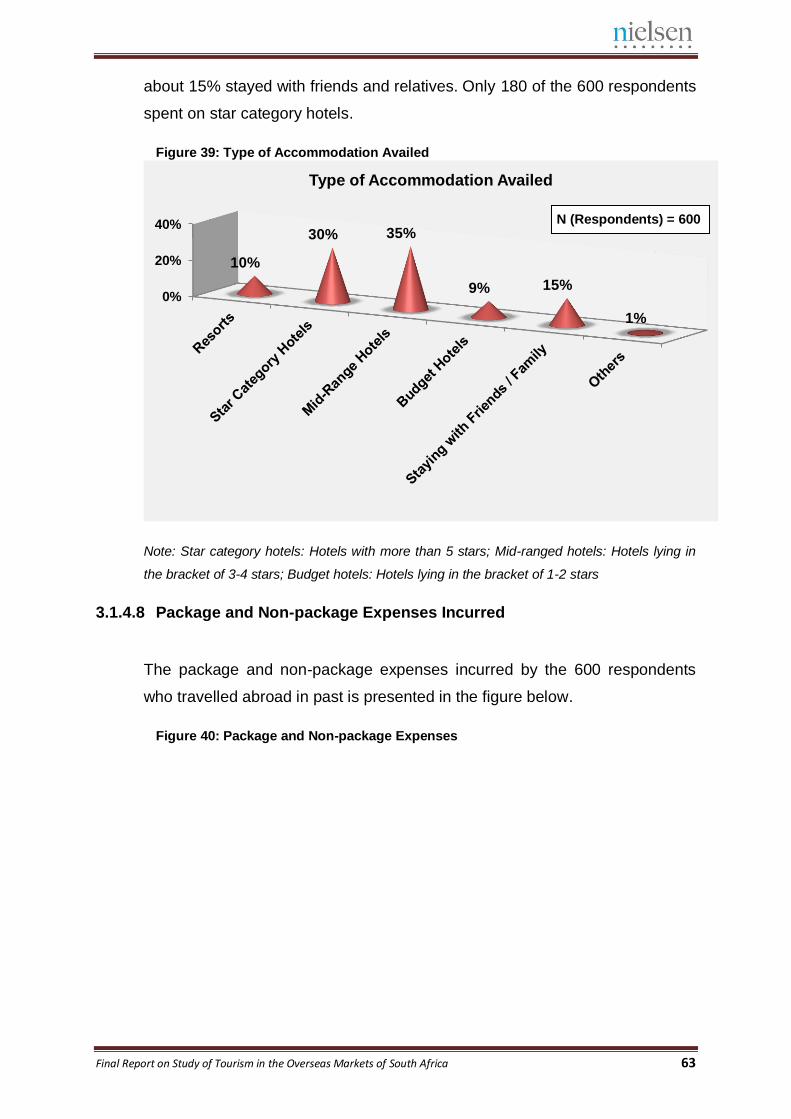
Final Report on Study of Tourism in the Overseas Markets of South Africa 63
about 15% stayed with friends and relatives. Only 180 of the 600 respondents
spent on star category hotels.
Figure 39: Type of Accommodation Availed
Note: Star category hotels: Hotels with more than 5 stars; Mid-ranged hotels: Hotels lying in
the bracket of 3-4 stars; Budget hotels: Hotels lying in the bracket of 1-2 stars
3.1.4.8 Package and Non-package Expenses Incurred
The package and non-package expenses incurred by the 600 respondents
who travelled abroad in past is presented in the figure below.
Figure 40: Package and Non-package Expenses
0%
20%
40%
10%
30% 35%
9% 15%
1%
Type of Accommodation Availed
N (Respondents) = 600
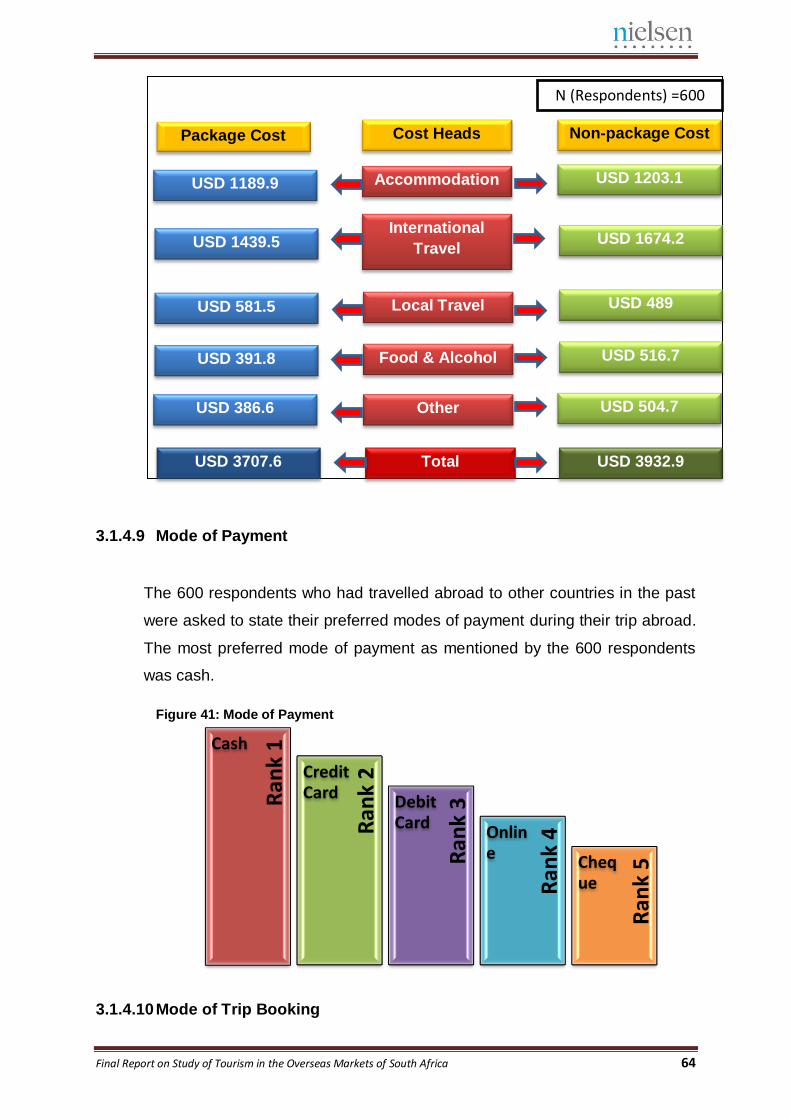
Final Report on Study of Tourism in the Overseas Markets of South Africa 64
3.1.4.9 Mode of Payment
The 600 respondents who had travelled abroad to other countries in the past
were asked to state their preferred modes of payment during their trip abroad.
The most preferred mode of payment as mentioned by the 600 respondents
was cash.
Figure 41: Mode of Payment
3.1.4.10 Mode of Trip Booking
Ran
k 3
Ran
k 2
Ran
k 4
Ran
k 1
Ran
k 5
Cash
Credit Card Debit
Card Online Cheq
ue
N (Respondents) =600
Package Cost Non-package Cost Cost Heads
Accommodation
International
Travel
Local Travel
Food & Alcohol
Other
USD 1203.1
USD 1674.2
USD 489
USD 516.7
USD 504.7
USD 1189.9
USD 1439.5
USD 581.5
USD 391.8
USD 386.6
Total USD 3932.9 USD 3707.6
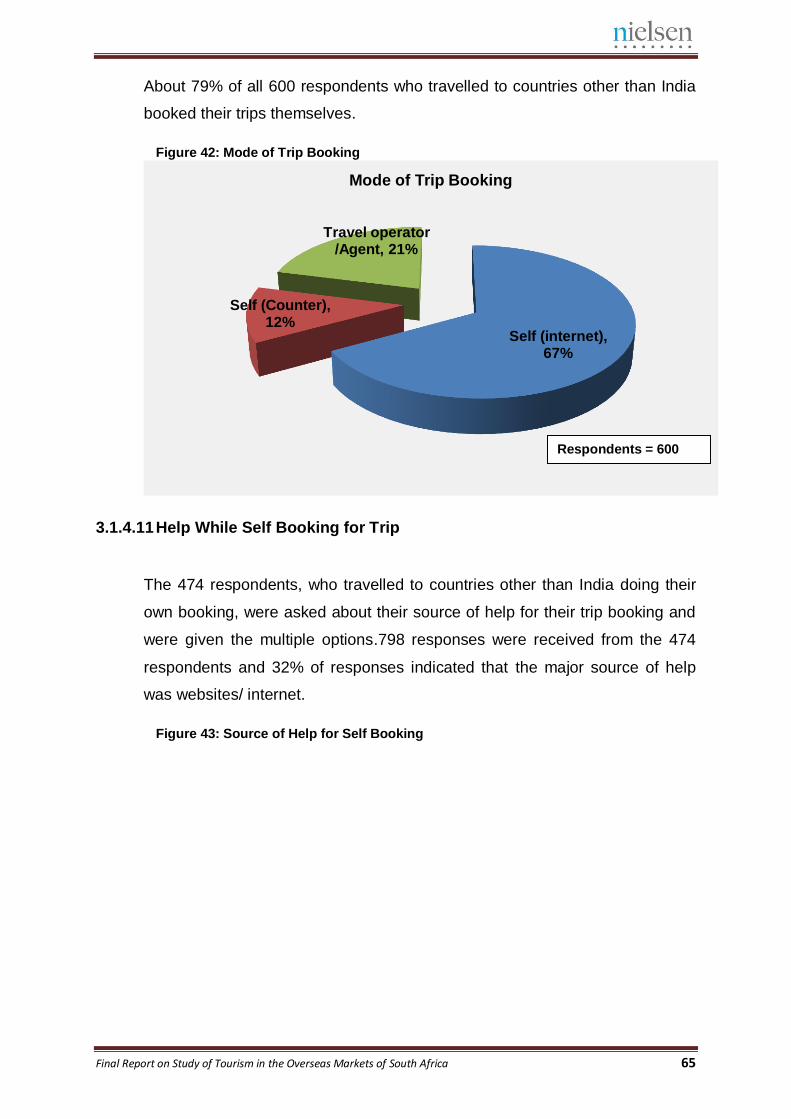
Final Report on Study of Tourism in the Overseas Markets of South Africa 65
About 79% of all 600 respondents who travelled to countries other than India
booked their trips themselves.
Figure 42: Mode of Trip Booking
3.1.4.11 Help While Self Booking for Trip
The 474 respondents, who travelled to countries other than India doing their
own booking, were asked about their source of help for their trip booking and
were given the multiple options.798 responses were received from the 474
respondents and 32% of responses indicated that the major source of help
was websites/ internet.
Figure 43: Source of Help for Self Booking
Self (internet), 67%
Self (Counter), 12%
Travel operator /Agent, 21%
Mode of Trip Booking
Respondents = 600
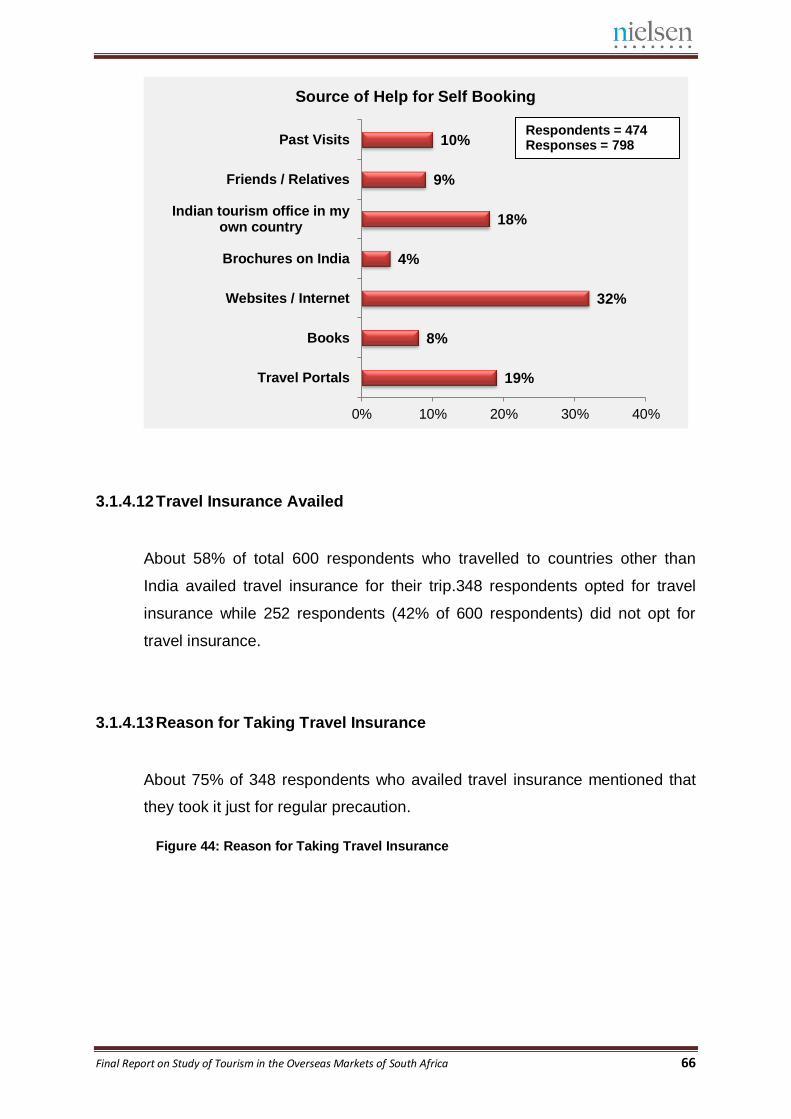
Final Report on Study of Tourism in the Overseas Markets of South Africa 66
3.1.4.12 Travel Insurance Availed
About 58% of total 600 respondents who travelled to countries other than
India availed travel insurance for their trip.348 respondents opted for travel
insurance while 252 respondents (42% of 600 respondents) did not opt for
travel insurance.
3.1.4.13 Reason for Taking Travel Insurance
About 75% of 348 respondents who availed travel insurance mentioned that
they took it just for regular precaution.
Figure 44: Reason for Taking Travel Insurance
19%
8%
32%
4%
18%
9%
10%
0% 10% 20% 30% 40%
Travel Portals
Books
Websites / Internet
Brochures on India
Indian tourism office in myown country
Friends / Relatives
Past Visits
Source of Help for Self Booking
Respondents = 474 Responses = 798
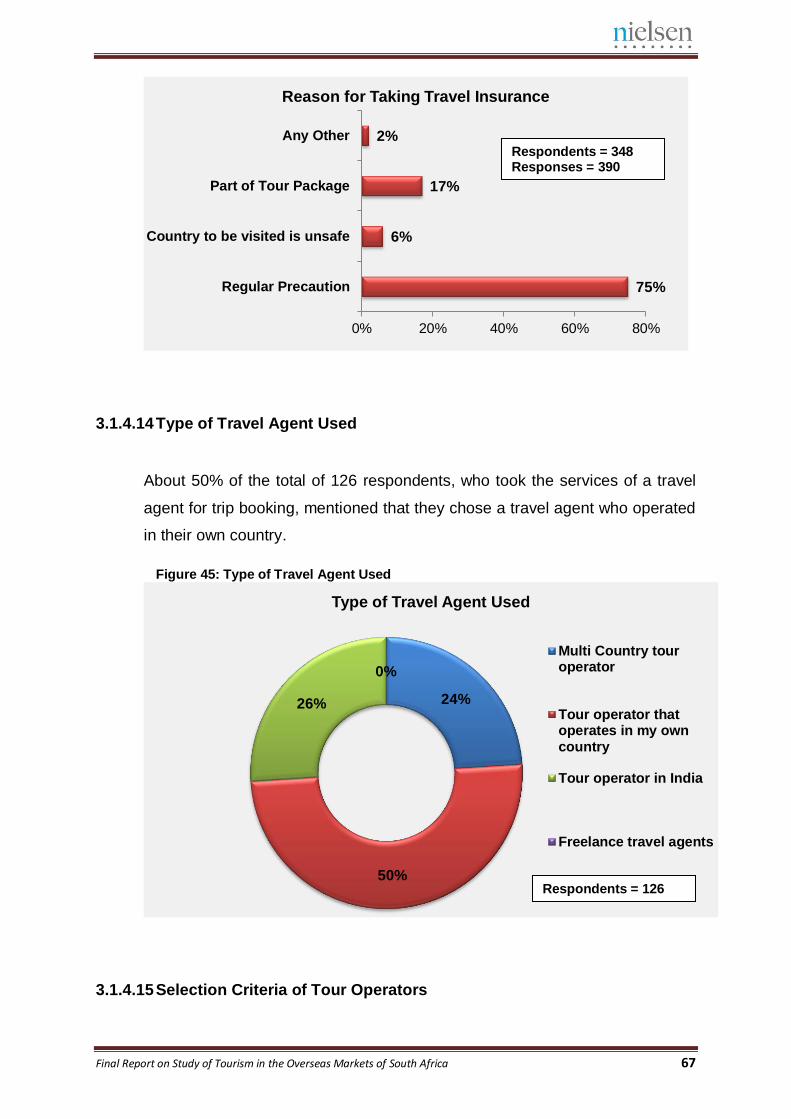
Final Report on Study of Tourism in the Overseas Markets of South Africa 67
3.1.4.14 Type of Travel Agent Used
About 50% of the total of 126 respondents, who took the services of a travel
agent for trip booking, mentioned that they chose a travel agent who operated
in their own country.
Figure 45: Type of Travel Agent Used
3.1.4.15 Selection Criteria of Tour Operators
75%
6%
17%
2%
0% 20% 40% 60% 80%
Regular Precaution
Country to be visited is unsafe
Part of Tour Package
Any Other
Reason for Taking Travel Insurance
24%
50%
26%
0%
Type of Travel Agent Used
Multi Country touroperator
Tour operator thatoperates in my owncountry
Tour operator in India
Freelance travel agents
Respondents = 348 Responses = 390
Respondents = 126
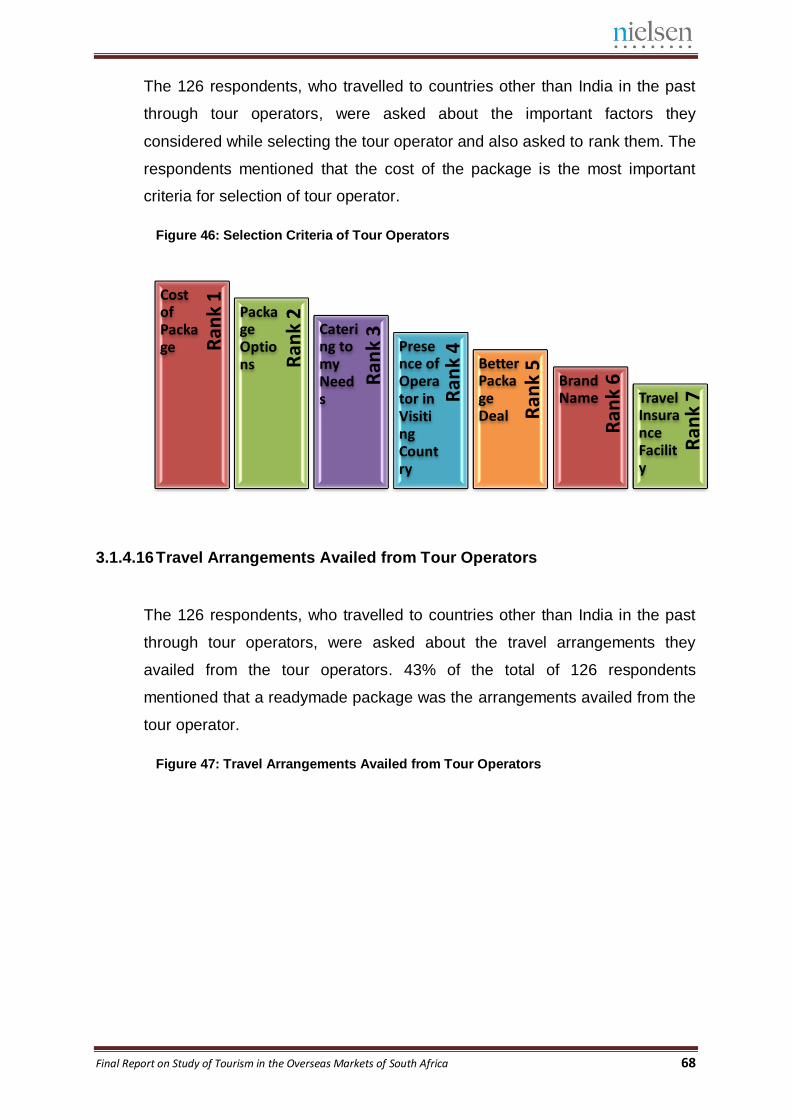
Final Report on Study of Tourism in the Overseas Markets of South Africa 68
The 126 respondents, who travelled to countries other than India in the past
through tour operators, were asked about the important factors they
considered while selecting the tour operator and also asked to rank them. The
respondents mentioned that the cost of the package is the most important
criteria for selection of tour operator.
Figure 46: Selection Criteria of Tour Operators
3.1.4.16 Travel Arrangements Availed from Tour Operators
The 126 respondents, who travelled to countries other than India in the past
through tour operators, were asked about the travel arrangements they
availed from the tour operators. 43% of the total of 126 respondents
mentioned that a readymade package was the arrangements availed from the
tour operator.
Figure 47: Travel Arrangements Availed from Tour Operators
Ran
k 3
Ran
k 2
Ran
k 4
Ran
k 1
Ran
k 5
Cost of Package
Ran
k 6
Package Options
Ran
k 7
Catering to my Needs
Presence of Operator in Visiting Country
Better Package Deal
Brand Name Travel
Insurance Facility
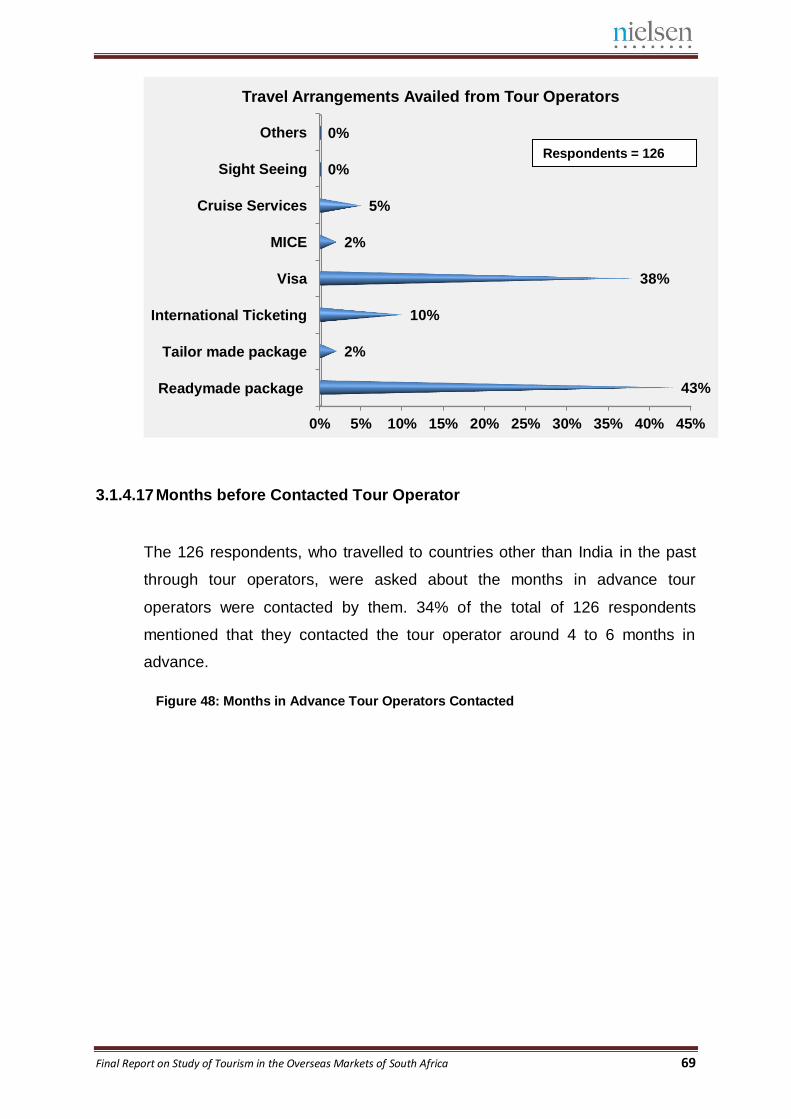
Final Report on Study of Tourism in the Overseas Markets of South Africa 69
3.1.4.17 Months before Contacted Tour Operator
The 126 respondents, who travelled to countries other than India in the past
through tour operators, were asked about the months in advance tour
operators were contacted by them. 34% of the total of 126 respondents
mentioned that they contacted the tour operator around 4 to 6 months in
advance.
Figure 48: Months in Advance Tour Operators Contacted
0% 5% 10% 15% 20% 25% 30% 35% 40% 45%
Readymade package
Tailor made package
International Ticketing
Visa
MICE
Cruise Services
Sight Seeing
Others
43%
2%
10%
38%
2%
5%
0%
0%
Travel Arrangements Availed from Tour Operators
Respondents = 126
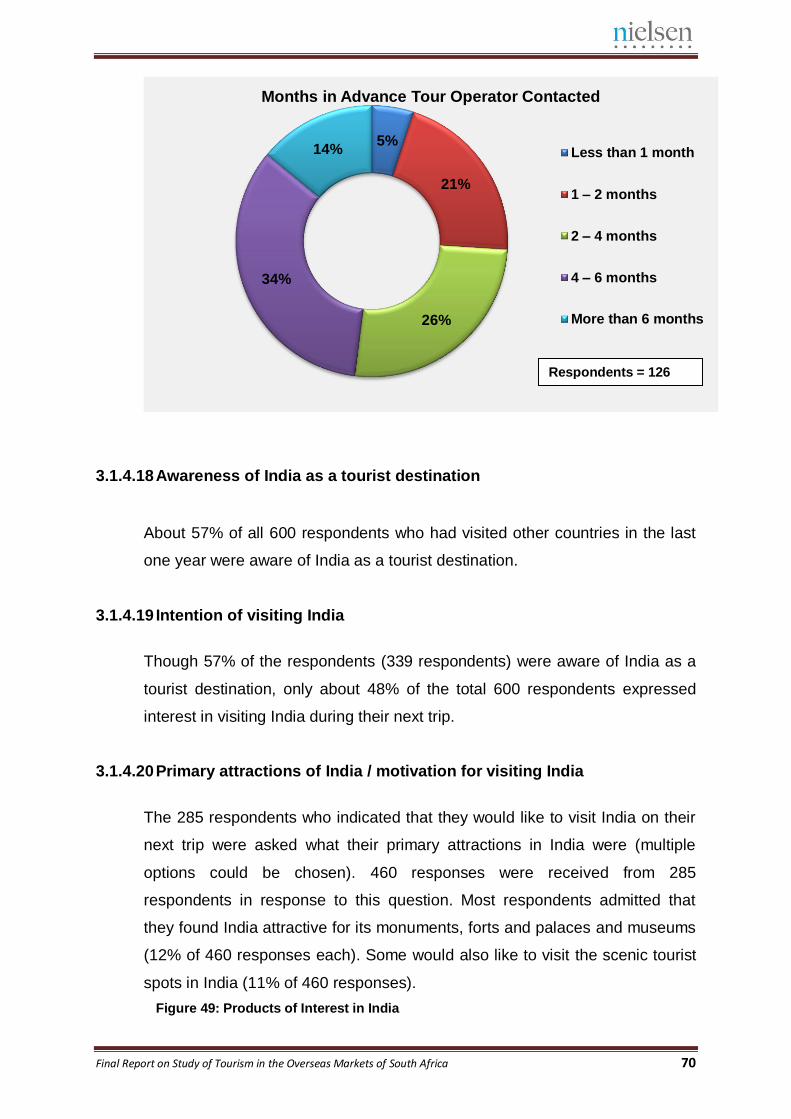
Final Report on Study of Tourism in the Overseas Markets of South Africa 70
3.1.4.18 Awareness of India as a tourist destination
About 57% of all 600 respondents who had visited other countries in the last
one year were aware of India as a tourist destination.
3.1.4.19 Intention of visiting India
Though 57% of the respondents (339 respondents) were aware of India as a
tourist destination, only about 48% of the total 600 respondents expressed
interest in visiting India during their next trip.
3.1.4.20 Primary attractions of India / motivation for visiting India
The 285 respondents who indicated that they would like to visit India on their
next trip were asked what their primary attractions in India were (multiple
options could be chosen). 460 responses were received from 285
respondents in response to this question. Most respondents admitted that
they found India attractive for its monuments, forts and palaces and museums
(12% of 460 responses each). Some would also like to visit the scenic tourist
spots in India (11% of 460 responses).
Figure 49: Products of Interest in India
5%
21%
26%
34%
14%
Months in Advance Tour Operator Contacted
Less than 1 month
1 – 2 months
2 – 4 months
4 – 6 months
More than 6 months
Respondents = 126
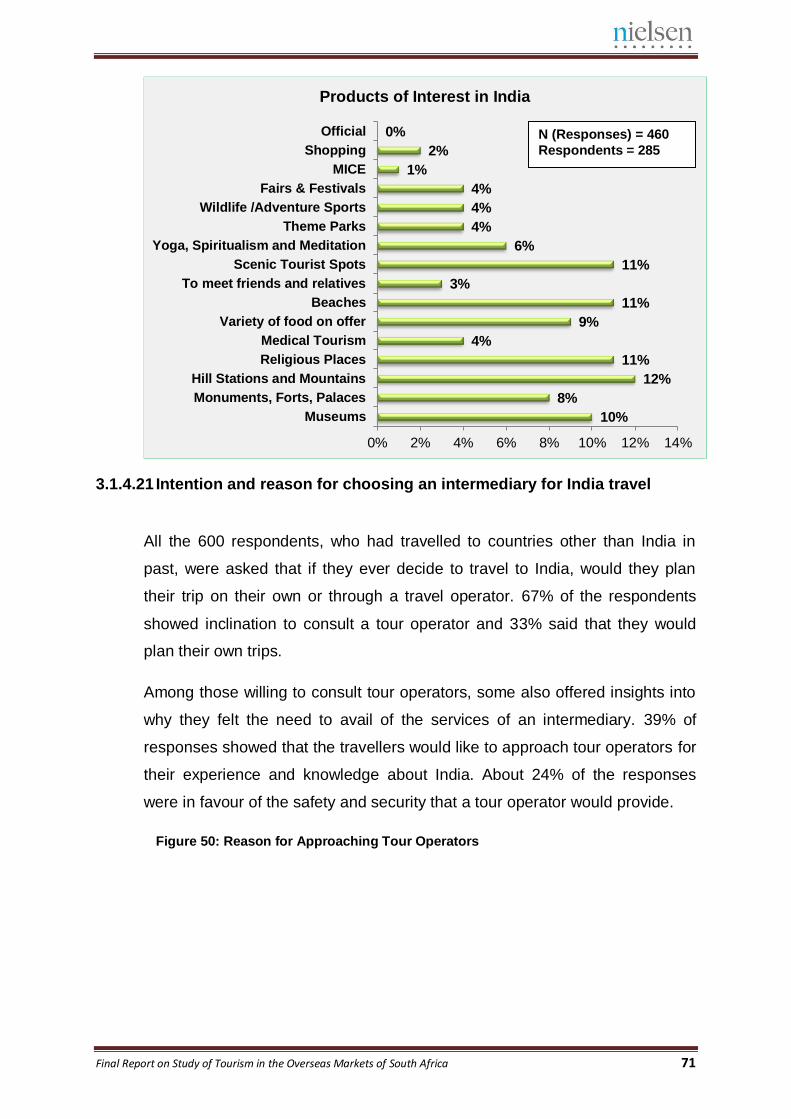
Final Report on Study of Tourism in the Overseas Markets of South Africa 71
3.1.4.21 Intention and reason for choosing an intermediary for India travel
All the 600 respondents, who had travelled to countries other than India in
past, were asked that if they ever decide to travel to India, would they plan
their trip on their own or through a travel operator. 67% of the respondents
showed inclination to consult a tour operator and 33% said that they would
plan their own trips.
Among those willing to consult tour operators, some also offered insights into
why they felt the need to avail of the services of an intermediary. 39% of
responses showed that the travellers would like to approach tour operators for
their experience and knowledge about India. About 24% of the responses
were in favour of the safety and security that a tour operator would provide.
Figure 50: Reason for Approaching Tour Operators
10%
8%
12%
11%
4%
9%
11%
3%
11%
6%
4%
4%
4%
1%
2%
0%
0% 2% 4% 6% 8% 10% 12% 14%
Museums
Monuments, Forts, Palaces
Hill Stations and Mountains
Religious Places
Medical Tourism
Variety of food on offer
Beaches
To meet friends and relatives
Scenic Tourist Spots
Yoga, Spiritualism and Meditation
Theme Parks
Wildlife /Adventure Sports
Fairs & Festivals
MICE
Shopping
Official
Products of Interest in India
N (Responses) = 460
Respondents = 285
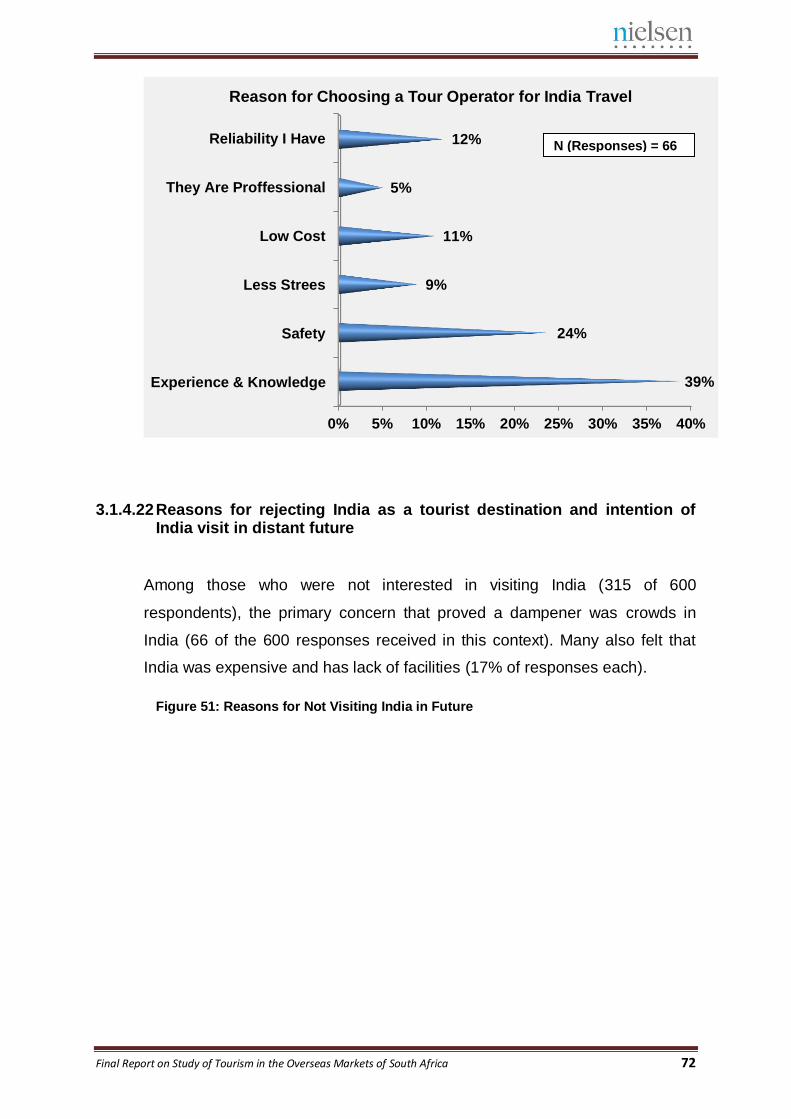
Final Report on Study of Tourism in the Overseas Markets of South Africa 72
3.1.4.22 Reasons for rejecting India as a tourist destination and intention of India visit in distant future
Among those who were not interested in visiting India (315 of 600
respondents), the primary concern that proved a dampener was crowds in
India (66 of the 600 responses received in this context). Many also felt that
India was expensive and has lack of facilities (17% of responses each).
Figure 51: Reasons for Not Visiting India in Future
0% 5% 10% 15% 20% 25% 30% 35% 40%
Experience & Knowledge
Safety
Less Strees
Low Cost
They Are Proffessional
Reliability I Have
39%
24%
9%
11%
5%
12%
Reason for Choosing a Tour Operator for India Travel
N (Responses) = 66
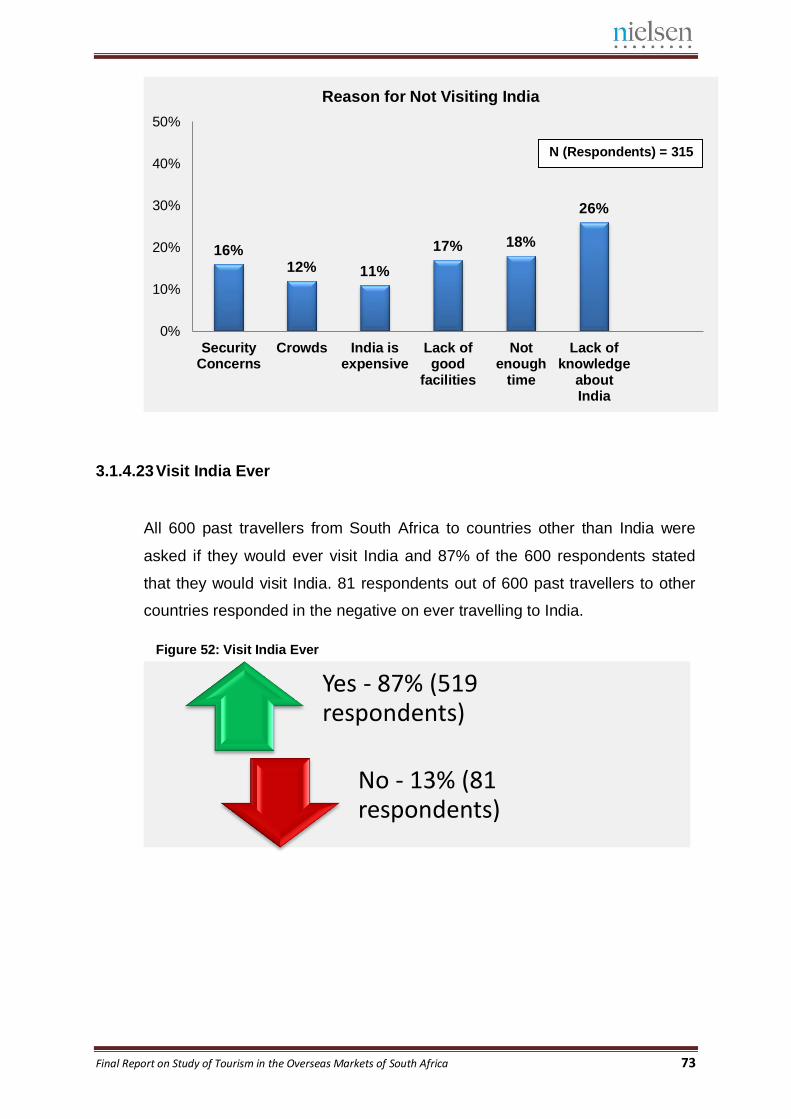
Final Report on Study of Tourism in the Overseas Markets of South Africa 73
3.1.4.23 Visit India Ever
All 600 past travellers from South Africa to countries other than India were
asked if they would ever visit India and 87% of the 600 respondents stated
that they would visit India. 81 respondents out of 600 past travellers to other
countries responded in the negative on ever travelling to India.
Figure 52: Visit India Ever
16% 12% 11%
17% 18%
26%
0%
10%
20%
30%
40%
50%
SecurityConcerns
Crowds India isexpensive
Lack ofgood
facilities
Notenough
time
Lack ofknowledge
aboutIndia
Reason for Not Visiting India
Yes - 87% (519 respondents)
No - 13% (81 respondents)
N (Respondents) = 315
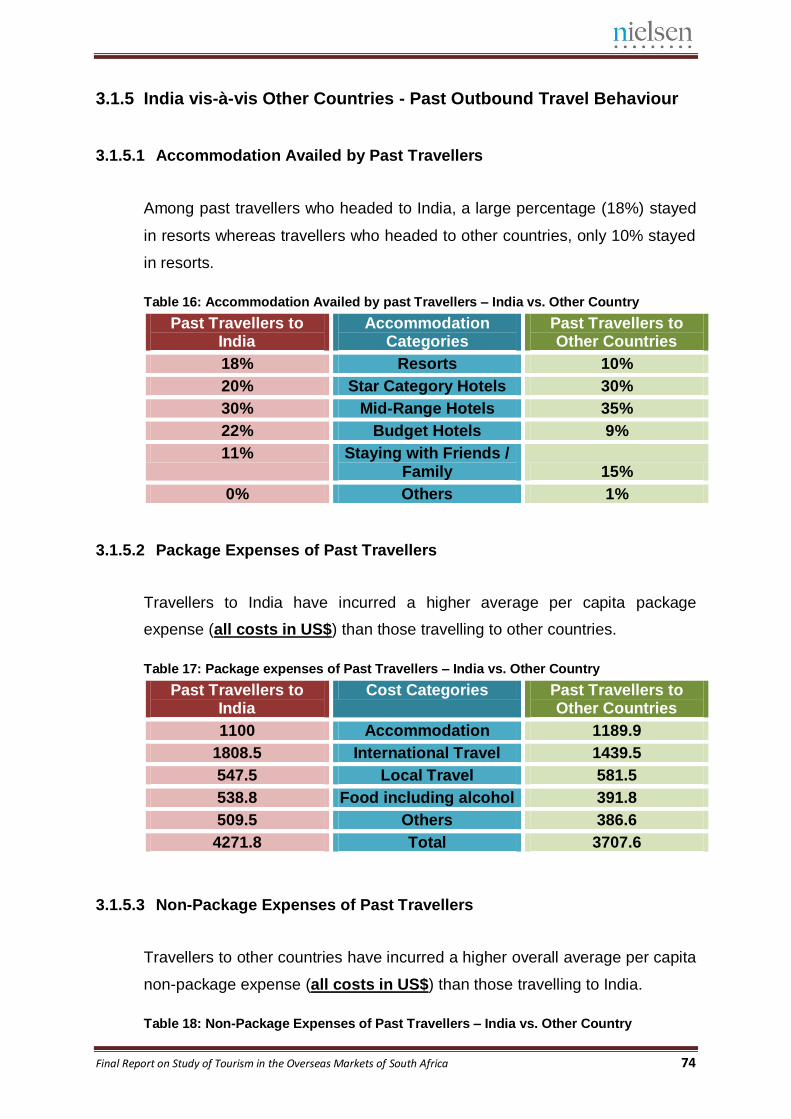
Final Report on Study of Tourism in the Overseas Markets of South Africa 74
3.1.5 India vis-à-vis Other Countries - Past Outbound Travel Behaviour
3.1.5.1 Accommodation Availed by Past Travellers
Among past travellers who headed to India, a large percentage (18%) stayed
in resorts whereas travellers who headed to other countries, only 10% stayed
in resorts.
Table 16: Accommodation Availed by past Travellers – India vs. Other Country
Past Travellers to India
Accommodation Categories
Past Travellers to Other Countries
18% Resorts 10%
20% Star Category Hotels 30%
30% Mid-Range Hotels 35%
22% Budget Hotels 9%
11% Staying with Friends / Family 15%
0% Others 1%
3.1.5.2 Package Expenses of Past Travellers
Travellers to India have incurred a higher average per capita package
expense (all costs in US$) than those travelling to other countries.
Table 17: Package expenses of Past Travellers – India vs. Other Country
Past Travellers to India
Cost Categories Past Travellers to Other Countries
1100 Accommodation 1189.9
1808.5 International Travel 1439.5
547.5 Local Travel 581.5
538.8 Food including alcohol 391.8
509.5 Others 386.6
4271.8 Total 3707.6
3.1.5.3 Non-Package Expenses of Past Travellers
Travellers to other countries have incurred a higher overall average per capita
non-package expense (all costs in US$) than those travelling to India.
Table 18: Non-Package Expenses of Past Travellers – India vs. Other Country
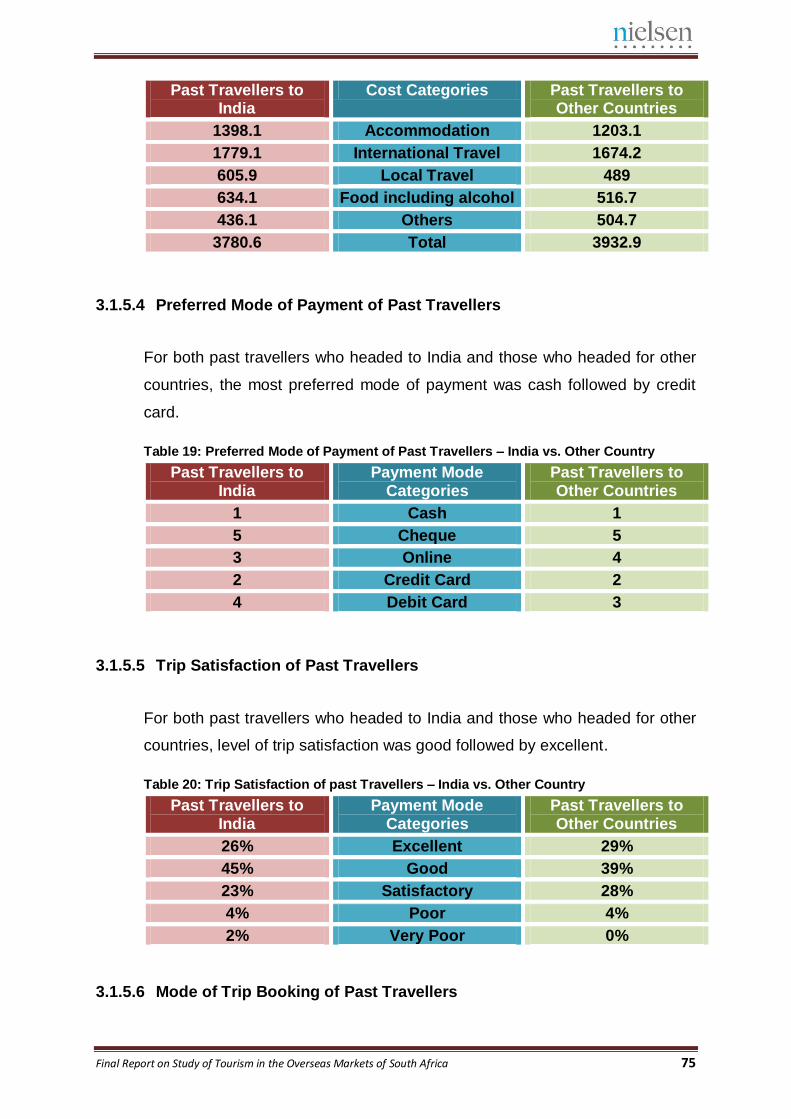
Final Report on Study of Tourism in the Overseas Markets of South Africa 75
Past Travellers to India
Cost Categories Past Travellers to Other Countries
1398.1 Accommodation 1203.1
1779.1 International Travel 1674.2
605.9 Local Travel 489
634.1 Food including alcohol 516.7
436.1 Others 504.7
3780.6 Total 3932.9
3.1.5.4 Preferred Mode of Payment of Past Travellers
For both past travellers who headed to India and those who headed for other
countries, the most preferred mode of payment was cash followed by credit
card.
Table 19: Preferred Mode of Payment of Past Travellers – India vs. Other Country
Past Travellers to India
Payment Mode Categories
Past Travellers to Other Countries
1 Cash 1
5 Cheque 5
3 Online 4
2 Credit Card 2
4 Debit Card 3
3.1.5.5 Trip Satisfaction of Past Travellers
For both past travellers who headed to India and those who headed for other
countries, level of trip satisfaction was good followed by excellent.
Table 20: Trip Satisfaction of past Travellers – India vs. Other Country
Past Travellers to India
Payment Mode Categories
Past Travellers to Other Countries
26% Excellent 29%
45% Good 39%
23% Satisfactory 28%
4% Poor 4%
2% Very Poor 0%
3.1.5.6 Mode of Trip Booking of Past Travellers
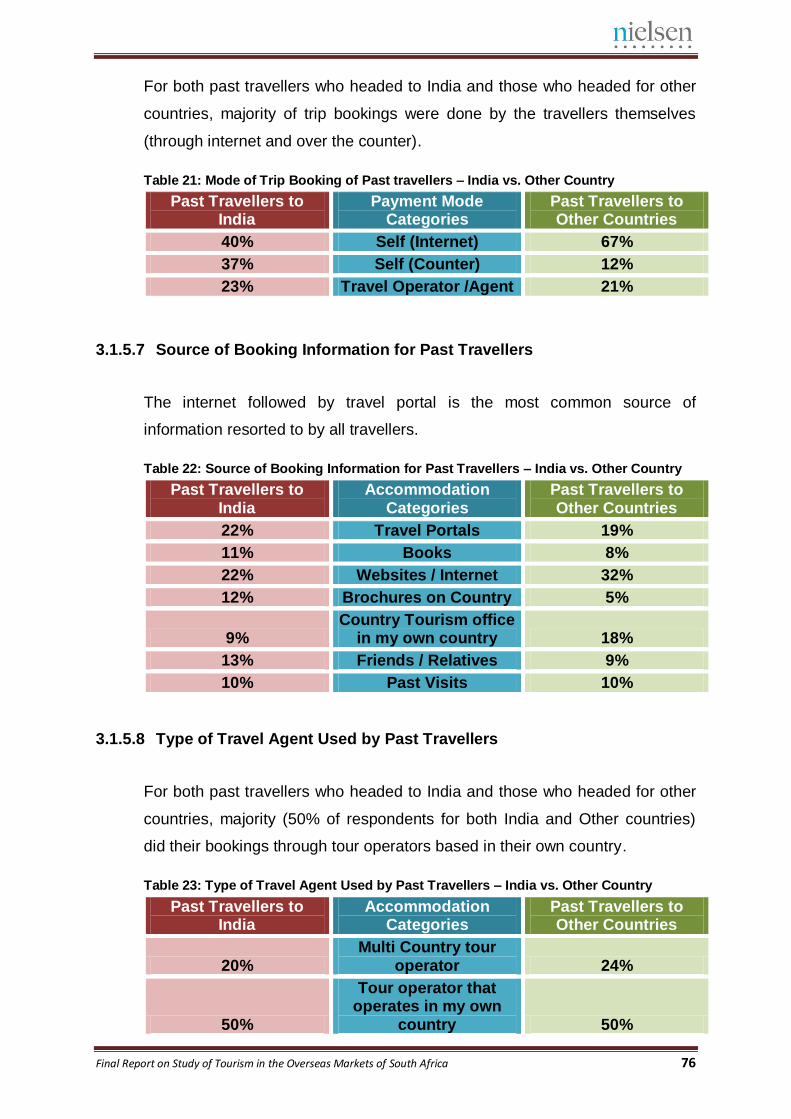
Final Report on Study of Tourism in the Overseas Markets of South Africa 76
For both past travellers who headed to India and those who headed for other
countries, majority of trip bookings were done by the travellers themselves
(through internet and over the counter).
Table 21: Mode of Trip Booking of Past travellers – India vs. Other Country
Past Travellers to India
Payment Mode Categories
Past Travellers to Other Countries
40% Self (Internet) 67%
37% Self (Counter) 12%
23% Travel Operator /Agent 21%
3.1.5.7 Source of Booking Information for Past Travellers
The internet followed by travel portal is the most common source of
information resorted to by all travellers.
Table 22: Source of Booking Information for Past Travellers – India vs. Other Country
Past Travellers to India
Accommodation Categories
Past Travellers to Other Countries
22% Travel Portals 19%
11% Books 8%
22% Websites / Internet 32%
12% Brochures on Country 5%
9% Country Tourism office
in my own country 18%
13% Friends / Relatives 9%
10% Past Visits 10%
3.1.5.8 Type of Travel Agent Used by Past Travellers
For both past travellers who headed to India and those who headed for other
countries, majority (50% of respondents for both India and Other countries)
did their bookings through tour operators based in their own country.
Table 23: Type of Travel Agent Used by Past Travellers – India vs. Other Country
Past Travellers to India
Accommodation Categories
Past Travellers to Other Countries
20% Multi Country tour
operator 24%
50%
Tour operator that operates in my own
country 50%
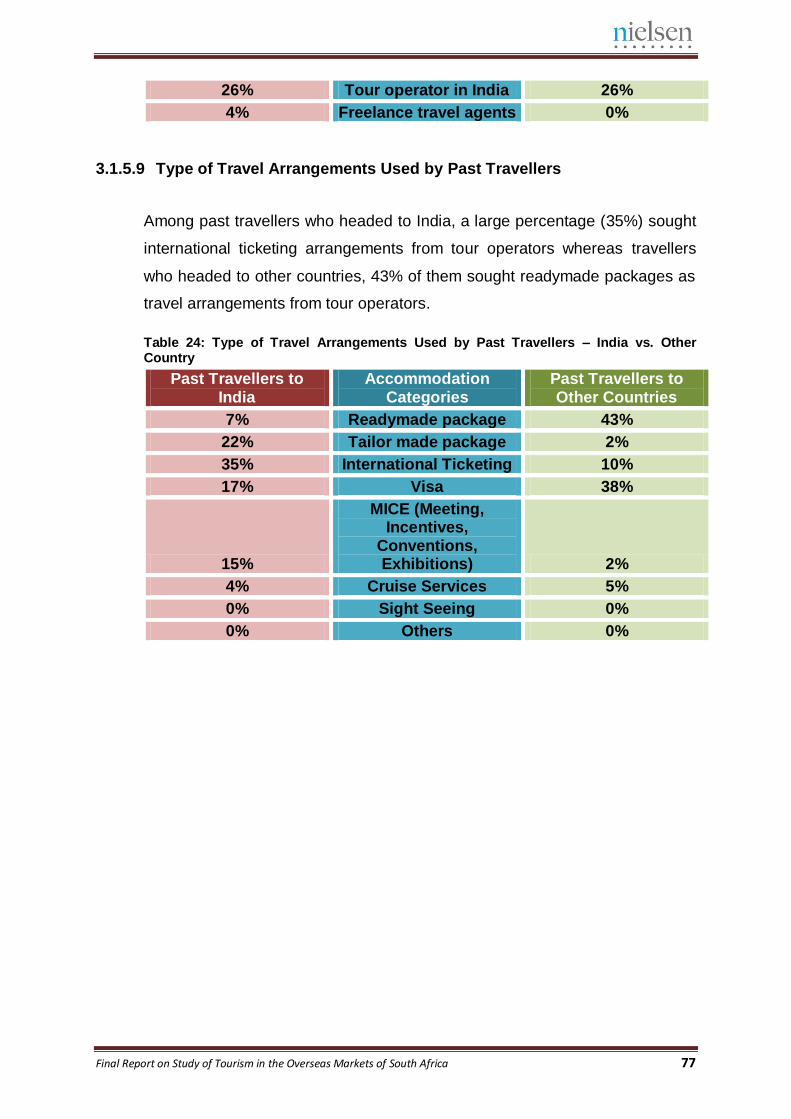
Final Report on Study of Tourism in the Overseas Markets of South Africa 77
26% Tour operator in India 26%
4% Freelance travel agents 0%
3.1.5.9 Type of Travel Arrangements Used by Past Travellers
Among past travellers who headed to India, a large percentage (35%) sought
international ticketing arrangements from tour operators whereas travellers
who headed to other countries, 43% of them sought readymade packages as
travel arrangements from tour operators.
Table 24: Type of Travel Arrangements Used by Past Travellers – India vs. Other Country
Past Travellers to India
Accommodation Categories
Past Travellers to Other Countries
7% Readymade package 43%
22% Tailor made package 2%
35% International Ticketing 10%
17% Visa 38%
15%
MICE (Meeting, Incentives,
Conventions, Exhibitions) 2%
4% Cruise Services 5%
0% Sight Seeing 0%
0% Others 0%
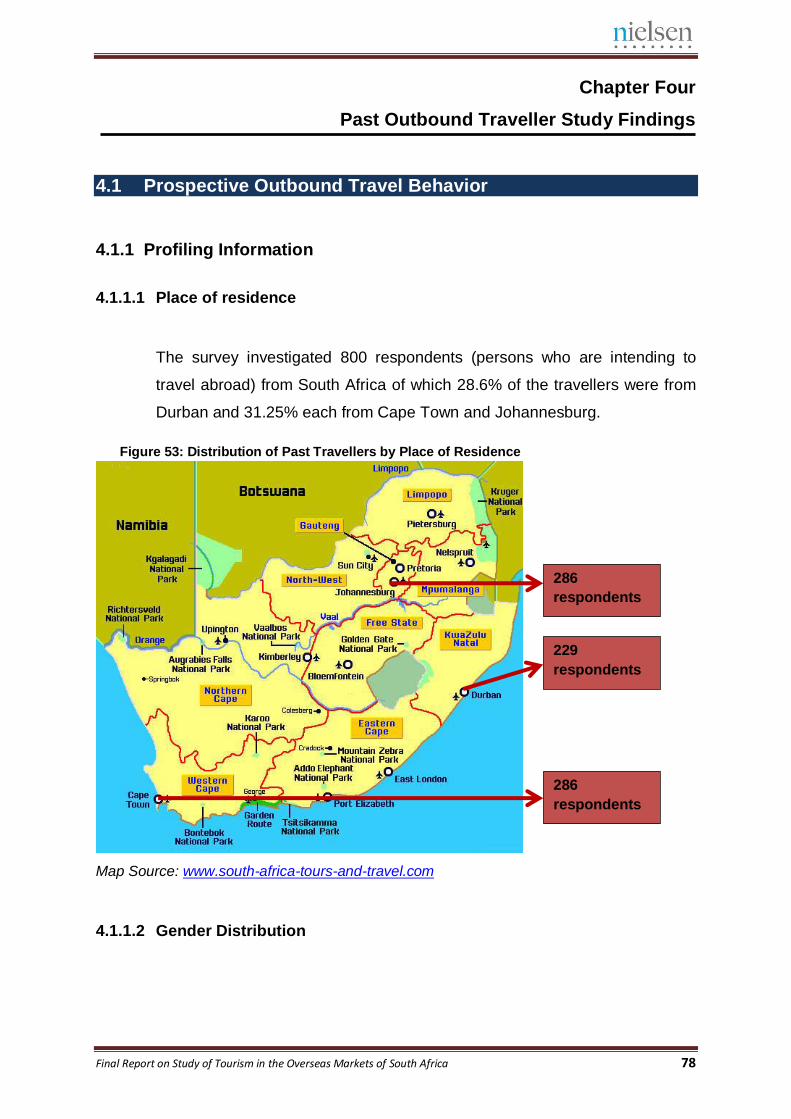
Final Report on Study of Tourism in the Overseas Markets of South Africa 78
Chapter Four
Past Outbound Traveller Study Findings
4.1 Prospective Outbound Travel Behavior
4.1.1 Profiling Information
4.1.1.1 Place of residence
The survey investigated 800 respondents (persons who are intending to
travel abroad) from South Africa of which 28.6% of the travellers were from
Durban and 31.25% each from Cape Town and Johannesburg.
Figure 53: Distribution of Past Travellers by Place of Residence
Map Source: www.south-africa-tours-and-travel.com
4.1.1.2 Gender Distribution
286
respondents
286
respondents
229
respondents
411 respondents of 2000
from Manchester, that is,
21%
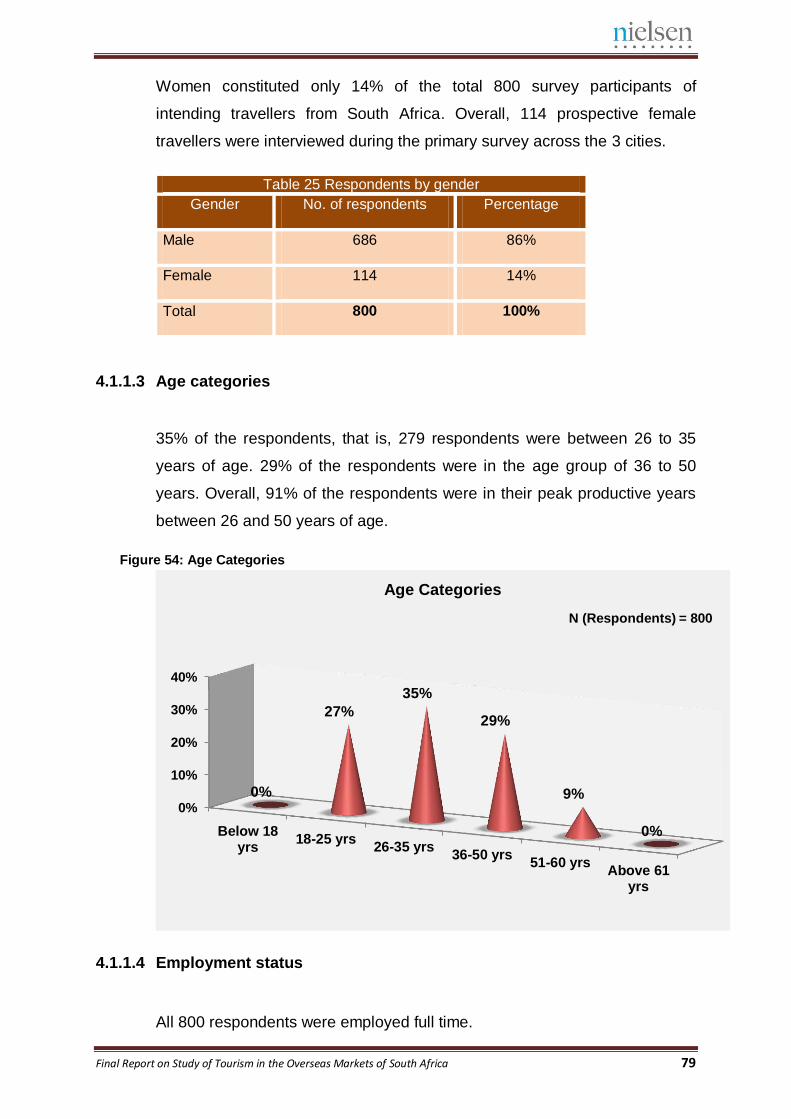
Final Report on Study of Tourism in the Overseas Markets of South Africa 79
Women constituted only 14% of the total 800 survey participants of
intending travellers from South Africa. Overall, 114 prospective female
travellers were interviewed during the primary survey across the 3 cities.
Table 25 Respondents by gender
Gender No. of respondents Percentage
Male 686 86%
Female 114 14%
Total 800 100%
4.1.1.3 Age categories
35% of the respondents, that is, 279 respondents were between 26 to 35
years of age. 29% of the respondents were in the age group of 36 to 50
years. Overall, 91% of the respondents were in their peak productive years
between 26 and 50 years of age.
Figure 54: Age Categories
4.1.1.4 Employment status
All 800 respondents were employed full time.
0%
10%
20%
30%
40%
Below 18yrs
18-25 yrs26-35 yrs
36-50 yrs51-60 yrs
Above 61yrs
0%
27%
35%
29%
9%
0%
Age Categories
N (Respondents) = 800
411 respondents of 2000
from Manchester, that is,
21%
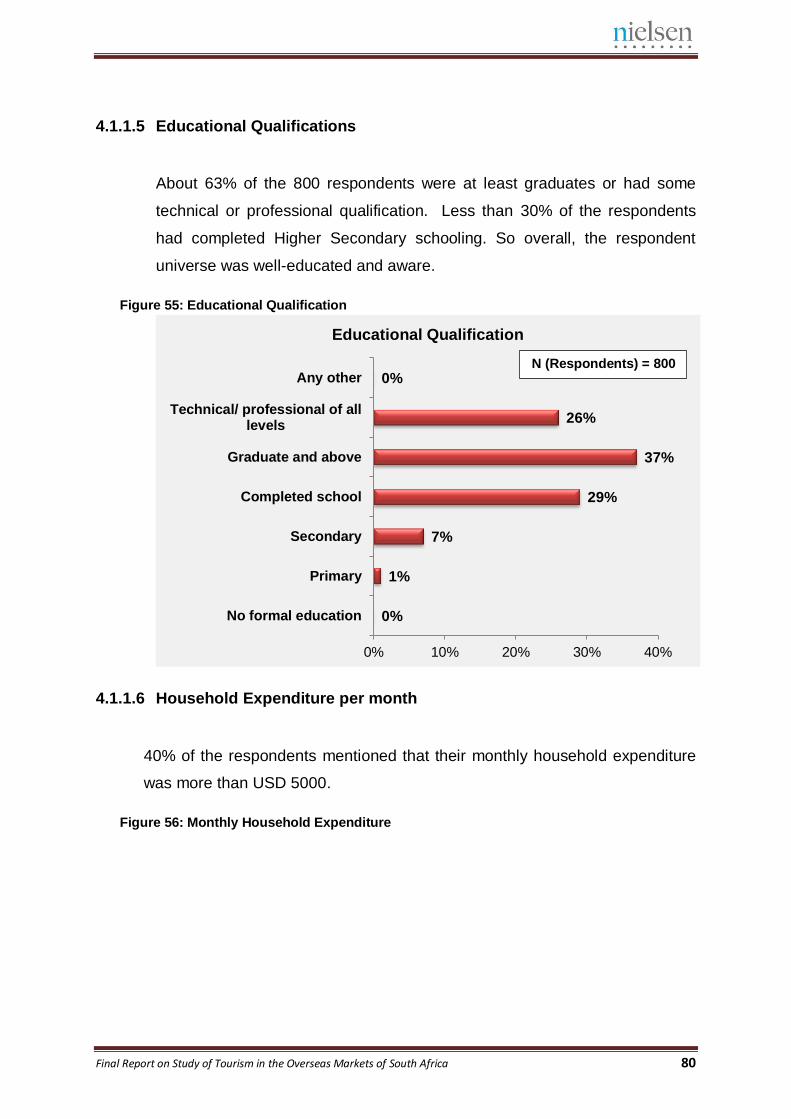
Final Report on Study of Tourism in the Overseas Markets of South Africa 80
4.1.1.5 Educational Qualifications
About 63% of the 800 respondents were at least graduates or had some
technical or professional qualification. Less than 30% of the respondents
had completed Higher Secondary schooling. So overall, the respondent
universe was well-educated and aware.
Figure 55: Educational Qualification
4.1.1.6 Household Expenditure per month
40% of the respondents mentioned that their monthly household expenditure
was more than USD 5000.
Figure 56: Monthly Household Expenditure
0%
1%
7%
29%
37%
26%
0%
0% 10% 20% 30% 40%
No formal education
Primary
Secondary
Completed school
Graduate and above
Technical/ professional of alllevels
Any other
Educational Qualification
N (Respondents) = 800
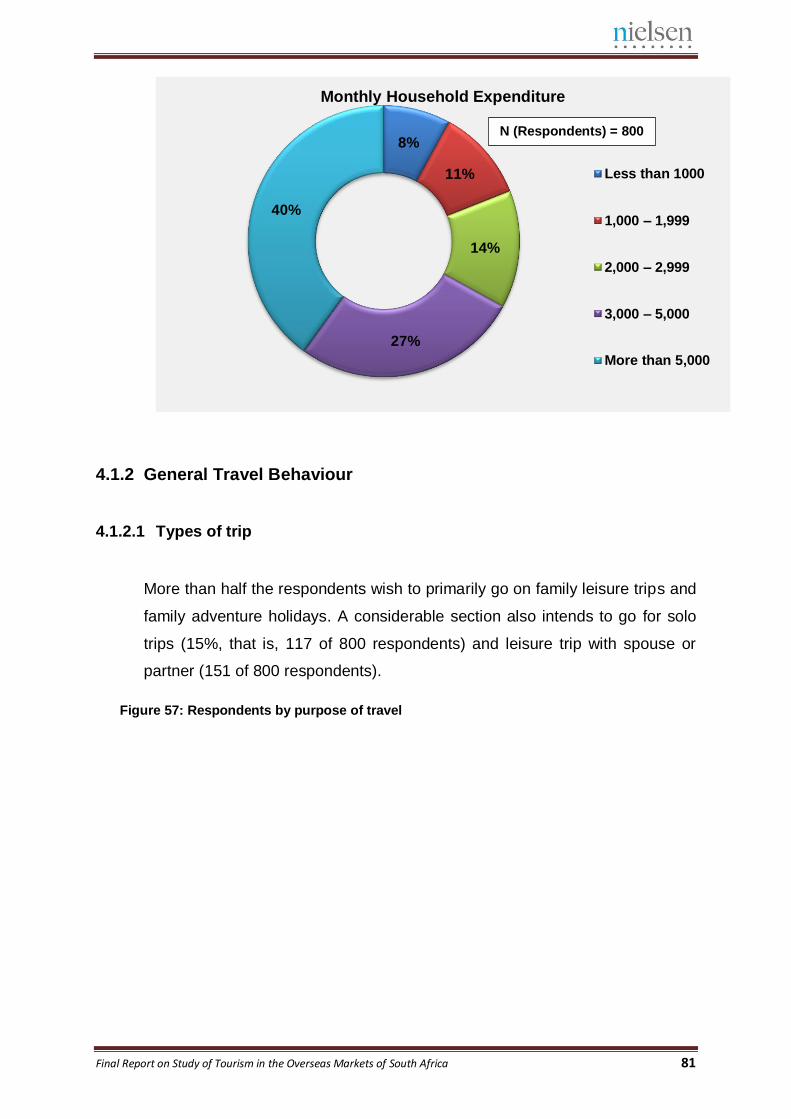
Final Report on Study of Tourism in the Overseas Markets of South Africa 81
4.1.2 General Travel Behaviour
4.1.2.1 Types of trip
More than half the respondents wish to primarily go on family leisure trips and
family adventure holidays. A considerable section also intends to go for solo
trips (15%, that is, 117 of 800 respondents) and leisure trip with spouse or
partner (151 of 800 respondents).
Figure 57: Respondents by purpose of travel
8%
11%
14%
27%
40%
Monthly Household Expenditure
Less than 1000
1,000 – 1,999
2,000 – 2,999
3,000 – 5,000
More than 5,000
N (Respondents) = 800
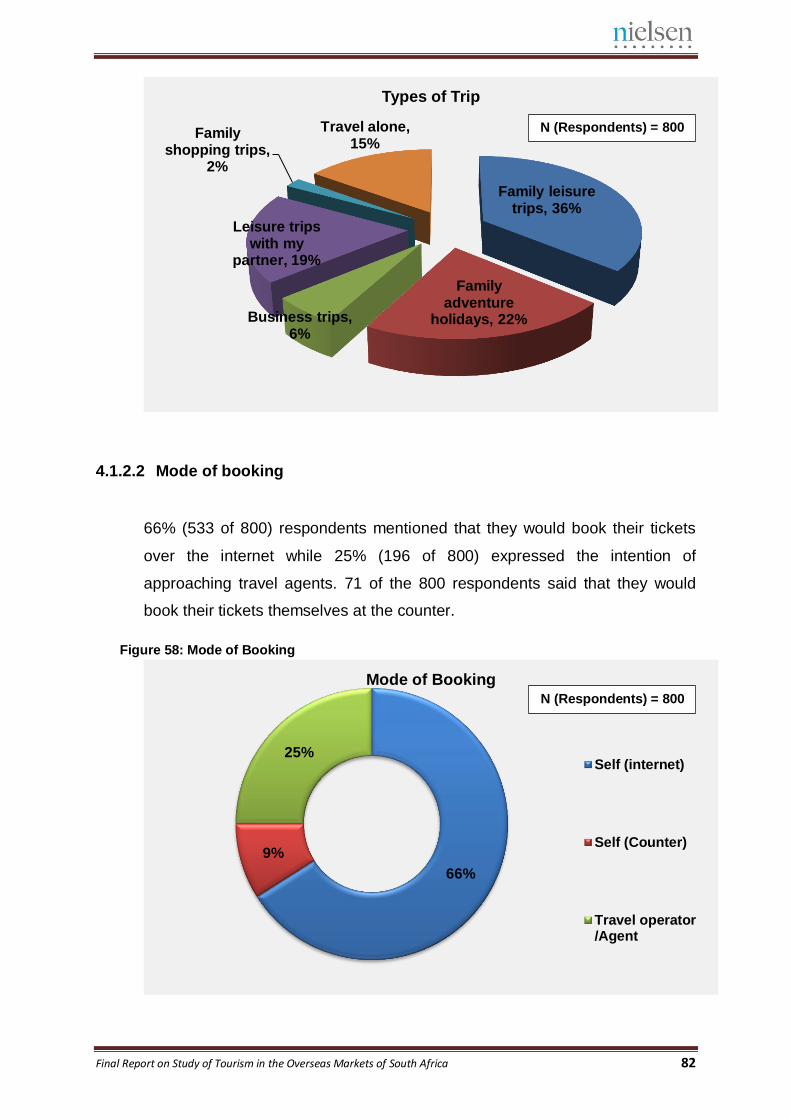
Final Report on Study of Tourism in the Overseas Markets of South Africa 82
4.1.2.2 Mode of booking
66% (533 of 800) respondents mentioned that they would book their tickets
over the internet while 25% (196 of 800) expressed the intention of
approaching travel agents. 71 of the 800 respondents said that they would
book their tickets themselves at the counter.
Figure 58: Mode of Booking
Family leisure trips, 36%
Family adventure
holidays, 22% Business trips, 6%
Leisure trips with my
partner, 19%
Family shopping trips,
2%
Travel alone, 15%
Types of Trip
66%
9%
25%
Mode of Booking
Self (internet)
Self (Counter)
Travel operator/Agent
N (Respondents) = 800
N (Respondents) = 800
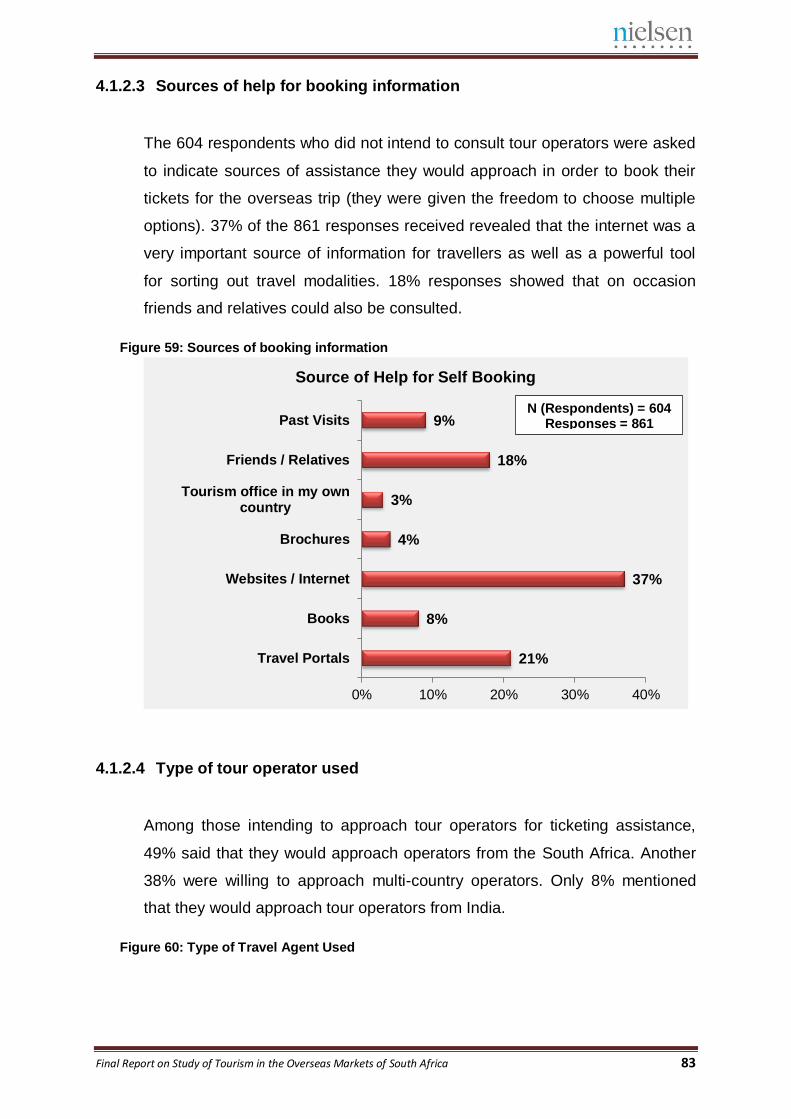
Final Report on Study of Tourism in the Overseas Markets of South Africa 83
4.1.2.3 Sources of help for booking information
The 604 respondents who did not intend to consult tour operators were asked
to indicate sources of assistance they would approach in order to book their
tickets for the overseas trip (they were given the freedom to choose multiple
options). 37% of the 861 responses received revealed that the internet was a
very important source of information for travellers as well as a powerful tool
for sorting out travel modalities. 18% responses showed that on occasion
friends and relatives could also be consulted.
Figure 59: Sources of booking information
4.1.2.4 Type of tour operator used
Among those intending to approach tour operators for ticketing assistance,
49% said that they would approach operators from the South Africa. Another
38% were willing to approach multi-country operators. Only 8% mentioned
that they would approach tour operators from India.
Figure 60: Type of Travel Agent Used
21%
8%
37%
4%
3%
18%
9%
0% 10% 20% 30% 40%
Travel Portals
Books
Websites / Internet
Brochures
Tourism office in my owncountry
Friends / Relatives
Past Visits
Source of Help for Self Booking
N (Respondents) = 604 Responses = 861
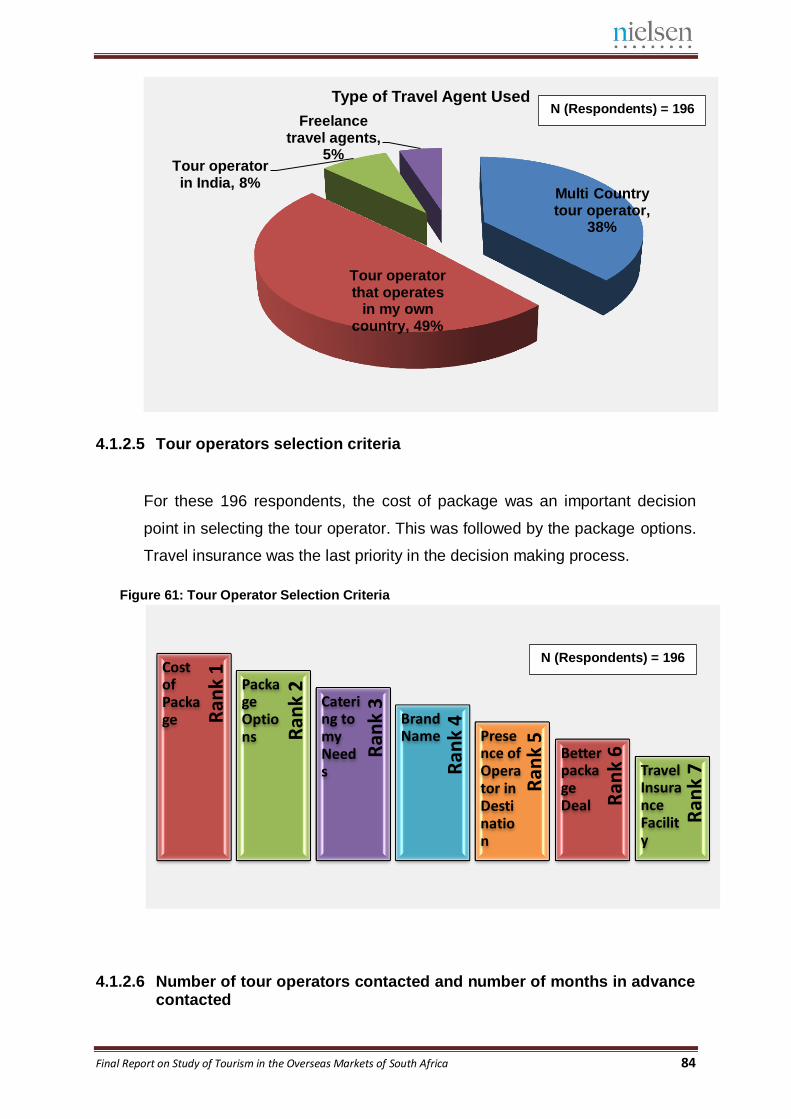
Final Report on Study of Tourism in the Overseas Markets of South Africa 84
4.1.2.5 Tour operators selection criteria
For these 196 respondents, the cost of package was an important decision
point in selecting the tour operator. This was followed by the package options.
Travel insurance was the last priority in the decision making process.
Figure 61: Tour Operator Selection Criteria
4.1.2.6 Number of tour operators contacted and number of months in advance contacted
Multi Country tour operator,
38%
Tour operator that operates
in my own country, 49%
Tour operator in India, 8%
Freelance travel agents,
5%
Type of Travel Agent Used
Ran
k 3
Ran
k 2
Ran
k 4
Ran
k 1
Ran
k 5
Cost of Package
Ran
k 6
Package Options
Ran
k 7
Catering to my Needs
Brand Name Prese
nce of Operator in Destination
Better package Deal
Travel Insurance Facility
N (Respondents) = 196
N (Respondents) = 196
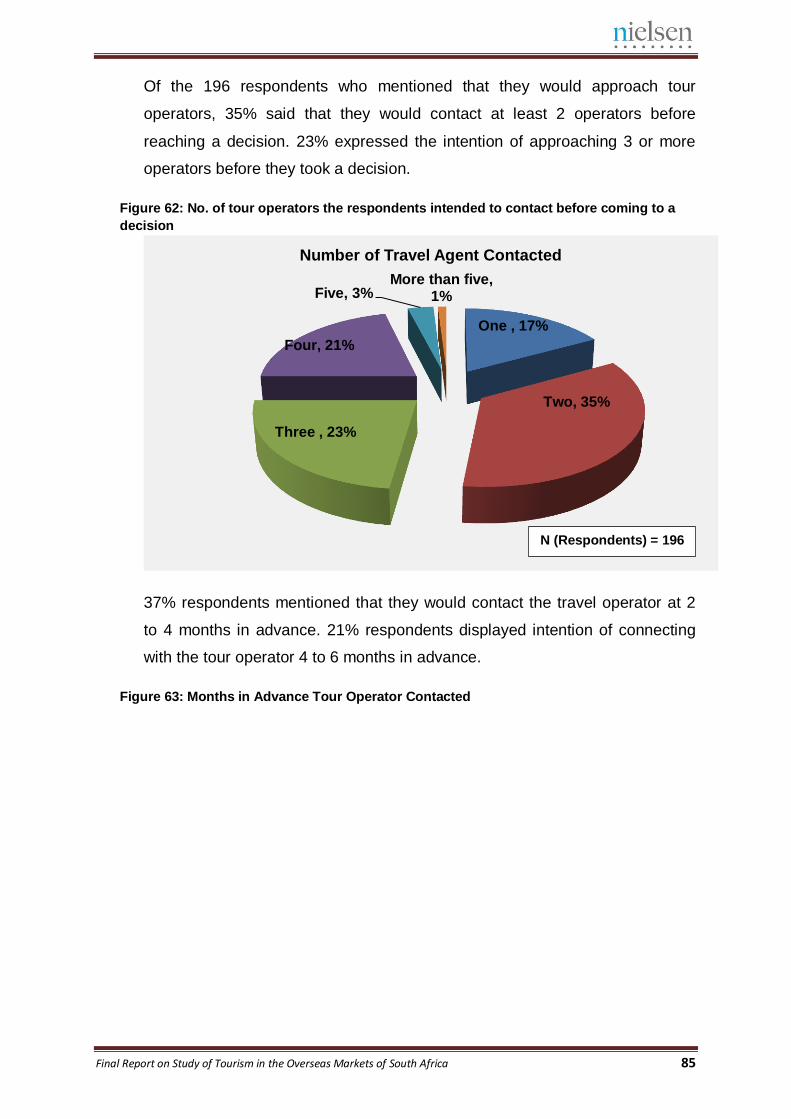
Final Report on Study of Tourism in the Overseas Markets of South Africa 85
Of the 196 respondents who mentioned that they would approach tour
operators, 35% said that they would contact at least 2 operators before
reaching a decision. 23% expressed the intention of approaching 3 or more
operators before they took a decision.
Figure 62: No. of tour operators the respondents intended to contact before coming to a
decision
37% respondents mentioned that they would contact the travel operator at 2
to 4 months in advance. 21% respondents displayed intention of connecting
with the tour operator 4 to 6 months in advance.
Figure 63: Months in Advance Tour Operator Contacted
One , 17%
Two, 35%
Three , 23%
Four, 21%
Five, 3% More than five,
1%
Number of Travel Agent Contacted
N (Respondents) = 196
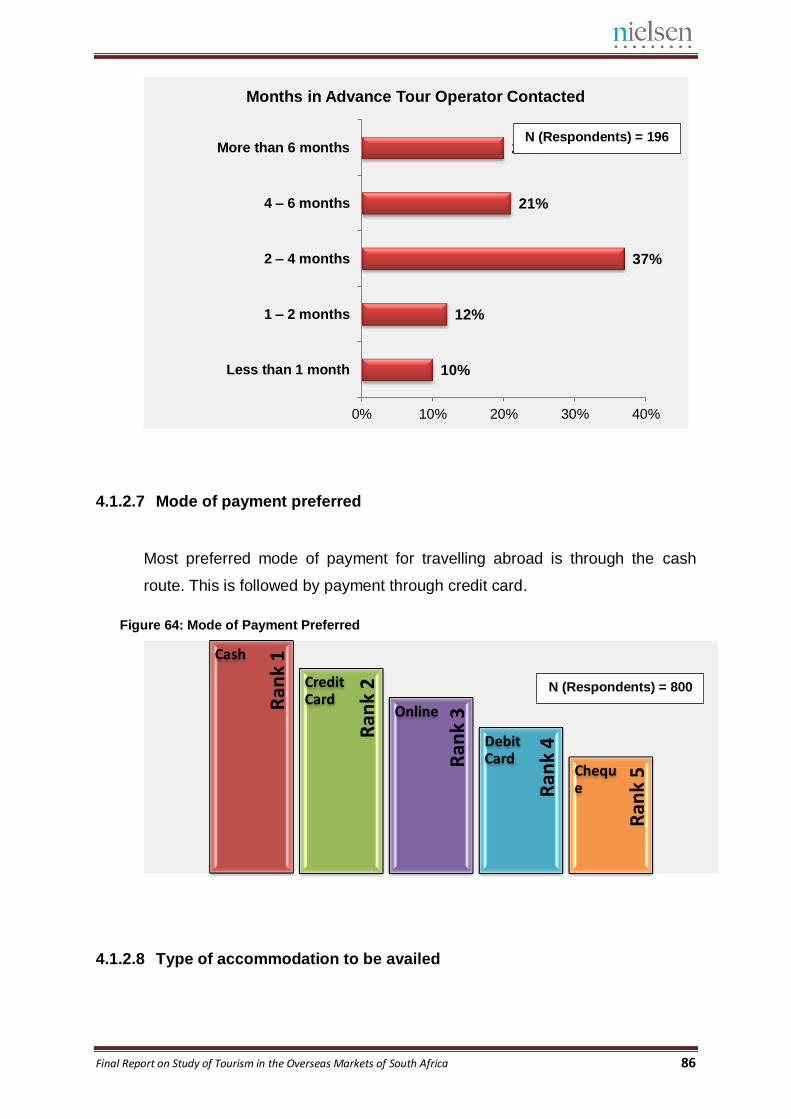
Final Report on Study of Tourism in the Overseas Markets of South Africa 86
4.1.2.7 Mode of payment preferred
Most preferred mode of payment for travelling abroad is through the cash
route. This is followed by payment through credit card.
Figure 64: Mode of Payment Preferred
4.1.2.8 Type of accommodation to be availed
10%
12%
37%
21%
20%
0% 10% 20% 30% 40%
Less than 1 month
1 – 2 months
2 – 4 months
4 – 6 months
More than 6 months
Months in Advance Tour Operator Contacted
Ran
k 3
Ran
k 2
Ran
k 4
Ran
k 1
Ran
k 5
Cash
Credit Card
Online
Debit Card
Cheque
N (Respondents) = 196
N (Respondents) = 800
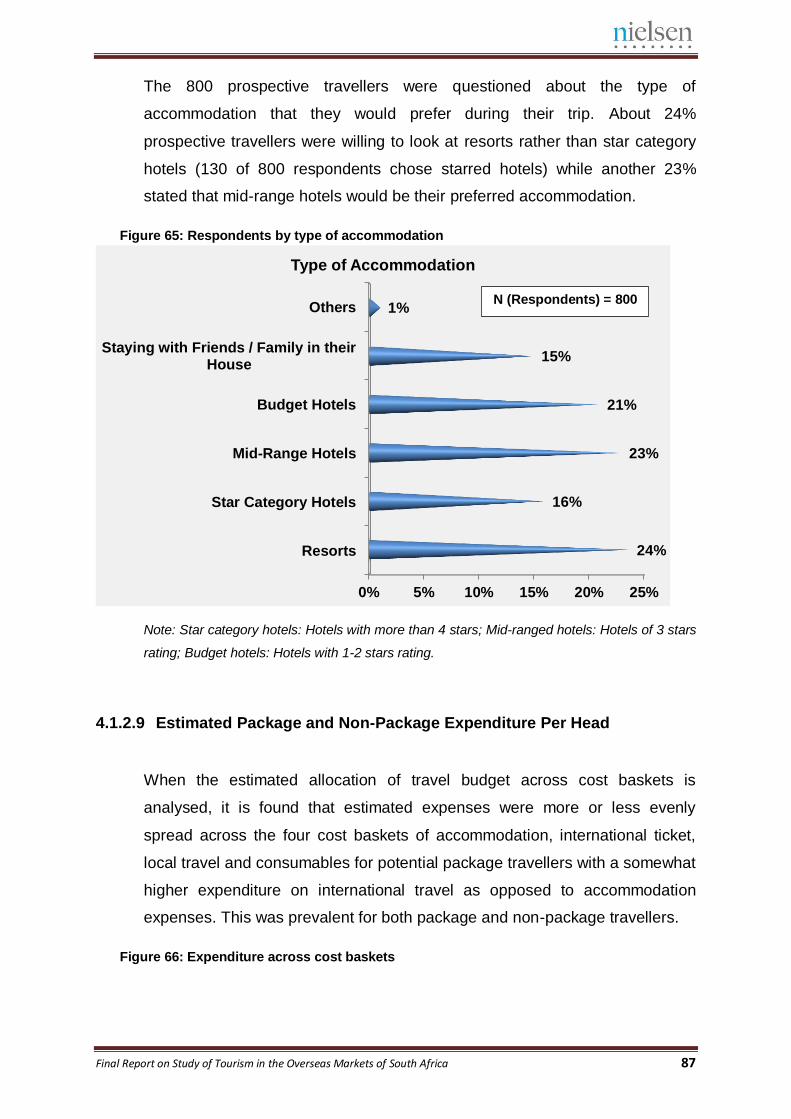
Final Report on Study of Tourism in the Overseas Markets of South Africa 87
The 800 prospective travellers were questioned about the type of
accommodation that they would prefer during their trip. About 24%
prospective travellers were willing to look at resorts rather than star category
hotels (130 of 800 respondents chose starred hotels) while another 23%
stated that mid-range hotels would be their preferred accommodation.
Figure 65: Respondents by type of accommodation
Note: Star category hotels: Hotels with more than 4 stars; Mid-ranged hotels: Hotels of 3 stars
rating; Budget hotels: Hotels with 1-2 stars rating.
4.1.2.9 Estimated Package and Non-Package Expenditure Per Head
When the estimated allocation of travel budget across cost baskets is
analysed, it is found that estimated expenses were more or less evenly
spread across the four cost baskets of accommodation, international ticket,
local travel and consumables for potential package travellers with a somewhat
higher expenditure on international travel as opposed to accommodation
expenses. This was prevalent for both package and non-package travellers.
Figure 66: Expenditure across cost baskets
0% 5% 10% 15% 20% 25%
Resorts
Star Category Hotels
Mid-Range Hotels
Budget Hotels
Staying with Friends / Family in theirHouse
Others
24%
16%
23%
21%
15%
1%
Type of Accommodation
N (Respondents) = 800
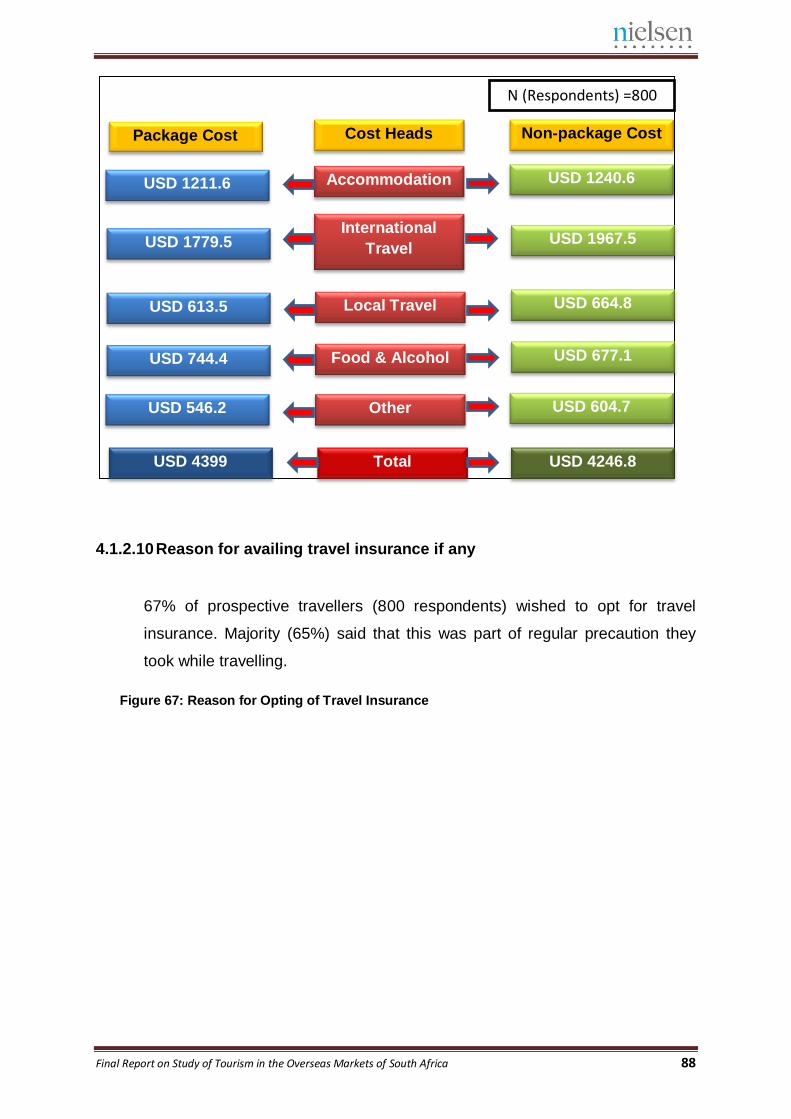
Final Report on Study of Tourism in the Overseas Markets of South Africa 88
4.1.2.10 Reason for availing travel insurance if any
67% of prospective travellers (800 respondents) wished to opt for travel
insurance. Majority (65%) said that this was part of regular precaution they
took while travelling.
Figure 67: Reason for Opting of Travel Insurance
N (Respondents) =800
Package Cost Non-package Cost Cost Heads
Accommodation
International
Travel
Local Travel
Food & Alcohol
Other
USD 1240.6
USD 1967.5
USD 664.8
USD 677.1
USD 604.7
USD 1211.6
USD 1779.5
USD 613.5
USD 744.4
USD 546.2
Total USD 4246.8 USD 4399
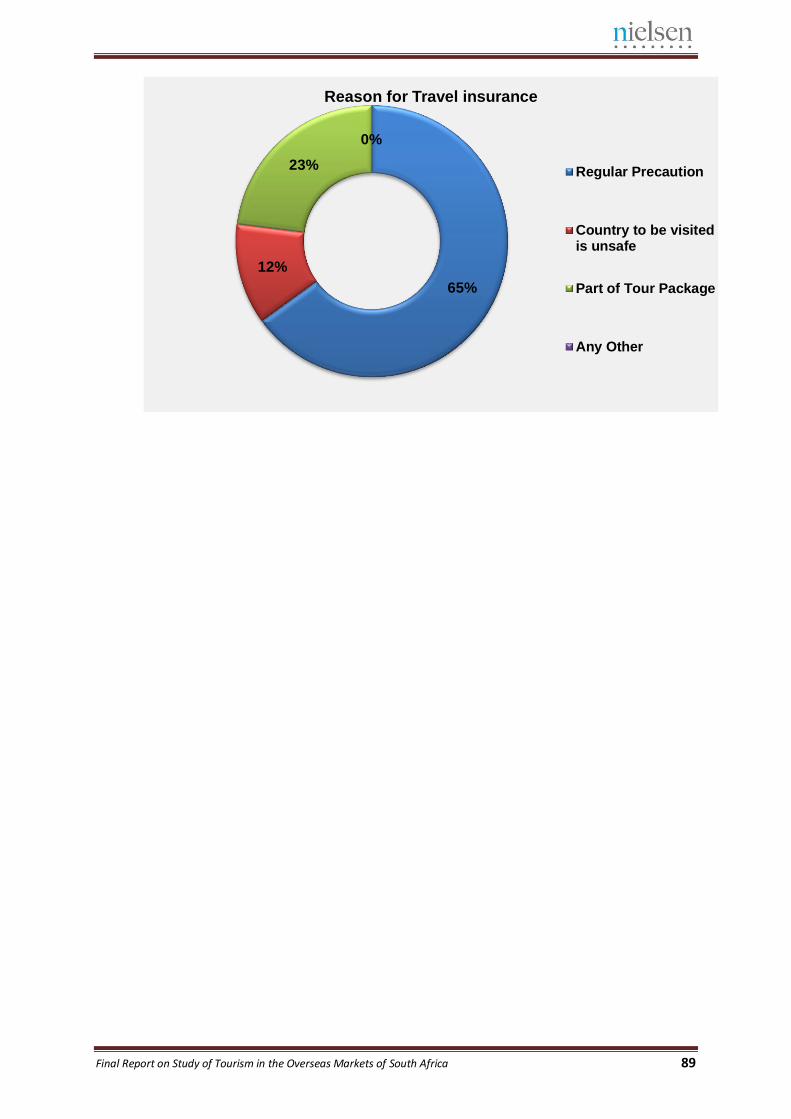
Final Report on Study of Tourism in the Overseas Markets of South Africa 89
65%
12%
23%
0%
Reason for Travel insurance
Regular Precaution
Country to be visitedis unsafe
Part of Tour Package
Any Other
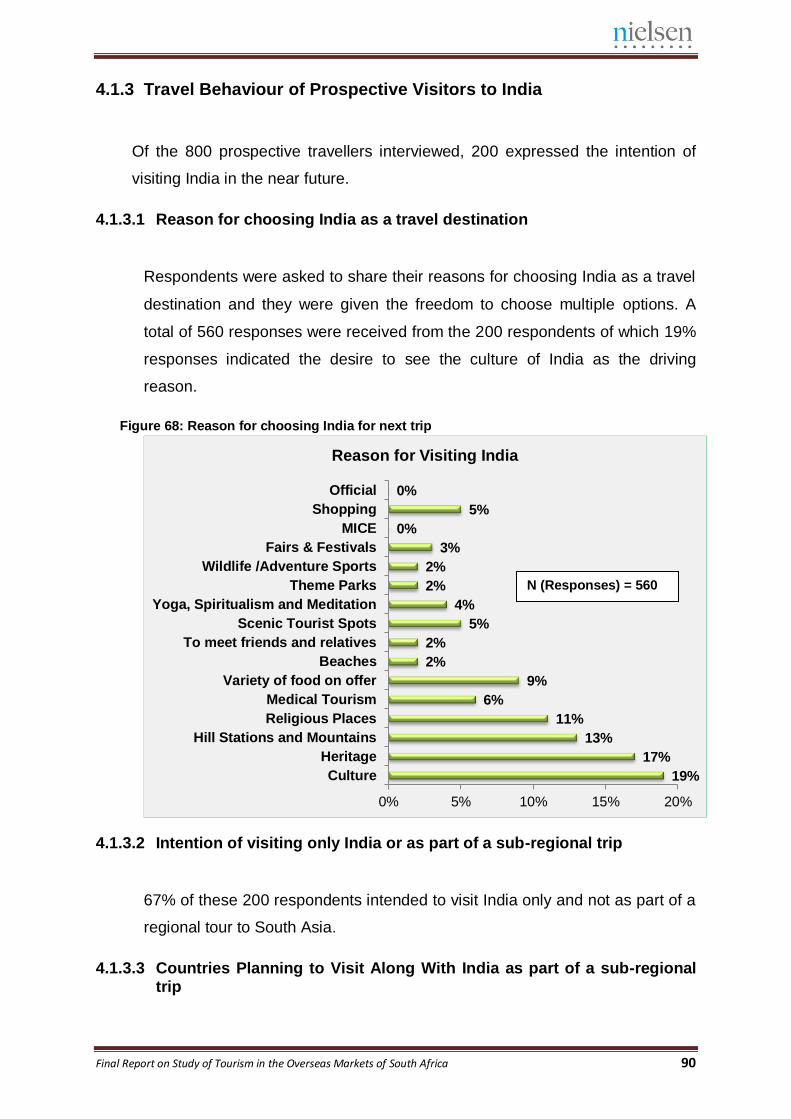
Final Report on Study of Tourism in the Overseas Markets of South Africa 90
4.1.3 Travel Behaviour of Prospective Visitors to India
Of the 800 prospective travellers interviewed, 200 expressed the intention of
visiting India in the near future.
4.1.3.1 Reason for choosing India as a travel destination
Respondents were asked to share their reasons for choosing India as a travel
destination and they were given the freedom to choose multiple options. A
total of 560 responses were received from the 200 respondents of which 19%
responses indicated the desire to see the culture of India as the driving
reason.
Figure 68: Reason for choosing India for next trip
4.1.3.2 Intention of visiting only India or as part of a sub-regional trip
67% of these 200 respondents intended to visit India only and not as part of a
regional tour to South Asia.
4.1.3.3 Countries Planning to Visit Along With India as part of a sub-regional trip
19%
17%
13%
11%
6%
9%
2%
2%
5%
4%
2%
2%
3%
0%
5%
0%
0% 5% 10% 15% 20%
Culture
Heritage
Hill Stations and Mountains
Religious Places
Medical Tourism
Variety of food on offer
Beaches
To meet friends and relatives
Scenic Tourist Spots
Yoga, Spiritualism and Meditation
Theme Parks
Wildlife /Adventure Sports
Fairs & Festivals
MICE
Shopping
Official
Reason for Visiting India
N (Responses) = 560
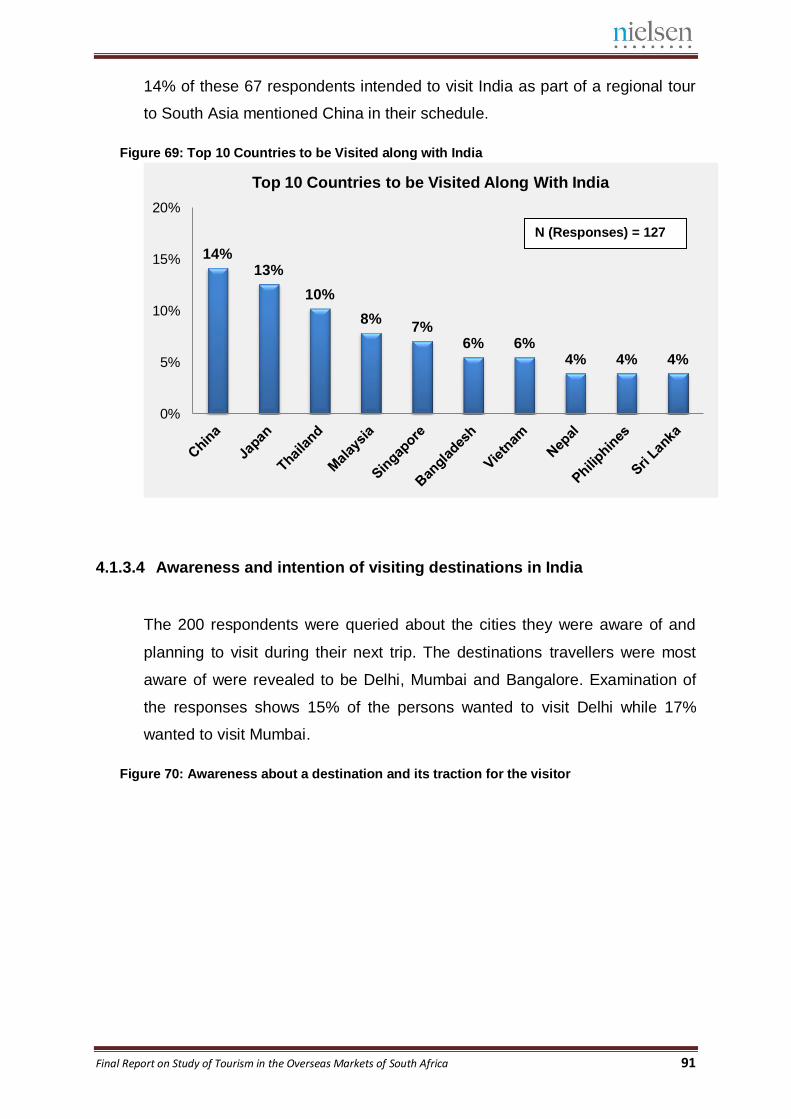
Final Report on Study of Tourism in the Overseas Markets of South Africa 91
14% of these 67 respondents intended to visit India as part of a regional tour
to South Asia mentioned China in their schedule.
Figure 69: Top 10 Countries to be Visited along with India
4.1.3.4 Awareness and intention of visiting destinations in India
The 200 respondents were queried about the cities they were aware of and
planning to visit during their next trip. The destinations travellers were most
aware of were revealed to be Delhi, Mumbai and Bangalore. Examination of
the responses shows 15% of the persons wanted to visit Delhi while 17%
wanted to visit Mumbai.
Figure 70: Awareness about a destination and its traction for the visitor
14% 13%
10%
8% 7%
6% 6% 4% 4% 4%
0%
5%
10%
15%
20%
Top 10 Countries to be Visited Along With India
N (Responses) = 127
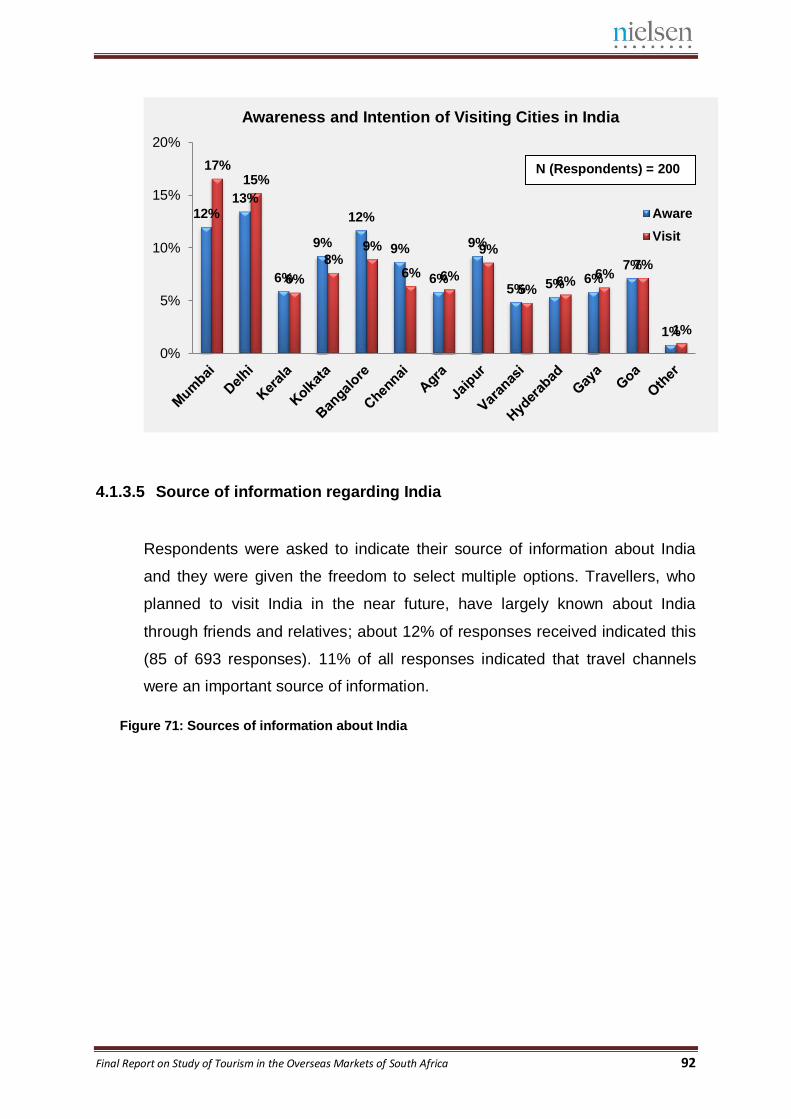
Final Report on Study of Tourism in the Overseas Markets of South Africa 92
4.1.3.5 Source of information regarding India
Respondents were asked to indicate their source of information about India
and they were given the freedom to select multiple options. Travellers, who
planned to visit India in the near future, have largely known about India
through friends and relatives; about 12% of responses received indicated this
(85 of 693 responses). 11% of all responses indicated that travel channels
were an important source of information.
Figure 71: Sources of information about India
12% 13%
6%
9%
12%
9%
6%
9%
5% 5% 6% 7%
1%
17% 15%
6%
8% 9%
6% 6%
9%
5% 6%
6% 7%
1%
0%
5%
10%
15%
20%
Awareness and Intention of Visiting Cities in India
Aware
Visit
N (Respondents) = 200
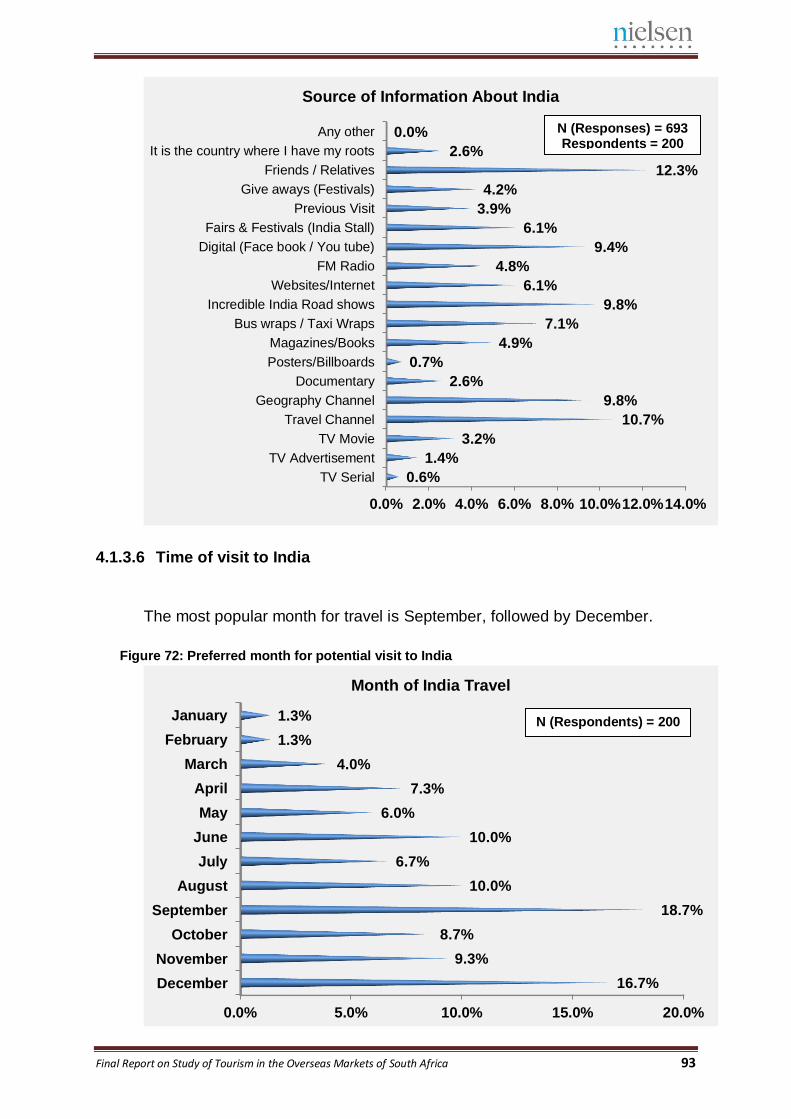
Final Report on Study of Tourism in the Overseas Markets of South Africa 93
4.1.3.6 Time of visit to India
The most popular month for travel is September, followed by December.
Figure 72: Preferred month for potential visit to India
0.0% 2.0% 4.0% 6.0% 8.0% 10.0%12.0%14.0%
TV Serial
TV Advertisement
TV Movie
Travel Channel
Geography Channel
Documentary
Posters/Billboards
Magazines/Books
Bus wraps / Taxi Wraps
Incredible India Road shows
Websites/Internet
FM Radio
Digital (Face book / You tube)
Fairs & Festivals (India Stall)
Previous Visit
Give aways (Festivals)
Friends / Relatives
It is the country where I have my roots
Any other
0.6%
1.4%
3.2%
10.7%
9.8%
2.6%
0.7%
4.9%
7.1%
9.8%
6.1%
4.8%
9.4%
6.1%
3.9%
4.2%
12.3%
2.6%
0.0%
Source of Information About India
0.0% 5.0% 10.0% 15.0% 20.0%
December
November
October
September
August
July
June
May
April
March
February
January
16.7%
9.3%
8.7%
18.7%
10.0%
6.7%
10.0%
6.0%
7.3%
4.0%
1.3%
1.3%
Month of India Travel
N (Responses) = 693 Respondents = 200
N (Respondents) = 200
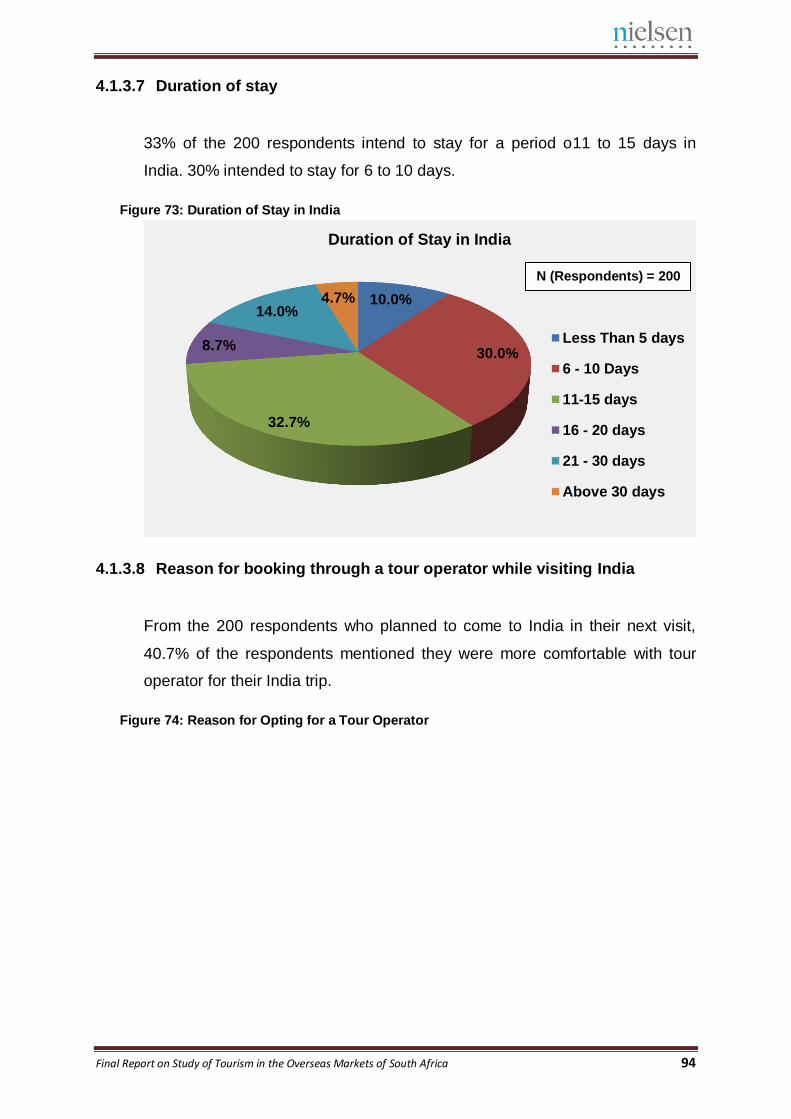
Final Report on Study of Tourism in the Overseas Markets of South Africa 94
4.1.3.7 Duration of stay
33% of the 200 respondents intend to stay for a period o11 to 15 days in
India. 30% intended to stay for 6 to 10 days.
Figure 73: Duration of Stay in India
4.1.3.8 Reason for booking through a tour operator while visiting India
From the 200 respondents who planned to come to India in their next visit,
40.7% of the respondents mentioned they were more comfortable with tour
operator for their India trip.
Figure 74: Reason for Opting for a Tour Operator
10.0%
30.0%
32.7%
8.7%
14.0% 4.7%
Duration of Stay in India
Less Than 5 days
6 - 10 Days
11-15 days
16 - 20 days
21 - 30 days
Above 30 days
N (Respondents) = 200
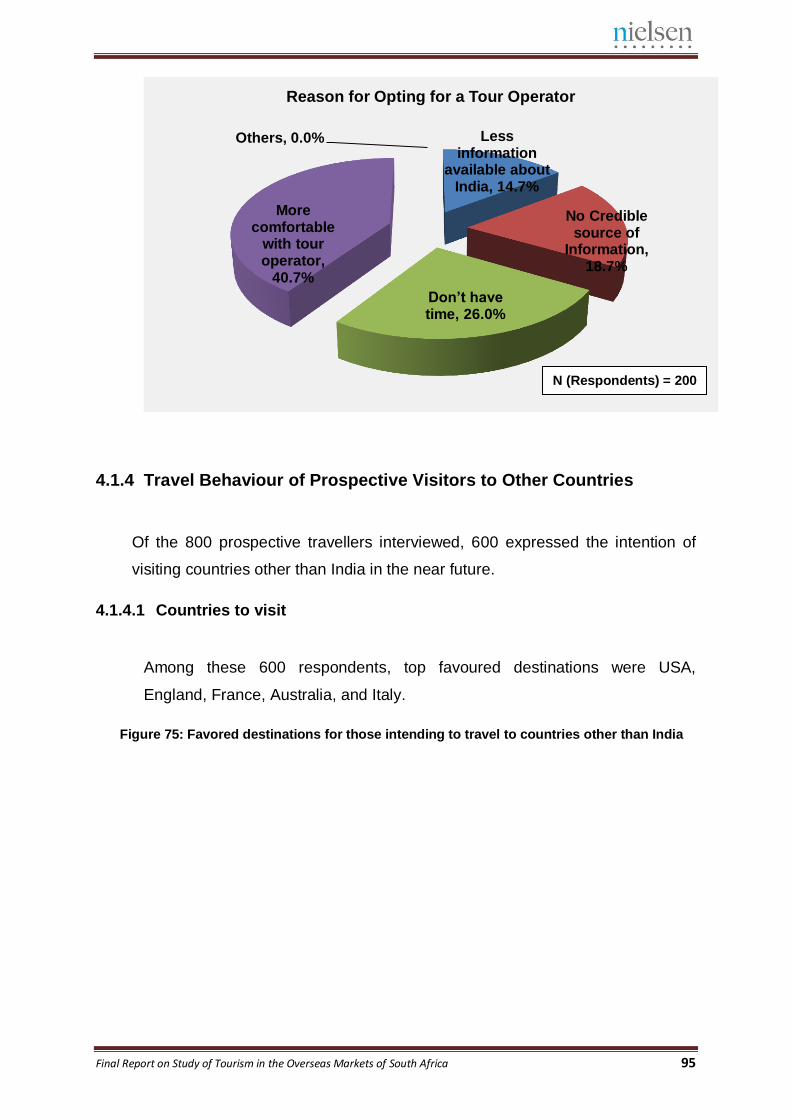
Final Report on Study of Tourism in the Overseas Markets of South Africa 95
4.1.4 Travel Behaviour of Prospective Visitors to Other Countries
Of the 800 prospective travellers interviewed, 600 expressed the intention of
visiting countries other than India in the near future.
4.1.4.1 Countries to visit
Among these 600 respondents, top favoured destinations were USA,
England, France, Australia, and Italy.
Figure 75: Favored destinations for those intending to travel to countries other than India
Less information
available about India, 14.7%
No Credible source of
Information, 18.7%
Don’t have time, 26.0%
More comfortable
with tour operator,
40.7%
Others, 0.0%
Reason for Opting for a Tour Operator
N (Respondents) = 200
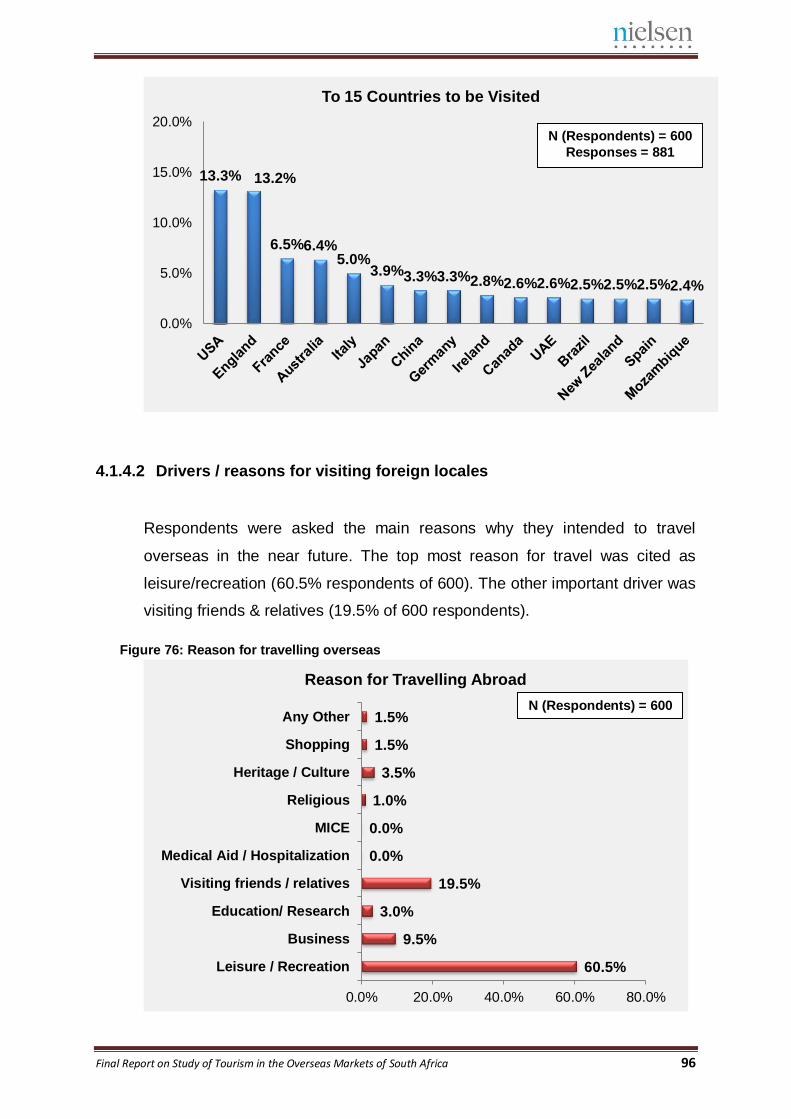
Final Report on Study of Tourism in the Overseas Markets of South Africa 96
4.1.4.2 Drivers / reasons for visiting foreign locales
Respondents were asked the main reasons why they intended to travel
overseas in the near future. The top most reason for travel was cited as
leisure/recreation (60.5% respondents of 600). The other important driver was
visiting friends & relatives (19.5% of 600 respondents).
Figure 76: Reason for travelling overseas
13.3% 13.2%
6.5% 6.4% 5.0%
3.9% 3.3% 3.3% 2.8% 2.6% 2.6% 2.5% 2.5% 2.5% 2.4%
0.0%
5.0%
10.0%
15.0%
20.0%
To 15 Countries to be Visited
60.5%
9.5%
3.0%
19.5%
0.0%
0.0%
1.0%
3.5%
1.5%
1.5%
0.0% 20.0% 40.0% 60.0% 80.0%
Leisure / Recreation
Business
Education/ Research
Visiting friends / relatives
Medical Aid / Hospitalization
MICE
Religious
Heritage / Culture
Shopping
Any Other
Reason for Travelling Abroad
N (Respondents) = 600
Responses = 881
N (Respondents) = 600
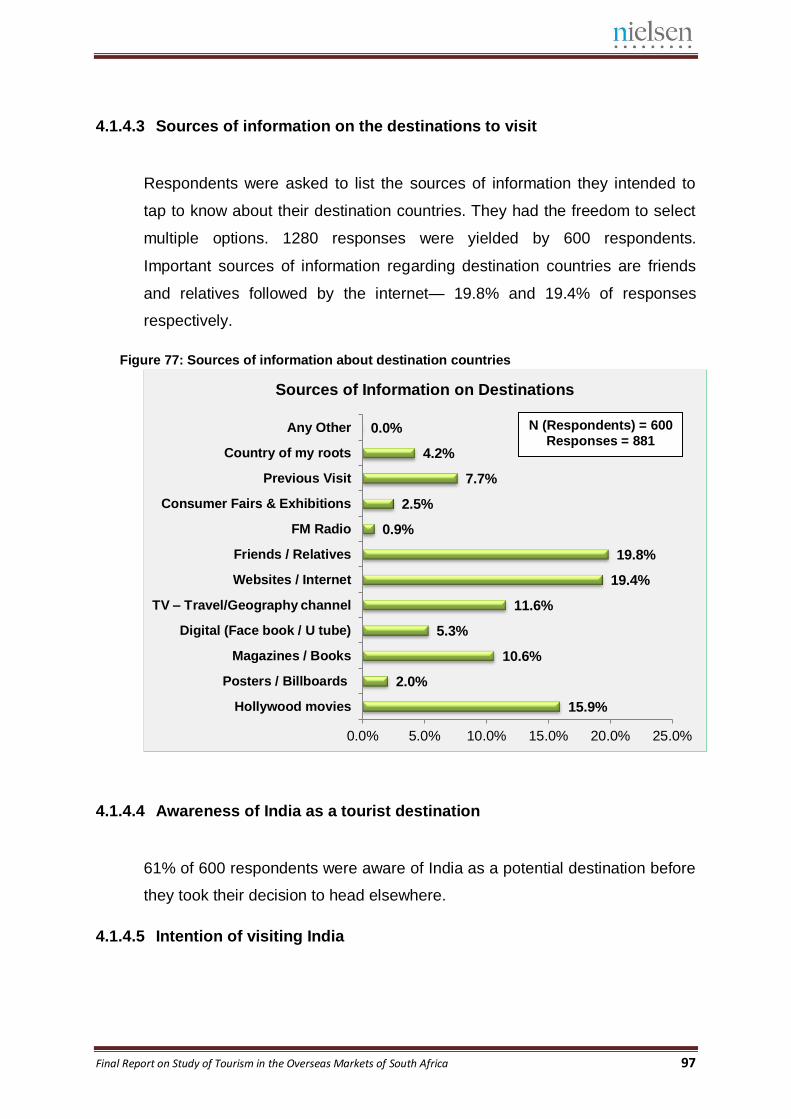
Final Report on Study of Tourism in the Overseas Markets of South Africa 97
4.1.4.3 Sources of information on the destinations to visit
Respondents were asked to list the sources of information they intended to
tap to know about their destination countries. They had the freedom to select
multiple options. 1280 responses were yielded by 600 respondents.
Important sources of information regarding destination countries are friends
and relatives followed by the internet— 19.8% and 19.4% of responses
respectively.
Figure 77: Sources of information about destination countries
4.1.4.4 Awareness of India as a tourist destination
61% of 600 respondents were aware of India as a potential destination before
they took their decision to head elsewhere.
4.1.4.5 Intention of visiting India
15.9%
2.0%
10.6%
5.3%
11.6%
19.4%
19.8%
0.9%
2.5%
7.7%
4.2%
0.0%
0.0% 5.0% 10.0% 15.0% 20.0% 25.0%
Hollywood movies
Posters / Billboards
Magazines / Books
Digital (Face book / U tube)
TV – Travel/Geography channel
Websites / Internet
Friends / Relatives
FM Radio
Consumer Fairs & Exhibitions
Previous Visit
Country of my roots
Any Other
Sources of Information on Destinations
N (Respondents) = 600 Responses = 881
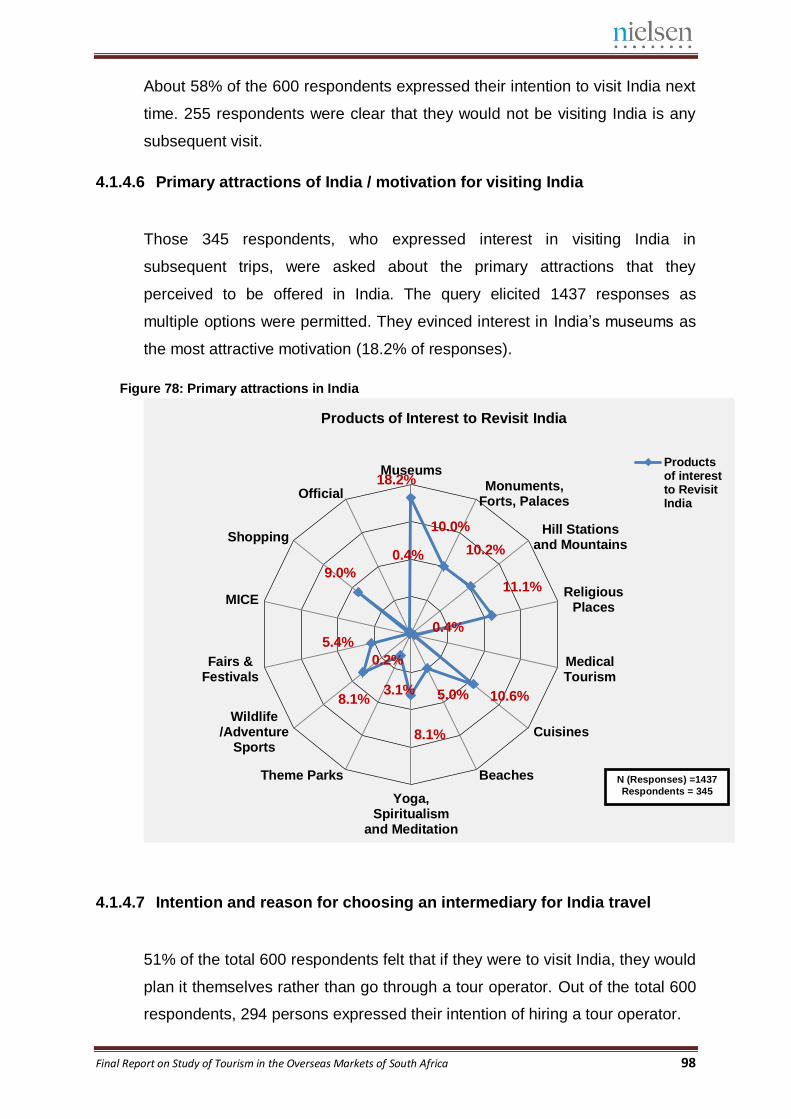
Final Report on Study of Tourism in the Overseas Markets of South Africa 98
About 58% of the 600 respondents expressed their intention to visit India next
time. 255 respondents were clear that they would not be visiting India is any
subsequent visit.
4.1.4.6 Primary attractions of India / motivation for visiting India
Those 345 respondents, who expressed interest in visiting India in
subsequent trips, were asked about the primary attractions that they
perceived to be offered in India. The query elicited 1437 responses as
multiple options were permitted. They evinced interest in India’s museums as
the most attractive motivation (18.2% of responses).
Figure 78: Primary attractions in India
4.1.4.7 Intention and reason for choosing an intermediary for India travel
51% of the total 600 respondents felt that if they were to visit India, they would
plan it themselves rather than go through a tour operator. Out of the total 600
respondents, 294 persons expressed their intention of hiring a tour operator.
18.2%
10.0%
10.2%
11.1%
0.4%
10.6% 5.0%
8.1%
3.1% 8.1%
5.4%
0.2%
9.0%
0.4%
MuseumsMonuments,
Forts, Palaces
Hill Stationsand Mountains
ReligiousPlaces
MedicalTourism
Cuisines
Beaches
Yoga,Spiritualism
and Meditation
Theme Parks
Wildlife/Adventure
Sports
Fairs &Festivals
MICE
Shopping
Official
Products of Interest to Revisit India
Productsof interestto RevisitIndia
N (Responses) =1437
Respondents = 345
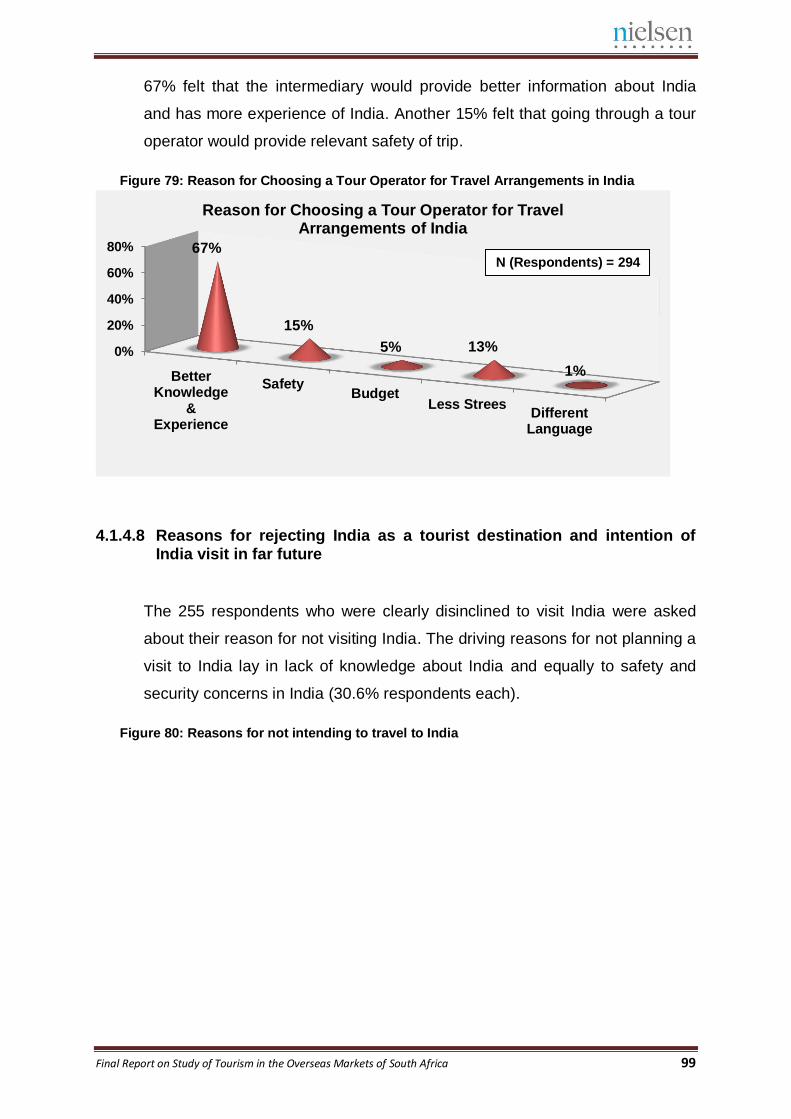
Final Report on Study of Tourism in the Overseas Markets of South Africa 99
67% felt that the intermediary would provide better information about India
and has more experience of India. Another 15% felt that going through a tour
operator would provide relevant safety of trip.
Figure 79: Reason for Choosing a Tour Operator for Travel Arrangements in India
4.1.4.8 Reasons for rejecting India as a tourist destination and intention of India visit in far future
The 255 respondents who were clearly disinclined to visit India were asked
about their reason for not visiting India. The driving reasons for not planning a
visit to India lay in lack of knowledge about India and equally to safety and
security concerns in India (30.6% respondents each).
Figure 80: Reasons for not intending to travel to India
0%
20%
40%
60%
80%
BetterKnowledge
&Experience
SafetyBudget
Less StreesDifferent
Language
67%
15%
5% 13%
1%
Reason for Choosing a Tour Operator for Travel Arrangements of India
N (Respondents) = 294
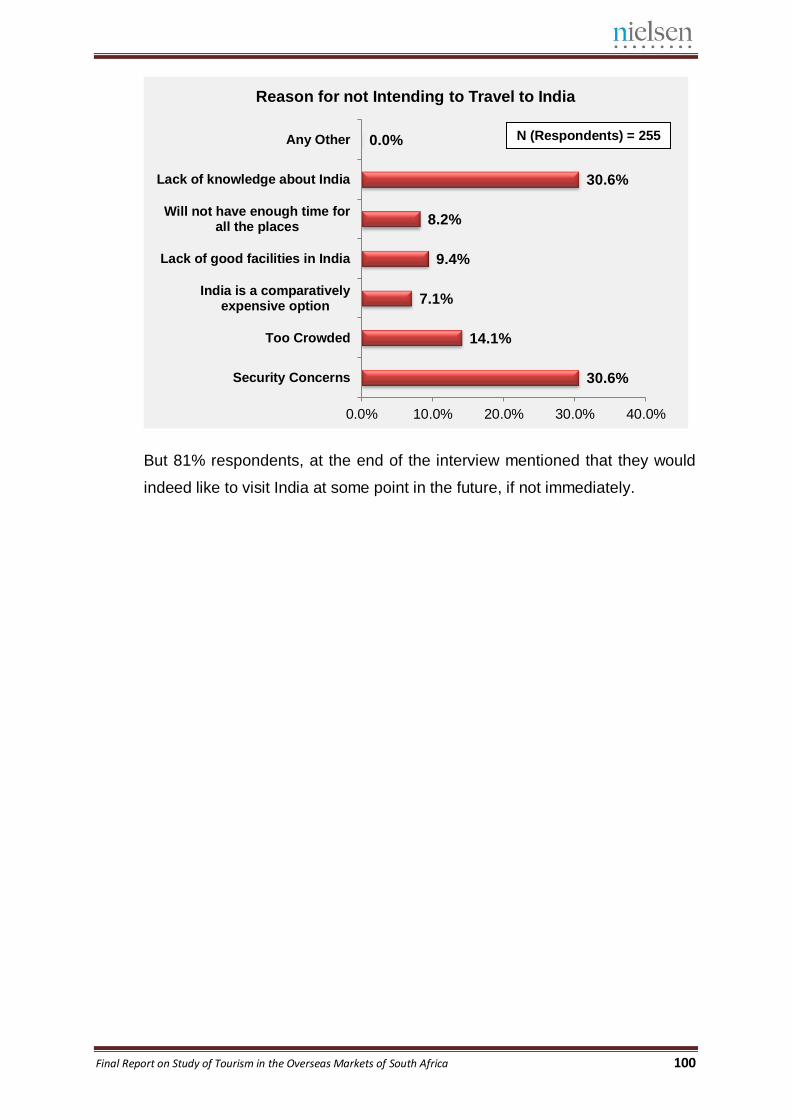
Final Report on Study of Tourism in the Overseas Markets of South Africa 100
But 81% respondents, at the end of the interview mentioned that they would
indeed like to visit India at some point in the future, if not immediately.
30.6%
14.1%
7.1%
9.4%
8.2%
30.6%
0.0%
0.0% 10.0% 20.0% 30.0% 40.0%
Security Concerns
Too Crowded
India is a comparativelyexpensive option
Lack of good facilities in India
Will not have enough time forall the places
Lack of knowledge about India
Any Other
Reason for not Intending to Travel to India
N (Respondents) = 255
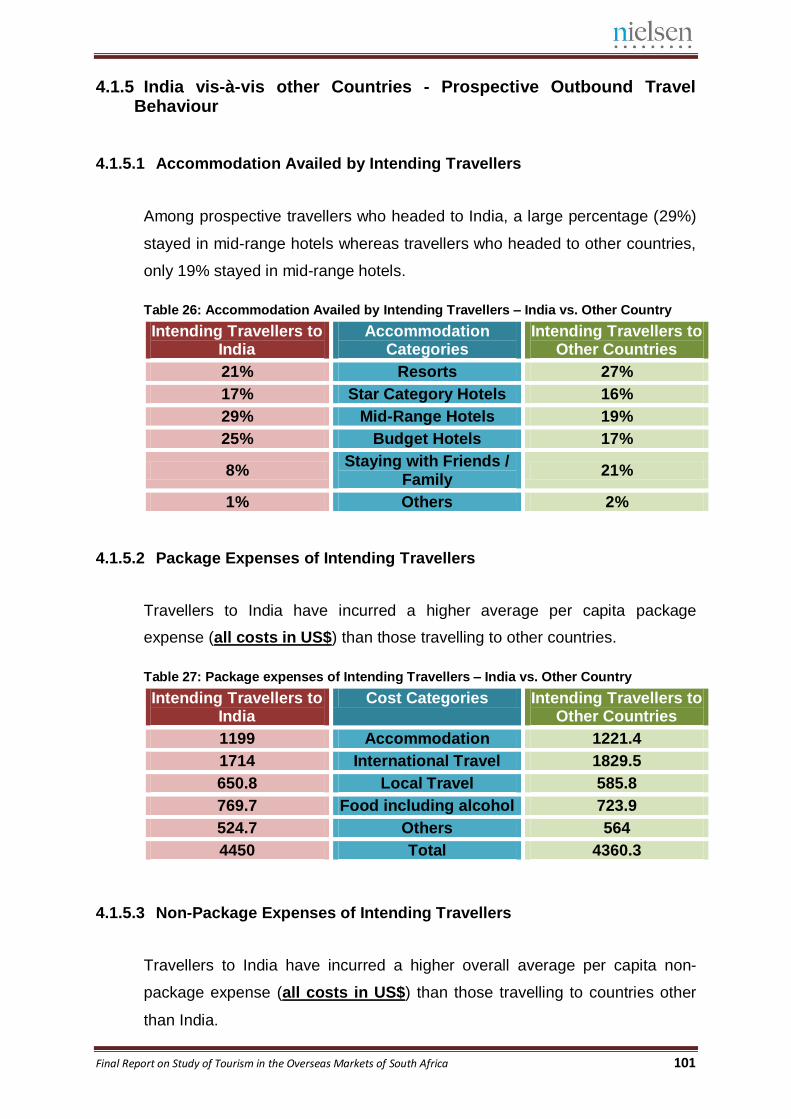
Final Report on Study of Tourism in the Overseas Markets of South Africa 101
4.1.5 India vis-à-vis other Countries - Prospective Outbound Travel Behaviour
4.1.5.1 Accommodation Availed by Intending Travellers
Among prospective travellers who headed to India, a large percentage (29%)
stayed in mid-range hotels whereas travellers who headed to other countries,
only 19% stayed in mid-range hotels.
Table 26: Accommodation Availed by Intending Travellers – India vs. Other Country
Intending Travellers to India
Accommodation Categories
Intending Travellers to Other Countries
21% Resorts 27%
17% Star Category Hotels 16%
29% Mid-Range Hotels 19%
25% Budget Hotels 17%
8% Staying with Friends /
Family 21%
1% Others 2%
4.1.5.2 Package Expenses of Intending Travellers
Travellers to India have incurred a higher average per capita package
expense (all costs in US$) than those travelling to other countries.
Table 27: Package expenses of Intending Travellers – India vs. Other Country
Intending Travellers to India
Cost Categories Intending Travellers to Other Countries
1199 Accommodation 1221.4
1714 International Travel 1829.5
650.8 Local Travel 585.8
769.7 Food including alcohol 723.9
524.7 Others 564
4450 Total 4360.3
4.1.5.3 Non-Package Expenses of Intending Travellers
Travellers to India have incurred a higher overall average per capita non-
package expense (all costs in US$) than those travelling to countries other
than India.
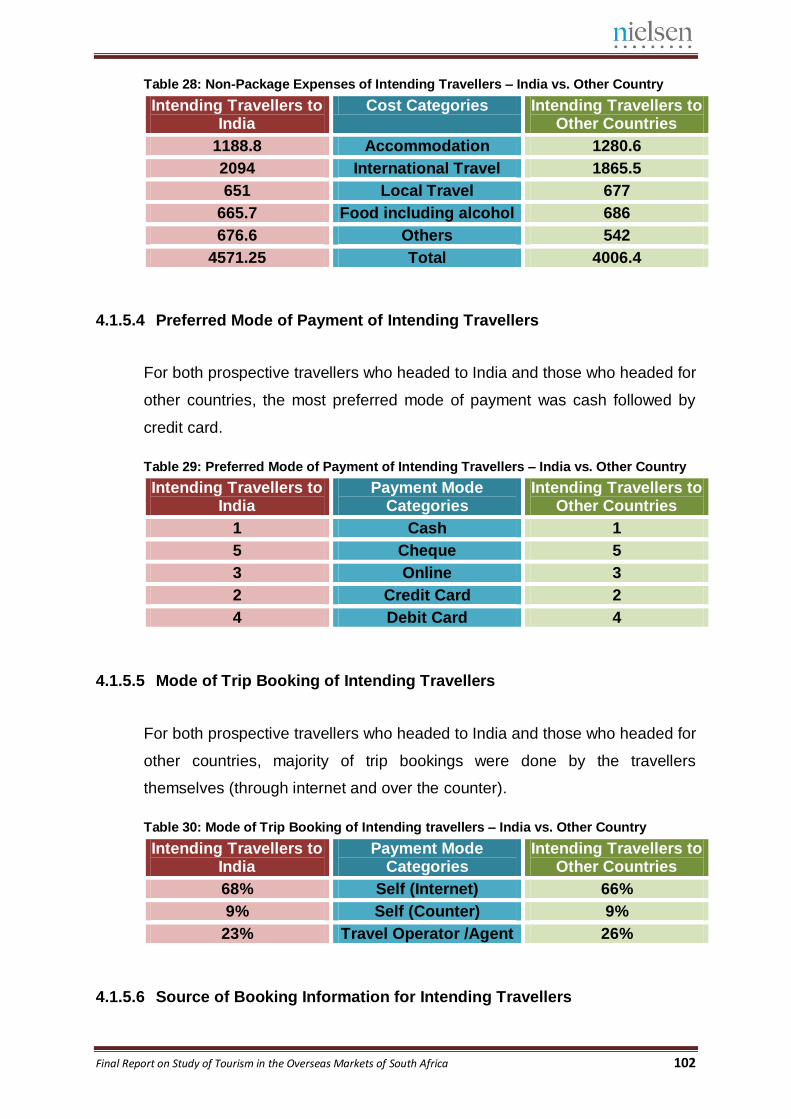
Final Report on Study of Tourism in the Overseas Markets of South Africa 102
Table 28: Non-Package Expenses of Intending Travellers – India vs. Other Country
Intending Travellers to India
Cost Categories Intending Travellers to Other Countries
1188.8 Accommodation 1280.6
2094 International Travel 1865.5
651 Local Travel 677
665.7 Food including alcohol 686
676.6 Others 542
4571.25 Total 4006.4
4.1.5.4 Preferred Mode of Payment of Intending Travellers
For both prospective travellers who headed to India and those who headed for
other countries, the most preferred mode of payment was cash followed by
credit card.
Table 29: Preferred Mode of Payment of Intending Travellers – India vs. Other Country
Intending Travellers to India
Payment Mode Categories
Intending Travellers to Other Countries
1 Cash 1
5 Cheque 5
3 Online 3
2 Credit Card 2
4 Debit Card 4
4.1.5.5 Mode of Trip Booking of Intending Travellers
For both prospective travellers who headed to India and those who headed for
other countries, majority of trip bookings were done by the travellers
themselves (through internet and over the counter).
Table 30: Mode of Trip Booking of Intending travellers – India vs. Other Country
Intending Travellers to India
Payment Mode Categories
Intending Travellers to Other Countries
68% Self (Internet) 66%
9% Self (Counter) 9%
23% Travel Operator /Agent 26%
4.1.5.6 Source of Booking Information for Intending Travellers
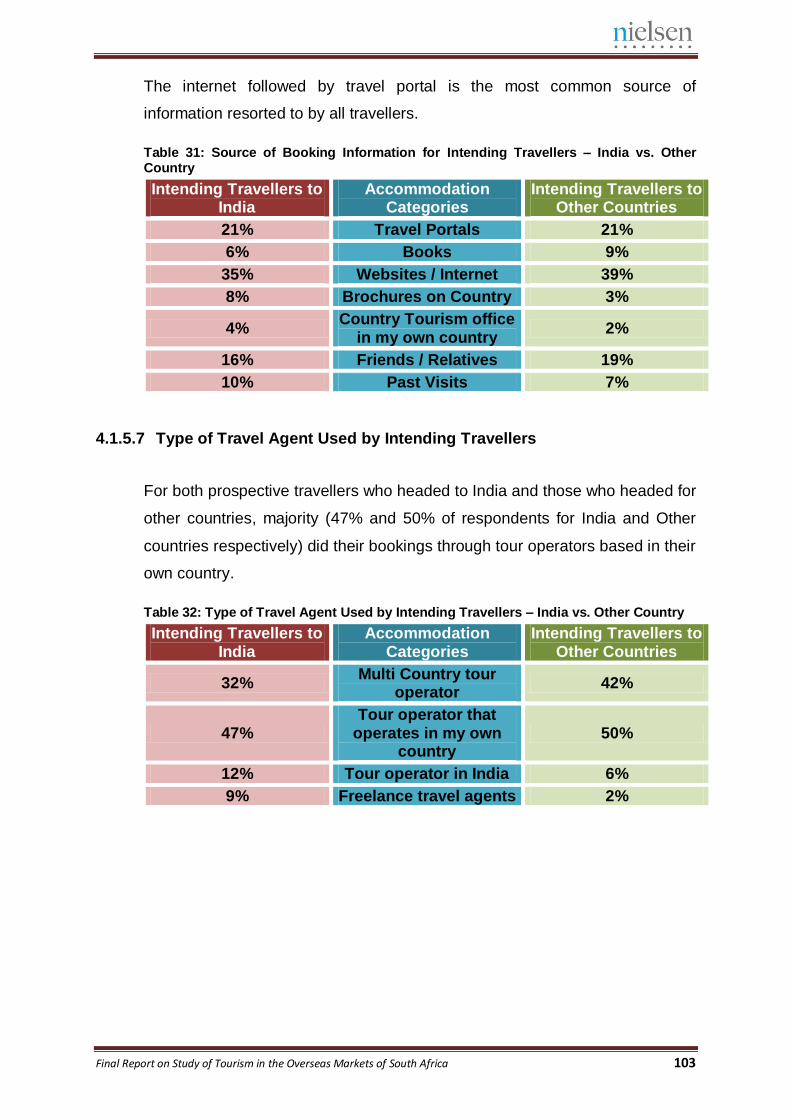
Final Report on Study of Tourism in the Overseas Markets of South Africa 103
The internet followed by travel portal is the most common source of
information resorted to by all travellers.
Table 31: Source of Booking Information for Intending Travellers – India vs. Other Country
Intending Travellers to India
Accommodation Categories
Intending Travellers to Other Countries
21% Travel Portals 21%
6% Books 9%
35% Websites / Internet 39%
8% Brochures on Country 3%
4% Country Tourism office
in my own country 2%
16% Friends / Relatives 19%
10% Past Visits 7%
4.1.5.7 Type of Travel Agent Used by Intending Travellers
For both prospective travellers who headed to India and those who headed for
other countries, majority (47% and 50% of respondents for India and Other
countries respectively) did their bookings through tour operators based in their
own country.
Table 32: Type of Travel Agent Used by Intending Travellers – India vs. Other Country
Intending Travellers to India
Accommodation Categories
Intending Travellers to Other Countries
32% Multi Country tour
operator 42%
47% Tour operator that
operates in my own country
50%
12% Tour operator in India 6%
9% Freelance travel agents 2%
Final Report on Study of Tourism in the Overseas Markets of South Africa 104
Chapter Five
India Tourism Office Findings
5.1 India Tourism Office
5.1.1 India Tourism Activity Response of Past Travellers
The survey had specific focus on the impact of the promotional activities of
India Tourism Office in South Africa. Past travellers to India were asked to
share their opinions on various aspects of the India Tourism Office.
5.1.1.1 Awareness of India tourism office promotions and advertisements
40% of the 600 travellers who had been to India in the past were aware of the
existence of an India Tourism Office in their country and out of them 67%
were also aware about its promotional campaigns. They had learnt of India
Tourism Offices from promotional campaigns disseminated through road
shows (27.5% of 160 respondents), Seminar/ workshops (22.5% of
respondents), Fairs (21%) and TV advertisements (16% of 160 respondents).
Figure 81: Source of information about India tourism office
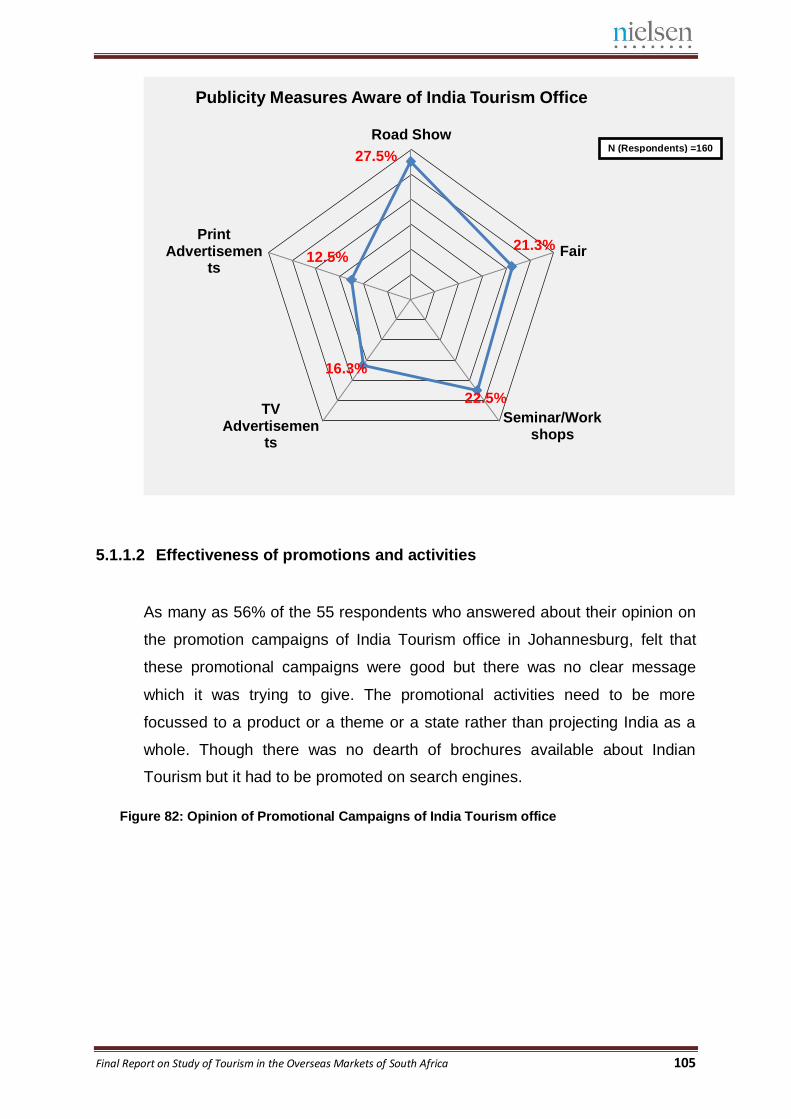
Final Report on Study of Tourism in the Overseas Markets of South Africa 105
5.1.1.2 Effectiveness of promotions and activities
As many as 56% of the 55 respondents who answered about their opinion on
the promotion campaigns of India Tourism office in Johannesburg, felt that
these promotional campaigns were good but there was no clear message
which it was trying to give. The promotional activities need to be more
focussed to a product or a theme or a state rather than projecting India as a
whole. Though there was no dearth of brochures available about Indian
Tourism but it had to be promoted on search engines.
Figure 82: Opinion of Promotional Campaigns of India Tourism office
27.5%
21.3%
22.5%
16.3%
12.5%
Road Show
Fair
Seminar/Workshops
TVAdvertisemen
ts
PrintAdvertisemen
ts
Publicity Measures Aware of India Tourism Office
N (Respondents) =160
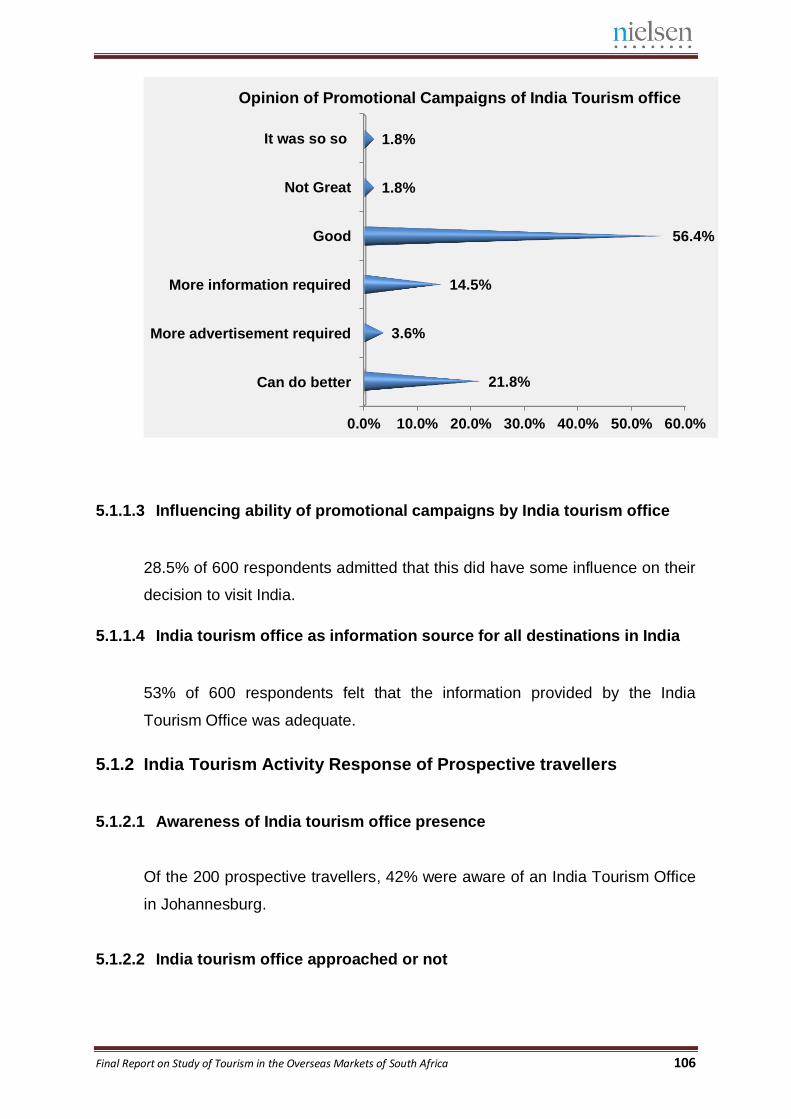
Final Report on Study of Tourism in the Overseas Markets of South Africa 106
5.1.1.3 Influencing ability of promotional campaigns by India tourism office
28.5% of 600 respondents admitted that this did have some influence on their
decision to visit India.
5.1.1.4 India tourism office as information source for all destinations in India
53% of 600 respondents felt that the information provided by the India
Tourism Office was adequate.
5.1.2 India Tourism Activity Response of Prospective travellers
5.1.2.1 Awareness of India tourism office presence
Of the 200 prospective travellers, 42% were aware of an India Tourism Office
in Johannesburg.
5.1.2.2 India tourism office approached or not
0.0% 10.0% 20.0% 30.0% 40.0% 50.0% 60.0%
Can do better
More advertisement required
More information required
Good
Not Great
It was so so
21.8%
3.6%
14.5%
56.4%
1.8%
1.8%
Opinion of Promotional Campaigns of India Tourism office
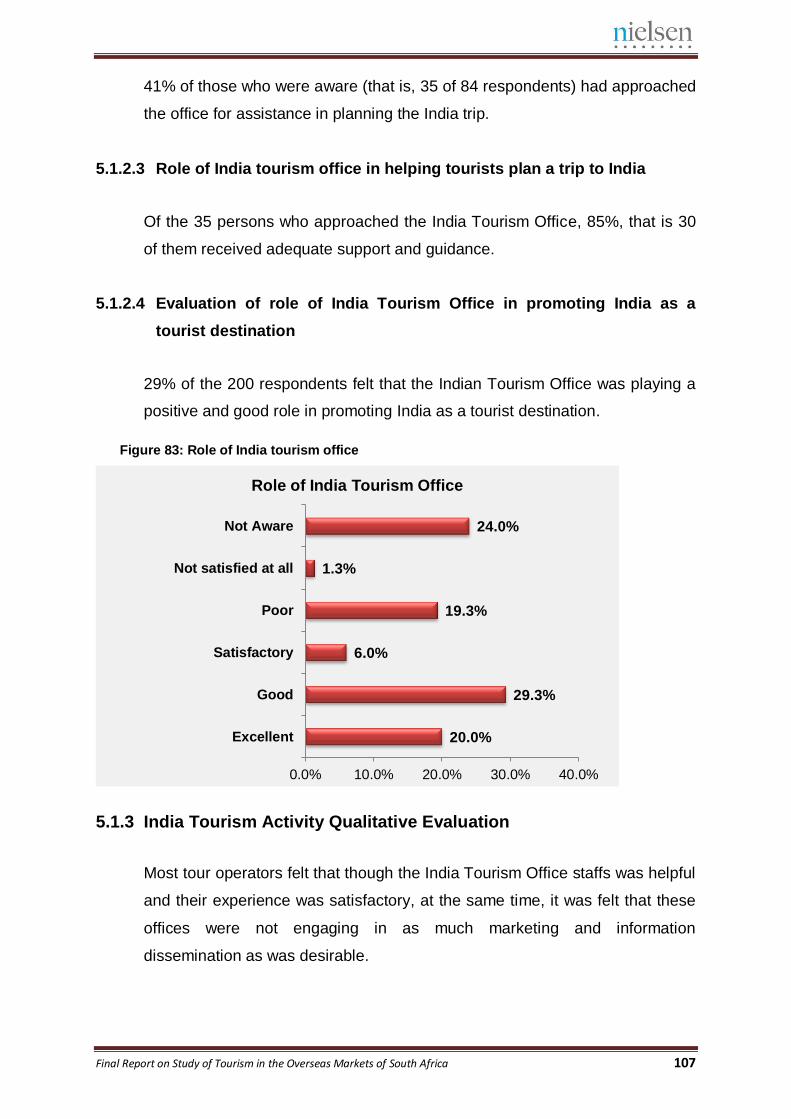
Final Report on Study of Tourism in the Overseas Markets of South Africa 107
41% of those who were aware (that is, 35 of 84 respondents) had approached
the office for assistance in planning the India trip.
5.1.2.3 Role of India tourism office in helping tourists plan a trip to India
Of the 35 persons who approached the India Tourism Office, 85%, that is 30
of them received adequate support and guidance.
5.1.2.4 Evaluation of role of India Tourism Office in promoting India as a
tourist destination
29% of the 200 respondents felt that the Indian Tourism Office was playing a
positive and good role in promoting India as a tourist destination.
Figure 83: Role of India tourism office
5.1.3 India Tourism Activity Qualitative Evaluation
Most tour operators felt that though the India Tourism Office staffs was helpful
and their experience was satisfactory, at the same time, it was felt that these
offices were not engaging in as much marketing and information
dissemination as was desirable.
20.0%
29.3%
6.0%
19.3%
1.3%
24.0%
0.0% 10.0% 20.0% 30.0% 40.0%
Excellent
Good
Satisfactory
Poor
Not satisfied at all
Not Aware
Role of India Tourism Office
Final Report on Study of Tourism in the Overseas Markets of South Africa 108
They felt that while the India Tourism Offices were participating in trade fairs
and road shows and generating publicity material in the form of brochures etc,
there was a dearth of focused marketing communication collateral that
engages with and sends out clear messages to the travel agents and tour
operators who are critical intermediaries in the trade. The tour operators also
expressed that there was no sharing of information, no get together or any
meeting with the Indian tourism office happening. No communication on any
developments in tourism in India is happening currently between India
Tourism Office and agents. The tour operators feel the need for organising
some Indian event/ consumer evening wherein through travel agents, the
local community is called and knowledge about India is shared and
information on Products are presented.
One tour operator said “If we ask for high resolution photographs of
destinations/places we do not get as it is not available. The current pictures
are dull and not attractive and so we cannot put in our brochures when we sell
to customers. As we have to survive and carry on our business we organise
the same at our end without any support from Indian tourism office. It is not
interactive with trade”.
Certain recommendations came in from the trade on thrust areas for the
future. These included:
1. Information about modern India & New India. Message that India is not
a beach destination neither it is for kids
2. More communication with trade. Regular updates about events and
activities
3. Advance notice and update about India Tourism activities so that trade
can also put in their bit and prepare
4. Offering more support in terms of promotional material and campaigns,
more enrolment with trade;
5. Increased marketing support, provide training to the front desk/ office of
the trade;
6. Help in visa- and passport-related issues and regular notifications to
trade regarding any change in visa rules and regulations
7. Search engine, advertisement support for trade;
Final Report on Study of Tourism in the Overseas Markets of South Africa 109
8. Attending press conferences and seminars and interacting with tour
operators and retail agents on a regular basis;
9. Educate agents/ trade about our products i.e. write ups, latest trends in
India, change the theme every time
10. Provide small ads but be more focussed on one product;
11. Placing more ads in travel magazines and newspapers; / joint
advertisement and support
12. Sorting out visa issues, for instance the photo dimensions required.
Final Report on Study of Tourism in the Overseas Markets of South Africa 110
Chapter Six
Future Outbound travel Projections
6.1 Projections for Future Outbound Travel
6.1.1 Method of Forecasting
To arrive at the future trends of FTA’s we have considered three possible
approaches i.e. “Most Likely Approach” which is the approach based on the
current growth trends- we have considered a compounded average growth
rate (CAGR) of 2.4% for the period 2006 to 2015. “Optimistic Approach”
assuming that all factors considered for the forecast grow at a constant rate-
we have taken the rate at 5%. “Pessimistic Approach” - assuming the
possibility that any future calamity can affect the factors considered- we have
taken the rate as 1.5%. These approaches are captured in the forecast
illustration below.
6.1.2 Forecast of Outbound Tourists from South Africa
Figure 84: Present & Forecasted FTAs from South Africa
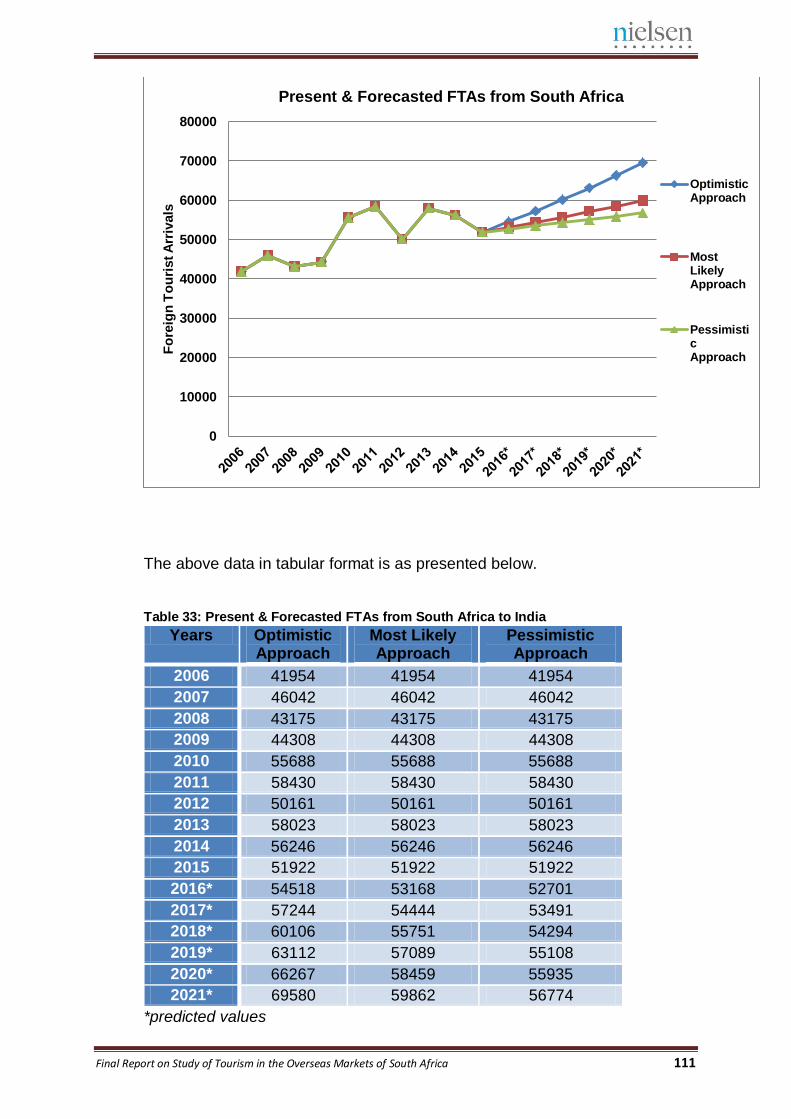
Final Report on Study of Tourism in the Overseas Markets of South Africa 111
The above data in tabular format is as presented below.
Table 33: Present & Forecasted FTAs from South Africa to India
Years Optimistic Approach
Most Likely Approach
Pessimistic Approach
2006 41954 41954 41954
2007 46042 46042 46042
2008 43175 43175 43175
2009 44308 44308 44308
2010 55688 55688 55688
2011 58430 58430 58430
2012 50161 50161 50161
2013 58023 58023 58023
2014 56246 56246 56246
2015 51922 51922 51922
2016* 54518 53168 52701
2017* 57244 54444 53491
2018* 60106 55751 54294
2019* 63112 57089 55108
2020* 66267 58459 55935
2021* 69580 59862 56774
*predicted values
0
10000
20000
30000
40000
50000
60000
70000
80000
Fo
reig
n T
ou
rist A
rriv
als
Present & Forecasted FTAs from South Africa
OptimisticApproach
MostLikelyApproach
PessimisticApproach
Final Report on Study of Tourism in the Overseas Markets of South Africa 112
Note: To arrive at these figures, the base years considered are 2006 to 2015
(both inclusive).
Please note that these figures were arrived assuming that economic, social
and political conditions of both India and South Africa will remain as it was
during the time period based on which these figures have been projected.
Occurrence of any contingency or event might affect the figures as given
above.
Final Report on Study of Tourism in the Overseas Markets of South Africa 113
Chapter Seven
Conclusion & Way Forward
7.1 Conclusion
Conclusion:
The study of 2000 travellers and tour operators was conducted in the South African
cities of Cape Town, Johannesburg and Durban. These 2000 travellers consisted of
1200 past travellers and 800 prospective travellers. Utmost care was taken so as to
not include NRIs/ PIOs as their responses might have skewed the trend of other
perceptibly impartial travellers in terms of their knowledge of India and reasons for
visiting India. However, it was found out from the study that South Africans are very
of India and they perceive India as a beautiful place with many religious and divine
places and they consider India as a place of culture and heritage. This knowledge of
India stems not only from the colonial ties that both the countries share but also
because of Mahatma Gandhi, as he had spent a part of his life in South Africa and is
revered there for his social activism in that country and India. The top of the mind
impression of India for South Africans is Rajghat, Agra, Jaipur, India Gate and
Mumbai. Also South Africans are more interested in the beaches that India has to
offer, Indian outfits, clothes, jewellery and Bollywood. For the native Africans also
Bollywood is a very attractive draw to come and visit India along with cricket and
football.
This positive impression of India is also dotted with some negative aspects which
primarily do not convert the intention of visiting India to actually visiting India. Some
of the negatives aspects of India, as per the South African travellers are the facet of
crowdedness, poverty & begging, pollution and communication with locals. This
along with an unfounded fear that India is a very big country and something might go
wrong during their trip are factors that make South Africans take a back step from
actually visiting India. This fear is enhanced by the fact that knowledge about the
developments in India is not present amongst many travellers since communication
about the new and developing India is not present amongst the mainstream media.
Final Report on Study of Tourism in the Overseas Markets of South Africa 114
The travellers interviewed mentioned that they preferred to book on their own when
travelling but in case of India, they are more comfortable booking through a tour
operator as they are not sure about India and not sure about what and where they
shall get, so prefer an agent who has experienced India, can tell them about India.
Food, though an issue with many western travellers to India, for South African
travellers food is not an issue as most of them love and like Spicy/masala food.
Most of them have travelled for their vacations during October to December to
destinations like Australia, Canada, Dubai, London, Italy, Vienna, etc. The average
duration for an African for a leisure holiday is 12 to 15 days and the bookings/travel
plans are done 2 to 4 months in advance.
As per the trade, the major destination for Africans is within Africa as well as
Malaysia, Thailand, Vietnam, Bali, Far East. Kenya and Egypt used to be on top
earlier but now due to the situation there it is almost nil. For India, one of the most
important hindrances from travellers is that there is no direct flight. One tour
operators mentioned “The travel for vacations/Leisure to Thailand/Phuket for 7 nights
in 5 star resort including flight shall be 12000 rands vis –a-vis Kerala which shall be
somewhere around 20000 Rands. Hence people opt for Thailand & Phuket and not
India”. The trade also pointed out that there are 2 types of markets – for the native
Africans and the Caucasians. Caucasians prefer Mumbai, Golden Triangle and
Kerala as they are more interested in Yoga, Spiritualism, and Heritage. Because of
no direct flight, either through Dubai or Doha with a stopover, the average duration is
for 8 to 10 days. On the other hand for the Native Africans –want to know about
Gandhi, History, and Architecture.
One tour operator quipped “The repeat travellers prefer Rajasthan, Chennai, Kochi
but the issue here is internal travel. Jaipur - Udaipur flights are no longer there. Only
train, trains are not up to the mark. The other circuit is Udaipur – Nathdwara –
Jodhpur for the ethnic travellers – but here again internal travelling is an issue”. The
internal travel from one city to another in India is not cheap.. The other major issue is
for internal travel in India which is besides being expensive, the baggage allowance
is only 15kg whereas for international its 30 to 40 kg. For every 10 kg of extra bag
USD 30 needs to be paid. The major season for travel from Africa is mainly between
October to January. If one wants to experience EXTREMES then they travel to India.
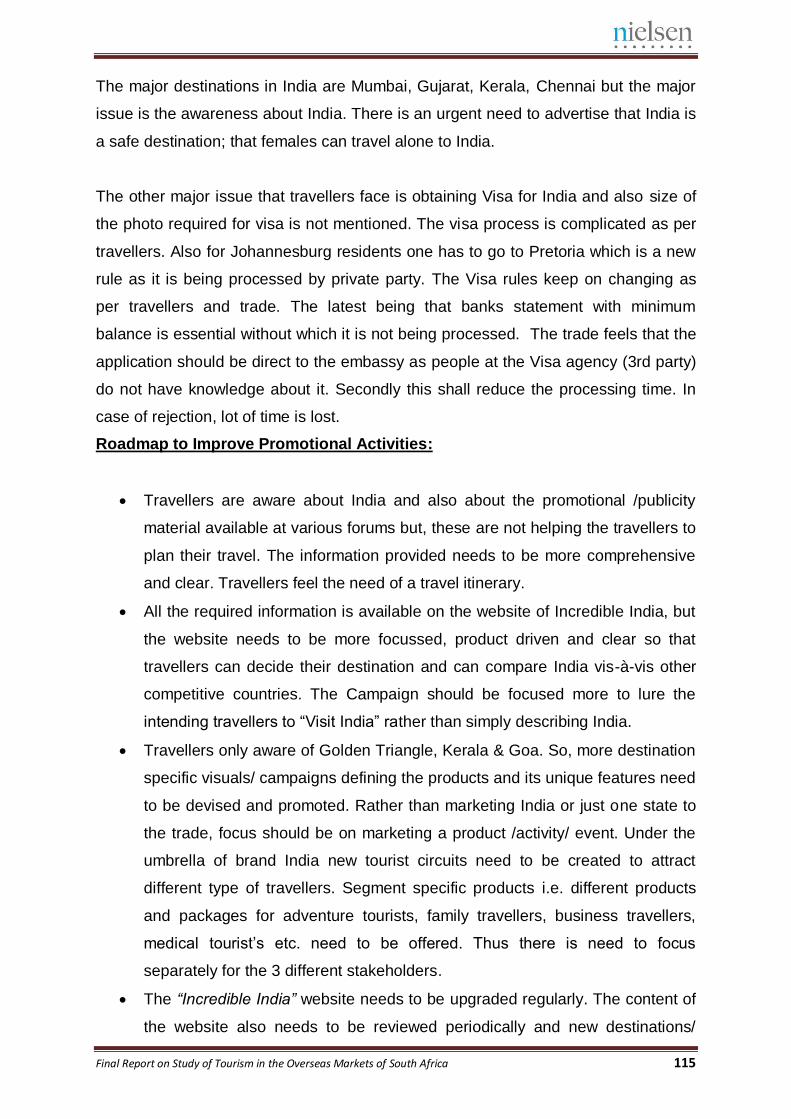
Final Report on Study of Tourism in the Overseas Markets of South Africa 115
The major destinations in India are Mumbai, Gujarat, Kerala, Chennai but the major
issue is the awareness about India. There is an urgent need to advertise that India is
a safe destination; that females can travel alone to India.
The other major issue that travellers face is obtaining Visa for India and also size of
the photo required for visa is not mentioned. The visa process is complicated as per
travellers. Also for Johannesburg residents one has to go to Pretoria which is a new
rule as it is being processed by private party. The Visa rules keep on changing as
per travellers and trade. The latest being that banks statement with minimum
balance is essential without which it is not being processed. The trade feels that the
application should be direct to the embassy as people at the Visa agency (3rd party)
do not have knowledge about it. Secondly this shall reduce the processing time. In
case of rejection, lot of time is lost.
Roadmap to Improve Promotional Activities:
Travellers are aware about India and also about the promotional /publicity
material available at various forums but, these are not helping the travellers to
plan their travel. The information provided needs to be more comprehensive
and clear. Travellers feel the need of a travel itinerary.
All the required information is available on the website of Incredible India, but
the website needs to be more focussed, product driven and clear so that
travellers can decide their destination and can compare India vis-à-vis other
competitive countries. The Campaign should be focused more to lure the
intending travellers to “Visit India” rather than simply describing India.
Travellers only aware of Golden Triangle, Kerala & Goa. So, more destination
specific visuals/ campaigns defining the products and its unique features need
to be devised and promoted. Rather than marketing India or just one state to
the trade, focus should be on marketing a product /activity/ event. Under the
umbrella of brand India new tourist circuits need to be created to attract
different type of travellers. Segment specific products i.e. different products
and packages for adventure tourists, family travellers, business travellers,
medical tourist’s etc. need to be offered. Thus there is need to focus
separately for the 3 different stakeholders.
The “Incredible India” website needs to be upgraded regularly. The content of
the website also needs to be reviewed periodically and new destinations/
Final Report on Study of Tourism in the Overseas Markets of South Africa 116
products/ circuits need to be brought to the knowledge of the travellers.
Promotional campaigns need to highlight the Incredible India web-address
more prominently. There is also a need to increase the visibility of the
website.
Trade/ Tour Operator:
Focussing on trade and forming a symbiotic relationship with trade will foster a
greater number of foreign tourist visits to India. It is also suggested to improve the
number of tour operators who sell India by providing free training and tutorials for
tourism in India by Ministry and motivate them to work for ‘India Tourism Office’.
There is a need for an integrated approach by India Tourism Office and tour
operators. India Tourism Office must participate in important fairs and festivals where
they can sponsor any event which will finally send a message to “Visit India” and not
just educate travellers about India. More communication with tour operators is
required with regards to events that can be organized to boost tourism to India.
Media:
Media is a medium that can be used to make people aware about India. Media
reaches the masses and hence is a very important tool of promotion. Currently the
advertisements of Incredible India campaign are currently shown in channels that are
international and the same for the entire African Subcontinent. Local channels in
South Africa, which are most watched by the potential travellers are not showing
India Tourism advertisements. The same is happening in case of print
advertisements too. The media advertisements need to focus on the various
products that India has to offer assuring that India is a safe and secure country to
visit and can also showcase the unique blend of modern and traditional experiences
that India has to offer. Media can also take the help of celebrities and famous
personalities to promote the pleasant experiences that they had encountered during
their stay in India.
Traveller:
More efforts need to be put in creating promotional campaigns which will increase
footfalls of travellers to India. In order to attract intending travellers as well as past
Final Report on Study of Tourism in the Overseas Markets of South Africa 117
travellers (for repeat visit) - a comprehensive travel guide or plan with lots of stimulus
is essential. Thus it is imperative to categorise the travellers from any particular
country on the basis of their travel pattern and habit/ behaviour. Promotional
campaigns need to highlight the Incredible India web-address more prominently to
increase the visibility of the website.
7.2 Way Forward – Long Term and Short Term Measures to Promote Indian Tourism
Short Term Measures:
Feature Incredible India advertisements in popular local channels and
mainstream popular print media and more importantly on social media.
A social media campaign of India Tourism highlighting the most liked aspects
of tourism in the South African context.
Organize focused Familiarization tours for media persons and tour operators.
Impart training to front office executives who are in direct contact with
prospective travellers so as they can handle all types of queries.
Though enough publicity material is there, but it is all out-dated, there is no
mention about New India – new destinations, new products, new packages,
new circuits and new luxury properties need to be promoted alongside well
known destinations, so as to offer a large choice in front of prospective
travellers.
Frequent interaction with tour operators – to remain connected.
Long Term Measures:
More focus on product /destination campaigns required for different set of
travellers. Products for specific countries should be designed based on the
needs and requirements of travellers from that specific geography.
Rather than sending brochures etc., fortnight updates though e-newsletters on
what is happening NEW in India –event, launch, festival etc.
Design advertisements with celebrities of the target country to lend trust and
credibility to the promotional advertisement.
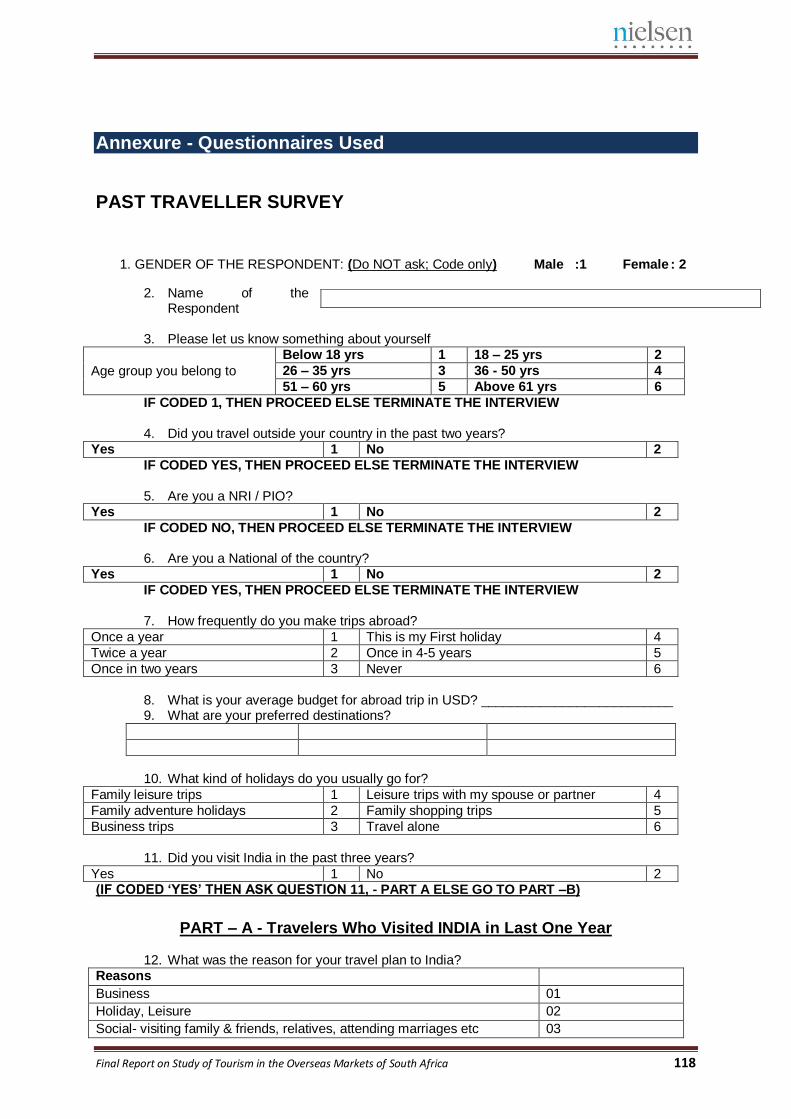
Final Report on Study of Tourism in the Overseas Markets of South Africa 118
Annexure - Questionnaires Used
PAST TRAVELLER SURVEY
1. GENDER OF THE RESPONDENT: (Do NOT ask; Code only) Male :1 Female : 2
2. Name of the Respondent
3. Please let us know something about yourself
Age group you belong to
Below 18 yrs 1 18 – 25 yrs 2
26 – 35 yrs 3 36 - 50 yrs 4
51 – 60 yrs 5 Above 61 yrs 6
IF CODED 1, THEN PROCEED ELSE TERMINATE THE INTERVIEW 4. Did you travel outside your country in the past two years?
Yes 1 No 2
IF CODED YES, THEN PROCEED ELSE TERMINATE THE INTERVIEW 5. Are you a NRI / PIO?
Yes 1 No 2
IF CODED NO, THEN PROCEED ELSE TERMINATE THE INTERVIEW 6. Are you a National of the country?
Yes 1 No 2
IF CODED YES, THEN PROCEED ELSE TERMINATE THE INTERVIEW 7. How frequently do you make trips abroad?
Once a year 1 This is my First holiday 4
Twice a year 2 Once in 4-5 years 5
Once in two years 3 Never 6
8. What is your average budget for abroad trip in USD? __________________________ 9. What are your preferred destinations?
10. What kind of holidays do you usually go for?
Family leisure trips 1 Leisure trips with my spouse or partner 4
Family adventure holidays 2 Family shopping trips 5
Business trips 3 Travel alone 6
11. Did you visit India in the past three years?
Yes 1 No 2 (IF CODED ‘YES’ THEN ASK QUESTION 11, - PART A ELSE GO TO PART –B)
PART – A - Travelers Who Visited INDIA in Last One Year
12. What was the reason for your travel plan to India?
Reasons
Business 01
Holiday, Leisure 02
Social- visiting family & friends, relatives, attending marriages etc 03
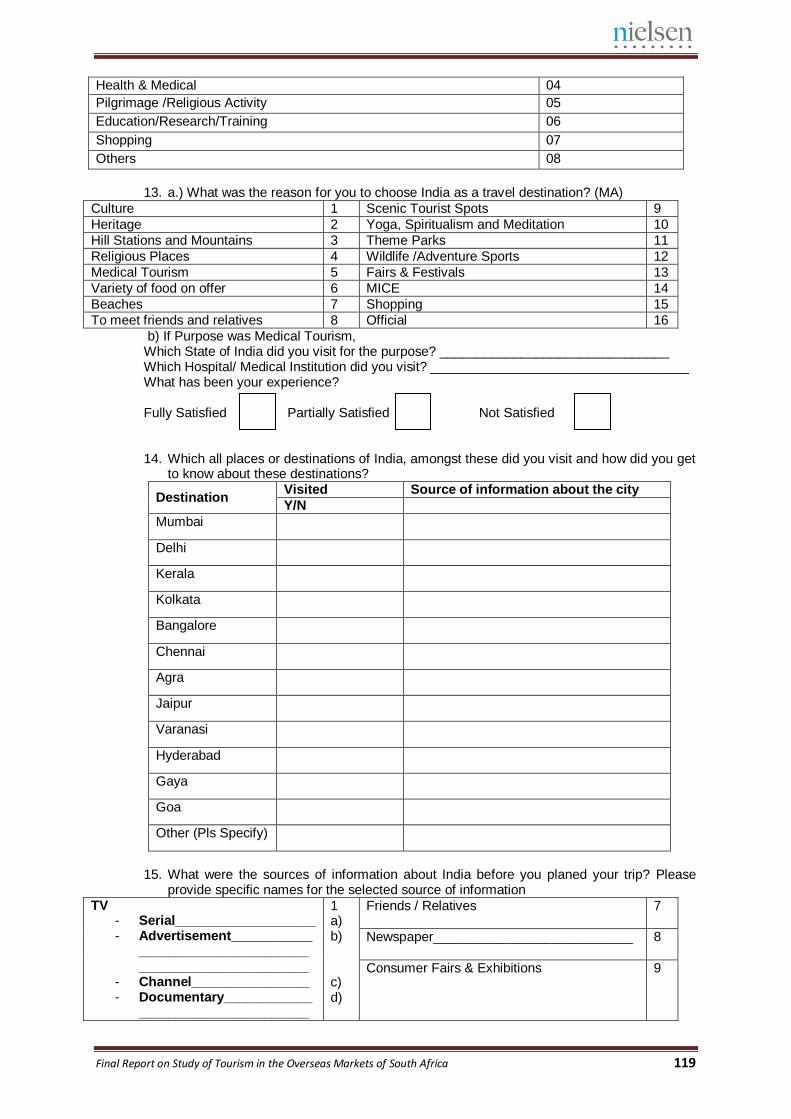
Final Report on Study of Tourism in the Overseas Markets of South Africa 119
Health & Medical 04
Pilgrimage /Religious Activity 05
Education/Research/Training 06
Shopping 07
Others 08
13. a.) What was the reason for you to choose India as a travel destination? (MA)
Culture 1 Scenic Tourist Spots 9
Heritage 2 Yoga, Spiritualism and Meditation 10
Hill Stations and Mountains 3 Theme Parks 11
Religious Places 4 Wildlife /Adventure Sports 12
Medical Tourism 5 Fairs & Festivals 13
Variety of food on offer 6 MICE 14
Beaches 7 Shopping 15
To meet friends and relatives 8 Official 16
b) If Purpose was Medical Tourism, Which State of India did you visit for the purpose? _______________________________ Which Hospital/ Medical Institution did you visit? ___________________________________ What has been your experience? Fully Satisfied Partially Satisfied Not Satisfied 14. Which all places or destinations of India, amongst these did you visit and how did you get
to know about these destinations?
Destination Visited Source of information about the city
Y/N
Mumbai
Delhi
Kerala
Kolkata
Bangalore
Chennai
Agra
Jaipur
Varanasi
Hyderabad
Gaya
Goa
Other (Pls Specify)
15. What were the sources of information about India before you planed your trip? Please
provide specific names for the selected source of information TV
- Serial___________________ - Advertisement___________
______________________________________________
- Channel________________ - Documentary____________
_______________________
1 a) b) c) d)
Friends / Relatives 7
Newspaper___________________________ 8
Consumer Fairs & Exhibitions 9
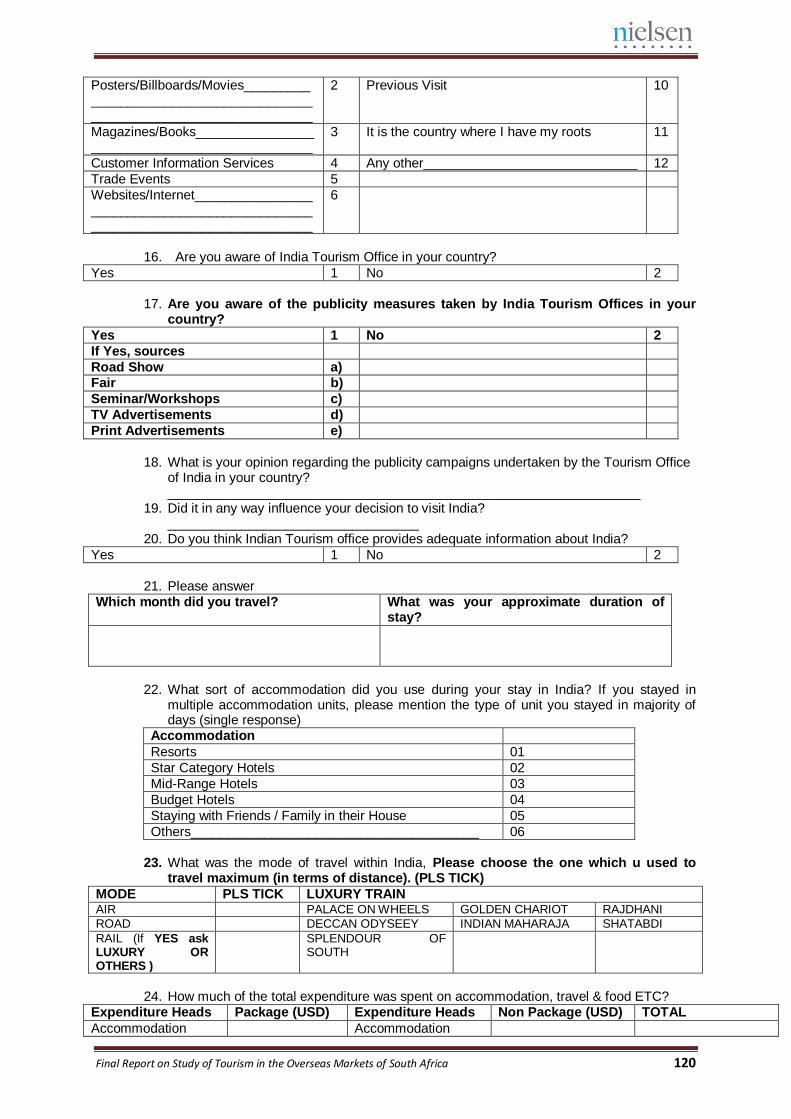
Final Report on Study of Tourism in the Overseas Markets of South Africa 120
Posters/Billboards/Movies_____________________________________________________________________
2 Previous Visit 10
Magazines/Books______________________________________________
3 It is the country where I have my roots 11
Customer Information Services 4 Any other_____________________________ 12
Trade Events 5
Websites/Internet____________________________________________________________________________
6
16. Are you aware of India Tourism Office in your country?
Yes 1 No 2
17. Are you aware of the publicity measures taken by India Tourism Offices in your
country?
Yes 1 No 2
If Yes, sources
Road Show a) Fair b)
Seminar/Workshops c)
TV Advertisements d)
Print Advertisements e)
18. What is your opinion regarding the publicity campaigns undertaken by the Tourism Office
of India in your country? ________________________________________________________________
19. Did it in any way influence your decision to visit India? __________________________________
20. Do you think Indian Tourism office provides adequate information about India?
Yes 1 No 2
21. Please answer
Which month did you travel? What was your approximate duration of stay?
22. What sort of accommodation did you use during your stay in India? If you stayed in
multiple accommodation units, please mention the type of unit you stayed in majority of days (single response)
Accommodation
Resorts 01
Star Category Hotels 02
Mid-Range Hotels 03
Budget Hotels 04
Staying with Friends / Family in their House 05
Others_______________________________________ 06
23. What was the mode of travel within India, Please choose the one which u used to
travel maximum (in terms of distance). (PLS TICK)
MODE PLS TICK LUXURY TRAIN AIR PALACE ON WHEELS GOLDEN CHARIOT RAJDHANI
ROAD DECCAN ODYSEEY INDIAN MAHARAJA SHATABDI
RAIL (If YES ask LUXURY OR OTHERS )
SPLENDOUR OF SOUTH
24. How much of the total expenditure was spent on accommodation, travel & food ETC?
Expenditure Heads Package (USD) Expenditure Heads Non Package (USD) TOTAL
Accommodation Accommodation
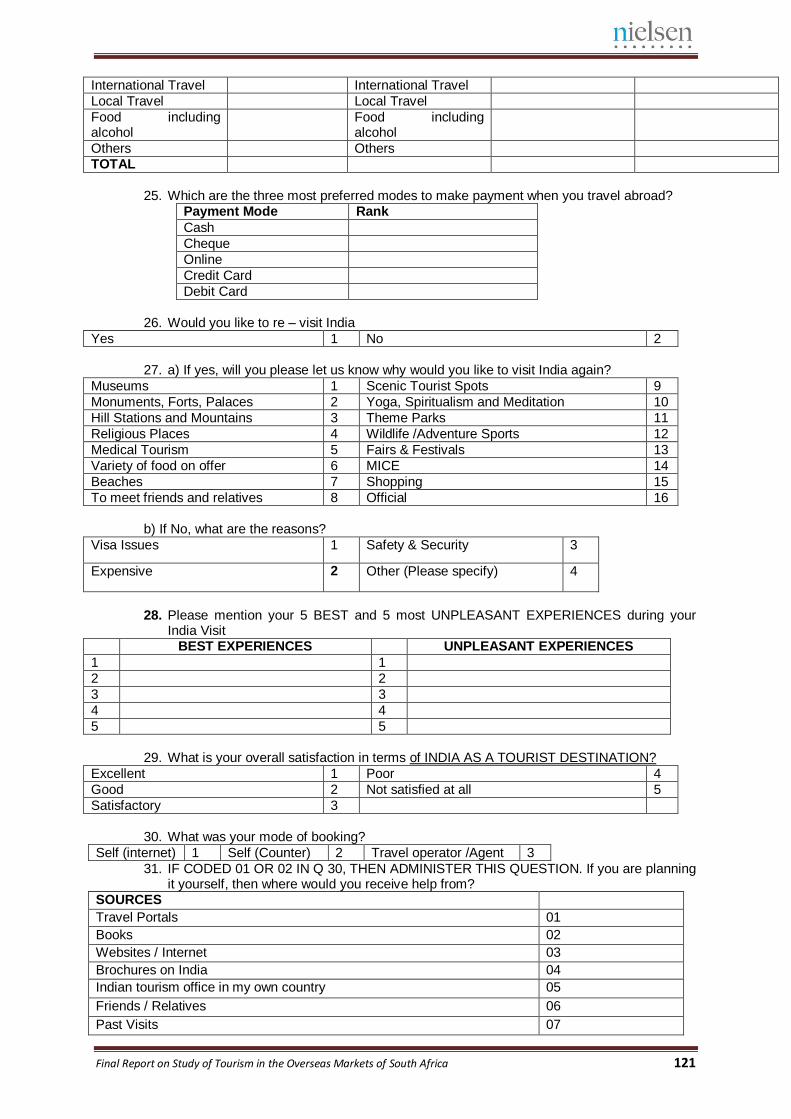
Final Report on Study of Tourism in the Overseas Markets of South Africa 121
International Travel International Travel
Local Travel Local Travel
Food including alcohol
Food including alcohol
Others Others TOTAL
25. Which are the three most preferred modes to make payment when you travel abroad? Payment Mode Rank
Cash
Cheque
Online
Credit Card
Debit Card 26. Would you like to re – visit India
Yes 1 No 2 27. a) If yes, will you please let us know why would you like to visit India again?
Museums 1 Scenic Tourist Spots 9
Monuments, Forts, Palaces 2 Yoga, Spiritualism and Meditation 10
Hill Stations and Mountains 3 Theme Parks 11
Religious Places 4 Wildlife /Adventure Sports 12
Medical Tourism 5 Fairs & Festivals 13
Variety of food on offer 6 MICE 14
Beaches 7 Shopping 15
To meet friends and relatives 8 Official 16 b) If No, what are the reasons?
Visa Issues 1 Safety & Security 3
Expensive 2 Other (Please specify) 4
28. Please mention your 5 BEST and 5 most UNPLEASANT EXPERIENCES during your
India Visit
BEST EXPERIENCES UNPLEASANT EXPERIENCES
1 1
2 2
3 3
4 4
5 5 29. What is your overall satisfaction in terms of INDIA AS A TOURIST DESTINATION?
Excellent 1 Poor 4
Good 2 Not satisfied at all 5
Satisfactory 3 30. What was your mode of booking?
Self (internet) 1 Self (Counter) 2 Travel operator /Agent 3
31. IF CODED 01 OR 02 IN Q 30, THEN ADMINISTER THIS QUESTION. If you are planning it yourself, then where would you receive help from?
SOURCES
Travel Portals 01
Books 02
Websites / Internet 03
Brochures on India 04
Indian tourism office in my own country 05
Friends / Relatives 06
Past Visits 07
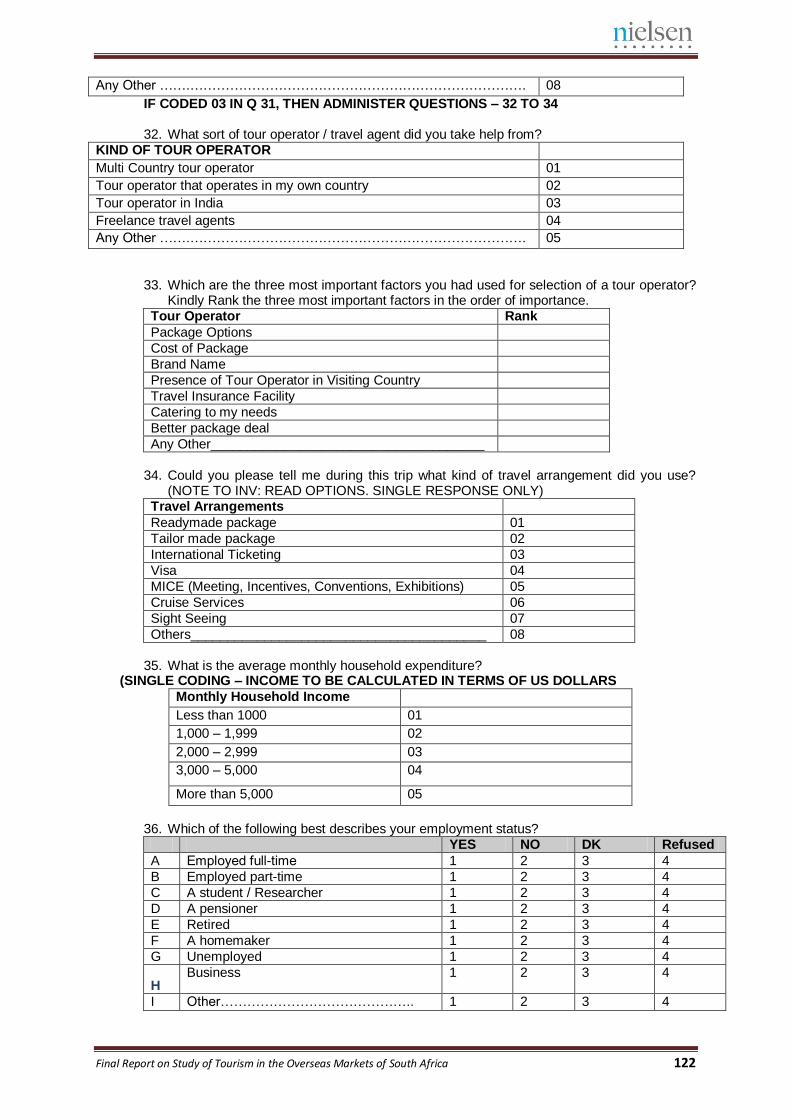
Final Report on Study of Tourism in the Overseas Markets of South Africa 122
Any Other …….…………………………………………………………………. 08
IF CODED 03 IN Q 31, THEN ADMINISTER QUESTIONS – 32 TO 34 32. What sort of tour operator / travel agent did you take help from?
KIND OF TOUR OPERATOR
Multi Country tour operator 01
Tour operator that operates in my own country 02
Tour operator in India 03
Freelance travel agents 04
Any Other …….…………………………………………………………………. 05
33. Which are the three most important factors you had used for selection of a tour operator? Kindly Rank the three most important factors in the order of importance.
Tour Operator Rank
Package Options
Cost of Package
Brand Name
Presence of Tour Operator in Visiting Country
Travel Insurance Facility
Catering to my needs
Better package deal
Any Other_____________________________________ 34. Could you please tell me during this trip what kind of travel arrangement did you use?
(NOTE TO INV: READ OPTIONS. SINGLE RESPONSE ONLY) Travel Arrangements
Readymade package 01
Tailor made package 02
International Ticketing 03
Visa 04
MICE (Meeting, Incentives, Conventions, Exhibitions) 05
Cruise Services 06
Sight Seeing 07
Others________________________________________ 08 35. What is the average monthly household expenditure?
(SINGLE CODING – INCOME TO BE CALCULATED IN TERMS OF US DOLLARS
Monthly Household Income
Less than 1000 01
1,000 – 1,999 02
2,000 – 2,999 03
3,000 – 5,000 04
More than 5,000 05
36. Which of the following best describes your employment status? YES NO DK Refused
A Employed full-time 1 2 3 4
B Employed part-time 1 2 3 4
C A student / Researcher 1 2 3 4
D A pensioner 1 2 3 4
E Retired 1 2 3 4
F A homemaker 1 2 3 4
G Unemployed 1 2 3 4
H Business 1 2 3 4
I Other…………………………………….. 1 2 3 4
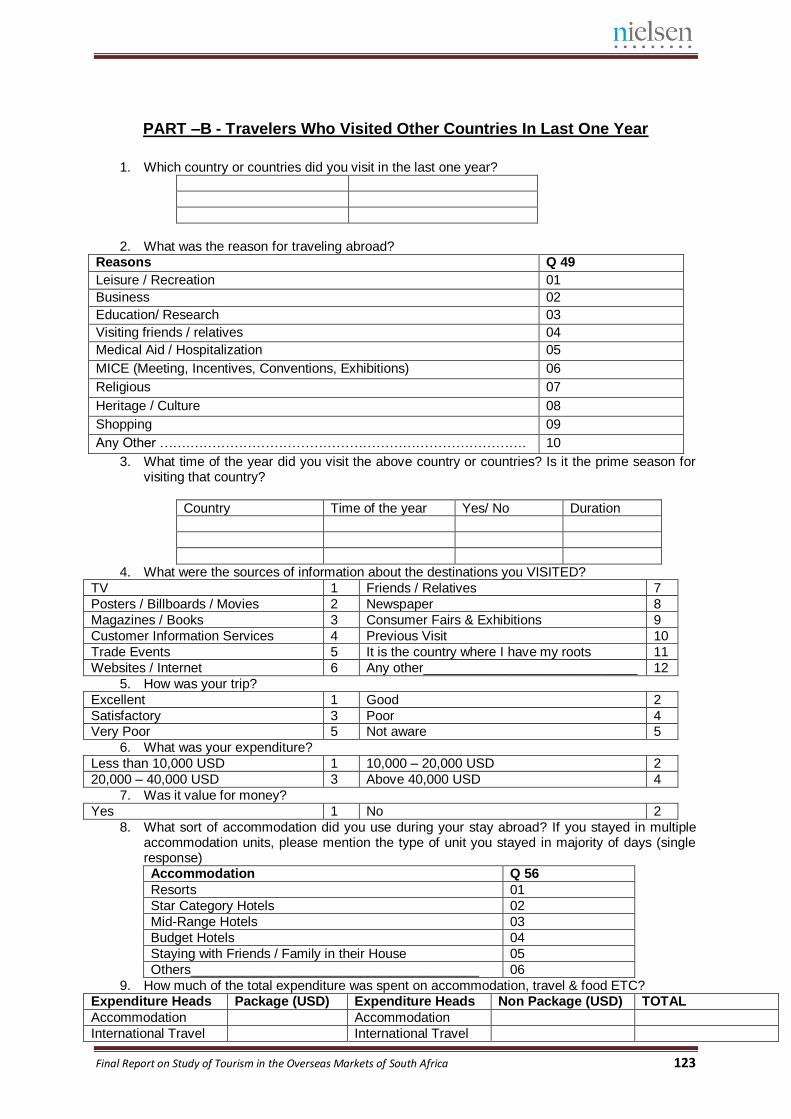
Final Report on Study of Tourism in the Overseas Markets of South Africa 123
PART –B - Travelers Who Visited Other Countries In Last One Year
1. Which country or countries did you visit in the last one year?
2. What was the reason for traveling abroad?
Reasons Q 49
Leisure / Recreation 01
Business 02
Education/ Research 03
Visiting friends / relatives 04
Medical Aid / Hospitalization 05
MICE (Meeting, Incentives, Conventions, Exhibitions) 06
Religious 07
Heritage / Culture 08
Shopping 09
Any Other …….…………………………………………………………………. 10
3. What time of the year did you visit the above country or countries? Is it the prime season for visiting that country?
Country Time of the year Yes/ No Duration
4. What were the sources of information about the destinations you VISITED?
TV 1 Friends / Relatives 7
Posters / Billboards / Movies 2 Newspaper 8
Magazines / Books 3 Consumer Fairs & Exhibitions 9
Customer Information Services 4 Previous Visit 10
Trade Events 5 It is the country where I have my roots 11
Websites / Internet 6 Any other_____________________________ 12
5. How was your trip?
Excellent 1 Good 2
Satisfactory 3 Poor 4 Very Poor 5 Not aware 5
6. What was your expenditure?
Less than 10,000 USD 1 10,000 – 20,000 USD 2
20,000 – 40,000 USD 3 Above 40,000 USD 4
7. Was it value for money?
Yes 1 No 2
8. What sort of accommodation did you use during your stay abroad? If you stayed in multiple accommodation units, please mention the type of unit you stayed in majority of days (single response) Accommodation Q 56
Resorts 01
Star Category Hotels 02
Mid-Range Hotels 03
Budget Hotels 04
Staying with Friends / Family in their House 05
Others_______________________________________ 06
9. How much of the total expenditure was spent on accommodation, travel & food ETC? Expenditure Heads Package (USD) Expenditure Heads Non Package (USD) TOTAL
Accommodation Accommodation
International Travel International Travel
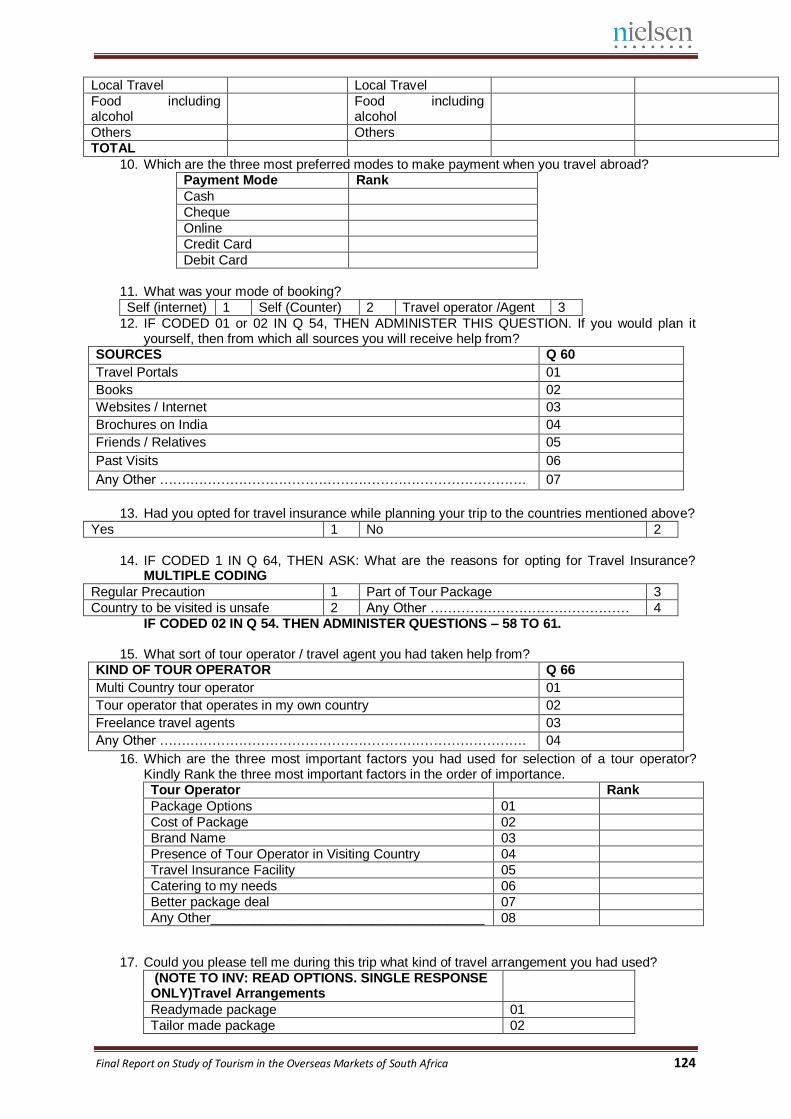
Final Report on Study of Tourism in the Overseas Markets of South Africa 124
Local Travel Local Travel
Food including alcohol
Food including alcohol
Others Others TOTAL
10. Which are the three most preferred modes to make payment when you travel abroad? Payment Mode Rank
Cash
Cheque
Online
Credit Card
Debit Card
11. What was your mode of booking?
Self (internet) 1 Self (Counter) 2 Travel operator /Agent 3
12. IF CODED 01 or 02 IN Q 54, THEN ADMINISTER THIS QUESTION. If you would plan it yourself, then from which all sources you will receive help from?
SOURCES Q 60
Travel Portals 01
Books 02
Websites / Internet 03
Brochures on India 04
Friends / Relatives 05
Past Visits 06
Any Other …….…………………………………………………………………. 07
13. Had you opted for travel insurance while planning your trip to the countries mentioned above?
Yes 1 No 2
14. IF CODED 1 IN Q 64, THEN ASK: What are the reasons for opting for Travel Insurance?
MULTIPLE CODING
Regular Precaution 1 Part of Tour Package 3
Country to be visited is unsafe 2 Any Other ……………………………………… 4 IF CODED 02 IN Q 54. THEN ADMINISTER QUESTIONS – 58 TO 61.
15. What sort of tour operator / travel agent you had taken help from? KIND OF TOUR OPERATOR Q 66
Multi Country tour operator 01
Tour operator that operates in my own country 02
Freelance travel agents 03
Any Other …….…………………………………………………………………. 04
16. Which are the three most important factors you had used for selection of a tour operator? Kindly Rank the three most important factors in the order of importance. Tour Operator Rank
Package Options 01
Cost of Package 02
Brand Name 03
Presence of Tour Operator in Visiting Country 04
Travel Insurance Facility 05
Catering to my needs 06
Better package deal 07
Any Other_____________________________________ 08
17. Could you please tell me during this trip what kind of travel arrangement you had used? (NOTE TO INV: READ OPTIONS. SINGLE RESPONSE ONLY)Travel Arrangements
Readymade package 01
Tailor made package 02
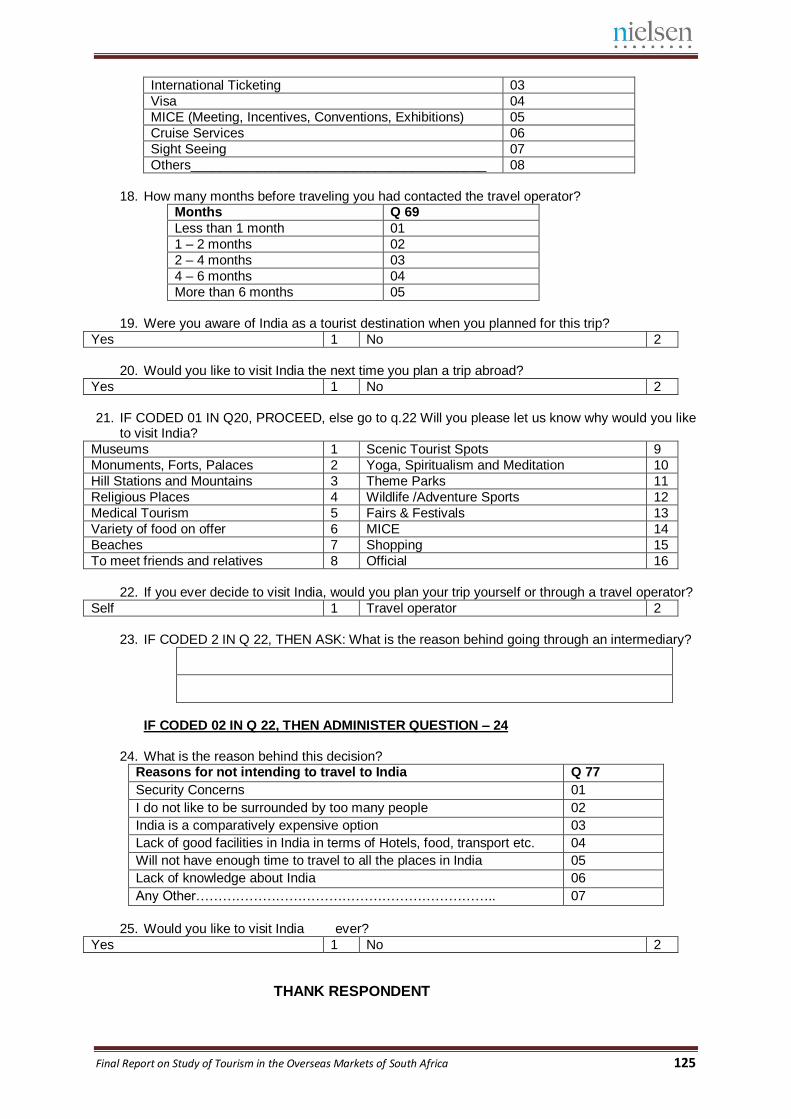
Final Report on Study of Tourism in the Overseas Markets of South Africa 125
International Ticketing 03
Visa 04
MICE (Meeting, Incentives, Conventions, Exhibitions) 05
Cruise Services 06
Sight Seeing 07
Others________________________________________ 08
18. How many months before traveling you had contacted the travel operator?
Months Q 69
Less than 1 month 01
1 – 2 months 02
2 – 4 months 03
4 – 6 months 04
More than 6 months 05
19. Were you aware of India as a tourist destination when you planned for this trip?
Yes 1 No 2
20. Would you like to visit India the next time you plan a trip abroad?
Yes 1 No 2
21. IF CODED 01 IN Q20, PROCEED, else go to q.22 Will you please let us know why would you like
to visit India?
Museums 1 Scenic Tourist Spots 9
Monuments, Forts, Palaces 2 Yoga, Spiritualism and Meditation 10
Hill Stations and Mountains 3 Theme Parks 11
Religious Places 4 Wildlife /Adventure Sports 12
Medical Tourism 5 Fairs & Festivals 13
Variety of food on offer 6 MICE 14
Beaches 7 Shopping 15
To meet friends and relatives 8 Official 16
22. If you ever decide to visit India, would you plan your trip yourself or through a travel operator?
Self 1 Travel operator 2
23. IF CODED 2 IN Q 22, THEN ASK: What is the reason behind going through an intermediary?
IF CODED 02 IN Q 22, THEN ADMINISTER QUESTION – 24
24. What is the reason behind this decision? Reasons for not intending to travel to India Q 77
Security Concerns 01
I do not like to be surrounded by too many people 02
India is a comparatively expensive option 03
Lack of good facilities in India in terms of Hotels, food, transport etc. 04
Will not have enough time to travel to all the places in India 05
Lack of knowledge about India 06
Any Other………………………………………………………….. 07
25. Would you like to visit India ever?
Yes 1 No 2
THANK RESPONDENT
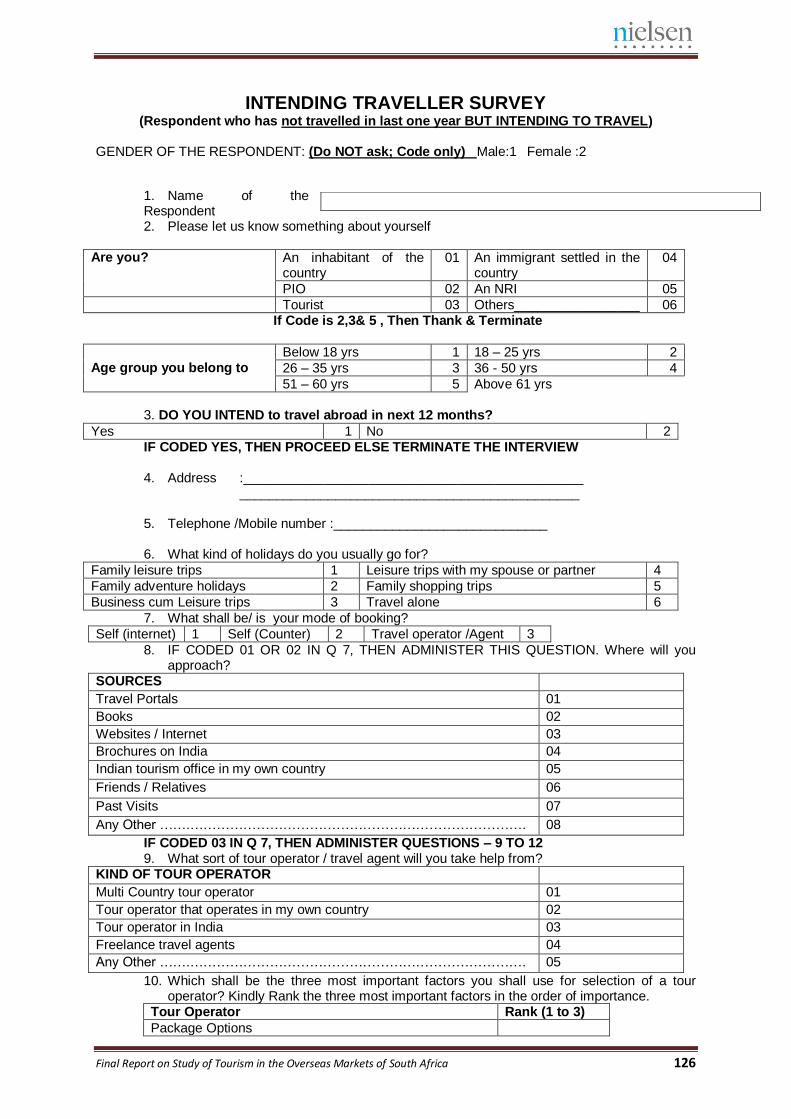
Final Report on Study of Tourism in the Overseas Markets of South Africa 126
INTENDING TRAVELLER SURVEY (Respondent who has not travelled in last one year BUT INTENDING TO TRAVEL)
GENDER OF THE RESPONDENT: (Do NOT ask; Code only) Male:1 Female :2
1. Name of the Respondent 2. Please let us know something about yourself
Are you? An inhabitant of the
country 01 An immigrant settled in the
country 04
PIO 02 An NRI 05 Tourist 03 Others_________________ 06
If Code is 2,3& 5 , Then Thank & Terminate
Age group you belong to Below 18 yrs 1 18 – 25 yrs 2
26 – 35 yrs 3 36 - 50 yrs 4
51 – 60 yrs 5 Above 61 yrs
3. DO YOU INTEND to travel abroad in next 12 months?
Yes 1 No 2 IF CODED YES, THEN PROCEED ELSE TERMINATE THE INTERVIEW 4. Address :______________________________________________ ______________________________________________ 5. Telephone /Mobile number :_____________________________ 6. What kind of holidays do you usually go for?
Family leisure trips 1 Leisure trips with my spouse or partner 4
Family adventure holidays 2 Family shopping trips 5
Business cum Leisure trips 3 Travel alone 6
7. What shall be/ is your mode of booking?
Self (internet) 1 Self (Counter) 2 Travel operator /Agent 3
8. IF CODED 01 OR 02 IN Q 7, THEN ADMINISTER THIS QUESTION. Where will you approach?
SOURCES
Travel Portals 01
Books 02
Websites / Internet 03
Brochures on India 04
Indian tourism office in my own country 05
Friends / Relatives 06
Past Visits 07
Any Other …….…………………………………………………………………. 08
IF CODED 03 IN Q 7, THEN ADMINISTER QUESTIONS – 9 TO 12 9. What sort of tour operator / travel agent will you take help from?
KIND OF TOUR OPERATOR
Multi Country tour operator 01
Tour operator that operates in my own country 02
Tour operator in India 03
Freelance travel agents 04
Any Other …….…………………………………………………………………. 05
10. Which shall be the three most important factors you shall use for selection of a tour operator? Kindly Rank the three most important factors in the order of importance.
Tour Operator Rank (1 to 3)
Package Options
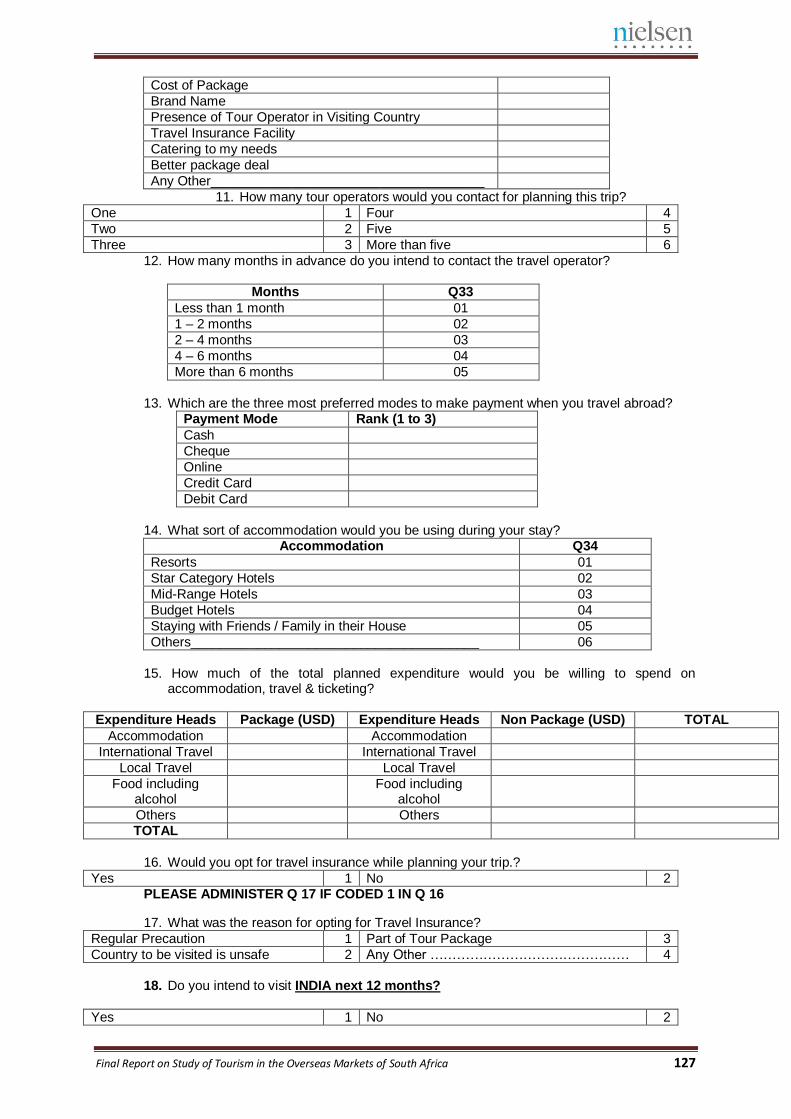
Final Report on Study of Tourism in the Overseas Markets of South Africa 127
Cost of Package
Brand Name
Presence of Tour Operator in Visiting Country
Travel Insurance Facility
Catering to my needs
Better package deal
Any Other_____________________________________
11. How many tour operators would you contact for planning this trip?
One 1 Four 4
Two 2 Five 5
Three 3 More than five 6
12. How many months in advance do you intend to contact the travel operator?
Months Q33
Less than 1 month 01
1 – 2 months 02
2 – 4 months 03
4 – 6 months 04
More than 6 months 05
13. Which are the three most preferred modes to make payment when you travel abroad?
Payment Mode Rank (1 to 3)
Cash
Cheque
Online
Credit Card
Debit Card
14. What sort of accommodation would you be using during your stay?
Accommodation Q34
Resorts 01
Star Category Hotels 02
Mid-Range Hotels 03
Budget Hotels 04
Staying with Friends / Family in their House 05
Others_______________________________________ 06
15. How much of the total planned expenditure would you be willing to spend on
accommodation, travel & ticketing?
Expenditure Heads Package (USD) Expenditure Heads Non Package (USD) TOTAL
Accommodation Accommodation
International Travel International Travel
Local Travel Local Travel
Food including alcohol
Food including alcohol
Others Others TOTAL
16. Would you opt for travel insurance while planning your trip.?
Yes 1 No 2 PLEASE ADMINISTER Q 17 IF CODED 1 IN Q 16
17. What was the reason for opting for Travel Insurance?
Regular Precaution 1 Part of Tour Package 3
Country to be visited is unsafe 2 Any Other ……………………………………… 4
18. Do you intend to visit INDIA next 12 months?
Yes 1 No 2
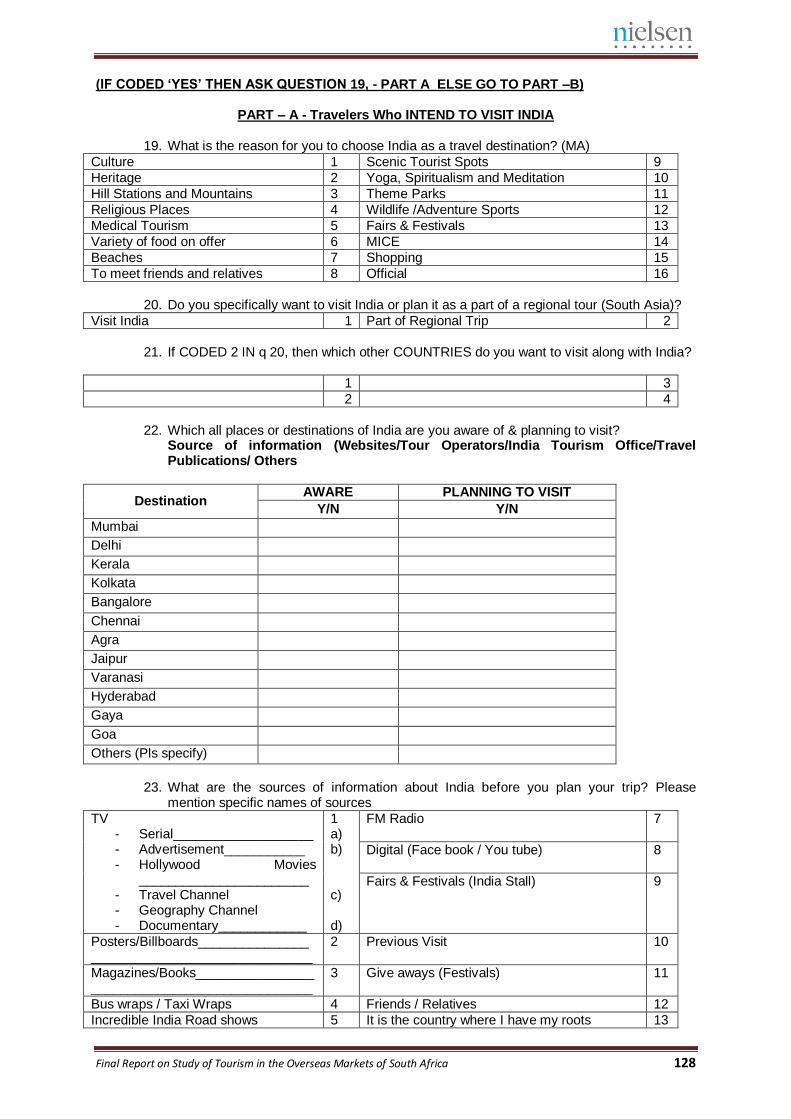
Final Report on Study of Tourism in the Overseas Markets of South Africa 128
(IF CODED ‘YES’ THEN ASK QUESTION 19, - PART A ELSE GO TO PART –B)
PART – A - Travelers Who INTEND TO VISIT INDIA 19. What is the reason for you to choose India as a travel destination? (MA)
Culture 1 Scenic Tourist Spots 9
Heritage 2 Yoga, Spiritualism and Meditation 10
Hill Stations and Mountains 3 Theme Parks 11
Religious Places 4 Wildlife /Adventure Sports 12
Medical Tourism 5 Fairs & Festivals 13
Variety of food on offer 6 MICE 14
Beaches 7 Shopping 15
To meet friends and relatives 8 Official 16
20. Do you specifically want to visit India or plan it as a part of a regional tour (South Asia)?
Visit India 1 Part of Regional Trip 2
21. If CODED 2 IN q 20, then which other COUNTRIES do you want to visit along with India?
1 3
2 4
22. Which all places or destinations of India are you aware of & planning to visit?
Source of information (Websites/Tour Operators/India Tourism Office/Travel Publications/ Others
Destination AWARE PLANNING TO VISIT
Y/N Y/N
Mumbai
Delhi
Kerala
Kolkata
Bangalore
Chennai
Agra
Jaipur
Varanasi
Hyderabad
Gaya
Goa
Others (Pls specify)
23. What are the sources of information about India before you plan your trip? Please
mention specific names of sources
TV - Serial___________________ - Advertisement___________ - Hollywood Movies
_______________________ - Travel Channel - Geography Channel - Documentary____________
1 a) b) c) d)
FM Radio 7
Digital (Face book / You tube) 8
Fairs & Festivals (India Stall) 9
Posters/Billboards_____________________________________________
2 Previous Visit 10
Magazines/Books______________________________________________
3 Give aways (Festivals) 11
Bus wraps / Taxi Wraps 4 Friends / Relatives 12
Incredible India Road shows 5 It is the country where I have my roots 13
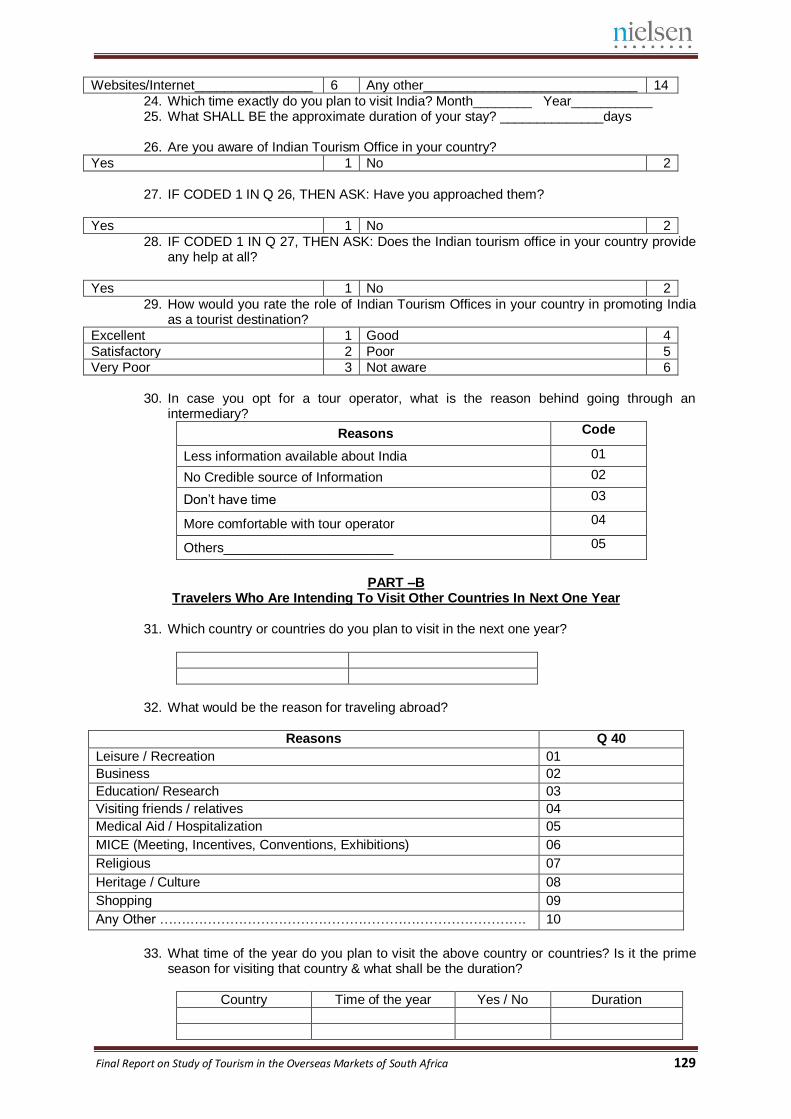
Final Report on Study of Tourism in the Overseas Markets of South Africa 129
Websites/Internet________________ 6 Any other_____________________________ 14
24. Which time exactly do you plan to visit India? Month________ Year___________ 25. What SHALL BE the approximate duration of your stay? ______________days 26. Are you aware of Indian Tourism Office in your country?
Yes 1 No 2
27. IF CODED 1 IN Q 26, THEN ASK: Have you approached them?
Yes 1 No 2
28. IF CODED 1 IN Q 27, THEN ASK: Does the Indian tourism office in your country provide any help at all?
Yes 1 No 2
29. How would you rate the role of Indian Tourism Offices in your country in promoting India as a tourist destination?
Excellent 1 Good 4
Satisfactory 2 Poor 5
Very Poor 3 Not aware 6 30. In case you opt for a tour operator, what is the reason behind going through an
intermediary?
Reasons Code
Less information available about India 01
No Credible source of Information 02
Don’t have time 03
More comfortable with tour operator 04
Others_______________________ 05
PART –B
Travelers Who Are Intending To Visit Other Countries In Next One Year
31. Which country or countries do you plan to visit in the next one year?
32. What would be the reason for traveling abroad?
Reasons Q 40
Leisure / Recreation 01
Business 02
Education/ Research 03
Visiting friends / relatives 04
Medical Aid / Hospitalization 05
MICE (Meeting, Incentives, Conventions, Exhibitions) 06
Religious 07
Heritage / Culture 08
Shopping 09
Any Other …….…………………………………………………………………. 10
33. What time of the year do you plan to visit the above country or countries? Is it the prime
season for visiting that country & what shall be the duration?
Country Time of the year Yes / No Duration
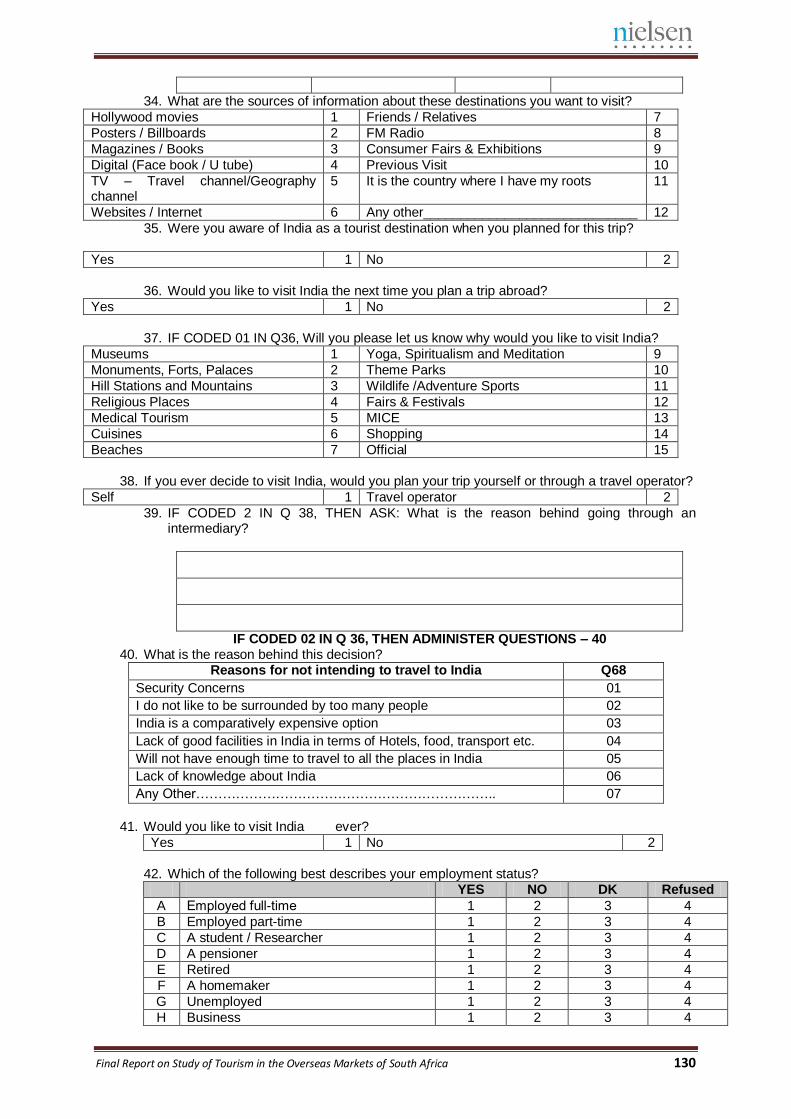
Final Report on Study of Tourism in the Overseas Markets of South Africa 130
34. What are the sources of information about these destinations you want to visit?
Hollywood movies 1 Friends / Relatives 7
Posters / Billboards 2 FM Radio 8
Magazines / Books 3 Consumer Fairs & Exhibitions 9
Digital (Face book / U tube) 4 Previous Visit 10
TV – Travel channel/Geography channel
5 It is the country where I have my roots 11
Websites / Internet 6 Any other_____________________________ 12
35. Were you aware of India as a tourist destination when you planned for this trip?
Yes 1 No 2
36. Would you like to visit India the next time you plan a trip abroad?
Yes 1 No 2
37. IF CODED 01 IN Q36, Will you please let us know why would you like to visit India?
Museums 1 Yoga, Spiritualism and Meditation 9
Monuments, Forts, Palaces 2 Theme Parks 10
Hill Stations and Mountains 3 Wildlife /Adventure Sports 11
Religious Places 4 Fairs & Festivals 12
Medical Tourism 5 MICE 13
Cuisines 6 Shopping 14
Beaches 7 Official 15
38. If you ever decide to visit India, would you plan your trip yourself or through a travel operator?
Self 1 Travel operator 2
39. IF CODED 2 IN Q 38, THEN ASK: What is the reason behind going through an intermediary?
IF CODED 02 IN Q 36, THEN ADMINISTER QUESTIONS – 40 40. What is the reason behind this decision?
Reasons for not intending to travel to India Q68
Security Concerns 01
I do not like to be surrounded by too many people 02
India is a comparatively expensive option 03
Lack of good facilities in India in terms of Hotels, food, transport etc. 04
Will not have enough time to travel to all the places in India 05
Lack of knowledge about India 06
Any Other………………………………………………………….. 07
41. Would you like to visit India ever?
Yes 1 No 2
42. Which of the following best describes your employment status? YES NO DK Refused
A Employed full-time 1 2 3 4
B Employed part-time 1 2 3 4
C A student / Researcher 1 2 3 4
D A pensioner 1 2 3 4
E Retired 1 2 3 4
F A homemaker 1 2 3 4
G Unemployed 1 2 3 4
H Business 1 2 3 4
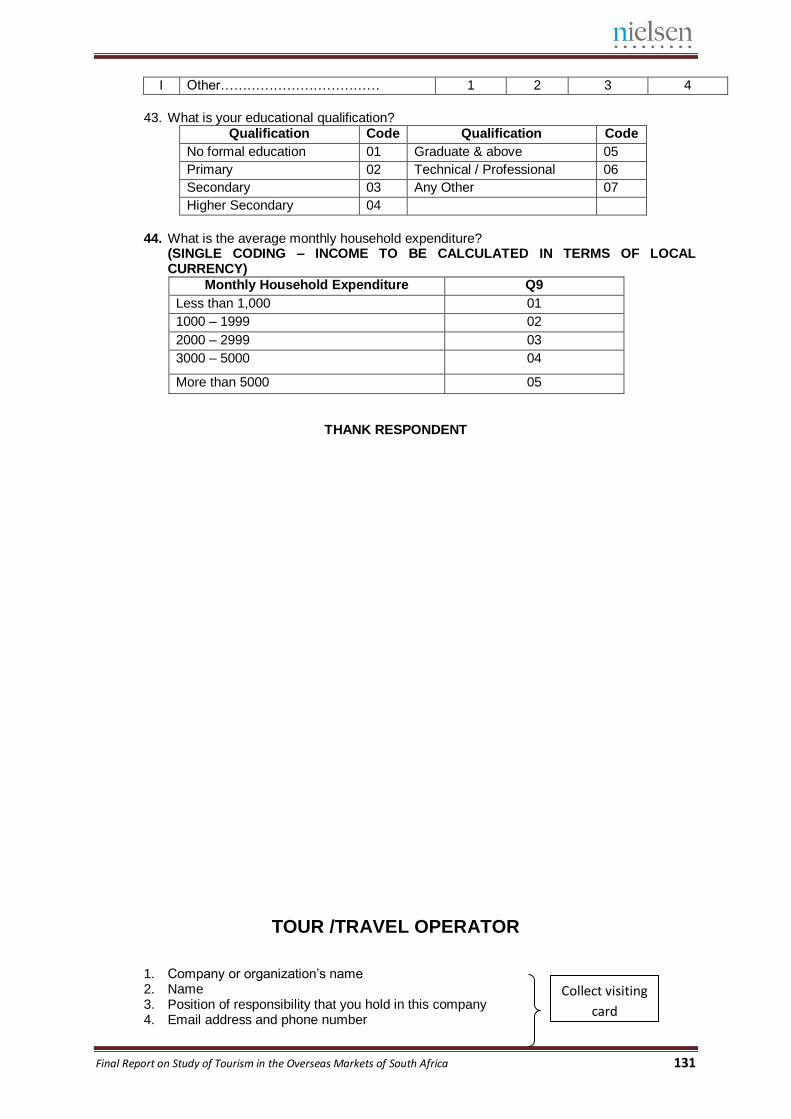
Final Report on Study of Tourism in the Overseas Markets of South Africa 131
I Other……………………………… 1 2 3 4
43. What is your educational qualification?
Qualification Code Qualification Code
No formal education 01 Graduate & above 05
Primary 02 Technical / Professional 06
Secondary 03 Any Other 07
Higher Secondary 04
44. What is the average monthly household expenditure?
(SINGLE CODING – INCOME TO BE CALCULATED IN TERMS OF LOCAL CURRENCY)
Monthly Household Expenditure Q9
Less than 1,000 01
1000 – 1999 02
2000 – 2999 03
3000 – 5000 04
More than 5000 05
THANK RESPONDENT
TOUR /TRAVEL OPERATOR
1. Company or organization’s name 2. Name 3. Position of responsibility that you hold in this company 4. Email address and phone number
Collect visiting
card
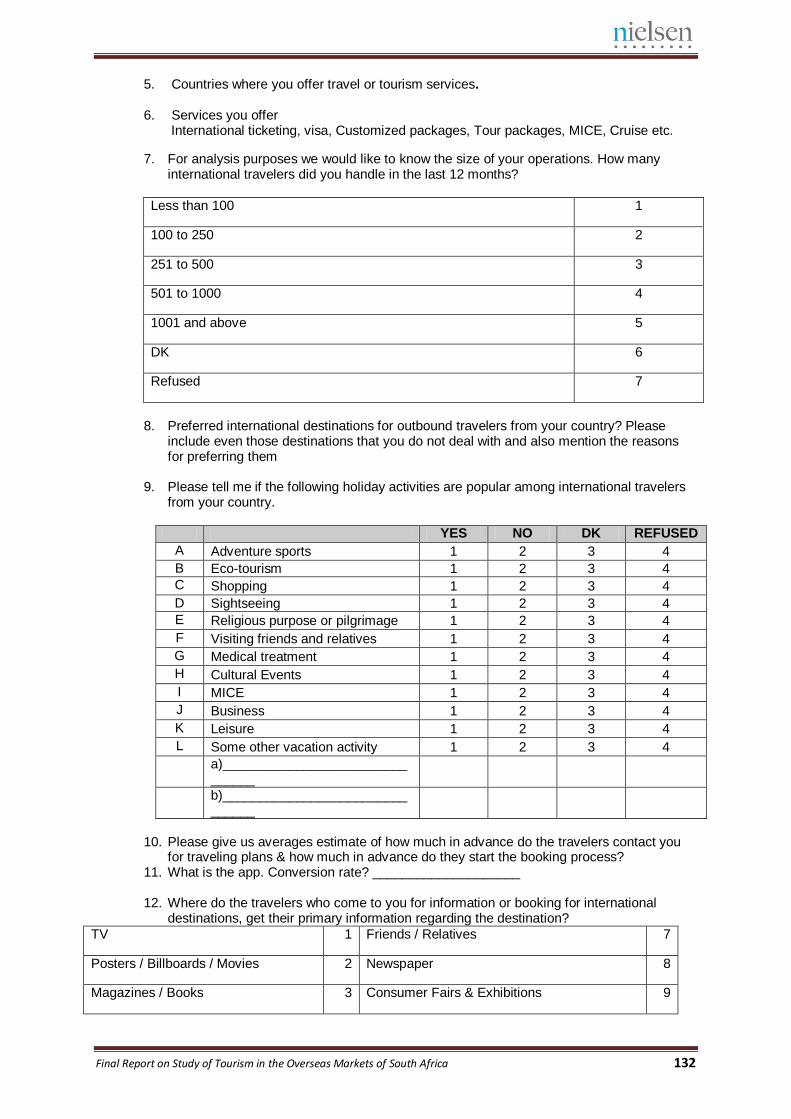
Final Report on Study of Tourism in the Overseas Markets of South Africa 132
5. Countries where you offer travel or tourism services. 6. Services you offer
International ticketing, visa, Customized packages, Tour packages, MICE, Cruise etc.
7. For analysis purposes we would like to know the size of your operations. How many international travelers did you handle in the last 12 months?
Less than 100 1
100 to 250 2
251 to 500 3
501 to 1000 4
1001 and above 5
DK 6
Refused 7
8. Preferred international destinations for outbound travelers from your country? Please
include even those destinations that you do not deal with and also mention the reasons for preferring them
9. Please tell me if the following holiday activities are popular among international travelers
from your country.
YES NO DK REFUSED
A Adventure sports 1 2 3 4
B Eco-tourism 1 2 3 4
C Shopping 1 2 3 4
D Sightseeing 1 2 3 4
E Religious purpose or pilgrimage 1 2 3 4
F Visiting friends and relatives 1 2 3 4
G Medical treatment 1 2 3 4
H Cultural Events 1 2 3 4
I MICE 1 2 3 4
J Business 1 2 3 4
K Leisure 1 2 3 4
L Some other vacation activity 1 2 3 4
a)_______________________________
b)_______________________________
10. Please give us averages estimate of how much in advance do the travelers contact you
for traveling plans & how much in advance do they start the booking process? 11. What is the app. Conversion rate? ____________________ 12. Where do the travelers who come to you for information or booking for international
destinations, get their primary information regarding the destination?
TV 1 Friends / Relatives 7
Posters / Billboards / Movies 2 Newspaper 8
Magazines / Books 3 Consumer Fairs & Exhibitions 9
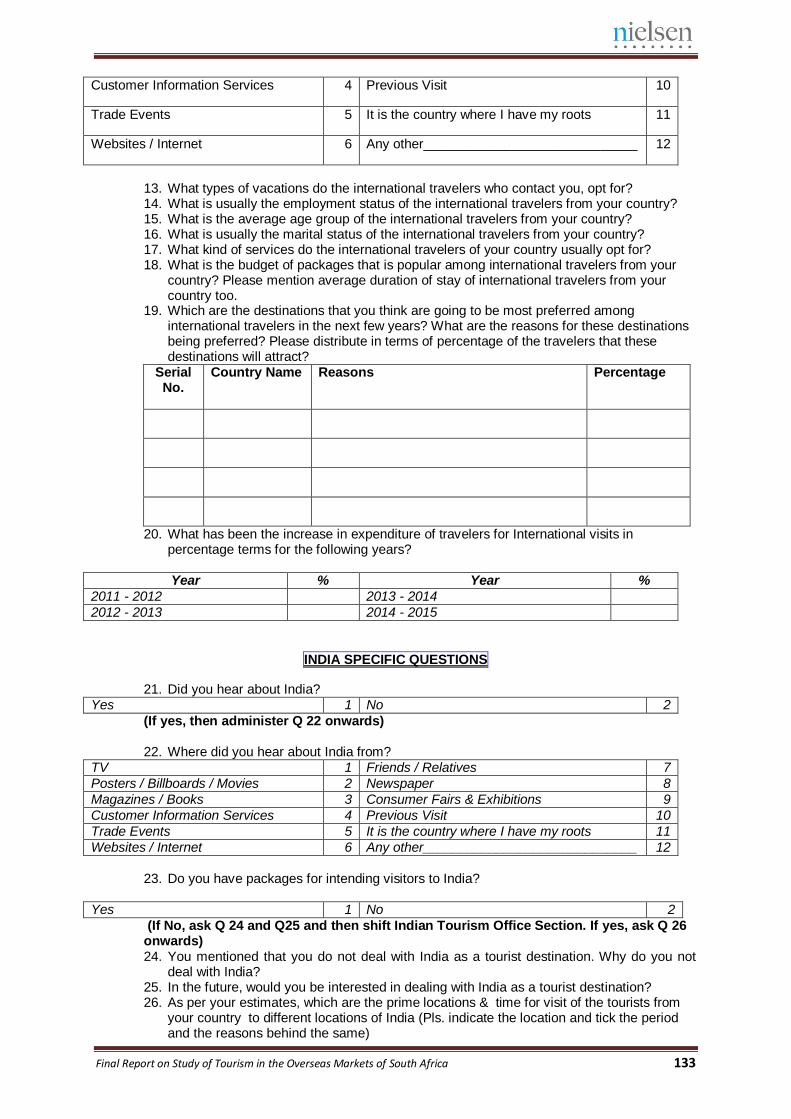
Final Report on Study of Tourism in the Overseas Markets of South Africa 133
Customer Information Services 4 Previous Visit 10
Trade Events 5 It is the country where I have my roots 11
Websites / Internet 6 Any other_____________________________ 12
13. What types of vacations do the international travelers who contact you, opt for? 14. What is usually the employment status of the international travelers from your country? 15. What is the average age group of the international travelers from your country? 16. What is usually the marital status of the international travelers from your country? 17. What kind of services do the international travelers of your country usually opt for? 18. What is the budget of packages that is popular among international travelers from your
country? Please mention average duration of stay of international travelers from your country too.
19. Which are the destinations that you think are going to be most preferred among international travelers in the next few years? What are the reasons for these destinations being preferred? Please distribute in terms of percentage of the travelers that these destinations will attract?
Serial No.
Country Name Reasons Percentage
20. What has been the increase in expenditure of travelers for International visits in percentage terms for the following years?
Year % Year %
2011 - 2012 2013 - 2014
2012 - 2013 2014 - 2015
INDIA SPECIFIC QUESTIONS
21. Did you hear about India? Yes 1 No 2
(If yes, then administer Q 22 onwards) 22. Where did you hear about India from?
TV 1 Friends / Relatives 7
Posters / Billboards / Movies 2 Newspaper 8
Magazines / Books 3 Consumer Fairs & Exhibitions 9
Customer Information Services 4 Previous Visit 10
Trade Events 5 It is the country where I have my roots 11
Websites / Internet 6 Any other_____________________________ 12
23. Do you have packages for intending visitors to India?
Yes 1 No 2
(If No, ask Q 24 and Q25 and then shift Indian Tourism Office Section. If yes, ask Q 26 onwards) 24. You mentioned that you do not deal with India as a tourist destination. Why do you not
deal with India? 25. In the future, would you be interested in dealing with India as a tourist destination? 26. As per your estimates, which are the prime locations & time for visit of the tourists from
your country to different locations of India (Pls. indicate the location and tick the period and the reasons behind the same)
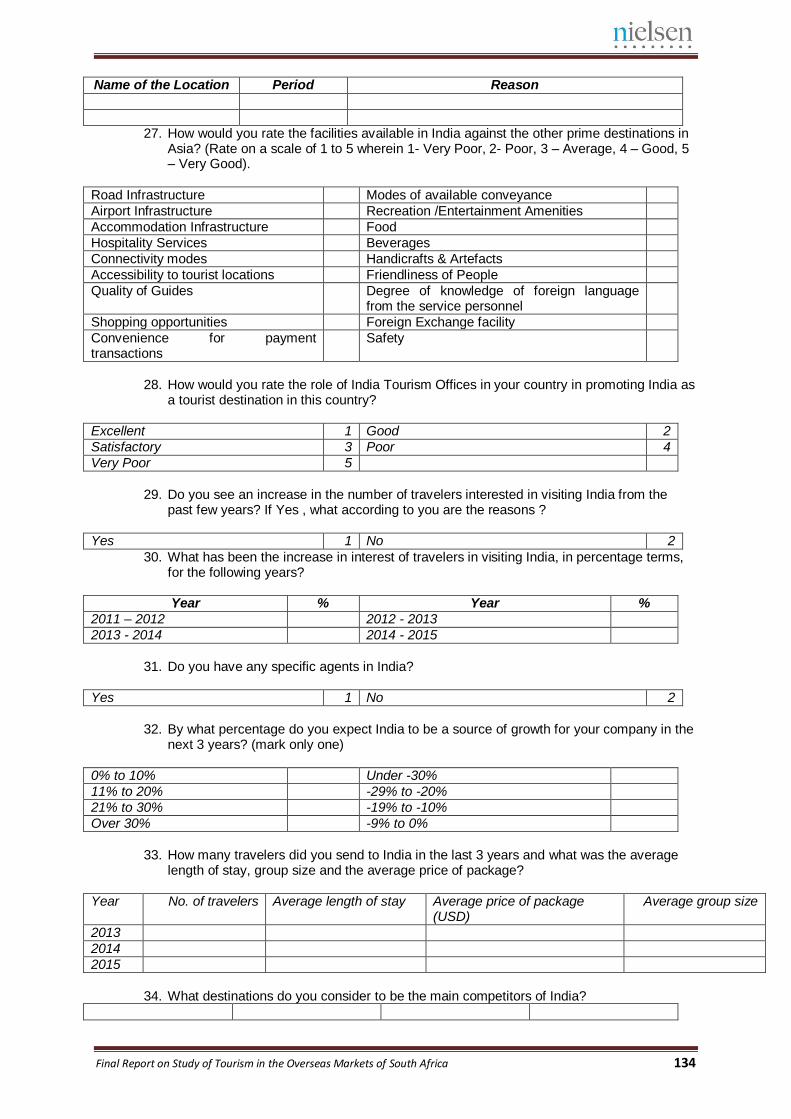
Final Report on Study of Tourism in the Overseas Markets of South Africa 134
Name of the Location Period Reason
27. How would you rate the facilities available in India against the other prime destinations in Asia? (Rate on a scale of 1 to 5 wherein 1- Very Poor, 2- Poor, 3 – Average, 4 – Good, 5 – Very Good).
Road Infrastructure Modes of available conveyance
Airport Infrastructure Recreation /Entertainment Amenities
Accommodation Infrastructure Food
Hospitality Services Beverages
Connectivity modes Handicrafts & Artefacts
Accessibility to tourist locations Friendliness of People
Quality of Guides Degree of knowledge of foreign language from the service personnel
Shopping opportunities Foreign Exchange facility
Convenience for payment transactions
Safety
28. How would you rate the role of India Tourism Offices in your country in promoting India as
a tourist destination in this country?
Excellent 1 Good 2
Satisfactory 3 Poor 4
Very Poor 5
29. Do you see an increase in the number of travelers interested in visiting India from the
past few years? If Yes , what according to you are the reasons ?
Yes 1 No 2
30. What has been the increase in interest of travelers in visiting India, in percentage terms, for the following years?
Year % Year %
2011 – 2012 2012 - 2013
2013 - 2014 2014 - 2015
31. Do you have any specific agents in India?
Yes 1 No 2
32. By what percentage do you expect India to be a source of growth for your company in the
next 3 years? (mark only one)
0% to 10% Under -30%
11% to 20% -29% to -20%
21% to 30% -19% to -10%
Over 30% -9% to 0%
33. How many travelers did you send to India in the last 3 years and what was the average
length of stay, group size and the average price of package?
Year No. of travelers Average length of stay Average price of package (USD)
Average group size
2013
2014
2015
34. What destinations do you consider to be the main competitors of India?
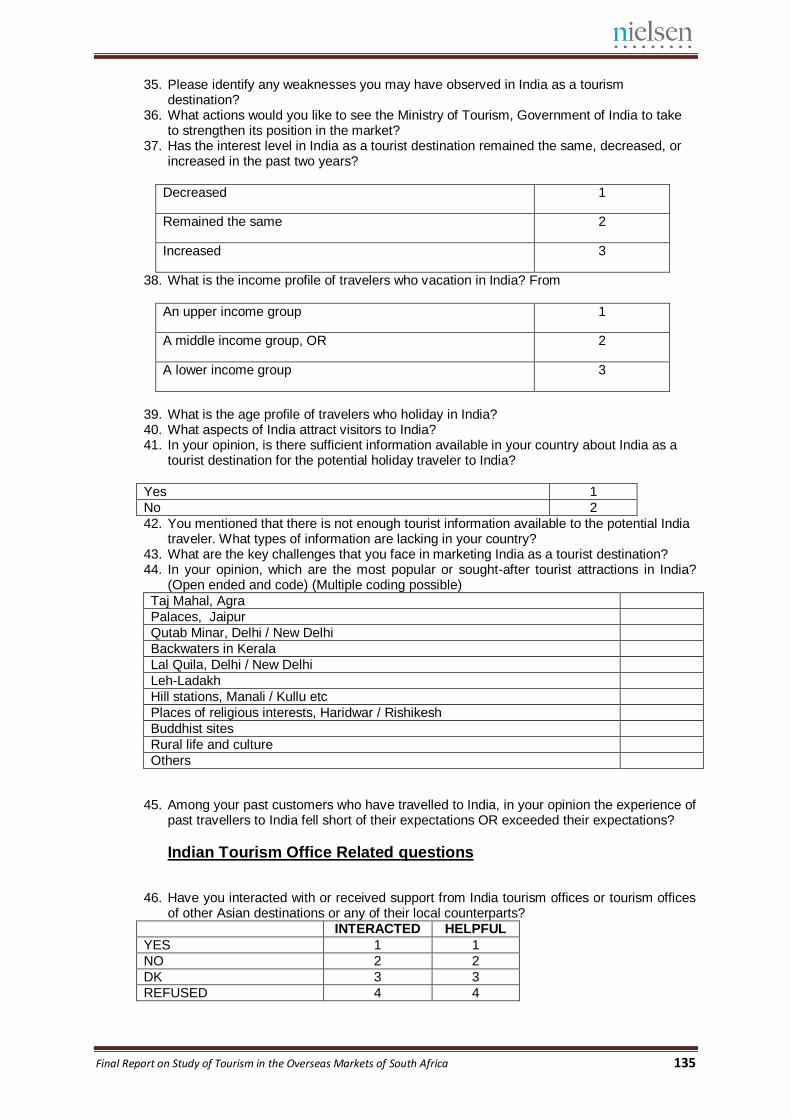
Final Report on Study of Tourism in the Overseas Markets of South Africa 135
35. Please identify any weaknesses you may have observed in India as a tourism destination?
36. What actions would you like to see the Ministry of Tourism, Government of India to take to strengthen its position in the market?
37. Has the interest level in India as a tourist destination remained the same, decreased, or increased in the past two years?
Decreased 1
Remained the same 2
Increased 3
38. What is the income profile of travelers who vacation in India? From
An upper income group 1
A middle income group, OR 2
A lower income group 3
39. What is the age profile of travelers who holiday in India? 40. What aspects of India attract visitors to India? 41. In your opinion, is there sufficient information available in your country about India as a
tourist destination for the potential holiday traveler to India?
Yes 1
No 2
42. You mentioned that there is not enough tourist information available to the potential India traveler. What types of information are lacking in your country?
43. What are the key challenges that you face in marketing India as a tourist destination? 44. In your opinion, which are the most popular or sought-after tourist attractions in India?
(Open ended and code) (Multiple coding possible)
Taj Mahal, Agra
Palaces, Jaipur
Qutab Minar, Delhi / New Delhi
Backwaters in Kerala
Lal Quila, Delhi / New Delhi
Leh-Ladakh
Hill stations, Manali / Kullu etc
Places of religious interests, Haridwar / Rishikesh
Buddhist sites
Rural life and culture
Others
45. Among your past customers who have travelled to India, in your opinion the experience of past travellers to India fell short of their expectations OR exceeded their expectations?
Indian Tourism Office Related questions
46. Have you interacted with or received support from India tourism offices or tourism offices of other Asian destinations or any of their local counterparts?
INTERACTED HELPFUL
YES 1 1
NO 2 2
DK 3 3
REFUSED 4 4
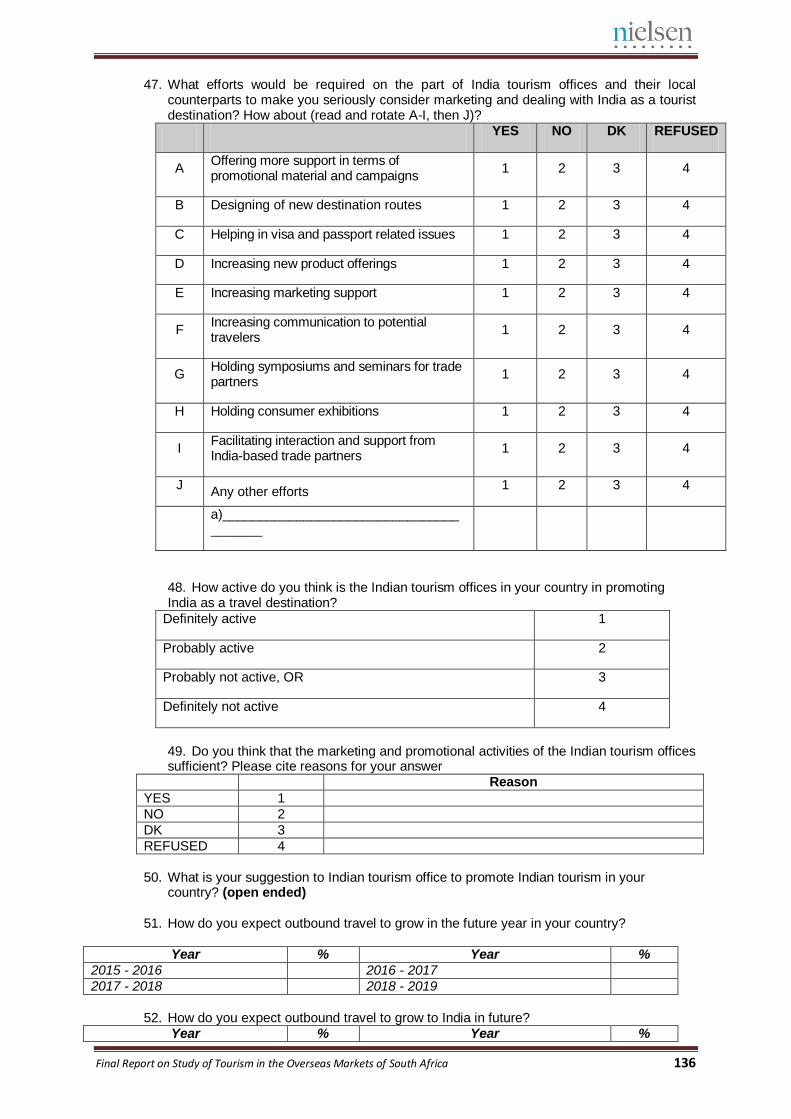
Final Report on Study of Tourism in the Overseas Markets of South Africa 136
47. What efforts would be required on the part of India tourism offices and their local counterparts to make you seriously consider marketing and dealing with India as a tourist destination? How about (read and rotate A-I, then J)?
YES NO DK REFUSED
A Offering more support in terms of promotional material and campaigns
1 2 3 4
B Designing of new destination routes 1 2 3 4
C Helping in visa and passport related issues 1 2 3 4
D Increasing new product offerings 1 2 3 4
E Increasing marketing support 1 2 3 4
F Increasing communication to potential travelers
1 2 3 4
G Holding symposiums and seminars for trade partners
1 2 3 4
H Holding consumer exhibitions 1 2 3 4
I Facilitating interaction and support from India-based trade partners
1 2 3 4
J Any other efforts
1 2 3 4
a)_______________________________________
48. How active do you think is the Indian tourism offices in your country in promoting India as a travel destination?
Definitely active 1
Probably active 2
Probably not active, OR 3
Definitely not active 4
49. Do you think that the marketing and promotional activities of the Indian tourism offices sufficient? Please cite reasons for your answer
Reason
YES 1
NO 2
DK 3
REFUSED 4
50. What is your suggestion to Indian tourism office to promote Indian tourism in your
country? (open ended) 51. How do you expect outbound travel to grow in the future year in your country?
Year % Year %
2015 - 2016 2016 - 2017
2017 - 2018 2018 - 2019
52. How do you expect outbound travel to grow to India in future?
Year % Year %
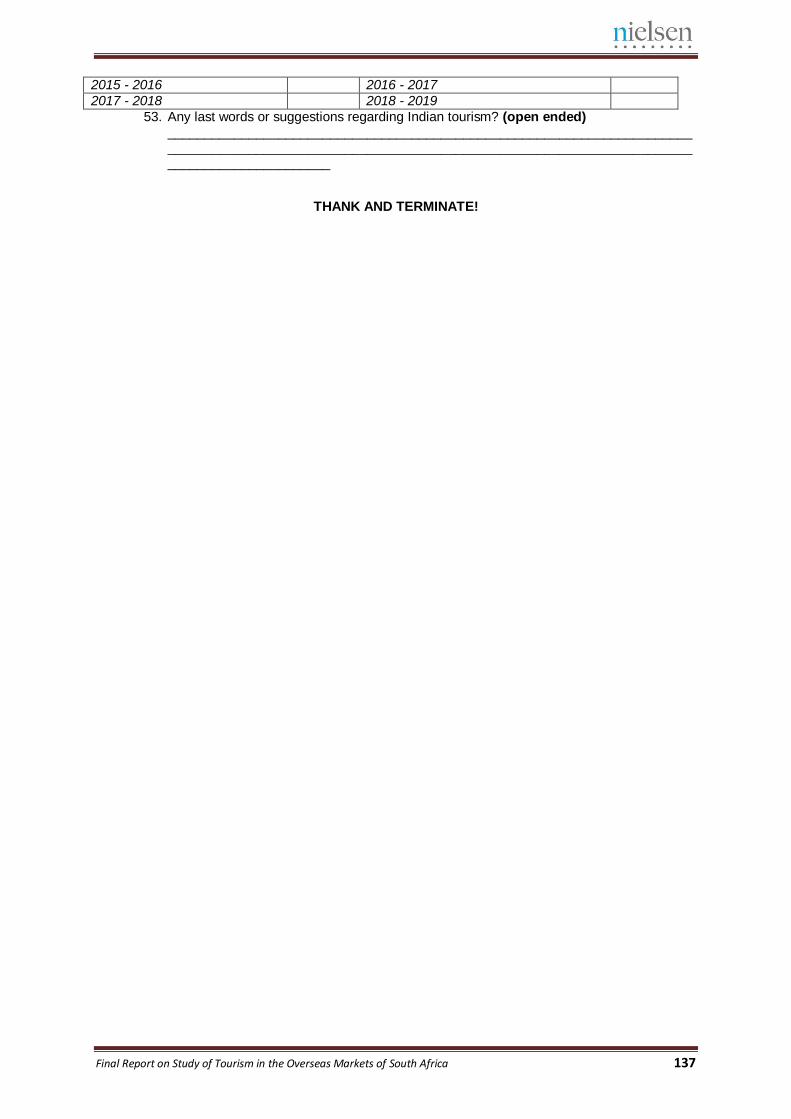
Final Report on Study of Tourism in the Overseas Markets of South Africa 137
2015 - 2016 2016 - 2017
2017 - 2018 2018 - 2019
53. Any last words or suggestions regarding Indian tourism? (open ended) ____________________________________________________________________________________________________________________________________________________________________
THANK AND TERMINATE!