Embed Size (px)
Citation preview
Study on the impact of reforms of corporate income taxation systems at the
EU level on the size of the tax bases of the EU companies, using the model
“European Tax Analyzer”
Project for the EU Commission TAXUD/2007/DE/325
FINAL REPORT
Christoph Spengel*, Andreas Oestreicher** Christina Elschner*, Timo Reister*, Christof Ernst*, Michael Grünewald*,
Katharina Finke*, Jens Prassel**, Lina Cui**
Mannheim and Göttingen, 29 th September, 2008
* Centre for European Economic Research (ZEW), ** University of Göttingen
2
Table of Contents
Executive Summary
I. Introduction: Objectives and Structure
II. Methodology for the Computation and Comparison of Effective Tax Burdens and Tax Base Effects
1. The European Tax Analyzer Model
2. Computation of the effective average tax burden
3. Tax Parameters Incorporated into the Model
4. Measurement of the Impact of Different Elements of a CCTB on the Size of
the Tax Base
5. Model-Firms and Data Base
5.1 Structure of Model-Firms and other Economic Assumptions
5.2 Data Base and Applied Aggregation Methods
III. Future Values of the Tax Bases and Effective Company Tax Burdens in the EU Member States
1. Scenario of a Common Corporate Tax Base
2. Analysis covering EU average Large Corporations
2.1 Benchmark Case Reflecting an EU-27 average Large Corporation
2.1.1 Tax Bases and Tax Burdens Based on Domestic Accounting
2.1.2 Tax Bases and Tax Burdens in Case of a CCTB
2.2 Sensitivity Analysis on Economic Model Assumptions
2.2.1 Capital Intensity
2.2.2 Profitability
2.2.3 Labour Intensity
2.2.4 Inventory Intensity
2.3 Sensitivity Analysis on Specific Sectors
2.4 Consideration of additional EU-15 / EU-12 average Large Corporations

3
3. Analysis covering EU average Small and Medium-Sized Corporations
3.1 Benchmark Case Reflecting a EU-27 average Large Corporation
3.1.1 Tax Bases and Tax Burdens Based on Domestic Accounting
3.1.2 Tax Bases and Tax Burdens in Case of a CCTB
3.2 Sensitivity Analysis on Economic Model Assumptions
3.2.1 Capital Intensity
3.2.2 Profitability
3.2.3 Labour Intensity
3.2.4 Inventory Intensity
3.3 Sensitivity Analysis on Specific Sectors
3.4 Consideration of additional EU-15 / EU-12 average Small and Medium-
Sized Corporations
3.5 A Multiple Linear Regression Model for analysing the relationship be-
tween key accounting ratios and the overall tax base effect
4. Consideration of recent national tax reforms in France, Germany, Italy, the
Netherlands and Spain
5. Summary of Conclusions
IV. References
V. Appendix
4
Executive Summary Introduction EU companies face many obstacles in their cross-border activities caused by the various corpora-tion tax systems operated in the different member states. These tax obstacles include the high compliance costs, the lack of cross-border loss-offset and the risk of double taxation as a result of conflicting rights between taxing jurisdictions. To tackle these problems, the European Commis-sion envisages putting forward a proposal for a tax reform that would allow improving the effi-ciency and simplicity of the corporate income tax systems in the EU. The most comprehensive approach would be a Common Consolidated Corporate Tax Base (CCCTB) which encompasses all elements of cross-border consolidation and loss compensation possibilities. A less far reaching approach – the Common Corporate Tax Base (CCTB) – covers all other non consolidation and non loss-compensation related provisions defining the domestic tax bases of EU companies. Purpose and Structure of the Report This report assesses the impact of a CCTB on the size of the corporate tax bases of EU compa-nies. The results of the report shall help to evaluate the economic consequences of the introduc-tion of a harmonized set of tax accounting rules for EU-based companies as promoted by the European Commission and the related Working Groups. The proposals for a CCTB covered in this report include the following elements: (A) depreciation on intangibles, machinery, buildings, furniture and fixture, (B) simplified valuation of inventories, (C) determination of production costs for stocks, (D) treatment of costs for R&D as part of production costs, (E) provisions for future pension payments, (F) provisions for legal obligations (e.g. warranty claims), (7) avoid-ance of double taxation regarding dividend income, and (G) loss relief. All proposed elements of a CCTB could be applied separately or simultaneously (I), the idea of a CCTB is clearly based on a simultaneous application of all eight elements in all 27 member states. The estimates on the size of the corporate tax bases in the event of a CCTB are based on the European Tax Analyzer. The European Tax Analyzer is a computer based model firm approach for the computation and comparison of international company tax burdens. The estimates on both the size of the corporate tax bases and the effective average tax burdens are derived by simulating the development of a corporation over a ten year period. In a first stage, this report applies the proposed options for a CCTB for both an average EU-27 large and an average EU-27 small and medium-sized corporation. The analysis is based on the tax rules as they stood in the year 2006 and takes into account the CCTB options specified by the Commission’s Steering Group. In a second stage, the report examines how the results will be affected by alternative assumptions on the economic data of the model companies. Therefore, various sensitivity analyses as well as computations for model companies belonging to different economic sectors and geographical regions (EU 15/ EU 12) are carried out. Finally, in a third stage, the effects of mayor tax reforms in five member states (Germany, France, Italy, the Netherlands and Spain) during 2006 and 2008 will be examined. Results for the Benchmark Case Scenarios
5
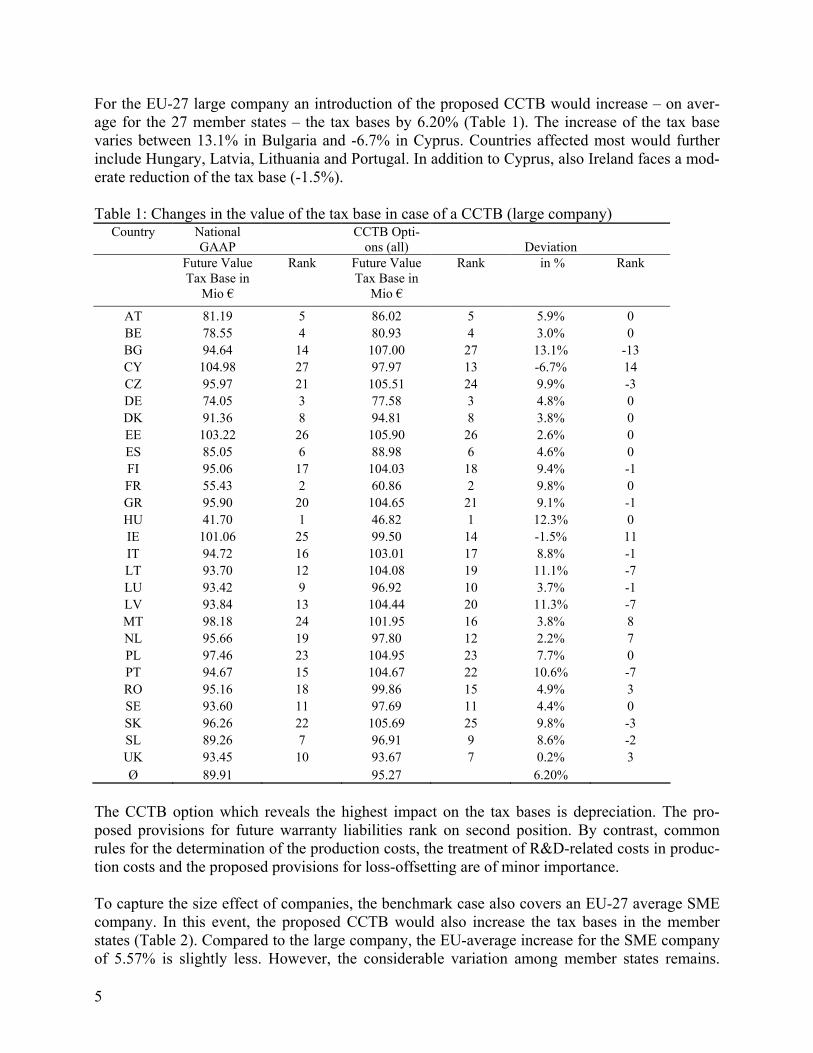
For the EU-27 large company an introduction of the proposed CCTB would increase – on aver-age for the 27 member states – the tax bases by 6.20% (Table 1). The increase of the tax base varies between 13.1% in Bulgaria and -6.7% in Cyprus. Countries affected most would further include Hungary, Latvia, Lithuania and Portugal. In addition to Cyprus, also Ireland faces a mod-erate reduction of the tax base (-1.5%). Table 1: Changes in the value of the tax base in case of a CCTB (large company)
Country National GAAP
CCTB Opti-ons (all) Deviation
Future Value Tax Base in
Mio €
Rank Future Value Tax Base in
Mio €
Rank in % Rank
AT 81.19 5 86.02 5 5.9% 0 BE 78.55 4 80.93 4 3.0% 0 BG 94.64 14 107.00 27 13.1% -13 CY 104.98 27 97.97 13 -6.7% 14 CZ 95.97 21 105.51 24 9.9% -3 DE 74.05 3 77.58 3 4.8% 0 DK 91.36 8 94.81 8 3.8% 0 EE 103.22 26 105.90 26 2.6% 0 ES 85.05 6 88.98 6 4.6% 0 FI 95.06 17 104.03 18 9.4% -1 FR 55.43 2 60.86 2 9.8% 0 GR 95.90 20 104.65 21 9.1% -1 HU 41.70 1 46.82 1 12.3% 0 IE 101.06 25 99.50 14 -1.5% 11 IT 94.72 16 103.01 17 8.8% -1 LT 93.70 12 104.08 19 11.1% -7 LU 93.42 9 96.92 10 3.7% -1 LV 93.84 13 104.44 20 11.3% -7 MT 98.18 24 101.95 16 3.8% 8 NL 95.66 19 97.80 12 2.2% 7 PL 97.46 23 104.95 23 7.7% 0 PT 94.67 15 104.67 22 10.6% -7 RO 95.16 18 99.86 15 4.9% 3 SE 93.60 11 97.69 11 4.4% 0 SK 96.26 22 105.69 25 9.8% -3 SL 89.26 7 96.91 9 8.6% -2 UK 93.45 10 93.67 7 0.2% 3 Ø 89.91 95.27 6.20%
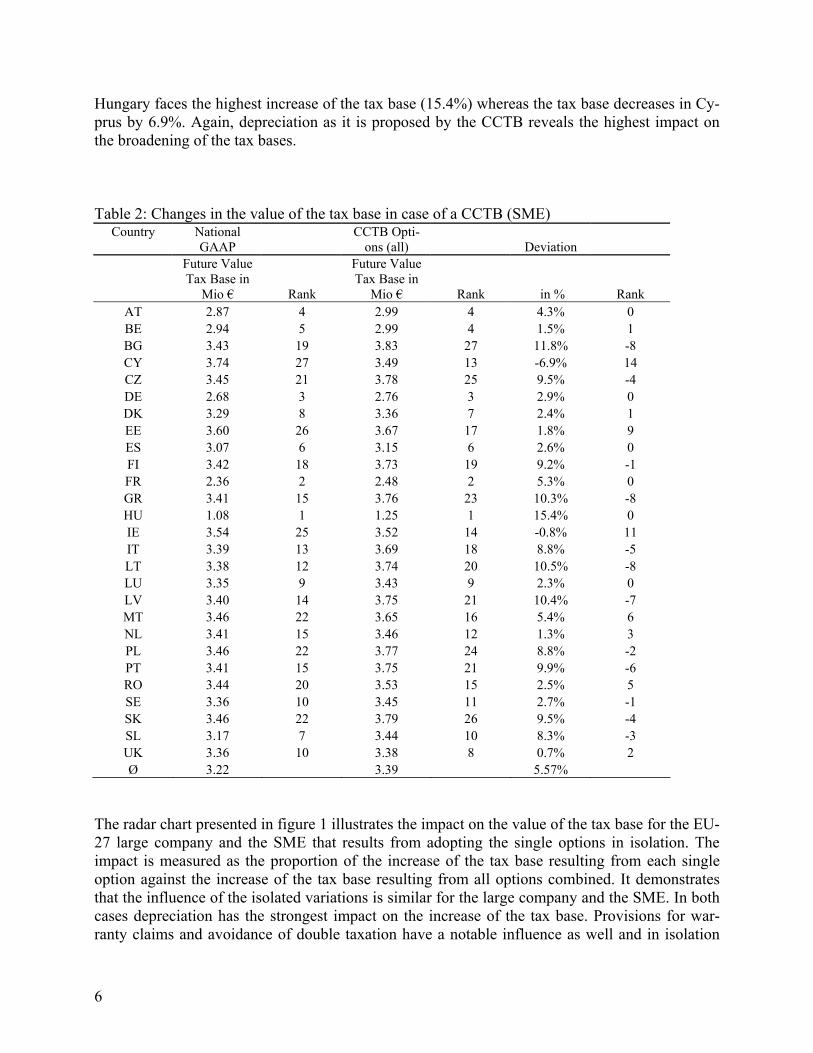
The CCTB option which reveals the highest impact on the tax bases is depreciation. The pro-posed provisions for future warranty liabilities rank on second position. By contrast, common rules for the determination of the production costs, the treatment of R&D-related costs in produc-tion costs and the proposed provisions for loss-offsetting are of minor importance. To capture the size effect of companies, the benchmark case also covers an EU-27 average SME company. In this event, the proposed CCTB would also increase the tax bases in the member states (Table 2). Compared to the large company, the EU-average increase for the SME company of 5.57% is slightly less. However, the considerable variation among member states remains.
6
Hungary faces the highest increase of the tax base (15.4%) whereas the tax base decreases in Cy-prus by 6.9%. Again, depreciation as it is proposed by the CCTB reveals the highest impact on the broadening of the tax bases. Table 2: Changes in the value of the tax base in case of a CCTB (SME)
Country National GAAP
CCTB Opti-ons (all) Deviation
Future Value Tax Base in
Mio € Rank
Future Value Tax Base in
Mio € Rank in % Rank AT 2.87 4 2.99 4 4.3% 0 BE 2.94 5 2.99 4 1.5% 1 BG 3.43 19 3.83 27 11.8% -8 CY 3.74 27 3.49 13 -6.9% 14 CZ 3.45 21 3.78 25 9.5% -4 DE 2.68 3 2.76 3 2.9% 0 DK 3.29 8 3.36 7 2.4% 1 EE 3.60 26 3.67 17 1.8% 9 ES 3.07 6 3.15 6 2.6% 0 FI 3.42 18 3.73 19 9.2% -1 FR 2.36 2 2.48 2 5.3% 0 GR 3.41 15 3.76 23 10.3% -8 HU 1.08 1 1.25 1 15.4% 0 IE 3.54 25 3.52 14 -0.8% 11 IT 3.39 13 3.69 18 8.8% -5 LT 3.38 12 3.74 20 10.5% -8 LU 3.35 9 3.43 9 2.3% 0 LV 3.40 14 3.75 21 10.4% -7 MT 3.46 22 3.65 16 5.4% 6 NL 3.41 15 3.46 12 1.3% 3 PL 3.46 22 3.77 24 8.8% -2 PT 3.41 15 3.75 21 9.9% -6 RO 3.44 20 3.53 15 2.5% 5 SE 3.36 10 3.45 11 2.7% -1 SK 3.46 22 3.79 26 9.5% -4 SL 3.17 7 3.44 10 8.3% -3 UK 3.36 10 3.38 8 0.7% 2 Ø 3.22 3.39 5.57%
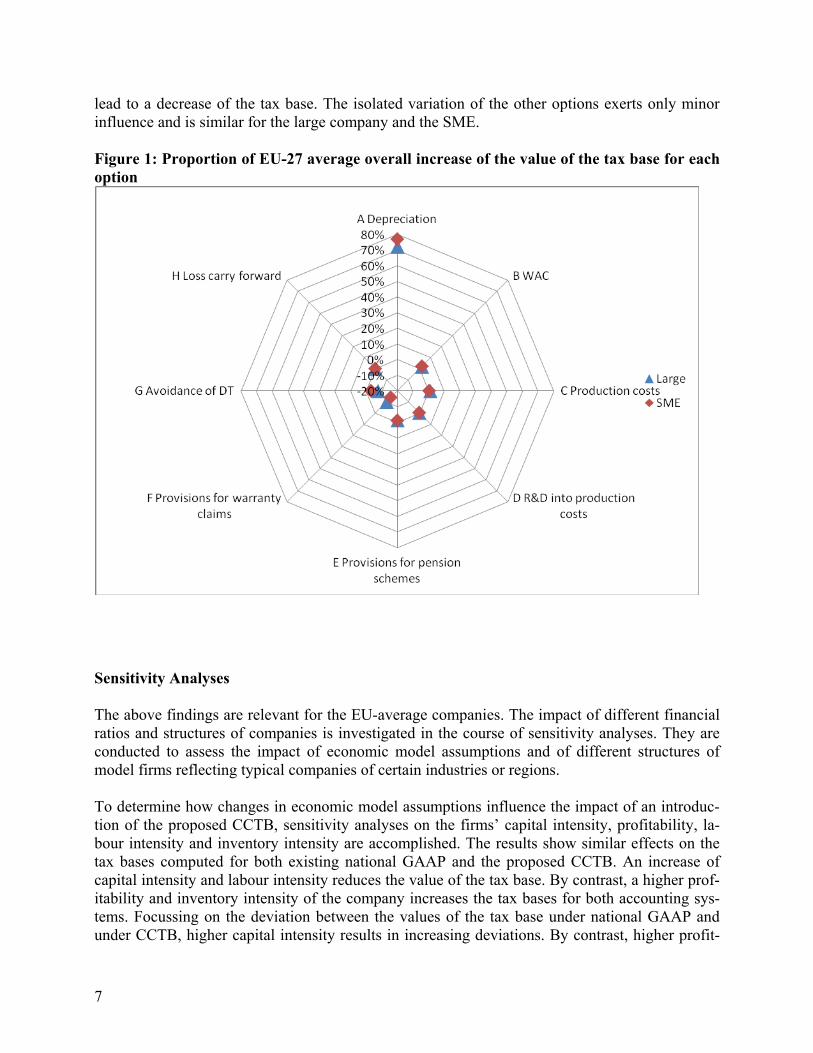
The radar chart presented in figure 1 illustrates the impact on the value of the tax base for the EU-27 large company and the SME that results from adopting the single options in isolation. The impact is measured as the proportion of the increase of the tax base resulting from each single option against the increase of the tax base resulting from all options combined. It demonstrates that the influence of the isolated variations is similar for the large company and the SME. In both cases depreciation has the strongest impact on the increase of the tax base. Provisions for war-ranty claims and avoidance of double taxation have a notable influence as well and in isolation
7
lead to a decrease of the tax base. The isolated variation of the other options exerts only minor influence and is similar for the large company and the SME. Figure 1: Proportion of EU-27 average overall increase of the value of the tax base for each option
Sensitivity Analyses The above findings are relevant for the EU-average companies. The impact of different financial ratios and structures of companies is investigated in the course of sensitivity analyses. They are conducted to assess the impact of economic model assumptions and of different structures of model firms reflecting typical companies of certain industries or regions. To determine how changes in economic model assumptions influence the impact of an introduc-tion of the proposed CCTB, sensitivity analyses on the firms’ capital intensity, profitability, la-bour intensity and inventory intensity are accomplished. The results show similar effects on the tax bases computed for both existing national GAAP and the proposed CCTB. An increase of capital intensity and labour intensity reduces the value of the tax base. By contrast, a higher prof-itability and inventory intensity of the company increases the tax bases for both accounting sys-tems. Focussing on the deviation between the values of the tax base under national GAAP and under CCTB, higher capital intensity results in increasing deviations. By contrast, higher profit-
8
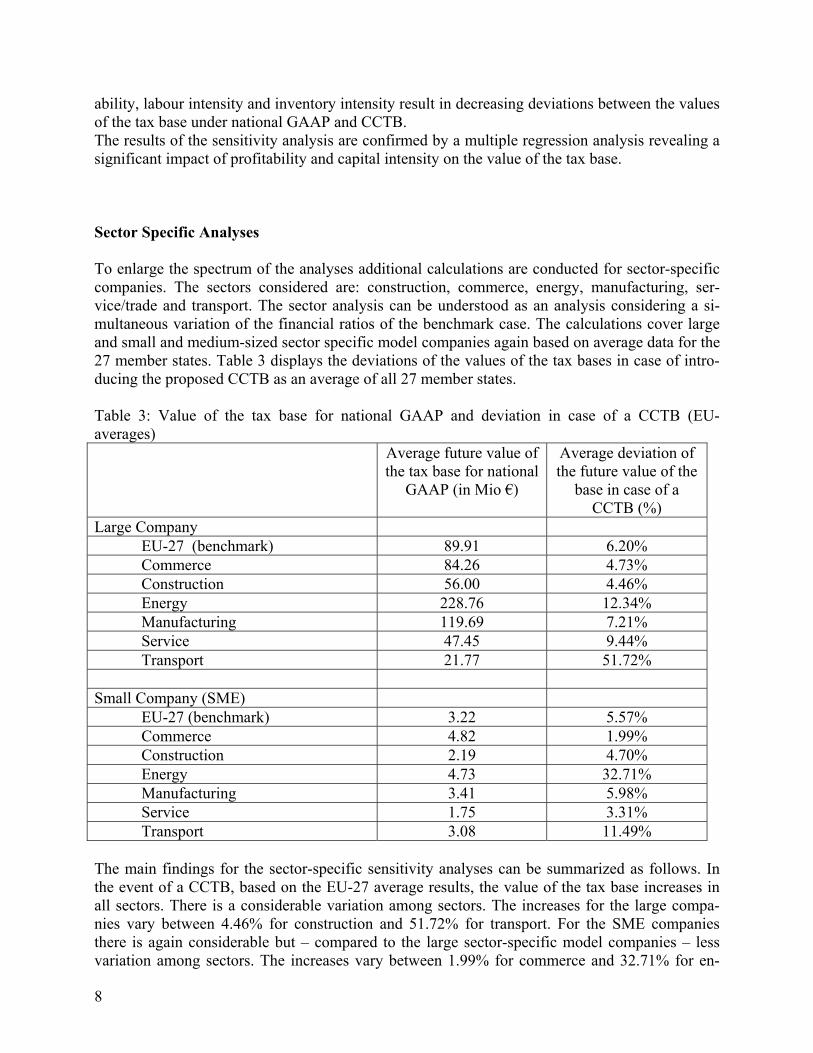
ability, labour intensity and inventory intensity result in decreasing deviations between the values of the tax base under national GAAP and CCTB. The results of the sensitivity analysis are confirmed by a multiple regression analysis revealing a significant impact of profitability and capital intensity on the value of the tax base. Sector Specific Analyses To enlarge the spectrum of the analyses additional calculations are conducted for sector-specific companies. The sectors considered are: construction, commerce, energy, manufacturing, ser-vice/trade and transport. The sector analysis can be understood as an analysis considering a si-multaneous variation of the financial ratios of the benchmark case. The calculations cover large and small and medium-sized sector specific model companies again based on average data for the 27 member states. Table 3 displays the deviations of the values of the tax bases in case of intro-ducing the proposed CCTB as an average of all 27 member states. Table 3: Value of the tax base for national GAAP and deviation in case of a CCTB (EU-averages) Average future value of
the tax base for national GAAP (in Mio €)
Average deviation of the future value of the
base in case of a CCTB (%)
Large Company EU-27 (benchmark) 89.91 6.20% Commerce 84.26 4.73% Construction 56.00 4.46% Energy 228.76 12.34% Manufacturing 119.69 7.21% Service 47.45 9.44% Transport 21.77 51.72% Small Company (SME) EU-27 (benchmark) 3.22 5.57% Commerce 4.82 1.99% Construction 2.19 4.70% Energy 4.73 32.71% Manufacturing 3.41 5.98% Service 1.75 3.31% Transport 3.08 11.49% The main findings for the sector-specific sensitivity analyses can be summarized as follows. In the event of a CCTB, based on the EU-27 average results, the value of the tax base increases in all sectors. There is a considerable variation among sectors. The increases for the large compa-nies vary between 4.46% for construction and 51.72% for transport. For the SME companies there is again considerable but – compared to the large sector-specific model companies – less variation among sectors. The increases vary between 1.99% for commerce and 32.71% for en-
9
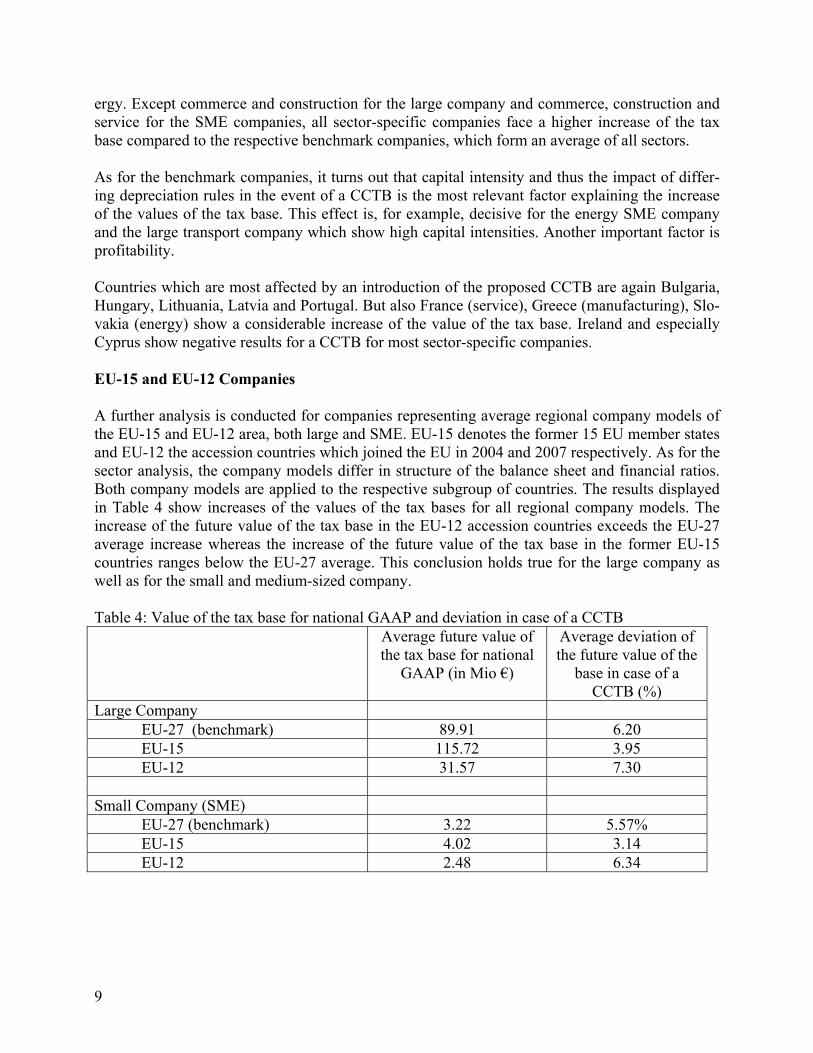
ergy. Except commerce and construction for the large company and commerce, construction and service for the SME companies, all sector-specific companies face a higher increase of the tax base compared to the respective benchmark companies, which form an average of all sectors. As for the benchmark companies, it turns out that capital intensity and thus the impact of differ-ing depreciation rules in the event of a CCTB is the most relevant factor explaining the increase of the values of the tax base. This effect is, for example, decisive for the energy SME company and the large transport company which show high capital intensities. Another important factor is profitability. Countries which are most affected by an introduction of the proposed CCTB are again Bulgaria, Hungary, Lithuania, Latvia and Portugal. But also France (service), Greece (manufacturing), Slo-vakia (energy) show a considerable increase of the value of the tax base. Ireland and especially Cyprus show negative results for a CCTB for most sector-specific companies. EU-15 and EU-12 Companies A further analysis is conducted for companies representing average regional company models of the EU-15 and EU-12 area, both large and SME. EU-15 denotes the former 15 EU member states and EU-12 the accession countries which joined the EU in 2004 and 2007 respectively. As for the sector analysis, the company models differ in structure of the balance sheet and financial ratios. Both company models are applied to the respective subgroup of countries. The results displayed in Table 4 show increases of the values of the tax bases for all regional company models. The increase of the future value of the tax base in the EU-12 accession countries exceeds the EU-27 average increase whereas the increase of the future value of the tax base in the former EU-15 countries ranges below the EU-27 average. This conclusion holds true for the large company as well as for the small and medium-sized company. Table 4: Value of the tax base for national GAAP and deviation in case of a CCTB Average future value of
the tax base for national GAAP (in Mio €)
Average deviation of the future value of the
base in case of a CCTB (%)
Large Company EU-27 (benchmark) 89.91 6.20 EU-15 115.72 3.95 EU-12 31.57 7.30 Small Company (SME) EU-27 (benchmark) 3.22 5.57% EU-15 4.02 3.14 EU-12 2.48 6.34
10
Impact of Recent Tax Reforms in Certain Member States Finally, consideration is given to major tax reforms in five countries (France, Germany, Italy, the Netherlands and Spain) which became effective in 2007 and 2008. The tax reforms resulted in a broadening of the tax bases according to national GAAP. Therefore, after the tax reforms became effective in these countries, the increases of the values of the tax base in the event of the proposed CCTB are smaller for both the EU-27 large and the EU-27 SME company. Respect given to the EU-27 average, the increases of the values of the tax base amount to 5.86% in case of the EU-27 large company (compared to 6.20% in the benchmark case) and to 5.30% in case of the EU-27 SME company (compared to 5.57% in the benchmark case). Conclusions The introduction of a CCTB as considered here has a considerable impact on the values of the tax base in the EU member states. Except for Cyprus and Ireland, the values of the tax base would increase in all countries. There is considerable variation among sectors and the size of companies. In this context, capital intensity and profitability turn out to be the most relevant factors out of the economic assump-tions in the event of a CCTB. The considered options for a CCTB show different impacts on the value of the tax base. The op-tion with the strongest impact on the tax base is the rules concerning depreciation. Countries affected most by the introduction of a CCTB are Bulgaria, Hungary, Latvia, Lithuania and Portugal. Sensitivity analyses reveal Greece, France and Slovakia as countries with strong impact as well.
11
I Introduction: Objectives and Structure
This report shall help to evaluate the economic consequences of introducing a harmonised tax base for EU-based companies as promoted by the European Commission.1 A harmonised tax base can help to eliminate the most important tax obstacles for cross-border EU-wide activities (com-pliance costs, denial of group-wide consolidation of profits and losses, transfer pricing problems and double taxation caused by cross-border reorganisations and conflicting taxing rights) stem-ming from the great diversity of the member states’ tax systems. A Common Corporate Tax Base as a policy option would replace the current 27 tax codes for the calculation of taxable income across EU member states by a single and common set of tax rules. The principle aim of this report is to provide an analysis of the consequences which an adoption of a Common Corporate Tax Base (CCTB) would have on the size of the corporate tax bases of EU companies located in each of the 27 member states, using the model of the “European Tax Analyzer”. As the concept of the CCTB is narrower compared to the concept of a Common Con-solidated Corporate Tax Base (CCCTB) which also takes into account consolidation, cross-border loss compensation and allocation of the tax bases to different member states, the latter three elements of a CCCTB are therefore not addressed in this study. More specifically, our study evaluates the impact on the size of the EU companies’ tax bases and therefore on the EU companies’ effective tax burdens of moving from the national corporate tax systems to alternative options for a CCTB, i.e. to an EU-wide harmonisation of selected non-consolidation and non cross-border loss-compensation related major provisions of the corporate tax base. In order to achieve reliable results, the quantitative analysis is based on standard EU-27-average large and small/medium companies. Furthermore, we not only analyse the cumulative effects of common tax accounting rules on the tax base and on the effective tax burdens, but also isolated effects of the different elements of a CCTB. According to the terms of reference, the idea of the quantitative analysis is to measure the corpo-rate tax base defined by current national tax provisions (benchmark case) for different types of “EU companies” in each member state and to compare the results with the tax base that results for these companies in each member state from the application of alternative options for a CCTB. These options were provided by the Commission. The benchmark case takes into account the EU member states’ tax provisions as the law stood for the fiscal year 2006. Since the focus of this report is on the corporation tax base and the resulting effective tax burdens of companies, the analysis is limited to corporations (i.e. transparent entities are not taken into account) and to taxes borne at the corporate level (i.e. personal taxes of shareholders are not taken into account). In order to estimate the quantitative effects of alternative options for a CCTB on the size of EU company tax bases by computing tax bases and effective company tax burdens it was first of all
1 This is a final report as outlined in the contract for TAXUD/2007/AO-010.
12
necessary to collect and verify the relevant tax variables as defined by national tax provisions for the fiscal year 2006 in each of the 27 EU member states. The tax data collected by the applicants was made available in form of tables to the Commission’s Steering Group in December 2007 and confirmed by the Steering Group in January 2008. Furthermore, alternative options for a CCTB underlying this report were defined in co-operation with the Commission’s Steering Group in January 2008. On this basis verified data and alternative options for a CCTB were implemented into the model of the “European Tax Analyzer”. Furthermore, company data for the different types of EU com-panies was extracted from databases covering balance sheet and statement of profit and loss data for EU-based companies and was also implemented into the “European Tax Analyzer”. With these steps the qualifications for the quantitative analysis were fulfilled. The report is divided into two broad sections. Section 2 introduces the European Tax Analyzer and the underlying methodological concept for the computation of tax bases and effective com-pany tax burdens. Since the European Tax Analyzer Model has already been approved by the European Commission in an earlier report commissioned by the Commission (see Jacobs/Spengel (2002)), the description only highlights the main underlying assumptions and recent modifica-tions and improvements of this approach. In addition to that it contains a detailed description about the way company data for different types of EU companies was derived from the AMA-DEUS database and aggregated to model firm data. Section 3 then computes and analyses the effects on tax bases and effective tax burdens resulting from the adoption of a CCTB in the 27 EU member states. Section 3 is divided into three stages. In a first stage, this report applies the proposed options for a CCTB for both an average EU-27 large and an average EU-27 small and medium-sized corporation. The analysis is based on the tax rules as they stood in the year 2006 and takes into account the CCTB options specified by the Commission’s Steering Group. In a second stage, the report examines how the results will be affected by alternative assumptions on the economic data of the model companies. Therefore, various sensitivity analyses as well as computations for model companies belonging to different economic sectors and geographical regions (EU 15/ EU 12) are carried out. Finally, in a third stage, the effects of mayor tax reforms in five member states (Germany, France, Italy, the Netherlands and Spain) during 2006 and 2008 will be examined. .
II Methodology for the Computation and Comparison of Effective Tax Burdens and Tax Base Effects
1 The European Tax Analyzer Model
The European Tax Analyzer is a computer program for a model firm that calculates and compares effective average tax burdens for companies located in different jurisdictions.2 The current ver-sion covers the tax systems of 27 member states. Since the standard model firm is designed as a
2 For detailed descriptions of the model see Spengel, 1995; Jacobs and Spengel, 1996; Meyer, 1996; Stetter, 2005; Gutekunst, 2005, Hermann, 2006.
13
corporation, the effective average tax burden can be calculated at the level of the corporation as well as at the level of the shareholders. This study will exclusively consider the effective average tax burden at the corporation level. The effective average tax burden is derived by simulating the development of a corporation over a ten year period. For the computation of the effective average tax burden the model uses the economic data of the corporation and tax data as inputs. The European Tax Analyzer Model was approved in an earlier study for the European Commis-sion (see Jacobs/Spengel (2002)). The following description therefore highlights only the basic assumptions and the most recent amendments of this approach. The European Tax Analyzer cal-culates and compares effective average tax burdens for companies over a period of ten years. The development of the corporation is based on the initial capital stock and the estimates for its future development (corporate planning).
A. Initial capital stock: The capital stock includes the firm’s total assets and liabilities which are either new or have already existed before. The assets consist of real estate, office and factory buildings, plant and machinery, office equipment, intangibles (patents and royalties), financial assets, shares in other corporations (both domestic and foreign), inventories, trade debtors, cash funds, and deposits. The liabilities include new equity capital, long-term and short-term debt, and trade creditors.
B. Development of capital stock: Corporate planning supplies data about the expected develop-ment of the capital stock over the simulation period of ten years. Estimates are based on peri-odical assumptions for production and sales, acquisition of goods, staff expenditure (e.g. num-ber of employees, wage per employee and pension costs), other receipts and expenses (e.g. ex-penses for R&D), investment, distribution, and costs of financing. Goods are assumed to be ei-ther stocked or sold on the market in the same period as they are produced. Therefore, multi-period production is possible. Additional assumptions are made for material and labour with regard to production costs. It is further assumed that depreciable assets (i.e. buildings, plant and machinery, office equipment, and intangibles) are run down at the end of their expected economic life. Reinvestments in new assets are made at that point based on the historical costs of the deposited assets adjusted for inflation. The model’s assumptions regarding investment make sure that the initial capital stock at least remains constant. In addition to differing rates of price increases, other macro-economic data considered are credit and debit interest rates, exchange rates for the given countries and the costs of energy and electricity.
C. Corporate finance: The initial capital stock contains new equity as well as both long and short term debt capital. Since the corporate plans, inter alia, make assumptions about the dis-tribution policy, the company can be financed by retained earnings (e.g. the distribution rate is below 100%) in addition to new equity and debt financing. If the national tax codes allow for internal book reserves (e.g. book reserves for bad debts), the money put into these reserves can also serve as a source of internal financing.
For the sake of comparability, it is assumed that the model firm always shows identical data be-fore any taxation. Due to this necessary assumption any differences between pre- and post-tax data in the model can be solely attributed to the applied national taxation rules.
2 Computation of the Effective Average Tax Burden
14
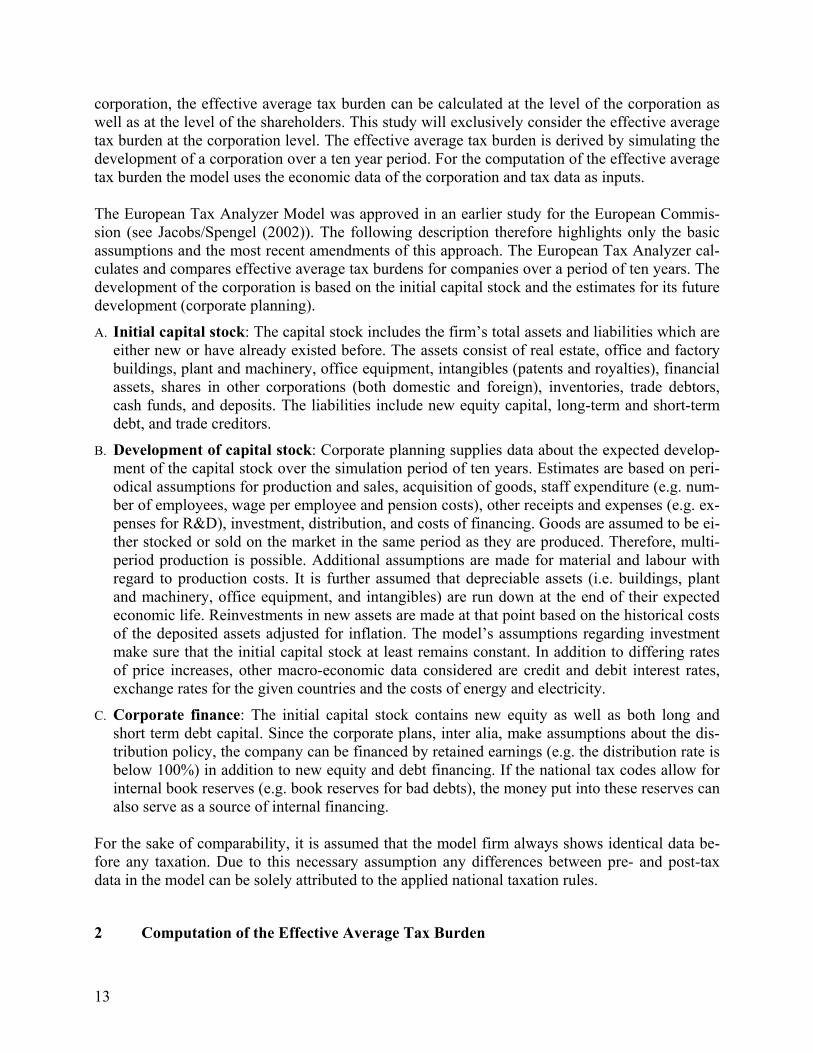
The measures for tax base and for tax burden are expressed in currency units. The effective tax burden is the difference between the pre-tax and the post-tax value of the firm at the end of the simulation period (i.e. period 10). The value of the firm is represented by the equity, which in-cludes the capital stock and the cumulative net income of each of the ten periods. At the end of period ten, the tax value of assets and liabilities may differ from their fair value, depending on the tax rules which are to be applied. These hidden reserves and liabilities are added to the taxable income in period ten and are taxed accordingly. As a consequence, only the effects of different tax accounting rules on the liquidity are taken into account. Remaining loss carry forwards at the end of the simulation are dissolved liquidity-related whereas a devaluation of 50 per cent is made if there are no restrictions for the use of loss carry forwards and a devaluation of 75 per cent if there are any restrictions. The computation of the absolute effective average tax burden requires two steps. In the first step, the pre-tax value of the firm at the end of the simulation period is calculated. The pre-tax value of the firm is derived from the estimated cash flows and the value of the net assets at the end of the simulation period. The cash flows are derived from estimates for the cash receipts (sales and other receipts, gains upon the disposal of assets, interest and dividend income) and expenses (wages and pension payments, expenses for material, energy consumption and other expenses, new investment, interest expenses and distributed profits) covered by the corpo-rate planning model. The cash flow (= liquidity) is calculated in each period. Thereby it is as-sumed that any given amount of surplus cash flow at the end of a single period can be invested at a given interest rate and any given deficit can be covered by borrowing money at a given debit rate (balancing investment or credit). The interest receipts or expenses plus the amount of the underlying balancing investments or credits are considered for the calculation of the cash flow in the following period. The value of the net assets at the end of the simulation period is computed by deducting the liabilities of the corporation from the assets. Both the assets and the liabilities are valued at calibrated parameters that are the same in each country. For assets we use replace-ment prices and for liabilities nominal values.
Pre-tax cash flow at the end of the simulation period
+ Value of the net assets at the end of the simulation period (= assets in the capital stock at replacement prices
– liabilities in the capital stock at nominal values)
= Pre-tax value of the firm at the end of the simulation period
In the second step, we calculate the post-tax value of the firm at the end of the simulation period. The determination of the post-tax value of the firm only has cash flow effects and no impact on the value of the net assets. The post-tax cash flow is derived in each period by deducting the tax liabilities from the pre-tax cash flow. In order to calculate the absolute amount of tax liabilities, receipts and expenses enter into the tax balance sheet and/ or into the tax profit and loss account following national taxation rules (e.g. regarding the computation of depreciation allowances). After having applied the national tax rates, we allow for other relevant components such as loss carryovers and tax credits in order to come to the amount of tax liabilities. The reduction of the cash flow due to tax payments (liabilities) also has an impact on the balancing investment or credit and the connected interest receipts or credits. By taking into account these tax-induced ef-fects on the interest income or expense of each period, the deferral of tax payments is integrated
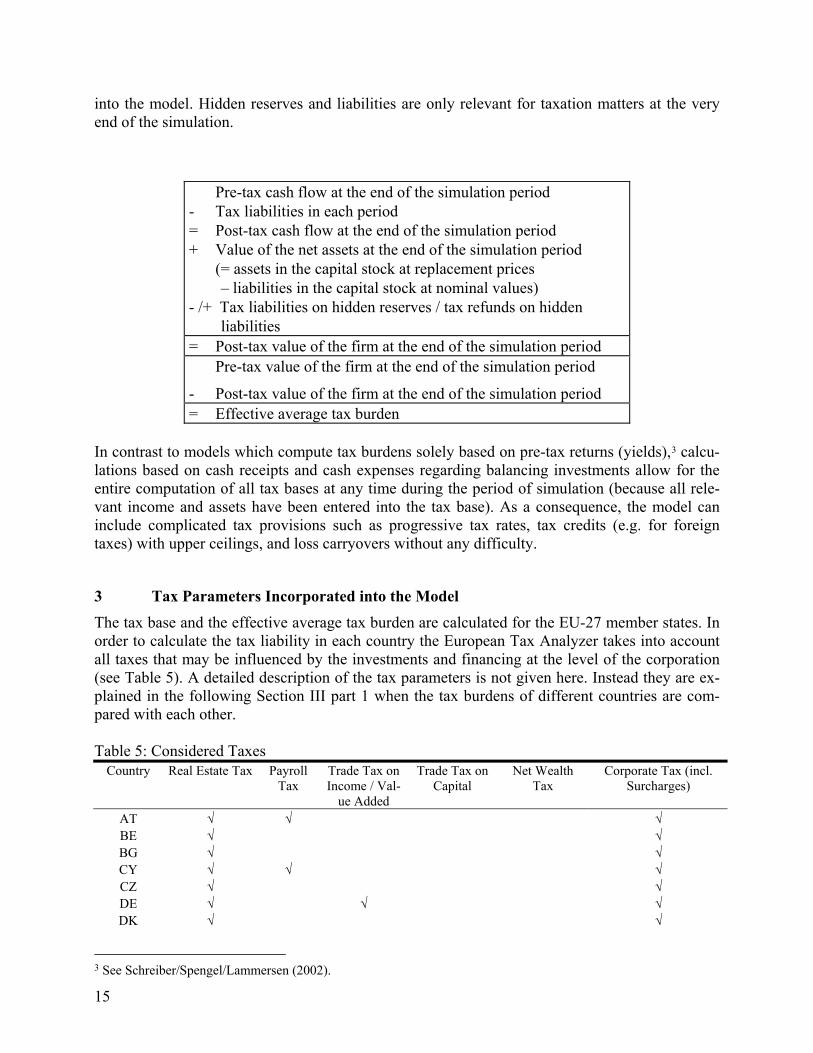
15
into the model. Hidden reserves and liabilities are only relevant for taxation matters at the very end of the simulation.
Pre-tax cash flow at the end of the simulation period - Tax liabilities in each period = Post-tax cash flow at the end of the simulation period + Value of the net assets at the end of the simulation period (= assets in the capital stock at replacement prices – liabilities in the capital stock at nominal values) - /+ Tax liabilities on hidden reserves / tax refunds on hidden liabilities = Post-tax value of the firm at the end of the simulation period Pre-tax value of the firm at the end of the simulation period
- Post-tax value of the firm at the end of the simulation period = Effective average tax burden
In contrast to models which compute tax burdens solely based on pre-tax returns (yields),3 calcu-lations based on cash receipts and cash expenses regarding balancing investments allow for the entire computation of all tax bases at any time during the period of simulation (because all rele-vant income and assets have been entered into the tax base). As a consequence, the model can include complicated tax provisions such as progressive tax rates, tax credits (e.g. for foreign taxes) with upper ceilings, and loss carryovers without any difficulty.
3 Tax Parameters Incorporated into the Model
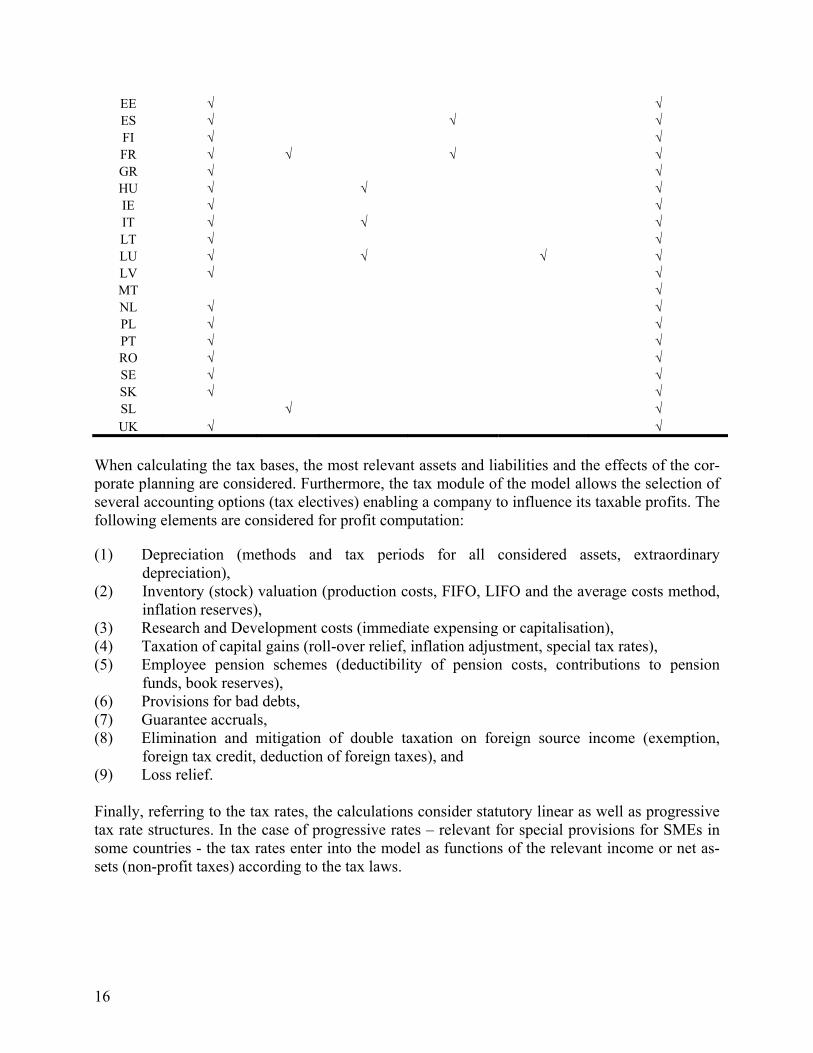
The tax base and the effective average tax burden are calculated for the EU-27 member states. In order to calculate the tax liability in each country the European Tax Analyzer takes into account all taxes that may be influenced by the investments and financing at the level of the corporation (see Table 5). A detailed description of the tax parameters is not given here. Instead they are ex-plained in the following Section III part 1 when the tax burdens of different countries are com-pared with each other. Table 5: Considered Taxes
Country Real Estate Tax Payroll Tax
Trade Tax on Income / Val-
ue Added
Trade Tax on Capital
Net Wealth Tax
Corporate Tax (incl. Surcharges)
AT √ √ √ BE √ √ BG √ √ CY √ √ √ CZ √ √ DE √ √ √ DK √ √
3 See Schreiber/Spengel/Lammersen (2002).
16
EE √ √ ES √ √ √ FI √ √ FR √ √ √ √ GR √ √ HU √ √ √ IE √ √ IT √ √ √ LT √ √ LU √ √ √ √ LV √ √ MT √ NL √ √ PL √ √ PT √ √ RO √ √ SE √ √ SK √ √ SL √ √ UK √ √
When calculating the tax bases, the most relevant assets and liabilities and the effects of the cor-porate planning are considered. Furthermore, the tax module of the model allows the selection of several accounting options (tax electives) enabling a company to influence its taxable profits. The following elements are considered for profit computation:
(1) Depreciation (methods and tax periods for all considered assets, extraordinary depreciation),
(2) Inventory (stock) valuation (production costs, FIFO, LIFO and the average costs method, inflation reserves),
(3) Research and Development costs (immediate expensing or capitalisation), (4) Taxation of capital gains (roll-over relief, inflation adjustment, special tax rates), (5) Employee pension schemes (deductibility of pension costs, contributions to pension
funds, book reserves), (6) Provisions for bad debts, (7) Guarantee accruals, (8) Elimination and mitigation of double taxation on foreign source income (exemption,
foreign tax credit, deduction of foreign taxes), and (9) Loss relief. Finally, referring to the tax rates, the calculations consider statutory linear as well as progressive tax rate structures. In the case of progressive rates – relevant for special provisions for SMEs in some countries - the tax rates enter into the model as functions of the relevant income or net as-sets (non-profit taxes) according to the tax laws.
17
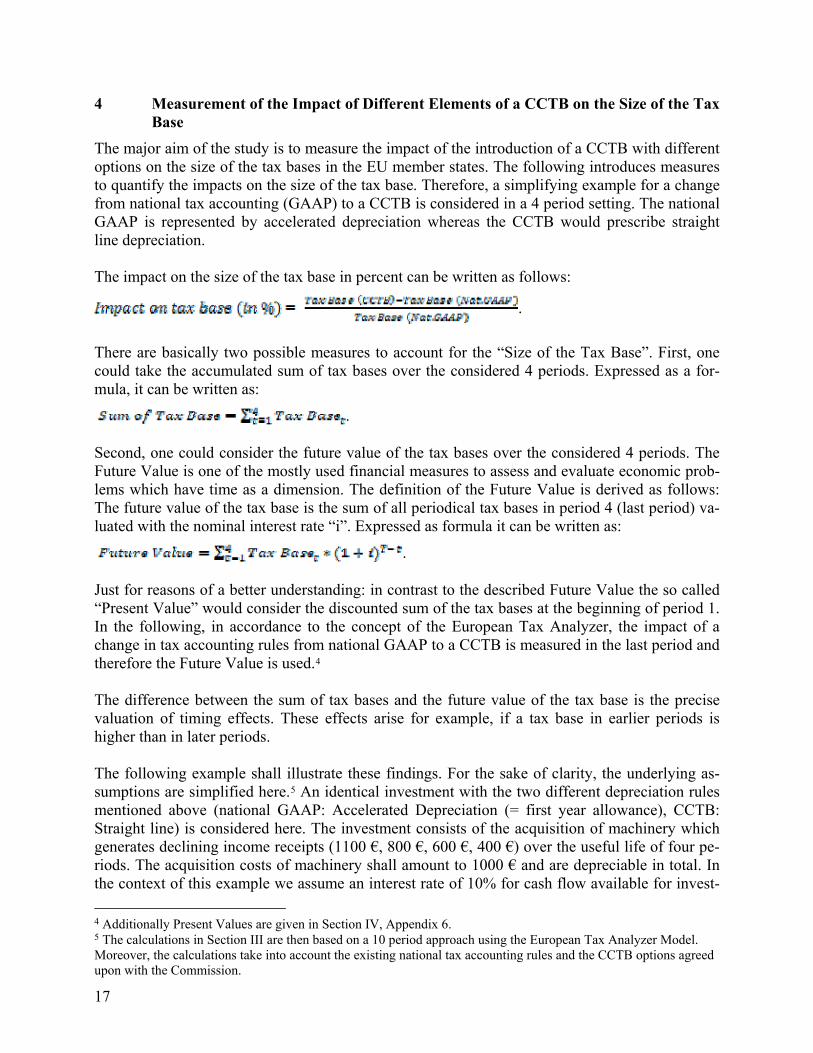
4 Measurement of the Impact of Different Elements of a CCTB on the Size of the Tax Base
The major aim of the study is to measure the impact of the introduction of a CCTB with different options on the size of the tax bases in the EU member states. The following introduces measures to quantify the impacts on the size of the tax base. Therefore, a simplifying example for a change from national tax accounting (GAAP) to a CCTB is considered in a 4 period setting. The national GAAP is represented by accelerated depreciation whereas the CCTB would prescribe straight line depreciation. The impact on the size of the tax base in percent can be written as follows:
.
There are basically two possible measures to account for the “Size of the Tax Base”. First, one could take the accumulated sum of tax bases over the considered 4 periods. Expressed as a for-mula, it can be written as:
. Second, one could consider the future value of the tax bases over the considered 4 periods. The Future Value is one of the mostly used financial measures to assess and evaluate economic prob-lems which have time as a dimension. The definition of the Future Value is derived as follows: The future value of the tax base is the sum of all periodical tax bases in period 4 (last period) va-luated with the nominal interest rate “i”. Expressed as formula it can be written as:
. Just for reasons of a better understanding: in contrast to the described Future Value the so called “Present Value” would consider the discounted sum of the tax bases at the beginning of period 1. In the following, in accordance to the concept of the European Tax Analyzer, the impact of a change in tax accounting rules from national GAAP to a CCTB is measured in the last period and therefore the Future Value is used.4 The difference between the sum of tax bases and the future value of the tax base is the precise valuation of timing effects. These effects arise for example, if a tax base in earlier periods is higher than in later periods. The following example shall illustrate these findings. For the sake of clarity, the underlying as-sumptions are simplified here.5 An identical investment with the two different depreciation rules mentioned above (national GAAP: Accelerated Depreciation (= first year allowance), CCTB: Straight line) is considered here. The investment consists of the acquisition of machinery which generates declining income receipts (1100 €, 800 €, 600 €, 400 €) over the useful life of four pe-riods. The acquisition costs of machinery shall amount to 1000 € and are depreciable in total. In the context of this example we assume an interest rate of 10% for cash flow available for invest-
4 Additionally Present Values are given in Section IV, Appendix 6. 5 The calculations in Section III are then based on a 10 period approach using the European Tax Analyzer Model. Moreover, the calculations take into account the existing national tax accounting rules and the CCTB options agreed upon with the Commission.

18
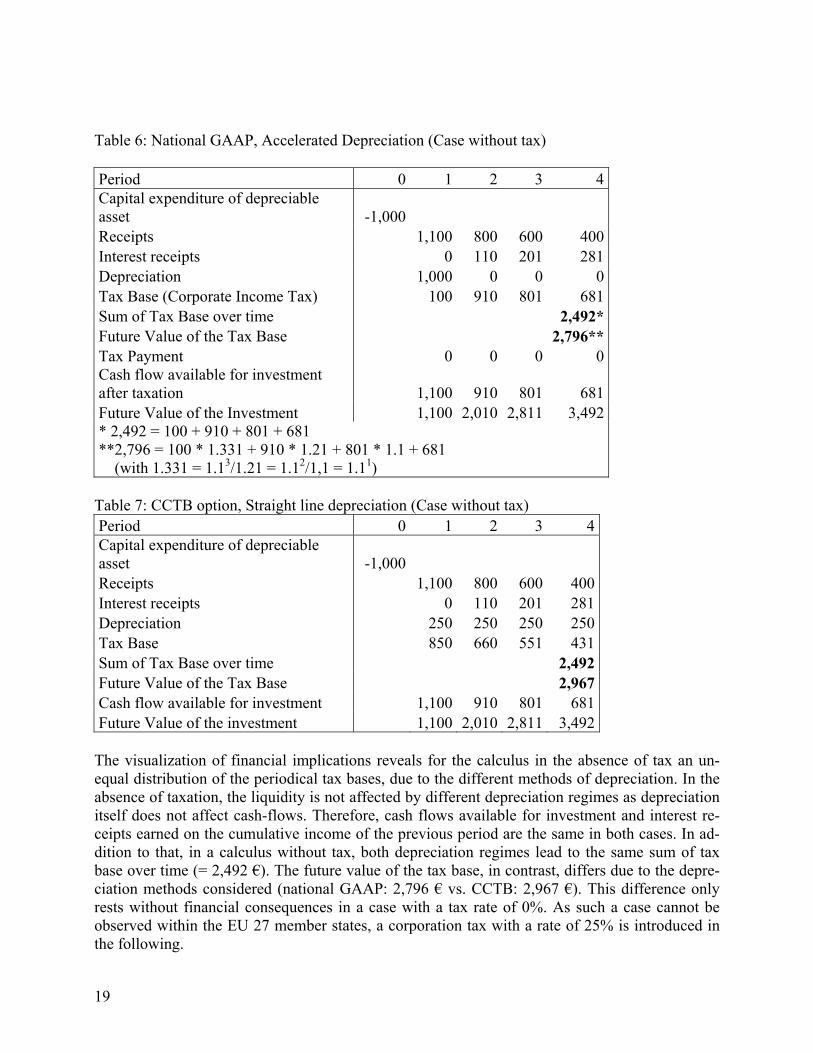
ment (liquidity) in order to gain distinct results. The future value of the tax base is obtained by valuating the tax base of each period with an interest rate of 10%. In the first example, the corporate income tax rate shall be 0% (i.e. no tax is levied). Thus, to illu-strate the influence of the temporal distribution of the tax base, we oppose national GAAP (accel-erated depreciation, see table 6) to a CCTB option (straight line depreciation, see table 7).
19
Table 6: National GAAP, Accelerated Depreciation (Case without tax) Period 0 1 2 3 4 Capital expenditure of depreciable asset -1,000 Receipts 1,100 800 600 400 Interest receipts 0 110 201 281 Depreciation 1,000 0 0 0 Tax Base (Corporate Income Tax) 100 910 801 681 Sum of Tax Base over time 2,492* Future Value of the Tax Base 2,796** Tax Payment 0 0 0 0 Cash flow available for investment after taxation 1,100 910 801 681 Future Value of the Investment 1,100 2,010 2,811 3,492 * 2,492 = 100 + 910 + 801 + 681 **2,796 = 100 * 1.331 + 910 * 1.21 + 801 * 1.1 + 681 (with 1.331 = 1.13/1.21 = 1.12/1,1 = 1.11)
Table 7: CCTB option, Straight line depreciation (Case without tax) Period 0 1 2 3 4 Capital expenditure of depreciable asset -1,000 Receipts 1,100 800 600 400 Interest receipts 0 110 201 281 Depreciation 250 250 250 250 Tax Base 850 660 551 431 Sum of Tax Base over time 2,492 Future Value of the Tax Base 2,967 Cash flow available for investment 1,100 910 801 681 Future Value of the investment 1,100 2,010 2,811 3,492
The visualization of financial implications reveals for the calculus in the absence of tax an un-equal distribution of the periodical tax bases, due to the different methods of depreciation. In the absence of taxation, the liquidity is not affected by different depreciation regimes as depreciation itself does not affect cash-flows. Therefore, cash flows available for investment and interest re-ceipts earned on the cumulative income of the previous period are the same in both cases. In ad-dition to that, in a calculus without tax, both depreciation regimes lead to the same sum of tax base over time (= 2,492 €). The future value of the tax base, in contrast, differs due to the depre-ciation methods considered (national GAAP: 2,796 € vs. CCTB: 2,967 €). This difference only rests without financial consequences in a case with a tax rate of 0%. As such a case cannot be observed within the EU 27 member states, a corporation tax with a rate of 25% is introduced in the following.
20
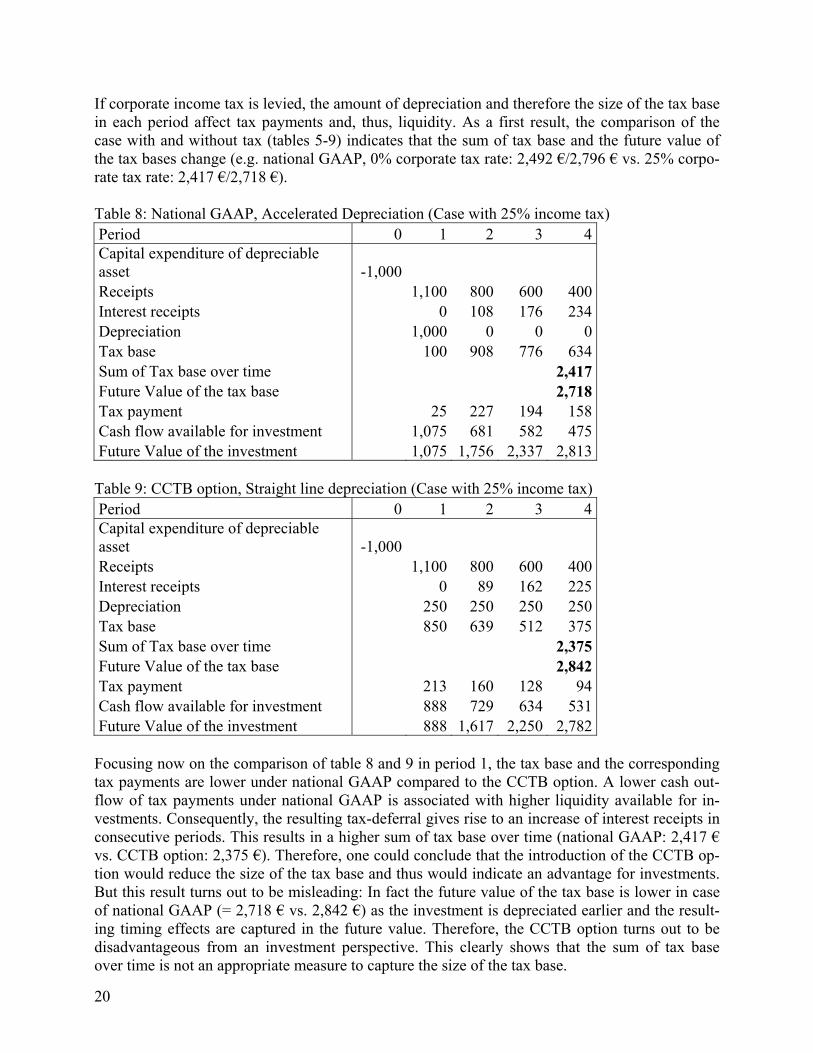
If corporate income tax is levied, the amount of depreciation and therefore the size of the tax base in each period affect tax payments and, thus, liquidity. As a first result, the comparison of the case with and without tax (tables 5-9) indicates that the sum of tax base and the future value of the tax bases change (e.g. national GAAP, 0% corporate tax rate: 2,492 €/2,796 € vs. 25% corpo-rate tax rate: 2,417 €/2,718 €). Table 8: National GAAP, Accelerated Depreciation (Case with 25% income tax)
Period 0 1 2 3 4 Capital expenditure of depreciable asset -1,000 Receipts 1,100 800 600 400 Interest receipts 0 108 176 234 Depreciation 1,000 0 0 0 Tax base 100 908 776 634 Sum of Tax base over time 2,417 Future Value of the tax base 2,718 Tax payment 25 227 194 158 Cash flow available for investment 1,075 681 582 475 Future Value of the investment 1,075 1,756 2,337 2,813
Table 9: CCTB option, Straight line depreciation (Case with 25% income tax)
Period 0 1 2 3 4 Capital expenditure of depreciable asset -1,000 Receipts 1,100 800 600 400 Interest receipts 0 89 162 225 Depreciation 250 250 250 250 Tax base 850 639 512 375 Sum of Tax base over time 2,375 Future Value of the tax base 2,842 Tax payment 213 160 128 94 Cash flow available for investment 888 729 634 531 Future Value of the investment 888 1,617 2,250 2,782
Focusing now on the comparison of table 8 and 9 in period 1, the tax base and the corresponding tax payments are lower under national GAAP compared to the CCTB option. A lower cash out-flow of tax payments under national GAAP is associated with higher liquidity available for in-vestments. Consequently, the resulting tax-deferral gives rise to an increase of interest receipts in consecutive periods. This results in a higher sum of tax base over time (national GAAP: 2,417 € vs. CCTB option: 2,375 €). Therefore, one could conclude that the introduction of the CCTB op-tion would reduce the size of the tax base and thus would indicate an advantage for investments. But this result turns out to be misleading: In fact the future value of the tax base is lower in case of national GAAP (= 2,718 € vs. 2,842 €) as the investment is depreciated earlier and the result-ing timing effects are captured in the future value. Therefore, the CCTB option turns out to be disadvantageous from an investment perspective. This clearly shows that the sum of tax base over time is not an appropriate measure to capture the size of the tax base.
21
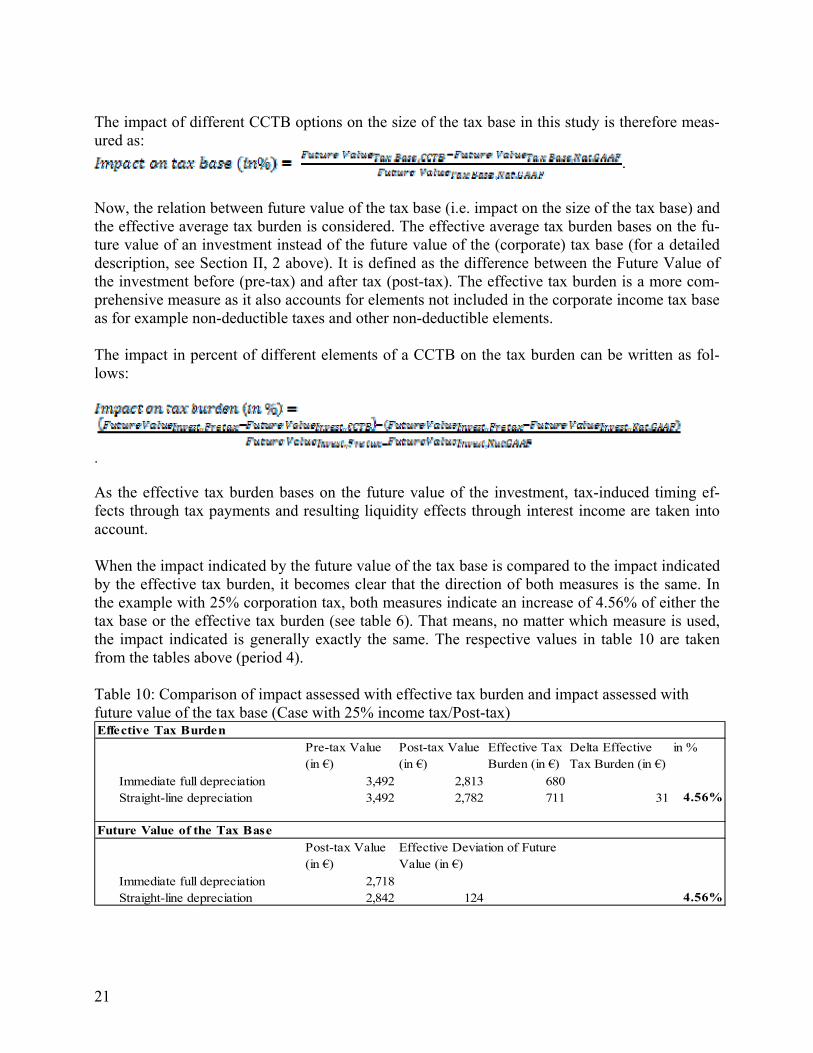
The impact of different CCTB options on the size of the tax base in this study is therefore meas-ured as:
.
Now, the relation between future value of the tax base (i.e. impact on the size of the tax base) and the effective average tax burden is considered. The effective average tax burden bases on the fu-ture value of an investment instead of the future value of the (corporate) tax base (for a detailed description, see Section II, 2 above). It is defined as the difference between the Future Value of the investment before (pre-tax) and after tax (post-tax). The effective tax burden is a more com-prehensive measure as it also accounts for elements not included in the corporate income tax base as for example non-deductible taxes and other non-deductible elements. The impact in percent of different elements of a CCTB on the tax burden can be written as fol-lows:
. As the effective tax burden bases on the future value of the investment, tax-induced timing ef-fects through tax payments and resulting liquidity effects through interest income are taken into account. When the impact indicated by the future value of the tax base is compared to the impact indicated by the effective tax burden, it becomes clear that the direction of both measures is the same. In the example with 25% corporation tax, both measures indicate an increase of 4.56% of either the tax base or the effective tax burden (see table 6). That means, no matter which measure is used, the impact indicated is generally exactly the same. The respective values in table 10 are taken from the tables above (period 4). Table 10: Comparison of impact assessed with effective tax burden and impact assessed with future value of the tax base (Case with 25% income tax/Post-tax) Effective Tax Burden
Pre-tax Value (in €)
Post-tax Value (in €)
Effective Tax Burden (in €)
Delta Effective Tax Burden (in €)
in %
Immediate full depreciation 3,492 2,813 680Straight-line depreciation 3,492 2,782 711 31 4.56%
Future Value of the Tax Base Post-tax Value (in €)
Immediate full depreciation 2,718Straight-line depreciation 2,842 124 4.56%
Effective Deviation of Future Value (in €)
22
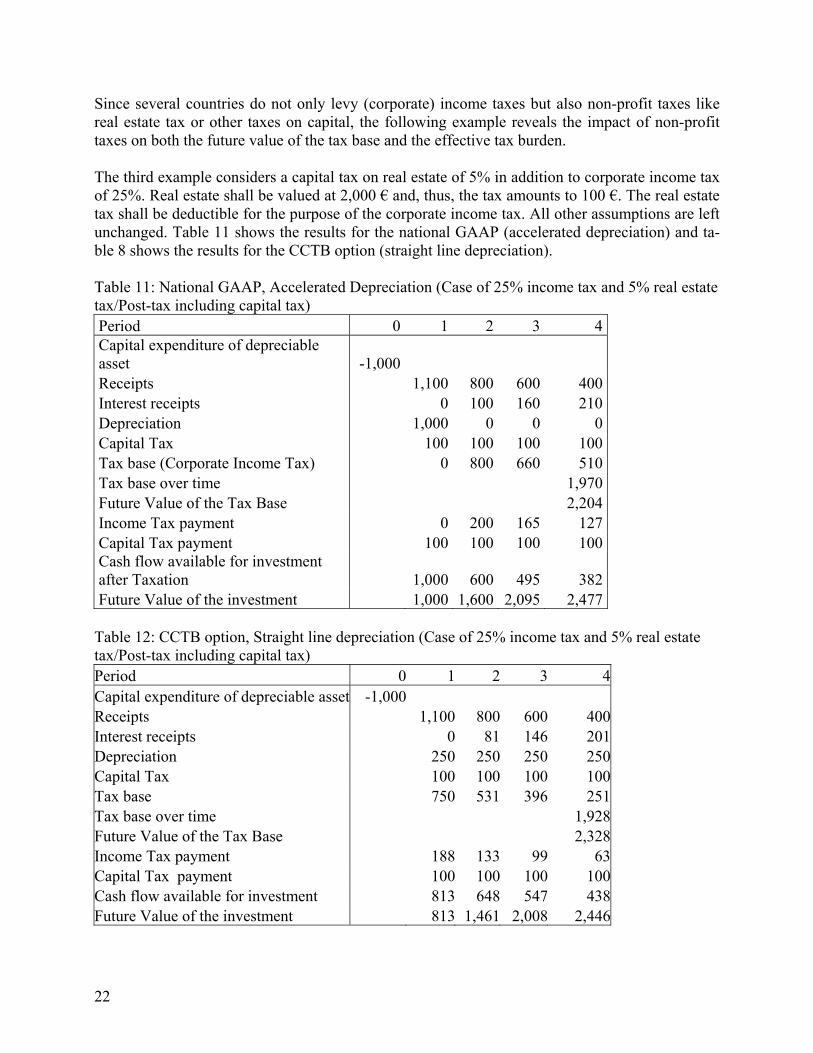
Since several countries do not only levy (corporate) income taxes but also non-profit taxes like real estate tax or other taxes on capital, the following example reveals the impact of non-profit taxes on both the future value of the tax base and the effective tax burden. The third example considers a capital tax on real estate of 5% in addition to corporate income tax of 25%. Real estate shall be valued at 2,000 € and, thus, the tax amounts to 100 €. The real estate tax shall be deductible for the purpose of the corporate income tax. All other assumptions are left unchanged. Table 11 shows the results for the national GAAP (accelerated depreciation) and ta-ble 8 shows the results for the CCTB option (straight line depreciation). Table 11: National GAAP, Accelerated Depreciation (Case of 25% income tax and 5% real estate tax/Post-tax including capital tax)
Period 0 1 2 3 4 Capital expenditure of depreciable asset -1,000 Receipts 1,100 800 600 400 Interest receipts 0 100 160 210 Depreciation 1,000 0 0 0 Capital Tax 100 100 100 100 Tax base (Corporate Income Tax) 0 800 660 510 Tax base over time 1,970 Future Value of the Tax Base 2,204 Income Tax payment 0 200 165 127 Capital Tax payment 100 100 100 100 Cash flow available for investment after Taxation 1,000 600 495 382 Future Value of the investment 1,000 1,600 2,095 2,477
Table 12: CCTB option, Straight line depreciation (Case of 25% income tax and 5% real estate tax/Post-tax including capital tax)
Period 0 1 2 3 4Capital expenditure of depreciable asset -1,000 Receipts 1,100 800 600 400Interest receipts 0 81 146 201Depreciation 250 250 250 250Capital Tax 100 100 100 100Tax base 750 531 396 251Tax base over time 1,928Future Value of the Tax Base 2,328Income Tax payment 188 133 99 63Capital Tax payment 100 100 100 100Cash flow available for investment 813 648 547 438Future Value of the investment 813 1,461 2,008 2,446
23
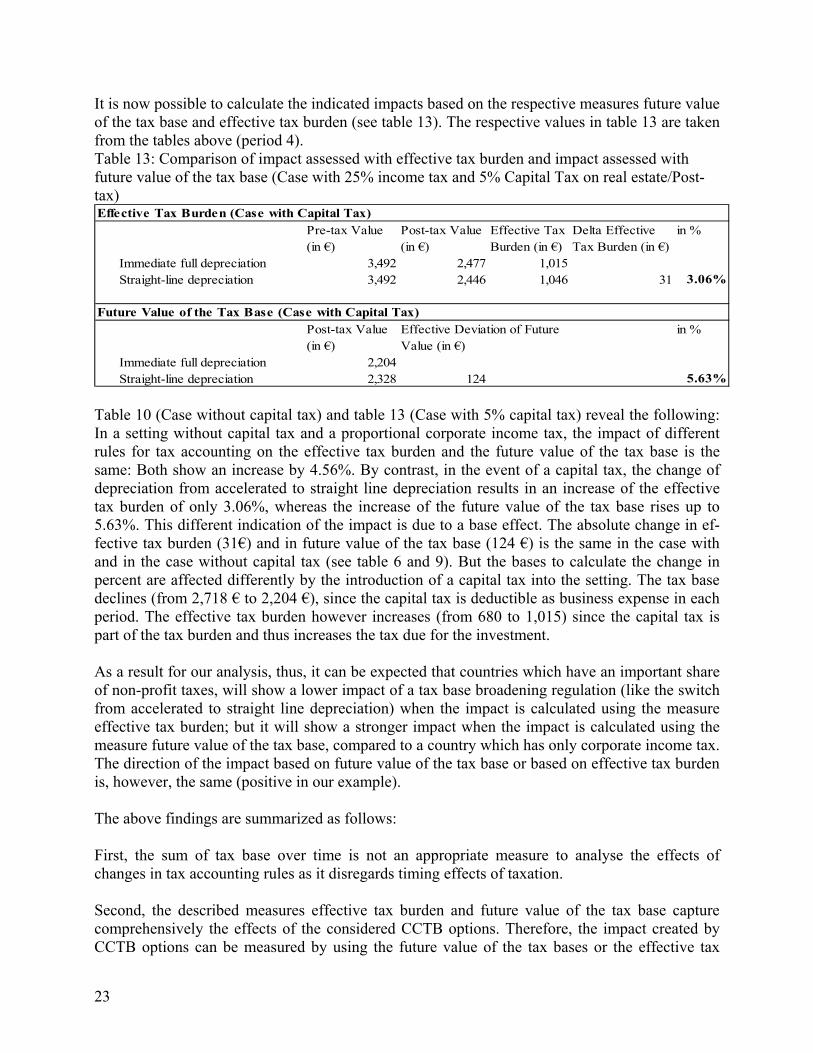
It is now possible to calculate the indicated impacts based on the respective measures future value of the tax base and effective tax burden (see table 13). The respective values in table 13 are taken from the tables above (period 4). Table 13: Comparison of impact assessed with effective tax burden and impact assessed with future value of the tax base (Case with 25% income tax and 5% Capital Tax on real estate/Post-tax) Effective Tax Burden (Case with Capital Tax)
Pre-tax Value (in €)
Post-tax Value (in €)
Effective Tax Burden (in €)
Delta Effective Tax Burden (in €)
in %
Immediate full depreciation 3,492 2,477 1,015Straight-line depreciation 3,492 2,446 1,046 31 3.06%
Future Value of the Tax Base (Case with Capital Tax)Post-tax Value (in €)
in %
Immediate full depreciation 2,204Straight-line depreciation 2,328 124 5.63%
Effective Deviation of Future Value (in €)
Table 10 (Case without capital tax) and table 13 (Case with 5% capital tax) reveal the following: In a setting without capital tax and a proportional corporate income tax, the impact of different rules for tax accounting on the effective tax burden and the future value of the tax base is the same: Both show an increase by 4.56%. By contrast, in the event of a capital tax, the change of depreciation from accelerated to straight line depreciation results in an increase of the effective tax burden of only 3.06%, whereas the increase of the future value of the tax base rises up to 5.63%. This different indication of the impact is due to a base effect. The absolute change in ef-fective tax burden (31€) and in future value of the tax base (124 €) is the same in the case with and in the case without capital tax (see table 6 and 9). But the bases to calculate the change in percent are affected differently by the introduction of a capital tax into the setting. The tax base declines (from 2,718 € to 2,204 €), since the capital tax is deductible as business expense in each period. The effective tax burden however increases (from 680 to 1,015) since the capital tax is part of the tax burden and thus increases the tax due for the investment. As a result for our analysis, thus, it can be expected that countries which have an important share of non-profit taxes, will show a lower impact of a tax base broadening regulation (like the switch from accelerated to straight line depreciation) when the impact is calculated using the measure effective tax burden; but it will show a stronger impact when the impact is calculated using the measure future value of the tax base, compared to a country which has only corporate income tax. The direction of the impact based on future value of the tax base or based on effective tax burden is, however, the same (positive in our example). The above findings are summarized as follows: First, the sum of tax base over time is not an appropriate measure to analyse the effects of changes in tax accounting rules as it disregards timing effects of taxation. Second, the described measures effective tax burden and future value of the tax base capture comprehensively the effects of the considered CCTB options. Therefore, the impact created by CCTB options can be measured by using the future value of the tax bases or the effective tax
24
burden. It has to be kept in mind that all elements of a CCTB except loss carry-forward and par-ticipation exemption for dividends will only have timing effects. Third, both indicators, the impact based on the future value of the tax base and the impact based on the effective tax burden show a very similar change due to changes in tax accounting rules, if there is only corporate income tax with a proportional tax rate. When non-profit taxes are consid-ered in addition, the indicated impact in percent, when based on the measure effective tax burden, will be different compared to the impact in percent based on the future value of the tax base. Therefore, the study will in addition to the effective tax burden display the impact of a CCTB on the size of the tax bases by measuring the change of the future value of the tax base as follows:
.
5 Model-Firms and Data Base
5.1 Structure of the Model-Firms and Other Economic Assumptions
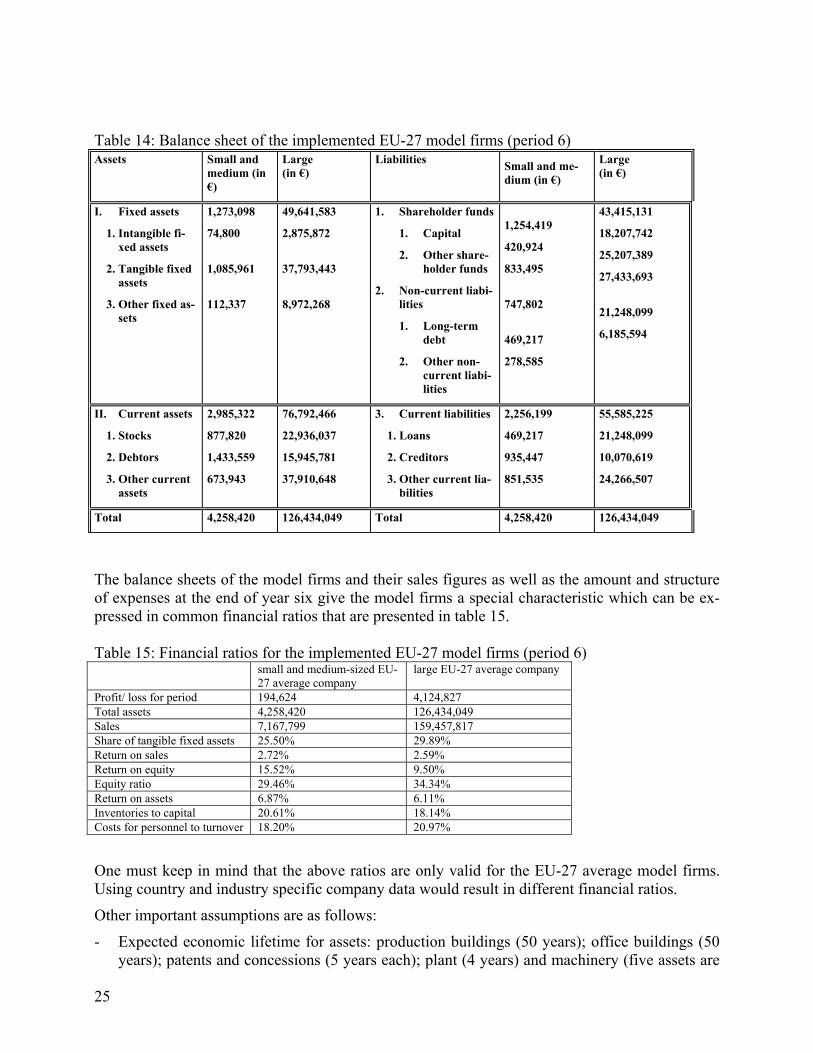
Various assumptions have to be made in order to define and describe the model firms analysed in this report, and the economic conditions which are assumed to prevail. These assumptions are presented in the following. In this study two model firms – one large and one small and medium-sized company - are im-plemented into the model representing both EU-27 average companies. An EU-27 average com-pany is a model of a firm ignoring country and industry specific effects on pre-tax data meaning that balance sheet, profit and loss account and corporate planning of this model company are given and are not dependent on country-specific taxation rules. The data determining the imple-mented model firms were mainly taken from the AMADEUS database (see Section II, 5.2). Table 14 shows the balance sheets of the model firms (i.e. SME and large corporations) at the end of year six (the mid-point of the ten year comparison). The balance sheets depict the different types of assets (investments) and their sources of finance which are considered here in detail. It also serves to highlight the relative weight of these investments and the sources of finance.
25
Table 14: Balance sheet of the implemented EU-27 model firms (period 6) Assets Small and
medium (in €)
Large (in €)
Liabilities Small and me-dium (in €)
Large (in €)
I. Fixed assets
1. Intangible fi-xed assets
2. Tangible fixed assets
3. Other fixed as-sets
1,273,098
74,800
1,085,961
112,337
49,641,583
2,875,872
37,793,443
8,972,268
1. Shareholder funds
1. Capital
2. Other share-holder funds
2. Non-current liabi-lities
1. Long-term debt
2. Other non-current liabi-lities
1,254,419
420,924
833,495
747,802
469,217
278,585
43,415,131
18,207,742
25,207,389
27,433,693
21,248,099
6,185,594
II. Current assets
1. Stocks
2. Debtors
3. Other current assets
2,985,322
877,820
1,433,559
673,943
76,792,466
22,936,037
15,945,781
37,910,648
3. Current liabilities
1. Loans
2. Creditors
3. Other current lia-bilities
2,256,199
469,217
935,447
851,535
55,585,225
21,248,099
10,070,619
24,266,507
Total 4,258,420 126,434,049 Total 4,258,420 126,434,049
The balance sheets of the model firms and their sales figures as well as the amount and structure of expenses at the end of year six give the model firms a special characteristic which can be ex-pressed in common financial ratios that are presented in table 15. Table 15: Financial ratios for the implemented EU-27 model firms (period 6) small and medium-sized EU-
27 average company large EU-27 average company
Profit/ loss for period 194,624 4,124,827 Total assets 4,258,420 126,434,049 Sales 7,167,799 159,457,817 Share of tangible fixed assets 25.50% 29.89% Return on sales 2.72% 2.59% Return on equity 15.52% 9.50% Equity ratio 29.46% 34.34% Return on assets 6.87% 6.11% Inventories to capital 20.61% 18.14% Costs for personnel to turnover 18.20% 20.97%
One must keep in mind that the above ratios are only valid for the EU-27 average model firms. Using country and industry specific company data would result in different financial ratios.
Other important assumptions are as follows:
- Expected economic lifetime for assets: production buildings (50 years); office buildings (50 years); patents and concessions (5 years each); plant (4 years) and machinery (five assets are
26
considered, 5 to 10 years); office furniture and fixtures (9 years); financial assets (all zero); stocks (zero).
- Rates of price increase: consumer price index (2.2%); price index for basic material (4.8%); price index for wages (0.8%); price index for investment goods (2.3%).6
- Interest rates for creditors and debtors: short term credit (3%); long term credit (3.9%); short term debt (5.9%); long term debt (5.1%).7
Since these assumptions in some cases do not represent the reality individual companies captured by the AMADEUS database are faced with, it is unavoidable that the structure of the imple-mented EU model firms slightly differs from the EU-27 average model companies shown in Ap-pendix 4. However, as the structure of the companies is very similar, significant distortions of the results could be excluded.
5.2 Data Base and Applied Aggregation Methods
5.2.1 Financial Data Derived from the AMADEUS Database
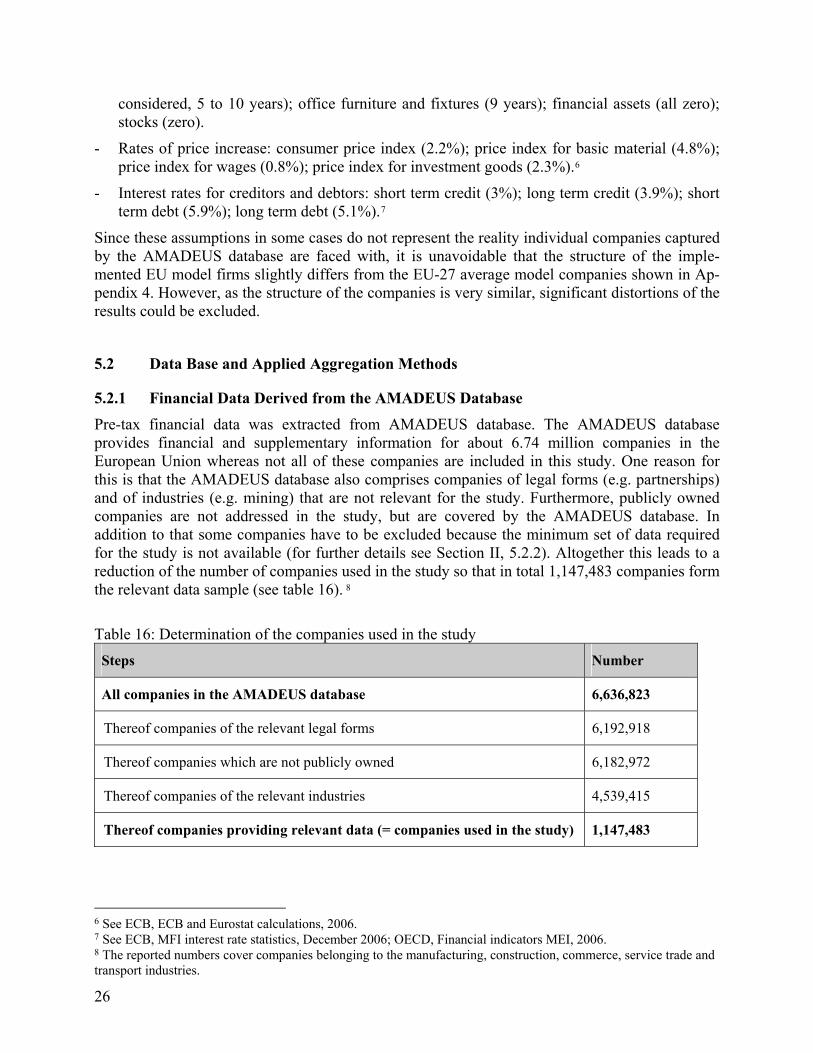
Pre-tax financial data was extracted from AMADEUS database. The AMADEUS database provides financial and supplementary information for about 6.74 million companies in the European Union whereas not all of these companies are included in this study. One reason for this is that the AMADEUS database also comprises companies of legal forms (e.g. partnerships) and of industries (e.g. mining) that are not relevant for the study. Furthermore, publicly owned companies are not addressed in the study, but are covered by the AMADEUS database. In addition to that some companies have to be excluded because the minimum set of data required for the study is not available (for further details see Section II, 5.2.2). Altogether this leads to a reduction of the number of companies used in the study so that in total 1,147,483 companies form the relevant data sample (see table 16). 8
Table 16: Determination of the companies used in the study
Steps Number
All companies in the AMADEUS database 6,636,823
Thereof companies of the relevant legal forms 6,192,918
Thereof companies which are not publicly owned 6,182,972
Thereof companies of the relevant industries 4,539,415
Thereof companies providing relevant data (= companies used in the study) 1,147,483
6 See ECB, ECB and Eurostat calculations, 2006. 7 See ECB, MFI interest rate statistics, December 2006; OECD, Financial indicators MEI, 2006. 8 The reported numbers cover companies belonging to the manufacturing, construction, commerce, service trade and transport industries.
27
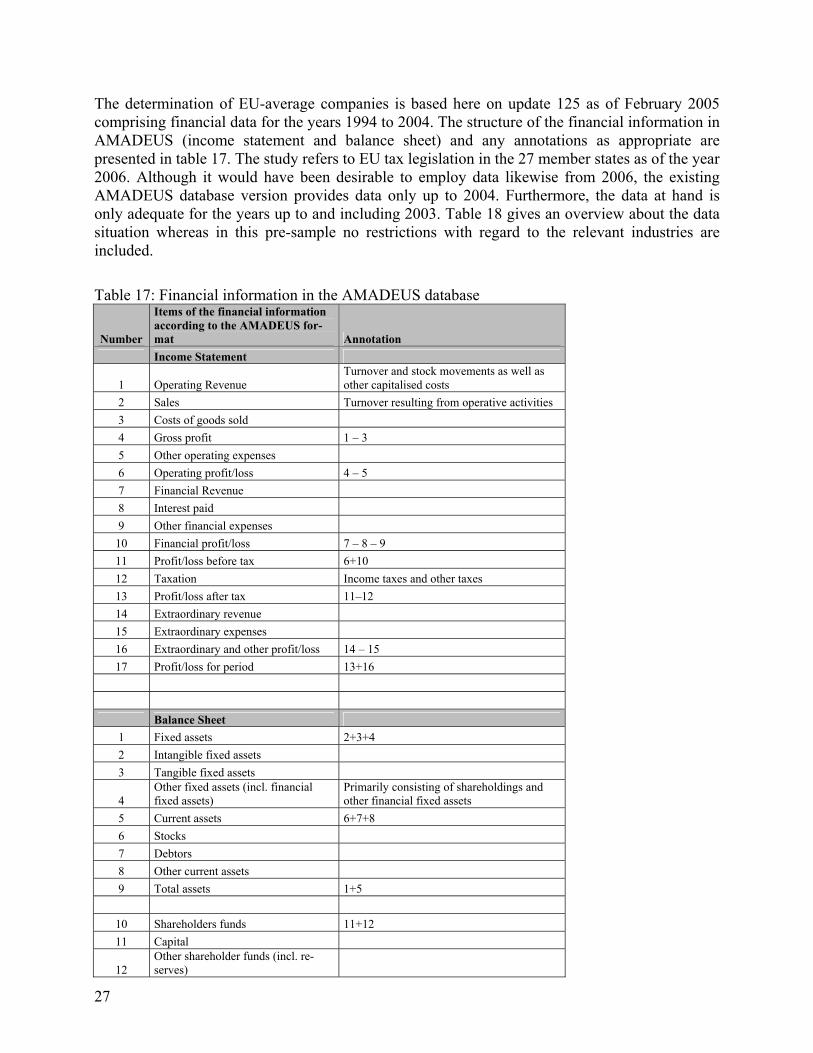
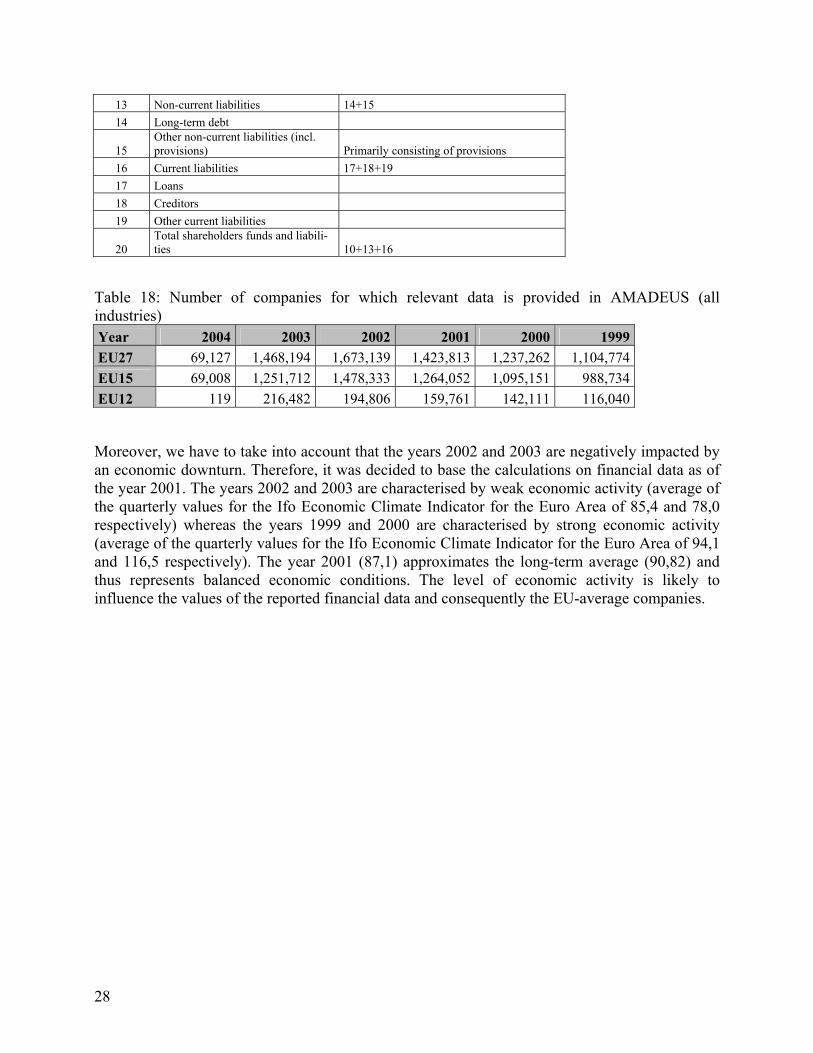
The determination of EU-average companies is based here on update 125 as of February 2005 comprising financial data for the years 1994 to 2004. The structure of the financial information in AMADEUS (income statement and balance sheet) and any annotations as appropriate are presented in table 17. The study refers to EU tax legislation in the 27 member states as of the year 2006. Although it would have been desirable to employ data likewise from 2006, the existing AMADEUS database version provides data only up to 2004. Furthermore, the data at hand is only adequate for the years up to and including 2003. Table 18 gives an overview about the data situation whereas in this pre-sample no restrictions with regard to the relevant industries are included.
Table 17: Financial information in the AMADEUS database
Number
Items of the financial information according to the AMADEUS for-mat Annotation
Income Statement
1 Operating Revenue Turnover and stock movements as well as other capitalised costs
2 Sales Turnover resulting from operative activities
3 Costs of goods sold
4 Gross profit 1 – 3
5 Other operating expenses
6 Operating profit/loss 4 – 5
7 Financial Revenue
8 Interest paid
9 Other financial expenses
10 Financial profit/loss 7 – 8 – 9
11 Profit/loss before tax 6+10
12 Taxation Income taxes and other taxes
13 Profit/loss after tax 11–12
14 Extraordinary revenue
15 Extraordinary expenses
16 Extraordinary and other profit/loss 14 – 15
17 Profit/loss for period 13+16
Balance Sheet
1 Fixed assets 2+3+4
2 Intangible fixed assets
3 Tangible fixed assets
4 Other fixed assets (incl. financial fixed assets)
Primarily consisting of shareholdings and other financial fixed assets
5 Current assets 6+7+8
6 Stocks
7 Debtors
8 Other current assets
9 Total assets 1+5
10 Shareholders funds 11+12
11 Capital
12 Other shareholder funds (incl. re-serves)
28
13 Non-current liabilities 14+15
14 Long-term debt
15 Other non-current liabilities (incl. provisions) Primarily consisting of provisions
16 Current liabilities 17+18+19
17 Loans
18 Creditors
19 Other current liabilities
20 Total shareholders funds and liabili-ties 10+13+16
Table 18: Number of companies for which relevant data is provided in AMADEUS (all industries) Year 2004 2003 2002 2001 2000 1999 EU27 69,127 1,468,194 1,673,139 1,423,813 1,237,262 1,104,774 EU15 69,008 1,251,712 1,478,333 1,264,052 1,095,151 988,734 EU12 119 216,482 194,806 159,761 142,111 116,040
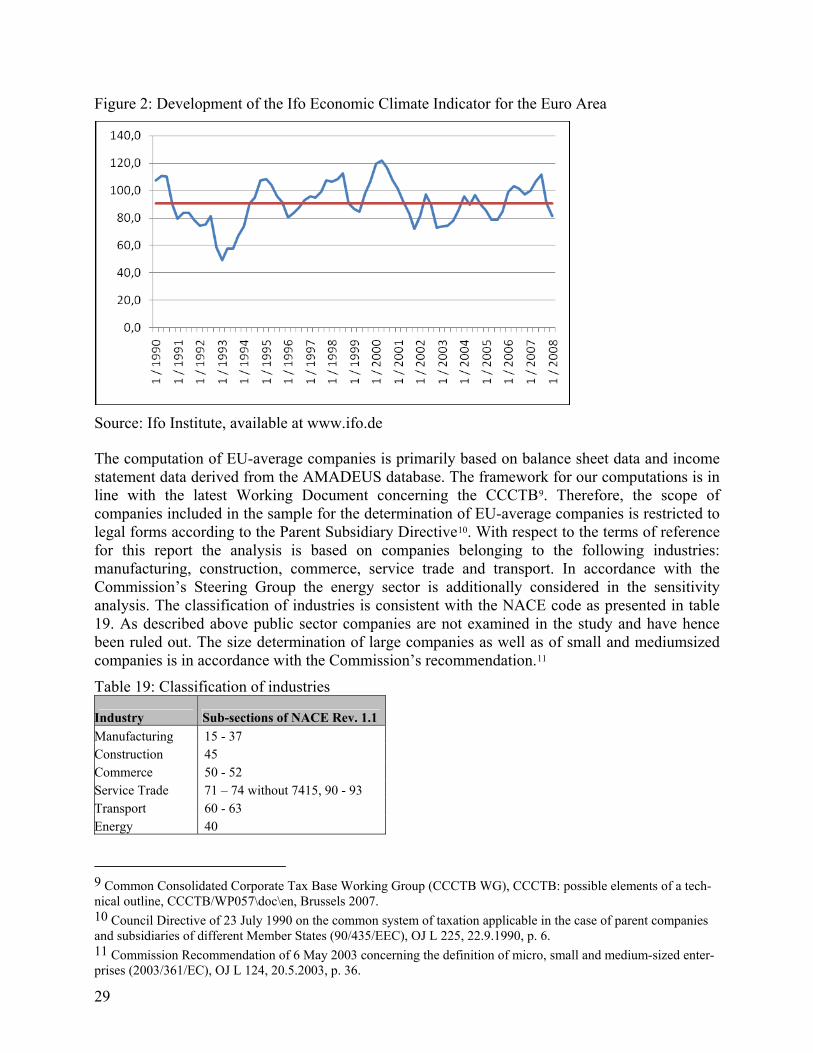
Moreover, we have to take into account that the years 2002 and 2003 are negatively impacted by an economic downturn. Therefore, it was decided to base the calculations on financial data as of the year 2001. The years 2002 and 2003 are characterised by weak economic activity (average of the quarterly values for the Ifo Economic Climate Indicator for the Euro Area of 85,4 and 78,0 respectively) whereas the years 1999 and 2000 are characterised by strong economic activity (average of the quarterly values for the Ifo Economic Climate Indicator for the Euro Area of 94,1 and 116,5 respectively). The year 2001 (87,1) approximates the long-term average (90,82) and thus represents balanced economic conditions. The level of economic activity is likely to influence the values of the reported financial data and consequently the EU-average companies.
29
Figure 2: Development of the Ifo Economic Climate Indicator for the Euro Area
Source: Ifo Institute, available at www.ifo.de
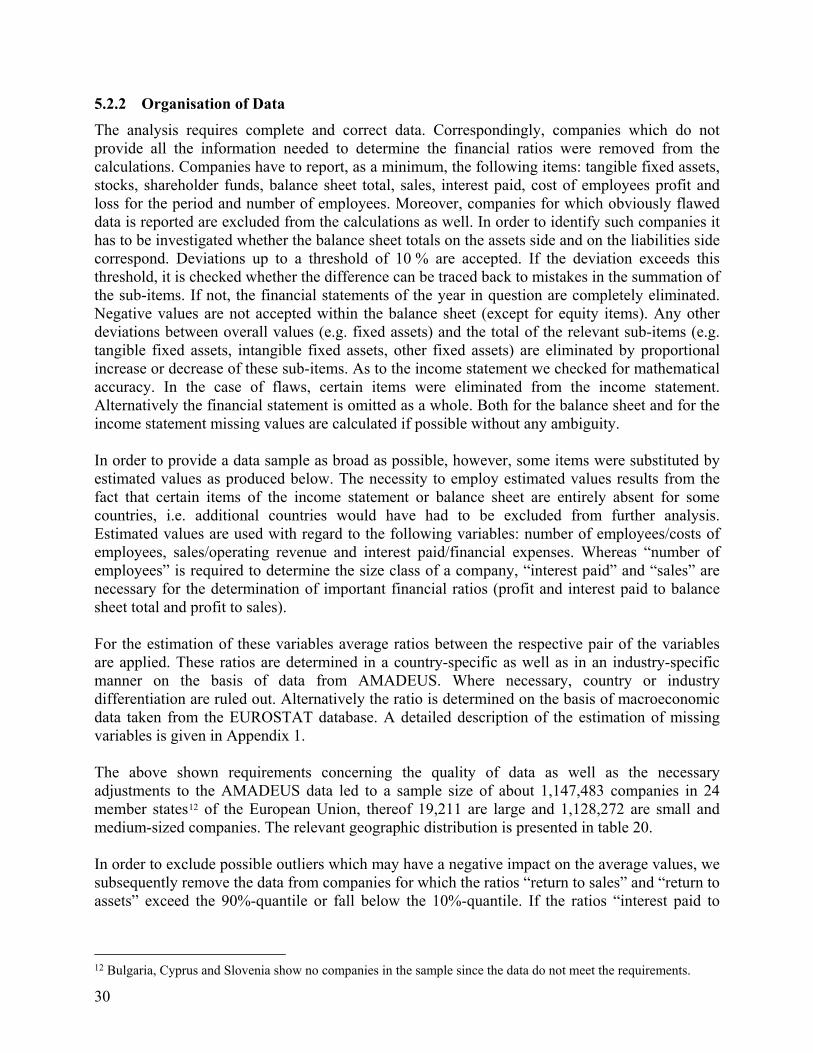
The computation of EU-average companies is primarily based on balance sheet data and income statement data derived from the AMADEUS database. The framework for our computations is in line with the latest Working Document concerning the CCCTB9. Therefore, the scope of companies included in the sample for the determination of EU-average companies is restricted to legal forms according to the Parent Subsidiary Directive10. With respect to the terms of reference for this report the analysis is based on companies belonging to the following industries: manufacturing, construction, commerce, service trade and transport. In accordance with the Commission’s Steering Group the energy sector is additionally considered in the sensitivity analysis. The classification of industries is consistent with the NACE code as presented in table 19. As described above public sector companies are not examined in the study and have hence been ruled out. The size determination of large companies as well as of small and mediumsized companies is in accordance with the Commission’s recommendation.11
Table 19: Classification of industries
Industry Sub-sections of NACE Rev. 1.1
Manufacturing 15 - 37 Construction 45 Commerce 50 - 52 Service Trade 71 – 74 without 7415, 90 - 93 Transport 60 - 63 Energy 40
9 Common Consolidated Corporate Tax Base Working Group (CCCTB WG), CCCTB: possible elements of a tech-nical outline, CCCTB/WP057\doc\en, Brussels 2007. 10 Council Directive of 23 July 1990 on the common system of taxation applicable in the case of parent companies and subsidiaries of different Member States (90/435/EEC), OJ L 225, 22.9.1990, p. 6. 11 Commission Recommendation of 6 May 2003 concerning the definition of micro, small and medium-sized enter-prises (2003/361/EC), OJ L 124, 20.5.2003, p. 36.
30
5.2.2 Organisation of Data
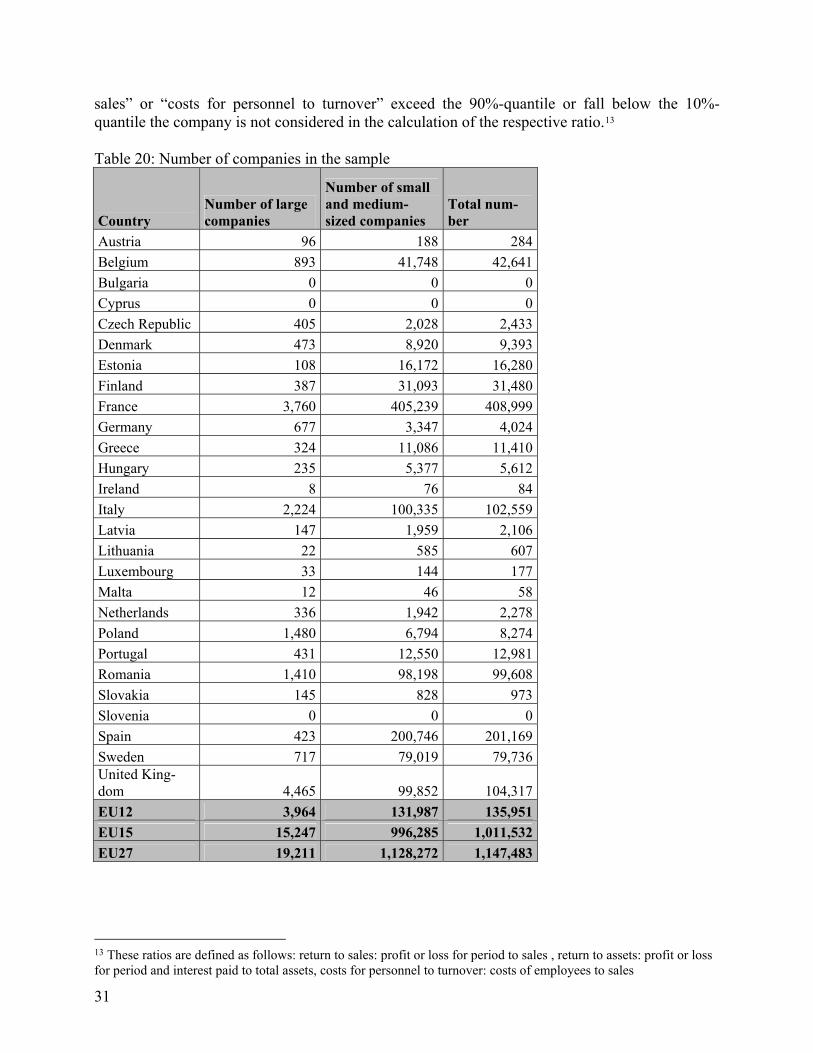
The analysis requires complete and correct data. Correspondingly, companies which do not provide all the information needed to determine the financial ratios were removed from the calculations. Companies have to report, as a minimum, the following items: tangible fixed assets, stocks, shareholder funds, balance sheet total, sales, interest paid, cost of employees profit and loss for the period and number of employees. Moreover, companies for which obviously flawed data is reported are excluded from the calculations as well. In order to identify such companies it has to be investigated whether the balance sheet totals on the assets side and on the liabilities side correspond. Deviations up to a threshold of 10 % are accepted. If the deviation exceeds this threshold, it is checked whether the difference can be traced back to mistakes in the summation of the sub-items. If not, the financial statements of the year in question are completely eliminated. Negative values are not accepted within the balance sheet (except for equity items). Any other deviations between overall values (e.g. fixed assets) and the total of the relevant sub-items (e.g. tangible fixed assets, intangible fixed assets, other fixed assets) are eliminated by proportional increase or decrease of these sub-items. As to the income statement we checked for mathematical accuracy. In the case of flaws, certain items were eliminated from the income statement. Alternatively the financial statement is omitted as a whole. Both for the balance sheet and for the income statement missing values are calculated if possible without any ambiguity. In order to provide a data sample as broad as possible, however, some items were substituted by estimated values as produced below. The necessity to employ estimated values results from the fact that certain items of the income statement or balance sheet are entirely absent for some countries, i.e. additional countries would have had to be excluded from further analysis. Estimated values are used with regard to the following variables: number of employees/costs of employees, sales/operating revenue and interest paid/financial expenses. Whereas “number of employees” is required to determine the size class of a company, “interest paid” and “sales” are necessary for the determination of important financial ratios (profit and interest paid to balance sheet total and profit to sales). For the estimation of these variables average ratios between the respective pair of the variables are applied. These ratios are determined in a country-specific as well as in an industry-specific manner on the basis of data from AMADEUS. Where necessary, country or industry differentiation are ruled out. Alternatively the ratio is determined on the basis of macroeconomic data taken from the EUROSTAT database. A detailed description of the estimation of missing variables is given in Appendix 1. The above shown requirements concerning the quality of data as well as the necessary adjustments to the AMADEUS data led to a sample size of about 1,147,483 companies in 24 member states12 of the European Union, thereof 19,211 are large and 1,128,272 are small and medium-sized companies. The relevant geographic distribution is presented in table 20. In order to exclude possible outliers which may have a negative impact on the average values, we subsequently remove the data from companies for which the ratios “return to sales” and “return to assets” exceed the 90%-quantile or fall below the 10%-quantile. If the ratios “interest paid to
12 Bulgaria, Cyprus and Slovenia show no companies in the sample since the data do not meet the requirements.
31
sales” or “costs for personnel to turnover” exceed the 90%-quantile or fall below the 10%-quantile the company is not considered in the calculation of the respective ratio.13 Table 20: Number of companies in the sample
Country Number of large companies
Number of small and medium-sized companies
Total num-ber
Austria 96 188 284
Belgium 893 41,748 42,641
Bulgaria 0 0 0
Cyprus 0 0 0
Czech Republic 405 2,028 2,433
Denmark 473 8,920 9,393
Estonia 108 16,172 16,280
Finland 387 31,093 31,480
France 3,760 405,239 408,999
Germany 677 3,347 4,024
Greece 324 11,086 11,410
Hungary 235 5,377 5,612
Ireland 8 76 84
Italy 2,224 100,335 102,559
Latvia 147 1,959 2,106
Lithuania 22 585 607
Luxembourg 33 144 177
Malta 12 46 58
Netherlands 336 1,942 2,278
Poland 1,480 6,794 8,274
Portugal 431 12,550 12,981
Romania 1,410 98,198 99,608
Slovakia 145 828 973
Slovenia 0 0 0
Spain 423 200,746 201,169
Sweden 717 79,019 79,736United King-dom 4,465 99,852 104,317
EU12 3,964 131,987 135,951
EU15 15,247 996,285 1,011,532
EU27 19,211 1,128,272 1,147,483
13 These ratios are defined as follows: return to sales: profit or loss for period to sales , return to assets: profit or loss for period and interest paid to total assets, costs for personnel to turnover: costs of employees to sales
32
5.2.3 Determination of the Model Firms
5.2.3.1 Average Model Firms for EU-27
When preparing data, a key goal is to provide consistent information on the structure of EU-average income statements and EU-average balance sheets in order to represent the companies in the EU member states. On the one hand, we have to consider an appropriate method to ensure that no inconsistencies arise. On the other hand, it is important that the structure of model EU-average companies is not unduly influenced by a small number of member states or companies. If the average balance sheet and income statement had been determined as the average of absolute figures for the items, large companies would have strongly influenced the structure of the EU-average companies. Therefore we decided to determine the items of the financial statements in relation to the “sales” or “total assets” figure for each company and to determine the average for the companies in each country. Consequently the computation of the EU-average companies is based on country-specific average ratios for the balance sheet items and the income statement items. These country-specific ratios are subsequently aggregated to obtain the EU-average ratios. Finally, these ratios are multiplied with the average values for “sales” and “total assets” averaged out across the EU member states in order to produce the absolute values in Euros for the EU-average companies. The following steps have to be conducted:
a) Income statement
In order to avoid inconsistencies, two alternative methods are employed: (1) Setting items in direct relation to sales and (2) determining items as residuals or as a proportion of a residual. To this end the former method is applied to “other operating revenue”, “operating profit/loss”, “profit/loss before tax”, “profit/loss after tax”, “profit/loss for the period” and “interest paid”, whereas all other items (financial revenue, financial profit/loss, taxes and extraordinary income) are determined as residual. For further division of residuals, we determine the ratios of costs for goods sold to cost of goods sold plus other operating expenses and other financial expenses to interest paid. This procedure leads to consistent income statements. Appendix 2 summarises the determination of the EU-average income statements by showing the relevant formulae.
b) Balance sheet
With regard to the balance sheet we apply a two step approach. In a first step, the headline items “fixed assets”, “current assets”, “shareholder funds”, “non-current liabilities” and “current liabilities” were set in relation to “total assets”. In a second step, sub-items (e.g. intangible fixed assets, tangible fixed assets and other fixed assets) are set in relation to the relevant headline items (e.g. fixed assets). In order to avoid inconsistencies in the resulting balance sheets, companies are only considered for the respective step if the values for all required items are available. This procedure leads to consistent balance sheets. Appendix 3 summarises the determination of the EU-average balance sheets by showing the relevant formulae. The structure, the values in Euro and the required financial ratios for the EU-27 companies (large and SME) are presented in appendix 4. These figures fit well with the data of the implemented model firms (tables 14 and 15) which shows that all relevant empirical information was included very precisely in the implementation process.
33
5.2.3.2 EU-12, EU-15 and industry-specific Model Firms
The approach described for determining the EU-27 companies was applied identically in order to create the EU-12 and EU-15 as well as the industry specific companies. To this end, the data sample was divided by region (EU-12, EU-15) or by industry class according to the NACE code (industries). The steps to determine the income statement and the balance sheet were then applied to the relevant sub-samples. The structure, the values in Euro and the required financial ratios for these companies (large and SME) are presented in the appendix 4.
5.2.4 Additional Ratios and Figures
The procedure of the European Tax Analyzer computations also requires information on the R&D-expenses in relation to sales. This information is taken into account in the production plan and is necessary in order to determine the cost of goods. The data supplied is based on EUROSTAT statistics. Therefore, the R&D-expenses as well as the volume of sales in the EU member states are identified. The R&D-expenses and sales figures are broken down by country and industry based on the NACE-sections D, F, G, I and K. The relation between R&D-expenses and sales is ascertained per country and industry. The information on R&D-expenses are taken on the one hand from the „Research and Development“ section under „Science and Technology“ (data of 2001) and on the other hand from the „Community Innovation Survey (CIS)“ (data of 2004). The data used in the European Tax Analyzer is mainly based on the R&D-information from CIS. If no CIS-data is available, the data based on the information from the section „Science and Technology“ is applied. If no data is available at all, the value is set to zero. In addition to R&D information the European Tax Analyzer Model comprises information on the manpower budget. In order to simulate the development of wage payments and the company pension scheme over time information on the wages of the employees, and its distribution, is needed. The information on the income distribution of personnel is based on EUROSTAT data as well. The relevant data is taken from EUROSTAT, Unit F2, Labour Market Statistics (Structure of Earnings Survey 2002). The number of employees is broken down by gender, country, industry and educational background.14 Hence, it is possible to supply information on the structure of employees with reference to the education. We are able to deliver the percentage of employees belonging to an educational level for each individual industry as well as across all industries. This information is additionally structured by gender. Moreover, a second data set provides the number of employees broken down by gender, country and size class. Based on this analysis it is also possible to deliver information on the structure of employees in the member states of the European Union (the percentage of male and female employees) depending on the size of companies.15 Corresponding analyses are carried out as to average annual earnings. On the one hand, the information is broken down by gender, country and size class. Consequently, similar information on the average annual earnings in the member states of the European Union is reported. Finally, information on the average annual earnings broken down by gender, country, industry and education level is identified and thus data on the structure of average annual earnings depending on education is created.
14 The educational background is based on the definitions according to the International Standard Classification of Education (ISCED-97). 15 Two classes are reported: companies up to 249 employees and companies with 250 employees and more.
34
Furthermore, more detailed data on property, plant and equipment is required for the European Tax Analyzer Model. Data of fixed assets is important for the production plan. In order to simulate amortization and depreciation expenses, additional information on the structure of fixed assets is necessary for the computations, i.e. to itemise the fixed assets into its components. Hence, the proportion of the items „land and buildings“, „plant and machinery“ and „fixtures“ have to be estimated. The estimation is based on the information of the BACH-Database for Belgium, Finland, France, Germany, Italy, Portugal and Spain as objects of comparison.16 Alternatively, these items are related to total assets, total fixed assets and tangible fixed assets. We choose the variation coefficient as the criterion to evaluate which figure leads to the best estimation of the structure. The analysis is carried out per country, size class and industry. On the one hand, the ratios for each industry are averaged over the countries considered (step one). On the other hand, the ratios are averaged out across the industries and subsequently across the countries (step two). The variation coefficient is identified for each step and alternative, i.e. the relation to tangible fixed assets, fixed assets and total assets. Given that the ratio to tangible fixed assets provides the best estimation results, the structure is consequently based on this ratio.
Additionally, information on the structure of provisions is generated. The analysis is conducted identically. As to provisions it is possible to distinguish „Provisions for Pensions“ and „Other Provisions“.17 The European Tax Analyzer computations require information on the source country of dividend receipts as well. This is important since the tax consequences differ if either the tax exemption method or the tax credit method is applied to avoid double taxation. Hence, particularly the ratio of participations in domestic and foreign companies is required. This information is not included in the balance sheet data. The AMADEUS database, however, provides additional ownership information. Information on direct shareholdings18 is taken from AMADEUS (see appendix 5) and aggregated for each country by adding up the shares. Information on shares in domestic and foreign companies in per cent for large as well as for small and medium-sized companies is delivered for each member state. Additionally, the following information is provided: the average number of shareholdings per company, the average amount of shareholding in per cent, the average equity capital of the affiliated companies, as well as the average financial assets of the shareholders. The two latter items include assessment of the proportion of shareholdings to the total financial assets. Finally, the European Tax Analyzer Model also processes data on warranty claims, which the AMADEUS database does not provide. Moreover, neither statistic institutions19 nor economic organisation20 provide this information. Such information, however, is necessary to calculate the provisions for warranty claims. In order to obtain evidence of the approximate level of warranty claims in per cent of sales, the consolidated accounts of the Dow Jones Stoxx 50 companies21 are
16 Austria and the Netherlands were ruled out due to questionable data. 17 In contrast, the information of Austria could be included, but the one for Belgium had to be ruled out by reason of inconsistent data. 18 Ownership information in the AMADEUS database is provided for direct shares and for the shares of the ultimate owner of a company. Indirect shares are not reported. 19 EUROSTAT as well as the German statistic agency DESTATIS. 20 For example OECD or ICC were contacted. 21 With the exception of the financial and utilities sectors as these are excluded from the determination of average model companies in the study.

35
examined. The percentage of warranty claims is averaged and taken as an indication for an appropriate estimated value.
36
III Future Values of the Tax Bases and Effective Company Tax Burdens in the EU Member States
The analysis comprises three steps. First, the options for a Common Corporate Tax Base (CCTB) which are taken into account for the analysis are described. Second, the corporate tax bases and the effective tax burdens stemming from the current national tax provisions in each member state are measured. Third, the impacts on the size of the tax bases and on the effective tax burdens re-sulting from the application of a CCTB are measured and analysed. In this context, the question to what extent an exclusive harmonisation of the tax base will effectively reduce the current EU-wide differences of effective company tax burdens is also examined. The study therefore also provides evidence to what extent a CCTB would broaden or reduce the EU-wide spread between the national tax bases and the effective tax burdens respectively. Steps two and three are done at first for a benchmark case of a large company representing an average corporation of the EU-27 member states. A second benchmark case takes into account a SME representing an average of the EU-27 member states as well.
1 Scenario of a Common Corporate Tax Base
The tax accounting rules considered here are based on the proposals of the working group con-cerned with the Common Consolidated Corporate Tax Base. The considered options for a CCTB were discussed and agreed with the steering group set up for this study. Altogether, eight differ-ent elements of the tax base will be taken into account: (A) depreciation rules, (B) valuation of inventories, (C) determination of production costs, (D) R&D costs as part of the production costs, (E) provisions for future pension payments, (F) provisions for legal obligations, (G) avoidance of double taxation of dividend income, and (H) loss relief. These options are outlined in the follow-ing. • Depreciation rules for intangible assets, machinery, buildings, furniture and fixture (office
equipment) (A): A distinction is made between long-term and short to medium term assets depending on the useful lifetime of each asset. In case of machinery as well as furniture and fixture pool depreciation is done at a rate of 20%. Special rules apply to buildings (individual straight-line depreciation with a rate of 2.5%) and intangible assets (individual straight-line depreciation with a general rate of 6.67% if useful lifetime doesn’t require a different rate).
• Valuation of inventories (B): the weighted average cost method (WAC) is chosen. Accord-ingly, items in inventory and the cost of goods which are sold in the period are valued with average costs. The average is calculated using costs of the units being in stock at that time.
• Production costs (C): in contrast to current country practice, which occasionally allows ac-counting for partial costs, all direct costs are treated as production costs.
• Costs for R&D as part of production costs (D): Current practice in some member states re-quires capitalization of R&D costs as part of the production costs. Some of these member states require to include costs for development activities related to production only, some re-quire to include costs for research activities as well. The considered CCTB option is to in-clude costs for development which can be allocated directly to the specific production. Re-search costs, in contrast, are deemed to be expensed as they are not in direct relation to pro-duction.
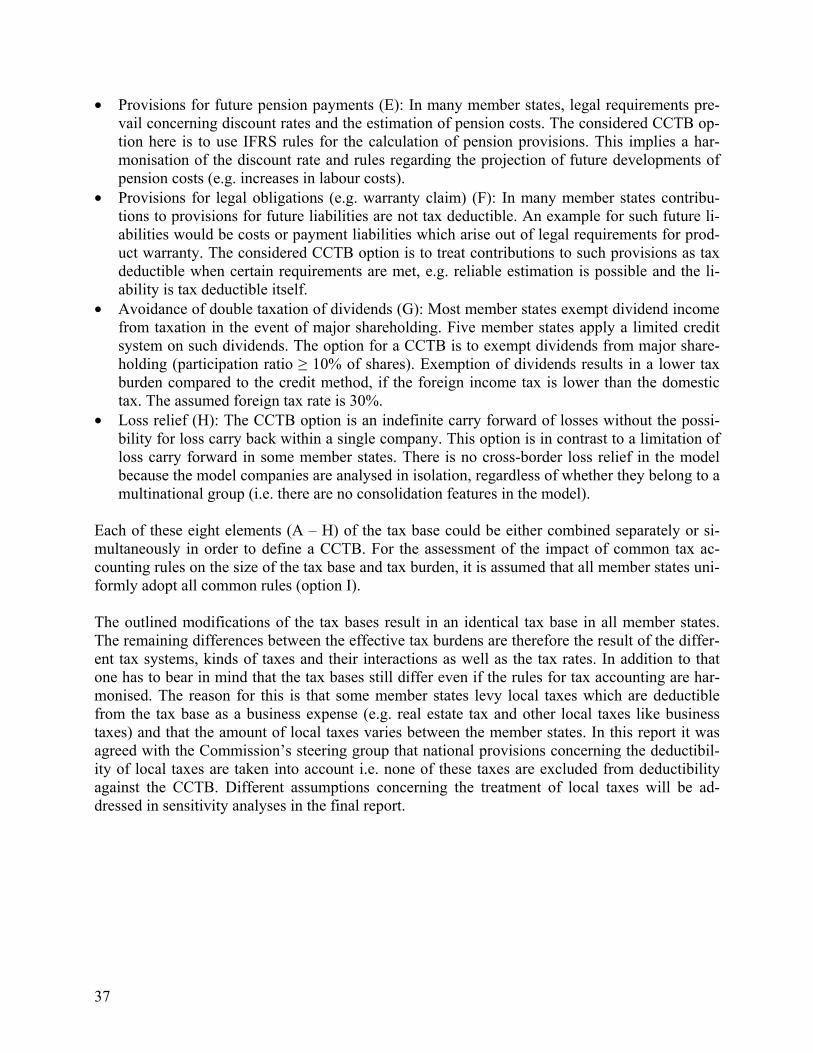
37
• Provisions for future pension payments (E): In many member states, legal requirements pre-vail concerning discount rates and the estimation of pension costs. The considered CCTB op-tion here is to use IFRS rules for the calculation of pension provisions. This implies a har-monisation of the discount rate and rules regarding the projection of future developments of pension costs (e.g. increases in labour costs).
• Provisions for legal obligations (e.g. warranty claim) (F): In many member states contribu-tions to provisions for future liabilities are not tax deductible. An example for such future li-abilities would be costs or payment liabilities which arise out of legal requirements for prod-uct warranty. The considered CCTB option is to treat contributions to such provisions as tax deductible when certain requirements are met, e.g. reliable estimation is possible and the li-ability is tax deductible itself.
• Avoidance of double taxation of dividends (G): Most member states exempt dividend income from taxation in the event of major shareholding. Five member states apply a limited credit system on such dividends. The option for a CCTB is to exempt dividends from major share-holding (participation ratio ≥ 10% of shares). Exemption of dividends results in a lower tax burden compared to the credit method, if the foreign income tax is lower than the domestic tax. The assumed foreign tax rate is 30%.
• Loss relief (H): The CCTB option is an indefinite carry forward of losses without the possi-bility for loss carry back within a single company. This option is in contrast to a limitation of loss carry forward in some member states. There is no cross-border loss relief in the model because the model companies are analysed in isolation, regardless of whether they belong to a multinational group (i.e. there are no consolidation features in the model).
Each of these eight elements (A – H) of the tax base could be either combined separately or si-multaneously in order to define a CCTB. For the assessment of the impact of common tax ac-counting rules on the size of the tax base and tax burden, it is assumed that all member states uni-formly adopt all common rules (option I). The outlined modifications of the tax bases result in an identical tax base in all member states. The remaining differences between the effective tax burdens are therefore the result of the differ-ent tax systems, kinds of taxes and their interactions as well as the tax rates. In addition to that one has to bear in mind that the tax bases still differ even if the rules for tax accounting are har-monised. The reason for this is that some member states levy local taxes which are deductible from the tax base as a business expense (e.g. real estate tax and other local taxes like business taxes) and that the amount of local taxes varies between the member states. In this report it was agreed with the Commission’s steering group that national provisions concerning the deductibil-ity of local taxes are taken into account i.e. none of these taxes are excluded from deductibility against the CCTB. Different assumptions concerning the treatment of local taxes will be ad-dressed in sensitivity analyses in the final report.
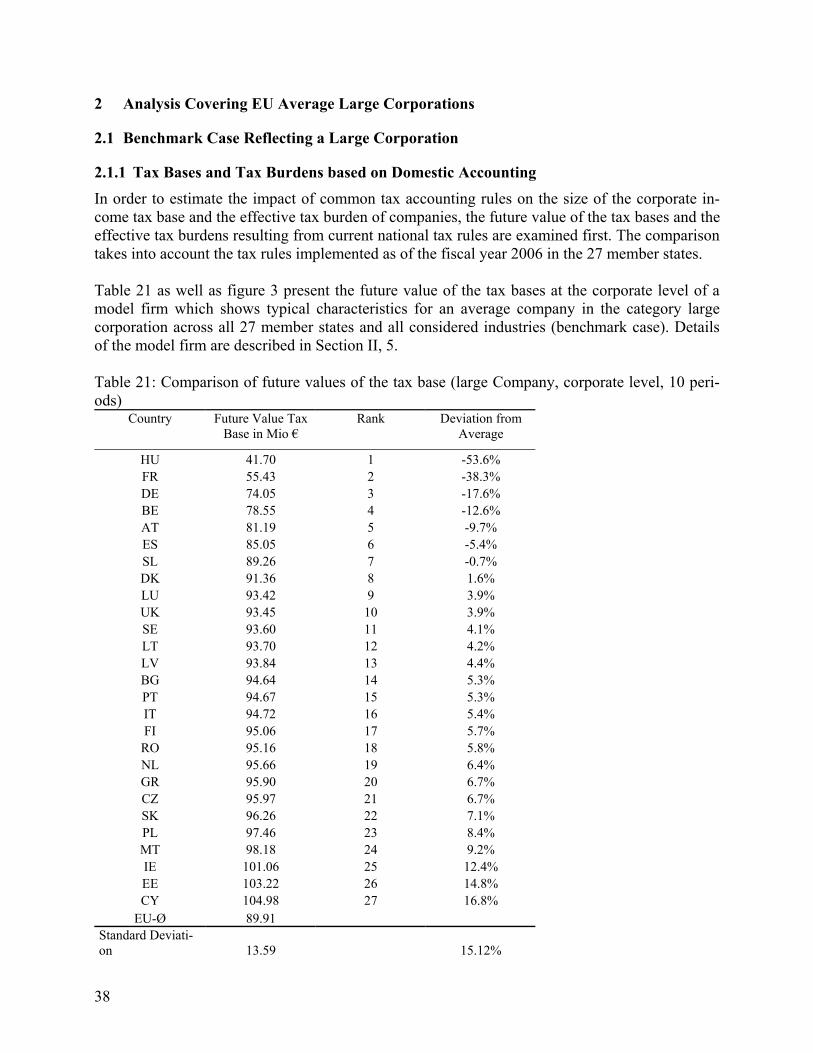
38
2 Analysis Covering EU Average Large Corporations
2.1 Benchmark Case Reflecting a Large Corporation
2.1.1 Tax Bases and Tax Burdens based on Domestic Accounting
In order to estimate the impact of common tax accounting rules on the size of the corporate in-come tax base and the effective tax burden of companies, the future value of the tax bases and the effective tax burdens resulting from current national tax rules are examined first. The comparison takes into account the tax rules implemented as of the fiscal year 2006 in the 27 member states. Table 21 as well as figure 3 present the future value of the tax bases at the corporate level of a model firm which shows typical characteristics for an average company in the category large corporation across all 27 member states and all considered industries (benchmark case). Details of the model firm are described in Section II, 5. Table 21: Comparison of future values of the tax base (large Company, corporate level, 10 peri-ods)
Country Future Value Tax Base in Mio €
Rank Deviation from Average
HU 41.70 1 -53.6% FR 55.43 2 -38.3% DE 74.05 3 -17.6% BE 78.55 4 -12.6% AT 81.19 5 -9.7% ES 85.05 6 -5.4% SL 89.26 7 -0.7% DK 91.36 8 1.6% LU 93.42 9 3.9% UK 93.45 10 3.9% SE 93.60 11 4.1% LT 93.70 12 4.2% LV 93.84 13 4.4% BG 94.64 14 5.3% PT 94.67 15 5.3% IT 94.72 16 5.4% FI 95.06 17 5.7% RO 95.16 18 5.8% NL 95.66 19 6.4% GR 95.90 20 6.7% CZ 95.97 21 6.7% SK 96.26 22 7.1% PL 97.46 23 8.4% MT 98.18 24 9.2% IE 101.06 25 12.4% EE 103.22 26 14.8% CY 104.98 27 16.8%
EU-Ø 89.91 Standard Deviati-on 13.59 15.12%
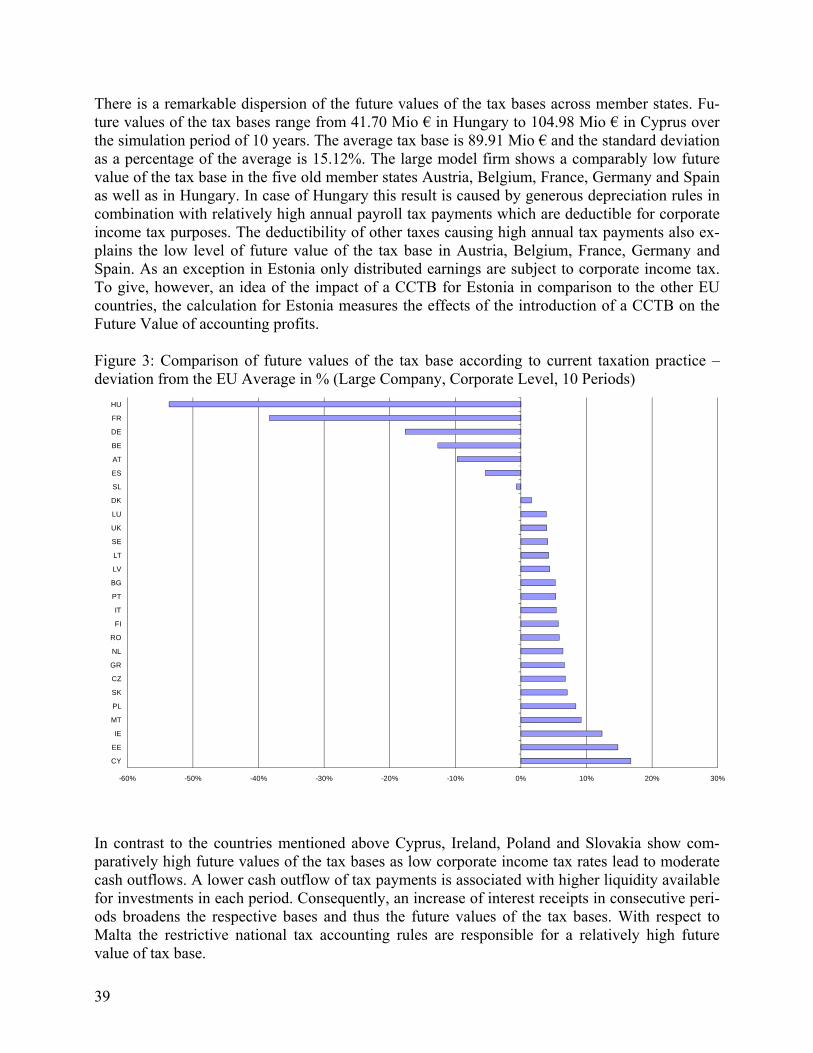
39
There is a remarkable dispersion of the future values of the tax bases across member states. Fu-ture values of the tax bases range from 41.70 Mio € in Hungary to 104.98 Mio € in Cyprus over the simulation period of 10 years. The average tax base is 89.91 Mio € and the standard deviation as a percentage of the average is 15.12%. The large model firm shows a comparably low future value of the tax base in the five old member states Austria, Belgium, France, Germany and Spain as well as in Hungary. In case of Hungary this result is caused by generous depreciation rules in combination with relatively high annual payroll tax payments which are deductible for corporate income tax purposes. The deductibility of other taxes causing high annual tax payments also ex-plains the low level of future value of the tax base in Austria, Belgium, France, Germany and Spain. As an exception in Estonia only distributed earnings are subject to corporate income tax. To give, however, an idea of the impact of a CCTB for Estonia in comparison to the other EU countries, the calculation for Estonia measures the effects of the introduction of a CCTB on the Future Value of accounting profits. Figure 3: Comparison of future values of the tax base according to current taxation practice – deviation from the EU Average in % (Large Company, Corporate Level, 10 Periods)
-60% -50% -40% -30% -20% -10% 0% 10% 20% 30%
HU
FR
DE
BE
AT
ES
SL
DK
LU
UK
SE
LT
LV
BG
PT
IT
FI
RO
NL
GR
CZ
SK
PL
MT
IE
EE
CY
In contrast to the countries mentioned above Cyprus, Ireland, Poland and Slovakia show com-paratively high future values of the tax bases as low corporate income tax rates lead to moderate cash outflows. A lower cash outflow of tax payments is associated with higher liquidity available for investments in each period. Consequently, an increase of interest receipts in consecutive peri-ods broadens the respective bases and thus the future values of the tax bases. With respect to Malta the restrictive national tax accounting rules are responsible for a relatively high future value of tax base.
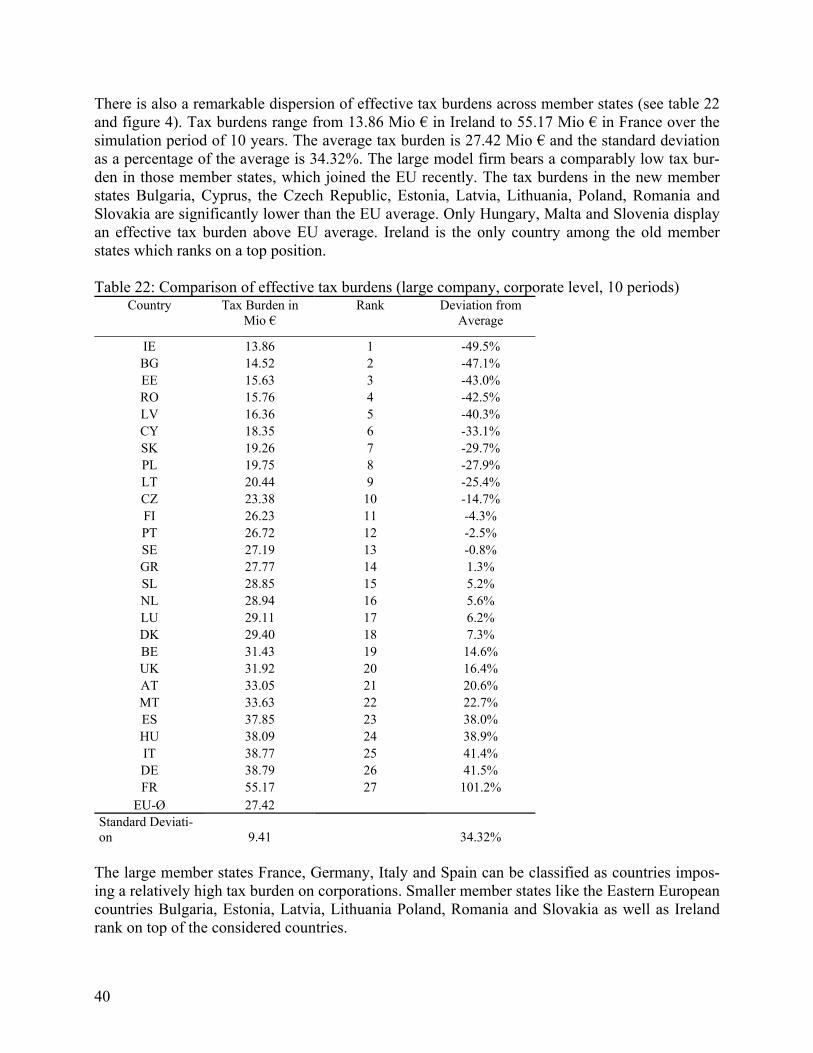
40
There is also a remarkable dispersion of effective tax burdens across member states (see table 22 and figure 4). Tax burdens range from 13.86 Mio € in Ireland to 55.17 Mio € in France over the simulation period of 10 years. The average tax burden is 27.42 Mio € and the standard deviation as a percentage of the average is 34.32%. The large model firm bears a comparably low tax bur-den in those member states, which joined the EU recently. The tax burdens in the new member states Bulgaria, Cyprus, the Czech Republic, Estonia, Latvia, Lithuania, Poland, Romania and Slovakia are significantly lower than the EU average. Only Hungary, Malta and Slovenia display an effective tax burden above EU average. Ireland is the only country among the old member states which ranks on a top position. Table 22: Comparison of effective tax burdens (large company, corporate level, 10 periods)
Country Tax Burden in Mio €
Rank Deviation from Average
IE 13.86 1 -49.5% BG 14.52 2 -47.1% EE 15.63 3 -43.0% RO 15.76 4 -42.5% LV 16.36 5 -40.3% CY 18.35 6 -33.1% SK 19.26 7 -29.7% PL 19.75 8 -27.9% LT 20.44 9 -25.4% CZ 23.38 10 -14.7% FI 26.23 11 -4.3% PT 26.72 12 -2.5% SE 27.19 13 -0.8% GR 27.77 14 1.3% SL 28.85 15 5.2% NL 28.94 16 5.6% LU 29.11 17 6.2% DK 29.40 18 7.3% BE 31.43 19 14.6% UK 31.92 20 16.4% AT 33.05 21 20.6% MT 33.63 22 22.7% ES 37.85 23 38.0% HU 38.09 24 38.9% IT 38.77 25 41.4% DE 38.79 26 41.5% FR 55.17 27 101.2%
EU-Ø 27.42 Standard Deviati-on 9.41 34.32%
The large member states France, Germany, Italy and Spain can be classified as countries impos-ing a relatively high tax burden on corporations. Smaller member states like the Eastern European countries Bulgaria, Estonia, Latvia, Lithuania Poland, Romania and Slovakia as well as Ireland rank on top of the considered countries.
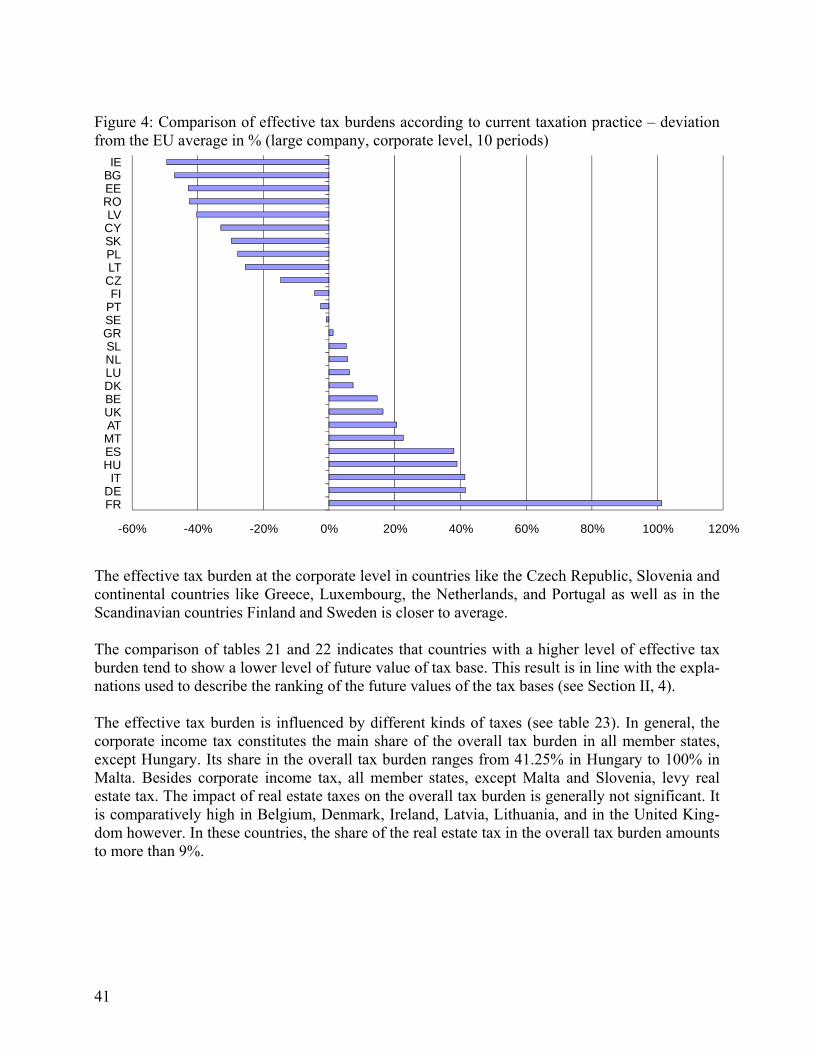
41
Figure 4: Comparison of effective tax burdens according to current taxation practice – deviation from the EU average in % (large company, corporate level, 10 periods)
-60% -40% -20% 0% 20% 40% 60% 80% 100% 120%
IEBGEEROLVCYSKPLLTCZFI
PTSEGRSLNLLUDKBEUKATMTESHU
ITDEFR
The effective tax burden at the corporate level in countries like the Czech Republic, Slovenia and continental countries like Greece, Luxembourg, the Netherlands, and Portugal as well as in the Scandinavian countries Finland and Sweden is closer to average. The comparison of tables 21 and 22 indicates that countries with a higher level of effective tax burden tend to show a lower level of future value of tax base. This result is in line with the expla-nations used to describe the ranking of the future values of the tax bases (see Section II, 4). The effective tax burden is influenced by different kinds of taxes (see table 23). In general, the corporate income tax constitutes the main share of the overall tax burden in all member states, except Hungary. Its share in the overall tax burden ranges from 41.25% in Hungary to 100% in Malta. Besides corporate income tax, all member states, except Malta and Slovenia, levy real estate tax. The impact of real estate taxes on the overall tax burden is generally not significant. It is comparatively high in Belgium, Denmark, Ireland, Latvia, Lithuania, and in the United King-dom however. In these countries, the share of the real estate tax in the overall tax burden amounts to more than 9%.
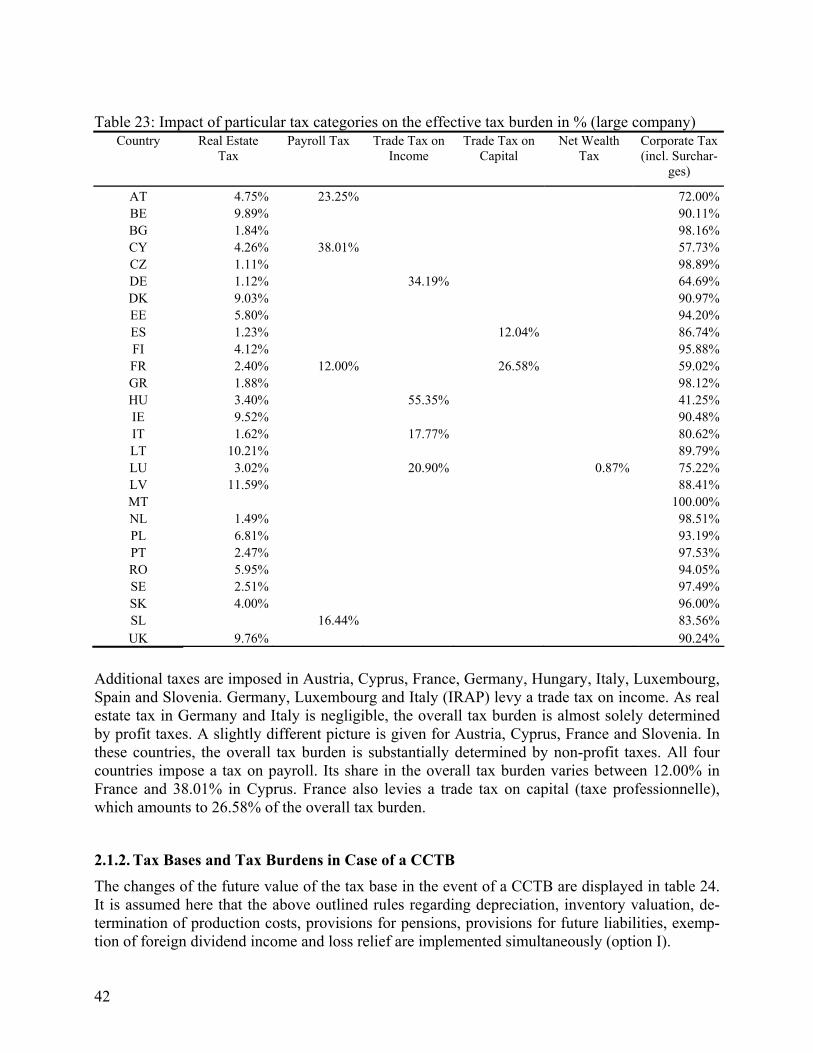
42
Table 23: Impact of particular tax categories on the effective tax burden in % (large company)
Country Real Estate Tax
Payroll Tax Trade Tax on Income
Trade Tax on Capital
Net Wealth Tax
Corporate Tax (incl. Surchar-
ges)
AT 4.75% 23.25% 72.00%BE 9.89% 90.11%BG 1.84% 98.16%CY 4.26% 38.01% 57.73%CZ 1.11% 98.89%DE 1.12% 34.19% 64.69%DK 9.03% 90.97%EE 5.80% 94.20%ES 1.23% 12.04% 86.74%FI 4.12% 95.88%FR 2.40% 12.00% 26.58% 59.02%GR 1.88% 98.12%HU 3.40% 55.35% 41.25%IE 9.52% 90.48%IT 1.62% 17.77% 80.62%LT 10.21% 89.79%LU 3.02% 20.90% 0.87% 75.22%LV 11.59% 88.41%MT 100.00%NL 1.49% 98.51%PL 6.81% 93.19%PT 2.47% 97.53%RO 5.95% 94.05%SE 2.51% 97.49%SK 4.00% 96.00%SL 16.44% 83.56%UK 9.76% 90.24%
Additional taxes are imposed in Austria, Cyprus, France, Germany, Hungary, Italy, Luxembourg, Spain and Slovenia. Germany, Luxembourg and Italy (IRAP) levy a trade tax on income. As real estate tax in Germany and Italy is negligible, the overall tax burden is almost solely determined by profit taxes. A slightly different picture is given for Austria, Cyprus, France and Slovenia. In these countries, the overall tax burden is substantially determined by non-profit taxes. All four countries impose a tax on payroll. Its share in the overall tax burden varies between 12.00% in France and 38.01% in Cyprus. France also levies a trade tax on capital (taxe professionnelle), which amounts to 26.58% of the overall tax burden.
2.1.2. Tax Bases and Tax Burdens in Case of a CCTB
The changes of the future value of the tax base in the event of a CCTB are displayed in table 24. It is assumed here that the above outlined rules regarding depreciation, inventory valuation, de-termination of production costs, provisions for pensions, provisions for future liabilities, exemp-tion of foreign dividend income and loss relief are implemented simultaneously (option I).
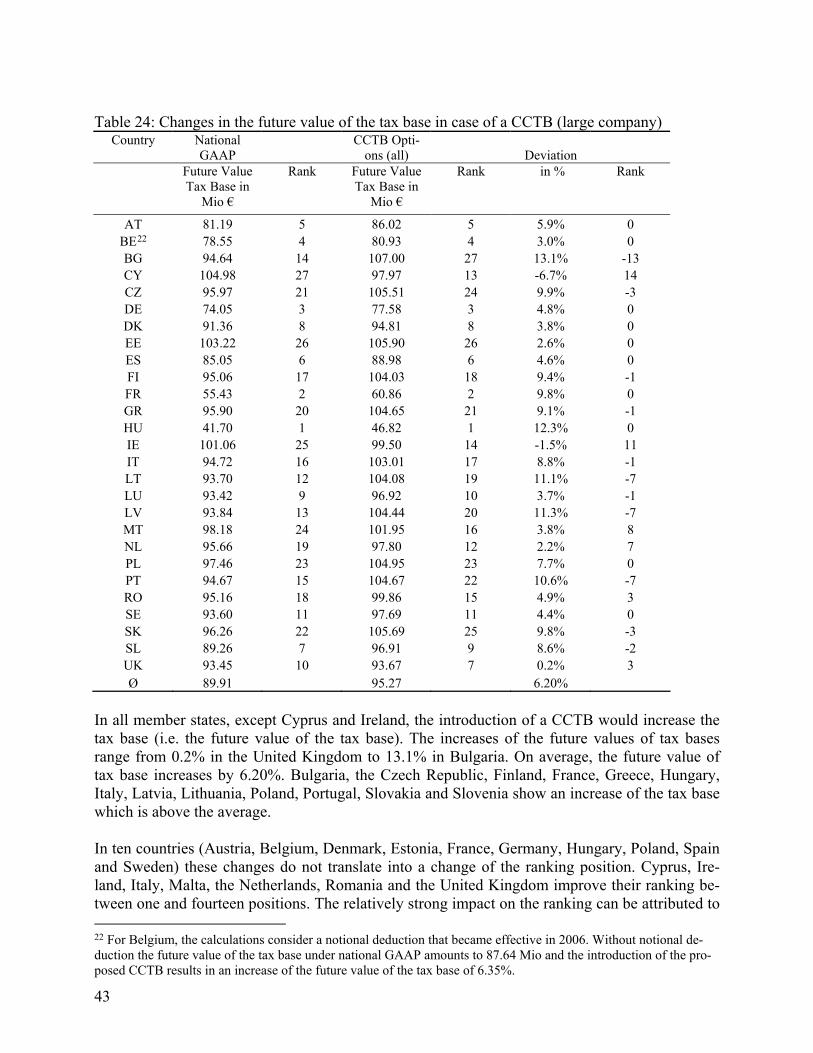
43
Table 24: Changes in the future value of the tax base in case of a CCTB (large company)
Country National GAAP
CCTB Opti-ons (all) Deviation
Future Value Tax Base in
Mio €
Rank Future Value Tax Base in
Mio €
Rank in % Rank
AT 81.19 5 86.02 5 5.9% 0 BE22 78.55 4 80.93 4 3.0% 0 BG 94.64 14 107.00 27 13.1% -13 CY 104.98 27 97.97 13 -6.7% 14 CZ 95.97 21 105.51 24 9.9% -3 DE 74.05 3 77.58 3 4.8% 0 DK 91.36 8 94.81 8 3.8% 0 EE 103.22 26 105.90 26 2.6% 0 ES 85.05 6 88.98 6 4.6% 0 FI 95.06 17 104.03 18 9.4% -1 FR 55.43 2 60.86 2 9.8% 0 GR 95.90 20 104.65 21 9.1% -1 HU 41.70 1 46.82 1 12.3% 0 IE 101.06 25 99.50 14 -1.5% 11 IT 94.72 16 103.01 17 8.8% -1 LT 93.70 12 104.08 19 11.1% -7 LU 93.42 9 96.92 10 3.7% -1 LV 93.84 13 104.44 20 11.3% -7 MT 98.18 24 101.95 16 3.8% 8 NL 95.66 19 97.80 12 2.2% 7 PL 97.46 23 104.95 23 7.7% 0 PT 94.67 15 104.67 22 10.6% -7 RO 95.16 18 99.86 15 4.9% 3 SE 93.60 11 97.69 11 4.4% 0 SK 96.26 22 105.69 25 9.8% -3 SL 89.26 7 96.91 9 8.6% -2 UK 93.45 10 93.67 7 0.2% 3 Ø 89.91 95.27 6.20%
In all member states, except Cyprus and Ireland, the introduction of a CCTB would increase the tax base (i.e. the future value of the tax base). The increases of the future values of tax bases range from 0.2% in the United Kingdom to 13.1% in Bulgaria. On average, the future value of tax base increases by 6.20%. Bulgaria, the Czech Republic, Finland, France, Greece, Hungary, Italy, Latvia, Lithuania, Poland, Portugal, Slovakia and Slovenia show an increase of the tax base which is above the average. In ten countries (Austria, Belgium, Denmark, Estonia, France, Germany, Hungary, Poland, Spain and Sweden) these changes do not translate into a change of the ranking position. Cyprus, Ire-land, Italy, Malta, the Netherlands, Romania and the United Kingdom improve their ranking be-tween one and fourteen positions. The relatively strong impact on the ranking can be attributed to 22 For Belgium, the calculations consider a notional deduction that became effective in 2006. Without notional de-duction the future value of the tax base under national GAAP amounts to 87.64 Mio and the introduction of the pro-posed CCTB results in an increase of the future value of the tax base of 6.35%.
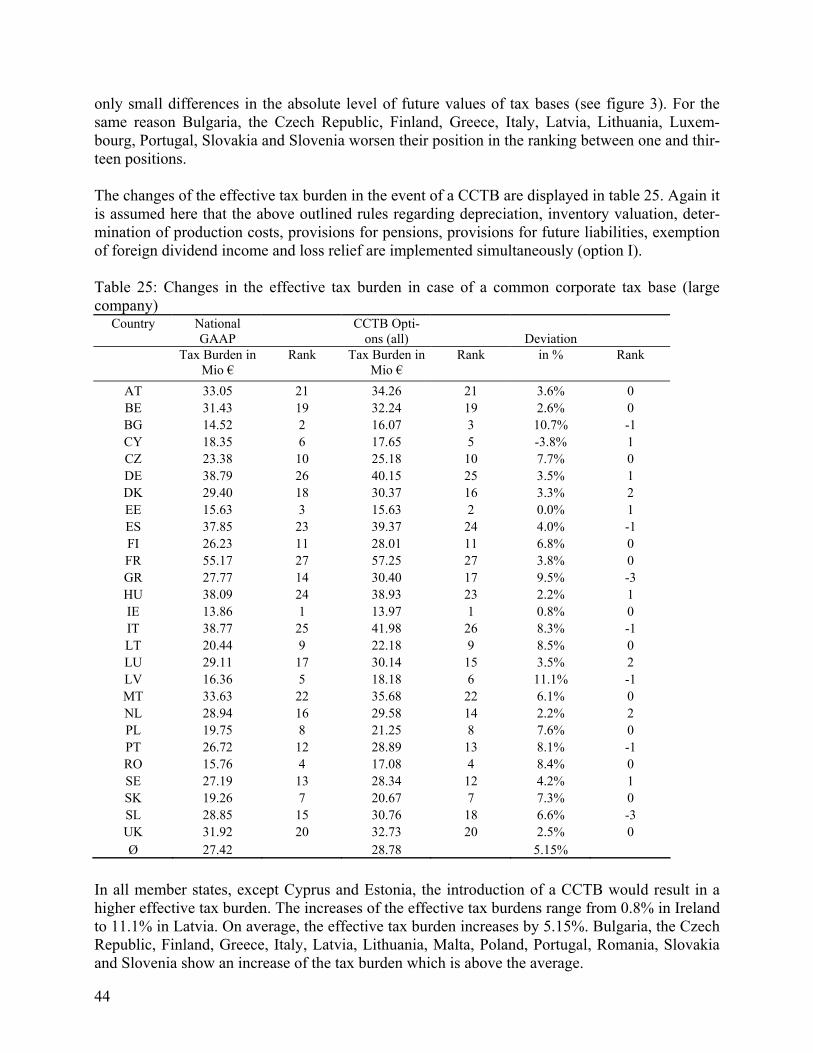
44
only small differences in the absolute level of future values of tax bases (see figure 3). For the same reason Bulgaria, the Czech Republic, Finland, Greece, Italy, Latvia, Lithuania, Luxem-bourg, Portugal, Slovakia and Slovenia worsen their position in the ranking between one and thir-teen positions. The changes of the effective tax burden in the event of a CCTB are displayed in table 25. Again it is assumed here that the above outlined rules regarding depreciation, inventory valuation, deter-mination of production costs, provisions for pensions, provisions for future liabilities, exemption of foreign dividend income and loss relief are implemented simultaneously (option I). Table 25: Changes in the effective tax burden in case of a common corporate tax base (large company)
Country National GAAP
CCTB Opti-ons (all) Deviation
Tax Burden in Mio €
Rank Tax Burden in Mio €
Rank in % Rank
AT 33.05 21 34.26 21 3.6% 0 BE 31.43 19 32.24 19 2.6% 0 BG 14.52 2 16.07 3 10.7% -1 CY 18.35 6 17.65 5 -3.8% 1 CZ 23.38 10 25.18 10 7.7% 0 DE 38.79 26 40.15 25 3.5% 1 DK 29.40 18 30.37 16 3.3% 2 EE 15.63 3 15.63 2 0.0% 1 ES 37.85 23 39.37 24 4.0% -1 FI 26.23 11 28.01 11 6.8% 0 FR 55.17 27 57.25 27 3.8% 0 GR 27.77 14 30.40 17 9.5% -3 HU 38.09 24 38.93 23 2.2% 1 IE 13.86 1 13.97 1 0.8% 0 IT 38.77 25 41.98 26 8.3% -1 LT 20.44 9 22.18 9 8.5% 0 LU 29.11 17 30.14 15 3.5% 2 LV 16.36 5 18.18 6 11.1% -1 MT 33.63 22 35.68 22 6.1% 0 NL 28.94 16 29.58 14 2.2% 2 PL 19.75 8 21.25 8 7.6% 0 PT 26.72 12 28.89 13 8.1% -1 RO 15.76 4 17.08 4 8.4% 0 SE 27.19 13 28.34 12 4.2% 1 SK 19.26 7 20.67 7 7.3% 0 SL 28.85 15 30.76 18 6.6% -3 UK 31.92 20 32.73 20 2.5% 0 Ø 27.42 28.78 5.15%
In all member states, except Cyprus and Estonia, the introduction of a CCTB would result in a higher effective tax burden. The increases of the effective tax burdens range from 0.8% in Ireland to 11.1% in Latvia. On average, the effective tax burden increases by 5.15%. Bulgaria, the Czech Republic, Finland, Greece, Italy, Latvia, Lithuania, Malta, Poland, Portugal, Romania, Slovakia and Slovenia show an increase of the tax burden which is above the average.
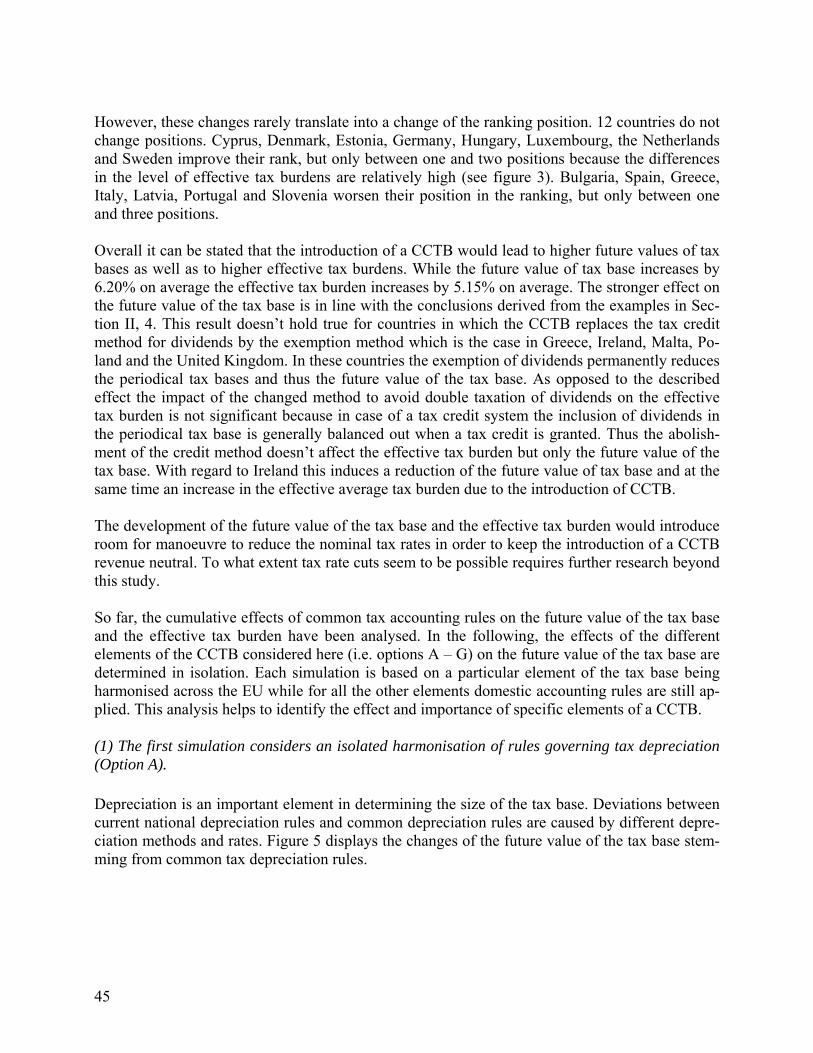
45
However, these changes rarely translate into a change of the ranking position. 12 countries do not change positions. Cyprus, Denmark, Estonia, Germany, Hungary, Luxembourg, the Netherlands and Sweden improve their rank, but only between one and two positions because the differences in the level of effective tax burdens are relatively high (see figure 3). Bulgaria, Spain, Greece, Italy, Latvia, Portugal and Slovenia worsen their position in the ranking, but only between one and three positions. Overall it can be stated that the introduction of a CCTB would lead to higher future values of tax bases as well as to higher effective tax burdens. While the future value of tax base increases by 6.20% on average the effective tax burden increases by 5.15% on average. The stronger effect on the future value of the tax base is in line with the conclusions derived from the examples in Sec-tion II, 4. This result doesn’t hold true for countries in which the CCTB replaces the tax credit method for dividends by the exemption method which is the case in Greece, Ireland, Malta, Po-land and the United Kingdom. In these countries the exemption of dividends permanently reduces the periodical tax bases and thus the future value of the tax base. As opposed to the described effect the impact of the changed method to avoid double taxation of dividends on the effective tax burden is not significant because in case of a tax credit system the inclusion of dividends in the periodical tax base is generally balanced out when a tax credit is granted. Thus the abolish-ment of the credit method doesn’t affect the effective tax burden but only the future value of the tax base. With regard to Ireland this induces a reduction of the future value of tax base and at the same time an increase in the effective average tax burden due to the introduction of CCTB. The development of the future value of the tax base and the effective tax burden would introduce room for manoeuvre to reduce the nominal tax rates in order to keep the introduction of a CCTB revenue neutral. To what extent tax rate cuts seem to be possible requires further research beyond this study. So far, the cumulative effects of common tax accounting rules on the future value of the tax base and the effective tax burden have been analysed. In the following, the effects of the different elements of the CCTB considered here (i.e. options A – G) on the future value of the tax base are determined in isolation. Each simulation is based on a particular element of the tax base being harmonised across the EU while for all the other elements domestic accounting rules are still ap-plied. This analysis helps to identify the effect and importance of specific elements of a CCTB. (1) The first simulation considers an isolated harmonisation of rules governing tax depreciation (Option A). Depreciation is an important element in determining the size of the tax base. Deviations between current national depreciation rules and common depreciation rules are caused by different depre-ciation methods and rates. Figure 5 displays the changes of the future value of the tax base stem-ming from common tax depreciation rules.
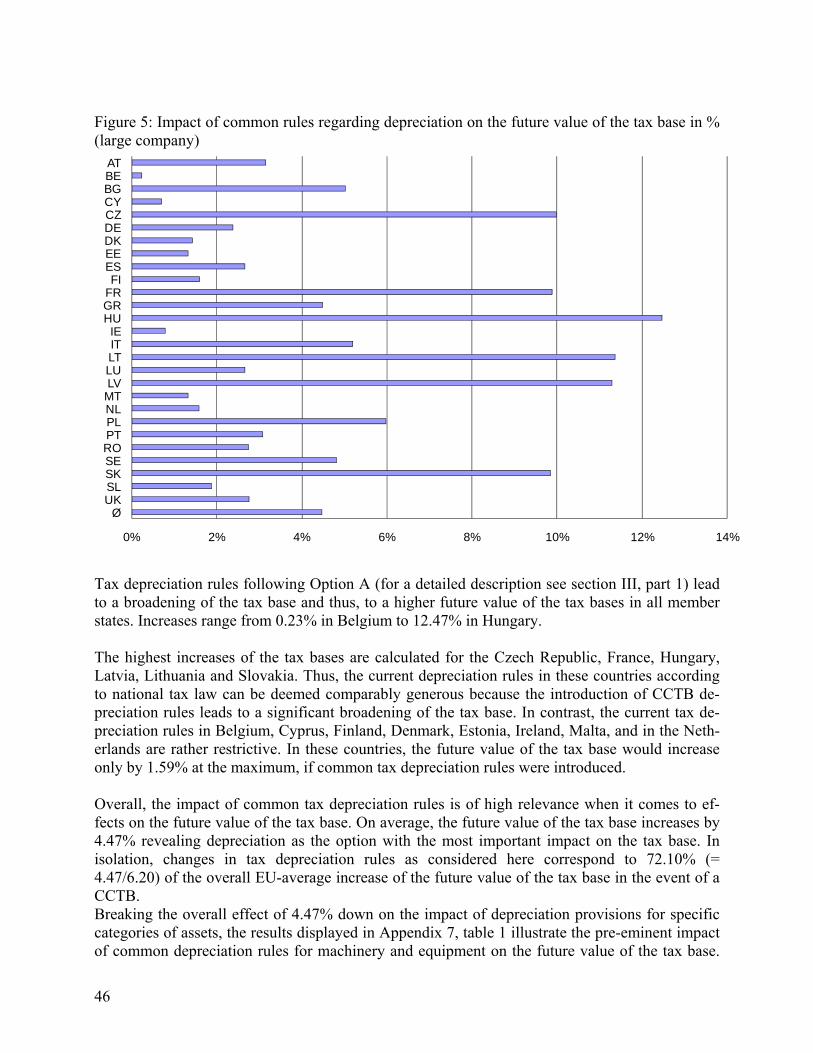
46
Figure 5: Impact of common rules regarding depreciation on the future value of the tax base in % (large company)
0% 2% 4% 6% 8% 10% 12% 14%
ATBEBGCYCZDEDKEEESFI
FRGRHUIEITLTLULV
MTNLPLPTROSESKSLUK
Ø
Tax depreciation rules following Option A (for a detailed description see section III, part 1) lead to a broadening of the tax base and thus, to a higher future value of the tax bases in all member states. Increases range from 0.23% in Belgium to 12.47% in Hungary. The highest increases of the tax bases are calculated for the Czech Republic, France, Hungary, Latvia, Lithuania and Slovakia. Thus, the current depreciation rules in these countries according to national tax law can be deemed comparably generous because the introduction of CCTB de-preciation rules leads to a significant broadening of the tax base. In contrast, the current tax de-preciation rules in Belgium, Cyprus, Finland, Denmark, Estonia, Ireland, Malta, and in the Neth-erlands are rather restrictive. In these countries, the future value of the tax base would increase only by 1.59% at the maximum, if common tax depreciation rules were introduced. Overall, the impact of common tax depreciation rules is of high relevance when it comes to ef-fects on the future value of the tax base. On average, the future value of the tax base increases by 4.47% revealing depreciation as the option with the most important impact on the tax base. In isolation, changes in tax depreciation rules as considered here correspond to 72.10% (= 4.47/6.20) of the overall EU-average increase of the future value of the tax base in the event of a CCTB. Breaking the overall effect of 4.47% down on the impact of depreciation provisions for specific categories of assets, the results displayed in Appendix 7, table 1 illustrate the pre-eminent impact of common depreciation rules for machinery and equipment on the future value of the tax base.
47
On average due to the isolated application of the proposed CCTB provisions concerning machin-ery and equipment the future value of the tax base increases by 4.17%. In contrast the increase of the future value of the tax base only amounts to 0.25% if common depreciation rules are applied exclusively for buildings and to 0.04% if the proposed CCTB provisions are only applied on in-tangibles (see Appendix 7, table 1). To sum up, the impact of common depreciation provisions for machinery and equipment largely dominates the increase of the future value of the tax base observed for Option A. Hence, changes in the definition of the proposed depreciation rules on machinery and equipment influence considerably the increase of the future value of the tax base in the event of a CCTB. To illustrate this influence, a modification of the depreciation rate for pool depreciation on ma-chinery and equipment is considered in Appendix 7, table 323. It reveals that a change in deprecia-tion rate for pool depreciation results in high changes of the future value of the tax base under CCTB and thus in the deviation between national GAAP and CCTB. If the depreciation rate for the mentioned assets is fixed at 25% instead of 20% (benchmark case), the average increase of the future value of the tax base due to the isolated application of common depreciation rules amounts 1.26%. It translates to an overall increase of the future value of the tax base of 1.09% if a simultaneous introduction of all CCTB options takes place. Both effects are significantly smaller than in the benchmark case where a 20% depreciation rate for pool depreciation is applied. (2) The second simulation analyses the effect of an isolated harmonisation of methods for simpli-fied valuation of inventories on the future value of the tax base (Option B). The weighted average costs method (WAC) was chosen as an option for the CCTB. Accordingly, items in inventory and the cost of goods which are sold in the period are valued with the average costs of the units being in stock at that time. Given inflation and rising costs over time, as it is assumed for these calculations, inventory is valued comparably moderate at average costs. Sold goods are valued moderate as well at average costs and in tendency below recently higher pro-duction costs. However, production costs do not necessarily increase over time. Instead, they may vary from period to period depending on the amount of indirect costs, such as depreciation, and the number of units produced. Therefore, the effects of an introduction of the WAC-method may vary. Changes of the future value of the tax base resulting from the introduction of the WAC-method are displayed in figure 6. Compared to the LIFO-method which is used in most member states’ national tax laws, the WAC-method results in a broader tax base. Sold goods are valued at lower costs thus increasing the taxable profits. This effect is compensated partly in the last period of the simulation when lower hidden reserves for the WAC-method lead to a smaller tax base and tax in that period. Aus-tria, Italy, Luxembourg, the Netherlands, Poland and Slovenia for example show the highest in-crease of the future value of the tax base when WAC is applied. Compared to countries applying the FIFO-method in their national tax law, the tax base with WAC is reduced and the future value of the tax base therefore is lower. Denmark, Finland and Lithuania therefore show a decrease in the future value of the tax base. There is no change for countries which already apply the WAC method in their national tax law. 23 For detailed results and interpretation of this modification see Appendix 7, page 170.
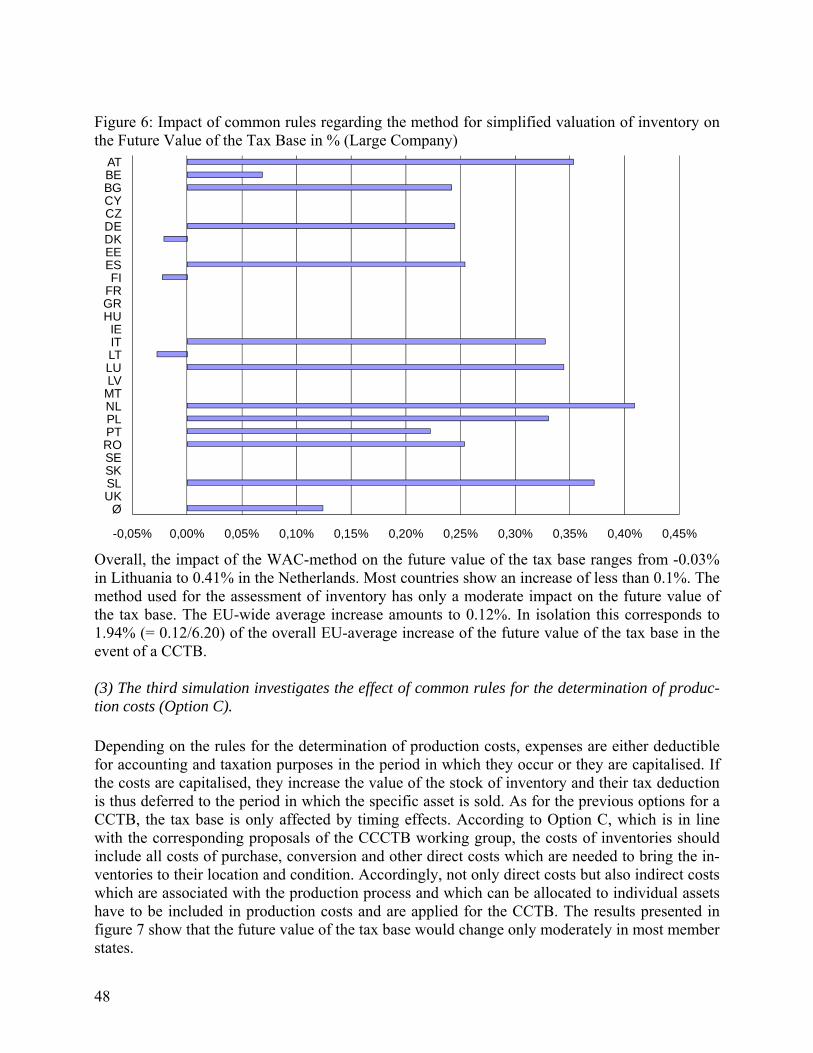
48
Figure 6: Impact of common rules regarding the method for simplified valuation of inventory on the Future Value of the Tax Base in % (Large Company)
-0,05% 0,00% 0,05% 0,10% 0,15% 0,20% 0,25% 0,30% 0,35% 0,40% 0,45%
ATBEBGCYCZDEDKEEESFI
FRGRHU
IEITLTLULV
MTNLPLPTROSESKSLUK
Ø
Overall, the impact of the WAC-method on the future value of the tax base ranges from -0.03% in Lithuania to 0.41% in the Netherlands. Most countries show an increase of less than 0.1%. The method used for the assessment of inventory has only a moderate impact on the future value of the tax base. The EU-wide average increase amounts to 0.12%. In isolation this corresponds to 1.94% (= 0.12/6.20) of the overall EU-average increase of the future value of the tax base in the event of a CCTB. (3) The third simulation investigates the effect of common rules for the determination of produc-tion costs (Option C). Depending on the rules for the determination of production costs, expenses are either deductible for accounting and taxation purposes in the period in which they occur or they are capitalised. If the costs are capitalised, they increase the value of the stock of inventory and their tax deduction is thus deferred to the period in which the specific asset is sold. As for the previous options for a CCTB, the tax base is only affected by timing effects. According to Option C, which is in line with the corresponding proposals of the CCCTB working group, the costs of inventories should include all costs of purchase, conversion and other direct costs which are needed to bring the in-ventories to their location and condition. Accordingly, not only direct costs but also indirect costs which are associated with the production process and which can be allocated to individual assets have to be included in production costs and are applied for the CCTB. The results presented in figure 7 show that the future value of the tax base would change only moderately in most member states.
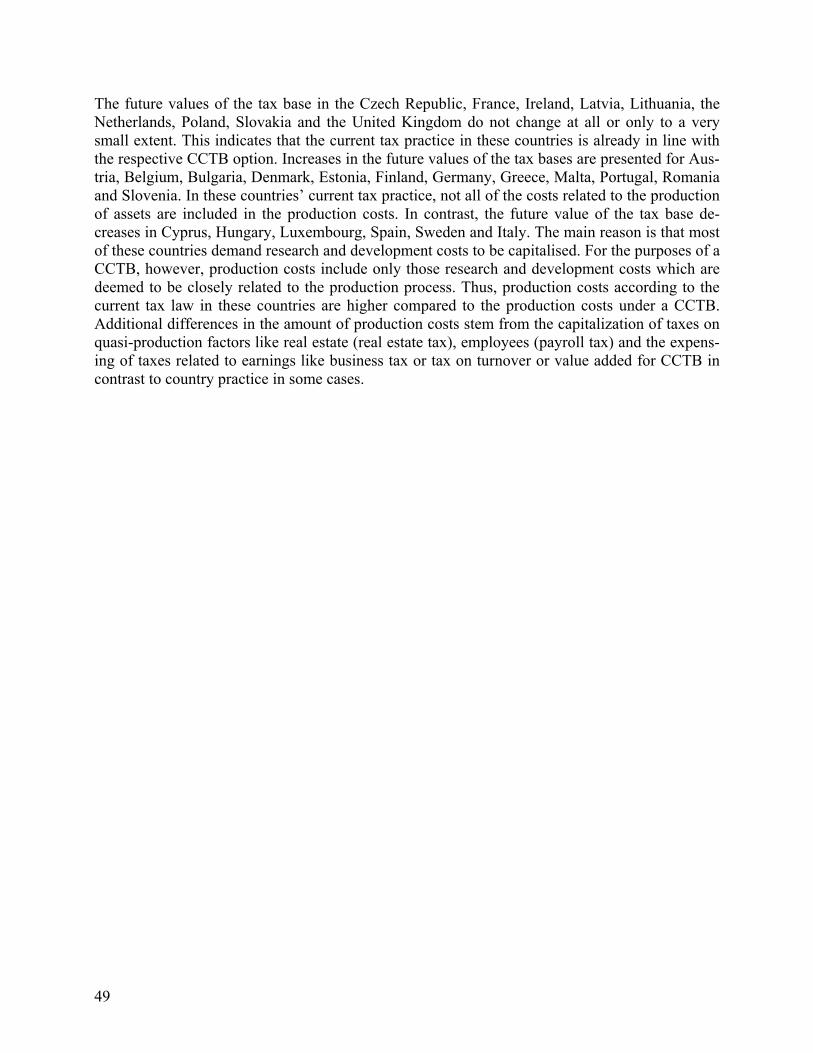
49
The future values of the tax base in the Czech Republic, France, Ireland, Latvia, Lithuania, the Netherlands, Poland, Slovakia and the United Kingdom do not change at all or only to a very small extent. This indicates that the current tax practice in these countries is already in line with the respective CCTB option. Increases in the future values of the tax bases are presented for Aus-tria, Belgium, Bulgaria, Denmark, Estonia, Finland, Germany, Greece, Malta, Portugal, Romania and Slovenia. In these countries’ current tax practice, not all of the costs related to the production of assets are included in the production costs. In contrast, the future value of the tax base de-creases in Cyprus, Hungary, Luxembourg, Spain, Sweden and Italy. The main reason is that most of these countries demand research and development costs to be capitalised. For the purposes of a CCTB, however, production costs include only those research and development costs which are deemed to be closely related to the production process. Thus, production costs according to the current tax law in these countries are higher compared to the production costs under a CCTB. Additional differences in the amount of production costs stem from the capitalization of taxes on quasi-production factors like real estate (real estate tax), employees (payroll tax) and the expens-ing of taxes related to earnings like business tax or tax on turnover or value added for CCTB in contrast to country practice in some cases.
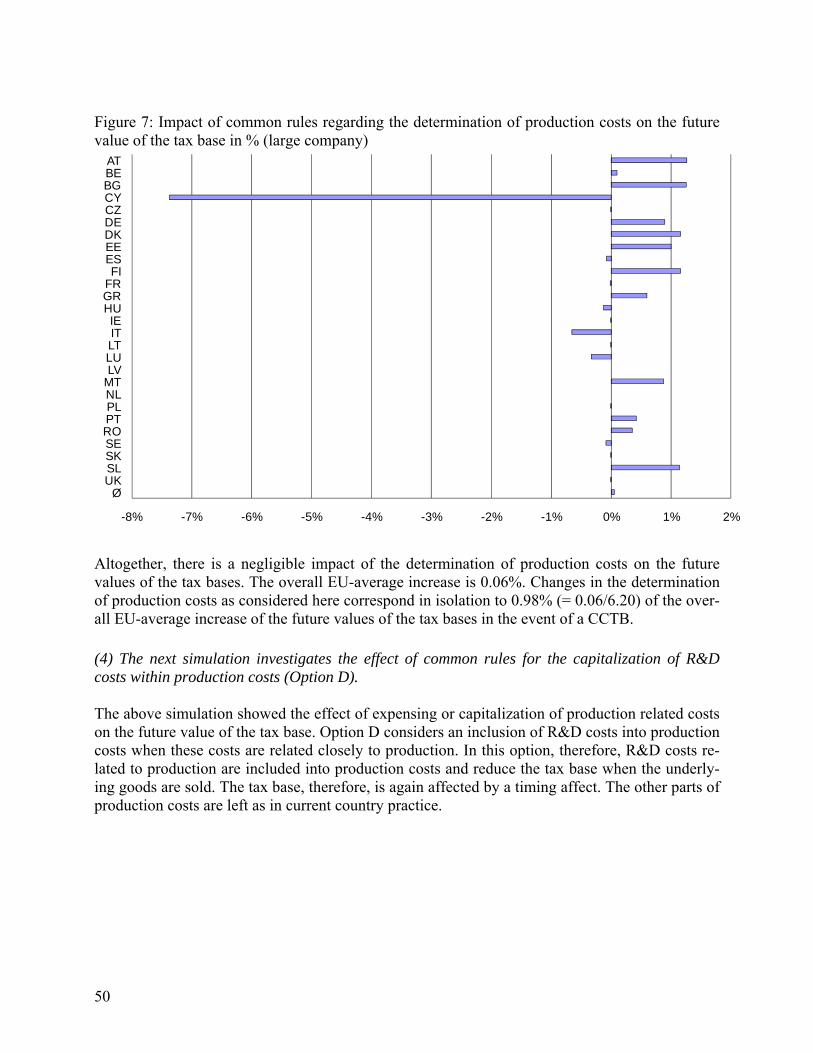
50
Figure 7: Impact of common rules regarding the determination of production costs on the future value of the tax base in % (large company)
-8% -7% -6% -5% -4% -3% -2% -1% 0% 1% 2%
ATBEBGCYCZDEDKEEESFI
FRGRHUIEITLTLULV
MTNLPLPTROSESKSLUK
Ø
Altogether, there is a negligible impact of the determination of production costs on the future values of the tax bases. The overall EU-average increase is 0.06%. Changes in the determination of production costs as considered here correspond in isolation to 0.98% (= 0.06/6.20) of the over-all EU-average increase of the future values of the tax bases in the event of a CCTB. (4) The next simulation investigates the effect of common rules for the capitalization of R&D costs within production costs (Option D). The above simulation showed the effect of expensing or capitalization of production related costs on the future value of the tax base. Option D considers an inclusion of R&D costs into production costs when these costs are related closely to production. In this option, therefore, R&D costs re-lated to production are included into production costs and reduce the tax base when the underly-ing goods are sold. The tax base, therefore, is again affected by a timing affect. The other parts of production costs are left as in current country practice.
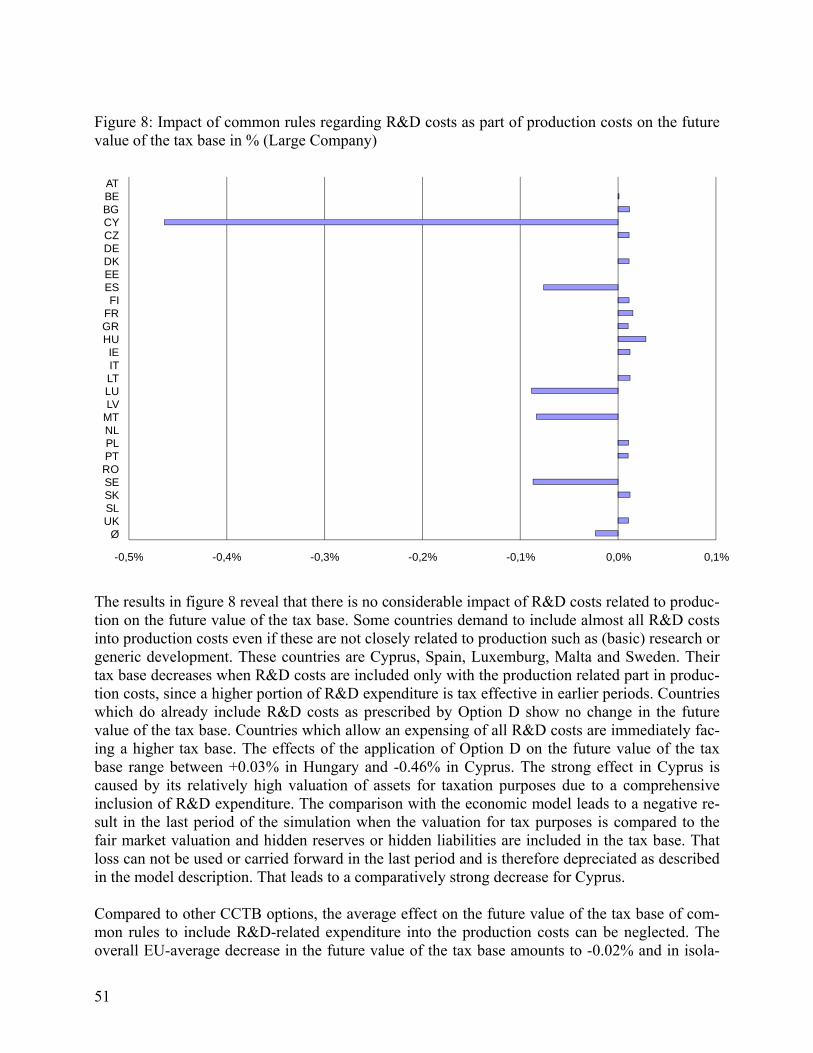
51
Figure 8: Impact of common rules regarding R&D costs as part of production costs on the future value of the tax base in % (Large Company)
-0,5% -0,4% -0,3% -0,2% -0,1% 0,0% 0,1%
ATBEBGCYCZDEDKEEESFI
FRGRHUIEITLTLULV
MTNLPLPTROSESKSLUK
Ø
The results in figure 8 reveal that there is no considerable impact of R&D costs related to produc-tion on the future value of the tax base. Some countries demand to include almost all R&D costs into production costs even if these are not closely related to production such as (basic) research or generic development. These countries are Cyprus, Spain, Luxemburg, Malta and Sweden. Their tax base decreases when R&D costs are included only with the production related part in produc-tion costs, since a higher portion of R&D expenditure is tax effective in earlier periods. Countries which do already include R&D costs as prescribed by Option D show no change in the future value of the tax base. Countries which allow an expensing of all R&D costs are immediately fac-ing a higher tax base. The effects of the application of Option D on the future value of the tax base range between +0.03% in Hungary and -0.46% in Cyprus. The strong effect in Cyprus is caused by its relatively high valuation of assets for taxation purposes due to a comprehensive inclusion of R&D expenditure. The comparison with the economic model leads to a negative re-sult in the last period of the simulation when the valuation for tax purposes is compared to the fair market valuation and hidden reserves or hidden liabilities are included in the tax base. That loss can not be used or carried forward in the last period and is therefore depreciated as described in the model description. That leads to a comparatively strong decrease for Cyprus. Compared to other CCTB options, the average effect on the future value of the tax base of com-mon rules to include R&D-related expenditure into the production costs can be neglected. The overall EU-average decrease in the future value of the tax base amounts to -0.02% and in isola-
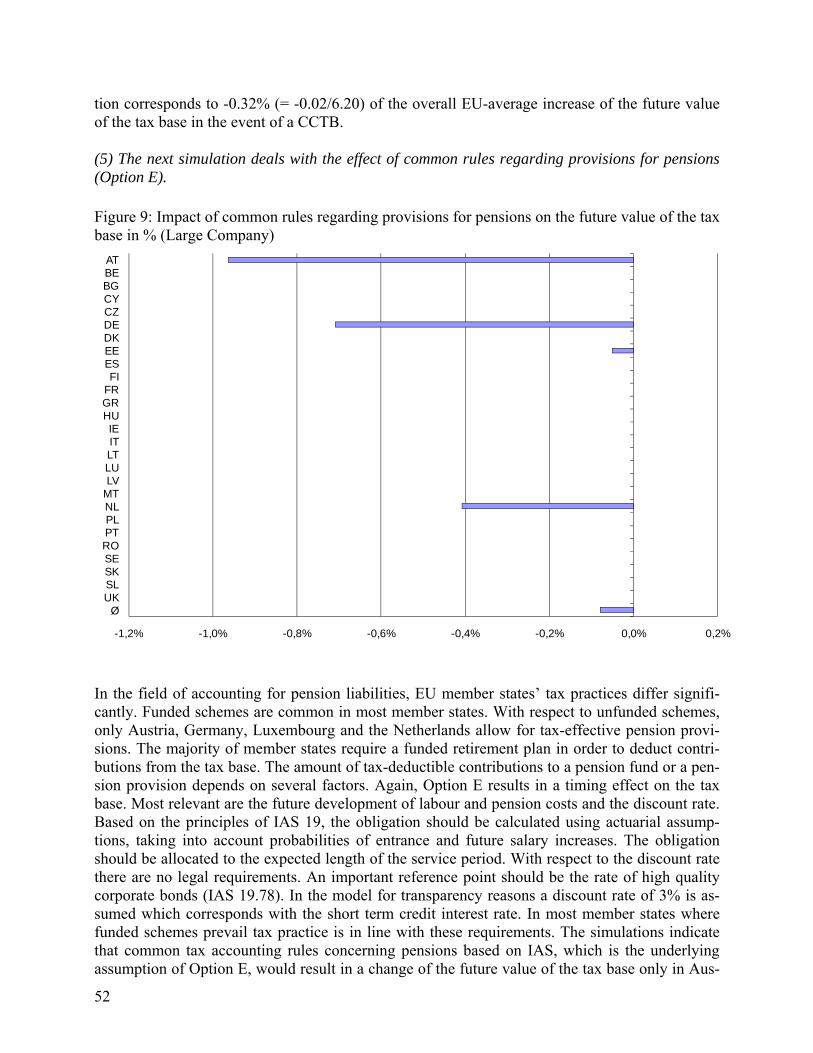
52
tion corresponds to -0.32% (= -0.02/6.20) of the overall EU-average increase of the future value of the tax base in the event of a CCTB. (5) The next simulation deals with the effect of common rules regarding provisions for pensions (Option E). Figure 9: Impact of common rules regarding provisions for pensions on the future value of the tax base in % (Large Company)
-1,2% -1,0% -0,8% -0,6% -0,4% -0,2% 0,0% 0,2%
ATBEBGCYCZDEDKEEESFI
FRGRHUIEITLTLULV
MTNLPLPTROSESKSLUK
Ø
In the field of accounting for pension liabilities, EU member states’ tax practices differ signifi-cantly. Funded schemes are common in most member states. With respect to unfunded schemes, only Austria, Germany, Luxembourg and the Netherlands allow for tax-effective pension provi-sions. The majority of member states require a funded retirement plan in order to deduct contri-butions from the tax base. The amount of tax-deductible contributions to a pension fund or a pen-sion provision depends on several factors. Again, Option E results in a timing effect on the tax base. Most relevant are the future development of labour and pension costs and the discount rate. Based on the principles of IAS 19, the obligation should be calculated using actuarial assump-tions, taking into account probabilities of entrance and future salary increases. The obligation should be allocated to the expected length of the service period. With respect to the discount rate there are no legal requirements. An important reference point should be the rate of high quality corporate bonds (IAS 19.78). In the model for transparency reasons a discount rate of 3% is as-sumed which corresponds with the short term credit interest rate. In most member states where funded schemes prevail tax practice is in line with these requirements. The simulations indicate that common tax accounting rules concerning pensions based on IAS, which is the underlying assumption of Option E, would result in a change of the future value of the tax base only in Aus-
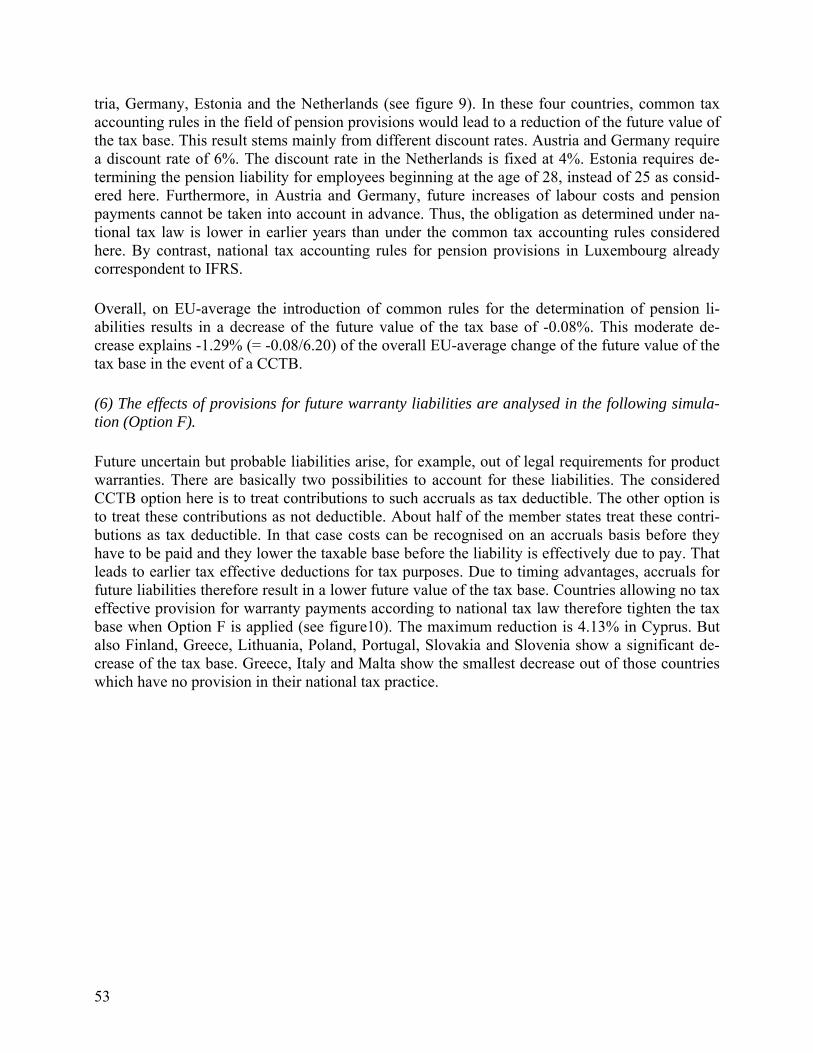
53
tria, Germany, Estonia and the Netherlands (see figure 9). In these four countries, common tax accounting rules in the field of pension provisions would lead to a reduction of the future value of the tax base. This result stems mainly from different discount rates. Austria and Germany require a discount rate of 6%. The discount rate in the Netherlands is fixed at 4%. Estonia requires de-termining the pension liability for employees beginning at the age of 28, instead of 25 as consid-ered here. Furthermore, in Austria and Germany, future increases of labour costs and pension payments cannot be taken into account in advance. Thus, the obligation as determined under na-tional tax law is lower in earlier years than under the common tax accounting rules considered here. By contrast, national tax accounting rules for pension provisions in Luxembourg already correspondent to IFRS. Overall, on EU-average the introduction of common rules for the determination of pension li-abilities results in a decrease of the future value of the tax base of -0.08%. This moderate de-crease explains -1.29% (= -0.08/6.20) of the overall EU-average change of the future value of the tax base in the event of a CCTB. (6) The effects of provisions for future warranty liabilities are analysed in the following simula-tion (Option F). Future uncertain but probable liabilities arise, for example, out of legal requirements for product warranties. There are basically two possibilities to account for these liabilities. The considered CCTB option here is to treat contributions to such accruals as tax deductible. The other option is to treat these contributions as not deductible. About half of the member states treat these contri-butions as tax deductible. In that case costs can be recognised on an accruals basis before they have to be paid and they lower the taxable base before the liability is effectively due to pay. That leads to earlier tax effective deductions for tax purposes. Due to timing advantages, accruals for future liabilities therefore result in a lower future value of the tax base. Countries allowing no tax effective provision for warranty payments according to national tax law therefore tighten the tax base when Option F is applied (see figure10). The maximum reduction is 4.13% in Cyprus. But also Finland, Greece, Lithuania, Poland, Portugal, Slovakia and Slovenia show a significant de-crease of the tax base. Greece, Italy and Malta show the smallest decrease out of those countries which have no provision in their national tax practice.
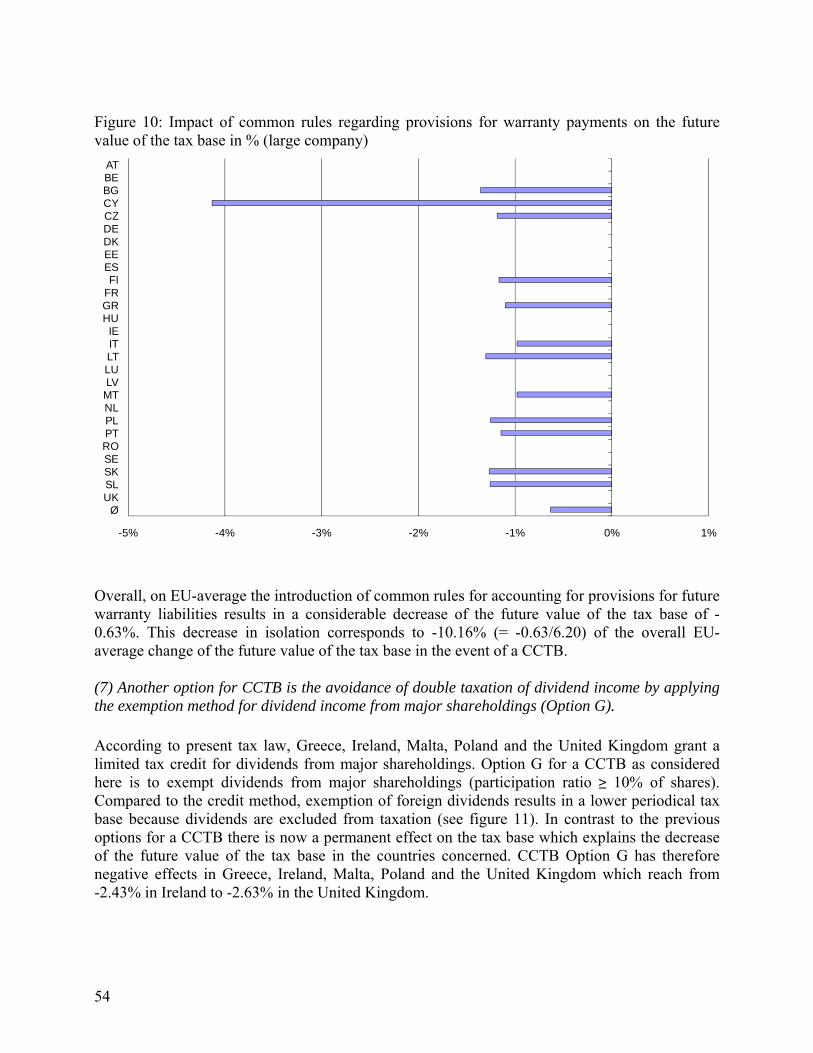
54
Figure 10: Impact of common rules regarding provisions for warranty payments on the future value of the tax base in % (large company)
-5% -4% -3% -2% -1% 0% 1%
ATBEBGCYCZDEDKEEESFI
FRGRHU
IEITLTLULV
MTNLPLPTROSESKSLUK
Ø
Overall, on EU-average the introduction of common rules for accounting for provisions for future warranty liabilities results in a considerable decrease of the future value of the tax base of -0.63%. This decrease in isolation corresponds to -10.16% (= -0.63/6.20) of the overall EU-average change of the future value of the tax base in the event of a CCTB. (7) Another option for CCTB is the avoidance of double taxation of dividend income by applying the exemption method for dividend income from major shareholdings (Option G). According to present tax law, Greece, Ireland, Malta, Poland and the United Kingdom grant a limited tax credit for dividends from major shareholdings. Option G for a CCTB as considered here is to exempt dividends from major shareholdings (participation ratio ≥ 10% of shares). Compared to the credit method, exemption of foreign dividends results in a lower periodical tax base because dividends are excluded from taxation (see figure 11). In contrast to the previous options for a CCTB there is now a permanent effect on the tax base which explains the decrease of the future value of the tax base in the countries concerned. CCTB Option G has therefore negative effects in Greece, Ireland, Malta, Poland and the United Kingdom which reach from -2.43% in Ireland to -2.63% in the United Kingdom.
55
Figure 11: Impact of common rules regarding exemption of foreign dividend income on the fu-ture value of the tax base in % (large company)
-3,0% -2,5% -2,0% -1,5% -1,0% -0,5% 0,0% 0,5%
ATBEBGCYCZDEDKEEESFI
FRGRHU
IEITLTLULV
MTNLPLPTROSESKSLUK
Ø
Compared to other CCTB options, the average effect on the future value of the tax base of an introduction of the exemption method for foreign dividend income is considerable. The overall EU-average decrease in the future value of the tax base amounts to -0.47% and in isolation corre-sponds to -7.58% (= -0.47/6.20) of the overall EU-average change of the future value of the tax base in the event of a CCTB. (8) The effects of loss carry forward are analysed in the following simulation (Option H). The large model firm considered in the base case scenario is a profitable company and shows no losses from regular activities during the simulation period of 10 years. The isolated application of the CCTB Option H for an indefinite loss carry forward itself does therefore not result in changes of the future value of the tax base of the model firm. To conclude, the introduction of a CCTB as considered here has a considerable impact on the future value of the tax base and the effective tax burden for the large company benchmark case (see tables 26 and 27 for details). The introduction of a CCTB would lead to higher future values of tax bases as well as to higher effective tax burdens. While the future value of tax base in-
56
creases by 6.20%24 on average of the EU-27 countries the effective tax burden increases by 5.15% on average. Countries affected most by the simulation of CCTB rules overall based on the two measures fu-ture value of the tax base and effective tax burden are Bulgaria (13.06%/10.70%), Latvia (11.30%/11.15%) and Lithuania (11.08%/8.50%). In case of Hungary the introduction of a CCTB leads to a high increase in the future value of the tax base (12.29%) but only to a comparably small increase of the effective tax burden (2.23%) which is mainly caused by the extraordinary importance of additional taxes beside the corporate income tax. Cyprus is the only country which is affected negatively in both, future value of the tax base (-6.68%) and effective tax burden (-3.82%). The CCTB option which reveals the highest impact on the tax bases and the tax burdens respec-tively is depreciation (A). A move to the CCTB depreciation rules considered here would in iso-lation correspond to 72.10% of the EU-27 average overall increase of the future value of the tax base. Especially the Czech Republic (9.98%), France (9.89%), Hungary (12.47%), Latvia (11.30%), Lithuania (11.36%) and Slovakia (9.84%) face higher tax bases due to modifications concerning depreciation. Out of the CCTB options which have a significant impact on the future value of the tax base, Option (F) concerning provisions for future warranty liabilities ranks on second position. It explains -10.16% of the overall EU-average increase. Countries most affected by this option are Cyprus (-4.13%), Finland (-1.17%), Greece (-1.11%), Lithuania (-1.30%), Po-land (-1.25%), Portugal (-1.14%), Slovakia (-1.27%) and Slovenia (-1.26%). CCTB rules con-cerning the avoidance of double taxation (G) also cause relevant changes in the future value of the tax bases and explain on average -7.58% of the average increase. Countries affected are Greece (-2.56%), Ireland (-2.43%), Malta (-2.49%), Poland (-2.52%) and the United Kingdom (-2.63%). The option to choose weighted average cost (WAC) valuation for inventory (B) contrib-utes 1.94% to the overall effect. The valuation of pension schemes based on IAS/IFRS (E) only causes -1.29% of the overall decrease and is thus of minor importance. In contrast to the above CCTB options, the common rules for the determination of the production costs (C) explain 0.98% of the overall increase and are negligible. The same holds true for option (D), which considers the inclusion of R&D-related costs in production costs, as well as for option (H). This option concerning the unlimited loss carry forward has no impact on the tax base being solely evaluated. It has an impact, however, if it is applied together with other CCTB options (I). It has to be kept in mind that the changes caused by the isolated application of single CCTB op-tions can not be summed up to receive the cumulative effects of common tax accounting rules on both the future value of the tax base and effective tax burden. The reasons for this result are tim-ing effects caused by interdependencies between different CCTB options that can intensify or weaken the impact of changed tax rules on the size of the tax base. For example, changed depre-ciation rules lead to changed production costs when depreciation is included in the definition of the production costs. If the proposed CCTB options allow higher depreciation in comparison to domestic accounting but are more restrictive concerning the production cost definition the impact
24 Thereof an increase of 5.26% can be attributed to the EU-15 countries and an increase of 7.41% can be attributed to the EU-12 countries.
57
of changed depreciation rules on the size of the tax base is weakened in the case both options are regarded simultaneously. The above findings are relevant for an EU-average large company. The results could be different for companies belonging to specific sectors revealing different economic structures. The impact of this sectors specific weights of assets and liabilities as well as of the performance will be in-vestigated in the course of the sensitivity analyses on specific sectors below. Another factor of influence is the size of a company, which translates into different pre-tax data such as structure of assets and liabilities and profitability. The impact of the size of a company on the effective tax burden will be analysed in the following.
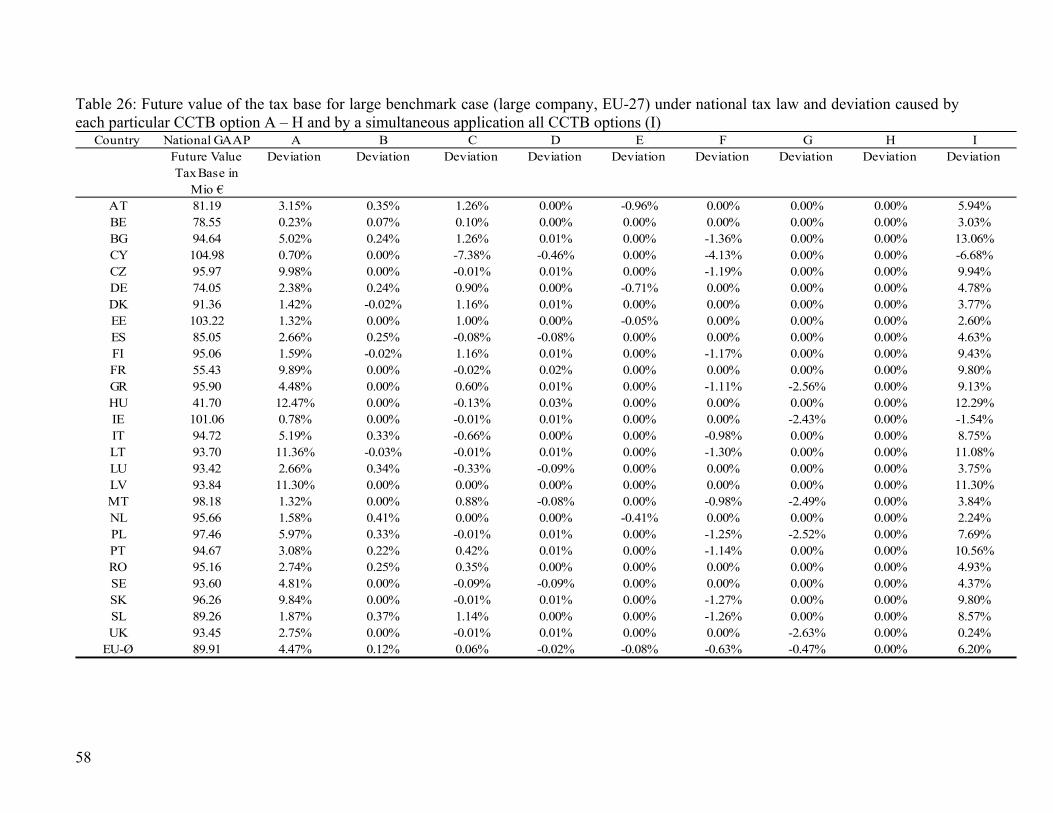
58
Table 26: Future value of the tax base for large benchmark case (large company, EU-27) under national tax law and deviation caused by each particular CCTB option A – H and by a simultaneous application all CCTB options (I)
Country National GAAP A B C D E F G H IFuture Value Tax Base in
Mio €
Deviation Deviation Deviation Deviation Deviation Deviation Deviation Deviation Deviation
AT 81.19 3.15% 0.35% 1.26% 0.00% -0.96% 0.00% 0.00% 0.00% 5.94%BE 78.55 0.23% 0.07% 0.10% 0.00% 0.00% 0.00% 0.00% 0.00% 3.03%BG 94.64 5.02% 0.24% 1.26% 0.01% 0.00% -1.36% 0.00% 0.00% 13.06%CY 104.98 0.70% 0.00% -7.38% -0.46% 0.00% -4.13% 0.00% 0.00% -6.68%CZ 95.97 9.98% 0.00% -0.01% 0.01% 0.00% -1.19% 0.00% 0.00% 9.94%DE 74.05 2.38% 0.24% 0.90% 0.00% -0.71% 0.00% 0.00% 0.00% 4.78%DK 91.36 1.42% -0.02% 1.16% 0.01% 0.00% 0.00% 0.00% 0.00% 3.77%EE 103.22 1.32% 0.00% 1.00% 0.00% -0.05% 0.00% 0.00% 0.00% 2.60%ES 85.05 2.66% 0.25% -0.08% -0.08% 0.00% 0.00% 0.00% 0.00% 4.63%FI 95.06 1.59% -0.02% 1.16% 0.01% 0.00% -1.17% 0.00% 0.00% 9.43%FR 55.43 9.89% 0.00% -0.02% 0.02% 0.00% 0.00% 0.00% 0.00% 9.80%GR 95.90 4.48% 0.00% 0.60% 0.01% 0.00% -1.11% -2.56% 0.00% 9.13%HU 41.70 12.47% 0.00% -0.13% 0.03% 0.00% 0.00% 0.00% 0.00% 12.29%IE 101.06 0.78% 0.00% -0.01% 0.01% 0.00% 0.00% -2.43% 0.00% -1.54%IT 94.72 5.19% 0.33% -0.66% 0.00% 0.00% -0.98% 0.00% 0.00% 8.75%LT 93.70 11.36% -0.03% -0.01% 0.01% 0.00% -1.30% 0.00% 0.00% 11.08%LU 93.42 2.66% 0.34% -0.33% -0.09% 0.00% 0.00% 0.00% 0.00% 3.75%LV 93.84 11.30% 0.00% 0.00% 0.00% 0.00% 0.00% 0.00% 0.00% 11.30%MT 98.18 1.32% 0.00% 0.88% -0.08% 0.00% -0.98% -2.49% 0.00% 3.84%NL 95.66 1.58% 0.41% 0.00% 0.00% -0.41% 0.00% 0.00% 0.00% 2.24%PL 97.46 5.97% 0.33% -0.01% 0.01% 0.00% -1.25% -2.52% 0.00% 7.69%PT 94.67 3.08% 0.22% 0.42% 0.01% 0.00% -1.14% 0.00% 0.00% 10.56%RO 95.16 2.74% 0.25% 0.35% 0.00% 0.00% 0.00% 0.00% 0.00% 4.93%SE 93.60 4.81% 0.00% -0.09% -0.09% 0.00% 0.00% 0.00% 0.00% 4.37%SK 96.26 9.84% 0.00% -0.01% 0.01% 0.00% -1.27% 0.00% 0.00% 9.80%SL 89.26 1.87% 0.37% 1.14% 0.00% 0.00% -1.26% 0.00% 0.00% 8.57%UK 93.45 2.75% 0.00% -0.01% 0.01% 0.00% 0.00% -2.63% 0.00% 0.24%
EU-Ø 89.91 4.47% 0.12% 0.06% -0.02% -0.08% -0.63% -0.47% 0.00% 6.20%
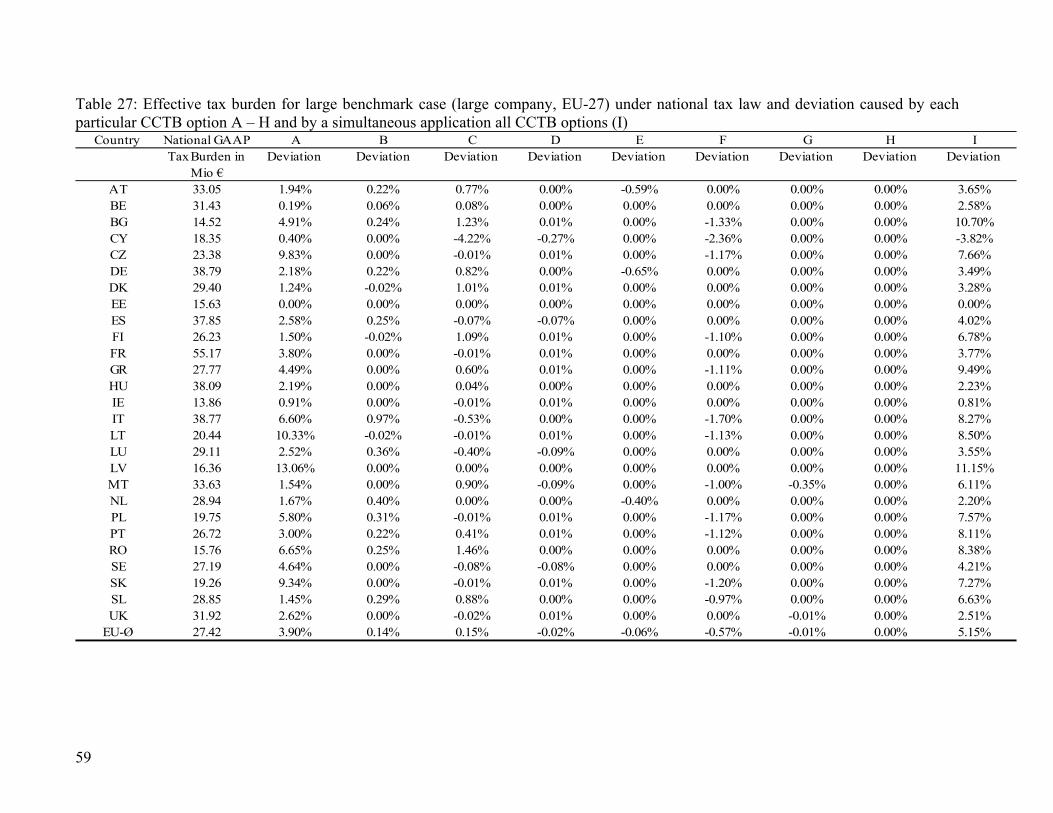
59
Table 27: Effective tax burden for large benchmark case (large company, EU-27) under national tax law and deviation caused by each particular CCTB option A – H and by a simultaneous application all CCTB options (I)
Country National GAAP A B C D E F G H ITax Burden in
Mio €Deviation Deviation Deviation Deviation Deviation Deviation Deviation Deviation Deviation
AT 33.05 1.94% 0.22% 0.77% 0.00% -0.59% 0.00% 0.00% 0.00% 3.65%BE 31.43 0.19% 0.06% 0.08% 0.00% 0.00% 0.00% 0.00% 0.00% 2.58%BG 14.52 4.91% 0.24% 1.23% 0.01% 0.00% -1.33% 0.00% 0.00% 10.70%CY 18.35 0.40% 0.00% -4.22% -0.27% 0.00% -2.36% 0.00% 0.00% -3.82%CZ 23.38 9.83% 0.00% -0.01% 0.01% 0.00% -1.17% 0.00% 0.00% 7.66%DE 38.79 2.18% 0.22% 0.82% 0.00% -0.65% 0.00% 0.00% 0.00% 3.49%DK 29.40 1.24% -0.02% 1.01% 0.01% 0.00% 0.00% 0.00% 0.00% 3.28%EE 15.63 0.00% 0.00% 0.00% 0.00% 0.00% 0.00% 0.00% 0.00% 0.00%ES 37.85 2.58% 0.25% -0.07% -0.07% 0.00% 0.00% 0.00% 0.00% 4.02%FI 26.23 1.50% -0.02% 1.09% 0.01% 0.00% -1.10% 0.00% 0.00% 6.78%FR 55.17 3.80% 0.00% -0.01% 0.01% 0.00% 0.00% 0.00% 0.00% 3.77%GR 27.77 4.49% 0.00% 0.60% 0.01% 0.00% -1.11% 0.00% 0.00% 9.49%HU 38.09 2.19% 0.00% 0.04% 0.00% 0.00% 0.00% 0.00% 0.00% 2.23%IE 13.86 0.91% 0.00% -0.01% 0.01% 0.00% 0.00% 0.00% 0.00% 0.81%IT 38.77 6.60% 0.97% -0.53% 0.00% 0.00% -1.70% 0.00% 0.00% 8.27%LT 20.44 10.33% -0.02% -0.01% 0.01% 0.00% -1.13% 0.00% 0.00% 8.50%LU 29.11 2.52% 0.36% -0.40% -0.09% 0.00% 0.00% 0.00% 0.00% 3.55%LV 16.36 13.06% 0.00% 0.00% 0.00% 0.00% 0.00% 0.00% 0.00% 11.15%MT 33.63 1.54% 0.00% 0.90% -0.09% 0.00% -1.00% -0.35% 0.00% 6.11%NL 28.94 1.67% 0.40% 0.00% 0.00% -0.40% 0.00% 0.00% 0.00% 2.20%PL 19.75 5.80% 0.31% -0.01% 0.01% 0.00% -1.17% 0.00% 0.00% 7.57%PT 26.72 3.00% 0.22% 0.41% 0.01% 0.00% -1.12% 0.00% 0.00% 8.11%RO 15.76 6.65% 0.25% 1.46% 0.00% 0.00% 0.00% 0.00% 0.00% 8.38%SE 27.19 4.64% 0.00% -0.08% -0.08% 0.00% 0.00% 0.00% 0.00% 4.21%SK 19.26 9.34% 0.00% -0.01% 0.01% 0.00% -1.20% 0.00% 0.00% 7.27%SL 28.85 1.45% 0.29% 0.88% 0.00% 0.00% -0.97% 0.00% 0.00% 6.63%UK 31.92 2.62% 0.00% -0.02% 0.01% 0.00% 0.00% -0.01% 0.00% 2.51%
EU-Ø 27.42 3.90% 0.14% 0.15% -0.02% -0.06% -0.57% -0.01% 0.00% 5.15%
60
2.1.3 Tax Bases in Case of National GAAP and CCTB if Corporate Taxes are Considered in Isolation (i.e. all Other Taxes are Excluded)
In the following variation all taxes except corporate tax are excluded from calculations. This is done by setting the specific tax rates of real estate taxes, business taxes, payroll taxes and taxes on capital as well as surcharges on corporate tax to zero. Consequently, these taxes do neither influence tax payments nor do they influence the tax base for corporate tax. Table 28 displays the results for an introduction of the proposed CCTB if only corporate taxes are considered. This scenario corresponds to a CCTB which is only applied to corporate income tax. In the following, in a first step, the level of the future value of tax base under national GAAP is analysed. In a sec-ond step an analysis of the deviation between the tax base according to national GAAP and ac-cording to CCTB is carried out. The level of the future value of the tax base under national GAAP if corporate taxes are consid-ered in isolation amounts on average to 96.66 Mio € (see table 24). Therefore, on average, the future value of the tax base is higher compared to calculations including all other taxes (89.91 Mio €, see table 28). This result is intuitive for two reasons: First, if other taxes exist and are in-cluded in the calculations they do reduce liquidity in the company and thus lower interest income which is subject to corporate tax and consequently part of the corporate tax base. Second, other taxes are mostly deductible from corporate tax base. Thus they lower the tax base of corporate tax in the benchmark case like other expenditures do. Hence, the isolated consideration of corporate taxes causes an increase of the future value of the tax base in all countries, except Malta. The increase is zero there as only a corporate tax exists in Malta and no other taxes are applied. Table 28 shows that the increase of the tax base is small for those countries where other taxes have only little relevance.25 Examples are Bulgaria, Czech Republic, Greece, the Netherlands, Sweden and Slovakia. The increase is small as well for countries which have relevant other taxes that are not deductible from the corporate tax base. This is the case in Cyprus, Estonia, Greece, Italy and Luxembourg. In accordance with the interpretations given above there is a relevant in-crease of the tax base in countries which have relevant other taxes that are deductible from the corporate tax base, e.g. in Austria (real estate and payroll tax), Belgium (real estate tax), Den-mark (real estate tax), Germany (real estate and trade tax on income), Spain (real estate tax and trade tax on capital), France (several taxes), Hungary (trade tax on income), Lithuania (real estate tax), Slovenia (payroll tax) and in the United Kingdom (real estate tax). Turning to the deviation of tax base due to an introduction of a CCTB, the results show a smaller impact of CCTB when other taxes are set to zero. The application of all considered CCTB op-tions (Option I) results in an average increase of 5.70% which is below the increase of the benchmark case (6.20%, see table 26). The main reason for this is a technical one: Since the fu-ture value of the tax base is, as described above, higher when other taxes are set to zero, the abso-lute increase due to the introduction of a CCTB is translated in a smaller relative increase. Against the average trend there is a positive instead of a negative impact of CCTB for Cyprus as the payroll tax, being included in production costs under CCTB but not under national GAAP, is set to zero. For the same reason a slightly stronger impact of CCTB on the tax base is also ob-served in Greece and Luxembourg. In addition to that a stronger impact appears for countries having surcharges on corporate tax or relevant other taxes that are influenced by a CCTB (e.g. Germany, Portugal). In these countries a broadening of the tax base caused by CCTB leads to increasing other taxes that in turn reduce the future value of the tax base. If the other taxes are set 25 For the relevance of other taxes in relation to corporate taxes see table 23.
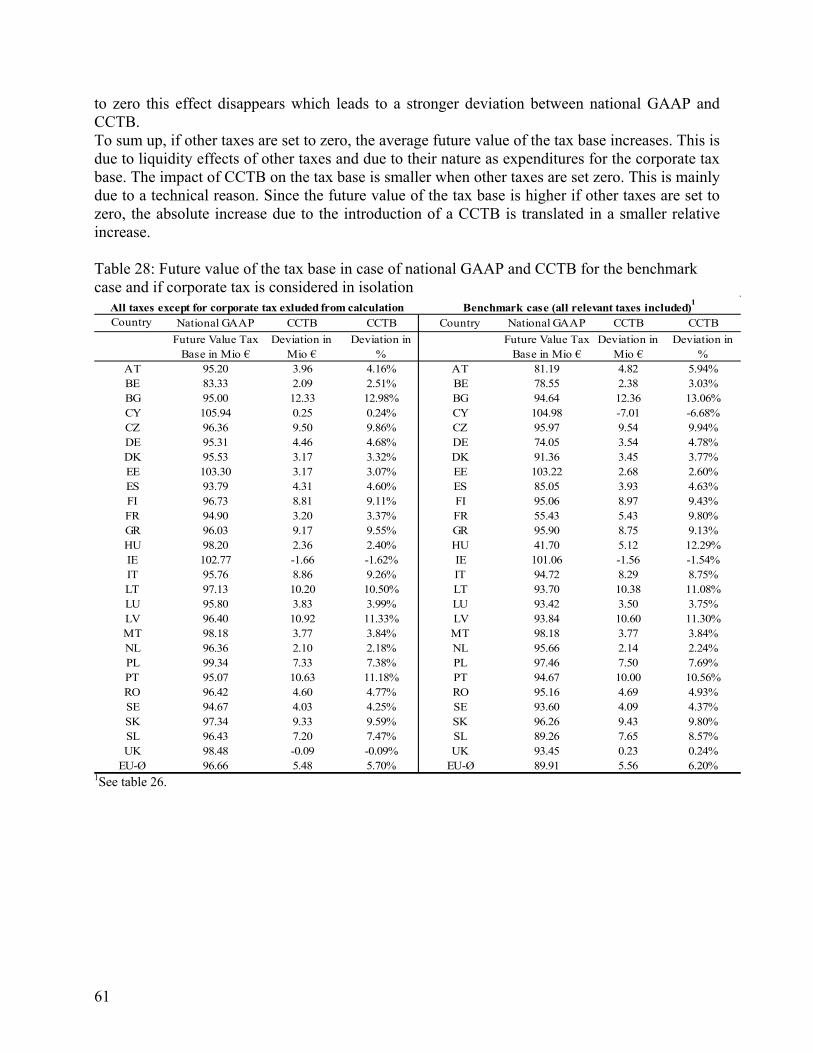
61
to zero this effect disappears which leads to a stronger deviation between national GAAP and CCTB. To sum up, if other taxes are set to zero, the average future value of the tax base increases. This is due to liquidity effects of other taxes and due to their nature as expenditures for the corporate tax base. The impact of CCTB on the tax base is smaller when other taxes are set zero. This is mainly due to a technical reason. Since the future value of the tax base is higher if other taxes are set to zero, the absolute increase due to the introduction of a CCTB is translated in a smaller relative increase. Table 28: Future value of the tax base in case of national GAAP and CCTB for the benchmark case and if corporate tax is considered in isolation
Country National GAAP CCTB CCTB Country National GAAP CCTB CCTB
Future Value Tax Base in Mio €
Deviation in Mio €
Deviation in %
Future Value Tax Base in Mio €
Deviation in Mio €
Deviation in %
AT 95.20 3.96 4.16% AT 81.19 4.82 5.94%BE 83.33 2.09 2.51% BE 78.55 2.38 3.03%BG 95.00 12.33 12.98% BG 94.64 12.36 13.06%CY 105.94 0.25 0.24% CY 104.98 -7.01 -6.68%CZ 96.36 9.50 9.86% CZ 95.97 9.54 9.94%DE 95.31 4.46 4.68% DE 74.05 3.54 4.78%DK 95.53 3.17 3.32% DK 91.36 3.45 3.77%EE 103.30 3.17 3.07% EE 103.22 2.68 2.60%ES 93.79 4.31 4.60% ES 85.05 3.93 4.63%FI 96.73 8.81 9.11% FI 95.06 8.97 9.43%FR 94.90 3.20 3.37% FR 55.43 5.43 9.80%GR 96.03 9.17 9.55% GR 95.90 8.75 9.13%HU 98.20 2.36 2.40% HU 41.70 5.12 12.29%IE 102.77 -1.66 -1.62% IE 101.06 -1.56 -1.54%IT 95.76 8.86 9.26% IT 94.72 8.29 8.75%LT 97.13 10.20 10.50% LT 93.70 10.38 11.08%LU 95.80 3.83 3.99% LU 93.42 3.50 3.75%LV 96.40 10.92 11.33% LV 93.84 10.60 11.30%MT 98.18 3.77 3.84% MT 98.18 3.77 3.84%NL 96.36 2.10 2.18% NL 95.66 2.14 2.24%PL 99.34 7.33 7.38% PL 97.46 7.50 7.69%PT 95.07 10.63 11.18% PT 94.67 10.00 10.56%RO 96.42 4.60 4.77% RO 95.16 4.69 4.93%SE 94.67 4.03 4.25% SE 93.60 4.09 4.37%SK 97.34 9.33 9.59% SK 96.26 9.43 9.80%SL 96.43 7.20 7.47% SL 89.26 7.65 8.57%UK 98.48 -0.09 -0.09% UK 93.45 0.23 0.24%
EU-Ø 96.66 5.48 5.70% EU-Ø 89.91 5.56 6.20%
Benchmark case (all relevant taxes included)1
All taxes except for corporate tax exluded from calculation
1See table 26.
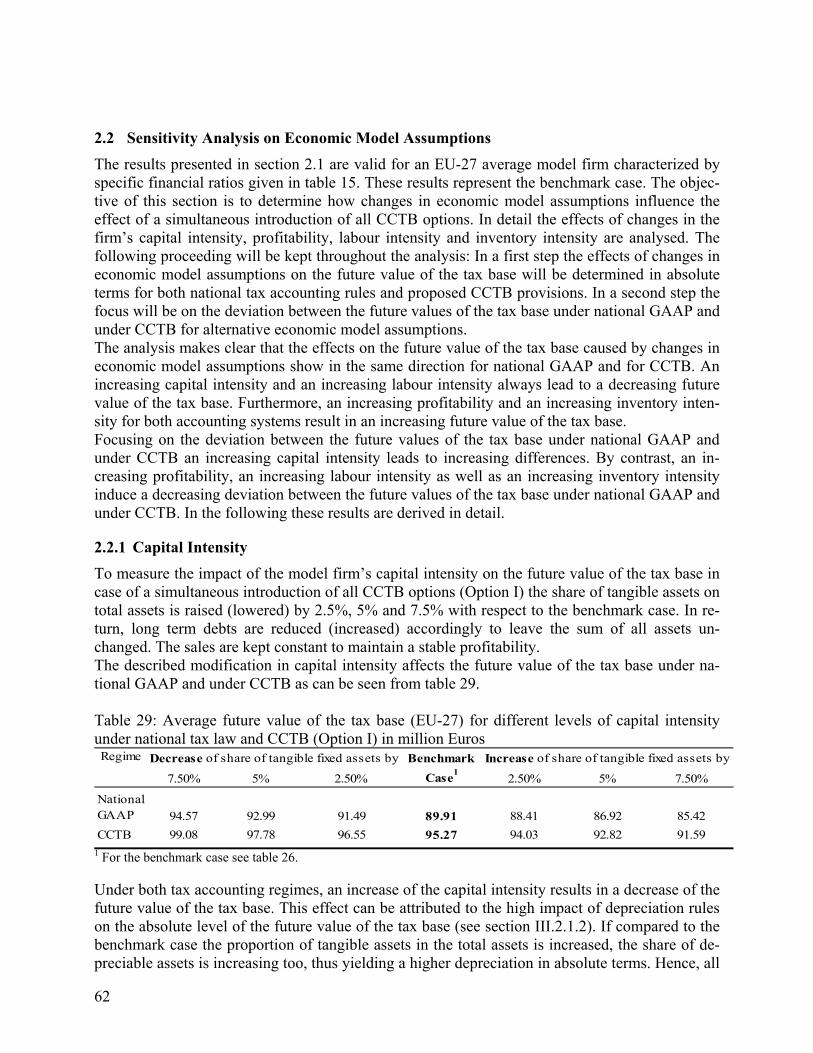
62
2.2 Sensitivity Analysis on Economic Model Assumptions
The results presented in section 2.1 are valid for an EU-27 average model firm characterized by specific financial ratios given in table 15. These results represent the benchmark case. The objec-tive of this section is to determine how changes in economic model assumptions influence the effect of a simultaneous introduction of all CCTB options. In detail the effects of changes in the firm’s capital intensity, profitability, labour intensity and inventory intensity are analysed. The following proceeding will be kept throughout the analysis: In a first step the effects of changes in economic model assumptions on the future value of the tax base will be determined in absolute terms for both national tax accounting rules and proposed CCTB provisions. In a second step the focus will be on the deviation between the future values of the tax base under national GAAP and under CCTB for alternative economic model assumptions. The analysis makes clear that the effects on the future value of the tax base caused by changes in economic model assumptions show in the same direction for national GAAP and for CCTB. An increasing capital intensity and an increasing labour intensity always lead to a decreasing future value of the tax base. Furthermore, an increasing profitability and an increasing inventory inten-sity for both accounting systems result in an increasing future value of the tax base. Focusing on the deviation between the future values of the tax base under national GAAP and under CCTB an increasing capital intensity leads to increasing differences. By contrast, an in-creasing profitability, an increasing labour intensity as well as an increasing inventory intensity induce a decreasing deviation between the future values of the tax base under national GAAP and under CCTB. In the following these results are derived in detail.
2.2.1 Capital Intensity
To measure the impact of the model firm’s capital intensity on the future value of the tax base in case of a simultaneous introduction of all CCTB options (Option I) the share of tangible assets on total assets is raised (lowered) by 2.5%, 5% and 7.5% with respect to the benchmark case. In re-turn, long term debts are reduced (increased) accordingly to leave the sum of all assets un-changed. The sales are kept constant to maintain a stable profitability. The described modification in capital intensity affects the future value of the tax base under na-tional GAAP and under CCTB as can be seen from table 29. Table 29: Average future value of the tax base (EU-27) for different levels of capital intensity under national tax law and CCTB (Option I) in million Euros Regime Benchmark
7.50% 5% 2.50% Case1
2.50% 5% 7.50%
National GAAP 94.57 92.99 91.49 89.91 88.41 86.92 85.42
CCTB 99.08 97.78 96.55 95.27 94.03 92.82 91.59
Increase of share of tangible fixed assets byDecrease of share of tangible fixed assets by
1 For the benchmark case see table 26. Under both tax accounting regimes, an increase of the capital intensity results in a decrease of the future value of the tax base. This effect can be attributed to the high impact of depreciation rules on the absolute level of the future value of the tax base (see section III.2.1.2). If compared to the benchmark case the proportion of tangible assets in the total assets is increased, the share of de-preciable assets is increasing too, thus yielding a higher depreciation in absolute terms. Hence, all
63
other financial ratios being unchanged, annual tax bases and the future value of the tax base de-crease with higher capital intensity. Reversely, a decrease of the share of tangible fixed assets is in both cases associated with lower depreciation and hence an increase of the future value of the tax base. Turning to the size of effects, the results displayed in table 29 reveal a higher absolute and rela-tive impact of capital intensity on the future value of the tax base under national GAAP than un-der CCTB. This result is due to the fact that national depreciation rules are less restrictive than the proposed CCTB provisions: Additional depreciable assets are therefore depreciated at higher rates thus reducing the tax base by a larger extent than under CCTB. Since for the benchmark case the future value of the tax base under national GAAP is already lower than the future value of the tax base under CCTB the deviation between the considered tax accounting regimes rises with capital intensity as can be seen from the results displayed in table 30. Table 30 displays the difference in percent between the future value of the tax base under na-tional GAAP and the future value of the tax base under CCTB (Option I). The deviations are given for the benchmark case and six variations of the share of tangible fixed assets in the total assets. The results show an increasing (decreasing) deviation due to an upward (downward) variation of capital intensity26. The EU average deviation rises from 6.2% to 7.55% in case of a capital intensity that is 7.5% above this ratio in the benchmark case. Correspondingly, given lower capital intensity than in the benchmark case, there is a smaller deviation of the future value of the tax base under CCTB from the future value of the tax base under national GAAP. If the share of tangible assets is reduced by 7.5%, the introduction of a CCTB would result in an EU-wide increase of the future value of the tax base of 4.93%. These effects are valid for all countries except Cyprus where national depreciation rules are com-parably restrictive. With respect to the ranking there is no substantial change due to the variation of capital intensity: Czech Republic, Finland, Lithuania, Luxembourg, Slovakia and Slovenia change by one position and Estonia by two positions. For all other countries a variation in capital intensity does not translate in a change in ranking position.
26 The measure effective tax burden also reveals a positive correlation between capital intensity and deviation be-tween national GAAP and CCTB. For detailed results see Appendix 7.1 table 1
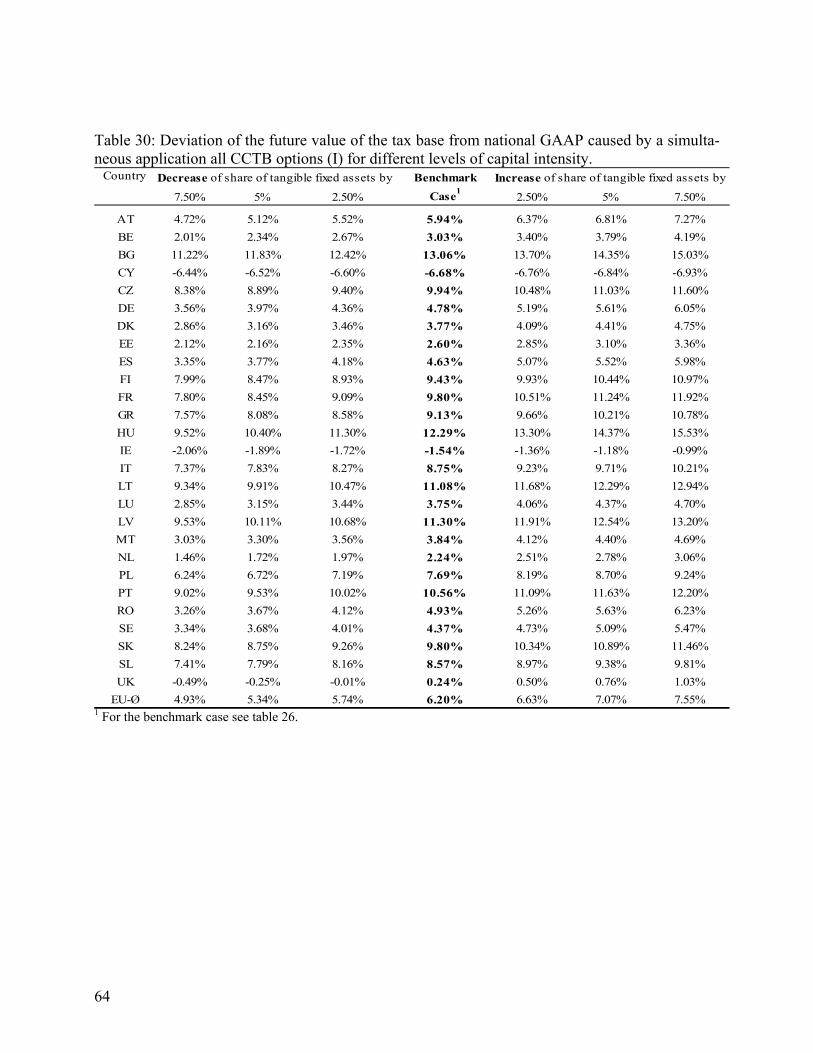
64
Table 30: Deviation of the future value of the tax base from national GAAP caused by a simulta-neous application all CCTB options (I) for different levels of capital intensity.
Country Benchmark
7.50% 5% 2.50% Case1
2.50% 5% 7.50%
AT 4.72% 5.12% 5.52% 5.94% 6.37% 6.81% 7.27%
BE 2.01% 2.34% 2.67% 3.03% 3.40% 3.79% 4.19%
BG 11.22% 11.83% 12.42% 13.06% 13.70% 14.35% 15.03%
CY -6.44% -6.52% -6.60% -6.68% -6.76% -6.84% -6.93%
CZ 8.38% 8.89% 9.40% 9.94% 10.48% 11.03% 11.60%
DE 3.56% 3.97% 4.36% 4.78% 5.19% 5.61% 6.05%
DK 2.86% 3.16% 3.46% 3.77% 4.09% 4.41% 4.75%
EE 2.12% 2.16% 2.35% 2.60% 2.85% 3.10% 3.36%
ES 3.35% 3.77% 4.18% 4.63% 5.07% 5.52% 5.98%
FI 7.99% 8.47% 8.93% 9.43% 9.93% 10.44% 10.97%
FR 7.80% 8.45% 9.09% 9.80% 10.51% 11.24% 11.92%
GR 7.57% 8.08% 8.58% 9.13% 9.66% 10.21% 10.78%
HU 9.52% 10.40% 11.30% 12.29% 13.30% 14.37% 15.53%
IE -2.06% -1.89% -1.72% -1.54% -1.36% -1.18% -0.99%
IT 7.37% 7.83% 8.27% 8.75% 9.23% 9.71% 10.21%
LT 9.34% 9.91% 10.47% 11.08% 11.68% 12.29% 12.94%
LU 2.85% 3.15% 3.44% 3.75% 4.06% 4.37% 4.70%
LV 9.53% 10.11% 10.68% 11.30% 11.91% 12.54% 13.20%
MT 3.03% 3.30% 3.56% 3.84% 4.12% 4.40% 4.69%
NL 1.46% 1.72% 1.97% 2.24% 2.51% 2.78% 3.06%
PL 6.24% 6.72% 7.19% 7.69% 8.19% 8.70% 9.24%
PT 9.02% 9.53% 10.02% 10.56% 11.09% 11.63% 12.20%
RO 3.26% 3.67% 4.12% 4.93% 5.26% 5.63% 6.23%
SE 3.34% 3.68% 4.01% 4.37% 4.73% 5.09% 5.47%
SK 8.24% 8.75% 9.26% 9.80% 10.34% 10.89% 11.46%
SL 7.41% 7.79% 8.16% 8.57% 8.97% 9.38% 9.81%
UK -0.49% -0.25% -0.01% 0.24% 0.50% 0.76% 1.03%
EU-Ø 4.93% 5.34% 5.74% 6.20% 6.63% 7.07% 7.55%
Increase of share of tangible fixed assets byDecrease of share of tangible fixed assets by
1 For the benchmark case see table 26.
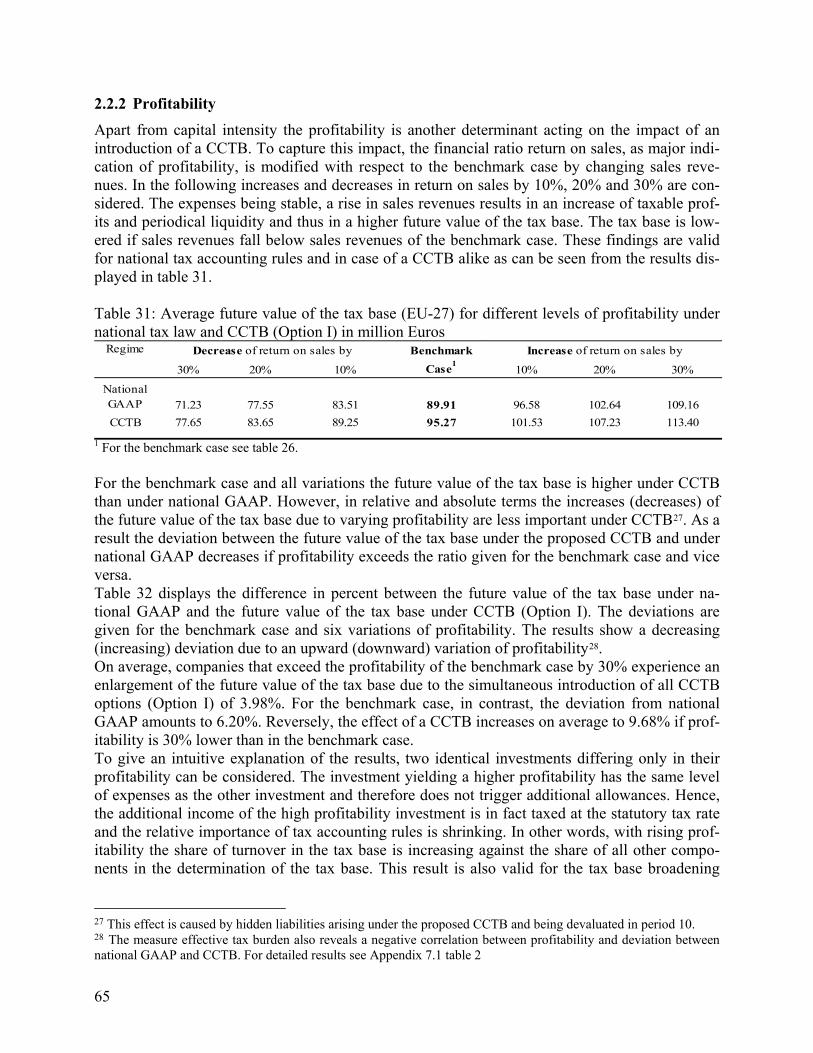
65
2.2.2 Profitability
Apart from capital intensity the profitability is another determinant acting on the impact of an introduction of a CCTB. To capture this impact, the financial ratio return on sales, as major indi-cation of profitability, is modified with respect to the benchmark case by changing sales reve-nues. In the following increases and decreases in return on sales by 10%, 20% and 30% are con-sidered. The expenses being stable, a rise in sales revenues results in an increase of taxable prof-its and periodical liquidity and thus in a higher future value of the tax base. The tax base is low-ered if sales revenues fall below sales revenues of the benchmark case. These findings are valid for national tax accounting rules and in case of a CCTB alike as can be seen from the results dis-played in table 31. Table 31: Average future value of the tax base (EU-27) for different levels of profitability under national tax law and CCTB (Option I) in million Euros
Regime Benchmark
30% 20% 10% Case1
10% 20% 30%
National GAAP 71.23 77.55 83.51 89.91 96.58 102.64 109.16
CCTB 77.65 83.65 89.25 95.27 101.53 107.23 113.40
Increase of return on sales byDecrease of return on sales by
1 For the benchmark case see table 26. For the benchmark case and all variations the future value of the tax base is higher under CCTB than under national GAAP. However, in relative and absolute terms the increases (decreases) of the future value of the tax base due to varying profitability are less important under CCTB27. As a result the deviation between the future value of the tax base under the proposed CCTB and under national GAAP decreases if profitability exceeds the ratio given for the benchmark case and vice versa. Table 32 displays the difference in percent between the future value of the tax base under na-tional GAAP and the future value of the tax base under CCTB (Option I). The deviations are given for the benchmark case and six variations of profitability. The results show a decreasing (increasing) deviation due to an upward (downward) variation of profitability28. On average, companies that exceed the profitability of the benchmark case by 30% experience an enlargement of the future value of the tax base due to the simultaneous introduction of all CCTB options (Option I) of 3.98%. For the benchmark case, in contrast, the deviation from national GAAP amounts to 6.20%. Reversely, the effect of a CCTB increases on average to 9.68% if prof-itability is 30% lower than in the benchmark case. To give an intuitive explanation of the results, two identical investments differing only in their profitability can be considered. The investment yielding a higher profitability has the same level of expenses as the other investment and therefore does not trigger additional allowances. Hence, the additional income of the high profitability investment is in fact taxed at the statutory tax rate and the relative importance of tax accounting rules is shrinking. In other words, with rising prof-itability the share of turnover in the tax base is increasing against the share of all other compo-nents in the determination of the tax base. This result is also valid for the tax base broadening
27 This effect is caused by hidden liabilities arising under the proposed CCTB and being devaluated in period 10. 28 The measure effective tax burden also reveals a negative correlation between profitability and deviation between national GAAP and CCTB. For detailed results see Appendix 7.1 table 2
66
effects induced by a CCTB that have been determined in section III part 2.1.2. To sum up, the tax base effects are of a higher relevance in case of lower profitability. With regard to the ranking of countries under the proposed CCTB it has to be kept in mind that the existence and importance of non profit taxes exerts influence on the observed results. Changes in the deviation from national GAAP due to higher or lower profitability are less impor-tant in countries with a high share of non profit taxes as profitability induced liquidity effects are smaller. With regard to the ranking, the results displayed in table 28 imply changes of one posi-tion for Bulgaria, Estonia, Greece, Ireland, Luxembourg, Portugal, Romania and Slovenia. Latvia worsens its position by two ranks.29
29 The alternative measure effective tax burden also reveals a negative relationship between profitability intensity and deviation of the measure from national GAAP in case of a CCTB. For detailed results see Appendix 7.1 table 3.
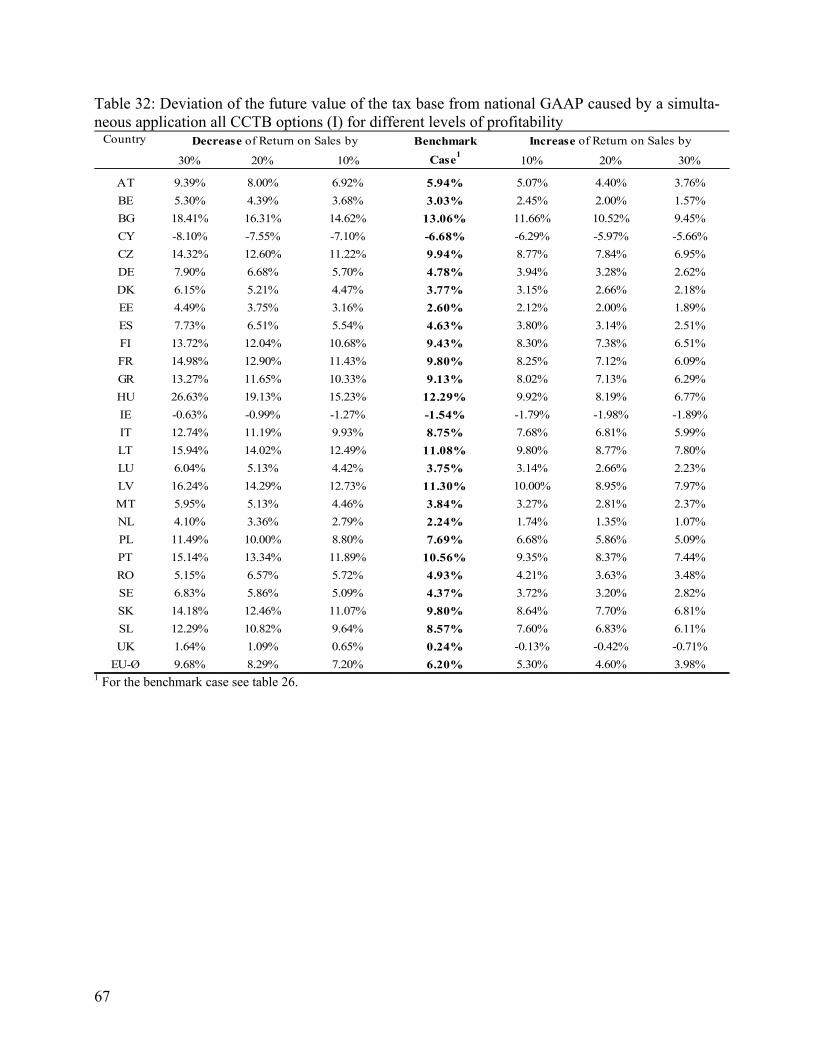
67
Table 32: Deviation of the future value of the tax base from national GAAP caused by a simulta-neous application all CCTB options (I) for different levels of profitability
Country Benchmark
30% 20% 10% Case1
10% 20% 30%
AT 9.39% 8.00% 6.92% 5.94% 5.07% 4.40% 3.76%
BE 5.30% 4.39% 3.68% 3.03% 2.45% 2.00% 1.57%
BG 18.41% 16.31% 14.62% 13.06% 11.66% 10.52% 9.45%
CY -8.10% -7.55% -7.10% -6.68% -6.29% -5.97% -5.66%
CZ 14.32% 12.60% 11.22% 9.94% 8.77% 7.84% 6.95%
DE 7.90% 6.68% 5.70% 4.78% 3.94% 3.28% 2.62%
DK 6.15% 5.21% 4.47% 3.77% 3.15% 2.66% 2.18%
EE 4.49% 3.75% 3.16% 2.60% 2.12% 2.00% 1.89%
ES 7.73% 6.51% 5.54% 4.63% 3.80% 3.14% 2.51%
FI 13.72% 12.04% 10.68% 9.43% 8.30% 7.38% 6.51%
FR 14.98% 12.90% 11.43% 9.80% 8.25% 7.12% 6.09%
GR 13.27% 11.65% 10.33% 9.13% 8.02% 7.13% 6.29%
HU 26.63% 19.13% 15.23% 12.29% 9.92% 8.19% 6.77%
IE -0.63% -0.99% -1.27% -1.54% -1.79% -1.98% -1.89%
IT 12.74% 11.19% 9.93% 8.75% 7.68% 6.81% 5.99%
LT 15.94% 14.02% 12.49% 11.08% 9.80% 8.77% 7.80%
LU 6.04% 5.13% 4.42% 3.75% 3.14% 2.66% 2.23%
LV 16.24% 14.29% 12.73% 11.30% 10.00% 8.95% 7.97%
MT 5.95% 5.13% 4.46% 3.84% 3.27% 2.81% 2.37%
NL 4.10% 3.36% 2.79% 2.24% 1.74% 1.35% 1.07%
PL 11.49% 10.00% 8.80% 7.69% 6.68% 5.86% 5.09%
PT 15.14% 13.34% 11.89% 10.56% 9.35% 8.37% 7.44%
RO 5.15% 6.57% 5.72% 4.93% 4.21% 3.63% 3.48%
SE 6.83% 5.86% 5.09% 4.37% 3.72% 3.20% 2.82%
SK 14.18% 12.46% 11.07% 9.80% 8.64% 7.70% 6.81%
SL 12.29% 10.82% 9.64% 8.57% 7.60% 6.83% 6.11%
UK 1.64% 1.09% 0.65% 0.24% -0.13% -0.42% -0.71%
EU-Ø 9.68% 8.29% 7.20% 6.20% 5.30% 4.60% 3.98%
Increase of Return on Sales byDecrease of Return on Sales by
1 For the benchmark case see table 26.
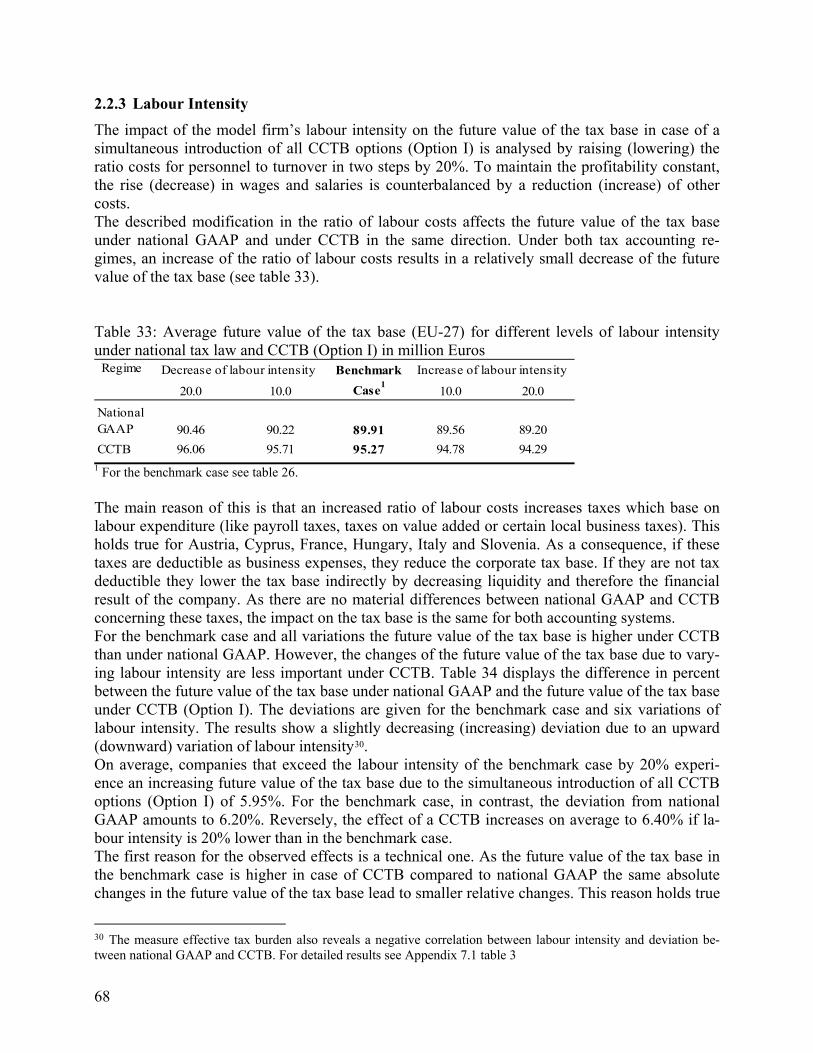
68
2.2.3 Labour Intensity
The impact of the model firm’s labour intensity on the future value of the tax base in case of a simultaneous introduction of all CCTB options (Option I) is analysed by raising (lowering) the ratio costs for personnel to turnover in two steps by 20%. To maintain the profitability constant, the rise (decrease) in wages and salaries is counterbalanced by a reduction (increase) of other costs. The described modification in the ratio of labour costs affects the future value of the tax base under national GAAP and under CCTB in the same direction. Under both tax accounting re-gimes, an increase of the ratio of labour costs results in a relatively small decrease of the future value of the tax base (see table 33). Table 33: Average future value of the tax base (EU-27) for different levels of labour intensity under national tax law and CCTB (Option I) in million Euros
Regime Benchmark
20.0 10.0 Case1
10.0 20.0
National GAAP 90.46 90.22 89.91 89.56 89.20
CCTB 96.06 95.71 95.27 94.78 94.29
Decrease of labour intensity Increase of labour intensity
1 For the benchmark case see table 26. The main reason of this is that an increased ratio of labour costs increases taxes which base on labour expenditure (like payroll taxes, taxes on value added or certain local business taxes). This holds true for Austria, Cyprus, France, Hungary, Italy and Slovenia. As a consequence, if these taxes are deductible as business expenses, they reduce the corporate tax base. If they are not tax deductible they lower the tax base indirectly by decreasing liquidity and therefore the financial result of the company. As there are no material differences between national GAAP and CCTB concerning these taxes, the impact on the tax base is the same for both accounting systems. For the benchmark case and all variations the future value of the tax base is higher under CCTB than under national GAAP. However, the changes of the future value of the tax base due to vary-ing labour intensity are less important under CCTB. Table 34 displays the difference in percent between the future value of the tax base under national GAAP and the future value of the tax base under CCTB (Option I). The deviations are given for the benchmark case and six variations of labour intensity. The results show a slightly decreasing (increasing) deviation due to an upward (downward) variation of labour intensity30. On average, companies that exceed the labour intensity of the benchmark case by 20% experi-ence an increasing future value of the tax base due to the simultaneous introduction of all CCTB options (Option I) of 5.95%. For the benchmark case, in contrast, the deviation from national GAAP amounts to 6.20%. Reversely, the effect of a CCTB increases on average to 6.40% if la-bour intensity is 20% lower than in the benchmark case. The first reason for the observed effects is a technical one. As the future value of the tax base in the benchmark case is higher in case of CCTB compared to national GAAP the same absolute changes in the future value of the tax base lead to smaller relative changes. This reason holds true
30 The measure effective tax burden also reveals a negative correlation between labour intensity and deviation be-tween national GAAP and CCTB. For detailed results see Appendix 7.1 table 3
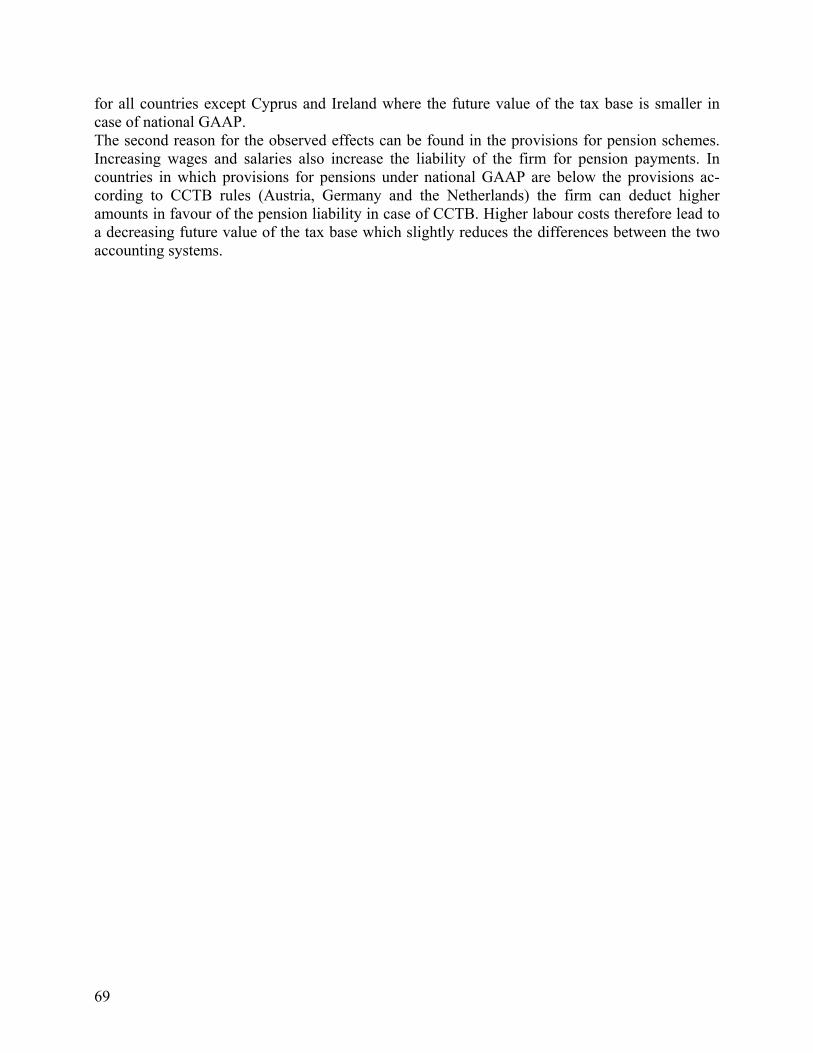
69
for all countries except Cyprus and Ireland where the future value of the tax base is smaller in case of national GAAP. The second reason for the observed effects can be found in the provisions for pension schemes. Increasing wages and salaries also increase the liability of the firm for pension payments. In countries in which provisions for pensions under national GAAP are below the provisions ac-cording to CCTB rules (Austria, Germany and the Netherlands) the firm can deduct higher amounts in favour of the pension liability in case of CCTB. Higher labour costs therefore lead to a decreasing future value of the tax base which slightly reduces the differences between the two accounting systems.
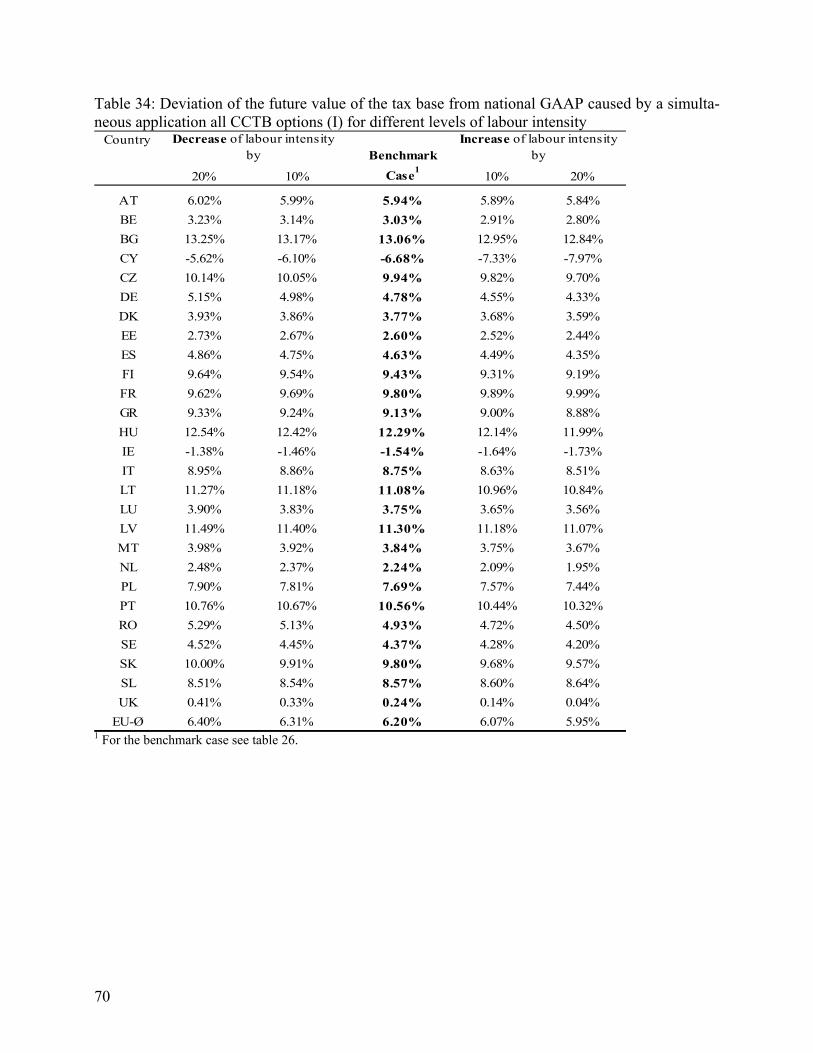
70
Table 34: Deviation of the future value of the tax base from national GAAP caused by a simulta-neous application all CCTB options (I) for different levels of labour intensity
CountryBenchmark
20% 10% Case1
10% 20%
AT 6.02% 5.99% 5.94% 5.89% 5.84%
BE 3.23% 3.14% 3.03% 2.91% 2.80%
BG 13.25% 13.17% 13.06% 12.95% 12.84%
CY -5.62% -6.10% -6.68% -7.33% -7.97%
CZ 10.14% 10.05% 9.94% 9.82% 9.70%
DE 5.15% 4.98% 4.78% 4.55% 4.33%
DK 3.93% 3.86% 3.77% 3.68% 3.59%
EE 2.73% 2.67% 2.60% 2.52% 2.44%
ES 4.86% 4.75% 4.63% 4.49% 4.35%
FI 9.64% 9.54% 9.43% 9.31% 9.19%
FR 9.62% 9.69% 9.80% 9.89% 9.99%
GR 9.33% 9.24% 9.13% 9.00% 8.88%
HU 12.54% 12.42% 12.29% 12.14% 11.99%
IE -1.38% -1.46% -1.54% -1.64% -1.73%
IT 8.95% 8.86% 8.75% 8.63% 8.51%
LT 11.27% 11.18% 11.08% 10.96% 10.84%
LU 3.90% 3.83% 3.75% 3.65% 3.56%
LV 11.49% 11.40% 11.30% 11.18% 11.07%
MT 3.98% 3.92% 3.84% 3.75% 3.67%
NL 2.48% 2.37% 2.24% 2.09% 1.95%
PL 7.90% 7.81% 7.69% 7.57% 7.44%
PT 10.76% 10.67% 10.56% 10.44% 10.32%
RO 5.29% 5.13% 4.93% 4.72% 4.50%
SE 4.52% 4.45% 4.37% 4.28% 4.20%
SK 10.00% 9.91% 9.80% 9.68% 9.57%
SL 8.51% 8.54% 8.57% 8.60% 8.64%
UK 0.41% 0.33% 0.24% 0.14% 0.04%
EU-Ø 6.40% 6.31% 6.20% 6.07% 5.95%
Decrease of labour intensity by
Increase of labour intensity by
1 For the benchmark case see table 26.
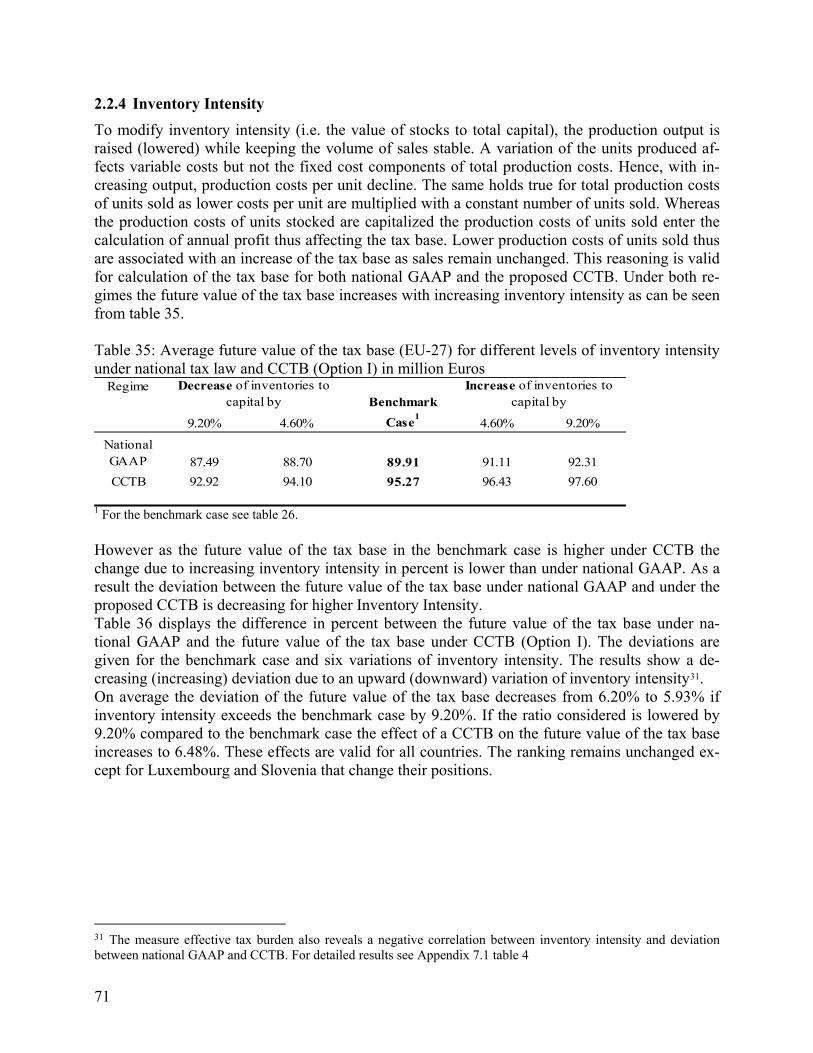
71
2.2.4 Inventory Intensity
To modify inventory intensity (i.e. the value of stocks to total capital), the production output is raised (lowered) while keeping the volume of sales stable. A variation of the units produced af-fects variable costs but not the fixed cost components of total production costs. Hence, with in-creasing output, production costs per unit decline. The same holds true for total production costs of units sold as lower costs per unit are multiplied with a constant number of units sold. Whereas the production costs of units stocked are capitalized the production costs of units sold enter the calculation of annual profit thus affecting the tax base. Lower production costs of units sold thus are associated with an increase of the tax base as sales remain unchanged. This reasoning is valid for calculation of the tax base for both national GAAP and the proposed CCTB. Under both re-gimes the future value of the tax base increases with increasing inventory intensity as can be seen from table 35. Table 35: Average future value of the tax base (EU-27) for different levels of inventory intensity under national tax law and CCTB (Option I) in million Euros
RegimeBenchmark
9.20% 4.60% Case1
4.60% 9.20%
National GAAP 87.49 88.70 89.91 91.11 92.31
CCTB 92.92 94.10 95.27 96.43 97.60
Decrease of inventories to capital by
Increase of inventories to capital by
1 For the benchmark case see table 26. However as the future value of the tax base in the benchmark case is higher under CCTB the change due to increasing inventory intensity in percent is lower than under national GAAP. As a result the deviation between the future value of the tax base under national GAAP and under the proposed CCTB is decreasing for higher Inventory Intensity. Table 36 displays the difference in percent between the future value of the tax base under na-tional GAAP and the future value of the tax base under CCTB (Option I). The deviations are given for the benchmark case and six variations of inventory intensity. The results show a de-creasing (increasing) deviation due to an upward (downward) variation of inventory intensity31. On average the deviation of the future value of the tax base decreases from 6.20% to 5.93% if inventory intensity exceeds the benchmark case by 9.20%. If the ratio considered is lowered by 9.20% compared to the benchmark case the effect of a CCTB on the future value of the tax base increases to 6.48%. These effects are valid for all countries. The ranking remains unchanged ex-cept for Luxembourg and Slovenia that change their positions.
31 The measure effective tax burden also reveals a negative correlation between inventory intensity and deviation between national GAAP and CCTB. For detailed results see Appendix 7.1 table 4
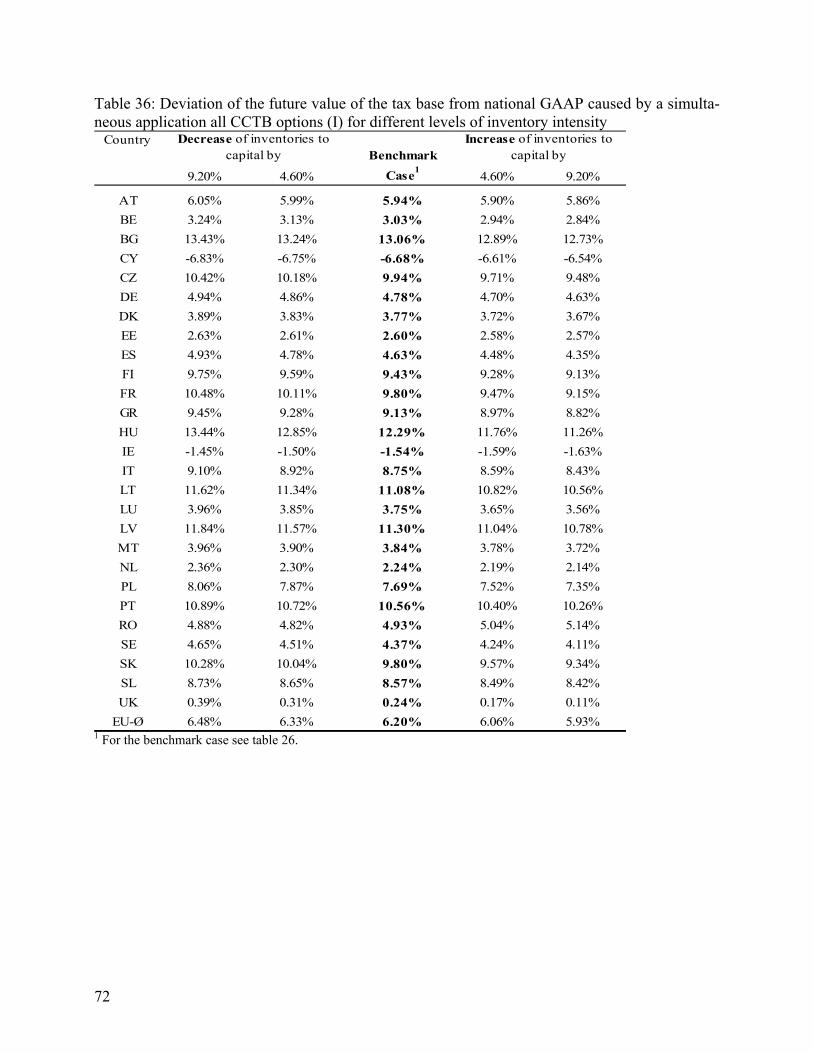
72
Table 36: Deviation of the future value of the tax base from national GAAP caused by a simulta-neous application all CCTB options (I) for different levels of inventory intensity
CountryBenchmark
9.20% 4.60% Case1
4.60% 9.20%
AT 6.05% 5.99% 5.94% 5.90% 5.86%
BE 3.24% 3.13% 3.03% 2.94% 2.84%
BG 13.43% 13.24% 13.06% 12.89% 12.73%
CY -6.83% -6.75% -6.68% -6.61% -6.54%
CZ 10.42% 10.18% 9.94% 9.71% 9.48%
DE 4.94% 4.86% 4.78% 4.70% 4.63%
DK 3.89% 3.83% 3.77% 3.72% 3.67%
EE 2.63% 2.61% 2.60% 2.58% 2.57%
ES 4.93% 4.78% 4.63% 4.48% 4.35%
FI 9.75% 9.59% 9.43% 9.28% 9.13%
FR 10.48% 10.11% 9.80% 9.47% 9.15%
GR 9.45% 9.28% 9.13% 8.97% 8.82%
HU 13.44% 12.85% 12.29% 11.76% 11.26%
IE -1.45% -1.50% -1.54% -1.59% -1.63%
IT 9.10% 8.92% 8.75% 8.59% 8.43%
LT 11.62% 11.34% 11.08% 10.82% 10.56%
LU 3.96% 3.85% 3.75% 3.65% 3.56%
LV 11.84% 11.57% 11.30% 11.04% 10.78%
MT 3.96% 3.90% 3.84% 3.78% 3.72%
NL 2.36% 2.30% 2.24% 2.19% 2.14%
PL 8.06% 7.87% 7.69% 7.52% 7.35%
PT 10.89% 10.72% 10.56% 10.40% 10.26%
RO 4.88% 4.82% 4.93% 5.04% 5.14%
SE 4.65% 4.51% 4.37% 4.24% 4.11%
SK 10.28% 10.04% 9.80% 9.57% 9.34%
SL 8.73% 8.65% 8.57% 8.49% 8.42%
UK 0.39% 0.31% 0.24% 0.17% 0.11%
EU-Ø 6.48% 6.33% 6.20% 6.06% 5.93%
Decrease of inventories to capital by
Increase of inventories to capital by
1 For the benchmark case see table 26.
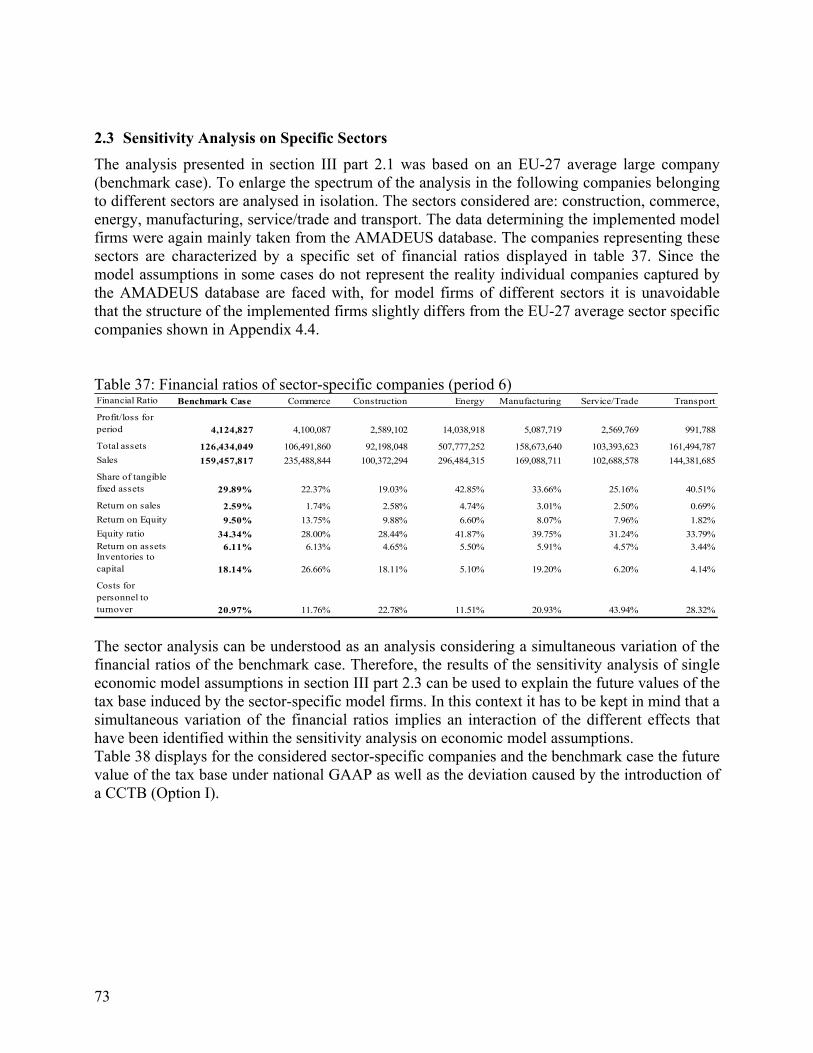
73
2.3 Sensitivity Analysis on Specific Sectors
The analysis presented in section III part 2.1 was based on an EU-27 average large company (benchmark case). To enlarge the spectrum of the analysis in the following companies belonging to different sectors are analysed in isolation. The sectors considered are: construction, commerce, energy, manufacturing, service/trade and transport. The data determining the implemented model firms were again mainly taken from the AMADEUS database. The companies representing these sectors are characterized by a specific set of financial ratios displayed in table 37. Since the model assumptions in some cases do not represent the reality individual companies captured by the AMADEUS database are faced with, for model firms of different sectors it is unavoidable that the structure of the implemented firms slightly differs from the EU-27 average sector specific companies shown in Appendix 4.4. Table 37: Financial ratios of sector-specific companies (period 6) Financial Ratio Benchmark Case Commerce Construction Energy Manufacturing Service/Trade Transport
Profit/loss for period 4,124,827 4,100,087 2,589,102 14,038,918 5,087,719 2,569,769 991,788
Total assets 126,434,049 106,491,860 92,198,048 507,777,252 158,673,640 103,393,623 161,494,787
Sales 159,457,817 235,488,844 100,372,294 296,484,315 169,088,711 102,688,578 144,381,685
Share of tangible fixed assets 29.89% 22.37% 19.03% 42.85% 33.66% 25.16% 40.51%
Return on sales 2.59% 1.74% 2.58% 4.74% 3.01% 2.50% 0.69%
Return on Equity 9.50% 13.75% 9.88% 6.60% 8.07% 7.96% 1.82%
Equity ratio 34.34% 28.00% 28.44% 41.87% 39.75% 31.24% 33.79%Return on assets 6.11% 6.13% 4.65% 5.50% 5.91% 4.57% 3.44%Inventories to capital 18.14% 26.66% 18.11% 5.10% 19.20% 6.20% 4.14%
Costs for personnel to turnover 20.97% 11.76% 22.78% 11.51% 20.93% 43.94% 28.32% The sector analysis can be understood as an analysis considering a simultaneous variation of the financial ratios of the benchmark case. Therefore, the results of the sensitivity analysis of single economic model assumptions in section III part 2.3 can be used to explain the future values of the tax base induced by the sector-specific model firms. In this context it has to be kept in mind that a simultaneous variation of the financial ratios implies an interaction of the different effects that have been identified within the sensitivity analysis on economic model assumptions. Table 38 displays for the considered sector-specific companies and the benchmark case the future value of the tax base under national GAAP as well as the deviation caused by the introduction of a CCTB (Option I).
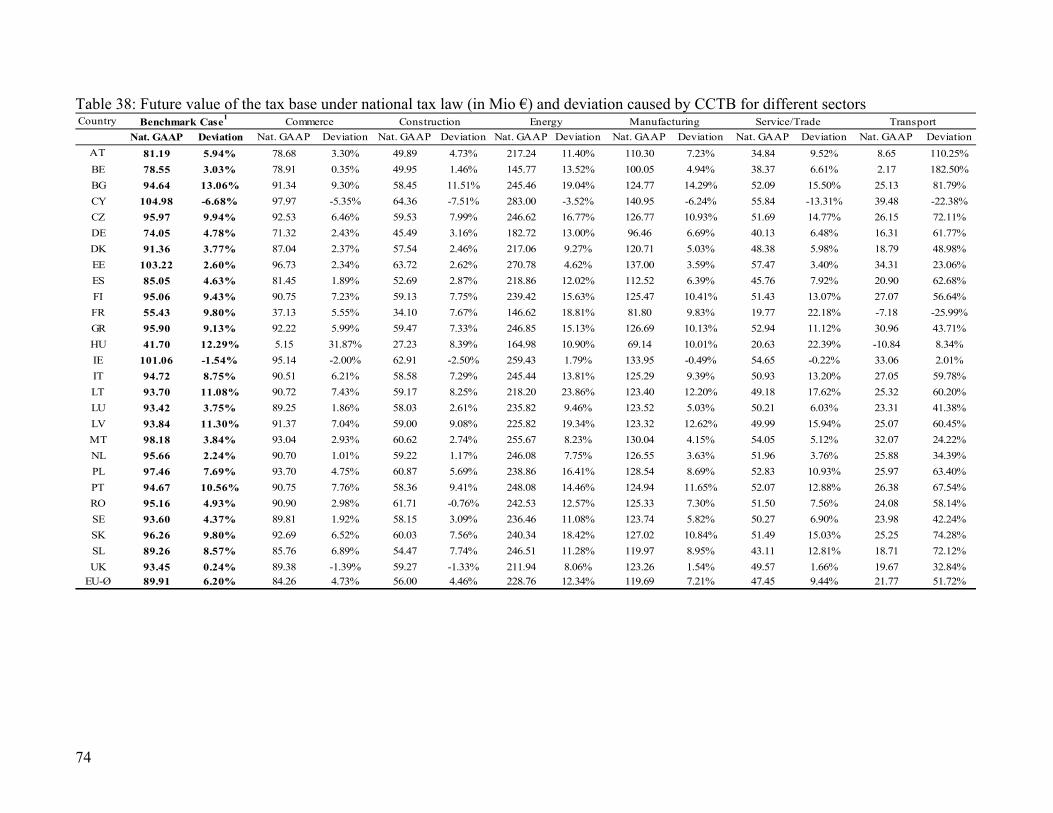
74
Table 38: Future value of the tax base under national tax law (in Mio €) and deviation caused by CCTB for different sectors Country
Nat. GAAP Deviation Nat. GAAP Deviation Nat. GAAP Deviation Nat. GAAP Deviation Nat. GAAP Deviation Nat. GAAP Deviation Nat. GAAP Deviation
AT 81.19 5.94% 78.68 3.30% 49.89 4.73% 217.24 11.40% 110.30 7.23% 34.84 9.52% 8.65 110.25%
BE 78.55 3.03% 78.91 0.35% 49.95 1.46% 145.77 13.52% 100.05 4.94% 38.37 6.61% 2.17 182.50%
BG 94.64 13.06% 91.34 9.30% 58.45 11.51% 245.46 19.04% 124.77 14.29% 52.09 15.50% 25.13 81.79%
CY 104.98 -6.68% 97.97 -5.35% 64.36 -7.51% 283.00 -3.52% 140.95 -6.24% 55.84 -13.31% 39.48 -22.38%
CZ 95.97 9.94% 92.53 6.46% 59.53 7.99% 246.62 16.77% 126.77 10.93% 51.69 14.77% 26.15 72.11%
DE 74.05 4.78% 71.32 2.43% 45.49 3.16% 182.72 13.00% 96.46 6.69% 40.13 6.48% 16.31 61.77%
DK 91.36 3.77% 87.04 2.37% 57.54 2.46% 217.06 9.27% 120.71 5.03% 48.38 5.98% 18.79 48.98%
EE 103.22 2.60% 96.73 2.34% 63.72 2.62% 270.78 4.62% 137.00 3.59% 57.47 3.40% 34.31 23.06%
ES 85.05 4.63% 81.45 1.89% 52.69 2.87% 218.86 12.02% 112.52 6.39% 45.76 7.92% 20.90 62.68%
FI 95.06 9.43% 90.75 7.23% 59.13 7.75% 239.42 15.63% 125.47 10.41% 51.43 13.07% 27.07 56.64%
FR 55.43 9.80% 37.13 5.55% 34.10 7.67% 146.62 18.81% 81.80 9.83% 19.77 22.18% -7.18 -25.99%
GR 95.90 9.13% 92.22 5.99% 59.47 7.33% 246.85 15.13% 126.69 10.13% 52.94 11.12% 30.96 43.71%
HU 41.70 12.29% 5.15 31.87% 27.23 8.39% 164.98 10.90% 69.14 10.01% 20.63 22.39% -10.84 8.34%
IE 101.06 -1.54% 95.14 -2.00% 62.91 -2.50% 259.43 1.79% 133.95 -0.49% 54.65 -0.22% 33.06 2.01%
IT 94.72 8.75% 90.51 6.21% 58.58 7.29% 245.44 13.81% 125.29 9.39% 50.93 13.20% 27.05 59.78%
LT 93.70 11.08% 90.72 7.43% 59.17 8.25% 218.20 23.86% 123.40 12.20% 49.18 17.62% 25.32 60.20%
LU 93.42 3.75% 89.25 1.86% 58.03 2.61% 235.82 9.46% 123.52 5.03% 50.21 6.03% 23.31 41.38%
LV 93.84 11.30% 91.37 7.04% 59.00 9.08% 225.82 19.34% 123.32 12.62% 49.99 15.94% 25.07 60.45%
MT 98.18 3.84% 93.04 2.93% 60.62 2.74% 255.67 8.23% 130.04 4.15% 54.05 5.12% 32.07 24.22%
NL 95.66 2.24% 90.70 1.01% 59.22 1.17% 246.08 7.75% 126.55 3.63% 51.96 3.76% 25.88 34.39%
PL 97.46 7.69% 93.70 4.75% 60.87 5.69% 238.86 16.41% 128.54 8.69% 52.83 10.93% 25.97 63.40%
PT 94.67 10.56% 90.75 7.76% 58.36 9.41% 248.08 14.46% 124.94 11.65% 52.07 12.88% 26.38 67.54%
RO 95.16 4.93% 90.90 2.98% 61.71 -0.76% 242.53 12.57% 125.33 7.30% 51.50 7.56% 24.08 58.14%
SE 93.60 4.37% 89.81 1.92% 58.15 3.09% 236.46 11.08% 123.74 5.82% 50.27 6.90% 23.98 42.24%
SK 96.26 9.80% 92.69 6.52% 60.03 7.56% 240.34 18.42% 127.02 10.84% 51.49 15.03% 25.25 74.28%
SL 89.26 8.57% 85.76 6.89% 54.47 7.74% 246.51 11.28% 119.97 8.95% 43.11 12.81% 18.71 72.12%
UK 93.45 0.24% 89.38 -1.39% 59.27 -1.33% 211.94 8.06% 123.26 1.54% 49.57 1.66% 19.67 32.84%EU-Ø 89.91 6.20% 84.26 4.73% 56.00 4.46% 228.76 12.34% 119.69 7.21% 47.45 9.44% 21.77 51.72%
TransportConstruction EnergyBenchmark Case1
Commerce Manufacturing Service/Trade
75
Commerce Table 37 displays slightly lower profits for the average company representing the commerce sec-tor than for the benchmark case. As a result the future value of the tax base, though on the same level, is lower for the average commerce company (see table 38). In all countries except Cyprus and Ireland the introduction of a CCTB results in an increase of the future value of the tax base. On average the increase amounts to 4.73% compared to 6.20% in the benchmark case. Thus the impact of a CCTB for the considered company in the commerce sector is lower compared to the benchmark case. However although both company types to not vary much in size, they differ in their specific financial ratios displayed in table 37. Capital intensity of the average commerce company amounts to 22.37% thus falling below the capital intensity of the benchmark case. It has been shown in section III part 2.2.1 that a low capi-tal intensity correlates with a smaller impact on the future value of the tax base in case of the in-troduction of a CCTB. Likewise, according to the sensitivity analysis in section III part 2.2.4 high inventory intensity also correlates with a smaller impact on the future value of the tax base in case of the introduction of a CCTB. With 26.66%, inventory intensity for the average commerce company exceeds the respective ratio of the benchmark case (18.14%). It has to be kept in mind that the financial ratios are not varied in isolation. Therefore, the effects induced by the specific profitability and labour intensity of the commerce sector have to be ac-counted for. With 1.74% the profitability of the average commerce company is below the bench-mark case. The sensitivity analysis on profitability in section III part 2.2.2 revealed a negative correlation between profitability and the impact of the introduction of a CCTB on the future value of the tax base. Hence, the low profitability of the average commerce company potentially raises the deviation between the future value of the tax base under CCTB and under national GAAP. The same reasoning holds true for labour intensity since a negative correlation between labour intensity and the impact of the introduction of a CCTB on the future value of the tax base has been derived in section III part 2.2.4 and the respective ratio falls with 11.76% for the average commerce company below the benchmark case (20.97%). However the potential increase of the future value of the tax base in the event of a CCTB due to lower profitability and lower labour intensity is dominated by the opposite effect induced by low capital intensity and high inventory intensity. To sum up the specific capital intensity and inventory intensity of an average commerce company imply a smaller increase of the future value of the tax base in the event of a CCTB. This effect is only partially cancelled out by the opposite effects induced by the specific profitability and la-bour intensity32. Construction As indicated in table 37 the model firm representing the construction sector shows lower annual profits than the benchmark case. Consequently, the future value of the tax base is below the one of the company of the benchmark case when national GAAP is applied (table 38). The introduc-tion of the proposed CCTB results in an increase of the future value of the tax base in all coun-tries except for Cyprus, Ireland and Romania. With an average increase of 4.46% the tax base broadening effect for an average company of the construction sector is smaller than for the benchmark case model firm. Again, the specific setting of financial ratios is responsible for the observed result. With respect to profitability and inventory intensity the comparison of financial
32 The results for the measure effective tax burden are displayed in Appendix 8 table 1 and confirm the conclusion for the commerce sector.
76
ratios displayed in table 37 reveals a high similarity between the benchmark case and the average company representing the commerce sector. Profitability amounts to 2.58% (against 2.59% in the benchmark case) and inventory intensity amounts to 18.11% (against 18.14% in the benchmark case). Hence these financial ratios can not explain the weaker impact of the proposed CCTB for the construction sector. However, the average company representing the construction sector and the benchmark case dif-fer notably in terms of capital intensity and also slightly in labour intensity. With regard to capital intensity the financial ratio is 19.03% and, thus, about ten percentage points below the respective ratio of the benchmark case. The positive correlation between capital intensity and the impact of the proposed CCTB on the future value of the tax base that has been identified in section III part 2.2.1 implies a decreasing deviation between the future values of the tax base under national GAAP and under CCTB for capital intensity below the benchmark case. This finding is in line with the results displayed in table 38. Moreover, it has been shown within the sensitivity analysis that a labour intensity above the respective ratio of the benchmark case is in isolation associated with a higher increase of the future value of the tax base in the event of a CCTB. Yet, compared to the impact of capital intensity, the impact of labour intensity is only of minor importance. Profitability and inventory intensity being stable and labour intensity of minor importance, the lower impact of the proposed CCTB on the future value of the tax base compared to the bench-mark case can primarily be attributed to the low capital intensity of the construction sector33. Energy Referring to the financial ratios displayed in table 37, the energy sector clearly stands out from the other sectors considered. The average company representing the energy sector is character-ized by particular high levels of profits, total assets and sales. Consequently, the level of the fu-ture value of the tax base under national GAAP is much higher compared to the benchmark case (table 38). The harmonisation of tax accounting provisions according to the proposed CCTB results in an average increase of the future value of the tax base by 12.34%. Only in Cyprus the decrease of the future value of the tax base persists. Taking into account that the future value of the tax base under national GAAP already is at a high level, the strong relative increase is associated with a particular high absolute increase. First of all, this result can be traced back to the high capital intensity of the average company representing the energy sector. Capital intensity amounts to 42.85% for the energy sector whereas this ratio amounts to only 29.89% for the benchmark case. Due to this considerable difference in capital intensity special importance should be attached to the positive correlation between capital intensity and the increase of the future value of the tax base caused by the strong impact of de-preciation rules. To some extent the effect is even strengthened due to the low inventory intensity (5.10% against 18.14 % in the benchmark case) and low labour intensity (11.51% against 20.97% in the bench-mark case) of the company representing the energy sector that are according to section III part 2.2.3 and 2.2.4 associated with a higher impact of the proposed CCTB. However the high capital intensity remains the main driver behind the significant increase of the deviation between the future values of the tax base under national GAAP and under CCTB.
33 The results for the measure effective tax burden are displayed in Appendix 8, table 1 and confirm the conclusion for the construction sector.
77
The described effect is partially compensated by the high profitability (4.74% against 2.59% in the benchmark case) yielded in the energy sector. In isolation, a higher profitability results in a lower increase of the future value of the tax base in the event of a CCTB. However, for the aver-age company representing the energy sector this impact is dominated by the opposite effect (i.e. capital intensity) described above. To sum up, the high capital intensity of the energy sector results in a higher impact of the pro-posed CCTB on the future value of the tax base compared to the benchmark case. This effect is compensated to a certain extent by the comparably high profitability of the energy sector34. Manufacturing Compared to the benchmark case, the manufacturing sector yields higher annual profits (see table 37). Therefore, the future value of the tax base is higher when national GAAP is applied (see ta-ble 38). In all countries except Cyprus and Ireland the introduction of a CCTB results in a substantial in-crease of the future value of the tax base. On average, the future value of the tax base increases by 7.21% in the event of a CCTB. Again, this result can be attributed to the interaction of finan-cial ratios displayed in table 37. In particular, the capital intensity of the company model repre-senting the manufacturing sector (33.66%) exceeds the respective ratio of the benchmark com-pany (29.89%) by around 4 percentage points. Hence the positive correlation between capital intensity and impact of the CCTB explains to a great extent the deviation between the future value of the tax base under national GAAP and CCTB. The described positive impact is compen-sated by the slightly higher profitability (3.01% against 2.59% in the benchmark case) as higher profitability weakens the impact of CCTB on the future value of the tax base (see section III part 2.2.2). The inventory intensity of the average manufacturing company is slightly higher than the inven-tory intensity of the benchmark company (19.20% against 18.14% in the benchmark case). In-creased inventory intensity tends to lower the impact of a CCTB on the future value of the tax base. However, the effect resulting from a change of inventory intensity is small and the differ-ence in inventory intensity between the manufacturing sector and the benchmark company is small as well. Labour intensity in the manufacturing sector and for the benchmark case is almost the same (20.93% against 20.97% in the benchmark case). Thus, there is no considerable impact on the increase of the future value of tax base stemming from labour intensity. To sum up, in the case of the manufacturing sector, the impact of higher capital intensity on the deviation between the future value of the tax base under national GAAP and under CCTB is of major importance. The effects induced by higher profitability and higher inventory intensity compensate the effect of higher capital intensity to a certain extent.35 Service/Trade The financial ratios displayed in table 37 indicate that the average company representing the ser-vice sector yields lower profits than the benchmark company. Consequently, the future value of
34 The results for the measure effective tax burden are displayed Appendix 8, table 1 and confirm the conclusion for the energy sector. 35 The results for the measure effective tax burden are displayed in Appendix 8, table 1 and confirm the conclusion for the manufacturing sector.
78
the tax base under national GAAP as displayed in table 38 is considerably lower than in the benchmark case. In the event of a CCTB, all countries except for Cyprus and Ireland experience an increase of the future value of the tax base. On average, the future value of the tax base increases by 9.44%. Considering the specific setting of financial ratios displayed in table 37, the observed effect can partially be explained by lower profitability and lower inventory intensity that are, in isolation, both associated with a higher impact of the proposed CCTB on the future value of the tax base. However, the effect of lower profitability can be deemed relatively small as the financial ratio for the service sector (2.50%) falls only slightly below the one for the benchmark case (2.59%). In-ventory intensity, in contrast, is considerably lower in the service sector (6.20% against 18.14% in the benchmark case) thus explaining, in isolation, an increase of the future value of the tax base in the event of a CCTB. This reasoning is in line with the findings in section III part 2.2.4. Yet, the described effect is partially compensated by an opposite effect induced by lower capital intensity and higher labour intensity compared to the benchmark case. The capital intensity of the service sector amounts to 25.16% compared to 29.89% in the benchmark case (see table 37). Due to the positive correlation between capital intensity and the impact of the proposed CCTB on the future value of the tax base that exists in isolation (section III part 2.2.1), lower capital intensity implies a smaller difference between the considered future values of the tax base. Moreover, it is striking that labour intensity in the service sector is almost twice as high as the labour intensity of the benchmark case. In isolation, a higher labour intensity is associated with a lower impact of changes in tax accounting regulations on the future value of the tax base. This effect, however, should not be overestimated since labour intensity is of minor importance for the absolute level of the future value of the tax base (section III part 2.2.3). To sum up, the effect derived from lower profitability and especially from lower inventory inten-sity in the service sector is not dominated by the opposite effect induced by lower capital inten-sity and higher labour intensity. Moreover, since the future value of the tax base under national GAAP is very low the absolute change due to the specific setting of financial ratios translates to a comparatively higher relative effect36. Transport Compared to the benchmark case, the transport sector yields considerably lower annual profits (see table 37). Hence, a lower level of the future value of the tax base appears when national GAAP is applied (see table 38). In France and Hungary, the future value of the tax base even turns negative. This can be attributed to the impact of non-profit taxes that are deductible from the tax base. In all countries except Cyprus the introduction of a CCTB results in a substantial increase of the future value of the tax base. On average, the future value of the tax base increases by 51.72% in the event of a CCTB. This result can mainly be attributed to the comparably high capital intensity of the company model representing the transport sector. Capital intensity amounts to 40.51% and, thus, exceeds the respective ratio in the benchmark case (29.89%) by almost 11 percentage points. Hence the positive correlation between capital intensity and impact of the CCTB explains for a large part the high deviation between the future value of the tax base under national GAAP and CCTB. The described positive impact is strengthened by the low profitability (0.69% against 2.59% in the benchmark case) and low inventory intensity (4.14% against 18.14% in the bench-
36 The results for the measure effective tax burden are displayed in Appendix 8 table 1 and confirm the conclusion for the service/trade sector.
79
mark case) of the average transport company since both correlate with an increase in the devia-tion between the future value of the tax base under national GAAP and under CCTB (section III part 2.2.2 and 2.2.4). Labour intensity (28.32%) is above the respective ratio in the benchmark case (20.97%).Taking into account that section III part 2.2.3 revealed a negative correlation of labour intensity and the impact of a CCTB, the given specification of the ratio indicates a decrease of the deviation be-tween the future value of the tax base under national GAAP and under CCTB. However, it has been shown within the sensitivity analysis that the impact of labour intensity on the deviation between the future value of the tax base under national GAAP and under CCTB is of minor im-portance. Therefore, this effect is dominated by the opposite effects described above when a si-multaneous variation of the financial ratios takes place. To sum up, for an average transport company the introduction of a CCTB has a higher impact on the future value of the tax base than in the benchmark case. This can be traced back to the higher capital intensity, lower profitability and lower inventory intensity compared to the benchmark case. Moreover there is a technical reason for the strong relative change: Since the future value of the tax base under national GAAP is very low, the absolute increase due to the specific constellation of financial ratios is translated in a particular high relative change.37 Conclusion The main findings for the sensitivity analyses carried out for sector-specific large model compa-nies can be summarized as follows: - Taking EU-average, the future value of the tax base increases in all sectors in the event of the
proposed CCTB. - There is a considerable variation among sectors in the increases of the future values of the tax
base. The increases vary between 4.46% in the construction sector and 51.72% in the trans-port sector
- Exception made for the commerce and the construction sector the average increases of the future values of the tax base exceed the increase for the benchmark company.
- As for the benchmark company, it turns out that capital intensity and thus the impact of dif-fering depreciation rules in the event of a CCTB is the most relevant factor explaining the in-crease of the future value of the tax base.
37The results for the measure effective tax burden are displayed in Appendix 8, table 1 and confirm the conclusion
for the transport sector.
80
2.4 Consideration of Additional EU-15 / EU-12 Average Large Corporations
The analysis presented in section III part 2.1 is based on an EU-27 average large company and represents the benchmark case. In the following the analysis is extended by accounting for two additional company models representing an EU-15 and an EU-12 large company (see table 39). As for the EU-27 average company data is derived from the AMADEUS database as described in section II part 5. The companies differ in the structure of their balance sheet and income state-ment thus yielding different financial ratios. Although the considered EU-12, EU-15 as well as EU-27 corporations are categorized as large corporations, they differ considerably in size in terms of profit, sales and total assets. Consequently, the following analysis will provide addi-tional information on the impact of an introduction of a CCTB for different company sizes. The EU-15 average large company model is only applied to the respective subgroup of countries namely the former EU-15 member states. Likewise the EU-12 average large company model is only applied to the EU-12 accession countries. The following analysis comprises three steps and is carried out separately for the EU-15 and EU-12 average large corporation. First, the future values of the tax base and the effective tax burden stemming from the current national tax provisions in each member state are considered. Second, the impacts on the size of the future value of the tax base and on the effective tax burden resulting from the isolated introduction of tax accounting rules in the event of a CCTB (Option A-H) are measured and analysed. Finally, the third step covers the simultaneous introduction of the pro-posed CCTB options. A detailed description about the proposed CCTB provisions is given in section III part 1. To avoid recurrences with section III part 2.2 the explanation of observed effects will be kept brief throughout the analysis as long as the effects correspond to those described for the EU-27 average company. Table 39: Financial ratios for the benchmark case (EU-27 average large) in comparison to EU-15 and EU-12 average large model firms Financial Ratio EU-27 EU-15 EU-12
Profit/loss for period 4,124,827 5,190,886 1,344,662
Total assets 126,434,049 177,384,948 35,042,958
Sales 159,457,817 228,539,993 42,527,194
Share of tangible fixed assets 29.89% 24.44% 38.20%
Return on sales 2.59% 2.27% 3.16%
Return on Equity 10.50% 9.28% 9.34%
Equity ratio 34.34% 31.53% 41.10%Return on assets 6.19% 5.61% 6.66%Inventories to capital 18.14% 16.83% 18.88%
Costs for personnel to turnover 20.97% 21.03% 21.06%
81
2.4.1 EU-15 Average Large Corporation
The first column of table 40 displays the future value of the tax base under national GAAP for the EU-15 average large company. As for the EU-27 average large company there is a remarkable dispersion of the Future Values of the Tax Bases across member states. The future values of the tax base range from 68.34 Mio € in France to 133.11 Mio € in Ireland. The average future value of the tax base amounts to 115.72 Mio €. Therefore, it exceeds the future value of the tax base of the benchmark case by 25.81 Mio €. The main reason for this effect are higher profits occurring in case of the EU-15 model firm (see table 39). (1) The first simulation considers an isolated harmonisation of rules governing tax depreciation
(Option A). It has been shown for the EU-27 average large corporation in section III part 2.2 that depreciation rules are highly relevant when determining the size of the tax base. The second column of table 40 displays the change of the future value of the tax base stemming from the common tax depre-ciation rules in case of a CCTB. For all countries the change due to the isolated introduction of the proposed tax depreciation rules is positive, indicating a broadening of the tax base. Depend-ing on the specific national depreciation provisions, the tax base broadening effect is larger in some countries than in others: France, Greece, Italy and Sweden experience the highest increase in the future value of the tax base whereas the increase is smallest in Belgium and Ireland. On average, the future value of the tax base increases by 2.57%.38 In isolation, common deprecia-tion rules correspond to 65.06% (=2.57/3.95) of the overall EU-average increase of the future value of the tax base thus revealing depreciation as the option with the most important impact on the future value of the tax base. (2) The second simulation analyses the effect of an isolated harmonisation of methods for simpli-fied valuation of inventories on the future value of the tax base (Option B). Changes of the future value of the tax base resulting from the introduction of the WAC-method in case of a CCTB are displayed in column 3 of table 40. Countries applying the LIFO-method in their national tax accounting rules experience an increase of the future value of the tax base due to the introduction of the WAC-method. A decrease of the future value of the tax base, in con-trast, is monitored for those countries applying the FIFO-method according to their national GAAP. There is no change for countries which already apply the WAC-method in their national tax law. Overall, the impact of the WAC-method on the future value of the tax base ranges from -0.02% in Denmark and Finland to 0.41% in the Netherlands. On average, the future value of the tax base increases by 0.16%.39 In isolation, this corresponds to 4.05% (= 0.16/3.95) of the overall EU-average increase of the future value of the tax base. As for the EU-27 average large corporation the assessment of inventory only exerts moderate impact on the future value of the tax base.
38 Under Option A the effective tax burden increases by 2.12% (table 41 column 2). 39 Under Option B the effective tax burden increases by 0.19% (table 41 column 3).
82
(3) The third simulation investigates the effect of common rules for the determination of produc-tion costs (Option C). The results of an isolated harmonisation of production costs are displayed in column 4 of table 40. The highest increase of the future value of the tax base is determined for Austria with 1.13%. France, Ireland, Italy, Luxembourg, Spain and Sweden show a decrease of the future value of the tax base ranging from 0.01% to 0.58%. In most countries the future value of the tax base only changes to a very small extent, indicating that the current national tax practice is very similar to the proposed CCTB provision. On average, the future value of the tax base increases by 0.27% due to an isolated harmonisation of the determination of production costs40. This average increase corresponds in isolation to 6.8%% (=0.27/3.95) of the overall EU-average increase of the future value of the tax base in the event of a simultaneous introduction of all CCTB options. To sum up, for the EU-15 countries, the proposed CCTB provisions for the determination of production costs have a moderate impact on the future value of the tax base. (4) The next simulation investigates the effect of common rules for the capitalization of R&D costs within production costs (Option D). The results displayed in column 5 of table 40 reveal no considerable impact of common rules for the capitalization of R&D costs on the future value of the tax base. In the majority of countries the future value of the tax base does not change at all or by not more than 0.1%. On average, the future value of the tax base decreases by 0.01%41. In isolation, this corresponds to -0.25% (= -0.01/3.95) of the overall EU-average increase of the future value of the tax base in event of a CCTB. Hence the conclusion drawn for the EU-27 average large company that the effect of har-monised rules for the capitalization of R&D is negligible also holds true for the EU-15 company and the respective countries. (5) The next simulation deals with the effect of common rules regarding provisions for pensions (Option E). As can be seen from column 6 of table 40 the proposed provisions for pension schemes only af-fect the future value of the tax base in Austria, Germany and the Netherlands. In all other coun-tries the national tax accounting rules concerning pension schemes are in line with the proposed CCTB provisions. On average, the results reveal a decrease of the future value of the tax base by 0.16%42. This moderate decrease corresponds in isolation to -4.05% (=-0.16/3.95) of the overall EU-average change of the future value of the tax base in the event of a CCTB. For this option again, the results approve the findings for the EU-27 average company. (6) The effects of provisions for future warranty liabilities are analysed in the following simula-tion (Option F).
40 Under Option C the effective tax burden increases by 0.23% (table 41 column 4). 41 Under option D the effective tax burden decreases by 0.01% (table 41 column 5). 42 Under option E the effective tax burden decreases by 0.13% (table 41 column 6).
83
The changes of the future value of the tax base due to the application of the proposed provisions concerning warranty liabilities are displayed in column 7 of table 40. This option either does not translate in a change of the future value of the tax base at all or causes a decrease of the future value of the tax base. The decrease ranges from 1.09% in Italy to 1.30% in Finland. Overall, the introduction of the proposed provisions for future warranty liabilities causes on average a de-crease of the future value of the tax base of 0.33%43. This decrease in isolation corresponds to -8.35% (= -0.33/3.953) of the overall EU-average change of the future value of the tax base in the event of a CCTB. (7) Another option for CCTB is the avoidance of double taxation of dividend income by applying the exemption method for dividend income from major shareholdings (Option G). Column 8 of table 40 displays the deviation of the future value of the tax base due to the applica-tion of the exemption method to avoid double taxation of dividend income. A change of the fu-ture value of the tax base can only be observed for Greece, Ireland and the United Kingdom since all other former EU-15 countries already apply the exemption method under national GAAP. If the tax credit in the above mentioned countries is replaced by the exemption method this change translates to a decrease of the future value of the tax base. On average, the decrease of the future value of the tax base caused by the implementation of the exemption method in all EU member states amounts to 0.64%44. This corresponds to -16.2% (=-0.64/3.95) of the overall EU-average change of the future value of the tax base in the event of a CCTB. This option thus bears considerable impact for the future value of the tax base. The same conclusion has been drawn for the EU-27 average large corporation. (8) The effects of loss carry forward are analysed in the following simulation (Option H). The large model firm representing EU-15 corporations is a profitable company and shows no losses from regular activities during the simulation period of 10 years. The isolated application of the CCTB Option H for an indefinite loss carry forward itself does therefore not result in changes of the future value of the tax base. This has already been the case for the EU-27 average large corporation. (9) The effects of simultaneous introduction of all CCTB options (Option I) So far, different regulations concerning the computation of taxable income have been harmonised in isolation. Now, the focus will be on a simultaneous introduction of the proposed CCTB op-tions. The results of this calculation are displayed in column 10 of table 40. Except for Ireland and the United Kingdom all countries experience a higher future value of the tax base due to the simultaneous introduction of all proposed CCTB options. On average the increase of the future value of the tax base amounts to 3.95%. The highest impact can be determined for Finland, France and Portugal. In Ireland and the United Kingdom the simultaneous introduction of all CCTB options results in a decrease of the future value of the tax base. With regard to the United Kingdom there has been a slightly positive impact of a CCTB for the EU-27 average corporation that turns to a negative impact of a CCTB when an EU-15 corporation is considered. This is due
43 Under option F the effective tax burden decreases by 0.37% (table 41 column 7). 44 Under option G the effective tax burden remains unchanged on average. (table 41 column 8).
84
to the fact that the tax base broadening effect of depreciation is lower than for an EU-27 average corporation. At the same time the decrease of the future value of the tax base due to the substitu-tion of tax credit by the exemption method is stronger. To sum up, based on an EU-15 average large corporation, the calculations reveal an increase of the future value of the tax base by 3.95%45.The increase of the future value of the tax base is lower compared to the benchmark EU-27 case (6.20%). This result strengthens the conclusion drawn from the EU-27 average large corporation that the introduction of a CCTB would increase tax bases according to the measured future values but that this increase is less pronounced in the former EU-15 countries. As for the benchmark case the harmonisation of depreciation rules by far has the strongest impact on the tax base. Relevant changes of the future value of the tax base are also caused by CCTB provisions for future warranty liabilities and the CCTB rules concerning the avoidance of double taxation of dividends. In contrast, the impact of common rules for the determination of produc-tion cost as well as the inclusion of R&D-related costs in production cost are of minor importance for the future value of the tax base in the EU-15 countries.
45 A simultaneous introduction of all CCTB options results in an increase of the effective tax burden by 3.47%.
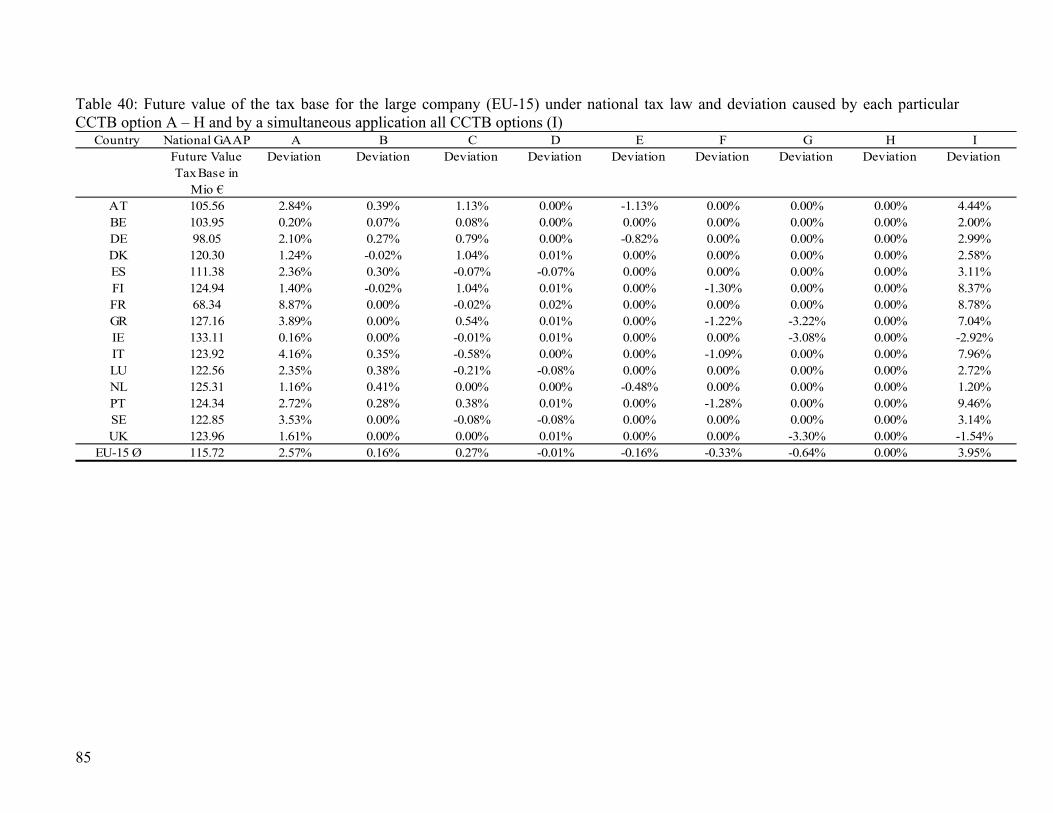
85
Table 40: Future value of the tax base for the large company (EU-15) under national tax law and deviation caused by each particular CCTB option A – H and by a simultaneous application all CCTB options (I)
Country National GAAP A B C D E F G H IFuture Value Tax Base in
Mio €
Deviation Deviation Deviation Deviation Deviation Deviation Deviation Deviation Deviation
AT 105.56 2.84% 0.39% 1.13% 0.00% -1.13% 0.00% 0.00% 0.00% 4.44%BE 103.95 0.20% 0.07% 0.08% 0.00% 0.00% 0.00% 0.00% 0.00% 2.00%DE 98.05 2.10% 0.27% 0.79% 0.00% -0.82% 0.00% 0.00% 0.00% 2.99%DK 120.30 1.24% -0.02% 1.04% 0.01% 0.00% 0.00% 0.00% 0.00% 2.58%ES 111.38 2.36% 0.30% -0.07% -0.07% 0.00% 0.00% 0.00% 0.00% 3.11%FI 124.94 1.40% -0.02% 1.04% 0.01% 0.00% -1.30% 0.00% 0.00% 8.37%FR 68.34 8.87% 0.00% -0.02% 0.02% 0.00% 0.00% 0.00% 0.00% 8.78%GR 127.16 3.89% 0.00% 0.54% 0.01% 0.00% -1.22% -3.22% 0.00% 7.04%IE 133.11 0.16% 0.00% -0.01% 0.01% 0.00% 0.00% -3.08% 0.00% -2.92%IT 123.92 4.16% 0.35% -0.58% 0.00% 0.00% -1.09% 0.00% 0.00% 7.96%LU 122.56 2.35% 0.38% -0.21% -0.08% 0.00% 0.00% 0.00% 0.00% 2.72%NL 125.31 1.16% 0.41% 0.00% 0.00% -0.48% 0.00% 0.00% 0.00% 1.20%PT 124.34 2.72% 0.28% 0.38% 0.01% 0.00% -1.28% 0.00% 0.00% 9.46%SE 122.85 3.53% 0.00% -0.08% -0.08% 0.00% 0.00% 0.00% 0.00% 3.14%UK 123.96 1.61% 0.00% 0.00% 0.01% 0.00% 0.00% -3.30% 0.00% -1.54%
EU-15 Ø 115.72 2.57% 0.16% 0.27% -0.01% -0.16% -0.33% -0.64% 0.00% 3.95%
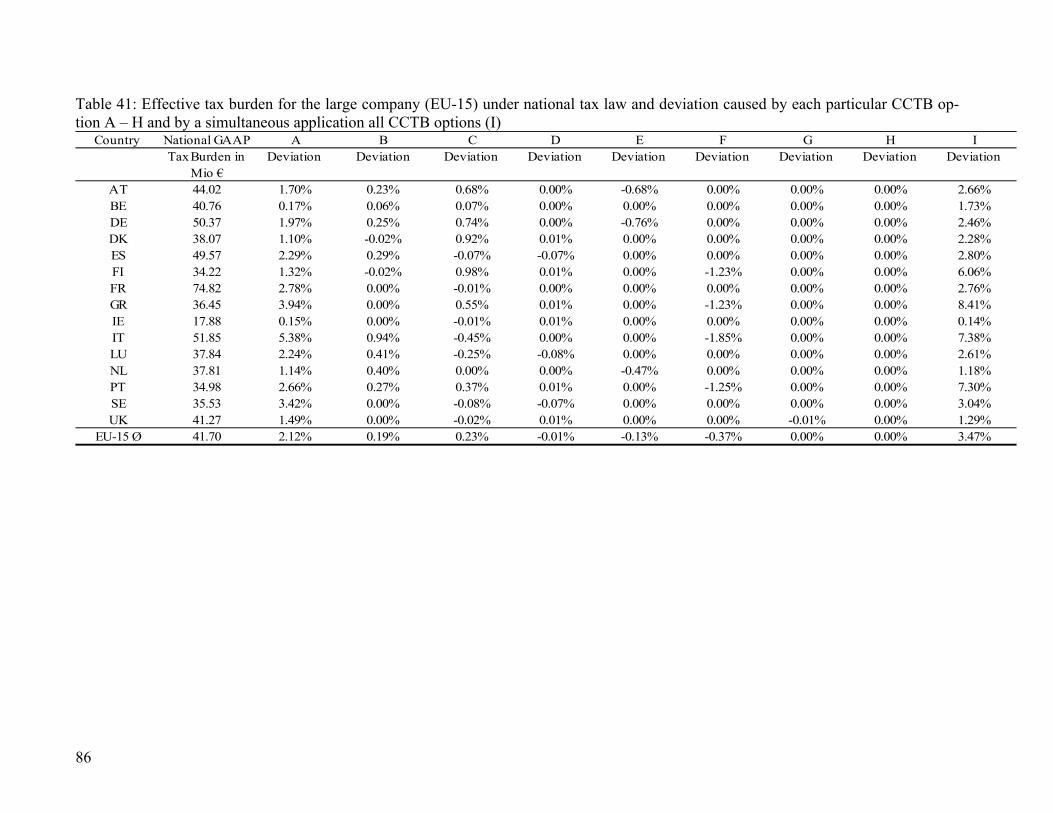
86
Table 41: Effective tax burden for the large company (EU-15) under national tax law and deviation caused by each particular CCTB op-tion A – H and by a simultaneous application all CCTB options (I)
Country National GAAP A B C D E F G H ITax Burden in
Mio €Deviation Deviation Deviation Deviation Deviation Deviation Deviation Deviation Deviation
AT 44.02 1.70% 0.23% 0.68% 0.00% -0.68% 0.00% 0.00% 0.00% 2.66%BE 40.76 0.17% 0.06% 0.07% 0.00% 0.00% 0.00% 0.00% 0.00% 1.73%DE 50.37 1.97% 0.25% 0.74% 0.00% -0.76% 0.00% 0.00% 0.00% 2.46%DK 38.07 1.10% -0.02% 0.92% 0.01% 0.00% 0.00% 0.00% 0.00% 2.28%ES 49.57 2.29% 0.29% -0.07% -0.07% 0.00% 0.00% 0.00% 0.00% 2.80%FI 34.22 1.32% -0.02% 0.98% 0.01% 0.00% -1.23% 0.00% 0.00% 6.06%FR 74.82 2.78% 0.00% -0.01% 0.00% 0.00% 0.00% 0.00% 0.00% 2.76%GR 36.45 3.94% 0.00% 0.55% 0.01% 0.00% -1.23% 0.00% 0.00% 8.41%IE 17.88 0.15% 0.00% -0.01% 0.01% 0.00% 0.00% 0.00% 0.00% 0.14%IT 51.85 5.38% 0.94% -0.45% 0.00% 0.00% -1.85% 0.00% 0.00% 7.38%LU 37.84 2.24% 0.41% -0.25% -0.08% 0.00% 0.00% 0.00% 0.00% 2.61%NL 37.81 1.14% 0.40% 0.00% 0.00% -0.47% 0.00% 0.00% 0.00% 1.18%PT 34.98 2.66% 0.27% 0.37% 0.01% 0.00% -1.25% 0.00% 0.00% 7.30%SE 35.53 3.42% 0.00% -0.08% -0.07% 0.00% 0.00% 0.00% 0.00% 3.04%UK 41.27 1.49% 0.00% -0.02% 0.01% 0.00% 0.00% -0.01% 0.00% 1.29%
EU-15 Ø 41.70 2.12% 0.19% 0.23% -0.01% -0.13% -0.37% 0.00% 0.00% 3.47%
87
2.4.2 EU-12 Average Large Corporation
The first column of table 42 displays the future value of the tax base under national GAAP for the EU-12 average large company. As for the previous cases there is a remarkable dispersion of the Future Values of the Tax Bases across member states. The Future Values of the Tax Base ranges from 20.54 Mio € in Hungary to 35.40 Mio € in Cyprus. The average future value of the tax base amounts to 31.57 Mio €. Compared to the benchmark case the average future value of the tax base of the model firm for the EU-12 case is lower by 58.34 Mio € which is mainly caused by the fact that the EU-12 average large company displays financial ratios which are closer to a small than to a typical large company. (1) The first simulation considers an isolated harmonisation of rules governing tax depreciation
(Option A).
The second column of table 42 displays the change of the future value of the tax base stemming from the common tax depreciation rules in case of a CCTB. For all countries the change due to the isolated introduction of the proposed tax depreciation rules is positive, indicating a broaden-ing of the tax base. Depending on the specific national depreciation provisions, the tax base broadening effect is larger in some countries than in others: The Czech Republic, Hungary, Lat-via, Lithuania and Slovakia experience the highest increase in the future value of the tax base whereas the increase is smallest in Cyprus. On average, the future value of the tax base increases by 6.06%.46 In isolation, common deprecia-tion rules correspond to 83.01% (=6.06/7.30) of the overall EU-average increase of the future value of the tax base thus, again, revealing depreciation as the option with the most important impact on the future value of the tax base. (2) The second simulation analyses the effect of an isolated harmonisation of methods for simpli-fied valuation of inventories on the future value of the tax base (Option B). Changes of the future value of the tax base resulting from the introduction of the WAC-method in case of a CCTB are displayed in column 3 of table 42. Countries applying the LIFO-method in their national tax accounting rules experience an increase of the future value of the tax base due to the introduction of the WAC-method. A decrease of the future value of the tax base, in con-trast, is monitored for those countries applying the FIFO-method according to their national GAAP. Overall, the impact of the WAC-method on the future value of the tax base ranges from °-0.02% in Lithuania to 0.29% in Slovenia. On average, the future value of the tax base increases by 0.08%47. In isolation, this corresponds to 1.10% (= 0.08/7.30) of the overall EU-average increase of the future value of the tax base (Op-tion I). As for the EU-27 average large corporation the assessment of inventory only exerts mod-erate impact on the future value of the tax base.
46 Under Option A the effective tax burden increases by 5.37% (table 43 column 2). 47 Under Option B the effective tax burden increases by 0.07% (table 43 column 3).
88
(3) The third simulation investigates the effect of common rules for the determination of produc-tion costs (Option C). The results of an isolated harmonisation of production costs are displayed in column 4 of table 42. The highest increase of the future value of the tax base is determined for Bulgaria with 0.78%, the strongest decrease in Cyprus with -6.19%. In most countries the future value of the tax base does not change at all or only to a very small extent, indicating that the current national tax practice is similar to the proposed CCTB provision. On average, the future value of the tax base decreases by 0.29% due to an isolated harmonisation of the determination of production costs48. This average increase corresponds in isolation to 3.97% (=0.29/7.30) of the overall EU-average increase of the future value of the tax base in the event of a simultaneous introduction of all CCTB options. (4) The next simulation investigates the effect of common rules for the capitalization of R&D costs within production costs (Option D). The results displayed in column 5 of table 42 reveal no considerable impact of common rules for the capitalization of R&D costs on the future value of the tax base. In the majority of countries the future value of the tax base either does not change at all or changes by not more than 0.03%. On average the future value of the tax base decreases by 0.03%.49 In isolation, this corresponds to -0.41% (= -0.03/7.3) of the overall EU-average increase of the future value of the tax base in event of a CCTB. Hence the conclusion drawn for the EU-27 average large company that the effect of harmonised rules for the capitalization of R&D is negligible holds true as well. (5) The next simulation deals with the effect of common rules regarding provisions for pensions (Option E). As can be seen from column 6 of table 42 the proposed provisions for pension schemes only af-fect the future value of the tax base in Estonia. Estonia experiences a decrease of the future value of the tax base of 0.02%. In all other EU-12 accession countries the national tax accounting rules concerning pension schemes are in line with the proposed CCTB provisions. Therefore, on aver-age, the future value of the tax base remains unchanged in the event of the proposed CCTB op-tion50. Hence, for the EU-12 accession countries, common rules regarding provisions for pensions are of no importance with regard to the size of the tax base. (6) The effects of provisions for future warranty liabilities are analysed in the following simula-tion (Option F). The changes of the future value of the tax base due to the application of the proposed provisions concerning warranty liabilities are displayed in column 7 of table 42. This option either does not translate in a change of the future value of the tax base at all or causes a decrease of the future value of the tax base. The decrease is strongest in Cyprus (3.59%). Overall, the introduction of the proposed provisions for future warranty liabilities causes on average a decrease of the future
48 Under Option C the effective tax burden decreases by 0.13% (table 43 column 4). 49 Under option D the effective tax burden decreases by 0.02% (table 43 column 5). 50 Under option E the effective tax burden does not change (table 43 column 6).
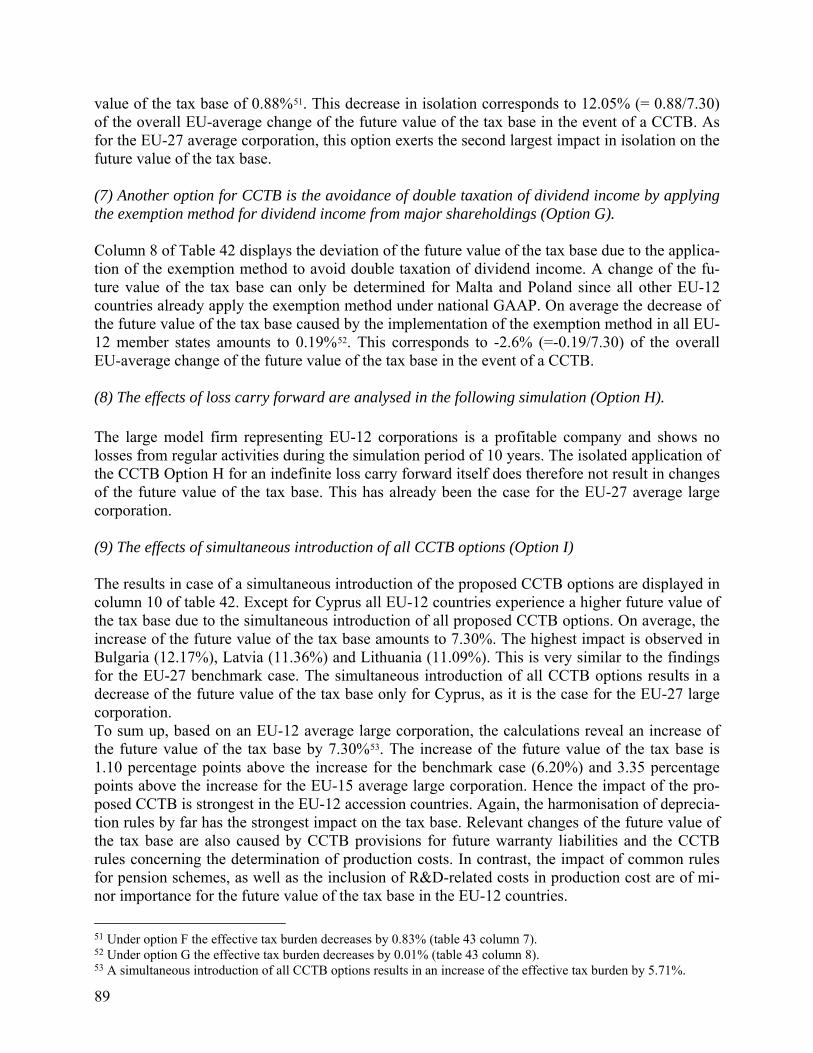
89
value of the tax base of 0.88%51. This decrease in isolation corresponds to 12.05% (= 0.88/7.30) of the overall EU-average change of the future value of the tax base in the event of a CCTB. As for the EU-27 average corporation, this option exerts the second largest impact in isolation on the future value of the tax base. (7) Another option for CCTB is the avoidance of double taxation of dividend income by applying the exemption method for dividend income from major shareholdings (Option G). Column 8 of Table 42 displays the deviation of the future value of the tax base due to the applica-tion of the exemption method to avoid double taxation of dividend income. A change of the fu-ture value of the tax base can only be determined for Malta and Poland since all other EU-12 countries already apply the exemption method under national GAAP. On average the decrease of the future value of the tax base caused by the implementation of the exemption method in all EU-12 member states amounts to 0.19%52. This corresponds to -2.6% (=-0.19/7.30) of the overall EU-average change of the future value of the tax base in the event of a CCTB. (8) The effects of loss carry forward are analysed in the following simulation (Option H). The large model firm representing EU-12 corporations is a profitable company and shows no losses from regular activities during the simulation period of 10 years. The isolated application of the CCTB Option H for an indefinite loss carry forward itself does therefore not result in changes of the future value of the tax base. This has already been the case for the EU-27 average large corporation. (9) The effects of simultaneous introduction of all CCTB options (Option I) The results in case of a simultaneous introduction of the proposed CCTB options are displayed in column 10 of table 42. Except for Cyprus all EU-12 countries experience a higher future value of the tax base due to the simultaneous introduction of all proposed CCTB options. On average, the increase of the future value of the tax base amounts to 7.30%. The highest impact is observed in Bulgaria (12.17%), Latvia (11.36%) and Lithuania (11.09%). This is very similar to the findings for the EU-27 benchmark case. The simultaneous introduction of all CCTB options results in a decrease of the future value of the tax base only for Cyprus, as it is the case for the EU-27 large corporation. To sum up, based on an EU-12 average large corporation, the calculations reveal an increase of the future value of the tax base by 7.30%53. The increase of the future value of the tax base is 1.10 percentage points above the increase for the benchmark case (6.20%) and 3.35 percentage points above the increase for the EU-15 average large corporation. Hence the impact of the pro-posed CCTB is strongest in the EU-12 accession countries. Again, the harmonisation of deprecia-tion rules by far has the strongest impact on the tax base. Relevant changes of the future value of the tax base are also caused by CCTB provisions for future warranty liabilities and the CCTB rules concerning the determination of production costs. In contrast, the impact of common rules for pension schemes, as well as the inclusion of R&D-related costs in production cost are of mi-nor importance for the future value of the tax base in the EU-12 countries.
51 Under option F the effective tax burden decreases by 0.83% (table 43 column 7). 52 Under option G the effective tax burden decreases by 0.01% (table 43 column 8). 53 A simultaneous introduction of all CCTB options results in an increase of the effective tax burden by 5.71%.
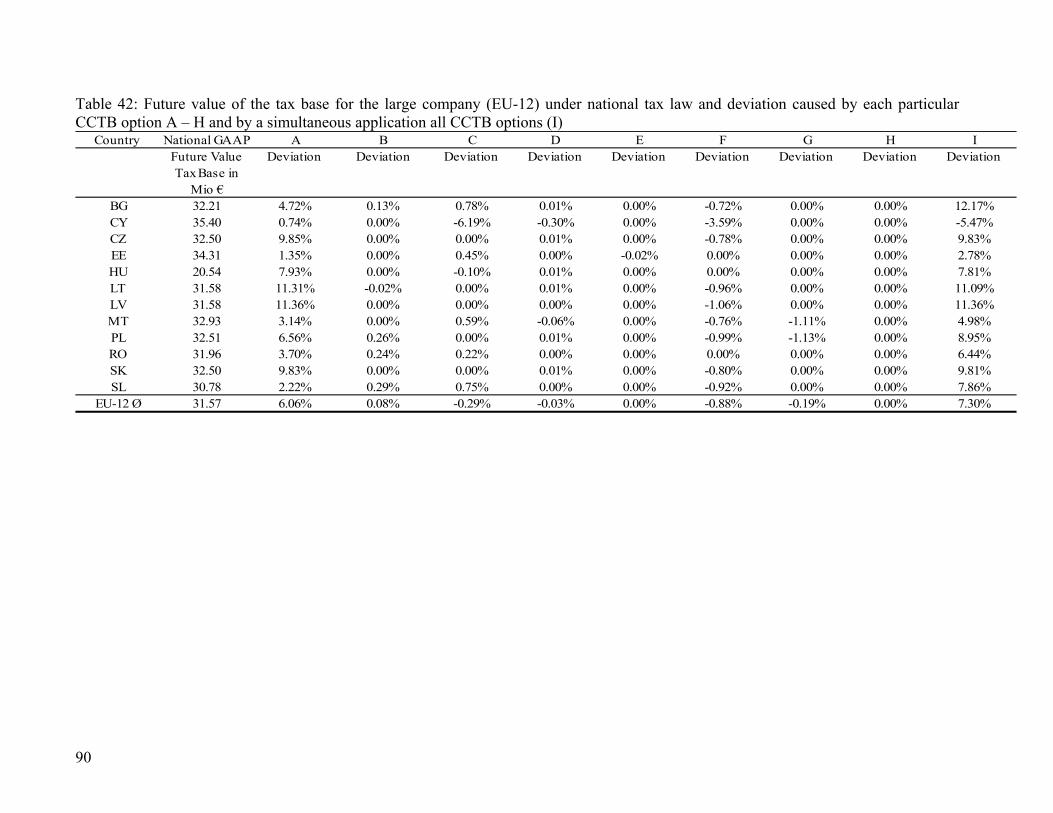
90
Table 42: Future value of the tax base for the large company (EU-12) under national tax law and deviation caused by each particular CCTB option A – H and by a simultaneous application all CCTB options (I)
Country National GAAP A B C D E F G H IFuture Value Tax Base in
Mio €
Deviation Deviation Deviation Deviation Deviation Deviation Deviation Deviation Deviation
BG 32.21 4.72% 0.13% 0.78% 0.01% 0.00% -0.72% 0.00% 0.00% 12.17%CY 35.40 0.74% 0.00% -6.19% -0.30% 0.00% -3.59% 0.00% 0.00% -5.47%CZ 32.50 9.85% 0.00% 0.00% 0.01% 0.00% -0.78% 0.00% 0.00% 9.83%EE 34.31 1.35% 0.00% 0.45% 0.00% -0.02% 0.00% 0.00% 0.00% 2.78%HU 20.54 7.93% 0.00% -0.10% 0.01% 0.00% 0.00% 0.00% 0.00% 7.81%LT 31.58 11.31% -0.02% 0.00% 0.01% 0.00% -0.96% 0.00% 0.00% 11.09%LV 31.58 11.36% 0.00% 0.00% 0.00% 0.00% -1.06% 0.00% 0.00% 11.36%MT 32.93 3.14% 0.00% 0.59% -0.06% 0.00% -0.76% -1.11% 0.00% 4.98%PL 32.51 6.56% 0.26% 0.00% 0.01% 0.00% -0.99% -1.13% 0.00% 8.95%RO 31.96 3.70% 0.24% 0.22% 0.00% 0.00% 0.00% 0.00% 0.00% 6.44%SK 32.50 9.83% 0.00% 0.00% 0.01% 0.00% -0.80% 0.00% 0.00% 9.81%SL 30.78 2.22% 0.29% 0.75% 0.00% 0.00% -0.92% 0.00% 0.00% 7.86%
EU-12 Ø 31.57 6.06% 0.08% -0.29% -0.03% 0.00% -0.88% -0.19% 0.00% 7.30%
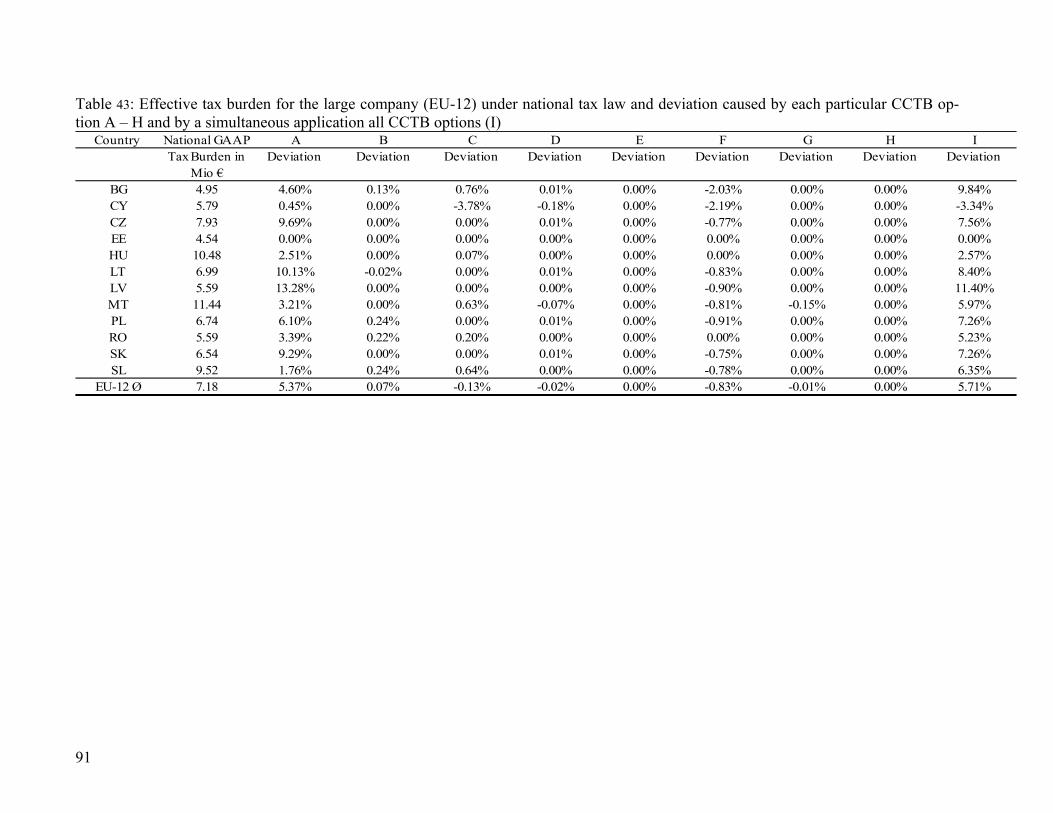
91
Table 43: Effective tax burden for the large company (EU-12) under national tax law and deviation caused by each particular CCTB op-tion A – H and by a simultaneous application all CCTB options (I)
Country National GAAP A B C D E F G H ITax Burden in
Mio €Deviation Deviation Deviation Deviation Deviation Deviation Deviation Deviation Deviation
BG 4.95 4.60% 0.13% 0.76% 0.01% 0.00% -2.03% 0.00% 0.00% 9.84%CY 5.79 0.45% 0.00% -3.78% -0.18% 0.00% -2.19% 0.00% 0.00% -3.34%CZ 7.93 9.69% 0.00% 0.00% 0.01% 0.00% -0.77% 0.00% 0.00% 7.56%EE 4.54 0.00% 0.00% 0.00% 0.00% 0.00% 0.00% 0.00% 0.00% 0.00%HU 10.48 2.51% 0.00% 0.07% 0.00% 0.00% 0.00% 0.00% 0.00% 2.57%LT 6.99 10.13% -0.02% 0.00% 0.01% 0.00% -0.83% 0.00% 0.00% 8.40%LV 5.59 13.28% 0.00% 0.00% 0.00% 0.00% -0.90% 0.00% 0.00% 11.40%MT 11.44 3.21% 0.00% 0.63% -0.07% 0.00% -0.81% -0.15% 0.00% 5.97%PL 6.74 6.10% 0.24% 0.00% 0.01% 0.00% -0.91% 0.00% 0.00% 7.26%RO 5.59 3.39% 0.22% 0.20% 0.00% 0.00% 0.00% 0.00% 0.00% 5.23%SK 6.54 9.29% 0.00% 0.00% 0.01% 0.00% -0.75% 0.00% 0.00% 7.26%SL 9.52 1.76% 0.24% 0.64% 0.00% 0.00% -0.78% 0.00% 0.00% 6.35%
EU-12 Ø 7.18 5.37% 0.07% -0.13% -0.02% 0.00% -0.83% -0.01% 0.00% 5.71%
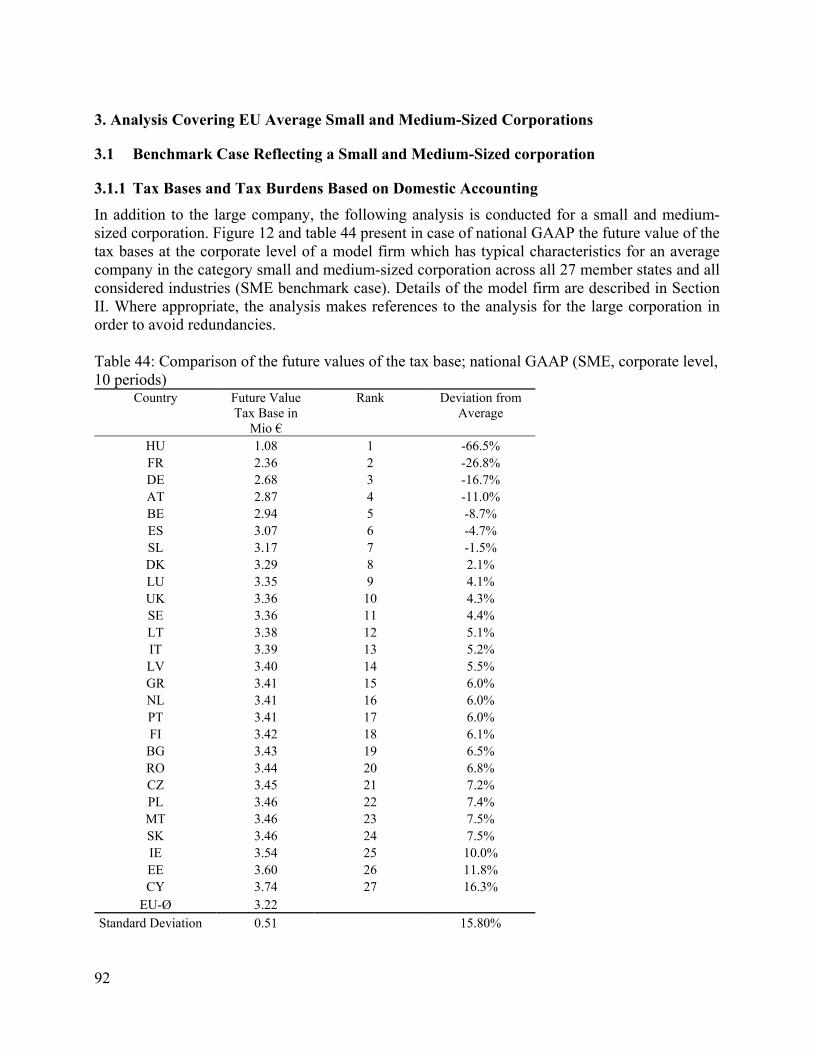
92
3. Analysis Covering EU Average Small and Medium-Sized Corporations
3.1 Benchmark Case Reflecting a Small and Medium-Sized corporation
3.1.1 Tax Bases and Tax Burdens Based on Domestic Accounting
In addition to the large company, the following analysis is conducted for a small and medium-sized corporation. Figure 12 and table 44 present in case of national GAAP the future value of the tax bases at the corporate level of a model firm which has typical characteristics for an average company in the category small and medium-sized corporation across all 27 member states and all considered industries (SME benchmark case). Details of the model firm are described in Section II. Where appropriate, the analysis makes references to the analysis for the large corporation in order to avoid redundancies. Table 44: Comparison of the future values of the tax base; national GAAP (SME, corporate level, 10 periods)
Country Future Value Tax Base in
Mio €
Rank Deviation from Average
HU 1.08 1 -66.5% FR 2.36 2 -26.8% DE 2.68 3 -16.7% AT 2.87 4 -11.0% BE 2.94 5 -8.7% ES 3.07 6 -4.7% SL 3.17 7 -1.5% DK 3.29 8 2.1% LU 3.35 9 4.1% UK 3.36 10 4.3% SE 3.36 11 4.4% LT 3.38 12 5.1% IT 3.39 13 5.2% LV 3.40 14 5.5% GR 3.41 15 6.0% NL 3.41 16 6.0% PT 3.41 17 6.0% FI 3.42 18 6.1%
BG 3.43 19 6.5% RO 3.44 20 6.8% CZ 3.45 21 7.2% PL 3.46 22 7.4% MT 3.46 23 7.5% SK 3.46 24 7.5% IE 3.54 25 10.0% EE 3.60 26 11.8% CY 3.74 27 16.3%
EU-Ø 3.22 Standard Deviation 0.51 15.80%
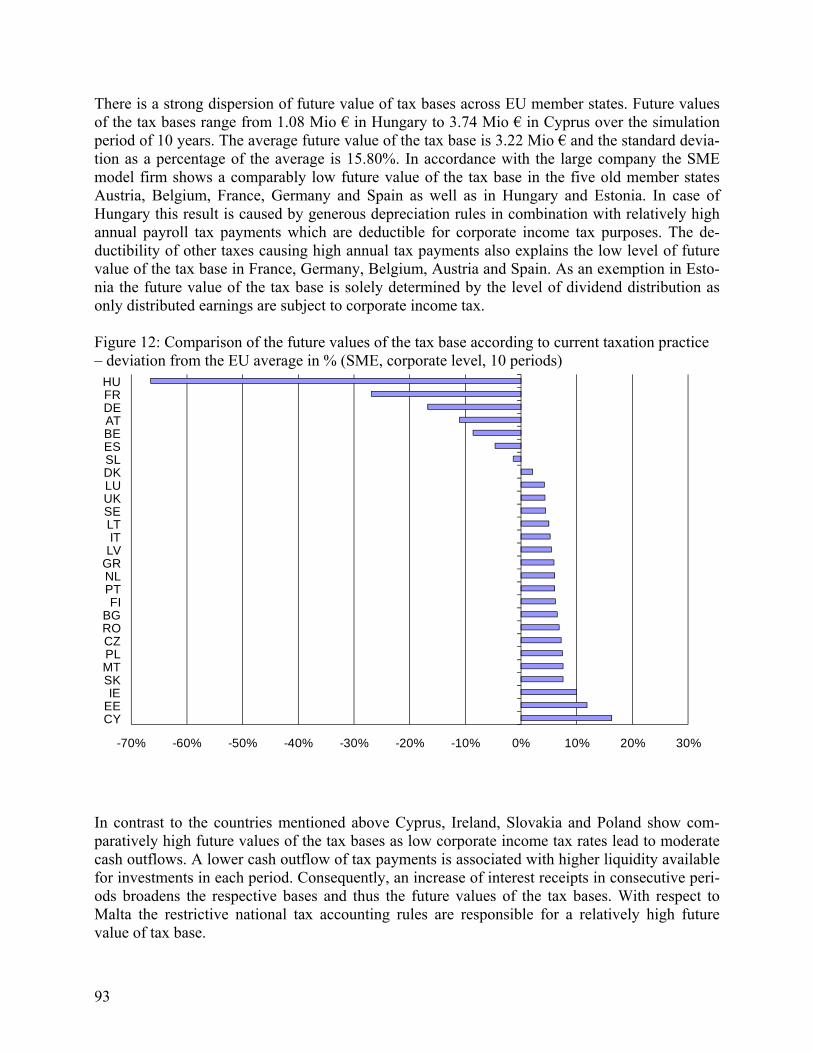
93
There is a strong dispersion of future value of tax bases across EU member states. Future values of the tax bases range from 1.08 Mio € in Hungary to 3.74 Mio € in Cyprus over the simulation period of 10 years. The average future value of the tax base is 3.22 Mio € and the standard devia-tion as a percentage of the average is 15.80%. In accordance with the large company the SME model firm shows a comparably low future value of the tax base in the five old member states Austria, Belgium, France, Germany and Spain as well as in Hungary and Estonia. In case of Hungary this result is caused by generous depreciation rules in combination with relatively high annual payroll tax payments which are deductible for corporate income tax purposes. The de-ductibility of other taxes causing high annual tax payments also explains the low level of future value of the tax base in France, Germany, Belgium, Austria and Spain. As an exemption in Esto-nia the future value of the tax base is solely determined by the level of dividend distribution as only distributed earnings are subject to corporate income tax. Figure 12: Comparison of the future values of the tax base according to current taxation practice – deviation from the EU average in % (SME, corporate level, 10 periods)
-70% -60% -50% -40% -30% -20% -10% 0% 10% 20% 30%
HUFRDEATBEESSLDKLUUKSELTIT
LVGRNLPTFI
BGROCZPLMTSKIE
EECY
In contrast to the countries mentioned above Cyprus, Ireland, Slovakia and Poland show com-paratively high future values of the tax bases as low corporate income tax rates lead to moderate cash outflows. A lower cash outflow of tax payments is associated with higher liquidity available for investments in each period. Consequently, an increase of interest receipts in consecutive peri-ods broadens the respective bases and thus the future values of the tax bases. With respect to Malta the restrictive national tax accounting rules are responsible for a relatively high future value of tax base.
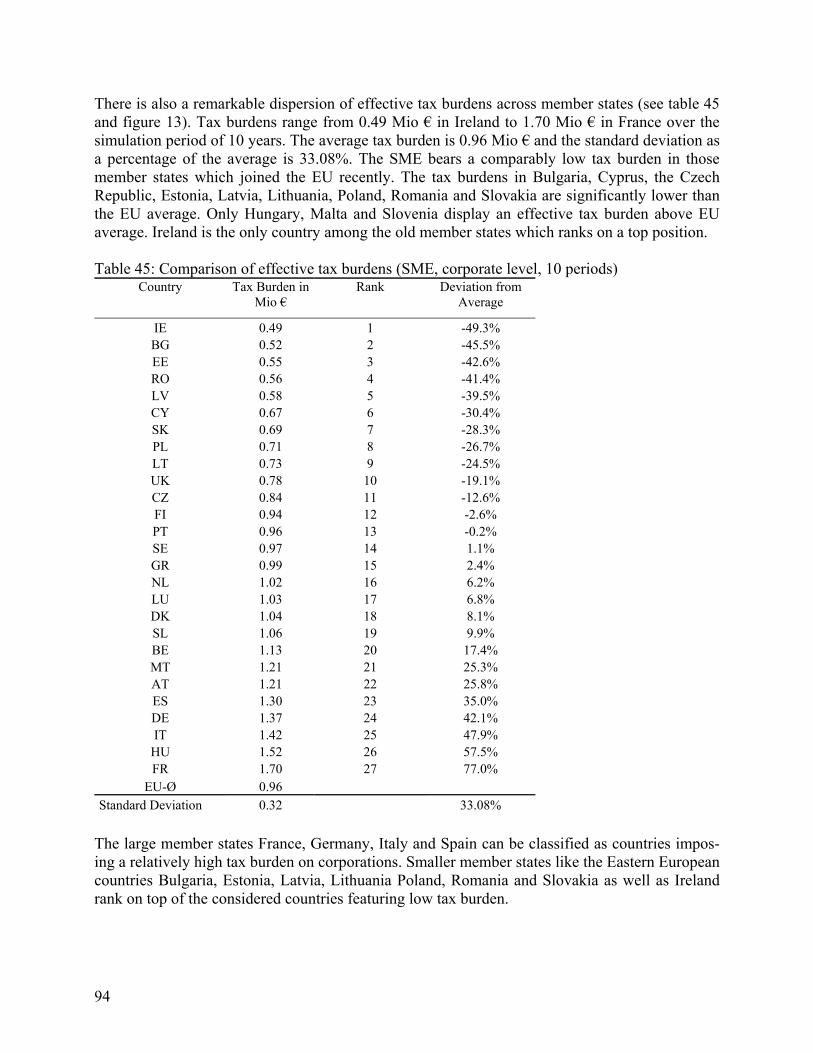
94
There is also a remarkable dispersion of effective tax burdens across member states (see table 45 and figure 13). Tax burdens range from 0.49 Mio € in Ireland to 1.70 Mio € in France over the simulation period of 10 years. The average tax burden is 0.96 Mio € and the standard deviation as a percentage of the average is 33.08%. The SME bears a comparably low tax burden in those member states which joined the EU recently. The tax burdens in Bulgaria, Cyprus, the Czech Republic, Estonia, Latvia, Lithuania, Poland, Romania and Slovakia are significantly lower than the EU average. Only Hungary, Malta and Slovenia display an effective tax burden above EU average. Ireland is the only country among the old member states which ranks on a top position. Table 45: Comparison of effective tax burdens (SME, corporate level, 10 periods)
Country Tax Burden in Mio €
Rank Deviation from Average
IE 0.49 1 -49.3% BG 0.52 2 -45.5% EE 0.55 3 -42.6% RO 0.56 4 -41.4% LV 0.58 5 -39.5% CY 0.67 6 -30.4% SK 0.69 7 -28.3% PL 0.71 8 -26.7% LT 0.73 9 -24.5% UK 0.78 10 -19.1% CZ 0.84 11 -12.6% FI 0.94 12 -2.6% PT 0.96 13 -0.2% SE 0.97 14 1.1% GR 0.99 15 2.4% NL 1.02 16 6.2% LU 1.03 17 6.8% DK 1.04 18 8.1% SL 1.06 19 9.9% BE 1.13 20 17.4% MT 1.21 21 25.3% AT 1.21 22 25.8% ES 1.30 23 35.0% DE 1.37 24 42.1% IT 1.42 25 47.9%
HU 1.52 26 57.5% FR 1.70 27 77.0%
EU-Ø 0.96 Standard Deviation 0.32 33.08%
The large member states France, Germany, Italy and Spain can be classified as countries impos-ing a relatively high tax burden on corporations. Smaller member states like the Eastern European countries Bulgaria, Estonia, Latvia, Lithuania Poland, Romania and Slovakia as well as Ireland rank on top of the considered countries featuring low tax burden.
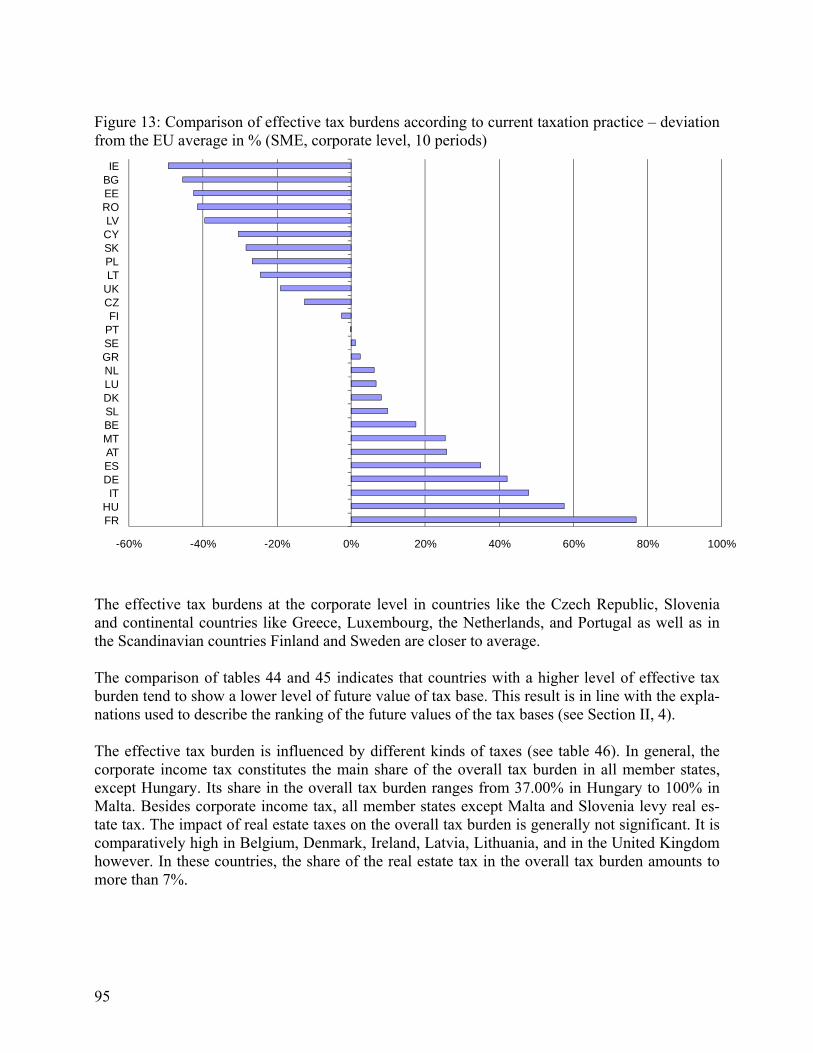
95
Figure 13: Comparison of effective tax burdens according to current taxation practice – deviation from the EU average in % (SME, corporate level, 10 periods)
-60% -40% -20% 0% 20% 40% 60% 80% 100%
IEBGEEROLVCYSKPLLT
UKCZFI
PTSEGRNLLUDKSLBEMTATESDEIT
HUFR
The effective tax burdens at the corporate level in countries like the Czech Republic, Slovenia and continental countries like Greece, Luxembourg, the Netherlands, and Portugal as well as in the Scandinavian countries Finland and Sweden are closer to average. The comparison of tables 44 and 45 indicates that countries with a higher level of effective tax burden tend to show a lower level of future value of tax base. This result is in line with the expla-nations used to describe the ranking of the future values of the tax bases (see Section II, 4). The effective tax burden is influenced by different kinds of taxes (see table 46). In general, the corporate income tax constitutes the main share of the overall tax burden in all member states, except Hungary. Its share in the overall tax burden ranges from 37.00% in Hungary to 100% in Malta. Besides corporate income tax, all member states except Malta and Slovenia levy real es-tate tax. The impact of real estate taxes on the overall tax burden is generally not significant. It is comparatively high in Belgium, Denmark, Ireland, Latvia, Lithuania, and in the United Kingdom however. In these countries, the share of the real estate tax in the overall tax burden amounts to more than 7%.
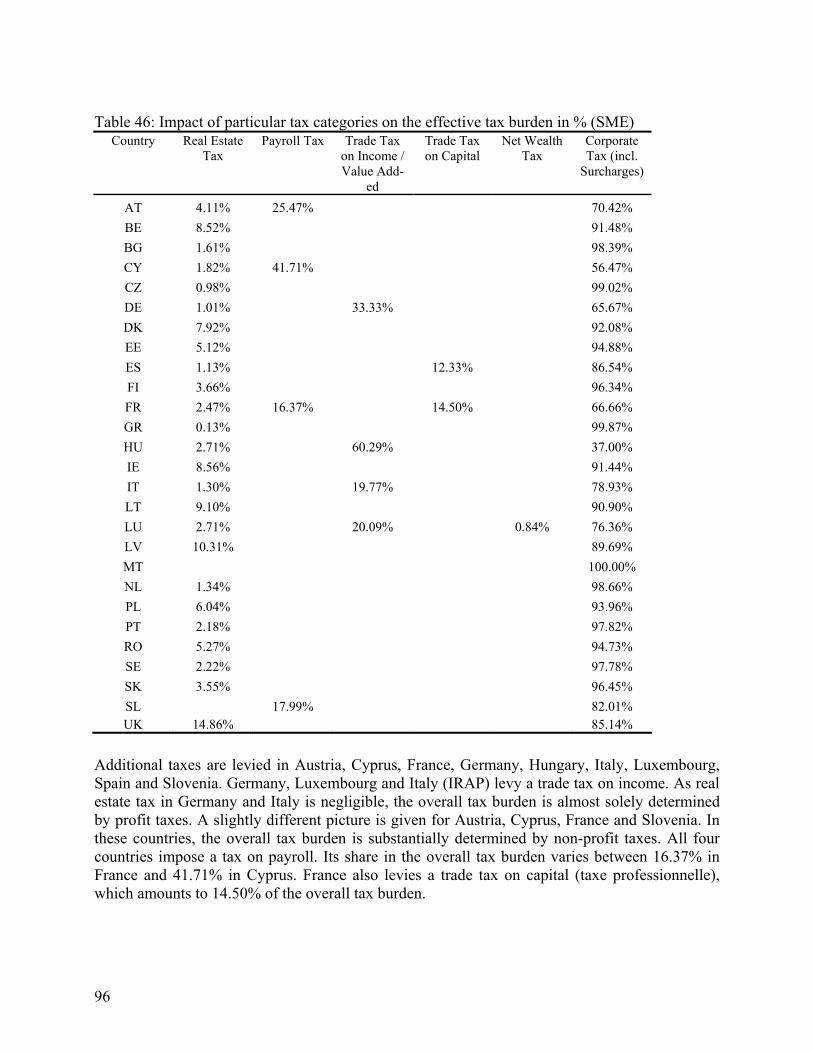
96
Table 46: Impact of particular tax categories on the effective tax burden in % (SME)
Country Real Estate Tax
Payroll Tax Trade Tax on Income / Value Add-
ed
Trade Tax on Capital
Net Wealth Tax
Corporate Tax (incl.
Surcharges)
AT 4.11% 25.47% 70.42%
BE 8.52% 91.48%
BG 1.61% 98.39%
CY 1.82% 41.71% 56.47%
CZ 0.98% 99.02%
DE 1.01% 33.33% 65.67%
DK 7.92% 92.08%
EE 5.12% 94.88%
ES 1.13% 12.33% 86.54%
FI 3.66% 96.34%
FR 2.47% 16.37% 14.50% 66.66%
GR 0.13% 99.87%
HU 2.71% 60.29% 37.00%
IE 8.56% 91.44%
IT 1.30% 19.77% 78.93%
LT 9.10% 90.90%
LU 2.71% 20.09% 0.84% 76.36%
LV 10.31% 89.69%
MT 100.00%
NL 1.34% 98.66%
PL 6.04% 93.96%
PT 2.18% 97.82%
RO 5.27% 94.73%
SE 2.22% 97.78%
SK 3.55% 96.45%
SL 17.99% 82.01% UK 14.86% 85.14%
Additional taxes are levied in Austria, Cyprus, France, Germany, Hungary, Italy, Luxembourg, Spain and Slovenia. Germany, Luxembourg and Italy (IRAP) levy a trade tax on income. As real estate tax in Germany and Italy is negligible, the overall tax burden is almost solely determined by profit taxes. A slightly different picture is given for Austria, Cyprus, France and Slovenia. In these countries, the overall tax burden is substantially determined by non-profit taxes. All four countries impose a tax on payroll. Its share in the overall tax burden varies between 16.37% in France and 41.71% in Cyprus. France also levies a trade tax on capital (taxe professionnelle), which amounts to 14.50% of the overall tax burden.
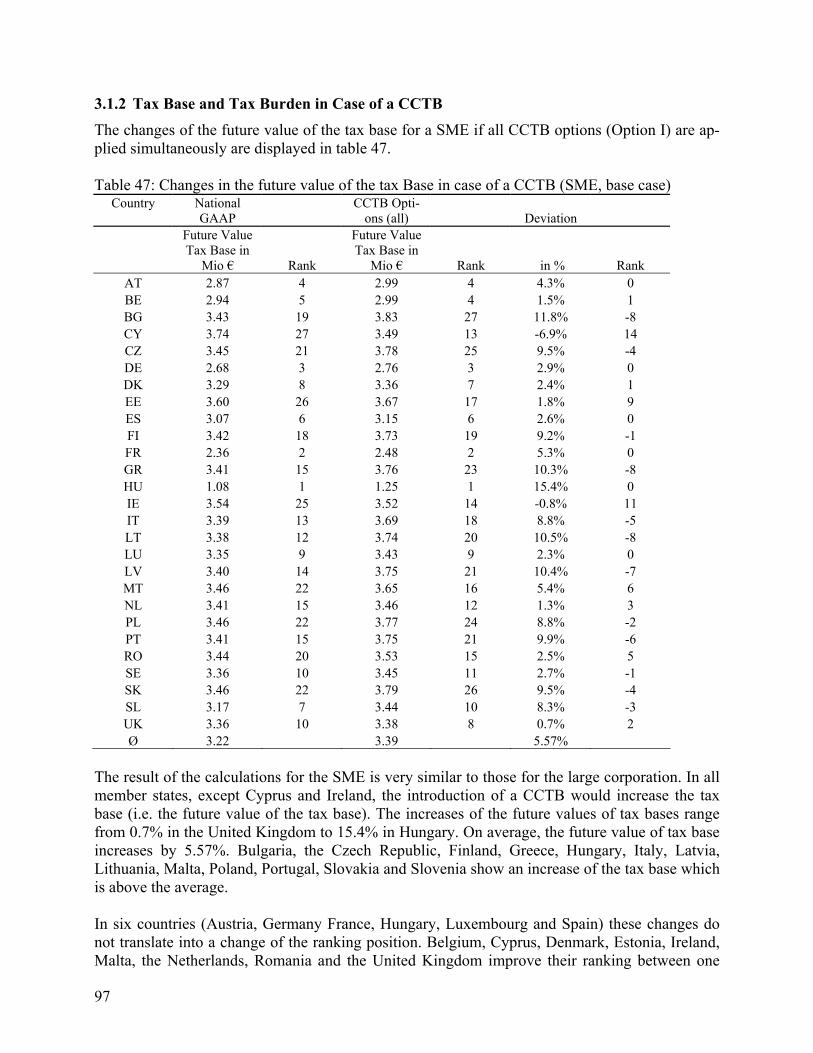
97
3.1.2 Tax Base and Tax Burden in Case of a CCTB
The changes of the future value of the tax base for a SME if all CCTB options (Option I) are ap-plied simultaneously are displayed in table 47. Table 47: Changes in the future value of the tax Base in case of a CCTB (SME, base case)
Country National GAAP
CCTB Opti-ons (all) Deviation
Future Value Tax Base in
Mio € Rank
Future Value Tax Base in
Mio € Rank in % Rank AT 2.87 4 2.99 4 4.3% 0 BE 2.94 5 2.99 4 1.5% 1 BG 3.43 19 3.83 27 11.8% -8 CY 3.74 27 3.49 13 -6.9% 14 CZ 3.45 21 3.78 25 9.5% -4 DE 2.68 3 2.76 3 2.9% 0 DK 3.29 8 3.36 7 2.4% 1 EE 3.60 26 3.67 17 1.8% 9 ES 3.07 6 3.15 6 2.6% 0 FI 3.42 18 3.73 19 9.2% -1 FR 2.36 2 2.48 2 5.3% 0 GR 3.41 15 3.76 23 10.3% -8 HU 1.08 1 1.25 1 15.4% 0 IE 3.54 25 3.52 14 -0.8% 11 IT 3.39 13 3.69 18 8.8% -5 LT 3.38 12 3.74 20 10.5% -8 LU 3.35 9 3.43 9 2.3% 0 LV 3.40 14 3.75 21 10.4% -7 MT 3.46 22 3.65 16 5.4% 6 NL 3.41 15 3.46 12 1.3% 3 PL 3.46 22 3.77 24 8.8% -2 PT 3.41 15 3.75 21 9.9% -6 RO 3.44 20 3.53 15 2.5% 5 SE 3.36 10 3.45 11 2.7% -1 SK 3.46 22 3.79 26 9.5% -4 SL 3.17 7 3.44 10 8.3% -3 UK 3.36 10 3.38 8 0.7% 2 Ø 3.22 3.39 5.57%
The result of the calculations for the SME is very similar to those for the large corporation. In all member states, except Cyprus and Ireland, the introduction of a CCTB would increase the tax base (i.e. the future value of the tax base). The increases of the future values of tax bases range from 0.7% in the United Kingdom to 15.4% in Hungary. On average, the future value of tax base increases by 5.57%. Bulgaria, the Czech Republic, Finland, Greece, Hungary, Italy, Latvia, Lithuania, Malta, Poland, Portugal, Slovakia and Slovenia show an increase of the tax base which is above the average. In six countries (Austria, Germany France, Hungary, Luxembourg and Spain) these changes do not translate into a change of the ranking position. Belgium, Cyprus, Denmark, Estonia, Ireland, Malta, the Netherlands, Romania and the United Kingdom improve their ranking between one
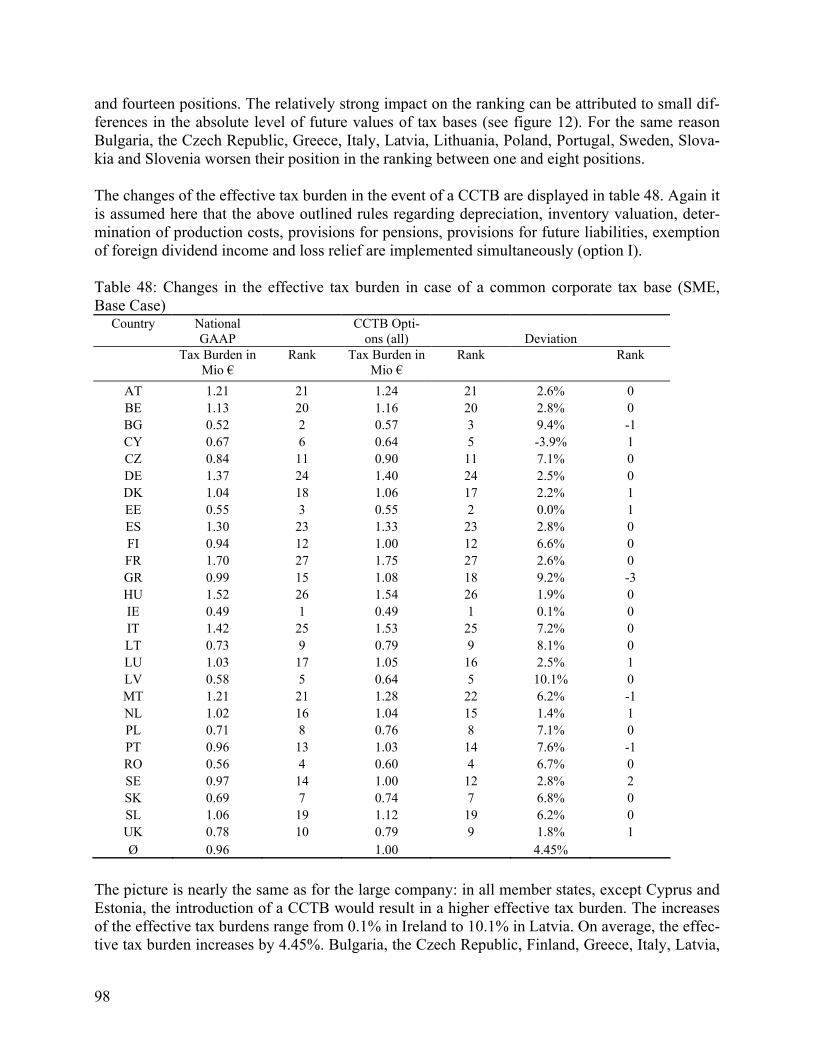
98
and fourteen positions. The relatively strong impact on the ranking can be attributed to small dif-ferences in the absolute level of future values of tax bases (see figure 12). For the same reason Bulgaria, the Czech Republic, Greece, Italy, Latvia, Lithuania, Poland, Portugal, Sweden, Slova-kia and Slovenia worsen their position in the ranking between one and eight positions. The changes of the effective tax burden in the event of a CCTB are displayed in table 48. Again it is assumed here that the above outlined rules regarding depreciation, inventory valuation, deter-mination of production costs, provisions for pensions, provisions for future liabilities, exemption of foreign dividend income and loss relief are implemented simultaneously (option I). Table 48: Changes in the effective tax burden in case of a common corporate tax base (SME, Base Case)
Country National GAAP
CCTB Opti-ons (all) Deviation
Tax Burden in Mio €
Rank Tax Burden in Mio €
Rank Rank
AT 1.21 21 1.24 21 2.6% 0 BE 1.13 20 1.16 20 2.8% 0 BG 0.52 2 0.57 3 9.4% -1 CY 0.67 6 0.64 5 -3.9% 1 CZ 0.84 11 0.90 11 7.1% 0 DE 1.37 24 1.40 24 2.5% 0 DK 1.04 18 1.06 17 2.2% 1 EE 0.55 3 0.55 2 0.0% 1 ES 1.30 23 1.33 23 2.8% 0 FI 0.94 12 1.00 12 6.6% 0 FR 1.70 27 1.75 27 2.6% 0 GR 0.99 15 1.08 18 9.2% -3 HU 1.52 26 1.54 26 1.9% 0 IE 0.49 1 0.49 1 0.1% 0 IT 1.42 25 1.53 25 7.2% 0 LT 0.73 9 0.79 9 8.1% 0 LU 1.03 17 1.05 16 2.5% 1 LV 0.58 5 0.64 5 10.1% 0 MT 1.21 21 1.28 22 6.2% -1 NL 1.02 16 1.04 15 1.4% 1 PL 0.71 8 0.76 8 7.1% 0 PT 0.96 13 1.03 14 7.6% -1 RO 0.56 4 0.60 4 6.7% 0 SE 0.97 14 1.00 12 2.8% 2 SK 0.69 7 0.74 7 6.8% 0 SL 1.06 19 1.12 19 6.2% 0 UK 0.78 10 0.79 9 1.8% 1 Ø 0.96 1.00 4.45%
The picture is nearly the same as for the large company: in all member states, except Cyprus and Estonia, the introduction of a CCTB would result in a higher effective tax burden. The increases of the effective tax burdens range from 0.1% in Ireland to 10.1% in Latvia. On average, the effec-tive tax burden increases by 4.45%. Bulgaria, the Czech Republic, Finland, Greece, Italy, Latvia,
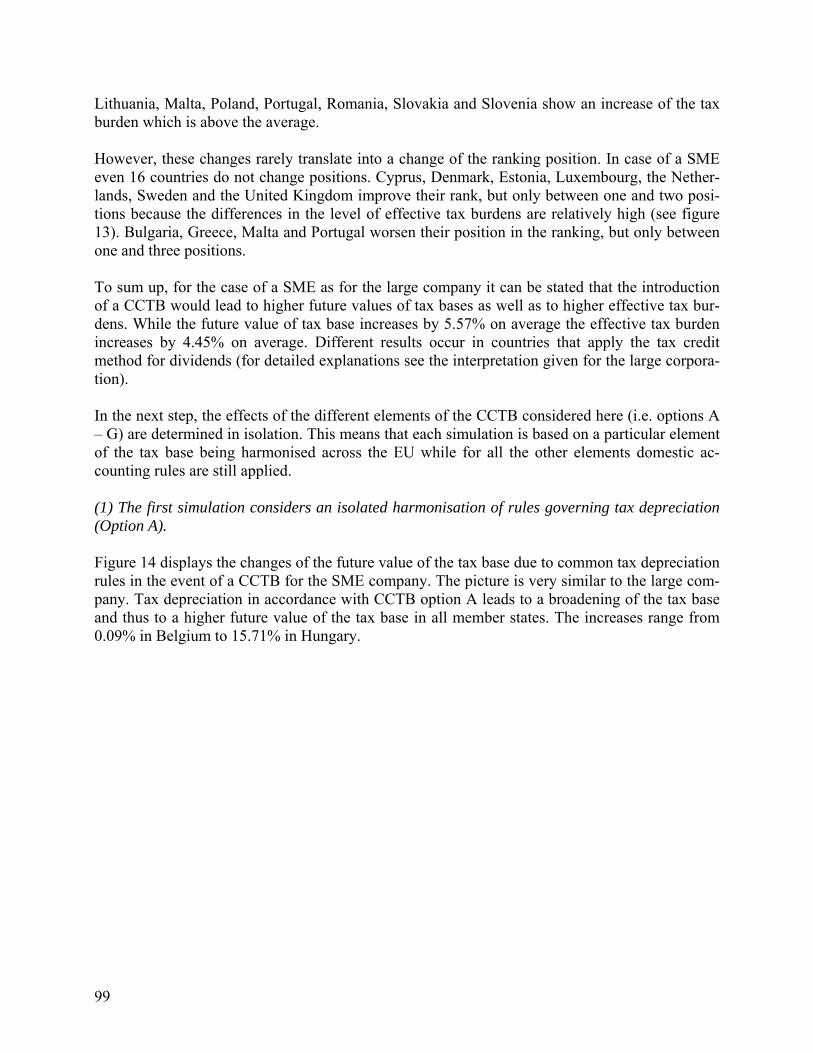
99
Lithuania, Malta, Poland, Portugal, Romania, Slovakia and Slovenia show an increase of the tax burden which is above the average. However, these changes rarely translate into a change of the ranking position. In case of a SME even 16 countries do not change positions. Cyprus, Denmark, Estonia, Luxembourg, the Nether-lands, Sweden and the United Kingdom improve their rank, but only between one and two posi-tions because the differences in the level of effective tax burdens are relatively high (see figure 13). Bulgaria, Greece, Malta and Portugal worsen their position in the ranking, but only between one and three positions. To sum up, for the case of a SME as for the large company it can be stated that the introduction of a CCTB would lead to higher future values of tax bases as well as to higher effective tax bur-dens. While the future value of tax base increases by 5.57% on average the effective tax burden increases by 4.45% on average. Different results occur in countries that apply the tax credit method for dividends (for detailed explanations see the interpretation given for the large corpora-tion). In the next step, the effects of the different elements of the CCTB considered here (i.e. options A – G) are determined in isolation. This means that each simulation is based on a particular element of the tax base being harmonised across the EU while for all the other elements domestic ac-counting rules are still applied. (1) The first simulation considers an isolated harmonisation of rules governing tax depreciation (Option A). Figure 14 displays the changes of the future value of the tax base due to common tax depreciation rules in the event of a CCTB for the SME company. The picture is very similar to the large com-pany. Tax depreciation in accordance with CCTB option A leads to a broadening of the tax base and thus to a higher future value of the tax base in all member states. The increases range from 0.09% in Belgium to 15.71% in Hungary.
100
Figure14: Impact of common rules regarding depreciation on the future value of the tax base in % (SME)
0% 2% 4% 6% 8% 10% 12% 14% 16% 18%
ATBEBGCYCZDEDKEEESFI
FRGRHU
IEITLTLULV
MTNLPLPTROSESKSLUK
Ø
The Czech Republic, Hungary, Latvia, Lithuania and Slovakia show the strongest broadening of the tax base. In contrast, the current tax depreciation rules in Belgium, Cyprus, Denmark, Esto-nia, Ireland, Malta and the Netherlands are rather restrictive. In these countries, the future value of the tax base would increase only by 1.07% at the maximum, if common tax depreciation rules following the suggestions of a CCTB were introduced. Overall, the impact of common depreciation rules is of high relevance when it comes to effects on the future value of the tax base of a SME. The future value of the tax base increases by 4.29% on average. As for the large company, depreciation is the option with the most important impact on the tax base. Changes in tax depreciation rules as considered here in isolation correspond to 77.02% (= 4.29/5.57) of the overall EU-average increase in the future value of the tax base in the event of a CCTB. The introduction of CCTB depreciation rules for the SME company even re-veals a higher relevance for the overall increase of the future value of the tax base compared to the large company (72.10 %). Breaking the overall effect of 4.29% down on the impact of depreciation provisions for specific categories of assets, the results displayed in Appendix 7, table 2 illustrate the pre-eminent impact of common depreciation rules for machinery and equipment on the future value of the tax base. On average due to the isolated application of the proposed CCTB provisions concerning machin-ery and equipment the future value of the tax base increases by 4.03%. In contrast the increase of the future value of the tax base only amounts to 0.23% if common depreciation rules are applied
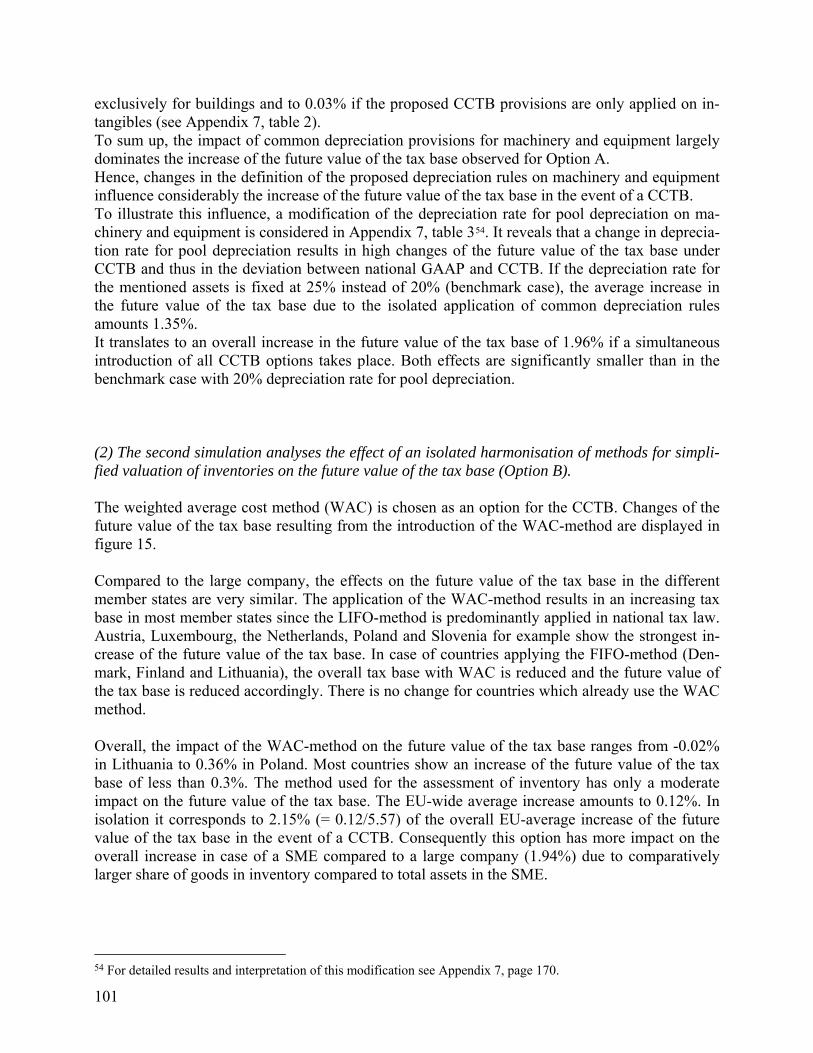
101
exclusively for buildings and to 0.03% if the proposed CCTB provisions are only applied on in-tangibles (see Appendix 7, table 2). To sum up, the impact of common depreciation provisions for machinery and equipment largely dominates the increase of the future value of the tax base observed for Option A. Hence, changes in the definition of the proposed depreciation rules on machinery and equipment influence considerably the increase of the future value of the tax base in the event of a CCTB. To illustrate this influence, a modification of the depreciation rate for pool depreciation on ma-chinery and equipment is considered in Appendix 7, table 354. It reveals that a change in deprecia-tion rate for pool depreciation results in high changes of the future value of the tax base under CCTB and thus in the deviation between national GAAP and CCTB. If the depreciation rate for the mentioned assets is fixed at 25% instead of 20% (benchmark case), the average increase in the future value of the tax base due to the isolated application of common depreciation rules amounts 1.35%. It translates to an overall increase in the future value of the tax base of 1.96% if a simultaneous introduction of all CCTB options takes place. Both effects are significantly smaller than in the benchmark case with 20% depreciation rate for pool depreciation. (2) The second simulation analyses the effect of an isolated harmonisation of methods for simpli-fied valuation of inventories on the future value of the tax base (Option B). The weighted average cost method (WAC) is chosen as an option for the CCTB. Changes of the future value of the tax base resulting from the introduction of the WAC-method are displayed in figure 15. Compared to the large company, the effects on the future value of the tax base in the different member states are very similar. The application of the WAC-method results in an increasing tax base in most member states since the LIFO-method is predominantly applied in national tax law. Austria, Luxembourg, the Netherlands, Poland and Slovenia for example show the strongest in-crease of the future value of the tax base. In case of countries applying the FIFO-method (Den-mark, Finland and Lithuania), the overall tax base with WAC is reduced and the future value of the tax base is reduced accordingly. There is no change for countries which already use the WAC method. Overall, the impact of the WAC-method on the future value of the tax base ranges from -0.02% in Lithuania to 0.36% in Poland. Most countries show an increase of the future value of the tax base of less than 0.3%. The method used for the assessment of inventory has only a moderate impact on the future value of the tax base. The EU-wide average increase amounts to 0.12%. In isolation it corresponds to 2.15% (= 0.12/5.57) of the overall EU-average increase of the future value of the tax base in the event of a CCTB. Consequently this option has more impact on the overall increase in case of a SME compared to a large company (1.94%) due to comparatively larger share of goods in inventory compared to total assets in the SME.
54 For detailed results and interpretation of this modification see Appendix 7, page 170.
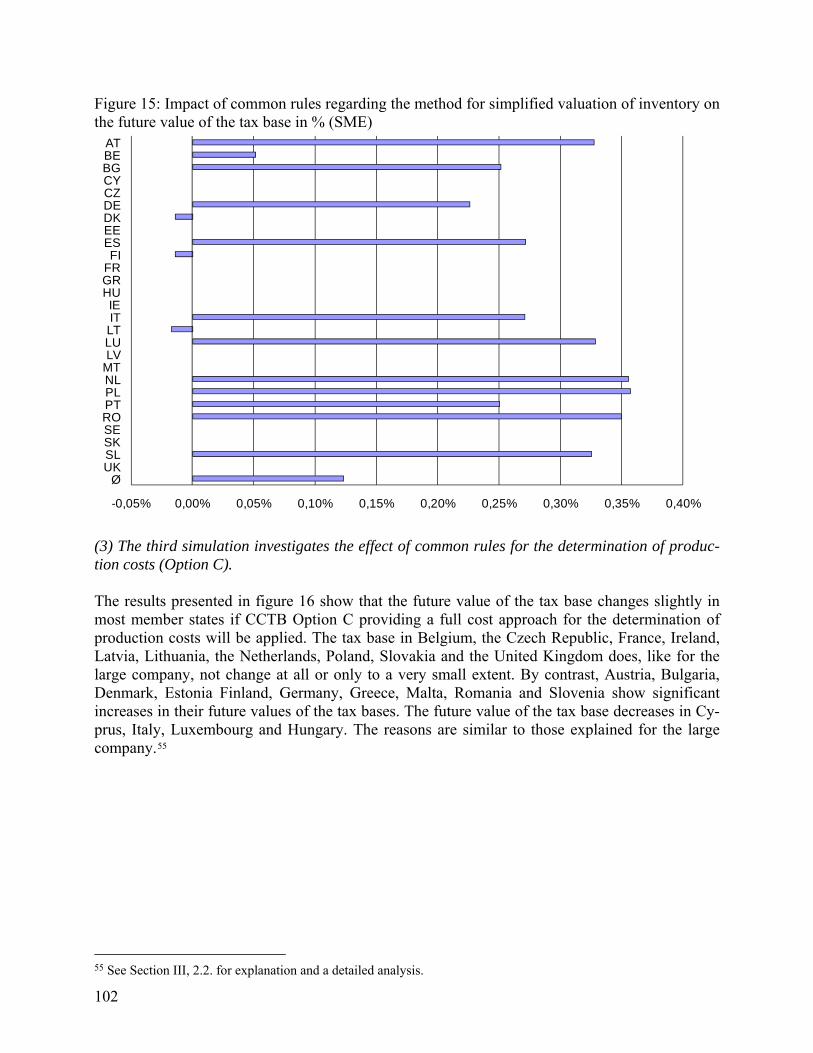
102
Figure 15: Impact of common rules regarding the method for simplified valuation of inventory on the future value of the tax base in % (SME)
-0,05% 0,00% 0,05% 0,10% 0,15% 0,20% 0,25% 0,30% 0,35% 0,40%
ATBEBGCYCZDEDKEEESFI
FRGRHUIEITLTLULV
MTNLPLPTROSESKSLUK
Ø
(3) The third simulation investigates the effect of common rules for the determination of produc-tion costs (Option C). The results presented in figure 16 show that the future value of the tax base changes slightly in most member states if CCTB Option C providing a full cost approach for the determination of production costs will be applied. The tax base in Belgium, the Czech Republic, France, Ireland, Latvia, Lithuania, the Netherlands, Poland, Slovakia and the United Kingdom does, like for the large company, not change at all or only to a very small extent. By contrast, Austria, Bulgaria, Denmark, Estonia Finland, Germany, Greece, Malta, Romania and Slovenia show significant increases in their future values of the tax bases. The future value of the tax base decreases in Cy-prus, Italy, Luxembourg and Hungary. The reasons are similar to those explained for the large company.55
55 See Section III, 2.2. for explanation and a detailed analysis.
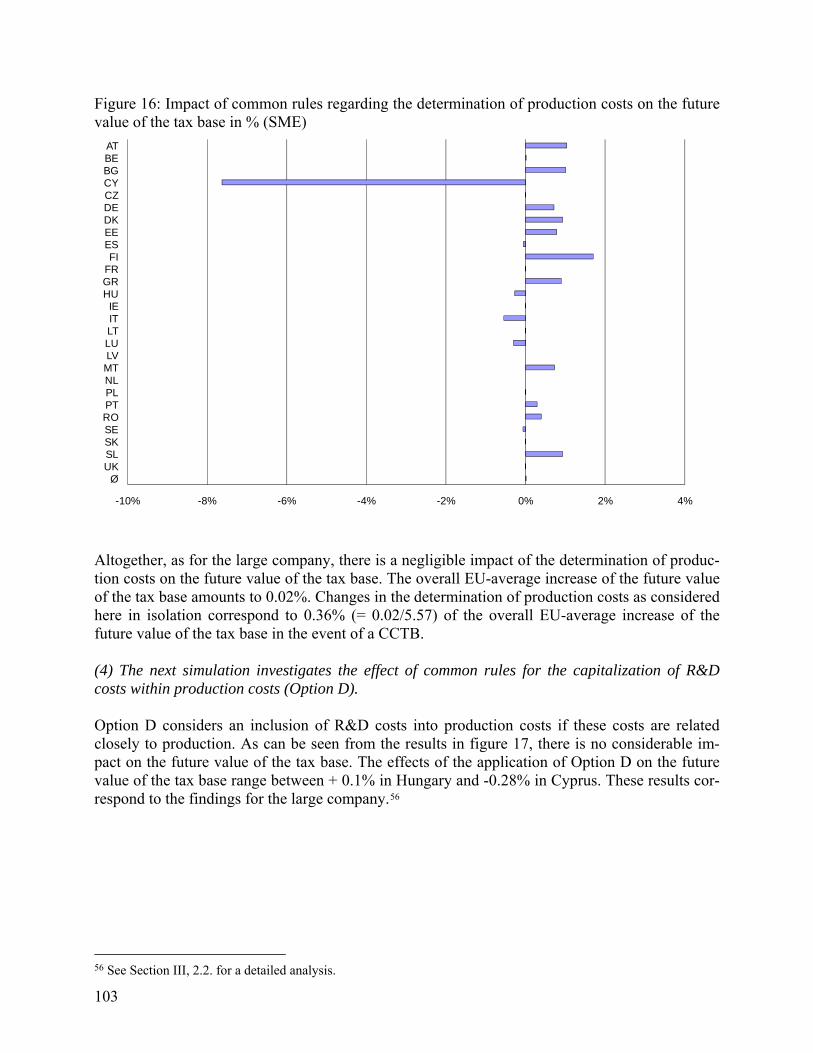
103
Figure 16: Impact of common rules regarding the determination of production costs on the future value of the tax base in % (SME)
-10% -8% -6% -4% -2% 0% 2% 4%
ATBEBGCYCZDEDKEEESFI
FRGRHU
IEITLTLULV
MTNLPLPTROSESKSLUK
Ø
Altogether, as for the large company, there is a negligible impact of the determination of produc-tion costs on the future value of the tax base. The overall EU-average increase of the future value of the tax base amounts to 0.02%. Changes in the determination of production costs as considered here in isolation correspond to 0.36% (= 0.02/5.57) of the overall EU-average increase of the future value of the tax base in the event of a CCTB. (4) The next simulation investigates the effect of common rules for the capitalization of R&D costs within production costs (Option D). Option D considers an inclusion of R&D costs into production costs if these costs are related closely to production. As can be seen from the results in figure 17, there is no considerable im-pact on the future value of the tax base. The effects of the application of Option D on the future value of the tax base range between + 0.1% in Hungary and -0.28% in Cyprus. These results cor-respond to the findings for the large company.56
56 See Section III, 2.2. for a detailed analysis.
104
Figure 17: Impact of common rules regarding R&D costs as part of production costs on the future value of the tax base in % (SME)
-0,3% -0,3% -0,2% -0,2% -0,1% -0,1% 0,0% 0,1% 0,1% 0,2%
ATBEBGCYCZDEDKEEESFI
FRGRHUIEITLTLULV
MTNLPLPTROSESKSLUK
Ø
The overall EU-average decrease in the future value of the tax base amounts to -0.01% and in isolation corresponds to -0.18% (= -0.01/5.57) of the overall EU-average change of the future value of the tax base in the event of a CCTB which is similar to the result for the large company (-0,32%). As for the large company, the average effect of common rules to include R&D-related expenditure into the production costs on the change of the future value of the tax base can be ne-glected. (5) The next simulation deals with the effect of common rules regarding provisions for pensions (Option E). With respect to accounting for pension liabilities, tax practice in most member states is in accor-dance with the provisions of CCTB Option E. Only the relevant tax provisions in Austria, Esto-nia, Germany and the Netherlands deviate from Option E which takes the IFRS as a point of ref-erence. In these four countries, therefore, the introduction of Option E would lead to a reduction of the future value of the tax base (see figure 18).57
57 See Section III, 2.2. for explanation and a detailed analysis.
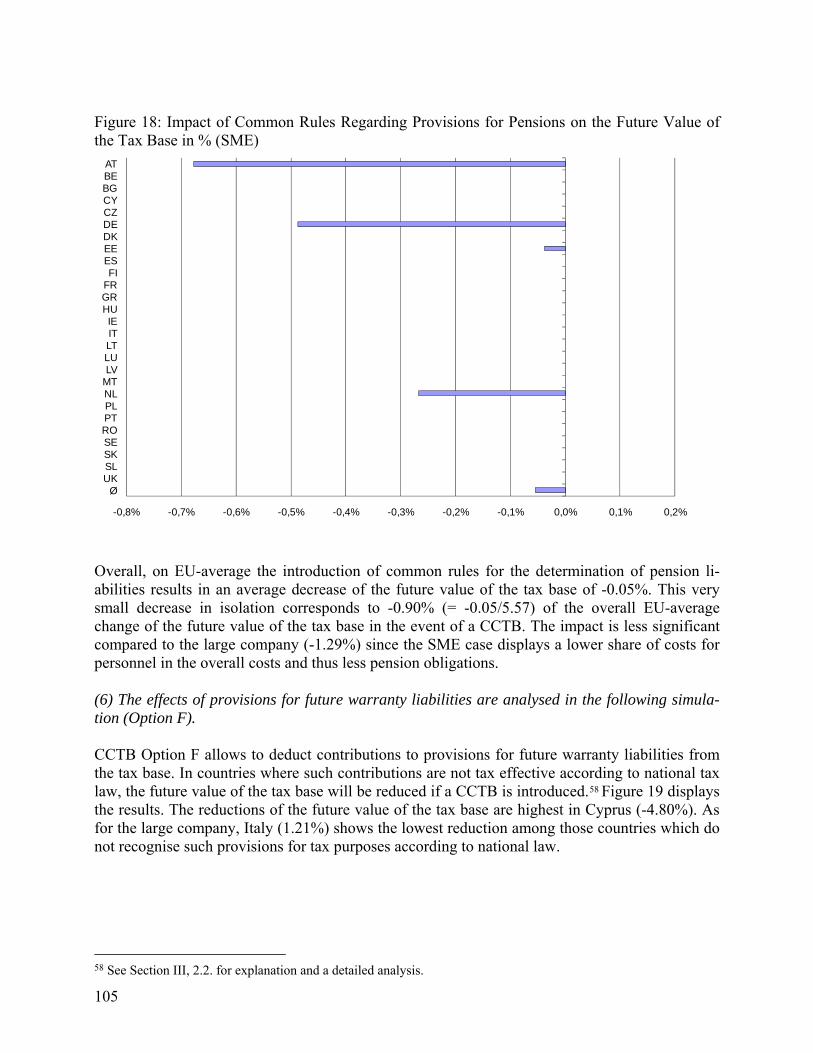
105
Figure 18: Impact of Common Rules Regarding Provisions for Pensions on the Future Value of the Tax Base in % (SME)
-0,8% -0,7% -0,6% -0,5% -0,4% -0,3% -0,2% -0,1% 0,0% 0,1% 0,2%
ATBEBGCYCZDEDKEEESFI
FRGRHUIEITLTLULV
MTNLPLPTROSESKSLUK
Ø
Overall, on EU-average the introduction of common rules for the determination of pension li-abilities results in an average decrease of the future value of the tax base of -0.05%. This very small decrease in isolation corresponds to -0.90% (= -0.05/5.57) of the overall EU-average change of the future value of the tax base in the event of a CCTB. The impact is less significant compared to the large company (-1.29%) since the SME case displays a lower share of costs for personnel in the overall costs and thus less pension obligations. (6) The effects of provisions for future warranty liabilities are analysed in the following simula-tion (Option F). CCTB Option F allows to deduct contributions to provisions for future warranty liabilities from the tax base. In countries where such contributions are not tax effective according to national tax law, the future value of the tax base will be reduced if a CCTB is introduced.58 Figure 19 displays the results. The reductions of the future value of the tax base are highest in Cyprus (-4.80%). As for the large company, Italy (1.21%) shows the lowest reduction among those countries which do not recognise such provisions for tax purposes according to national law.
58 See Section III, 2.2. for explanation and a detailed analysis.
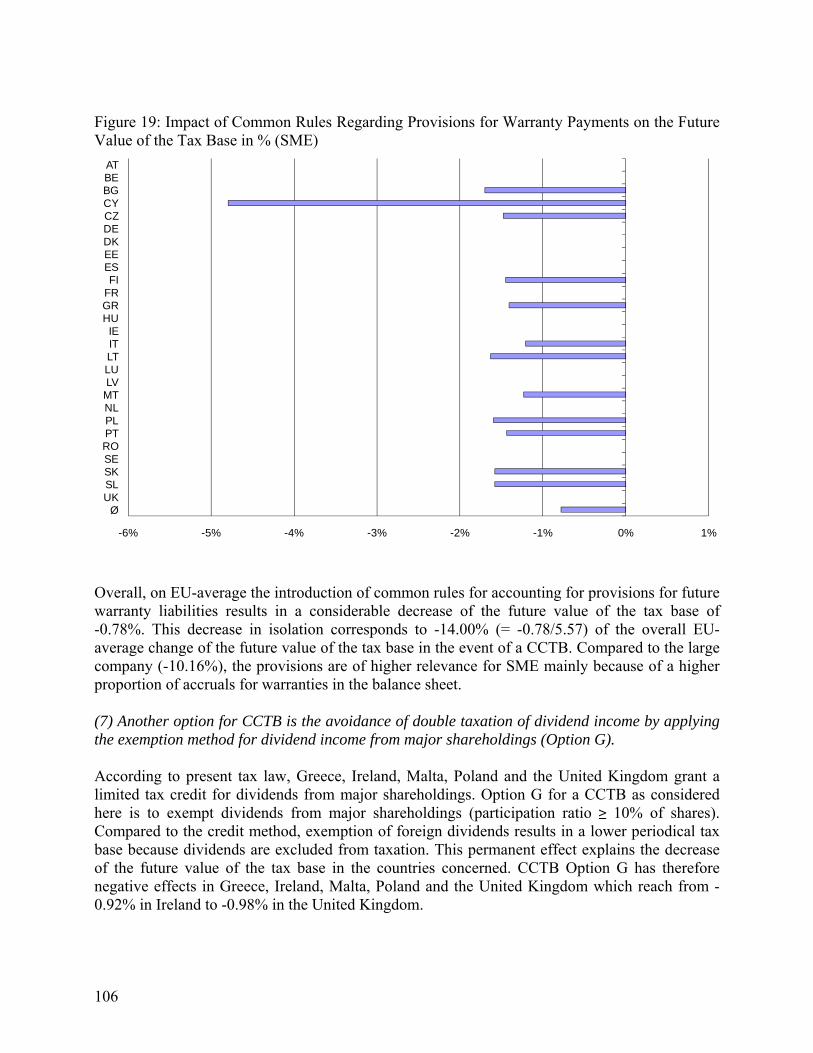
106
Figure 19: Impact of Common Rules Regarding Provisions for Warranty Payments on the Future Value of the Tax Base in % (SME)
-6% -5% -4% -3% -2% -1% 0% 1%
ATBEBGCYCZDEDKEEESFI
FRGRHU
IEITLTLULV
MTNLPLPTROSESKSLUK
Ø
Overall, on EU-average the introduction of common rules for accounting for provisions for future warranty liabilities results in a considerable decrease of the future value of the tax base of -0.78%. This decrease in isolation corresponds to -14.00% (= -0.78/5.57) of the overall EU-average change of the future value of the tax base in the event of a CCTB. Compared to the large company (-10.16%), the provisions are of higher relevance for SME mainly because of a higher proportion of accruals for warranties in the balance sheet. (7) Another option for CCTB is the avoidance of double taxation of dividend income by applying the exemption method for dividend income from major shareholdings (Option G). According to present tax law, Greece, Ireland, Malta, Poland and the United Kingdom grant a limited tax credit for dividends from major shareholdings. Option G for a CCTB as considered here is to exempt dividends from major shareholdings (participation ratio ≥ 10% of shares). Compared to the credit method, exemption of foreign dividends results in a lower periodical tax base because dividends are excluded from taxation. This permanent effect explains the decrease of the future value of the tax base in the countries concerned. CCTB Option G has therefore negative effects in Greece, Ireland, Malta, Poland and the United Kingdom which reach from -0.92% in Ireland to -0.98% in the United Kingdom.
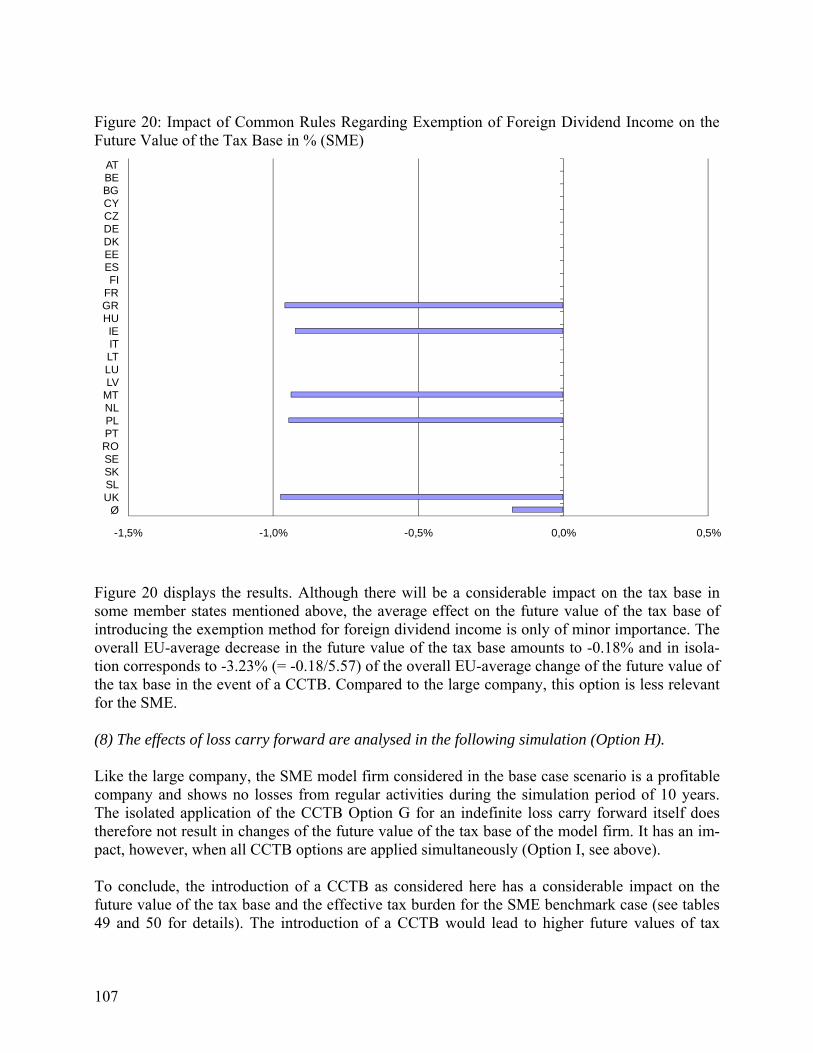
107
Figure 20: Impact of Common Rules Regarding Exemption of Foreign Dividend Income on the Future Value of the Tax Base in % (SME)
-1,5% -1,0% -0,5% 0,0% 0,5%
ATBEBGCYCZDEDKEEESFI
FRGRHUIEITLTLULV
MTNLPLPTROSESKSLUK
Ø
Figure 20 displays the results. Although there will be a considerable impact on the tax base in some member states mentioned above, the average effect on the future value of the tax base of introducing the exemption method for foreign dividend income is only of minor importance. The overall EU-average decrease in the future value of the tax base amounts to -0.18% and in isola-tion corresponds to -3.23% (= -0.18/5.57) of the overall EU-average change of the future value of the tax base in the event of a CCTB. Compared to the large company, this option is less relevant for the SME. (8) The effects of loss carry forward are analysed in the following simulation (Option H). Like the large company, the SME model firm considered in the base case scenario is a profitable company and shows no losses from regular activities during the simulation period of 10 years. The isolated application of the CCTB Option G for an indefinite loss carry forward itself does therefore not result in changes of the future value of the tax base of the model firm. It has an im-pact, however, when all CCTB options are applied simultaneously (Option I, see above). To conclude, the introduction of a CCTB as considered here has a considerable impact on the future value of the tax base and the effective tax burden for the SME benchmark case (see tables 49 and 50 for details). The introduction of a CCTB would lead to higher future values of tax
108
bases as well as to higher effective tax burdens. While the future value of tax base increases by 5.57%59 on average the effective tax burden increases by 4.45% on average. Countries affected most by the simulation of CCTB rules overall based on the two measures fu-ture value of the tax base and effective tax burden are Bulgaria (11.80%/9.38%), Greece (10.31%/9.20%), Latvia (10.42%/10.06%) and Lithuania (10.48%/8.12%). In case of Hungary the introduction of a CCTB leads to the highest increase in the future value of the tax base (15.43%) but only to a comparably small increase of the effective tax burden (1.85%) which is mainly caused by the extraordinary importance of additional taxes beside the corporate income tax. Cyprus is the only country which is affected negatively in both, future value of the tax base (-6.91%) and effective tax burden (-3.87%). In accordance to the large company the CCTB option which affects the future value of the tax base strongest is depreciation (A) which in isolation corresponds to 77.02% of the overall EU-average increase of the future value of the tax base. Countries affected strongest by CCTB depre-ciation rules are the Czech Republic (9.53%), Hungary (15.71%), Latvia (10.42%), Lithuania (10.60%) and Slovakia (9.48%). The CCTB option provision for future warranty liabilities (F) is again second concerning the importance for the future value of the tax base and explains -14.00% (-10.16% for the large company) of the overall EU-average increase. The reductions of the future value of the tax base are highest in Cyprus (-4.80%) and lowest in Italy (-1.21%). CCTB rules concerning the avoidance of double taxation (G) are third and explain on average 3.23% (7.58%) for the large company) of the average increase. CCTB Option G has negative effects in Greece (-0.96%), Ireland (-0.92%), Malta (-0.94%), Poland (-0.95%) and the United Kingdom (-0.98%). The option to choose weighted average cost (WAC) valuation for inventory (B) contributes 2.15% to the overall effect. In contrast to the above CCTB options, the common rules for the determination of the production costs (C) explain 0.36% of the overall increase and are negligible. The same holds true for option (D), which considers the inclusion of R&D-related costs in production costs, as well as for option (H). This option concerning the unlimited loss carry forward has no impact on the tax base when evaluated on isolation. It has an impact, however, if is applied together with other CCTB options (I). It has to be kept in mind that the above findings are relevant for an EU-average SME and cannot be generalised. In comparison to the large company the options (A – G) influence the future value of the tax base of the SME in the same direction. However, the weights of the factors determining effective tax burden differ slightly. While options A and F have a significantly higher impact on the change of the future value of the tax base in case of a SME, option G shows a significantly minor importance. The radar chart in figure 21 allows a comparison of the effects derived for the SME with the re-spective effects derived in section III part 2 for the large company. Therefore the radar chart illus-trates the impact on the future value of the tax base for the EU-27 large company and the SME that results from adopting the single options in isolation. The impact is measured as the propor-tion of the increase of the tax base resulting from each single option against the increase of the
59 Thereof an increase of 4.23% can be attributed to the EU-15 countries and an increase of 7.36% can be attributed to the EU-12 countries.
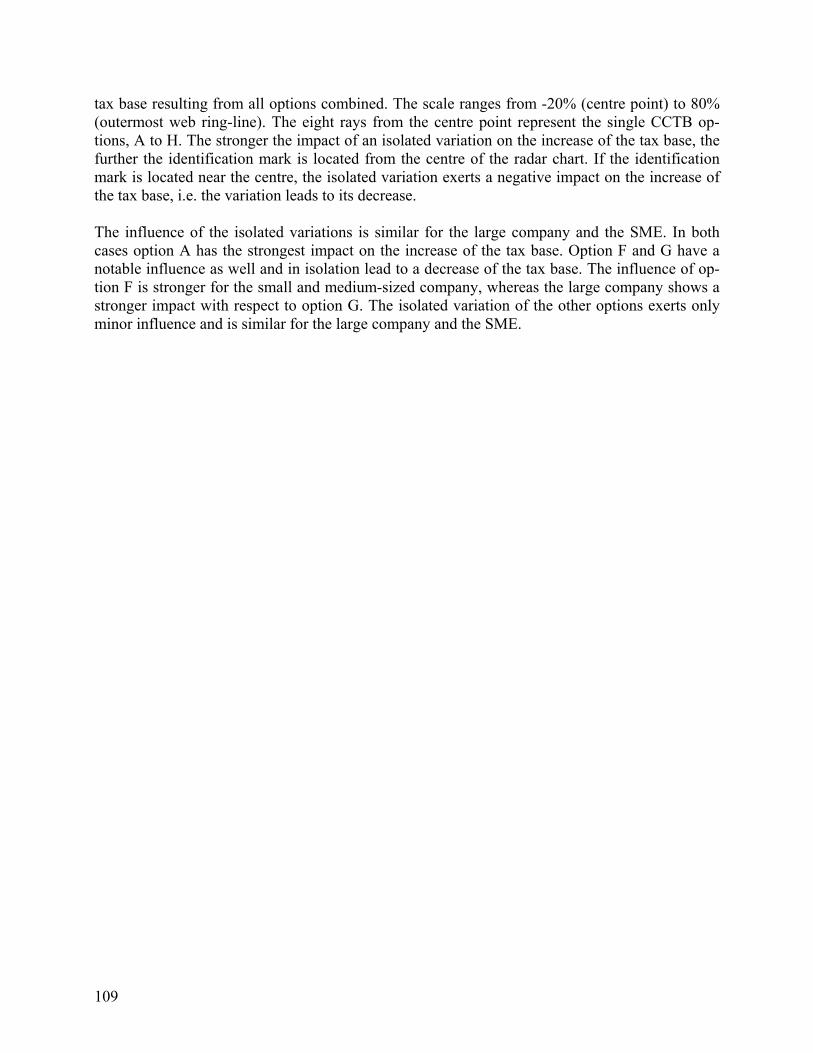
109
tax base resulting from all options combined. The scale ranges from -20% (centre point) to 80% (outermost web ring-line). The eight rays from the centre point represent the single CCTB op-tions, A to H. The stronger the impact of an isolated variation on the increase of the tax base, the further the identification mark is located from the centre of the radar chart. If the identification mark is located near the centre, the isolated variation exerts a negative impact on the increase of the tax base, i.e. the variation leads to its decrease. The influence of the isolated variations is similar for the large company and the SME. In both cases option A has the strongest impact on the increase of the tax base. Option F and G have a notable influence as well and in isolation lead to a decrease of the tax base. The influence of op-tion F is stronger for the small and medium-sized company, whereas the large company shows a stronger impact with respect to option G. The isolated variation of the other options exerts only minor influence and is similar for the large company and the SME.
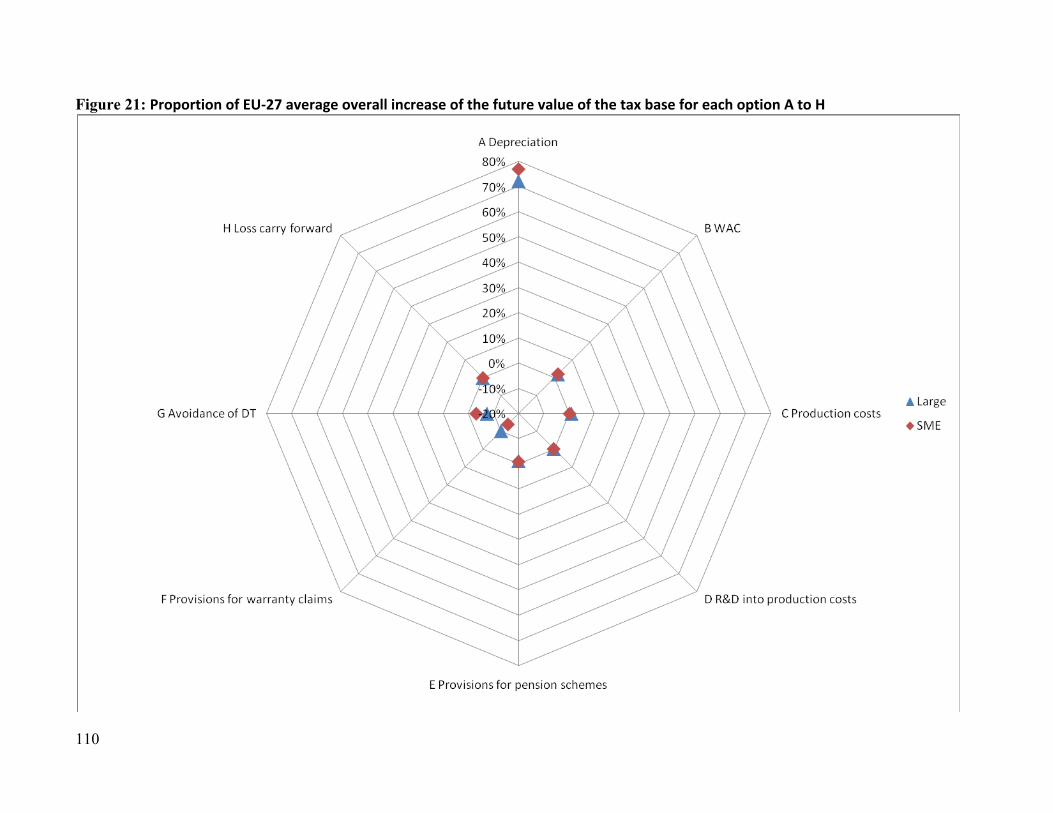
110
Figure 21: Proportion of EU-27 average overall increase of the future value of the tax base for each option A to H
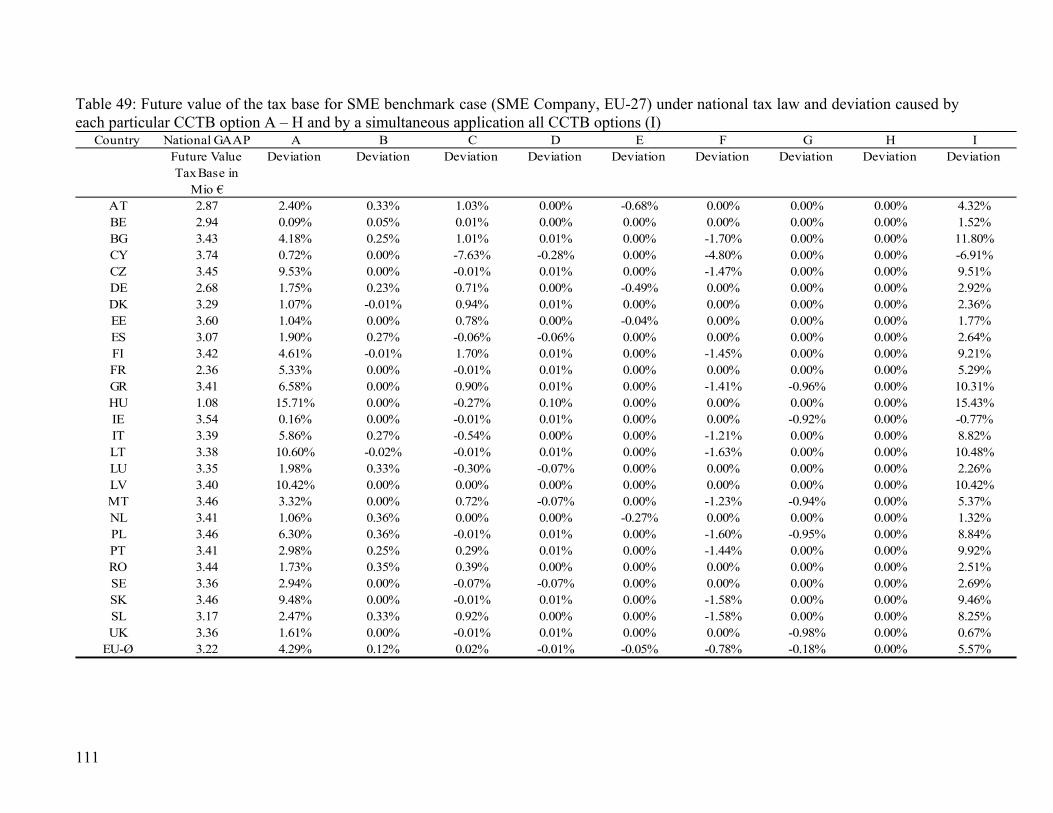
111
Table 49: Future value of the tax base for SME benchmark case (SME Company, EU-27) under national tax law and deviation caused by each particular CCTB option A – H and by a simultaneous application all CCTB options (I)
Country National GAAP A B C D E F G H IFuture Value Tax Base in
Mio €
Deviation Deviation Deviation Deviation Deviation Deviation Deviation Deviation Deviation
AT 2.87 2.40% 0.33% 1.03% 0.00% -0.68% 0.00% 0.00% 0.00% 4.32%BE 2.94 0.09% 0.05% 0.01% 0.00% 0.00% 0.00% 0.00% 0.00% 1.52%BG 3.43 4.18% 0.25% 1.01% 0.01% 0.00% -1.70% 0.00% 0.00% 11.80%CY 3.74 0.72% 0.00% -7.63% -0.28% 0.00% -4.80% 0.00% 0.00% -6.91%CZ 3.45 9.53% 0.00% -0.01% 0.01% 0.00% -1.47% 0.00% 0.00% 9.51%DE 2.68 1.75% 0.23% 0.71% 0.00% -0.49% 0.00% 0.00% 0.00% 2.92%DK 3.29 1.07% -0.01% 0.94% 0.01% 0.00% 0.00% 0.00% 0.00% 2.36%EE 3.60 1.04% 0.00% 0.78% 0.00% -0.04% 0.00% 0.00% 0.00% 1.77%ES 3.07 1.90% 0.27% -0.06% -0.06% 0.00% 0.00% 0.00% 0.00% 2.64%FI 3.42 4.61% -0.01% 1.70% 0.01% 0.00% -1.45% 0.00% 0.00% 9.21%FR 2.36 5.33% 0.00% -0.01% 0.01% 0.00% 0.00% 0.00% 0.00% 5.29%GR 3.41 6.58% 0.00% 0.90% 0.01% 0.00% -1.41% -0.96% 0.00% 10.31%HU 1.08 15.71% 0.00% -0.27% 0.10% 0.00% 0.00% 0.00% 0.00% 15.43%IE 3.54 0.16% 0.00% -0.01% 0.01% 0.00% 0.00% -0.92% 0.00% -0.77%IT 3.39 5.86% 0.27% -0.54% 0.00% 0.00% -1.21% 0.00% 0.00% 8.82%LT 3.38 10.60% -0.02% -0.01% 0.01% 0.00% -1.63% 0.00% 0.00% 10.48%LU 3.35 1.98% 0.33% -0.30% -0.07% 0.00% 0.00% 0.00% 0.00% 2.26%LV 3.40 10.42% 0.00% 0.00% 0.00% 0.00% 0.00% 0.00% 0.00% 10.42%MT 3.46 3.32% 0.00% 0.72% -0.07% 0.00% -1.23% -0.94% 0.00% 5.37%NL 3.41 1.06% 0.36% 0.00% 0.00% -0.27% 0.00% 0.00% 0.00% 1.32%PL 3.46 6.30% 0.36% -0.01% 0.01% 0.00% -1.60% -0.95% 0.00% 8.84%PT 3.41 2.98% 0.25% 0.29% 0.01% 0.00% -1.44% 0.00% 0.00% 9.92%RO 3.44 1.73% 0.35% 0.39% 0.00% 0.00% 0.00% 0.00% 0.00% 2.51%SE 3.36 2.94% 0.00% -0.07% -0.07% 0.00% 0.00% 0.00% 0.00% 2.69%SK 3.46 9.48% 0.00% -0.01% 0.01% 0.00% -1.58% 0.00% 0.00% 9.46%SL 3.17 2.47% 0.33% 0.92% 0.00% 0.00% -1.58% 0.00% 0.00% 8.25%UK 3.36 1.61% 0.00% -0.01% 0.01% 0.00% 0.00% -0.98% 0.00% 0.67%
EU-Ø 3.22 4.29% 0.12% 0.02% -0.01% -0.05% -0.78% -0.18% 0.00% 5.57%
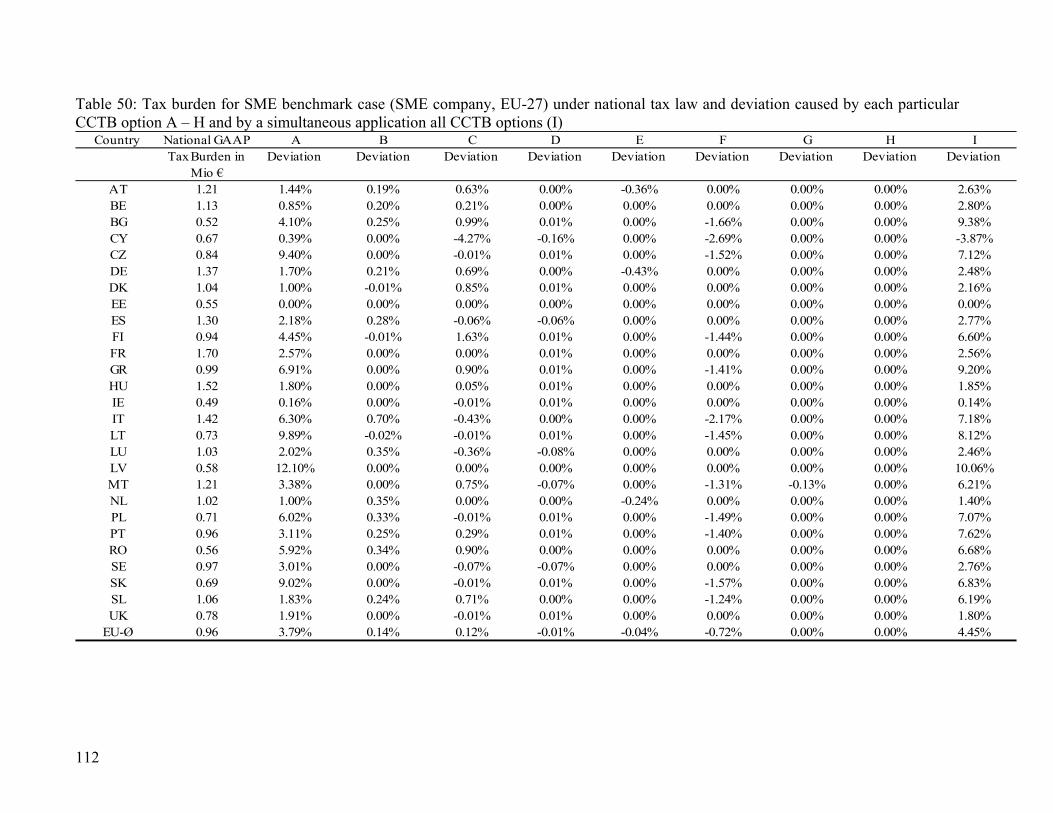
112
Table 50: Tax burden for SME benchmark case (SME company, EU-27) under national tax law and deviation caused by each particular CCTB option A – H and by a simultaneous application all CCTB options (I)
Country National GAAP A B C D E F G H ITax Burden in
Mio €Deviation Deviation Deviation Deviation Deviation Deviation Deviation Deviation Deviation
AT 1.21 1.44% 0.19% 0.63% 0.00% -0.36% 0.00% 0.00% 0.00% 2.63%BE 1.13 0.85% 0.20% 0.21% 0.00% 0.00% 0.00% 0.00% 0.00% 2.80%BG 0.52 4.10% 0.25% 0.99% 0.01% 0.00% -1.66% 0.00% 0.00% 9.38%CY 0.67 0.39% 0.00% -4.27% -0.16% 0.00% -2.69% 0.00% 0.00% -3.87%CZ 0.84 9.40% 0.00% -0.01% 0.01% 0.00% -1.52% 0.00% 0.00% 7.12%DE 1.37 1.70% 0.21% 0.69% 0.00% -0.43% 0.00% 0.00% 0.00% 2.48%DK 1.04 1.00% -0.01% 0.85% 0.01% 0.00% 0.00% 0.00% 0.00% 2.16%EE 0.55 0.00% 0.00% 0.00% 0.00% 0.00% 0.00% 0.00% 0.00% 0.00%ES 1.30 2.18% 0.28% -0.06% -0.06% 0.00% 0.00% 0.00% 0.00% 2.77%FI 0.94 4.45% -0.01% 1.63% 0.01% 0.00% -1.44% 0.00% 0.00% 6.60%FR 1.70 2.57% 0.00% 0.00% 0.01% 0.00% 0.00% 0.00% 0.00% 2.56%GR 0.99 6.91% 0.00% 0.90% 0.01% 0.00% -1.41% 0.00% 0.00% 9.20%HU 1.52 1.80% 0.00% 0.05% 0.01% 0.00% 0.00% 0.00% 0.00% 1.85%IE 0.49 0.16% 0.00% -0.01% 0.01% 0.00% 0.00% 0.00% 0.00% 0.14%IT 1.42 6.30% 0.70% -0.43% 0.00% 0.00% -2.17% 0.00% 0.00% 7.18%LT 0.73 9.89% -0.02% -0.01% 0.01% 0.00% -1.45% 0.00% 0.00% 8.12%LU 1.03 2.02% 0.35% -0.36% -0.08% 0.00% 0.00% 0.00% 0.00% 2.46%LV 0.58 12.10% 0.00% 0.00% 0.00% 0.00% 0.00% 0.00% 0.00% 10.06%MT 1.21 3.38% 0.00% 0.75% -0.07% 0.00% -1.31% -0.13% 0.00% 6.21%NL 1.02 1.00% 0.35% 0.00% 0.00% -0.24% 0.00% 0.00% 0.00% 1.40%PL 0.71 6.02% 0.33% -0.01% 0.01% 0.00% -1.49% 0.00% 0.00% 7.07%PT 0.96 3.11% 0.25% 0.29% 0.01% 0.00% -1.40% 0.00% 0.00% 7.62%RO 0.56 5.92% 0.34% 0.90% 0.00% 0.00% 0.00% 0.00% 0.00% 6.68%SE 0.97 3.01% 0.00% -0.07% -0.07% 0.00% 0.00% 0.00% 0.00% 2.76%SK 0.69 9.02% 0.00% -0.01% 0.01% 0.00% -1.57% 0.00% 0.00% 6.83%SL 1.06 1.83% 0.24% 0.71% 0.00% 0.00% -1.24% 0.00% 0.00% 6.19%UK 0.78 1.91% 0.00% -0.01% 0.01% 0.00% 0.00% 0.00% 0.00% 1.80%
EU-Ø 0.96 3.79% 0.14% 0.12% -0.01% -0.04% -0.72% 0.00% 0.00% 4.45%
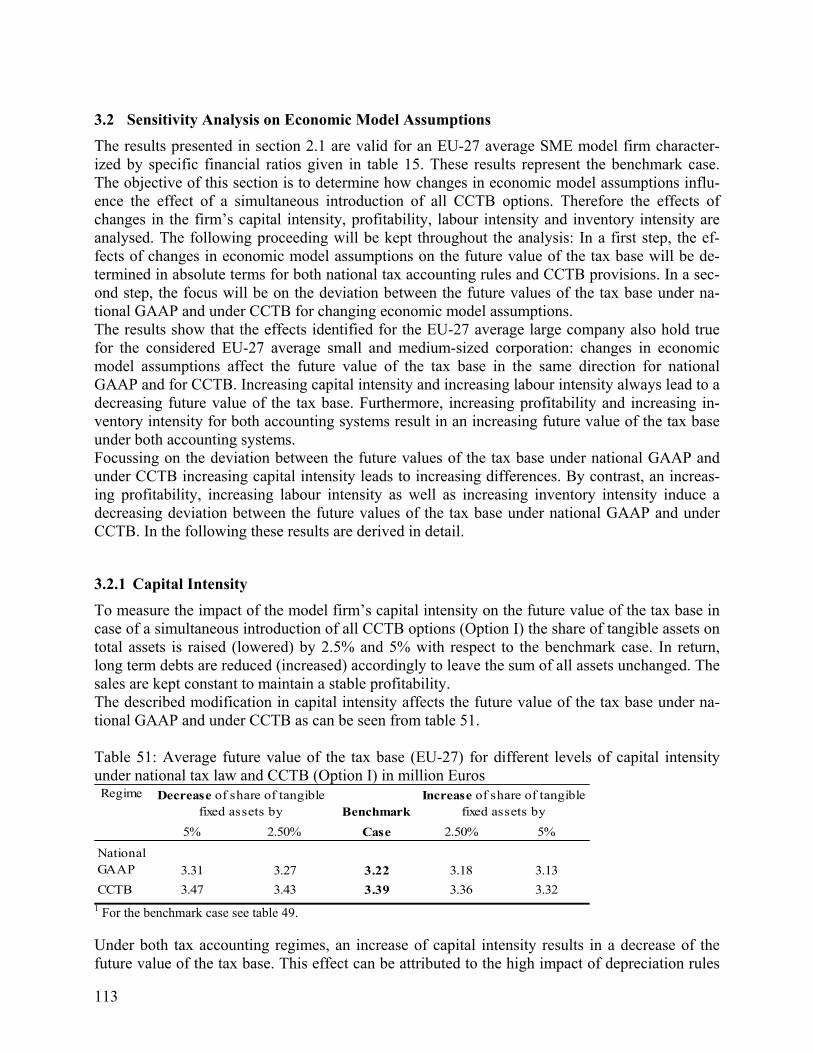
113
3.2 Sensitivity Analysis on Economic Model Assumptions
The results presented in section 2.1 are valid for an EU-27 average SME model firm character-ized by specific financial ratios given in table 15. These results represent the benchmark case. The objective of this section is to determine how changes in economic model assumptions influ-ence the effect of a simultaneous introduction of all CCTB options. Therefore the effects of changes in the firm’s capital intensity, profitability, labour intensity and inventory intensity are analysed. The following proceeding will be kept throughout the analysis: In a first step, the ef-fects of changes in economic model assumptions on the future value of the tax base will be de-termined in absolute terms for both national tax accounting rules and CCTB provisions. In a sec-ond step, the focus will be on the deviation between the future values of the tax base under na-tional GAAP and under CCTB for changing economic model assumptions. The results show that the effects identified for the EU-27 average large company also hold true for the considered EU-27 average small and medium-sized corporation: changes in economic model assumptions affect the future value of the tax base in the same direction for national GAAP and for CCTB. Increasing capital intensity and increasing labour intensity always lead to a decreasing future value of the tax base. Furthermore, increasing profitability and increasing in-ventory intensity for both accounting systems result in an increasing future value of the tax base under both accounting systems. Focussing on the deviation between the future values of the tax base under national GAAP and under CCTB increasing capital intensity leads to increasing differences. By contrast, an increas-ing profitability, increasing labour intensity as well as increasing inventory intensity induce a decreasing deviation between the future values of the tax base under national GAAP and under CCTB. In the following these results are derived in detail.
3.2.1 Capital Intensity
To measure the impact of the model firm’s capital intensity on the future value of the tax base in case of a simultaneous introduction of all CCTB options (Option I) the share of tangible assets on total assets is raised (lowered) by 2.5% and 5% with respect to the benchmark case. In return, long term debts are reduced (increased) accordingly to leave the sum of all assets unchanged. The sales are kept constant to maintain a stable profitability. The described modification in capital intensity affects the future value of the tax base under na-tional GAAP and under CCTB as can be seen from table 51. Table 51: Average future value of the tax base (EU-27) for different levels of capital intensity under national tax law and CCTB (Option I) in million Euros Regime
Benchmark
5% 2.50% Case 2.50% 5%
National GAAP 3.31 3.27 3.22 3.18 3.13
CCTB 3.47 3.43 3.39 3.36 3.32
Decrease of share of tangible fixed assets by
Increase of share of tangible fixed assets by
1 For the benchmark case see table 49. Under both tax accounting regimes, an increase of capital intensity results in a decrease of the future value of the tax base. This effect can be attributed to the high impact of depreciation rules
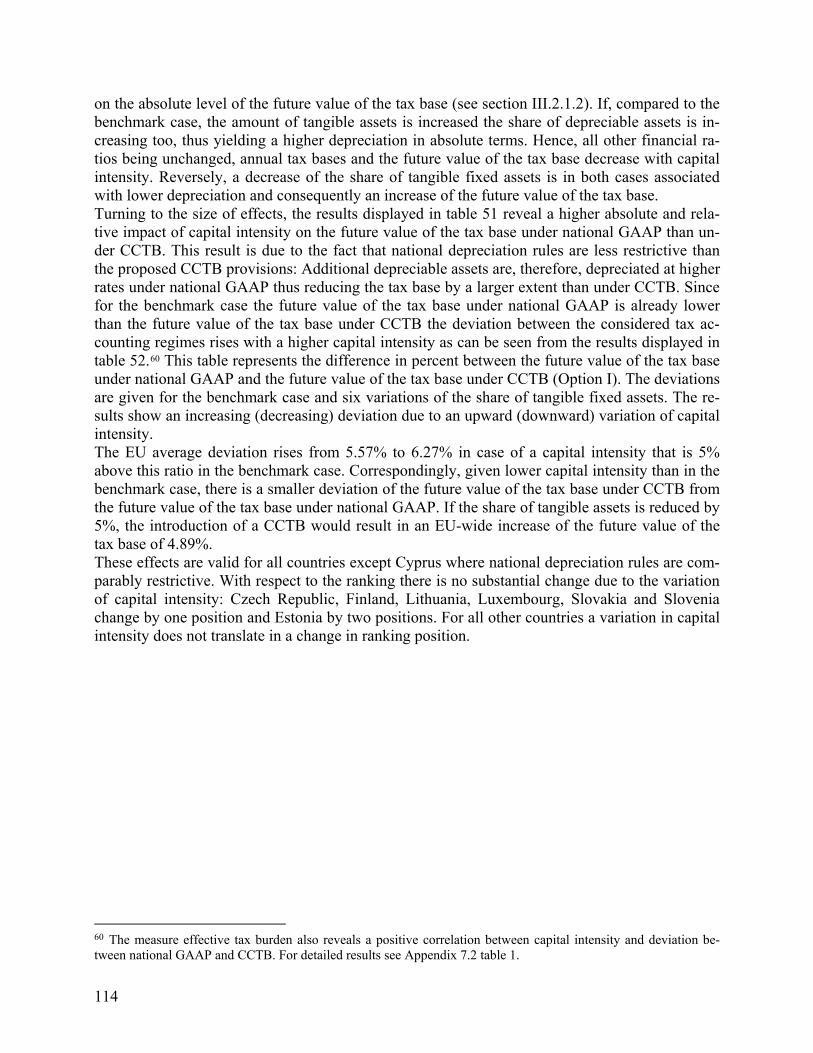
114
on the absolute level of the future value of the tax base (see section III.2.1.2). If, compared to the benchmark case, the amount of tangible assets is increased the share of depreciable assets is in-creasing too, thus yielding a higher depreciation in absolute terms. Hence, all other financial ra-tios being unchanged, annual tax bases and the future value of the tax base decrease with capital intensity. Reversely, a decrease of the share of tangible fixed assets is in both cases associated with lower depreciation and consequently an increase of the future value of the tax base. Turning to the size of effects, the results displayed in table 51 reveal a higher absolute and rela-tive impact of capital intensity on the future value of the tax base under national GAAP than un-der CCTB. This result is due to the fact that national depreciation rules are less restrictive than the proposed CCTB provisions: Additional depreciable assets are, therefore, depreciated at higher rates under national GAAP thus reducing the tax base by a larger extent than under CCTB. Since for the benchmark case the future value of the tax base under national GAAP is already lower than the future value of the tax base under CCTB the deviation between the considered tax ac-counting regimes rises with a higher capital intensity as can be seen from the results displayed in table 52.60 This table represents the difference in percent between the future value of the tax base under national GAAP and the future value of the tax base under CCTB (Option I). The deviations are given for the benchmark case and six variations of the share of tangible fixed assets. The re-sults show an increasing (decreasing) deviation due to an upward (downward) variation of capital intensity. The EU average deviation rises from 5.57% to 6.27% in case of a capital intensity that is 5% above this ratio in the benchmark case. Correspondingly, given lower capital intensity than in the benchmark case, there is a smaller deviation of the future value of the tax base under CCTB from the future value of the tax base under national GAAP. If the share of tangible assets is reduced by 5%, the introduction of a CCTB would result in an EU-wide increase of the future value of the tax base of 4.89%. These effects are valid for all countries except Cyprus where national depreciation rules are com-parably restrictive. With respect to the ranking there is no substantial change due to the variation of capital intensity: Czech Republic, Finland, Lithuania, Luxembourg, Slovakia and Slovenia change by one position and Estonia by two positions. For all other countries a variation in capital intensity does not translate in a change in ranking position.
60 The measure effective tax burden also reveals a positive correlation between capital intensity and deviation be-tween national GAAP and CCTB. For detailed results see Appendix 7.2 table 1.
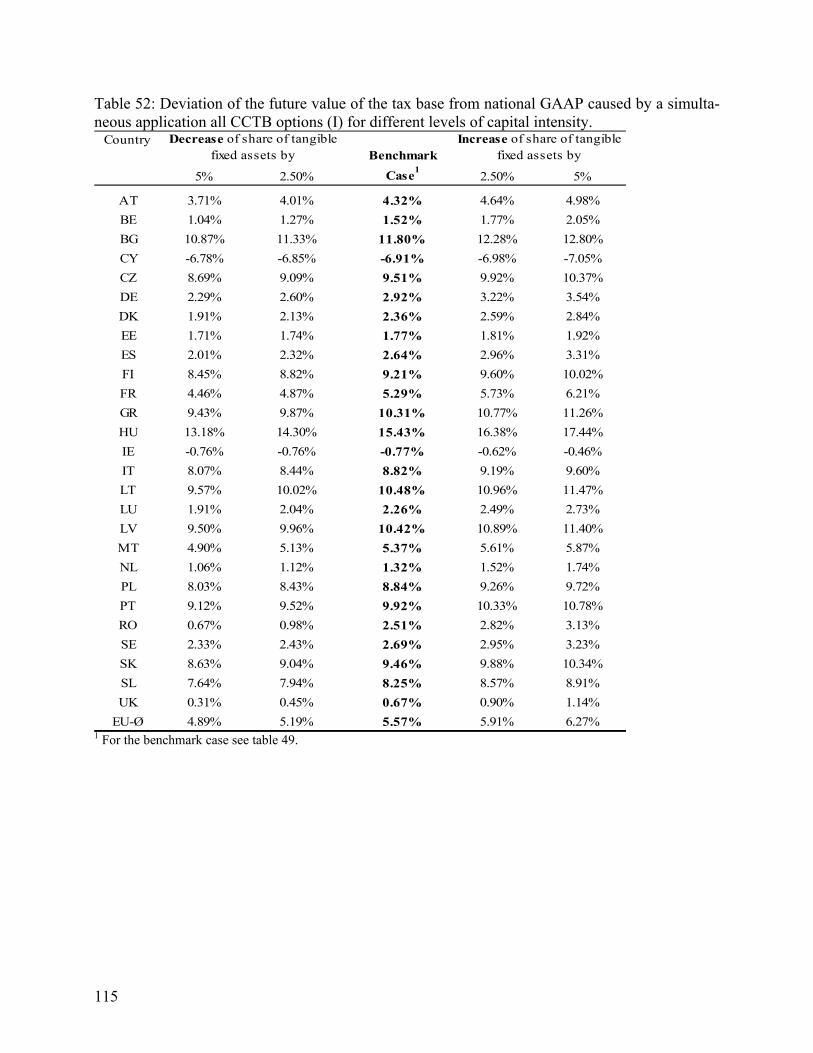
115
Table 52: Deviation of the future value of the tax base from national GAAP caused by a simulta-neous application all CCTB options (I) for different levels of capital intensity.
CountryBenchmark
5% 2.50% Case1
2.50% 5%
AT 3.71% 4.01% 4.32% 4.64% 4.98%
BE 1.04% 1.27% 1.52% 1.77% 2.05%
BG 10.87% 11.33% 11.80% 12.28% 12.80%
CY -6.78% -6.85% -6.91% -6.98% -7.05%
CZ 8.69% 9.09% 9.51% 9.92% 10.37%
DE 2.29% 2.60% 2.92% 3.22% 3.54%
DK 1.91% 2.13% 2.36% 2.59% 2.84%
EE 1.71% 1.74% 1.77% 1.81% 1.92%
ES 2.01% 2.32% 2.64% 2.96% 3.31%
FI 8.45% 8.82% 9.21% 9.60% 10.02%
FR 4.46% 4.87% 5.29% 5.73% 6.21%
GR 9.43% 9.87% 10.31% 10.77% 11.26%
HU 13.18% 14.30% 15.43% 16.38% 17.44%
IE -0.76% -0.76% -0.77% -0.62% -0.46%
IT 8.07% 8.44% 8.82% 9.19% 9.60%
LT 9.57% 10.02% 10.48% 10.96% 11.47%
LU 1.91% 2.04% 2.26% 2.49% 2.73%
LV 9.50% 9.96% 10.42% 10.89% 11.40%
MT 4.90% 5.13% 5.37% 5.61% 5.87%
NL 1.06% 1.12% 1.32% 1.52% 1.74%
PL 8.03% 8.43% 8.84% 9.26% 9.72%
PT 9.12% 9.52% 9.92% 10.33% 10.78%
RO 0.67% 0.98% 2.51% 2.82% 3.13%
SE 2.33% 2.43% 2.69% 2.95% 3.23%
SK 8.63% 9.04% 9.46% 9.88% 10.34%
SL 7.64% 7.94% 8.25% 8.57% 8.91%
UK 0.31% 0.45% 0.67% 0.90% 1.14%
EU-Ø 4.89% 5.19% 5.57% 5.91% 6.27%
Decrease of share of tangible fixed assets by
Increase of share of tangible fixed assets by
1 For the benchmark case see table 49.
116
3.2.2 Profitability
Apart from capital intensity the profitability is another determinant acting on the impact of intro-ducing a CCTB. To capture this impact, the financial ratio return on sales, as major indication of profitability, is modified with respect to the benchmark case by changing sales revenues. In the following, increases and decreases in return on sales by 10%, 20% and 30% are considered. The expenses being stable, a rise in sales revenues results in an increase of taxable profits and peri-odical liquidity and thus in a higher future value of the tax base. The tax base is lowered if sales revenues fall below sales revenues of the benchmark case. These findings are valid for national tax accounting rules and in case of a CCTB alike as can be seen from the results displayed in ta-ble 53. Table 53: Average future value of the tax base (EU-27) for different levels of profitability under national tax law and CCTB (Option I) in million Euros
Regime Benchmark
30% 20% 10% Case1
10% 20% 30%
National GAAP 2.33 2.63 2.92 3.22 3.54 3.83 4.15
CCTB 2.55 2.83 3.11 3.39 3.70 3.98 4.28
Increase of return on sales byDecrease of return on sales by
1 For the benchmark case see table 49. For the benchmark case and all variations the future value of the tax base is higher under CCTB than under national GAAP. However, in relative and absolute terms the increases (decreases) of the future value of the tax base due to varying profitability are less important under CCTB.61 As a result the deviation between the future value of the tax base under the proposed CCTB and under national GAAP decreases if profitability exceeds the ratio given for the benchmark case and vice versa. Table 54 displays the difference in percent between the future value of the tax base under na-tional GAAP and the future value of the tax base under CCTB (Option I). The deviations are given for the benchmark case and six variations of profitability. The results show a decreasing (increasing) deviation due to an upward (downward) variation of profitability.62 On average, companies that exceed the profitability of the benchmark case by 30% experience an enlargement of the future value of the tax base due to the simultaneous introduction of all CCTB options (Option I) of 3.21%. For the benchmark case, in contrast, the deviation from national GAAP amounts to 5.57%. Reversely, the effect of a CCTB increases on average to 11.34% if profitability is 30% lower than in the benchmark case. Therefore, as for the large company, the tax base effects are of a higher relevance in case of lower profitability.63
61 This effect is caused by hidden liabilities arising under the proposed CCTB and being devaluated in period 10. 62 The measure effective tax burden also reveals a negative correlation between profitability and deviation between national GAAP and CCTB. For detailed results see Appendix 7.2 table 2 63 The alternative measure effective tax burden also reveals a negative relationship between profitability intensity and deviation of the measure from national GAAP in case of a CCTB. For detailed results see Appendix 7.2 table 3.
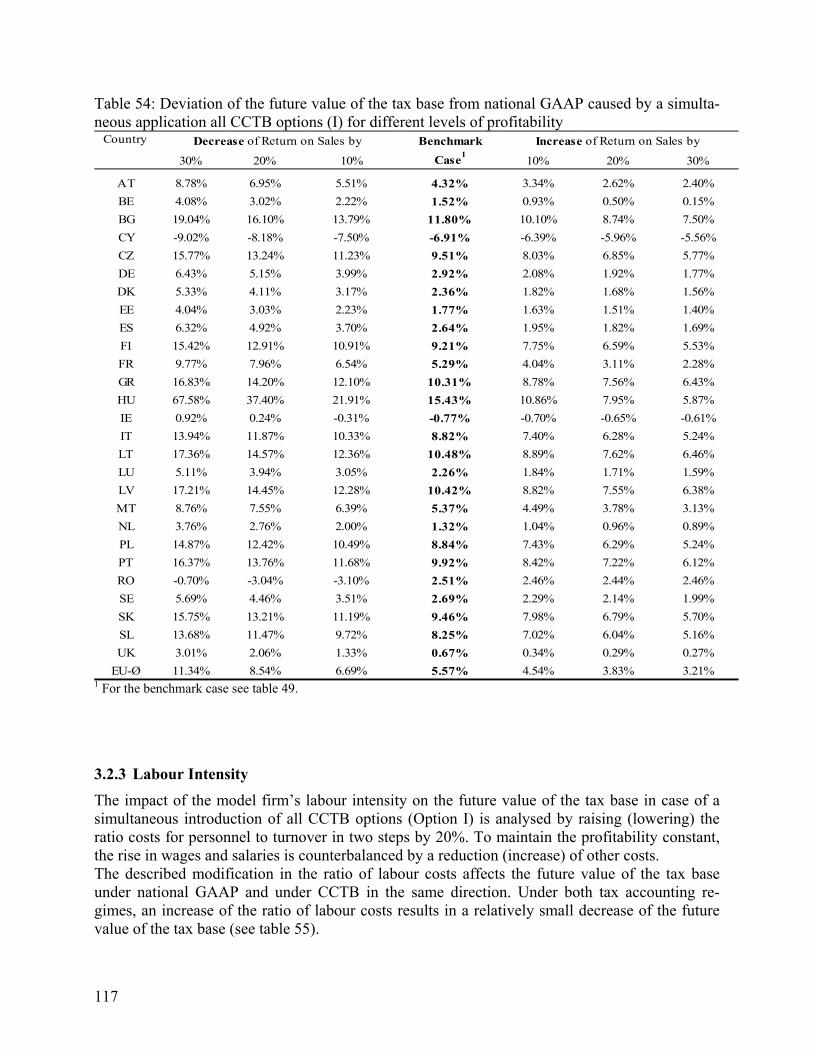
117
Table 54: Deviation of the future value of the tax base from national GAAP caused by a simulta-neous application all CCTB options (I) for different levels of profitability
Country Benchmark
30% 20% 10% Case1
10% 20% 30%
AT 8.78% 6.95% 5.51% 4.32% 3.34% 2.62% 2.40%
BE 4.08% 3.02% 2.22% 1.52% 0.93% 0.50% 0.15%
BG 19.04% 16.10% 13.79% 11.80% 10.10% 8.74% 7.50%
CY -9.02% -8.18% -7.50% -6.91% -6.39% -5.96% -5.56%
CZ 15.77% 13.24% 11.23% 9.51% 8.03% 6.85% 5.77%
DE 6.43% 5.15% 3.99% 2.92% 2.08% 1.92% 1.77%
DK 5.33% 4.11% 3.17% 2.36% 1.82% 1.68% 1.56%
EE 4.04% 3.03% 2.23% 1.77% 1.63% 1.51% 1.40%
ES 6.32% 4.92% 3.70% 2.64% 1.95% 1.82% 1.69%
FI 15.42% 12.91% 10.91% 9.21% 7.75% 6.59% 5.53%
FR 9.77% 7.96% 6.54% 5.29% 4.04% 3.11% 2.28%
GR 16.83% 14.20% 12.10% 10.31% 8.78% 7.56% 6.43%
HU 67.58% 37.40% 21.91% 15.43% 10.86% 7.95% 5.87%
IE 0.92% 0.24% -0.31% -0.77% -0.70% -0.65% -0.61%
IT 13.94% 11.87% 10.33% 8.82% 7.40% 6.28% 5.24%
LT 17.36% 14.57% 12.36% 10.48% 8.89% 7.62% 6.46%
LU 5.11% 3.94% 3.05% 2.26% 1.84% 1.71% 1.59%
LV 17.21% 14.45% 12.28% 10.42% 8.82% 7.55% 6.38%
MT 8.76% 7.55% 6.39% 5.37% 4.49% 3.78% 3.13%
NL 3.76% 2.76% 2.00% 1.32% 1.04% 0.96% 0.89%
PL 14.87% 12.42% 10.49% 8.84% 7.43% 6.29% 5.24%
PT 16.37% 13.76% 11.68% 9.92% 8.42% 7.22% 6.12%
RO -0.70% -3.04% -3.10% 2.51% 2.46% 2.44% 2.46%
SE 5.69% 4.46% 3.51% 2.69% 2.29% 2.14% 1.99%
SK 15.75% 13.21% 11.19% 9.46% 7.98% 6.79% 5.70%
SL 13.68% 11.47% 9.72% 8.25% 7.02% 6.04% 5.16%
UK 3.01% 2.06% 1.33% 0.67% 0.34% 0.29% 0.27%
EU-Ø 11.34% 8.54% 6.69% 5.57% 4.54% 3.83% 3.21%
Increase of Return on Sales byDecrease of Return on Sales by
1 For the benchmark case see table 49.
3.2.3 Labour Intensity
The impact of the model firm’s labour intensity on the future value of the tax base in case of a simultaneous introduction of all CCTB options (Option I) is analysed by raising (lowering) the ratio costs for personnel to turnover in two steps by 20%. To maintain the profitability constant, the rise in wages and salaries is counterbalanced by a reduction (increase) of other costs. The described modification in the ratio of labour costs affects the future value of the tax base under national GAAP and under CCTB in the same direction. Under both tax accounting re-gimes, an increase of the ratio of labour costs results in a relatively small decrease of the future value of the tax base (see table 55).
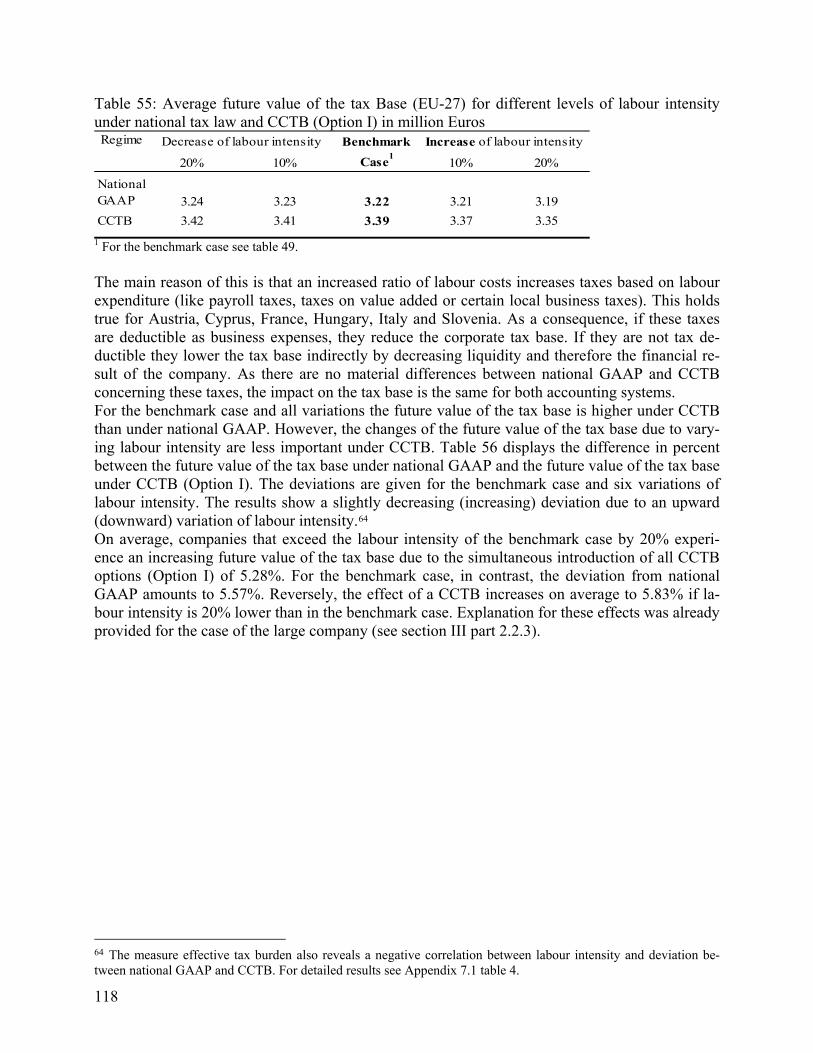
118
Table 55: Average future value of the tax Base (EU-27) for different levels of labour intensity under national tax law and CCTB (Option I) in million Euros Regime Benchmark
20% 10% Case1
10% 20%
National GAAP 3.24 3.23 3.22 3.21 3.19
CCTB 3.42 3.41 3.39 3.37 3.35
Increase of labour intensityDecrease of labour intensity
1 For the benchmark case see table 49. The main reason of this is that an increased ratio of labour costs increases taxes based on labour expenditure (like payroll taxes, taxes on value added or certain local business taxes). This holds true for Austria, Cyprus, France, Hungary, Italy and Slovenia. As a consequence, if these taxes are deductible as business expenses, they reduce the corporate tax base. If they are not tax de-ductible they lower the tax base indirectly by decreasing liquidity and therefore the financial re-sult of the company. As there are no material differences between national GAAP and CCTB concerning these taxes, the impact on the tax base is the same for both accounting systems. For the benchmark case and all variations the future value of the tax base is higher under CCTB than under national GAAP. However, the changes of the future value of the tax base due to vary-ing labour intensity are less important under CCTB. Table 56 displays the difference in percent between the future value of the tax base under national GAAP and the future value of the tax base under CCTB (Option I). The deviations are given for the benchmark case and six variations of labour intensity. The results show a slightly decreasing (increasing) deviation due to an upward (downward) variation of labour intensity.64 On average, companies that exceed the labour intensity of the benchmark case by 20% experi-ence an increasing future value of the tax base due to the simultaneous introduction of all CCTB options (Option I) of 5.28%. For the benchmark case, in contrast, the deviation from national GAAP amounts to 5.57%. Reversely, the effect of a CCTB increases on average to 5.83% if la-bour intensity is 20% lower than in the benchmark case. Explanation for these effects was already provided for the case of the large company (see section III part 2.2.3).
64 The measure effective tax burden also reveals a negative correlation between labour intensity and deviation be-tween national GAAP and CCTB. For detailed results see Appendix 7.1 table 4.
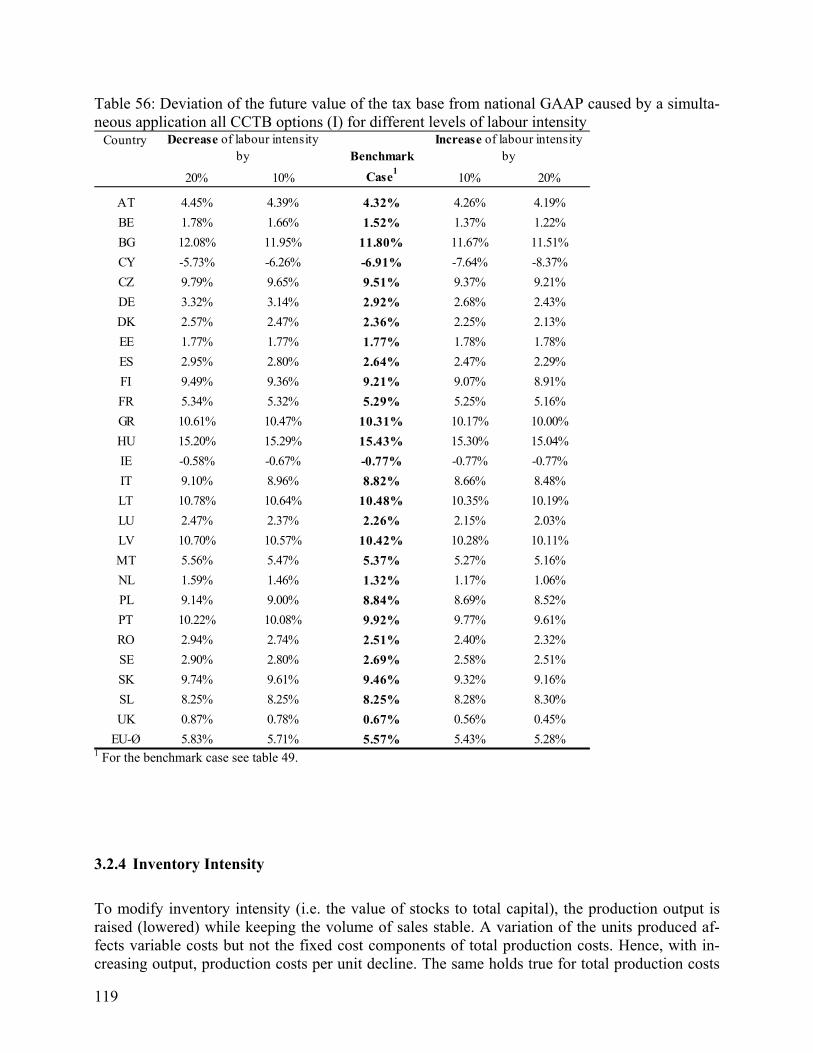
119
Table 56: Deviation of the future value of the tax base from national GAAP caused by a simulta-neous application all CCTB options (I) for different levels of labour intensity
CountryBenchmark
20% 10% Case1
10% 20%
AT 4.45% 4.39% 4.32% 4.26% 4.19%
BE 1.78% 1.66% 1.52% 1.37% 1.22%
BG 12.08% 11.95% 11.80% 11.67% 11.51%
CY -5.73% -6.26% -6.91% -7.64% -8.37%
CZ 9.79% 9.65% 9.51% 9.37% 9.21%
DE 3.32% 3.14% 2.92% 2.68% 2.43%
DK 2.57% 2.47% 2.36% 2.25% 2.13%
EE 1.77% 1.77% 1.77% 1.78% 1.78%
ES 2.95% 2.80% 2.64% 2.47% 2.29%
FI 9.49% 9.36% 9.21% 9.07% 8.91%
FR 5.34% 5.32% 5.29% 5.25% 5.16%
GR 10.61% 10.47% 10.31% 10.17% 10.00%
HU 15.20% 15.29% 15.43% 15.30% 15.04%
IE -0.58% -0.67% -0.77% -0.77% -0.77%
IT 9.10% 8.96% 8.82% 8.66% 8.48%
LT 10.78% 10.64% 10.48% 10.35% 10.19%
LU 2.47% 2.37% 2.26% 2.15% 2.03%
LV 10.70% 10.57% 10.42% 10.28% 10.11%
MT 5.56% 5.47% 5.37% 5.27% 5.16%
NL 1.59% 1.46% 1.32% 1.17% 1.06%
PL 9.14% 9.00% 8.84% 8.69% 8.52%
PT 10.22% 10.08% 9.92% 9.77% 9.61%
RO 2.94% 2.74% 2.51% 2.40% 2.32%
SE 2.90% 2.80% 2.69% 2.58% 2.51%
SK 9.74% 9.61% 9.46% 9.32% 9.16%
SL 8.25% 8.25% 8.25% 8.28% 8.30%
UK 0.87% 0.78% 0.67% 0.56% 0.45%
EU-Ø 5.83% 5.71% 5.57% 5.43% 5.28%
Decrease of labour intensity by
Increase of labour intensity by
1 For the benchmark case see table 49.
3.2.4 Inventory Intensity
To modify inventory intensity (i.e. the value of stocks to total capital), the production output is raised (lowered) while keeping the volume of sales stable. A variation of the units produced af-fects variable costs but not the fixed cost components of total production costs. Hence, with in-creasing output, production costs per unit decline. The same holds true for total production costs
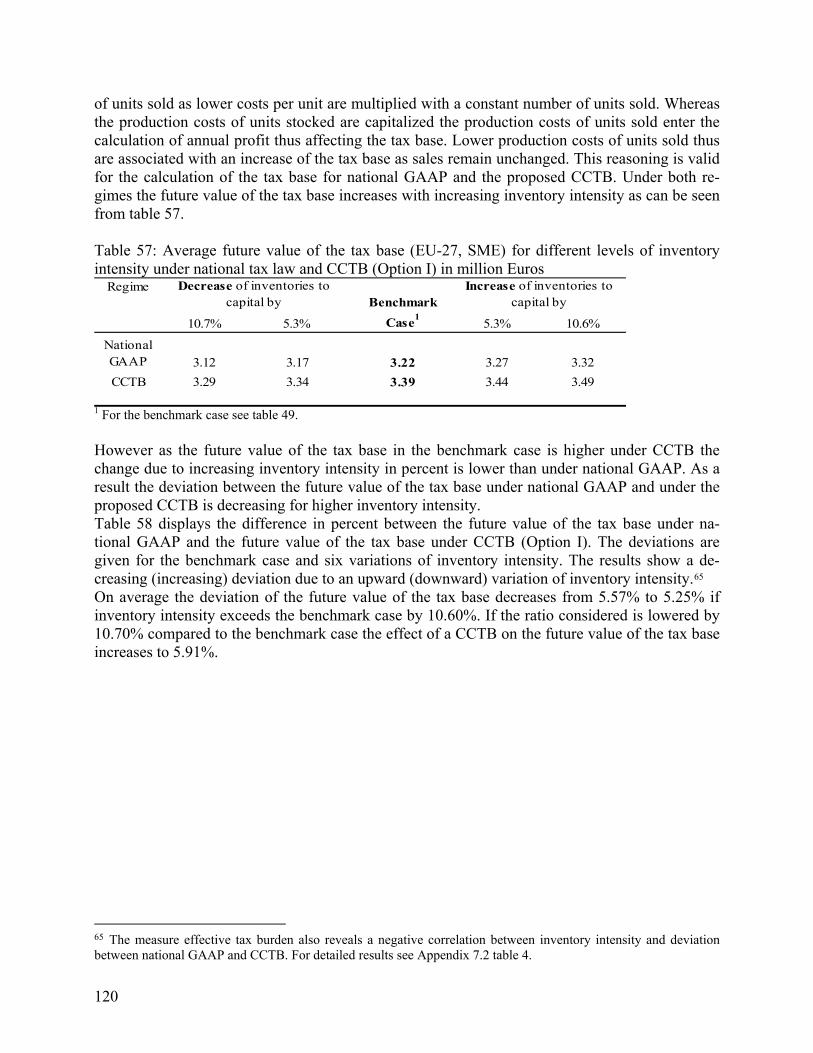
120
of units sold as lower costs per unit are multiplied with a constant number of units sold. Whereas the production costs of units stocked are capitalized the production costs of units sold enter the calculation of annual profit thus affecting the tax base. Lower production costs of units sold thus are associated with an increase of the tax base as sales remain unchanged. This reasoning is valid for the calculation of the tax base for national GAAP and the proposed CCTB. Under both re-gimes the future value of the tax base increases with increasing inventory intensity as can be seen from table 57. Table 57: Average future value of the tax base (EU-27, SME) for different levels of inventory intensity under national tax law and CCTB (Option I) in million Euros
RegimeBenchmark
10.7% 5.3% Case1
5.3% 10.6%
National GAAP 3.12 3.17 3.22 3.27 3.32
CCTB 3.29 3.34 3.39 3.44 3.49
Decrease of inventories to capital by
Increase of inventories to capital by
1 For the benchmark case see table 49. However as the future value of the tax base in the benchmark case is higher under CCTB the change due to increasing inventory intensity in percent is lower than under national GAAP. As a result the deviation between the future value of the tax base under national GAAP and under the proposed CCTB is decreasing for higher inventory intensity. Table 58 displays the difference in percent between the future value of the tax base under na-tional GAAP and the future value of the tax base under CCTB (Option I). The deviations are given for the benchmark case and six variations of inventory intensity. The results show a de-creasing (increasing) deviation due to an upward (downward) variation of inventory intensity.65 On average the deviation of the future value of the tax base decreases from 5.57% to 5.25% if inventory intensity exceeds the benchmark case by 10.60%. If the ratio considered is lowered by 10.70% compared to the benchmark case the effect of a CCTB on the future value of the tax base increases to 5.91%.
65 The measure effective tax burden also reveals a negative correlation between inventory intensity and deviation between national GAAP and CCTB. For detailed results see Appendix 7.2 table 4.
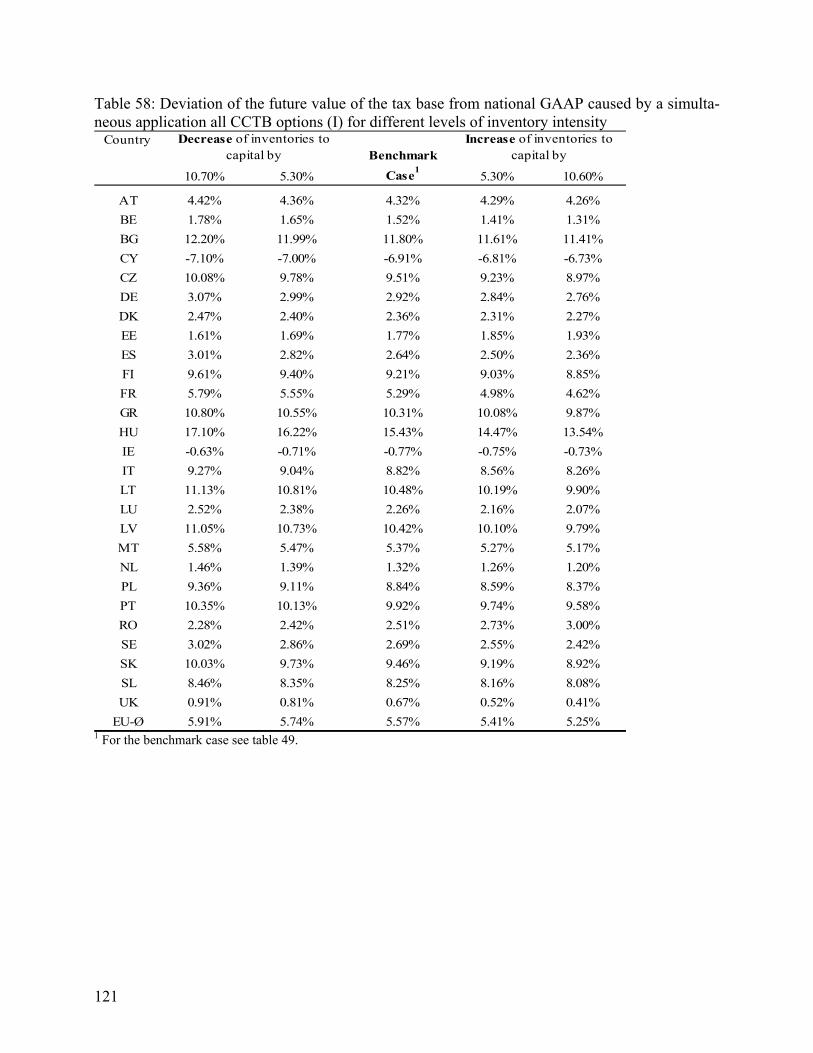
121
Table 58: Deviation of the future value of the tax base from national GAAP caused by a simulta-neous application all CCTB options (I) for different levels of inventory intensity
CountryBenchmark
10.70% 5.30% Case1
5.30% 10.60%
AT 4.42% 4.36% 4.32% 4.29% 4.26%
BE 1.78% 1.65% 1.52% 1.41% 1.31%
BG 12.20% 11.99% 11.80% 11.61% 11.41%
CY -7.10% -7.00% -6.91% -6.81% -6.73%
CZ 10.08% 9.78% 9.51% 9.23% 8.97%
DE 3.07% 2.99% 2.92% 2.84% 2.76%
DK 2.47% 2.40% 2.36% 2.31% 2.27%
EE 1.61% 1.69% 1.77% 1.85% 1.93%
ES 3.01% 2.82% 2.64% 2.50% 2.36%
FI 9.61% 9.40% 9.21% 9.03% 8.85%
FR 5.79% 5.55% 5.29% 4.98% 4.62%
GR 10.80% 10.55% 10.31% 10.08% 9.87%
HU 17.10% 16.22% 15.43% 14.47% 13.54%
IE -0.63% -0.71% -0.77% -0.75% -0.73%
IT 9.27% 9.04% 8.82% 8.56% 8.26%
LT 11.13% 10.81% 10.48% 10.19% 9.90%
LU 2.52% 2.38% 2.26% 2.16% 2.07%
LV 11.05% 10.73% 10.42% 10.10% 9.79%
MT 5.58% 5.47% 5.37% 5.27% 5.17%
NL 1.46% 1.39% 1.32% 1.26% 1.20%
PL 9.36% 9.11% 8.84% 8.59% 8.37%
PT 10.35% 10.13% 9.92% 9.74% 9.58%
RO 2.28% 2.42% 2.51% 2.73% 3.00%
SE 3.02% 2.86% 2.69% 2.55% 2.42%
SK 10.03% 9.73% 9.46% 9.19% 8.92%
SL 8.46% 8.35% 8.25% 8.16% 8.08%
UK 0.91% 0.81% 0.67% 0.52% 0.41%
EU-Ø 5.91% 5.74% 5.57% 5.41% 5.25%
Decrease of inventories to capital by
Increase of inventories to capital by
1 For the benchmark case see table 49.
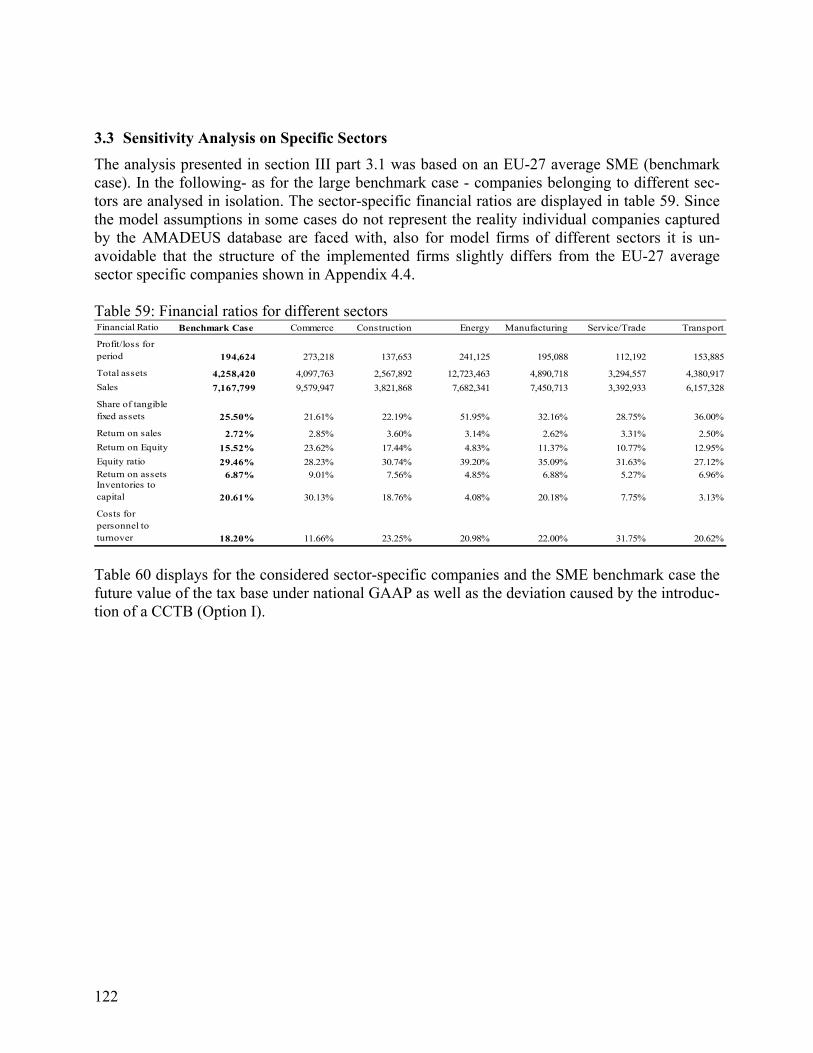
122
3.3 Sensitivity Analysis on Specific Sectors
The analysis presented in section III part 3.1 was based on an EU-27 average SME (benchmark case). In the following- as for the large benchmark case - companies belonging to different sec-tors are analysed in isolation. The sector-specific financial ratios are displayed in table 59. Since the model assumptions in some cases do not represent the reality individual companies captured by the AMADEUS database are faced with, also for model firms of different sectors it is un-avoidable that the structure of the implemented firms slightly differs from the EU-27 average sector specific companies shown in Appendix 4.4. Table 59: Financial ratios for different sectors Financial Ratio Benchmark Case Commerce Construction Energy Manufacturing Service/Trade Transport
Profit/loss for period 194,624 273,218 137,653 241,125 195,088 112,192 153,885
Total assets 4,258,420 4,097,763 2,567,892 12,723,463 4,890,718 3,294,557 4,380,917
Sales 7,167,799 9,579,947 3,821,868 7,682,341 7,450,713 3,392,933 6,157,328
Share of tangible fixed assets 25.50% 21.61% 22.19% 51.95% 32.16% 28.75% 36.00%
Return on sales 2.72% 2.85% 3.60% 3.14% 2.62% 3.31% 2.50%
Return on Equity 15.52% 23.62% 17.44% 4.83% 11.37% 10.77% 12.95%
Equity ratio 29.46% 28.23% 30.74% 39.20% 35.09% 31.63% 27.12%Return on assets 6.87% 9.01% 7.56% 4.85% 6.88% 5.27% 6.96%Inventories to capital 20.61% 30.13% 18.76% 4.08% 20.18% 7.75% 3.13%
Costs for personnel to turnover 18.20% 11.66% 23.25% 20.98% 22.00% 31.75% 20.62%
Table 60 displays for the considered sector-specific companies and the SME benchmark case the future value of the tax base under national GAAP as well as the deviation caused by the introduc-tion of a CCTB (Option I).
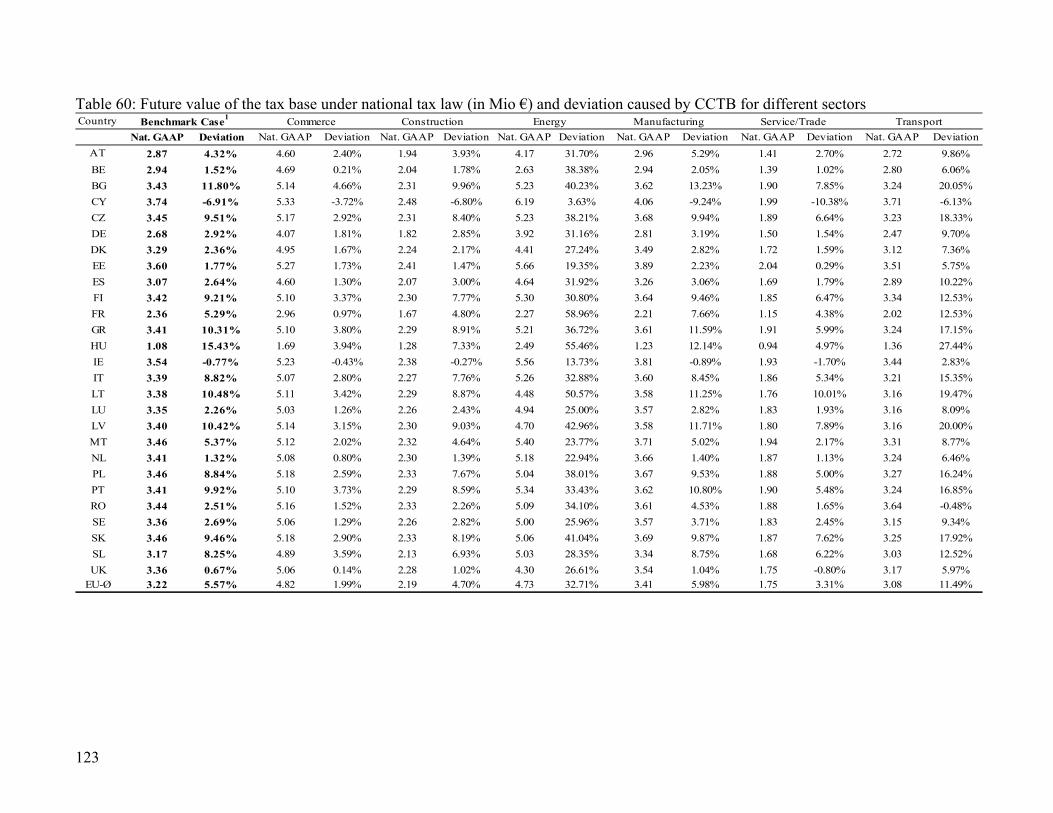
123
Table 60: Future value of the tax base under national tax law (in Mio €) and deviation caused by CCTB for different sectors Country
Nat. GAAP Deviation Nat. GAAP Deviation Nat. GAAP Deviation Nat. GAAP Deviation Nat. GAAP Deviation Nat. GAAP Deviation Nat. GAAP Deviation
AT 2.87 4.32% 4.60 2.40% 1.94 3.93% 4.17 31.70% 2.96 5.29% 1.41 2.70% 2.72 9.86%
BE 2.94 1.52% 4.69 0.21% 2.04 1.78% 2.63 38.38% 2.94 2.05% 1.39 1.02% 2.80 6.06%
BG 3.43 11.80% 5.14 4.66% 2.31 9.96% 5.23 40.23% 3.62 13.23% 1.90 7.85% 3.24 20.05%
CY 3.74 -6.91% 5.33 -3.72% 2.48 -6.80% 6.19 3.63% 4.06 -9.24% 1.99 -10.38% 3.71 -6.13%
CZ 3.45 9.51% 5.17 2.92% 2.31 8.40% 5.23 38.21% 3.68 9.94% 1.89 6.64% 3.23 18.33%
DE 2.68 2.92% 4.07 1.81% 1.82 2.85% 3.92 31.16% 2.81 3.19% 1.50 1.54% 2.47 9.70%
DK 3.29 2.36% 4.95 1.67% 2.24 2.17% 4.41 27.24% 3.49 2.82% 1.72 1.59% 3.12 7.36%
EE 3.60 1.77% 5.27 1.73% 2.41 1.47% 5.66 19.35% 3.89 2.23% 2.04 0.29% 3.51 5.75%
ES 3.07 2.64% 4.60 1.30% 2.07 3.00% 4.64 31.92% 3.26 3.06% 1.69 1.79% 2.89 10.22%
FI 3.42 9.21% 5.10 3.37% 2.30 7.77% 5.30 30.80% 3.64 9.46% 1.85 6.47% 3.34 12.53%
FR 2.36 5.29% 2.96 0.97% 1.67 4.80% 2.27 58.96% 2.21 7.66% 1.15 4.38% 2.02 12.53%
GR 3.41 10.31% 5.10 3.80% 2.29 8.91% 5.21 36.72% 3.61 11.59% 1.91 5.99% 3.24 17.15%
HU 1.08 15.43% 1.69 3.94% 1.28 7.33% 2.49 55.46% 1.23 12.14% 0.94 4.97% 1.36 27.44%
IE 3.54 -0.77% 5.23 -0.43% 2.38 -0.27% 5.56 13.73% 3.81 -0.89% 1.93 -1.70% 3.44 2.83%
IT 3.39 8.82% 5.07 2.80% 2.27 7.76% 5.26 32.88% 3.60 8.45% 1.86 5.34% 3.21 15.35%
LT 3.38 10.48% 5.11 3.42% 2.29 8.87% 4.48 50.57% 3.58 11.25% 1.76 10.01% 3.16 19.47%
LU 3.35 2.26% 5.03 1.26% 2.26 2.43% 4.94 25.00% 3.57 2.82% 1.83 1.93% 3.16 8.09%
LV 3.40 10.42% 5.14 3.15% 2.30 9.03% 4.70 42.96% 3.58 11.71% 1.80 7.89% 3.16 20.00%
MT 3.46 5.37% 5.12 2.02% 2.32 4.64% 5.40 23.77% 3.71 5.02% 1.94 2.17% 3.31 8.77%
NL 3.41 1.32% 5.08 0.80% 2.30 1.39% 5.18 22.94% 3.66 1.40% 1.87 1.13% 3.24 6.46%
PL 3.46 8.84% 5.18 2.59% 2.33 7.67% 5.04 38.01% 3.67 9.53% 1.88 5.00% 3.27 16.24%
PT 3.41 9.92% 5.10 3.73% 2.29 8.59% 5.34 33.43% 3.62 10.80% 1.90 5.48% 3.24 16.85%
RO 3.44 2.51% 5.16 1.52% 2.33 2.26% 5.09 34.10% 3.61 4.53% 1.88 1.65% 3.64 -0.48%
SE 3.36 2.69% 5.06 1.29% 2.26 2.82% 5.00 25.96% 3.57 3.71% 1.83 2.45% 3.15 9.34%
SK 3.46 9.46% 5.18 2.90% 2.33 8.19% 5.06 41.04% 3.69 9.87% 1.87 7.62% 3.25 17.92%
SL 3.17 8.25% 4.89 3.59% 2.13 6.93% 5.03 28.35% 3.34 8.75% 1.68 6.22% 3.03 12.52%
UK 3.36 0.67% 5.06 0.14% 2.28 1.02% 4.30 26.61% 3.54 1.04% 1.75 -0.80% 3.17 5.97%
EU-Ø 3.22 5.57% 4.82 1.99% 2.19 4.70% 4.73 32.71% 3.41 5.98% 1.75 3.31% 3.08 11.49%
TransportConstruction EnergyBenchmark Case1
Commerce Manufacturing Service/Trade
124
Commerce Table 59 shows higher profits for the average company representing the commerce sector than for the benchmark case. As a result the future value of the tax base is comparably higher for the average commerce company (see table 60). In all countries except Cyprus and Ireland the introduction of a CCTB results in an increase of the future value of the tax base. On average the increase amounts to 1.99% compared to 5.57% in the benchmark case. Thus the impact of a CCTB for the considered company in the commerce sector is much lower than in the benchmark case. This result can be attributed to - compared to the benchmark case – lower capital intensity, higher profitability and higher in-ventory intensity of the company belonging to the commerce sector. The described effect is compensated to a small extent by lower labour intensity.66 Construction As indicated in table 59 the small model firm representing the construction sector gains con-siderably lower annual profits than the benchmark case. Consequently, the future value of the tax base is below the benchmark case when national GAAP is applied (see table 60). The in-troduction of the proposed CCTB results in an increase of the future value of the tax base in all countries except for Cyprus and Ireland. With an average increase of 4.70% the tax base broadening effect for a small and medium-sized average company of the construction sector is smaller than for the benchmark case model firm (5.57%). The observed result can be ex-plained by the – compared to the benchmark case – lower capital intensity, higher profitability and higher labour intensity. The described effect is compensated to some extent by lower in-ventory intensity.67 Energy The average company representing the energy sector yields higher profits compared to the benchmark case. Due to the high annual profits, the level of the future value of the tax base under national GAAP is higher than in the benchmark case (see tables 59, 60). The introduc-tion of the proposed CCTB results in an increase of the future value of the tax base in all countries. On average the increase amounts to 32.71%. Taking into account that the future value of the tax base under national GAAP already is at a high level, the strong relative in-crease is associated with a particular high absolute increase. Above all, this result can be at-tributed to the – compared to the benchmark case – higher capital intensity of the company belonging to the energy sector. This effect is strengthened by the lower inventory intensity but compensated to a certain extent by the higher profitability and labour intensity.68 Manufacturing The average small and medium-sized company representing the manufacturing sector yields higher profits than the benchmark company (see table 59). Hence, compared to the benchmark case, the future value of the tax base under national GAAP is higher for the manufacturing sector (see table 60). In all countries except Cyprus and Ireland the introduction of a CCTB results in an increase of the future value of the tax base. On average the future value of the tax base increases by 5.98% in the event of a CCTB against an increase of 3.22% in the bench-mark case. The observed result can be explained by the – compared to the benchmark case –
66 The results for the measure effective tax burden are displayed in Appendix 8 table 2 and confirm the conclu-sion for an average small company representing the commerce sector. 67 The results for the measure effective tax burden are displayed in Appendix 8 table 2 and confirm the conclu-sion for an average small company representing the construction sector. 68 The results for the measure effective tax burden are displayed Appendix 8 table 2 and confirm the conclusion for an average small company representing the energy sector.
125
higher capital intensity and lower profitability. The described effect is slightly weakened by higher labour intensity.69 Service/Trade Compared to the average small and medium-sized benchmark company the financial ratios displayed in table 59 show lower profits for the average company representing the service sector. Therefore the future value of the tax base under national GAAP as displayed in table 60 is considerably lower than in the benchmark case. In all countries, apart from Cyprus and Ireland, the introduction of the proposed CCTB leads to an increase of the future value of the tax base. On average the increase of the future value of the tax base amounts to 3.31% thus falling below the respective increase for the benchmark case. This result can be attributed to – compared to the benchmark case - higher profitability and higher labour intensity. Yet, the described effect is partially compensated by an opposite effect induced by lower capital inten-sity and higher labour intensity compared to the benchmark case.70 Transport Compared to the benchmark case, the transport sector yields lower annual profits and hence a lower level of the future value of the tax base when national GAAP is applied. In all countries except Cyprus and Romania the introduction of a CCTB results in an increase of the future value of the tax base. On average the future value of the tax base increases by 11.49% in the event of a CCTB. Above all, the effect can be explained by the – compared to the benchmark case – higher capital intensity, lower profitability and lower inventory intensity. The de-scribed effect is only slightly compensated by higher labour intensity.71 Conclusion The main findings for the sensitivity analysis carried out for sector-specific small model com-panies can be summarised as follows: - Taking EU-average, as for the large sector-specific model companies, the future value of
the tax base increases in all sectors in the event of the proposed CCTB. - Again, there is considerable but – compared to the large sector-specific model companies
– less variation among sectors in the increases of the future value of the tax base. The in-creases vary between 1.99% in the commerce sector and 32.71% in the energy sector.
- In case of the manufacturing and transport sector the average increases of the future value of the tax base exceed the increase for the benchmark company.
- As for the benchmark company, it turns out that capital intensity and thus the impact of differing depreciation rules in the event of a CCTB is the most relevant factor explaining the increase of the future value of the tax base.
69 The results for the measure effective tax burden are displayed in Appendix 8 table 2 and confirm the conclu-sion for an average small company representing the manufacturing sector. 70 The results for the measure effective tax burden are displayed in Appendix 8 table 2 and confirm the conclu-sion for an average small company representing the service/trade sector. 71 The results for the measure effective tax burden are displayed in Appendix 6 table 8 and confirm the conclu-sion for an average small company representing the transport sector.
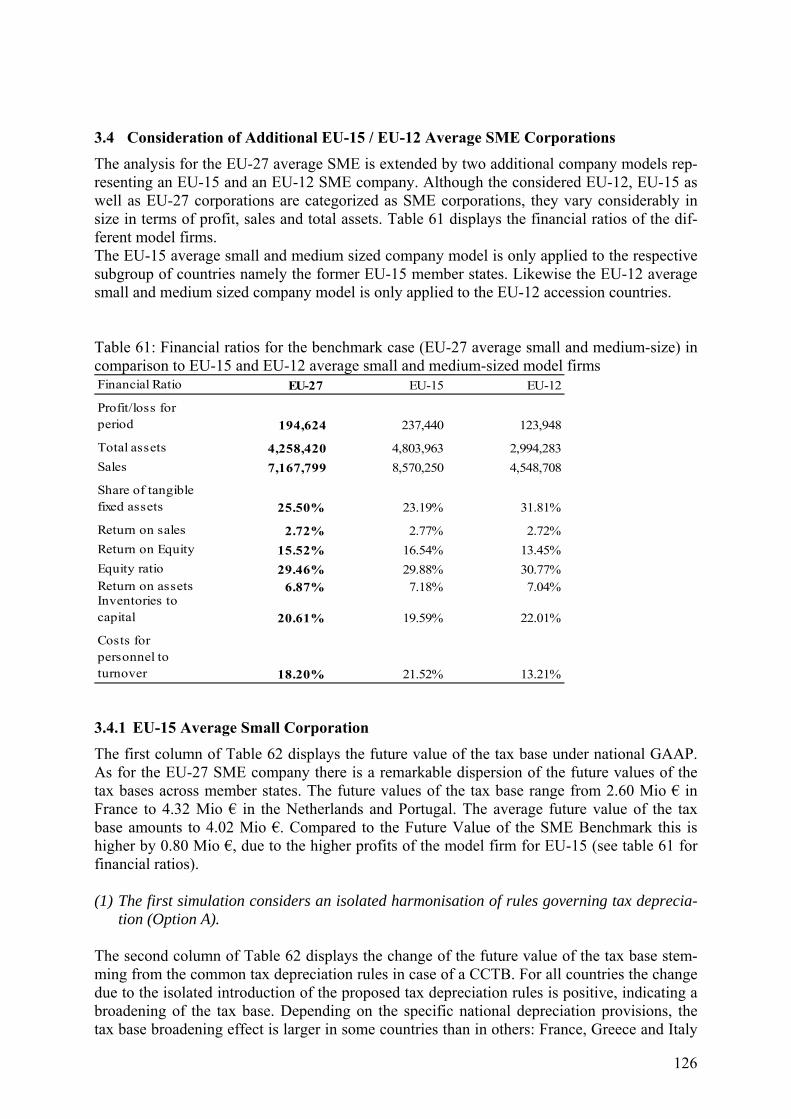
126
3.4 Consideration of Additional EU-15 / EU-12 Average SME Corporations
The analysis for the EU-27 average SME is extended by two additional company models rep-resenting an EU-15 and an EU-12 SME company. Although the considered EU-12, EU-15 as well as EU-27 corporations are categorized as SME corporations, they vary considerably in size in terms of profit, sales and total assets. Table 61 displays the financial ratios of the dif-ferent model firms. The EU-15 average small and medium sized company model is only applied to the respective subgroup of countries namely the former EU-15 member states. Likewise the EU-12 average small and medium sized company model is only applied to the EU-12 accession countries. Table 61: Financial ratios for the benchmark case (EU-27 average small and medium-size) in comparison to EU-15 and EU-12 average small and medium-sized model firms Financial Ratio EU-27 EU-15 EU-12
Profit/loss for period 194,624 237,440 123,948
Total assets 4,258,420 4,803,963 2,994,283
Sales 7,167,799 8,570,250 4,548,708
Share of tangible fixed assets 25.50% 23.19% 31.81%
Return on sales 2.72% 2.77% 2.72%
Return on Equity 15.52% 16.54% 13.45%
Equity ratio 29.46% 29.88% 30.77%Return on assets 6.87% 7.18% 7.04%Inventories to capital 20.61% 19.59% 22.01%
Costs for personnel to turnover 18.20% 21.52% 13.21%
3.4.1 EU-15 Average Small Corporation
The first column of Table 62 displays the future value of the tax base under national GAAP. As for the EU-27 SME company there is a remarkable dispersion of the future values of the tax bases across member states. The future values of the tax base range from 2.60 Mio € in France to 4.32 Mio € in the Netherlands and Portugal. The average future value of the tax base amounts to 4.02 Mio €. Compared to the Future Value of the SME Benchmark this is higher by 0.80 Mio €, due to the higher profits of the model firm for EU-15 (see table 61 for financial ratios). (1) The first simulation considers an isolated harmonisation of rules governing tax deprecia-
tion (Option A).
The second column of Table 62 displays the change of the future value of the tax base stem-ming from the common tax depreciation rules in case of a CCTB. For all countries the change due to the isolated introduction of the proposed tax depreciation rules is positive, indicating a broadening of the tax base. Depending on the specific national depreciation provisions, the tax base broadening effect is larger in some countries than in others: France, Greece and Italy
127
experience the highest increase in the future value of the tax base whereas the increase is smallest in Belgium, Denmark Ireland and the Netherlands. On average the future value of the tax base increases by 2.00%.72 In isolation, common depre-ciation rules correspond to 63.69% (=2.00/3.14) of the overall EU-average increase of the future value of the tax base thus revealing depreciation as the option with the most important impact on the future value of the tax base. (2) The second simulation analyses the effect of an isolated harmonisation of methods for simplified valuation of inventories on the future value of the tax base (Option B). Changes of the future value of the tax base resulting from the introduction of the WAC-method in case of a CCTB are displayed in column 3 of table 62. Overall, the impact of the WAC-method on the future value of the tax base ranges from -0.01% in Denmark, Finland and Lithuania to 0.36% in the Netherlands. On average the future value of the tax base increases by 0.14%.73 In isolation this corresponds to 4.46% (= 0.14/3.14) of the overall EU-average increase of the future value of the tax base (Option I). As for the EU-27 average SME corporation the assessment of inventory only ex-erts moderate impact on the future value of the tax base. (3) The third simulation investigates the effect of common rules for the determination of pro-duction costs (Option C). The results of an isolated harmonisation of production costs are displayed in column 4 of ta-ble 62. The strongest increase of the future value of the tax base is determined for Austria with 0.94%, the strongest decrease in Italy with 0.44%. In most countries the future value of the tax base changes only to a very small extent. On average the future value of the tax base, in contrast to the case for the EU-27 SME company, decreases by 0.25% due to an isolated har-monisation of production cost.74 This average decrease corresponds in isolation to -7.96% (=-0.25/3.14) of the overall EU-average increase of the future value of the tax base in the event of a simultaneous introduction of all CCTB options. (4) The next simulation investigates the effect of common rules for the capitalization of R&D costs within production costs (Option D). The results displayed in column 5 of table 62 reveal no considerable impact of common rules for the capitalization of R&D costs on the future value of the tax base. In the majority of countries the future value of the tax base does not change at all or by not more than 0.06%. On average the future value of the tax base decreases by 0.01%.75 In isolation this corresponds to -0.32% (= -0.01/3.14) of the overall EU-average increase of the future value of the tax base in event of a CCTB. The effect of harmonised rules for the capitalization of R&D is thus neg-ligible. (5) The next simulation deals with the effect of common rules regarding provisions for pen-sions (Option E).
72 Under Option A the effective tax burden increases by 1.80% (table 63 column 2). 73 Under Option B the effective tax burden increases by 0.16% (table 63 column 3). 74Under Option C the effective tax burden increases by 0.23% (table 63 column 4). 75 Under option D the effective tax burden decreases by 0.01% (table 63 column 5).
128
As can be seen from column 6 of table 62 the proposed provisions for pension schemes only affect the future value of the tax base in Austria, Germany and the Netherlands. On average the results reveal a decrease of the future value of the tax base by 0.12%.76 This moderate decrease corresponds in isolation to -3.82% (=-0.12/3.14) of the overall EU-average change of the future value of the tax base in the event of a CCTB. (6) The effects of provisions for future warranty liabilities are analysed in the following simu-lation (Option F). The changes of the future value of the tax base due to the application of the proposed provi-sions concerning warranty liabilities are displayed in column 7 of table 62. This option either does not translate in a change of the future value of the tax base at all or causes a decrease of the future value of the tax base. The decrease ranges from 1.06 in Greece to 1.39 in Finland. Overall, the introduction of the proposed provisions for future warranty liabilities causes on average a decrease of the future value of the tax base of 0.33%.77 This decrease in isolation corresponds to -10.51% (= -0.33/3.14) of the overall EU-average change of the future value of the tax base in the event of a CCTB. As for the EU-27 average corporation this option exerts the second largest impact in isolation on the future value of the tax base. (7) Another option for CCTB is the avoidance of double taxation of dividend income by apply-ing the exemption method for dividend income from major shareholdings (Option G). Column 8 of Table 62 displays the deviation of the future value of the tax base due to the ap-plication of the exemption method to avoid double taxation of dividend income. A change of the future value of the tax base is only found for Greece, Ireland and the United Kingdom since all other EU-15 countries already apply the exemption method under national GAAP. On average the decrease of the future value of the tax base caused by the implementation of the exemption method in all EU member states amounts to 0.19%.78 This corresponds to -6.05% (=-0.19/3.14) of the overall EU-average change of the future value of the tax base in the event of a CCTB. This option thus bears considerable impact for the future value of the tax base. (8) The effects of loss carry forward are analysed in the following simulation (Option H). The large model firm representing an average EU-15 SME corporation is a profitable com-pany and shows no losses from regular activities during the simulation period of 10 years. The isolated application of the CCTB Option H for an indefinite loss carry forward itself does therefore not result in changes of the future value of the tax base of the model firm. (9) The effects of simultaneous introduction of all CCTB options (Option I) So far, different regulations concerning the computation of taxable income have been harmo-nised in isolation. Now, the focus will be on a simultaneous introduction of the proposed CCTB options. The results of this calculation are displayed in column 10 of table 62. Except for Cyprus and Ireland all countries experience a broadening of the future value of the tax base due to the simultaneous introduction of all proposed CCTB options. On average the in-crease of the future value of the tax base amounts to 3.14%. The highest impact is found for Finland (6.99%), France (5.78%), Greece (7.74%), Italy (6.77%) and Portugal (7.63%). In 76 Under option E the effective tax burden decreases by 0.08% (table 63 column 6). 77 Under option F the effective tax burden decreases by 0.44% (table 63 column 7). 78 Under option G the effective tax burden remains unchanged on average (table 63 column 8).
129
Ireland the simultaneous introduction of all CCTB options results in a decrease of the future value of the tax base. Compared to the EU-27 average corporation, the tax base broadening effect of depreciation is lower. At the same time the decrease of the future value of the tax base due to the provisions for warranty liabilities is less strong. To sum up, based on an EU-15 average SME corporation, the calculations reveal an increase of the future value of the tax base by 3.14%.79 This increase is lower compared to the bench-mark EU-27 case (5.57%). This result strengthens the conclusion drawn for the EU-27 aver-age SME corporation that the introduction of a CCTB would increase tax bases according to the measured future values but that this increase is less pronounced for the former EU-15 countries. Again, the harmonisation of depreciation rules has the strongest impact on the tax base. Relevant changes of the future value of the tax base are also caused by CCTB provi-sions for future warranty liabilities, common rules for the determination of production cost and the CCTB rules concerning the avoidance of double taxation of dividends. In contrast, the impact of common rules for the simplified valuation of inventories as well as the inclusion of R&D-related costs in production cost are of minor importance for the future value of the tax base in the EU-15 countries. The radar chart in figure 22 allows a comparison of the effects derived for the EU-15 SME with the respective effects derived in section III part 2.4 for the EU-15 large company. There-fore, the radar chart illustrates the impact on the increase of the future value of the tax base for the EU-15 (Large and SME) that results from adopting the single options in isolation. Com-pared to the EU-27 case there are three notable changes. First, the impact of option A ap-proximates the value for the small and medium-sized company and now both values are con-siderably lower compared to the EU-27 case. Second, for both cases the influence of option B, C and E is remarkably intensified, whereas the impact is slightly mitigated with respect to option F. Third, with respect to option G, there is a notable increase of the influence which is even stronger for the large company than for the small and medium-sized one.
79 A simultaneous introduction of all CCTB options results in an increase of the effective tax burden by 2.66%.
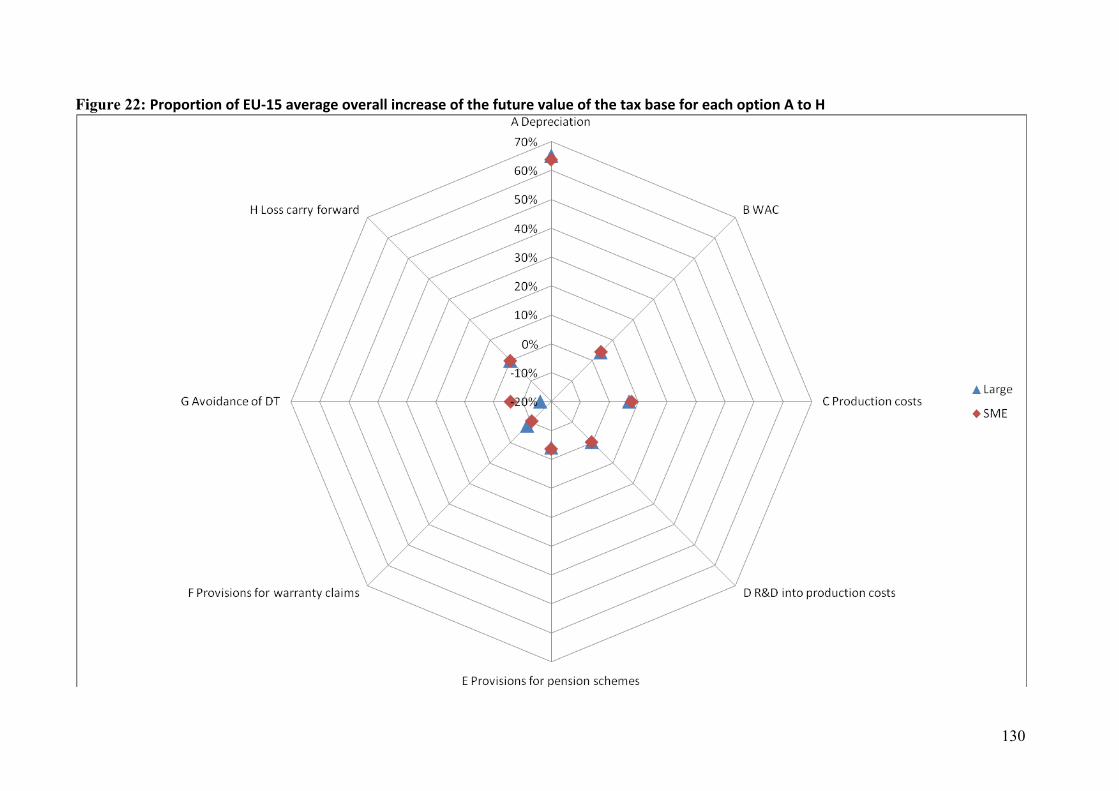
130
Figure 22: Proportion of EU-15 average overall increase of the future value of the tax base for each option A to H
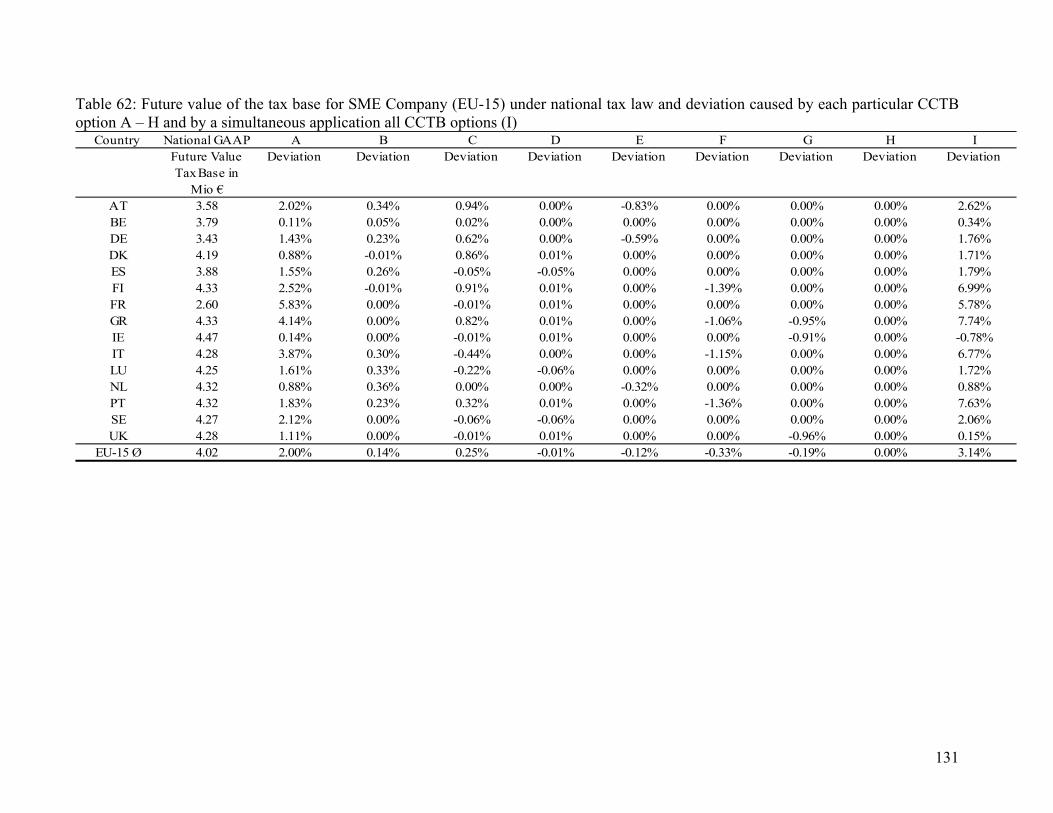
131
Table 62: Future value of the tax base for SME Company (EU-15) under national tax law and deviation caused by each particular CCTB option A – H and by a simultaneous application all CCTB options (I)
Country National GAAP A B C D E F G H IFuture Value Tax Base in
Mio €
Deviation Deviation Deviation Deviation Deviation Deviation Deviation Deviation Deviation
AT 3.58 2.02% 0.34% 0.94% 0.00% -0.83% 0.00% 0.00% 0.00% 2.62%BE 3.79 0.11% 0.05% 0.02% 0.00% 0.00% 0.00% 0.00% 0.00% 0.34%DE 3.43 1.43% 0.23% 0.62% 0.00% -0.59% 0.00% 0.00% 0.00% 1.76%DK 4.19 0.88% -0.01% 0.86% 0.01% 0.00% 0.00% 0.00% 0.00% 1.71%ES 3.88 1.55% 0.26% -0.05% -0.05% 0.00% 0.00% 0.00% 0.00% 1.79%FI 4.33 2.52% -0.01% 0.91% 0.01% 0.00% -1.39% 0.00% 0.00% 6.99%FR 2.60 5.83% 0.00% -0.01% 0.01% 0.00% 0.00% 0.00% 0.00% 5.78%GR 4.33 4.14% 0.00% 0.82% 0.01% 0.00% -1.06% -0.95% 0.00% 7.74%IE 4.47 0.14% 0.00% -0.01% 0.01% 0.00% 0.00% -0.91% 0.00% -0.78%IT 4.28 3.87% 0.30% -0.44% 0.00% 0.00% -1.15% 0.00% 0.00% 6.77%LU 4.25 1.61% 0.33% -0.22% -0.06% 0.00% 0.00% 0.00% 0.00% 1.72%NL 4.32 0.88% 0.36% 0.00% 0.00% -0.32% 0.00% 0.00% 0.00% 0.88%PT 4.32 1.83% 0.23% 0.32% 0.01% 0.00% -1.36% 0.00% 0.00% 7.63%SE 4.27 2.12% 0.00% -0.06% -0.06% 0.00% 0.00% 0.00% 0.00% 2.06%UK 4.28 1.11% 0.00% -0.01% 0.01% 0.00% 0.00% -0.96% 0.00% 0.15%
EU-15 Ø 4.02 2.00% 0.14% 0.25% -0.01% -0.12% -0.33% -0.19% 0.00% 3.14%
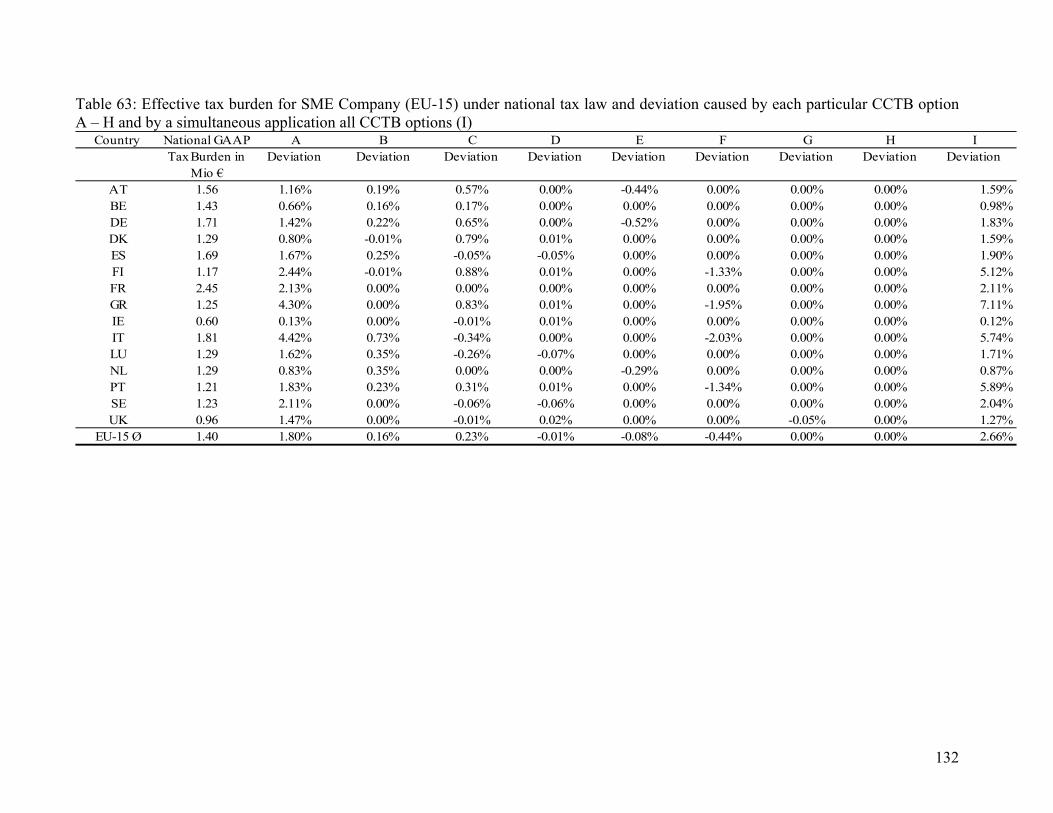
132
Table 63: Effective tax burden for SME Company (EU-15) under national tax law and deviation caused by each particular CCTB option A – H and by a simultaneous application all CCTB options (I)
Country National GAAP A B C D E F G H ITax Burden in
Mio €Deviation Deviation Deviation Deviation Deviation Deviation Deviation Deviation Deviation
AT 1.56 1.16% 0.19% 0.57% 0.00% -0.44% 0.00% 0.00% 0.00% 1.59%BE 1.43 0.66% 0.16% 0.17% 0.00% 0.00% 0.00% 0.00% 0.00% 0.98%DE 1.71 1.42% 0.22% 0.65% 0.00% -0.52% 0.00% 0.00% 0.00% 1.83%DK 1.29 0.80% -0.01% 0.79% 0.01% 0.00% 0.00% 0.00% 0.00% 1.59%ES 1.69 1.67% 0.25% -0.05% -0.05% 0.00% 0.00% 0.00% 0.00% 1.90%FI 1.17 2.44% -0.01% 0.88% 0.01% 0.00% -1.33% 0.00% 0.00% 5.12%FR 2.45 2.13% 0.00% 0.00% 0.00% 0.00% 0.00% 0.00% 0.00% 2.11%GR 1.25 4.30% 0.00% 0.83% 0.01% 0.00% -1.95% 0.00% 0.00% 7.11%IE 0.60 0.13% 0.00% -0.01% 0.01% 0.00% 0.00% 0.00% 0.00% 0.12%IT 1.81 4.42% 0.73% -0.34% 0.00% 0.00% -2.03% 0.00% 0.00% 5.74%LU 1.29 1.62% 0.35% -0.26% -0.07% 0.00% 0.00% 0.00% 0.00% 1.71%NL 1.29 0.83% 0.35% 0.00% 0.00% -0.29% 0.00% 0.00% 0.00% 0.87%PT 1.21 1.83% 0.23% 0.31% 0.01% 0.00% -1.34% 0.00% 0.00% 5.89%SE 1.23 2.11% 0.00% -0.06% -0.06% 0.00% 0.00% 0.00% 0.00% 2.04%UK 0.96 1.47% 0.00% -0.01% 0.02% 0.00% 0.00% -0.05% 0.00% 1.27%
EU-15 Ø 1.40 1.80% 0.16% 0.23% -0.01% -0.08% -0.44% 0.00% 0.00% 2.66%
133
3.4.2 EU-12 Average Small Corporation
The first column of Table 64 displays the future value of the tax base under national GAAP. As for the EU-27 SME company there is a remarkable dispersion of the Future Values of the Tax Bases across member states. The future values of the tax base range from 0.84 Mio € in Hungary to 2.83 Mio € in Cyprus. The average future value of the tax base amounts to 2.48 Mio €. Compared to the Future Value of the SME benchmark this is lower by 0.74 Mio €, due to the lower profits of the model firm for EU-12 (please see table 31 for financial ratios). (1) The first simulation considers an isolated harmonisation of rules governing tax deprecia-
tion (Option A).
The second column of Table 64 displays the change of the future value of the tax base stem-ming from the common tax depreciation rules in case of a CCTB. For all countries the change due to the isolated introduction of the proposed tax depreciation rules is positive, indicating a broadening of the tax base. Depending on the specific national depreciation provisions, the tax base broadening effect is larger in some countries than in others: Czech Republic, Hun-gary, Latvia, Lithuania and Slovakia experience the highest increase in the future value of the tax base whereas the increase is smallest in Cyprus and Malta. On average the future value of the tax base increases by 5.10%.80 In isolation, common depre-ciation rules correspond to 80.44% (=5.10/6.34) of the overall EU-average increase of the future value of the tax base thus revealing depreciation as the option with the most important impact on the future value of the tax base. (2) The second simulation analyses the effect of an isolated harmonisation of methods for simplified valuation of inventories on the future value of the tax base (Option B). Changes of the future value of the tax base resulting from the introduction of the WAC-method in case of a CCTB are displayed in column 3 of table 64. Overall, the impact of the WAC-method on the future value of the tax base ranges from -0.02% in Lithuania to 0.38% in Slovenia. On average the future value of the tax base increases by 0.10%.81 In isolation this corresponds to 1.57% (= 0.10/6.34) of the overall EU-average increase of the future value of the tax base (Option I). As for the EU-27 average SME corporation the assessment of inventory only ex-erts moderate impact on the future value of the tax base. (3) The third simulation investigates the effect of common rules for the determination of pro-duction costs (Option C). The results of an isolated harmonisation of production costs are displayed in column 4 of ta-ble 64. The strongest increase of the future value of the tax base is determined for Bulgaria with 1.17%, the strongest decrease in Cyprus with -5.06%. In most countries the future value of the tax base does change only to a very small extent. On average the future value of the tax base decreases by 0.9% due to an isolated harmonisation of production cost.82 This average decrease corresponds in isolation to -1.42% (= -0.09/6.34) of the overall EU-average increase of the future value of the tax base in the event of a simultaneous introduction of all CCTB options. In line with the findings for the EU-27 average SME corporation, the proposed
80 Under Option A the effective tax burden increases by 4.52% (table 65 column 2). 81 Under Option B the effective tax burden increases by 0.10% (table 65 column 3). 82 Under Option C the effective tax burden increases by 0.17% (table 65 column 4).
134
CCTB provision for the determination of production costs induces only slight changes in the future value of the tax base. (4) The next simulation investigates the effect of common rules for the capitalization of R&D costs within production costs (Option D). The results displayed in column 5 of table 64 reveal no considerable impact of common rules for the capitalization of R&D costs on the future value of the tax base. In the majority of countries the future value of the tax base does not change at all or by not more than 0.01%. On average the future value of the tax base decreases by 0.03%.83 In isolation this corresponds to -0.47% (= -0.03/6.34) of the overall EU-average increase of the future value of the tax base in event of a CCTB. The effect of harmonised rules for the capitalization of R&D is thus neg-ligible. (5) The next simulation deals with the effect of common rules regarding provisions for pen-sions (Option E). As can be seen from column 6 of table 64 the proposed provisions for pension schemes only affect the future value of the tax base in Estonia that experiences a decrease of the future value of the tax base of 0.02%. On average, for the EU-12 countries, the future value of the tax base remains unchanged.84 (6) The effects of provisions for future warranty liabilities are analysed in the following simu-lation (Option F). The changes of the future value of the tax base due to the application of the proposed provi-sions concerning warranty liabilities are displayed in column 7 of table 64. This option either does not translate in a change of the future value of the tax base at all or causes a decrease of the future value of the tax base. This decrease is strongest in Cyprus with 3.06%. Overall, the introduction of the proposed provisions for future warranty liabilities causes on average a de-crease of the future value of the tax base of 1.01%.85 This decrease in isolation corresponds to -15.93% (= -1.01/6.34) of the overall EU-average change of the future value of the tax base in the event of a CCTB. As for the EU-27 average corporation this option exerts the second largest impact in isolation on the future value of the tax base. (7) Another option for CCTB is the avoidance of double taxation of dividend income by apply-ing the exemption method for dividend income from major shareholdings (Option G). Column 8 of Table 64 displays the deviation of the future value of the tax base due to the ap-plication of the exemption method to avoid double taxation of dividend income. A change of the future value of the tax base is only found for Malta and Poland since all other EU-12 countries already apply the exemption method under national GAAP. On average the decrease of the future value of the tax base caused by the implementation of the exemption method in all EU member states amounts to 0.10%.86 This corresponds to -1.58% (=-0.10/6.34) of the overall EU-average change of the future value of the tax base in the event of a CCTB. This option thus bears a small impact for the future value of the tax base for the EU-12 countries.
83 Under option D the effective tax burden decreases by 0.02% (table 65 column 5). 84 Under option E the effective tax burden remains unchanged on average (table 65 column 6). 85 Under option F the effective tax burden decreases by 0.90% (table 65 column 7). 86 Under option G the effective tax burden decreases by 0.01% (table 65 column 8).
135
(8) The effects of loss carry forward are analysed in the following simulation (Option H). The large model firm representing an average EU-12 SME corporation is a profitable com-pany and shows no losses from regular activities during the simulation period of 10 years. The isolated application of the CCTB Option H for an indefinite loss carry forward itself does therefore not result in changes of the future value of the tax base of the model firm. (9) The effects of simultaneous introduction of all CCTB options (Option I) So far, different regulations concerning the computation of taxable income have been harmo-nised in isolation. Now, the focus will be on a simultaneous introduction of the proposed CCTB options. The results of this calculation are displayed in column 10 of table 64. Except for Cyprus and Ireland all countries experience a broadening of the future value of the tax base due to the simultaneous introduction of all proposed CCTB options. On average the in-crease of the future value of the tax base amounts to 6.34%. The highest impact is found for Hungary (13.71%), Bulgaria (10.44%), Latvia (8.80%) and Lithuania (8.79%). This is in line with the findings for the EU-27 average small corporation. In Cyprus the simultaneous intro-duction of all CCTB options results in a decrease of the future value of the tax base which is mainly because compared to the EU-27 average SME corporation, the tax base broadening effect of depreciation is lower. To sum up, based on an EU-12 average SME corporation, the calculations reveal an increase of the future value of the tax base by 6.34%.87 This increase almost equals the increase of the future value of the tax base of the benchmark case and is considerably above the increase ob-served for the EU-15 small corporation (3.12%). Hence the impact of the proposed CCTB is strongest in the EU-12 accession countries. Again, the harmonisation of depreciation rules has the strongest impact on the tax base. Relevant changes of the future value of the tax base are also caused by CCTB provisions for future warranty liabilities, common rules for a simplified valuation of inventories and the CCTB rules concerning the avoidance of double taxation of dividends. In contrast, the impact of common provisions for pension schemes, as well as the inclusion of R&D-related costs in production cost are of minor importance for the future value of the tax base in the EU-12 countries. The radar chart in figure 21 allows a comparison of the effects derived for the EU-12 SME with the respective effects derived in section III part 2.4 for the EU-12 large company. There-fore the radar chart illustrates the impact on the increase of the future value of the tax base for the EU-12 (Large and SME) that results from adopting the single options in isolation. Com-pared to the EU-27 case there are four notable changes. Again, the impact of option A ap-proximates the value of the small and medium-sized company, but now both values are higher compared to the EU-27 case. The impact of option C is decreased for the large company, as well as for the small and medium-sized company. The negative impact on the tax base of op-tion F is intensified for the both companies. With respect to option G, the impact for the large company approximates the value for the small and medium-sized company, i.e. the negative impact on the tax base is reduced.
87 A simultaneous introduction of all CCTB options results in an increase of the effective tax burden by 5.18%.
136
Figure 22: Proportion of EU-12 average overall increase of the future value of the tax base for each option A to H
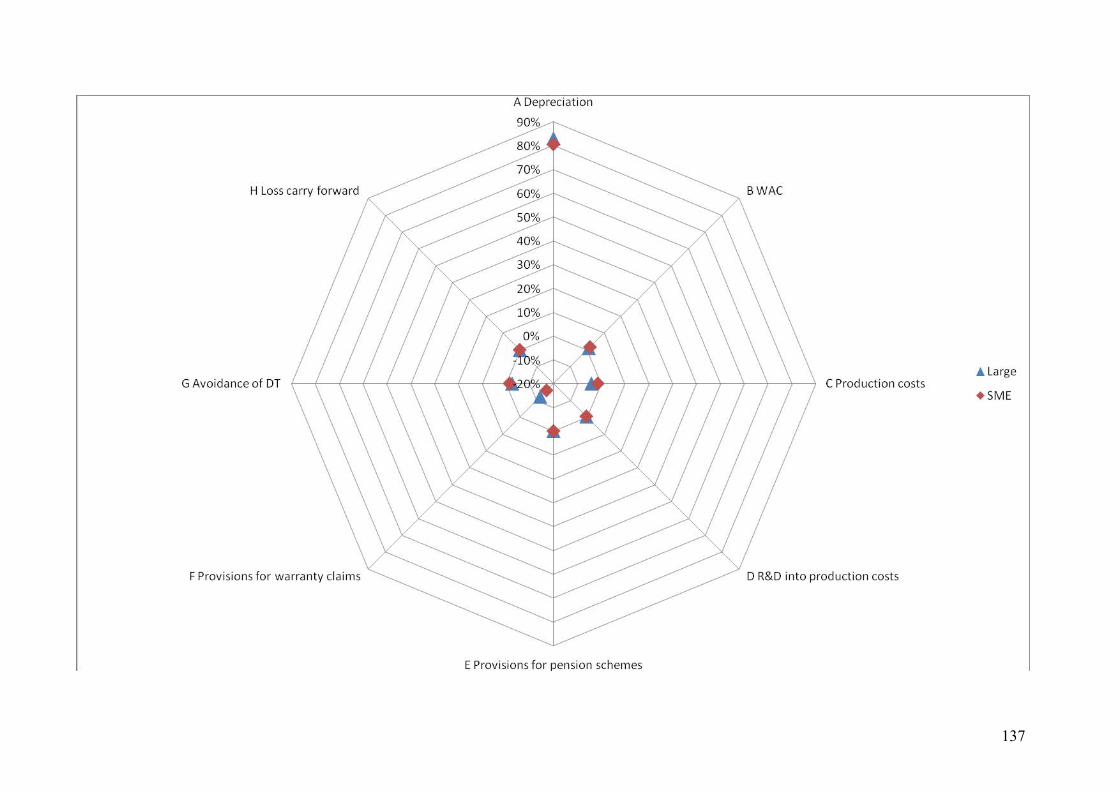
137
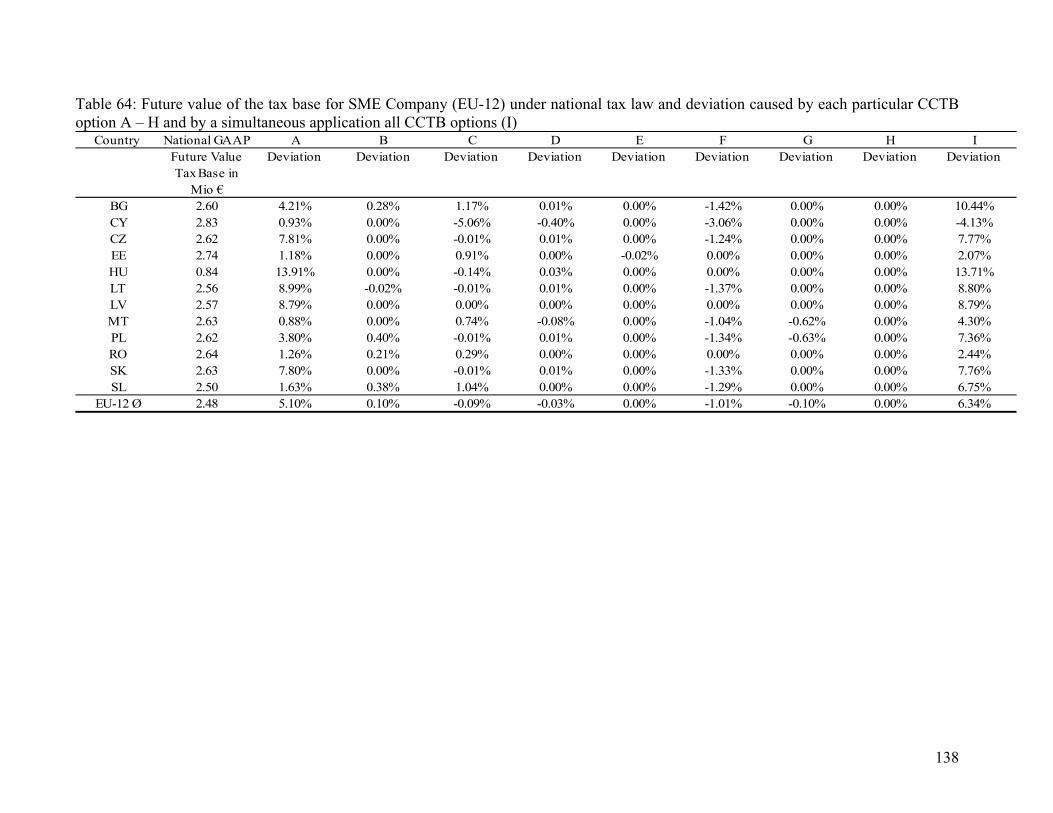
138
Table 64: Future value of the tax base for SME Company (EU-12) under national tax law and deviation caused by each particular CCTB option A – H and by a simultaneous application all CCTB options (I)
Country National GAAP A B C D E F G H IFuture Value Tax Base in
Mio €
Deviation Deviation Deviation Deviation Deviation Deviation Deviation Deviation Deviation
BG 2.60 4.21% 0.28% 1.17% 0.01% 0.00% -1.42% 0.00% 0.00% 10.44%CY 2.83 0.93% 0.00% -5.06% -0.40% 0.00% -3.06% 0.00% 0.00% -4.13%CZ 2.62 7.81% 0.00% -0.01% 0.01% 0.00% -1.24% 0.00% 0.00% 7.77%EE 2.74 1.18% 0.00% 0.91% 0.00% -0.02% 0.00% 0.00% 0.00% 2.07%HU 0.84 13.91% 0.00% -0.14% 0.03% 0.00% 0.00% 0.00% 0.00% 13.71%LT 2.56 8.99% -0.02% -0.01% 0.01% 0.00% -1.37% 0.00% 0.00% 8.80%LV 2.57 8.79% 0.00% 0.00% 0.00% 0.00% 0.00% 0.00% 0.00% 8.79%MT 2.63 0.88% 0.00% 0.74% -0.08% 0.00% -1.04% -0.62% 0.00% 4.30%PL 2.62 3.80% 0.40% -0.01% 0.01% 0.00% -1.34% -0.63% 0.00% 7.36%RO 2.64 1.26% 0.21% 0.29% 0.00% 0.00% 0.00% 0.00% 0.00% 2.44%SK 2.63 7.80% 0.00% -0.01% 0.01% 0.00% -1.33% 0.00% 0.00% 7.76%SL 2.50 1.63% 0.38% 1.04% 0.00% 0.00% -1.29% 0.00% 0.00% 6.75%
EU-12 Ø 2.48 5.10% 0.10% -0.09% -0.03% 0.00% -1.01% -0.10% 0.00% 6.34%
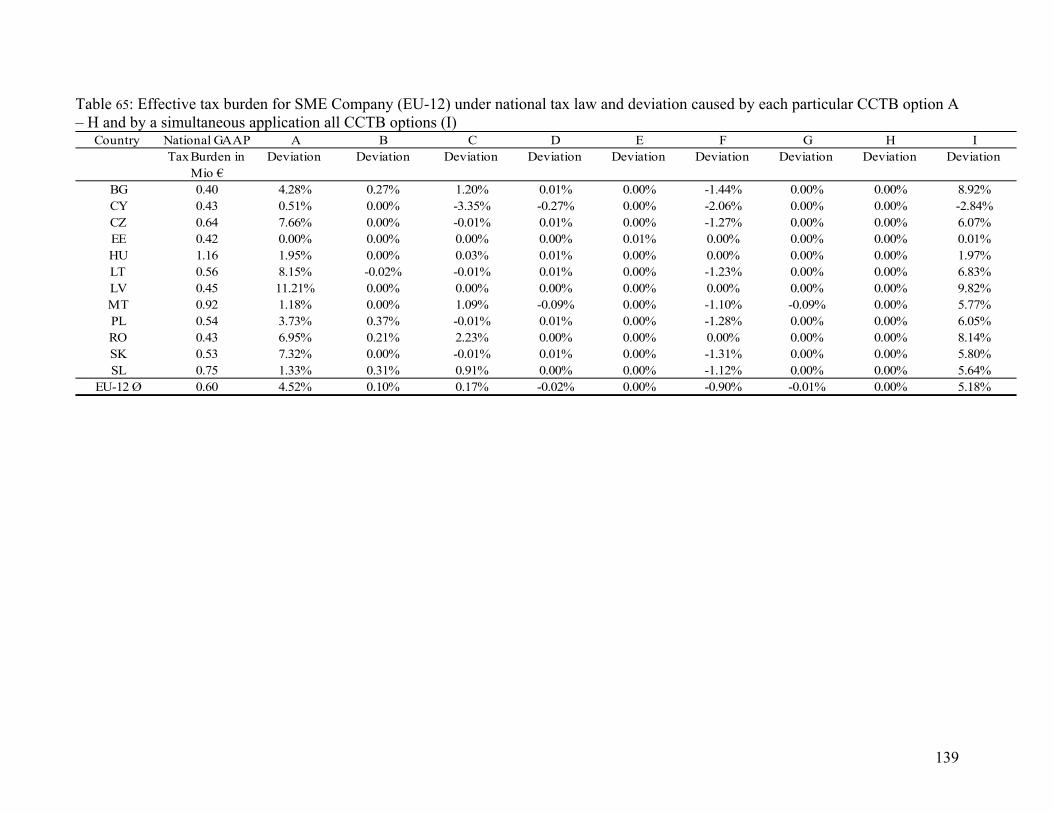
139
Table 65: Effective tax burden for SME Company (EU-12) under national tax law and deviation caused by each particular CCTB option A – H and by a simultaneous application all CCTB options (I)
Country National GAAP A B C D E F G H ITax Burden in
Mio €Deviation Deviation Deviation Deviation Deviation Deviation Deviation Deviation Deviation
BG 0.40 4.28% 0.27% 1.20% 0.01% 0.00% -1.44% 0.00% 0.00% 8.92%CY 0.43 0.51% 0.00% -3.35% -0.27% 0.00% -2.06% 0.00% 0.00% -2.84%CZ 0.64 7.66% 0.00% -0.01% 0.01% 0.00% -1.27% 0.00% 0.00% 6.07%EE 0.42 0.00% 0.00% 0.00% 0.00% 0.01% 0.00% 0.00% 0.00% 0.01%HU 1.16 1.95% 0.00% 0.03% 0.01% 0.00% 0.00% 0.00% 0.00% 1.97%LT 0.56 8.15% -0.02% -0.01% 0.01% 0.00% -1.23% 0.00% 0.00% 6.83%LV 0.45 11.21% 0.00% 0.00% 0.00% 0.00% 0.00% 0.00% 0.00% 9.82%MT 0.92 1.18% 0.00% 1.09% -0.09% 0.00% -1.10% -0.09% 0.00% 5.77%PL 0.54 3.73% 0.37% -0.01% 0.01% 0.00% -1.28% 0.00% 0.00% 6.05%RO 0.43 6.95% 0.21% 2.23% 0.00% 0.00% 0.00% 0.00% 0.00% 8.14%SK 0.53 7.32% 0.00% -0.01% 0.01% 0.00% -1.31% 0.00% 0.00% 5.80%SL 0.75 1.33% 0.31% 0.91% 0.00% 0.00% -1.12% 0.00% 0.00% 5.64%
EU-12 Ø 0.60 4.52% 0.10% 0.17% -0.02% 0.00% -0.90% -0.01% 0.00% 5.18%
140
3.5 Relationship between key accounting ratios and overall tax base effect
For a comprehensive view of the overall tax base effect it is useful to analyse the increase of the tax base in relation to key financial ratios, e.g. return on sales, based on statistical meth-ods. To this end, we employed a multiple linear regression model (standard OLS model). The combined impact of several independent variables on a dependent variable is modelled as a linear function:
The parameters express the relationship between the single factors and the dependent variable . The dependent variable in this study is measured as the average relative increase in the future value of the tax base for the average model companies that results from adopting the CCTB options combined, i.e. option A to H are incorporated simultaneously (hereafter referred to as increase of the tax base). As the independent variables expected to explain this increase of the tax base we use the following key accounting ratios: return on sales, return on assets, return on equity, capital intensity, proportions on the assets side (intangible assets, tangible assets and financial assets to fixed assets on the one hand and to total assets on the other hand), stocks to balance sheet total, equity ratio, provisions for warranty claims to total assets and labour intensity. Values of the dependent and independent variables were observed taking 18 average model companies, i.e. EU-27, EU-15 and EU-12 companies (each large and SME) as well as the industry-specific companies in the manufacturing, construction, com-merce, service trade, transport and energy sectors (each large and SME). A precondition for using a multiple linear regression model is that the independent variables have to be independent from each other. This precondition, however, is not completely ful-filled regarding accounting ratios. Nevertheless, the above-mentioned ratios can be grouped according to obvious interdependencies, i.e. return figures, proportions on the assets side and proportions on the liabilities side, as well as labour intensity. Each group is represented by an independent variable that has been applied to the model. Due to the existence of multicollin-earity, however, one exception had to be made for the proportions on the liabilities side (eq-uity ratio or provisions for warranty claims to total assets). The outcome was that the vari-ables return on sales, capital intensity and labour intensity fit best the multiple linear regres-sion model given above. The quality of this model is measured as the coefficient of determi-nation R2 which expresses the variance of the values estimated by the model in relation to the variance of the values observed. Hence, the R2 value can range from zero to one and here it amounts to 0.715 at a significance level of one percent. This value thus indicates good valid-ity of the model.88
88 It has to be noted that the small sample size increases the influence of random deviations so that a value near one hence cannot be expected.
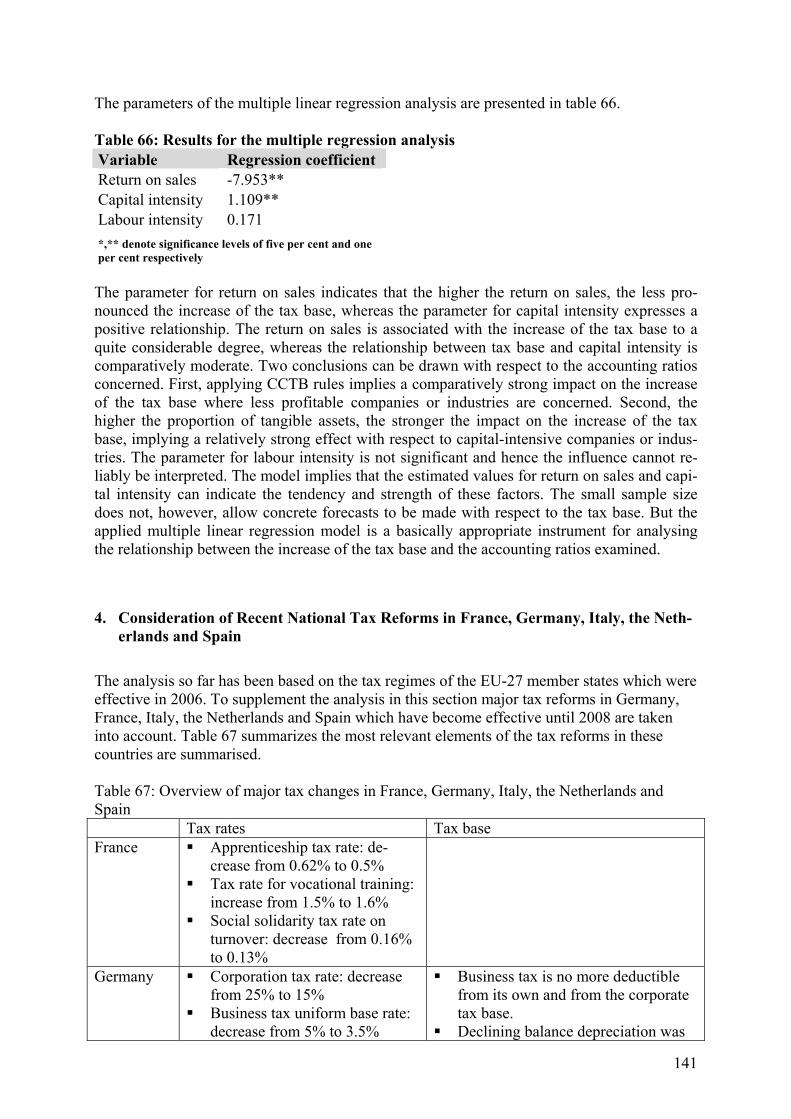
141
The parameters of the multiple linear regression analysis are presented in table 66. Table 66: Results for the multiple regression analysis Variable Regression coefficient Return on sales -7.953** Capital intensity 1.109** Labour intensity 0.171
*,** denote significance levels of five per cent and one per cent respectively
The parameter for return on sales indicates that the higher the return on sales, the less pro-nounced the increase of the tax base, whereas the parameter for capital intensity expresses a positive relationship. The return on sales is associated with the increase of the tax base to a quite considerable degree, whereas the relationship between tax base and capital intensity is comparatively moderate. Two conclusions can be drawn with respect to the accounting ratios concerned. First, applying CCTB rules implies a comparatively strong impact on the increase of the tax base where less profitable companies or industries are concerned. Second, the higher the proportion of tangible assets, the stronger the impact on the increase of the tax base, implying a relatively strong effect with respect to capital-intensive companies or indus-tries. The parameter for labour intensity is not significant and hence the influence cannot re-liably be interpreted. The model implies that the estimated values for return on sales and capi-tal intensity can indicate the tendency and strength of these factors. The small sample size does not, however, allow concrete forecasts to be made with respect to the tax base. But the applied multiple linear regression model is a basically appropriate instrument for analysing the relationship between the increase of the tax base and the accounting ratios examined.
4. Consideration of Recent National Tax Reforms in France, Germany, Italy, the Neth-erlands and Spain
The analysis so far has been based on the tax regimes of the EU-27 member states which were effective in 2006. To supplement the analysis in this section major tax reforms in Germany, France, Italy, the Netherlands and Spain which have become effective until 2008 are taken into account. Table 67 summarizes the most relevant elements of the tax reforms in these countries are summarised. Table 67: Overview of major tax changes in France, Germany, Italy, the Netherlands and Spain Tax rates Tax base France Apprenticeship tax rate: de-
crease from 0.62% to 0.5% Tax rate for vocational training:
increase from 1.5% to 1.6% Social solidarity tax rate on
turnover: decrease from 0.16% to 0.13%
Germany Corporation tax rate: decrease from 25% to 15%
Business tax uniform base rate: decrease from 5% to 3.5%
Business tax is no more deductible from its own and from the corporate tax base.
Declining balance depreciation was
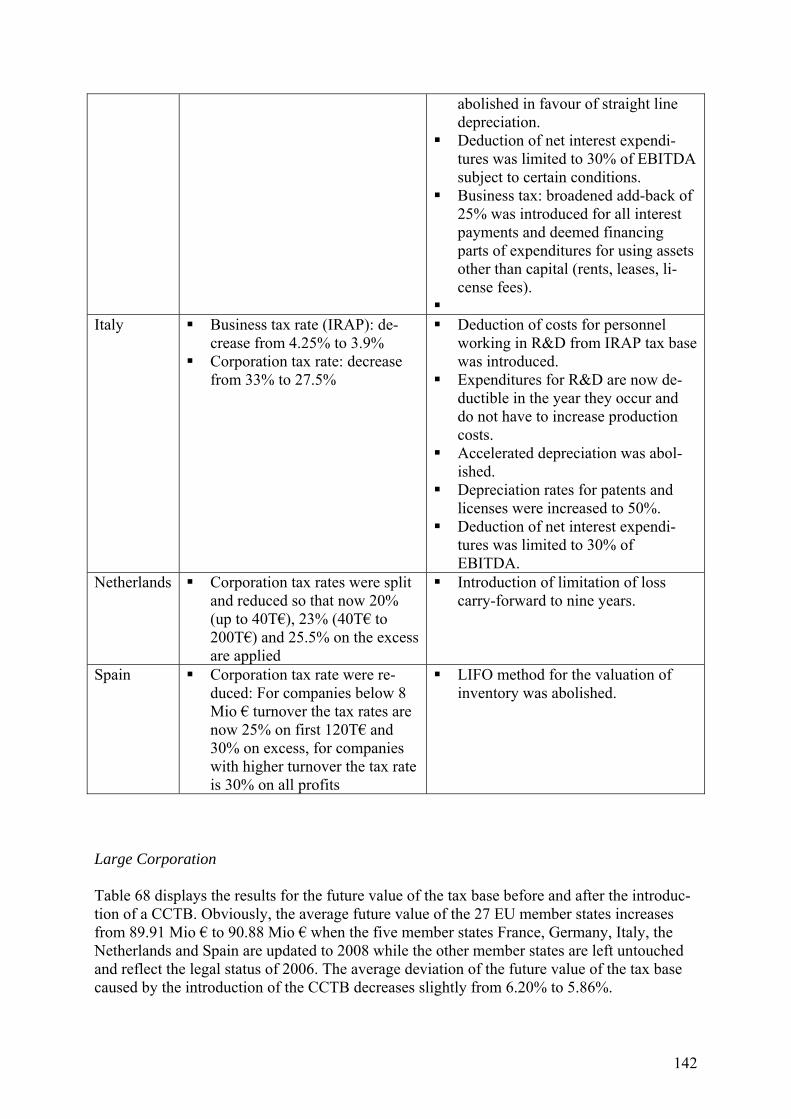
142
abolished in favour of straight line depreciation.
Deduction of net interest expendi-tures was limited to 30% of EBITDA subject to certain conditions.
Business tax: broadened add-back of 25% was introduced for all interest payments and deemed financing parts of expenditures for using assets other than capital (rents, leases, li-cense fees).
Italy Business tax rate (IRAP): de-
crease from 4.25% to 3.9% Corporation tax rate: decrease
from 33% to 27.5%
Deduction of costs for personnel working in R&D from IRAP tax base was introduced.
Expenditures for R&D are now de-ductible in the year they occur and do not have to increase production costs.
Accelerated depreciation was abol-ished.
Depreciation rates for patents and licenses were increased to 50%.
Deduction of net interest expendi-tures was limited to 30% of EBITDA.
Netherlands Corporation tax rates were split and reduced so that now 20% (up to 40T€), 23% (40T€ to 200T€) and 25.5% on the excess are applied
Introduction of limitation of loss carry-forward to nine years.
Spain Corporation tax rate were re-duced: For companies below 8 Mio € turnover the tax rates are now 25% on first 120T€ and 30% on excess, for companies with higher turnover the tax rate is 30% on all profits
LIFO method for the valuation of inventory was abolished.
Large Corporation Table 68 displays the results for the future value of the tax base before and after the introduc-tion of a CCTB. Obviously, the average future value of the 27 EU member states increases from 89.91 Mio € to 90.88 Mio € when the five member states France, Germany, Italy, the Netherlands and Spain are updated to 2008 while the other member states are left untouched and reflect the legal status of 2006. The average deviation of the future value of the tax base caused by the introduction of the CCTB decreases slightly from 6.20% to 5.86%.
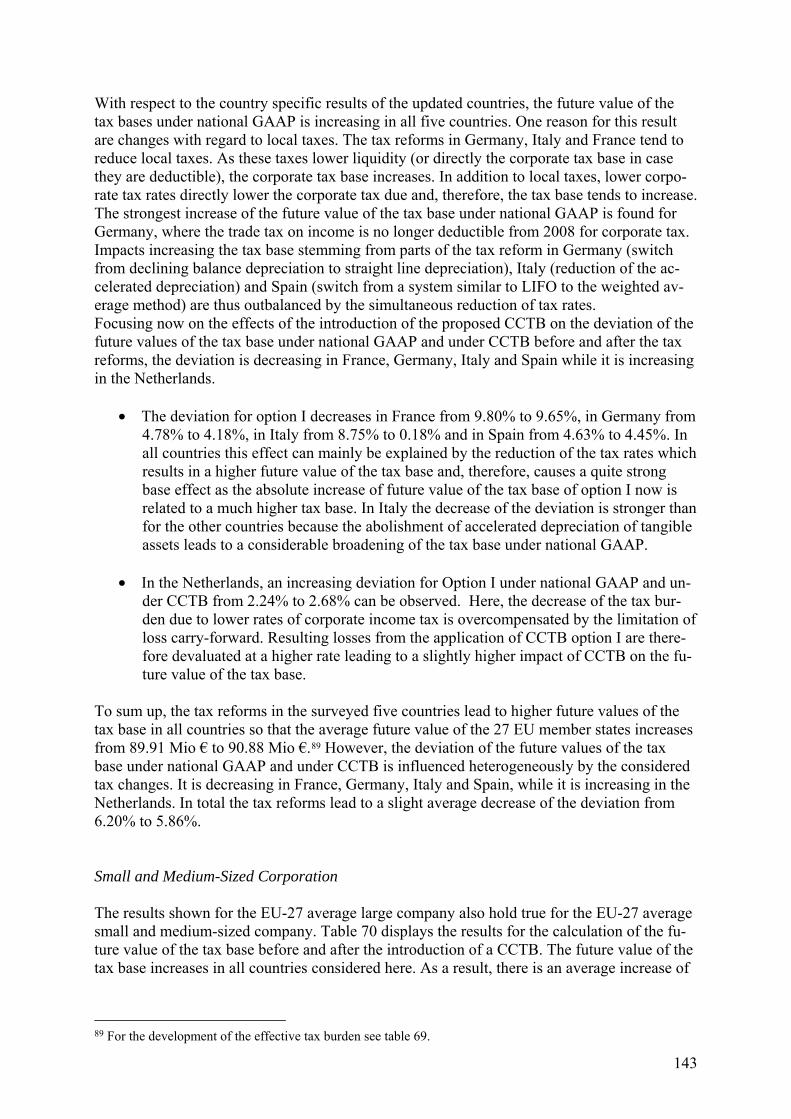
143
With respect to the country specific results of the updated countries, the future value of the tax bases under national GAAP is increasing in all five countries. One reason for this result are changes with regard to local taxes. The tax reforms in Germany, Italy and France tend to reduce local taxes. As these taxes lower liquidity (or directly the corporate tax base in case they are deductible), the corporate tax base increases. In addition to local taxes, lower corpo-rate tax rates directly lower the corporate tax due and, therefore, the tax base tends to increase. The strongest increase of the future value of the tax base under national GAAP is found for Germany, where the trade tax on income is no longer deductible from 2008 for corporate tax. Impacts increasing the tax base stemming from parts of the tax reform in Germany (switch from declining balance depreciation to straight line depreciation), Italy (reduction of the ac-celerated depreciation) and Spain (switch from a system similar to LIFO to the weighted av-erage method) are thus outbalanced by the simultaneous reduction of tax rates. Focusing now on the effects of the introduction of the proposed CCTB on the deviation of the future values of the tax base under national GAAP and under CCTB before and after the tax reforms, the deviation is decreasing in France, Germany, Italy and Spain while it is increasing in the Netherlands.
• The deviation for option I decreases in France from 9.80% to 9.65%, in Germany from 4.78% to 4.18%, in Italy from 8.75% to 0.18% and in Spain from 4.63% to 4.45%. In all countries this effect can mainly be explained by the reduction of the tax rates which results in a higher future value of the tax base and, therefore, causes a quite strong base effect as the absolute increase of future value of the tax base of option I now is related to a much higher tax base. In Italy the decrease of the deviation is stronger than for the other countries because the abolishment of accelerated depreciation of tangible assets leads to a considerable broadening of the tax base under national GAAP.
• In the Netherlands, an increasing deviation for Option I under national GAAP and un-
der CCTB from 2.24% to 2.68% can be observed. Here, the decrease of the tax bur-den due to lower rates of corporate income tax is overcompensated by the limitation of loss carry-forward. Resulting losses from the application of CCTB option I are there-fore devaluated at a higher rate leading to a slightly higher impact of CCTB on the fu-ture value of the tax base.
To sum up, the tax reforms in the surveyed five countries lead to higher future values of the tax base in all countries so that the average future value of the 27 EU member states increases from 89.91 Mio € to 90.88 Mio €.89 However, the deviation of the future values of the tax base under national GAAP and under CCTB is influenced heterogeneously by the considered tax changes. It is decreasing in France, Germany, Italy and Spain, while it is increasing in the Netherlands. In total the tax reforms lead to a slight average decrease of the deviation from 6.20% to 5.86%. Small and Medium-Sized Corporation The results shown for the EU-27 average large company also hold true for the EU-27 average small and medium-sized company. Table 70 displays the results for the calculation of the fu-ture value of the tax base before and after the introduction of a CCTB. The future value of the tax base increases in all countries considered here. As a result, there is an average increase of
89 For the development of the effective tax burden see table 69.

144
the future value of the tax base from 3.22 Mio € to 3.25 Mio €.90 The average deviation of the future value of the tax base caused by the introduction of the CCTB decreases slightly from 5.57% to 5.30%.
90 For the development of the effective tax burden see table 71.

145
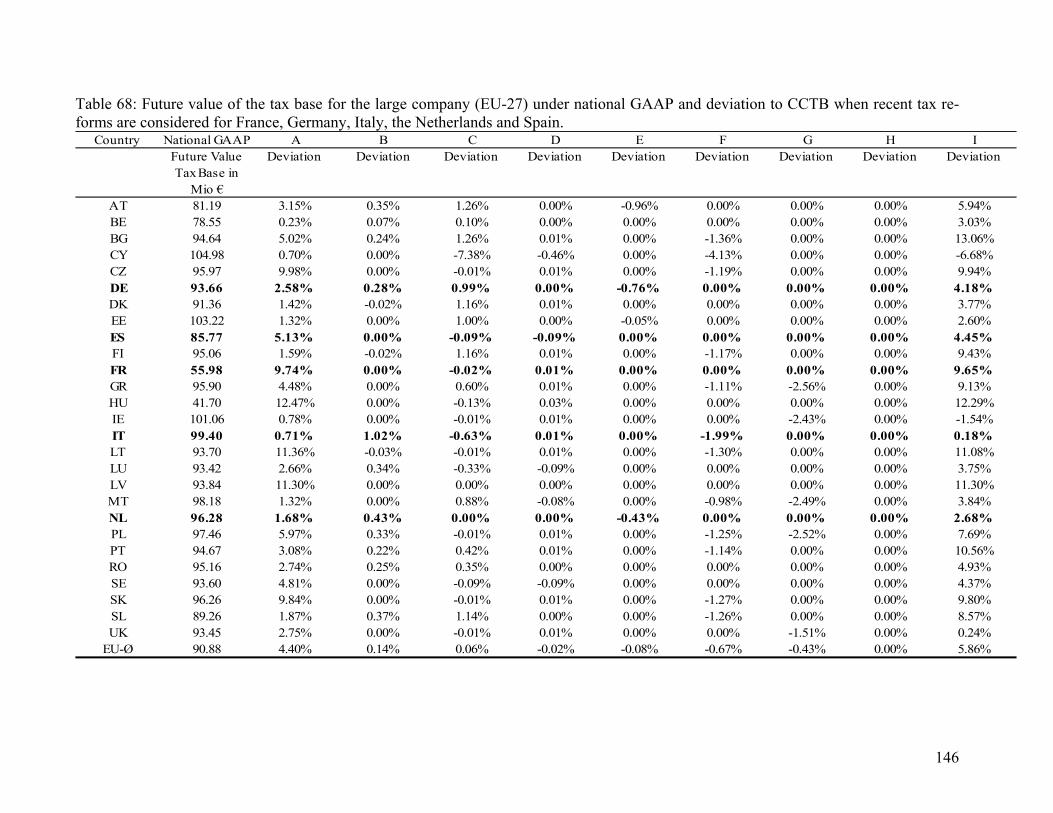
146
Table 68: Future value of the tax base for the large company (EU-27) under national GAAP and deviation to CCTB when recent tax re-forms are considered for France, Germany, Italy, the Netherlands and Spain.
Country National GAAP A B C D E F G H IFuture Value Tax Base in
Mio €
Deviation Deviation Deviation Deviation Deviation Deviation Deviation Deviation Deviation
AT 81.19 3.15% 0.35% 1.26% 0.00% -0.96% 0.00% 0.00% 0.00% 5.94%BE 78.55 0.23% 0.07% 0.10% 0.00% 0.00% 0.00% 0.00% 0.00% 3.03%BG 94.64 5.02% 0.24% 1.26% 0.01% 0.00% -1.36% 0.00% 0.00% 13.06%CY 104.98 0.70% 0.00% -7.38% -0.46% 0.00% -4.13% 0.00% 0.00% -6.68%CZ 95.97 9.98% 0.00% -0.01% 0.01% 0.00% -1.19% 0.00% 0.00% 9.94%DE 93.66 2.58% 0.28% 0.99% 0.00% -0.76% 0.00% 0.00% 0.00% 4.18%DK 91.36 1.42% -0.02% 1.16% 0.01% 0.00% 0.00% 0.00% 0.00% 3.77%EE 103.22 1.32% 0.00% 1.00% 0.00% -0.05% 0.00% 0.00% 0.00% 2.60%ES 85.77 5.13% 0.00% -0.09% -0.09% 0.00% 0.00% 0.00% 0.00% 4.45%FI 95.06 1.59% -0.02% 1.16% 0.01% 0.00% -1.17% 0.00% 0.00% 9.43%FR 55.98 9.74% 0.00% -0.02% 0.01% 0.00% 0.00% 0.00% 0.00% 9.65%GR 95.90 4.48% 0.00% 0.60% 0.01% 0.00% -1.11% -2.56% 0.00% 9.13%HU 41.70 12.47% 0.00% -0.13% 0.03% 0.00% 0.00% 0.00% 0.00% 12.29%IE 101.06 0.78% 0.00% -0.01% 0.01% 0.00% 0.00% -2.43% 0.00% -1.54%IT 99.40 0.71% 1.02% -0.63% 0.01% 0.00% -1.99% 0.00% 0.00% 0.18%LT 93.70 11.36% -0.03% -0.01% 0.01% 0.00% -1.30% 0.00% 0.00% 11.08%LU 93.42 2.66% 0.34% -0.33% -0.09% 0.00% 0.00% 0.00% 0.00% 3.75%LV 93.84 11.30% 0.00% 0.00% 0.00% 0.00% 0.00% 0.00% 0.00% 11.30%MT 98.18 1.32% 0.00% 0.88% -0.08% 0.00% -0.98% -2.49% 0.00% 3.84%NL 96.28 1.68% 0.43% 0.00% 0.00% -0.43% 0.00% 0.00% 0.00% 2.68%PL 97.46 5.97% 0.33% -0.01% 0.01% 0.00% -1.25% -2.52% 0.00% 7.69%PT 94.67 3.08% 0.22% 0.42% 0.01% 0.00% -1.14% 0.00% 0.00% 10.56%RO 95.16 2.74% 0.25% 0.35% 0.00% 0.00% 0.00% 0.00% 0.00% 4.93%SE 93.60 4.81% 0.00% -0.09% -0.09% 0.00% 0.00% 0.00% 0.00% 4.37%SK 96.26 9.84% 0.00% -0.01% 0.01% 0.00% -1.27% 0.00% 0.00% 9.80%SL 89.26 1.87% 0.37% 1.14% 0.00% 0.00% -1.26% 0.00% 0.00% 8.57%UK 93.45 2.75% 0.00% -0.01% 0.01% 0.00% 0.00% -1.51% 0.00% 0.24%
EU-Ø 90.88 4.40% 0.14% 0.06% -0.02% -0.08% -0.67% -0.43% 0.00% 5.86%
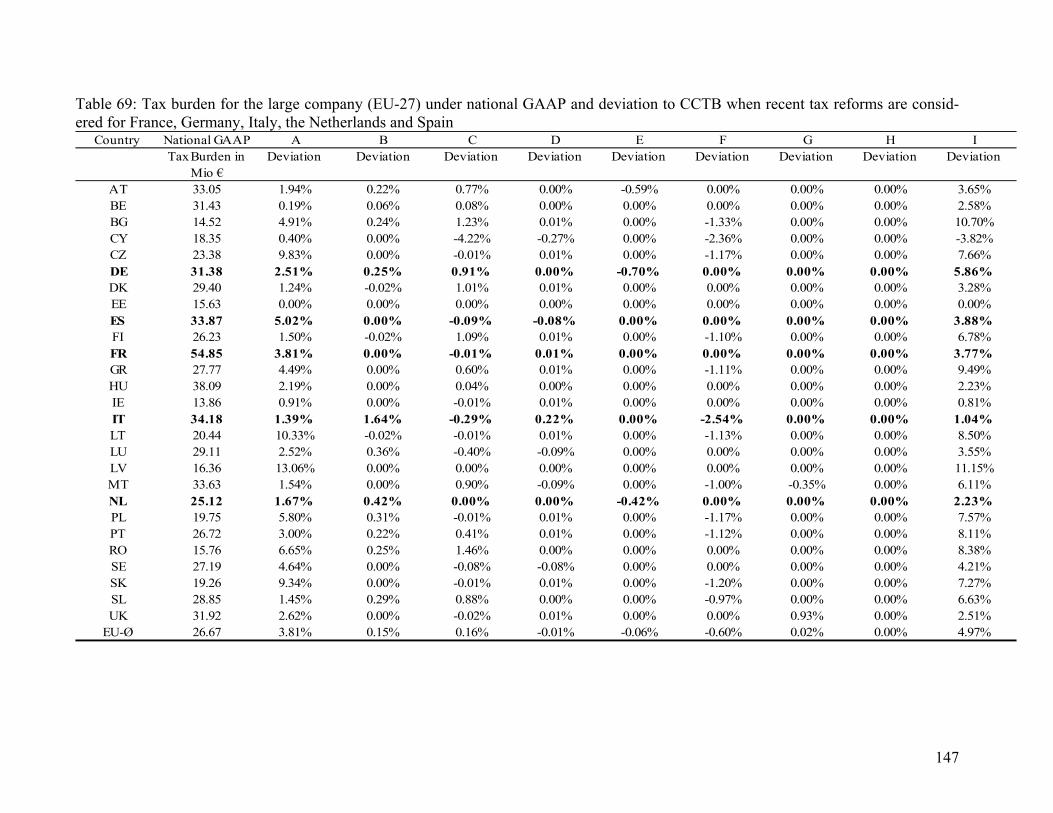
147
Table 69: Tax burden for the large company (EU-27) under national GAAP and deviation to CCTB when recent tax reforms are consid-ered for France, Germany, Italy, the Netherlands and Spain
Country National GAAP A B C D E F G H ITax Burden in
Mio €Deviation Deviation Deviation Deviation Deviation Deviation Deviation Deviation Deviation
AT 33.05 1.94% 0.22% 0.77% 0.00% -0.59% 0.00% 0.00% 0.00% 3.65%BE 31.43 0.19% 0.06% 0.08% 0.00% 0.00% 0.00% 0.00% 0.00% 2.58%BG 14.52 4.91% 0.24% 1.23% 0.01% 0.00% -1.33% 0.00% 0.00% 10.70%CY 18.35 0.40% 0.00% -4.22% -0.27% 0.00% -2.36% 0.00% 0.00% -3.82%CZ 23.38 9.83% 0.00% -0.01% 0.01% 0.00% -1.17% 0.00% 0.00% 7.66%DE 31.38 2.51% 0.25% 0.91% 0.00% -0.70% 0.00% 0.00% 0.00% 5.86%DK 29.40 1.24% -0.02% 1.01% 0.01% 0.00% 0.00% 0.00% 0.00% 3.28%EE 15.63 0.00% 0.00% 0.00% 0.00% 0.00% 0.00% 0.00% 0.00% 0.00%ES 33.87 5.02% 0.00% -0.09% -0.08% 0.00% 0.00% 0.00% 0.00% 3.88%FI 26.23 1.50% -0.02% 1.09% 0.01% 0.00% -1.10% 0.00% 0.00% 6.78%FR 54.85 3.81% 0.00% -0.01% 0.01% 0.00% 0.00% 0.00% 0.00% 3.77%GR 27.77 4.49% 0.00% 0.60% 0.01% 0.00% -1.11% 0.00% 0.00% 9.49%HU 38.09 2.19% 0.00% 0.04% 0.00% 0.00% 0.00% 0.00% 0.00% 2.23%IE 13.86 0.91% 0.00% -0.01% 0.01% 0.00% 0.00% 0.00% 0.00% 0.81%IT 34.18 1.39% 1.64% -0.29% 0.22% 0.00% -2.54% 0.00% 0.00% 1.04%LT 20.44 10.33% -0.02% -0.01% 0.01% 0.00% -1.13% 0.00% 0.00% 8.50%LU 29.11 2.52% 0.36% -0.40% -0.09% 0.00% 0.00% 0.00% 0.00% 3.55%LV 16.36 13.06% 0.00% 0.00% 0.00% 0.00% 0.00% 0.00% 0.00% 11.15%MT 33.63 1.54% 0.00% 0.90% -0.09% 0.00% -1.00% -0.35% 0.00% 6.11%NL 25.12 1.67% 0.42% 0.00% 0.00% -0.42% 0.00% 0.00% 0.00% 2.23%PL 19.75 5.80% 0.31% -0.01% 0.01% 0.00% -1.17% 0.00% 0.00% 7.57%PT 26.72 3.00% 0.22% 0.41% 0.01% 0.00% -1.12% 0.00% 0.00% 8.11%RO 15.76 6.65% 0.25% 1.46% 0.00% 0.00% 0.00% 0.00% 0.00% 8.38%SE 27.19 4.64% 0.00% -0.08% -0.08% 0.00% 0.00% 0.00% 0.00% 4.21%SK 19.26 9.34% 0.00% -0.01% 0.01% 0.00% -1.20% 0.00% 0.00% 7.27%SL 28.85 1.45% 0.29% 0.88% 0.00% 0.00% -0.97% 0.00% 0.00% 6.63%UK 31.92 2.62% 0.00% -0.02% 0.01% 0.00% 0.00% 0.93% 0.00% 2.51%
EU-Ø 26.67 3.81% 0.15% 0.16% -0.01% -0.06% -0.60% 0.02% 0.00% 4.97%
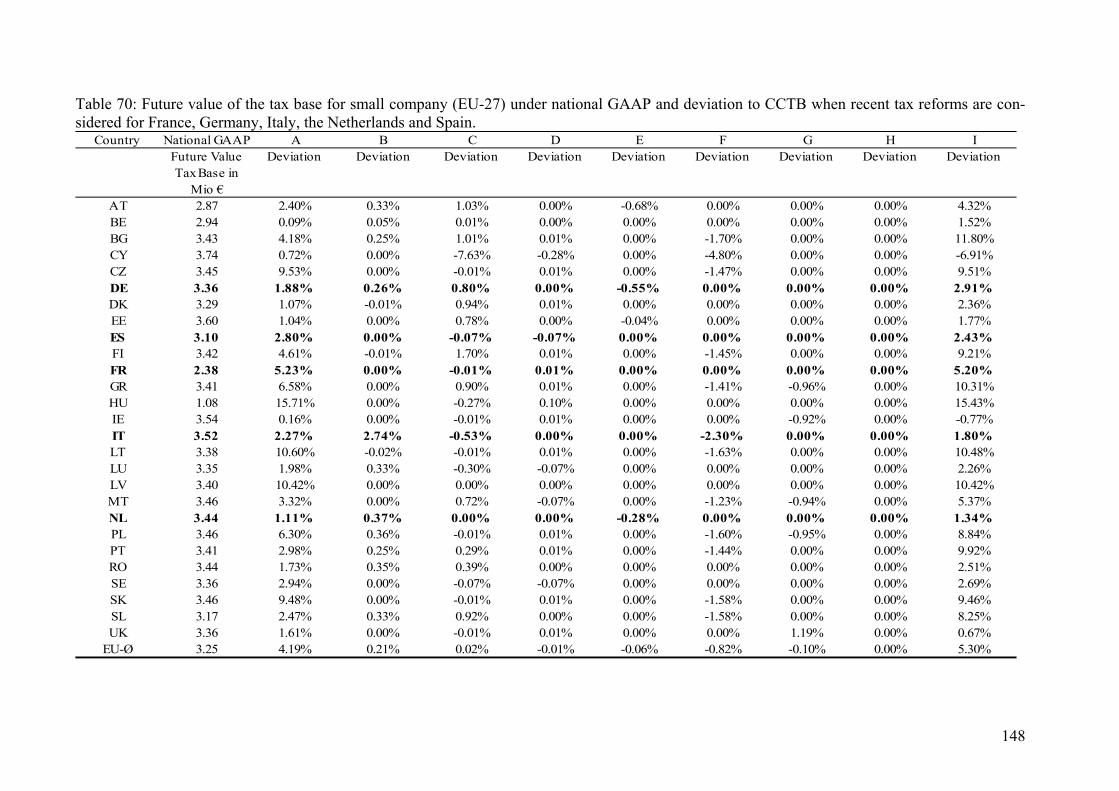
148
Table 70: Future value of the tax base for small company (EU-27) under national GAAP and deviation to CCTB when recent tax reforms are con-sidered for France, Germany, Italy, the Netherlands and Spain.
Country National GAAP A B C D E F G H IFuture Value Tax Base in
Mio €
Deviation Deviation Deviation Deviation Deviation Deviation Deviation Deviation Deviation
AT 2.87 2.40% 0.33% 1.03% 0.00% -0.68% 0.00% 0.00% 0.00% 4.32%BE 2.94 0.09% 0.05% 0.01% 0.00% 0.00% 0.00% 0.00% 0.00% 1.52%BG 3.43 4.18% 0.25% 1.01% 0.01% 0.00% -1.70% 0.00% 0.00% 11.80%CY 3.74 0.72% 0.00% -7.63% -0.28% 0.00% -4.80% 0.00% 0.00% -6.91%CZ 3.45 9.53% 0.00% -0.01% 0.01% 0.00% -1.47% 0.00% 0.00% 9.51%DE 3.36 1.88% 0.26% 0.80% 0.00% -0.55% 0.00% 0.00% 0.00% 2.91%DK 3.29 1.07% -0.01% 0.94% 0.01% 0.00% 0.00% 0.00% 0.00% 2.36%EE 3.60 1.04% 0.00% 0.78% 0.00% -0.04% 0.00% 0.00% 0.00% 1.77%ES 3.10 2.80% 0.00% -0.07% -0.07% 0.00% 0.00% 0.00% 0.00% 2.43%FI 3.42 4.61% -0.01% 1.70% 0.01% 0.00% -1.45% 0.00% 0.00% 9.21%FR 2.38 5.23% 0.00% -0.01% 0.01% 0.00% 0.00% 0.00% 0.00% 5.20%GR 3.41 6.58% 0.00% 0.90% 0.01% 0.00% -1.41% -0.96% 0.00% 10.31%HU 1.08 15.71% 0.00% -0.27% 0.10% 0.00% 0.00% 0.00% 0.00% 15.43%IE 3.54 0.16% 0.00% -0.01% 0.01% 0.00% 0.00% -0.92% 0.00% -0.77%IT 3.52 2.27% 2.74% -0.53% 0.00% 0.00% -2.30% 0.00% 0.00% 1.80%LT 3.38 10.60% -0.02% -0.01% 0.01% 0.00% -1.63% 0.00% 0.00% 10.48%LU 3.35 1.98% 0.33% -0.30% -0.07% 0.00% 0.00% 0.00% 0.00% 2.26%LV 3.40 10.42% 0.00% 0.00% 0.00% 0.00% 0.00% 0.00% 0.00% 10.42%MT 3.46 3.32% 0.00% 0.72% -0.07% 0.00% -1.23% -0.94% 0.00% 5.37%NL 3.44 1.11% 0.37% 0.00% 0.00% -0.28% 0.00% 0.00% 0.00% 1.34%PL 3.46 6.30% 0.36% -0.01% 0.01% 0.00% -1.60% -0.95% 0.00% 8.84%PT 3.41 2.98% 0.25% 0.29% 0.01% 0.00% -1.44% 0.00% 0.00% 9.92%RO 3.44 1.73% 0.35% 0.39% 0.00% 0.00% 0.00% 0.00% 0.00% 2.51%SE 3.36 2.94% 0.00% -0.07% -0.07% 0.00% 0.00% 0.00% 0.00% 2.69%SK 3.46 9.48% 0.00% -0.01% 0.01% 0.00% -1.58% 0.00% 0.00% 9.46%SL 3.17 2.47% 0.33% 0.92% 0.00% 0.00% -1.58% 0.00% 0.00% 8.25%UK 3.36 1.61% 0.00% -0.01% 0.01% 0.00% 0.00% 1.19% 0.00% 0.67%
EU-Ø 3.25 4.19% 0.21% 0.02% -0.01% -0.06% -0.82% -0.10% 0.00% 5.30%
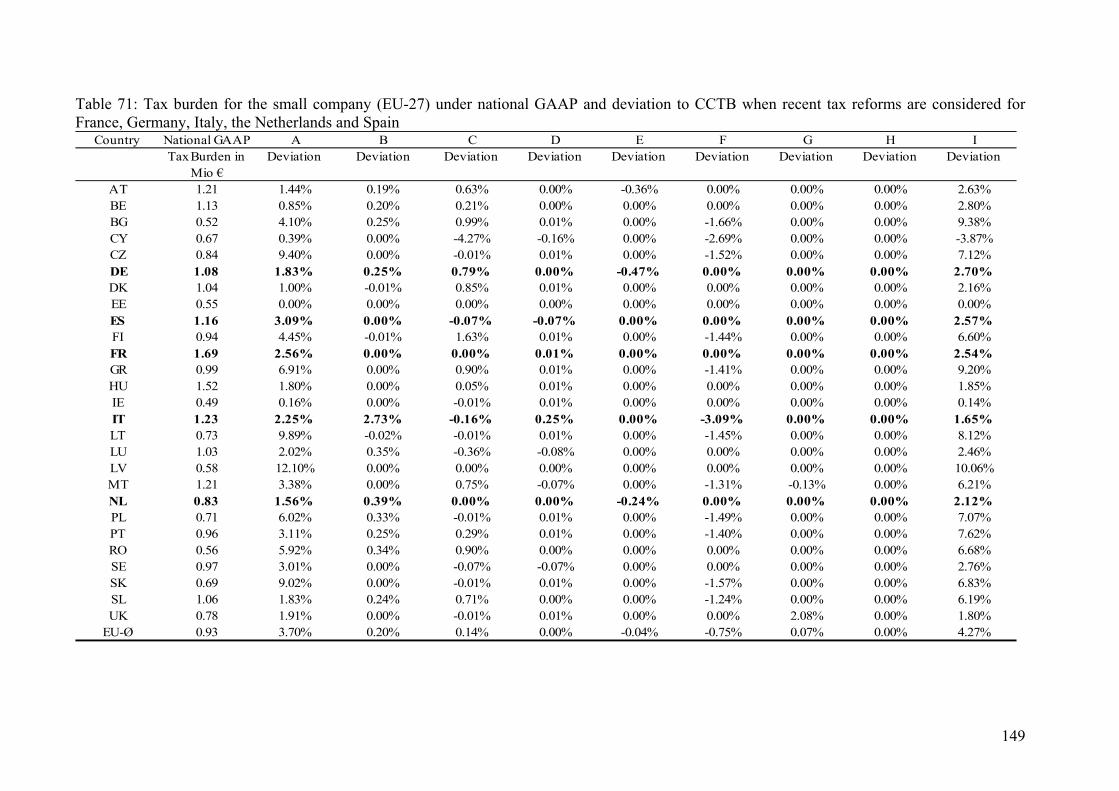
149
Table 71: Tax burden for the small company (EU-27) under national GAAP and deviation to CCTB when recent tax reforms are considered for France, Germany, Italy, the Netherlands and Spain
Country National GAAP A B C D E F G H ITax Burden in
Mio €Deviation Deviation Deviation Deviation Deviation Deviation Deviation Deviation Deviation
AT 1.21 1.44% 0.19% 0.63% 0.00% -0.36% 0.00% 0.00% 0.00% 2.63%BE 1.13 0.85% 0.20% 0.21% 0.00% 0.00% 0.00% 0.00% 0.00% 2.80%BG 0.52 4.10% 0.25% 0.99% 0.01% 0.00% -1.66% 0.00% 0.00% 9.38%CY 0.67 0.39% 0.00% -4.27% -0.16% 0.00% -2.69% 0.00% 0.00% -3.87%CZ 0.84 9.40% 0.00% -0.01% 0.01% 0.00% -1.52% 0.00% 0.00% 7.12%DE 1.08 1.83% 0.25% 0.79% 0.00% -0.47% 0.00% 0.00% 0.00% 2.70%DK 1.04 1.00% -0.01% 0.85% 0.01% 0.00% 0.00% 0.00% 0.00% 2.16%EE 0.55 0.00% 0.00% 0.00% 0.00% 0.00% 0.00% 0.00% 0.00% 0.00%ES 1.16 3.09% 0.00% -0.07% -0.07% 0.00% 0.00% 0.00% 0.00% 2.57%FI 0.94 4.45% -0.01% 1.63% 0.01% 0.00% -1.44% 0.00% 0.00% 6.60%FR 1.69 2.56% 0.00% 0.00% 0.01% 0.00% 0.00% 0.00% 0.00% 2.54%GR 0.99 6.91% 0.00% 0.90% 0.01% 0.00% -1.41% 0.00% 0.00% 9.20%HU 1.52 1.80% 0.00% 0.05% 0.01% 0.00% 0.00% 0.00% 0.00% 1.85%IE 0.49 0.16% 0.00% -0.01% 0.01% 0.00% 0.00% 0.00% 0.00% 0.14%IT 1.23 2.25% 2.73% -0.16% 0.25% 0.00% -3.09% 0.00% 0.00% 1.65%LT 0.73 9.89% -0.02% -0.01% 0.01% 0.00% -1.45% 0.00% 0.00% 8.12%LU 1.03 2.02% 0.35% -0.36% -0.08% 0.00% 0.00% 0.00% 0.00% 2.46%LV 0.58 12.10% 0.00% 0.00% 0.00% 0.00% 0.00% 0.00% 0.00% 10.06%MT 1.21 3.38% 0.00% 0.75% -0.07% 0.00% -1.31% -0.13% 0.00% 6.21%NL 0.83 1.56% 0.39% 0.00% 0.00% -0.24% 0.00% 0.00% 0.00% 2.12%PL 0.71 6.02% 0.33% -0.01% 0.01% 0.00% -1.49% 0.00% 0.00% 7.07%PT 0.96 3.11% 0.25% 0.29% 0.01% 0.00% -1.40% 0.00% 0.00% 7.62%RO 0.56 5.92% 0.34% 0.90% 0.00% 0.00% 0.00% 0.00% 0.00% 6.68%SE 0.97 3.01% 0.00% -0.07% -0.07% 0.00% 0.00% 0.00% 0.00% 2.76%SK 0.69 9.02% 0.00% -0.01% 0.01% 0.00% -1.57% 0.00% 0.00% 6.83%SL 1.06 1.83% 0.24% 0.71% 0.00% 0.00% -1.24% 0.00% 0.00% 6.19%UK 0.78 1.91% 0.00% -0.01% 0.01% 0.00% 0.00% 2.08% 0.00% 1.80%
EU-Ø 0.93 3.70% 0.20% 0.14% 0.00% -0.04% -0.75% 0.07% 0.00% 4.27%
150
5. Summary of Conclusions
The introduction of a CCTB as considered here has a considerable impact on the values of the tax base in the EU member states. Except for Cyprus and Ireland, the values of the tax base would increase in all countries. There is considerable variation among sectors and the size of companies. In this context, capi-tal intensity and profitability turn out to be the most relevant factors out of the economic as-sumptions in the event of a CCTB. The considered options for a CCTB show different impacts on the value of the tax base. The option with the strongest impact on the tax base is the rules concerning depreciation. Countries affected most by the introduction of a CCTB are Bulgaria, Hungary, Latvia, Lithuania and Portugal. Sensitivity analyses reveal Greece, France and Slovakia as countries with strong impact as well.
151
IV. References European Commission (2001b), Company Taxation in the Internal Market, Communication
from the Commission to the Council, the European Parliament and the European Economic
and Social Committee, COM (2001), 582 final, Brussels.
Gutekunst, G. (2005), Steuerbelastungen und Steuerwirkungen bei nationaler und grenzüber-
schreitender Geschäftstätigkeit, Lohmar.
Endres, D./Oestreicher, A./Scheffler, W./Spengel, C. (2007), The Determination of Corporate Taxable Income in the EU Member States, Alphen aan den Rijn
Hermann, R.A. (2006), Die Besteuerung von Personengesellschaften in den EU-
Mitgliedstaaten und den USA, Lohmar.
Jacobs, O.H./Spengel, C. (Tax Analyzer, 1996): European Tax Analyzer : EDVgestützter
Vergleich der Steuerbelastung von Kapitalgesellschaften in Deutschland,
Frankreich und Großbritannien, Baden-Baden.
Lammersen, L. (2005): Steuerbelastungsvergleiche, Wiesbaden.
Meyer, R. (1996), Computergestützte Simulation von Steuerbelastungen, ZEW Schriftenrei-
he, Baden-Baden.
Schreiber, U., C. Spengel and L. Lammersen (2002), Measuring the Impact of Taxation on
Investment and Financial Decisions, in: Schmalenbach business review, 2-23.
Spengel, C. (1995), Europäische Steuerbelastungsvergleiche: Deutschland – Frankreich –
Großbritannien, Düsseldorf.
Stetter, T. (2005), Computergestützte internationale Steuerbelastungsvergleiche. Baustein-
basiertes Metamodell zur Modellierung von Steuersystemen, Lohmar.

152
Council Directive 90/434/EEC of 23 July 1990 on the Common System of Taxation Applica-
ble to Mergers, Divisions, Transfers of Assets and Exchanges of Shares Concerning Compa-
nies of Different Member States, Official Journal of the European Communities No. L 225/1.
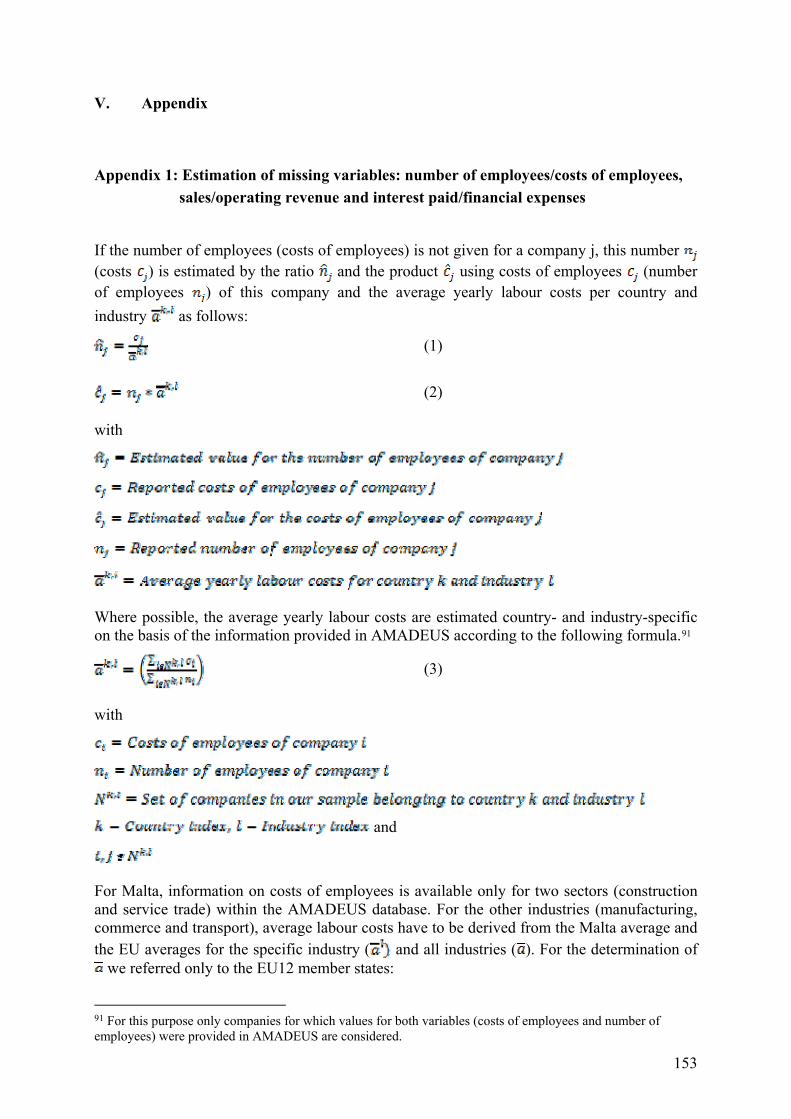
153
V. Appendix
Appendix 1: Estimation of missing variables: number of employees/costs of employees,
sales/operating revenue and interest paid/financial expenses
If the number of employees (costs of employees) is not given for a company j, this number (costs ) is estimated by the ratio and the product using costs of employees (number of employees ) of this company and the average yearly labour costs per country and
industry as follows:
(1)
(2)
with
Where possible, the average yearly labour costs are estimated country- and industry-specific on the basis of the information provided in AMADEUS according to the following formula.91
(3)
with
and
For Malta, information on costs of employees is available only for two sectors (construction and service trade) within the AMADEUS database. For the other industries (manufacturing, commerce and transport), average labour costs have to be derived from the Malta average and the EU averages for the specific industry ( and all industries ( ). For the determination of
we referred only to the EU12 member states:
91 For this purpose only companies for which values for both variables (costs of employees and number of employees) were provided in AMADEUS are considered.
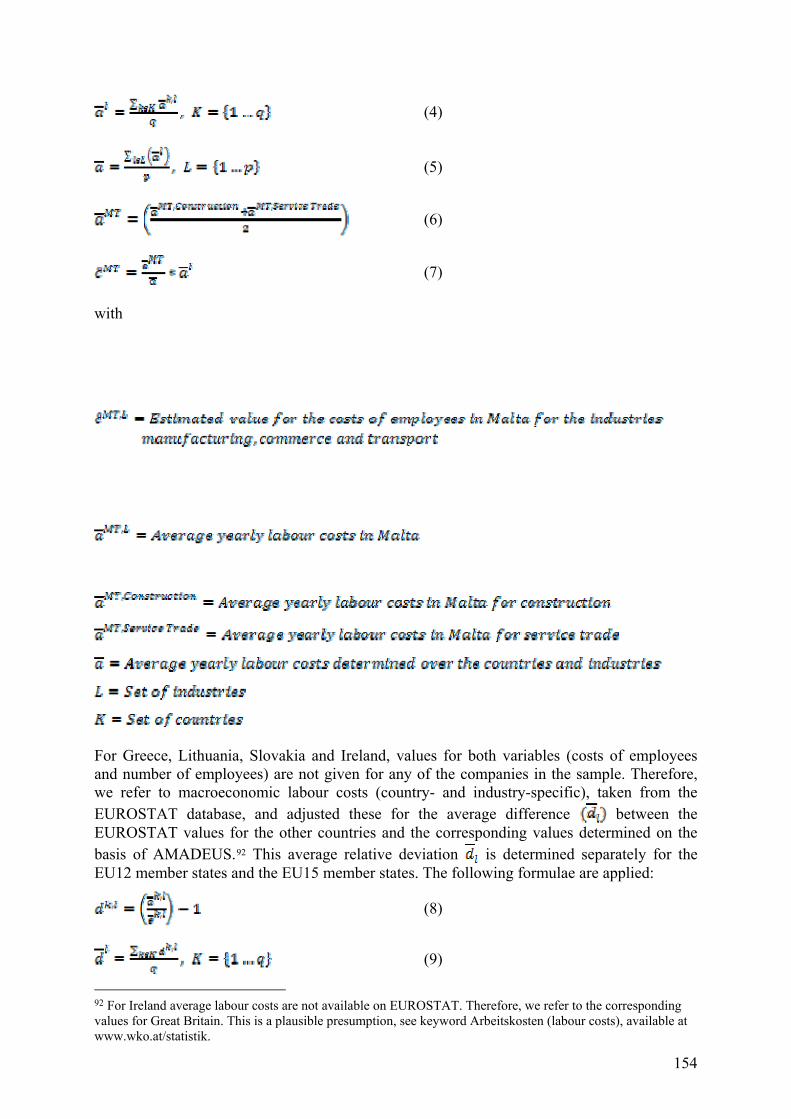
154
(4)
(5)
(6)
(7)
with
For Greece, Lithuania, Slovakia and Ireland, values for both variables (costs of employees and number of employees) are not given for any of the companies in the sample. Therefore, we refer to macroeconomic labour costs (country- and industry-specific), taken from the EUROSTAT database, and adjusted these for the average difference between the EUROSTAT values for the other countries and the corresponding values determined on the basis of AMADEUS.92 This average relative deviation is determined separately for the EU12 member states and the EU15 member states. The following formulae are applied:
(8)
(9)
92 For Ireland average labour costs are not available on EUROSTAT. Therefore, we refer to the corresponding values for Great Britain. This is a plausible presumption, see keyword Arbeitskosten (labour costs), available at www.wko.at/statistik.
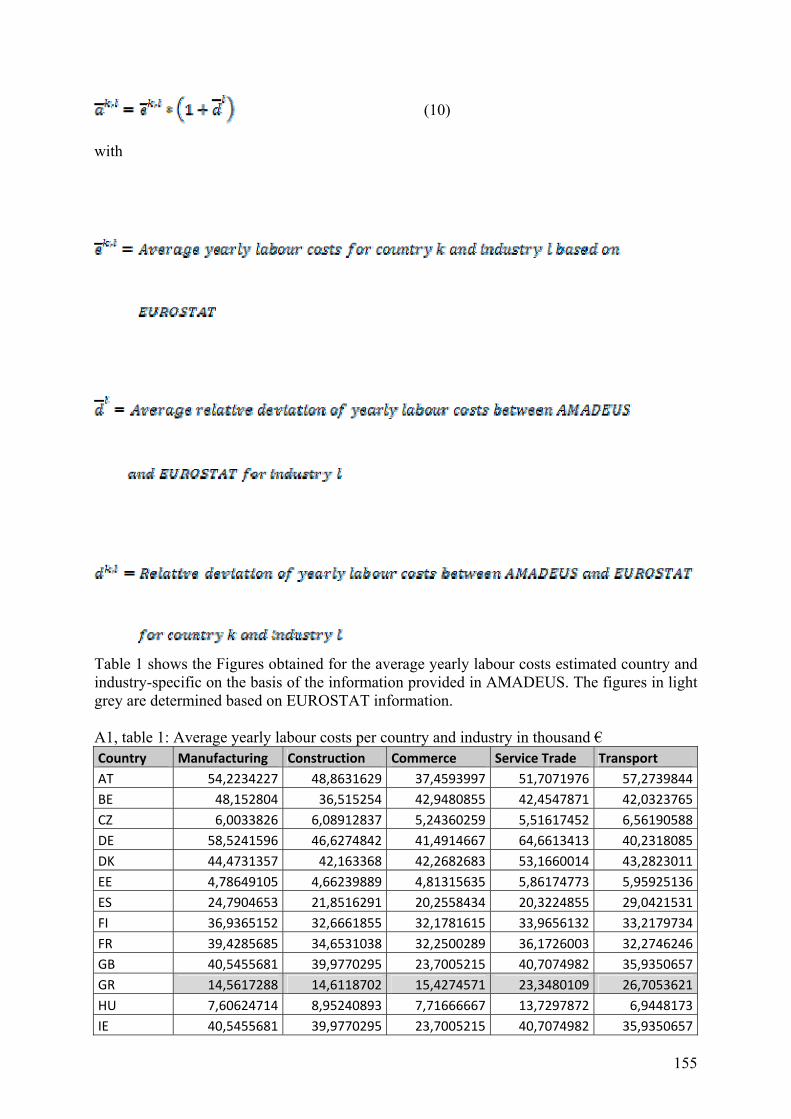
155
(10)
with
Table 1 shows the Figures obtained for the average yearly labour costs estimated country and industry-specific on the basis of the information provided in AMADEUS. The figures in light grey are determined based on EUROSTAT information. A1, table 1: Average yearly labour costs per country and industry in thousand € Country Manufacturing Construction Commerce Service Trade Transport AT 54,2234227 48,8631629 37,4593997 51,7071976 57,2739844BE 48,152804 36,515254 42,9480855 42,4547871 42,0323765CZ 6,0033826 6,08912837 5,24360259 5,51617452 6,56190588DE 58,5241596 46,6274842 41,4914667 64,6613413 40,2318085DK 44,4731357 42,163368 42,2682683 53,1660014 43,2823011EE 4,78649105 4,66239889 4,81315635 5,86174773 5,95925136ES 24,7904653 21,8516291 20,2558434 20,3224855 29,0421531FI 36,9365152 32,6661855 32,1781615 33,9656132 33,2179734FR 39,4285685 34,6531038 32,2500289 36,1726003 32,2746246GB 40,5455681 39,9770295 23,7005215 40,7074982 35,9350657GR 14,5617288 14,6118702 15,4274571 23,3480109 26,7053621HU 7,60624714 8,95240893 7,71666667 13,7297872 6,9448173IE 40,5455681 39,9770295 23,7005215 40,7074982 35,9350657
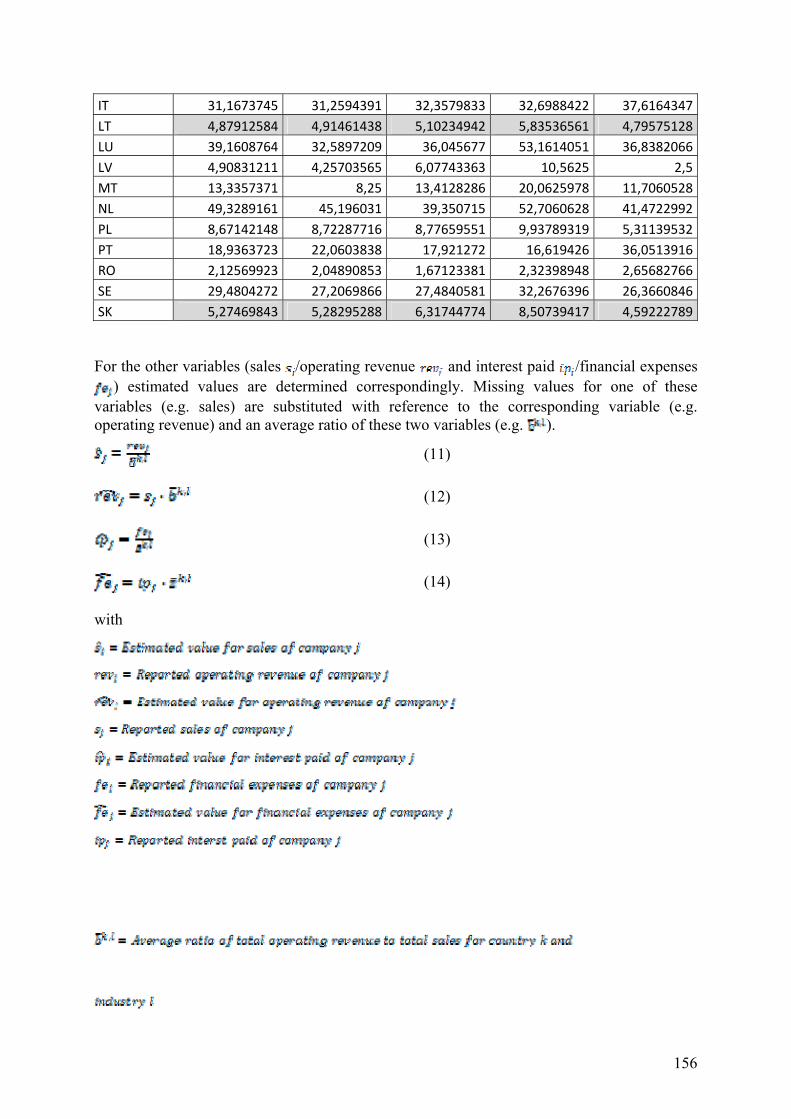
156
IT 31,1673745 31,2594391 32,3579833 32,6988422 37,6164347LT 4,87912584 4,91461438 5,10234942 5,83536561 4,79575128LU 39,1608764 32,5897209 36,045677 53,1614051 36,8382066LV 4,90831211 4,25703565 6,07743363 10,5625 2,5MT 13,3357371 8,25 13,4128286 20,0625978 11,7060528NL 49,3289161 45,196031 39,350715 52,7060628 41,4722992PL 8,67142148 8,72287716 8,77659551 9,93789319 5,31139532PT 18,9363723 22,0603838 17,921272 16,619426 36,0513916RO 2,12569923 2,04890853 1,67123381 2,32398948 2,65682766SE 29,4804272 27,2069866 27,4840581 32,2676396 26,3660846SK 5,27469843 5,28295288 6,31744774 8,50739417 4,59222789
For the other variables (sales /operating revenue and interest paid /financial expenses ) estimated values are determined correspondingly. Missing values for one of these
variables (e.g. sales) are substituted with reference to the corresponding variable (e.g. operating revenue) and an average ratio of these two variables (e.g. ).
(11)
(12)
(13)
(14)
with
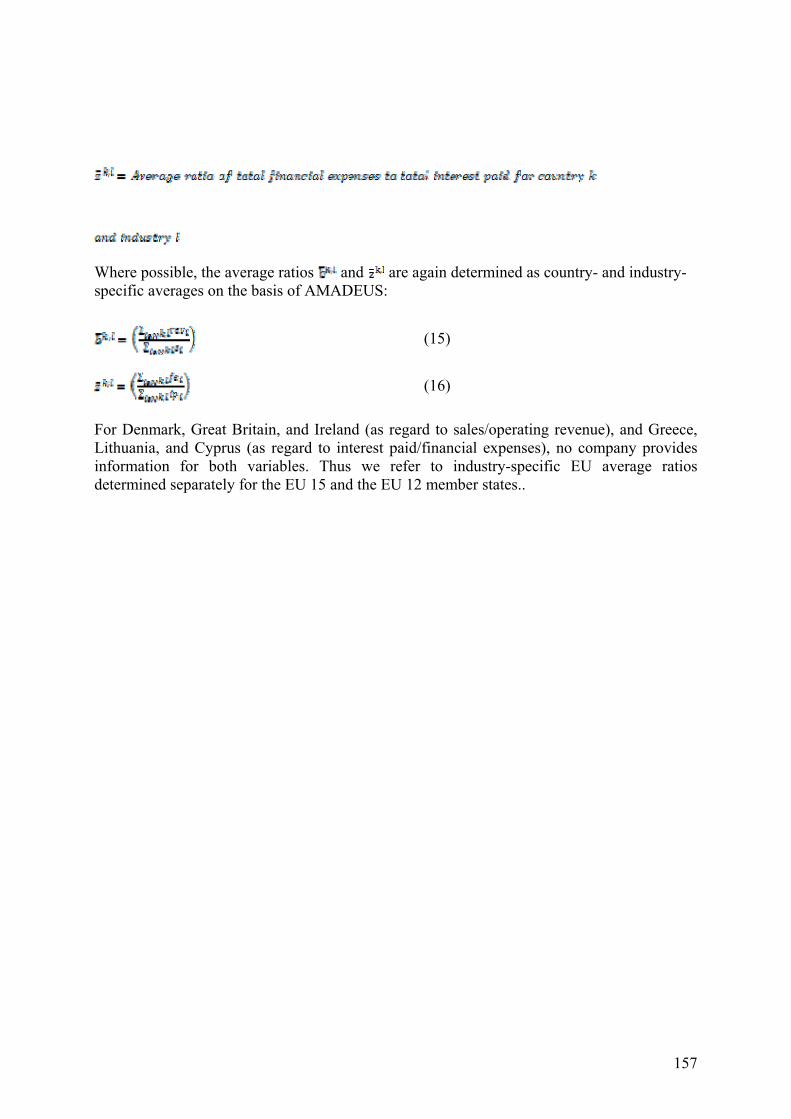
157
Where possible, the average ratios and are again determined as country- and industry-specific averages on the basis of AMADEUS:
(15)
(16)
For Denmark, Great Britain, and Ireland (as regard to sales/operating revenue), and Greece, Lithuania, and Cyprus (as regard to interest paid/financial expenses), no company provides information for both variables. Thus we refer to industry-specific EU average ratios determined separately for the EU 15 and the EU 12 member states..
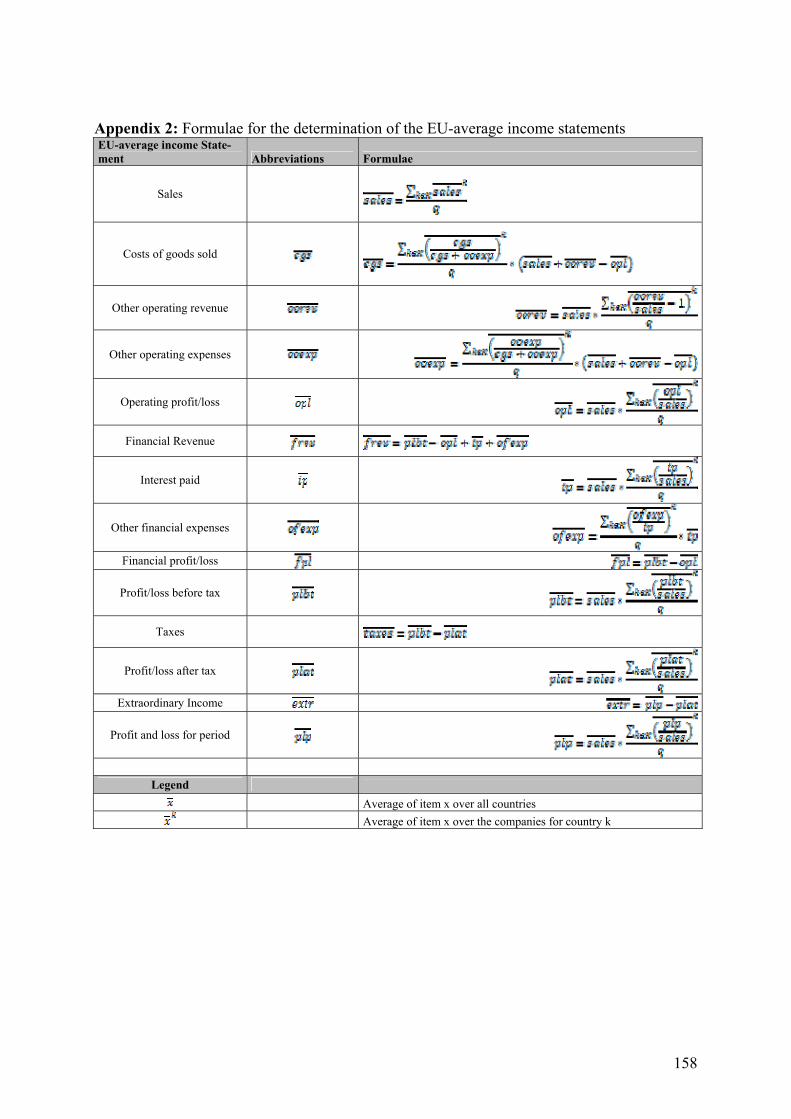
158
Appendix 2: Formulae for the determination of the EU-average income statements EU-average income State-ment Abbreviations Formulae
Sales
Costs of goods sold
Other operating revenue
Other operating expenses
Operating profit/loss
Financial Revenue
Interest paid
Other financial expenses
Financial profit/loss
Profit/loss before tax
Taxes
Profit/loss after tax
Extraordinary Income
Profit and loss for period
Legend
Average of item x over all countries
Average of item x over the companies for country k
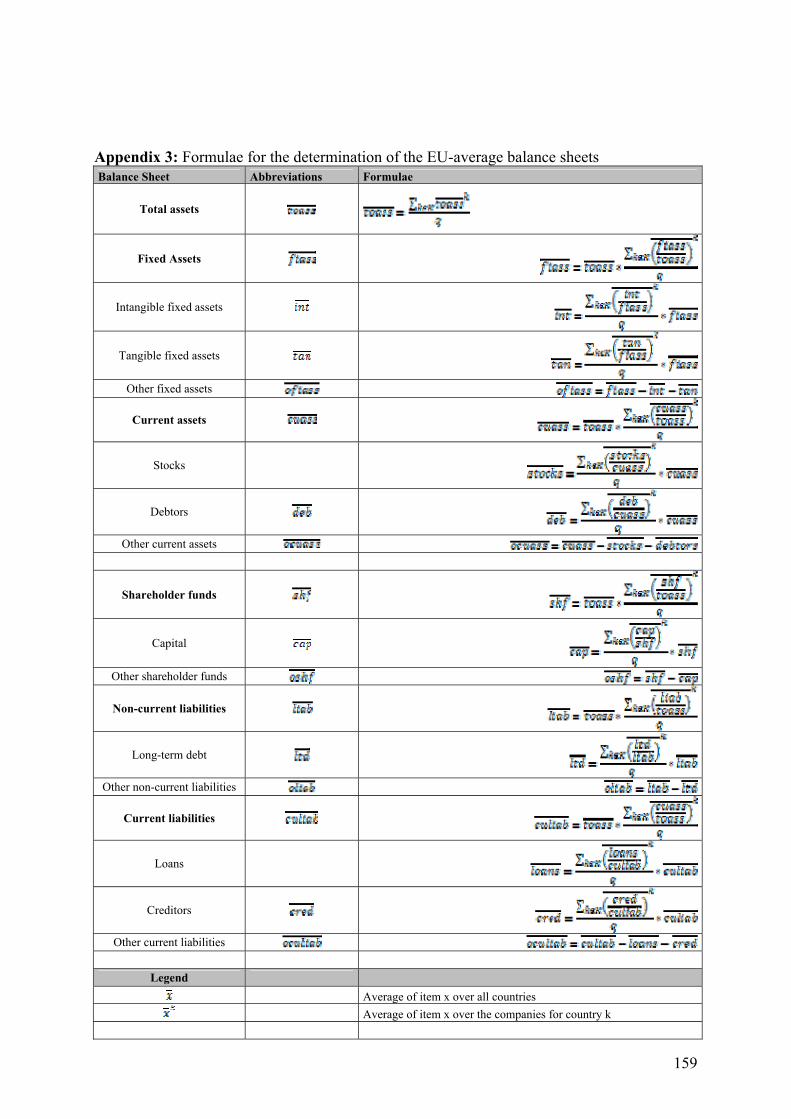
159
Appendix 3: Formulae for the determination of the EU-average balance sheets Balance Sheet Abbreviations Formulae
Total assets
Fixed Assets
Intangible fixed assets
Tangible fixed assets
Other fixed assets
Current assets
Stocks
Debtors
Other current assets
Shareholder funds
Capital
Other shareholder funds
Non-current liabilities
Long-term debt
Other non-current liabilities
Current liabilities
Loans
Creditors
Other current liabilities
Legend
Average of item x over all countries
Average of item x over the companies for country k
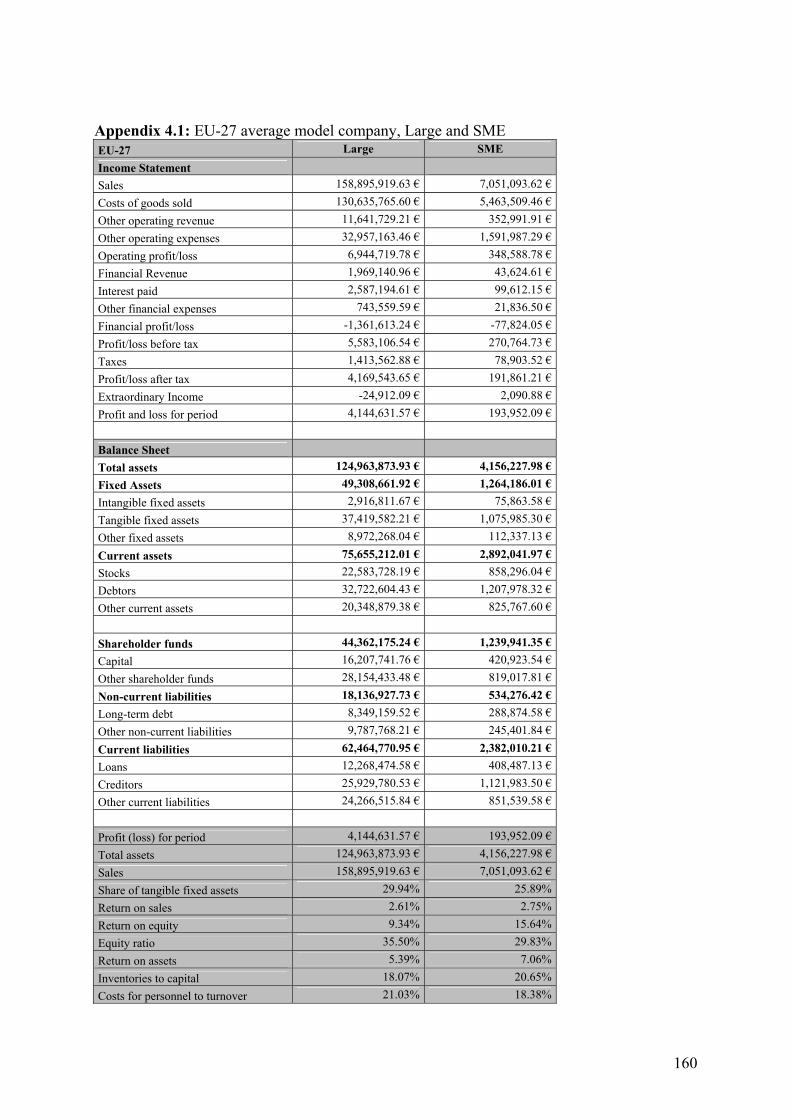
160
Appendix 4.1: EU-27 average model company, Large and SME EU-27 Large SME
Income Statement
Sales 158,895,919.63 € 7,051,093.62 €
Costs of goods sold 130,635,765.60 € 5,463,509.46 €
Other operating revenue 11,641,729.21 € 352,991.91 €
Other operating expenses 32,957,163.46 € 1,591,987.29 €
Operating profit/loss 6,944,719.78 € 348,588.78 €
Financial Revenue 1,969,140.96 € 43,624.61 €
Interest paid 2,587,194.61 € 99,612.15 €
Other financial expenses 743,559.59 € 21,836.50 €
Financial profit/loss -1,361,613.24 € -77,824.05 €
Profit/loss before tax 5,583,106.54 € 270,764.73 €
Taxes 1,413,562.88 € 78,903.52 €
Profit/loss after tax 4,169,543.65 € 191,861.21 €
Extraordinary Income -24,912.09 € 2,090.88 €
Profit and loss for period 4,144,631.57 € 193,952.09 €
Balance Sheet
Total assets 124,963,873.93 € 4,156,227.98 €
Fixed Assets 49,308,661.92 € 1,264,186.01 €
Intangible fixed assets 2,916,811.67 € 75,863.58 €
Tangible fixed assets 37,419,582.21 € 1,075,985.30 €
Other fixed assets 8,972,268.04 € 112,337.13 €
Current assets 75,655,212.01 € 2,892,041.97 €
Stocks 22,583,728.19 € 858,296.04 €
Debtors 32,722,604.43 € 1,207,978.32 €
Other current assets 20,348,879.38 € 825,767.60 €
Shareholder funds 44,362,175.24 € 1,239,941.35 €
Capital 16,207,741.76 € 420,923.54 €
Other shareholder funds 28,154,433.48 € 819,017.81 €
Non-current liabilities 18,136,927.73 € 534,276.42 €
Long-term debt 8,349,159.52 € 288,874.58 €
Other non-current liabilities 9,787,768.21 € 245,401.84 €
Current liabilities 62,464,770.95 € 2,382,010.21 €
Loans 12,268,474.58 € 408,487.13 €
Creditors 25,929,780.53 € 1,121,983.50 €
Other current liabilities 24,266,515.84 € 851,539.58 €
Profit (loss) for period 4,144,631.57 € 193,952.09 €
Total assets 124,963,873.93 € 4,156,227.98 €
Sales 158,895,919.63 € 7,051,093.62 €
Share of tangible fixed assets 29.94% 25.89%
Return on sales 2.61% 2.75%
Return on equity 9.34% 15.64%
Equity ratio 35.50% 29.83%
Return on assets 5.39% 7.06%
Inventories to capital 18.07% 20.65%
Costs for personnel to turnover 21.03% 18.38%
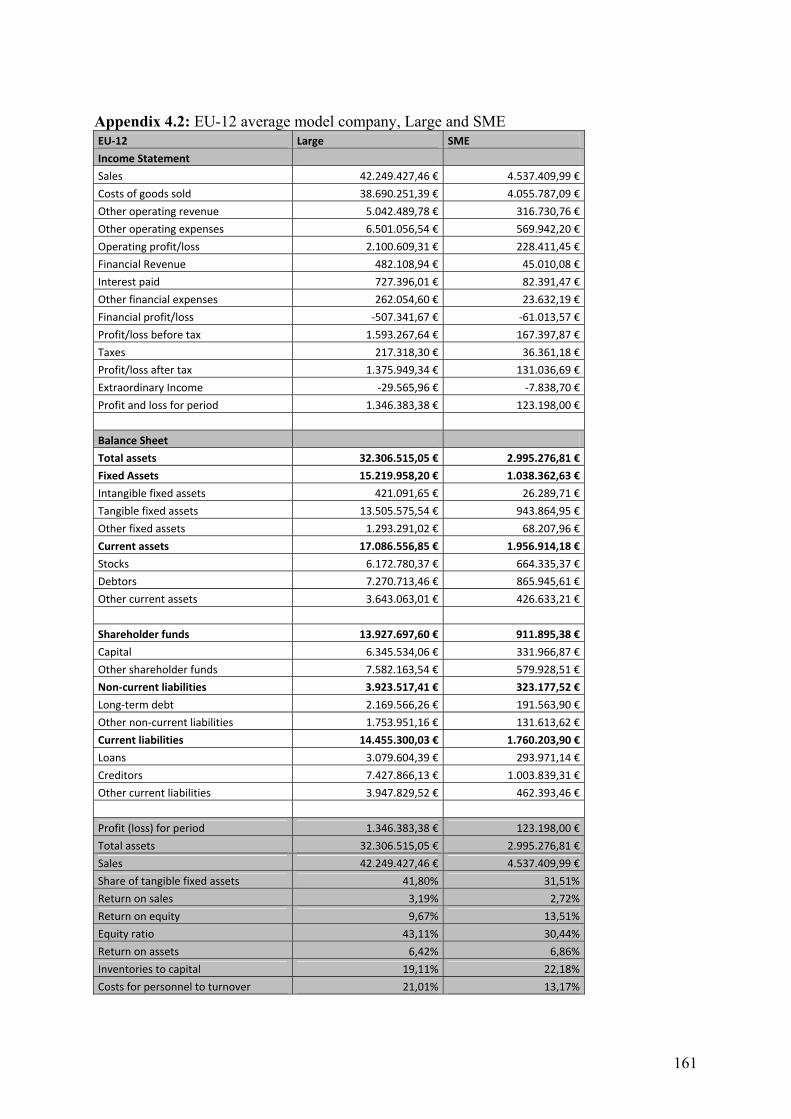
161
Appendix 4.2: EU-12 average model company, Large and SME EU-12 Large SME
Income Statement
Sales 42.249.427,46 € 4.537.409,99 €
Costs of goods sold 38.690.251,39 € 4.055.787,09 €
Other operating revenue 5.042.489,78 € 316.730,76 €
Other operating expenses 6.501.056,54 € 569.942,20 €
Operating profit/loss 2.100.609,31 € 228.411,45 €
Financial Revenue 482.108,94 € 45.010,08 €
Interest paid 727.396,01 € 82.391,47 €
Other financial expenses 262.054,60 € 23.632,19 €
Financial profit/loss -507.341,67 € -61.013,57 €
Profit/loss before tax 1.593.267,64 € 167.397,87 €
Taxes 217.318,30 € 36.361,18 €
Profit/loss after tax 1.375.949,34 € 131.036,69 €
Extraordinary Income -29.565,96 € -7.838,70 €
Profit and loss for period 1.346.383,38 € 123.198,00 €
Balance Sheet
Total assets 32.306.515,05 € 2.995.276,81 €
Fixed Assets 15.219.958,20 € 1.038.362,63 €
Intangible fixed assets 421.091,65 € 26.289,71 €
Tangible fixed assets 13.505.575,54 € 943.864,95 €
Other fixed assets 1.293.291,02 € 68.207,96 €
Current assets 17.086.556,85 € 1.956.914,18 €
Stocks 6.172.780,37 € 664.335,37 €
Debtors 7.270.713,46 € 865.945,61 €
Other current assets 3.643.063,01 € 426.633,21 €
Shareholder funds 13.927.697,60 € 911.895,38 €
Capital 6.345.534,06 € 331.966,87 €
Other shareholder funds 7.582.163,54 € 579.928,51 €
Non-current liabilities 3.923.517,41 € 323.177,52 €
Long-term debt 2.169.566,26 € 191.563,90 €
Other non-current liabilities 1.753.951,16 € 131.613,62 €
Current liabilities 14.455.300,03 € 1.760.203,90 €
Loans 3.079.604,39 € 293.971,14 €
Creditors 7.427.866,13 € 1.003.839,31 €
Other current liabilities 3.947.829,52 € 462.393,46 €
Profit (loss) for period 1.346.383,38 € 123.198,00 €
Total assets 32.306.515,05 € 2.995.276,81 €
Sales 42.249.427,46 € 4.537.409,99 €
Share of tangible fixed assets 41,80% 31,51%
Return on sales 3,19% 2,72%
Return on equity 9,67% 13,51%
Equity ratio 43,11% 30,44%
Return on assets 6,42% 6,86%
Inventories to capital 19,11% 22,18%
Costs for personnel to turnover 21,01% 13,17%
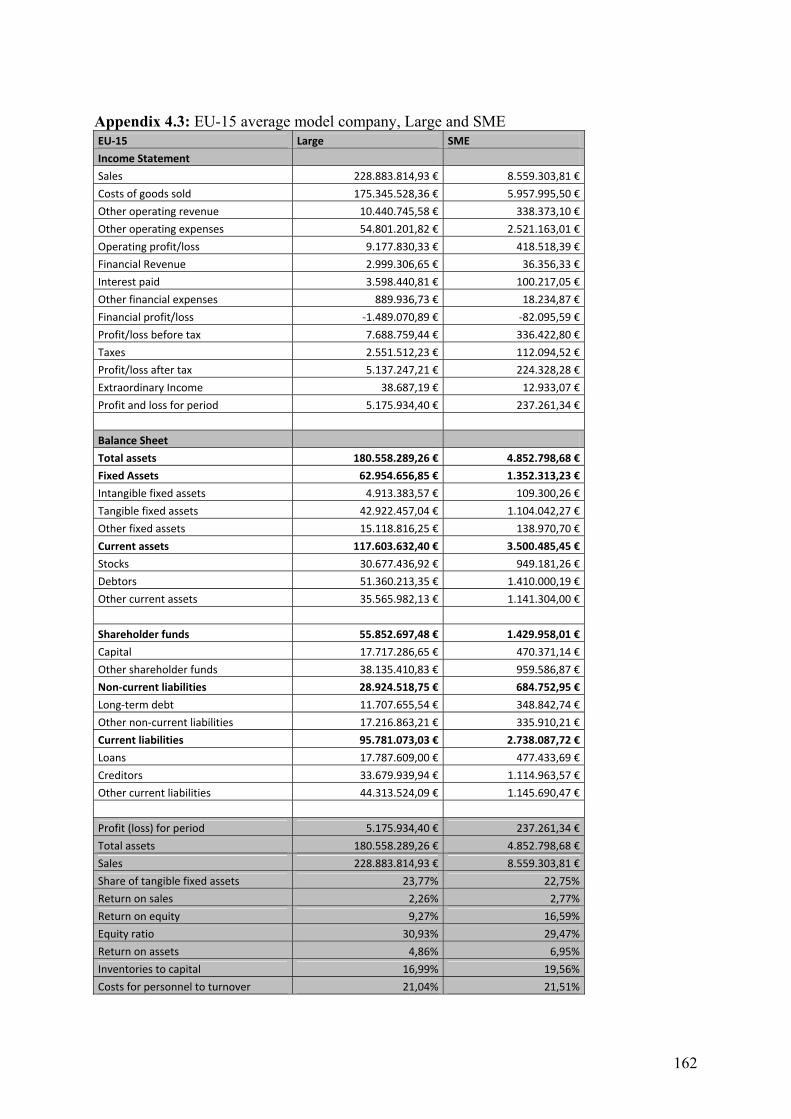
162
Appendix 4.3: EU-15 average model company, Large and SME EU-15 Large SME
Income Statement
Sales 228.883.814,93 € 8.559.303,81 €
Costs of goods sold 175.345.528,36 € 5.957.995,50 €
Other operating revenue 10.440.745,58 € 338.373,10 €
Other operating expenses 54.801.201,82 € 2.521.163,01 €
Operating profit/loss 9.177.830,33 € 418.518,39 €
Financial Revenue 2.999.306,65 € 36.356,33 €
Interest paid 3.598.440,81 € 100.217,05 €
Other financial expenses 889.936,73 € 18.234,87 €
Financial profit/loss -1.489.070,89 € -82.095,59 €
Profit/loss before tax 7.688.759,44 € 336.422,80 €
Taxes 2.551.512,23 € 112.094,52 €
Profit/loss after tax 5.137.247,21 € 224.328,28 €
Extraordinary Income 38.687,19 € 12.933,07 €
Profit and loss for period 5.175.934,40 € 237.261,34 €
Balance Sheet
Total assets 180.558.289,26 € 4.852.798,68 €
Fixed Assets 62.954.656,85 € 1.352.313,23 €
Intangible fixed assets 4.913.383,57 € 109.300,26 €
Tangible fixed assets 42.922.457,04 € 1.104.042,27 €
Other fixed assets 15.118.816,25 € 138.970,70 €
Current assets 117.603.632,40 € 3.500.485,45 €
Stocks 30.677.436,92 € 949.181,26 €
Debtors 51.360.213,35 € 1.410.000,19 €
Other current assets 35.565.982,13 € 1.141.304,00 €
Shareholder funds 55.852.697,48 € 1.429.958,01 €
Capital 17.717.286,65 € 470.371,14 €
Other shareholder funds 38.135.410,83 € 959.586,87 €
Non-current liabilities 28.924.518,75 € 684.752,95 €
Long-term debt 11.707.655,54 € 348.842,74 €
Other non-current liabilities 17.216.863,21 € 335.910,21 €
Current liabilities 95.781.073,03 € 2.738.087,72 €
Loans 17.787.609,00 € 477.433,69 €
Creditors 33.679.939,94 € 1.114.963,57 €
Other current liabilities 44.313.524,09 € 1.145.690,47 €
Profit (loss) for period 5.175.934,40 € 237.261,34 €
Total assets 180.558.289,26 € 4.852.798,68 €
Sales 228.883.814,93 € 8.559.303,81 €
Share of tangible fixed assets 23,77% 22,75%
Return on sales 2,26% 2,77%
Return on equity 9,27% 16,59%
Equity ratio 30,93% 29,47%
Return on assets 4,86% 6,95%
Inventories to capital 16,99% 19,56%
Costs for personnel to turnover 21,04% 21,51%
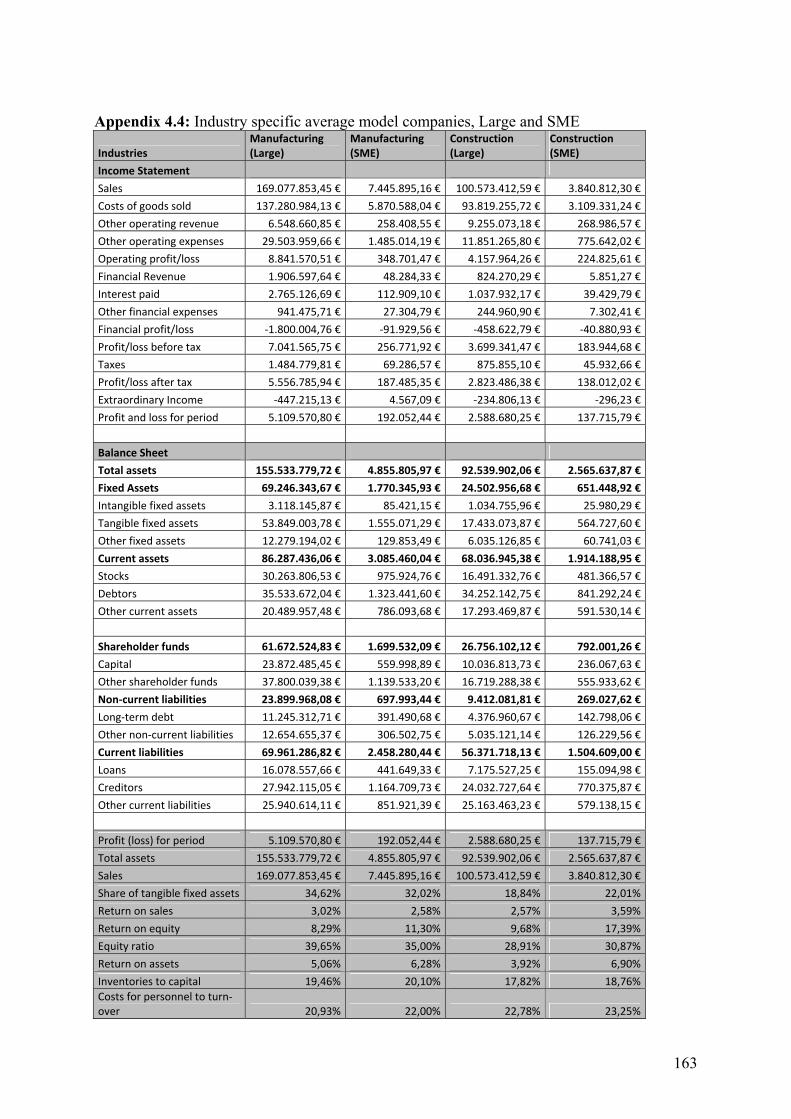
163
Appendix 4.4: Industry specific average model companies, Large and SME
Industries Manufacturing (Large)
Manufacturing (SME)
Construction (Large)
Construction (SME)
Income Statement
Sales 169.077.853,45 € 7.445.895,16 € 100.573.412,59 € 3.840.812,30 €
Costs of goods sold 137.280.984,13 € 5.870.588,04 € 93.819.255,72 € 3.109.331,24 €
Other operating revenue 6.548.660,85 € 258.408,55 € 9.255.073,18 € 268.986,57 €
Other operating expenses 29.503.959,66 € 1.485.014,19 € 11.851.265,80 € 775.642,02 €
Operating profit/loss 8.841.570,51 € 348.701,47 € 4.157.964,26 € 224.825,61 €
Financial Revenue 1.906.597,64 € 48.284,33 € 824.270,29 € 5.851,27 €
Interest paid 2.765.126,69 € 112.909,10 € 1.037.932,17 € 39.429,79 €
Other financial expenses 941.475,71 € 27.304,79 € 244.960,90 € 7.302,41 €
Financial profit/loss -1.800.004,76 € -91.929,56 € -458.622,79 € -40.880,93 €
Profit/loss before tax 7.041.565,75 € 256.771,92 € 3.699.341,47 € 183.944,68 €
Taxes 1.484.779,81 € 69.286,57 € 875.855,10 € 45.932,66 €
Profit/loss after tax 5.556.785,94 € 187.485,35 € 2.823.486,38 € 138.012,02 €
Extraordinary Income -447.215,13 € 4.567,09 € -234.806,13 € -296,23 €
Profit and loss for period 5.109.570,80 € 192.052,44 € 2.588.680,25 € 137.715,79 €
Balance Sheet
Total assets 155.533.779,72 € 4.855.805,97 € 92.539.902,06 € 2.565.637,87 €
Fixed Assets 69.246.343,67 € 1.770.345,93 € 24.502.956,68 € 651.448,92 €
Intangible fixed assets 3.118.145,87 € 85.421,15 € 1.034.755,96 € 25.980,29 €
Tangible fixed assets 53.849.003,78 € 1.555.071,29 € 17.433.073,87 € 564.727,60 €
Other fixed assets 12.279.194,02 € 129.853,49 € 6.035.126,85 € 60.741,03 €
Current assets 86.287.436,06 € 3.085.460,04 € 68.036.945,38 € 1.914.188,95 €
Stocks 30.263.806,53 € 975.924,76 € 16.491.332,76 € 481.366,57 €
Debtors 35.533.672,04 € 1.323.441,60 € 34.252.142,75 € 841.292,24 €
Other current assets 20.489.957,48 € 786.093,68 € 17.293.469,87 € 591.530,14 €
Shareholder funds 61.672.524,83 € 1.699.532,09 € 26.756.102,12 € 792.001,26 €
Capital 23.872.485,45 € 559.998,89 € 10.036.813,73 € 236.067,63 €
Other shareholder funds 37.800.039,38 € 1.139.533,20 € 16.719.288,38 € 555.933,62 €
Non-current liabilities 23.899.968,08 € 697.993,44 € 9.412.081,81 € 269.027,62 €
Long-term debt 11.245.312,71 € 391.490,68 € 4.376.960,67 € 142.798,06 €
Other non-current liabilities 12.654.655,37 € 306.502,75 € 5.035.121,14 € 126.229,56 €
Current liabilities 69.961.286,82 € 2.458.280,44 € 56.371.718,13 € 1.504.609,00 €
Loans 16.078.557,66 € 441.649,33 € 7.175.527,25 € 155.094,98 €
Creditors 27.942.115,05 € 1.164.709,73 € 24.032.727,64 € 770.375,87 €
Other current liabilities 25.940.614,11 € 851.921,39 € 25.163.463,23 € 579.138,15 €
Profit (loss) for period 5.109.570,80 € 192.052,44 € 2.588.680,25 € 137.715,79 €
Total assets 155.533.779,72 € 4.855.805,97 € 92.539.902,06 € 2.565.637,87 €
Sales 169.077.853,45 € 7.445.895,16 € 100.573.412,59 € 3.840.812,30 €
Share of tangible fixed assets 34,62% 32,02% 18,84% 22,01%
Return on sales 3,02% 2,58% 2,57% 3,59%
Return on equity 8,29% 11,30% 9,68% 17,39%
Equity ratio 39,65% 35,00% 28,91% 30,87%
Return on assets 5,06% 6,28% 3,92% 6,90%
Inventories to capital 19,46% 20,10% 17,82% 18,76% Costs for personnel to turn-over 20,93% 22,00% 22,78% 23,25%
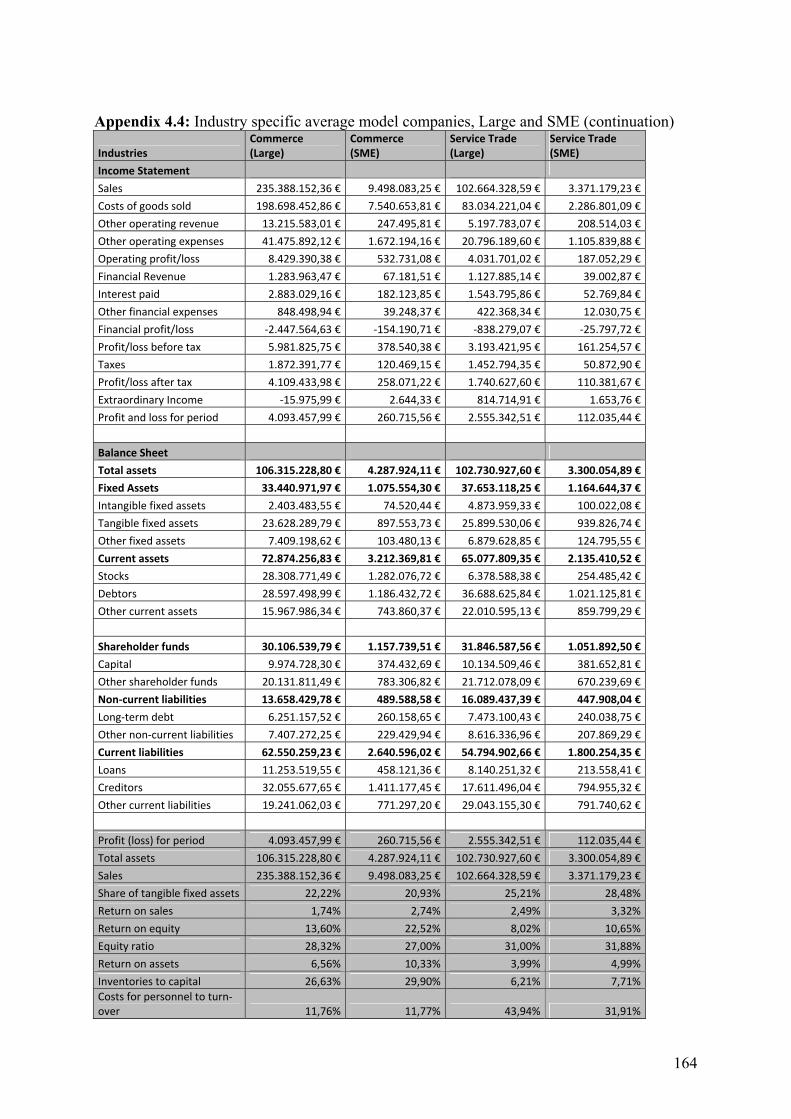
164
Appendix 4.4: Industry specific average model companies, Large and SME (continuation)
Industries Commerce (Large)
Commerce (SME)
Service Trade (Large)
Service Trade (SME)
Income Statement
Sales 235.388.152,36 € 9.498.083,25 € 102.664.328,59 € 3.371.179,23 €
Costs of goods sold 198.698.452,86 € 7.540.653,81 € 83.034.221,04 € 2.286.801,09 €
Other operating revenue 13.215.583,01 € 247.495,81 € 5.197.783,07 € 208.514,03 €
Other operating expenses 41.475.892,12 € 1.672.194,16 € 20.796.189,60 € 1.105.839,88 €
Operating profit/loss 8.429.390,38 € 532.731,08 € 4.031.701,02 € 187.052,29 €
Financial Revenue 1.283.963,47 € 67.181,51 € 1.127.885,14 € 39.002,87 €
Interest paid 2.883.029,16 € 182.123,85 € 1.543.795,86 € 52.769,84 €
Other financial expenses 848.498,94 € 39.248,37 € 422.368,34 € 12.030,75 €
Financial profit/loss -2.447.564,63 € -154.190,71 € -838.279,07 € -25.797,72 €
Profit/loss before tax 5.981.825,75 € 378.540,38 € 3.193.421,95 € 161.254,57 €
Taxes 1.872.391,77 € 120.469,15 € 1.452.794,35 € 50.872,90 €
Profit/loss after tax 4.109.433,98 € 258.071,22 € 1.740.627,60 € 110.381,67 €
Extraordinary Income -15.975,99 € 2.644,33 € 814.714,91 € 1.653,76 €
Profit and loss for period 4.093.457,99 € 260.715,56 € 2.555.342,51 € 112.035,44 €
Balance Sheet
Total assets 106.315.228,80 € 4.287.924,11 € 102.730.927,60 € 3.300.054,89 €
Fixed Assets 33.440.971,97 € 1.075.554,30 € 37.653.118,25 € 1.164.644,37 €
Intangible fixed assets 2.403.483,55 € 74.520,44 € 4.873.959,33 € 100.022,08 €
Tangible fixed assets 23.628.289,79 € 897.553,73 € 25.899.530,06 € 939.826,74 €
Other fixed assets 7.409.198,62 € 103.480,13 € 6.879.628,85 € 124.795,55 €
Current assets 72.874.256,83 € 3.212.369,81 € 65.077.809,35 € 2.135.410,52 €
Stocks 28.308.771,49 € 1.282.076,72 € 6.378.588,38 € 254.485,42 €
Debtors 28.597.498,99 € 1.186.432,72 € 36.688.625,84 € 1.021.125,81 €
Other current assets 15.967.986,34 € 743.860,37 € 22.010.595,13 € 859.799,29 €
Shareholder funds 30.106.539,79 € 1.157.739,51 € 31.846.587,56 € 1.051.892,50 €
Capital 9.974.728,30 € 374.432,69 € 10.134.509,46 € 381.652,81 €
Other shareholder funds 20.131.811,49 € 783.306,82 € 21.712.078,09 € 670.239,69 €
Non-current liabilities 13.658.429,78 € 489.588,58 € 16.089.437,39 € 447.908,04 €
Long-term debt 6.251.157,52 € 260.158,65 € 7.473.100,43 € 240.038,75 €
Other non-current liabilities 7.407.272,25 € 229.429,94 € 8.616.336,96 € 207.869,29 €
Current liabilities 62.550.259,23 € 2.640.596,02 € 54.794.902,66 € 1.800.254,35 €
Loans 11.253.519,55 € 458.121,36 € 8.140.251,32 € 213.558,41 €
Creditors 32.055.677,65 € 1.411.177,45 € 17.611.496,04 € 794.955,32 €
Other current liabilities 19.241.062,03 € 771.297,20 € 29.043.155,30 € 791.740,62 €
Profit (loss) for period 4.093.457,99 € 260.715,56 € 2.555.342,51 € 112.035,44 €
Total assets 106.315.228,80 € 4.287.924,11 € 102.730.927,60 € 3.300.054,89 €
Sales 235.388.152,36 € 9.498.083,25 € 102.664.328,59 € 3.371.179,23 €
Share of tangible fixed assets 22,22% 20,93% 25,21% 28,48%
Return on sales 1,74% 2,74% 2,49% 3,32%
Return on equity 13,60% 22,52% 8,02% 10,65%
Equity ratio 28,32% 27,00% 31,00% 31,88%
Return on assets 6,56% 10,33% 3,99% 4,99%
Inventories to capital 26,63% 29,90% 6,21% 7,71% Costs for personnel to turn-over 11,76% 11,77% 43,94% 31,91%
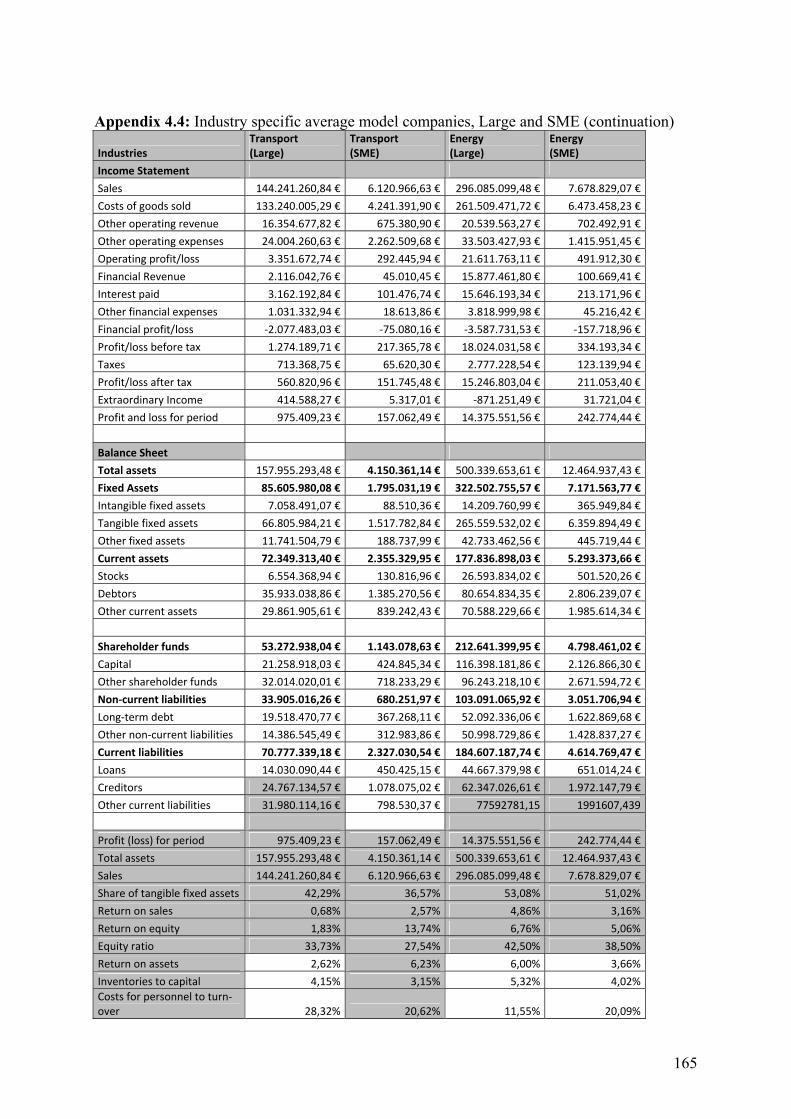
165
Appendix 4.4: Industry specific average model companies, Large and SME (continuation)
Industries Transport (Large)
Transport (SME)
Energy (Large)
Energy (SME)
Income Statement
Sales 144.241.260,84 € 6.120.966,63 € 296.085.099,48 € 7.678.829,07 €
Costs of goods sold 133.240.005,29 € 4.241.391,90 € 261.509.471,72 € 6.473.458,23 €
Other operating revenue 16.354.677,82 € 675.380,90 € 20.539.563,27 € 702.492,91 €
Other operating expenses 24.004.260,63 € 2.262.509,68 € 33.503.427,93 € 1.415.951,45 €
Operating profit/loss 3.351.672,74 € 292.445,94 € 21.611.763,11 € 491.912,30 €
Financial Revenue 2.116.042,76 € 45.010,45 € 15.877.461,80 € 100.669,41 €
Interest paid 3.162.192,84 € 101.476,74 € 15.646.193,34 € 213.171,96 €
Other financial expenses 1.031.332,94 € 18.613,86 € 3.818.999,98 € 45.216,42 €
Financial profit/loss -2.077.483,03 € -75.080,16 € -3.587.731,53 € -157.718,96 €
Profit/loss before tax 1.274.189,71 € 217.365,78 € 18.024.031,58 € 334.193,34 €
Taxes 713.368,75 € 65.620,30 € 2.777.228,54 € 123.139,94 €
Profit/loss after tax 560.820,96 € 151.745,48 € 15.246.803,04 € 211.053,40 €
Extraordinary Income 414.588,27 € 5.317,01 € -871.251,49 € 31.721,04 €
Profit and loss for period 975.409,23 € 157.062,49 € 14.375.551,56 € 242.774,44 €
Balance Sheet
Total assets 157.955.293,48 € 4.150.361,14 € 500.339.653,61 € 12.464.937,43 €
Fixed Assets 85.605.980,08 € 1.795.031,19 € 322.502.755,57 € 7.171.563,77 €
Intangible fixed assets 7.058.491,07 € 88.510,36 € 14.209.760,99 € 365.949,84 €
Tangible fixed assets 66.805.984,21 € 1.517.782,84 € 265.559.532,02 € 6.359.894,49 €
Other fixed assets 11.741.504,79 € 188.737,99 € 42.733.462,56 € 445.719,44 €
Current assets 72.349.313,40 € 2.355.329,95 € 177.836.898,03 € 5.293.373,66 €
Stocks 6.554.368,94 € 130.816,96 € 26.593.834,02 € 501.520,26 €
Debtors 35.933.038,86 € 1.385.270,56 € 80.654.834,35 € 2.806.239,07 €
Other current assets 29.861.905,61 € 839.242,43 € 70.588.229,66 € 1.985.614,34 €
Shareholder funds 53.272.938,04 € 1.143.078,63 € 212.641.399,95 € 4.798.461,02 €
Capital 21.258.918,03 € 424.845,34 € 116.398.181,86 € 2.126.866,30 €
Other shareholder funds 32.014.020,01 € 718.233,29 € 96.243.218,10 € 2.671.594,72 €
Non-current liabilities 33.905.016,26 € 680.251,97 € 103.091.065,92 € 3.051.706,94 €
Long-term debt 19.518.470,77 € 367.268,11 € 52.092.336,06 € 1.622.869,68 €
Other non-current liabilities 14.386.545,49 € 312.983,86 € 50.998.729,86 € 1.428.837,27 €
Current liabilities 70.777.339,18 € 2.327.030,54 € 184.607.187,74 € 4.614.769,47 €
Loans 14.030.090,44 € 450.425,15 € 44.667.379,98 € 651.014,24 €
Creditors 24.767.134,57 € 1.078.075,02 € 62.347.026,61 € 1.972.147,79 €
Other current liabilities 31.980.114,16 € 798.530,37 € 77592781,15 1991607,439
Profit (loss) for period 975.409,23 € 157.062,49 € 14.375.551,56 € 242.774,44 €
Total assets 157.955.293,48 € 4.150.361,14 € 500.339.653,61 € 12.464.937,43 €
Sales 144.241.260,84 € 6.120.966,63 € 296.085.099,48 € 7.678.829,07 €
Share of tangible fixed assets 42,29% 36,57% 53,08% 51,02%
Return on sales 0,68% 2,57% 4,86% 3,16%
Return on equity 1,83% 13,74% 6,76% 5,06%
Equity ratio 33,73% 27,54% 42,50% 38,50%
Return on assets 2,62% 6,23% 6,00% 3,66%
Inventories to capital 4,15% 3,15% 5,32% 4,02% Costs for personnel to turn-over 28,32% 20,62% 11,55% 20,09%
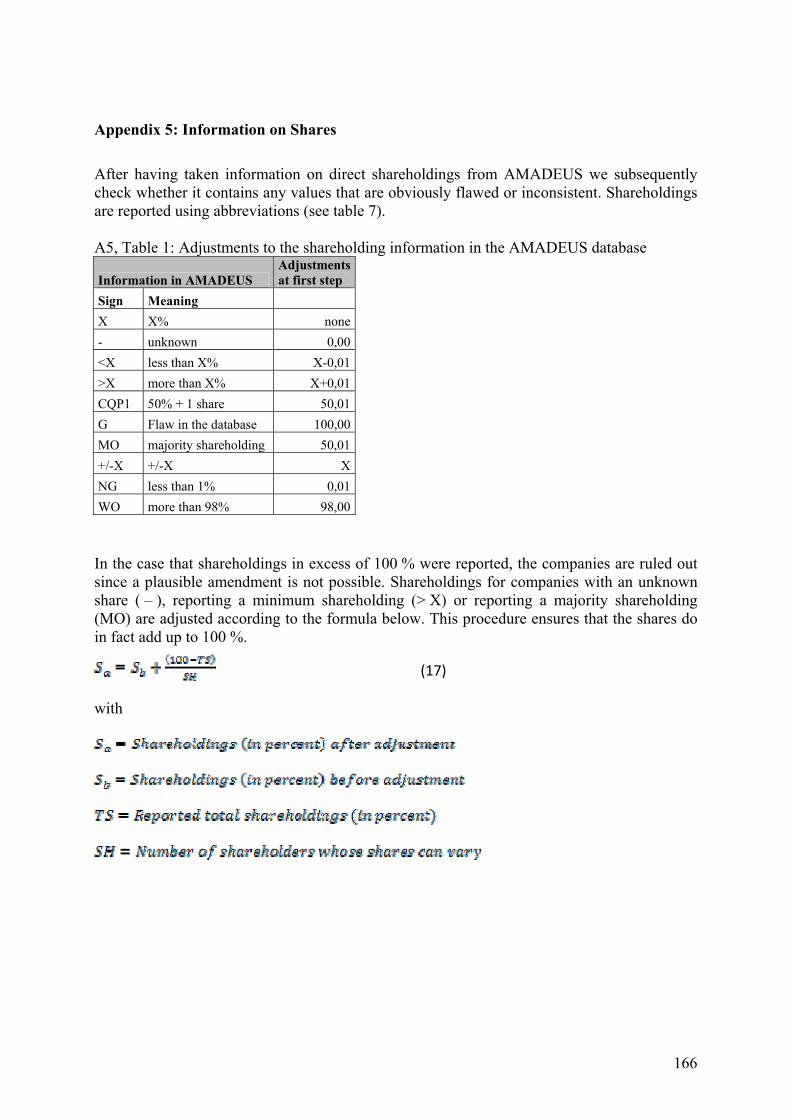
166
Appendix 5: Information on Shares
After having taken information on direct shareholdings from AMADEUS we subsequently check whether it contains any values that are obviously flawed or inconsistent. Shareholdings are reported using abbreviations (see table 7). A5, Table 1: Adjustments to the shareholding information in the AMADEUS database
Information in AMADEUS Adjustments at first step
Sign Meaning
X X% none
- unknown 0,00
<X less than X% X-0,01
>X more than X% X+0,01
CQP1 50% + 1 share 50,01
G Flaw in the database 100,00
MO majority shareholding 50,01
+/-X +/-X X
NG less than 1% 0,01
WO more than 98% 98,00
In the case that shareholdings in excess of 100 % were reported, the companies are ruled out since a plausible amendment is not possible. Shareholdings for companies with an unknown share ( – ), reporting a minimum shareholding (> X) or reporting a majority shareholding (MO) are adjusted according to the formula below. This procedure ensures that the shares do in fact add up to 100 %.
with
(17)
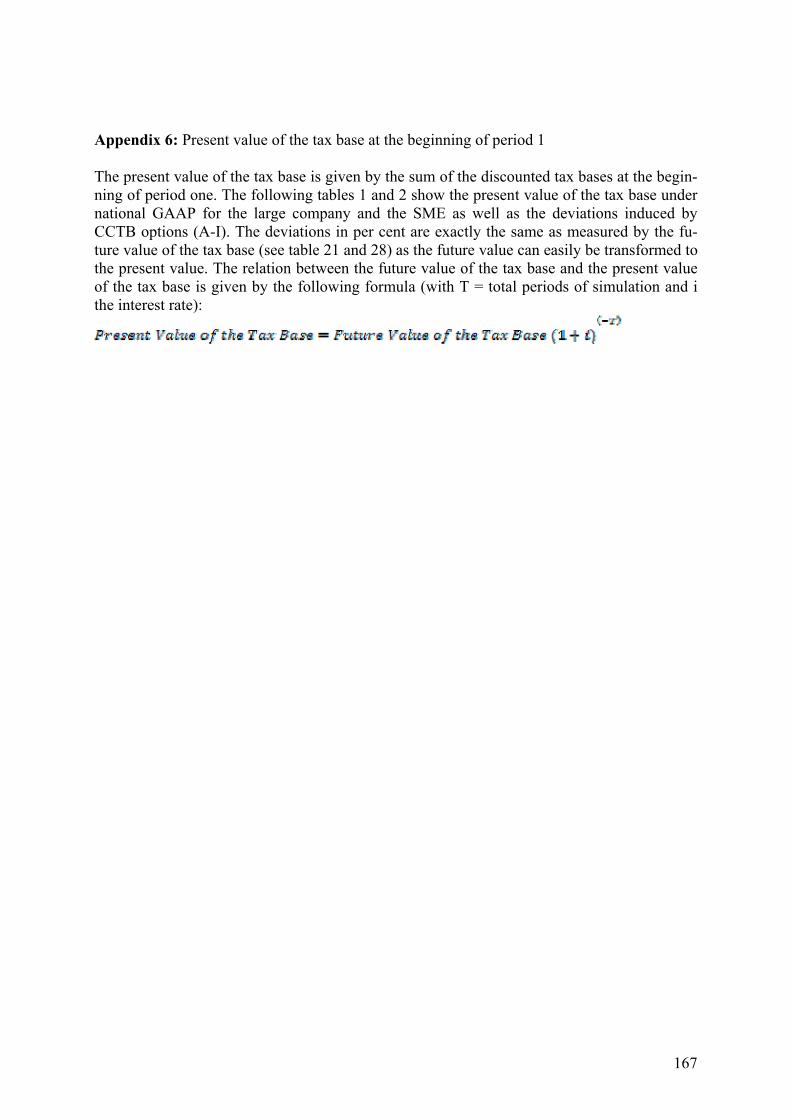
167
Appendix 6: Present value of the tax base at the beginning of period 1 The present value of the tax base is given by the sum of the discounted tax bases at the begin-ning of period one. The following tables 1 and 2 show the present value of the tax base under national GAAP for the large company and the SME as well as the deviations induced by CCTB options (A-I). The deviations in per cent are exactly the same as measured by the fu-ture value of the tax base (see table 21 and 28) as the future value can easily be transformed to the present value. The relation between the future value of the tax base and the present value of the tax base is given by the following formula (with T = total periods of simulation and i the interest rate):
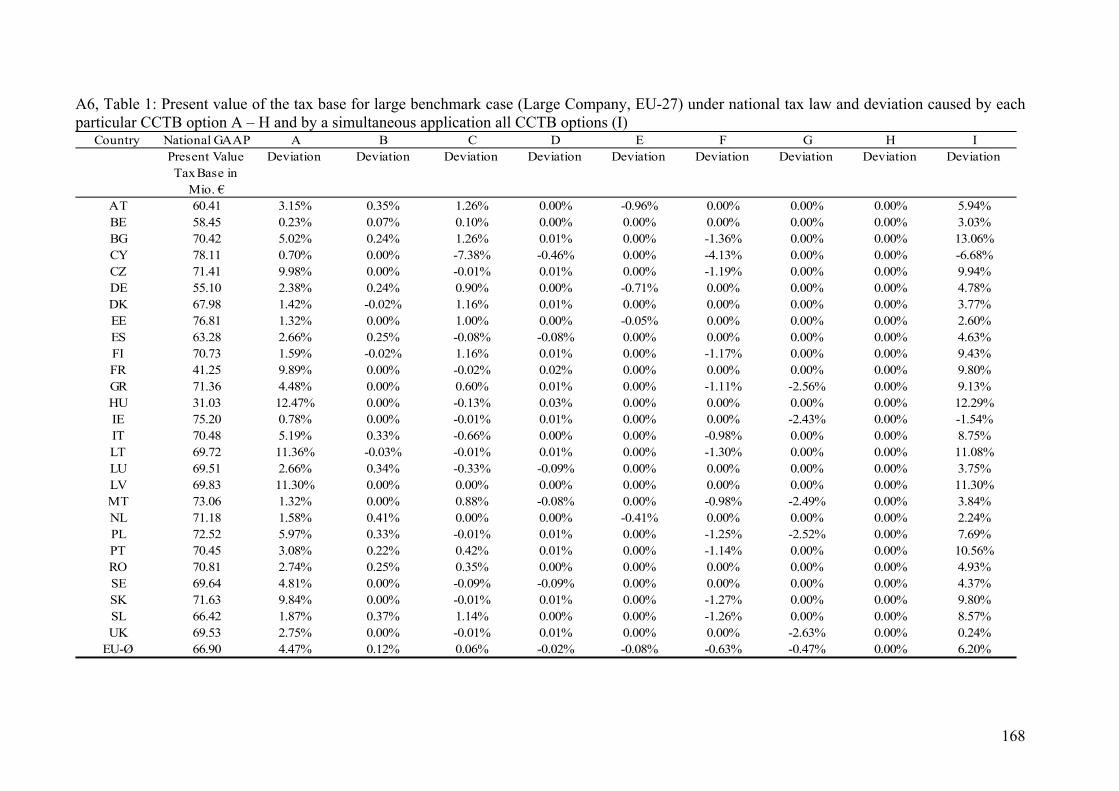
168
A6, Table 1: Present value of the tax base for large benchmark case (Large Company, EU-27) under national tax law and deviation caused by each particular CCTB option A – H and by a simultaneous application all CCTB options (I)
Country National GAAP A B C D E F G H IPresent Value Tax Base in
Mio. €
Deviation Deviation Deviation Deviation Deviation Deviation Deviation Deviation Deviation
AT 60.41 3.15% 0.35% 1.26% 0.00% -0.96% 0.00% 0.00% 0.00% 5.94%BE 58.45 0.23% 0.07% 0.10% 0.00% 0.00% 0.00% 0.00% 0.00% 3.03%BG 70.42 5.02% 0.24% 1.26% 0.01% 0.00% -1.36% 0.00% 0.00% 13.06%CY 78.11 0.70% 0.00% -7.38% -0.46% 0.00% -4.13% 0.00% 0.00% -6.68%CZ 71.41 9.98% 0.00% -0.01% 0.01% 0.00% -1.19% 0.00% 0.00% 9.94%DE 55.10 2.38% 0.24% 0.90% 0.00% -0.71% 0.00% 0.00% 0.00% 4.78%DK 67.98 1.42% -0.02% 1.16% 0.01% 0.00% 0.00% 0.00% 0.00% 3.77%EE 76.81 1.32% 0.00% 1.00% 0.00% -0.05% 0.00% 0.00% 0.00% 2.60%ES 63.28 2.66% 0.25% -0.08% -0.08% 0.00% 0.00% 0.00% 0.00% 4.63%FI 70.73 1.59% -0.02% 1.16% 0.01% 0.00% -1.17% 0.00% 0.00% 9.43%FR 41.25 9.89% 0.00% -0.02% 0.02% 0.00% 0.00% 0.00% 0.00% 9.80%GR 71.36 4.48% 0.00% 0.60% 0.01% 0.00% -1.11% -2.56% 0.00% 9.13%HU 31.03 12.47% 0.00% -0.13% 0.03% 0.00% 0.00% 0.00% 0.00% 12.29%IE 75.20 0.78% 0.00% -0.01% 0.01% 0.00% 0.00% -2.43% 0.00% -1.54%IT 70.48 5.19% 0.33% -0.66% 0.00% 0.00% -0.98% 0.00% 0.00% 8.75%LT 69.72 11.36% -0.03% -0.01% 0.01% 0.00% -1.30% 0.00% 0.00% 11.08%LU 69.51 2.66% 0.34% -0.33% -0.09% 0.00% 0.00% 0.00% 0.00% 3.75%LV 69.83 11.30% 0.00% 0.00% 0.00% 0.00% 0.00% 0.00% 0.00% 11.30%MT 73.06 1.32% 0.00% 0.88% -0.08% 0.00% -0.98% -2.49% 0.00% 3.84%NL 71.18 1.58% 0.41% 0.00% 0.00% -0.41% 0.00% 0.00% 0.00% 2.24%PL 72.52 5.97% 0.33% -0.01% 0.01% 0.00% -1.25% -2.52% 0.00% 7.69%PT 70.45 3.08% 0.22% 0.42% 0.01% 0.00% -1.14% 0.00% 0.00% 10.56%RO 70.81 2.74% 0.25% 0.35% 0.00% 0.00% 0.00% 0.00% 0.00% 4.93%SE 69.64 4.81% 0.00% -0.09% -0.09% 0.00% 0.00% 0.00% 0.00% 4.37%SK 71.63 9.84% 0.00% -0.01% 0.01% 0.00% -1.27% 0.00% 0.00% 9.80%SL 66.42 1.87% 0.37% 1.14% 0.00% 0.00% -1.26% 0.00% 0.00% 8.57%UK 69.53 2.75% 0.00% -0.01% 0.01% 0.00% 0.00% -2.63% 0.00% 0.24%
EU-Ø 66.90 4.47% 0.12% 0.06% -0.02% -0.08% -0.63% -0.47% 0.00% 6.20%

169
A6, Table 2: Present value of the tax base for SME benchmark case (SME, EU-27) under national tax law and deviation caused by each particular CCTB option A – H and by a simultaneous application all CCTB options (I)
Country National GAAP A B C D E F G H IPresent Value Tax Base in
Mio. €
Deviation Deviation Deviation Deviation Deviation Deviation Deviation Deviation Deviation
AT 2.13 2.40% 0.33% 1.03% 0.00% -0.68% 0.00% 0.00% 0.00% 4.32%BE 2.19 0.09% 0.05% 0.01% 0.00% 0.00% 0.00% 0.00% 0.00% 1.52%BG 2.55 4.18% 0.25% 1.01% 0.01% 0.00% -1.70% 0.00% 0.00% 11.80%CY 2.79 0.72% 0.00% -7.63% -0.28% 0.00% -4.80% 0.00% 0.00% -6.91%CZ 2.57 9.53% 0.00% -0.01% 0.01% 0.00% -1.47% 0.00% 0.00% 9.51%DE 2.00 1.75% 0.23% 0.71% 0.00% -0.49% 0.00% 0.00% 0.00% 2.92%DK 2.45 1.07% -0.01% 0.94% 0.01% 0.00% 0.00% 0.00% 0.00% 2.36%EE 2.68 1.04% 0.00% 0.78% 0.00% -0.04% 0.00% 0.00% 0.00% 1.77%ES 2.28 1.90% 0.27% -0.06% -0.06% 0.00% 0.00% 0.00% 0.00% 2.64%FI 2.54 4.61% -0.01% 1.70% 0.01% 0.00% -1.45% 0.00% 0.00% 9.21%FR 1.75 5.33% 0.00% -0.01% 0.01% 0.00% 0.00% 0.00% 0.00% 5.29%GR 2.54 6.58% 0.00% 0.90% 0.01% 0.00% -1.41% -0.96% 0.00% 10.31%HU 0.80 15.71% 0.00% -0.27% 0.10% 0.00% 0.00% 0.00% 0.00% 15.43%IE 2.64 0.16% 0.00% -0.01% 0.01% 0.00% 0.00% -0.92% 0.00% -0.77%IT 2.52 5.86% 0.27% -0.54% 0.00% 0.00% -1.21% 0.00% 0.00% 8.82%LT 2.52 10.60% -0.02% -0.01% 0.01% 0.00% -1.63% 0.00% 0.00% 10.48%LU 2.50 1.98% 0.33% -0.30% -0.07% 0.00% 0.00% 0.00% 0.00% 2.26%LV 2.53 10.42% 0.00% 0.00% 0.00% 0.00% 0.00% 0.00% 0.00% 10.42%MT 2.58 3.32% 0.00% 0.72% -0.07% 0.00% -1.23% -0.94% 0.00% 5.37%NL 2.54 1.06% 0.36% 0.00% 0.00% -0.27% 0.00% 0.00% 0.00% 1.32%PL 2.57 6.30% 0.36% -0.01% 0.01% 0.00% -1.60% -0.95% 0.00% 8.84%PT 2.54 2.98% 0.25% 0.29% 0.01% 0.00% -1.44% 0.00% 0.00% 9.92%RO 2.56 1.73% 0.35% 0.39% 0.00% 0.00% 0.00% 0.00% 0.00% 2.51%SE 2.50 2.94% 0.00% -0.07% -0.07% 0.00% 0.00% 0.00% 0.00% 2.69%SK 2.58 9.48% 0.00% -0.01% 0.01% 0.00% -1.58% 0.00% 0.00% 9.46%SL 2.36 2.47% 0.33% 0.92% 0.00% 0.00% -1.58% 0.00% 0.00% 8.25%UK 2.50 1.61% 0.00% -0.01% 0.01% 0.00% 0.00% -0.98% 0.00% 0.67%
EU-Ø 2.40 4.29% 0.12% 0.02% -0.01% -0.05% -0.78% -0.18% 0.00% 5.57%
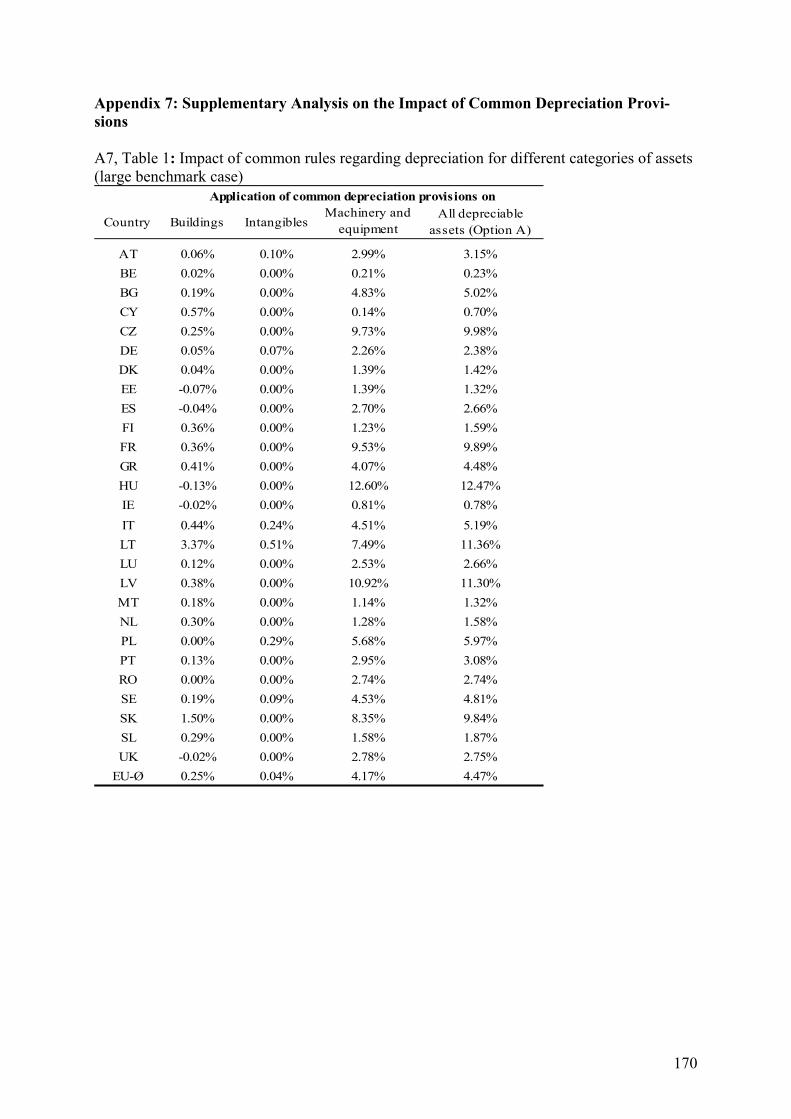
170
Appendix 7: Supplementary Analysis on the Impact of Common Depreciation Provi-sions A7, Table 1: Impact of common rules regarding depreciation for different categories of assets (large benchmark case)
Country Buildings IntangiblesMachinery and
equipmentAll depreciable
assets (Option A)
AT 0.06% 0.10% 2.99% 3.15%
BE 0.02% 0.00% 0.21% 0.23%
BG 0.19% 0.00% 4.83% 5.02%
CY 0.57% 0.00% 0.14% 0.70%
CZ 0.25% 0.00% 9.73% 9.98%
DE 0.05% 0.07% 2.26% 2.38%
DK 0.04% 0.00% 1.39% 1.42%
EE -0.07% 0.00% 1.39% 1.32%
ES -0.04% 0.00% 2.70% 2.66%
FI 0.36% 0.00% 1.23% 1.59%
FR 0.36% 0.00% 9.53% 9.89%
GR 0.41% 0.00% 4.07% 4.48%
HU -0.13% 0.00% 12.60% 12.47%
IE -0.02% 0.00% 0.81% 0.78%
IT 0.44% 0.24% 4.51% 5.19%
LT 3.37% 0.51% 7.49% 11.36%
LU 0.12% 0.00% 2.53% 2.66%
LV 0.38% 0.00% 10.92% 11.30%
MT 0.18% 0.00% 1.14% 1.32%
NL 0.30% 0.00% 1.28% 1.58%
PL 0.00% 0.29% 5.68% 5.97%
PT 0.13% 0.00% 2.95% 3.08%
RO 0.00% 0.00% 2.74% 2.74%
SE 0.19% 0.09% 4.53% 4.81%
SK 1.50% 0.00% 8.35% 9.84%
SL 0.29% 0.00% 1.58% 1.87%
UK -0.02% 0.00% 2.78% 2.75%
EU-Ø 0.25% 0.04% 4.17% 4.47%
Application of common depreciation provisions on
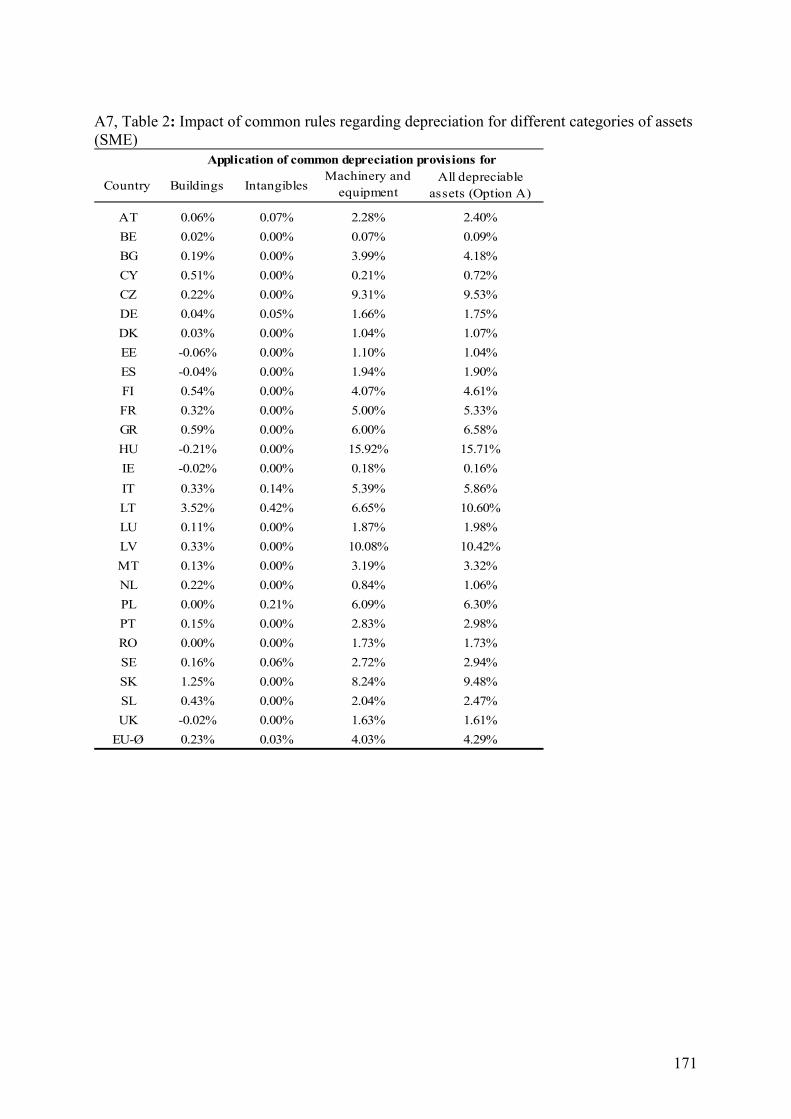
171
A7, Table 2: Impact of common rules regarding depreciation for different categories of assets (SME)
Country Buildings IntangiblesMachinery and
equipmentAll depreciable
assets (Option A)
AT 0.06% 0.07% 2.28% 2.40%
BE 0.02% 0.00% 0.07% 0.09%
BG 0.19% 0.00% 3.99% 4.18%
CY 0.51% 0.00% 0.21% 0.72%
CZ 0.22% 0.00% 9.31% 9.53%
DE 0.04% 0.05% 1.66% 1.75%
DK 0.03% 0.00% 1.04% 1.07%
EE -0.06% 0.00% 1.10% 1.04%
ES -0.04% 0.00% 1.94% 1.90%
FI 0.54% 0.00% 4.07% 4.61%
FR 0.32% 0.00% 5.00% 5.33%
GR 0.59% 0.00% 6.00% 6.58%
HU -0.21% 0.00% 15.92% 15.71%
IE -0.02% 0.00% 0.18% 0.16%
IT 0.33% 0.14% 5.39% 5.86%
LT 3.52% 0.42% 6.65% 10.60%
LU 0.11% 0.00% 1.87% 1.98%
LV 0.33% 0.00% 10.08% 10.42%
MT 0.13% 0.00% 3.19% 3.32%
NL 0.22% 0.00% 0.84% 1.06%
PL 0.00% 0.21% 6.09% 6.30%
PT 0.15% 0.00% 2.83% 2.98%
RO 0.00% 0.00% 1.73% 1.73%
SE 0.16% 0.06% 2.72% 2.94%
SK 1.25% 0.00% 8.24% 9.48%
SL 0.43% 0.00% 2.04% 2.47%
UK -0.02% 0.00% 1.63% 1.61%
EU-Ø 0.23% 0.03% 4.03% 4.29%
Application of common depreciation provisions for
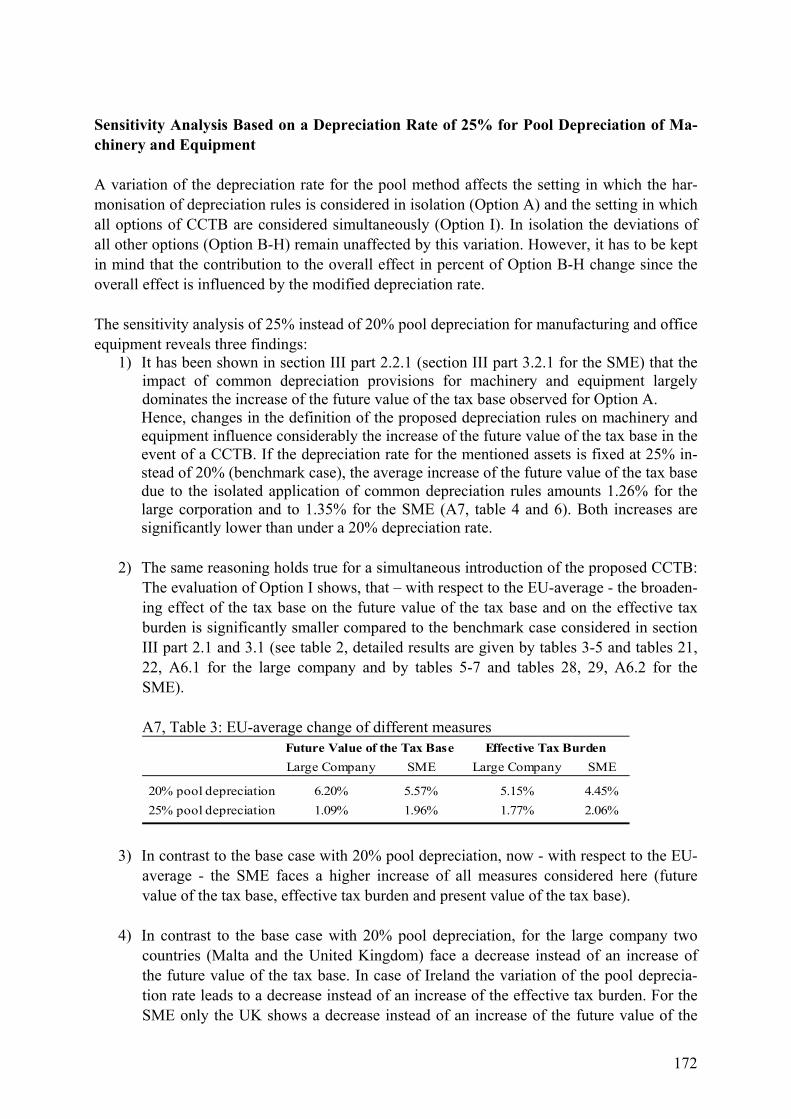
172
Sensitivity Analysis Based on a Depreciation Rate of 25% for Pool Depreciation of Ma-chinery and Equipment A variation of the depreciation rate for the pool method affects the setting in which the har-monisation of depreciation rules is considered in isolation (Option A) and the setting in which all options of CCTB are considered simultaneously (Option I). In isolation the deviations of all other options (Option B-H) remain unaffected by this variation. However, it has to be kept in mind that the contribution to the overall effect in percent of Option B-H change since the overall effect is influenced by the modified depreciation rate. The sensitivity analysis of 25% instead of 20% pool depreciation for manufacturing and office equipment reveals three findings:
1) It has been shown in section III part 2.2.1 (section III part 3.2.1 for the SME) that the impact of common depreciation provisions for machinery and equipment largely dominates the increase of the future value of the tax base observed for Option A. Hence, changes in the definition of the proposed depreciation rules on machinery and equipment influence considerably the increase of the future value of the tax base in the event of a CCTB. If the depreciation rate for the mentioned assets is fixed at 25% in-stead of 20% (benchmark case), the average increase of the future value of the tax base due to the isolated application of common depreciation rules amounts 1.26% for the large corporation and to 1.35% for the SME (A7, table 4 and 6). Both increases are significantly lower than under a 20% depreciation rate.
2) The same reasoning holds true for a simultaneous introduction of the proposed CCTB:
The evaluation of Option I shows, that – with respect to the EU-average - the broaden-ing effect of the tax base on the future value of the tax base and on the effective tax burden is significantly smaller compared to the benchmark case considered in section III part 2.1 and 3.1 (see table 2, detailed results are given by tables 3-5 and tables 21, 22, A6.1 for the large company and by tables 5-7 and tables 28, 29, A6.2 for the SME).
A7, Table 3: EU-average change of different measures
Large Company SME Large Company SME
20% pool depreciation 6.20% 5.57% 5.15% 4.45%
25% pool depreciation 1.09% 1.96% 1.77% 2.06%
Future Value of the Tax Base Effective Tax Burden
3) In contrast to the base case with 20% pool depreciation, now - with respect to the EU-average - the SME faces a higher increase of all measures considered here (future value of the tax base, effective tax burden and present value of the tax base).
4) In contrast to the base case with 20% pool depreciation, for the large company two
countries (Malta and the United Kingdom) face a decrease instead of an increase of the future value of the tax base. In case of Ireland the variation of the pool deprecia-tion rate leads to a decrease instead of an increase of the effective tax burden. For the SME only the UK shows a decrease instead of an increase of the future value of the

173
tax base and the present value of the tax base. Again, in case of Ireland the variation of the pool depreciation rate leads to a decrease instead of an increase of the effective tax burden.
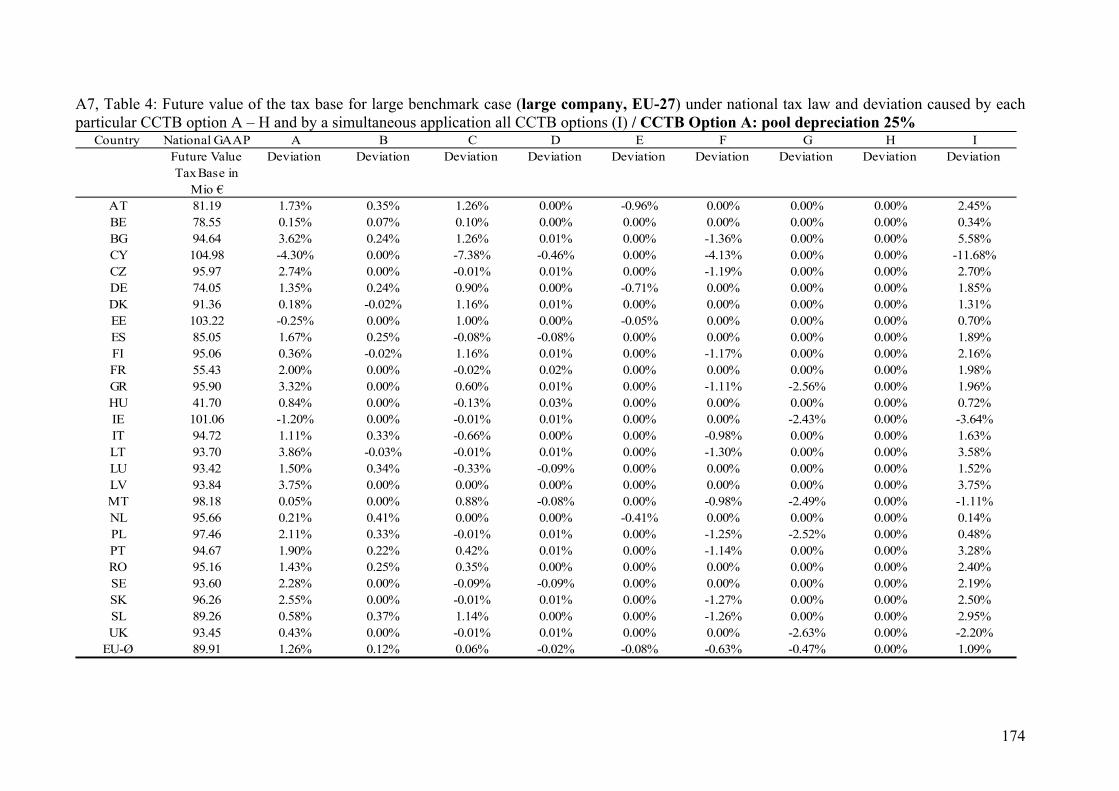
174
A7, Table 4: Future value of the tax base for large benchmark case (large company, EU-27) under national tax law and deviation caused by each particular CCTB option A – H and by a simultaneous application all CCTB options (I) / CCTB Option A: pool depreciation 25%
Country National GAAP A B C D E F G H IFuture Value Tax Base in
Mio €
Deviation Deviation Deviation Deviation Deviation Deviation Deviation Deviation Deviation
AT 81.19 1.73% 0.35% 1.26% 0.00% -0.96% 0.00% 0.00% 0.00% 2.45%BE 78.55 0.15% 0.07% 0.10% 0.00% 0.00% 0.00% 0.00% 0.00% 0.34%BG 94.64 3.62% 0.24% 1.26% 0.01% 0.00% -1.36% 0.00% 0.00% 5.58%CY 104.98 -4.30% 0.00% -7.38% -0.46% 0.00% -4.13% 0.00% 0.00% -11.68%CZ 95.97 2.74% 0.00% -0.01% 0.01% 0.00% -1.19% 0.00% 0.00% 2.70%DE 74.05 1.35% 0.24% 0.90% 0.00% -0.71% 0.00% 0.00% 0.00% 1.85%DK 91.36 0.18% -0.02% 1.16% 0.01% 0.00% 0.00% 0.00% 0.00% 1.31%EE 103.22 -0.25% 0.00% 1.00% 0.00% -0.05% 0.00% 0.00% 0.00% 0.70%ES 85.05 1.67% 0.25% -0.08% -0.08% 0.00% 0.00% 0.00% 0.00% 1.89%FI 95.06 0.36% -0.02% 1.16% 0.01% 0.00% -1.17% 0.00% 0.00% 2.16%FR 55.43 2.00% 0.00% -0.02% 0.02% 0.00% 0.00% 0.00% 0.00% 1.98%GR 95.90 3.32% 0.00% 0.60% 0.01% 0.00% -1.11% -2.56% 0.00% 1.96%HU 41.70 0.84% 0.00% -0.13% 0.03% 0.00% 0.00% 0.00% 0.00% 0.72%IE 101.06 -1.20% 0.00% -0.01% 0.01% 0.00% 0.00% -2.43% 0.00% -3.64%IT 94.72 1.11% 0.33% -0.66% 0.00% 0.00% -0.98% 0.00% 0.00% 1.63%LT 93.70 3.86% -0.03% -0.01% 0.01% 0.00% -1.30% 0.00% 0.00% 3.58%LU 93.42 1.50% 0.34% -0.33% -0.09% 0.00% 0.00% 0.00% 0.00% 1.52%LV 93.84 3.75% 0.00% 0.00% 0.00% 0.00% 0.00% 0.00% 0.00% 3.75%MT 98.18 0.05% 0.00% 0.88% -0.08% 0.00% -0.98% -2.49% 0.00% -1.11%NL 95.66 0.21% 0.41% 0.00% 0.00% -0.41% 0.00% 0.00% 0.00% 0.14%PL 97.46 2.11% 0.33% -0.01% 0.01% 0.00% -1.25% -2.52% 0.00% 0.48%PT 94.67 1.90% 0.22% 0.42% 0.01% 0.00% -1.14% 0.00% 0.00% 3.28%RO 95.16 1.43% 0.25% 0.35% 0.00% 0.00% 0.00% 0.00% 0.00% 2.40%SE 93.60 2.28% 0.00% -0.09% -0.09% 0.00% 0.00% 0.00% 0.00% 2.19%SK 96.26 2.55% 0.00% -0.01% 0.01% 0.00% -1.27% 0.00% 0.00% 2.50%SL 89.26 0.58% 0.37% 1.14% 0.00% 0.00% -1.26% 0.00% 0.00% 2.95%UK 93.45 0.43% 0.00% -0.01% 0.01% 0.00% 0.00% -2.63% 0.00% -2.20%
EU-Ø 89.91 1.26% 0.12% 0.06% -0.02% -0.08% -0.63% -0.47% 0.00% 1.09%
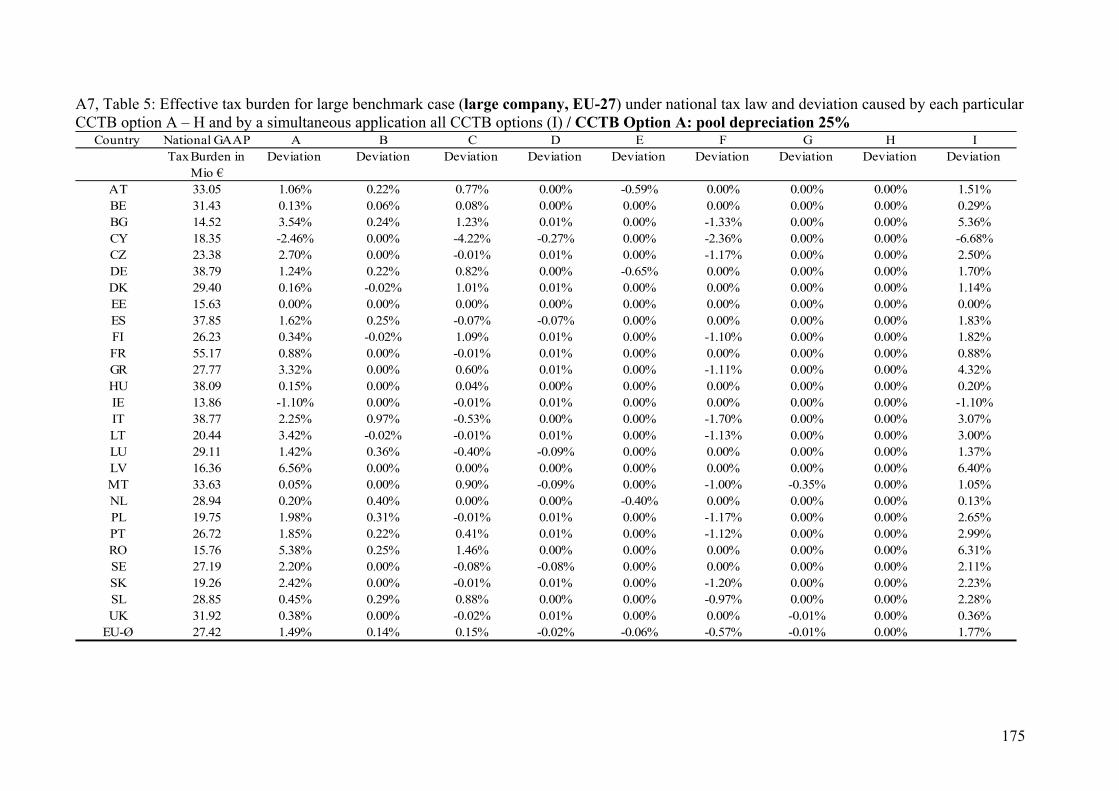
175
A7, Table 5: Effective tax burden for large benchmark case (large company, EU-27) under national tax law and deviation caused by each particular CCTB option A – H and by a simultaneous application all CCTB options (I) / CCTB Option A: pool depreciation 25%
Country National GAAP A B C D E F G H ITax Burden in
Mio €Deviation Deviation Deviation Deviation Deviation Deviation Deviation Deviation Deviation
AT 33.05 1.06% 0.22% 0.77% 0.00% -0.59% 0.00% 0.00% 0.00% 1.51%BE 31.43 0.13% 0.06% 0.08% 0.00% 0.00% 0.00% 0.00% 0.00% 0.29%BG 14.52 3.54% 0.24% 1.23% 0.01% 0.00% -1.33% 0.00% 0.00% 5.36%CY 18.35 -2.46% 0.00% -4.22% -0.27% 0.00% -2.36% 0.00% 0.00% -6.68%CZ 23.38 2.70% 0.00% -0.01% 0.01% 0.00% -1.17% 0.00% 0.00% 2.50%DE 38.79 1.24% 0.22% 0.82% 0.00% -0.65% 0.00% 0.00% 0.00% 1.70%DK 29.40 0.16% -0.02% 1.01% 0.01% 0.00% 0.00% 0.00% 0.00% 1.14%EE 15.63 0.00% 0.00% 0.00% 0.00% 0.00% 0.00% 0.00% 0.00% 0.00%ES 37.85 1.62% 0.25% -0.07% -0.07% 0.00% 0.00% 0.00% 0.00% 1.83%FI 26.23 0.34% -0.02% 1.09% 0.01% 0.00% -1.10% 0.00% 0.00% 1.82%FR 55.17 0.88% 0.00% -0.01% 0.01% 0.00% 0.00% 0.00% 0.00% 0.88%GR 27.77 3.32% 0.00% 0.60% 0.01% 0.00% -1.11% 0.00% 0.00% 4.32%HU 38.09 0.15% 0.00% 0.04% 0.00% 0.00% 0.00% 0.00% 0.00% 0.20%IE 13.86 -1.10% 0.00% -0.01% 0.01% 0.00% 0.00% 0.00% 0.00% -1.10%IT 38.77 2.25% 0.97% -0.53% 0.00% 0.00% -1.70% 0.00% 0.00% 3.07%LT 20.44 3.42% -0.02% -0.01% 0.01% 0.00% -1.13% 0.00% 0.00% 3.00%LU 29.11 1.42% 0.36% -0.40% -0.09% 0.00% 0.00% 0.00% 0.00% 1.37%LV 16.36 6.56% 0.00% 0.00% 0.00% 0.00% 0.00% 0.00% 0.00% 6.40%MT 33.63 0.05% 0.00% 0.90% -0.09% 0.00% -1.00% -0.35% 0.00% 1.05%NL 28.94 0.20% 0.40% 0.00% 0.00% -0.40% 0.00% 0.00% 0.00% 0.13%PL 19.75 1.98% 0.31% -0.01% 0.01% 0.00% -1.17% 0.00% 0.00% 2.65%PT 26.72 1.85% 0.22% 0.41% 0.01% 0.00% -1.12% 0.00% 0.00% 2.99%RO 15.76 5.38% 0.25% 1.46% 0.00% 0.00% 0.00% 0.00% 0.00% 6.31%SE 27.19 2.20% 0.00% -0.08% -0.08% 0.00% 0.00% 0.00% 0.00% 2.11%SK 19.26 2.42% 0.00% -0.01% 0.01% 0.00% -1.20% 0.00% 0.00% 2.23%SL 28.85 0.45% 0.29% 0.88% 0.00% 0.00% -0.97% 0.00% 0.00% 2.28%UK 31.92 0.38% 0.00% -0.02% 0.01% 0.00% 0.00% -0.01% 0.00% 0.36%
EU-Ø 27.42 1.49% 0.14% 0.15% -0.02% -0.06% -0.57% -0.01% 0.00% 1.77%
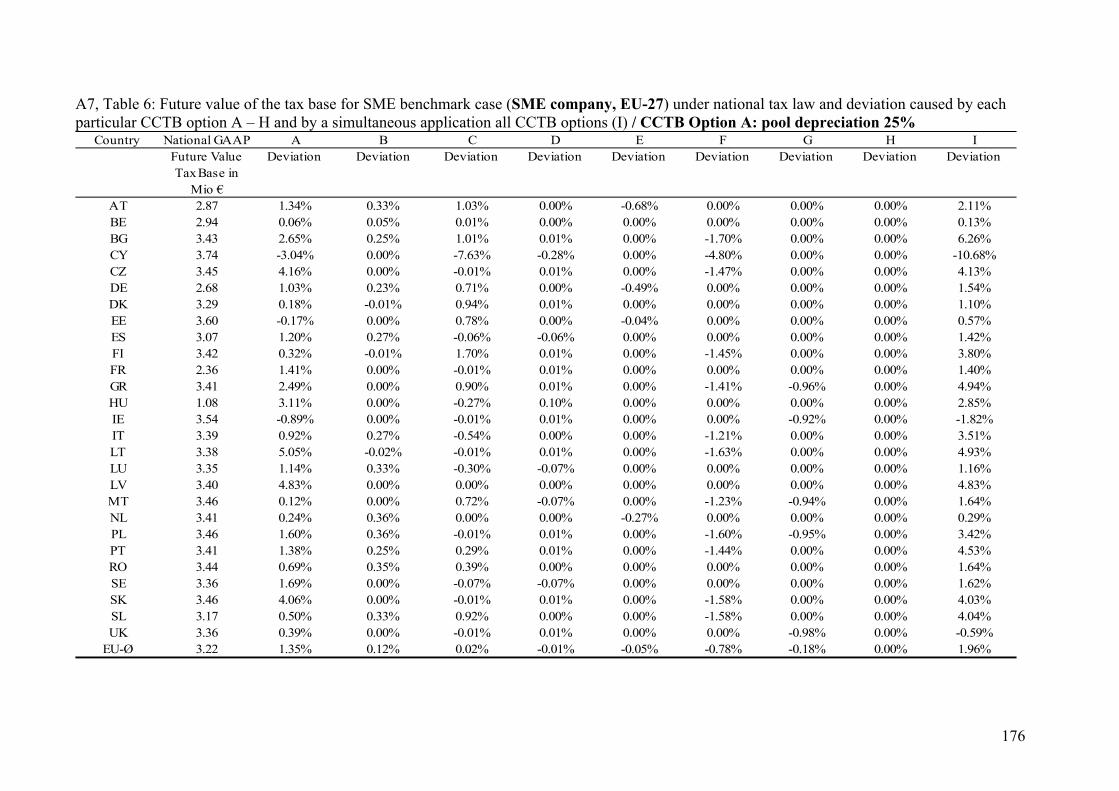
176
A7, Table 6: Future value of the tax base for SME benchmark case (SME company, EU-27) under national tax law and deviation caused by each particular CCTB option A – H and by a simultaneous application all CCTB options (I) / CCTB Option A: pool depreciation 25%
Country National GAAP A B C D E F G H IFuture Value Tax Base in
Mio €
Deviation Deviation Deviation Deviation Deviation Deviation Deviation Deviation Deviation
AT 2.87 1.34% 0.33% 1.03% 0.00% -0.68% 0.00% 0.00% 0.00% 2.11%BE 2.94 0.06% 0.05% 0.01% 0.00% 0.00% 0.00% 0.00% 0.00% 0.13%BG 3.43 2.65% 0.25% 1.01% 0.01% 0.00% -1.70% 0.00% 0.00% 6.26%CY 3.74 -3.04% 0.00% -7.63% -0.28% 0.00% -4.80% 0.00% 0.00% -10.68%CZ 3.45 4.16% 0.00% -0.01% 0.01% 0.00% -1.47% 0.00% 0.00% 4.13%DE 2.68 1.03% 0.23% 0.71% 0.00% -0.49% 0.00% 0.00% 0.00% 1.54%DK 3.29 0.18% -0.01% 0.94% 0.01% 0.00% 0.00% 0.00% 0.00% 1.10%EE 3.60 -0.17% 0.00% 0.78% 0.00% -0.04% 0.00% 0.00% 0.00% 0.57%ES 3.07 1.20% 0.27% -0.06% -0.06% 0.00% 0.00% 0.00% 0.00% 1.42%FI 3.42 0.32% -0.01% 1.70% 0.01% 0.00% -1.45% 0.00% 0.00% 3.80%FR 2.36 1.41% 0.00% -0.01% 0.01% 0.00% 0.00% 0.00% 0.00% 1.40%GR 3.41 2.49% 0.00% 0.90% 0.01% 0.00% -1.41% -0.96% 0.00% 4.94%HU 1.08 3.11% 0.00% -0.27% 0.10% 0.00% 0.00% 0.00% 0.00% 2.85%IE 3.54 -0.89% 0.00% -0.01% 0.01% 0.00% 0.00% -0.92% 0.00% -1.82%IT 3.39 0.92% 0.27% -0.54% 0.00% 0.00% -1.21% 0.00% 0.00% 3.51%LT 3.38 5.05% -0.02% -0.01% 0.01% 0.00% -1.63% 0.00% 0.00% 4.93%LU 3.35 1.14% 0.33% -0.30% -0.07% 0.00% 0.00% 0.00% 0.00% 1.16%LV 3.40 4.83% 0.00% 0.00% 0.00% 0.00% 0.00% 0.00% 0.00% 4.83%MT 3.46 0.12% 0.00% 0.72% -0.07% 0.00% -1.23% -0.94% 0.00% 1.64%NL 3.41 0.24% 0.36% 0.00% 0.00% -0.27% 0.00% 0.00% 0.00% 0.29%PL 3.46 1.60% 0.36% -0.01% 0.01% 0.00% -1.60% -0.95% 0.00% 3.42%PT 3.41 1.38% 0.25% 0.29% 0.01% 0.00% -1.44% 0.00% 0.00% 4.53%RO 3.44 0.69% 0.35% 0.39% 0.00% 0.00% 0.00% 0.00% 0.00% 1.64%SE 3.36 1.69% 0.00% -0.07% -0.07% 0.00% 0.00% 0.00% 0.00% 1.62%SK 3.46 4.06% 0.00% -0.01% 0.01% 0.00% -1.58% 0.00% 0.00% 4.03%SL 3.17 0.50% 0.33% 0.92% 0.00% 0.00% -1.58% 0.00% 0.00% 4.04%UK 3.36 0.39% 0.00% -0.01% 0.01% 0.00% 0.00% -0.98% 0.00% -0.59%
EU-Ø 3.22 1.35% 0.12% 0.02% -0.01% -0.05% -0.78% -0.18% 0.00% 1.96%
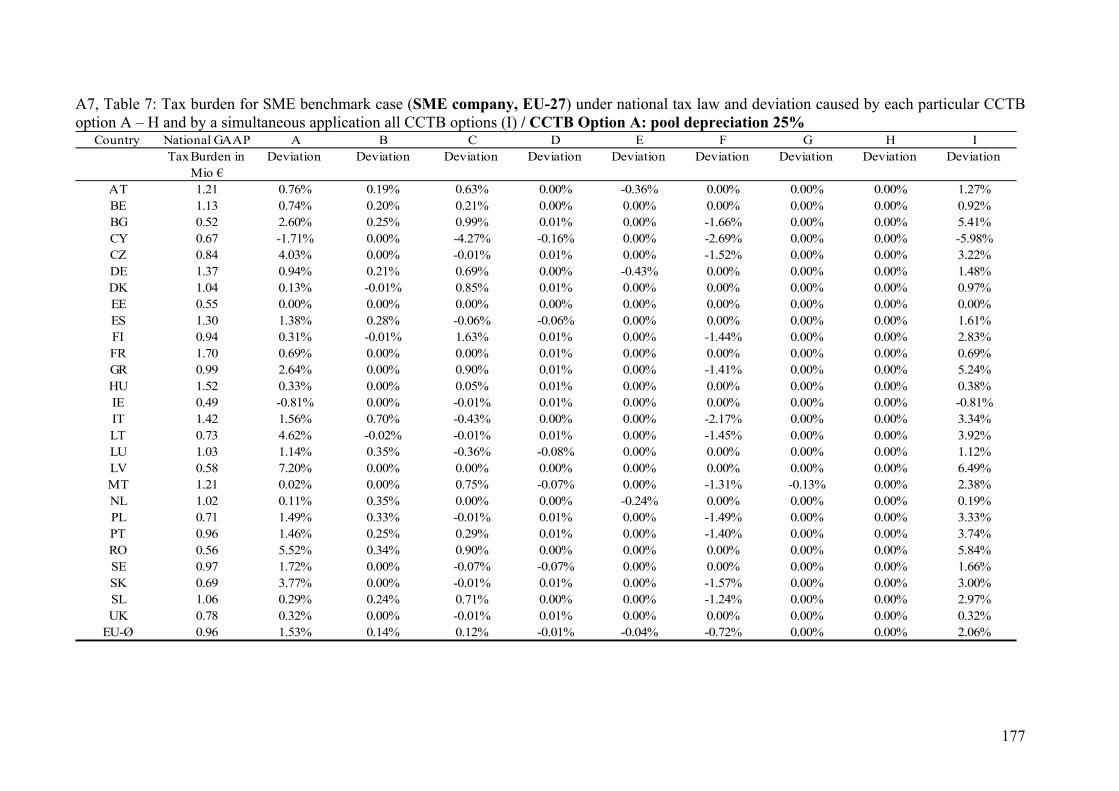
177
A7, Table 7: Tax burden for SME benchmark case (SME company, EU-27) under national tax law and deviation caused by each particular CCTB option A – H and by a simultaneous application all CCTB options (I) / CCTB Option A: pool depreciation 25%
Country National GAAP A B C D E F G H ITax Burden in
Mio €Deviation Deviation Deviation Deviation Deviation Deviation Deviation Deviation Deviation
AT 1.21 0.76% 0.19% 0.63% 0.00% -0.36% 0.00% 0.00% 0.00% 1.27%BE 1.13 0.74% 0.20% 0.21% 0.00% 0.00% 0.00% 0.00% 0.00% 0.92%BG 0.52 2.60% 0.25% 0.99% 0.01% 0.00% -1.66% 0.00% 0.00% 5.41%CY 0.67 -1.71% 0.00% -4.27% -0.16% 0.00% -2.69% 0.00% 0.00% -5.98%CZ 0.84 4.03% 0.00% -0.01% 0.01% 0.00% -1.52% 0.00% 0.00% 3.22%DE 1.37 0.94% 0.21% 0.69% 0.00% -0.43% 0.00% 0.00% 0.00% 1.48%DK 1.04 0.13% -0.01% 0.85% 0.01% 0.00% 0.00% 0.00% 0.00% 0.97%EE 0.55 0.00% 0.00% 0.00% 0.00% 0.00% 0.00% 0.00% 0.00% 0.00%ES 1.30 1.38% 0.28% -0.06% -0.06% 0.00% 0.00% 0.00% 0.00% 1.61%FI 0.94 0.31% -0.01% 1.63% 0.01% 0.00% -1.44% 0.00% 0.00% 2.83%FR 1.70 0.69% 0.00% 0.00% 0.01% 0.00% 0.00% 0.00% 0.00% 0.69%GR 0.99 2.64% 0.00% 0.90% 0.01% 0.00% -1.41% 0.00% 0.00% 5.24%HU 1.52 0.33% 0.00% 0.05% 0.01% 0.00% 0.00% 0.00% 0.00% 0.38%IE 0.49 -0.81% 0.00% -0.01% 0.01% 0.00% 0.00% 0.00% 0.00% -0.81%IT 1.42 1.56% 0.70% -0.43% 0.00% 0.00% -2.17% 0.00% 0.00% 3.34%LT 0.73 4.62% -0.02% -0.01% 0.01% 0.00% -1.45% 0.00% 0.00% 3.92%LU 1.03 1.14% 0.35% -0.36% -0.08% 0.00% 0.00% 0.00% 0.00% 1.12%LV 0.58 7.20% 0.00% 0.00% 0.00% 0.00% 0.00% 0.00% 0.00% 6.49%MT 1.21 0.02% 0.00% 0.75% -0.07% 0.00% -1.31% -0.13% 0.00% 2.38%NL 1.02 0.11% 0.35% 0.00% 0.00% -0.24% 0.00% 0.00% 0.00% 0.19%PL 0.71 1.49% 0.33% -0.01% 0.01% 0.00% -1.49% 0.00% 0.00% 3.33%PT 0.96 1.46% 0.25% 0.29% 0.01% 0.00% -1.40% 0.00% 0.00% 3.74%RO 0.56 5.52% 0.34% 0.90% 0.00% 0.00% 0.00% 0.00% 0.00% 5.84%SE 0.97 1.72% 0.00% -0.07% -0.07% 0.00% 0.00% 0.00% 0.00% 1.66%SK 0.69 3.77% 0.00% -0.01% 0.01% 0.00% -1.57% 0.00% 0.00% 3.00%SL 1.06 0.29% 0.24% 0.71% 0.00% 0.00% -1.24% 0.00% 0.00% 2.97%UK 0.78 0.32% 0.00% -0.01% 0.01% 0.00% 0.00% 0.00% 0.00% 0.32%
EU-Ø 0.96 1.53% 0.14% 0.12% -0.01% -0.04% -0.72% 0.00% 0.00% 2.06%
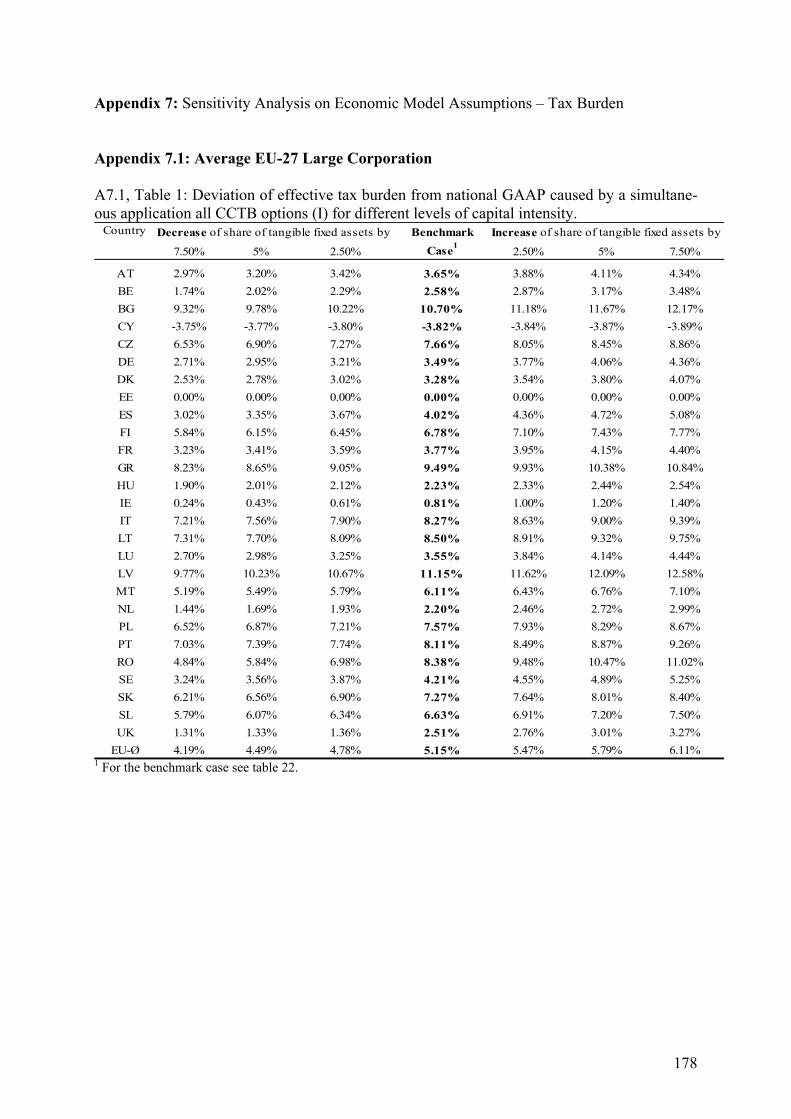
178
Appendix 7: Sensitivity Analysis on Economic Model Assumptions – Tax Burden Appendix 7.1: Average EU-27 Large Corporation A7.1, Table 1: Deviation of effective tax burden from national GAAP caused by a simultane-ous application all CCTB options (I) for different levels of capital intensity.
Country Benchmark
7.50% 5% 2.50% Case1
2.50% 5% 7.50%
AT 2.97% 3.20% 3.42% 3.65% 3.88% 4.11% 4.34%
BE 1.74% 2.02% 2.29% 2.58% 2.87% 3.17% 3.48%
BG 9.32% 9.78% 10.22% 10.70% 11.18% 11.67% 12.17%
CY -3.75% -3.77% -3.80% -3.82% -3.84% -3.87% -3.89%
CZ 6.53% 6.90% 7.27% 7.66% 8.05% 8.45% 8.86%
DE 2.71% 2.95% 3.21% 3.49% 3.77% 4.06% 4.36%
DK 2.53% 2.78% 3.02% 3.28% 3.54% 3.80% 4.07%
EE 0.00% 0.00% 0.00% 0.00% 0.00% 0.00% 0.00%
ES 3.02% 3.35% 3.67% 4.02% 4.36% 4.72% 5.08%
FI 5.84% 6.15% 6.45% 6.78% 7.10% 7.43% 7.77%
FR 3.23% 3.41% 3.59% 3.77% 3.95% 4.15% 4.40%
GR 8.23% 8.65% 9.05% 9.49% 9.93% 10.38% 10.84%
HU 1.90% 2.01% 2.12% 2.23% 2.33% 2.44% 2.54%
IE 0.24% 0.43% 0.61% 0.81% 1.00% 1.20% 1.40%
IT 7.21% 7.56% 7.90% 8.27% 8.63% 9.00% 9.39%
LT 7.31% 7.70% 8.09% 8.50% 8.91% 9.32% 9.75%
LU 2.70% 2.98% 3.25% 3.55% 3.84% 4.14% 4.44%
LV 9.77% 10.23% 10.67% 11.15% 11.62% 12.09% 12.58%
MT 5.19% 5.49% 5.79% 6.11% 6.43% 6.76% 7.10%
NL 1.44% 1.69% 1.93% 2.20% 2.46% 2.72% 2.99%
PL 6.52% 6.87% 7.21% 7.57% 7.93% 8.29% 8.67%
PT 7.03% 7.39% 7.74% 8.11% 8.49% 8.87% 9.26%
RO 4.84% 5.84% 6.98% 8.38% 9.48% 10.47% 11.02%
SE 3.24% 3.56% 3.87% 4.21% 4.55% 4.89% 5.25%
SK 6.21% 6.56% 6.90% 7.27% 7.64% 8.01% 8.40%
SL 5.79% 6.07% 6.34% 6.63% 6.91% 7.20% 7.50%
UK 1.31% 1.33% 1.36% 2.51% 2.76% 3.01% 3.27%
EU-Ø 4.19% 4.49% 4.78% 5.15% 5.47% 5.79% 6.11%
Increase of share of tangible fixed assets byDecrease of share of tangible fixed assets by
1 For the benchmark case see table 22.
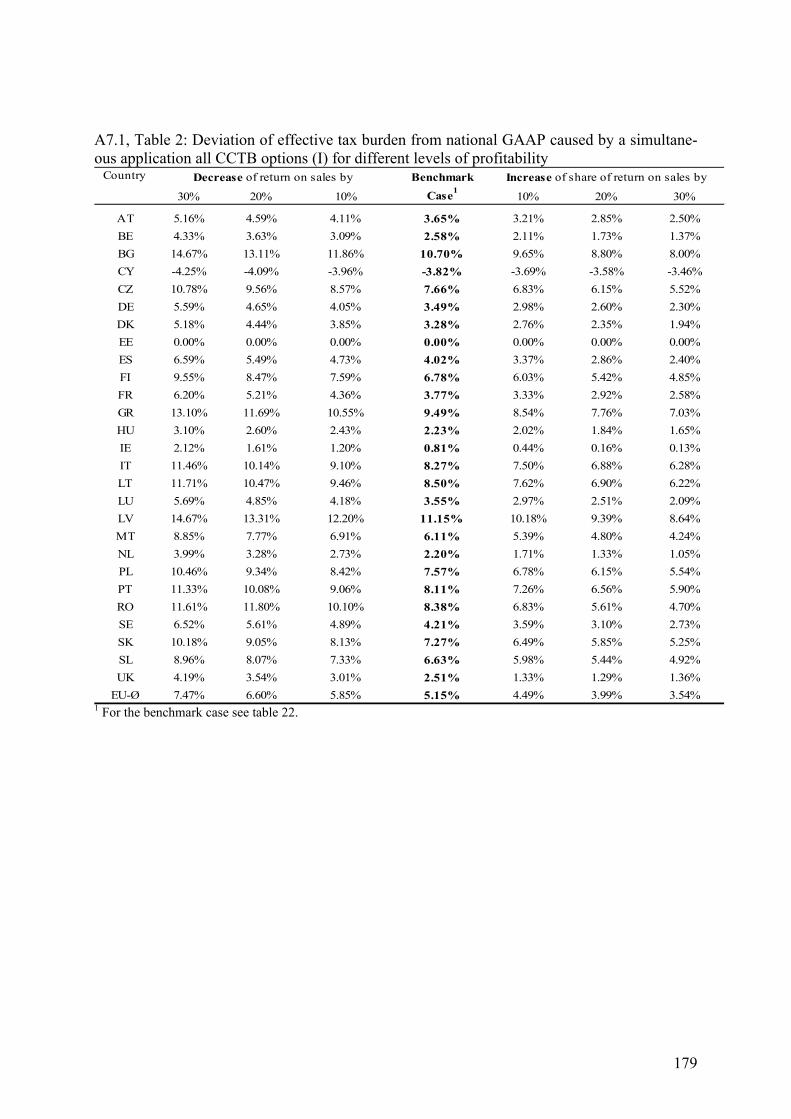
179
A7.1, Table 2: Deviation of effective tax burden from national GAAP caused by a simultane-ous application all CCTB options (I) for different levels of profitability
Country Benchmark
30% 20% 10% Case1
10% 20% 30%
AT 5.16% 4.59% 4.11% 3.65% 3.21% 2.85% 2.50%
BE 4.33% 3.63% 3.09% 2.58% 2.11% 1.73% 1.37%
BG 14.67% 13.11% 11.86% 10.70% 9.65% 8.80% 8.00%
CY -4.25% -4.09% -3.96% -3.82% -3.69% -3.58% -3.46%
CZ 10.78% 9.56% 8.57% 7.66% 6.83% 6.15% 5.52%
DE 5.59% 4.65% 4.05% 3.49% 2.98% 2.60% 2.30%
DK 5.18% 4.44% 3.85% 3.28% 2.76% 2.35% 1.94%
EE 0.00% 0.00% 0.00% 0.00% 0.00% 0.00% 0.00%
ES 6.59% 5.49% 4.73% 4.02% 3.37% 2.86% 2.40%
FI 9.55% 8.47% 7.59% 6.78% 6.03% 5.42% 4.85%
FR 6.20% 5.21% 4.36% 3.77% 3.33% 2.92% 2.58%
GR 13.10% 11.69% 10.55% 9.49% 8.54% 7.76% 7.03%
HU 3.10% 2.60% 2.43% 2.23% 2.02% 1.84% 1.65%
IE 2.12% 1.61% 1.20% 0.81% 0.44% 0.16% 0.13%
IT 11.46% 10.14% 9.10% 8.27% 7.50% 6.88% 6.28%
LT 11.71% 10.47% 9.46% 8.50% 7.62% 6.90% 6.22%
LU 5.69% 4.85% 4.18% 3.55% 2.97% 2.51% 2.09%
LV 14.67% 13.31% 12.20% 11.15% 10.18% 9.39% 8.64%
MT 8.85% 7.77% 6.91% 6.11% 5.39% 4.80% 4.24%
NL 3.99% 3.28% 2.73% 2.20% 1.71% 1.33% 1.05%
PL 10.46% 9.34% 8.42% 7.57% 6.78% 6.15% 5.54%
PT 11.33% 10.08% 9.06% 8.11% 7.26% 6.56% 5.90%
RO 11.61% 11.80% 10.10% 8.38% 6.83% 5.61% 4.70%
SE 6.52% 5.61% 4.89% 4.21% 3.59% 3.10% 2.73%
SK 10.18% 9.05% 8.13% 7.27% 6.49% 5.85% 5.25%
SL 8.96% 8.07% 7.33% 6.63% 5.98% 5.44% 4.92%
UK 4.19% 3.54% 3.01% 2.51% 1.33% 1.29% 1.36%
EU-Ø 7.47% 6.60% 5.85% 5.15% 4.49% 3.99% 3.54%
Increase of share of return on sales byDecrease of return on sales by
1 For the benchmark case see table 22.
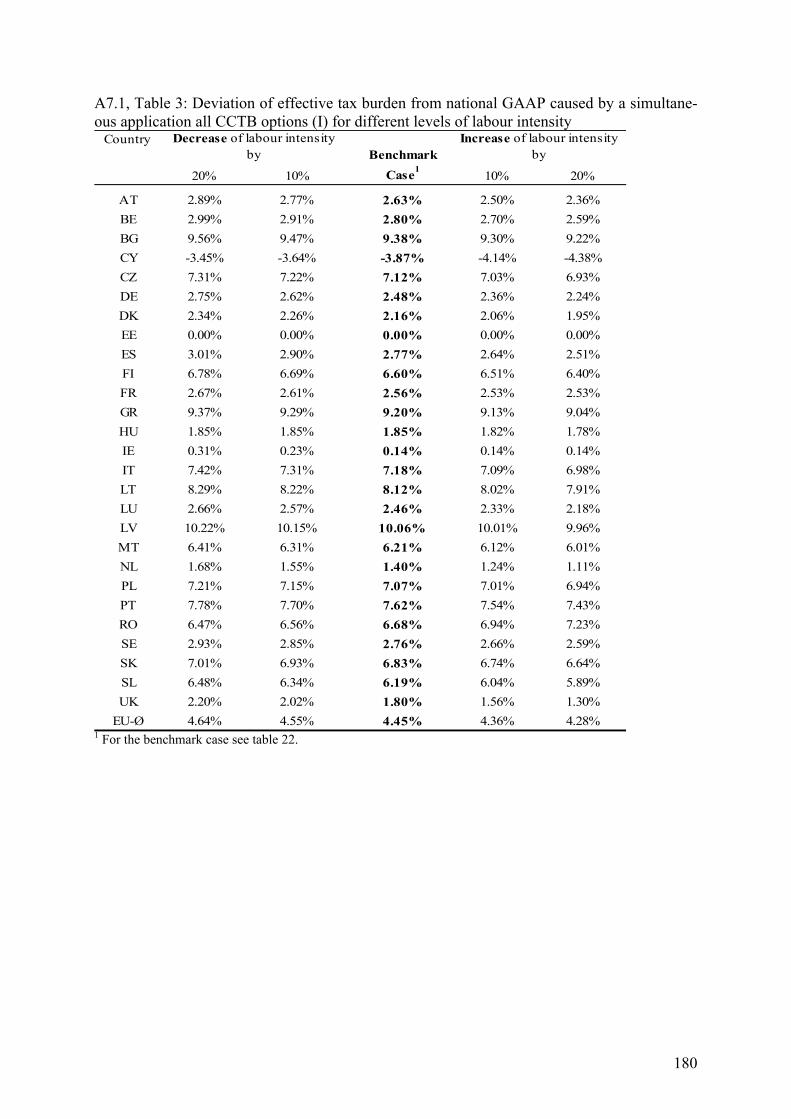
180
A7.1, Table 3: Deviation of effective tax burden from national GAAP caused by a simultane-ous application all CCTB options (I) for different levels of labour intensity
CountryBenchmark
20% 10% Case1
10% 20%
AT 2.89% 2.77% 2.63% 2.50% 2.36%
BE 2.99% 2.91% 2.80% 2.70% 2.59%
BG 9.56% 9.47% 9.38% 9.30% 9.22%
CY -3.45% -3.64% -3.87% -4.14% -4.38%
CZ 7.31% 7.22% 7.12% 7.03% 6.93%
DE 2.75% 2.62% 2.48% 2.36% 2.24%
DK 2.34% 2.26% 2.16% 2.06% 1.95%
EE 0.00% 0.00% 0.00% 0.00% 0.00%
ES 3.01% 2.90% 2.77% 2.64% 2.51%
FI 6.78% 6.69% 6.60% 6.51% 6.40%
FR 2.67% 2.61% 2.56% 2.53% 2.53%
GR 9.37% 9.29% 9.20% 9.13% 9.04%
HU 1.85% 1.85% 1.85% 1.82% 1.78%
IE 0.31% 0.23% 0.14% 0.14% 0.14%
IT 7.42% 7.31% 7.18% 7.09% 6.98%
LT 8.29% 8.22% 8.12% 8.02% 7.91%
LU 2.66% 2.57% 2.46% 2.33% 2.18%
LV 10.22% 10.15% 10.06% 10.01% 9.96%
MT 6.41% 6.31% 6.21% 6.12% 6.01%
NL 1.68% 1.55% 1.40% 1.24% 1.11%
PL 7.21% 7.15% 7.07% 7.01% 6.94%
PT 7.78% 7.70% 7.62% 7.54% 7.43%
RO 6.47% 6.56% 6.68% 6.94% 7.23%
SE 2.93% 2.85% 2.76% 2.66% 2.59%
SK 7.01% 6.93% 6.83% 6.74% 6.64%
SL 6.48% 6.34% 6.19% 6.04% 5.89%
UK 2.20% 2.02% 1.80% 1.56% 1.30%
EU-Ø 4.64% 4.55% 4.45% 4.36% 4.28%
Decrease of labour intensity by
Increase of labour intensity by
1 For the benchmark case see table 22.
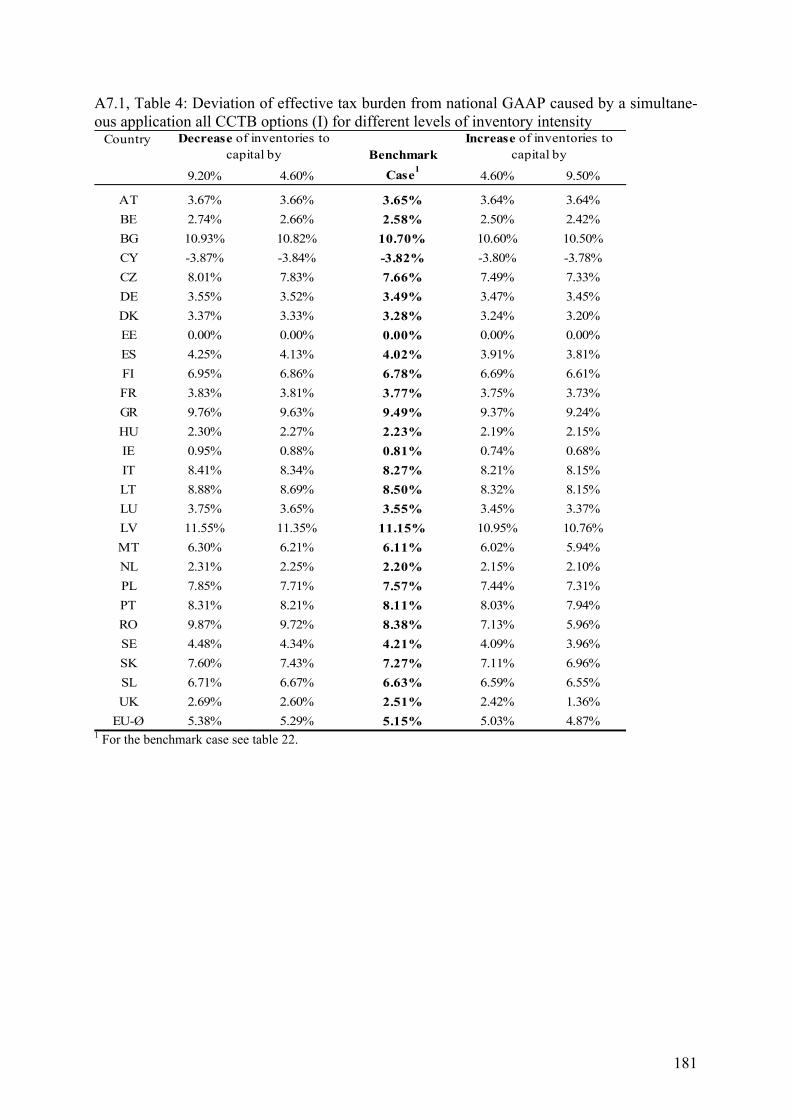
181
A7.1, Table 4: Deviation of effective tax burden from national GAAP caused by a simultane-ous application all CCTB options (I) for different levels of inventory intensity
CountryBenchmark
9.20% 4.60% Case1
4.60% 9.50%
AT 3.67% 3.66% 3.65% 3.64% 3.64%
BE 2.74% 2.66% 2.58% 2.50% 2.42%
BG 10.93% 10.82% 10.70% 10.60% 10.50%
CY -3.87% -3.84% -3.82% -3.80% -3.78%
CZ 8.01% 7.83% 7.66% 7.49% 7.33%
DE 3.55% 3.52% 3.49% 3.47% 3.45%
DK 3.37% 3.33% 3.28% 3.24% 3.20%
EE 0.00% 0.00% 0.00% 0.00% 0.00%
ES 4.25% 4.13% 4.02% 3.91% 3.81%
FI 6.95% 6.86% 6.78% 6.69% 6.61%
FR 3.83% 3.81% 3.77% 3.75% 3.73%
GR 9.76% 9.63% 9.49% 9.37% 9.24%
HU 2.30% 2.27% 2.23% 2.19% 2.15%
IE 0.95% 0.88% 0.81% 0.74% 0.68%
IT 8.41% 8.34% 8.27% 8.21% 8.15%
LT 8.88% 8.69% 8.50% 8.32% 8.15%
LU 3.75% 3.65% 3.55% 3.45% 3.37%
LV 11.55% 11.35% 11.15% 10.95% 10.76%
MT 6.30% 6.21% 6.11% 6.02% 5.94%
NL 2.31% 2.25% 2.20% 2.15% 2.10%
PL 7.85% 7.71% 7.57% 7.44% 7.31%
PT 8.31% 8.21% 8.11% 8.03% 7.94%
RO 9.87% 9.72% 8.38% 7.13% 5.96%
SE 4.48% 4.34% 4.21% 4.09% 3.96%
SK 7.60% 7.43% 7.27% 7.11% 6.96%
SL 6.71% 6.67% 6.63% 6.59% 6.55%
UK 2.69% 2.60% 2.51% 2.42% 1.36%
EU-Ø 5.38% 5.29% 5.15% 5.03% 4.87%
Decrease of inventories to capital by
Increase of inventories to capital by
1 For the benchmark case see table 22.
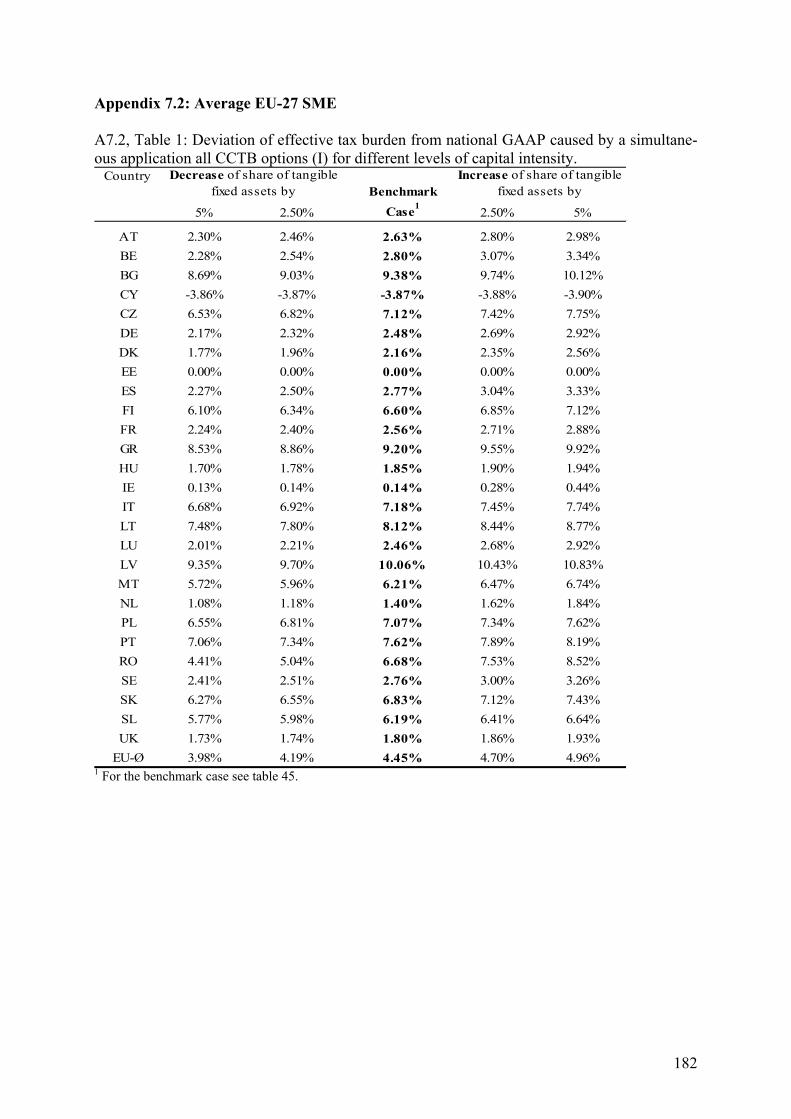
182
Appendix 7.2: Average EU-27 SME A7.2, Table 1: Deviation of effective tax burden from national GAAP caused by a simultane-ous application all CCTB options (I) for different levels of capital intensity.
CountryBenchmark
5% 2.50% Case1
2.50% 5%
AT 2.30% 2.46% 2.63% 2.80% 2.98%
BE 2.28% 2.54% 2.80% 3.07% 3.34%
BG 8.69% 9.03% 9.38% 9.74% 10.12%
CY -3.86% -3.87% -3.87% -3.88% -3.90%
CZ 6.53% 6.82% 7.12% 7.42% 7.75%
DE 2.17% 2.32% 2.48% 2.69% 2.92%
DK 1.77% 1.96% 2.16% 2.35% 2.56%
EE 0.00% 0.00% 0.00% 0.00% 0.00%
ES 2.27% 2.50% 2.77% 3.04% 3.33%
FI 6.10% 6.34% 6.60% 6.85% 7.12%
FR 2.24% 2.40% 2.56% 2.71% 2.88%
GR 8.53% 8.86% 9.20% 9.55% 9.92%
HU 1.70% 1.78% 1.85% 1.90% 1.94%
IE 0.13% 0.14% 0.14% 0.28% 0.44%
IT 6.68% 6.92% 7.18% 7.45% 7.74%
LT 7.48% 7.80% 8.12% 8.44% 8.77%
LU 2.01% 2.21% 2.46% 2.68% 2.92%
LV 9.35% 9.70% 10.06% 10.43% 10.83%
MT 5.72% 5.96% 6.21% 6.47% 6.74%
NL 1.08% 1.18% 1.40% 1.62% 1.84%
PL 6.55% 6.81% 7.07% 7.34% 7.62%
PT 7.06% 7.34% 7.62% 7.89% 8.19%
RO 4.41% 5.04% 6.68% 7.53% 8.52%
SE 2.41% 2.51% 2.76% 3.00% 3.26%
SK 6.27% 6.55% 6.83% 7.12% 7.43%
SL 5.77% 5.98% 6.19% 6.41% 6.64%
UK 1.73% 1.74% 1.80% 1.86% 1.93%
EU-Ø 3.98% 4.19% 4.45% 4.70% 4.96%
Decrease of share of tangible fixed assets by
Increase of share of tangible fixed assets by
1 For the benchmark case see table 45.
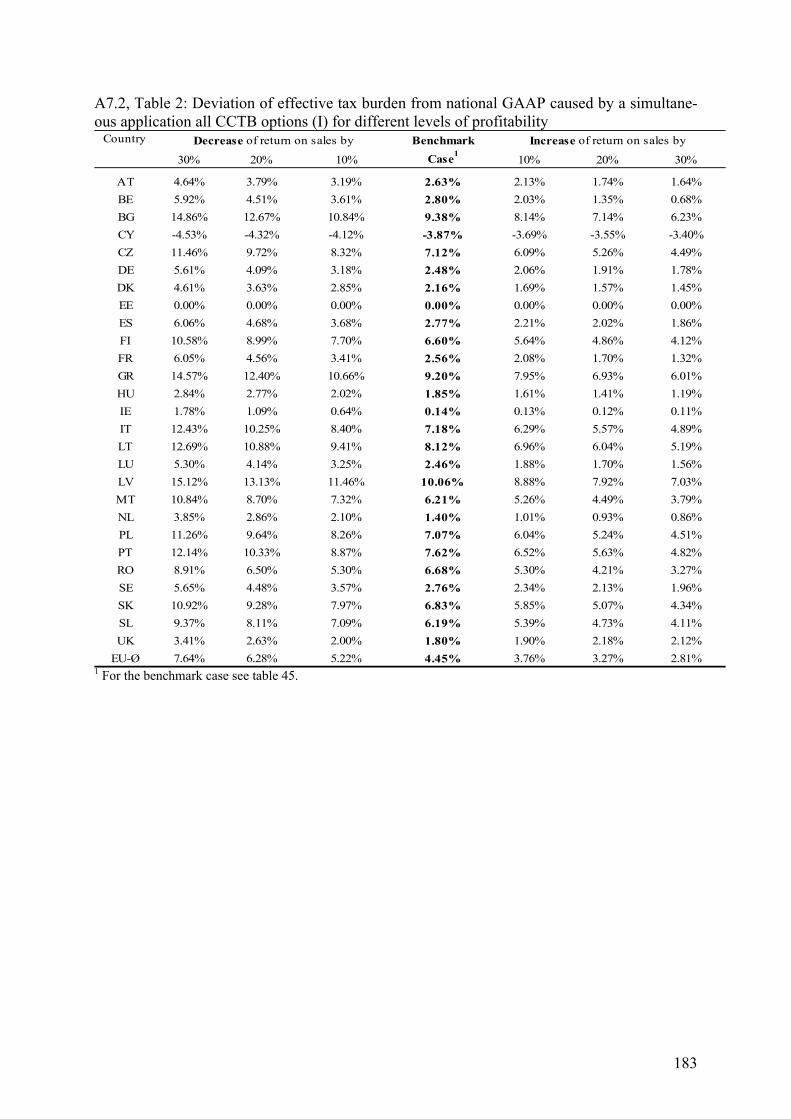
183
A7.2, Table 2: Deviation of effective tax burden from national GAAP caused by a simultane-ous application all CCTB options (I) for different levels of profitability
Country Benchmark
30% 20% 10% Case1
10% 20% 30%
AT 4.64% 3.79% 3.19% 2.63% 2.13% 1.74% 1.64%
BE 5.92% 4.51% 3.61% 2.80% 2.03% 1.35% 0.68%
BG 14.86% 12.67% 10.84% 9.38% 8.14% 7.14% 6.23%
CY -4.53% -4.32% -4.12% -3.87% -3.69% -3.55% -3.40%
CZ 11.46% 9.72% 8.32% 7.12% 6.09% 5.26% 4.49%
DE 5.61% 4.09% 3.18% 2.48% 2.06% 1.91% 1.78%
DK 4.61% 3.63% 2.85% 2.16% 1.69% 1.57% 1.45%
EE 0.00% 0.00% 0.00% 0.00% 0.00% 0.00% 0.00%
ES 6.06% 4.68% 3.68% 2.77% 2.21% 2.02% 1.86%
FI 10.58% 8.99% 7.70% 6.60% 5.64% 4.86% 4.12%
FR 6.05% 4.56% 3.41% 2.56% 2.08% 1.70% 1.32%
GR 14.57% 12.40% 10.66% 9.20% 7.95% 6.93% 6.01%
HU 2.84% 2.77% 2.02% 1.85% 1.61% 1.41% 1.19%
IE 1.78% 1.09% 0.64% 0.14% 0.13% 0.12% 0.11%
IT 12.43% 10.25% 8.40% 7.18% 6.29% 5.57% 4.89%
LT 12.69% 10.88% 9.41% 8.12% 6.96% 6.04% 5.19%
LU 5.30% 4.14% 3.25% 2.46% 1.88% 1.70% 1.56%
LV 15.12% 13.13% 11.46% 10.06% 8.88% 7.92% 7.03%
MT 10.84% 8.70% 7.32% 6.21% 5.26% 4.49% 3.79%
NL 3.85% 2.86% 2.10% 1.40% 1.01% 0.93% 0.86%
PL 11.26% 9.64% 8.26% 7.07% 6.04% 5.24% 4.51%
PT 12.14% 10.33% 8.87% 7.62% 6.52% 5.63% 4.82%
RO 8.91% 6.50% 5.30% 6.68% 5.30% 4.21% 3.27%
SE 5.65% 4.48% 3.57% 2.76% 2.34% 2.13% 1.96%
SK 10.92% 9.28% 7.97% 6.83% 5.85% 5.07% 4.34%
SL 9.37% 8.11% 7.09% 6.19% 5.39% 4.73% 4.11%
UK 3.41% 2.63% 2.00% 1.80% 1.90% 2.18% 2.12%
EU-Ø 7.64% 6.28% 5.22% 4.45% 3.76% 3.27% 2.81%
Increase of return on sales byDecrease of return on sales by
1 For the benchmark case see table 45.

184
A7.2, Table 3: Deviation of effective tax burden from national GAAP caused by a simultane-ous application all CCTB options (I) for different levels of labour intensity
CountryBenchmark
20% 10% Case1
10% 20%
AT 2.89% 2.77% 2.63% 2.50% 2.52%
BE 2.99% 2.91% 2.80% 2.70% 2.68%
BG 9.56% 9.47% 9.38% 9.30% 9.22%
CY -3.45% -3.64% -3.87% -4.14% -3.99%
CZ 7.31% 7.22% 7.12% 7.03% 6.97%
DE 2.75% 2.62% 2.48% 2.36% 2.37%
DK 2.34% 2.26% 2.16% 2.06% 2.05%
EE 0.00% 0.00% 0.00% 0.00% 0.00%
ES 3.01% 2.90% 2.77% 2.64% 2.63%
FI 6.78% 6.69% 6.60% 6.51% 6.46%
FR 2.67% 2.61% 2.56% 2.53% 2.48%
GR 9.37% 9.29% 9.20% 9.13% 9.04%
HU 1.85% 1.85% 1.85% 1.82% 1.82%
IE 0.31% 0.23% 0.14% 0.14% 0.14%
IT 7.42% 7.31% 7.18% 7.09% 7.03%
LT 8.29% 8.22% 8.12% 8.02% 7.96%
LU 2.66% 2.57% 2.46% 2.33% 2.33%
LV 10.22% 10.15% 10.06% 10.01% 9.92%
MT 6.41% 6.31% 6.21% 6.12% 6.07%
NL 1.68% 1.55% 1.40% 1.24% 1.26%
PL 7.21% 7.15% 7.07% 7.01% 6.94%
PT 7.78% 7.70% 7.62% 7.54% 7.47%
RO 6.47% 6.56% 6.68% 6.94% 6.66%
SE 2.93% 2.85% 2.76% 2.66% 2.64%
SK 7.01% 6.93% 6.83% 6.74% 6.69%
SL 6.48% 6.34% 6.19% 6.04% 6.04%
UK 2.20% 2.02% 1.80% 1.56% 1.67%
EU-Ø 4.64% 4.55% 4.45% 4.36% 4.34%
Decrease of labour intensity by
Increase of labour intensity by
1 For the benchmark case see table 45.
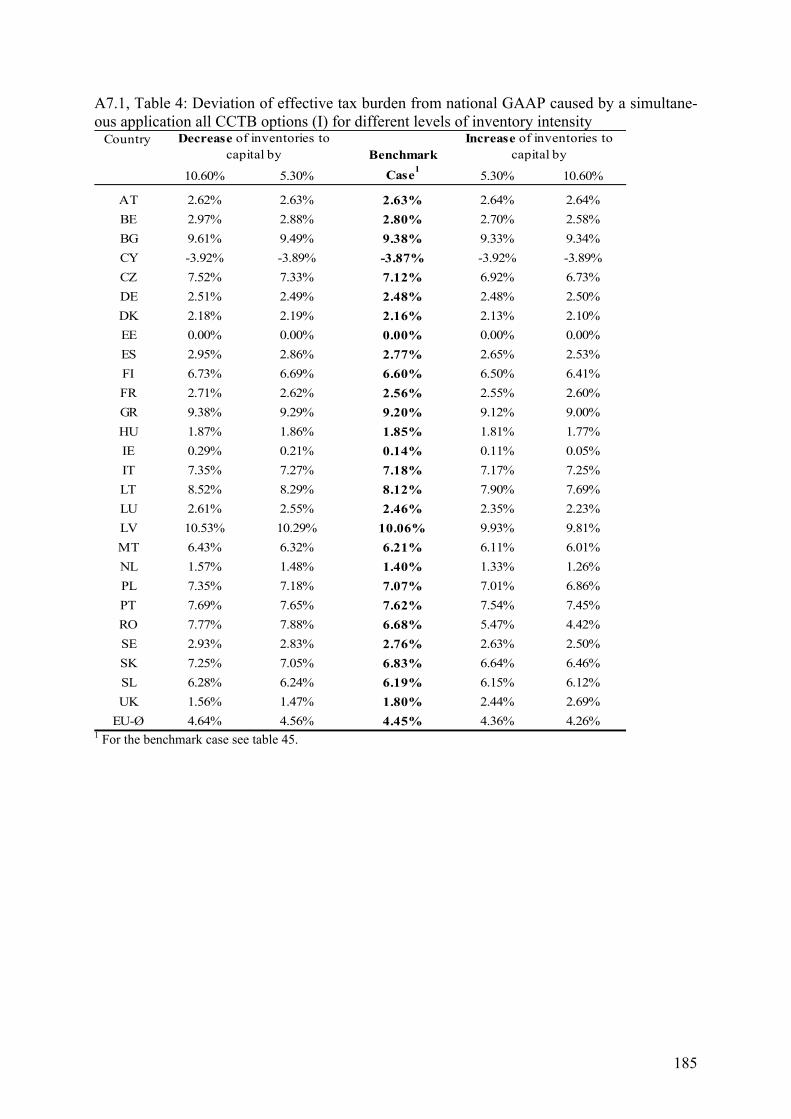
185
A7.1, Table 4: Deviation of effective tax burden from national GAAP caused by a simultane-ous application all CCTB options (I) for different levels of inventory intensity
CountryBenchmark
10.60% 5.30% Case1
5.30% 10.60%
AT 2.62% 2.63% 2.63% 2.64% 2.64%
BE 2.97% 2.88% 2.80% 2.70% 2.58%
BG 9.61% 9.49% 9.38% 9.33% 9.34%
CY -3.92% -3.89% -3.87% -3.92% -3.89%
CZ 7.52% 7.33% 7.12% 6.92% 6.73%
DE 2.51% 2.49% 2.48% 2.48% 2.50%
DK 2.18% 2.19% 2.16% 2.13% 2.10%
EE 0.00% 0.00% 0.00% 0.00% 0.00%
ES 2.95% 2.86% 2.77% 2.65% 2.53%
FI 6.73% 6.69% 6.60% 6.50% 6.41%
FR 2.71% 2.62% 2.56% 2.55% 2.60%
GR 9.38% 9.29% 9.20% 9.12% 9.00%
HU 1.87% 1.86% 1.85% 1.81% 1.77%
IE 0.29% 0.21% 0.14% 0.11% 0.05%
IT 7.35% 7.27% 7.18% 7.17% 7.25%
LT 8.52% 8.29% 8.12% 7.90% 7.69%
LU 2.61% 2.55% 2.46% 2.35% 2.23%
LV 10.53% 10.29% 10.06% 9.93% 9.81%
MT 6.43% 6.32% 6.21% 6.11% 6.01%
NL 1.57% 1.48% 1.40% 1.33% 1.26%
PL 7.35% 7.18% 7.07% 7.01% 6.86%
PT 7.69% 7.65% 7.62% 7.54% 7.45%
RO 7.77% 7.88% 6.68% 5.47% 4.42%
SE 2.93% 2.83% 2.76% 2.63% 2.50%
SK 7.25% 7.05% 6.83% 6.64% 6.46%
SL 6.28% 6.24% 6.19% 6.15% 6.12%
UK 1.56% 1.47% 1.80% 2.44% 2.69%
EU-Ø 4.64% 4.56% 4.45% 4.36% 4.26%
Decrease of inventories to capital by
Increase of inventories to capital by
1 For the benchmark case see table 45.

186
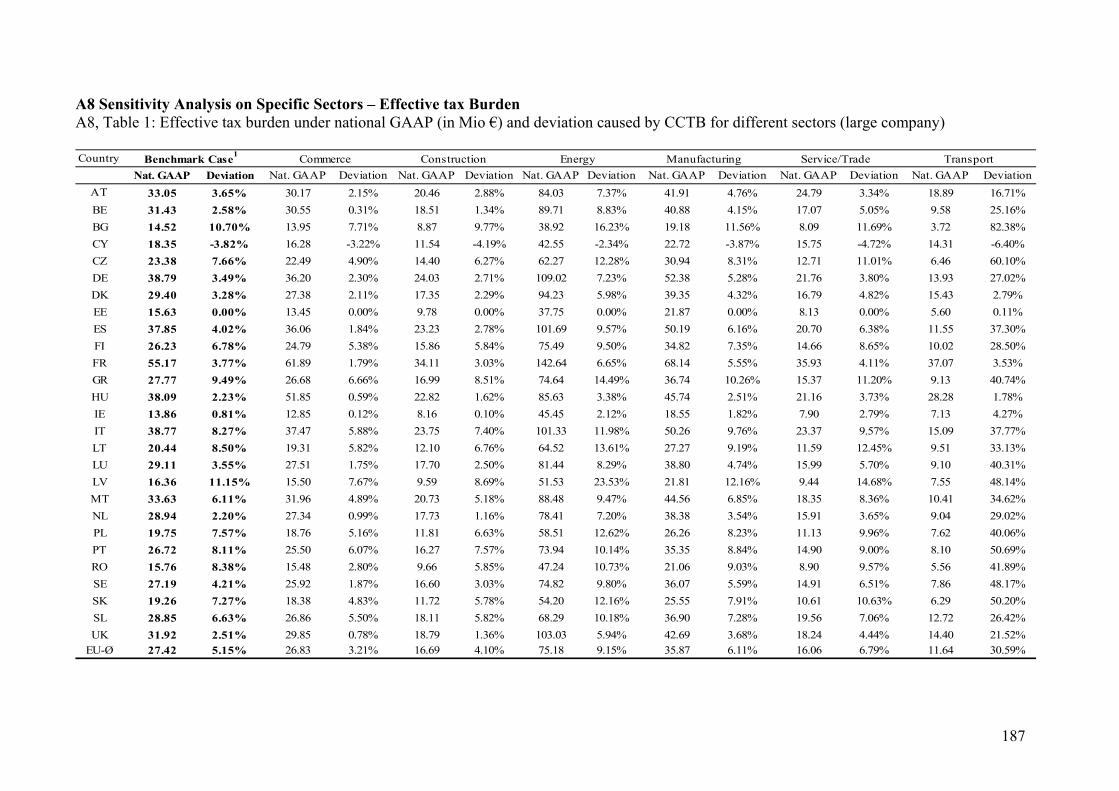
187
A8 Sensitivity Analysis on Specific Sectors – Effective tax Burden A8, Table 1: Effective tax burden under national GAAP (in Mio €) and deviation caused by CCTB for different sectors (large company) Country
Nat. GAAP Deviation Nat. GAAP Deviation Nat. GAAP Deviation Nat. GAAP Deviation Nat. GAAP Deviation Nat. GAAP Deviation Nat. GAAP Deviation
AT 33.05 3.65% 30.17 2.15% 20.46 2.88% 84.03 7.37% 41.91 4.76% 24.79 3.34% 18.89 16.71%
BE 31.43 2.58% 30.55 0.31% 18.51 1.34% 89.71 8.83% 40.88 4.15% 17.07 5.05% 9.58 25.16%
BG 14.52 10.70% 13.95 7.71% 8.87 9.77% 38.92 16.23% 19.18 11.56% 8.09 11.69% 3.72 82.38%
CY 18.35 -3.82% 16.28 -3.22% 11.54 -4.19% 42.55 -2.34% 22.72 -3.87% 15.75 -4.72% 14.31 -6.40%
CZ 23.38 7.66% 22.49 4.90% 14.40 6.27% 62.27 12.28% 30.94 8.31% 12.71 11.01% 6.46 60.10%
DE 38.79 3.49% 36.20 2.30% 24.03 2.71% 109.02 7.23% 52.38 5.28% 21.76 3.80% 13.93 27.02%
DK 29.40 3.28% 27.38 2.11% 17.35 2.29% 94.23 5.98% 39.35 4.32% 16.79 4.82% 15.43 2.79%
EE 15.63 0.00% 13.45 0.00% 9.78 0.00% 37.75 0.00% 21.87 0.00% 8.13 0.00% 5.60 0.11%
ES 37.85 4.02% 36.06 1.84% 23.23 2.78% 101.69 9.57% 50.19 6.16% 20.70 6.38% 11.55 37.30%
FI 26.23 6.78% 24.79 5.38% 15.86 5.84% 75.49 9.50% 34.82 7.35% 14.66 8.65% 10.02 28.50%
FR 55.17 3.77% 61.89 1.79% 34.11 3.03% 142.64 6.65% 68.14 5.55% 35.93 4.11% 37.07 3.53%
GR 27.77 9.49% 26.68 6.66% 16.99 8.51% 74.64 14.49% 36.74 10.26% 15.37 11.20% 9.13 40.74%
HU 38.09 2.23% 51.85 0.59% 22.82 1.62% 85.63 3.38% 45.74 2.51% 21.16 3.73% 28.28 1.78%
IE 13.86 0.81% 12.85 0.12% 8.16 0.10% 45.45 2.12% 18.55 1.82% 7.90 2.79% 7.13 4.27%
IT 38.77 8.27% 37.47 5.88% 23.75 7.40% 101.33 11.98% 50.26 9.76% 23.37 9.57% 15.09 37.77%
LT 20.44 8.50% 19.31 5.82% 12.10 6.76% 64.52 13.61% 27.27 9.19% 11.59 12.45% 9.51 33.13%
LU 29.11 3.55% 27.51 1.75% 17.70 2.50% 81.44 8.29% 38.80 4.74% 15.99 5.70% 9.10 40.31%
LV 16.36 11.15% 15.50 7.67% 9.59 8.69% 51.53 23.53% 21.81 12.16% 9.44 14.68% 7.55 48.14%
MT 33.63 6.11% 31.96 4.89% 20.73 5.18% 88.48 9.47% 44.56 6.85% 18.35 8.36% 10.41 34.62%
NL 28.94 2.20% 27.34 0.99% 17.73 1.16% 78.41 7.20% 38.38 3.54% 15.91 3.65% 9.04 29.02%
PL 19.75 7.57% 18.76 5.16% 11.81 6.63% 58.51 12.62% 26.26 8.23% 11.13 9.96% 7.62 40.06%
PT 26.72 8.11% 25.50 6.07% 16.27 7.57% 73.94 10.14% 35.35 8.84% 14.90 9.00% 8.10 50.69%
RO 15.76 8.38% 15.48 2.80% 9.66 5.85% 47.24 10.73% 21.06 9.03% 8.90 9.57% 5.56 41.89%
SE 27.19 4.21% 25.92 1.87% 16.60 3.03% 74.82 9.80% 36.07 5.59% 14.91 6.51% 7.86 48.17%
SK 19.26 7.27% 18.38 4.83% 11.72 5.78% 54.20 12.16% 25.55 7.91% 10.61 10.63% 6.29 50.20%
SL 28.85 6.63% 26.86 5.50% 18.11 5.82% 68.29 10.18% 36.90 7.28% 19.56 7.06% 12.72 26.42%
UK 31.92 2.51% 29.85 0.78% 18.79 1.36% 103.03 5.94% 42.69 3.68% 18.24 4.44% 14.40 21.52%EU-Ø 27.42 5.15% 26.83 3.21% 16.69 4.10% 75.18 9.15% 35.87 6.11% 16.06 6.79% 11.64 30.59%
TransportConstruction EnergyBenchmark Case1
Commerce Manufacturing Service/Trade
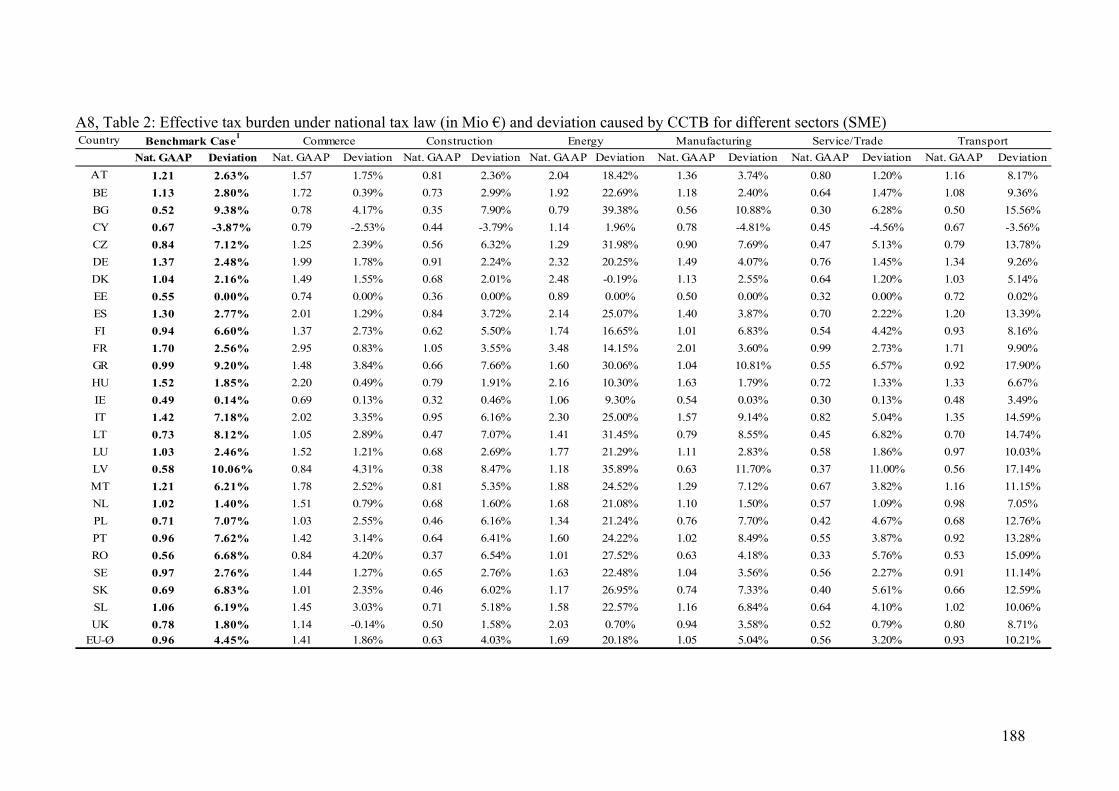
188
A8, Table 2: Effective tax burden under national tax law (in Mio €) and deviation caused by CCTB for different sectors (SME) Country
Nat. GAAP Deviation Nat. GAAP Deviation Nat. GAAP Deviation Nat. GAAP Deviation Nat. GAAP Deviation Nat. GAAP Deviation Nat. GAAP Deviation
AT 1.21 2.63% 1.57 1.75% 0.81 2.36% 2.04 18.42% 1.36 3.74% 0.80 1.20% 1.16 8.17%
BE 1.13 2.80% 1.72 0.39% 0.73 2.99% 1.92 22.69% 1.18 2.40% 0.64 1.47% 1.08 9.36%
BG 0.52 9.38% 0.78 4.17% 0.35 7.90% 0.79 39.38% 0.56 10.88% 0.30 6.28% 0.50 15.56%
CY 0.67 -3.87% 0.79 -2.53% 0.44 -3.79% 1.14 1.96% 0.78 -4.81% 0.45 -4.56% 0.67 -3.56%
CZ 0.84 7.12% 1.25 2.39% 0.56 6.32% 1.29 31.98% 0.90 7.69% 0.47 5.13% 0.79 13.78%
DE 1.37 2.48% 1.99 1.78% 0.91 2.24% 2.32 20.25% 1.49 4.07% 0.76 1.45% 1.34 9.26%
DK 1.04 2.16% 1.49 1.55% 0.68 2.01% 2.48 -0.19% 1.13 2.55% 0.64 1.20% 1.03 5.14%
EE 0.55 0.00% 0.74 0.00% 0.36 0.00% 0.89 0.00% 0.50 0.00% 0.32 0.00% 0.72 0.02%
ES 1.30 2.77% 2.01 1.29% 0.84 3.72% 2.14 25.07% 1.40 3.87% 0.70 2.22% 1.20 13.39%
FI 0.94 6.60% 1.37 2.73% 0.62 5.50% 1.74 16.65% 1.01 6.83% 0.54 4.42% 0.93 8.16%
FR 1.70 2.56% 2.95 0.83% 1.05 3.55% 3.48 14.15% 2.01 3.60% 0.99 2.73% 1.71 9.90%
GR 0.99 9.20% 1.48 3.84% 0.66 7.66% 1.60 30.06% 1.04 10.81% 0.55 6.57% 0.92 17.90%
HU 1.52 1.85% 2.20 0.49% 0.79 1.91% 2.16 10.30% 1.63 1.79% 0.72 1.33% 1.33 6.67%
IE 0.49 0.14% 0.69 0.13% 0.32 0.46% 1.06 9.30% 0.54 0.03% 0.30 0.13% 0.48 3.49%
IT 1.42 7.18% 2.02 3.35% 0.95 6.16% 2.30 25.00% 1.57 9.14% 0.82 5.04% 1.35 14.59%
LT 0.73 8.12% 1.05 2.89% 0.47 7.07% 1.41 31.45% 0.79 8.55% 0.45 6.82% 0.70 14.74%
LU 1.03 2.46% 1.52 1.21% 0.68 2.69% 1.77 21.29% 1.11 2.83% 0.58 1.86% 0.97 10.03%
LV 0.58 10.06% 0.84 4.31% 0.38 8.47% 1.18 35.89% 0.63 11.70% 0.37 11.00% 0.56 17.14%
MT 1.21 6.21% 1.78 2.52% 0.81 5.35% 1.88 24.52% 1.29 7.12% 0.67 3.82% 1.16 11.15%
NL 1.02 1.40% 1.51 0.79% 0.68 1.60% 1.68 21.08% 1.10 1.50% 0.57 1.09% 0.98 7.05%
PL 0.71 7.07% 1.03 2.55% 0.46 6.16% 1.34 21.24% 0.76 7.70% 0.42 4.67% 0.68 12.76%
PT 0.96 7.62% 1.42 3.14% 0.64 6.41% 1.60 24.22% 1.02 8.49% 0.55 3.87% 0.92 13.28%
RO 0.56 6.68% 0.84 4.20% 0.37 6.54% 1.01 27.52% 0.63 4.18% 0.33 5.76% 0.53 15.09%
SE 0.97 2.76% 1.44 1.27% 0.65 2.76% 1.63 22.48% 1.04 3.56% 0.56 2.27% 0.91 11.14%
SK 0.69 6.83% 1.01 2.35% 0.46 6.02% 1.17 26.95% 0.74 7.33% 0.40 5.61% 0.66 12.59%
SL 1.06 6.19% 1.45 3.03% 0.71 5.18% 1.58 22.57% 1.16 6.84% 0.64 4.10% 1.02 10.06%
UK 0.78 1.80% 1.14 -0.14% 0.50 1.58% 2.03 0.70% 0.94 3.58% 0.52 0.79% 0.80 8.71%EU-Ø 0.96 4.45% 1.41 1.86% 0.63 4.03% 1.69 20.18% 1.05 5.04% 0.56 3.20% 0.93 10.21%
TransportConstruction EnergyBenchmark Case1
Commerce Manufacturing Service/Trade